Embed Size (px)
Citation preview

| FISHERIES SITUATIONER
HIGHLIGHTS
The volume of fisheries production for the first quarter of 2010 added up to 1,247,464.06 metric tons. This was 0.70 percent lower than last year’s record for the same period. Commercial and municipal fisheries posted production decreases of 3.50 percent and 0.14 percent, respectively. Aquaculture registered an increased production of 0.36 percent (Table 1).
Commercial fisheries production at 290,035.26 metric tons exhibited a downward trend. It went down by 3.50 percent or 10,525.36 metric tons from the previous year’s levels. Ten (10) regions registered production shortfalls while six (6) regions surpassed their last year’s production records. The decline in production was traced to reduced fishing trips due to high cost of gas and fuel while other commercial fishing vessels in some provinces totally stopped operation. There were reports that there were commercial fishing boats that stopped operation due to non-renewal of license while other fishing boats underwent dry docking for repair and maintenance. On the other hand, the production gains of six (6) regions were results of more fishing trips due to favorable weather condition that prevailed during the quarter and abundant catch of in-season species. About 147,053.84 metric tons or 50.70 percent of total volume of commercial fish caught were unloaded at traditional landing centers. Commercial fisheries accounted for 23.25 percent of the total fisheries production in the first quarter of 2010.
Municipal fisheries production was estimated at 333,321.84 metric tons during the first quarter of 2010. Production slid by 0.14 percent or 483.72 metric tons from the output during the same quarter last year. The volume of fish unloaded by municipal fishing boats reached 290,839.24 metric tons or 87.25 percent of the total municipal fisheries output. The rest at 42,480.60 or 12.75 percent came from inland municipal fisheries. The volume of fish caught by inland municipal fishing households was reduced by 5.61 percent or 2,526.96 metric tons. The major constraint of inland municipal fishermen was either the low water level or almost dried-up waterways. Ten (10) regions recorded production shortfalls while seven (7) regions exhibited production increases. Municipal fisheries contributed 26.72 percent to the total fisheries production.
Aquaculture surpassed its last year’s first quarter production by 0.36 percent or 2,252.51 metric tons. It derived output increases from seaweed farms, marine fish pens and fish cages. The production gain in marine fish cages was evidenced by biggest volume of milkfish harvested from fish cages in Pangasinan owing to good salinity of water. The growth of species in marine fish pens was a result of increased stocking and proper feeding in Davao Region. Of the total aquaculture production, seaweeds contributed 69.84 percent while fins/shellfishes shared 30.16 percent. Seaweed production posted a 2.00 percent increase this quarter as a result of quality planting materials and financial support from BFAR and LGU particularly in Zamboanga del Norte. Aquaculture shared 50.03 percent in the total fisheries production during the first quarter of 2010.
1
0
100
200
300
400
500
600
700
'000 MT
Commercial Municipal Aquaculture
Fig. 1 Fisheries: Volume of Production
by Sector, Philippines,
January - March 2009 - 2010
2009 2010
Fig. 2 Fisheries: Percent Distribution of
Production by Sector, Philippines,
January - March 2010
Aquaculture
50.03%
Commercial
23.25%
Municipal
26.72%

| FISHERIES SITUATIONER
COMMERCIAL FISHERIES
During the first quarter of 2010, commercial fishermen produced 290,035.26 metric tons of fish. This was 3.50 percent or 10,525.36 metric tons lower than last year’s first quarter record of 300,560.62 metric tons (Table 2). Fish production went down in ten (10) regions namely; Ilocos Region, Central Luzon, National Capital Region, CALABARZON, Central Visayas, Western Visayas, Zamboanga Peninsula, Northern Mindanao, Davao Region, and Caraga. The drop in production was traced to some commercial fishing boats that stopped operation in Pangasinan, Quezon, Davao Oriental and Surigao del Norte due to high cost of gas and fuel while some commercial fishing boats reduced their fishing trips. It was likewise reported that some commercial boats in Bohol stopped operation due to non- renewal of their license while other fishing boats in Zamboanga Sibugay, Misamis Occidental, Misamis Oriental and Iloilo underwent dry docking for repair and maintenance. The decrease was also attributed to the closure of commercial landing centers in Bataan because of the conversion of Bataan economic zone to free port area for eco-tourism. Decreased volume of unloadings of yellowfin and bigeye tunas from foreign-flagged fishing vessels was noted in Davao City.
On the other hand, six (6) regions managed to surpass their last year’s records namely; Cagayan Valley, MIMAROPA, Bicol Region, Eastern Visayas, SOCCSKSARGEN and ARMM. There were more fishing trips attributed to favorable weather condition that prevailed during the quarter. Abundant catch of in-season species such as sardines, roundscads, cavalla, anchovies, tunas, mackerels, slipmount and skipjack are observed. There was increased volume of unloadings of frozen tuna by foreign-flagged fishing vessels in response to high demand from canneries in General Santos City.
The volume of fish catch unloaded at private and traditional landing centers reached 53,050.60 metric tons and 147,053.84 metric tons, respectively. Private landing centers transactions were 28.81 percent lower this year. In traditional landing centers, unloadings were cut by 3.95 percent. Most unloadings of commercial fish catch were at traditional landing centers. On the other hand, the higher volumes of unloadings at Philippine Fisheries Development Authority (PFDA) with 27.25 percent gains and Local Government Unit (LGU)-managed landing centers with 8.18 percent increase from their last year’s records (Table 2).
MUNICIPAL FISHERIES During the first three (3) months of 2010, production of municipal fisheries declined by 0.14 percent
compared to the record of the same period last year. Production was 333,321.84 metric tons and 87.25 percent came from unloadings of municipal fishing boats and the rest came from inland fishing. The volume of fish captured in marine waters reached 290,839.24 metric tons. This indicated an increase of 0.71 percent, while the volume of fish caught in rivers, lakes, dams, swamps, creeks, irrigation canals and other communal bodies of water dropped by 5.61 percent (Table 3).
By major island group, Luzon shared 40.08 percent in total marine fish production, while contributions from Visayas and Mindanao corresponded to 27.23 percent and 32.69 percent. Provinces in Luzon suffered the biggest production losses amounting to 314.96 metric tons due to changing temperature. Mindanao recorded an output loss of 152.43 metric tons. In the Visayas, production shortfall was estimated at 16.33 metric tons.
2

| FISHERIES SITUATIONER
Big increments in volume of fish landed were recorded in Bicol Region (3,464.43 metric tons), ARMM (2,015.70 metric tons), Zamboanga Peninsula (1,592.34 metric tons) and Eastern Visayas (1,389.19 metric tons). These regions were the major contributors to the production increase of 0.71 percent in marine municipal fisheries. The impact of global warming on fisheries was being offset by frequent fishing trips. Other factors that afforded the increase in marine fishing, aside from the absence of weather disturbances, were strict monitoring of BFAR-LGUs against commercial fishing vessels encroaching in municipal waters (Camarines Norte, Batangas, Northern Samar, Zamboanga del Norte, Biliran); the use of payaos and other fish shelters that were still popular among sustenance fishermen (Ilocos Norte, Sorsogon, Guimaras); and the distribution of boats ad gears (Romblon, Masbate, Biliran) by BFAR. Dominant species landed during the quarter were Indian sardines (tamban), frigate tuna (tulingan), roundscad (galunggong), big-eyed scad (matang-baka) and fimbriated sardines (tunsoy). Palawan remained the top producing province for marine fishing, followed by Iloilo and Zamboanga del Norte.
While marine municipal fisheries grew in the first quarter, this was not realized in nine (9) out of 16 regions that declared scarcity of species in fishing grounds. Dwindling catch was a manifestation of continued changing temperature of coastal waters brought by the El Niño phenomenon. This situation caused species to retreat to cooler habitat in deeper part of the sea. It was further observed that fluctuations in water temperature adversely affected growth of species, thus, the smaller sizes of fish caught in coastal waters.
In inland fishing, five (5) regions posted growth for the quarter, but this was overshadowed by the decline in 11 regions resulting in 5.61 percent drop in production. The quantity of fish caught was reduced by 2,526.96 metric tons from the record of the same period last year or from 45,009.56 metric tons to 42,482.60 metric tons. Ilocos Region, Eastern Visayas, MIMAROPA, Western Visayas and Central Visayas had the biggest negative growth rates in production. The major factor that prevented fishermen from doing their usual fishing activities was either the low water level or almost dried-up waterways.
Fishing activities in Liguasan Marsh in Cotabato, Lake Sebu in South Cotabato and in Lake Mainit, Surigao del Norte became rare and irregular due to disappearance of fish, crustaceans and mollusks. In Central Luzon, it was reported that Candaba Swamp and rivers in Pampanga, Bulacan, and Tarlac were drying-up. Critical water level of dams, likewise, reduced quantity of species caught.
Several fishermen also opted to engage in farming activities for fixed income due to inadequate catch from fishing which was just enough for home consumption. Some fishermen, especially the elder ones, shortened fishing hours to avoid long exposure to the scorching heat of the sun due to health reasons.
Nevertheless, it was still noteworthy to mention that combined production of Laguna and Rizal provinces from Laguna de Bay reached 18,208.28 metric tons, equivalent to 42.86 percent share in total inland production for the quarter.
AQUACULTURE
The aquaculture production of 624 thousand metric tons during the first quarter of 2010 was 0.36 percent higher than the previous year’s level. In spite of the El Niño phenomenon that beset aquaculture during the period, it recorded gains from seaweed farms, marine fish pens and fish cages (Table 4).
Seaweed production attained a two percent increase as a result of quality planting materials dispersed by BFAR, particularly, in Zamboanga del Norte. Furthermore, less infestation and good water salinity enhanced the growth of seaweed in said province. On the other hand, in MIMAROPA and CALABARZON, seaweed production went down by 41.56 and 43.28 percent, respectively. These regions noted the insufficient supply of planting materials and occurrence of ice-ice disease caused by prolonged hot weather.
3

| FISHERIES SITUATIONER
The increase in aquaculture production came mainly from marine fish pens and fish cages. The 11.83 percent increase in marine fish cage production was brought about by bigger volume of milkfish harvests from fish cages in Pangasinan due to good salinity of water. At the same time, Eastern Visayas reported full blown operation of fishing company engaged in exportation of live grouper in Eastern Samar. In the case of marine fish pens, the 14.00 percent gain in output was credited to the increased stocking and proper feeding of species in Davao Region.
Meanwhile, the aquaculture output decreases were evident in brackishwater and freshwater fishponds.
Brackishwater fishpond production was reduced by almost 3,000 metric tons from the last year’s level. The decrease came from Central Luzon, Central Visayas and Davao Region. The 2.87 percent decline from freshwater fishpond harvest was accounted for by Central Luzon. Lower survival rate and smaller sizes of species were harvested from both aquafarm types due to prolonged hot weather condition during the quarter.
Table 4 shows the percentage change in production by aquafarm type from 2009 to 2010.
Type of Aquafarm/Environment % Increase (Decrease)
Brackishwater fishpond (4.94) Brackishwater fish pen (73.13) Brackishwater fish cage (77.21) Freshwater fishpond (2.87) Freshwater fish pen (11.14) Freshwater fish cage (2.06) Rice fish 204.76 Small farm reservoir (28.01) Marine fish pen (14.60) Marine fish cage (11.83)
Oyster (5.05) Mussel (7.78)
Seaweed 2.00
SELECTED AQUACULTURE SPECIES
MILKFISH
Production of milkfish in the first quarter of 2010 was estimated at 66,510.07 metric tons, or 3.31 percent lower than last year’s level. (Table 5)
Milkfish production from brackishwater fishponds, fishpens and fishcages was down this year. About 58 percent of the milkfish produced came from brackishwater fishponds which registered a 4.66 percent reduction in output. Bulacan, Pampanga, Capiz, Bataan and Pangasinan experienced production cuts. Operators in the municipalities of Hagonoy and Paombong in Bulacan shifted from milkfish to tiger prawn and tilapia culture to earn more profit. Pampanga, Capiz, Bataan and Pangasinan experienced abrupt changes of water temperature brought by the El Niño phenomenon which affected the growth of natural food and the quality of species cultured. On the other hand, Negros Occidental produced 3.78 percent more milkfish this year because of increase in stocking density.
4

| FISHERIES SITUATIONER
Harvests of milkfish from brackishwater fishpens and fishcages went down by 75.99 percent and 79.06
percent, respectively. In La Union, smaller sizes of fishes were harvested due to low water level brought by the El Niño phenomenon. In Agusan del Norte, operators temporarily stopped because of insufficient funds and lesser stocking density was also observed due to hot weather condition. Production from other provinces like Pangasinan registered 100 percent cut in production of milkfish due to washed-out stocks caused by typhoon Pepeng last October 2009. There was late stocking due to intense heat.
A decrease of 11.84 percent in milkfish production was recorded by freshwater fish pens while there was an increase of 5.20 percent in fish cage production. The decrease of milkfish production in Rizal was attributed to the low water level along Laguna Lake while in Sultan Kudarat, smaller sizes were harvested due to abrupt changes in water temperature. Batangas registered a 5.07 percent increase in production of milkfish because of quality fingerlings stocked, intensive feeding and good water condition.
Production in marine fish pens and fish cages for this quarter rose by 14.80 percent and 10.05
percent, respectively. Bigger sizes of harvested species was reported in Pangasinan due to better water salinity. In Davao del Sur, quality fingerlings stocked, intensive feeding and proper management were noted. Increase in stocking density and better administration were observed in Iloilo. In Davao del Norte, harvests were recorded from additional fish cages in Panabo City.
TILAPIA
Tilapia production from all types of aquafarms summed up to 93,348.46 metric tons and dropped by 3.19 percent from its last year’s level. The distribution of tilapia production were as follows: 65 percent from freshwater fishponds, 27 percent from freshwater fish cages, three (3) percent from brackishwater fishponds, four (4) percent from freshwater fish pens, and about one (1) percent from the combined harvests in small farm reservoirs (SFRs), rice fish culture and marine fish pens and cages (Table 6).
Production from freshwater fishponds went down by 3.02
percent from last year’s level. Among the provinces that contributed to the decline were Pampanga, Tarlac and Nueva Ecija. In Pampanga, harvests dropped by 3.85 percent. The decrease in harvests was attributed to hot water temperature brought by the El Niño phenomenon resulting in smaller sizes of tilapia produced. Also, some operators reported that they temporarily stopped operation due to high cost of inputs. Tilapia production in Tarlac declined by 25.73 percent due to the poor quality fingerlings. Nueva Ecija recorded a decrease of 3.19 percent due to early harvest because of prolonged hot weather. On the other hand, production of tilapia in Pangasinan and Isabela grew by 11.90 percent and 46.57 percent, respectively. The increase in output in both provinces was attributed to the expansion in area harvested and forced harvesting due to low water level.
Harvests from freshwater fish cages dropped by 2.17 percent this quarter. Provinces contributing to the decrease were Laguna, Camarines Sur, and Ifugao with 19.05 percent, 8.24 percent and 46.69 percent, respectively. The reduction in tilapia production in Laguna was caused by damages to fish cages by typhoons Ondoy and Santi. The repaired cages, however, were not utilized due to insufficient supply of fingerlings. In Camarines Sur, some fish cage operators temporarily stopped operation due to financial difficulties. Other operators reduced their stocks due to hot weather in the province. Reduction of harvests in Ifugao was due to fish kill. The low water level in Magat Dam caused an alarm to fish cage operators, thus, the early harvesting to avoid further losses. Many operators reduced the number of units used in anticipation of the prolonged dry season. On the other hand, Batangas and South Cotabato registered increases of 1.0 percent and 19.55 percent, respectively. In Batangas, the output gain was due to high demand in the market, quality fingerlings and intensive feeding. In South Cotabato, favorable weather condition that prevailed during the quarter in Lake Sebu, benefited the growth of stocks that encouraged operators to stock more fingerlings.
5

| FISHERIES SITUATIONER
fingerlings and intensive feeding. In South Cotabato, favorable weather condition that prevailed during the quarter in Lake Sebu, benefited the growth of stocks that encouraged operators to stock more fingerlings.
Production from freshwater fish pens decreased by 10.55 percent this year. The provinces of Rizal, Sultan Kudarat and Laguna reported production decline. In Rizal, production went down by 1.56 percent and in Sultan Kudarat, it was down by 20.85 percent due to the low water level in Laguna and Buluan Lakes, respectively. The low water level in these lakes resulted in stunted growth of tilapia. Production in Laguna was reduced by 20 percent due to rehabilitation of fish pens and minimal area harvested. On the contrary, production in Maguindanao and Lanao del Sur rose by 2.03 percent and 14.06 percent, respectively. This was due to favorable weather conditions and availability of fingerlings from BFAR/LGU.
Tilapia production from brackishwater fishponds declined by 3.66 percent and the main sources of the negative growth were Pampanga and Cagayan where outputs went down by 25.60 percent and 4.10 percent, respectively. In Pampanga. there was abrupt change in water temperature and in Cagayan, smaller sizes of tilapia were harvested due to forced harvesting owing to prolonged hot weather. On the other hand, Bulacan, Zamboanga del Sur and Zamboanga Sibugay recorded output increments of 18 percent, 5.64 percent and 13.99 percent, respectively. There was shifting of culture of milkfish to tilapia in Bulacan and shifting to tiger prawn in Zamboanga del Sur, The use of quality fingerlings allowed fishpond operators to increase their production.
It was noted that production in all provinces culturing tilapia in brackishwater fish pens and fish cages was reduced by 25.17 percent. Some operators in Cagayan and Ilocos Norte temporarily stopped operations due to financial constraints and insufficient fingerlings. Lesser number of cages were set up in Ilocos Sur as the water level was low. Furthermore, smaller sizes of tilapia were harvested as a result of prolonged hot weather. Late stocking was reported in La Union due to siltation and shallow water.
TIGER PRAWN
The first quarter 2010 harvest of tiger prawn at 10,374.08 metric tons was 8.30 percent lower than last year’s level (Table 7). The production cut was the effect of the El Niño phenomenon.
In Pampanga, smaller sizes of prawn were harvested. In addition, fungus
infestation and insufficient supply of oxygen resulted in low survival rate. There were also operators who did not stock their fishponds with post larvae due to insufficient capital and fear of the effects of El Niño. Tiger prawn production in Zamboanga del Sur decreased by 0.65 percent as some operators shifted from tiger prawn to tilapia culture and some fishponds in the province were under repair. In Bohol, the 22.19 percent output decrease was the result of not stocking post larvae due to spreading of lime in the pond area (pond rest) in preparation for the next cropping.
Among the top producing provinces, only Zamboanga Sibugay recorded an output gain. This was the
result of increased area utilized due to availability of quality post larvae and good market demand.
6

| FISHERIES SITUATIONER
MUD CRAB
Production of mud crab during the first quarter of 2010 at 3,591.78 metric tons was 1.49 percent more than last year’s level. The combined output increases in Sorsogon, Misamis Occidental and Camarines Norte were able to offset the production cut in Lanao del Norte and Pampanga. The production gains in Sorsogon and Camarines Norte were 16.09 percent and 15.82 percent, respectively. These were achieved due to availability of crablets and good price in the market, the continuous support from BFAR-LGU and the opening of new farm areas in Camarines Norte. In Misamis Occidental, the 3.66 percent increase was traced to the big sizes of mud crab harvested. (Table 7).
The reduced production of mud crab in Lanao del Norte was attributed to low water level coupled with high temperature owing to long dry season. In Pampanga, mud crab production declined by 2.05 percent because fishpond owners opted to reduce their area because of high cost of inputs and fear of the effects of El Niño.
Other provinces posted an increase of 1.35 percent due to availability of quality crablets and the continuous support of BFAR-LGU.
CARP
The 4.31 percent cut in carp production this first
quarter of 2010 was largely the consequences of 7.07 percent decreases in harvests from freshwater fish pen and fish cages and by 5.51 percent from small farm reservoirs (SFRs). The dry spell caused water level of Laguna Lake to go down prompting Rizal operators to harvest their stocks before their due schedule for fear of fish kill. In Laguna, few fish pen operators had yet to recover from damages brought by typhoon Ondoy. While most fish cages had been repaired, these were not stocked yet. In Metro Manila, the zero production or no harvest was the result of ongoing fish cage rehabilitation. Lower volume of harvests from SFRs was noted in Cagayan because of the low water level due to dry spell.
Production of carps from fishponds increased by 24.27 percent and this was attributed to Quezon’s
100 percent output increment. Operators increased stocking rate to meet the demand during the Lenten season. The other top fishpond-based producing provinces experienced lower output this year. In Lanao del Norte, growth of carps was affected by drought while in Pampanga, operators stocked less due to high labor costs (Table 7).
CATFISH
Catfish production during the first quarter of 2010 was 609.21 metric
tons or 3.89 percent higher than it was in the same quarter last year. This came mostly from freshwater fishponds and small farm
reservoirs (SFRs). Nueva Ecija was the main source of growth with its 50.0 percent output gain due to the increase in area harvested and quality fingerlings. An increasing demand of catfish from grills and restaurants was noted. The sources of production decline were Iloilo, Davao City, Laguna and South Cotabato, outputs dropped by 1.33 percent to 19.83 percent. The downward trend in production of Iloilo, Davao City and South Cotabato was attributed to poor growth of catfish, less area utilized due to hot water temperature and insufficient water supply. In Laguna, it was due to overflowing of ponds because of excessive water brought by the previous typhoons Ondoy and Santi (Table 7).
7

| FISHERIES SITUATIONER
SEAWEEDS
Production of seaweed at 435,856.03 metric tons this quarter recorded a 2.00 percent growth compared to production in the same quarter of last year. Zamboanga del Norte posted a remarkable increase of 788.95 percent. Seaweed farmers were able to expand their area planted through the dispersal of quality planting materials and financial support from BFAR and LGU specifically in seaweed producing municipalities of the province. In addition, it was observed that the province had good water salinity and less infestation during the quarter. Area expansion in Bohol and Sulu was encouraged by high demand and better prices of seaweeds.
Production decline in the provinces of Palawan and Tawi-Tawi, on the
other hand, was due to ice-ice disease. High water temperature was another reason for the decrease in production (Table 8).
OYSTER
Production of oyster registered a 5.05 percent growth during the reference period. Zamboanga Sibugay and Bulacan produced 66.67 percent and 26.55 percent more outputs this quarter. Better quality and prolific propagation of spats resulted in bigger sizes of oyster harvested during the period. Moreover, higher prices in Pangasinan encouraged farmers to plant more, thus, increasing their production (Table 8).
On the contrary, Iloilo and Capiz suffered decreases of 14.78 percent and 4.68 percent, respectively. Too much heat affected the growth of oyster that resulted in low quality of harvests (thin and small size). Siltation of rivers, where oysters are being cultured, was also cited while some areas remained unharvested.
MUSSEL
Mussel production went down by 7.78 percent this year. Too much heat affected the growth of mussel in Capiz, thus, the poor quality and smaller sizes of harvests. Some farmers from Negros Occidental were not able to plant due to limited supply of spats (planting materials). In Bataan, operators were still hesitant to re-invest in mussel culture due to the on going Coastal Rehabilitation Program of Manila Bay.
Meanwhile, Cavite producers managed to put up a 25.26 percent growth in output. The cleaning of
Bacoor Bay and re aligning of farms allowed the current to enter and wash out pollutants and other waste materials that resulted in the occurrence of quality spats. Some operators who temporarily stopped operation resumed their culture of mussels (Table 8).
8

| FISHERIES SITUATIONER
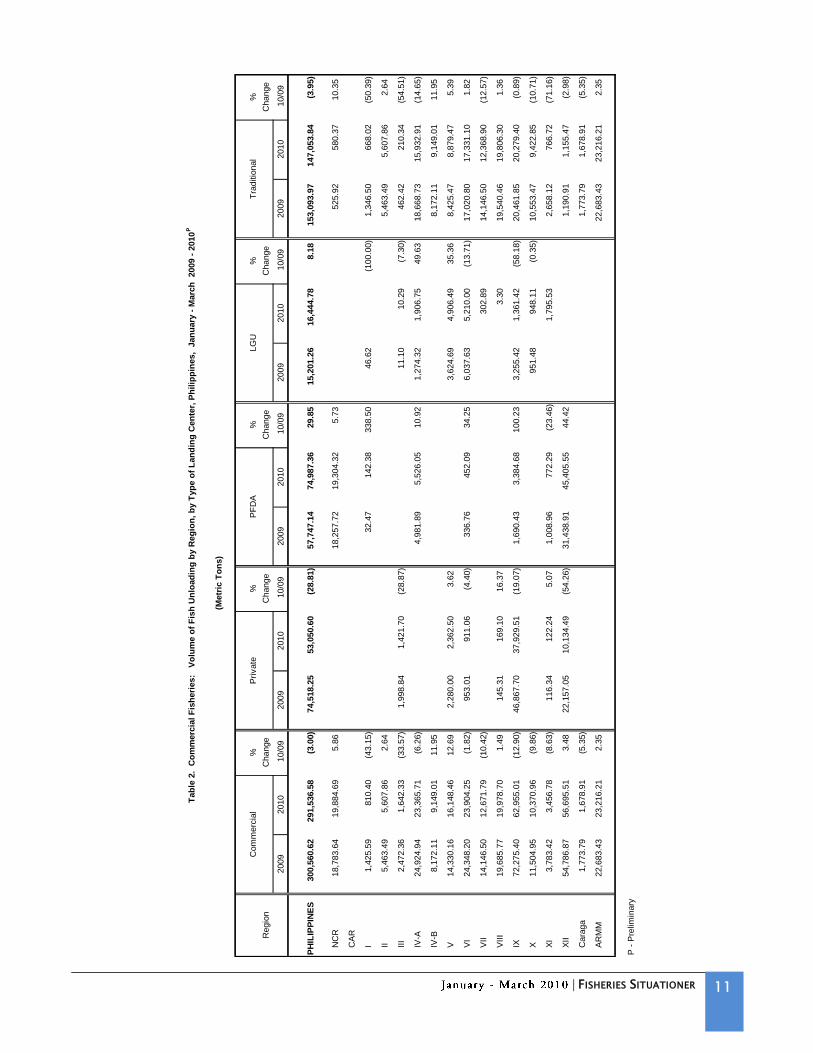
In the first quarter of 2010, producer prices of milkfish and indian mackerel averaged P84.03 and P56.26, per kilogram, respectively. These corresponded to price increases of 4.23 percent and 0.66 percent from their 2009 levels. The average producer prices of tilapia, tiger prawn, roundscad and frigate tuna were lower this year compared to their 2009 levels. Tilapia had the biggest price cut at 13.78 percent. Average prices were P60.37 for tilapia, P378.58 for tiger prawn, P49.41 for roundscad and P56.56 for frigate tuna.
Wholesale prices of the above-cited fish species rolled
up, except for roundscad. Increases in the average prices of frigate tuna, tiger prawn and indian mackerel were between 5.46 percent and 6.26 percent while those of milkfish and tilapia were 1.44 percent and 1.19 percent, respectively. The wholesale price of roundscad went down by 0.17 percent this quarter.
Fish prices at the retail level also increased. Those of
tiger prawn and frigate tuna were up by 2.45 percent and 2.05 percent, respectively. Milkfish, tilapia, roundscad and indian mackerel were quoted at prices higher by 0.64 percent to 0.95 percent from their 2009 levels.
During the first quarter of 2010, the widest producer-retail
price margin was noted for tiger prawn at P57.50. This was followed by indian mackerel at P52.80. In the case of roundscad, frigate tuna and milkfish, producer-retail price margins were P39.81, P38.87 and P33.19, respectively. Tilapia's producer-retail price margin was the narrowest at P26.65.
9
45
60
75
90
105
120
135
Q1 '08 Q1 '09 Q1 '10
P/Kg.
Fig. 3 Average Prices of Milkfish, Philippines, First Quarter
2008 - 2010
producer wholesale retail
45
55
65
75
85
95
105
Q1 '08 Q1 '09 Q1 '10
P/Kg.
Fig. 4 Average Prices of Tilapia, Philippines, First Quarter
2008 - 2010
producer wholesale retail
340
360
380
400
420
440
460
Q1 '08 Q1 '09 Q1 '10
P/Kg.
Fig. 5 Average Prices of Tiger Prawn, Philippines, First Quarter
2008 - 2010
producer wholesale retail
20
35
50
65
80
95
110
Q1 '08 Q1 '09 Q1 '10
P/Kg.
Fig. 6 Average Prices of Roundscad Philippines, First Quarter
2008-2010
producer wholesale retail
40
52
64
76
88
100
112
Q1 '08 Q1 '09 Q1 '10
P/Kg.
Fig. 7 Average Prices of Frigate Tuna, Philippines, First Quarter
2008 - 2010
producer wholesale retail
35
50
65
80
95
110
125
Q1 '08 Q1 '09 Q1 '10
P/Kg.
Fig. 8 Average Prices of Iindian Mackerel, Philippines, First Quarter
2008 - 2010
producer wholesale retail
FISH PRICES

| FISHERIES SITUATIONER 10
(Metr
ic T
on
s)
Regio
n/
%%
%%
Sub-S
ecto
rC
hange
Change
Change
Change
2009
2010
10/0
92009
2010
10/0
92009
2010
10/0
92009
2010
10/0
9
PH
ILIP
PIN
ES
1,2
56,2
20.6
3
1,2
47,4
64.0
6
(0
.70)
300,5
60.6
2
290,0
35.2
6
(3.5
0)
333,8
05.5
6
333,3
21.8
4
(0.1
4)
621,8
54.4
5
624,1
06.9
6
0.3
6
NC
R
20,1
12.2
0
19,2
50.5
9
(4
.28)
18,7
83.6
4
18,3
83.3
7
(2
.13)
1,0
21.8
4
825.2
8
(19.2
4)
306.7
2
41.9
4
(8
6.3
3)
CA
R1,2
74.2
9
1,0
50.3
5
250.3
1
256.7
8
2.5
8
1,0
23.9
8
793.5
7
(22.5
0)
I32,8
99.4
1
29,9
95.2
2
(8
.83)
1,4
25.5
9
810.4
0
(43.1
5)
10,7
92.4
8
9,0
17.1
0
(16.4
5)
20,6
81.3
4
20,1
67.7
2
(2
.48)
II18,3
55.3
6
18,8
73.4
1
2.8
2
5,4
63.4
9
5,6
07.8
6
2.6
4
10,2
12.0
9
10,3
62.4
5
1.4
7
2,6
79.7
8
2,9
03.1
0
8.3
3
III
94,2
93.6
7
90,1
13.7
5
(4
.43)
2,4
72.3
6
1,6
42.3
3
(33.5
7)
11,5
72.0
2
11,3
29.5
0
(2
.10)
80,2
49.2
9
77,1
41.9
2
(3
.87)
IV-A
99,7
44.8
0
92,2
47.2
7
(7
.52)
24,9
24.9
4
23,3
65.7
1
(6
.26)
29,4
96.8
0
28,7
32.4
7
(2
.59)
45,3
23.0
6
40,1
49.0
9
(1
1.4
2)
IV-B
92,0
93.8
9
76,3
92.7
0
(1
7.0
5)
8,1
72.1
1
9,1
49.0
1
11.9
5
45,0
34.1
1
44,1
11.1
4
(2
.05)
38,8
87.6
7
23,1
32.5
5
(4
0.5
1)
V66,1
32.2
4
72,8
46.6
2
10.1
5
14,3
30.1
6
16,1
48.4
6
12.6
9
36,0
01.1
2
39,4
31.0
9
9.5
3
15,8
00.9
6
17,2
67.0
7
9.2
8
VI
102,6
75.2
7
105,7
36.4
1
2.9
8
24,3
48.2
0
23,9
04.2
5
(1
.82)
43,8
06.0
5
42,5
50.7
9
(2
.87)
34,5
21.0
2
39,2
81.3
7
13.7
9
VII
63,8
11.2
8
65,4
50.1
3
2.5
7
14,1
46.5
0
12,6
71.7
9
(1
0.4
2)
14,4
87.1
4
14,5
99.4
3
0.7
8
35,1
77.6
4
38,1
78.9
1
8.5
3
VII
I49,1
79.5
7
51,0
90.8
1
3.8
9
19,6
85.7
7
19,9
78.7
0
1.4
9
22,8
82.4
6
24,0
09.1
0
4.9
2
6,6
11.3
4
7,1
03.0
1
7.4
4
IX175,3
87.4
0
186,3
02.3
3
6.2
2
72,2
75.4
0
62,9
55.0
1
(1
2.9
0)
34,9
24.2
8
36,5
79.1
3
4.7
4
68,1
87.7
2
86,7
68.1
9
27.2
5
X36,9
06.6
2
36,9
60.5
5
0.1
5
11,5
04.9
5
10,3
70.9
6
(9
.86)
10,8
83.1
6
10,8
44.8
7
(0
.35)
14,5
18.5
1
15,7
44.7
2
8.4
5
XI
18,9
22.2
3
17,3
99.5
0
(8
.05)
3,7
83.4
2
3,4
56.7
8
(8.6
3)
7,5
31.6
3
7,1
58.6
1
(4.9
5)
7,6
07.1
8
6,7
84.1
1
(10.8
2)
XII
74,2
60.6
4
74,6
11.8
4
0.4
7
54,7
86.8
7
56,6
95.5
1
3.4
8
11,9
93.8
4
11,0
51.2
0
(7
.86)
7,4
79.9
3
6,8
65.1
3
(8.2
2)
Cara
ga
23,7
33.4
5
20,3
94.7
3
(1
4.0
7)
1,7
73.7
9
1,6
78.9
1
(5.3
5)
19,0
71.7
3
16,4
22.3
1
(1
3.8
9)
2,8
87.9
3
2,2
93.5
1
(20.5
8)
AR
MM
286,4
38.3
4
288,7
47.8
5
0.8
1
22,6
83.4
3
23,2
16.2
1
2.3
5
23,8
44.5
0
26,0
40.5
9
9.2
1
239,9
10.4
1
239,4
91.0
5
(0.1
7)
P -
Pre
lim
inary
Tab
le 1
. F
ish
eri
es:
Vo
lum
e o
f F
ish
Pro
du
cti
on
by S
ub
-Secto
r, b
y R
eg
ion
, P
hil
ipp
ines,
Jan
uary
- M
arc
h 2
009 -
2010
P
Aquaculture
Fis
heri
es
Com
merc
ial
Munic
ipal
| FISHERIES SITUATIONER 11
(Metr
ic T
on
s)
%%
%%
%
Regio
nC
hange
Change
Change
Change
Change
2009
2010
10/0
92009
2010
10/0
92009
2010
10/0
92009
2010
10/0
92009
2010
10/0
9
PH
ILIP
PIN
ES
300,5
60.6
2
291,5
36.5
8
(3
.00)
74,5
18.2
5
53,0
50.6
0
(28.8
1)
57,7
47.1
4
74,9
87.3
6
29.8
5
15,2
01.2
6
16,4
44.7
8
8.1
8
153,0
93.9
7
147,0
53.8
4
(3
.95)
NC
R
18,7
83.6
4
19,8
84.6
9
5.8
6
18,2
57.7
2
19,3
04.3
2
5.7
3
525.9
2
580.3
7
10.3
5
CA
R
I1,4
25.5
9
810.4
0
(4
3.1
5)
32.4
7
142.3
8
338.5
0
46.6
2
(100.0
0)
1,3
46.5
0
668.0
2
(5
0.3
9)
II5,4
63.4
9
5,6
07.8
6
2.6
4
5,4
63.4
9
5,6
07.8
6
2.6
4
III
2,4
72.3
6
1,6
42.3
3
(3
3.5
7)
1,9
98.8
4
1,4
21.7
0
(2
8.8
7)
11.1
0
10.2
9
(7.3
0)
462.4
2
210.3
4
(5
4.5
1)
IV-A
24,9
24.9
4
23,3
65.7
1
(6.2
6)
4,9
81.8
9
5,5
26.0
5
10.9
2
1,2
74.3
2
1,9
06.7
5
49.6
3
18,6
68.7
3
15,9
32.9
1
(14.6
5)
IV-B
8,1
72.1
1
9,1
49.0
1
11.9
5
8,1
72.1
1
9,1
49.0
1
11.9
5
V14,3
30.1
6
16,1
48.4
6
12.6
9
2,2
80.0
0
2,3
62.5
0
3.6
2
3,6
24.6
9
4,9
06.4
9
35.3
6
8,4
25.4
7
8,8
79.4
7
5.3
9
VI
24,3
48.2
0
23,9
04.2
5
(1.8
2)
953.0
1
911.0
6
(4
.40)
336.7
6
452.0
9
34.2
5
6,0
37.6
3
5,2
10.0
0
(1
3.7
1)
17,0
20.8
0
17,3
31.1
0
1.8
2
VII
14,1
46.5
0
12,6
71.7
9
(10.4
2)
302.8
9
14,1
46.5
0
12,3
68.9
0
(12.5
7)
VII
I19,6
85.7
7
19,9
78.7
0
1.4
9
145.3
1
169.1
0
16.3
7
3.3
0
19,5
40.4
6
19,8
06.3
0
1.3
6
IX72,2
75.4
0
62,9
55.0
1
(12.9
0)
46,8
67.7
0
37,9
29.5
1
(19.0
7)
1,6
90.4
3
3,3
84.6
8
100.2
3
3,2
55.4
2
1,3
61.4
2
(5
8.1
8)
20,4
61.8
5
20,2
79.4
0
(0.8
9)
X11,5
04.9
5
10,3
70.9
6
(9.8
6)
951.4
8
948.1
1
(0
.35)
10,5
53.4
7
9,4
22.8
5
(1
0.7
1)
XI
3,7
83.4
2
3,4
56.7
8
(8
.63)
116.3
4
122.2
4
5.0
7
1,0
08.9
6
772.2
9
(2
3.4
6)
1,7
95.5
3
2,6
58.1
2
766.7
2
(7
1.1
6)
XII
54,7
86.8
7
56,6
95.5
1
3.4
8
22,1
57.0
5
10,1
34.4
9
(54.2
6)
31,4
38.9
1
45,4
05.5
5
44.4
2
1,1
90.9
1
1,1
55.4
7
(2
.98)
Cara
ga
1,7
73.7
9
1,6
78.9
1
(5
.35)
1,7
73.7
9
1,6
78.9
1
(5
.35)
AR
MM
22,6
83.4
3
23,2
16.2
1
2.3
5
22,6
83.4
3
23,2
16.2
1
2.3
5
P -
Pre
lim
inary
Tab
le 2
. C
om
merc
ial
Fis
heri
es:
V
olu
me o
f F
ish
Un
load
ing
by R
eg
ion
, b
y T
yp
e o
f L
an
din
g C
en
ter,
Ph
ilip
pin
es,
Jan
uary
- M
arc
h
2009 -
2010
P
Tra
ditio
nal
Com
merc
ial
Pri
vate
PF
DA
LG
U

| FISHERIES SITUATIONER 12
(Metr
ic T
on
s)
%%
%
Regio
nC
hange
Change
Change
2009
2010
10/0
92009
2010
10/0
92009
2010
10/0
9
PH
ILIP
PIN
ES
333,8
05.5
6
333,3
21.8
4
(0
.14)
288,7
96.0
0
290,8
39.2
4
0.7
1
45,0
09.5
6
42,4
82.6
0
(5.6
1)
NC
R
1,0
21.8
4
825.2
8
(1
9.2
4)
1,0
21.8
4
825.2
8
(1
9.2
4)
CA
R250.3
1
256.7
8
2.5
8
250.3
1
256.7
8
2.5
8
I10,7
92.4
8
9,0
17.1
0
(1
6.4
5)
9,9
85.5
3
8,5
65.4
7
(1
4.2
2)
806.9
5
451.6
3
(4
4.0
3)
II10,2
12.0
9
10,3
62.4
5
1.4
7
7,0
48.4
5
7,1
07.0
2
0.8
3
3,1
63.6
4
3,2
55.4
3
2.9
0
III
11,5
72.0
2
11,3
29.5
0
(2.1
0)
8,2
91.0
7
8,5
31.1
4
2.9
0
3,2
80.9
5
2,7
98.3
6
(1
4.7
1)
IV-A
29,4
96.8
0
28,7
32.4
7
(2.5
9)
9,7
85.3
6
9,6
28.6
1
(1
.60)
19,7
11.4
4
19,1
03.8
6
(3.0
8)
IV-B
45,0
34.1
1
44,1
11.1
4
(2.0
5)
44,8
21.3
5
43,9
52.3
2
(1.9
4)
212.7
6
158.8
2
(2
5.3
5)
V36,0
01.1
2
39,4
31.0
9
9.5
3
34,4
99.1
1
37,9
63.5
4
10.0
4
1,5
02.0
1
1,4
67.5
5
(2
.29)
VI
43,8
06.0
5
42,5
50.7
9
(2.8
7)
41,9
95.9
1
41,1
93.4
2
(1.9
1)
1,8
10.1
4
1,3
57.3
7
(2
5.0
1)
VII
14,4
87.1
4
14,5
99.4
3
0.7
8
14,4
30.4
0
14,5
55.7
4
0.8
7
56.7
4
43.6
9
(2
3.0
0)
VII
I22,8
82.4
6
24,0
09.1
0
4.9
2
22,0
46.0
0
23,4
35.1
9
6.3
0
836.4
6
573.9
1
(3
1.3
9)
IX34,9
24.2
8
36,5
79.1
3
4.7
4
34,7
16.3
5
36,3
08.6
9
4.5
9
207.9
3
270.4
4
30.0
6
X10,8
83.1
6
10,8
44.8
7
(0.3
5)
10,1
38.9
7
9,8
16.9
7
(3
.18)
744.1
9
1,0
27.9
0
38.1
2
XI
7,5
31.6
3
7,1
58.6
1
(4
.95)
7,4
96.0
9
7,1
29.8
6
(4
.89)
35.5
4
28.7
5
(1
9.1
1)
XII
11,9
93.8
4
11,0
51.2
0
(7.8
6)
5,3
20.8
0
5,1
10.3
6
(3
.96)
6,6
73.0
4
5,9
40.8
4
(1
0.9
7)
Cara
ga
19,0
71.7
3
16,4
22.3
1
(13.8
9)
17,7
52.2
4
15,2
54.0
0
(14.0
7)
1,3
19.4
9
1,1
68.3
1
(1
1.4
6)
AR
MM
23,8
44.5
0
26,0
40.5
9
9.2
1
19,4
46.5
3
21,4
61.6
3
10.3
6
4,3
97.9
7
4,5
78.9
6
4.1
2
P -
Pre
lim
inary
Tab
le 3
. M
un
icip
al
Fis
h P
rod
ucti
on
by R
eg
ion
, P
hil
ipp
ines,
Jan
uary
- M
arc
h 2
009 -
2010
P
Munic
ipal
Mari
ne
Inla
nd

| FISHERIES SITUATIONER 13
% C
hange
% C
hange
% C
hange
% C
hange
% C
hange
% C
hange
% C
hange
2009
2010
10/0
92009
2010
10/0
92009
2010
10/0
92009
2010
10/0
92009
2010
10/0
92009
2010
10/0
92009
2010
10/0
9
PH
ILIP
PIN
ES
621,8
54.4
5
624,1
06.9
6
0.3
660,1
37.2
3
57,1
68.6
4
(4.9
4)
1,3
39.1
9
359.7
8
(7
3.1
3)
408.8
3
93.1
8
(77.2
1)
63,7
31.1
6
61,9
05.1
8
(2.8
7)
14,2
14.8
1
12,6
30.9
6
(11.1
4)
26,7
10.8
3
26,1
59.2
6
(2.0
6)
NC
R306.7
2
41.9
4
(86.3
3)
26.9
4
24.4
1
(9.4
1)
195.1
2
53.7
4
CA
R1,0
23.9
8
793.5
7
(2
2.5
0)
487.8
1
475.6
7
(2
.49)
536.1
7
317.9
0
(40.7
1)
I20,6
81.3
4
20,1
67.7
2
(2
.48)
3,8
19.2
7
3,5
06.9
9
(8
.18)
1,3
32.7
7
354.4
8
(7
3.4
0)
272.4
2
6.9
9
(9
7.4
4)
3,3
50.1
7
3,7
28.6
7
11.3
00.0
3
0.0
1
(77.8
1)
11.9
0
11.0
8
(6
.96)
II2,6
79.7
8
2,9
03.1
0
8.3
3699.9
5
512.6
4
(2
6.7
6)
5.9
4
4.3
9
(2
6.1
2)
1,5
70.5
3
1,9
87.2
2
26.5
3196.8
7
210.6
4
7.0
0
III
80,2
49.2
9
77,1
41.9
2
(3
.87)
21,5
87.3
8
20,7
03.2
3
(4.1
0)
0.6
0
0.7
5
25.0
055,6
91.0
6
52,8
58.2
8
(5.0
9)
IV-A
45,3
23.0
6
40,1
49.0
9
(1
1.4
2)
1,1
08.7
5
1,0
87.4
5
(1
.92)
720.9
6
967.1
3
34.1
49,2
71.3
9
8,6
94.4
5
(6
.22)
23,3
08.9
8
23,0
37.2
1
(1.1
7)
IV-B
38,8
87.6
7
23,1
32.5
5
(4
0.5
1)
920.0
0
780.7
6
(1
5.1
3)
173.9
6
150.2
0
(1
3.6
6)
V15,8
00.9
6
17,2
67.0
7
9.2
81,6
13.5
1
1,8
54.4
6
14.9
3341.1
3
274.3
0
(1
9.5
9)
1,8
38.7
6
1,6
86.8
2
(8
.26)
VI
34,5
21.0
2
39,2
81.3
7
13.7
911,5
23.2
0
11,3
52.3
0
(1.4
8)
1.3
0
1.5
5
19.8
40.6
3
0.6
3
0.3
8344.2
9
243.3
3
(2
9.3
2)
0.7
5
0.8
0
VII
35,1
77.6
4
38,1
78.9
1
8.5
32,6
56.5
6
2,0
25.2
5
(2
3.7
6)
0.0
1
1.1
1
1.9
8
77.8
534.1
2
48.7
7
42.9
01.8
4
3.9
2
112.4
2
VII
I6,6
11.3
4
7,1
03.0
1
7.4
41,0
75.1
3
1,4
01.3
7
30.3
42.9
4
3.6
1
22.6
012.9
5
16.5
0
27.4
1136.1
5
210.6
2
54.7
05.6
4
6.5
8
16.6
711.1
9
11.6
4
4.0
7
IX68,1
87.7
2
86,7
68.1
9
27.2
54,5
81.6
4
4,7
71.5
2
4.1
40.0
8
30.5
7
50.0
1
63.5
90.3
7
X14,5
18.5
1
15,7
44.7
2
8.4
55,6
61.8
5
5,0
78.1
7
(1
0.3
1)
305.7
6
375.0
3
22.6
6
XI
7,6
07.1
8
6,7
84.1
1
(10.8
2)
1,7
66.9
1
1,0
81.1
2
(3
8.8
1)
6.8
0
4.4
3
(3
4.8
7)
282.6
7
327.1
2
15.7
21.4
9
0.6
2
(58.4
9)
0.7
8
XII
7,4
79.9
3
6,8
65.1
3
(8.2
2)
1,8
81.7
3
1,8
75.6
7
(0
.32)
200.9
4
148.8
9
(2
5.9
0)
4,2
58.3
9
3,4
19.2
2
(1
9.7
1)
672.5
7
803.5
3
19.4
7
Cara
ga
2,8
87.9
3
2,2
93.5
1
(20.5
8)
555.0
6
425.9
5
(2
3.2
6)
2.1
7
0.1
4
(9
3.7
2)
108.3
8
57.4
3
(47.0
1)
40.0
5
37.2
6
(6.9
7)
30.3
0
19.8
5
(3
4.5
0)
AR
MM
239,9
10.4
1
239,4
91.0
5
(0.1
7)
659.3
5
687.3
6
4.2
520.9
8
22.6
8
8.1
0482.7
6
508.9
7
5.4
347.7
1
55.9
0
17.1
6
% C
hange
% C
hange
% C
hange
% C
hange
% C
hange
% C
hange
% C
hange
2009
2010
10/0
92009
2010
10/0
92009
2010
10/0
92009
2010
10/0
92009
2010
10/0
92009
2010
10/0
92009
2010
10/0
9
PH
ILIP
PIN
ES
5,5
65.0
3
6,3
77.4
3
14.6
011,4
21.7
2
12,7
72.3
9
11.8
34,8
48.2
9
5,0
93.1
3
5.0
56,1
37.0
6
5,6
59.3
5
(7.7
8)
427,2
99.4
2
435,8
56.0
3
2.0
00.9
5
2.8
8
204.7
639.9
3
28.7
4
(2
8.0
1)
NC
R30.9
2
17.5
3
(43.3
0)
CA
R
I3,2
40.5
4
3,3
58.2
3
3.6
38,0
32.1
4
8,5
86.6
6
6.9
0432.0
5
430.7
7
(0
.30)
38.0
0
40.1
0
5.5
4149.9
3
138.0
8
(7
.90)
0.8
2
2.8
8
253.3
71.2
9
2.7
9
115.7
3
II111.9
5
113.9
0
1.7
463.0
1
56.8
5
(9.7
8)
31.5
2
17.4
5
(4
4.6
3)
III
485.9
6
497.6
0
2.4
01,7
67.3
1
2,2
35.5
9
26.5
0629.7
7
610.0
6
(3
.13)
84.0
0
231.5
8
175.6
83.2
0
4.8
3
51.0
4
IV-A
0.2
5
0.0
9
(6
3.7
1)
48.0
9
55.4
5
15.2
9210.8
4
264.1
0
25.2
610,6
53.8
0
6,0
43.2
2
(4
3.2
8)
IV-B
178.5
0
218.5
0
22.4
137,6
15.2
1
21,9
83.0
9
(41.5
6)
V15.0
0
0.7
2
2.1
7
199.5
412,0
06.8
3
13,4
34.3
2
11.8
9
VI
200.9
9
273.2
4
35.9
511.9
3
59.4
5
398.2
22,0
98.6
9
1,8
23.4
7
(13.1
1)
4,4
42.9
1
3,9
36.2
6
(11.4
0)
15,8
96.2
8
21,5
89.3
9
35.8
11.0
0
VII
7.7
5
47.3
3
510.6
4109.8
2
216.7
5
97.3
765.5
7
63.7
2
(2.8
3)
32,2
97.1
3
35,7
68.6
4
10.7
53.7
1
2.5
6
(30.9
6)
VII
I17.8
0
19.8
0
11.2
4357.8
9
577.6
1
61.3
912.4
4
18.0
9
45.4
6784.3
3
791.3
0
0.8
94,1
94.8
9
4,0
45.9
0
(3
.55)
IX9.5
8
7.2
1
(2
4.6
8)
155.4
5
248.6
2
59.9
30.2
8
63,4
10.1
9
81,6
90.3
7
28.8
3
X0.1
5
257.6
3
351.6
0
36.4
81.2
9
0.3
6
(7
2.0
9)
8,2
91.8
3
9,9
39.5
5
19.8
7
XI
2,0
72.2
0
2,6
41.0
4
27.4
51,4
93.2
7
1,6
60.9
0
11.2
3155.4
4
103.1
7
(3
3.6
3)
1,8
28.2
6
964.9
4
(4
7.2
2)
0.1
3
XII
432.5
4
547.7
0
26.6
333.5
5
70.0
0
108.6
40.2
0
0.1
1
(48.0
9)
Cara
ga
25.1
4
22.3
4
(11.1
3)
51.4
9
38.4
1
(25.4
1)
2,0
75.3
5
1,6
92.1
3
(1
8.4
7)
AR
MM
0.4
6
0.4
4
(3
.96)
7.7
4
238,6
99.1
5
238,2
07.9
7
(0
.21)
Ta
ble
4.
Aq
ua
cu
ltu
re P
rod
uc
tio
n b
y T
yp
e o
f A
qu
afa
rm,
by E
nvir
on
me
nt
an
d b
y R
eg
ion
, J
an
ua
ry -
Ma
rch
20
09
- 2
01
0P
RE
GIO
NA
quaculture
Bra
ckis
hw
ate
r F
ishpond
Bra
ckis
hw
ate
r F
ish P
en
Bra
ckis
hw
ate
r F
ish C
age
Fre
shw
ate
r F
ishpond
Fre
shw
ate
r F
ish P
en
Fre
shw
ate
r F
ish C
age
Mussel
Seaw
eed
Ric
e F
ish
Sm
all F
arm
Reserv
oir
RE
GIO
NM
ari
ne F
ish P
en
Mari
ne F
ish C
age
Oyste
r

| FISHERIES SITUATIONER 14
Philippines, January - March 2009 - 2010P
Culture Environment/ % Change
Type of Aquafarm/Province 10/09
PHILIPPINES 68,789.83 66,510.07 (3.31)
Brackishwater Fishpond 40,557.06 38,667.17 (4.66)
Bulacan 7,078.55 6,722.50 (5.03)
Negros Occidental 4,813.06 4,994.99 3.78
Pampanga 3,701.95 3,468.73 (6.30)
Capiz 2,995.08 2,626.39 (12.31)
Bataan 2,581.59 2,518.86 (2.43)
Pangasinan 2,602.44 2,203.49 (15.33)
Other Provinces 16,784.39 16,132.21 (3.89)
Brackishwater Fish pen 1,285.34 308.66 (75.99)
La Union 365.88 304.19 (16.86)
Northern Samar 2.34 2.91 24.56
Other Provinces 917.13 1.56 (99.83)
Brackishwater Fish cage 374.50 78.43 (79.06)
Agusan del Norte 107.60 55.31 (48.60)
Northern Samar 11.00 11.00 0.00
Other Provinces 255.90 12.13 (95.26)
Freshwater Fish pen 9,194.09 8,105.37 (11.84)
Rizal 6,706.18 6,199.87 (7.55)
Sultan Kudarat 2,116.54 1,724.13 (18.54)
Maguindanao 117.29 134.83 14.95
Other Provinces 254.07 46.54 (81.68)
Freshwater Fish cage 775.55 815.86 5.20
Batangas 754.21 792.45 5.07
Other Provinces 21.33 23.41 9.73
Marine Fish pen 5,525.73 6,343.51 14.80
Pangasinan 3,239.35 3,358.23 3.67
Davao del Sur 2,071.40 2,641.04 27.50
Iloilo 70.55 115.69 63.97
Other Provinces 144.43 228.55 58.24
Marine Fish cage 11,077.56 12,191.06 10.05
Pangasinan 7,958.97 8,572.60 7.71
Davao Sur 1,180.63 1,222.90 3.58
Zambales 479.46 496.05 3.46
Davao Norte 303.78 392.37 29.16
Other Provinces 1,154.72 1,507.15 30.52
P - Preliminary
Provinces by Culture Environment and Type of Aquafarm,
Table 5. Aquaculture: Milkfish Production of Top Producing
2009 2010
(Metric Tons)

| FISHERIES SITUATIONER
15
Table 6. Aquaculture: Tilapia Production of Top Producing Provinces,
by Culture Environment/Type of Aquafarm, Philippines,
January - March 2009 - 2010P
(Metric Tons)
Culture Environment/ % Change
Type of Aquafarm/Province 10/09
PHILIPPINES 96,423.37 93,348.46 (3.19)
Brackishwater Fishpond 3,092.20 2,979.17 (3.66)
Pampanga 1,005.47 964.25 (4.10)
Cagayan 430.71 320.45 (25.60)
Bulacan 274.81 324.28 18.00
Zamboanga del Sur 213.50 225.54 5.64
Zamboanga Sibugay 195.77 223.15 13.99
Other Provinces 971.95 921.51 (5.19)
Brackishwater Fishcage/fishpen 74.2943 55.5963 (25.17)
La Union 62.7318 49.4551 (21.16)
Cagayan 4.2767 3.5916 (16.02)
Ilocos Norte 6.2898 2.2782 (63.78)
Ilocos Sur 0.2682 0.2431 (9.36)
Other provinces 0.7278 0.0283 (96.11)
Freshwater Fishpond** 62,926.18 61,024.78 (3.02)
Pampanga 49,398.63 47,496.78 (3.85)
Pangasinan 2,929.79 3,278.43 11.90
Tarlac 3,011.16 2,236.39 (25.73)
Isabela 1,068.76 1,566.48 46.57
Nueva Ecija 1,380.72 1,336.68 (3.19)
Other Provinces 5,137.11 5,110.02 (0.53)
Freshwater Fish cage 25,753.36 25,194.21 (2.17)
Batangas 19,726.64 19,923.91 1.00
Laguna 2,562.71 2,074.50 (19.05)
Camarines Sur 1,691.21 1,551.85 (8.24)
South Cotobato 671.78 803.11 19.55
Ifugao 472.79 252.05 (46.69)
Other Provinces 628.24 588.80 (6.28)
Freshwater Fish pen 4,569.72 4,087.51 (10.55)
Rizal 1,983.65 1,952.70 (1.56)
Sultan Kudarat 2,141.62 1,695.09 (20.85)
Maguindanao 355.01 362.21 2.03
Laguna 71.61 57.29 (20.00)
Lanao del Sur 10.46 11.93 14.06
Other Provinces 7.39 8.29 12.13
Marine Fish Pen/Cage 7.62 7.20 (5.51)
Leyte 7.30 7.00 (4.11)
Other Provinces 0.32 0.20 (37.50)
2009 2010

| FISHERIES SITUATIONER
16
% Change
10/09
TIGER PRAWN 11,311.81 10,374.09 (8.29)
Brackishwater Fishpond
Pampanga 4,672.79 4,329.81 (7.34)
Lanao del Norte 2,011.48 1,765.07 (12.25)
Zamboanga del Sur 791.22 786.08 (0.65)
Bohol 693.20 539.38 (22.19)
Zamboanga Sibugay 674.65 778.01 15.32
Other Provinces* 2,468.48 2,175.74 (11.86)
MUD CRAB 3,539.00 3,591.78 1.49
Brackishwater Fishpond
Lanao del Norte 1,384.50 1,257.96 (9.14)
Sorsogon 1,092.30 1,268.05 16.09
Pampanga 619.50 606.82 (2.05)
Misamis Occidental 83.00 86.04 3.66
Camarines Norte 56.12 65.00 15.82
Other Provinces* 303.58 307.91 1.43
CARP 694.53 664.57 (4.31)
Freshwater Fishpond 59.61 74.08 24.27
Lanao del Norte 14.75 12.76 (13.49)
Quezon 18.18 36.36 100.00
Pampanga 10.17 9.31 (8.46)
Other Provinces 16.52 15.66 (5.21)
Freshwater Fish Pen/Cage 631.80 587.15 (7.07)
Rizal 422.53 416.45 (1.44)
Laguna 192.60 166.28 (13.67)
Manila 11.14 (100.00)
Other Provinces 5.53 4.42 (20.07)
Small Farm Reservoir 3.12 2.95 (5.45)
Quirino 2.15 2.58 20.00
Other Provinces 0.97 0.37 (61.86)
Rice Fish 0.40
Pangasinan 0.40
CATFISH 586.42 609.21 3.89
Freshwater Fishpond
Iloilo 177.14 174.78 (1.33)
Nueva Ecija 89.34 134.00 49.99
Davao City 77.58 72.93 (6.00)
Laguna 35.61 31.27 (4.06)
South Cotabato 35.22 28.24 (19.82)
Other Provinces 171.53 167.99 (2.06)
* - Includes production from marine fishcage and marine fish pens.
P - Preliminary
Top Producing Provinces by Culture Environment and Type of Aquafarm,
Table 7. Aquaculture: Tiger Prawn, Mud Crab, Carp and Catfish Production of
(Metric Tons)
Species/Province 2009 2010
Philippines, January - March 2009 - 2010P

| FISHERIES SITUATIONER 17
Philippines, January - March 2009 - 2010P
% Change
10/09
Seaweed 427,299.42 435,856.03 2.00
Tawi-Tawi 158,901.77 154,452.52 (2.80)
Sulu 59,022.26 62,185.85 5.36
Bohol 29,008.50 32,641.79 12.52
Zamboanga del Norte 3,397.63 30,203.11 788.95
Palawan 37,217.29 21,585.23 (42.00)
Other Provinces 139,751.98 134,787.54 (3.55)
Oyster 4,848.29 5,093.13 5.05
Bulacan 1,763.90 2,232.21 26.55
Capiz 1,426.17 1,359.42 (4.68)
Pangasinan 267.90 282.26 5.36
Iloilo 261.94 223.23 (14.78)
Zamboanga Sibugay 129.31 215.52 66.67
Other Provinces 999.07 780.49 (21.88)
Mussel 6,137.06 5,659.35 (7.78)
Capiz 3,684.07 3,216.19 (12.70)
Samar 784.33 791.00 0.85
Bataan 629.77 610.06 (3.13)
Negros Occidental 525.80 503.24 (4.29)
Cavite 210.84 264.10 25.26
Other Provinces 302.25 274.76 (9.09)
P - Preliminary
Table 8. Aquaculture: Mariculture Production by Species and by Province,
(Metric Tons)
2009 2009Species/Province
| FISHERIES SITUATIONER
18
%%
%
Sp
ecie
sC
ha
ng
eC
ha
ng
eC
ha
ng
e
10
/09
10
/09
10
/09
20
08
20
09
20
10
20
08
20
09
20
10
Milk
fish
70
.36
80
.62
84
.03
4.2
38
1.2
39
7.2
89
8.6
81
.44
10
0.1
11
16
.48
11
7.2
20
.64
10
.87
16
.66
14
.65
29
.75
35
.86
33
.19
Tila
pia
56
.39
70
.02
60
.37
(13
.78
)5
8.9
66
8.9
06
9.7
21
.19
76
.51
86
.20
87
.02
0.9
52
.57
(1.1
2)
9.3
52
0.1
21
6.1
82
6.6
5
Tig
er
Pra
wn
39
4.8
44
02
.24
37
8.5
8(5
.88
)3
77
.01
36
9.2
13
91
.31
5.9
94
22
.95
42
5.6
74
36
.08
2.4
5(1
7.8
3)
(33
.03
)1
2.7
32
8.1
12
3.4
35
7.5
0
Ro
un
dsca
d4
7.1
55
0.6
04
9.4
1(2
.35
)6
2.1
66
5.3
76
5.2
6(0
.17
)8
6.0
28
8.5
18
9.2
20
.80
15
.01
14
.77
15
.85
38
.87
37
.91
39
.81
Frig
ate
Tu
na
53
.31
57
.97
56
.56
(2.4
3)
76
.00
75
.92
80
.67
6.2
68
7.8
19
3.5
19
5.4
32
.05
22
.69
17
.95
24
.11
34
.50
35
.54
38
.87
Ind
ian
Ma
cke
rel
53
.28
55
.89
56
.26
0.6
68
3.3
68
3.2
08
7.7
45
.46
10
2.6
71
08
.06
10
9.0
60
.93
30
.08
27
.31
31
.48
49
.39
52
.17
52
.80
* B
AS
AM
SA
D d
ata
20
08
20
09
20
10
20
08
Ta
ble
9.
Pro
du
ce
r, W
ho
lesa
le a
nd
Re
tail P
ric
es a
nd
Pri
ce
Ma
rgin
s o
f S
ele
cte
d F
ish
Sp
ec
ies,
Ph
ilip
pin
es,
Ja
nu
ary
-
Ma
rch
20
08
- 2
01
0
(Pe
so
pe
r K
ilo
gra
m)
Pro
du
ce
rW
ho
lesa
le*
Re
tail
20
10
Pri
ce
Ma
rgin
20
09
20
10
20
08
20
09
Pro
du
ce
r -
Wh
ole
sa
leP
rod
uce
r -
Re
tail

| FISHERIES SITUATIONER
ISSN-2012-0400
18
DEPARTMENT OF AGRICULTURE
BUREAU OF AGRICULTURAL STATISTICS PHILIPPINES