Embed Size (px)
DESCRIPTION
2009-10 CEGEG046 / GEOG3051 Principles & Practice of Remote Sensing (PPRS) 8: RADAR 1. Dr. Mathias (Mat) Disney UCL Geography Office: 113, Pearson Building Tel: 7670 0592 1 Email: [email protected] www.geog.ucl.ac.uk/~mdisney. OVERVIEW AGENDA. Principles of RADAR, SLAR and SAR - PowerPoint PPT Presentation
Citation preview
2009-10 CEGEG046 / GEOG3051Principles & Practice of Remote Sensing (PPRS) 8: RADAR 1
Dr. Mathias (Mat) Disney
UCL Geography
Office: 113, Pearson Building
Tel: 7670 05921
Email: [email protected]
www.geog.ucl.ac.uk/~mdisney
2
OVERVIEW AGENDA
• Principles of RADAR, SLAR and SAR• Characteristics of RADAR• SAR interferometry• Applications of SAR• Student summaries
3
LECTURE 1PRINCIPLES AND CHARACTERISTICS OF RADAR, SLAR AND SAR
• Examples• Definitions• Principles of RADAR and SAR• Resolution• Frequency• Geometry• Radiometry
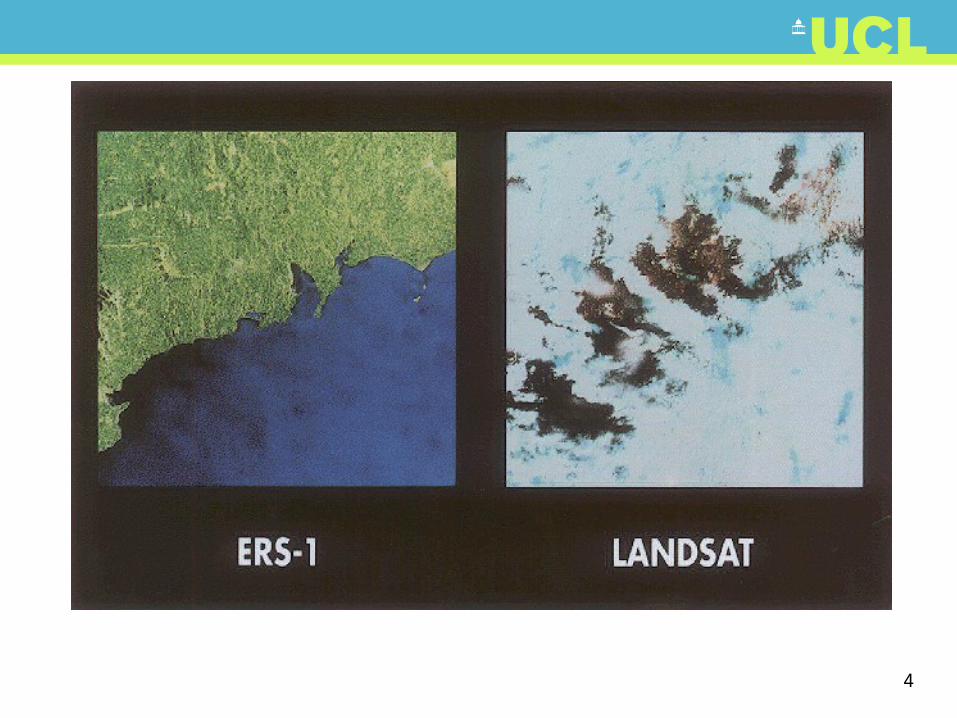
49/8/91 ERS-1 (11.25 am), Landsat (10.43 am)
5
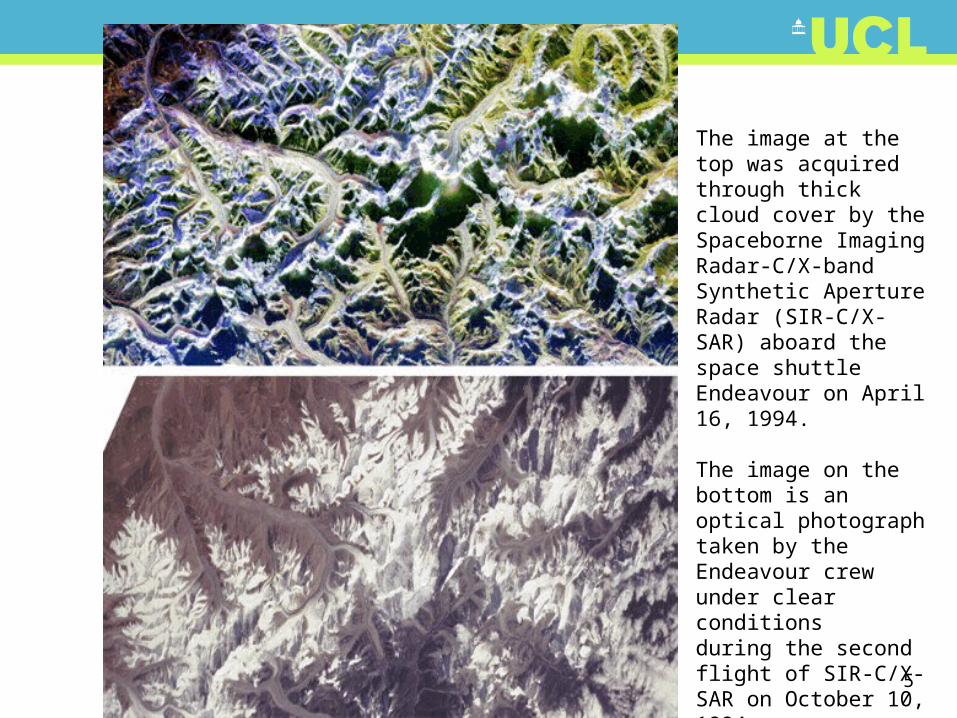
The image at the top was acquired through thick cloud cover by the Spaceborne Imaging Radar-C/X-band Synthetic Aperture Radar (SIR-C/X-SAR) aboard the space shuttle Endeavour on April 16, 1994.
The image on the bottom is an optical photograph taken by the Endeavour crew under clear conditions during the second flight of SIR-C/X-SAR on October 10, 1994
6
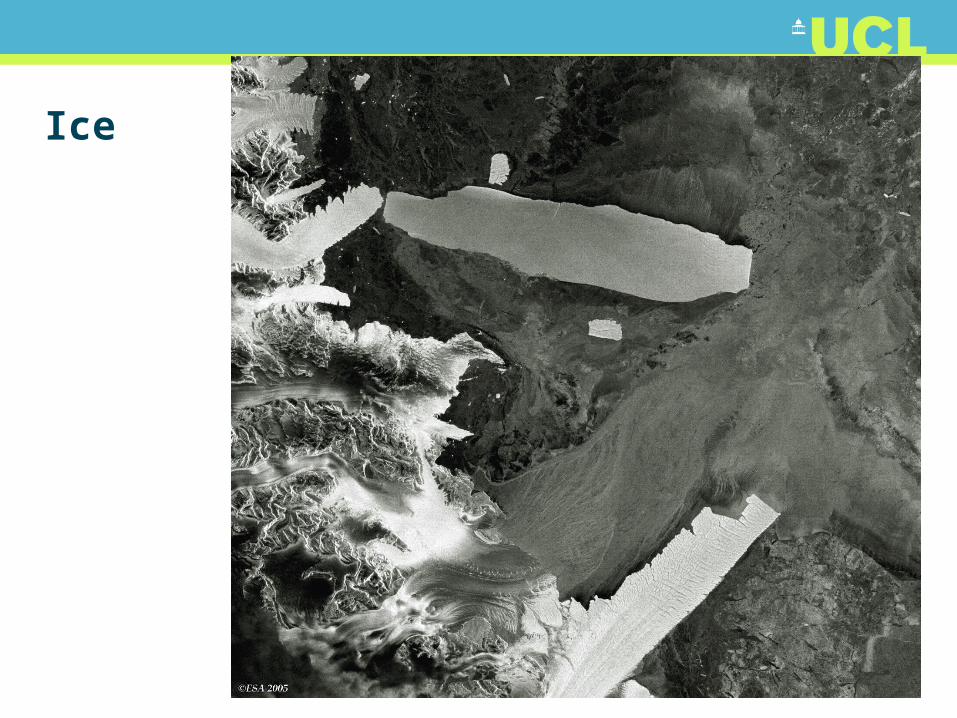
Ice
7
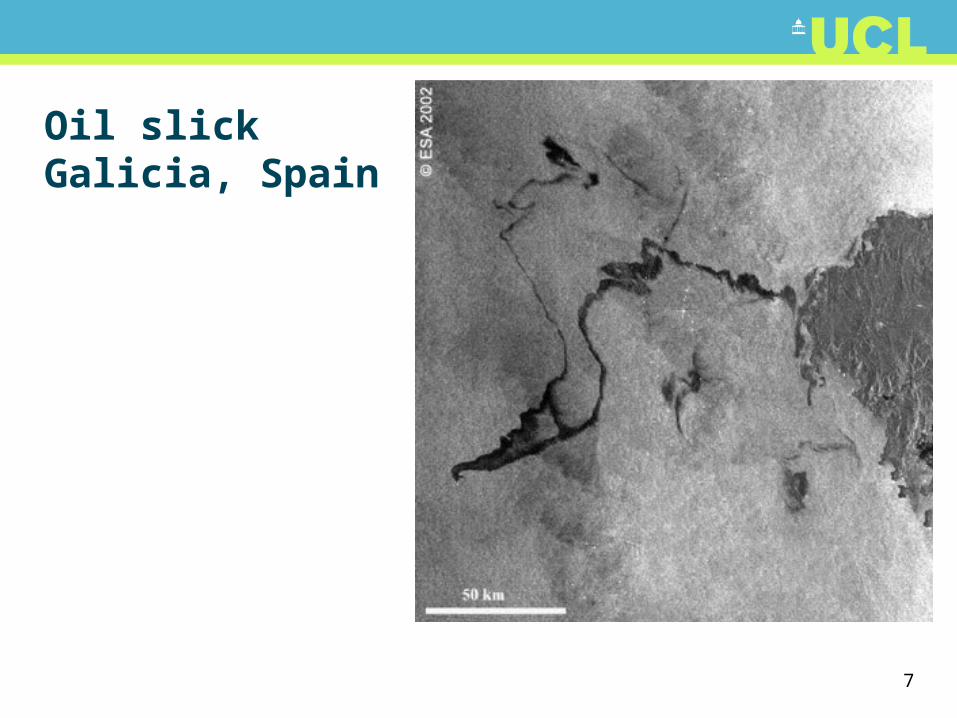
Oil slickGalicia, Spain
8
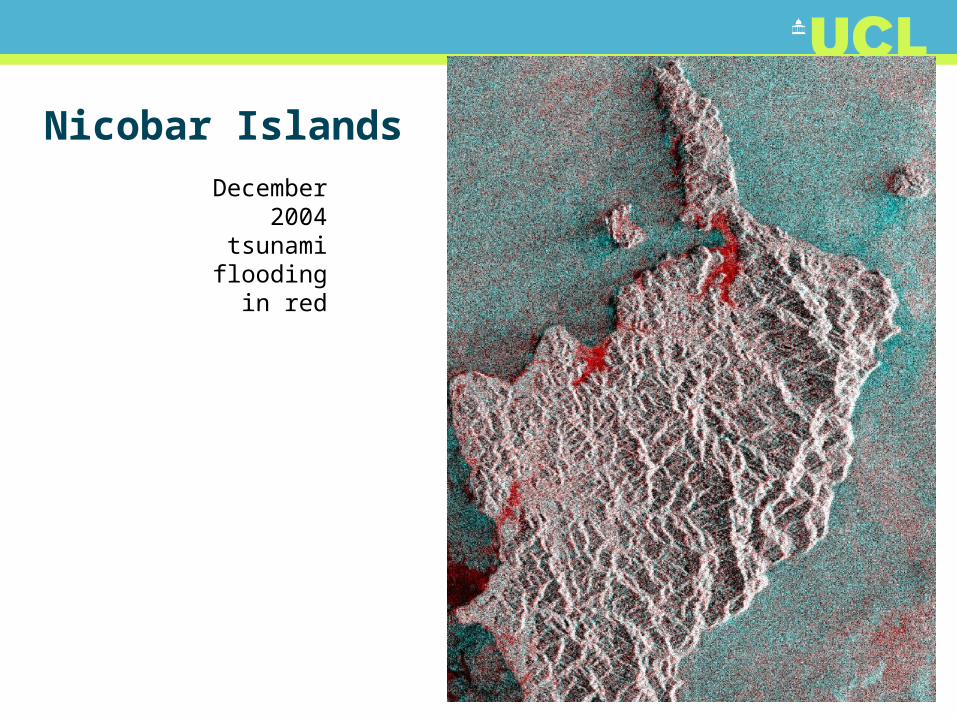
Nicobar Islands
December 2004
tsunami flooding in
red

9
Paris
10
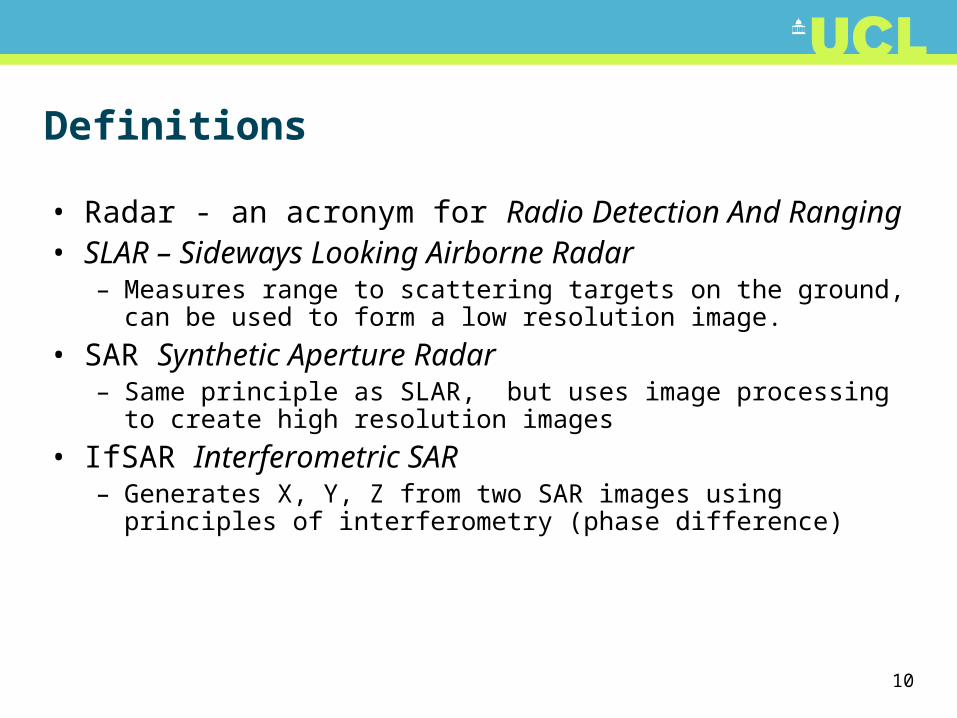
Definitions
• Radar - an acronym for Radio Detection And Ranging• SLAR – Sideways Looking Airborne Radar
– Measures range to scattering targets on the ground, can be used to form a low resolution image.
• SAR Synthetic Aperture Radar– Same principle as SLAR, but uses image processing to create
high resolution images
• IfSAR Interferometric SAR– Generates X, Y, Z from two SAR images using principles of
interferometry (phase difference)
11
References
• Henderson and Lewis, Principles and Applications of Imaging Radar, John Wiley and Sons
• Allan T D (ed) Satellite microwave remote sensing, Ellis Horwood, 1983
• F. Ulaby, R. Moore and A. Fung, Microwave Remote Sensing: Active and Passive (3 vols), 1981, 1982, 1986
• S. Kingsley and S. Quegan, Understanding Radar Systems, SciTech Publishing.
• C. Oliver and S. Quegan, Understanding Synthetic Aperture Radar Images, Artech House, 1998.
• Woodhouse I H (2000) Tutorial review. Stop, look and listen: auditory perception analogies for radar remote sensing, International Journal of Remote Sensing 21 (15), 2901-2913.
• Jensen, J. R. (2000) Remote sensing of the Environment, Chapter 9.
12
Web sites
Canada• http://www.ccrs.nrcan.gc.ca/resource/tutor/fundam/chapter
3/01_e.php• ftp://ftp2.ccrs.nrcan.gc.ca/ftp/ad/MAS/fundamentals_e.pdf
ESA• http://earth.esa.int/applications/data_util/SARDOCS/space
borne/Radar_Courses/
13
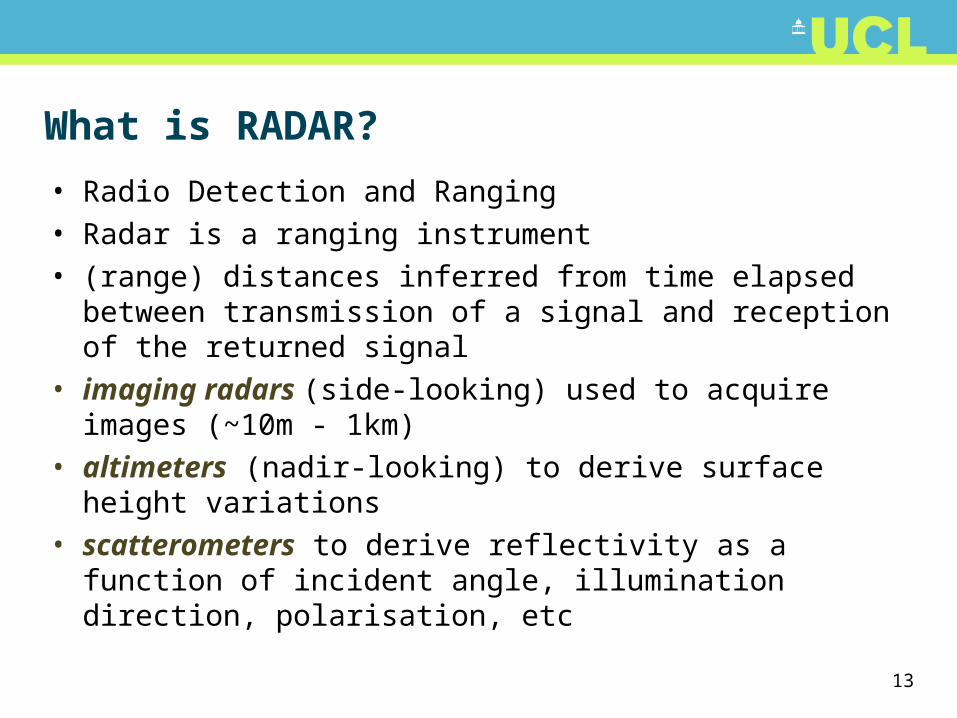
What is RADAR?
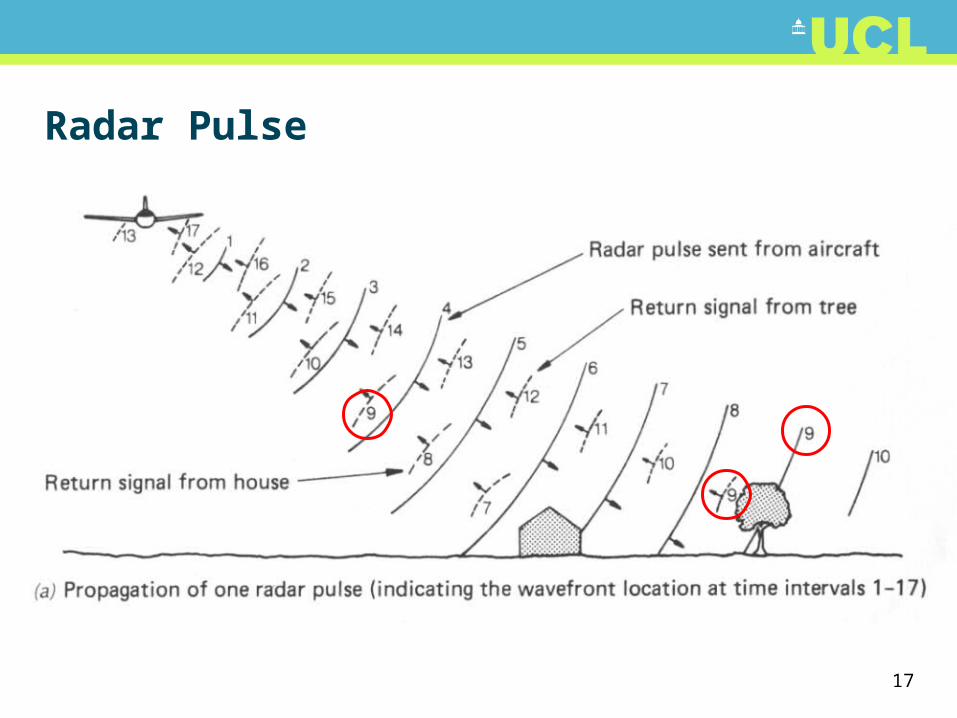
• Radio Detection and Ranging• Radar is a ranging instrument• (range) distances inferred from time elapsed between
transmission of a signal and reception of the returned signal
• imaging radars (side-looking) used to acquire images (~10m - 1km)
• altimeters (nadir-looking) to derive surface height variations
• scatterometers to derive reflectivity as a function of incident angle, illumination direction, polarisation, etc
14
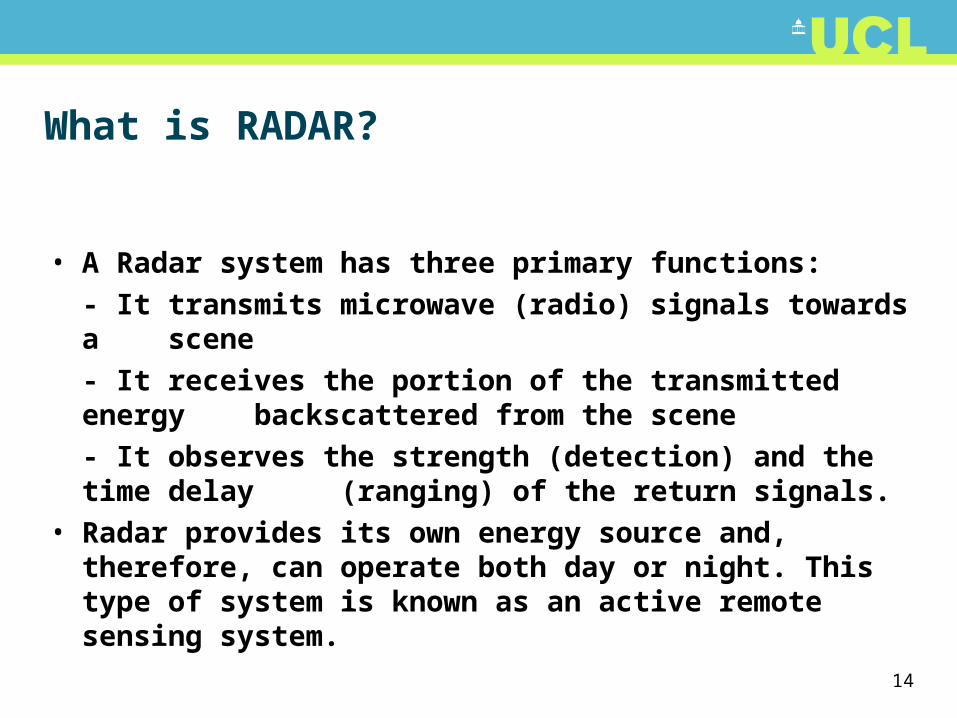
What is RADAR?
• A Radar system has three primary functions:
- It transmits microwave (radio) signals towards a scene
- It receives the portion of the transmitted energy backscattered from the scene
- It observes the strength (detection) and the time delay (ranging) of the return signals.
• Radar provides its own energy source and, therefore, can operate both day or night. This type of system is known as an active remote sensing system.
15
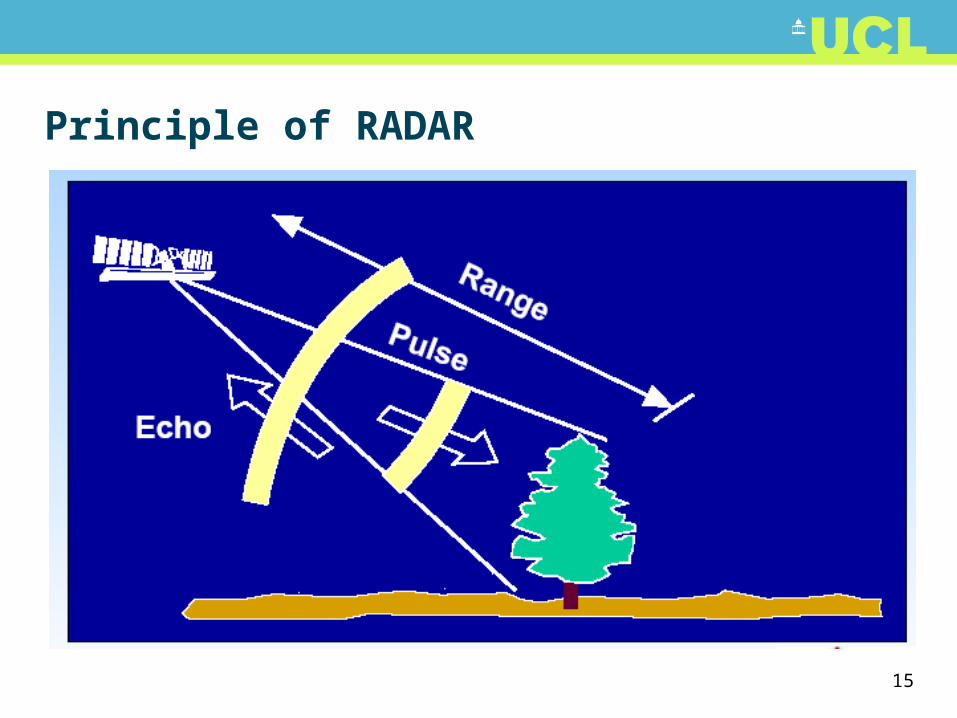
Principle of RADAR
16
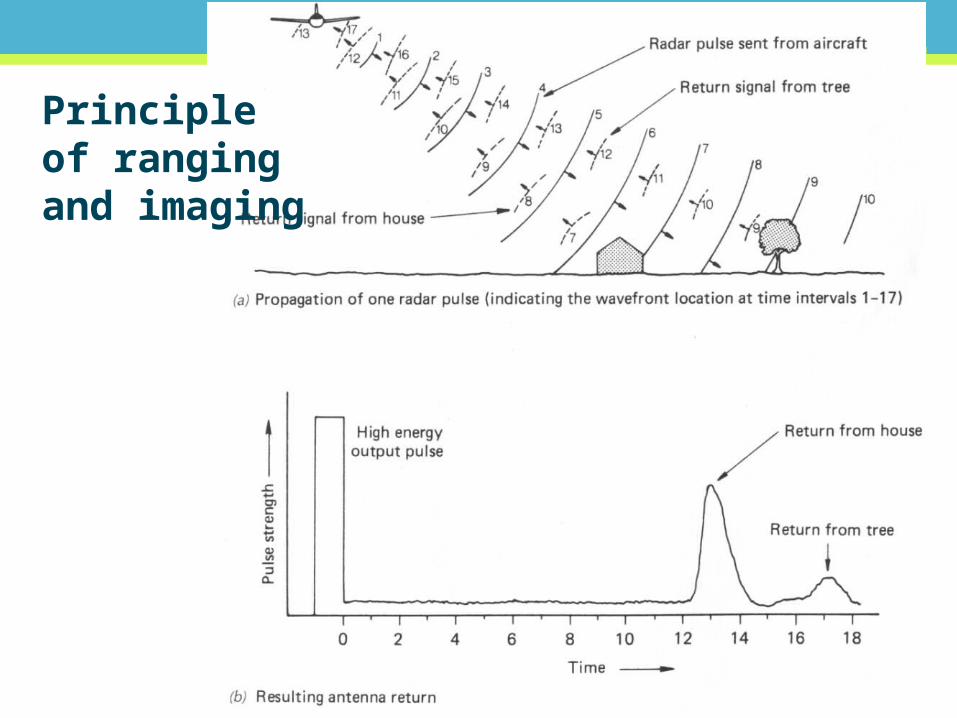
Principle of ranging and imaging
17
Radar Pulse
18
19
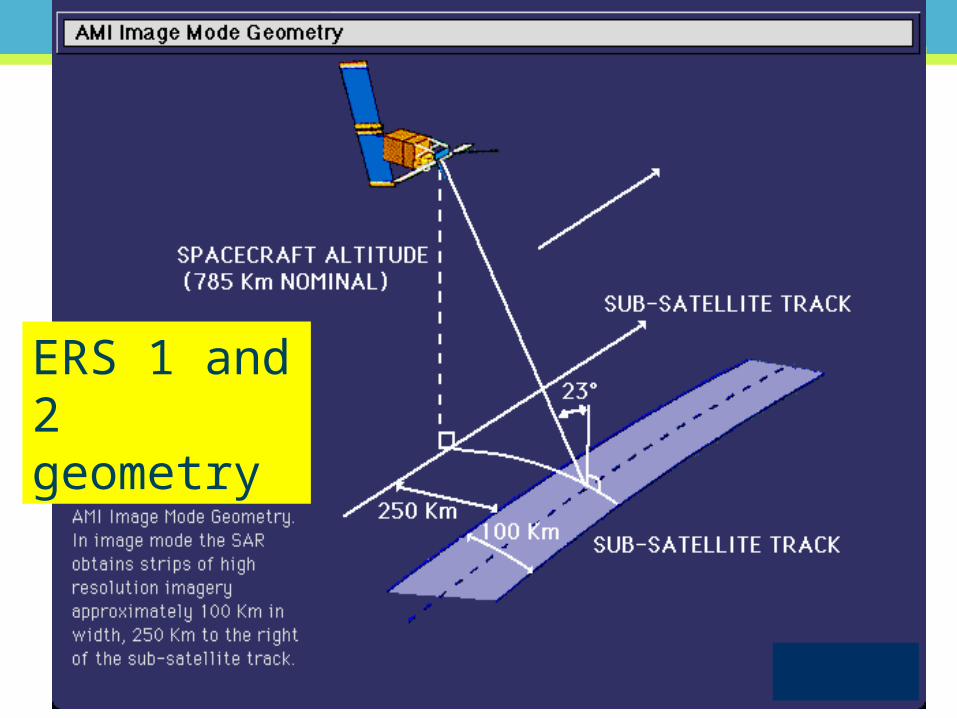
ERS 1 and 2geometry
20
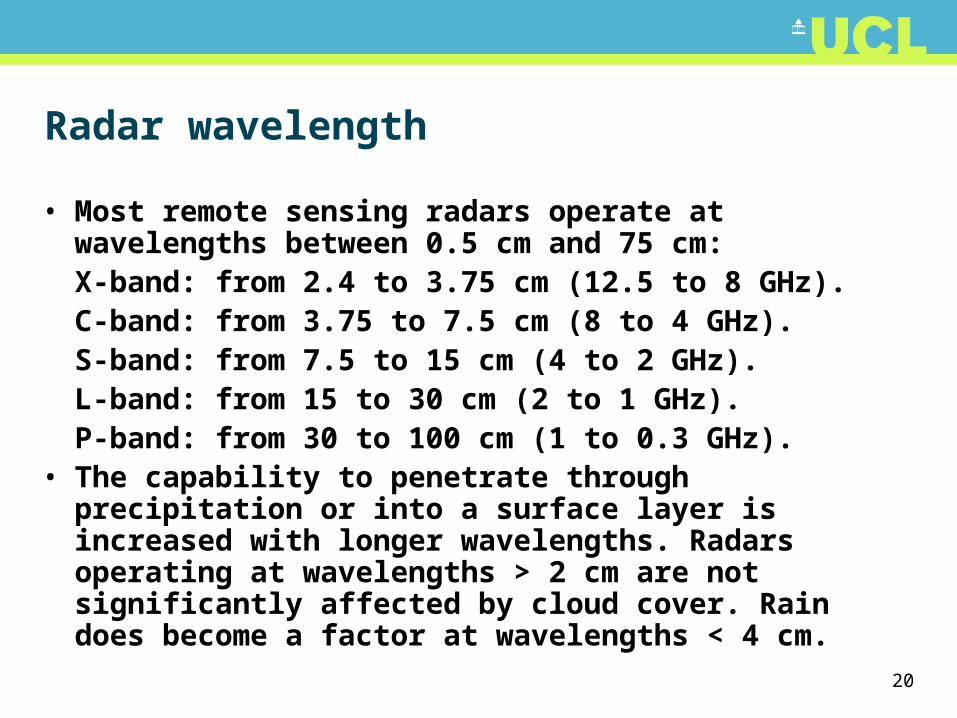
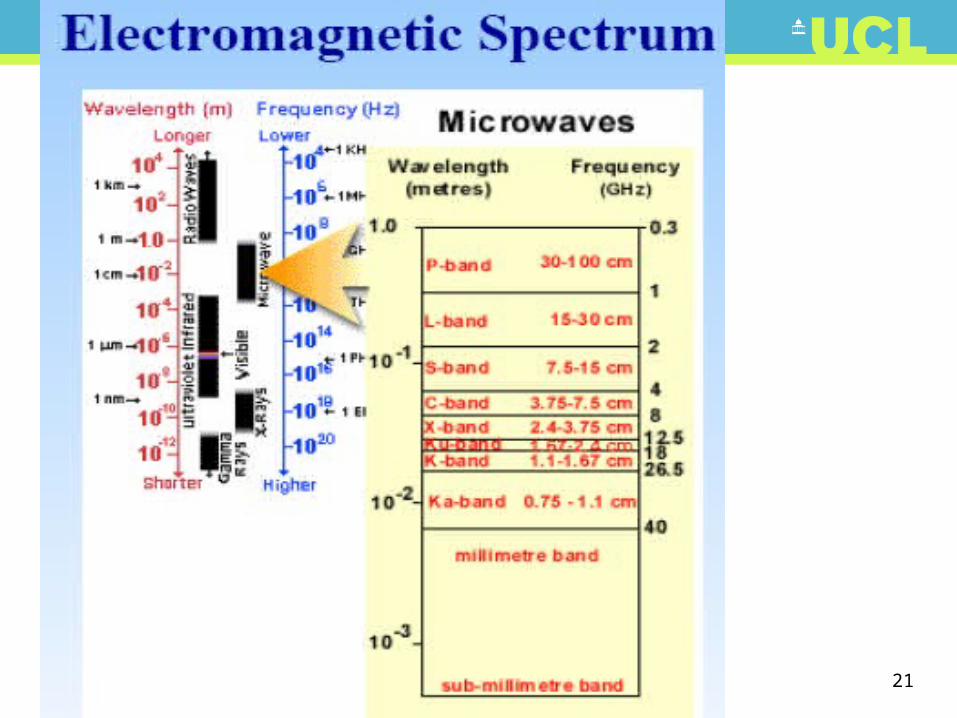
Radar wavelength
• Most remote sensing radars operate at wavelengths between 0.5 cm and 75 cm:
X-band: from 2.4 to 3.75 cm (12.5 to 8 GHz). C-band: from 3.75 to 7.5 cm (8 to 4 GHz). S-band: from 7.5 to 15 cm (4 to 2 GHz).L-band: from 15 to 30 cm (2 to 1 GHz). P-band: from 30 to 100 cm (1 to 0.3 GHz).
• The capability to penetrate through precipitation or into a surface layer is increased with longer wavelengths. Radars operating at wavelengths > 2 cm are not significantly affected by cloud cover. Rain does become a factor at wavelengths < 4 cm.
21
22
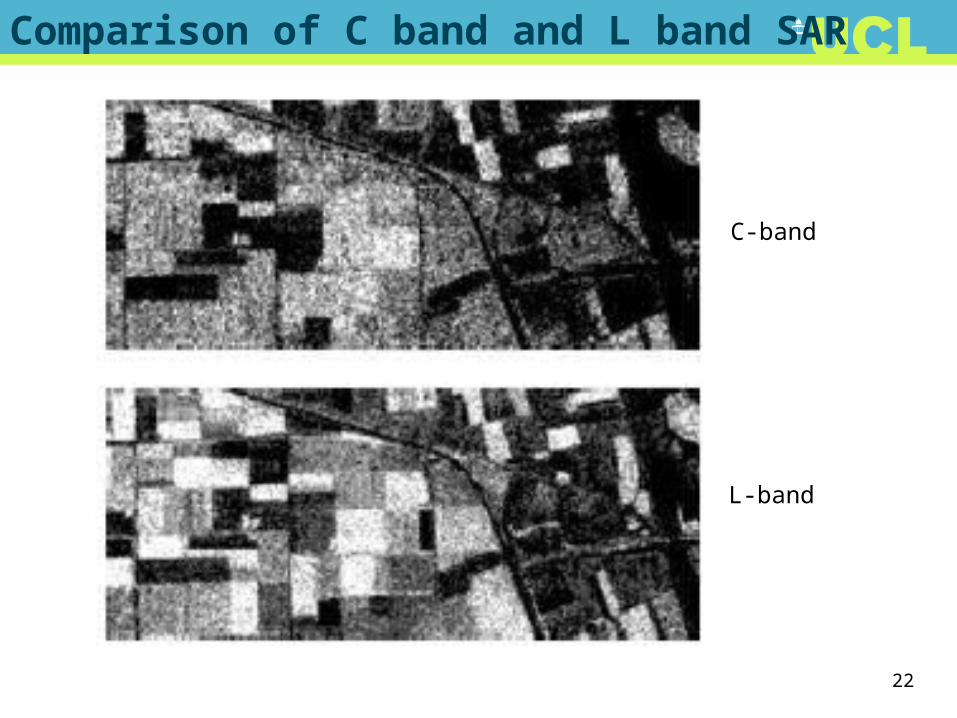
Comparison of C band and L band SAR
C-band
L-band
23
24
Choice of wave length
• Radar wavelength should be matched to the size of the surface features that we wish to discriminate
• – e.g. Ice discrimination, small features, use X-band• – e.g. Geology mapping, large features, use L-band• – e.g. Foliage penetration, better at low frequencies,
use P-band• In general, C-band is a good compromise• New airborne systems combine X and P band to give
optimum measurement of vegetation
25
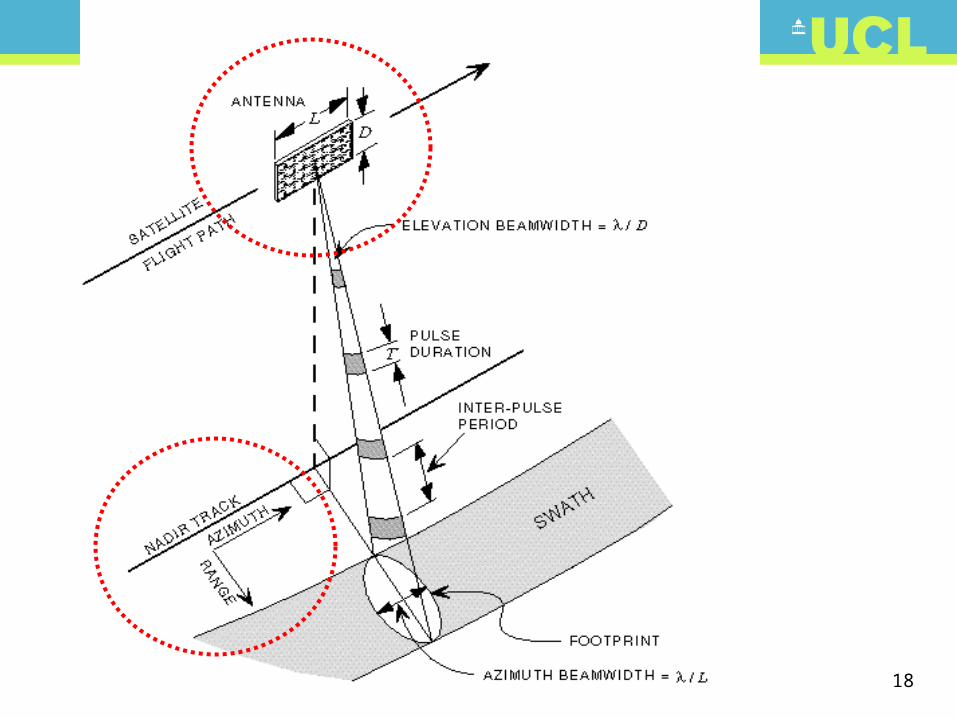
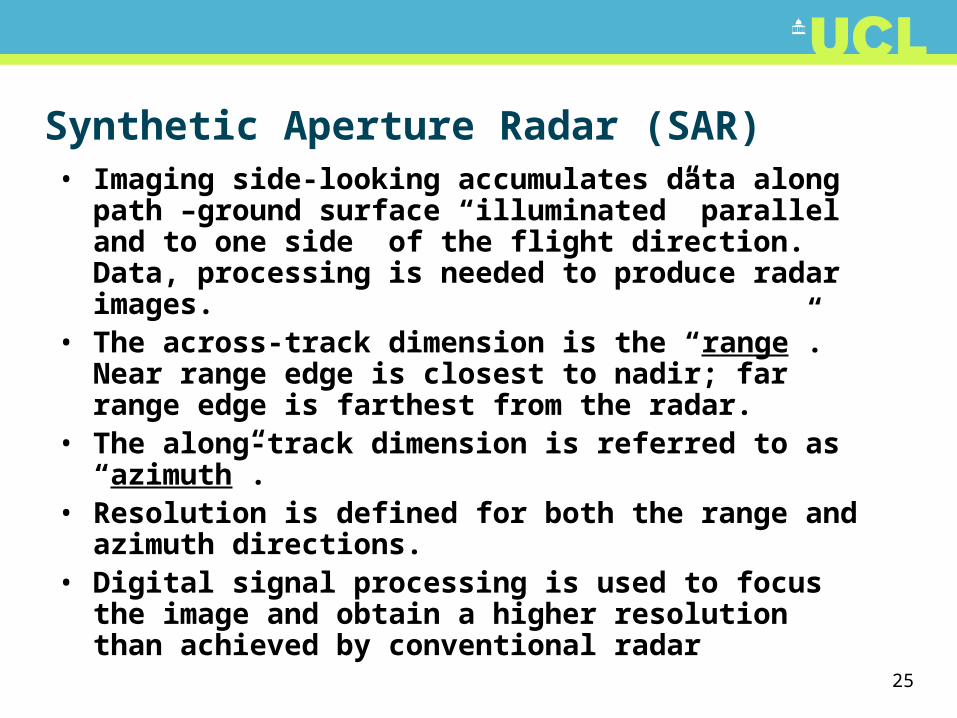
Synthetic Aperture Radar (SAR)• Imaging side-looking accumulates data along path –
ground surface “illuminated” parallel and to one side of the flight direction. Data, processing is needed to produce radar images.
• The across-track dimension is the “range”. Near range edge is closest to nadir; far range edge is farthest from the radar.
• The along-track dimension is referred to as “azimuth”.• Resolution is defined for both the range and azimuth
directions.• Digital signal processing is used to focus the image
and obtain a higher resolution than achieved by conventional radar
26
27
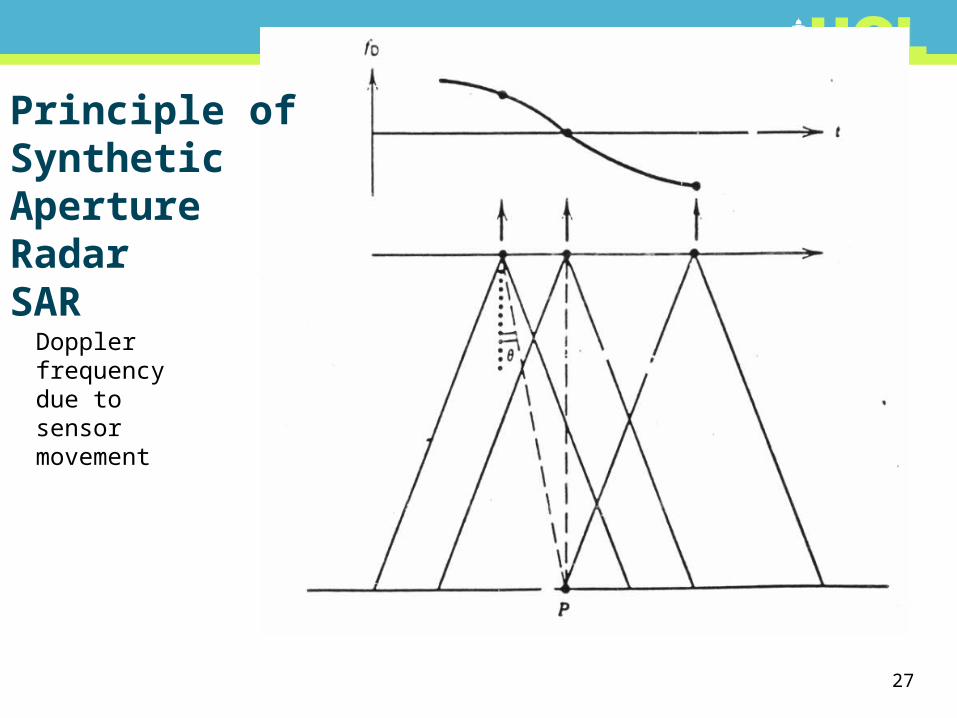
Principle of Synthetic Aperture Radar
SARDoppler frequency due to sensor movement
28
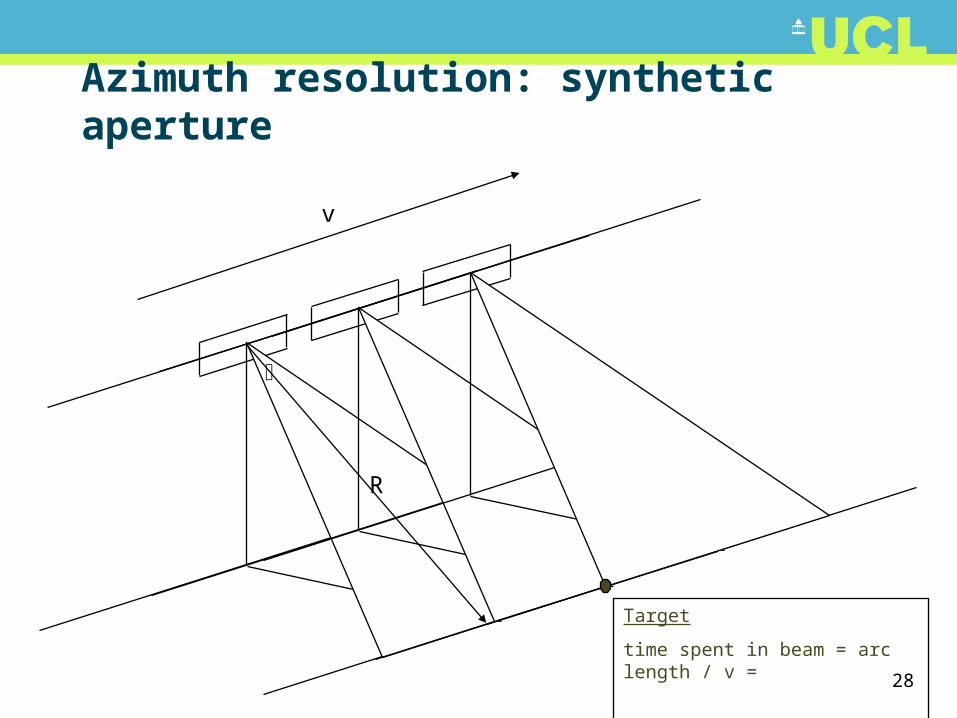
Azimuth resolution: synthetic aperture
Target
time spent in beam = arc length / v =
Rv = R / vLa
v
R
29
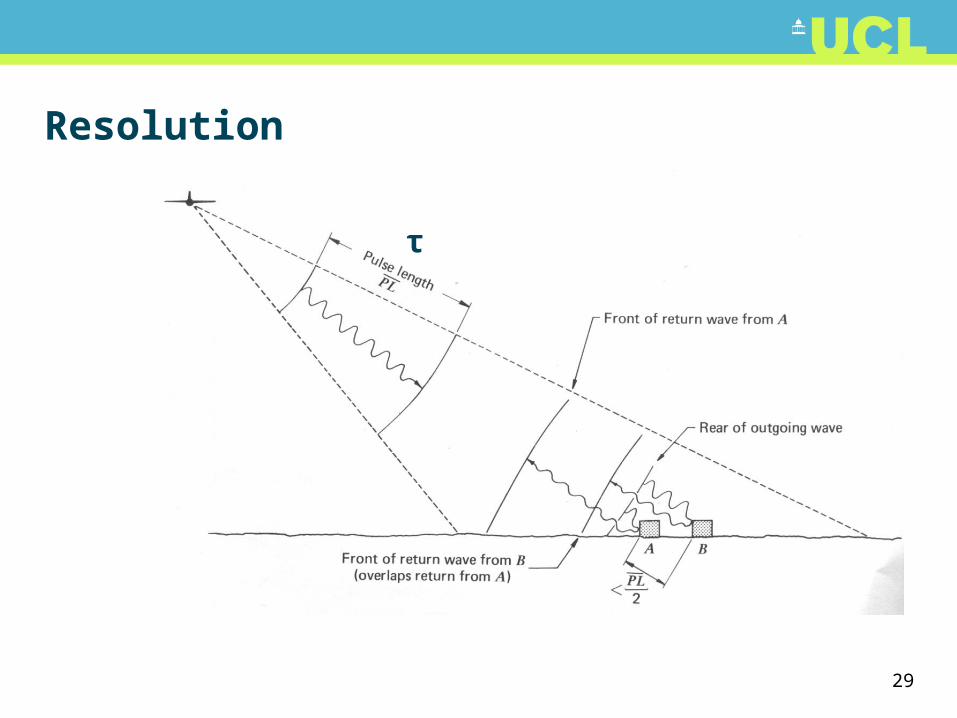
Resolution
τ
30
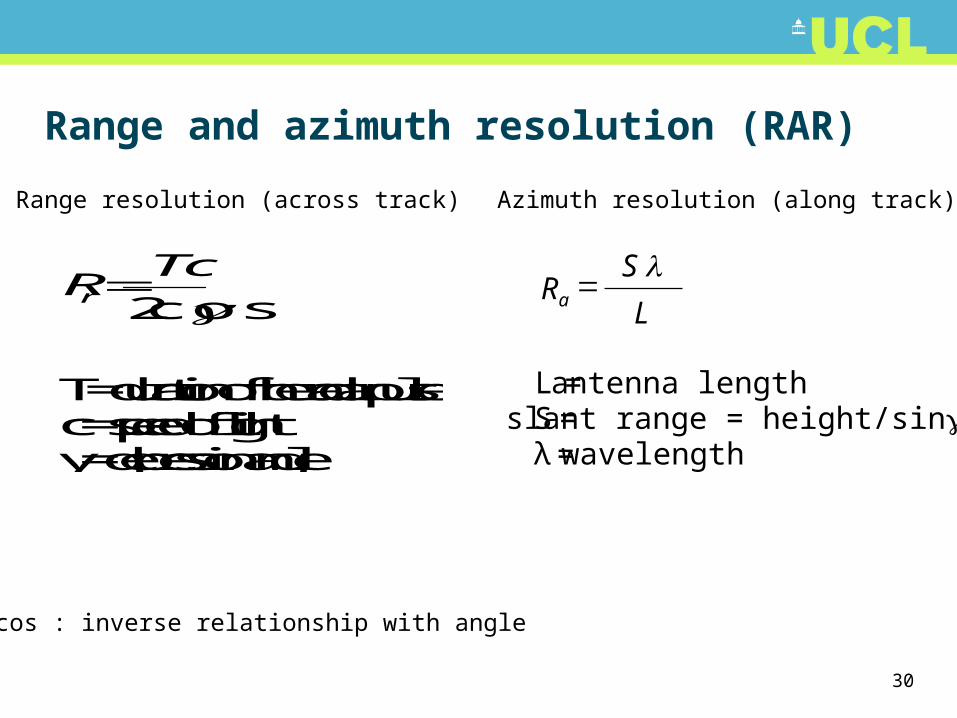
Range and azimuth resolution (RAR)
cos2
TcRr
T = duration of the radar pulse c = speed of light γ = depression angle
Range resolution (across track)
L
SRa
L = antenna length S = slant range = height/sinλ = wavelength
Azimuth resolution (along track)
cos : inverse relationship with angle
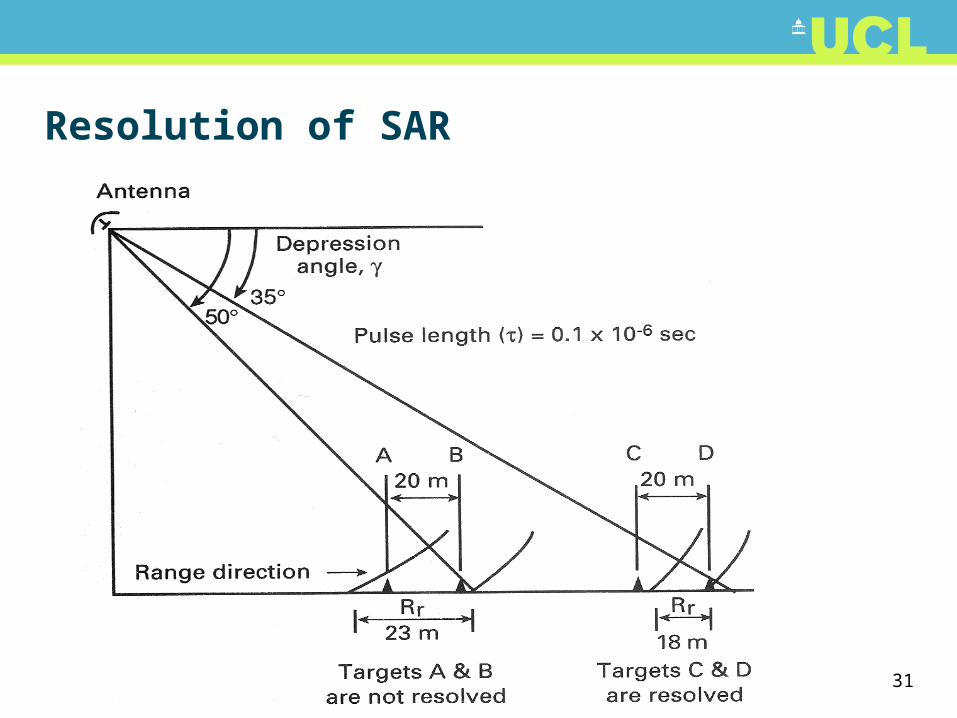
31
Resolution of SAR
32
Important point
• Resolution cell (i.e. the cell defined by the resolutions in the range and azimuth directions) does NOT mean the same thing as pixel. Pixel sizes need not be the same thing. This is important since (i) the independent elements in the scene are resolutions cells, (ii) neighbouring pixels may exhibit some correlation.
33
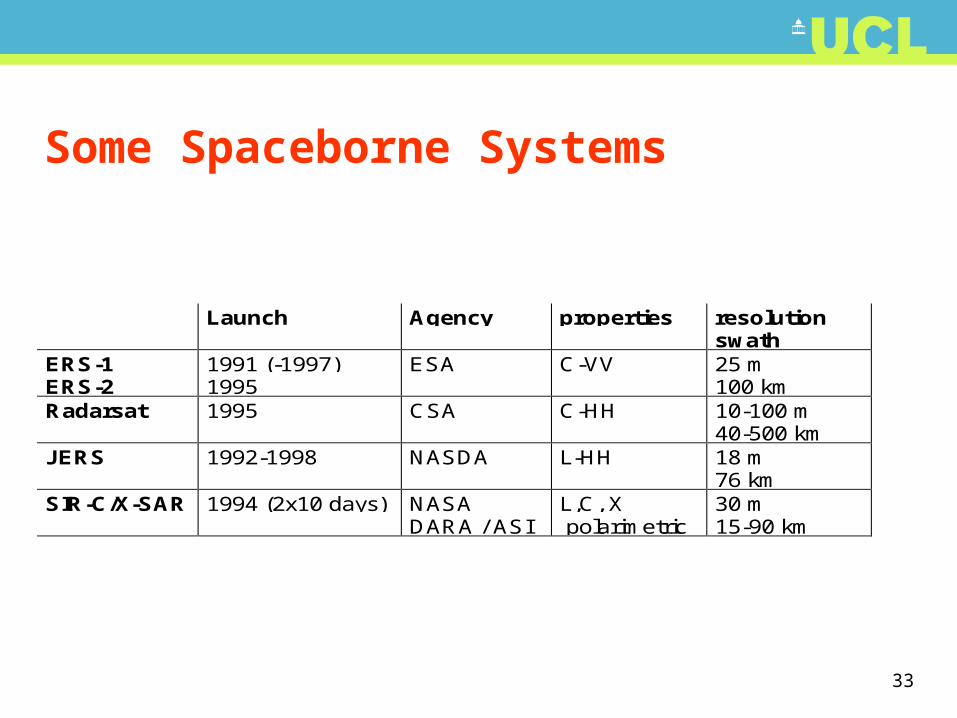
Some Spaceborne Systems
Launch Agency properties resolutionswath
ERS-1ERS-2
1991 (-1997)1995
ESA C-VV 25 m100 km
Radarsat 1995 CSA C-HH 10-100 m40-500 km
JERS 1992-1998 NASDA L-HH 18 m76 km
SIR-C/X-SAR 1994 (2x10 days) NASADARA / ASI
L,C, X polarimetric
30 m15-90 km
34
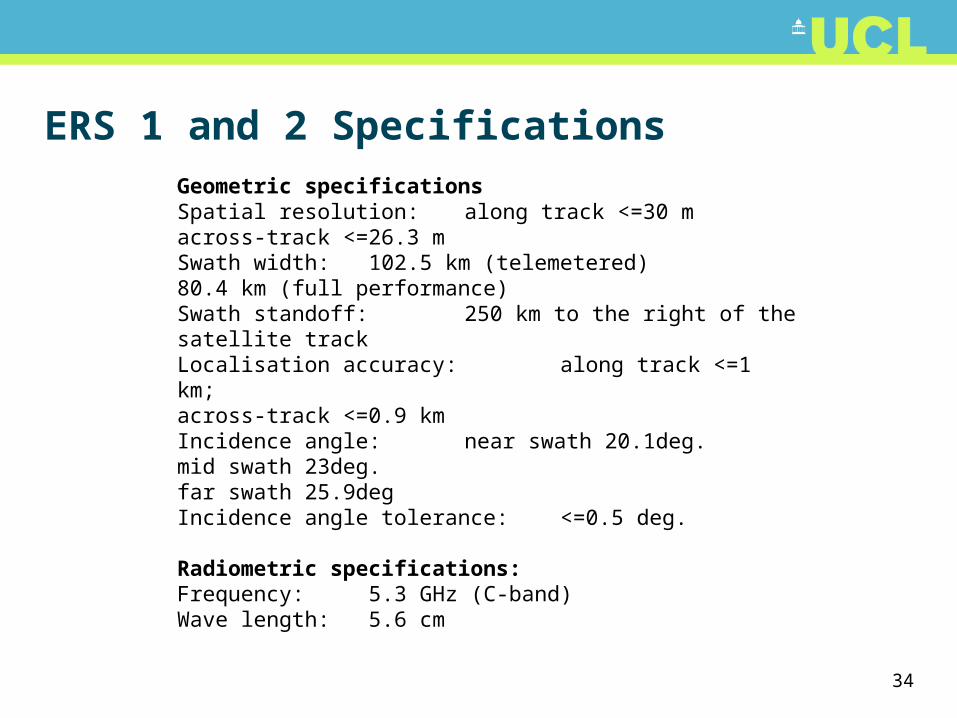
ERS 1 and 2 SpecificationsGeometric specifications Spatial resolution: along track <=30 m across-track <=26.3 m Swath width: 102.5 km (telemetered) 80.4 km (full performance) Swath standoff: 250 km to the right of the satellite track Localisation accuracy: along track <=1 km; across-track <=0.9 km Incidence angle: near swath 20.1deg. mid swath 23deg. far swath 25.9deg Incidence angle tolerance: <=0.5 deg.
Radiometric specifications: Frequency: 5.3 GHz (C-band) Wave length: 5.6 cm
35
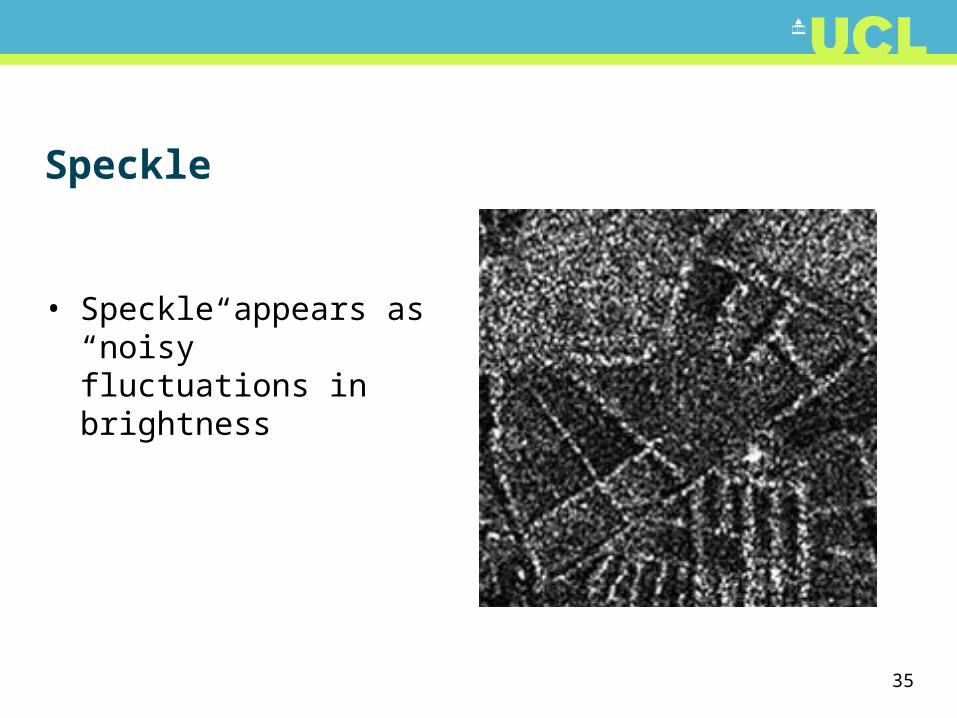
Speckle
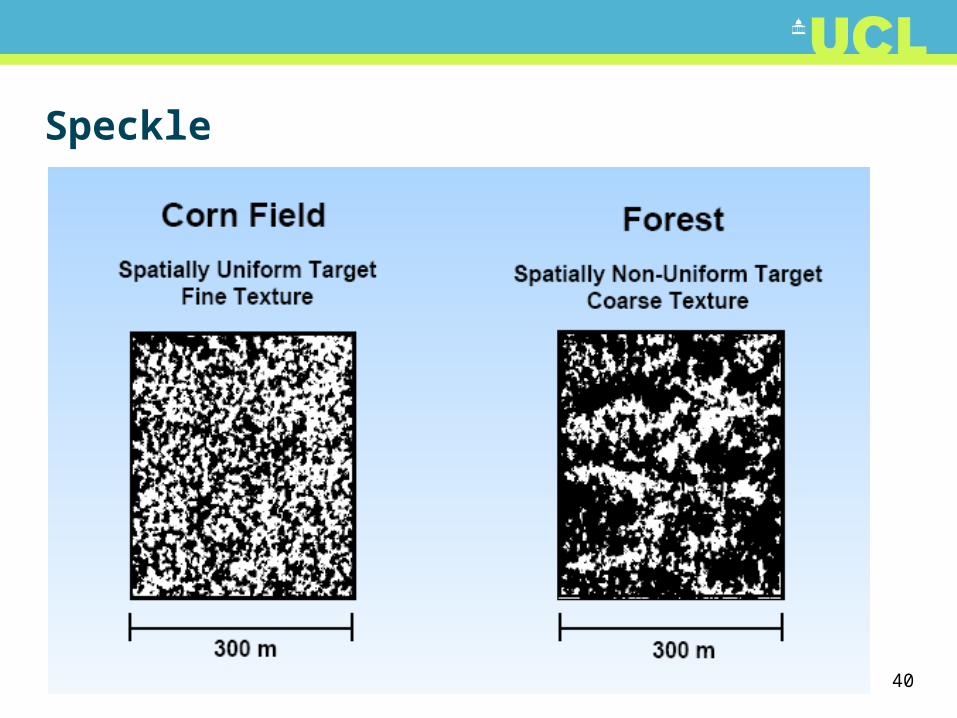
• Speckle appears as “noisy” fluctuations in brightness
36
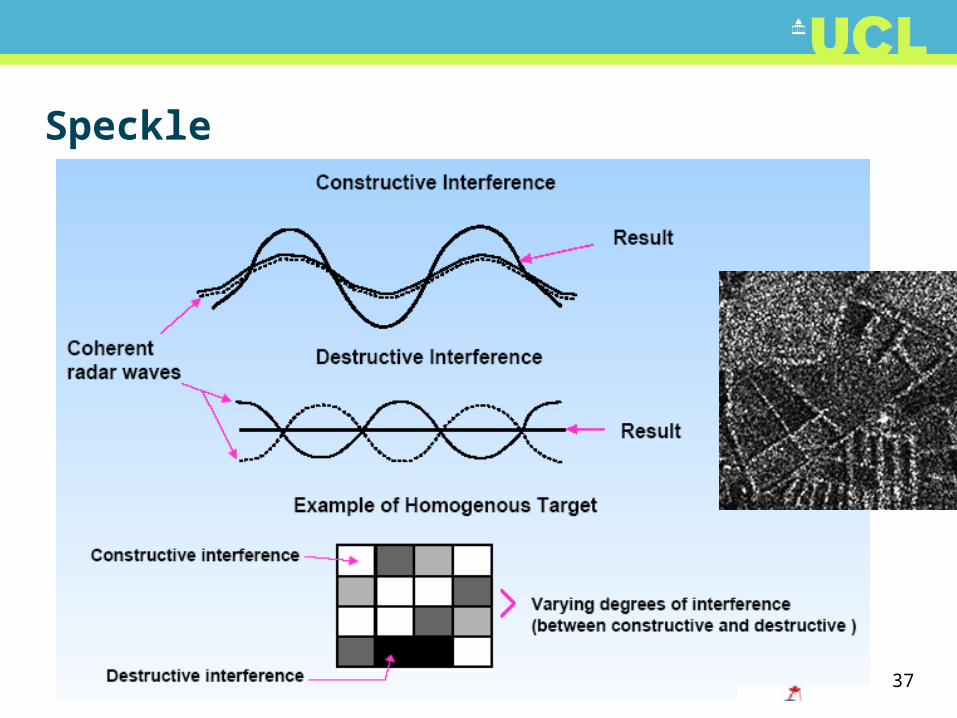
Speckle
• Fading and speckle are the inherent “noise-like” processes which degrade image quality in a coherent imaging system.
• Local constructive and destructive interference appears in the image as bright and dark speckles, respectively.
• Using independent data sets to estimate the same ground patch, by average independent samples, can effectively reduce the effects of speckle. This can be done by:
• Multiple-look filtering, separates the maximum synthetic aperture into smaller sub-apertures generating independent looks at target areas based on the angular position of the targets. Therefore, looks are different Doppler frequency bands.
• Averaging (incoherently) adjacent pixels.• Reducing these effects enhances radiometric resolution at the
expense of spatial resolution.
37
Speckle
38
Speckle
• Radar images are formed coherently and therefore inevitably have a “noise-like” appearance
• Implies that a single pixel is not representative of the backscattering
• “Averaging” needs to be done
39
Multi-looking
• Speckle can be suppressed by “averaging” several intensity images
• This is often done in SAR processing• Split the synthetic aperture into N separate parts• Suppressing the speckle means decreasing the width
of the intensity distribution• We also get a decrease in spatial resolution by the
same factor (N)• Note this is in the azimuth direction (because it
relies on the motion of the sensor which is in this direction)
40
Speckle

41
Principle of ranging and imaging
42
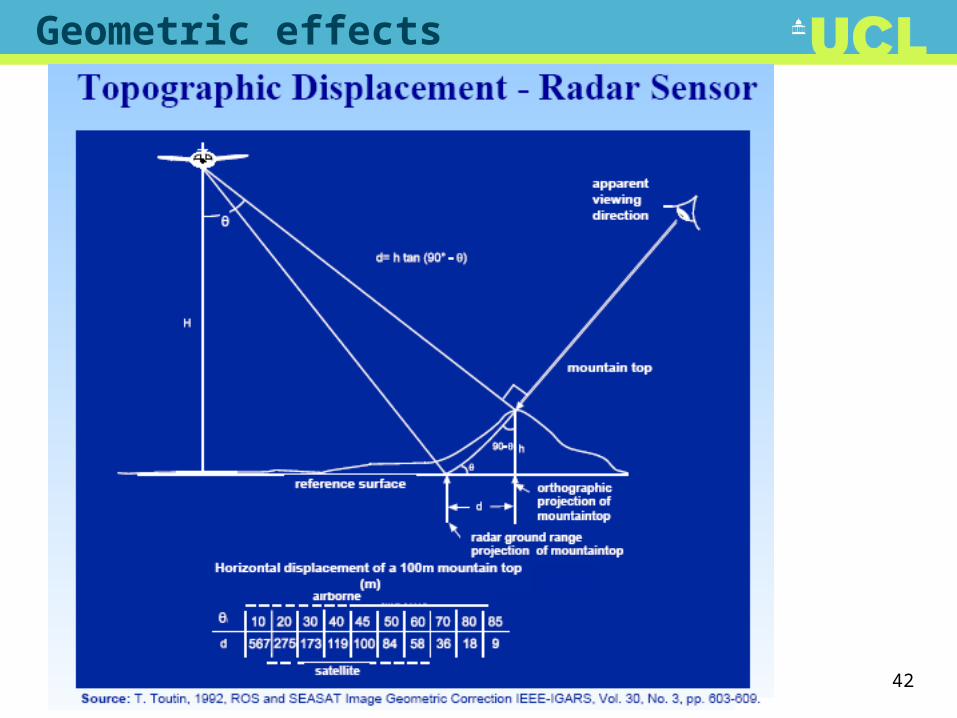
Geometric effects
43
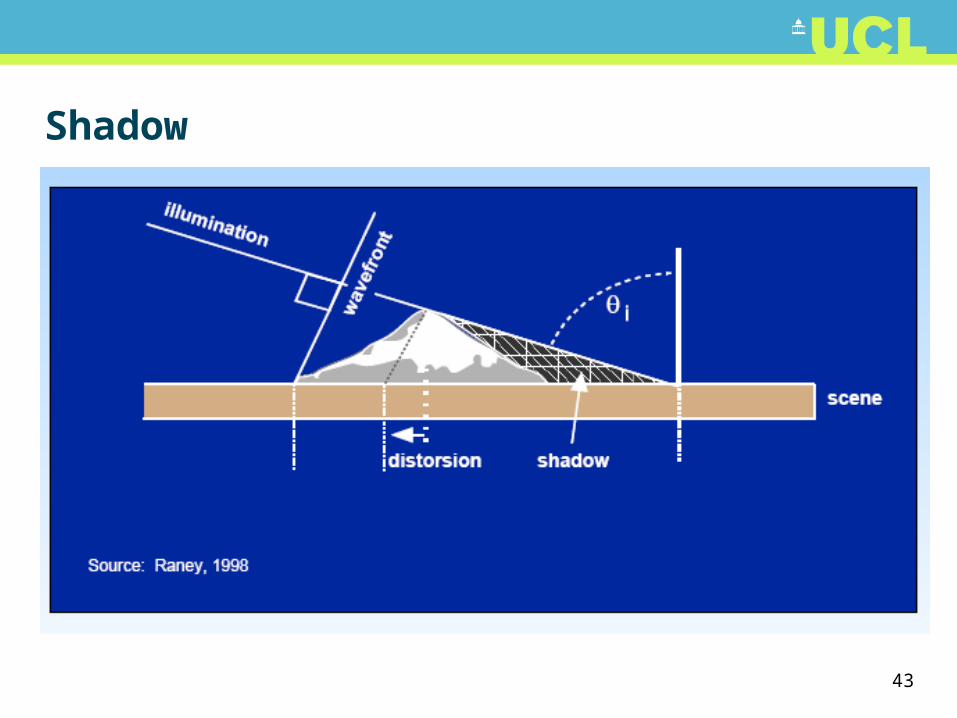
Shadow
44
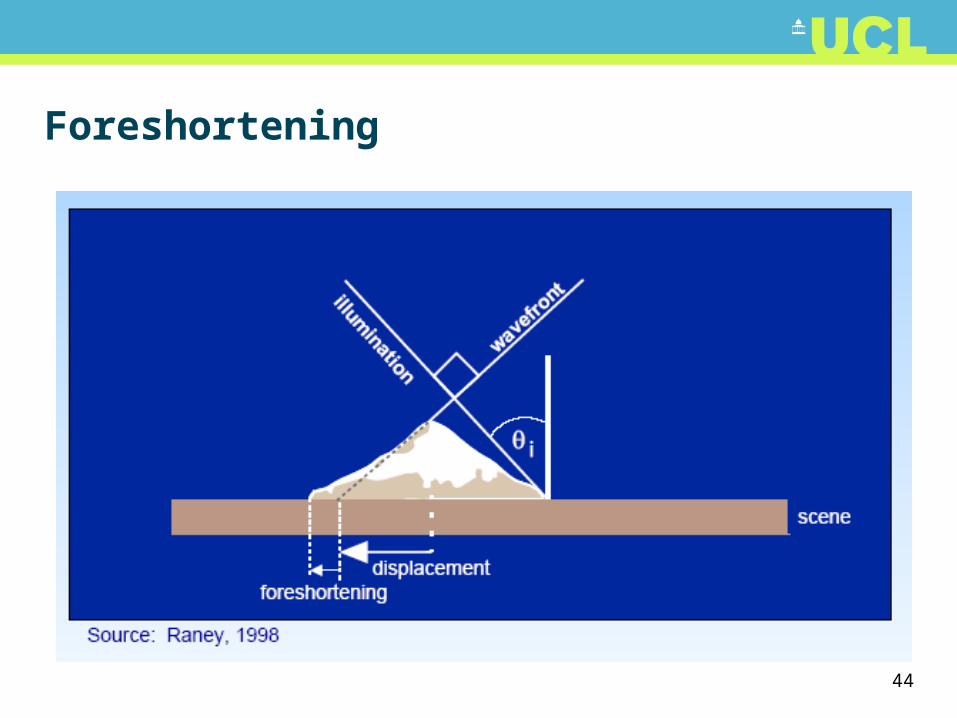
Foreshortening
45
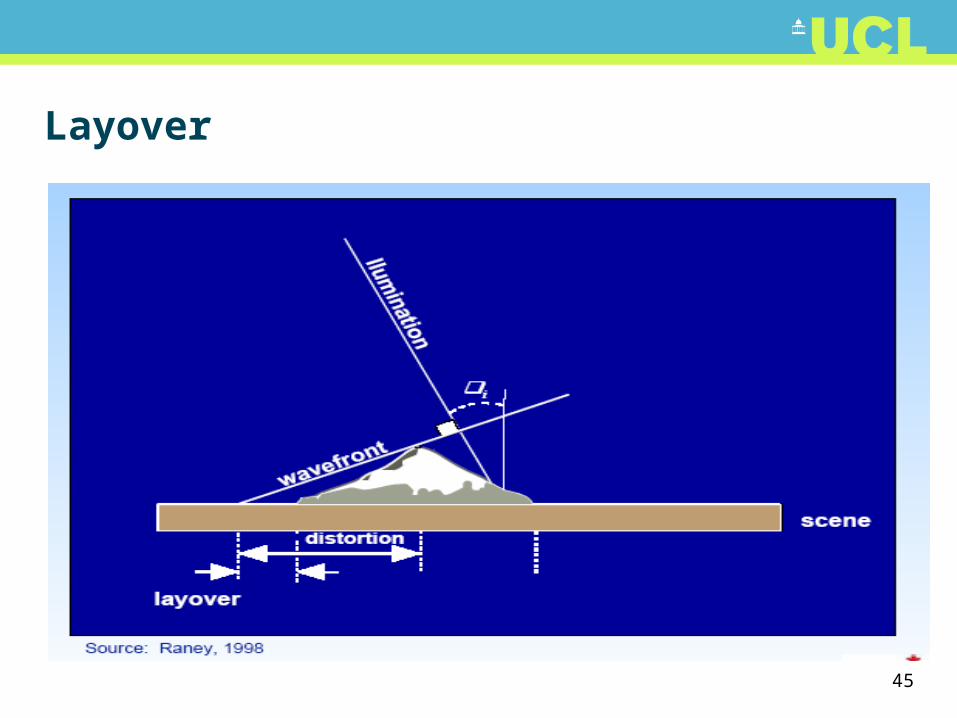
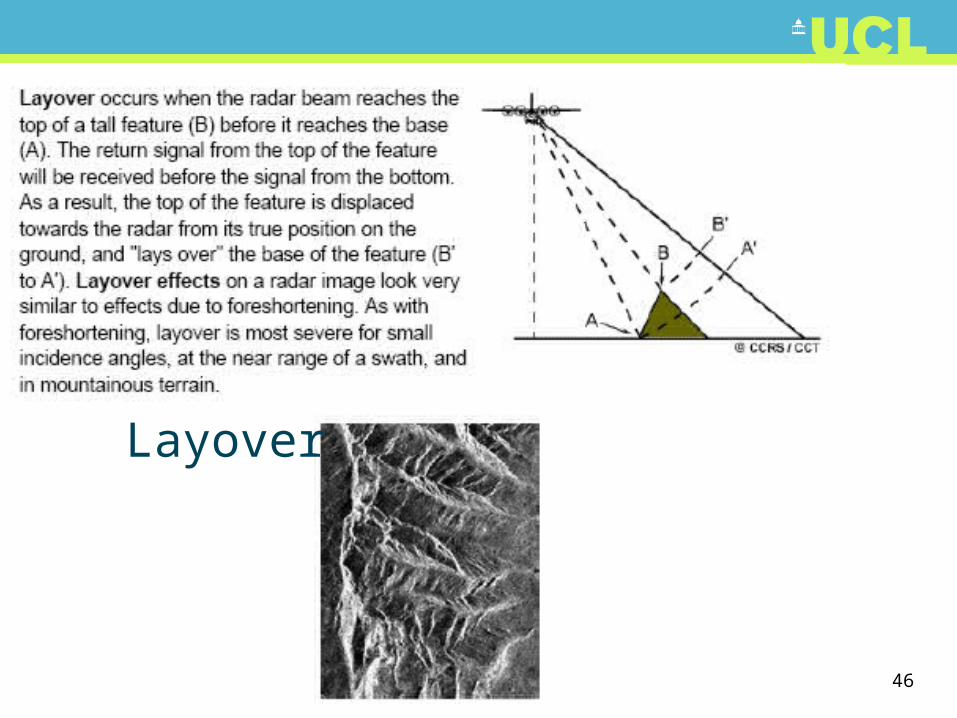
Layover
46
Layover
47
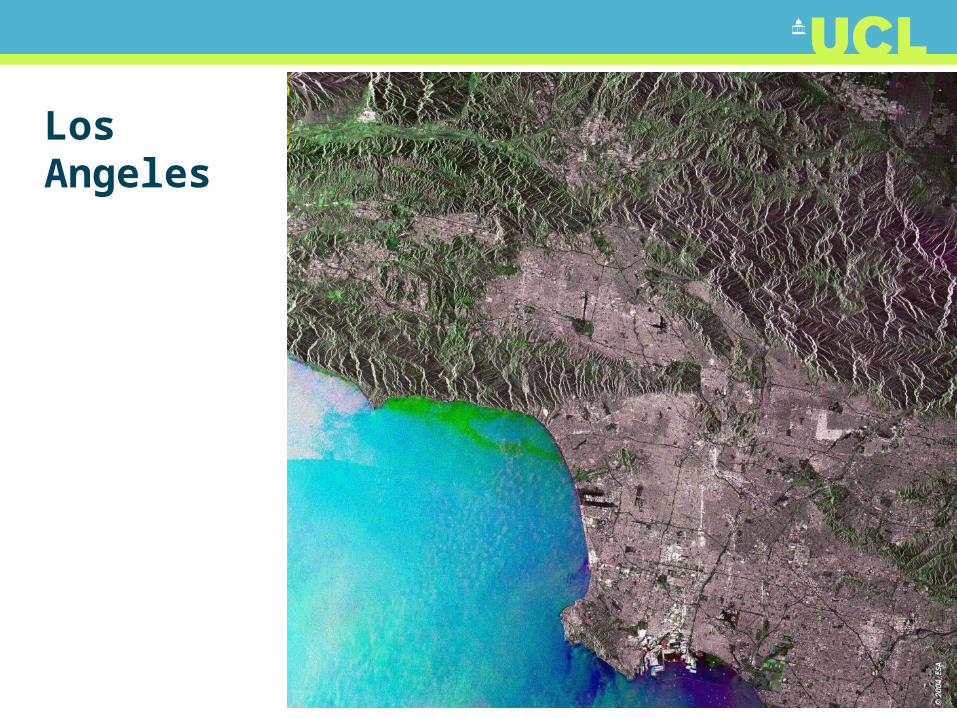
LosAngeles
48
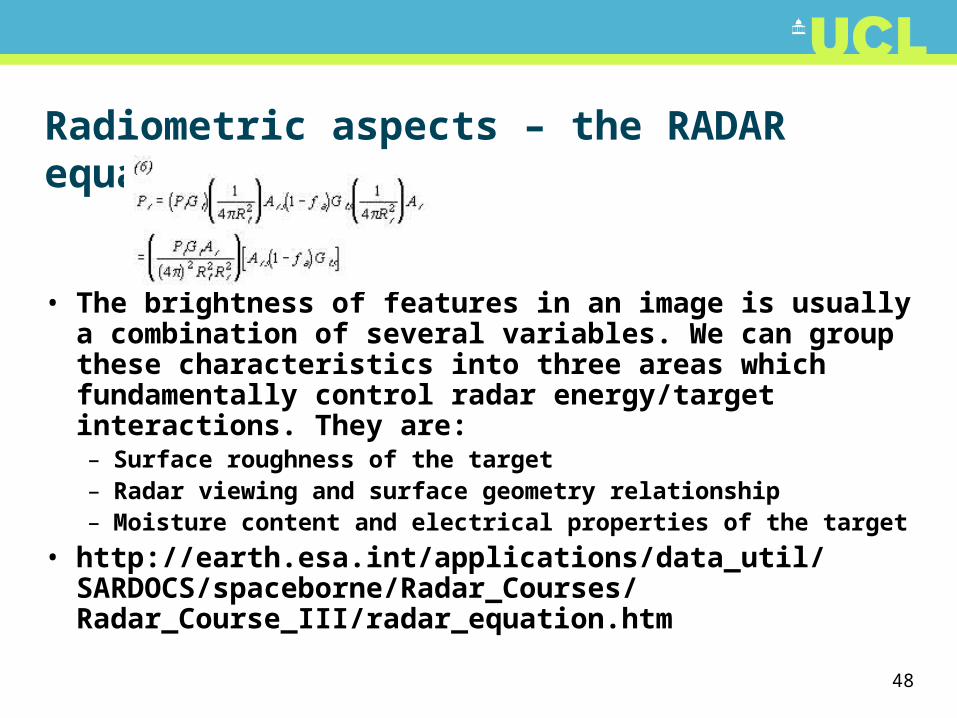
Radiometric aspects – the RADAR equation
• The brightness of features in an image is usually a combination of several variables. We can group these characteristics into three areas which fundamentally control radar energy/target interactions. They are:– Surface roughness of the target– Radar viewing and surface geometry relationship– Moisture content and electrical properties of the target
• http://earth.esa.int/applications/data_util/SARDOCS/spaceborne/Radar_Courses/Radar_Course_III/radar_equation.htm
49
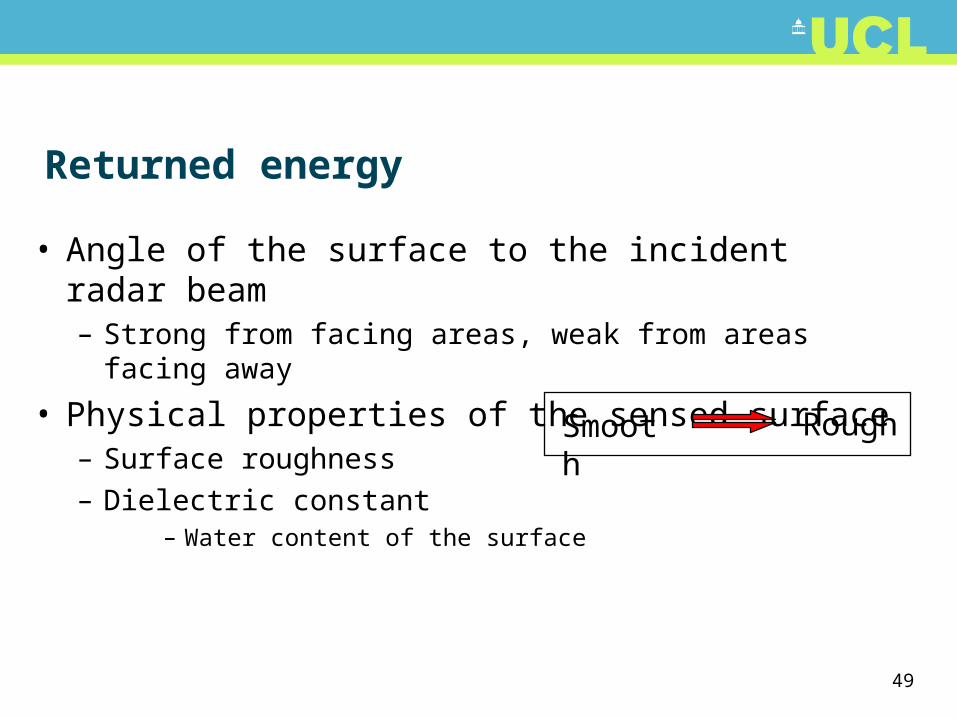
Returned energy
• Angle of the surface to the incident radar beam– Strong from facing areas, weak from areas facing away
• Physical properties of the sensed surface– Surface roughness– Dielectric constant
– Water content of the surface
Smooth Rough
50
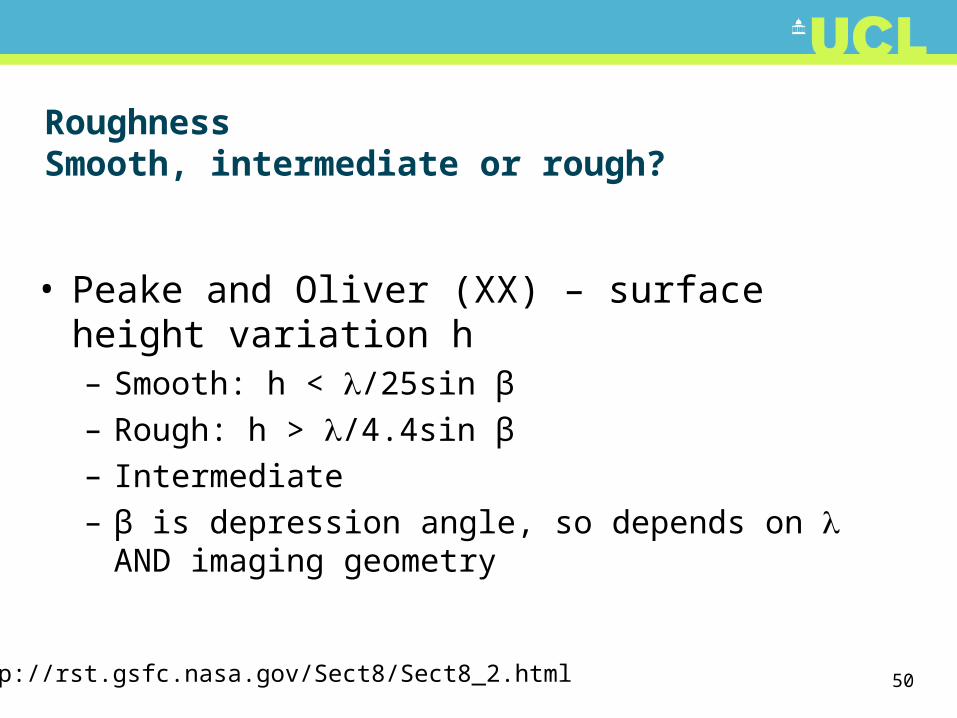
RoughnessSmooth, intermediate or rough?
• Peake and Oliver (XX) – surface height variation h– Smooth: h < /25sin β– Rough: h > /4.4sin β– Intermediate– β is depression angle, so depends on AND imaging
geometry
http://rst.gsfc.nasa.gov/Sect8/Sect8_2.html

51
Oil slickGalicia, Spain

52
LosAngeles
53
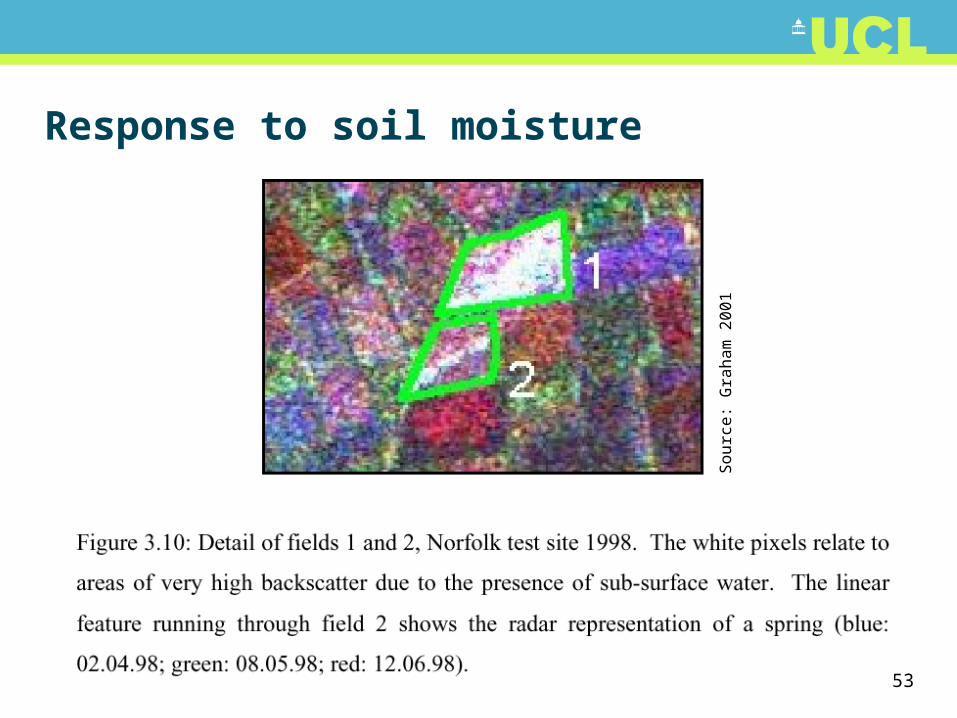
Response to soil moisture
So
urc
e:
Gra
ha
m 2
00
1
54
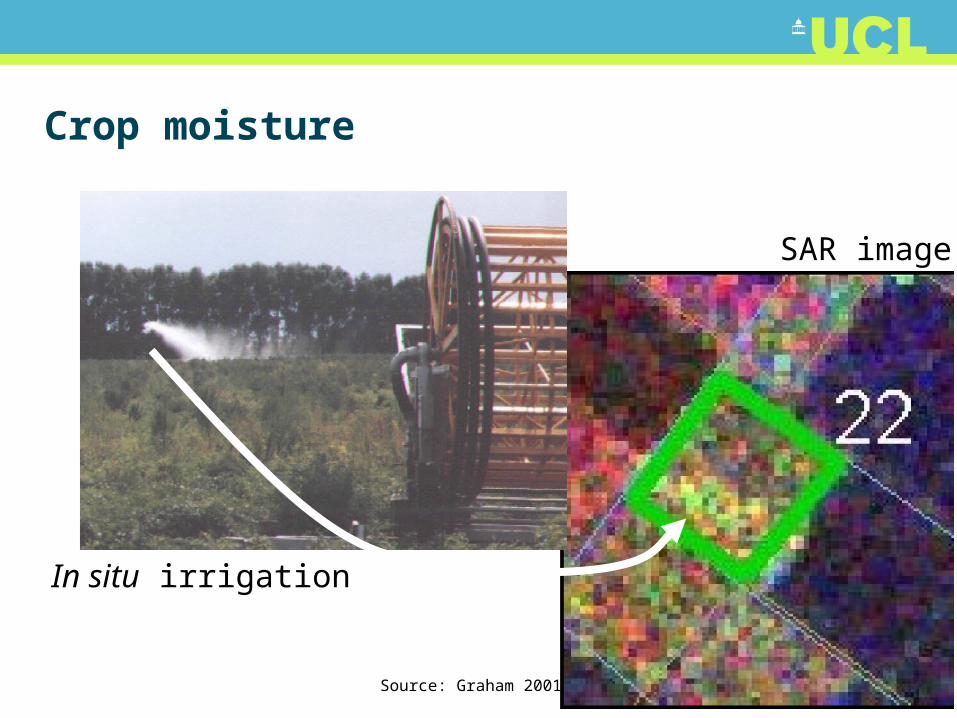
Crop moisture
SAR image
In situ irrigation
Source: Graham 2001
55
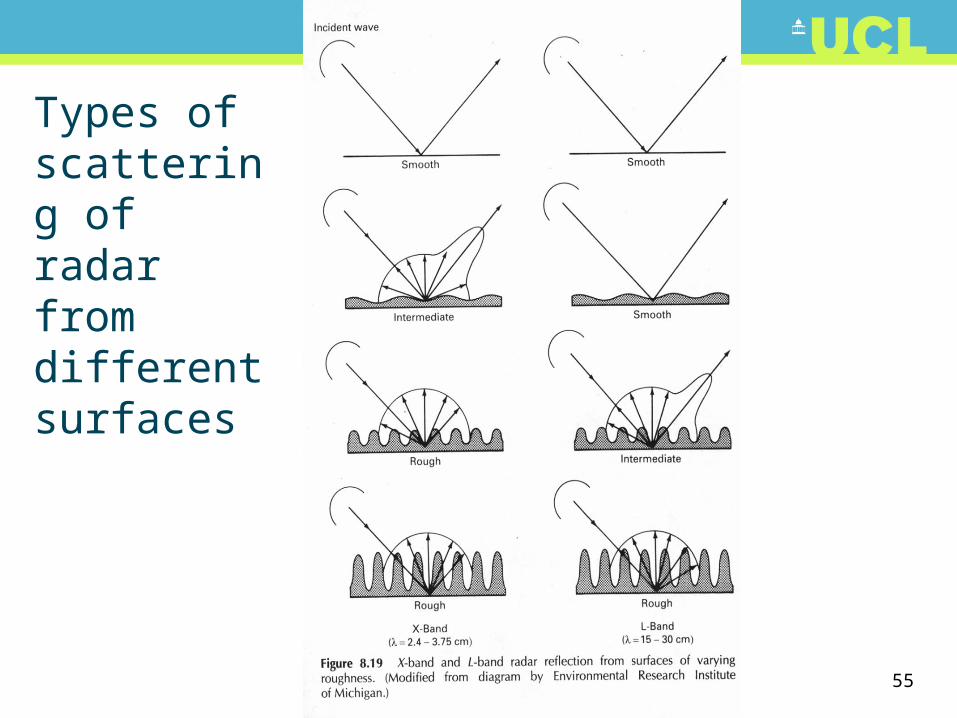
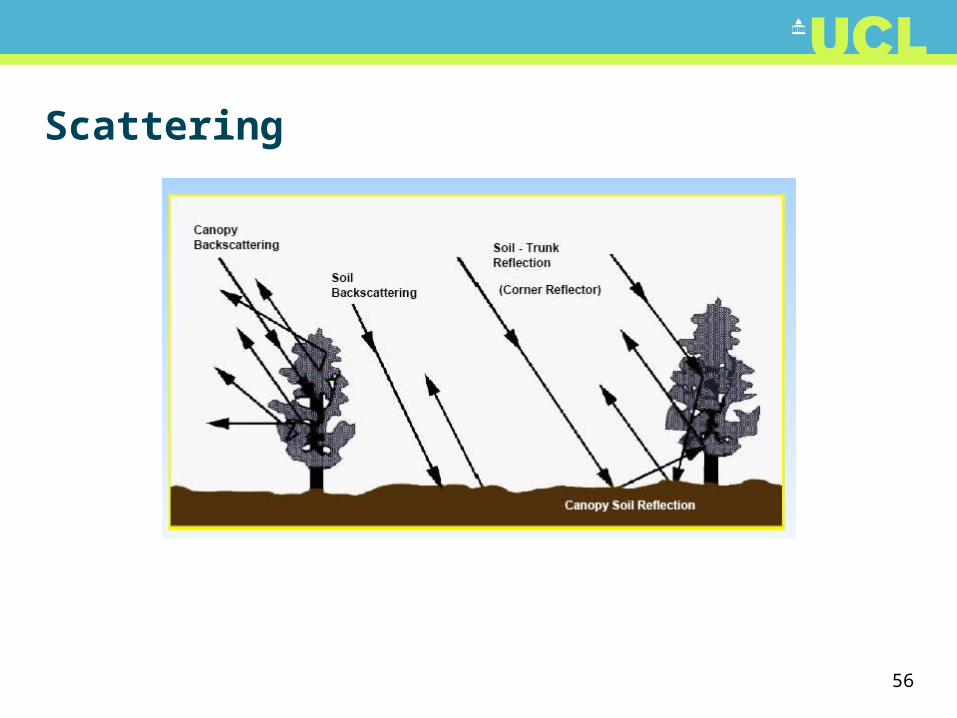
Types of scattering of radar from different surfaces
56
Scattering
57
The Radar Equation
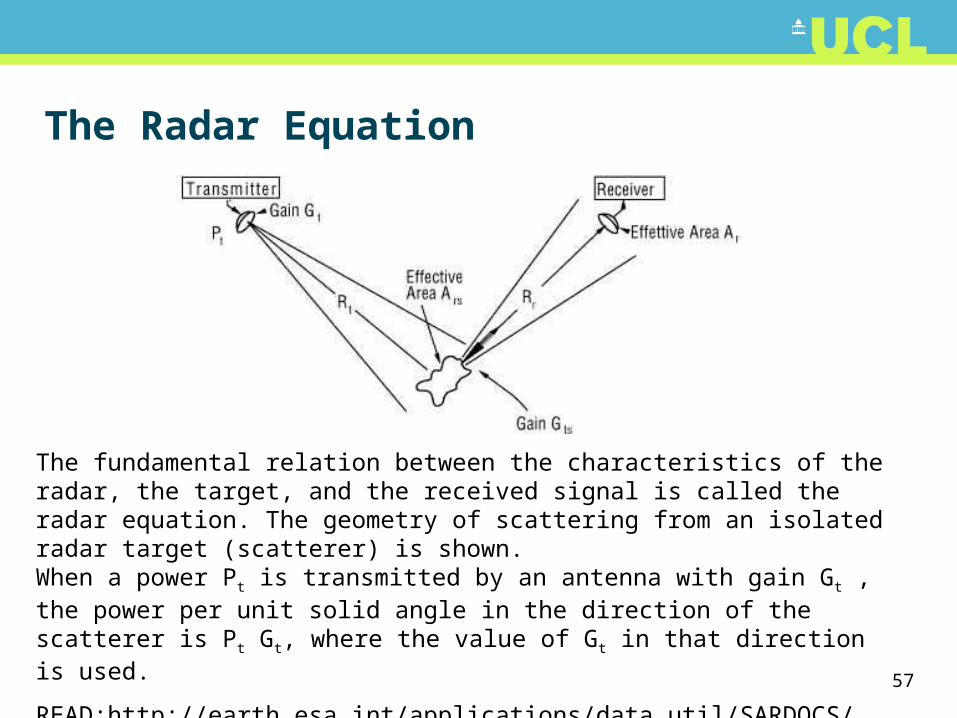
The fundamental relation between the characteristics of the radar, the target, and the received signal is called the radar equation. The geometry of scattering from an isolated radar target (scatterer) is shown.When a power Pt is transmitted by an antenna with gain Gt , the power per unit solid angle in the direction of the scatterer is Pt Gt, where the value of Gt in that direction is used.
READ:http://earth.esa.int/applications/data_util/SARDOCS/spaceborne/Radar_Courses/Radar_Course_III/radar_equation.htm and Jensen Chapter 9
58
The Radar Equation
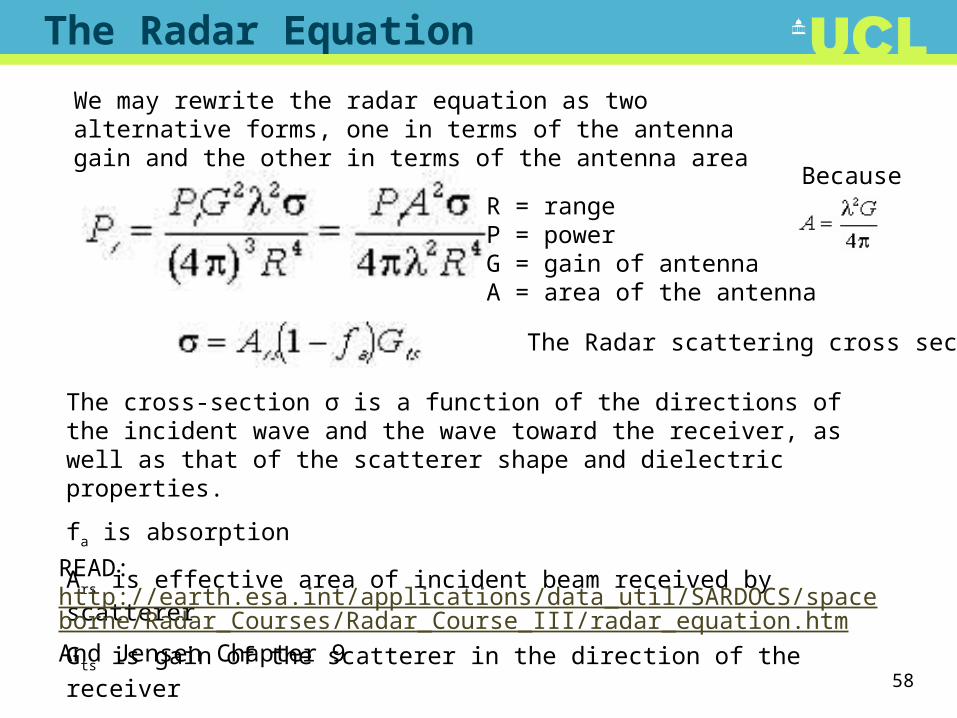
The cross-section σ is a function of the directions of the incident wave and the wave toward the receiver, as well as that of the scatterer shape and dielectric properties.
fa is absorption
Ars is effective area of incident beam received by scatterer
Gts is gain of the scatterer in the direction of the receiver
We may rewrite the radar equation as two alternative forms, one in terms of the antenna gain and the other in terms of the antenna area
Where: The Radar scattering cross section
R = rangeP = powerG = gain of antennaA = area of the antenna
Because
READ: http://earth.esa.int/applications/data_util/SARDOCS/spaceborne/Radar_Courses/Radar_Course_III/radar_equation.htmAnd Jensen Chapter 9
59
Measured quantities
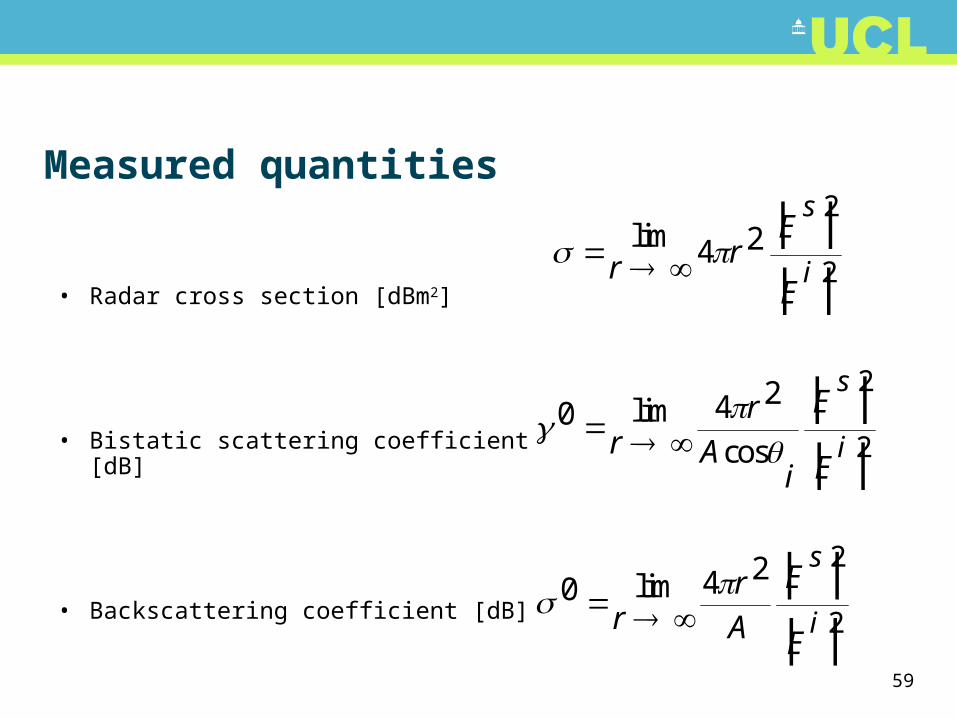
• Radar cross section [dBm2]
• Bistatic scattering coefficient [dB]
• Backscattering coefficient [dB]
lim | |
| |r rE
E
s
i4 2
2
2
0 4 2 2
2
limcos
| |
| |rr
Ai
E
E
s
i
0 4 2 2
2
lim | |
| |rr
A
E
E
s
i
60
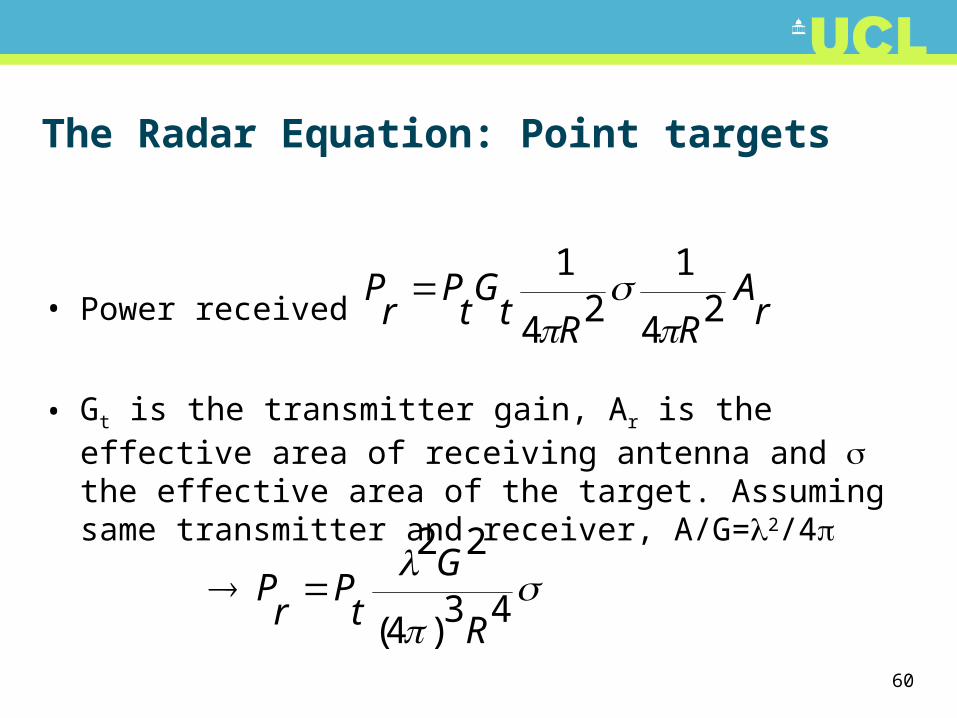
The Radar Equation: Point targets
• Power received
• Gt is the transmitter gain, Ar is the effective area of receiving antenna and the effective area of the target. Assuming same transmitter and receiver, A/G=2/4
Pr
PtG
t R RA
r
1
42
1
42
Pr
Pt
G
R
2 2
43 4
( )
61
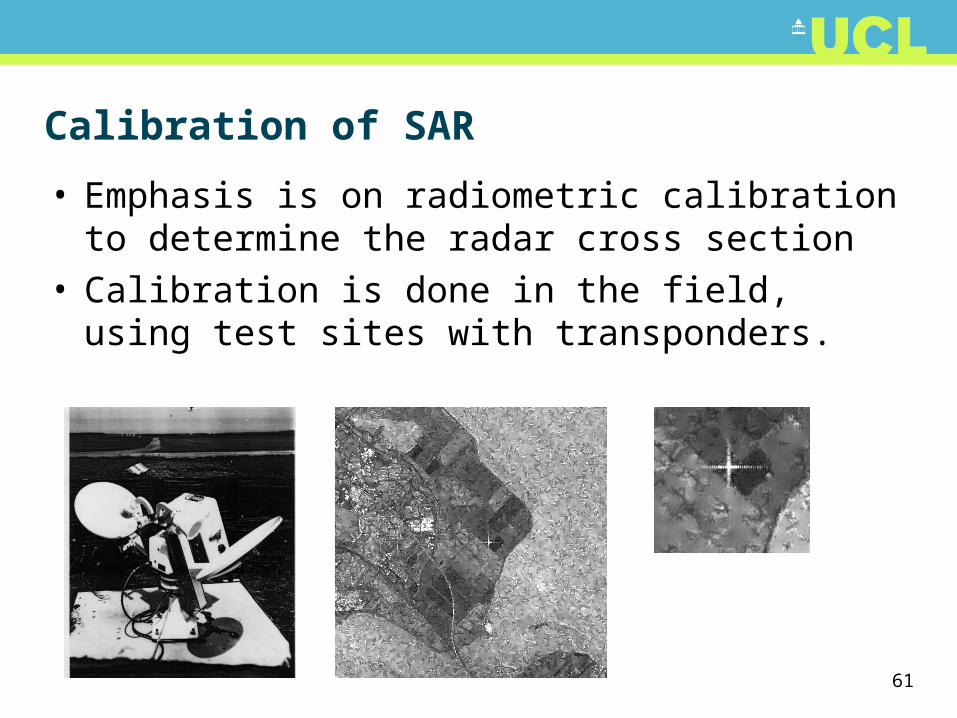
Calibration of SAR
• Emphasis is on radiometric calibration to determine the radar cross section
• Calibration is done in the field, using test sites with transponders.