Embed Size (px)
Citation preview
2008/2009
Annual Report
Published by: Screening Mammography Program 801 - 686 West Broadway Vancouver, BC V5Z 1G1 Tel: 604-877-6200 Fax: 604-660-3645 Website: www.smpbc.ca
TABLE OF CONTENTS
.....................................................1 1.0 MESSAGE FROM THE PROVINCIAL CHIEF RADIOLOGIST
.................................................................................................................2 2.0 PROGRAM OVERVIEW
...................................................................................................................5 3.0 PROGRAM RESULTS3.1. ............................................................................................5 Recruitment and Re-screening
• ............................................................5 FIGURE 1: SMP Annual Screening Volume (2004-2008)
• .....................................6 TABLE I: SMP Volume by Health Service Delivery Area (HSDA) (2008)
• ...............................................................................................................6
TABLE II: Regional Participation Rates by 10-Year Age Groups between 2007 and 2008 Inclusive
• ...............................................................................................................7
FIGURE 2: Bilateral Mammography Utilization by Women Ages 50 to 69 in BC between 2007 and 2008 Inclusive
• ..........................................................8
TABLE III: Regional Participation Rates of Women Ages 50 to 69 by Selected Ethnic Groups between 2007 and 2008 Inclusive
• ........................................................................................9
FIGURE 3: Return Rates for Women Ages 40 to 49 by First/Subsequent Screens (2005-2007)
• .......................................................................................10
FIGURE 4: Return Rates for Women Ages 50 to 69 by First/Subsequent Screens (2005-2007)
• ..........................................................................................................10
TABLE IV: Cumulative Numbers and Return Rate for Women Ages 50 to 69 (2005-2007)
3.2. .....................................................................................................11 2008 Screening Results• ............................................11 TABLE V: SMP Outcome Indicators by 10-Year Age Group (2008)
• ..............................................................................12
TABLE VI: Diagnostic Procedures Received by SMP Participants with “Abnormal” Screening Mammograms (2008)
• ........................................................................12 FIGURE 5: Screening Outcome Summary 2008
3.3. ......................................................................................................13 2007 Cancer Detection• .............................13 TABLE VII: Histologic Features of Breast Cancers Detected by SMP (2007)
3.4. ...........................................................14 Outcome Indicators by Calendar Year: 2004-2008•
.............................................................................................................15 TABLE VIII: SMP Outcome Indicators by Calendar Year between 2004 and 2008 Inclusive
3.5. .........................................................16 Outcome Indicators by Age: 2004-2008 Cumulative•
.............................................................................................................16 TABLE IX: SMP Outcome Indicators by 10-Year Age Groups between 2004 and 2008 Inclusive
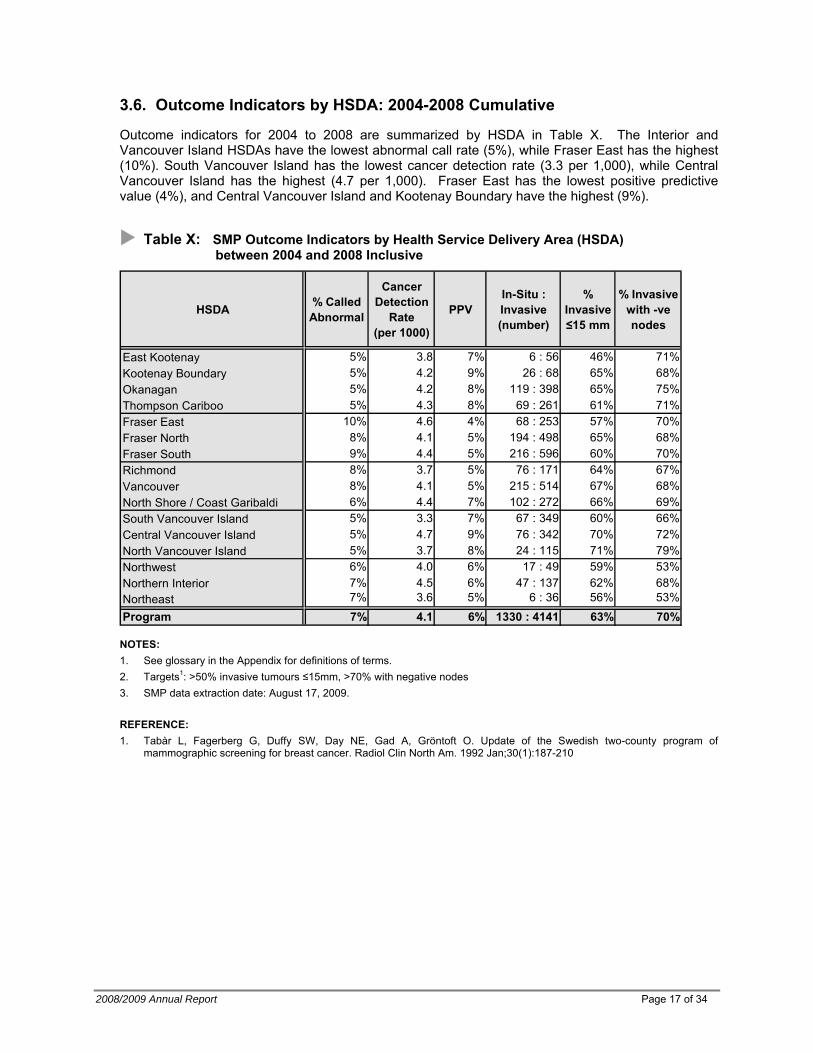
3.6. .....................................................17 Outcome Indicators by HSDA: 2004-2008 Cumulative•
.............................................................................................................17 Table X: SMP Outcome Indicators by Health Service Delivery Area (HSDA) between 2004 and 2008 Inclusive
3.7. ..................18 Cancer Characteristics by Age (Year: Cumulative up to and including 2007)•
...........................................................................................................18 TABLE XI: Histologic Features of Breast Cancers Detected by SMP Cumulative Up To and Including 2007
3.8. ..............................................................................19 Comparison with Canadian Standards•
........................................................................................................20 TABLE XII: Comparison of SMP Performance with Canadian Breast Screening Standards for Ages 50 to 69
3.9. .....................................................................................................................21 Cost Analysis• .............................................................................21 TABLE XIII: Cost Comparison by Fiscal Year
1/2
TABLE OF CONTENTS
.............................................................22 APPENDIX 1: General Cancer Screening Program Overview
...............................................................................23 APPENDIX 2: SMP Screening Recommendations
APPENDIX 3: SMP/BCCA Organization Chart .....................................................................................24
APPENDIX 4: .............................................................................................25 Map of Screening Centres
APPENDIX 5: ...........................................................................26 Screening Centre Contact Information
APPENDIX 6: .................................................................................27 Educational Materials Order Form
.........................................................................................................................28 APPENDIX 7: Glossary
APPENDIX 8: ..................................................................................30 Acknowledgement & Contributors
....................................................................................................................31 APPENDIX 9: Committees
APPENDIX 10: ...................................................................................................32 Radiologist Screeners
APPENDIX 11: ........................................................................................33 Publications & Presentations
APPENDIX 12: ...................................................................................34 SMP/BCCA Contact Information
2/2


1.0 MESSAGE FROM THE PROVINCIAL CHIEF RADIOLOGIST
In this 21st year of operation for our program, we conducted 286,993 examinations, nearly 8,000 more than in 2007. We detected 1,203 cancers, which is 80 more than in the previous year. Overall, participation for the 50 to 69 year age group is now 50%. It is this group for which 70% participation is the goal by 2017. The Ministry of Health continues to provide operating funds to help to reach this goal. Professional and Academic Activities
The annual scientific forum was held on the 25th of October, 2008. Again, our registration was the highest ever at 257. The 2008 program focused on breast cancer risk including a BC perspective, risk calculation for high-risk women, digital transition, new technologies including Magnetic Resonance Imaging (MRI), biopsy, Tomosynthesis, and Computed Tomography (CT). Our out-of-town faculty included:
• Robert Smith, PhD. Cancer Epidemiologist and Director of Cancer Screening, The National Office of the American Cancer Society; Adjunct Professor, Epidemiology, The Rollins School of Public Health, Emory University School of Medicine; Adjunct Professor, Hematology/Oncology, The Winship cancer Center, Emory University School of Medicine, Atlanta, GA, USA
• Edward Sickles, MD. Professor Emeritus, Department of Radiology, University of California at San Francisco School of Medicine; Former Chief, Breast Imaging Section, University of California at San Francisco Medical Center, San Francisco, CA, USA
• Tammy Coryell, RTRN. Clinical Applications Specialist and Clinical Educator, Hologic Breast Imaging, Springfield, CO, USA
Dr. Charmaine Kim-Sing, Dr. Paula Gordon, Dr. Christine Wilson, and myself represented the local faculty. Again, our screening program was well represented in the radiologic literature; three publications were written and 18 lectures were given by our SMP representatives and scientists. Administrative Activities Further work has been done on planning for digital transition for the entire screening program. Digital units are now operational at seven screening centres. The Technical Workforce project group has held discussions with individual SMP centres focused on various recruitment and retention issues, including: compensation, workload distribution, ergonomics and workplace safety, work force demographics, and, professional development and continuing education. Our administrative team continues to be the “backbone” of our organization. However, our program’s success is ultimately due to the determination and dedication to service of our staff at all of our screening centres, the central office, and of our health care professionals throughout the Province. Technological change and service expansion will be our challenges in the future; however, we can continue to meet them and transcend them with everyone’s support.
Dr. Linda Warren, Provincial Chief Radiologist
2008/2009 Annual Report Page 1 of 34
Page 2 of 34 BC Cancer Agency – Screening Mammography Program
2.0 PROGRAM OVERVIEW
The SMP provides standard two-view bilateral mammography to British Columbian women between ages 40 to 79 without doctor’s referral. Women outside of this age group may be referred to the SMP by their family physicians, if they are at high risk.
Women are not eligible for screening if they have had breast cancer, breast implants, or if they currently have breast symptoms requiring a diagnostic investigation. The Screening Process The Screening Process is illustrated in a diagram at the end of this section. The process consists of four stages:
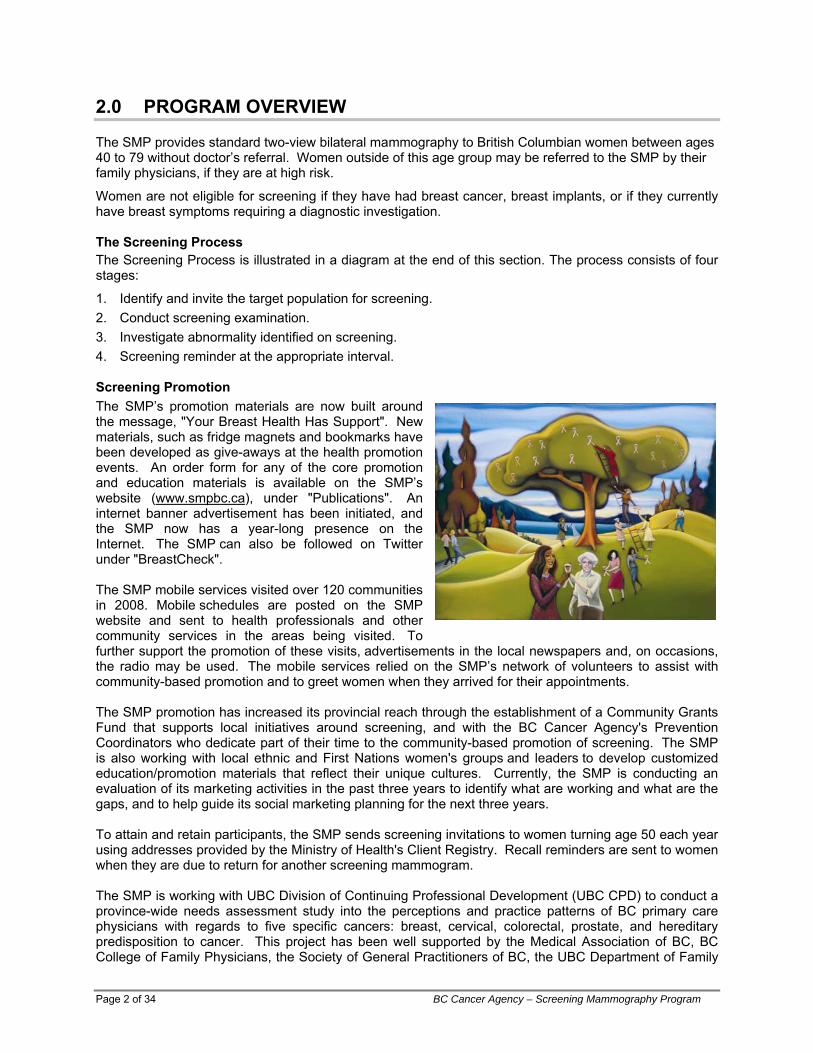
1. Identify and invite the target population for screening. 2. Conduct screening examination. 3. Investigate abnormality identified on screening. 4. Screening reminder at the appropriate interval. Screening Promotion The SMP’s promotion materials are now built around the message, "Your Breast Health Has Support". New materials, such as fridge magnets and bookmarks have been developed as give-aways at the health promotion events. An order form for any of the core promotion and education materials is available on the SMP’s website (www.smpbc.ca), under "Publications". An internet banner advertisement has been initiated, and the SMP now has a year-long presence on the Internet. The SMP can also be followed on Twitter under "BreastCheck". The SMP mobile services visited over 120 communities in 2008. Mobile schedules are posted on the SMP website and sent to health professionals and other community services in the areas being visited. To further support the promotion of these visits, advertisements in the local newspapers and, on occasions, the radio may be used. The mobile services relied on the SMP’s network of volunteers to assist with community-based promotion and to greet women when they arrived for their appointments. The SMP promotion has increased its provincial reach through the establishment of a Community Grants Fund that supports local initiatives around screening, and with the BC Cancer Agency's Prevention Coordinators who dedicate part of their time to the community-based promotion of screening. The SMP is also working with local ethnic and First Nations women's groups and leaders to develop customized education/promotion materials that reflect their unique cultures. Currently, the SMP is conducting an evaluation of its marketing activities in the past three years to identify what are working and what are the gaps, and to help guide its social marketing planning for the next three years. To attain and retain participants, the SMP sends screening invitations to women turning age 50 each year using addresses provided by the Ministry of Health's Client Registry. Recall reminders are sent to women when they are due to return for another screening mammogram. The SMP is working with UBC Division of Continuing Professional Development (UBC CPD) to conduct a province-wide needs assessment study into the perceptions and practice patterns of BC primary care physicians with regards to five specific cancers: breast, cervical, colorectal, prostate, and hereditary predisposition to cancer. This project has been well supported by the Medical Association of BC, BC College of Family Physicians, the Society of General Practitioners of BC, the UBC Department of Family
Practice, as well as the Family Practice Oncology Network, British Columbia. The survey phase of the needs assessment was very successful with almost 900 physicians in the province providing feedback. The project team will continue with detailed analysis of survey data and focus groups with physicians in order to discuss the survey findings in greater depth. Physician feedback in this initiative will be instrumental in the design of further educational programming, clinical support strategies, promotional materials, and other engagement strategies to improve cancer screening practices and increase patient uptake in recommended cancer screening. Quality Assurance and Quality Control Quality standards and systems in the SMP are developed based on guidelines and recommendations from the Canadian Association of Radiologists (CAR), Public Health Agency of Canada (PHAC), the Canadian Association of Medical Radiation Technologists (CAMRT), the BCCA Physics Support Group, and the scientific literature.
CAR Mammography Accreditation is mandatory for all SMP Centres. The SMP has a team of Medical Physicists, a Provincial Professional Practice Leader for Mammography Technologists and a Quality Management Coordinator. This team supports imaging quality assurance and provides professional direction in equipment selection, acceptance testing, and troubleshooting at screening centres around the province. The Program also supports continuing education for radiologists and technologists. Digital mammography is gradually being introduced across the province. The SMPBC Physics Support Group has provided leadership and technical support to centers as they transition to a digital setting. SMP has developed, based upon best practices, and implemented a comprehensive, harmonized quality control program specific for digital mammography equipment. SMP has also developed digital mammography specific phantoms for equipment testing and provides ongoing support to centres in their daily quality control practices. Technologist Professional Development The screening mammography workforce is comprised of technologists from across BC who are trained and experienced in breast imaging. The Provincial Professional Practice Leader for Mammography Technologists has developed various initiatives to support the technologist professional development, including:
• Certificate in Breast Imaging scholarship program, in partnership with the Canadian Breast Cancer Foundation.
• SMP Technologist Writing Contest.
• A Technologist Newsletter.
• An educational event at the Annual SMP Forum with continuing medical education (CME) credits. FAST TRACK - Facilitated Referral to Diagnostic Imaging In 1999, the SMP initiated a voluntary facilitated referral to diagnostic imaging (“Fast Track”) for patients with abnormal screening mammograms. Currently, 62% of general practitioners with patients participating in the SMP are enrolled in the Fast Track referral process. Analysis of data from January 2003 to June 2005 showed that the median time between abnormal screening report and the first assessment procedure is 1.5 weeks less for patients on Fast Track referral. General practitioners are encouraged to participate in the Fast Track process. Evaluation Data are collected and analyzed on an ongoing basis to monitor the Program’s effectiveness and to identify areas for improvement. Results of this analysis are presented in the “PROGRAM RESULTS” section of this report. Age specific breast cancer incidence and mortality rates are tracked in conjunction with the BC Cancer Registry.
2008/2009 Annual Report Page 3 of 34
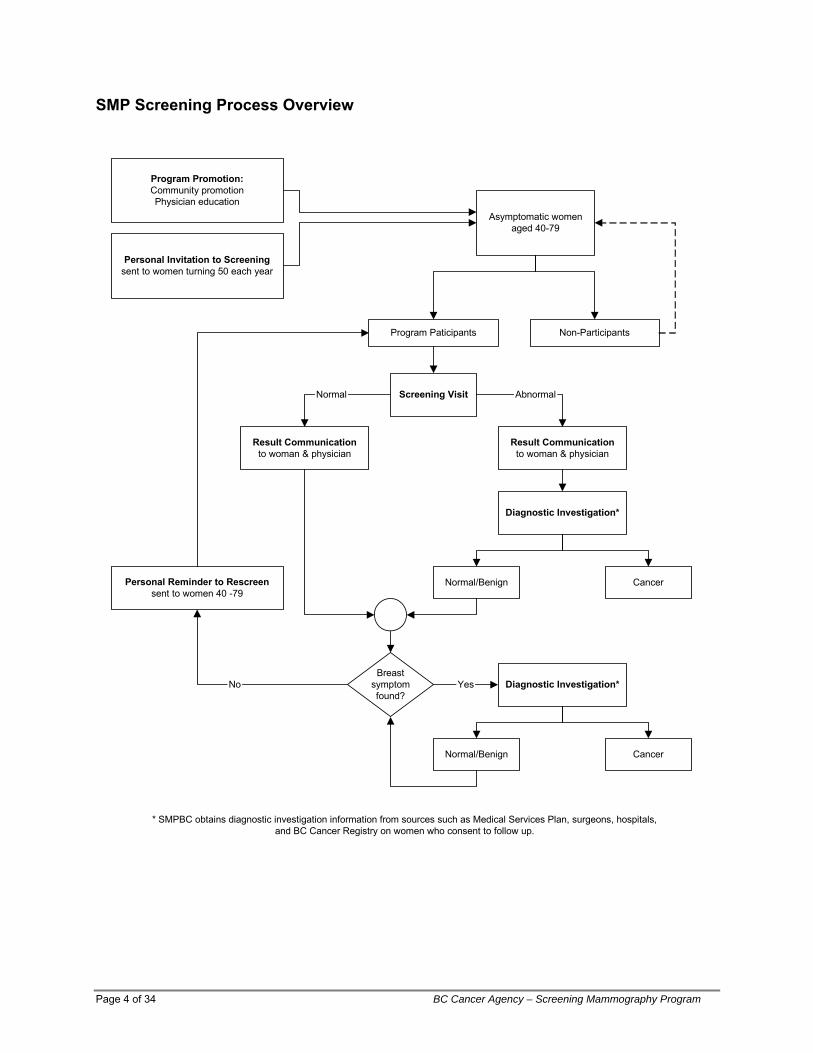
SMP Screening Process Overview
Program Promotion:Community promotionPhysician education
Asymptomatic womenaged 40-79
Personal Invitation to Screeningsent to women turning 50 each year
Program Paticipants Non-Participants
Screening Visit
Result Communicationto woman & physician
Result Communicationto woman & physician
Diagnostic Investigation*
Normal Abnormal
Normal/Benign Cancer
Breastsymptomfound?
Diagnostic Investigation*
Normal/Benign Cancer
Yes
Personal Reminder to Rescreensent to women 40 -79
No
* SMPBC obtains diagnostic investigation information from sources such as Medical Services Plan, surgeons, hospitals,and BC Cancer Registry on women who consent to follow up.
Page 4 of 34 BC Cancer Agency – Screening Mammography Program
3.0 PROGRAM RESULTS
3.1. Recruitment and Re-screening
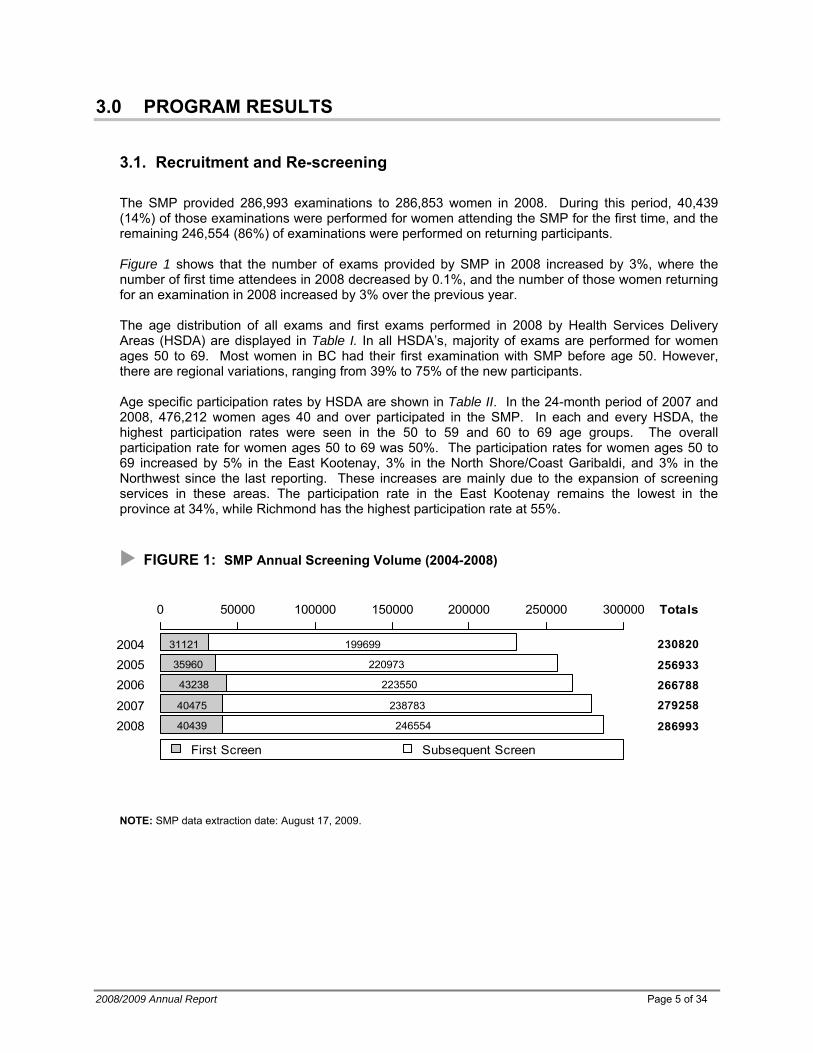
The SMP provided 286,993 examinations to 286,853 women in 2008. During this period, 40,439 (14%) of those examinations were performed for women attending the SMP for the first time, and the remaining 246,554 (86%) of examinations were performed on returning participants. Figure 1 shows that the number of exams provided by SMP in 2008 increased by 3%, where the number of first time attendees in 2008 decreased by 0.1%, and the number of those women returning for an examination in 2008 increased by 3% over the previous year. The age distribution of all exams and first exams performed in 2008 by Health Services Delivery Areas (HSDA) are displayed in Table I. In all HSDA’s, majority of exams are performed for women ages 50 to 69. Most women in BC had their first examination with SMP before age 50. However, there are regional variations, ranging from 39% to 75% of the new participants. Age specific participation rates by HSDA are shown in Table II. In the 24-month period of 2007 and 2008, 476,212 women ages 40 and over participated in the SMP. In each and every HSDA, the highest participation rates were seen in the 50 to 59 and 60 to 69 age groups. The overall participation rate for women ages 50 to 69 was 50%. The participation rates for women ages 50 to 69 increased by 5% in the East Kootenay, 3% in the North Shore/Coast Garibaldi, and 3% in the Northwest since the last reporting. These increases are mainly due to the expansion of screening services in these areas. The participation rate in the East Kootenay remains the lowest in the province at 34%, while Richmond has the highest participation rate at 55%.
FIGURE 1: SMP Annual Screening Volume (2004-2008)
20082007
200620052004
0 50000 100000 150000 200000 250000 300000
40439
40475
43238
35960
31121
246554
238783
223550
220973
199699
286993
279258
266788
256933
230820
Totals
First Screen Subsequent Screen
NOTE: SMP data extraction date: August 17, 2009.
2008/2009 Annual Report Page 5 of 34
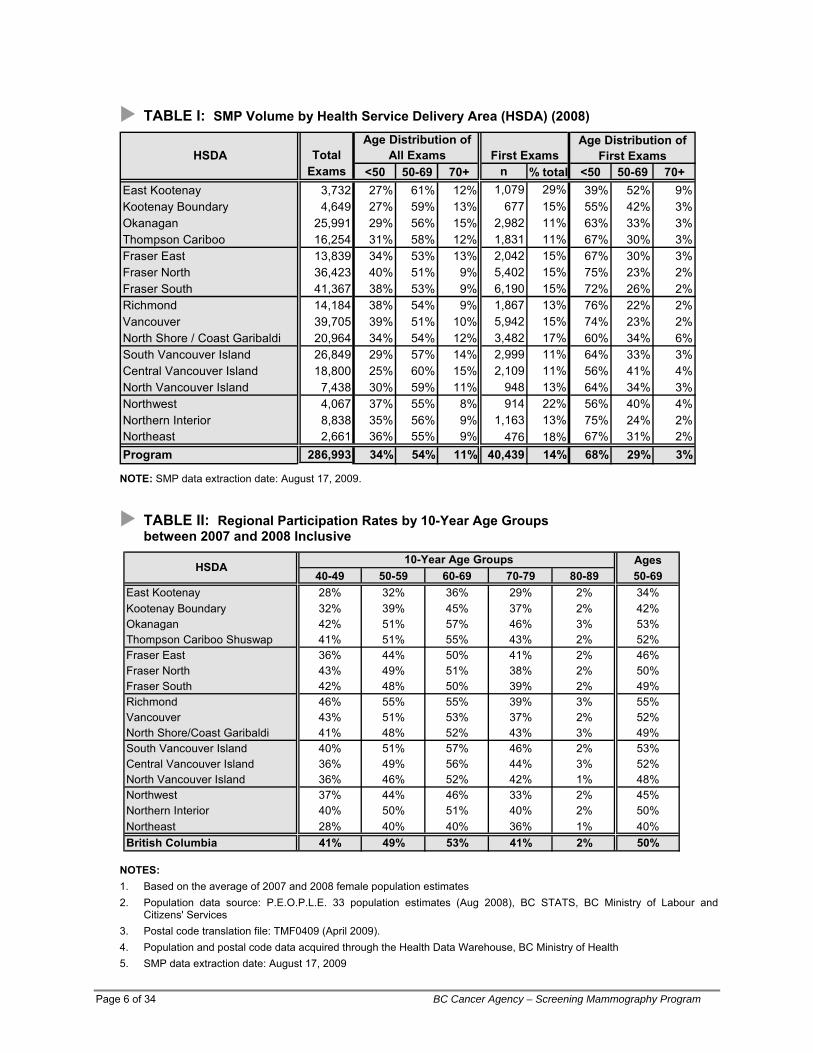
TABLE I: SMP Volume by Health Service Delivery Area (HSDA) (2008)
TotalAge Distribution of
First ExamsExams <50 50-69 70+ n % total <50 50-69 70+
East Kootenay 3,732 27% 61% 12% 1,079 29% 39% 52% 9%Kootenay Boundary 4,649 27% 59% 13% 677 15% 55% 42% 3%Okanagan 25,991 29% 56% 15% 2,982 11% 63% 33% 3%Thompson Cariboo 16,254 31% 58% 12% 1,831 11% 67% 30% 3%Fraser East 13,839 34% 53% 13% 2,042 15% 67% 30% 3%Fraser North 36,423 40% 51% 9% 5,402 15% 75% 23% 2%Fraser South 41,367 38% 53% 9% 6,190 15% 72% 26% 2%Richmond 14,184 38% 54% 9% 1,867 13% 76% 22% 2%Vancouver 39,705 39% 51% 10% 5,942 15% 74% 23% 2%North Shore / Coast Garibaldi 20,964 34% 54% 12% 3,482 17% 60% 34% 6%South Vancouver Island 26,849 29% 57% 14% 2,999 11% 64% 33% 3%Central Vancouver Island 18,800 25% 60% 15% 2,109 11% 56% 41% 4%North Vancouver Island 7,438 30% 59% 11% 948 13% 64% 34% 3%Northwest 4,067 37% 55% 8% 914 22% 56% 40% 4%Northern Interior 8,838 35% 56% 9% 1,163 13% 75% 24% 2%Northeast 2,661 36% 55% 9% 476 18% 67% 31% 2%Program 286,993 34% 54% 11% 40,439 14% 68% 29% 3%
First ExamsHSDAAge Distribution of
All Exams
NOTE: SMP data extraction date: August 17, 2009.
TABLE II: Regional Participation Rates by 10-Year Age Groups between 2007 and 2008 Inclusive
Ages40-49 50-59 60-69 70-79 80-89 50-69
East Kootenay 28% 32% 36% 29% 2% 34%Kootenay Boundary 32% 39% 45% 37% 2% 42%Okanagan 42% 51% 57% 46% 3% 53%Thompson Cariboo Shuswap 41% 51% 55% 43% 2% 52%Fraser East 36% 44% 50% 41% 2% 46%Fraser North 43% 49% 51% 38% 2% 50%Fraser South 42% 48% 50% 39% 2% 49%Richmond 46% 55% 55% 39% 3% 55%Vancouver 43% 51% 53% 37% 2% 52%North Shore/Coast Garibaldi 41% 48% 52% 43% 3% 49%South Vancouver Island 40% 51% 57% 46% 2% 53%Central Vancouver Island 36% 49% 56% 44% 3% 52%North Vancouver Island 36% 46% 52% 42% 1% 48%Northwest 37% 44% 46% 33% 2% 45%Northern Interior 40% 50% 51% 40% 2% 50%Northeast 28% 40% 40% 36% 1% 40%British Columbia 41% 49% 53% 41% 2% 50%
10-Year Age GroupsHSDA
NOTES: 1. Based on the average of 2007 and 2008 female population estimates 2. Population data source: P.E.O.P.L.E. 33 population estimates (Aug 2008), BC STATS, BC Ministry of Labour and
Citizens' Services 3. Postal code translation file: TMF0409 (April 2009). 4. Population and postal code data acquired through the Health Data Warehouse, BC Ministry of Health 5. SMP data extraction date: August 17, 2009
Page 6 of 34 BC Cancer Agency – Screening Mammography Program
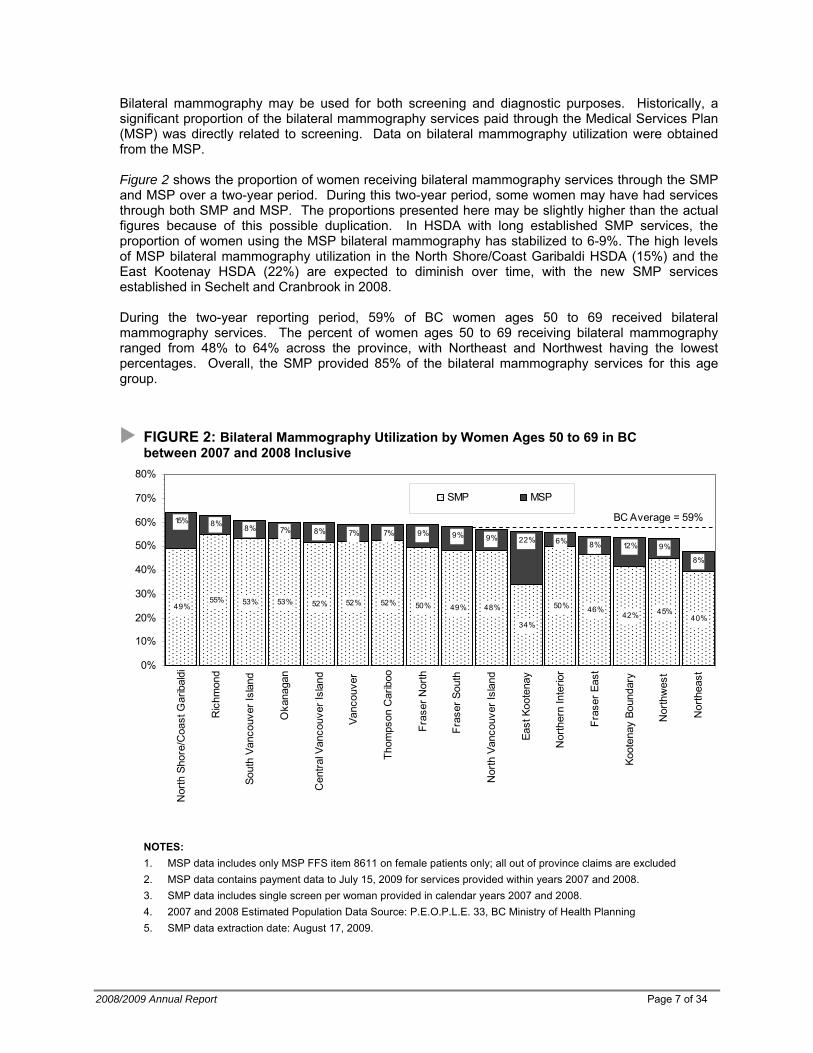
Bilateral mammography may be used for both screening and diagnostic purposes. Historically, a significant proportion of the bilateral mammography services paid through the Medical Services Plan (MSP) was directly related to screening. Data on bilateral mammography utilization were obtained from the MSP. Figure 2 shows the proportion of women receiving bilateral mammography services through the SMP and MSP over a two-year period. During this two-year period, some women may have had services through both SMP and MSP. The proportions presented here may be slightly higher than the actual figures because of this possible duplication. In HSDA with long established SMP services, the proportion of women using the MSP bilateral mammography has stabilized to 6-9%. The high levels of MSP bilateral mammography utilization in the North Shore/Coast Garibaldi HSDA (15%) and the East Kootenay HSDA (22%) are expected to diminish over time, with the new SMP services established in Sechelt and Cranbrook in 2008. During the two-year reporting period, 59% of BC women ages 50 to 69 received bilateral mammography services. The percent of women ages 50 to 69 receiving bilateral mammography ranged from 48% to 64% across the province, with Northeast and Northwest having the lowest percentages. Overall, the SMP provided 85% of the bilateral mammography services for this age group.
FIGURE 2: Bilateral Mammography Utilization by Women Ages 50 to 69 in BC between 2007 and 2008 Inclusive
49%55% 53% 53% 52% 52% 52% 50% 49% 48%
34%
50% 46%42% 45%
40%
15% 8% 8% 7% 8% 7% 7% 9% 9% 9% 22% 6% 8% 12% 9%
8%
0%
10%
20%
30%
40%
50%
60%
70%
80%
Nor
th S
hore
/Coa
st G
arib
aldi
Ric
hmon
d
Sout
h Va
ncou
ver I
slan
d
Oka
naga
n
Cen
tral V
anco
uver
Isla
nd
Vanc
ouve
r
Thom
pson
Car
iboo
Fras
er N
orth
Fras
er S
outh
Nor
th V
anco
uver
Isla
nd
East
Koo
tena
y
Nor
ther
n In
terio
r
Fras
er E
ast
Koot
enay
Bou
ndar
y
Nor
thw
est
Nor
thea
st
SMP MSP
BC Average = 59%
NOTES: 1. MSP data includes only MSP FFS item 8611 on female patients only; all out of province claims are excluded 2. MSP data contains payment data to July 15, 2009 for services provided within years 2007 and 2008. 3. SMP data includes single screen per woman provided in calendar years 2007 and 2008. 4. 2007 and 2008 Estimated Population Data Source: P.E.O.P.L.E. 33, BC Ministry of Health Planning 5. SMP data extraction date: August 17, 2009.
2008/2009 Annual Report Page 7 of 34
Page 8 of 34 BC Cancer Agency – Screening Mammography Program
Population Percentage
Participation Rate
Population Percentage
Participation Rate
Population Percentage
Participation Rate
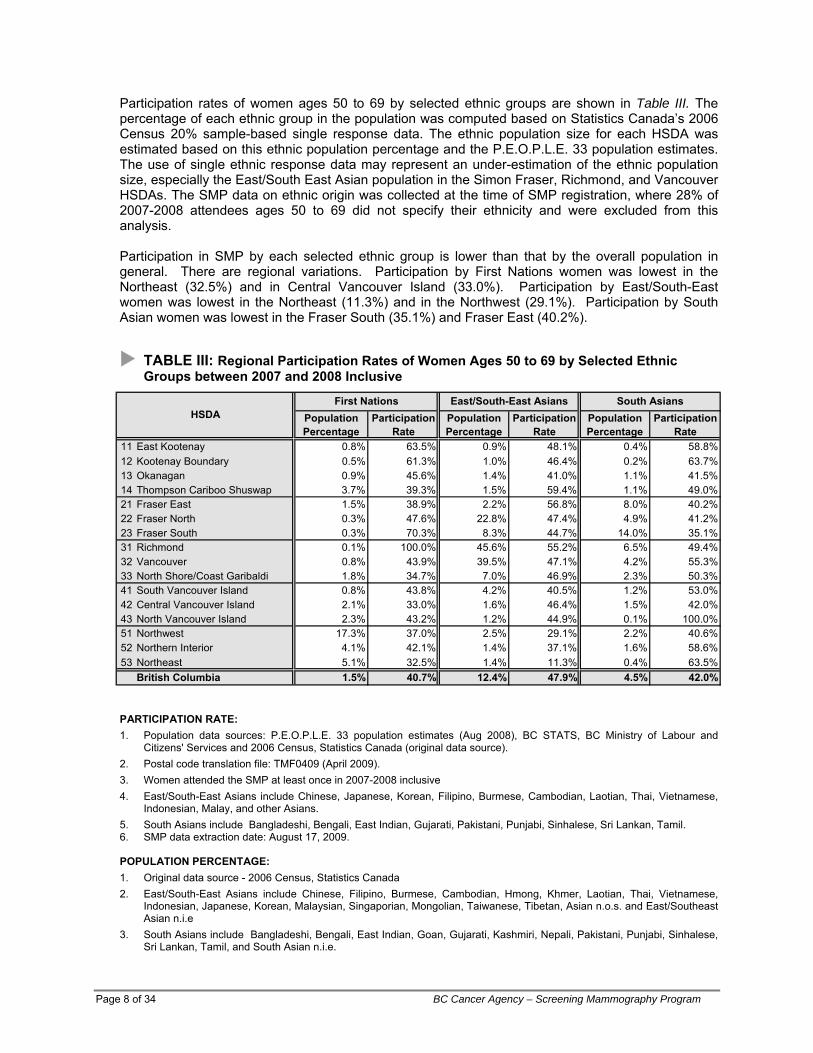
East Kootenay 0.8% 63.5% 0.9% 48.1% 0.4% 58.8%Kootenay Boundary 0.5% 61.3% 1.0% 46.4% 0.2% 63.7%Okanagan 0.9% 45.6% 1.4% 41.0% 1.1% 41.5%Thompson Cariboo Shuswap 3.7% 39.3% 1.5% 59.4% 1.1% 49.0%Fraser East 1.5% 38.9% 2.2% 56.8% 8.0% 40.2%Fraser North 0.3% 47.6% 22.8% 47.4% 4.9% 41.2%Fraser South 0.3% 70.3% 8.3% 44.7% 14.0% 35.1%Richmond 0.1% 100.0% 45.6% 55.2% 6.5% 49.4%Vancouver 0.8% 43.9% 39.5% 47.1% 4.2% 55.3%North Shore/Coast Garibaldi 1.8% 34.7% 7.0% 46.9% 2.3% 50.3%South Vancouver Island 0.8% 43.8% 4.2% 40.5% 1.2% 53.0%Central Vancouver Island 2.1% 33.0% 1.6% 46.4% 1.5% 42.0%North Vancouver Island 2.3% 43.2% 1.2% 44.9% 0.1% 100.0%Northwest 17.3% 37.0% 2.5% 29.1% 2.2% 40.6%Northern Interior 4.1% 42.1% 1.4% 37.1% 1.6% 58.6%Northeast 5.1% 32.5% 1.4% 11.3% 0.4% 63.5%British Columbia 1.5% 40.7% 12.4% 47.9% 4.5% 42.0%
HSDAFirst Nations East/South-East Asians South Asians
11121314212223313233414243515253
Participation rates of women ages 50 to 69 by selected ethnic groups are shown in Table III. The percentage of each ethnic group in the population was computed based on Statistics Canada’s 2006 Census 20% sample-based single response data. The ethnic population size for each HSDA was estimated based on this ethnic population percentage and the P.E.O.P.L.E. 33 population estimates. The use of single ethnic response data may represent an under-estimation of the ethnic population size, especially the East/South East Asian population in the Simon Fraser, Richmond, and Vancouver HSDAs. The SMP data on ethnic origin was collected at the time of SMP registration, where 28% of 2007-2008 attendees ages 50 to 69 did not specify their ethnicity and were excluded from this analysis. Participation in SMP by each selected ethnic group is lower than that by the overall population in general. There are regional variations. Participation by First Nations women was lowest in the Northeast (32.5%) and in Central Vancouver Island (33.0%). Participation by East/South-East women was lowest in the Northeast (11.3%) and in the Northwest (29.1%). Participation by South Asian women was lowest in the Fraser South (35.1%) and Fraser East (40.2%).
TABLE III: Regional Participation Rates of Women Ages 50 to 69 by Selected Ethnic Groups between 2007 and 2008 Inclusive
PARTICIPATION RATE: 1. Population data sources: P.E.O.P.L.E. 33 population estimates (Aug 2008), BC STATS, BC Ministry of Labour and
Citizens' Services and 2006 Census, Statistics Canada (original data source). 2. Postal code translation file: TMF0409 (April 2009). 3. Women attended the SMP at least once in 2007-2008 inclusive 4. East/South-East Asians include Chinese, Japanese, Korean, Filipino, Burmese, Cambodian, Laotian, Thai, Vietnamese,
Indonesian, Malay, and other Asians. 5. South Asians include Bangladeshi, Bengali, East Indian, Gujarati, Pakistani, Punjabi, Sinhalese, Sri Lankan, Tamil. 6. SMP data extraction date: August 17, 2009.
POPULATION PERCENTAGE: 1. Original data source - 2006 Census, Statistics Canada 2. East/South-East Asians include Chinese, Filipino, Burmese, Cambodian, Hmong, Khmer, Laotian, Thai, Vietnamese,
Indonesian, Japanese, Korean, Malaysian, Singaporian, Mongolian, Taiwanese, Tibetan, Asian n.o.s. and East/Southeast Asian n.i.e
3. South Asians include Bangladeshi, Bengali, East Indian, Goan, Gujarati, Kashmiri, Nepali, Pakistani, Punjabi, Sinhalese, Sri Lankan, Tamil, and South Asian n.i.e.
2008/2009 Annual Report Page 9 of 34
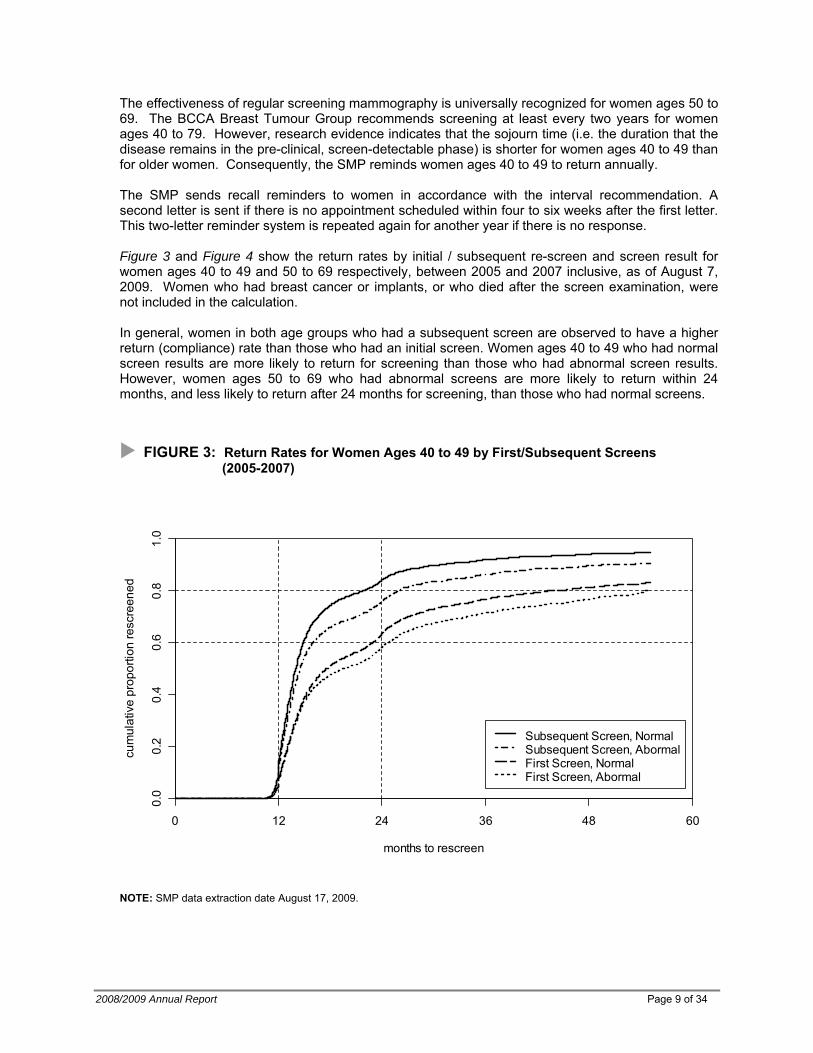
The effectiveness of regular screening mammography is universally recognized for women ages 50 to 69. The BCCA Breast Tumour Group recommends screening at least every two years for women ages 40 to 79. However, research evidence indicates that the sojourn time (i.e. the duration that the disease remains in the pre-clinical, screen-detectable phase) is shorter for women ages 40 to 49 than for older women. Consequently, the SMP reminds women ages 40 to 49 to return annually.
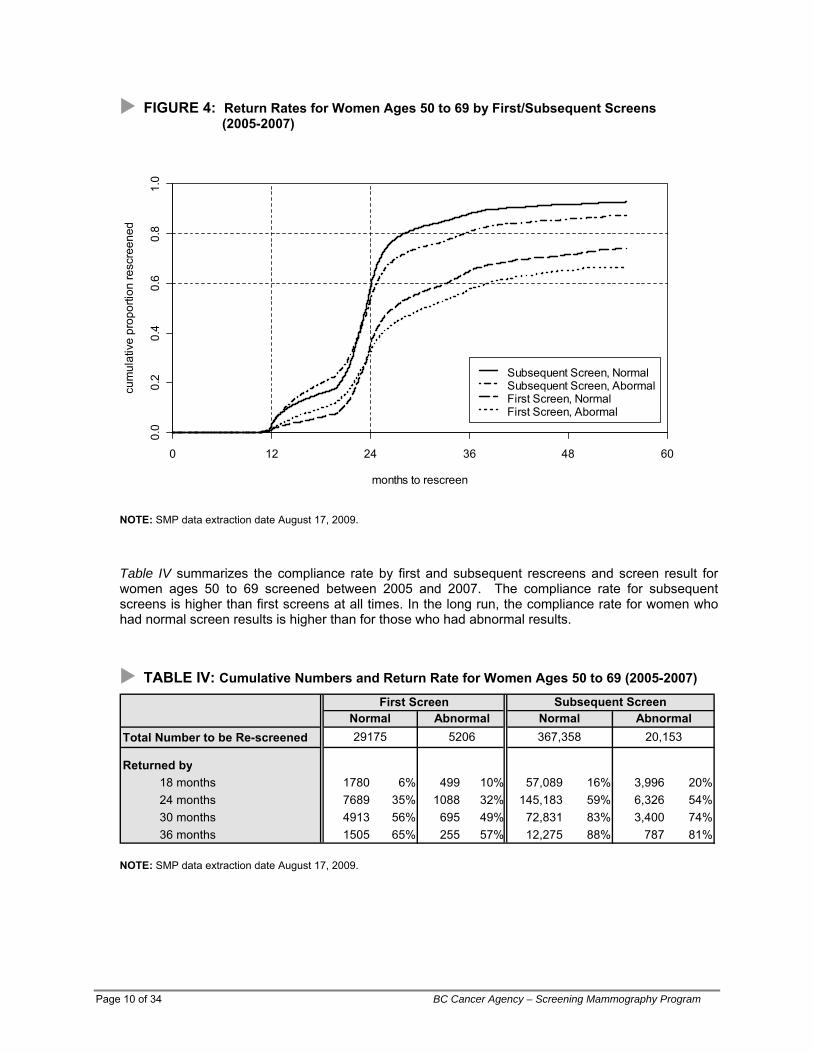
The SMP sends recall reminders to women in accordance with the interval recommendation. A second letter is sent if there is no appointment scheduled within four to six weeks after the first letter. This two-letter reminder system is repeated again for another year if there is no response. Figure 3 and Figure 4 show the return rates by initial / subsequent re-screen and screen result for women ages 40 to 49 and 50 to 69 respectively, between 2005 and 2007 inclusive, as of August 7, 2009. Women who had breast cancer or implants, or who died after the screen examination, were not included in the calculation. In general, women in both age groups who had a subsequent screen are observed to have a higher return (compliance) rate than those who had an initial screen. Women ages 40 to 49 who had normal screen results are more likely to return for screening than those who had abnormal screen results. However, women ages 50 to 69 who had abnormal screens are more likely to return within 24 months, and less likely to return after 24 months for screening, than those who had normal screens.
FIGURE 3: Return Rates for Women Ages 40 to 49 by First/Subsequent Screens (2005-2007)
months to rescreen
cum
ulat
ive
prop
ortio
n re
scre
ened
Subsequent Screen, NormalSubsequent Screen, AbormalFirst Screen, NormalFirst Screen, Abormal
0 12 24 36 48 60
0.0
0.2
0.4
0.6
0.8
1.0
NOTE: SMP data extraction date August 17, 2009.
Page 10 of 34 BC Cancer Agency – Screening Mammography Program
FIGURE 4: Return Rates for Women Ages 50 to 69 by First/Subsequent Screens (2005-2007)
months to rescreen
cum
ulat
ive
prop
ortio
n re
scre
ened
Subsequent Screen, NormalSubsequent Screen, AbormalFirst Screen, NormalFirst Screen, Abormal
0 12 24 36 48 60
0.0
0.2
0.4
0.6
0.8
1.0
NOTE: SMP data extraction date August 17, 2009.
Table IV summarizes the compliance rate by first and subsequent rescreens and screen result for women ages 50 to 69 screened between 2005 and 2007. The compliance rate for subsequent screens is higher than first screens at all times. In the long run, the compliance rate for women who had normal screen results is higher than for those who had abnormal results.
TABLE IV: Cumulative Numbers and Return Rate for Women Ages 50 to 69 (2005-2007)
Total Number to be Re-screened
Returned by 18 months 1780 6% 499 10% 57,089 16% 3,996 20% 24 months 7689 35% 1088 32% 145,183 59% 6,326 54% 30 months 4913 56% 695 49% 72,831 83% 3,400 74%
AbnormalSubsequent ScreenFirst Screen
Normal Abnormal Normal29175 5206 367,358 20,153
36 months 1505 65% 255 57% 12,275 88% 787 81%
NOTE: SMP data extraction date August 17, 2009.
2008/2009 Annual Report Page 11 of 34
3.2. 2008 Screening Results
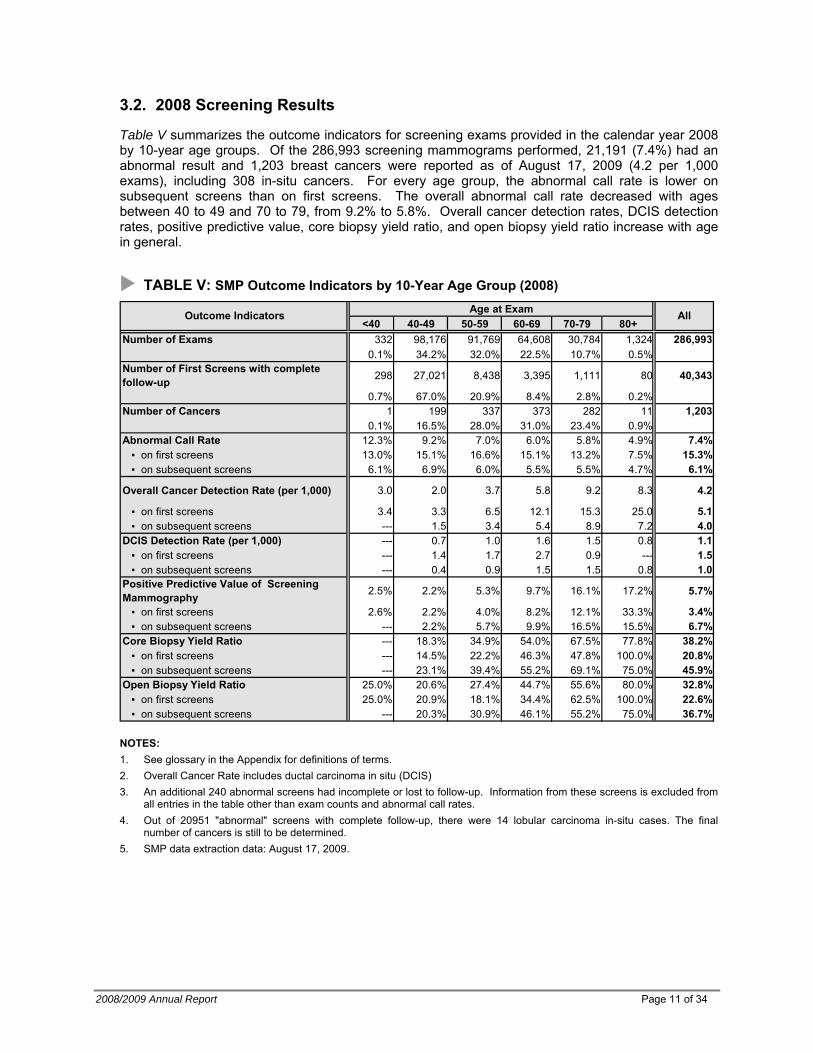
Table V summarizes the outcome indicators for screening exams provided in the calendar year 2008 by 10-year age groups. Of the 286,993 screening mammograms performed, 21,191 (7.4%) had an abnormal result and 1,203 breast cancers were reported as of August 17, 2009 (4.2 per 1,000 exams), including 308 in-situ cancers. For every age group, the abnormal call rate is lower on subsequent screens than on first screens. The overall abnormal call rate decreased with ages between 40 to 49 and 70 to 79, from 9.2% to 5.8%. Overall cancer detection rates, DCIS detection rates, positive predictive value, core biopsy yield ratio, and open biopsy yield ratio increase with age in general.
TABLE V: SMP Outcome Indicators by 10-Year Age Group (2008) Age at Exam
<40 40-49 50-59 60-69 70-79 80+Number of Exams 332 98,176 91,769 64,608 30,784 1,324 286,993
0.1% 34.2% 32.0% 22.5% 10.7% 0.5%Number of First Screens with complete follow-up 298 27,021 8,438 3,395 1,111 80 40,343
0.7% 67.0% 20.9% 8.4% 2.8% 0.2%Number of Cancers 1 199 337 373 282 11 1,203
0.1% 16.5% 28.0% 31.0% 23.4% 0.9%Abnormal Call Rate 12.3% 9.2% 7.0% 6.0% 5.8% 4.9% 7.4% ▪ on first screens 13.0% 15.1% 16.6% 15.1% 13.2% 7.5% 15.3% ▪ on subsequent screens 6.1% 6.9% 6.0% 5.5% 5.5% 4.7% 6.1%
Overall Cancer Detection Rate (per 1,000) 3.0 2.0 3.7 5.8 9.2 8.3 4.2
▪ on first screens 3.4 3.3 6.5 12.1 15.3 25.0 5.1 ▪ on subsequent screens --- 1.5 3.4 5.4 8.9 7.2 4.0DCIS Detection Rate (per 1,000) --- 0.7 1.0 1.6 1.5 0.8 1.1 ▪ on first screens --- 1.4 1.7 2.7 0.9 --- 1.5 ▪ on subsequent screens --- 0.4 0.9 1.5 1.5 0.8 1.0Positive Predictive Value of Screening Mammography 2.5% 2.2% 5.3% 9.7% 16.1% 17.2% 5.7%
▪ on first screens 2.6% 2.2% 4.0% 8.2% 12.1% 33.3% 3.4% ▪ on subsequent screens --- 2.2% 5.7% 9.9% 16.5% 15.5% 6.7%Core Biopsy Yield Ratio --- 18.3% 34.9% 54.0% 67.5% 77.8% 38.2% ▪ on first screens --- 14.5% 22.2% 46.3% 47.8% 100.0% 20.8% ▪ on subsequent screens --- 23.1% 39.4% 55.2% 69.1% 75.0% 45.9%Open Biopsy Yield Ratio 25.0% 20.6% 27.4% 44.7% 55.6% 80.0% 32.8% ▪ on first screens 25.0% 20.9% 18.1% 34.4% 62.5% 100.0% 22.6%
AllOutcome Indicators
▪ on subsequent screens --- 20.3% 30.9% 46.1% 55.2% 75.0% 36.7%
NOTES: 1. See glossary in the Appendix for definitions of terms. 2. Overall Cancer Rate includes ductal carcinoma in situ (DCIS) 3. An additional 240 abnormal screens had incomplete or lost to follow-up. Information from these screens is excluded from
all entries in the table other than exam counts and abnormal call rates. 4. Out of 20951 "abnormal" screens with complete follow-up, there were 14 lobular carcinoma in-situ cases. The final
number of cancers is still to be determined. 5. SMP data extraction data: August 17, 2009.
Page 12 of 34 BC Cancer Agency – Screening Mammography Program
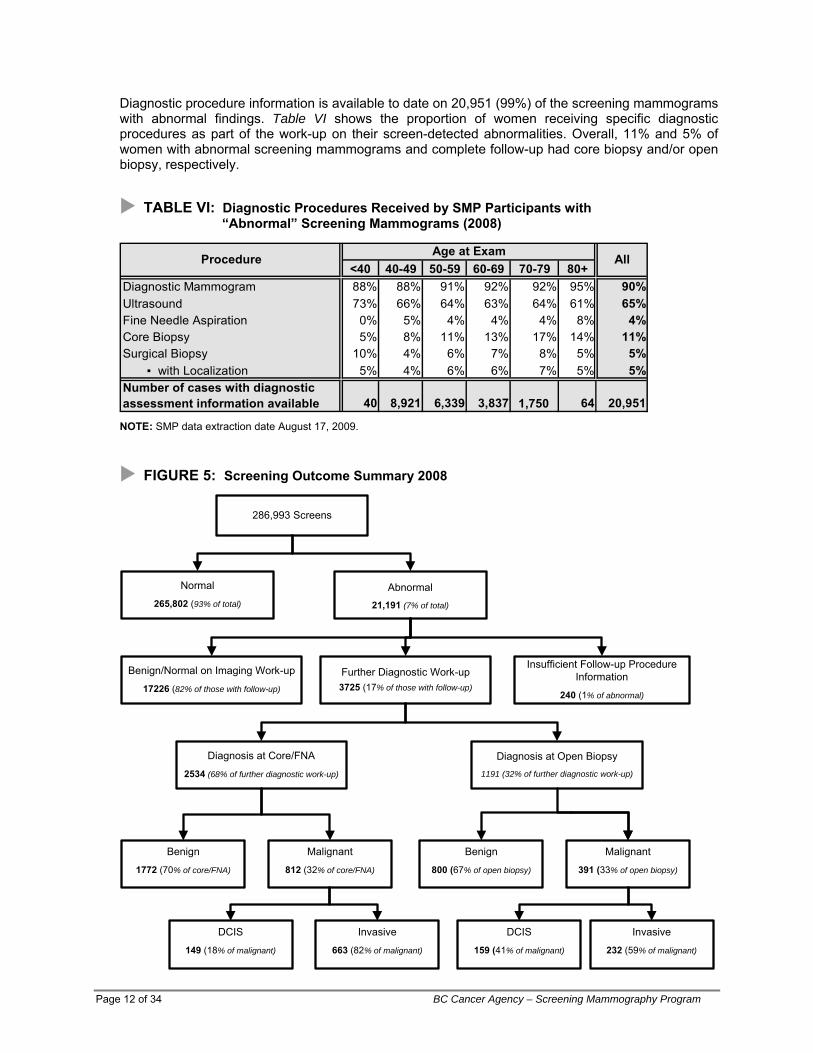
Diagnostic procedure information is available to date on 20,951 (99%) of the screening mammograms with abnormal findings. Table VI shows the proportion of women receiving specific diagnostic procedures as part of the work-up on their screen-detected abnormalities. Overall, 11% and 5% of women with abnormal screening mammograms and complete follow-up had core biopsy and/or open biopsy, respectively.
TABLE VI: Diagnostic Procedures Received by SMP Participants with “Abnormal” Screening Mammograms (2008)
<40 40-49 50-59 60-69 70-79 80+Diagnostic Mammogram 88% 88% 91% 92% 92% 95% 90% Ultrasound 73% 66% 64% 63% 64% 61% 65% Fine Needle Aspiration 0% 5% 4% 4% 4% 8% 4% Core Biopsy 5% 8% 11% 13% 17% 14% 11% Surgical Biopsy 10% 4% 6% 7% 8% 5% 5% ▪ with Localization 5% 4% 6% 6% 7% 5% 5% Number of cases with diagnostic assessment information available 40 8,921 6,339 3,837 1,750 64 20,951
Procedure AllAge at Exam
NOTE: SMP data extraction date August 17, 2009.
FIGURE 5: Screening Outcome Summary 2008
286,993 Screens
Normal
265,802 (93% of total)
Abnormal
21,191 (7% of total)
Insufficient Follow-up Procedure Information
240 (1% of abnormal)
Further Diagnostic Work-up3725 (17% of those with follow-up)
Benign/Normal on Imaging Work-up
17226 (82% of those with follow-up)
Diagnosis at Core/FNA
2534 (68% of further diagnostic work-up)
Diagnosis at Open Biopsy1191 (32% of further diagnostic work-up)
Benign
1772 (70% of core/FNA)
Malignant
812 (32% of core/FNA)
Benign
800 (67% of open biopsy)
Malignant
391 (33% of open biopsy)
Invasive
663 (82% of malignant)
DCIS
149 (18% of malignant)
DCIS
159 (41% of malignant)
Invasive
232 (59% of malignant)
2008/2009 Annual Report Page 13 of 34
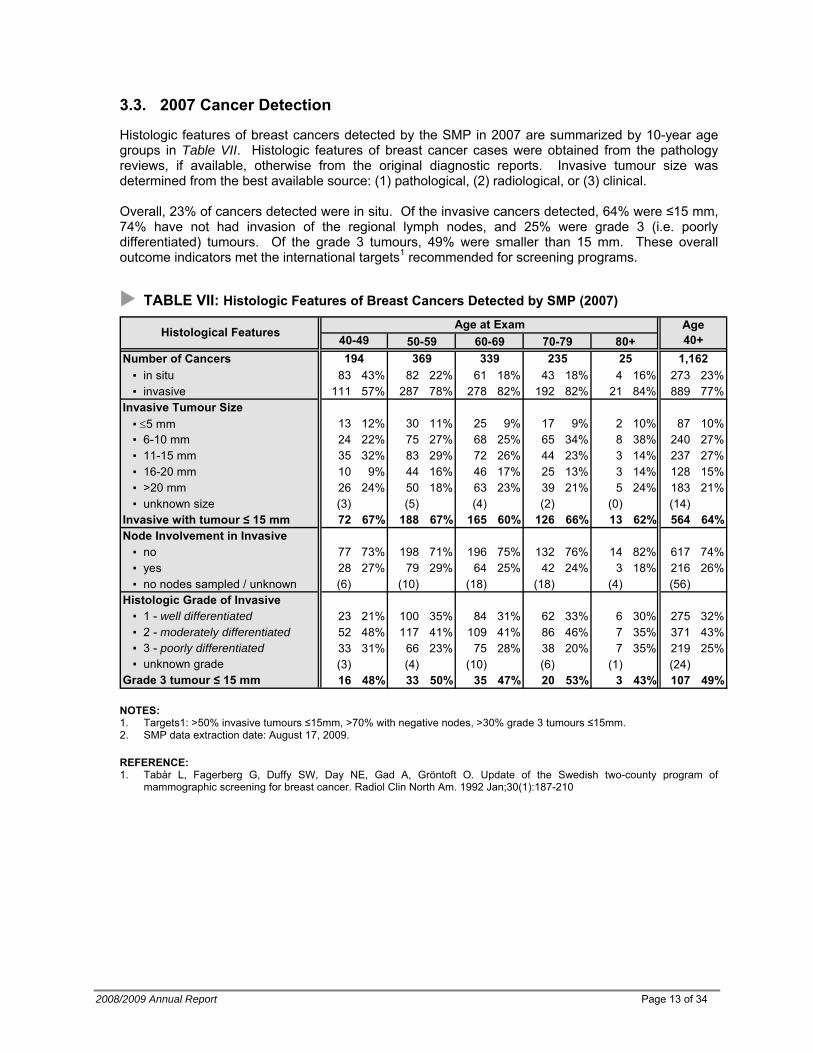
3.3. 2007 Cancer Detection
Histologic features of breast cancers detected by the SMP in 2007 are summarized by 10-year age groups in Table VII. Histologic features of breast cancer cases were obtained from the pathology reviews, if available, otherwise from the original diagnostic reports. Invasive tumour size was determined from the best available source: (1) pathological, (2) radiological, or (3) clinical.
Overall, 23% of cancers detected were in situ. Of the invasive cancers detected, 64% were ≤15 mm, 74% have not had invasion of the regional lymph nodes, and 25% were grade 3 (i.e. poorly differentiated) tumours. Of the grade 3 tumours, 49% were smaller than 15 mm. These overall outcome indicators met the international targets1 recommended for screening programs.
TABLE VII: Histologic Features of Breast Cancers Detected by SMP (2007)
50-59 60-69 70-79 80+Number of Cancers ▪ in situ 83 43% 82 22% 61 18% 43 18% 4 16% 273 23% ▪ invasive 111 57% 287 78% 278 82% 192 82% 21 84% 889 77%Invasive Tumour Size ▪ ≤5 mm 13 12% 30 11% 25 9% 17 9% 2 10% 87 10% ▪ 6-10 mm 24 22% 75 27% 68 25% 65 34% 8 38% 240 27% ▪ 11-15 mm 35 32% 83 29% 72 26% 44 23% 3 14% 237 27% ▪ 16-20 mm 10 9% 44 16% 46 17% 25 13% 3 14% 128 15% ▪ >20 mm 26 24% 50 18% 63 23% 39 21% 5 24% 183 21% ▪ unknown size (3) (5) (4) (2) (0) (14)Invasive with tumour ≤ 15 mm 72 67% 188 67% 165 60% 126 66% 13 62% 564 64%Node Involvement in Invasive ▪ no 77 73% 198 71% 196 75% 132 76% 14 82% 617 74% ▪ yes 28 27% 79 29% 64 25% 42 24% 3 18% 216 26% ▪ no nodes sampled / unknown (6) (10) (18) (18) (4) (56)Histologic Grade of Invasive ▪ 1 - well differentiated 23 21% 100 35% 84 31% 62 33% 6 30% 275 32% ▪ 2 - moderately differentiated 52 48% 117 41% 109 41% 86 46% 7 35% 371 43% ▪ 3 - poorly differentiated 33 31% 66 23% 75 28% 38 20% 7 35% 219 25% ▪ unknown grade (3) (4) (10) (6) (1) (24)
Histological Features Age at Exam Age 40+40-49
25 1,162194 369 339 235
Grade 3 tumour ≤ 15 mm 16 48% 33 50% 35 47% 20 53% 3 43% 107 49%
NOTES: 1. Targets1: >50% invasive tumours ≤15mm, >70% with negative nodes, >30% grade 3 tumours ≤15mm. 2. SMP data extraction date: August 17, 2009.
REFERENCE: 1. Tabàr L, Fagerberg G, Duffy SW, Day NE, Gad A, Gröntoft O. Update of the Swedish two-county program of
mammographic screening for breast cancer. Radiol Clin North Am. 1992 Jan;30(1):187-210
3.4. Outcome Indicators by Calendar Year: 2004-2008
The overall abnormal call rate in 2008 of 7.4% is slightly higher than the previous year (7.0%) and the five-year cumulative rate (7.2%). The overall cancer detection rate and DCIS detection rate for 2008, as well as the corresponding rate for first screens, are slightly higher than the respective five-year cumulative rate. The core biopsy yield ratio and the open biopsy yield ratio in 2008 are lower than the five-year cumulative rate. Regular record linkage with the British Columbia Cancer Registry enables the SMP to determine the number of non-screen detected (interval) cancers in the SMP participants for each year. Sensitivity (i.e. probability of finding women with breast cancer) and specificity (i.e. probability of a negative mammography in women without breast cancer) by calendar year are shown in Table VIII. The SMP conducts formal reviews, both blinded and retrospective, of all interval cancers in the SMP participants. Comparison of prevalence rate at first screen with the historical incidence rate prior to the onset of screening practice provides another measure of program performance. The expected age-specific incidence rates in the absence of screening were derived from the 1982 breast cancer incidence data reported for British Columbia. Since screening may be obtained outside of the SMP, prevalent screens have been restricted to those women with no previous outside mammogram within 24 months of their first SMP encounter. A Swedish two-county study showed a prevalence to expected incidence ratio of 3.09 for ages 50 to 59, and 4.59 for ages 60 to 691, and had recommended the target of >3.0 for organized screening programs2. The annual prevalence to expected incidence ratios for ages 50 to 79 has consistently been above 3.0 from 1995 onwards.
REFERENCES:
1. Tabar L, Fagerberg G, Duffy, SW, Day NE, Gad A, Grontoft O. Update of The Swedish Two-Country Program of
Mammographic Screening for Breast Cancer. Radiol Clin North Am 1992;30:187-209 2. Day NE, Williams DRR, Khaw KT. Breast cancer screening programmes: the development of a monitoring and evaluation
system. Br J Cancer 1989;59:954-958
Page 14 of 34 BC Cancer Agency – Screening Mammography Program
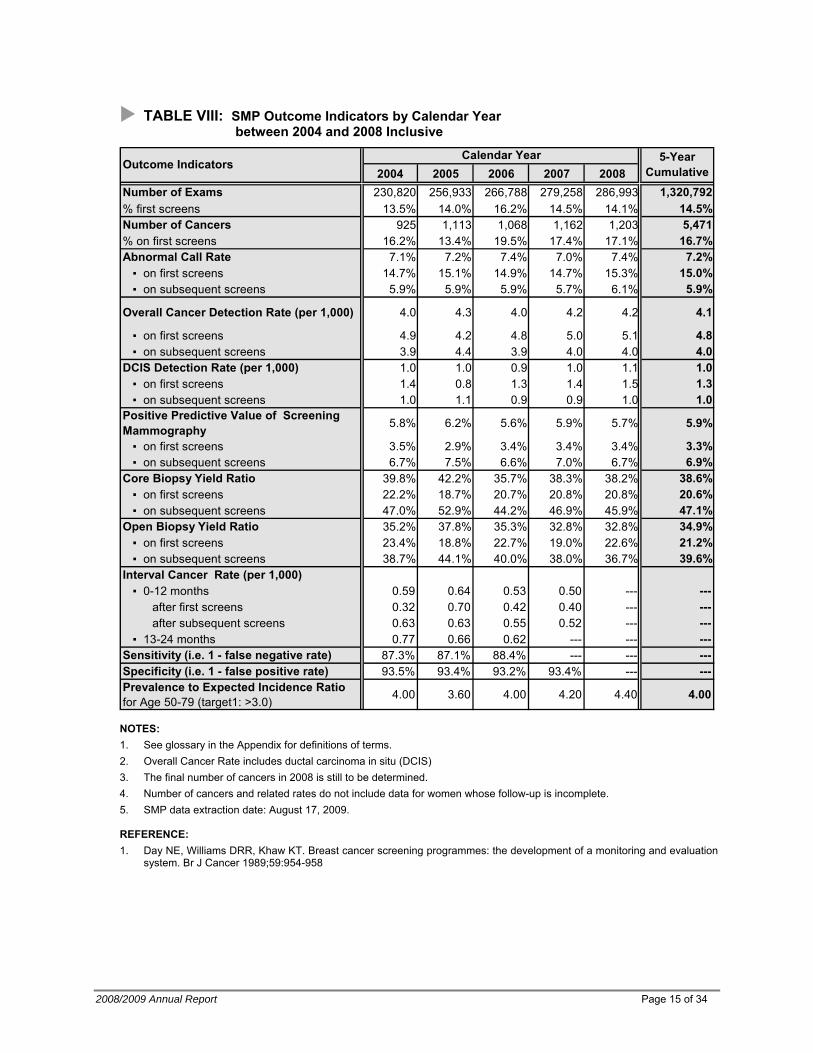
TABLE VIII: SMP Outcome Indicators by Calendar Year between 2004 and 2008 Inclusive
2004 2005 2006 2007 2008Number of Exams 230,820 256,933 266,788 279,258 286,993 1,320,792% first screens 13.5% 14.0% 16.2% 14.5% 14.1% 14.5%Number of Cancers 925 1,113 1,068 1,162 1,203 5,471% on first screens 16.2% 13.4% 19.5% 17.4% 17.1% 16.7%Abnormal Call Rate 7.1% 7.2% 7.4% 7.0% 7.4% 7.2% ▪ on first screens 14.7% 15.1% 14.9% 14.7% 15.3% 15.0% ▪ on subsequent screens 5.9% 5.9% 5.9% 5.7% 6.1% 5.9%
Overall Cancer Detection Rate (per 1,000) 4.0 4.3 4.0 4.2 4.2 4.1
▪ on first screens 4.9 4.2 4.8 5.0 5.1 4.8 ▪ on subsequent screens 3.9 4.4 3.9 4.0 4.0 4.0DCIS Detection Rate (per 1,000) 1.0 1.0 0.9 1.0 1.1 1.0 ▪ on first screens 1.4 0.8 1.3 1.4 1.5 1.3 ▪ on subsequent screens 1.0 1.1 0.9 0.9 1.0 1.0Positive Predictive Value of Screening Mammography 5.8% 6.2% 5.6% 5.9% 5.7% 5.9%
▪ on first screens 3.5% 2.9% 3.4% 3.4% 3.4% 3.3% ▪ on subsequent screens 6.7% 7.5% 6.6% 7.0% 6.7% 6.9%Core Biopsy Yield Ratio 39.8% 42.2% 35.7% 38.3% 38.2% 38.6% ▪ on first screens 22.2% 18.7% 20.7% 20.8% 20.8% 20.6% ▪ on subsequent screens 47.0% 52.9% 44.2% 46.9% 45.9% 47.1%Open Biopsy Yield Ratio 35.2% 37.8% 35.3% 32.8% 32.8% 34.9% ▪ on first screens 23.4% 18.8% 22.7% 19.0% 22.6% 21.2% ▪ on subsequent screens 38.7% 44.1% 40.0% 38.0% 36.7% 39.6%Interval Cancer Rate (per 1,000) ▪ 0-12 months 0.59 0.64 0.53 0.50 --- --- after first screens 0.32 0.70 0.42 0.40 --- --- after subsequent screens 0.63 0.63 0.55 0.52 --- --- ▪ 13-24 months 0.77 0.66 0.62 --- --- ---Sensitivity (i.e. 1 - false negative rate) 87.3% 87.1% 88.4% --- --- ---Specificity (i.e. 1 - false positive rate) 93.5% 93.4% 93.2% 93.4% --- ---Prevalence to Expected Incidence Ratio for Age 50-79 (target1: >3.0) 4.00 3.60 4.00 4.20 4.40 4.00
Outcome Indicators 5-Year Cumulative
Calendar Year
NOTES: 1. See glossary in the Appendix for definitions of terms. 2. Overall Cancer Rate includes ductal carcinoma in situ (DCIS) 3. The final number of cancers in 2008 is still to be determined. 4. Number of cancers and related rates do not include data for women whose follow-up is incomplete. 5. SMP data extraction date: August 17, 2009.
REFERENCE: 1. Day NE, Williams DRR, Khaw KT. Breast cancer screening programmes: the development of a monitoring and evaluation
system. Br J Cancer 1989;59:954-958
2008/2009 Annual Report Page 15 of 34
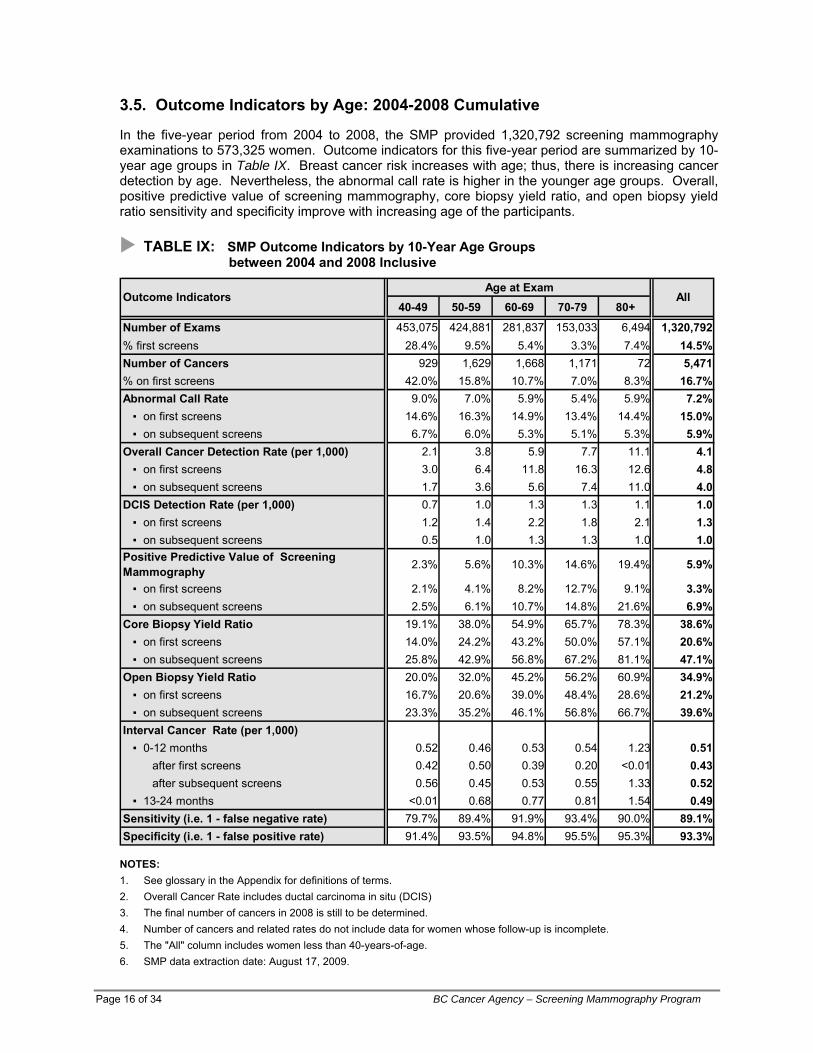
3.5. Outcome Indicators by Age: 2004-2008 Cumulative
In the five-year period from 2004 to 2008, the SMP provided 1,320,792 screening mammography examinations to 573,325 women. Outcome indicators for this five-year period are summarized by 10-year age groups in Table IX. Breast cancer risk increases with age; thus, there is increasing cancer detection by age. Nevertheless, the abnormal call rate is higher in the younger age groups. Overall, positive predictive value of screening mammography, core biopsy yield ratio, and open biopsy yield ratio sensitivity and specificity improve with increasing age of the participants.
TABLE IX: SMP Outcome Indicators by 10-Year Age Groups between 2004 and 2008 Inclusive
Age at Exam40-49 50-59 60-69 70-79 80+
Number of Exams 453,075 424,881 281,837 153,033 6,494 1,320,792% first screens 28.4% 9.5% 5.4% 3.3% 7.4% 14.5%Number of Cancers 929 1,629 1,668 1,171 72 5,471% on first screens 42.0% 15.8% 10.7% 7.0% 8.3% 16.7%Abnormal Call Rate 9.0% 7.0% 5.9% 5.4% 5.9% 7.2% ▪ on first screens 14.6% 16.3% 14.9% 13.4% 14.4% 15.0% ▪ on subsequent screens 6.7% 6.0% 5.3% 5.1% 5.3% 5.9%Overall Cancer Detection Rate (per 1,000) 2.1 3.8 5.9 7.7 11.1 4.1 ▪ on first screens 3.0 6.4 11.8 16.3 12.6 4.8 ▪ on subsequent screens 1.7 3.6 5.6 7.4 11.0 4.0DCIS Detection Rate (per 1,000) 0.7 1.0 1.3 1.3 1.1 1.0 ▪ on first screens 1.2 1.4 2.2 1.8 2.1 1.3 ▪ on subsequent screens 0.5 1.0 1.3 1.3 1.0 1.0Positive Predictive Value of Screening Mammography 2.3% 5.6% 10.3% 14.6% 19.4% 5.9%
▪ on first screens 2.1% 4.1% 8.2% 12.7% 9.1% 3.3% ▪ on subsequent screens 2.5% 6.1% 10.7% 14.8% 21.6% 6.9%Core Biopsy Yield Ratio 19.1% 38.0% 54.9% 65.7% 78.3% 38.6% ▪ on first screens 14.0% 24.2% 43.2% 50.0% 57.1% 20.6% ▪ on subsequent screens 25.8% 42.9% 56.8% 67.2% 81.1% 47.1%Open Biopsy Yield Ratio 20.0% 32.0% 45.2% 56.2% 60.9% 34.9% ▪ on first screens 16.7% 20.6% 39.0% 48.4% 28.6% 21.2% ▪ on subsequent screens 23.3% 35.2% 46.1% 56.8% 66.7% 39.6%Interval Cancer Rate (per 1,000) ▪ 0-12 months 0.52 0.46 0.53 0.54 1.23 0.51 after first screens 0.42 0.50 0.39 0.20 <0.01 0.43 after subsequent screens 0.56 0.45 0.53 0.55 1.33 0.52 ▪ 13-24 months <0.01 0.68 0.77 0.81 1.54 0.49Sensitivity (i.e. 1 - false negative rate) 79.7% 89.4% 91.9% 93.4% 90.0% 89.1%Specificity (i.e. 1 - false positive rate) 91.4% 93.5% 94.8% 95.5% 95.3% 93.3%
Outcome Indicators All
NOTES: 1. See glossary in the Appendix for definitions of terms. 2. Overall Cancer Rate includes ductal carcinoma in situ (DCIS) 3. The final number of cancers in 2008 is still to be determined. 4. Number of cancers and related rates do not include data for women whose follow-up is incomplete. 5. The "All" column includes women less than 40-years-of-age. 6. SMP data extraction date: August 17, 2009.
Page 16 of 34 BC Cancer Agency – Screening Mammography Program
2008/2009 Annual Report Page 17 of 34
3.6. Outcome Indicators by HSDA: 2004-2008 Cumulative
Outcome indicators for 2004 to 2008 are summarized by HSDA in Table X. The Interior and Vancouver Island HSDAs have the lowest abnormal call rate (5%), while Fraser East has the highest (10%). South Vancouver Island has the lowest cancer detection rate (3.3 per 1,000), while Central Vancouver Island has the highest (4.7 per 1,000). Fraser East has the lowest positive predictive value (4%), and Central Vancouver Island and Kootenay Boundary have the highest (9%).
Table X: SMP Outcome Indicators by Health Service Delivery Area (HSDA) between 2004 and 2008 Inclusive
HSDA % Called Abnormal
Cancer Detection
Rate (per 1000)
PPVIn-Situ : Invasive (number)
% Invasive ≤15 mm
% Invasive with -ve nodes
East Kootenay 5% 3.8 7% 6 : 56 46% 71% Kootenay Boundary 5% 4.2 9% 26 : 68 65% 68% Okanagan 5% 4.2 8% 119 : 398 65% 75% Thompson Cariboo 5% 4.3 8% 69 : 261 61% 71% Fraser East 10% 4.6 4% 68 : 253 57% 70% Fraser North 8% 4.1 5% 194 : 498 65% 68% Fraser South 9% 4.4 5% 216 : 596 60% 70% Richmond 8% 3.7 5% 76 : 171 64% 67% Vancouver 8% 4.1 5% 215 : 514 67% 68% North Shore / Coast Garibaldi 6% 4.4 7% 102 : 272 66% 69% South Vancouver Island 5% 3.3 7% 67 : 349 60% 66% Central Vancouver Island 5% 4.7 9% 76 : 342 70% 72% North Vancouver Island 5% 3.7 8% 24 : 115 71% 79% Northwest 6% 4.0 6% 17 : 49 59% 53% Northern Interior 7% 4.5 6% 47 : 137 62% 68% Northeast 7% 3.6 5% 6 : 36 56% 53% Program 7% 4.1 6% 1330 : 4141 63% 70%
NOTES: 1. See glossary in the Appendix for definitions of terms. 2. Targets1: >50% invasive tumours ≤15mm, >70% with negative nodes 3. SMP data extraction date: August 17, 2009.
REFERENCE: 1. Tabàr L, Fagerberg G, Duffy SW, Day NE, Gad A, Gröntoft O. Update of the Swedish two-county program of
mammographic screening for breast cancer. Radiol Clin North Am. 1992 Jan;30(1):187-210
Page 18 of 34 BC Cancer Agency – Screening Mammography Program
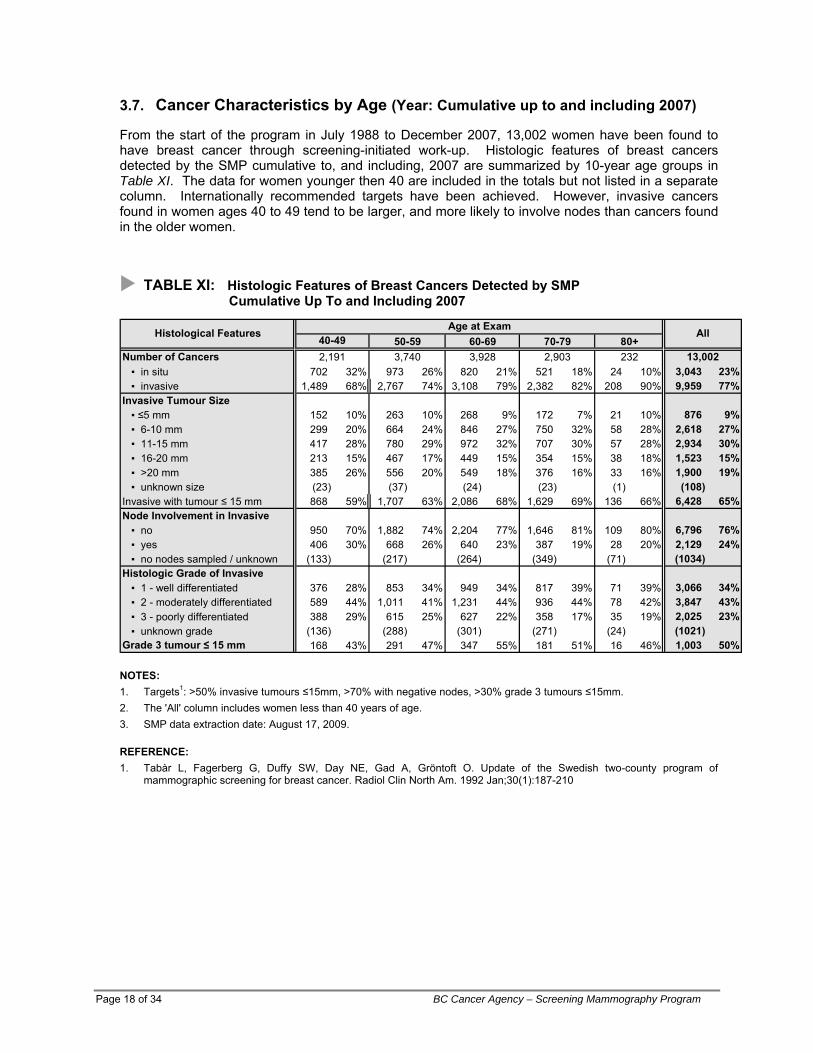
3.7. Cancer Characteristics by Age (Year: Cumulative up to and including 2007)
From the start of the program in July 1988 to December 2007, 13,002 women have been found to have breast cancer through screening-initiated work-up. Histologic features of breast cancers detected by the SMP cumulative to, and including, 2007 are summarized by 10-year age groups in Table XI. The data for women younger then 40 are included in the totals but not listed in a separate column. Internationally recommended targets have been achieved. However, invasive cancers found in women ages 40 to 49 tend to be larger, and more likely to involve nodes than cancers found in the older women.
TABLE XI: Histologic Features of Breast Cancers Detected by SMP Cumulative Up To and Including 2007
50-59 60-69 70-79 80+Number of Cancers ▪ in situ 702 32% 973 26% 820 21% 521 18% 24 10% 3,043 23% ▪ invasive 1,489 68% 2,767 74% 3,108 79% 2,382 82% 208 90% 9,959 77%Invasive Tumour Size ▪ ≤5 mm 152 10% 263 10% 268 9% 172 7% 21 10% 876 9% ▪ 6-10 mm 299 20% 664 24% 846 27% 750 32% 58 28% 2,618 27% ▪ 11-15 mm 417 28% 780 29% 972 32% 707 30% 57 28% 2,934 30% ▪ 16-20 mm 213 15% 467 17% 449 15% 354 15% 38 18% 1,523 15% ▪ >20 mm 385 26% 556 20% 549 18% 376 16% 33 16% 1,900 19% ▪ unknown size (23) (37) (24) (23) (1) (108)Invasive with tumour ≤ 15 mm 868 59% 1,707 63% 2,086 68% 1,629 69% 136 66% 6,428 65%Node Involvement in Invasive ▪ no 950 70% 1,882 74% 2,204 77% 1,646 81% 109 80% 6,796 76% ▪ yes 406 30% 668 26% 640 23% 387 19% 28 20% 2,129 24% ▪ no nodes sampled / unknown (133) (217) (264) (349) (71) (1034)Histologic Grade of Invasive ▪ 1 - well differentiated 376 28% 853 34% 949 34% 817 39% 71 39% 3,066 34% ▪ 2 - moderately differentiated 589 44% 1,011 41% 1,231 44% 936 44% 78 42% 3,847 43% ▪ 3 - poorly differentiated 388 29% 615 25% 627 22% 358 17% 35 19% 2,025 23% ▪ unknown grade (136) (288) (301) (271) (24) (1021)
Histological Features Age at Exam All40-49232 13,0022,191 3,740 3,928 2,903
Grade 3 tumour ≤ 15 mm 168 43% 291 47% 347 55% 181 51% 16 46% 1,003 50% NOTES: 1. Targets1: >50% invasive tumours ≤15mm, >70% with negative nodes, >30% grade 3 tumours ≤15mm. 2. The 'All' column includes women less than 40 years of age. 3. SMP data extraction date: August 17, 2009.
REFERENCE: 1. Tabàr L, Fagerberg G, Duffy SW, Day NE, Gad A, Gröntoft O. Update of the Swedish two-county program of
mammographic screening for breast cancer. Radiol Clin North Am. 1992 Jan;30(1):187-210
3.8. Comparison with Canadian Standards
The Canadian Breast Cancer Screening Initiative (CBCSI) was launched in 1992. Under this initiative, Health Canada (now Public Health Agency of Canada) facilitated a federal/provincial/territorial network that enabled collaboration in the implementation and evaluation of breast cancer screening programs in Canada. The Canadian Breast Cancer Screening Database (CBCSD) was first established in 1993. All provincial and territorial programs in Canada are now contributing data to the CBCSD. The first evaluation report on Organized Breast Cancer Screening Programs in Canada was published in 1999, and prompted the creation of the Evaluation Indicators Working Group to begin the task of defining performance measures for Canadian breast cancer screening programs. Biennial evaluation reports are now produced regularly from the CBCSD by PHAC. In this section, the SMP performance measures are presented against the targets set for Canadian breast cancer screening programs1. This document defined a set of performance measures that were developed on the basis of recognized population screening principles, evidence from randomized controlled trials, demonstration projects, and observational studies.
REFERENCE: 1. Report from the Evaluation Indicators Working Group: Guidelines for Monitoring Breast Screening Program Performance
Second Edition. Health Canada 2007
2008/2009 Annual Report Page 19 of 34
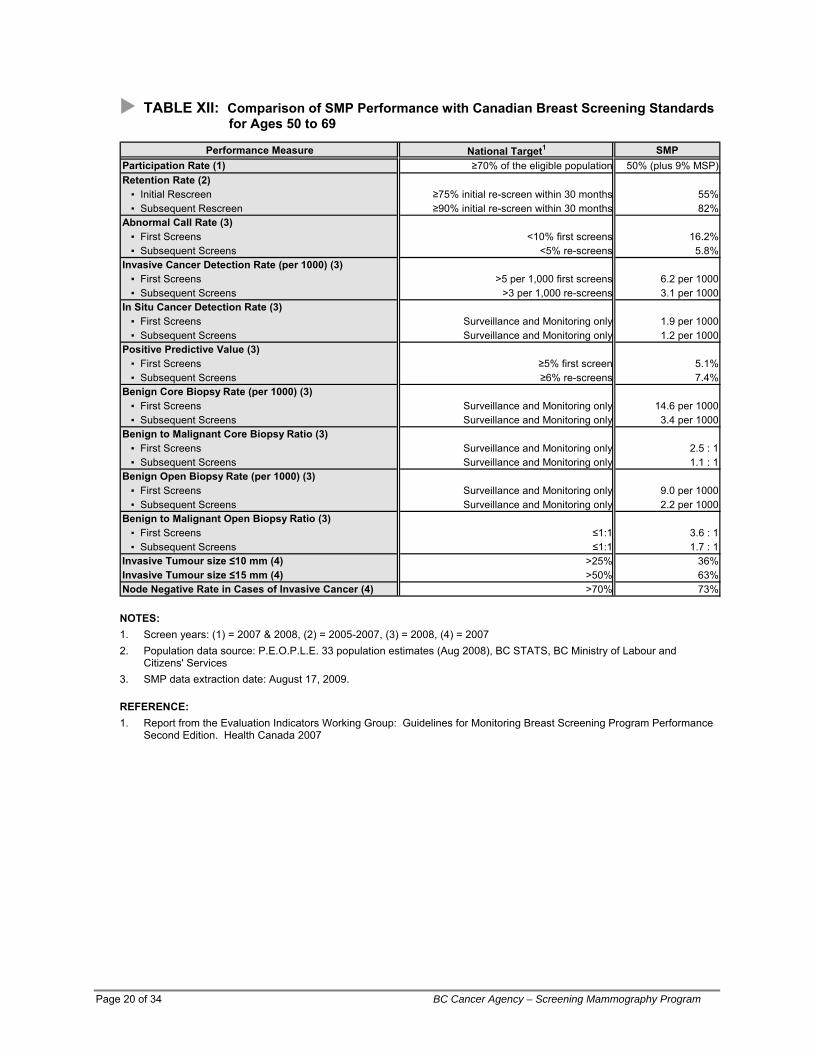
TABLE XII: Comparison of SMP Performance with Canadian Breast Screening Standards for Ages 50 to 69
Performance Measure National Target1 SMPParticipation Rate (1) ≥70% of the eligible population 50% (plus 9% MSP)Retention Rate (2) ▪ Initial Rescreen ≥75% initial re-screen within 30 months 55% ▪ Subsequent Rescreen ≥90% initial re-screen within 30 months 82%Abnormal Call Rate (3) ▪ First Screens <10% first screens 16.2% ▪ Subsequent Screens <5% re-screens 5.8%Invasive Cancer Detection Rate (per 1000) (3) ▪ First Screens >5 per 1,000 first screens 6.2 per 1000 ▪ Subsequent Screens >3 per 1,000 re-screens 3.1 per 1000In Situ Cancer Detection Rate (3) ▪ First Screens Surveillance and Monitoring only 1.9 per 1000 ▪ Subsequent Screens Surveillance and Monitoring only 1.2 per 1000Positive Predictive Value (3) ▪ First Screens ≥5% first screen 5.1% ▪ Subsequent Screens ≥6% re-screens 7.4%Benign Core Biopsy Rate (per 1000) (3) ▪ First Screens Surveillance and Monitoring only 14.6 per 1000 ▪ Subsequent Screens Surveillance and Monitoring only 3.4 per 1000Benign to Malignant Core Biopsy Ratio (3) ▪ First Screens Surveillance and Monitoring only 2.5 : 1 ▪ Subsequent Screens Surveillance and Monitoring only 1.1 : 1Benign Open Biopsy Rate (per 1000) (3) ▪ First Screens Surveillance and Monitoring only 9.0 per 1000 ▪ Subsequent Screens Surveillance and Monitoring only 2.2 per 1000Benign to Malignant Open Biopsy Ratio (3) ▪ First Screens ≤1:1 3.6 : 1 ▪ Subsequent Screens ≤1:1 1.7 : 1Invasive Tumour size ≤10 mm (4) >25% 36%Invasive Tumour size ≤15 mm (4) >50% 63%Node Negative Rate in Cases of Invasive Cancer (4) >70% 73%
NOTES: 1. Screen years: (1) = 2007 & 2008, (2) = 2005-2007, (3) = 2008, (4) = 2007 2. Population data source: P.E.O.P.L.E. 33 population estimates (Aug 2008), BC STATS, BC Ministry of Labour and
Citizens' Services 3. SMP data extraction date: August 17, 2009.
REFERENCE: 1. Report from the Evaluation Indicators Working Group: Guidelines for Monitoring Breast Screening Program Performance
Second Edition. Health Canada 2007
Page 20 of 34 BC Cancer Agency – Screening Mammography Program
2008/2009 Annual Report Page 21 of 34
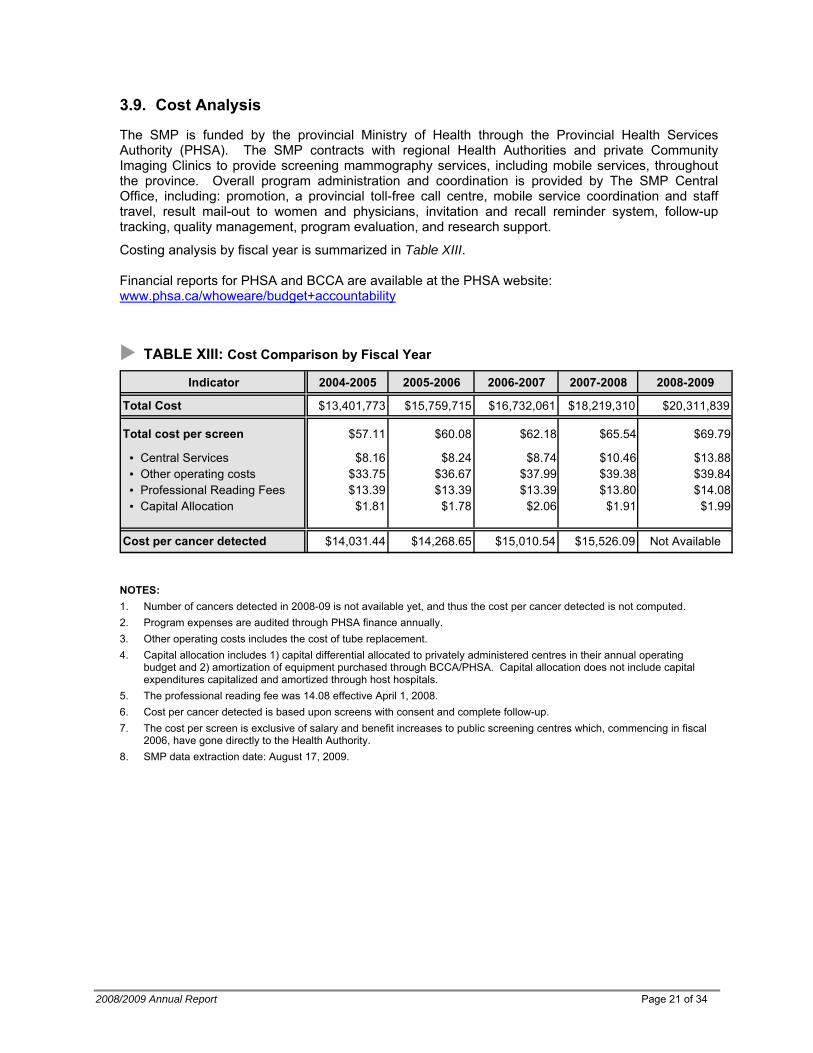
3.9. Cost Analysis
The SMP is funded by the provincial Ministry of Health through the Provincial Health Services Authority (PHSA). The SMP contracts with regional Health Authorities and private Community Imaging Clinics to provide screening mammography services, including mobile services, throughout the province. Overall program administration and coordination is provided by The SMP Central Office, including: promotion, a provincial toll-free call centre, mobile service coordination and staff travel, result mail-out to women and physicians, invitation and recall reminder system, follow-up tracking, quality management, program evaluation, and research support.
Costing analysis by fiscal year is summarized in Table XIII. Financial reports for PHSA and BCCA are available at the PHSA website: www.phsa.ca/whoweare/budget+accountability
TABLE XIII: Cost Comparison by Fiscal Year
Indicator 2004-2005 2005-2006 2006-2007 2007-2008 2008-2009
Total Cost $13,401,773 $15,759,715 $16,732,061 $18,219,310 $20,311,839
Total cost per screen $57.11 $60.08 $62.18 $65.54 $69.79
▪ Central Services $8.16 $8.24 $8.74 $10.46 $13.88 ▪ Other operating costs $33.75 $36.67 $37.99 $39.38 $39.84 ▪ Professional Reading Fees $13.39 $13.39 $13.39 $13.80 $14.08 ▪ Capital Allocation $1.81 $1.78 $2.06 $1.91 $1.99
Cost per cancer detected $14,031.44 $14,268.65 $15,010.54 $15,526.09 Not Available
NOTES: 1. Number of cancers detected in 2008-09 is not available yet, and thus the cost per cancer detected is not computed. 2. Program expenses are audited through PHSA finance annually. 3. Other operating costs includes the cost of tube replacement. 4. Capital allocation includes 1) capital differential allocated to privately administered centres in their annual operating
budget and 2) amortization of equipment purchased through BCCA/PHSA. Capital allocation does not include capital expenditures capitalized and amortized through host hospitals.
5. The professional reading fee was 14.08 effective April 1, 2008. 6. Cost per cancer detected is based upon screens with consent and complete follow-up. 7. The cost per screen is exclusive of salary and benefit increases to public screening centres which, commencing in fiscal
2006, have gone directly to the Health Authority. 8. SMP data extraction date: August 17, 2009.
APPENDIX 1: General Cancer Screening Program Overview
Definition of Screening Screening is a prevention strategy. Primary cancer prevention strategy involves changes of behavior or habits that reduce a risk, for example, stopping smoking, fat reduction in the diet, etc. Screening for cancer is a secondary prevention strategy. Secondary cancer prevention strategy targets disease in process1. A secondary prevention can reduce cancer morbidity and mortality by: diagnosing invasive disease at an earlier, more favorable prognostic stage; and, detecting precursor lesions associated with some cancers that once eliminated, prevent progression to invasive disease. Screening is “the application of various tests to apparently healthy individuals to sort out those who probably have risk factors or are in the early stages of specified conditions.”2 Limitations of Screening The decision to screen an at-risk population for pre-clinical signs of cancer is based on well-established criteria related to cancer and the screening tests that we used to identify individuals who may have occult disease.3,4,5 The overall objective of a screening program is to reduce morbidity and mortality from cancer. The goal of screening is to “apply a relatively simple, inexpensive test to a large number of persons in order to classify them as likely or unlikely to have the cancer”. The emphasis on likelihood underscores the limits of what should be expected from screening (i.e., screening tests are not diagnostic tests). A person with an abnormal screening test does not have a definitive diagnosis until additional, more sophisticated diagnostic tests are completed. The emphasis on likelihood also is important because screening tests are inherently limited in their accuracy, which varies by test, cancer site, and individual characteristics. Although most of screening interpretations are accurate, it is inevitable that some individuals are identified as possibly having cancer when they do not, and screening tests fail to identify some individuals who do not have the disease. The comparative evaluation of accuracy versus error cannot be considered in absolute terms, but rather should be evaluated in terms of the relative consequences of one or the other kind of error. Organized Population Screening Program To reduce morbidity and mortality from cancer in a population by screening, there must be coordinated and effective strategies to ensure acceptance and utilization of the established screening test. Since screening is targeted at asymptomatic women, the fine balance between maximizing benefits and minimizing undesirable effects must be maintained. An organized approach to screening ensures that the target population has access to the screening service and that it accepts and uses the services offered. This is achieved by including the following six program components:
1. Health Promotion 4. Screening Test & Reporting 2. Professional Development/Education 5. Follow-up 3. Recruitment & Retention 6. Evaluation/Research Partnerships
The success of screening is a shared responsibility of the team of individuals working together to develop goals, set standards, monitor progress, and continue improvement in each of the six components. 1US Preventive Services Task Force: Guide to Clinical Preventive Services, Ed 2. Baltimore, Williams & Wilkins, 1996 2 Morrison A: Screening in Chronic Disease. New York, Oxford Press, 1992 3 Cole P, Morrison AS: Basic issues in cancer screening. In Miller AB (ed); Screening in Cancer. Geneva, International Union Against Cancer, 1978, p7 4 Miller AB; Fundamentals of Screening. In Screening for Cancer. Orlando, Academic Press, 1985, p3 5 Wilson JMG, Junger G; Principles and Practice of Screening for Disease. Geneva, World Health Organization, 196
Page 22 of 34 BC Cancer Agency – Screening Mammography Program
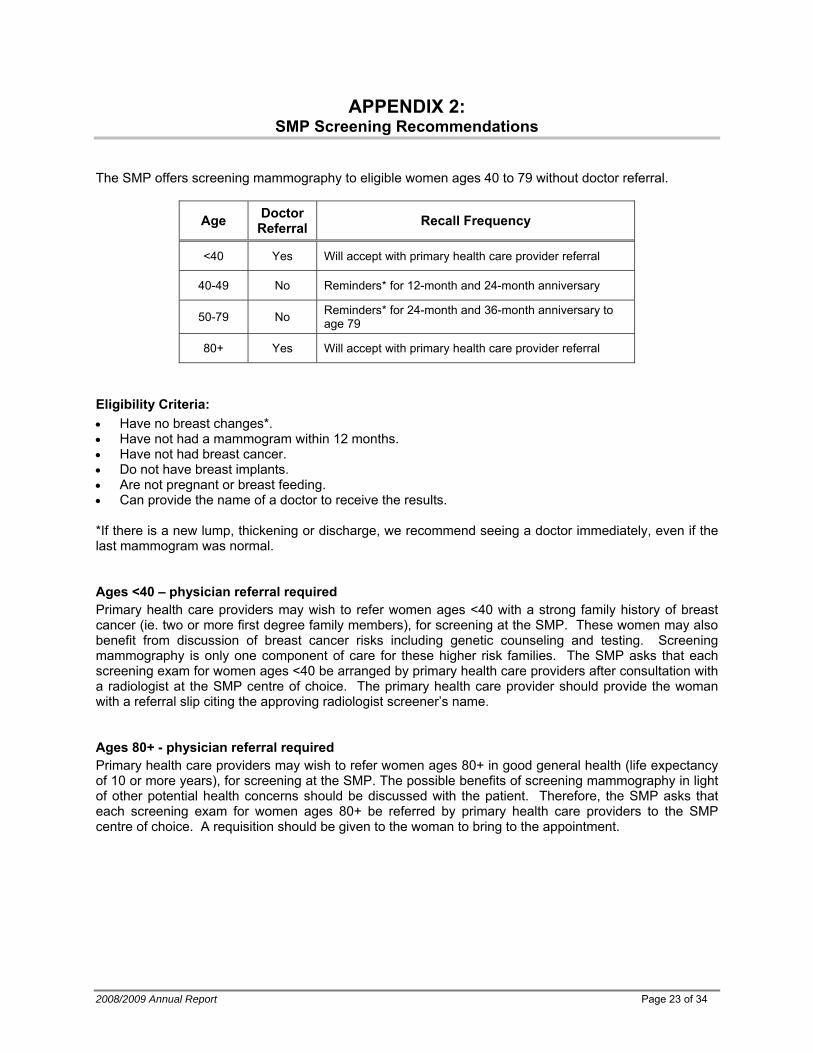
APPENDIX 2: SMP Screening Recommendations
The SMP offers screening mammography to eligible women ages 40 to 79 without doctor referral.
Doctor Referral Age Recall Frequency
<40 Yes Will accept with primary health care provider referral
40-49 No Reminders* for 12-month and 24-month anniversary
50-79 No Reminders* for 24-month and 36-month anniversary to age 79
80+ Yes Will accept with primary health care provider referral
Eligibility Criteria: • Have no breast changes*. • Have not had a mammogram within 12 months. • Have not had breast cancer. • Do not have breast implants. • Are not pregnant or breast feeding. • Can provide the name of a doctor to receive the results. *If there is a new lump, thickening or discharge, we recommend seeing a doctor immediately, even if the last mammogram was normal. Ages <40 – physician referral required Primary health care providers may wish to refer women ages <40 with a strong family history of breast cancer (ie. two or more first degree family members), for screening at the SMP. These women may also benefit from discussion of breast cancer risks including genetic counseling and testing. Screening mammography is only one component of care for these higher risk families. The SMP asks that each screening exam for women ages <40 be arranged by primary health care providers after consultation with a radiologist at the SMP centre of choice. The primary health care provider should provide the woman with a referral slip citing the approving radiologist screener’s name. Ages 80+ - physician referral required Primary health care providers may wish to refer women ages 80+ in good general health (life expectancy of 10 or more years), for screening at the SMP. The possible benefits of screening mammography in light of other potential health concerns should be discussed with the patient. Therefore, the SMP asks that each screening exam for women ages 80+ be referred by primary health care providers to the SMP centre of choice. A requisition should be given to the woman to bring to the appointment.
2008/2009 Annual Report Page 23 of 34
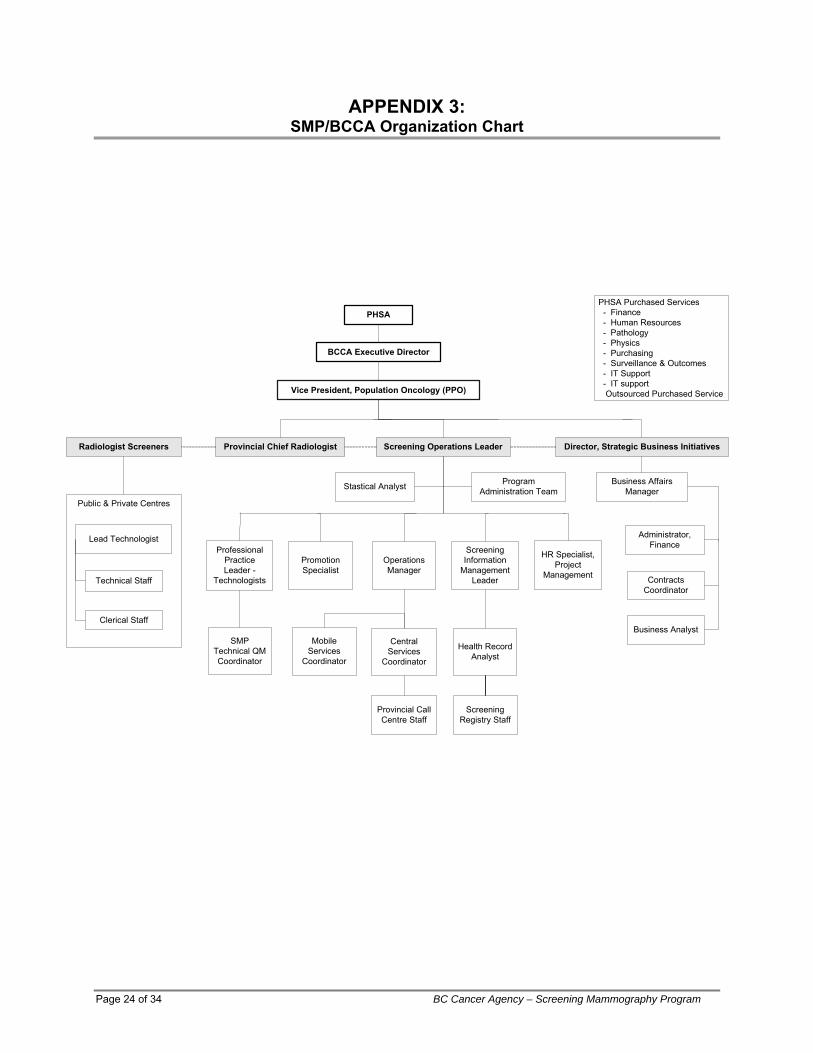
APPENDIX 3: SMP/BCCA Organization Chart
PHSA
Vice President, Population Oncology (PPO)
Provincial Chief RadiologistRadiologist Screeners
Public & Private Centres
Lead Technologist
Technical Staff
Clerical Staff
Screening Information
Management Leader
Program Administration Team
Operations Manager
Health Record Analyst
PHSA Purchased Services - Finance - Human Resources - Pathology - Physics - Purchasing - Surveillance & Outcomes - IT Support - IT support Outsourced Purchased Service
BCCA Executive Director
Screening Operations Leader
Mobile Services
Coordinator
Professional Practice Leader -
Technologists
Director, Strategic Business Initiatives
Promotion Specialist
Central Services
Coordinator
Screening Registry Staff
SMP Technical QM Coordinator
Provincial Call Centre Staff
HR Specialist, Project
Management
Business Affairs ManagerStastical Analyst
Administrator, Finance
Contracts Coordinator
Business Analyst
Page 24 of 34 BC Cancer Agency – Screening Mammography Program
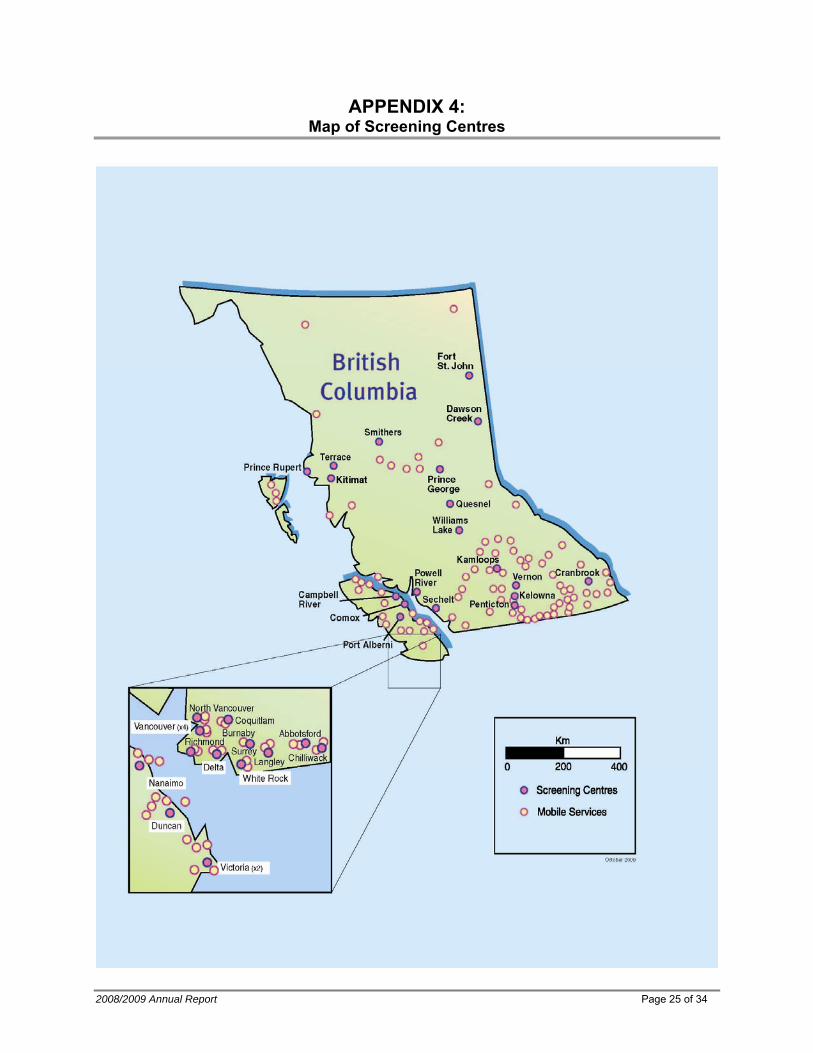
APPENDIX 4: Map of Screening Centres
2008/2009 Annual Report Page 25 of 34
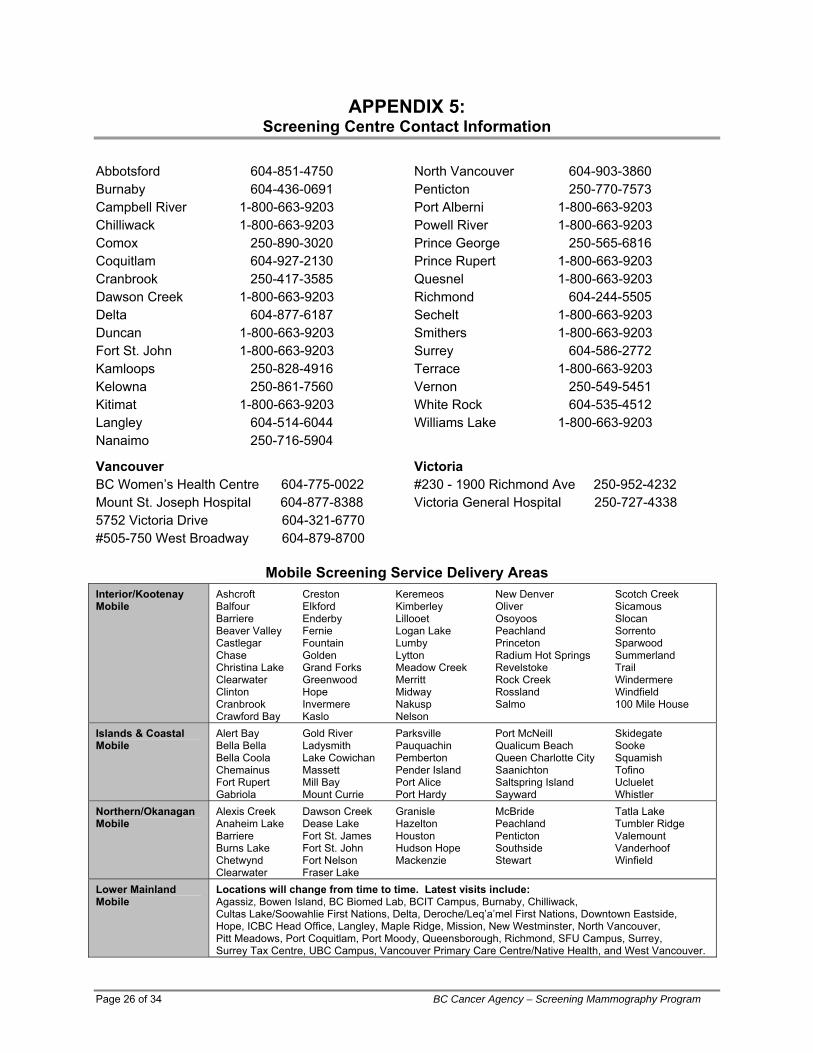
APPENDIX 5: Screening Centre Contact Information
North Vancouver 604-903-3860 Abbotsford 604-851-4750 Penticton 250-770-7573 Burnaby 604-436-0691 Port Alberni 1-800-663-9203 Campbell River 1-800-663-9203 Powell River 1-800-663-9203 Chilliwack 1-800-663-9203 Prince George 250-565-6816 Comox 250-890-3020 Prince Rupert 1-800-663-9203 Coquitlam 604-927-2130 Quesnel 1-800-663-9203 Cranbrook 250-417-3585 Richmond 604-244-5505 Dawson Creek 1-800-663-9203 Sechelt 1-800-663-9203 Delta 604-877-6187 Smithers 1-800-663-9203 Duncan 1-800-663-9203 Surrey 604-586-2772 Fort St. John 1-800-663-9203 Terrace 1-800-663-9203 Kamloops 250-828-4916 Vernon 250-549-5451 Kelowna 250-861-7560 White Rock 604-535-4512 Kitimat 1-800-663-9203 Williams Lake 1-800-663-9203 Langley 604-514-6044 Nanaimo 250-716-5904
Victoria Vancouver #230 - 1900 Richmond Ave 250-952-4232 BC Women’s Health Centre 604-775-0022 Victoria General Hospital 250-727-4338 Mount St. Joseph Hospital 604-877-8388
5752 Victoria Drive 604-321-6770 #505-750 West Broadway 604-879-8700
Mobile Screening Service Delivery Areas
Interior/Kootenay Ashcroft Creston Keremeos New Denver Scotch Creek Mobile Balfour Elkford Kimberley Oliver Sicamous
Barriere Enderby Lillooet Osoyoos Slocan Beaver Valley Fernie Logan Lake Peachland Sorrento Castlegar Fountain Lumby Princeton Sparwood Chase Golden Lytton Radium Hot Springs Summerland Christina Lake Grand Forks Meadow Creek Revelstoke Trail Clearwater Greenwood Merritt Rock Creek Windermere Clinton Hope Midway Rossland Windfield Cranbrook Invermere Nakusp Salmo 100 Mile House Crawford Bay Kaslo Nelson
Islands & Coastal Alert Bay Gold River Parksville Port McNeill Skidegate Mobile Bella Bella Ladysmith Pauquachin Qualicum Beach Sooke
Bella Coola Lake Cowichan Pemberton Queen Charlotte City Squamish Chemainus Massett Pender Island Saanichton Tofino Fort Rupert Mill Bay Port Alice Saltspring Island Ucluelet Gabriola Mount Currie Port Hardy Sayward Whistler
Northern/Okanagan Alexis Creek Dawson Creek Granisle McBride Tatla Lake Mobile Anaheim Lake Dease Lake Hazelton Peachland Tumbler Ridge
Barriere Fort St. James Houston Penticton Valemount Burns Lake Fort St. John Hudson Hope Southside Vanderhoof Chetwynd Fort Nelson Mackenzie Stewart Winfield Clearwater Fraser Lake Locations will change from time to time. Latest visits include: Lower Mainland
Mobile Agassiz, Bowen Island, BC Biomed Lab, BCIT Campus, Burnaby, Chilliwack, Cultas Lake/Soowahlie First Nations, Delta, Deroche/Leq’a’mel First Nations, Downtown Eastside, Hope, ICBC Head Office, Langley, Maple Ridge, Mission, New Westminster, North Vancouver, Pitt Meadows, Port Coquitlam, Port Moody, Queensborough, Richmond, SFU Campus, Surrey, Surrey Tax Centre, UBC Campus, Vancouver Primary Care Centre/Native Health, and West Vancouver.
Page 26 of 34 BC Cancer Agency – Screening Mammography Program

2008/2009 Annual Report Page 27 of 34
APPENDIX 6: Educational Materials Order Form
SMP PAMPHLETS, TEAR PADS, POSTERS, BOOKMARKS & CDS/DVDS PAMPHLETS Quantities 1) Pass it On (order code SMP 028)
English 25 50 Chinese 25 50 Punjabi 25 50
APPOINTMENT PADS (TEAR PADS) Quantities 1) Lower Mainland English 5 10 Punjabi 5 10 Traditional Chinese 5 10 2) All other locations English 5 10 Punjabi 5 10 Traditional Chinese 5 10 POSTERS (limit of 10 posters)-English only BOOKMARKS Quantities
Pass it On ______ Quantities:
Why Regular Mammograms are Important ______ ___________ Balancing Your Health Needs (Aboriginal Poster) _______ CD - How a Screening Mammogram is Given (no audio-PowerPoint)
English Only English/Punjabi
Chinese Only English/Chinese
Punjabi Only English/Punjabi/Chinese
DVD - Having a Screening Mammogram (with audio)
English only
ABORIGINAL MATERIALS Quantities
Health Check Cards 25 50
Posters _________ (maximum 10)
Please fax this form to:
604-877-6113
or mail to: SMPBC Central Office, 711-750 W. Broadway, Vancouver, B.C. V5Z 1H6
PLEASE PROVIDE YOUR ADDRESS & PHONE Name:___________________________
________________________________
Address:_________________________
________________________________
________________________________
________________________________
Postal Code:______________________
PHONE NUMBER:
_______________________________

Page 28 of 34 BC Cancer Agency – Screening Mammography Program
APPENDIX 7: Glossary
• Abnormal Call Rate: Proportion of screening mammography examinations determined to require further diagnostic assessment (ie. called "abnormal").
• Benign Core Biopsy Rate: Proportion of cases with complete follow-up that resulted in a benign core biopsy.
• Benign Open Biopsy Rate: Proportion of cases with complete follow-up that resulted in a benign open
biopsy. • Benign to Malignant Core Biopsy Ratio
1 : MB
b
b=RatioBiopsy CoreMalignant Benign to
Bb Number of women who had screen-initiated core biopsy and did not have breast cancer diagnosis.
Mb Number of women who had screen-initiated core biopsy and had breast cancer diagnosis. • Benign to Malignant Open Biopsy Ratio
1 : MB
b
b=RatioBiopsy Open Malignant Benign to
Bb Number of women who had screen-initiated open biopsy and did not have breast cancer diagnosis.
Mb Number of women who had screen-initiated open biopsy and had breast cancer diagnosis. • Core Biopsy Yield Ratio: Proportion of cases with core biopsy that resulted in a diagnosis of breast
cancer.
Bb Number of women without breast cancer diagnosis on screen-initiated core biopsy.
Mb Number of women found to have breast cancer on screen-initiated core biopsy. • Open Biopsy Yield Ratio: Proportion of cases with open biopsy that resulted in a diagnosis of breast
cancer. %100Ratio YieldBiopsy Open ×
+=
MB
bb
M b
Bb Number of women without breast cancer diagnosis on screen-initiated open biopsy.
Mb Number of women found to have breast cancer on screen-initiated open biopsy. • Overall Cancer Detection Rate: Number of cancer cases detected per 1,000 screens with complete
follow-up. • DCIS (or In Situ Cancer) Detection Rate: Number of ductal carcinoma in situ (DCIS) cases detected
per 1,000 screens with complete follow-up. • Invasive Cancer Detection Rate: Number of invasive cancer cases detected per 1,000 screens with
complete follow-up.
examsofnumber Totalabnormal called exams ofNumber = Rate Call Abnormal
%100Ratio YieldBiopsy Core ×+
= MB
M bb
b
2008/2009 Annual Report Page 29 of 34
• Interval Cancer Rate: Number of women being diagnosed with post-screen breast cancer within the specified period of time per 1,000 “normal” screening episode.
• Positive Predictive Value (PPV) of Screening Mammography: Proportion of "abnormal" cases found
to have breast cancer after diagnostic workup.
up-follow complete with cases abnormal"" ofNumber cancers detected-screen ofNumber PPV =
• Prevalence to Expected Incidence Ratio: Comparison between incidence rate at first (prevalent)
screen with historical incidence rate prior to onset of screening practice. Prevalent screens have been restricted to those women with no previous outside mammogram within 24 months of their first program screens. The 1982 incidence rates by five-year age group obtained from the BC Cancer Registry were chosen as the comparison reference.
∑∑=
i ii
i i
RNCa
Ratio I:P
Where Ni is the number of prevalent screens for age group i, Cai is the number of cancers detected in prevalent screens for age group i and Ri is the expected incidence rate for age group i. Prevalence to expected incidence ratio for ages 50 to 79 would be calculated by summing over age groups 50 to 54, 55 to 59, 60 to 64, 65 to 69, 70 to 74, and 75 to 79 in the numerator and denominator.
• Retention Rate: The percentage of women returned for rescreen within 30 months of their previous
visit.
rescreenforeligiblewomenofNumberrescreenforturnedrewomen ofNumberRatetentionRe =
• Return (Compliance) Rate: The percentage of women without history of breast cancer diagnosis
returned for rescreen within a certain period of time. • Sensitivity: Probability of interpreting screening mammograms of breast cancer cases as “abnormal”.
It measures how well screening mammography determines the presence of breast cancer.
FN + TPTP = ySensitivit
TP Number of screen-detected breast cancer cases. FN Number of breast cancer cases called “normal” and diagnosed within 12 months post
screen. • Specificity: Probability of interpreting screening mammograms of cases with no evidence of breast
cancer as "normal". It measures how well screening mammography determines the absence of breast cancer.
FP + TNTN = ySpecificit
TN Number of cases with "normal" screening mammograms that remained without evidence of breast cancer before the next screening visit, or within 12 months after the last screening visit.
FP Number of cases with no evidence of breast cancer but whose screening mammograms were called "abnormal".
• Participation Rate: The percentage of women who have a screening mammogram (calculated
biennially) as a proportion of the eligible population. The eligible population is estimated by the average of the two-year population from forecast.
• Node Negative Rate in Cases of Invasive Cancer: Proportion of invasive cancers in which the
cancer has not invaded the lymph nodes.

APPENDIX 8: Acknowledgement & Contributors
The Screening Mammography Program would like to thank its partners who have supported and contributed to the Program over the years. The success of the Program depends on an integrated system of:
• Community health professionals promoting the benefits of screening
• Dedicated and highly trained staff to process and read the screening mammograms
• Family doctors and medical specialists to provide diagnostic follow-up and treatment
• Community facilities providing space and personnel to support mammography
We would like to thank the following organizations for their ongoing support (alphabetical):
• Alliance for Breast Cancer
• BC Cancer Foundation
• BC Medical Association
• BC Women’s Health Centre
• Canadian Breast Cancer Foundation
• College of Physicians and Surgeons
• Women’s Health Bureau
Contributors (Alphabetical Listing)
• Margaret Bangen, Director, Strategic Business Initiatives, Population Oncology
• Irene Brown, Administrative Coordinator
• Christina Chu, Biostatistician, Surveillance & Outcomes, Population Oncology
• Dr. Andrew Coldman, Vice President, Population Oncology
• Magali Coustalin, Program Secretary
• Lisa Kan, Screening Operations Leader
• Dr. Linda Warren, Provincial Chief Radiologist
Page 30 of 34 BC Cancer Agency – Screening Mammography Program

APPENDIX 9: Committees
Alphabetical Listing Academic Committee Screener’s Advisory Committee Dr. Andy Coldman Dr. Ken Bentley Dr. Paula Gordon - Chair Dr. Larry Breckon Dr. Malcolm Hayes Dr. Michael Clare Ms. Lisa Kan Dr. Eleanore Clark Dr. Rasika Rajapakshe Dr. Don Coish Ms. Janette Sam Dr. Andy Coldman Dr. Linda Warren Dr. Dan Dolden Dr. Nancy Graham Quality Management Committee Dr. Lynn Jacobsen
Dr. Rob Johnson Dr. Stephen Chia Ms. Lisa Kan Ms. Christina Chu Dr. Nicola Lapinsky Dr. Andy Coldman Dr. Richard Lee Dr. Malcolm Hayes Dr. Patrick Llewellyn Ms. Lisa Kan Dr. Heather MacNaughton Ms. Ann MacDonald Dr. Daryn Maisonneuve Ms. Sheila MacMahon Dr. Peter McNicholas Ms. Janette Sam Dr. Katherine Miller Ms. Elaine Simpson Dr. David O'Keeffe Mr. Larry St. Germain Dr. Rasika Rajapakshe Dr. Linda Warren - Chair Dr. Stuart Silver Dr. Kelly Silverthorn Dr. Frederick Smith Dr. Catherine Staples Dr. Phil Switzer Dr. Lynette Thurber Dr. Linda Warren - Chair Dr. Jose Zanbilowicz
2008/2009 Annual Report Page 31 of 34

APPENDIX 10: Radiologist Screeners
Alphabetical Listing Abbotsford Langley Vancouver BC Women’s
Health Centre Dr. Lynn Jacobsen Dr. Ron Campbell Dr. Marion J. Kreml Dr. Paula Gordon Dr. John Matheson Dr. Caroline Pon Dr. Patricia Hassell Dr. Kathryn Miller Dr. Linda Warren Burnaby & Richmond Nanaimo/Islands & Coastal
Mobile Dr. Bill Collins Vancouver Mount St. Joseph Hospital Dr. Nancy Graham Dr. David Coupland
Dr. Henry Huey Dr. Richard Lee Dr. Rob Johnson Dr. Marty Jenkins Dr. Zenobia Kotwall Dr. Vee Lail Dr. David O'Keeffe Vancouver Victoria Drive Dr. Elizabeth Tanton Dr. Paul Trepanier Dr. Lorna Fulton Dr. Lynette Thurber Dr. Connie Siu Northern/Okanagan/Lower
Mainland Mobile Dr. Phil Switzer Comox
Dr. Dave McKeown Dr. Kelly Silverthorn Vancouver #505 - 750 West Broadway Dr. Jose Zanbilowicz
North Vancouver Dr. Nicola Lapinsky Coquitlam Dr. Sven Aippersbach Dr. Linda Warren Dr. Jennifer Dolden Dr. Barry Irish Dr. Maria Kidney Dr. Patrick Llewellyn Vernon Dr. Heather MacNaughton Dr. Catherine Phillips Dr. Ken Bentley Dr. Carol Miller Dr. Ian Marsh Dr. Anita McEachern Penticton Dr. Glenn Scheske Dr. Peter McNicholas Cranbrook Dr. Stacey Piche Victoria General Hospital/
Victoria Richmond Ave Dr. Daryn Maisonneuve Dr. Julie Nicol Prince George Dr. Richard Eddy Dr. Larry Breckon Dr. Nicola Finn Interior/Kootenay Mobile Dr. Alasdair Leighton Dr. George Hodgins Dr. Kelly Silverthorn Dr. Greg Shand Dr. Robert Koopmans Dr. Brent Lee Kamloops Dr. Colin Lee Sechelt Dr. Michael Clare Dr. Delmer Pengelly Dr. Daniel Dolden Dr. Donal Downey Dr. Stuart Silver Dr. Frederick Smith Surrey
Dr. John Wrinch Kelowna Dr. Don Coish Dr. Wayne Middelkamp Dr. Guy Eriksen Victoria Richmond Avenue Dr. Catherine Staples Dr. Dennis Janzen Dr. Timothy Wall See Victoria General Hospital Dr. Amir Neyestani
Dr. John Sisler White Rock Dr. L. Earl Tregobov Dr. Eleanor Clark Dr. Joanne Coppola
Page 32 of 34 BC Cancer Agency – Screening Mammography Program
APPENDIX 11: Publications & Presentations
Publications
1. Borugian MJ, Kan L. The effect of socioeconomic status on first visits to mammography screening. Network News, Canadian Breast Cancer Network; Summer 2008.
2. Coldman AJ, Phillips N, Olivotto IA, Gordon P, Warren L, Kan L. Impact of changing from annual to biennial screening mammographic screening on breast cancer outcomes in women ages 50 to 79 in British Columbia. J Med Screen. 2008;15(4):182-7
3. Poole B, Gelmon K, Borugian, MJ, Kan L, Stilwell M. Breast cancer screening and diagnosis in BC. British Columbia Medical Journal 2008; 50(4):198-205.
Presentations and Lectures Alphabetical Listing
• Dr. Paula Gordon
1. Breast Lumps in Young Women: Diagnosis and Referral, Reach Clinic In-Service Day, Vancouver, BC. June 18, 2008.
2. Ultrasound Guided Breast Interventional Procedures (Hands-on Workshop), Radiological Society of North America Annual Meeting, Chicago, IL, Dec 1, 2008.
3. Small Parts Interventional Ultrasound (Hands-on Workshop), Radiological Society of North America Annual Meeting, Chicago, IL, Dec 4, 2008.
4. Breast Ultrasound: Equipment and Technique, Radiological Society of North America Annual Meeting, Chicago, IL, Dec 4, 2008.
5. New Ultrasound Technologies in the Breast. Practical Radiology, Whistler, BC, Feb 10, 2009.
• Dr. Rasika Rajapakshe
1. Quality Improvements in Breast Health: Analog to Digital Mammography, Improving Quality of Care and Patient Safety Through Accreditation, Diagnostic Accreditation Program Educational Conference, Vancouver, BC, May 12, 2008
• Dr. Linda Warren
1. Selection, Training and Monitoring 2. Performance Indicators 3. Abnormal Philosophy 4. CAD – Looking Twice 5. Calcifications 6. The False Negative Mammogram 7. Masses 8. Screening Radiologists Performance and Standardized Test King Fahad Specialist Hospital, Damman, Saudi Arabia, April 26-30, 2008.
9. Mammography Screening Program – Philosophy and Design 10. How to Set-Up and Run a Screening Program 11. Lessons From Accreditation 12. Economic Factors in Mammography Screening National Breast Screening Guidelines Symposium, King Fahad Specialist Hospital, Damman, Saudi Arabia, May 1, 2008.
2008/2009 Annual Report Page 33 of 34
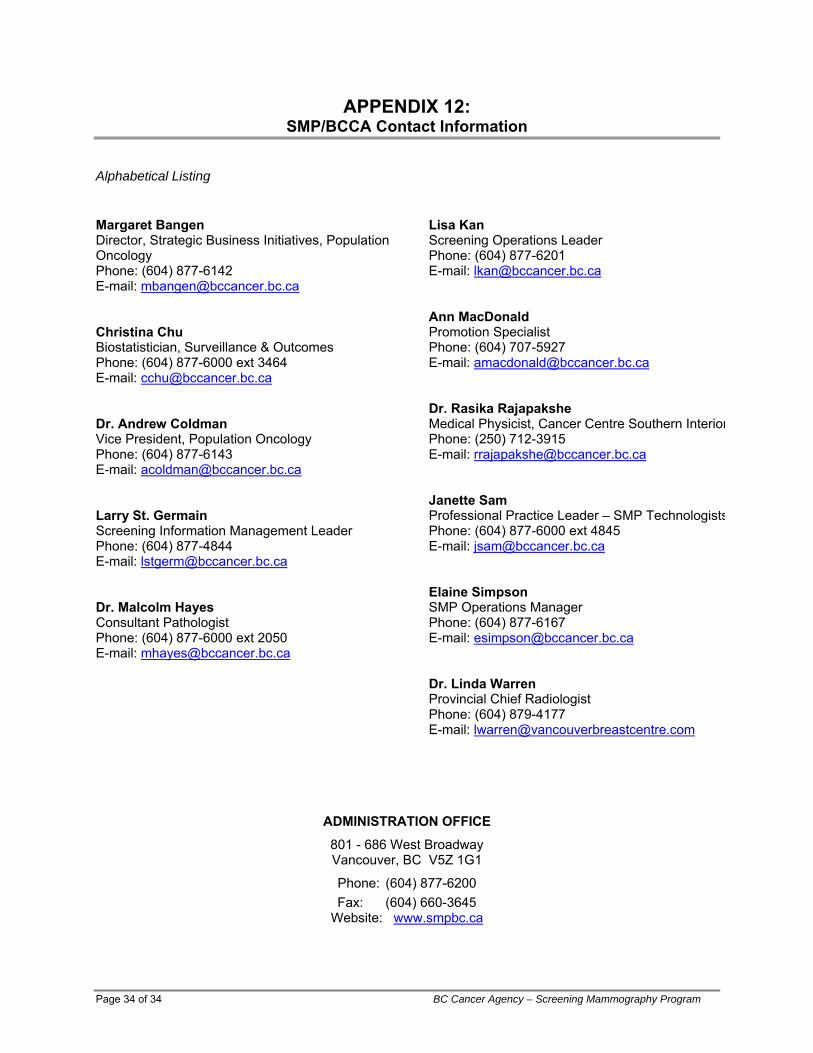
Page 34 of 34 BC Cancer Agency – Screening Mammography Program
APPENDIX 12: SMP/BCCA Contact Information
Alphabetical Listing Margaret Bangen Director, Strategic Business Initiatives, Population Oncology Phone: (604) 877-6142 E-mail: [email protected] Christina Chu Biostatistician, Surveillance & Outcomes Phone: (604) 877-6000 ext 3464 E-mail: [email protected] Dr. Andrew Coldman Vice President, Population Oncology Phone: (604) 877-6143 E-mail: [email protected] Larry St. Germain Screening Information Management Leader Phone: (604) 877-4844 E-mail: [email protected] Dr. Malcolm Hayes Consultant Pathologist Phone: (604) 877-6000 ext 2050 E-mail: [email protected]
Lisa Kan Screening Operations Leader Phone: (604) 877-6201 E-mail: [email protected] Ann MacDonald Promotion Specialist Phone: (604) 707-5927 E-mail: [email protected] Dr. Rasika Rajapakshe Medical Physicist, Cancer Centre Southern InteriorPhone: (250) 712-3915 E-mail: [email protected] Janette Sam Professional Practice Leader – SMP TechnologistsPhone: (604) 877-6000 ext 4845 E-mail: [email protected] Elaine Simpson SMP Operations Manager Phone: (604) 877-6167 E-mail: [email protected] Dr. Linda Warren Provincial Chief Radiologist Phone: (604) 879-4177 E-mail: [email protected]
ADMINISTRATION OFFICE
801 - 686 West Broadway Vancouver, BC V5Z 1G1
Phone: (604) 877-6200 Fax: (604) 660-3645
Website: www.smpbc.ca