Embed Size (px)
Citation preview
SURVEILLANCE REPORT
www.ecdc.europa.eu
Surveillance of invasive bacterial diseases in Europe
2008/09
ECDC SURVEILLANCE REPORT
Surveillance of invasive bacterial diseases in Europe
2008/2009

This report was produced by the ECDC Vaccine-preventable Diseases Group, coordinated by Ida Czumbel.
The authors gratefully acknowledge all national meningococcal disease and Haemophilus influenzae disease experts who kindly shared their knowledge and expertise.
Suggested citation: European Centre for Disease Prevention and Control. Surveillance of invasive bacterial diseases in Europe 2008/2009. Stockholm: ECDC; 2011.
Stockholm, June 2011
ISBN 978-92-9193-301-3
doi:10.2900/56013
© European Centre for Disease Prevention and Control, 2011
Reproduction is authorised, provided the source is acknowledged.

SURVEILLANCE REPORT Surveillance of invasive bacterial diseases in Europe 2008/2009
iii
Table of contents Executive summary ........................................................................................................................................ 1
1 Introduction ............................................................................................................................................... 3
2 Methods ..................................................................................................................................................... 4
2.1 Case definition ...................................................................................................................................... 4
2.1.1 Invasive H. influenzae disease .......................................................................................................... 4
2.1.2 Invasive meningococcal disease ....................................................................................................... 4
2.2 Data sources ........................................................................................................................................ 4
2.2.1 Population data ............................................................................................................................... 5
2.3 Data submission and validation .............................................................................................................. 5
2.4 Data analysis ........................................................................................................................................ 5
2.4.1 Invasive Haemophilus influenzae disease .......................................................................................... 5
2.4.2 Invasive meningococcal disease ....................................................................................................... 6
3 Results: invasive Haemophilus influenzae disease .......................................................................................... 7
3.1 Laboratory methods used for strain identification ..................................................................................... 7
3.2 Data quality .......................................................................................................................................... 7
3.3 Epidemiological analysis ......................................................................................................................... 7
3.3.1 Seasonal trend .............................................................................................................................. 10
3.3.2 Gender distribution........................................................................................................................ 11
3.3.3 Age distribution ............................................................................................................................ 11
3.3.4 Serotypes ..................................................................................................................................... 12
3.3.5 Clinical presentation ...................................................................................................................... 18
3.3.6 Case fatality ratio .......................................................................................................................... 19
3.3.7 Vaccination status ......................................................................................................................... 20
3.3.8 Vaccination schedules .................................................................................................................... 21
4 Results: invasive meningococcal disease ..................................................................................................... 22
4.1 Laboratory methods used for strain identification ................................................................................... 22
4.2 Data quality ........................................................................................................................................ 22
4.3 Epidemiological analysis ....................................................................................................................... 22
4.3.1 Overall notification rates ................................................................................................................ 22
4.3.2 Seasonal trend .............................................................................................................................. 25
4.3.3. Gender distribution....................................................................................................................... 25
4.3.4 Age distribution ............................................................................................................................ 25
4.3.5 Probable country of infection .......................................................................................................... 26
4.3.6 Serogroups ................................................................................................................................... 26
4.3.7 Further characterisation of N. meningitidis....................................................................................... 33
4.3.8 Antimicrobial susceptibility of isolates of N. meningitidis ................................................................... 35
4.3.9 Clinical presentation ...................................................................................................................... 35
4.3.10 Case fatality ratio ........................................................................................................................ 38
4.3.11 Vaccination status ....................................................................................................................... 41
4.3.12 Vaccination schedules .................................................................................................................. 42

Surveillance of invasive bacterial diseases in Europe 2008/2009 SURVEILLANCE REPORT
iv
5 Discussion ................................................................................................................................................ 44
5.1 Case definitions .................................................................................................................................. 44
5.2 Data sources ...................................................................................................................................... 44
5.3 Laboratory test methods ...................................................................................................................... 44
5.4 Completeness of surveillance data ........................................................................................................ 44
5.5 Epidemiology of invasive H. influenzae disease ...................................................................................... 45
5.5.1 Overall notification rates ................................................................................................................ 45
5.5.2 Age distribution ............................................................................................................................ 45
5.5 3 Serotypes ..................................................................................................................................... 45
5.5.4 Clinical presentation ...................................................................................................................... 46
5.5.5 Case fatality ratio .......................................................................................................................... 46
5.5.6 Vaccination status ......................................................................................................................... 46
5.5.7 Vaccination schedule ..................................................................................................................... 46
5.6 Epidemiology of invasive meningococcal disease .................................................................................... 46
5.6.1 Overall notification rates ................................................................................................................ 46
5.6.2 Age distribution ............................................................................................................................ 47
5.6.3 Serogroups ................................................................................................................................... 47
5.6.4 Molecular typing data .................................................................................................................... 47
5.6.5 Clinical presentation ...................................................................................................................... 47
5.6.6 Vaccination status and vaccination schedule .................................................................................... 48
6 Conclusions .............................................................................................................................................. 49
7 Recommendations ..................................................................................................................................... 50
References .................................................................................................................................................. 51
Annex 1: Country profiles – H. influenzae disease ........................................................................................... 52
Annex 2: Invasive H. influenzae disease ......................................................................................................... 81
Annex 3: Invasive meningococcal disease .................................................................................................... 104

SURVEILLANCE REPORT Surveillance of invasive bacterial diseases in Europe 2008/2009
v
Abbreviations CFR Case fatality ratio ECDC European Centre for Disease Prevention and Control EEA European Economic Area EU European Union EUCAST European Committee on Antimicrobial Susceptibility Testing EU-IBIS European Union Invasive Bacterial Infections Surveillance Network Eurostat Statistical office of the European Union Hi Haemophilus influenzae Hib H. influenzae type b IBD Invasive bacterial disease IMD Invasive meningococcal disease MCC Meningococcal C vaccination MIC Minimal inhibitory concentration MLST Multilocus sequence typing MS Member State PCR Polymerase chain reaction WHO World Health Organization


SURVEILLANCE REPORT Surveillance of invasive bacterial diseases in Europe 2008/2009
1
Executive summary This report describes the epidemiology of invasive bacterial diseases due to Haemophilus influenzae and Neisseria meningitidis in the European Union (EU) Member States in 2008 and 2009. Designated national contact points from national public health institutes submitted data using the revised metadata set for both diseases.
Out of the 30 EU/EEA Member States, 29 submitted data on invasive Haemophilus influenzae (Hi) disease and on invasive meningococcal disease. The majority of participating countries (Belgium, Spain and France reported voluntary system for Hi) have a passive and compulsory surveillance system in place for both diseases. In terms of comprehensiveness, two countries (France and Spain) provided sentinel surveillance data for invasive Haemophilus influenzae disease. Twenty-eight countries reported case-based data and one country (Bulgaria) submitted aggregated data. The used case definitions differed from country to country, with the majority applying 2008 case definitions. Historical data used in this analysis (1999–2006) were retrieved from the European Union Invasive Bacterial Infections Surveillance Network (EU-IBIS) database, now hosted at ECDC. Population statistics were derived from Eurostat, the statistical office of the European Union.
Various changes in the surveillance methods occurred along the years – changes in case definitions, in population sources, in data collection methods, in validation rules, new laboratory methodologies became available and the systems became more comprehensive.
Furthermore, the heterogeneity in the data reporting may be attributable to a number of possible differences:
• among disease surveillance systems in the Member States (MS), such as sensitivity of the surveillance systems, variation in the types of clinical presentations under surveillance (i.e., sepsis or meningitis or both) in each MS;
• in the applied case definitions; • in the laboratory capacities; or • in the healthcare practices for ensuring early blood culture sampling.
Therefore, the results should be interpreted with proper care, taking into account the above mentioned changes and variations.
Invasive meningococcal disease In 2008–2009, 9 615 cases of invasive bacterial disease due to N. meningitidis were notified in the EU/EEA, with an overall notification rate of 0.99 in 2008 and 0.92 in 2009 per 100 000. Almost all cases were laboratory confirmed (96% in 2008, 97% in 2009). Meningococcal disease appears to be rare in the majority of MS. The two most affected countries were Ireland (3.68 in 2008 and 3.37 in 2009) and UK (2.29 in 2008 and 2.02 in 2009) compared to the rest of Europe, although in both countries there is a sustained declining trend. Apart from these two countries, another four MS had notification rates above 1.00 per 100 000 in 2008 and 2009: Lithuania, Spain, Denmark, and Austria.
Information on age was available for 99.4% of reported cases. The most affected age group was infants younger than 1 year (notification rate: 18.3 in 2008 and 15.9 in 2009) followed by 1–4 year-olds (notification rate: 5.8 in 2008 and 5.4 in 2009) and teenagers 15–19 years old (notification rate: 2.1 in 2008 and 2.0 in 2009). Among the older age groups the disease was reported only rarely.
Information on serogroup was available in 88% of reported cases. Twenty-six out of 28 reporting countries provided data on serogroup. The serogroup identification has improved substantially over the years, with the number of unknown cases decreasing substantially over the last seven years, from 1 448 in 2003 to 347 of unknown serogroup in 2009.
Among the known serogroups, B formed the largest proportion (71% in 2008 and 2009) followed by serogroup C (14% in 2008 and 13% in 2009). The highest proportion of Y cases was reported in Nordic countries in a range lying between 34% and 15% (Sweden: 20% in 2008 and 34% in 2009; Norway: 17% in 2008 and 25% in 2009; Finland: 15% in 2009), followed by Estonia (17% in 2008). In the rest of Europe, the Y disease was present in a range lying between 0% and 8%.
Serogroup A activity still remains low in Europe (< 1% in 2008 and 2009; n=18 in 2008 and n=24 in 2009).
In countries with meningococcal C vaccination (MCC), there is a large predominance of B cases in all age groups and, in particular, in the age groups younger than 1 year and 1–4 years (76% and 78% of cases, respectively), the usual targeted groups for vaccination against serogroup C.

Surveillance of invasive bacterial diseases in Europe 2008/2009 SURVEILLANCE REPORT
2
In countries with MCC vaccination, the proportion of cases due to serogroup C has decreased dramatically and the notification rates (per 100 000 population) of C disease fell by half in age groups targeted by vaccination (< 1 year: 0.54; 1–4 years: 0.22; 15–19 years: 0.17 ), compared with countries without MCC vaccination (< 1year: 1.01; 1–4 years: 0.45; 15–19 years: 0.29).
Information on serotyping and subtyping of strains is increasing due to the adoption of molecular technologies in more and more countries. However, the number of samples serotyped and serosubtyped remains low and the interpretation of these results must be done with care. For multilocus sequence typing (MLST), data completeness was 10.9% of cases. Taking into account 2008 and 2009 data (n=981), MLST showed that the bacterial population was highly diverted, comprising 26 different clonal complexes, of which 26.1% of isolates (n=256) belonged to CC ST-41 complex, followed by CC ST-11 complex (21.1% n=207) and CC ST-32 complex (16.3% n=160). Outcome was available in 92% of cases. With 340 deaths attributed to invasive meningococcal disease (IMD), the overall case fatality ratio was 7.4%.
Until vaccines against a broad range of serogroup B meningococci become available for universal use, the main methods of control remain the early detection, adequate treatment of primary cases and the prevention of secondary cases.
Invasive Haemophilus influenzae disease A total of 3 572 cases of invasive Haemophilus influenzae disease were reported in 2008 and 2009 with an overall European notification rate of 0.41 per 100 000 population in 2008 and 0.36 per 100 000 population in 2009. The notification rates varied across the MS and the rates in the Nordic countries, in particular Sweden (1.78 in 2008 and 1.58 in 2009) and Norway (1.58 in 2008 and 1.48 in 2009) were higher compared to the rest of Europe. However, the majority of the countries stayed below 1 case per 100 000 population.
The highest overall notification rates have been reported among infants younger than 1 year of age (2.84 in 2008 and 2.69 in 2009) and persons over 65 years old (1.09 in 2008 and 0.84 in 2009).
While notification rates among infants younger than 1 year decreased substantially for serotype b (from 2.94 in 1999 to 0.50 in 2009), they increased for non-capsulated strains, moving from 1.57 up to 3.45 in the same period.
In 2008 and 2009, 68% of all reported invasive H. influenzae cases were due to non-capsulated strains.
Non-capsulated strains have been the most frequently reported serotype among countries that consistently report all serotypes. The increase in the number of non-capsulated strains reported over the years may be partially attributable to an improvement in the sensitivity of the surveillance systems, which have also been documented in several MS; however, it could also be explained by changes in the epidemiological profile of the disease [1].
After a peak in 2002–2003, a gradual decrease in the notification rate of b serotype has been observed. The introduction of the H. influenzae type b (Hib) conjugate vaccine has led to a higher proportion of invasive H. influenzae infection attributable to non-type b strains and noticeably, over the last years, diseases due to non-type b strains are becoming relatively more frequent.
However, unlike the pneumococcal conjugate vaccination programme, there is no consistent or robust evidence to suggest that mass Hib vaccination in infancy has led to serotype replacement. A World Health Organization position paper on Hib conjugate vaccines1
In terms of absolute numbers of reported Hi cases, there appears to be a shift towards older age groups. Of all cases reported in 2008 and 2009, 46% were among adults 65 years of age and older. The epidemiological characteristics of H. influenzae also changed from a disease predominantly found in children and dominated by serotype b to a disease predominantly found in adults and dominated by non-typeable serotypes.
concluded that ‘so far, bacterial strain replacement has not been a prominent feature of large-scale Hib immunisation’.
With the data available, it was not possible in this report to assess in depth primary or secondary vaccine failures. This is because of the data completeness for vaccination status was very low (8.9%) and only few countries reported complete information. In addition, an enhanced dataset on vaccination status (availability of type of vaccine, number of doses received, period interval between doses and date of the last dose) and data pertaining to multiple risk factors of vaccine failure was not collected.
1 World Health Organization. WHO position paper on Haemophilus influenzae type b conjugate vaccines. (Replaces WHO position paper on Hib vaccines previously published in the Weekly Epidemiological Record. Wkly Epidemiol Rec. 2006 Nov 24;81(47):445-52.

SURVEILLANCE REPORT Surveillance of invasive bacterial diseases in Europe 2008/2009
3
1 Introduction Invasive bacterial infections caused by Haemophilus influenzae and Neisseria meningitidis pathogens represent a significant public health problem across Europe due to the rapid onset of the disease, high case fatality and the high proportion of surviving patients with severe complications, such as permanent disabilities including neurological sequelae and subsequent death. Children below 5 years are the most affected age group. Early diagnosis and treatment play an essential role in the control of invasive bacterial disease. The introduction of mass vaccination against the meningococcal C strain in several European countries has resulted in a dramatic decrease in the number of reported cases due to serogroup C in the last decade. Similarly, the incidence of H. influenzae type b disease has decreased substantially after the introduction of the vaccine on a national level, and has contributed immensely to changing the epidemiology of the disease.
The surveillance of these diseases is important to study the epidemiological trends and to monitor the circulating strains, as incidence varies geographically and temporally. Since the number of cases is decreasing because of the availability of effective vaccines, pooling European data together increases the power of the epidemiological analysis.
EU-IBIS was established in 1999, funded by the European Commission’s Directorate-General for Health and Consumers (DG SANCO). Since the year of establishment, EU-IBIS collected data on invasive meningococcal and H. influenzae disease between 1999 and 2007 in EU/EEA countries and was successful in providing relevant epidemiological information to help guide decision-making process on vaccine policies.
In October 2007, the coordination of the network was transferred to the ECDC and data collection of invasive bacterial infections has been carried out through The European Surveillance System (TESSy). Coordination of laboratory surveillance activities, such as external quality assessments (EQA) and training, have been outsourced, and a consortium of European laboratory experts, mainly coming from national reference laboratories, has been set up to work together on these topics.
Thirty countries now participate in the network: the 27 countries of the European Union plus three EEA countries (Iceland, Liechtenstein and Norway).
Surveillance of invasive bacterial diseases in Europe 2008/2009 SURVEILLANCE REPORT
4
2 Methods 2.1 Case definition 2.1.1 Invasive H. influenzae disease For the 2008–2009 data collection, participants were requested to submit data on cases of invasive H. influenzae using the 2008 EU case definition. However, several case definitions have been used:
• 18 countries applied the 2008 version of the EU case definition; • seven countries applied the 2002 version of the EU case definition; • two countries applied other case definitions; and • three countries did not refer to any case definition.
A key difference between the 2008 version of the case definition and the previous version of 2002 is that possible and probable category are no longer applicable and clinical criteria are no longer relevant. In addition, there is no distinction between serotypes and the laboratory methods used to confirm a case (see Table A1 in Annex 2).
For 2008 and 2009 data, according to 2008 EU case definition, only confirmed cases are relevant for surveillance purpose. Therefore, in this analysis a total of five (0.1%) probable cases were excluded, three from Poland and two from Lithuania. On the other hand, regarding historical data there is no distinction made between the case definitions used; hence until 2007 all reported cases were included in the analysis, incorporating also probable and cases defined according to other case definition.
2.1.2 Invasive meningococcal disease The case definitions referring to meningococcal disease applied by the Member States differed, with the majority applying the 2008 EU case definitions:
• 18 countries applied the 2008 version of the EU case definition; • five countries applied the 2002 version of the EU case definition; • four countries applied other case definitions; • three countries did not refer to any case definition.
A major difference between the 2008 version of the case definition and the previous version (2002) is that in the 2008 case definition the cases are defined as probable according to epidemiological criteria only. This is different from the previous definition as no laboratory methods are included in the definition of a probable case. In addition, the category of a possible case has been introduced (see Table B1 in Annex 3).
2.2 Data sources The report includes data on invasive H. influenzae and invasive meningococcal disease cases submitted by the national public health institutes from the EU/EEA countries. The current data collection concerned 2008–2009 data.
Historical data used in the analysis (1999–2006) were transferred from the former EU-IBIS database, now housed at ECDC. All participating countries have a surveillance system in place for both diseases. Twenty-eight countries reported case-based data for both diseases, and one country (Bulgaria) reported aggregated data.
The Member States are asked in the annual data call to ensure that the data source information is up-to-date since the correct interpretation of the surveillance data relies heavily on this information being current and accurate.
Clinically and laboratory-notified cases are linked at national level and submitted to TESSy with a single record number.
At this stage, ECDC does not yet have a comprehensive overview of what variables are collected and available in the countries, partly because the information on data sources were not fully provided by MS. Therefore, comparisons within countries should be done with caution. Specific characteristics of the national surveillance systems should be taken into account for data interpretation. Caution must also be taken while analysing trends as various changes in the surveillance methods occurred over the years: availability of new laboratory methodologies, comprehensiveness of the system, expansion of age groups and serotypes, and syndromes under surveillance.
Regarding invasive H. influenzae disease, France reported sentinel surveillance data only for 2008. Regarding invasive meningococcal disease, all reporting countries have a comprehensive, passive and compulsory surveillance system in place.
SURVEILLANCE REPORT Surveillance of invasive bacterial diseases in Europe 2008/2009
5
Tables A2 (Annex 2) and B2 (Annex 3) present an overview of surveillance systems by diseases and by country, listing the main characteristics of each data source.
2.2.1 Population data The population on 1 January of each year is used for most analyses as denominator. The 1 January data is obtained from the Eurostat database (http://epp.eurostat.ec.europa.eu) and is extracted on a regular basis by TESSy data managers.
Historical notification rates 1999–2006 (EU-IBIS) and 2007 rates were retrieved from 2007 epidemiological report [2].
2.3 Data submission and validation Specifications of variables for each disease were specified in TESSy metadata set 16, either case based or aggregated data were submitted, but case-base data were preferred.
Designated national contact points were requested to submit data using the latest version of the metadata set. This incorporates case-based information on epidemiological and laboratory variables, a common set of variables applicable to all diseases and a disease specific enhanced set of variables.
To facilitate the data submission, the Member States received online training in April 2010, and online supplementary training video materials were made available prior to the data call.
Out of the 30 EU/EEA countries, 29 submitted data for each disease. After data submission, data were validated and approved by Member States’ disease-specific experts. The cleaning and validation process included two components: automatic checks and manual checks, which aim to identify any potential inconsistency in the database. Once a first draft of the annual report was prepared, it was shared with all the Member States for comments and final confirmation.
Regarding invasive meningococcal disease, a consensus for molecular typing has been achieved in Europe and as a result a new set of variables has been introduced, which enable a more in-depth analysis on information retrieved form microbiology laboratories, in particular a number of variables regarding methods used to identify Neisseria meningitis.
2.4 Data analysis The notification rates were calculated by using total population estimates at the beginning of the year published by Eurostat (see 2.2.1). If zero cases were reported, then the notification rate would similarly be zero. The validation rules were based on the EU 2008 case definition and the data analysis was done accordingly.
Only known laboratory methods were taken into account, as well as laboratory methods declared as ‘unknown’ for which the specimen was known. If both the methods and the specimens could not be identified, the laboratory methods were not added to the ‘unknown’ category; instead the case was excluded from the totals.
Vaccination failures were not estimated due to the lack of sufficient information provided by the current variables in the IBD metadata set. The vaccination status ‘fully vaccinated’ and ‘partly vaccinated’ were defined by the reporting country, according the country’s immunisation schedule.
Unless stated otherwise, all ‘unknown’ and ‘missing’ responses were excluded from the epidemiological analysis.
It should be noted that the annual number of cases by country is calculated over a reporting period of one year defined as ‘Date used for Statistics’, which is the date that the country chooses as its preferred date for reporting. This could be either date of onset of disease, date of diagnosis, date of notification, or any other date the country uses in its report.
2.4.1 Invasive Haemophilus influenzae disease With regard to invasive H. influenzae disease, only confirmed cases were taken into account.
The notification data and the age-specific population data were aggregated into the following age groups used in the analysis: < 1, 1–4, 5–14, 15–64 and ≥ 65 years.
The serotypes were categorised into three major groups: serotype b; non-b (a, c, d, e, f, unspecified non-b); and non-capsulated (non-typeable).
The trends in notification rates by serotype expressed as numbers of confirmed cases of either serotype b, non-b or non-capsulated (non-typeable) per population of 100 000 were analysed.

Surveillance of invasive bacterial diseases in Europe 2008/2009 SURVEILLANCE REPORT
6
Only the countries that have had a surveillance system with consistent reporting (they have all serotypes available) to EU-IBIS and TESSy in 1999–2009 were included in the trend analyses. For 2008 and 2009 data, were included in the analysis those countries who reported at least one known serotype.
2.4.2 Invasive meningococcal disease For the analysis of the data containing laboratory variables, only ‘confirmed’ cases were filtered. For the general epidemiological variables, such as classification, seasonality, age and gender distribution, clinical presentation and case fatality ratio the total number of reported cases was taken into account.
The notification data and the Eurostat age-specific population data were aggregated into the following age groups used in the analysis: 1, 1-4, 5-9,10-14,15-19, 20-24, 25-44, 45-64, ≥ 65 years.
The distributions of minimal inhibitory concentrations (MIC) were displayed for all cases reported on a numeric scale by rounding the values to next two-fold dilution. The occurrence of resistant cases out of all cases reported on a numeric scale was shown. Cut-off values for resistant versus non-resistant cases were based on the values published at the European Committee on Antimicrobial Susceptibility Testing (EUCAST) website (www.eucast.org), if available. The cut-off values for penicillin and rifampicin were not available at the EUCAST website and occurrence was not reported (see Annex 3, Tables B34 and B35).
In the trend analysis were included countries with consistent reporting, those who reported at least one case to EU-IBIS network and TESSy in 1999–2009.

SURVEILLANCE REPORT Surveillance of invasive bacterial diseases in Europe 2008/2009
7
3 Results: invasive Haemophilus influenzae disease 3.1 Laboratory methods used for strain identification Confirming a case of invasive disease caused by H. influenzae requires isolating and culturing the bacterium from a normally sterile body site such as: cerebrospinal fluid (CSF), blood, joint fluid, pleural effusion, pericardial effusion, peritoneal fluid, subcutaneous tissues fluid, placenta, and amniotic fluid. Laboratory methods used to detect the pathogen are: culture, serology, immunodiagnostic tests, antigen detection, and detection of nucleic acid, genotyping and sequencing. Culture was overall the most frequently method reported, performed 79.7% of total methods reported in 2008–2009. See Tables A4 and A51 in Annex 2.
3.2 Data quality In Table A3 (Annex 2) the completeness of data reporting is presented for 2008–2009. It shows the completeness by variable and the minimum and the maximum value. The completeness of reporting for variables such as: age, gender and all laboratory variables (specimen, test method) is high ranging between 50–100%. Completeness of variable reporting clinical information (‘Clinical Presentation’ and ‘Outcome’) is around 40% to 73%. The ‘Vaccination status’ show considerably less completeness (around 8.5–9.1%).
3.3 Epidemiological analysis In 2008–2009, a total of 3 572 confirmed cases of invasive H. influenzae disease were reported from 29 countries: 1 976 in 2008 and 1 596 in 2009. Three out of 29 Member States reported zero cases in both years (Iceland, Luxembourg and the Netherlands). Bulgaria reported data related to the common set of variables in the aggregated format, no data related to enhanced variables were included. France and Spain reported data collected by a sentinel system. France reported data and specific denominator for 2008 only. No invasive H. influenzae data was reported by Liechtenstein. The number of cases, notification rate and case definition used are displayed in Tables A6 and A7 in Annex 2.
Five probable cases were reported, two from Latvia and three from Poland. According to 2008 EU case definition probable cases are not relevant for surveillance purposes, therefore they were not included in the following analysis.
The overall notification rates are presented in Figure 1; the overall European notification rate in 2008 was 0.41 per 100 000 population while in 2009 was 0.36.

Surveillance of invasive bacterial diseases in Europe 2008/2009 SURVEILLANCE REPORT
8
Figure 1 Overall notification rates of invasive H. influenzae disease by country, 2008 (n=1 976) and 2009 (n=1 596)
Note: Zero cases reported from Luxembourg, Iceland and the Netherlands. No data available from France (2009) and Liechtenstein.
These data are further illustrated in Table 1, presenting the number of reported cases and notification rates 1999–2009 (EU-IBIS data 1999–2006). For a more in-depth analysis, country profiles are presented in Annex 2, Tables A6 and A7.
0
0.2
0.4
0.6
0.8
1
1.2
1.4
1.6
1.8
2Au
stria
Belg
ium
Bulg
aria
Cypr
us
Czec
h R
epub
lic
Den
mar
k
Esto
nia
Finl
and
Fran
ce
Ger
man
y
Gre
ece
Hun
gary
Irel
and
Ital
y
Latv
ia
Lith
uani
a
Luxe
mbo
urg
Mal
ta
Net
herla
nds
Pola
nd
Port
ugal
Rom
ania
Slov
akia
Slov
enia
Spai
n
Swed
en
Uni
ted
King
dom
EU T
otal
Icel
and
Liec
hten
stei
n
Nor
way
Tota
l
Not
ifica
tion
rate
(pe
r 10
0 00
0)
2008
0
0.2
0.4
0.6
0.8
1
1.2
1.4
1.6
1.8
Aust
ria
Belg
ium
Bulg
aria
Cypr
us
Czec
h R
epub
lic
Den
mar
k
Esto
nia
Finl
and
Fran
ce
Ger
man
y
Gre
ece
Hun
gary
Irel
and
Ital
y
Latv
ia
Lith
uani
a
Luxe
mbo
urg
Mal
ta
Net
herla
nds
Pola
nd
Port
ugal
Rom
ania
Slov
akia
Slov
enia
Spai
n
Swed
en
Uni
ted
King
dom
EU T
otal
Icel
and
Liec
hten
stei
n
Nor
way
Tota
l
Not
ifica
tion
rate
(pe
r 10
0 00
0)
2009

SURVEILLANCE REPORT Surveillance of invasive bacterial diseases in Europe 2008/2009
9
Table 1 Notification rates (per 100 000 population) and total number of cases of invasive H. influenzae disease by country, 1999–20091
Country 1999 2000 2001 2002 2003 2004 2005 2006 2007 2008 2009
Austria - - - 0.05 (4)
0.05 (4)
0.13 (11)
0.18 (15)
0.09 (7)
0.05 (4)
0.06 (5)
0.17 (14)
Belgium - 0.61 (63)
0.52 (54)
0.63 (65)
0.53 (55)
0.56 (58) - - 0.52
(55) 0.46 (49)
0.71 (76)
Bulgaria - - - - - - - - 0.26 (20)
0.18 (14)
0.20 (15)
Cyprus - - - - - - - - 0.00 (0)
0.00 (0)
0.25 (2)
Czech Republic2
1.00 (103)
1.02 (105)
0.90 (92)
0.55 (56)
0.49 (50)
0.16 (16)
0.18 (18)
0.11 (11)
0.13 (13)
0.07 (7)
0.10 (10)
Denmark3 0.09 (5)
0.04 (2)
0.02 (1)
0.02 (1)
0.07 (4)
0.07 (4)
0.07 (4)
0.07 (4)
0.28 (15)
0.58 (32)
0.56 (31)
Estonia4 0.22 (3)
0.07 (1)
0.22 (3)
0.22 (3)
0.07 (1)
1.33 (18)
1.49 (20)
0.60 (8)
0.22 (3)
0.08 (1)
0.08 (1)
Finland 0.56 (29)
0.72 (37)
0.95 (49)
0.44 (23)
0.69 (36)
0.50 (26)
0.84 (44)
0.61 (32)
1.02 (54)
0.85 (45)
0.88 (47)
France5 0.89 (521)
0.96 (565)
1.01 (598)
0.81 (479)
0.91 (546
1.01 (608)
1.06 (646)
0.98 (605)
1.06 (658)
1.10 (442) -
Germany6 0.33 (42)
0.57 (73)
0.45 (57)
0.38 (47)
0.37 (46)
0.26 (32)
0.29 (34)
0.49 (57)
0.11 (93)
0.20 (160)
0.24 (196)
Greece7 0.35 (2)
0.52 (3)
0.34 (2)
1.39 (8)
0.50 (8)
0.56 (9)
0.13 (2)
0.19 (3)
0.06 (7)
0.04 (4)
0.12 (13)
Hungary8 - - - - 0.07 (7)
0.12 (12)
0.01 (1)
0.00 (0)
0.02 (2)
0.06 (6)
0.03 (3)
Ireland 0.78 (27)
0.55 (21)
0.70 (27)
0.54 (21)
0.56 (22)
0.94 (38)
0.82 (34)
0.90 (38)
0.72 (31)
0.50 (22)
0.97 (43)
Italy 0.19 (109)
0.11 (64)
0.05 (31)
0.03 (19)
0.04 (24)
0.02 (9)
0.03 (15)
0.04 (23)
0.06 (33)
0.08 (50)
0.09 (56)
Latvia - - - - 0.13 (3)
0.04 (1)
0.00 (0)
0.00 (0)
0.00 (0)
0.04 (1)
0.04 (1)
Lithuania8 - - - - 0.03 (1)
0.23 (8)
0.09 (3)
0.06 (2)
0.00 (0)
0.09 (3)
0.03 (1)
Luxembourg - - - - - - - - 0.21 (1)
0.00 (0)
0.00 (0)
Malta 0.00 (0)
0.26 (1)
0.00 (0)
0.00 (0)
0.00 (0)
0.77 (3)
0.00 (0)
0.00 (0)
0.25 (1)
0.00 (0)
0.73 (3)
Netherlands 0.43 (68)
0.49 (77)
0.57 (91)
0.67 (108)
0.82 (132)
0.78 (127)
0.85 (139)
0.75 (122) - 0.00
(0) 0.00 (0)
Poland9 0.06 (25)
0.08 (31)
0.09 (35)
0.09 (33)
0.09 (36)
0.08 (32)
0.05 (19)
0.05 (20)
0.11 (43)
0.07 (28)
0.05 (19)
Portugal 0.09 (9)
0.10 (10)
0.15 (16)
0.12 (12)
0.12 (13)
0.11 (12)
0.13 (14)
0.22 (23)
0.15 (16)
0.05 (5)
0.08 (8)
Romania - - - - - - - - - 0.01 (2)
0.10 (22)
Slovakia 0.35 (19)
0.28 (15)
0.20 (11)
0.13 (7)
0.17 (9)
0.07 (4)
0.13 (7)
0.06 (3)
0.11 (6)
0.07 (4)
0.09 (5)
Slovenia - 0.65 (13)
0.85 (17)
0.40 (8)
0.65 (13)
0.70 (14)
0.40 (8)
0.65 (13)
0.65 (13)
0.60 (12)
0.89 (18)
Spain10 - - - - - - - - (66) (73) (53)

Surveillance of invasive bacterial diseases in Europe 2008/2009 SURVEILLANCE REPORT
10
Country 1999 2000 2001 2002 2003 2004 2005 2006 2007 2008 2009
Sweden11 0.18 (16)
0.34 (30)
0.21 (19)
0.25 (22)
0.27 (24)
0.41 (37)
1.29 (117)
1.32 (120)
1.58 (144)
1.78 (163)
1.58 (146)
United Kingdom
0.68 (400)
0.85 (498)
1.03 (605)
1.28 (757)
1.26 (750)
0.92 (550)
1.10 (661)
1.08 (650)
1.14 (696)
1.26 (773)
1.20 (742)
Iceland12 1.44 (4)
0.36 (1)
0.70 (2)
0.00 (0)
0.00 (0)
0.34 (1)
0.00 (0)
0.00 (0)
0.33 (1)
0.00 (0)
0.00 (0)
Liechtenstein - - - - - - - - - - -
Norway 1.62 (72)
1.27 (57)
1.09 (49)
1.57 (71)
1.69 (77)
1.70 (78)
1.67 (77)
1.59 (74)
1.77 (83)
1.58 (75)
1.48 (71)
1 1999–2006 from EU-IBIS 2006 report, 2007–2009 using Eurostat as population source. 2 Serotype b only 1999–2004. 3 Meningitis only/mostly meningitis 1999–2006, thereafter all. 4 Serotype b only; all rates from 1999–2006 are recalculated from EU-IBIS 2006 report using the overall population (Eurostat) as denominator. Previously rates were calculated for population < 15 years. 5 Data collected by a sentinel surveillance system and corrected for underreporting and undercoverage. 6 Rates based on < 15 years old population 1999–2006. From 2007, all age groups have been included. 7 Mainly serotype b & non-b; meningitis and meningitis/septicaemia rates. Rates were calculated on population < 15 years old for 1999–2006, from 2007 all age groups have been included. 8 Only meningitis and septicaemia. 9 Serotype b, non-caps have been added since 2004; only meningitis 1999–2006. 10 Data collected by sentinel surveillance. 11 Only serotype b 1999–2004; aggregated data 2000–2001. 12 Serotype b.
The overall notification rates were higher in northern European countries. In particular Sweden and Denmark reported highest rates compared to previous years but the trend seems stabilising recently as illustrated in Figure 2 (more detailed information is available in the country profiles, Annex 1). The increased reporting can be explained by the implementation of enhanced surveillance systems, including all serotypes and/or clinical presentations, the increased awareness among the clinicians to notify, and the improved high case ascertainment in general (i.e. enhanced sensitivity).
Figure 2 Overall notification rates (100 000) of invasive H. influenzae disease in Sweden and Denmark, 1999–2009 (n=941)
3.3.1 Seasonal trend The data showed a typical seasonal trend. The highest number of invasive H. influenzae infections was observed during the winter months followed by a steady decrease until September, no differences were observed among serotypes. See Tables A8 and A9 in Annex 2 for further details, reporting number of cases by month and country.
0.0
0.2
0.4
0.6
0.8
1.0
1.2
1.4
1.6
1.8
2.0
1999 2000 2001 2002 2003 2004 2005 2006 2007 2008 2009
Not
ifica
tion
rate
(10
0 00
0)
Sweden
Denmark
SURVEILLANCE REPORT Surveillance of invasive bacterial diseases in Europe 2008/2009
11
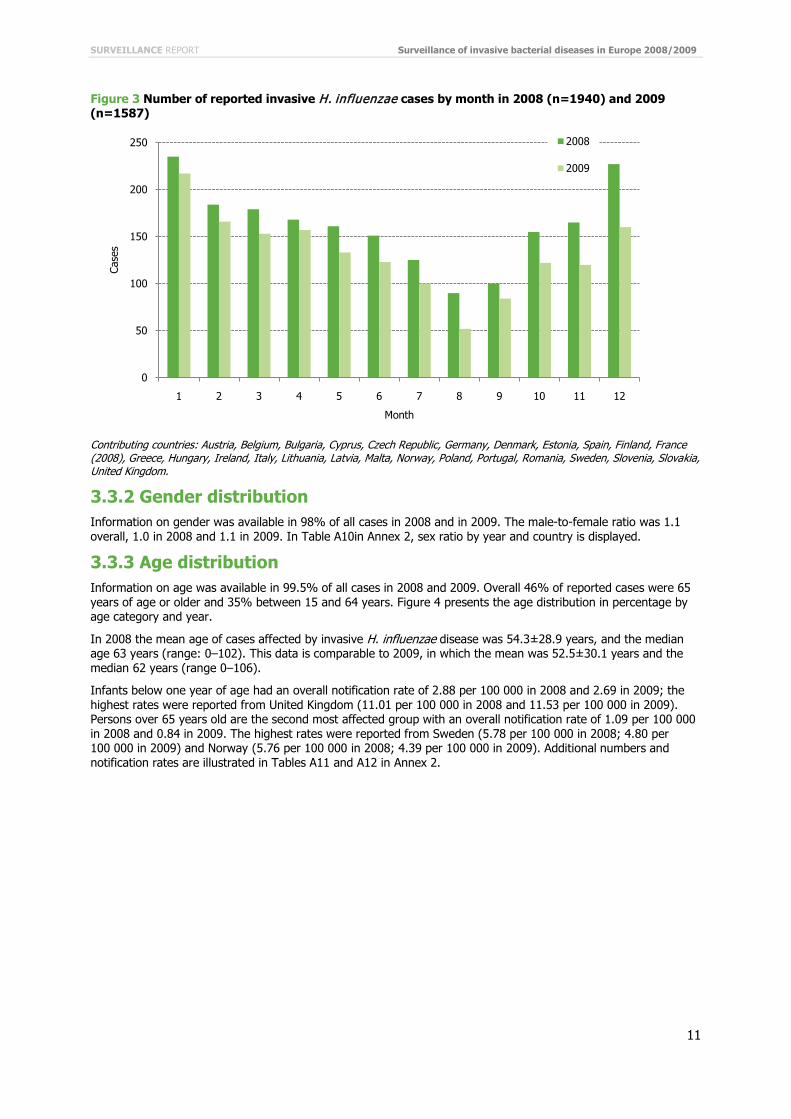
Figure 3 Number of reported invasive H. influenzae cases by month in 2008 (n=1940) and 2009 (n=1587)
Contributing countries: Austria, Belgium, Bulgaria, Cyprus, Czech Republic, Germany, Denmark, Estonia, Spain, Finland, France (2008), Greece, Hungary, Ireland, Italy, Lithuania, Latvia, Malta, Norway, Poland, Portugal, Romania, Sweden, Slovenia, Slovakia, United Kingdom.
3.3.2 Gender distribution Information on gender was available in 98% of all cases in 2008 and in 2009. The male-to-female ratio was 1.1 overall, 1.0 in 2008 and 1.1 in 2009. In Table A10in Annex 2, sex ratio by year and country is displayed.
3.3.3 Age distribution Information on age was available in 99.5% of all cases in 2008 and 2009. Overall 46% of reported cases were 65 years of age or older and 35% between 15 and 64 years. Figure 4 presents the age distribution in percentage by age category and year.
In 2008 the mean age of cases affected by invasive H. influenzae disease was 54.3±28.9 years, and the median age 63 years (range: 0–102). This data is comparable to 2009, in which the mean was 52.5±30.1 years and the median 62 years (range 0–106).
Infants below one year of age had an overall notification rate of 2.88 per 100 000 in 2008 and 2.69 in 2009; the highest rates were reported from United Kingdom (11.01 per 100 000 in 2008 and 11.53 per 100 000 in 2009). Persons over 65 years old are the second most affected group with an overall notification rate of 1.09 per 100 000 in 2008 and 0.84 in 2009. The highest rates were reported from Sweden (5.78 per 100 000 in 2008; 4.80 per 100 000 in 2009) and Norway (5.76 per 100 000 in 2008; 4.39 per 100 000 in 2009). Additional numbers and notification rates are illustrated in Tables A11 and A12 in Annex 2.
0
50
100
150
200
250
1 2 3 4 5 6 7 8 9 10 11 12
Case
s
Month
2008
2009
Surveillance of invasive bacterial diseases in Europe 2008/2009 SURVEILLANCE REPORT
12
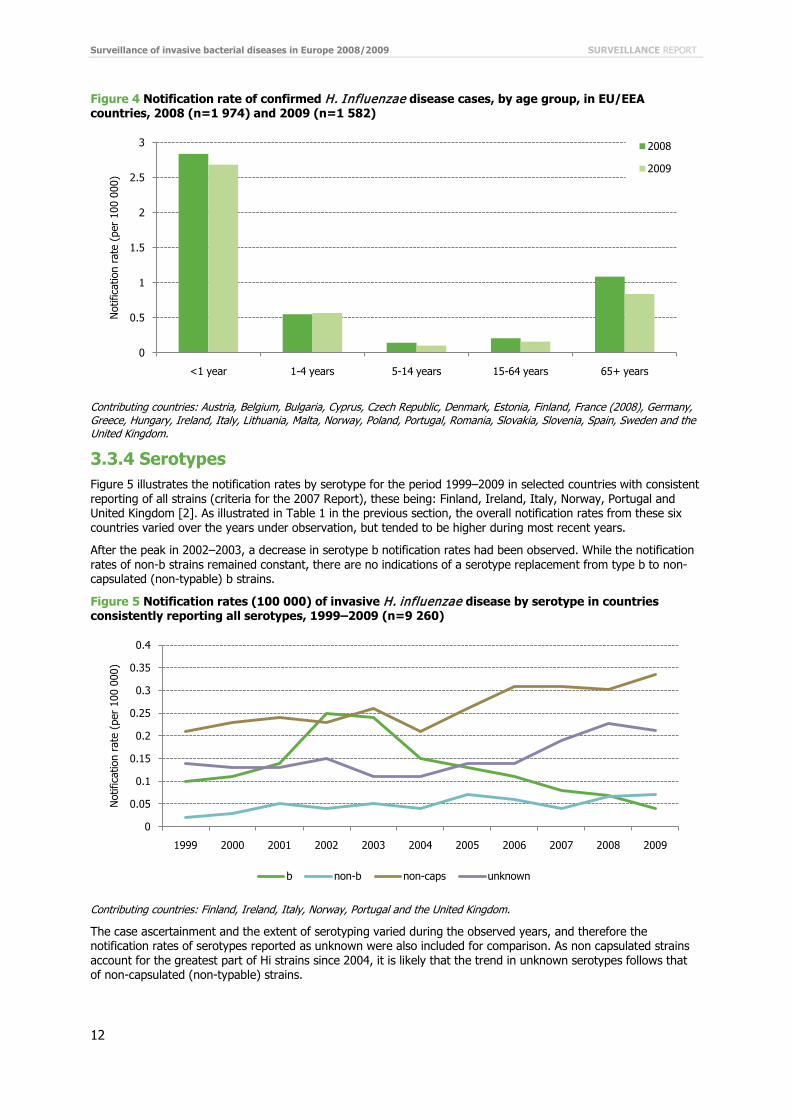
Figure 4 Notification rate of confirmed H. Influenzae disease cases, by age group, in EU/EEA countries, 2008 (n=1 974) and 2009 (n=1 582)
Contributing countries: Austria, Belgium, Bulgaria, Cyprus, Czech Republic, Denmark, Estonia, Finland, France (2008), Germany, Greece, Hungary, Ireland, Italy, Lithuania, Malta, Norway, Poland, Portugal, Romania, Slovakia, Slovenia, Spain, Sweden and the United Kingdom.
3.3.4 Serotypes Figure 5 illustrates the notification rates by serotype for the period 1999–2009 in selected countries with consistent reporting of all strains (criteria for the 2007 Report), these being: Finland, Ireland, Italy, Norway, Portugal and United Kingdom [2]. As illustrated in Table 1 in the previous section, the overall notification rates from these six countries varied over the years under observation, but tended to be higher during most recent years.
After the peak in 2002–2003, a decrease in serotype b notification rates had been observed. While the notification rates of non-b strains remained constant, there are no indications of a serotype replacement from type b to non-capsulated (non-typable) b strains.
Figure 5 Notification rates (100 000) of invasive H. influenzae disease by serotype in countries consistently reporting all serotypes, 1999–2009 (n=9 260)
Contributing countries: Finland, Ireland, Italy, Norway, Portugal and the United Kingdom.
The case ascertainment and the extent of serotyping varied during the observed years, and therefore the notification rates of serotypes reported as unknown were also included for comparison. As non capsulated strains account for the greatest part of Hi strains since 2004, it is likely that the trend in unknown serotypes follows that of non-capsulated (non-typable) strains.
0
0.5
1
1.5
2
2.5
3
<1 year 1-4 years 5-14 years 15-64 years 65+ years
Not
ifica
tion
rate
(pe
r 10
0 00
0)
2008
2009
0
0.05
0.1
0.15
0.2
0.25
0.3
0.35
0.4
1999 2000 2001 2002 2003 2004 2005 2006 2007 2008 2009
Not
ifica
tion
rate
(pe
r 10
0 00
0)
b non-b non-caps unknown

SURVEILLANCE REPORT Surveillance of invasive bacterial diseases in Europe 2008/2009
13
Information on serotype was available in 44.9% of cases, 40.0% in 2008 and 50.9% in 2009. After exclusion of serotypes reported as unknown or missing (n=1 186 in 2008 and n=783 in 2009), a total of 67.6% were reported as non-typable, 17.9% as serotype non-b and 14.5% as serotype b. Figure 6 illustrates the reported serotype distribution in 2008 and 2009.
Figure 6 Serotype distribution of invasive H. influenzae disease in 2008 (n=790) and 2009 (n=813)
Contributing countries: Austria, Czech Republic, Denmark, Estonia, Finland, Greece, Hungary, Ireland, Italy, Latvia, Lithuania, Malta, Norway, Poland, Romania, Slovakia, Slovenia, Spain, Sweden and the United Kingdom. Unknown serotypes were excluded.
Figures 7 and 8 illustrate the proportion of reported serotypes by country. The limited data completeness should be taken into account when comparing serotype distribution.
Based on the available data in 2008–2009, it is notable that 89.5% cases from Austria (n=17) and 73.3% Slovenia (n=22) were reported as non-capsulated strains. Also Finland (68.5%, n=63), Norway (65.8%, n=96), Denmark (58.7%, n=37) reported more than the half of their cases as non-capsulated strains.
For Belgium and Bulgaria, information on serotype is missing. See also Tables A13 and A14 in Annex 2.
Figure 1 Reported serotype distribution of reported invasive H. influenzae disease by country in 2008 (n=1 913)
b17.8%
non-b18.4%non-
caps63.8%
2008
b11.2%
non-b17.5%
non-caps
71.3%
2009
0%
10%
20%
30%
40%
50%
60%
70%
80%
90%
100%
Aust
ria
Czec
h R
epub
lic
Den
mar
k
Esto
nia
Finl
and
Fran
ce
Ger
man
y
Gre
ece
Hun
gary
Irel
and
Ital
y
Latv
ia
Lith
uani
a
Pola
nd
Port
ugal
Rom
ania
Slov
akia
Slov
enia
Spai
n
Swed
en
Uni
ted …
EU T
otal
Nor
way
Tota
l
b non-b non-caps Unk

Surveillance of invasive bacterial diseases in Europe 2008/2009 SURVEILLANCE REPORT
14
Figure 2 Reported serotype distribution of reported invasive H. influenzae disease by country in 2009 (n=1 504)
Figure 9 and 10 illustrate the distribution of serotypes by age group in countries collecting all serotypes. Cases reported as unknown serotype or unknown age were excluded from the analysis. Non-capsulated strains were the most commonly reported across all age groups for both years, followed by non-type b.
Figure 9 Serotype distribution of confirmed invasive H. influenzae cases by age group, of countries collecting at least one known serotype in 2008 (n=790)
Contributing countries: Austria, Czech Republic, Denmark, Estonia, Finland, Greece, Hungary, Ireland, Italy Latvia, Lithuania, Norway, Poland, Romania, Slovenia, Spain, Sweden and the United Kingdom.
0%
10%
20%
30%
40%
50%
60%
70%
80%
90%
100%Au
stria
Czec
h R
epub
lic
Den
mar
k
Esto
nia
Finl
and
Ger
man
y
Gre
ece
Hun
gary
Irel
and
Ital
y
Latv
ia
Lith
uani
a
Mal
ta
Pola
nd
Port
ugal
Rom
ania
Slov
akia
Slov
enia
Spai
n
Swed
en
Uni
ted
King
dom
EU T
otal
Nor
way
Tota
l
Unk b non-b non-caps
<1 year 1-4 years 5-14 years 15-64 years 65+ years Total
b 22 22 14 56 26 141
non-b 13 9 7 55 61 145
non-caps 53 27 11 165 248 504
0%
10%
20%
30%
40%
50%
60%
70%
80%
90%
100%

SURVEILLANCE REPORT Surveillance of invasive bacterial diseases in Europe 2008/2009
15
Figure 10 Serotype distribution of confirmed invasive H. influenzae cases by age group, in countries collecting at least one known serotype in 2009 (n=813)
Contributing countries: Austria, Czech Republic, Denmark, Estonia, Finland, Greece, Hungary, Ireland, Italy, Lithuania, Malta, Norway, Poland, Slovakia, Slovenia, Spain, Sweden and the United Kingdom.
3.3.4.1 Serotype b strains The notification rates of serotype b, by age group in 1999–2009, in those countries with consistent reporting, were selected according to criteria defined in 2007 (countries with consistent reporting of all strains)[2]. Reports are illustrated in Figure 11. The rates appear to be decreasing across all age groups and infants below 1 year of age were the most affected.
Figure 11 Notification rate (per 100 000 population) of invasive H. influenzae serotype b disease, by age group, in selected countries, 1999–2009 (n=2 718)
Contributing countries: Czech Republic, Finland, Iceland, Ireland, Italy, Malta, Norway, Poland and the United Kingdom.
Overall, the number of cases reported with serotype b in 2008 and 2009 was low and notification rates were below 0.1 per 100 000 population, consequently a limited number of cases in smaller countries resulted in a large difference in notification rates. Infants < 1 year of age were the most affected, in this group Ireland (2.84 per 100 000) reported the higher notification rate in 2008 and Lithuania (2.87 per 100 000) in 2009. See further details in Tables A15 and A16 in Annex 2.
The rate of invasive H. influenzae serotype b disease among the < 5-year-olds is often used as main indicator of the burden of disease and it is the most reliable notification rate for comparisons between countries. Table 2
<1 year 1-4 years 5-14 years 15-64 years 65+ years Total
b 15 13 2 41 16 91
non-b 12 10 10 50 60 142
non-caps 59 45 13 181 282 580
0%
10%
20%
30%
40%
50%
60%
70%
80%
90%
100%
0.0
0.5
1.0
1.5
2.0
2.5
3.0
3.5
1999 2000 2001 2002 2003 2004 2005 2006 2007 2008 2009
<1 year 1-4 years 5-14 years 15-64 years 65+ years

Surveillance of invasive bacterial diseases in Europe 2008/2009 SURVEILLANCE REPORT
16
illustrates the notification rates of H. influenzae serotype b in Europe among < 5–year-olds in 2008–2009. All countries reported notification rate < 1 per 100 000 population, except Lithuania (1.30 per 100 000 population (n=2) in 2008).
Table 2 Notification rate (per 100 000 population) of invasive H. influenzae serotype b disease in the < 5 years age group, by countries who reported serotypes, 2008 (n=43) and 2009 (n=28)
Country 2008 2009 Czech Republic 0.19 0.18 Denmark 0.61 0.31 Estonia 0.00 0.00 Finland 0.34 0.68 Greece 0.00 0.36 Ireland 0.93 0.30 Italy 0.04 0.04 Lithuania 1.30 0.63 Netherlands 0.00 0.00 Norway 0.34 0.34 Poland 0.27 0.32 Slovakia 0.00 0.37 Spain 0.04 0.04 Sweden 0.00 0.19 United Kingdom 0.63 0.25
3.3.4.2 Non-type b strains Due to the small number of reported non-type b strains, only absolute numbers are illustrated below. Figure 12 shows the absolute numbers of reported cases with non-type b strains across age groups from 1999–2009 in countries with consistent reporting according to the criteria defined in the 2007 IBD report [2].
The overall rate was 0.10 per 100 000 population in 2008 (n=145) and in 2009 (n=142). The notification rate was highest in the age group < 1 year (0.80, n=13, in 2008; and 0.73, n=12, in 2009). The oldest age group was the most affected comparing absolute numbers (44%).
Figure 12 Percentage distribution of confirmed invasive H. influenzae non-b cases, by age group, in selected countries, 1999–2009 (n=749)
Contributing countries: Finland, Ireland, Italy, Norway, Portugal and the United Kingdom. Included strains: a, c, d, e, f, and non-defined b
1999 2000 2001 2002 2003 2004 2005 2006 2007 2008 2009
<1 year 2 4 2 1 3 5 7 2 4 8 12
1-4 years 3 6 9 5 3 4 7 7 5 5 7
5-14 years 1 2 1 0 2 8 0 4 2 6 8
15-64 years 11 10 19 22 29 22 34 25 18 37 31
>65 years 9 16 33 22 31 23 52 43 29 42 46
0%
10%
20%
30%
40%
50%
60%
70%
80%
90%
100%
SURVEILLANCE REPORT Surveillance of invasive bacterial diseases in Europe 2008/2009
17
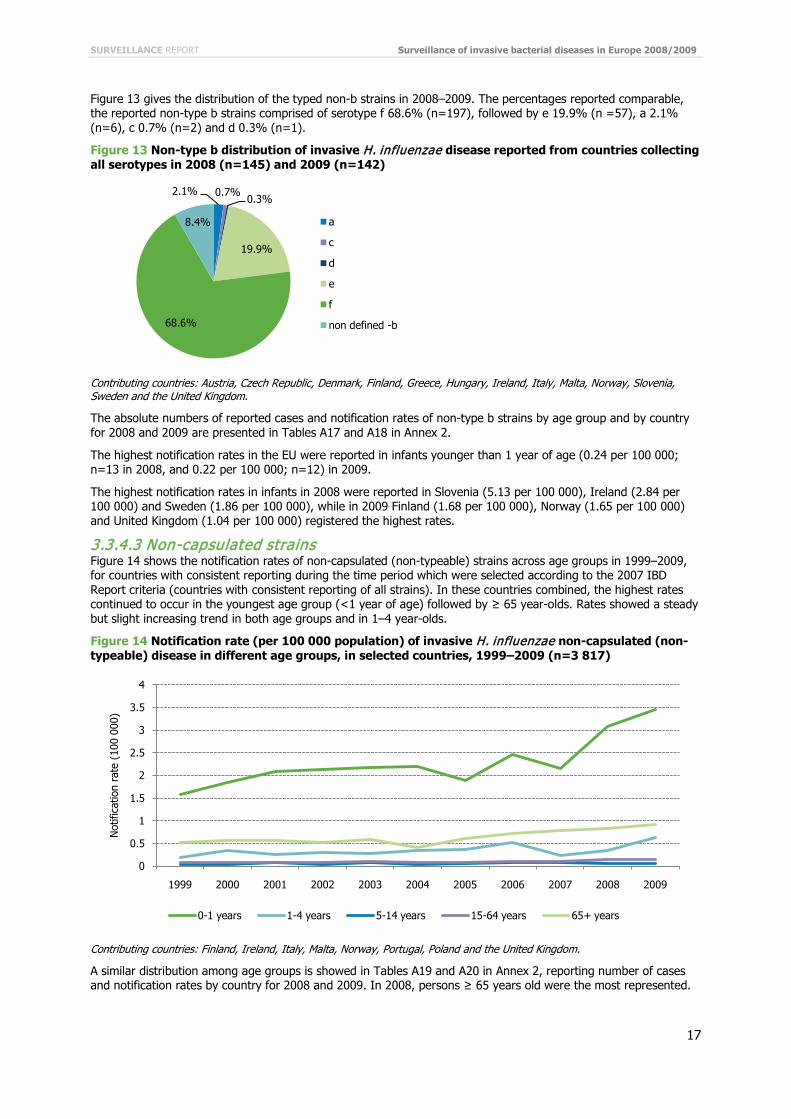
Figure 13 gives the distribution of the typed non-b strains in 2008–2009. The percentages reported comparable, the reported non-type b strains comprised of serotype f 68.6% (n=197), followed by e 19.9% (n =57), a 2.1% (n=6), c 0.7% (n=2) and d 0.3% (n=1).
Figure 13 Non-type b distribution of invasive H. influenzae disease reported from countries collecting all serotypes in 2008 (n=145) and 2009 (n=142)
Contributing countries: Austria, Czech Republic, Denmark, Finland, Greece, Hungary, Ireland, Italy, Malta, Norway, Slovenia, Sweden and the United Kingdom.
The absolute numbers of reported cases and notification rates of non-type b strains by age group and by country for 2008 and 2009 are presented in Tables A17 and A18 in Annex 2.
The highest notification rates in the EU were reported in infants younger than 1 year of age (0.24 per 100 000; n=13 in 2008, and 0.22 per 100 000; n=12) in 2009.
The highest notification rates in infants in 2008 were reported in Slovenia (5.13 per 100 000), Ireland (2.84 per 100 000) and Sweden (1.86 per 100 000), while in 2009 Finland (1.68 per 100 000), Norway (1.65 per 100 000) and United Kingdom (1.04 per 100 000) registered the highest rates.
3.3.4.3 Non-capsulated strains Figure 14 shows the notification rates of non-capsulated (non-typeable) strains across age groups in 1999–2009, for countries with consistent reporting during the time period which were selected according to the 2007 IBD Report criteria (countries with consistent reporting of all strains). In these countries combined, the highest rates continued to occur in the youngest age group (<1 year of age) followed by ≥ 65 year-olds. Rates showed a steady but slight increasing trend in both age groups and in 1–4 year-olds.
Figure 14 Notification rate (per 100 000 population) of invasive H. influenzae non-capsulated (non-typeable) disease in different age groups, in selected countries, 1999–2009 (n=3 817)
Contributing countries: Finland, Ireland, Italy, Malta, Norway, Portugal, Poland and the United Kingdom.
A similar distribution among age groups is showed in Tables A19 and A20 in Annex 2, reporting number of cases and notification rates by country for 2008 and 2009. In 2008, persons ≥ 65 years old were the most represented.
2.1% 0.7%0.3%
19.9%
68.6%
8.4% a
c
d
e
f
non defined -b
0
0.5
1
1.5
2
2.5
3
3.5
4
1999 2000 2001 2002 2003 2004 2005 2006 2007 2008 2009
Not
ifica
tion
rate
(10
0 00
0)
0-1 years 1-4 years 5-14 years 15-64 years 65+ years

Surveillance of invasive bacterial diseases in Europe 2008/2009 SURVEILLANCE REPORT
18
In children younger than 1 year, the United Kingdom (5.96 per 100 000) reported the highest notification rate. In 2009, Norway reported the highest rate in both children < 1 year (6.59 per 100 000) and persons ≥ 65 years (2.29 per 100 000).
3.3.5 Clinical presentation The distribution of clinical information was available in 39.8% of reported cases (33.7% in 2008 and 46.6% in 2009) and is presented in Figure 15. Septicaemia was the most common presentation, accounting for 54.0% of the cases overall, 53.5% in 2008 and 55.0% in 2009. Of all cases affected by septicaemia and in which the serotype is known, 73.9% (n=439) were reported as non-capsulated strains. Meningitis was reported in 19.2% (n=270), and of these 48.7% (n=73) were non-capsulated, and 26.7% (n=40) serotype strains.
Figure 15 Reported distribution of invasive H. influenzae disease clinical presentation in 2008 (n=663) and 2009 (n=740)
Contributing countries: Austria, Czech Republic, Denmark, Estonia, Germany, Greece, Hungary, Ireland, Italy, Lithuania, Malta, Norway, Poland, Portugal, Romania, Slovakia, Slovenia, Spain and the United Kingdom.
Variations were observed across age groups, serotypes and clinical presentation and while meningitis was reported mostly in children, septicaemia occurred mainly among adults (Figure 16 and 17).
Regarding cases affected by type b infection, meningitis and septicaemia were reported as the most frequent cause of disease among infants < 1 year of age, more than 90.0% of cases were diagnosed with meningitis, septicaemia or both infections. Septicaemia accounted for 90.5% of all reported serotype b cases among >65 years. Overall 3.3% of the cases were reported as affected by pneumonia. Epiglottis was reported in two cases, both children: one 8-year-old and one 3-year-old. A single case each of cellulitis and osteomyelitis were reported, and 1.7% was referred to other clinical presentation.
The number of non-type b infections was limited (n=68 in 2008, n=68 in 2009, among cases with a known age). Among them, septicaemia (64.0% of cases) was the most common presentation.
Overall, non-capsulated serotypes accounted for 569 (n=268 in 2008, n=301 in 2009) cases; septicaemia (77.2% of cases) was the leading presentation reported.
These findings are consistent with data presented in the 2007 IBD Report.
55.0%
19.2%
2.0%
13.2%
0.1% 0.1% 0.1%
10.2%
0%
10%
20%
30%
40%
50%
60% 2008
2009

SURVEILLANCE REPORT Surveillance of invasive bacterial diseases in Europe 2008/2009
19
Figure 16 Clinical presentation of invasive H. influenzae disease by serotype and age group, 2008 (n=411*)
*Cases missing clinical presentation, serotype information and age were excluded. Contributing countries: Austria, Czech Republic, Denmark, Estonia, Greece, Hungary, Ireland, Italy, Lithuania, Norway, Poland, Romania, Slovenia, Spain and the United Kingdom.
Figure 17 Clinical presentation of invasive H. influenzae disease by serotype and age group, 2009 (n=415*)
*Cases missing clinical presentation, serotype information and age were excluded. Contributing countries: Austria, Czech Republic, Denmark, Estonia, Greece, Hungary, Ireland, Italy, Lithuania, Malta, Norway, Poland, Slovakia, Slovenia and the United Kingdom.
3.3.6 Case fatality ratio Outcome was reported in 56% of reported cases in 2008 and in 73% of reported cases in 2009. Overall, the case fatality ratio (CFR) of invasive H. influenzae among the European countries was 4.5% (n=1 913) in 2008 and 7.8% (n=1 505) in 2009. This calculation was made including all countries that reported at least one case with a known outcome. See Tables A21 and A22 in Annex 2.
The CFR varied markedly across age groups. The highest was observed in age group < 1 year (8.3% in 2008 and 10.9% in 2009), followed by age group 5–14 (5.26 % in 2008) and 1–4 year-olds (4.80% in 2008), while in 2009
0%
10%
20%
30%
40%
50%
60%
70%
80%
90%
100%<
1 y
1-4
y
5-14
y
15-6
4 y
>65
y
<1
y
1-4
y
5-14
y
15-6
4 y
>65
y
<1
y
1-4
y
5-14
y
15-6
4 y
>65
y
b non-type b non-caps
Septicaemia
Meningitis
Meningitis/Septicemia
Pneumonia
Osteomyelitis
Cellulitis
Epiglottitis
Other
0%
10%
20%
30%
40%
50%
60%
70%
80%
90%
100%
<1
y
1-4
y
5-14
y
15-6
4 y
>65
y
<1
y
1-4
y
5-14
y
15-6
4 y
>65
y
<1
y
1-4
y
5-14
y
15-6
4 y
>65
y
b non-type b non-caps
Septicaemia
Meningitidis
Meningitis/Septicemia
Pneumonia
Osteomyelitis
Cellulitis
Epiglottitis
Other

Surveillance of invasive bacterial diseases in Europe 2008/2009 SURVEILLANCE REPORT
20
the second most affected were persons aged 65 and over (9.39%) followed by persons aged 15–65 (6.07%). The CFR was also associated with serotype. The highest overall CFRs were observed in non-capsulated strains, 8.5% in 2008 and 12.4% in 2009. Tables A23 and A24 in Annex 2 show the relationship between CFR and serotype stratified by age. The increased number of death in 2009 compared to 2008 can be explained by the better data completeness of variable.
As expected, the CFR varied widely across clinical presentations. The overall highest CFR was observed in septicaemia (11.5%) in 2008 and in meningitis and septicaemia (13.3%) in 2009. When interpreting the data it must be taken into account that small number of cases resulted in high CFR.
The CFR varied also considering serotypes and clinical presentation, as showed in Tables A25 and A26 in Annex 2.
In 2008 septicaemia caused the highest CFR in almost all serotypes, and among them the highest rate was observed in cases affected by b serotype (16. 3 %), followed by cases reported with an unknown serotype (12.9%).
In 2009 meningitis and septicaemia caused the highest CFR in almost all serotypes. The highest rates for meningitis and septicaemia were reported among persons infected with non-capsulated strains (33%) followed by non-b strains (20.0%). Pneumonia accounted for 25.0% of persons infected with non-capsulated strains.
3.3.7 Vaccination status It was not possible to determine vaccination failures from the data on vaccination, thus numbers and proportions of reported vaccination status are described. Figures 18 and 19 display the distribution of the reported vaccination status by age groups among children < 15 years in cases affected by serotype b in 2008 and 2009, respectively.
In 2008 (n=58), in all age groups, cases reported fully vaccinated accounted the highest proportion (43.1%, n=25). If stratified by age group, those aged 5–14 years were the most represented (71.4%, n=10). Among non-vaccinated cases, those aged below one year were the most represented (41%, n=9).
In 2009, the highest proportion of notified cases (n=30) was reported among cases non-vaccinated (36%, n=25). Among non-vaccinated, children < 1 year of age (53.3 %, n=8) were the most represented. The largest proportion of fully vaccinated cases occurred in those aged 1–4 years old (46%, n=6).
Figure 18 Distribution of vaccination status and number of cases reported with invasive H. influenzae serotype b disease among children < 15 years, all countries combined, 2008 (n=58)
Contributing countries: Czech Republic, Denmark, Estonia, Finland, Greece, Ireland, Italy, Latvia, Norway, Poland, Romania, Sweden and the United Kingdom. Unknown = vaccination status unknown. Fully vaccinated = according to the recommended schedule in the reporting country. Partly vaccinated = according to the recommended schedule in the reporting country. Not vaccinated = not vaccinated at all.
69
10
25
1
1 2
9
7
4
20
6 5 11
0%
10%
20%
30%
40%
50%
60%
70%
80%
90%
100%
<1 year 1-4 years 5-14 years Total
Fully vaccinated Partly vaccinated Not vaccinated Unknown

SURVEILLANCE REPORT Surveillance of invasive bacterial diseases in Europe 2008/2009
21
Figure 19 Distribution of vaccination status and number of cases reported with invasive H. influenzae serotype b disease among children < 15 years, all countries combined, 2009 (n=30)
Contributing countries: Czech Republic, Denmark, Estonia, Finland, Greece, Ireland, Italy, Lithuania, Norway, Poland, Slovakia, Sweden and the United Kingdom. Unknown = vaccination status unknown. Fully vaccinated = according to the recommended schedule in the reporting country. Partly vaccinated = according to the recommended schedule in the reporting country. Not vaccinated = not vaccinated at all.
The numbers and percentage of reported H. influenzae serotype b cases by age group, country and vaccination status are listed in Tables A27 and A28 in Annex 2. Data must be analysed with caution as sensitivity of surveillance system varies considerable, as well as vaccination data completeness. In addition, the United Kingdom alone accounted for 47.6% of cases.
3.3.8 Vaccination schedules In 1992, the conjugate H. influenzae serotype b vaccine was introduced into the national immunisation programme in several EU/EEA countries. By 2010, all Member States had included the vaccine into their programmes. However, the vaccine strategies implemented varies widely across Europe in terms of combined products used, vaccination schedule and population covered (see Table A29 in Annex 2 for more details).
2
6
81
2
3
8
2
1
11
4 3
1
8
0%
10%
20%
30%
40%
50%
60%
70%
80%
90%
100%
<1 year 1-4 years 5-14 years Total
Fully vaccinated Partly vaccinated Not vaccinated Unknown

Surveillance of invasive bacterial diseases in Europe 2008/2009 SURVEILLANCE REPORT
22
4 Results: invasive meningococcal disease 4.1 Laboratory methods used for strain identification The laboratory methods used in the routine strain characterisation in the majority of Member States, include phenotyping (serogroup, serotype and serosubtype) and genotyping (/FetA), multilocus sequence typing (MLST), techniques used on cultured isolates and, when available, detection and strain characterisation from non-culture specimens, as well as antibiotic sensitivity testing for the pathogen.
The methods used range from basic microbiology for meningococcal specification to immunoassays for phenotype, to nucleic acid amplification (including real-time PCR) and nucleic acid sequencing for genotyping. Molecular subtyping also allows recognition of outbreak strains and permits a better demarcation of outbreaks from endemic disease. Tables B4 and B5 in Annex 3 illustrate the percentage distribution of laboratory methods used for confirming a case.
Although culture was the most frequent method reported for identifying a case (47.9% in 2008 and 44.7% in 2009), PCR-based approaches have increasingly been used and 25% of the reported cases were confirmed by PCR in 2009. A significant proportion of cases was identified by PCR in Ireland (59.4% in 2008 and 58.3% in 2009), UK (48.2% in 2008 and 51.6% in 2009) and Greece (30.9% in 2008 and 42.7% in 2009).
4.2 Data quality Table B3 in Annex 3 shows the proportion of reported data with ‘known’ information per variable in 2008 and 2009, highlighting the minimum and maximum values of data completeness from all countries (n=28) that reported case-based data. Aggregated data from Bulgaria were not included in this table. The completeness of reporting varied substantially between variables.
Taking into account the two years’ average, the data completeness of the common set of variables was very high (Pathogen 99%, Age 99%, Classification 99%, Gender 98%, Outcome 92%). The data completeness on enhanced set of the variables ranged between 88% (Serogroup) and 10% (MIC_CTX). Information on basic laboratory variables was available in the majority of cases; however, information on advanced laboratory methods for the diagnosis of N. meningitidis was reported in 10–25% of the cases. Looking into this in more detail, the molecular typing variables data completeness was very low (e.g. MLST 2008: 6.8% and 2009: 16%). The variables were reported by seven countries in 2008 and by nine countries in 2009.
The information on minimum inhibitory concentration (MIC) for different kinds of antibiotics was also very low. The highest completeness on MIC was reported on penicillin, 25% of the total number of cases, and this was reported by 7–13 countries.
Vaccination status was reported in 35% of cases.
4.3 Epidemiological analysis 4.3.1 Overall notification rates In 2008 (n=4 978) and in 2009 (n=4 637), a total number of 9 615 cases of invasive meningococcal disease were reported by 29 countries with an overall notification rate of 0.99 per 100 000 population in 2008 and 0.92 in 2009. The decline was substantial compared to the rate 10 years ago (1.9 per 100 000 in 1999). Almost all cases were laboratory confirmed (96% in 2008, 97% in 2009). Only 126 cases (2.6%) were classified as probable in 2008 and even fewer cases, 77 ( 1.6%), were classified as probable in 2009, compared with 347 (6%)in 2007. A total of 68 cases in 2008 and 74 cases in 2009 were reported as invasive meningococcal cases with unknown classification. For further details, see Tables B6 and B7 in Annex 3.
Meningococcal disease appears to be rare in the majority of MS, although Ireland (3.68 in 2008 and 3.37 in 2009) and United Kingdom (2.29 in 2008 and 2.02 in 2009) reported a relatively higher notification rate per 100 000 population. The lowest notification rate was reported by Cyprus (0.25 in 2008 and 0.13 in 2009), Hungary (0.37 in 2008 and 0.30 in 2009) and Italy (0.30 in 2008 and 2009). These figures may reflect real differences in incidences, but might also reflect the difference in the sensitivity of the surveillance systems and in the case definition used. The differences can be understood in the context of national surveillance systems as well as vaccination programmes.

SURVEILLANCE REPORT Surveillance of invasive bacterial diseases in Europe 2008/2009
23
Figure 20 Overall notification rate (per 100 000 population) of invasive meningococcal disease by case classification and by country, 2008 and 2009 (n=9615)
Table 3 illustrates the notification rates and in brackets the total number of cases reported by countries between 1999 and 2009.
For the majority of countries with consistent reporting the notification rate peaked between 1999 and 2003. Belgium, Denmark, Ireland, the Netherlands, Spain and the United Kingdom reported relatively higher notification rates, however, the data in Finland, Ireland, the Netherlands and the United Kingdom show consistently decline over the period. A great care must be taken while analysing the trends as disease surveillance varies among Member States and various changes in the surveillance methods occurred along the years.
0.000.501.001.502.002.503.003.504.004.50
Aust
riaBe
lgiu
mBu
lgar
iaCy
prus
Czec
h R
epub
licD
enm
ark
Esto
nia
Finl
and
Fran
ceG
erm
any
Gre
ece
Hun
gary
Irel
and
Ital
yLa
tvia
Lith
uani
aLu
xem
bour
gM
alta
Net
herla
nds
Pola
ndPo
rtug
alR
oman
iaSl
ovak
iaSl
oven
iaSp
ain
Swed
enU
nite
d Ki
ngdo
mEU
Tot
alIc
elan
dLi
echt
enst
ein
Nor
way
Tota
lN
orw
ayTo
tal
Not
ifica
tion
rate
2008
Total cases
Confirmed cases
0.000.501.001.502.002.503.003.504.004.50
Aust
riaBe
lgiu
mBu
lgar
iaCy
prus
Czec
h R
epub
licD
enm
ark
Esto
nia
Finl
and
Fran
ceG
erm
any
Gre
ece
Hun
gary
Irel
and
Ital
yLa
tvia
Lith
uani
aLu
xem
bour
gM
alta
Net
herla
nds
Pola
ndPo
rtug
alR
oman
iaSl
ovak
iaSl
oven
iaSp
ain
Swed
enU
nite
d Ki
ngdo
mEU
Tot
alIc
elan
dLi
echt
enst
ein
Nor
way
Tota
lN
orw
ayTo
tal
Not
ifica
tion
rate
2009
Total cases
Confirmed cases

Surveillance of invasive bacterial diseases in Europe 2008/2009 SURVEILLANCE REPORT
24
Table 3 Notification rates (per 100 000) and total number cases of invasive meningococcal disease by country, 1999–20091
Country 1999 2000 2001 2002 2003 2004 2005 2006 20072 20082 20092
Austria 1.20 (97)
1.05 (85)
1.32 (107)
1.06 (86)
1.00 (82)
1.08 (88)
1.30 (106)
0.93 (76)
0.74 (69)
1.01 (84)
1.07 (89)
Belgium 2.90 (297)
2.60 (267)
3.69 (380)
2.54 (262)
2.20 (228)
1.51 (157)
1.63 (171)
1.32 (138)
1.49 (158)
1.03 (110)
0.97 (104)
Bulgaria - - - - - - - - 0.31 (24)
0.26 (20)
0.21 (16)
Cyprus - - - - - - - - 0.51 (4)
0.25 (2)
0.13 (1)
Czech Republic
1.00 (103)
0.72 (74)
1.06 (108)
1.20 (122)
0.98 (100)
1.03 (105)
0.95 (97)
0.77 (79)
0.73 (75)
0.79 (82)
0.76 (80)
Denmark 3.50 (186)
3.00 (160)
3.08 (165)
1.86 (100)
1.95 (105)
1.85 (100)
1.64 (89)
1.45 (79)
1.43 (78)
1.15 (63)
1.29 (71)
Estonia 0.44 (6) 0.80 (11)
1.61 (22)
0.73 (10)
0.74 (10)
0.81 (11)
0.96 (13)
0.82 (11)
0.82 (11)
0.45 (6) 0.37 (5)
Finland 1.11 (57)
0.93 (48)
0.98 (51)
0.94 (49)
0.81 (42)
0.86 (45)
0.77 (40)
0.86 (45)
0.81 (43)
0.53 (28)
0.62 (33)
France 0.74 (448)
0.81 (489)
0.92 (559)
1.11 (678)
1.31 (803)
1.13 (699)
1.19 (748)
1.13 (714)
1.07 (680)
1.05 (673)
0.95 (614)
Germany 0.49 (402)
0.55 (452)
0.95 (782)
0.89 (736)
0.94 (774)
0.73 (601)
0.76 (629)
0.67 (555)
0.53 (439)
0.55 (452)
0.59 (485)
Greece 1.94 (211)
2.39 (261)
2.14 (234)
2.12 (233)
1.19 (131)
0.65 (72)
0.88 (98)
1.02 (114)
0.95 (106)
0.70 (78)
0.68) (77)
Hungary - - - - 0.42 (43)
0.43 (43)
0.32 (32)
0.35 (35)
0.43 (43)
0.30 (30)
0.37 (37)
Ireland 14.33 (536)
13.59 (515)
8.58 (330)
6.49 (253)
5.96 (237)
4.92 (198)
4.91 (203)
4.97 (209)
3.76 (162)
3.45 (152)
3.01 (134)
Italy 0.48 (275)
0.44 (250)
0.36 (203)
0.39 (223)
0.48 (278)
0.55 (321)
0.56 (327)
0.30 (176)
0.30 (178)
0.30 (178)
0.30 (181)
Latvia - - - - 1.03 (24)
1.03 (24)
0.78 (18)
0.52 (12)
0.66 (15)
0.31 (7) 0.22 (5)
Lithuania - - 2.18 (76)
1.90 (66)
1.27 (44)
2.67 (92)
2.36 (81)
2.26 (77)
1.48 (50)
1.43 (68)
1.16 (39)
Luxembourg 4.15 (18)
0.23 (1)
0.23 (1)
0.23 (1)
0.45 (2)
0.00 0.22 (1)
- 0.42 (2)
0.41 (2)
0.61 (3)
Malta 5.88 (23)
7.92 (31)
5.32 (21)
3.52 (14)
4.25 (17)
3.33 (13)
2.47 (10)
8.90 (36)
1.47 (6)
0.73 (3)
0.97 (4)
Netherlands 3.65 (576)
3.42 (542)
4.51 (721)
3.82 (616)
2.19 (354)
1.75 (284)
1.51 (246)
1.09 (178)
1.19 (195)
0.99 (162)
0.91 (150)
Poland 0.17 (67)
0.11 (43)
0.10 (37)
0.09 (35)
0.15 (58)
0.31 (117)
0.52 (198)
0.43 (165)
0.88 (335)
0.84 (321)
0.79 (301)
Portugal - 0.57 (59)
1.03 (106)
2.08 (216)
1.99 (208)
1.73 (182)
1.60 (169)
1.25 (132)
0.92 (98)
0.57 (60)
0.61 (65)
Romania - - - - - - - - 0.67 (145)
0.46 (99)
0.47 (102)
Slovakia - - - - 0.91 (49)
0.59 (32)
0.82 (44)
0.67 (36)
0.65 (35)
0.89 (48)
0.72 (39)
Slovenia 0.30 (6)
0.40 (8)
0.50 (10)
0.40 (8)
0.80 (16)
0.45 (9)
0.80 (16)
0.40 (8)
0.90 (18)
1.19 (24)
0.74 (15)
Spain 3.52 (1403)
3.74 (1499)
2.23 (904)
2.71 (1109)
2.45 (1019)
2.11 (892)
2.15 (923)
1.84 (800)
1.39 (620)
1.30 (590)
1.16 (533)
Sweden 0.37 (33)
0.46 (41)
0.64 (57)
0.53 (47)
0.63 (56)
0.65 (59)
0.63 (57)
0.57 (52)
0.54 (49)
0.53 (49)
0.70 (65)
United Kingdom
5.39 (3150)
5.23 (3067)
4.51 (2655)
3.38 (2004)
3.10 (1848)
2.59 (1549)
2.78 (1672)
2.33 (1401)
2.50 (1522)
2.21 (1355)
1.93 (1190)
Iceland 7.58 (21)
6.40 (18)
6.67 (19)
5.22 (15)
2.77 (8)
3.42 (10)
1.69 (5)
1.31 (4)
1.30 (4)
0.63 (2)
1.57 (5)
Liechtenstein - - - - - - - - - - -
Norway 1.80 (80)
1.94 (87)
1.71 (77)
1.13 (51)
1.12 (51)
0.74 (34)
0.85 (39)
0.75 (35)
0.64 (30)
0.76 (36)
0.92 (44)
1 Population data source: EU-IBIS; 1999-2006 contains laboratory-confirmed and laboratory-confirmed probable cases according to the 2002 case definition. 2 Population data source: Eurostat; 2007–2009 contains only confirmed cases. -: no data was reported (unknown number of cases, not necessarily zero).
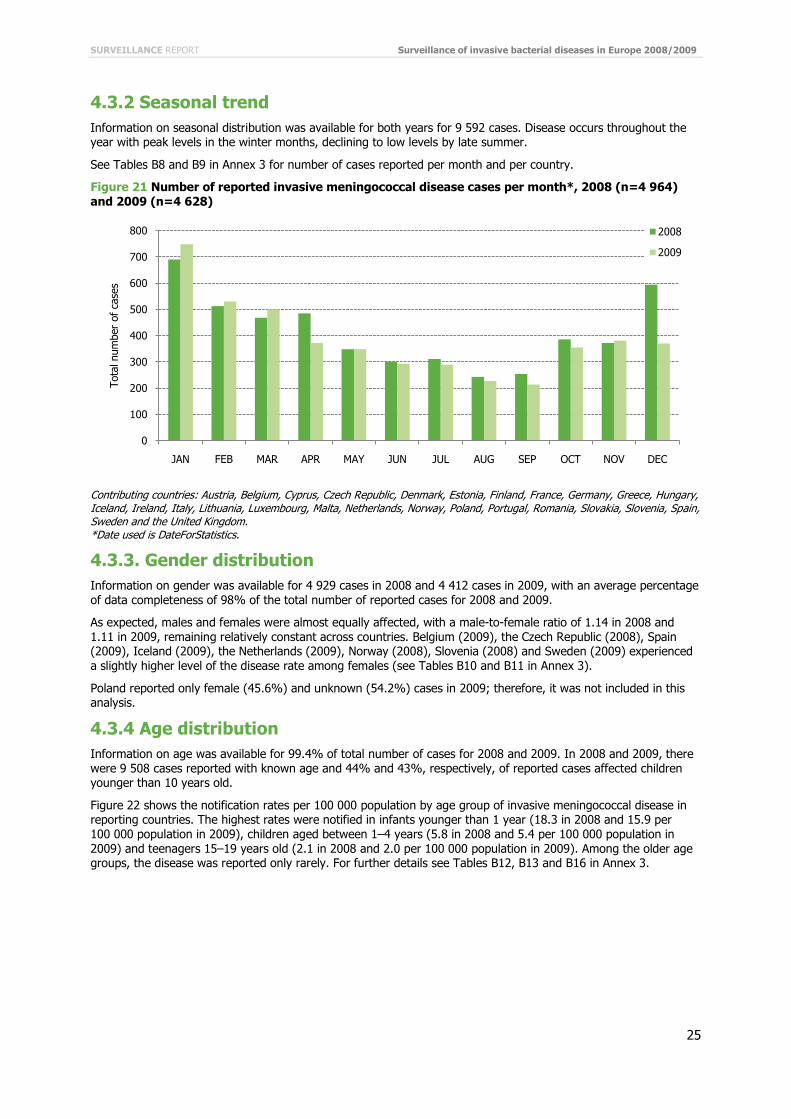
SURVEILLANCE REPORT Surveillance of invasive bacterial diseases in Europe 2008/2009
25
4.3.2 Seasonal trend Information on seasonal distribution was available for both years for 9 592 cases. Disease occurs throughout the year with peak levels in the winter months, declining to low levels by late summer.
See Tables B8 and B9 in Annex 3 for number of cases reported per month and per country.
Figure 21 Number of reported invasive meningococcal disease cases per month*, 2008 (n=4 964) and 2009 (n=4 628)
Contributing countries: Austria, Belgium, Cyprus, Czech Republic, Denmark, Estonia, Finland, France, Germany, Greece, Hungary, Iceland, Ireland, Italy, Lithuania, Luxembourg, Malta, Netherlands, Norway, Poland, Portugal, Romania, Slovakia, Slovenia, Spain, Sweden and the United Kingdom. *Date used is DateForStatistics.
4.3.3. Gender distribution Information on gender was available for 4 929 cases in 2008 and 4 412 cases in 2009, with an average percentage of data completeness of 98% of the total number of reported cases for 2008 and 2009.
As expected, males and females were almost equally affected, with a male-to-female ratio of 1.14 in 2008 and 1.11 in 2009, remaining relatively constant across countries. Belgium (2009), the Czech Republic (2008), Spain (2009), Iceland (2009), the Netherlands (2009), Norway (2008), Slovenia (2008) and Sweden (2009) experienced a slightly higher level of the disease rate among females (see Tables B10 and B11 in Annex 3).
Poland reported only female (45.6%) and unknown (54.2%) cases in 2009; therefore, it was not included in this analysis.
4.3.4 Age distribution Information on age was available for 99.4% of total number of cases for 2008 and 2009. In 2008 and 2009, there were 9 508 cases reported with known age and 44% and 43%, respectively, of reported cases affected children younger than 10 years old.
Figure 22 shows the notification rates per 100 000 population by age group of invasive meningococcal disease in reporting countries. The highest rates were notified in infants younger than 1 year (18.3 in 2008 and 15.9 per 100 000 population in 2009), children aged between 1–4 years (5.8 in 2008 and 5.4 per 100 000 population in 2009) and teenagers 15–19 years old (2.1 in 2008 and 2.0 per 100 000 population in 2009). Among the older age groups, the disease was reported only rarely. For further details see Tables B12, B13 and B16 in Annex 3.
0
100
200
300
400
500
600
700
800
JAN FEB MAR APR MAY JUN JUL AUG SEP OCT NOV DEC
Tota
l num
ber
of c
ases
2008
2009

Surveillance of invasive bacterial diseases in Europe 2008/2009 SURVEILLANCE REPORT
26
Figure 22 Notification rates per 100 000 population of total number of reported invasive meningococcal disease cases, 2008 and 2009, all countries combined (n=4 978 in 2008, n=4 637 in 2009)
Contributing countries: Austria, Belgium, Cyprus, Czech Republic, Denmark, Estonia, Finland, France, Germany, Greece, Hungary, Iceland, Ireland, Italy, Latvia, Lithuania, Luxembourg, Malta, Netherlands, Norway, Poland, Portugal, Romania, Slovakia, Slovenia, Spain, Sweden and the United Kingdom. Age class for Bulgaria is missing due to aggregated data.
4.3.5 Probable country of infection According to the cases reported in 2008–2009, 12 cases were reported as acquired out of EU: three cases in Albania (B serogroup), one in Bosnia-Herzegovina (B serogroup ), one in Turkey (B serogroup), one in Russia (unkown serogroup), one from Morocco (B serogroup), one from Mexico (B serogroup), two cases in Thailand (B and W135 serogroups), one in Philippines (B serogroup), one from USA (Y serogroup). However, this variable was only 47% completed for both years of the case reports.
4.3.6 Serogroups The distribution of serogroups among laboratory-diagnosed cases reported between 2003 and 2009 is shown in Figure 23. There was a decreasing trend over time, especially in serogroup B and C, that dropped from 4 522 (2003) to 3 010 (2009) and from 1 177 (2003) to 565 (2009), respectively.
The distribution of the other (NGA, W135, Y) serogroups remained relatively unchanged, however, the figure suggests an increasing number (154 in 2003, 118 in 2007 and 187 in 2009) of Y cases. The data quality has improved over the years and the number of cases with unknown serogroup decreased from 1 448 (19% of reported cases) in 2003 to 261 (6% of reported cases) in 2009.
0
2
4
6
8
10
12
14
16
18
20
<1 01-04 05-09 10-14 15-19 20-24 25-44 45-64 65 +
Not
ifica
tion
rate
2008
2009
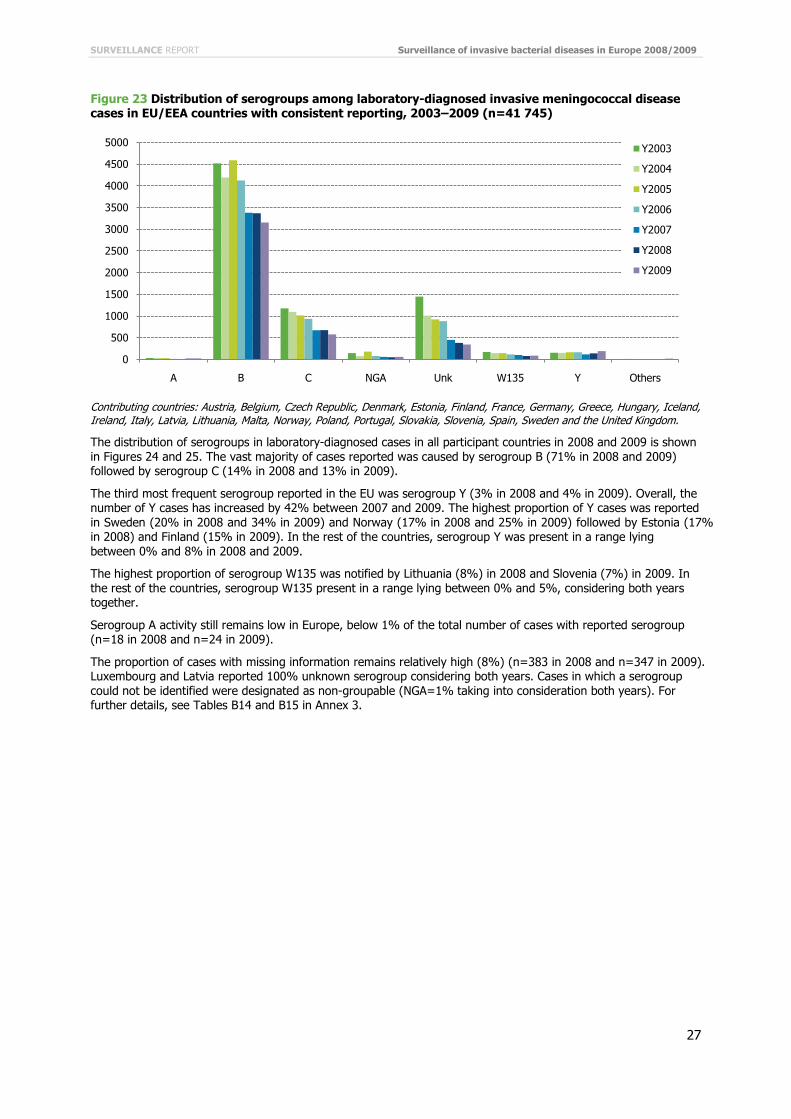
SURVEILLANCE REPORT Surveillance of invasive bacterial diseases in Europe 2008/2009
27
Figure 23 Distribution of serogroups among laboratory-diagnosed invasive meningococcal disease cases in EU/EEA countries with consistent reporting, 2003–2009 (n=41 745)
Contributing countries: Austria, Belgium, Czech Republic, Denmark, Estonia, Finland, France, Germany, Greece, Hungary, Iceland, Ireland, Italy, Latvia, Lithuania, Malta, Norway, Poland, Portugal, Slovakia, Slovenia, Spain, Sweden and the United Kingdom.
The distribution of serogroups in laboratory-diagnosed cases in all participant countries in 2008 and 2009 is shown in Figures 24 and 25. The vast majority of cases reported was caused by serogroup B (71% in 2008 and 2009) followed by serogroup C (14% in 2008 and 13% in 2009).
The third most frequent serogroup reported in the EU was serogroup Y (3% in 2008 and 4% in 2009). Overall, the number of Y cases has increased by 42% between 2007 and 2009. The highest proportion of Y cases was reported in Sweden (20% in 2008 and 34% in 2009) and Norway (17% in 2008 and 25% in 2009) followed by Estonia (17% in 2008) and Finland (15% in 2009). In the rest of the countries, serogroup Y was present in a range lying between 0% and 8% in 2008 and 2009.
The highest proportion of serogroup W135 was notified by Lithuania (8%) in 2008 and Slovenia (7%) in 2009. In the rest of the countries, serogroup W135 present in a range lying between 0% and 5%, considering both years together.
Serogroup A activity still remains low in Europe, below 1% of the total number of cases with reported serogroup (n=18 in 2008 and n=24 in 2009).
The proportion of cases with missing information remains relatively high (8%) (n=383 in 2008 and n=347 in 2009). Luxembourg and Latvia reported 100% unknown serogroup considering both years. Cases in which a serogroup could not be identified were designated as non-groupable (NGA=1% taking into consideration both years). For further details, see Tables B14 and B15 in Annex 3.
0
500
1000
1500
2000
2500
3000
3500
4000
4500
5000
A B C NGA Unk W135 Y Others
Y2003
Y2004
Y2005
Y2006
Y2007
Y2008
Y2009

Surveillance of invasive bacterial diseases in Europe 2008/2009 SURVEILLANCE REPORT
28
Figure 24 Percentage distribution of serogroups of laboratory-confirmed invasive meningococcal disease cases by country, 2008 (n=4 764)
Data from Bulgaria is not included since aggregated reporting did not include reporting of serogroups. Unk = the serogroup is not known at MS level. O = Other. The specific codes are kept for the most common serogroups. Others are the remaining/other groupable serogroups that should be reported.
Figure 25 Percentage distribution of serogroups of laboratory-confirmed invasive meningococcal disease cases by country, 2009 (n=4 487)
Data from Bulgaria is not included since aggregated reporting did not include reporting of serogroups. Unk = the serogroup is not known at MS level. O = Other. The specific codes are kept for the most common serogroups. Others are the remaining/other groupable serogroups that should be reported.
The distribution of serogroups by age group is illustrated in Figures 26 and 27. Among the cases in infants younger than 1 year, 89.4% in 2008 and 88.9 % in 2009 were due to serogroup B and only 6.7% in 2008 and 7.1% in 2009 to serogroup C. Among cases in children aged 1–4 years, 87.3% in 2008 and 86.3% in 2009 were due to serogoup B, and 9.1% in 2008 and 9.5% in 2009 due to serogroup C.
0%
10%
20%
30%
40%
50%
60%
70%
80%
90%
100%
Aust
ria
Belg
ium
Bulg
aria
Cypr
us
Czec
h R
epub
lic
Den
mar
k
Esto
nia
Finl
and
Fran
ce
Ger
man
y
Gre
ece
Hun
gary
Irel
and
Ital
y
Latv
ia
Lith
uani
a
Luxe
mbo
urg
Mal
ta
Net
herla
nds
Pola
nd
Port
ugal
Rom
ania
Slov
akia
Slov
enia
Spai
n
Swed
en
Uni
ted
King
dom
EU T
otal
Icel
and
Liec
hten
stei
n
Nor
way
Tota
l
B C W135 A Y NGA X Others Unk
0%
10%
20%
30%
40%
50%
60%
70%
80%
90%
100%
Aust
riaBe
lgiu
mBu
lgar
iaCy
prus
Czec
h R
epub
licD
enm
ark
Esto
nia
Finl
and
Fran
ceG
erm
any
Gre
ece
Hun
gary
Irel
and
Ital
yLa
tvia
Lith
uani
aLu
xem
bour
gM
alta
Net
herla
nds
Pola
ndPo
rtug
alR
oman
iaSl
ovak
iaSl
oven
iaSp
ain
Swed
enU
nite
d Ki
ngdo
m
EU T
otal
Icel
and
Liec
hten
stei
nN
orw
ayTo
tal
B C W135 A Y NGA X Others Unk

SURVEILLANCE REPORT Surveillance of invasive bacterial diseases in Europe 2008/2009
29
The proportion of serogroup C cases increased with age and the highest percentages were reported in young adults 20–25 years (24.3%) and adults 25–44 years (27.8%) in 2008, whereas in 2009 the highest proportion was registered in teenagers 10–14 years (25.5%) and in young adults 20–25 years (19.3%).
Compared to previous years’ data, a shift from adolescents to an older, unvaccinated, young adults age group is noticeable. This finding could be explained by the impact of the vaccination against serogroup C in age groups targeted by vaccination.
The highest proportion of Y and W135 cases was reported among elderly people above 65 years (Y: 16.4% in 2008 and 23.0% in 2009; W135: 7.3% in 2008 and 6.2% in 2009). Cases reported as unknown serogroup were not included in the analysis.
Figure 26 Distribution of confirmed invasive meningococcal disease by serogroups and by age group, 2008 (n=4 344)
Contributing countries: Austria, Belgium, Cyprus, Czech Republic, Denmark, Estonia, Finland, France, Germany, Greece, Hungary, Iceland, Ireland, Italy, Latvia, Lithuania, Luxembourg , Malta, Netherlands , Norway, Poland, Portugal, Romania, Slovakia, Slovenia, Spain, Sweden and the United Kingdom.
Figure 27 Distribution of confirmed invasive meningococcal disease serogroups by age group, 2009 (n=4 452)
Contributing countries: Austria, Belgium, Cyprus, Czech Republic, Denmark, Estonia, Finland, France, Germany, Greece, Hungary, Iceland, Ireland, Italy, Latvia, Lithuania, Luxembourg , Malta, Netherlands , Norway, Poland, Portugal, Romania, Slovakia, Slovenia, Spain, Sweden and the United Kingdom.
773 936253 143 408 187 235 255
156
223368
58 9855 40 132 66 101 73
53
1
677
21
2547
0%
10%
20%
30%
40%
50%
60%
70%
80%
90%
100%
<1 year 1-4 years 5-9 years 10-14 years
15-19 years
20-24 years
25-44 years
45-64 years
65+ years Unk Total
B C W135 A NGA Y X Others
683 869 262149
402 196 208 224145
16 3154
55 9643
5888 52
7561
48
1 577
310 40 35
66
0%
10%
20%
30%
40%
50%
60%
70%
80%
90%
100%
<1 year 1-4 years 5-9 years 10-14 years
15-19 years
20-24 years
25-44 years
45-64 years
65+ years Unk Total
B C W135 A NGA Y X Others

Surveillance of invasive bacterial diseases in Europe 2008/2009 SURVEILLANCE REPORT
30
The percentage distribution of serogroups over time, before and after the year of introduction of MCC into the country’s routine vaccination schedule is shown in Figure 28 (source for vaccination schedules provided by EUVAC.NET). The figure highlights the impact of MCC vaccination as the proportion of cases due to serogroup C dramatically decreased in the post-vaccination years. Not all countries have available data for all 19 years (eight years before starting the vaccination programme and 10 after), this, however, does not invalidate the results since the percentage distribution is analysed.
Figure 28 Percentage distribution of invasive meningococcal disease by serogroup in MCC countries* in the years before and after the introduction of MCC vaccination into the routine vaccination schedule, 1999–2009 (n=56 385)
*Countries included as MCC countries: Belgium, Germany, Greece, Iceland, Italy, Ireland, Netherlands, Portugal, Spain and the United Kingdom.
Age-group-specific notification rates of serogroup B cases for 2008 and 2009 are shown in Figures 29 and 30. The highest rates were notified in infants and children younger than 4 years, followed by adolescents 15–19 years old. For further details see Tables B19 and B20 in Annex 3.
Figure 29 Age-group-specific notification rates (per 100 000) of serogroup B invasive meningococcal disease cases, 2008 (n=3 346)
Population data: Eurostat Contributing countries: Austria, Belgium, Cyprus, Czech Republic, Denmark, Estonia, Finland, France, Germany, Greece, Hungary, Iceland, Ireland, Italy, Latvia, Lithuania, Malta, Netherlands, Norway, Poland, Portugal, Romania, Slovakia, Slovenia, Spain, Sweden and the United Kingdom.
0%
10%
20%
30%
40%
50%
60%
70%
80%
90%
100%
B C NGA Others
0
2
4
6
8
10
12
14
16
<1 year 1-4 years 5-9 years 10-14 years 15-19 years 20-24 years 25-44 years 45-64 years 65+ years
Not
ifica
tion
rate
(pe
r 10
0 00
0)

SURVEILLANCE REPORT Surveillance of invasive bacterial diseases in Europe 2008/2009
31
Figure 30 Age-group-specific notification rates (per 100 000) of serogroup B invasive meningococcal disease cases, 2009 (n=3 138)
Population data: Eurostat Contributing countries: Austria, Belgium, Cyprus, Czech Republic, Denmark, Estonia, Finland, France, Germany, Greece, Hungary, Iceland, Ireland, Italy, Latvia, Lithuania, Malta, Netherlands, Norway, Poland, Portugal, Romania, Slovakia, Slovenia, Spain, Sweden and the United Kingdom.
The age-specific rates for serogroup C in 2008 and 2009, by countries with and without MCC vaccination, is shown in Figures 31 and 32. In countries with MCC vaccination, the notification rates were below 0.6 per 100 000 population in infants and particularly low rates (0.2 to 0.0 per 100 000) were reported in all the other age groups. See Tables B21 and B22 in Annex 3.
Figure 31 Age-group-specific notification rates (per 100 000) of serogroup C invasive meningococcal disease cases, in countries with MCC and without MCC vaccination, 2008 (n=676)
Population data: Eurostat. *Countries included as MCC countries: Belgium, Germany, Greece, Iceland, Ireland, Italy, Netherlands, Portugal Spain and the United Kingdom. **Countries included as non-MCC countries: Austria, Cyprus, Czech Republic, Denmark, Estonia, Finland, France, Hungary, Latvia, Lithuania, Luxembourg, Malta, Norway, Poland, Romania, Slovakia, Slovenia and Sweden.
0
2
4
6
8
10
12
14
16
<1 year 1-4 years 5-9 years 10-14 years 15-19 years 20-24 years 25-44 years 45-64 years 65+ years
Not
ifica
tion
rate
(pe
r 10
0 00
0)
0
0.2
0.4
0.6
0.8
1
1.2
1.4
1.6
1.8
2
<1 year 1-4 years 5-9 years 10-14 years 15-19 years 20-24 years 25-44 years 45-64 years 65+ years
Not
ifica
tion
rate
(pe
r 10
0000
)
Without MCC
With MCC
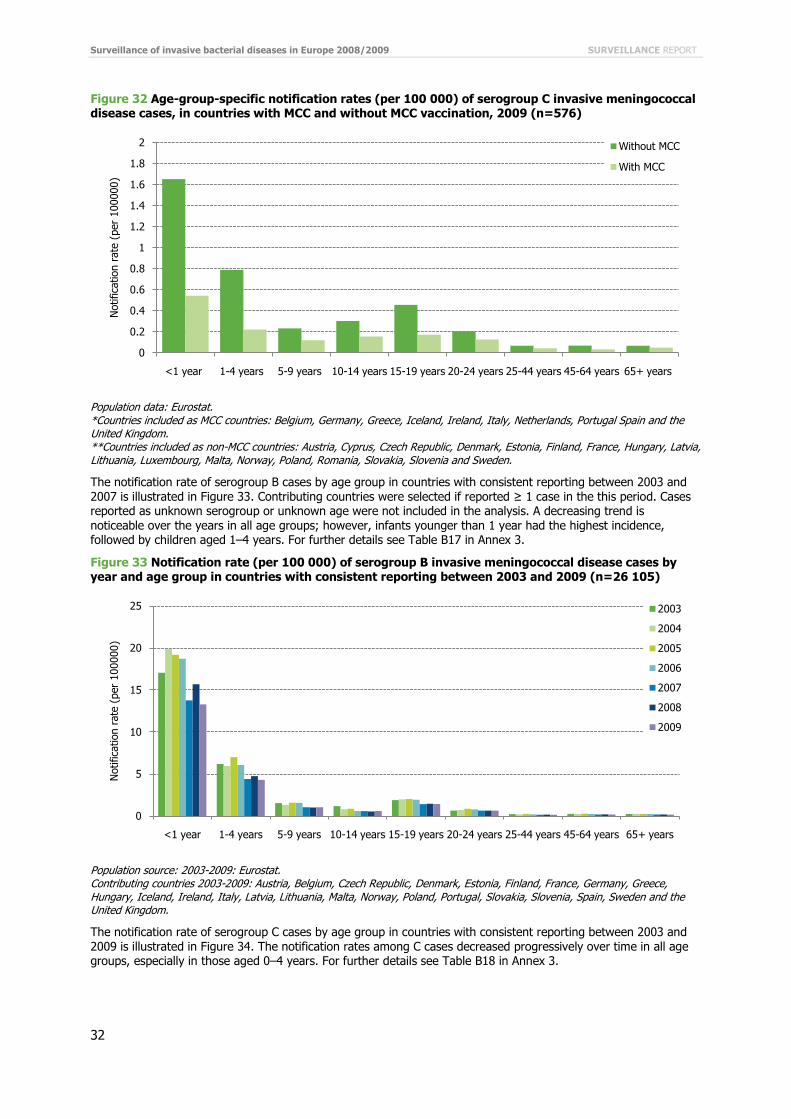
Surveillance of invasive bacterial diseases in Europe 2008/2009 SURVEILLANCE REPORT
32
Figure 32 Age-group-specific notification rates (per 100 000) of serogroup C invasive meningococcal disease cases, in countries with MCC and without MCC vaccination, 2009 (n=576)
Population data: Eurostat. *Countries included as MCC countries: Belgium, Germany, Greece, Iceland, Ireland, Italy, Netherlands, Portugal Spain and the United Kingdom. **Countries included as non-MCC countries: Austria, Cyprus, Czech Republic, Denmark, Estonia, Finland, France, Hungary, Latvia, Lithuania, Luxembourg, Malta, Norway, Poland, Romania, Slovakia, Slovenia and Sweden.
The notification rate of serogroup B cases by age group in countries with consistent reporting between 2003 and 2007 is illustrated in Figure 33. Contributing countries were selected if reported ≥ 1 case in the this period. Cases reported as unknown serogroup or unknown age were not included in the analysis. A decreasing trend is noticeable over the years in all age groups; however, infants younger than 1 year had the highest incidence, followed by children aged 1–4 years. For further details see Table B17 in Annex 3.
Figure 33 Notification rate (per 100 000) of serogroup B invasive meningococcal disease cases by year and age group in countries with consistent reporting between 2003 and 2009 (n=26 105)
Population source: 2003-2009: Eurostat. Contributing countries 2003-2009: Austria, Belgium, Czech Republic, Denmark, Estonia, Finland, France, Germany, Greece, Hungary, Iceland, Ireland, Italy, Latvia, Lithuania, Malta, Norway, Poland, Portugal, Slovakia, Slovenia, Spain, Sweden and the United Kingdom.
The notification rate of serogroup C cases by age group in countries with consistent reporting between 2003 and 2009 is illustrated in Figure 34. The notification rates among C cases decreased progressively over time in all age groups, especially in those aged 0–4 years. For further details see Table B18 in Annex 3.
0
0.2
0.4
0.6
0.8
1
1.2
1.4
1.6
1.8
2
<1 year 1-4 years 5-9 years 10-14 years 15-19 years 20-24 years 25-44 years 45-64 years 65+ years
Not
ifica
tion
rate
(pe
r 10
0000
)
Without MCC
With MCC
0
5
10
15
20
25
<1 year 1-4 years 5-9 years 10-14 years 15-19 years 20-24 years 25-44 years 45-64 years 65+ years
Not
ifica
tion
rate
(pe
r 10
0000
)
2003
2004
2005
2006
2007
2008
2009

SURVEILLANCE REPORT Surveillance of invasive bacterial diseases in Europe 2008/2009
33
Figure 34 Notification rate (per 100 000) of serogroup C invasive meningococcal disease cases by year and age group in countries with consistent reporting, 2003–2009 (n=5 871)
Population source: Eurostat. Contributing countries: Austria, Belgium, Czech Republic, Denmark, Estonia, Finland, France, Germany, Greece, Hungary, Iceland, Ireland, Italy, Latvia, Lithuania, Malta, Norway, Poland, Portugal, Slovakia, Slovenia, Spain, Sweden and the United Kingdom.
4.3.7 Further characterisation of N. meningitidis Data on FetVR was available in 11.4% (n=1 008) of total number of cases and 61 variants have been reported for 2008 and 2009 together. Isolates of the variant F1-5 (n=208; 20.6%), F3-3 (n=110; 10.9%) and F5-1 (n=97; 9.6%) were the most frequently reported. Table 4 below shows the most frequent FetVR variants in the EU.
Table 4 Total number and percentage distribution of FetVR variants, in reporting countries, 2008 and 2009 combined
Fet VR Number of cases N
Percentage distribution %
F1-5 208 20.6
F3-3 110 10.9
F5-1 97 9.6
F3-6 94 9.3
F5-5 75 7.4
F3-9 69 6.8
F4-1 58 5.8
F1-7 54 5.4
F5-9 47 4.7
F5-8 26 2.6
F5-2 21 2.1
F5-12 16 1.6
F1-15 15 1.5
Multilocus sequence typing (MLST) data completeness was 10.9% (n=981) of all cases for 2008 and 2009. MLST showed that the bacterial population was highly diverse, comprising 26 different clonal complexes: 256 (26.1%) isolates belong to CC ST-41 complex, followed by CC ST-11 complex (21.1% n=207) and CC ST-32 complex (16.3% n=160).
ST-11 complex/ET-37 complex strains were identified in C disease, while ST-41/44 complex/Linage 3 strains and ST-32 complex/ET-5 complex were responsible for B disease.
The most frequently reported invasive meningococcal lineages are shown in Table 5.
The clonal complex distribution by country and by serogroup is illustrated Tables B28 and B29 in Annex 3.
0.0
0.2
0.4
0.6
0.8
1.0
1.2
1.4
1.6
1.8
2.0
<1 year 1-4 years 5-9 years 10-14 years 15-19 years 20-24 years 25-44 years 45-64 years 65+ years
Not
ifica
tion
rate
(pe
r 10
0000
)
2003
2004
2005
2006
2007
2008
2009
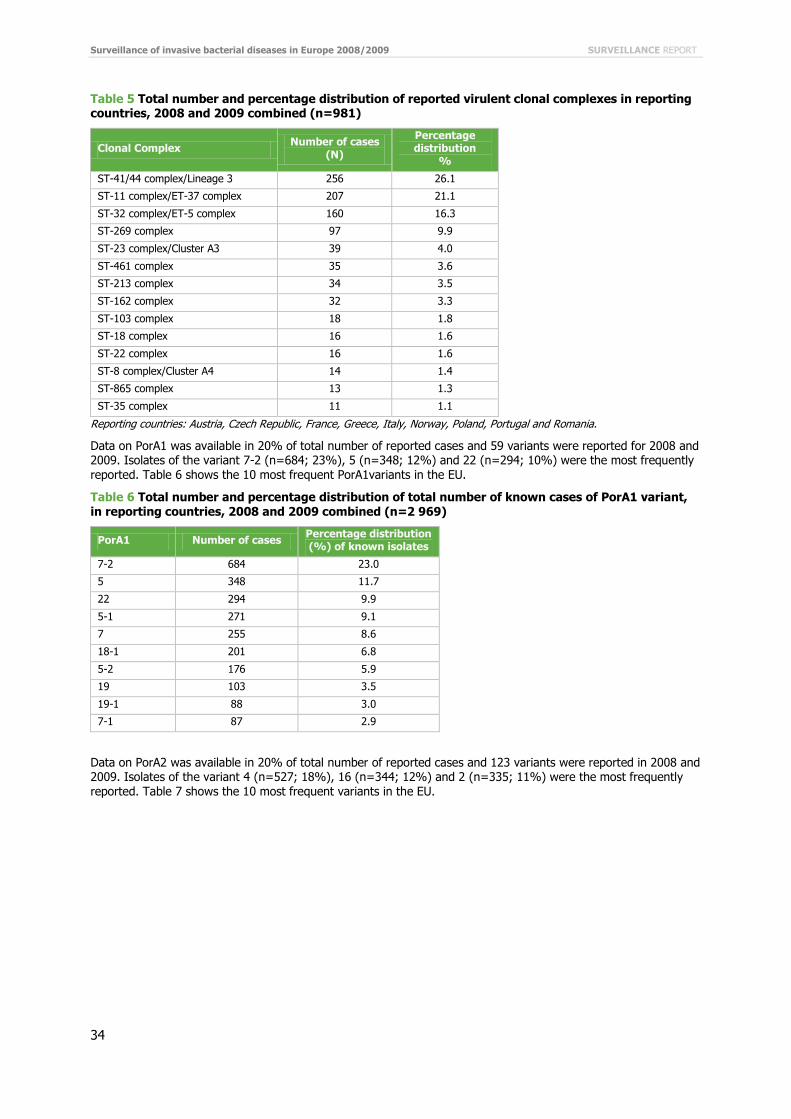
Surveillance of invasive bacterial diseases in Europe 2008/2009 SURVEILLANCE REPORT
34
Table 5 Total number and percentage distribution of reported virulent clonal complexes in reporting countries, 2008 and 2009 combined (n=981)
Clonal Complex Number of cases (N)
Percentage distribution
%
ST-41/44 complex/Lineage 3 256 26.1
ST-11 complex/ET-37 complex 207 21.1
ST-32 complex/ET-5 complex 160 16.3
ST-269 complex 97 9.9
ST-23 complex/Cluster A3 39 4.0
ST-461 complex 35 3.6
ST-213 complex 34 3.5
ST-162 complex 32 3.3
ST-103 complex 18 1.8
ST-18 complex 16 1.6
ST-22 complex 16 1.6
ST-8 complex/Cluster A4 14 1.4
ST-865 complex 13 1.3
ST-35 complex 11 1.1
Reporting countries: Austria, Czech Republic, France, Greece, Italy, Norway, Poland, Portugal and Romania.
Data on PorA1 was available in 20% of total number of reported cases and 59 variants were reported for 2008 and 2009. Isolates of the variant 7-2 (n=684; 23%), 5 (n=348; 12%) and 22 (n=294; 10%) were the most frequently reported. Table 6 shows the 10 most frequent PorA1variants in the EU.
Table 6 Total number and percentage distribution of total number of known cases of PorA1 variant, in reporting countries, 2008 and 2009 combined (n=2 969)
PorA1 Number of cases Percentage distribution (%) of known isolates
7-2 684 23.0
5 348 11.7
22 294 9.9
5-1 271 9.1
7 255 8.6
18-1 201 6.8
5-2 176 5.9
19 103 3.5
19-1 88 3.0
7-1 87 2.9
Data on PorA2 was available in 20% of total number of reported cases and 123 variants were reported in 2008 and 2009. Isolates of the variant 4 (n=527; 18%), 16 (n=344; 12%) and 2 (n=335; 11%) were the most frequently reported. Table 7 shows the 10 most frequent variants in the EU.

SURVEILLANCE REPORT Surveillance of invasive bacterial diseases in Europe 2008/2009
35
Table 7 Total number and percentage distribution of total number of known cases of PorA2 variant, in reporting countries, 2008 and 2009 combined (n=2 981)
PorA2 Number of cases Percentage
distribution (%) of known isolates
4 527 17.7
16 344 11.5
2 335 11.2
14 213 7.1
3 162 5.4
10-1 133 4.5
10-8 109 3.7
13-1 100 3.4
9 99 3.3
15 96 3.2
4.3.8 Antimicrobial susceptibility of isolates of N. meningitidis The majority of isolates tested were susceptible to the antibiotics that are currently used in treatment and prophylaxis (rifampicin, cefotaxime, penicillin G, and ciprofloxacin). In 2008 and 2009, six strains were reported as resistant to ciprofloxacin (Austria (n=2), Slovakia (n=1), Estonia (n=1), Italy (n=1) and Sweden (n=1)) and six strains were resistant to ceftriaxone in Estonia (n=3 in 2008 and n=3 in 2009). Only the numeric values were included in the analysis; for data interpretation, the EUCAST guideline was used. The results intermediated between twofold dilutions were converted to the next twofold dilution. Detailed information on antimicrobial susceptibility is shown in Tables B34 and B35 in Annex 3.
4.3.9 Clinical presentation The average data completeness was 50.7% of the total number of reported cases for 2008 and 2009.
Among known cases meningitis (40.0% in 2008 and 44.8% in 2009) contributed in the highest proportion to the clinical picture of the disease in Europe. In Slovakia and Romania, the ratio for meningitis was considerably higher (81.2% and 71.3% in 2008; 82.0% in 2009 and 68.5% in 2009) than the EU overall. In Malta (66.6% in 2008), Estonia (50% in 2008), Lithuania (47.7% in 2009) and Spain (48.2% in 2009), septicaemia contributed in the highest proportions to the clinical picture of the disease. See Tables B23, B24 and B25 in Annex 3 for details by country.
Figure 35 Percentage distribution of clinical presentation of invasive meningococcal disease cases, all countries, 2008 (n=2 542)
Contributing countries: Austria, Belgium, Cyprus, Czech Republic, Denmark, Estonia, Finland, France, Germany, Greece, Hungary, Iceland, Ireland, Italy, Latvia, Lithuania, Luxembourg Malta, Norway, Netherlands, Poland, Portugal, Romania, Slovakia, Slovenia, Spain and the United Kingdom.
40.0%
36.4%
20.5%
3.1%
Meningitis
Septicemia
Meningitis and Septicemia
Other

Surveillance of invasive bacterial diseases in Europe 2008/2009 SURVEILLANCE REPORT
36
Figure 36 Percentage distribution of clinical presentation of invasive meningococcal disease cases, all countries, 2009 (n=2 440)
Contributing countries: Austria, Belgium, Cyprus, Czech Republic, Denmark, Estonia, Finland, France, Germany, Greece, Hungary, Iceland, Ireland, Italy, Latvia, Lithuania, Luxembourg Malta, Norway, Netherlands, Poland, Portugal, Romania, Slovakia, Slovenia, Spain and the United Kingdom.
The association between clinical presentation and age is shown in Figures 37 and 38. Variations were observed across age and clinical presentation. Meningitis was reported mainly (30%) in adolescents aged 15–19 yeas (27.7% in 2008) and young adults aged 25–44 years (31.5 in 2008 ); while the proportion of septicaemia occurred in infants younger than 1 year old (20.2% in 2008) and in persons over 65 years of age (24.5% in 2008).
Figure 37 Clinical presentation of confirmed invasive meningococcal disease cases by age group, in EU/EEA countries, 2008 (n=2 514)
Contributing countries: Austria, Belgium, Denmark, Estonia, Germany, Greece, Hungary, Iceland, Ireland, Italy, Latvia, Lithuania, Luxembourg, Malta, Norway, Poland, Portugal, Romania, Slovakia, Spain and the United Kingdom.
44.8%
34.3%
17.6%
3.4%
Meningitis
Septicemia
Meningitis and Septicemia
Other
162 171 7654
176 75 13397
60
194 246 76
41
83 51 7775 80
101 12864
32 65 25 3940
1430 11 7 7
0%
10%
20%
30%
40%
50%
60%
70%
80%
90%
100%
<1 year 1-4 years 5-9 years 10-14 years 15-19 years 20-24 years 25-44 years 45-64 years 65+ years
Meningitis Septicemia Meningitis and septicaemia Other

SURVEILLANCE REPORT Surveillance of invasive bacterial diseases in Europe 2008/2009
37
Figure 38 Clinical presentation of confirmed invasive meningococcal disease cases by age group, in EU/EEA countries, 2009 (n=2 415)
Contributing countries: Austria, Belgium, Denmark, Estonia, Germany, Greece, Hungary, Iceland, Ireland, Italy, Latvia, Lithuania, Luxembourg, Malta, Norway, Poland, Portugal, Romania, Slovakia, Spain and the United Kingdom.
Figures 39 and 40 show the association between clinical presentation and serogroup considering cases with known serogroup and known age group. Among serogroup B and C, meningitis and septicaemia were reported in about equal proportions (B: 17.6%; C: 17.1% in 2008 and B: 19.9%; C: 16.5% in 2009). Meningitis was the most common clinical form of serogrop A (2008 and 2009) and Y (2008), however, the total number of reported cases for these serogroups was considerably low.
Figure 39 Clinical presentation of confirmed invasive meningococcal disease cases by serogroup, all countries, 2008 (n=4 344)
Contributing countries: Austria, Belgium, Denmark, Estonia, Germany, Greece, Hungary, Iceland, Ireland, Italy, Latvia, Lithuania, Luxembourg, Malta, Norway, Netherlands, Poland, Portugal, Romania, Slovakia, Spain and the United Kingdom.
151 219 8486 170
96 12096
59
173220 68
45 7230 57
7393
8697 45 31 71 29 24 24 14
24 12 5 3 6 3 8 9 12
0%
10%
20%
30%
40%
50%
60%
70%
80%
90%
100%
<1 year 1-4 years 5-9 years 10-14 years 15-19 years 20-24 years 25-44 years 45-64 years 65+ years
Meningitis Septicemia Meningitis and septicaemia Other
592 171
8
17
1026
1
2
577 171
1815
4
16
1
325 945 10
2
4
1
42
71
0%
10%
20%
30%
40%
50%
60%
70%
80%
90%
100%
B C W135 NGA A Y X OthersSerogroup
Meningitis Septicemia Meningitis and septicaemia Other

Surveillance of invasive bacterial diseases in Europe 2008/2009 SURVEILLANCE REPORT
38
Figure 40 Clinical presentation of confirmed invasive meningococcal disease cases by serogroup, all countries, 2009 (n=4 105)
Contributing countries: Austria, Belgium, Denmark, Estonia, Germany, Greece, Hungary, Iceland, Ireland, Italy, Latvia, Lithuania, Luxembourg, Malta, Norway, Netherlands, Poland, Portugal, Romania, Slovakia, Spain and the United Kingdom.
4.3.10 Case fatality ratio Case fatality ratio (CFR) for the total number of cases reported in 2008 and 2009 is shown in Figures 41 and 42. Data completeness was quite high: outcome was available in average for 92% of reported cases for both years. No death were reported from four countries in 2008 (Cyprus, Iceland, Luxembourg and Slovenia) and five countries in 2009 (Cyprus, Latvia, Luxembourg, Slovenia and Iceland). Outcome data were lacking from two countries (Bulgaria and Liechtenstein), therefore they were excluded from calculations.
When interpreting the data, it must be taken into account that a limited number of cases in smaller countries resulted in a large difference in case fatality ratio. The overall CFR among the European countries was 8.5% in 2008 and 7.3% in 2009, almost the same range of values as in the previous years (7.7 in 2006% and 8.1 in 2007%). However, the highest CFR was found in Malta (66.6% in 2008 and 75% in 2009), Estonia (33.3% in 2008 and 20% in 2009), followed by Hungary (20% in 2008 and 13.5 in 2009). The lowest CF in 2008 was reported in Belgium (3.6%), Netherlands (3.7%) and Ireland (4.9%), and in 2009 in Ireland (4% in 2009), Denmark (4.1% in 2009) and Portugal (4.5% in 2009).
628 17213
29
14
24
6
521 135 1716
5
312
1267 81 6
7 13
5 6 1
0%
10%
20%
30%
40%
50%
60%
70%
80%
90%
100%
B C W135 NGA A Y X Others
Serogroup
Meningitis Septicemia Meningitis and septicaemia Other
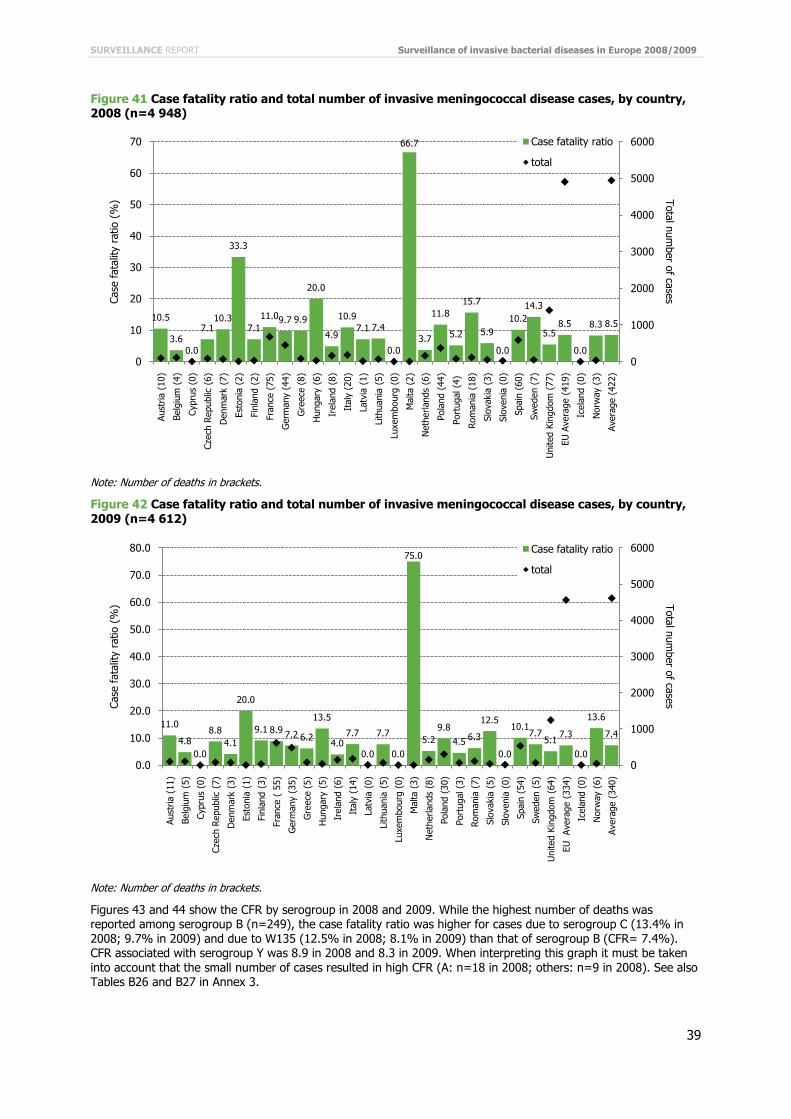
SURVEILLANCE REPORT Surveillance of invasive bacterial diseases in Europe 2008/2009
39
Figure 41 Case fatality ratio and total number of invasive meningococcal disease cases, by country, 2008 (n=4 948)
Note: Number of deaths in brackets.
Figure 42 Case fatality ratio and total number of invasive meningococcal disease cases, by country, 2009 (n=4 612)
Note: Number of deaths in brackets.
Figures 43 and 44 show the CFR by serogroup in 2008 and 2009. While the highest number of deaths was reported among serogroup B (n=249), the case fatality ratio was higher for cases due to serogroup C (13.4% in 2008; 9.7% in 2009) and due to W135 (12.5% in 2008; 8.1% in 2009) than that of serogroup B (CFR= 7.4%). CFR associated with serogroup Y was 8.9 in 2008 and 8.3 in 2009. When interpreting this graph it must be taken into account that the small number of cases resulted in high CFR (A: n=18 in 2008; others: n=9 in 2008). See also Tables B26 and B27 in Annex 3.
10.5
3.60.0
7.110.3
33.3
7.111.09.7 9.9
20.0
4.9
10.97.1 7.4
0.0
66.7
3.7
11.8
5.2
15.7
5.9
0.0
10.214.3
5.58.5
0.0
8.3 8.5
0
1000
2000
3000
4000
5000
6000
0
10
20
30
40
50
60
70
Aust
ria (
10)
Belg
ium
(4)
Cypr
us (
0)
Czec
h Rep
ublic
(6)
Den
mar
k (7
)
Esto
nia
(2)
Finl
and
(2)
Fran
ce (
75)
Ger
man
y (4
4)
Gre
ece
(8)
Hun
gary
(6)
Irel
and
(8)
Ital
y (2
0)
Latv
ia (
1)
Lith
uani
a (5
)
Luxe
mbo
urg
(0)
Mal
ta (
2)
Net
herla
nds
(6)
Pola
nd (
44)
Port
ugal
(4)
Rom
ania
(18
)
Slov
akia
(3)
Slov
enia
(0)
Spai
n (6
0)
Swed
en (
7)
Uni
ted
King
dom
(77
)
EU A
vera
ge (
419)
Icel
and
(0)
Nor
way
(3)
Aver
age
(422
)
Total number of casesCa
se fa
talit
y ra
tio (
%)
Case fatality ratio
total
11.0
4.80.0
8.84.1
20.0
9.1 8.9 7.2 6.2
13.5
4.07.7
0.0
7.7
0.0
75.0
5.29.8
4.5 6.3
12.5
0.0
10.17.7
5.17.3
0.0
13.6
7.4
0
1000
2000
3000
4000
5000
6000
0.0
10.0
20.0
30.0
40.0
50.0
60.0
70.0
80.0
Aust
ria (
11)
Belg
ium
(5)
Cypr
us (
0)
Czec
h Rep
ublic
(7)
Den
mar
k (3
)
Esto
nia
(1)
Finl
and
(3)
Fran
ce (
55)
Ger
man
y (3
5)
Gre
ece
(5)
Hun
gary
(5)
Irel
and
(6)
Ital
y (1
4)
Latv
ia (
0)
Lith
uani
a (5
)
Luxe
mbo
urg
(0)
Mal
ta (
3)
Net
herla
nds
(8)
Pola
nd (
30)
Port
ugal
(3)
Rom
ania
(7)
Slov
akia
(5)
Slov
enia
(0)
Spai
n (5
4)
Swed
en (
5)
Uni
ted
King
dom
(64
)
EU A
vera
ge (
334)
Icel
and
(0)
Nor
way
(6)
Aver
age
(340
)
Total number of casesCa
se fa
talit
y ra
tio (
%)
Case fatality ratio
total
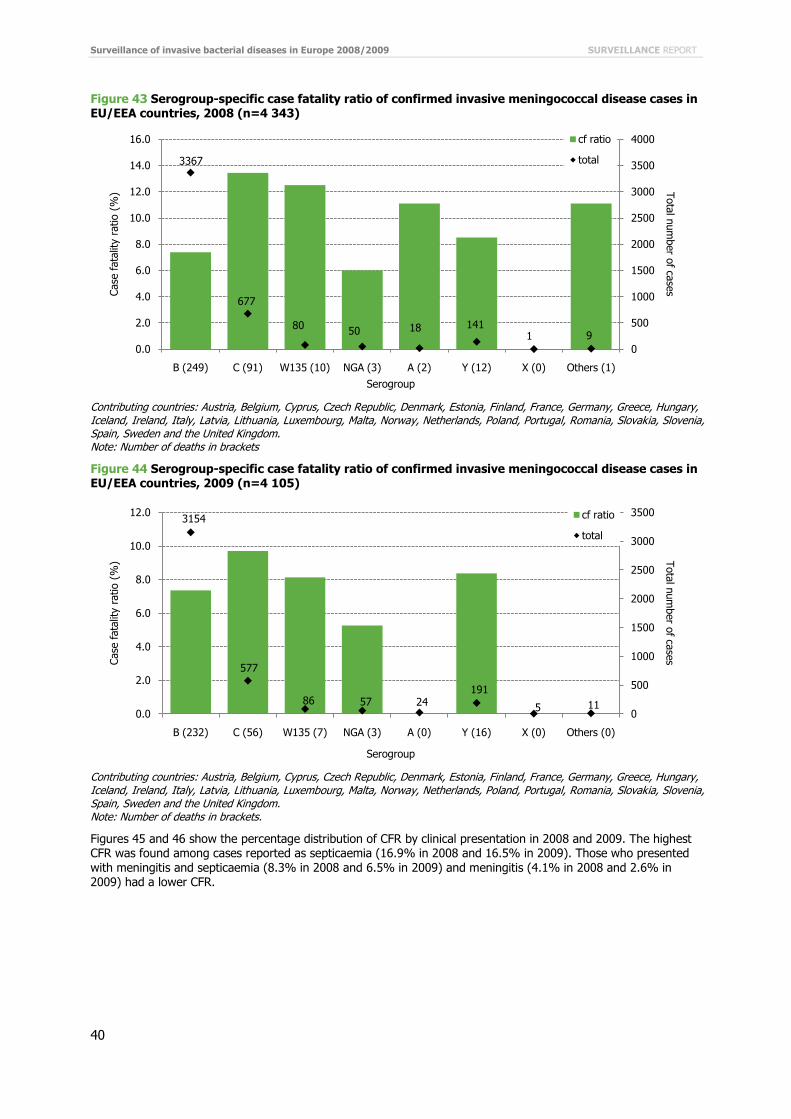
Surveillance of invasive bacterial diseases in Europe 2008/2009 SURVEILLANCE REPORT
40
Figure 43 Serogroup-specific case fatality ratio of confirmed invasive meningococcal disease cases in EU/EEA countries, 2008 (n=4 343)
Contributing countries: Austria, Belgium, Cyprus, Czech Republic, Denmark, Estonia, Finland, France, Germany, Greece, Hungary, Iceland, Ireland, Italy, Latvia, Lithuania, Luxembourg, Malta, Norway, Netherlands, Poland, Portugal, Romania, Slovakia, Slovenia, Spain, Sweden and the United Kingdom. Note: Number of deaths in brackets
Figure 44 Serogroup-specific case fatality ratio of confirmed invasive meningococcal disease cases in EU/EEA countries, 2009 (n=4 105)
Contributing countries: Austria, Belgium, Cyprus, Czech Republic, Denmark, Estonia, Finland, France, Germany, Greece, Hungary, Iceland, Ireland, Italy, Latvia, Lithuania, Luxembourg, Malta, Norway, Netherlands, Poland, Portugal, Romania, Slovakia, Slovenia, Spain, Sweden and the United Kingdom. Note: Number of deaths in brackets.
Figures 45 and 46 show the percentage distribution of CFR by clinical presentation in 2008 and 2009. The highest CFR was found among cases reported as septicaemia (16.9% in 2008 and 16.5% in 2009). Those who presented with meningitis and septicaemia (8.3% in 2008 and 6.5% in 2009) and meningitis (4.1% in 2008 and 2.6% in 2009) had a lower CFR.
3367
677
80 50 18 1411 9
0
500
1000
1500
2000
2500
3000
3500
4000
0.0
2.0
4.0
6.0
8.0
10.0
12.0
14.0
16.0
B (249) C (91) W135 (10) NGA (3) A (2) Y (12) X (0) Others (1)
Total number of casesCa
se fa
talit
y ra
tio (
%)
Serogroup
cf ratio
total
3154
577
86 57 24191
5 110
500
1000
1500
2000
2500
3000
3500
0.0
2.0
4.0
6.0
8.0
10.0
12.0
B (232) C (56) W135 (7) NGA (3) A (0) Y (16) X (0) Others (0)
Total number of casesCa
se fa
talit
y ra
tio (
%)
Serogroup
cf ratio
total

SURVEILLANCE REPORT Surveillance of invasive bacterial diseases in Europe 2008/2009
41
Figure 45 Case fatality ratio by clinical presentation of total number of invasive meningococcal disease cases in EU/EEA countries, 2008 (n=2 542)
Contributing countries: Austria, Belgium, Cyprus, Czech Republic, Denmark, Estonia, Finland, France, Germany, Greece, Hungary, Iceland, Ireland, Italy, Latvia, Lithuania, Luxembourg, Malta, Netherlands, Norway, Poland, Portugal, Romania, Slovakia, Slovenia, Spain, Sweden and the United Kingdom. Note: Number of deaths in brackets.
Figure 46 Case fatality ratio by clinical presentation of total number of invasive meningococcal disease cases in EU/EEA countries, 2009 (n=2 440)
Contributing countries: Austria, Belgium, Cyprus, Czech Republic, Denmark, Estonia, Finland, France, Germany, Greece, Hungary, Iceland, Ireland, Italy, Latvia, Lithuania, Luxembourg, Malta, Netherlands, Norway, Poland, Portugal, Romania, Slovakia, Slovenia, Spain, Sweden and the United Kingdom. Note: Number of death in brackets.
4.3.11 Vaccination status Data completeness on vaccination status (33.8% in 2008 and 36.1% in 2009) did not allow the analysis of vaccination failure, therefore only numbers and proportions of reported vaccinations status are presented. The total proportion of unvaccinated cases accounted for the overall highest proportion in all age groups (60%, n=314, in 2008; and 56%, n=250, in 2009) followed by those whose vaccination status was reported as unknown (37%, n=193, in 2008; and 39%, n=172, in 2009). Only a small proportion of notified cases were reported as fully vaccinated (3%, n=17, in 2008; and 5%, n=23, in 2009). See Tables B30 and B31 in Annex 3.
1017
925
520
800
200
400
600
800
1000
1200
0
2
4
6
8
10
12
14
16
18
Meningitis (42) Septicemia (156) Meningitis and Septicemia (43)
Others (4)
Total number of cases Ca
se fa
talit
y ra
tio (
%)
Clinical presentation
CFR%
Total number of cases
1093
836
429
820
200
400
600
800
1000
1200
0
2
4
6
8
10
12
14
16
18
Meningitis (28) Septicemia (138) Meningitis and Septicemia (28)
Others (2)
Total number of casesCa
se fa
talit
y ra
tio (
%)
Clinical presentation
CFR%
Total number of cases
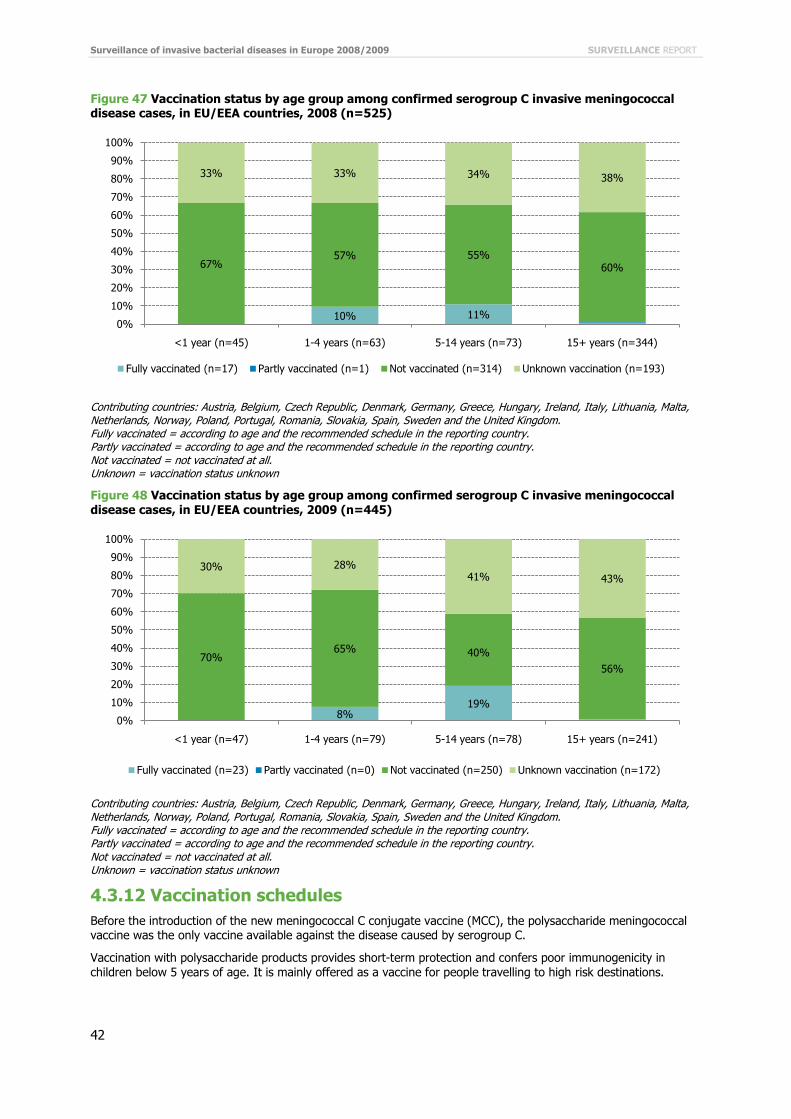
Surveillance of invasive bacterial diseases in Europe 2008/2009 SURVEILLANCE REPORT
42
Figure 47 Vaccination status by age group among confirmed serogroup C invasive meningococcal disease cases, in EU/EEA countries, 2008 (n=525)
Contributing countries: Austria, Belgium, Czech Republic, Denmark, Germany, Greece, Hungary, Ireland, Italy, Lithuania, Malta, Netherlands, Norway, Poland, Portugal, Romania, Slovakia, Spain, Sweden and the United Kingdom. Fully vaccinated = according to age and the recommended schedule in the reporting country. Partly vaccinated = according to age and the recommended schedule in the reporting country. Not vaccinated = not vaccinated at all. Unknown = vaccination status unknown
Figure 48 Vaccination status by age group among confirmed serogroup C invasive meningococcal disease cases, in EU/EEA countries, 2009 (n=445)
Contributing countries: Austria, Belgium, Czech Republic, Denmark, Germany, Greece, Hungary, Ireland, Italy, Lithuania, Malta, Netherlands, Norway, Poland, Portugal, Romania, Slovakia, Spain, Sweden and the United Kingdom. Fully vaccinated = according to age and the recommended schedule in the reporting country. Partly vaccinated = according to age and the recommended schedule in the reporting country. Not vaccinated = not vaccinated at all. Unknown = vaccination status unknown
4.3.12 Vaccination schedules Before the introduction of the new meningococcal C conjugate vaccine (MCC), the polysaccharide meningococcal vaccine was the only vaccine available against the disease caused by serogroup C.
Vaccination with polysaccharide products provides short-term protection and confers poor immunogenicity in children below 5 years of age. It is mainly offered as a vaccine for people travelling to high risk destinations.
10% 11%
67%57% 55%
60%
33% 33% 34% 38%
0%
10%
20%
30%
40%
50%
60%
70%
80%
90%
100%
<1 year (n=45) 1-4 years (n=63) 5-14 years (n=73) 15+ years (n=344)
Fully vaccinated (n=17) Partly vaccinated (n=1) Not vaccinated (n=314) Unknown vaccination (n=193)
8%19%
70%65% 40%
56%
30% 28%41% 43%
0%
10%
20%
30%
40%
50%
60%
70%
80%
90%
100%
<1 year (n=47) 1-4 years (n=79) 5-14 years (n=78) 15+ years (n=241)
Fully vaccinated (n=23) Partly vaccinated (n=0) Not vaccinated (n=250) Unknown vaccination (n=172)
SURVEILLANCE REPORT Surveillance of invasive bacterial diseases in Europe 2008/2009
43
Tetravalent conjugate vaccine against serogroup A, C, W135 and Y has recently been licensed in Europe and recommended for persons aged 11 years and up.
Three different single MCC vaccines are currently available, two of which are conjugated to diphtheria, and one to tetanus toxoid.
The first MCC vaccines were licensed and have been in used in Europe since 1999. The United Kingdom was the first country to introduce MCC vaccination followed by Ireland and Spain (both in 2000). By 2009, 12 European countries included MCC vaccine in their routine vaccination programme.
In some of the countries (UK, Iceland) the infant schedule was offered and in other countries (Belgium, Netherlands, Luxembourg, Germany) only a single dose was recommended in the second year of life and a catch up campaign targeted adolescents younger than 19 years of age (with the exception of Germany, where only catch-up was recommended on an individual basis only).
The vaccination schedules and details of catch-up campaigns are summarised in Tables B32 and B33 in Annex 3.

Surveillance of invasive bacterial diseases in Europe 2008/2009 SURVEILLANCE REPORT
44
5 Discussion 5.1 Case definitions The EU case definition changed twice over the past few years. For defining a case, the majority of the countries applied the 2008 version of the EU case definition, however, 2002 version and other case definition were also applied, and few countries did not define the case definition used.
5.2 Data sources The general overview of national surveillance systems reveals a heterogeneous situation for both diseases. Of the 29 countries reporting, most data came from surveillance systems working on the general population, but there are differences in terms of age groups under surveillance, sensitivity of the systems, laboratory methods used for case confirmation, completeness information on clinical symptoms and outcome and consistency of information on vaccination status collected. In the majority of the countries, the epidemiological and laboratory data are merged at country level, however, there are some countries where this is not possible and the epidemiological data and laboratory data are submitted to ECDC from two different sources. These differences in surveillance systems in the MS complicate comparative analyses. In addition, changes in the systems over time and improvement in case ascertainment further complicated the comparability of trend data, even within countries.
ECDC did not have a full overview of the surveillance systems in place. Therefore, the inclusion criteria for different analyses followed what was stated in the EU-IBIS report from 2006 and were consistent with the reported data from 2008-2009. However, only countries with consistent reporting over the years have been included for trend analyses.
Based upon the information above, inferences on the difference observed between MS have to be made with caution. It is expected that the data comparability will gradually improve in the coming years as MS move more towards a common EU surveillance system.
5.3 Laboratory test methods One of the objectives of the IBD surveillance is to monitor circulating strains in order to detect any modification in phenotype and genotype characteristics of the more commonly observed strains. The surveillance can also serve to monitor the circulation of emerging strains and any serotype replacement due to the selective pressure of vaccines. Therefore, a high completeness of laboratory data is desirable for accurate epidemiological analyses.
Laboratory capacities have improved over the years and the number of countries that are able to perform molecular typing methods of N. meningitidis, in particular, is increasing. However, only few of them provided this information. Culture was the most frequently reported laboratory method for both diseases; and the information on nucleic acid detection and the genotyping approaches have increasingly been reported, especially in Ireland, the United Kingdom and Greece. This is quite encouraging; nevertheless the routine use for strain characterisation appears to be limited in the majority of MS. On the other hand, the feedback received by many MS during the validation period of the data call indicated that the descriptions of the variables related to the test method used, and its link to a particular specimen, provided a certain level of confusion and may have been interpreted differently in different MS. Therefore, even if information on further test methods performed would have been available in MS, only information on the test methods used on the first specimen taken for case confirmation was reported.
The description about the variables related to the specimen collected and the test method used would benefit further simplifications and standardisation before the next data call in order to obtain valid and utilisable data.
5.4 Completeness of surveillance data The completeness of reporting varied greatly between variables and across countries.
The data completeness improved consistently comparing with 2007, in which a total of 12 variables were reported as 100% unknown by 2–14 countries. In 2008 and 2009, no variable was reported 100% unknown.
This was the first data call using the new metadata set. Several lessons were learned and further revision of the metadata set will be carried out prior to the next data call. This may include a removal or change of certain variables, changes/additions in codes of the variables, and development of further automatic validation rules when uploading the data.

SURVEILLANCE REPORT Surveillance of invasive bacterial diseases in Europe 2008/2009
45
With regard to invasive meningococcal disease cases, information on basic laboratory variables were reported in almost all MS (26 countries), however, further information on advanced laboratory methods for the diagnosis of N. meningitidis was reported between 10–25% by a limited number of countries (8–15countries).
5.5 Epidemiology of invasive H. influenzae disease 5.5.1 Overall notification rates H. influenzae type b has been a major cause of morbidity and mortality prior to the introduction of conjugate vaccines [3]. However, since their inclusion in routine childhood vaccination programmes, invasive H. influenzae type b disease has been practically eliminated in some parts of the developing world [4]. In EU/EEA countries the disease became rare, an overall notification rate of 0.41 per 100 000 population in 2008 and 0.32 in 2009 was observed. Comparisons of absolute number and rates between and within countries should be done with caution as specific characteristics of the national surveillance systems and its level of sensitivity may vary. Caution must also be taken while analysing trends as various changes in the surveillance methods occurred during the years: availability of new laboratory methodologies, comprehensiveness of the system, expansion of age groups and serotypes and syndromes under surveillance. In addition to being a rare disease, small changes in numbers may cause large differences in notification rates in smaller countries.
Increasing rates were observed in some countries but this trend has slowed down recently. As previously suggested in 2007 data report, these findings are possibly due to the improved sensitivity of the surveillance system more than a true increase in the incidence rates. However, there are exceptions, e.g. in Germany the increase was limited to the older age groups and is not likely explainable by changes in the surveillance system.
In the past few years, an improved case ascertainment in those countries may also have contributed as well as the implementation of enhanced surveillance systems including all serotypes, clinical presentations and age groups. In addition, a delay of several years until a new notifiable disease reaches a level of acceptable sensitivity have been reported in the literature in one of those countries (Sweden) and is probably attributed to the level of awareness among physicians and laboratories [5]. A number of additional factors could explain the changes in serotype distribution observed, such as a true increase in the non-capsulated strains, an increased completeness of serotype reporting due to an increased proportion of serotyping in the laboratories, and enhanced laboratory methods.
5.5.2 Age distribution The mean and the median age of cases affected by invasive H. influenzae disease are comparable in the observed years: mean=54.3±28.9 years and median=63 years in 2008, and mean=52.5±30.1 years and median=62 years in 2009. The findings are also in line with the previous year. In terms of absolute numbers, the age group of ≥ 65 years is the most affected group, while the highest notification rates were reported among infants < 1 year of age.
5.5 3 Serotypes Non-capsulated strains were the most frequently reported serotype during the period 1999–2009, and with an increasing trend. Among non-b serotypes f was the one most commonly isolated. There have been some concerns regarding the replacement of H. influenzae serotype in populations where the conjugated H. influenzae type b vaccines have been introduced, but so far there do not appear to be indications of any increase among the capsulated non-b strains in the EU. However, is not possible to infer that the trend is increasing, as was reported in Canada [6]. There are too many influencing factors that may bias the data and, as such, do not allow any inference to be made with confidence. One such factor is the low completeness of reported serotypes; another is the small sample of countries with stable surveillance systems and consistent reporting.
The issue of serotype replacement was discussed in a position paper by the WHO concluding ‘so far, bacterial strain replacement has not been a prominent feature of large-scale H. influenzae type b immunisation’ [4]. Ladhani et al. suggested that the introduction of the H. influenzae type b conjugate vaccine has led to a higher proportion of H influenzae cases attributable to non-b strains because of the reduction in H. influenzae type b disease and that unlike the pneumococcal conjugate vaccination programme, there is no consistent or robust evidence to suggest that mass H. influenzae type b vaccination in infancy has led to serotype replacement in either carriage or disease [7]. However, the continued increasing trend observed is an important observation, and needs to be followed up.
Serotype b is continuing to decrease; notification rates were below 0.1 per 100 000 population. In particular, the decreasing trend is beneficial to the children below 5 years old. It is important to continue monitoring the trend and evaluate the effectiveness of the vaccination on a long-term perspective, in particular comparing it with the vaccination coverage and the strategy adopted.

Surveillance of invasive bacterial diseases in Europe 2008/2009 SURVEILLANCE REPORT
46
5.5.4 Clinical presentation Clinical presentation is associated with different serotypes and strongly related to age. Sixty per cent of the reported cases lack information on clinical presentation. Septicaemia accounted for the largest proportion of the reported cases (54.0% in 2008–2009), with the majority occurring in the oldest age group (65+). It is well known that it is often the most severe cases of the disease that are reported, with many countries reporting only meningitis or meningitis/septicaemia, mainly based on hospital data.
5.5.5 Case fatality ratio Outcome was reported in 63% of the invasive H. influenzae cases, and the calculations of case fatality ratio are most likely an underestimate of the actual CFR in the EU, due to the inclusion of cases with unknown outcome in the denominator. Based upon the available data, the overall CFR in 2008–2009 was 6.15% (204 deaths) and highest among cases with the non-capsulated strains in the oldest age group (12.8%). In total, during this period, 14 deaths were reported among serotype b, with three deaths among children younger than five years of age – one was reported as partly vaccinated and the other two were not vaccinated.
5.5.6 Vaccination status Based on the variables currently collected, it is not possible to analyse the vaccination data and determine the vaccine failures, as additional variables such as birth date, number and dates of doses are necessary. In addition, data completeness of the values included in the current vaccination status variable is low (below 10% overall).
Further discussion is needed among the experts to improve the data completeness and to facilitate this analysis. In any population with high vaccination coverage, the majority of observed cases are expected to be vaccinated, as happened in 2008. However, in 2009, the proportion of cases in vaccinated patients was lower compared to non-vaccinated population.
In addition, the United Kingdom accounted for 47.8% of cases in children < 15 years old for which the vaccine information was reported. This is probably due to an increased awareness following the vaccines failure observed in England and Wales in 1999–2003. The data, therefore, are more likely to depict a picture of that country than of the EU [8].
5.5.7 Vaccination schedule In 2010, the H. influenzae b vaccine was included in national immunisation programmes by Romania and Bulgaria, hence all EU countries are currently vaccinating against H. influenzae b disease. In addition, Romania implemented a H. influenzae surveillance system in 2010; however the reported incidence was low. In other countries, such as Sweden, a delay of several years was described until a new notifiable disease reaches a level of acceptable sensitivity [5]. Bulgaria reported aggregated data with a limited set of variables, not including information on serotypes.
The vaccination schedules continue to vary across the countries; both in number of doses and age of administration (see Table A29 in Annex 2 for H. influenzae serotype b vaccination schedules).
5.6 Epidemiology of invasive meningococcal disease 5.6.1 Overall notification rates The incidence of invasive meningococcal disease varies in Europe and the reported data show that this variation is about 10-fold among the Member States. This variation might reflect real differences but might also be due to various changes in the surveillance methods that occurred over time, changes in case definitions, in population data sources, in the set of variables collected and in validation rules applied. Caution must be taken in analysing trends as disease surveillance varies across the Member States as well. For in-depth explanations of these variations, a better understanding of the data sources and a better knowledge of the healthcare practices (blood culture sampling) available at the Member States level would be required [9, 10].
In 2008 and 2009, 9 615 cases of invasive meningococcal disease were reported by 29 countries with an overall notification rate of 0.99 per 100 000 population in 2008 and 0.92 in 2009, which indicates an important decline compared to the rates reported 9–10 years before. Since that time several countries have introduced MCC vaccination in their national immunisation programmes, so even people who are not vaccinated are also protected [11, 12].
The disease remains rare in Europe with most countries reporting a notification rate below 1 per 100 000 population. A notification rate of less than 0.5 per 100 000 was registered in five countries in 2009. However, Ireland and the United Kingdom still experience a relatively high rate (3.2 and 2.02 in 2009, respectively) [13].

SURVEILLANCE REPORT Surveillance of invasive bacterial diseases in Europe 2008/2009
47
5.6.2 Age distribution As in previous years, the highest incidence of meningococcal infections was still that among children younger than 5 years old and adolescents aged between 15–19 years. The rates in children 5–9 years old and in the older age groups remained relatively unchanged compared with the previous years.
A high number of cases was still observed in age groups targeted by vaccination programmes. These cases need to be further investigated, especially those due to serogroup C observed in countries with MCC vaccination. They should be followed up more closely to identify any cases due to waning immunity [14].
It is important to maintain and continue high-quality disease surveillance, both at national and at EU level, complemented by seroprevalence studies of serogroup C in order to identify groups that may be susceptible to infection [12].
5.6.3 Serogroups Serogroup data were provided in average in 87.7% of total cases. As in the previous years, the most frequent serogroup causing invasive meningococcal disease in the EU in 2008 and 2009 was serogroup B (n=3 154 in 2009), especially prevalent in those under 5 years old and in teenagers. The number of cases of meningococcal C (n=577 in 2009) disease is currently low. The reported data accurately show that in countries with MCC vaccination the notification rates due to serogroup C remained considerably lower than in countries where vaccination against serogroup C is not included or the coverage is still very low. Regarding percentage distribution of serogroups, the data show that the proportion of serogroup C cases increased with age and, compared to previous year’s data, a shift from adolescents to an older, unvaccinated, young adults age group is noticeable.
Serogroup A disease remains low in Europe, and serogroups W135 and Y are not currently a major cause of disease in the continent. The highest proportion of W135 and Y cases was reported in the oldest age group, 65 years old and above [14, 15].
The incidence of meningococcal disease due to all serogroups decreased. Over the years a gradual decrease has been observed, especially in serogroup B and C, in each age group. In countries with MCC, the decrease in serogroup C disease has been greater than in serogroup B. A particular focus should be given to serogroup Y disease to monitor over time the observed increasing trend.
5.6.4 Molecular typing data A limited number of countries have the facilities for the typing of strains from all invasive cases. Seven countries in 2008 and nine countries in 2009 reported data on multilocus sequence typing (MLST).
In this report due to low data availability it was not possible to analyse these results in depth. Therefore, only the percentage distribution tables are shown. Multilocus sequence typing showed that the bacterial population was highly diverse, comprising 26 different clonal complexes: 256 (26.1%) isolates belonged to CC ST-41 complex, 207 (21.1%) to CC ST-11 complex 160 (16.3%) to CC ST-32 complex.
Particular clonal complexes were found to be preferentially associated with certain serogroups: ST-41/44 complex/Lineage3 with B and C serogroups; ST-32 complex/ET-5 complex with mainly C but also B serogroup; and ST-23 comlex/cluster A3 with Y serogroup [9, 13, 16].
According to the available data, the meningococcal FetA, an iron-regulated outer membrane protein, was shown to be highly diverse: 61 variants were reported in 2008 and 2009 from 1 008 N. meningitidis isolates. Variants F1-5, F3-3 and F5-1 were the most commonly represented [17].
The PorA outer membrane protein is a key immunogenic component of several meningococcal vaccines under development, and the subtypes defined by variation in the PorA provide comprehensive epidemiologic information [18].
5.6.5 Clinical presentation Information on clinical presentation was available in 50.7% of total number of reported cases. Overall, meningococcal meningitis was the most commonly recognised presentation (40.0% in 2008 and 44.8% in 2009). Septicaemia was the most common reported presentation in children younger than five years of age and in the oldest age group, while meningitis was most frequently reported in adolescents in 2008, with a peak in those aged 15–19 years (53.2%), and in young adults in 2009, with a peak in those aged 20–24 years (60.7%).
Meningitis and septicaemia were reported in roughly equal proportions among serogroups B and C: B 39.0% and C 38.4% in meningitis 2008, and B 38.8% and C 38.4% in septicaemia in 2008). It is clear that these data need to be interpreted with caution as in some countries meningitis is mainly or only reported, while the proportion of septicaemia notified is heavily influenced by the health practices in MS and is likely to be underreported. Better

Surveillance of invasive bacterial diseases in Europe 2008/2009 SURVEILLANCE REPORT
48
data completeness and understanding of the different practices applied in different Member States is required in order to interpret the results.
The case fatality ratio is an important measure of the effectiveness of treatment and the virulence of Neisseria meningitidis. Meningococcal septicaemia and meningitis are common causes of death in children and adults. Disease due to serogroup C (CFR: 13.4 in 2008 and 9.7 in 2009) appears to cause death more frequently than that due to other serogroups.
Outcome was reported in 91.7% of the cases for both years, with 26 out of 28 countries providing data on outcome in 2008 and 28 out of 28 countries providing data in 2009. Due to the inclusion of cases with unknown outcome, CFR might be underestimated especially in countries with a high percentage of unknown outcomes or late report of outcome. The overall case fatality ratio was 8.1% and ranged between 3.6% and 75.0%. The highest CFR in countries with low notification rates may indicate a bias in their data towards reporting the most severe cases. Similarly, the low CFR in countries with high notification rates may indicate that their system has a higher sensitivity. In addition, in small countries the low number of cases seemed to be associated with a high CF, possibly due to small number of cases or underreporting of less severe cases (Malta: 66.7% in 2008 and 75.0% in 2009).
5.6.6 Vaccination status and vaccination schedule The prevention of meningococcal disease depends greatly on effective vaccination on a large scale. Although polysaccharide vaccines have been available for serogroup A, C, Y and W135 for many years in several European countries, serogroup C polysaccharide–protein conjugate vaccines have been licensed 10 years ago. Newly licensed quadrivalent meningococcal conjugate vaccine for routine use among adolescents has been available in Europe since spring 2010. The United Kingdom was the first country to introduce MCC vaccination in 1999. Subsequently, Ireland, Belgium, Iceland, Portugal and Germany incorporated the vaccine into the routine vaccination schedule, offering two alternatives: the infant schedule (two doses in the first year of life followed by a third dose in the second year) or a single dose of vaccine in the second year of life. An essential element of the success of the vaccine introduction was the catch-up campaign that aimed at immunising adolescents younger than 19 years. Three further countries (Greece, Luxembourg and Cyprus) included the vaccine into the national vaccination programme. In Italy, the vaccination is recommended in many regions, but with different time of introduction for specific groups.
In addition, there are six countries (Austria, the Czech Republic, Hungary, Norway, Poland and Sweden) where the vaccine is available, used for outbreak control, and generally recommended to contacts of the disease cases, to travellers or to patients with underlying conditions.
Although recent vaccines have improved coverage for the targeted age group, there is still no vaccine available against invasive meningococcal disease group B, now the predominant serogroup responsible for the disease in Europe.
However several conjugate vaccines B are now in phase III trials with promising results and it is likely that some of them will be available in the near future [19].
Unfortunately, it was not possible in this report to analyse in depth primary or secondary vaccine failures or to make inferences on the proportion of cases among vaccinated individuals in countries with and without vaccination. This is because of the data completeness for vaccination status was very low, on average 8.9% of total number of cases for both years (2008 and 2009). In addition, an enhanced dataset on vaccination status (availability of type of vaccine, number of doses received, period interval between doses and date of the last dose) and data pertaining to multiple risk factors of vaccine failure was not collected [15].

SURVEILLANCE REPORT Surveillance of invasive bacterial diseases in Europe 2008/2009
49
6 Conclusions • Meningococcal disease remains rare in Europe with almost twofold decrease of incidence compared to the
1999 rate (1.9 per 100 000).
• Infants and children experienced the highest number of invasive meningococcal disease (IMD) cases.
• Currently, serogroup B cause the majority of infections of IMD.
• In countries with MCC, the proportion of IMD cases due to serogroup C decreased.
• Haemophilus influenzae disease was predominantly found in infants younger than 1 year old and in the oldest age group (65 years old and over).
• Haemophilus influenzae non-capsulated and non-b notifications are increasing.
• Haemophilus influenzae b notifications are gradually decreasing.
• Haemophilus influenzae non-capsulated and non-b were the most frequently reported serotypes.
• The most affected age groups by Haemophilus influenzae serotype b were infants younger than 1 year old and children below 5 years of age.
• Surveillance systems for invasive bacterial diseases are very diverse across Europe.
• Although the European Union standard case definition (2008/426/EC) for invasive meningococcal disease and invasive Haemophilus influenzae disease are in place, the case definition used in 2008 and 2009 for identifying a case differed from country to country. However, the majority of the Member States applied 2008 EU case definition.
• Case-based data were available in almost all Member States, with information usually collected on the common set of variables (classification, age, sex, outcome). However, only a few countries routinely reported information on the vaccination status of cases.
• The data show an improving level of completeness comparing to previous years, although the low level of completeness on the enhanced set of variables considerably affected the validity of the data and, consequently, the results.
• In Europe, a consensus for molecular typing has been achieved [20].
Surveillance of invasive bacterial diseases in Europe 2008/2009 SURVEILLANCE REPORT
50
7 Recommendations • Further work on the surveillance data standardisation across Europe is needed.
• Strengthening surveillance activities and establishing a better standardisation of laboratory methods used are required.
• In order to provide reliable and comprehensive information on highly virulent strains, genotyping methods should be used more frequently in Europe.
• Representative case ascertainment strategies are necessary if data are to be exploited for trend analysis, geographic visualization, detection of outbreaks and prediction of vaccine coverage.
• To further develop the integration of laboratory data into surveillance data, close collaboration between networks of epidemiologists and microbiologists is needed.
SURVEILLANCE REPORT Surveillance of invasive bacterial diseases in Europe 2008/2009
51
References 1. Ulanova M, Tsang RS. Invasive Haemophilus influenzae disease: changing epidemiology and host-parasite interactions in
the 21st century. Infect Genet Evol. 2009 Jul;9(4):594-605. Epub 2009 Mar 18.
2. European Centre for Disease Prevention and Control. Surveillance of invasive bacterial diseases in Europe 2007. Stockholm: ECDC; 2007.
3. Peltola H. Worldwide Haemophilus influenzae type b disease at the beginning of the 21st century: global analysis of the disease burden 25 years after the use of the polysaccharide vaccine and a decade after the advent of conjugates. Clin Microbiol Rev. 2000 Apr;13(2):302-17.
4. World Health Organization. WHO position paper on Haemophilus influenzae type b conjugate vaccines. (Replaces WHO position paper on Hib vaccines previously published in the Weekly Epidemiological Record. Wkly Epidemiol Rec. 2006 Nov 24;81(47):445-52.
5. Jansson A, Arneborn M, Ekdahl K. Sensitivity of the Swedish statutory surveillance system for communicable diseases 1998-2002, assessed by the capture-recapture method. Epidemiol Infect. 2005 Jun;133(3):401-7.
6. Adam HJ, Richardson SE, Jamieson FB, Rawte P, Low DE, Fisman DN. Changing epidemiology of invasive Haemophilus influenzae in Ontario, Canada: evidence for herd effects and strain replacement due to Hib vaccination. Vaccine. May 28;28(24):4073-8.
7. Ladhani S, Ramsay ME, Chandra M, Slack MP. No evidence for Haemophilus influenzae serotype replacement in Europe after introduction of the Hib conjugate vaccine. Lancet Infect Dis. 2008 May;8(5):275-6.
8. Aracil B, Slack M, Perez-Vazquez M, Roman F, Ramsay M, Campos J. Molecular epidemiology of Haemophilus influenzae type b causing vaccine failures in the United Kingdom. J Clin Microbiol. 2006 May;44(5):1645-9.
9. Harisson LH, Trotter CL, Ramsay ME. Global epidemiology of meningococcal disease. Vaccine. 2009:275 B51-B63.
10. Roberts J, Chandra M, Pebody R, Stuart J. Variation in incidence of pneumococcal and meningococcal disease across Europe. Euro Surveill. 2007 Nov;12(11):E071115 5.
11. EU-IBIS Network. Invasive Neisseria meningitidis in Europe 2006. London: Health Protection Agency2006.
12. Campbell H, Andrews N, Borrow R, Trotter C, Miller E. Updated postlicensure surveillance of the meningococcal C conjugate vaccine in England and Wales: effectiveness, validation of serological correlates of protection, and modeling predictions of the duration of herd immunity. Clin Vaccine Immunol. 2010 March 10;17(5): 840–847. .
13. Trotter CL, Chandra M, Cano R, Larrauri A, Ramsay ME, Brehony C, et al. A surveillance network for meningococcal disease in Europe. FEMS Microbiol Rev 2006 31 Jan 2007;31(1):27-36.
14. Trotter CL, Andrews NJ, Kaczmarski EB, Miller E, Ramsay ME. Effectiveness of meningococcal serogroup C conjugate vaccine 4 years after introduction. Lancet. 2004 24-30 Jul 2004 364(9431):365-7.
15. Trotter CL, Ramsay ME. Vaccination against meningococcal disease in Europe: review and recommendations for the use of conjugate vaccines. FEMS Microbiology Reviews. 2006 31 Jan 2007;31(1):101-7.
16. Jolley KA, Kalmusova J, Feil EJ, Gupta S, Musilek M, Kriz P, et al. Carried meningococci in the Czech Republic: a diverse recombining population. Journal of Clinical Microbiology. 2000 Dec 2008;38(12):4492-8.
17. Thompson EA, Feavers IM, Maiden MC. Antigenic diversity of meningococcal enterobactin receptor FetA, a vaccine component. Microbiology. 2003 Jul 2003 149(Pt 7):1849-58.
18. Russell JE, Jolley KA, Feavers IM, Maiden MC, Suker J. PorA variable regions of Neisseria meningitidis. Emerg Infect Dis. 2004 Apr 2004 10(4):674-8.
19. Tan LK, Carlone GM, Borrow R. Advances in the development of vaccines against Neisseria meningitidis The New England Journal of Medicine 2010 Apr 2010;362(16):1511-20.
20. Vogel U. Molecular epidemiology of meningococci: application of DNA sequence typing. Int J Med Microbiol. 2010 Nov;300(7):415-20.
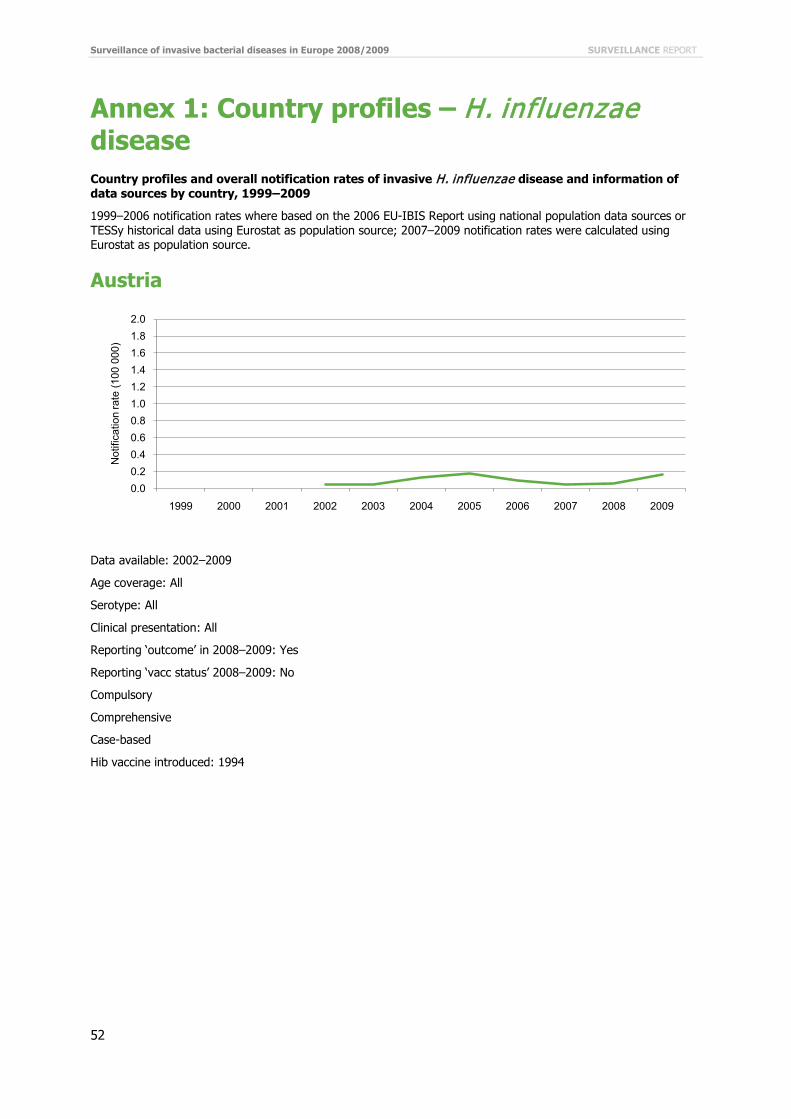
Surveillance of invasive bacterial diseases in Europe 2008/2009 SURVEILLANCE REPORT
52
Annex 1: Country profiles – H. influenzae disease Country profiles and overall notification rates of invasive H. influenzae disease and information of data sources by country, 1999–2009
1999–2006 notification rates where based on the 2006 EU-IBIS Report using national population data sources or TESSy historical data using Eurostat as population source; 2007–2009 notification rates were calculated using Eurostat as population source.
Austria
Data available: 2002–2009
Age coverage: All
Serotype: All
Clinical presentation: All
Reporting ‘outcome’ in 2008–2009: Yes
Reporting ‘vacc status’ 2008–2009: No
Compulsory
Comprehensive
Case-based
Hib vaccine introduced: 1994
0.00.20.40.60.81.01.21.41.61.82.0
1999 2000 2001 2002 2003 2004 2005 2006 2007 2008 2009
Not
ifica
tion
rate
(100
000
)

SURVEILLANCE REPORT Surveillance of invasive bacterial diseases in Europe 2008/2009
53
Belgium
Data available: 2002–2009
Age coverage: All
Serotype: Not determined
Clinical presentation: All: 2000–2004; not determined: 2007–2009
Reporting ‘outcome’ in 2008–2009: No
Reporting ‘vacc status’ 2008–2009: No
Voluntary
Sentinel
Case-based
Hib vaccine introduced: 1993
Comments: No reporting 2005-2006
0.00.20.40.60.81.01.21.41.61.82.0
1999 2000 2001 2002 2003 2004 2005 2006 2007 2008 2009
Not
ifica
tion
rate
(100
000
)
Year

Surveillance of invasive bacterial diseases in Europe 2008/2009 SURVEILLANCE REPORT
54
Bulgaria
Data available: 2007–2009
Age coverage: All
Serotype: Not determined
Clinical presentation: Not determined
Reporting ‘outcome’ in 2008–2009: No
Reporting ‘vacc status’ 2008–2009: No
Aggregated
Hib vaccine introduced: No
Comments: Aggregated reporting in 2007–2009, which only enabled reporting a common set of variables. Information on gender available since 2008.
0.0
0.2
0.4
0.6
0.8
1.0
1.2
1.4
1.6
1.8
2.0
1999 2000 2001 2002 2003 2004 2005 2006 2007 2008 2009
Not
ifica
tion
rate
(100
000
)

SURVEILLANCE REPORT Surveillance of invasive bacterial diseases in Europe 2008/2009
55
Cyprus
Data available: 2007–2009
Age coverage: All
Serotype: Unknown
Clinical presentation: Unknown
Reporting ‘outcome’ in 2008–2009: Yes
Reporting ‘vacc status’ 2008–2009: Unknown
Compulsory
Comprehensive
Case-based
Hib vaccine introduced: 2001.
0.0
0.2
0.4
0.6
0.8
1.0
1.2
1.4
1.6
1.8
2.0
1999 2000 2001 2002 2003 2004 2005 2006 2007 2008 2009
Not
ifica
tion
rate
(100
000
)

Surveillance of invasive bacterial diseases in Europe 2008/2009 SURVEILLANCE REPORT
56
Czech Republic
Data available: 1999–2009
Age coverage: All
Serotype: b 1999–2004; all 2005–2009
Clinical presentation: All
Reporting ‘outcome’ in 2008–2009: Yes
Reporting ‘vacc status’ 2008–2009: Yes
Compulsory
Comprehensive
Case-based
Hib vaccine introduced: 2001
Comments: Sharp decrease in notification rates over 2001–2004 attributed mainly to the introduction of the Hib vaccine in 2001. Since 2005, all strains are typed and reported, which may explain the stabilisation in the overall notification rates.
0.0
0.2
0.4
0.6
0.8
1.0
1.2
1.4
1.6
1.8
2.0
1999 2000 2001 2002 2003 2004 2005 2006 2007 2008 2009
Not
ifica
tion
rate
(100
000
)

SURVEILLANCE REPORT Surveillance of invasive bacterial diseases in Europe 2008/2009
57
Denmark
Data available: 1999–2009
Age coverage: All
Serotype: All
Clinical presentation: Meningitis only 1999–2006, All 2007–2009
Reporting ‘outcome’ in 2008–2009: Yes
Reporting ‘vacc status’ 2008–2009: Yes
Compulsory
Comprehensive
Case-based
Hib vaccine introduced: 1993
Comments: Increases in overall notification rates from 2006–2008 attributable to the inclusion of more clinical presentation, such as bacteraemia and septicaemia. During 2003–2006, four cases per year, all classified as meningitis, were reported. In 2007, two out of 15 cases were reported as meningitis, in 2008, six cases out of 32, and in 2009, five (three meningitis and two meningitis-sepsis) out of 31.
Reporting of invasive isolates of H. influenzae type b have been mandatory since October 2007, thus an expected increase in notification rates the following year. However, since non-type b and non-capsulated are not mandatory, the serotype distribution is also expected to be skewed (source: SSI/DK).
0.0
0.2
0.4
0.6
0.8
1.0
1.2
1.4
1.6
1.8
2.0
1999 2000 2001 2002 2003 2004 2005 2006 2007 2008 2009
Not
ifica
tion
rate
(100
000
)

Surveillance of invasive bacterial diseases in Europe 2008/2009 SURVEILLANCE REPORT
58
Estonia
Data available: 1999–2009
Age coverage: All
Serotype: b
Clinical presentation: Septicaemia: 1999–2003; All: 2004–2009
Reporting ‘outcome’ in 2008–2009: Yes
Reporting ‘vacc status’ 2008–2009: Yes
Compulsory
Comprehensive
Case-based
Hib vaccine introduced: 2005
Comments: The increase is partially explained by improved case ascertainment and by inclusion of all clinical presentation. The decrease after 2005 is possibly explained by the Hib vaccine introduction the same year (source: NSCP/EE).
Rates 1999–2006 recalculated from EU-IBIS 2006 Report using total population as denominator (Eurostat).
0.0
0.2
0.4
0.6
0.8
1.0
1.2
1.4
1.6
1.8
2.0
1999 2000 2001 2002 2003 2004 2005 2006 2007 2008 2009
Not
ifica
tion
rate
(100
000
)

SURVEILLANCE REPORT Surveillance of invasive bacterial diseases in Europe 2008/2009
59
Finland
Data available: 1999–2009
Age coverage: All
Serotype: All
Clinical presentation: All
Reporting ‘outcome’ in 2008–2009: Yes
Reporting ‘vacc status’ 2008–2009: Yes
Compulsory
Comprehensive
Case-based
Hib vaccine introduced: 1986
Comments: Consistent reporting/stable surveillance system 1999–2009, with coverage of strains typed very high since 1995 (Source: THL/FI).
0.0
0.2
0.4
0.6
0.8
1.0
1.2
1.4
1.6
1.8
2.0
1999 2000 2001 2002 2003 2004 2005 2006 2007 2008 2009
Not
ifica
tion
rate
(100
000
)

Surveillance of invasive bacterial diseases in Europe 2008/2009 SURVEILLANCE REPORT
60
France
Data available: 1999–2008
Age coverage: All
Serotype: All: 1999–2006, not determined in 2007–2008
Clinical presentation: All: 1999–2006, not determined in 2007–2008
Reporting ‘outcome’ in 2008: No
Reporting ‘vacc status’ 2008: No
Voluntary
Sentinel
Case-based
Hib vaccine introduced: 1992
Comments: In 2007 aggregated data corrected for underreporting and undercoverage were reported. In 2008 case-based data were reported along with the correction factor for undernotification and undercoverage. No data available for 2009.
0.0
0.2
0.4
0.6
0.8
1.0
1.2
1.4
1.6
1.8
2.0
1999 2000 2001 2002 2003 2004 2005 2006 2007 2008 2009
Not
ifica
tion
rate
(100
000
)
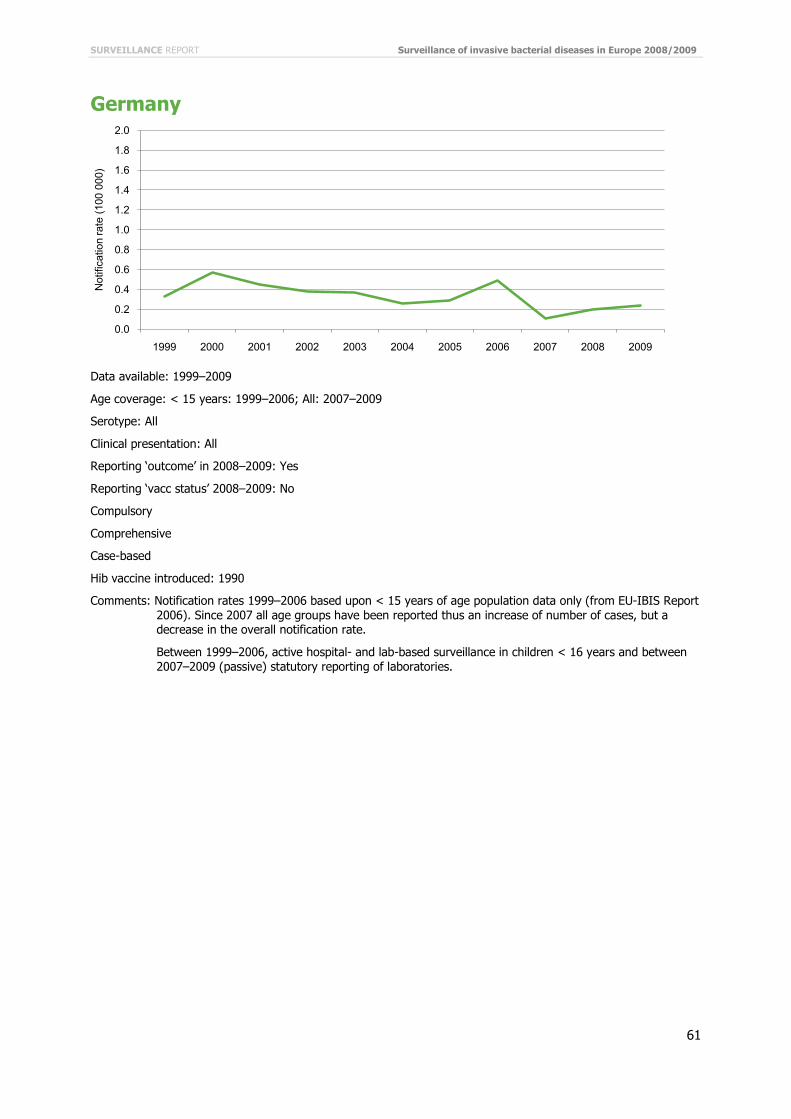
SURVEILLANCE REPORT Surveillance of invasive bacterial diseases in Europe 2008/2009
61
Germany
Data available: 1999–2009
Age coverage: < 15 years: 1999–2006; All: 2007–2009
Serotype: All
Clinical presentation: All
Reporting ‘outcome’ in 2008–2009: Yes
Reporting ‘vacc status’ 2008–2009: No
Compulsory
Comprehensive
Case-based
Hib vaccine introduced: 1990
Comments: Notification rates 1999–2006 based upon < 15 years of age population data only (from EU-IBIS Report 2006). Since 2007 all age groups have been reported thus an increase of number of cases, but a decrease in the overall notification rate.
Between 1999–2006, active hospital- and lab-based surveillance in children < 16 years and between 2007–2009 (passive) statutory reporting of laboratories.
0.0
0.2
0.4
0.6
0.8
1.0
1.2
1.4
1.6
1.8
2.0
1999 2000 2001 2002 2003 2004 2005 2006 2007 2008 2009
Not
ifica
tion
rate
(100
000
)

Surveillance of invasive bacterial diseases in Europe 2008/2009 SURVEILLANCE REPORT
62
Greece
Data available: 1999–2009
Age coverage: < 15 years
Serotype: All (mainly b & non-b)
Clinical presentation: meningitis and meningitis/septicaemia only
Reporting ‘outcome’ in 2008–2009: Yes
Reporting ‘vacc status’ 2008–2009: No
Compulsory
Comprehensive
Case-based
Hib vaccine introduced: 1999
Comments: Notification rates 1999–2006 based upon < 15 years of age population data only (from EU-IBIS Report 2006). Since 2007, all age groups have been reported, thus an increase of number of cases, but a decrease in the overall notification rate.
0.0
0.2
0.4
0.6
0.8
1.0
1.2
1.4
1.6
1.8
2.0
1999 2000 2001 2002 2003 2004 2005 2006 2007 2008 2009
Not
ifica
tion
rate
(100
000
)

SURVEILLANCE REPORT Surveillance of invasive bacterial diseases in Europe 2008/2009
63
Hungary
Data available: 2003–2009
Age coverage: All
Serotype: All
Clinical presentation: Meningitis and septicaemia only
Reporting ‘outcome’ in 2008–2009: Yes
Reporting ‘vacc status’ 2008–2009: Yes
Compulsory
Comprehensive
Case-based
Hib vaccine introduced: 1999
0.0
0.2
0.4
0.6
0.8
1.0
1.2
1.4
1.6
1.8
2.0
1999 2000 2001 2002 2003 2004 2005 2006 2007 2008 2009
Not
ifica
tion
rate
(100
000
)
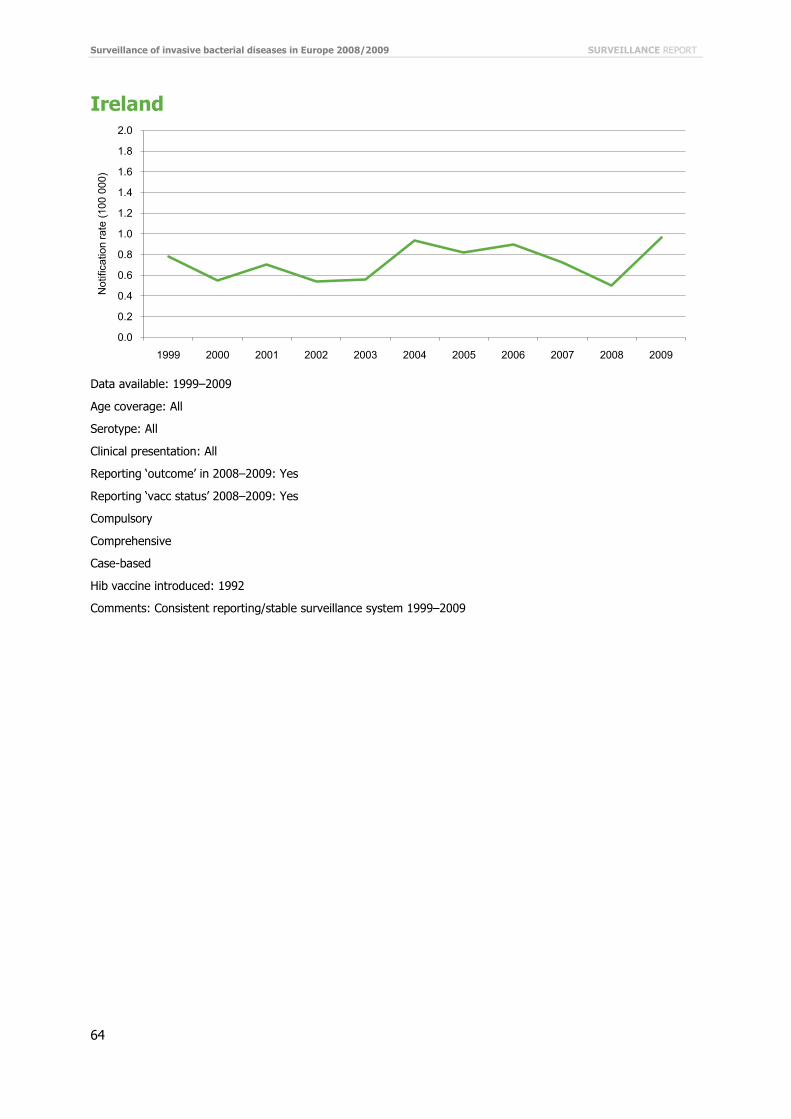
Surveillance of invasive bacterial diseases in Europe 2008/2009 SURVEILLANCE REPORT
64
Ireland
Data available: 1999–2009
Age coverage: All
Serotype: All
Clinical presentation: All
Reporting ‘outcome’ in 2008–2009: Yes
Reporting ‘vacc status’ 2008–2009: Yes
Compulsory
Comprehensive
Case-based
Hib vaccine introduced: 1992
Comments: Consistent reporting/stable surveillance system 1999–2009
0.0
0.2
0.4
0.6
0.8
1.0
1.2
1.4
1.6
1.8
2.0
1999 2000 2001 2002 2003 2004 2005 2006 2007 2008 2009
Not
ifica
tion
rate
(100
000
)

SURVEILLANCE REPORT Surveillance of invasive bacterial diseases in Europe 2008/2009
65
Italy
Data available: 1999–2009
Age coverage: All
Serotype: All
Clinical presentation: All
Reporting ‘outcome’ in 2008–2009: Yes
Reporting ‘vacc status’ 2008–2009: No
Compulsory
Comprehensive
Case-based
Hib vaccine introduced: 1995 (1999 in routine schedule)
Comments: Consistent reporting/stable surveillance system 1999–2009.
0.0
0.2
0.4
0.6
0.8
1.0
1.2
1.4
1.6
1.8
2.0
1999 2000 2001 2002 2003 2004 2005 2006 2007 2008 2009
Not
ifica
tion
rate
(100
000
)

Surveillance of invasive bacterial diseases in Europe 2008/2009 SURVEILLANCE REPORT
66
Latvia
Data available: 2003–2009
Age coverage: All
Serotype: All
Clinical presentation: All
Reporting ‘outcome’ in 2008–2009: Yes
Reporting ‘vacc status’ 2008–2009:Yes
Compulsory
Comprehensive
Case-based
Hib vaccine introduced: 1994
0.0
0.2
0.4
0.6
0.8
1.0
1.2
1.4
1.6
1.8
2.0
1999 2000 2001 2002 2003 2004 2005 2006 2007 2008 2009
Not
ifica
tion
rate
(100
000
)

SURVEILLANCE REPORT Surveillance of invasive bacterial diseases in Europe 2008/2009
67
Lithuania
Data available: 2003–2009
Age coverage: All
Serotype: b
Clinical presentation: Meningitis and septicaemia only
Reporting ‘outcome’ in 2008–2009: Yes
Reporting ‘vacc status’ 2008–2009: Yes
Compulsory
Comprehensive
Case-based
Hib vaccine introduced: 2004
0.0
0.2
0.4
0.6
0.8
1.0
1.2
1.4
1.6
1.8
2.0
1999 2000 2001 2002 2003 2004 2005 2006 2007 2008 2009
Not
ifica
tion
rate
(100
000
)

Surveillance of invasive bacterial diseases in Europe 2008/2009 SURVEILLANCE REPORT
68
Luxembourg
Data available: 2007–2009
Age coverage: All
Serotype: Not determined
Clinical presentation: Meningitis
Reporting ‘outcome’ in 2008–2009: Yes
Reporting ‘vacc status’ 2008–2009: No
Compulsory
Comprehensive
Case-based
0.0
0.2
0.4
0.6
0.8
1.0
1.2
1.4
1.6
1.8
2.0
1999 2000 2001 2002 2003 2004 2005 2006 2007 2008 2009
Not
ifica
tion
rate
(100
000
)
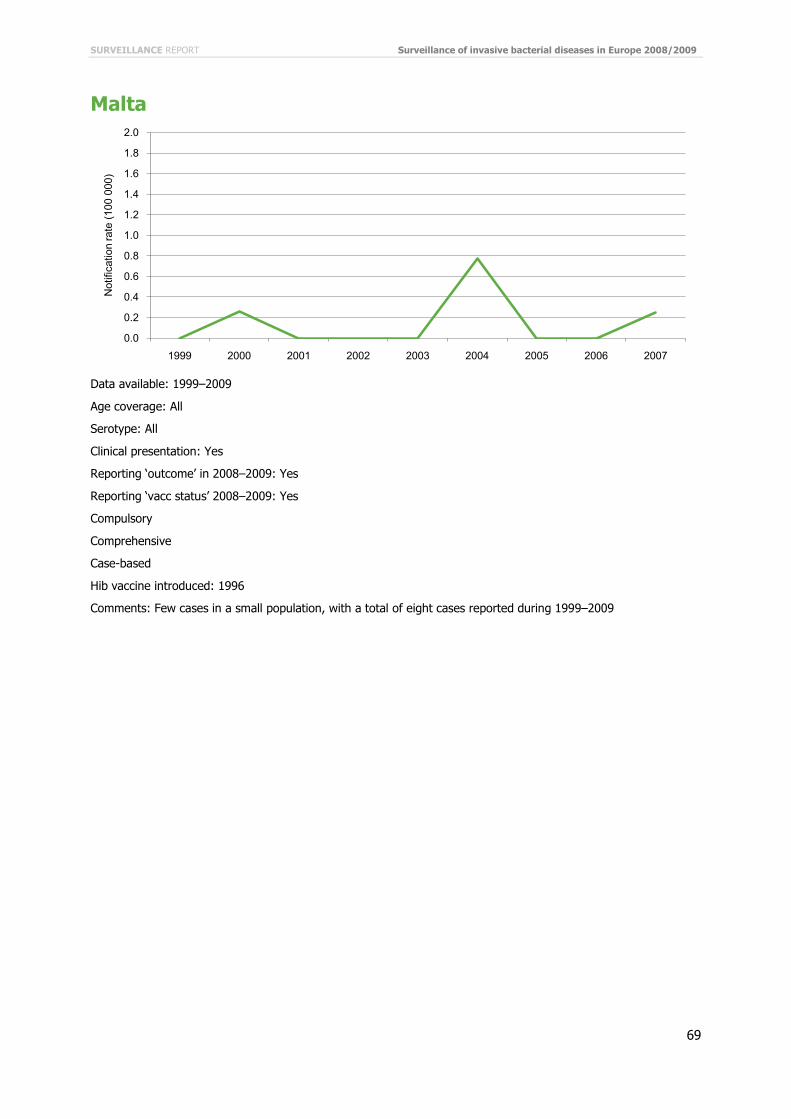
SURVEILLANCE REPORT Surveillance of invasive bacterial diseases in Europe 2008/2009
69
Malta
Data available: 1999–2009
Age coverage: All
Serotype: All
Clinical presentation: Yes
Reporting ‘outcome’ in 2008–2009: Yes
Reporting ‘vacc status’ 2008–2009: Yes
Compulsory
Comprehensive
Case-based
Hib vaccine introduced: 1996
Comments: Few cases in a small population, with a total of eight cases reported during 1999–2009
0.0
0.2
0.4
0.6
0.8
1.0
1.2
1.4
1.6
1.8
2.0
1999 2000 2001 2002 2003 2004 2005 2006 2007
Not
ifica
tion
rate
(100
000
)

Surveillance of invasive bacterial diseases in Europe 2008/2009 SURVEILLANCE REPORT
70
Netherlands
Data available: 1999–2006
Age coverage: All
Serotype: All
Clinical presentation: All
Reporting ‘outcome’ in 2008–2009: zero reporting
Reporting ‘vacc status’ 2008–2009: zero reporting
Compulsory
Comprehensive
Case-based
Hib vaccine introduced: 1993
Comments: Consistent reporting until 2006. No available data in 2007 due to larger changes (upgrading) in the national surveillance system. In 2008–2009, zero reporting.
0.0
0.2
0.4
0.6
0.8
1.0
1.2
1.4
1.6
1.8
2.0
1999 2000 2001 2002 2003 2004 2005 2006 2007 2008 2009
Not
ifica
tion
rate
(100
000
)

SURVEILLANCE REPORT Surveillance of invasive bacterial diseases in Europe 2008/2009
71
Poland
Data available: 1999–2009
Age coverage: All
Serotype: Mainly b 1999–2003, all 2004–2009
Clinical presentation: Meningitis: 1999–2006; All: 2007–2009
Reporting ‘outcome’ in 2008–2009: Yes
Reporting ‘vacc status’ 2008–2009: Yes
Compulsory
Comprehensive
Case-based
Hib vaccine introduced: 2005
0.0
0.2
0.4
0.6
0.8
1.0
1.2
1.4
1.6
1.8
2.0
1999 2000 2001 2002 2003 2004 2005 2006 2007 2008 2009
Not
ifica
tion
rate
(100
000
)

Surveillance of invasive bacterial diseases in Europe 2008/2009 SURVEILLANCE REPORT
72
Portugal
Data available: 1999–2009
Age coverage: All
Serotype: All
Clinical presentation: All
Reporting ‘outcome’ in 2008–2009: Yes
Reporting ‘vacc status’ 2008–2009: Yes
Compulsory
Comprehensive
Case-based
Hib vaccine introduced: 2000
Comments: Consistent reporting/stable surveillance system 1999–2009.
0.0
0.2
0.4
0.6
0.8
1.0
1.2
1.4
1.6
1.8
2.0
1999 2000 2001 2002 2003 2004 2005 2006 2007 2008 2009
Not
ifica
tion
rate
(100
000
)

SURVEILLANCE REPORT Surveillance of invasive bacterial diseases in Europe 2008/2009
73
Romania
Data available: 2008–2009
Age coverage: All
Serotype: All
Clinical presentation: All
Reporting ‘outcome’ in 2008–2009: Yes
Reporting ‘vacc status’ 2008–2009: Yes
Hib vaccine introduced: No
Comments: H. influenzae disease surveillance started in 2008.
0.0
0.2
0.4
0.6
0.8
1.0
1.2
1.4
1.6
1.8
2.0
1999 2000 2001 2002 2003 2004 2005 2006 2007 2008 2009
Not
ifica
tion
rate
(100
000
)

Surveillance of invasive bacterial diseases in Europe 2008/2009 SURVEILLANCE REPORT
74
Slovakia
Data available: 1999–2009
Age coverage: All
Serotype: Not determined: 1999–2006, all: 2007–2009
Clinical presentation: All
Reporting ‘outcome’ in 2008–2009: Yes
Reporting ‘vacc status’ 2008–2009: Yes
Compulsory
Comprehensive
Case-based
Hib vaccine introduced: 2000
0.0
0.2
0.4
0.6
0.8
1.0
1.2
1.4
1.6
1.8
2.0
1999 2000 2001 2002 2003 2004 2005 2006 2007 2008 2009
Not
ifica
tion
rate
(100
000
)
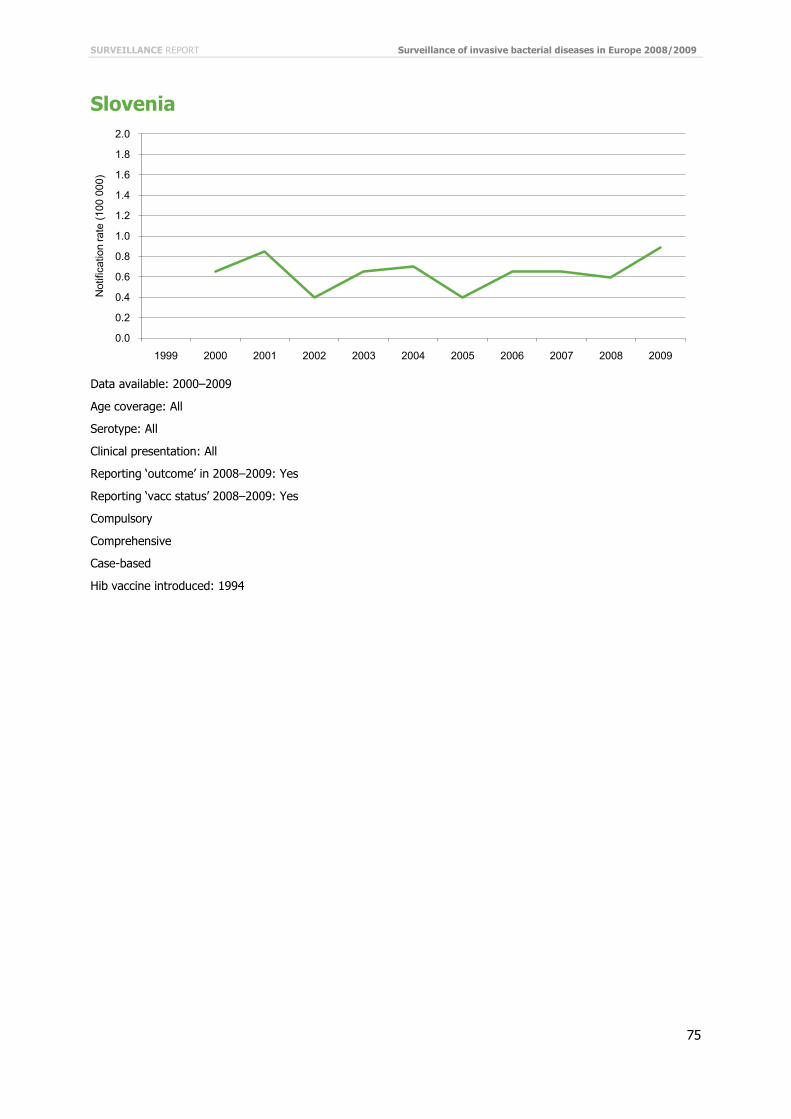
SURVEILLANCE REPORT Surveillance of invasive bacterial diseases in Europe 2008/2009
75
Slovenia
Data available: 2000–2009
Age coverage: All
Serotype: All
Clinical presentation: All
Reporting ‘outcome’ in 2008–2009: Yes
Reporting ‘vacc status’ 2008–2009: Yes
Compulsory
Comprehensive
Case-based
Hib vaccine introduced: 1994
0.0
0.2
0.4
0.6
0.8
1.0
1.2
1.4
1.6
1.8
2.0
1999 2000 2001 2002 2003 2004 2005 2006 2007 2008 2009
Not
ifica
tion
rate
(100
000
)

Surveillance of invasive bacterial diseases in Europe 2008/2009 SURVEILLANCE REPORT
76
Spain
Data available: 2007–2009
Age coverage: All
Serotype: All
Clinical presentation: All
Reporting ‘outcome’ in 2008–2009: No
Reporting ‘vacc status’ 2008–2009: No
Voluntary
Sentinel/Regional
Case-based
Hib vaccine introduced: 1998
0.0
0.2
0.4
0.6
0.8
1.0
1.2
1.4
1.6
1.8
2.0
1999 2000 2001 2002 2003 2004 2005 2006 2007 2008 2009
Not
ifica
tion
rate
(100
000
)

SURVEILLANCE REPORT Surveillance of invasive bacterial diseases in Europe 2008/2009
77
Sweden
Data available: 1999–2009
Age coverage: All
Serotype: b: 1999–2004, All: 2005–2009
Clinical presentation: All: 1999–2006; Not determined: 2007–2009
Reporting ‘outcome’ in 2008–2009: No
Reporting ‘vacc status’ 2008–2009: Yes
Compulsory
Comprehensive
Case-based
Hib vaccine introduced: 1993
Comments: Only Hib was notifiable until July 2004 when a new Communicable Disease Act came into place and all strains became mandatorily notifiable.
Since 2006, an enhanced surveillance collecting all invasive isolates is ongoing. Since 2007, a questionnaire on clinical information of invasive bacterial infections is sent to physicians, this may have increased the awareness and thus the sensitivity of the surveillance.
0.0
0.2
0.4
0.6
0.8
1.0
1.2
1.4
1.6
1.8
2.0
1999 2000 2001 2002 2003 2004 2005 2006 2007 2008 2009
Not
ifica
tion
rate
(100
000
)

Surveillance of invasive bacterial diseases in Europe 2008/2009 SURVEILLANCE REPORT
78
United Kingdom
Data available: 1999–2009
Age coverage: All
Serotype: All
Clinical presentation: All
Reporting ‘outcome’ in 2008–2009: Yes
Reporting ‘vacc status’ 2008–2009: Yes
Compulsory
Comprehensive
Case-based
Hib vaccine introduced: 1992
Comments: Consistent reporting/stable surveillance system 1999–2009. Booster introduced into the vaccination programme in September 2006, and a catch-up campaign organised September 2007–March 2009.
0.0
0.2
0.4
0.6
0.8
1.0
1.2
1.4
1.6
1.8
2.0
1999 2000 2001 2002 2003 2004 2005 2006 2007 2008 2009
Not
ifica
tion
rate
(100
000
)
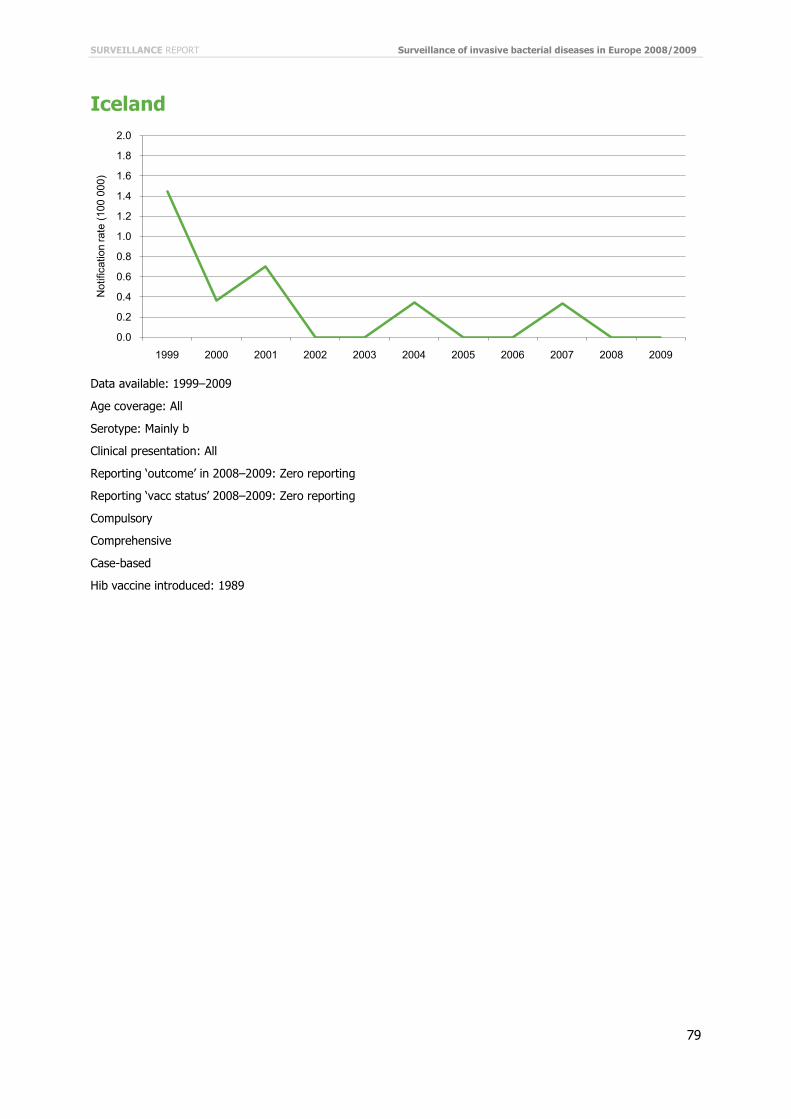
SURVEILLANCE REPORT Surveillance of invasive bacterial diseases in Europe 2008/2009
79
Iceland
Data available: 1999–2009
Age coverage: All
Serotype: Mainly b
Clinical presentation: All
Reporting ‘outcome’ in 2008–2009: Zero reporting
Reporting ‘vacc status’ 2008–2009: Zero reporting
Compulsory
Comprehensive
Case-based
Hib vaccine introduced: 1989
0.0
0.2
0.4
0.6
0.8
1.0
1.2
1.4
1.6
1.8
2.0
1999 2000 2001 2002 2003 2004 2005 2006 2007 2008 2009
Not
ifica
tion
rate
(100
000
)

Surveillance of invasive bacterial diseases in Europe 2008/2009 SURVEILLANCE REPORT
80
Norway
Data available: 1999–2009
Age coverage: All
Serotype: All
Clinical presentation: All
Reporting ‘outcome’ in 2008–2009: Yes
Reporting ‘vacc status’ 2008–2009: Yes
Compulsory
Comprehensive
Case-based
Hib vaccine introduced: 1992
Comments: Consistent reporting/stable surveillance system 1999–2009.
Highest overall notification rate in Europe. The majority of the cases are hospitalised cases based upon positive culture from blood or CSF.
Strengthening of reference laboratory in recent years, but inclusion of results into MSIS surveillance not done systematically, which may have influenced the serotype data (completeness and/or skewed distribution).
0.0
0.2
0.4
0.6
0.8
1.0
1.2
1.4
1.6
1.8
2.0
1999 2000 2001 2002 2003 2004 2005 2006 2007 2008 2009
Not
ifica
tion
rate
(100
000
)

SURVEILLANCE REPORT Surveillance of invasive bacterial diseases in Europe 2008/2009
81
Annex 2: Invasive H. influenzae disease Methods Table A1 Invasive H. influenzae disease EU case definitions, 2002 and 2008
EU case definition confirmed 2002 (Decision 2002/253/EC)
Confirmed case
A clinically compatible case diagnosed by one of the following laboratory criteria:
• Isolation of H. influenzae serotype b from a normally sterile site
• Detection of H. influenzae nucleic acid from a normally sterile site
Probable case
A clinically compatible case diagnosed by the following laboratory criteria:
• Detection of H influenzae antigen from normally sterile site.
Possible case
A case with clinical epiglottitis without any laboratory confirmation or with identification only from non-sterile site
EU case definition confirmed 2008 (EC Decision of 28/IV/2008)
Clinical Criteria
Not relevant for surveillance purposes
Laboratory Criteria
Laboratory criteria for case definition
At least one of the following two:
• Isolation of H. influenzae from a normally sterile site
• Detection of H. influenzae nucleic acid from a normally sterile site
Typing of the isolates should be performed, if possible
Epidemiological link: NA
Case Classification
• Possible case: NA
• Probable case: NA
• Confirmed case: Any person meeting the laboratory criteria for case confirmation

Surveillance of invasive bacterial diseases in Europe 2008/2009 SURVEILLANCE REPORT
82
Data source table Table A2 Overview of the sources of data used for H. influenzae disease report, 2008–2009
Country Data source*
Com
puls
ory
(Cp)
/ V
olu
nta
ry (
V)
Com
preh
ensi
ve (
Co)
/ S
enti
nel (
Se)
Act
ive(
A)/
P
assi
ve(P
)
Cas
e-ba
sed
(CB
)/
Agg
rega
ted
(A)
Data reported by
Labo
rato
ries
Ph
ysic
ians
Hos
pita
ls
Oth
ers
Austria AT-Epidemiegesetz Cp Co P C Y Y Y Y
Belgium BE-LABNET V Se A C Y N U U
Bulgaria BG-NATIONAL_SURVEILLANCE Cp Co P A Y Y Y Y
Cyprus CY-NOTIFIED_DISEASES Cp Co P C N Y N N
Czech Republic CZ-EPIDAT Cp Co A C Y Y Y N
Denmark DK-MIS Cp Co P C N Y N N
Estonia EE-HIB Cp Co P C Y Y Y Y
Finland FI-NIDR Cp Co P C Y N N N
France FR-EPIBAC V Se A C Y N Y N
Germany [email protected] Cp Co P C Y N N Y
Greece GR-NOTIFIABLE_DISEASES Cp Co P C Y Y Y N
Hungary HU-EFRIR Cp Co P C Y Y Y N
Iceland IS-SUBJECT_TO_REGISTRATION Cp Co P C Y Y Y N
Ireland IE-CIDR Cp Co P C Y Y Y N
Italy IT-MENINGITIS Cp Co P C N Y Y Y
Latvia LV-BSN Cp Co P C Y Y Y N
Liechtenstein - - - - - - - - -
Lithuania LT-COMMUNICABLE_DISEASES Cp Co P C Y Y N N
Luxembourg LU-SYSTEM1 Cp Co P C U Y N N
Malta MT-DISEASE_SURVEILLANCE Cp Co P C Y Y Y Y
Netherlands NL-OSIRIS Cp Co P C Y Y N N
Norway NO-MSIS_A Cp Co P C Y Y Y N
Poland PL-NATIONAL_SURVEILLANCE Cp Co P C Y Y N N
Portugal PT-HAEMOPHILUS_INFLUENZAE Cp Co P C N Y N N
Romania RO-RNSSy Cp Co P C N N Y N
Slovakia SK-EPIS Cp Co A C Y Y Y N
Slovenia SI-SURVIVAL Cp Co P C Y Y Y N
Spain ES-MICROBIOLOGICAL V Se P C Y N N N
Sweden SE-SMINET Cp Co P C Y Y N N
United Kingdom
UK-HIB O Co P C Y N Y Y
Note: The clinically reported and laboratory reported cases are linked at national level. *Sources of data used in the report. Cp= Comprehensive, Se= Sentinel, V= Voluntary, O= Other, Y= Yes, N= No.
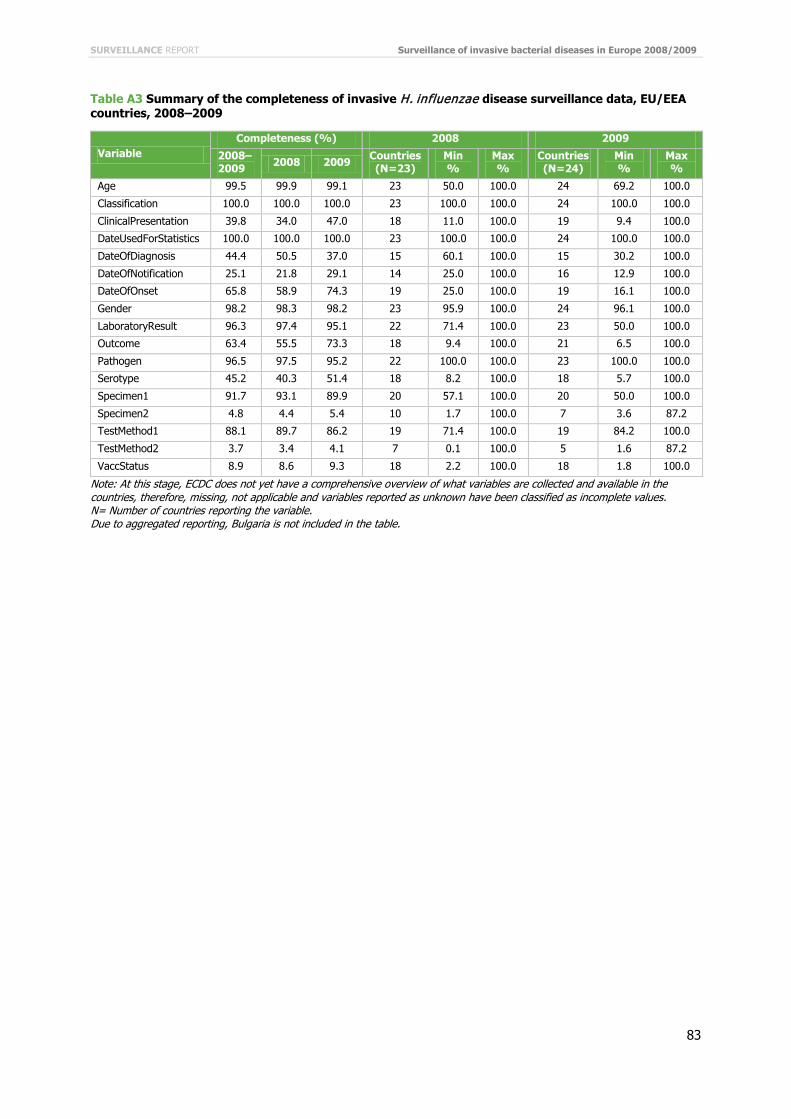
SURVEILLANCE REPORT Surveillance of invasive bacterial diseases in Europe 2008/2009
83
Table A3 Summary of the completeness of invasive H. influenzae disease surveillance data, EU/EEA countries, 2008–2009
Note: At this stage, ECDC does not yet have a comprehensive overview of what variables are collected and available in the countries, therefore, missing, not applicable and variables reported as unknown have been classified as incomplete values. N= Number of countries reporting the variable. Due to aggregated reporting, Bulgaria is not included in the table.
Variable Completeness (%) 2008 2009
2008–2009 2008 2009 Countries
(N=23) Min %
Max %
Countries (N=24)
Min %
Max %
Age 99.5 99.9 99.1 23 50.0 100.0 24 69.2 100.0
Classification 100.0 100.0 100.0 23 100.0 100.0 24 100.0 100.0
ClinicalPresentation 39.8 34.0 47.0 18 11.0 100.0 19 9.4 100.0
DateUsedForStatistics 100.0 100.0 100.0 23 100.0 100.0 24 100.0 100.0
DateOfDiagnosis 44.4 50.5 37.0 15 60.1 100.0 15 30.2 100.0
DateOfNotification 25.1 21.8 29.1 14 25.0 100.0 16 12.9 100.0
DateOfOnset 65.8 58.9 74.3 19 25.0 100.0 19 16.1 100.0
Gender 98.2 98.3 98.2 23 95.9 100.0 24 96.1 100.0
LaboratoryResult 96.3 97.4 95.1 22 71.4 100.0 23 50.0 100.0
Outcome 63.4 55.5 73.3 18 9.4 100.0 21 6.5 100.0
Pathogen 96.5 97.5 95.2 22 100.0 100.0 23 100.0 100.0
Serotype 45.2 40.3 51.4 18 8.2 100.0 18 5.7 100.0
Specimen1 91.7 93.1 89.9 20 57.1 100.0 20 50.0 100.0
Specimen2 4.8 4.4 5.4 10 1.7 100.0 7 3.6 87.2
TestMethod1 88.1 89.7 86.2 19 71.4 100.0 19 84.2 100.0
TestMethod2 3.7 3.4 4.1 7 0.1 100.0 5 1.6 87.2
VaccStatus 8.9 8.6 9.3 18 2.2 100.0 18 1.8 100.0

Surveillance of invasive bacterial diseases in Europe 2008/2009 SURVEILLANCE REPORT
84
Results Table A4 Number and proportion (%) of all reported test methods used among cases of invasive H. influenzae disease by country, 2008
Country Culture Nuclear
Acid Antigen Other Not Applicable Unknown Missing Total
n % n % n % n % n % n % n % n
Austria 1 20.0 4 80.0 0 0.0 0 0.0 0 0.0 0 0.0 0 0.0 5
Belgium 0 0.0 0 0.0 0 0.0 0 0.0 0 0.0 0 0.0 49 100 49
Bulgaria 0 0.0 0 0.0 0 0.0 0 0.0 0 0.0 0 0.0 14 100 14
Cyprus 0 0.0 0 0.0 0 0.0 0 0.0 0 0.0 0 0.0 0 0.0 0
Czech Republic 3 42.9 1 14.3 1 14.3 0 0.0 0 0.0 2 28.6 0 0.0 7
Denmark 32 100 0 0.0 0 0.0 0 0.0 0 0.0 0 0.0 0 0.0 32
Estonia 1 50.0 0 0.0 0 0.0 0 0.0 1 50.0 0 0.0 0 0.0 2
Finland 89 100 0 0.0 0 0.0 0 0.0 0 0.0 0 0.0 0 0.0 89
France 452 100 0 0.0 0 0.0 0 0.0 0 0.0 0 0.0 0 0.0 452
Germany 156 95.7 6 3.7 0 0.0 1 0.6 0 0.0 0 0.0 0 0.0 163
Greece 2 40.0 3 60.0 0 0.0 0 0.0 0 0.0 0 0.0 0 0.0 5
Hungary 6 100 0 0.0 0 0.0 0 0.0 0 0.0 0 0.0 0 0.0 6
Ireland 19 86.4 0 0.0 0 0.0 0 0.0 3 13.6 0 0.0 0 0.0 22
Italy 49 94.2 1 1.9 1 1.9 0 0.0 0 0.0 1 1.9 0 0.0 52
Latvia 1 50.0 0 0.0 0 0.0 0 0.0 0 0.0 1 50.0 0 0.0 2
Lithuania 0 0.0 0 0.0 0 0.0 0 0.0 0 0.0 3 100 0 0.0 3
Luxembourg 0 0.0 0 0.0 0 0.0 0 0.0 0 0.0 0 0.0 0 0.0 0
Malta 0 0.0 0 0.0 0 0.0 0 0.0 0 0.0 0 0.0 0 0.0 0
Netherlands 0 0.0 0 0.0 0 0.0 0 0.0 0 0.0 0 0.0 0 0.0 0
Poland 31 55.4 1 1.8 4 7.1 0 0.0 0 0.0 20 35.7 0 0.0 56
Portugal 0 0.0 0 0.0 0 0.0 0 0.0 0 0.0 5 100 0 0.0 5
Romania 3 100 0 0.0 0 0.0 0 0.0 0 0.0 0 0.0 0 0.0 3
Slovakia 4 100 0 0.0 0 0.0 0 0.0 0 0.0 0 0.0 0 0.0 4
Slovenia 12 33.3 12 33.3 12 33.3 0 0.0 0 0.0 0 0.0 0 0.0 36
Spain 73 100 0 0.0 0 0.0 0 0.0 0 0.0 0 0.0 0 0.0 73
Sweden 137 71.7 13 6.8 16 8.4 0 0.0 0 0.0 25 13.1 0 0.0 191
United Kingdom 660 77.3 0 0.0 0 0.0 0 0.0 0 0.0 194 22.7 0 0.0 854
EU total 1 731 81.5 41 1.9 34 1.6 1 0.0 4 0.2 251 11.8 63 3.0 2 125
Iceland 0 0.0 0 0.0 0 0.0 0 0.0 0 0.0 0 0.0 0 0.0 0
Liechtenstein - - - - - - - - - - - - - - -
Norway 75 100 0 0.0 0 0.0 0 0.0 0 0.0 0 0.0 0 0.0 75
Total 1 806 82.1 41 1.9 34 1.5 1 0.0 4 0.2 251 11.4 63 2.9 2 200
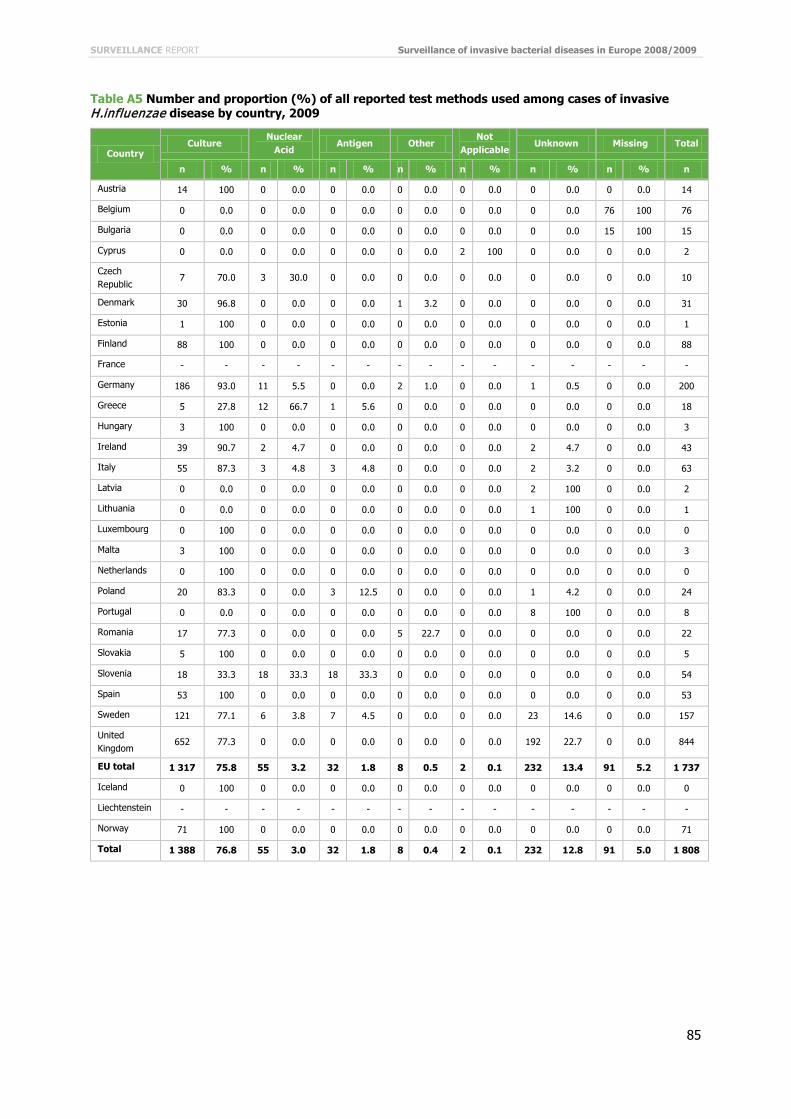
SURVEILLANCE REPORT Surveillance of invasive bacterial diseases in Europe 2008/2009
85
Table A5 Number and proportion (%) of all reported test methods used among cases of invasive H.influenzae disease by country, 2009
Country Culture
Nuclear Acid
Antigen Other Not
Applicable Unknown Missing Total
n % n % n % n % n % n % n % n
Austria 14 100 0 0.0 0 0.0 0 0.0 0 0.0 0 0.0 0 0.0 14
Belgium 0 0.0 0 0.0 0 0.0 0 0.0 0 0.0 0 0.0 76 100 76
Bulgaria 0 0.0 0 0.0 0 0.0 0 0.0 0 0.0 0 0.0 15 100 15
Cyprus 0 0.0 0 0.0 0 0.0 0 0.0 2 100 0 0.0 0 0.0 2
Czech Republic
7 70.0 3 30.0 0 0.0 0 0.0 0 0.0 0 0.0 0 0.0 10
Denmark 30 96.8 0 0.0 0 0.0 1 3.2 0 0.0 0 0.0 0 0.0 31
Estonia 1 100 0 0.0 0 0.0 0 0.0 0 0.0 0 0.0 0 0.0 1
Finland 88 100 0 0.0 0 0.0 0 0.0 0 0.0 0 0.0 0 0.0 88
France - - - - - - - - - - - - - - -
Germany 186 93.0 11 5.5 0 0.0 2 1.0 0 0.0 1 0.5 0 0.0 200
Greece 5 27.8 12 66.7 1 5.6 0 0.0 0 0.0 0 0.0 0 0.0 18
Hungary 3 100 0 0.0 0 0.0 0 0.0 0 0.0 0 0.0 0 0.0 3
Ireland 39 90.7 2 4.7 0 0.0 0 0.0 0 0.0 2 4.7 0 0.0 43
Italy 55 87.3 3 4.8 3 4.8 0 0.0 0 0.0 2 3.2 0 0.0 63
Latvia 0 0.0 0 0.0 0 0.0 0 0.0 0 0.0 2 100 0 0.0 2
Lithuania 0 0.0 0 0.0 0 0.0 0 0.0 0 0.0 1 100 0 0.0 1
Luxembourg 0 100 0 0.0 0 0.0 0 0.0 0 0.0 0 0.0 0 0.0 0
Malta 3 100 0 0.0 0 0.0 0 0.0 0 0.0 0 0.0 0 0.0 3
Netherlands 0 100 0 0.0 0 0.0 0 0.0 0 0.0 0 0.0 0 0.0 0
Poland 20 83.3 0 0.0 3 12.5 0 0.0 0 0.0 1 4.2 0 0.0 24
Portugal 0 0.0 0 0.0 0 0.0 0 0.0 0 0.0 8 100 0 0.0 8
Romania 17 77.3 0 0.0 0 0.0 5 22.7 0 0.0 0 0.0 0 0.0 22
Slovakia 5 100 0 0.0 0 0.0 0 0.0 0 0.0 0 0.0 0 0.0 5
Slovenia 18 33.3 18 33.3 18 33.3 0 0.0 0 0.0 0 0.0 0 0.0 54
Spain 53 100 0 0.0 0 0.0 0 0.0 0 0.0 0 0.0 0 0.0 53
Sweden 121 77.1 6 3.8 7 4.5 0 0.0 0 0.0 23 14.6 0 0.0 157
United Kingdom
652 77.3 0 0.0 0 0.0 0 0.0 0 0.0 192 22.7 0 0.0 844
EU total 1 317 75.8 55 3.2 32 1.8 8 0.5 2 0.1 232 13.4 91 5.2 1 737
Iceland 0 100 0 0.0 0 0.0 0 0.0 0 0.0 0 0.0 0 0.0 0
Liechtenstein - - - - - - - - - - - - - - -
Norway 71 100 0 0.0 0 0.0 0 0.0 0 0.0 0 0.0 0 0.0 71
Total 1 388 76.8 55 3.0 32 1.8 8 0.4 2 0.1 232 12.8 91 5.0 1 808

Surveillance of invasive bacterial diseases in Europe 2008/2009 SURVEILLANCE REPORT
86
Table A6 Number and notification rates (per 100 000 population) of confirmed and probable cases of invasive H. influenzae disease EU/EEA countries by country, 2008
Country Case definition Number of cases
Population Notification rate
Confirmed Probable Total Confirmed
Austria EU'08 5 0 5 8 318 592 0.06
Belgium Not determined 49 0 49 10 666 866 0.46
Bulgaria EU'02 14 0 14 7 640 238 0.18
Cyprus EU'08 0 0 0 789 269 0.00
Czech Republic EU'08 7 0 7 10 381 130 0.07
Denmark Other 32 0 32 5 475 791 0.58
Estonia EU'02 1 0 1 1 340 935 0.08
Finland EU'02 45 0 45 5 300 484 0.85
France EU'08 442 0 442 40 034 089 1.10
Germany Other 160 0 160 82 217 837 0.20
Greece Other 4 0 4 11 213 785 0.04
Hungary EU'08 6 0 6 10 045 401 0.06
Ireland EU'02 22 0 22 4 401 335 0.50
Italy EU'08 50 0 50 59 619 290 0.08
Latvia EU'08 1 0 1 2 270 894 0.04
Lithuania Not determined 3 1 4 3 366 357 0.09
Luxembourg none 0 0 0 483 799 0.00
Malta EU'08 0 0 0 410 290 0.00
Netherlands EU'08 0 0 0 16 405 399 0.00
Poland EU'02 28 3 31 38 115 641 0.07
Portugal EU'02 5 0 5 10 617 575 0.05
Romania EU'08 2 0 2 21 528 627 0.01
Slovakia EU'08 4 0 4 5 400 998 0.07
Slovenia EU'08 12 0 12 2 010 269 0.60
Spain* EU'08 73 0 73 45 283 259 0.16
Sweden EU'08 163 0 163 9 182 927 1.78
United Kingdom EU'02 773 0 773 61 179 256 1.26
EU total 1 901 4 1 905 497 649 125 0.38
Iceland EU'08 0 0 0 315 459 0.00
Liechtenstein Not determined - - - 35 356 -
Norway EU'08 75 0 75 4 737 171 1.58
Total 1 976 4 1 980 502 737 111 0.41
*Spain reported data from sentinel surveillance.

SURVEILLANCE REPORT Surveillance of invasive bacterial diseases in Europe 2008/2009
87
Table A7 Number and notification rates (per 100 000 population) of confirmed and probable cases of invasive H. influenzae disease EU/EEA countries by country, 2009
Country Case definition Number of cases
Population Notification rate
Confirmed Probable Total Confirmed
Austria EU'08 14 0 14 8 355 260 0.17
Belgium Not determined 76 0 76 10 750 000 0.71
Bulgaria EU'02 15 0 15 7 606 551 0.20
Cyprus EU'08 2 0 2 796 875 0.25
Czech Republic EU'08 10 0 10 10 467 542 0.10
Denmark Other 31 0 31 5 511 451 0.56
Estonia EU'02 1 0 1 1 340 415 0.08
Finland EU'02 47 0 47 5 326 314 0.88
France EU'08 - - - 64 350 759 -
Germany Other 196 0 196 82 002 356 0.24
Greece EU-2008 13 0 13 11 260 402 0.12
Hungary EU'08 3 0 3 10 030 975 0.03
Ireland EU'02 43 0 43 4 450 014 0.97
Italy EU'08 56 0 56 60 045 068 0.09
Latvia EU'08 1 0 1 2 261 294 0.04
Lithuania EU'08 1 1 2 3 349 872 0.03
Luxembourg Not determined 0 0 0 493 500 0.00
Malta EU'08 3 0 3 413 609 0.73
Netherlands EU'08 0 0 0 16 485 787 0.00
Poland EU'02 19 0 19 3 8135 876 0.05
Portugal EU'02 8 0 8 10 627 250 0.08
Romania EU'08 22 0 22 21 498 616 0.10
Slovakia EU'08 5 0 5 5 412 254 0.09
Slovenia EU'08 18 0 18 2 032 362 0.89
*Spain EU'08 53 0 53 45 828 172 0.12
Sweden EU'08 146 0 146 9 256 347 1.58
United Kingdom EU'02 742 0 742 61 634 599 1.20
EU total
1 525 1 1 526 499 723 520 0.35
Iceland EU'08 0 0 0 319 368 0.00
Norway EU'08 71 0 71 4 799 252 1.48
Total
1 596 1 1 597 504 877 729 0.36
*Spain reported data from sentinel surveillance.

Surveillance of invasive bacterial diseases in Europe 2008/2009 SURVEILLANCE REPORT
88
Table A8 Number of reported invasive H. influenzae cases by country and month in 2008
Country Jan Feb Mar Apr May Jun Jul Aug Sep Oct Nov Dec Total
Austria 0 1 0 2 0 1 0 1 0 0 0 0 5
Belgium 6 10 6 3 5 3 2 3 4 3 1 3 49
Bulgaria 2 2 1 1 1 1 0 0 2 1 1 2 14
Cyprus 0 0 0 0 0 0 0 0 0 0 0 0 0
Czech Republic 0 1 0 1 1 1 0 1 0 0 1 1 7
Denmark 6 1 6 2 2 4 1 2 1 3 3 1 32
Estonia 0 1 0 0 0 0 0 0 0 0 0 0 1
Finland 6 3 4 4 5 3 1 6 2 4 2 5 45
France 55 46 50 40 32 27 28 22 24 31 39 48 442
Germany 11 13 14 17 16 18 11 4 13 13 12 18 160
Greece 1 1 0 0 1 0 0 0 0 0 1 0 4
Hungary 1 0 0 0 2 0 1 0 1 0 0 1 6
Ireland 3 0 3 4 2 2 1 1 2 1 1 2 22
Italy 5 6 8 3 4 4 0 5 1 2 5 7 50
Latvia 0 0 0 0 1 0 0 0 0 0 0 0 1
Lithuania 0 0 0 0 0 0 0 0 0 2 1 0 3
Luxembourg 0 0 0 0 0 0 0 0 0 0 0 0 0
Malta 0 0 0 0 0 0 0 0 0 0 0 0 0
Netherlands 0 0 0 0 0 0 0 0 0 0 0 0 0
Poland 4 4 3 0 4 3 2 0 1 3 3 1 28
Portugal 0 2 0 0 1 0 1 0 0 0 0 1 5
Romania 0 0 0 1 0 0 0 0 0 0 0 1 2
Slovakia 0 0 1 0 0 0 0 0 1 1 1 0 4
Slovenia 1 2 1 0 3 1 1 0 0 1 0 2 12
Spain 11 9 2 8 2 9 6 4 2 6 6 8 73
Sweden 19 7 7 14 13 13 10 11 10 22 21 16 163
United Kingdom 92 72 67 63 56 57 54 24 34 57 57 104 737
EU total 223 181 173 163 151 147 119 84 98 150 155 221 1 865
Iceland 0 0 0 0 0 0 0 0 0 0 0 0 0
Norway 12 3 6 5 10 4 6 6 2 5 10 6 75
Total 235 184 179 168 161 151 125 90 100 155 165 227 1 940

SURVEILLANCE REPORT Surveillance of invasive bacterial diseases in Europe 2008/2009
89
Table A9 Number of reported invasive H. influenzae cases by country and month in 2009
Country Jan Feb Mar Apr May Jun Jul Aug Sep Oct Nov Dec Total
Austria 2 1 1 3 2 1 1 0 0 1 2 0 14
Belgium 4 14 5 8 4 3 2 2 3 11 12 8 76
Bulgaria 2 2 0 1 1 2 0 2 1 2 0 2 15
Cyprus 0 0 0 0 0 0 1 0 0 1 0 0 2
Czech Republic 0 4 0 1 1 0 0 0 2 1 0 1 10
Denmark 2 2 7 3 2 2 4 2 2 1 1 3 31
Estonia 0 0 0 0 0 0 1 0 0 0 0 0 1
Finland 3 3 5 2 8 2 2 2 6 4 6 4 47
France - - - - - - - - - - - - -
Germany 23 17 25 22 17 21 14 7 9 11 11 19 196
Greece 1 2 2 2 0 2 2 0 0 1 0 1 13
Hungary 0 0 0 0 1 0 1 0 0 0 0 1 3
Ireland 7 9 3 7 2 3 1 1 1 3 4 2 43
Italy 6 10 5 6 9 1 1 2 3 1 4 8 56
Latvia 1 0 0 0 0 0 0 0 0 0 0 0 1
Lithuania 1 0 0 0 0 0 0 0 0 0 0 0 1
Luxembourg 0 0 0 0 0 0 0 0 0 0 0 0 0
Malta 0 0 1 1 0 1 0 0 0 0 0 0 3
Netherlands 0 0 0 0 0 0 0 0 0 0 0 0 0
Poland 2 0 0 2 4 3 1 3 1 0 1 2 19
Portugal 0 1 0 0 2 0 1 0 0 1 2 1 8
Romania 5 2 2 2 1 3 1 0 0 2 3 1 22
Slovakia 0 1 1 1 0 1 0 0 0 0 0 1 5
Slovenia 1 0 1 5 2 1 1 1 0 0 2 4 18
Spain 10 5 1 7 2 5 6 1 1 4 2 9 53
Sweden 20 11 11 10 14 13 11 7 9 19 11 10 146
United Kingdom 117 76 75 67 53 53 47 19 43 54 50 79 733
EU total 207 160 145 150 125 117 98 49 81 117 111 156 1 525
Iceland 0 0 0 0 0 0 0 0 0 0 0 0 0
Liechtenstein - - - - - - - - - - - - -
Norway 10 6 8 7 8 6 2 3 3 5 9 4 71
Total 217 166 153 157 133 123 100 52 84 122 120 160 1 587

Surveillance of invasive bacterial diseases in Europe 2008/2009 SURVEILLANCE REPORT
90
Table A10 Total number of invasive H. influenzae disease cases by country and gender, 2008–2009
Country 2008 2009
Males Females Unknown Gender ratio Males Females Unknown Gender
ratio
Austria 2 3 0 0.7 5 9 0 0.6
Belgium 24 25 0 1.0 47 29 0 1.6
Bulgaria 9 5 0 1.8 7 8 0 0.9
Cyprus 0 0 0 0 2 0 0
Czech Republic 2 5 0 0.4 8 2 0 4.0
Denmark 17 15 0 1.1 12 19 0 0.6
Estonia 0 1 0 0.0 1 0 0
Finland 25 20 0 1.3 22 25 0 0.9
France 241 201 0 1.2 - - - -
Germany 84 75 10 1.1 110 86 0 1.3
Greece 3 1 0 3.0 5 8 0 0.6
Hungary 3 3 0 1.0 1 2 0 0.5
Ireland 14 8 0 1.8 23 20 0 1.2
Italy 23 27 0 0.9 33 23 0 1.4
Latvia 1 0 0 0 1 0 0 0
Lithuania 1 2 0 0.5 0 1 0 0.0
Luxembourg 0 0 0 0 0 0 0 0
Malta 0 0 0 0 1 2 0 0.5
Netherlands 0 0 0 0 0 0 0 0
Poland 13 15 0 0.9 13 6 0 2.2
Portugal 2 3 0 0.7 5 3 0 1.7
Romania 1 1 0 1.0 16 6 0 2.7
Slovakia 3 1 0 3.0 1 4 0 0.3
Slovenia 5 7 0 0.7 11 7 0 1.6
Spain 44 28 1 1.6 21 32 0 0.7
Sweden 71 92 0 0.8 82 64 0 1.3
United Kingdom 370 371 32 1.0 370 343 29 1.1
EU total 958 909 34 1.1 797 699 29 1.1
Iceland 0 0 0 0 0 0 0 0
Liechtenstein - - - - - - - -
Norway 36 39 0 0.9 26 45 0 0.6
Total 994 948 34 1.0 823 744 29 1.1

SURVEILLANCE REPORT Surveillance of invasive bacterial diseases in Europe 2008/2009
91
Table A11 Total number and notification rates (per 100 000 population) of invasive H. influenzae disease by country and age group, 2008
Country < 1 year 1–4 years 5–14 years 15–64 years 65+ years Unk Total
n rate n rate n rate n rate n rate n n Austria 2 2.64 0 0.00 0 0.00 0 0.00 3 0.21 0 5
Belgium 2 1.65 4 0.83 1 0.08 15 0.21 27 1.48 0 49
Bulgaria 5 6.99 6 2.15 0 0.00 3 0.06 0 0.00 0 14
Cyprus - - - - - - - - - - - -
Czech Republic 0 0.00 1 0.25 3 0.31 1 0.01 2 0.13 0 7
Denmark 2 3.11 3 1.15 2 0.29 10 0.28 15 1.76 0 32
Estonia 0 0.00 0 0.00 0 0.00 1 0.11 0 0.00 0 1
Finland 2 3.4 3 1.29 0 0.00 19 0.54 21 2.40 0 45
France 20 2.45 21 0.67 17 0.22 170 0.41 214 2.04 0 442
Germany 7 1.02 8 0.29 4 0.05 49 0.09 92 0.56 0 160
Greece 0 0.00 0 0.00 0 0.00 2 0.03 0 0.00 2 4
Hungary 1 1.04 1 0.26 0 0.00 3 0.04 1 0.06 0 6
Ireland 5 7.11 2 0.79 2 0.34 5 0.17 8 1.67 0 22
Italy 1 0.18 4 0.18 3 0.05 18 0.05 24 0.20 0 50
Latvia 0 0.00 1 1.16 0 0.00 0 0.00 0 0.00 0 1
Lithuania 1 3.11 1 0.82 0 0.00 1 0.04 0 0.00 0 3
Luxembourg - - - - - - - - - - - -
Malta - - - - - - - - - - - -
Netherlands - - - - - - - - - - - -
Poland 5 1.3 8 0.56 5 0.12 9 0.03 1 0.02 0 28
Portugal 1 0.98 0 0.00 1 0.09 2 0.03 1 0.05 0 5
Romania 0 0.00 2 0.23 0 0.00 0 0.00 0 0.00 0 2
Slovakia 0 0.00 0 0.00 1 0.17 3 0.08 0 0.00 0 4
Slovenia 2 10.3 3 4.1 0 0.00 3 0.21 4 1.22 0 12
Spain 5 1.02 3 0.16 4 0.09 14 0.05 47 0.63 0 73
Sweden 4 3.71 4 0.96 4 0.39 58 0.96 93 5.78 0 163
United Kingdom 85 11 36 1.25 29 0.41 286 0.71 337 3.42 0 773
EU total 150 2.85 111 0.54 76 0.15 672 0.20 890 1.05 2 1 901
Norway 1 1.71 3 1.28 1 0.16 30 0.96 40 5.77 0 75
Total 151 2.84 114 0.55 77 0.15 702 0.21 930 1.09 2 1 976

Surveillance of invasive bacterial diseases in Europe 2008/2009 SURVEILLANCE REPORT
92
Table A12 Total number and notification rates (per 100 000 population) of invasive H. influenzae disease by country and age group, 2009
Country < 1 year 1–4 years 5–14 years 15–64 years 65+ years Unk Total
n rate n rate n rate n rate n rate n n
Austria 0 0.00 3 0.94 1 0.12 6 0.11 4 0.28 0 14
Belgium 5 4.13 4 0.83 2 0.17 23 0.33 32 1.76 10 76
Bulgaria 4 5.41 7 2.44 1 0.15 2 0.04 1 0.08 0 15
Cyprus 0 0.00 0 0.00 0 0.00 2 0.36 0 0.00 0 2
Czech Republic 0 0.00 2 0.47 0 0.00 4 0.05 4 0.26 0 10
Denmark 2 3.06 1 0.38 0 0.00 18 0.50 10 1.14 0 31
Estonia 0 0.00 0 0.00 0 0.00 0 0.00 1 0.44 0 1
Finland 2 3.36 1 0.43 2 0.34 19 0.54 23 2.58 0 47
France - - - - - - - - - - - -
Germany 10 1.46 7 0.25 8 0.10 57 0.11 114 0.68 0 196
Greece 0 0.00 2 0.46 1 0.10 5 0.07 1 0.05 4 13
Hungary 0 0.00 1 0.26 1 0.10 1 0.01 0 0.00 0 3
Ireland 4 5.47 4 1.51 7 1.18 12 0.40 16 3.25 0 43
Italy 7 1.21 3 0.13 0 0.00 20 0.05 26 0.22 0 56
Latvia 1 4.28 0 0.00 0 0.00 0 0.00 0 0.00 0 1
Lithuania 1 2.87 0 0.00 0 0.00 0 0.00 0 0.00 0 1
Luxembourg - - - - - - - - - - - -
Malta 0 0.00 0 0.00 0 0.00 2 0.69 1 1.72 0 3
Netherlands - - - - - - - - - - - -
Poland 5 1.21 5 0.34 3 0.08 3 0.01 3 0.06 0 19
Portugal 1 0.96 2 0.47 0 0.00 3 0.04 2 0.11 0 8
Romania 5 2.27 9 1.05 4 0.18 2 0.01 2 0.06 0 22
Slovakia 1 1.75 0 0.00 0 0.00 2 0.05 2 0.31 0 5
Slovenia 0 0.00 0 0.00 1 0.54 12 0.85 5 1.50 0 18
Spain 1 0.20 7 0.37 1 0.02 13 0.04 31 0.41 0 53
Sweden 3 2.74 3 0.70 3 0.30 58 0.96 79 4.80 0 146
United Kingdom 89 11.53 53 1.84 19 0.27 244 0.60 337 3.42 0 742
EU total 141 2.63 114 0.55 54 0.10 508 0.15 694 0.81 14 1 525
Norway 5 8.24 5 2.10 1 0.16 29 0.91 31 4.40 0 71
Total 146 2.69 119 0.57 55 0.10 537 0.16 725 0.84 14 1 596

SURVEILLANCE REPORT Surveillance of invasive bacterial diseases in Europe 2008/2009
93
Table A13 Proportion of reported serotypes of invasive H. influenzae cases by country, 2008
Country b non-b non-caps Unk Missing Total
n % n % n % n % n n
Austria 1 20.0 0 0.0 4 80.0 0 0.0 0 5
Belgium 0 - 0 - 0 - 0 - 49 49
Bulgaria 0 - 0 - 0 - 0 - 14 14
Cyprus - - - - - - - - - -
Czech Republic 3 42.9 0 0.0 0 0.0 4 57.1 0 7
Denmark 7 21.9 8 25.0 17 53.1 0 0.0 0 32
Estonia 1 100.0 0 0.0 0 0.0 0 0.0 0 1
Finland 3 6.7 8 17.8 33 73.3 1 2.2 0 45
France 0 0.0 0 0.0 0 0.0 442 100.0 0 442
Germany 0 0.0 0 0.0 0 0.0 160 100.0 0 160
Greece 1 25.0 2 50.0 0 0.0 1 25.0 0 4
Hungary 0 0.0 4 66.7 0 0.0 2 33.3 0 6
Ireland 5 22.7 3 13.6 12 54.5 2 9.1 0 22
Italy 3 6.0 3 6.0 19 38.0 25 50.0 0 50
Latvia 1 100.0 0 0.0 0 0.0 0 0.0 0 1
Lithuania 3 100.0 0 0.0 0 0.0 0 0.0 0 3
Luxembourg - - - - - - - - - -
Malta - - - - - - - - - -
Netherlands - - - - - - - - - -
Poland 8 28.6 0 0.0 0 0.0 20 71.4 0 28
Portugal 0 0.0 0 0.0 0 0.0 5 100.0 0 5
Romania 2 100.0 0 0.0 0 0.0 0 0.0 0 2
Slovakia 0 0.0 0 0.0 0 0.0 4 100.0 0 4
Slovenia 0 0.0 1 8.3 11 91.7 0 0.0 0 12
Spain 6 8.2 0 0.0 0 0.0 67 91.8 0 73
Sweden 9 5.5 32 19.6 31 19.0 91 55.8 0 163
United Kingdom 87 11.3 67 8.7 327 42.3 292 37.8 0 773
EU total 140 7.6 128 7.0 454 24.7 1116 60.7 63 1 901
Iceland - - - - - - - - - -
Liechtenstein - - - - - - - - - -
Norway 1 1.3 17 22.7 50 66.7 7 9.3 0 75
Total 141 7.4 145 7.6 504 26.3 1123 58.7 63 1 976

Surveillance of invasive bacterial diseases in Europe 2008/2009 SURVEILLANCE REPORT
94
Table A14 Proportion of reported serotypes of invasive H. influenzae cases by country, 2009
Country b non-b non-caps Unk Missing Total
n % n % n % n % n n
Austria 0 0.0 1 7.1 13 92.9 0 0.0 0 14
Belgium 0 - 0 - 0 - 0 - 76 76
Bulgaria 0 - 0 - 0 - 0 - 15 15
Cyprus 0 0.0 0 0.0 0 0.0 2 100.0 0 2
Czech Republic 3 30.0 1 10.0 2 20.0 4 40.0 0 10
Denmark 5 16.7 4 13.3 20 66.7 1 3.3 1 31
Estonia 1 100.0 0 0.0 0 0.0 0 0.0 0 1
Finland 6 12.8 9 19.1 30 63.8 2 4.3 0 47
France - - - - - - - - - -
Germany 0 0.0 0 0.0 0 0.0 196 100.0 0 196
Greece 7 53.8 6 46.2 0 0.0 0 0.0 0 13
Hungary 0 0.0 2 66.7 0 0.0 1 33.3 0 3
Ireland 1 2.3 8 18.6 25 58.1 9 20.9 0 43
Italy 4 7.1 5 8.9 21 37.5 26 46.4 0 56
Latvia 0 0.0 0 0.0 0 0.0 1 100.0 0 1
Lithuania 1 100.0 0 0.0 0 0.0 0 0.0 0 1
Luxembourg - - - - - - - - - -
Malta 0 0.0 1 33.3 1 33.3 1 33.3 0 3
Netherlands - - - - - - - - - -
Poland 7 36.8 0 0.0 0 0.0 12 63.2 0 19
Portugal 0 0.0 0 0.0 0 0.0 8 100.0 0 8
Romania 0 0.0 0 0.0 0 0.0 22 100.0 0 22
Slovakia 1 20.0 0 0.0 0 0.0 4 80.0 0 5
Slovenia 0 0.0 7 38.9 11 61.1 0 0.0 0 18
Spain 3 5.7 0 0.0 0 0.0 50 94.3 0 53
Sweden 3 2.1 16 11.0 42 28.8 85 58.2 0 146
United Kingdom 43 5.8 68 9.2 369 49.7 262 35.3 0 742
EU total 85 5.9 128 8.9 534 37.3 686 47.9 92 1 525
Iceland - - - - - - - - - -
Liechtenstein - - - - - - - - - -
Norway 6 8.5 14 19.7 46 64.8 5 7.0 0 71
Total 91 6.1 142 9.4 580 38.6 691 45.9 92 1 596
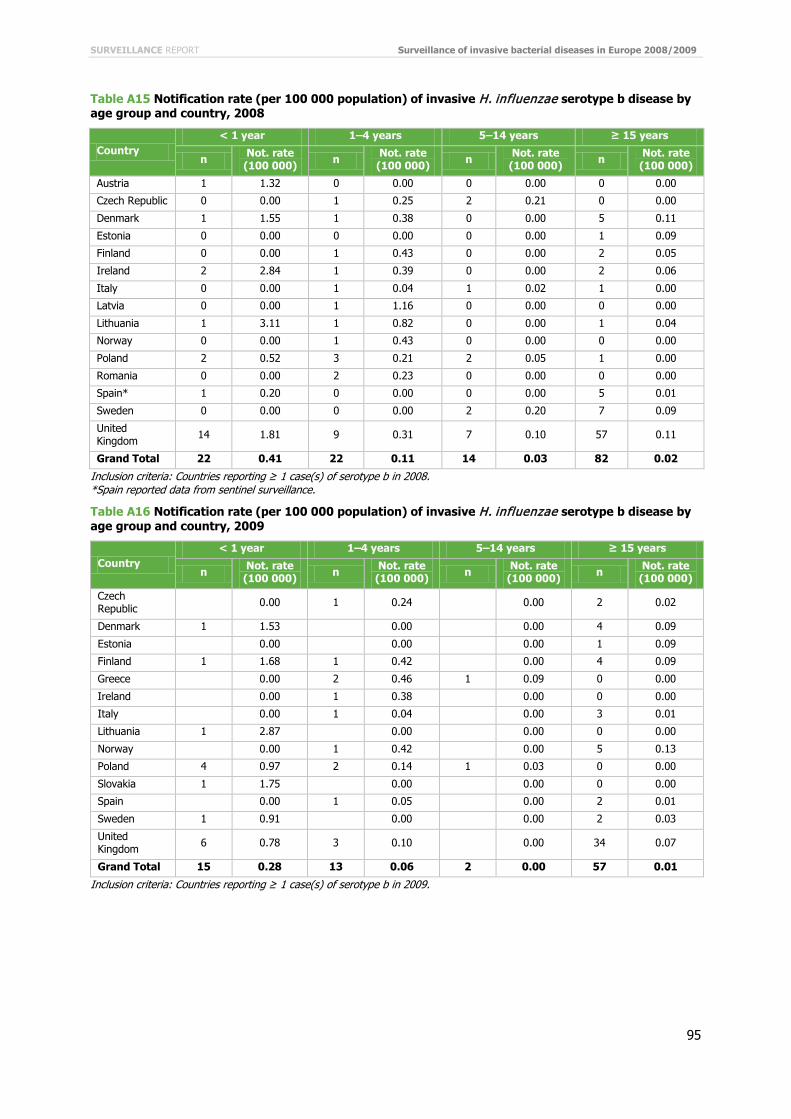
SURVEILLANCE REPORT Surveillance of invasive bacterial diseases in Europe 2008/2009
95
Table A15 Notification rate (per 100 000 population) of invasive H. influenzae serotype b disease by age group and country, 2008
Country < 1 year 1–4 years 5–14 years ≥ 15 years
n Not. rate (100 000) n Not. rate
(100 000) n Not. rate (100 000) n Not. rate
(100 000)
Austria 1 1.32 0 0.00 0 0.00 0 0.00
Czech Republic 0 0.00 1 0.25 2 0.21 0 0.00
Denmark 1 1.55 1 0.38 0 0.00 5 0.11
Estonia 0 0.00 0 0.00 0 0.00 1 0.09
Finland 0 0.00 1 0.43 0 0.00 2 0.05
Ireland 2 2.84 1 0.39 0 0.00 2 0.06
Italy 0 0.00 1 0.04 1 0.02 1 0.00
Latvia 0 0.00 1 1.16 0 0.00 0 0.00
Lithuania 1 3.11 1 0.82 0 0.00 1 0.04
Norway 0 0.00 1 0.43 0 0.00 0 0.00
Poland 2 0.52 3 0.21 2 0.05 1 0.00
Romania 0 0.00 2 0.23 0 0.00 0 0.00
Spain* 1 0.20 0 0.00 0 0.00 5 0.01
Sweden 0 0.00 0 0.00 2 0.20 7 0.09
United Kingdom 14 1.81 9 0.31 7 0.10 57 0.11
Grand Total 22 0.41 22 0.11 14 0.03 82 0.02
Inclusion criteria: Countries reporting ≥ 1 case(s) of serotype b in 2008. *Spain reported data from sentinel surveillance.
Table A16 Notification rate (per 100 000 population) of invasive H. influenzae serotype b disease by age group and country, 2009
Country < 1 year 1–4 years 5–14 years ≥ 15 years
n Not. rate (100 000) n Not. rate
(100 000) n Not. rate (100 000) n Not. rate
(100 000)
Czech Republic
0.00 1 0.24
0.00 2 0.02
Denmark 1 1.53
0.00
0.00 4 0.09
Estonia
0.00
0.00
0.00 1 0.09
Finland 1 1.68 1 0.42
0.00 4 0.09
Greece
0.00 2 0.46 1 0.09 0 0.00
Ireland
0.00 1 0.38
0.00 0 0.00
Italy
0.00 1 0.04
0.00 3 0.01
Lithuania 1 2.87
0.00
0.00 0 0.00
Norway
0.00 1 0.42
0.00 5 0.13
Poland 4 0.97 2 0.14 1 0.03 0 0.00
Slovakia 1 1.75
0.00
0.00 0 0.00
Spain
0.00 1 0.05
0.00 2 0.01
Sweden 1 0.91
0.00
0.00 2 0.03
United Kingdom 6 0.78 3 0.10
0.00 34 0.07
Grand Total 15 0.28 13 0.06 2 0.00 57 0.01
Inclusion criteria: Countries reporting ≥ 1 case(s) of serotype b in 2009.
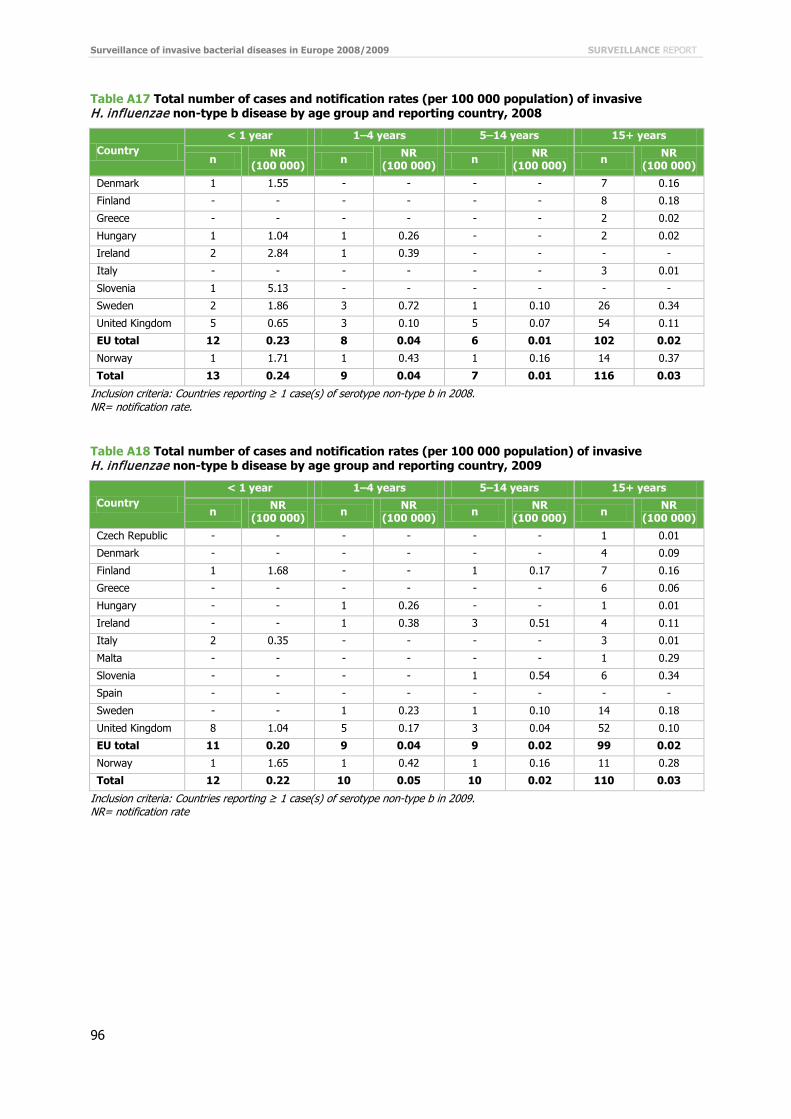
Surveillance of invasive bacterial diseases in Europe 2008/2009 SURVEILLANCE REPORT
96
Table A17 Total number of cases and notification rates (per 100 000 population) of invasive H. influenzae non-type b disease by age group and reporting country, 2008
Country < 1 year 1–4 years 5–14 years 15+ years
n NR (100 000) n NR
(100 000) n NR (100 000) n NR
(100 000)
Denmark 1 1.55 - - - - 7 0.16
Finland - - - - - - 8 0.18
Greece - - - - - - 2 0.02
Hungary 1 1.04 1 0.26 - - 2 0.02
Ireland 2 2.84 1 0.39 - - - -
Italy - - - - - - 3 0.01
Slovenia 1 5.13 - - - - - -
Sweden 2 1.86 3 0.72 1 0.10 26 0.34
United Kingdom 5 0.65 3 0.10 5 0.07 54 0.11
EU total 12 0.23 8 0.04 6 0.01 102 0.02
Norway 1 1.71 1 0.43 1 0.16 14 0.37
Total 13 0.24 9 0.04 7 0.01 116 0.03
Inclusion criteria: Countries reporting ≥ 1 case(s) of serotype non-type b in 2008. NR= notification rate.
Table A18 Total number of cases and notification rates (per 100 000 population) of invasive H. influenzae non-type b disease by age group and reporting country, 2009
Country < 1 year 1–4 years 5–14 years 15+ years
n NR (100 000) n NR
(100 000) n NR (100 000) n NR
(100 000)
Czech Republic - - - - - - 1 0.01
Denmark - - - - - - 4 0.09
Finland 1 1.68 - - 1 0.17 7 0.16
Greece - - - - - - 6 0.06
Hungary - - 1 0.26 - - 1 0.01
Ireland - - 1 0.38 3 0.51 4 0.11
Italy 2 0.35 - - - - 3 0.01
Malta - - - - - - 1 0.29
Slovenia - - - - 1 0.54 6 0.34
Spain - - - - - - - -
Sweden - - 1 0.23 1 0.10 14 0.18
United Kingdom 8 1.04 5 0.17 3 0.04 52 0.10
EU total 11 0.20 9 0.04 9 0.02 99 0.02
Norway 1 1.65 1 0.42 1 0.16 11 0.28
Total 12 0.22 10 0.05 10 0.02 110 0.03
Inclusion criteria: Countries reporting ≥ 1 case(s) of serotype non-type b in 2009. NR= notification rate

SURVEILLANCE REPORT Surveillance of invasive bacterial diseases in Europe 2008/2009
97
Table A19 Total number of cases and notification rate (per 100 000 population) of invasive H. influenzae non-capsulated disease by age group and reporting country, 2008 (n=504)
Country
< 1 year 1–4 years 5–14 years 15–64 years 65+ years
n NR (100 000) n NR
(100 000) n NR (100 000) n NR
(100 000) n NR (100 000)
Austria 1 1.32 - - - - - - 3 0.21
Denmark - - 2 0.77 2 0.29 5 0.14 8 0.94
Finland 2 3.40 2 0.86 - - 11 0.31 18 2.06
Ireland 1 1.42 - - 1 0.17 4 0.13 6 1.25
Italy 1 0.18 2 0.09 - - 7 0.02 9 0.08
Slovenia 1 5.13 3 4.10 - - 3 0.21 4 1.22
Sweden 1 0.93 1 0.24 1 0.10 7 0.12 21 1.31
United Kingdom 46 5.96 16 0.56 7 0.10 110 0.27 148 1.50
EU total 53 1.01 26 0.13 11 0.02 147 0.04 217 0.26
Norway - - 1 0.43 - - 18 0.57 31 4.47
Total 53 1.00 27 0.13 11 0.02 165 0.05 248 0.29
Inclusion criteria: Countries reporting ≥ 1 case(s) of non-caps in 2008. NR= notification rate
Table A20 Total number of cases and notification rate (per 100 000 population) of invasive H. influenzae non-capsulated disease by age group and reporting country, 2009
Country
< 1 year 1–4 years 5–14 years 15–64 years 65+ years
n NR (100 000) n NR
(100 000) n NR (100 000) n NR
(100 000) n NR (100 000)
Austria - - 2 0.63 1 0.12 6 0.11 4 0.28
Czech Republic - - 1 0.24 - - - - 1 0.06
Denmark 1 1.53 1 0.38 - - 9 0.25 9 1.03
Finland - - - - 1 0.17 13 0.37 16 1.79
Ireland 2 2.74 2 0.75 4 0.67 8 0.26 9 1.83
Italy 3 0.52 2 0.09 - - 7 0.02 9 0.07
Malta - - - - - - 1 0.34 - -
Slovenia - - - - - - 8 0.57 3 0.90
Sweden 1 0.91 1 0.23 2 0.20 10 0.16 28 1.70
United Kingdom 48 6.22 33 1.15 5 0.07 101 0.25 182 1.85
EU total 55 1.02 42 0.20 13 0.02 163 0.05 261 0.30
Norway 4 6.59 3 1.26 - - 18 0.57 21 2.98
Total 59 1.08 45 0.21 13 0.02 181 0.05 282 0.33
Inclusion criteria: Countries reporting ≥ 1 case(s) of non-caps in 2009. NR= notification rate

Surveillance of invasive bacterial diseases in Europe 2008/2009 SURVEILLANCE REPORT
98
Table A21 Case fatality ratio and total number of confirmed invasive H. influenzae cases, by country, 2008
Country Deaths (n) Total number of cases (n) Case fatality ratio (%)
Austria 0 5 0.0
Belgium - - -
Bulgaria - - -
Cyprus - - -
Czech Republic 0 7 0.0
Denmark 1 32 3.1
Estonia 0 1 0.0
Finland 4 45 8.9
France 0 442 0.0
Germany 8 160 5.0
Greece 0 4 0.0
Hungary 2 6 33.3
Ireland 2 22 9.1
Italy 3 50 6.0
Latvia 0 1 0.0
Lithuania 0 3 0.0
Luxembourg - - -
Malta - - -
Netherlands - - -
Poland 2 28 7.1
Portugal 0 5 0.0
Romania 1 2 50.0
Slovakia 0 4 0.0
Slovenia 1 12 8.3
Sweden 0 163 0.0
United Kingdom 59 773 7.6
EU total 83 1 838 4.5
Iceland - - -
Liechtenstein - - -
Norway 4 75 5.3
Total 87 1 913 4.5
Note: Outcome data are not collected in Spain.
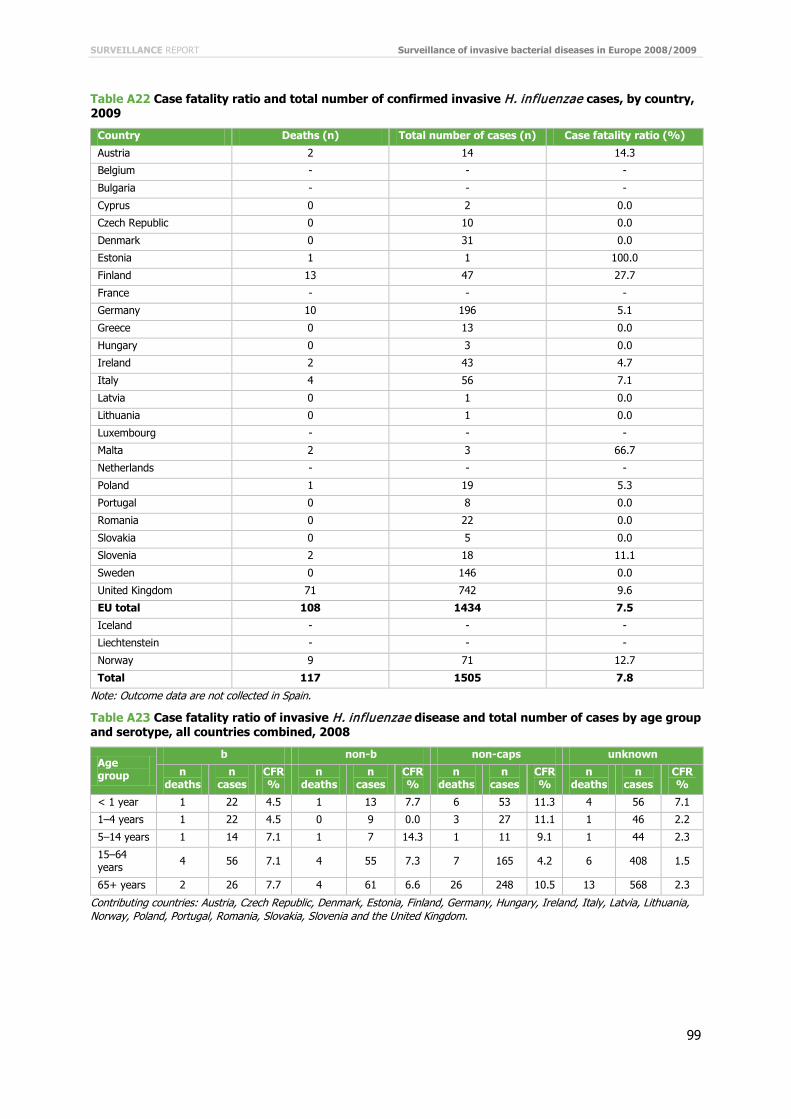
SURVEILLANCE REPORT Surveillance of invasive bacterial diseases in Europe 2008/2009
99
Table A22 Case fatality ratio and total number of confirmed invasive H. influenzae cases, by country, 2009
Country Deaths (n) Total number of cases (n) Case fatality ratio (%)
Austria 2 14 14.3
Belgium - - -
Bulgaria - - -
Cyprus 0 2 0.0
Czech Republic 0 10 0.0
Denmark 0 31 0.0
Estonia 1 1 100.0
Finland 13 47 27.7
France - - -
Germany 10 196 5.1
Greece 0 13 0.0
Hungary 0 3 0.0
Ireland 2 43 4.7
Italy 4 56 7.1
Latvia 0 1 0.0
Lithuania 0 1 0.0
Luxembourg - - -
Malta 2 3 66.7
Netherlands - - -
Poland 1 19 5.3
Portugal 0 8 0.0
Romania 0 22 0.0
Slovakia 0 5 0.0
Slovenia 2 18 11.1
Sweden 0 146 0.0
United Kingdom 71 742 9.6
EU total 108 1434 7.5
Iceland - - -
Liechtenstein - - -
Norway 9 71 12.7
Total 117 1505 7.8
Note: Outcome data are not collected in Spain.
Table A23 Case fatality ratio of invasive H. influenzae disease and total number of cases by age group and serotype, all countries combined, 2008
Age group
b non-b non-caps unknown
n deaths
n cases
CFR%
n deaths
n cases
CFR%
n deaths
n cases
CFR%
n deaths
n cases
CFR%
< 1 year 1 22 4.5 1 13 7.7 6 53 11.3 4 56 7.1
1–4 years 1 22 4.5 0 9 0.0 3 27 11.1 1 46 2.2
5–14 years 1 14 7.1 1 7 14.3 1 11 9.1 1 44 2.3
15–64 years 4 56 7.1 4 55 7.3 7 165 4.2 6 408 1.5
65+ years 2 26 7.7 4 61 6.6 26 248 10.5 13 568 2.3
Contributing countries: Austria, Czech Republic, Denmark, Estonia, Finland, Germany, Hungary, Ireland, Italy, Latvia, Lithuania, Norway, Poland, Portugal, Romania, Slovakia, Slovenia and the United Kingdom.
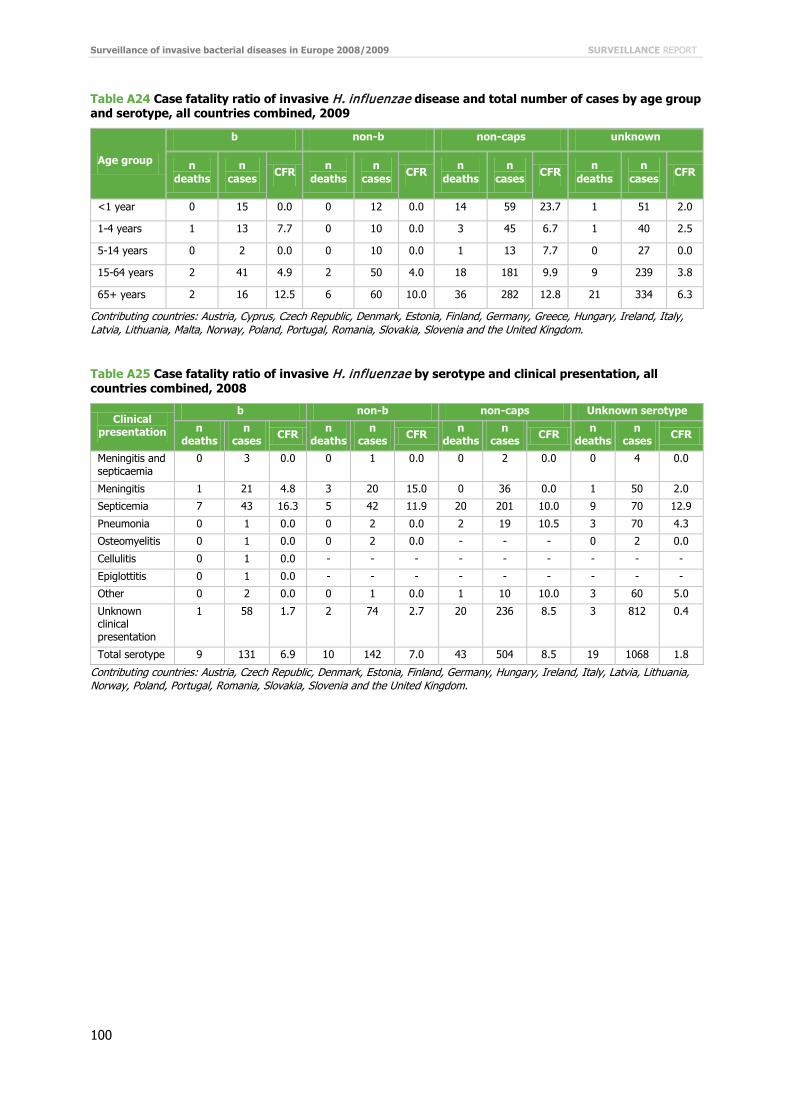
Surveillance of invasive bacterial diseases in Europe 2008/2009 SURVEILLANCE REPORT
100
Table A24 Case fatality ratio of invasive H. influenzae disease and total number of cases by age group and serotype, all countries combined, 2009
Age group
b non-b non-caps unknown
n deaths
n cases CFR n
deaths n
cases CFR n deaths
n cases CFR n
deaths n
cases CFR
<1 year 0 15 0.0 0 12 0.0 14 59 23.7 1 51 2.0
1-4 years 1 13 7.7 0 10 0.0 3 45 6.7 1 40 2.5
5-14 years 0 2 0.0 0 10 0.0 1 13 7.7 0 27 0.0
15-64 years 2 41 4.9 2 50 4.0 18 181 9.9 9 239 3.8
65+ years 2 16 12.5 6 60 10.0 36 282 12.8 21 334 6.3
Contributing countries: Austria, Cyprus, Czech Republic, Denmark, Estonia, Finland, Germany, Greece, Hungary, Ireland, Italy, Latvia, Lithuania, Malta, Norway, Poland, Portugal, Romania, Slovakia, Slovenia and the United Kingdom.
Table A25 Case fatality ratio of invasive H. influenzae by serotype and clinical presentation, all countries combined, 2008
Clinical presentation
b non-b non-caps Unknown serotype
n deaths
n cases CFR n
deaths n
cases CFR n deaths
n cases CFR n
deaths n
cases CFR
Meningitis and septicaemia
0 3 0.0 0 1 0.0 0 2 0.0 0 4 0.0
Meningitis 1 21 4.8 3 20 15.0 0 36 0.0 1 50 2.0
Septicemia 7 43 16.3 5 42 11.9 20 201 10.0 9 70 12.9
Pneumonia 0 1 0.0 0 2 0.0 2 19 10.5 3 70 4.3
Osteomyelitis 0 1 0.0 0 2 0.0 - - - 0 2 0.0
Cellulitis 0 1 0.0 - - - - - - - - -
Epiglottitis 0 1 0.0 - - - - - - - - -
Other 0 2 0.0 0 1 0.0 1 10 10.0 3 60 5.0
Unknown clinical presentation
1 58 1.7 2 74 2.7 20 236 8.5 3 812 0.4
Total serotype 9 131 6.9 10 142 7.0 43 504 8.5 19 1068 1.8
Contributing countries: Austria, Czech Republic, Denmark, Estonia, Finland, Germany, Hungary, Ireland, Italy, Latvia, Lithuania, Norway, Poland, Portugal, Romania, Slovakia, Slovenia and the United Kingdom.

SURVEILLANCE REPORT Surveillance of invasive bacterial diseases in Europe 2008/2009
101
Table A26 Case fatality ratio of invasive H. influenzae by serotype and clinical presentation, all countries combined, 2009
Clinical presentation
b non-b non-caps Unknown
n deaths
n cases CFR n
deaths n
cases CFR n deaths
n cases CFR n
deaths n
cases CFR
Meningitis and septicaemia 1 5 20.0 0 1 0.0 1 3 33.3 0 6 0.0
Meningitis 0 19 0.0 0 17 0.0 4 37 10.8 1 70 1.4
Septicemia 2 25 8.0 4 45 8.9 21 238 8.8 12 101 11.9
Pneumonia 0 3 0.0 0 3 0.0 3 12 25.0 4 80 5.0
Osteomyelitis - - - - - - - - - 0 1 0.0
Cellulitis - - - - - - - - - 0 1 0.0
Epiglottitis 0 1 0.0 - - - - - - - - -
Other - - - 1 2 50.0 2 11 18.2 1 63 1.6
Unknown clinical presentation
2 33 6.1 2 66 3 41 279 14.7 4 319 1.3
Total serotype 5 86 5.8 7 134 5.2 72 580 12.4 22 641 3.4
Contributing countries: Austria, Cyprus, Czech Republic, Denmark, Estonia, Finland, Germany, Greece, Hungary, Ireland, Italy, Latvia, Lithuania, Malta, Norway, Poland, Portugal, Romania, Slovakia, Slovenia and the United Kingdom.
Table A27 Total numbers of invasive H. influenzae serotype b disease among cases < 15 year of age with reported vaccination status, by country, 2008
Age groups Country Fully vaccinated Partly vaccinated Not vaccinated Unknown Total
n % n % n % n % n
< 1 year Denmark 0 0.0% 0 0.0% 1 100% 0 0.0% 1
Ireland 0 0.0% 1 50.0% 1 50.0% 0 0.0% 2
Poland 0 0.0% 0 0.0% 2 100% 0 0.0% 2
United Kingdom 6 42.9% 0 0.0% 5 35.7% 3 21.4% 14
1–4 years Czech Republic 0 0.0% 0 0.0% 1 100% 0 0.0% 1
Denmark 1 100% 0 0.0% 0 0.0% 0 0.0% 1
Finland 1 100% 0 0.0% 0 0.0% 0 0.0% 1
Ireland 0 0.0% 0 0.0% 1 100% 0 0.0% 1
Italy 1 100% 0 0.0% 0 0.0% 0 0.0% 1
Norway 1 100% 0 0.0% 0 0.0% 0 0.0% 1
Poland 0 0.0% 1 33.3% 2 66.7% 0 0.0% 3
Romania 0 0.0% 0 0.0% 2 100% 0 0.0% 2
United Kingdom 5 55.6% 0 0.0% 0 0.0% 4 44.4% 9
5–14 years Czech Republic 1 50.0% 0 0.0% 1 50.0% 0 0.0% 2
Italy 0 0.0% 0 0.0% 1 100% 0 0.0% 1
Poland 0 0.0% 0 0.0% 2 100% 0 0.0% 2
Sweden 2 100% 0 0.0% 0 0.0% 0 0.0% 2
United Kingdom 7 100% 0 0.0% 0 0.0% 0 0.0% 7
Inclusion criteria: Countries reporting ≥ 1 case(s) of serotype b in 2008.

Surveillance of invasive bacterial diseases in Europe 2008/2009 SURVEILLANCE REPORT
102
Table A28 Total numbers of invasive H. influenzae serotype b disease among cases < 15 year of age with reported vaccination status, by country, 2009
Age groups Country Fully vaccinated Partly vaccinated Not vaccinated Unknown Total
n % n % n % n % n
< 1 year Denmark 0 0.0% 0 0.0% 0 0.0% 1 100% 1
Finland 0 0.0% 0 0.0% 0 0.0% 1 100% 1
Lithuania 0 0.0% 0 0.0% 1 100% 0 0.0% 1
Poland 0 0.0% 1 25.0% 3 75.0% 0 0.0% 4
Slovakia 0 0.0% 0 0.0% 1 100% 0 0.0% 1
Sweden 0 0% 0 0.0% 1 100% 0 0% 1
United Kingdom 6 50% 2 16.7% 2 16.7% 2 16.7% 12
1–4 years Czech Republic 1 100% 0 0.0% 0 0.0% 0 0.0% 1
Finland 1 100% 0 0.0% 0 0.0% 0 0.0% 1
Greece 0 0% 0 0.0% 1 50.0% 1 50.0% 2
Ireland 0 0.0% 1 100% 0 0.0% 0 0.0% 1
Italy 0 0.0% 0 0.0% 0 0.0% 1 100% 1
Norway 1 100% 0 0.0% 0 0.0% 0 0.0% 1
Poland 3 100% 0 0.0% 0 0.0% 0 0.0% 3
United Kingdom 0 0.0% 0 0.0% 1 50.0% 1 50.0% 2
5–14 years Greece 0 0.0% 0 0.0% 0 0.0% 1 100% 1
Poland 0 0% 0 0.0% 1 100% 0 0.0% 1
Inclusion criteria: Countries reporting ≥ 1 case(s) of serotype b in 2009.
Table 24 Year of introduction of conjugate H. influenzae serotype b vaccination and childhood immunisation schedule in 2010
Country Year of Hib introduction
Vaccine given Combined with Immunisation schedule Source date:
Austria 1994 Hib-PRP-T DTaP, IPV, HBV 2, 4, 6 months, AND 2nd year of life
Jan-08
Belgium 1993 Hib-PRP-T DTaP, IPV, HBV 8, 12, 16 weeks AND 15 months
Aug-08
Bulgaria 2010 Hib-PRP-T DTaP, IPV, Hib 2, 3, 4 months AND 16 months
Jan -10
Cyprus 2001 Hib-PRP-T not combined 2–3, 4–5, 6–8, AND 12–18 months
Mar-09
Czech Republic
2001 Hib-PRP-T DTaP, IPV, HBV 13 weeks, 17 weeks–1 year, 21 weeks–1 year, 11 months 1 week–18 months
Sep-07
Denmark 1993 Hib-PRP-T DTaP, IPV 3, 5, AND 12 months Mar-09
Estonia 2005 Hib-PRP-T DTaP, IPV 3, 4.5, 6 months AND 2 years Febr-11
Finland 1986 Hib-PRP-T DTaP, IPV 3, 5, AND 12 months Sep-09
France 1992 Hib-PRP-T DTaP, IPV, HBV 2, 3, 4, AND 16–18 months Mar-09
Germany 1990 Hib-PRP-T DTaP, IPV, HBV 2, 3, 4 months AND 11–14 months
Jul-09
Greece 1999 Hib-PRP-T DTaP, IPV/OPV, HBV 2, 4, 6, AND 12–15 months Apr-07
Hungary 1999 Hib-PRP-T DTaP, IPV 2, 3, 4, AND 18 months Jan-10
Iceland 1989 Hib-PRP-T DTaP, IPV 3, 5, AND 12 months Oct-07
Ireland 1992 Hib-PRP-T DTaP, IPV, HBV 2, 4, 6, AND 13 months Jan-09

SURVEILLANCE REPORT Surveillance of invasive bacterial diseases in Europe 2008/2009
103
Country Year of Hib introduction
Vaccine given Combined with Immunisation schedule Source date:
Italy 1995 (1999 included in routine schedule)
Hib PRP-T DTaP, IPV, HBV 3, 5, AND 11 months Oct-10
Latvia 1994 Hib-PRP-T DTaP, IPV, HBV 2, 4, 6 AND 12–15 months Apr-10
Lichtenstein - - - -
Lithuania 2004 Hib-PRP-T DTaP, IPV 2, 4, 6 AND 18 months Jan-08
Luxembourg - - 1st, 2nd and 4th dose: DTaP, IPV, HBV
3rd dose: DTaP, IPV
2, 3, 4 AND 12 months Apr-08
Malta 1996 Hib-PRP-T Public: DTwP-OPV
Private: DTaP-IPV-HBV
Public: 6–8 weeks, 3 AND 4 months
Private: 2, 3, 4, AND 12–18 months
Mar-09
Netherlands 1993 Hib-PRP-T DTaP, IPV 2, 3, 4, AND 11 months Dec-06
Norway 1992 - DTaP, IPV 3, 5, 12 months Sep-06
Poland 2005 Hib 2, 3–4, 5–6, AND 16–18 months
Apr-07
Portugal 2000 Hib 1st, 2nd and 3rd dose: DTaP, IPV
4th dose: DTaP
2, 4, 6, AND 18 months Mar-09
Romania 2010 Hib-PRP-T DTaP-IPV-Hib 2, 4, 6 AND 12 months Jan-10
Slovakia 2000 Hib DTaP-IPV-HBV 2, 4 AND 10 months Mar-09
Slovenia 2000 Hib-PRP-T DTaP, IPV 3, 4–5, 6, AND 12–24 months Apr-09
Spain 1998 Hib-PRP-T DTaP, IPV, IPV 2, 4, 6, AND 15–18 months Jun-08
Sweden 1993 Hib-PRP-T DTaP, IPV 3, 5, AND 12 months Apr-10
United Kingdom
1992 Hib-PRP-T 1st, 2nd and 3rd dose: DTaP, IPV
4th dose: MenC
2, 3, 4 AND 12 months Apr-10
Source: EUVAC.NET (June 2010) http://www.euvac.net/graphics/euvac/vaccination/vaccination.html Cyprus and Estonia: comments from the countries.

Surveillance of invasive bacterial diseases in Europe 2008/2009 SURVEILLANCE REPORT
104
Annex 3: Invasive meningococcal disease Methods Table B1 Invasive menincococcal disease EU case definitions, 2002 and 2008
EU case definition confirmed 2002 (Decision 2002/253/EC)
Confirmed case
A clinically compatible case diagnosed by one or more of the following laboratory criteria:
• Isolation of N. meningitidis from a normally sterile site
• Detection of N. meningitidis nucleic acid from normally sterile site
• Detection of N. meningitidis antigen from normally sterile site
• Demonstration of Gram-negative diplococci from normally sterile site by microscopy
Probable case
A clinically compatible case that is diagnosed by one or more of the following laboratory criteria:
• N. meningitidis identification from a non-sterile site
• High levels of meningococcal antibody in convalescent serum
or
• Clinical picture compatible with meningococcal disease (e.g. meningitis and/or meningococcemia that may progress rapidly to purpura fulminans, shock and death. Other manifestations are possible) without any laboratory confirmation.
EU case definition confirmed 2008 (EC Decision of 28/IV/2008)
Clinical criteria
Any person with at least one of the following five:
• Fever
• Meningeal signs
• Petechial rash
• Septic shock
• Septic arthritis
Laboratory criteria
At least one of the following four:
• Isolation of N. meningitidis from normally sterile site, including purpuric skin lesions
• Detection of N. meningitidis nucleic acid from a normally sterile site, including purpuric skin lesions
• Detection of N. meningitidis antigen in CSF
• Detection of Gram-negative stained diplococci in CSF
Epidemiological criteria
• An epidemiological link by human-to-human transmission
Case classification
A. Possible case
• Any person meeting the clinical criteria
B. Probable case
• Any person meeting the clinical criteria and with an epidemiological link
C. Confirmed case
• Any person meeting the laboratory criteria

SURVEILLANCE REPORT Surveillance of invasive bacterial diseases in Europe 2008/2009
105
Data source Table B2 Overview of the sources of data used for invasive meningococcal disease report, 2008–2009
Country DataSource*
Lega
lCh
arac
ter
Com
preh
ensi
vene
ss
Act
ive
Cas
eBas
ed
Data reported by
Labo
rato
ries
Ph
ysic
ians
Hos
pita
ls
Oth
ers
Austria AT-Epidemiegesetz Cp Co P C Y Y Y Y
Belgium BE FRENCHCOMMUNITY
BE FLANDERS_BRUSSEL
Cp Co P C Y Y Y Y
Bulgaria BG-NATIONAL_SURVEILLANCE Cp Co P A Y Y Y Y
Cyprus CY -NOTIFIED_DISEASES Cp Co P C N Y N N
Czech Republic
CZ-EPIDAT Cp Co P C Y Y Y N
Denmark DK-MIS Cp Co P C N Y N N
Estonia EE-MENINGOCOCC Cp Co P C Y Y Y Y
Finland FI-NIDR Cp Co P C Y Y N N
France FR-MANDATORY_INFECTIOUS_DISEASES
Cp Co P C Y Y Y Y
Germany [email protected]/6 Cp Co P C Y Y Y Y
Greece GR-NOTIFIABLE_DISEASES Cp Co P C Y Y Y N
Hungary HU-EFRIR Cp Co P C Y Y Y N
Iceland IS-SUBJECT_TO_REGISTRATION Cp Co P C Y Y Y N
Ireland IE-CIDR Cp Co P C Y Y Y N
Italy IT-MENINGITIS Cp Co P C N Y Y N
Latvia LV-BSN Cp Co P C Y Y Y N
Latvia LV-LABORATORY Cp Co P C Y N N N
Lithuania LT-COMMUNICABLE_DISEASES Cp Co P C Y Y N N
Luxembourg LU-SYSTEM1 Cp Co P C - Y N N
Malta MT-DISEASE_SURVEILLANCE Cp Co P C Y Y Y Y
Netherlands NL-AGGR Cp Co P A Y Y N Y
Netherlands NL-OSIRIS Cp Co P C Y Y N Y
Norway NO-MSIS_A Cp Co P C Y Y Y N
Poland PL-NATIONAL_SURVEILLANCE Cp Co P C Y Y N N
Portugal PT-MENINGOCOCAL Cp Co P C Y Y N N
Romania RO-RNSSy Cp Co P C N N Y N
Slovakia SK-EPIS Cp Co P C Y Y Y N
Slovenia SI-SURVIVAL Cp Co P C Y Y Y N
Spain ES STATUTORY_DISEASES Cp Co P C N Y Y N
Sweden SE-SMINET Cp Co P C Y Y N N
United Kingdom
UK-MENINGOCOCCAL O Co P C Y N Y Y
*Sources of data used in the report. Cp: compulsory; Co: comprehensive; P: passive; C: case-based; A: active; Y: Yes; N: No. Clinically and laboratory notified cases are linked at national level, and submitted to TESSY with a single identifier.

Surveillance of invasive bacterial diseases in Europe 2008/2009 SURVEILLANCE REPORT
106
Data quality Table B3 Summary of the completeness of invasive meningococcal disease surveillance data, EU/EEA countries, 2008–2009
Variable Completeness (%) 2008 2009
2008–2009 2008 2009 Countries (N=28)
Min %
Max %
Countries (N=28)
Min %
Max %
Age 99.4 99.4 99.4 27 74.1 100.0 28 71.6 100.0
Classification 98.5 98.6 98.4 27 57.1 100.0 28 66.7 100.0
ClinicalCriteria 82.6 80.4 85.0 23 1.2 100.0 26 57.1 100.0
ClinicalPresentation 50.7 48.6 52.8 18 8.9 100.0 21 11.2 100.0
DateUsedForStatistics 100.0 100.0 100.0 28 100.0 100.0 28 100.0 100.0
DateOfDiagnosis 41.1 39.6 42.6 16 59.3 100.0 18 50.0 100.0
DateOfNotification 46.2 46.4 46.1 22 2.1 100.0 21 11.2 100.0
DateOfOnset 79.4 78.7 80.1 24 50.0 100.0 25 48.5 100.0
EpiLinked 34.6 34.9 34.2 18 1.2 100.0 17 1.2 100.0
Gender 97.7 99.6 95.7 27 98.6 100.0 28 45.6 100.0
Imported 46.8 45.1 48.6 21 4.4 100.0 23 1.4 100.0
LaboratoryResult 95.4 93.9 96.9 25 50.0 100.0 28 55.6 100.0
MIC_CIP 24.8 27.9 21.4 10 21.6 100.0 11 20.0 100.0
MIC_CTX 9.8 9.1 10.5 7 3.3 100.0 7 32.4 94.2
MIC_PEN 25.1 28.2 21.8 13 9.9 100.0 14 2.5 100.0
MIC_RIF 23.6 26.7 20.2 9 21.6 100.0 11 20.0 100.0
Outcome 91.7 91.6 91.8 26 24.7 100.0 28 34.6 100.0
Pathogen 98.7 97.6 99.9 26 50.0 100.0 28 55.6 100.0
ResultFetVR 11.4 6.1 17.1 8 0.5 86.1 9 13.3 81.8
ResultMLST1 10.9 6.2 16.0 7 3.5 66.7 9 8.6 70.5
ResultPorA1 25.1 20.9 29.5 13 7.0 91.7 15 12.4 97.7
ResultPorA2 25.2 20.9 29.7 13 7.5 91.7 15 12.4 97.7
Serogroup 87.7 87.6 87.8 25 33.9 100.0 26 32.4 100.0
Specimen1 78.1 76.0 80.2 23 1.2 100.0 25 45.7 100.0
Specimen2 16.1 16.2 15.9 18 0.3 100.0 21 0.2 100.0
TestMethod1 79.5 77.8 81.3 21 85.3 100.0 23 60.0 100.0
TestMethod2 52.7 54.2 51.0 17 2.5 100.0 19 2.9 100.0
VaccStatus 34.9 33.8 36.1 16 7.6 100.0 19 7.9 100.0
*N= Number of countries reporting the variable Due to aggregated reporting, Bulgaria is not included in the table. Missing, not applicable and UNK values have been classified as incomplete values.
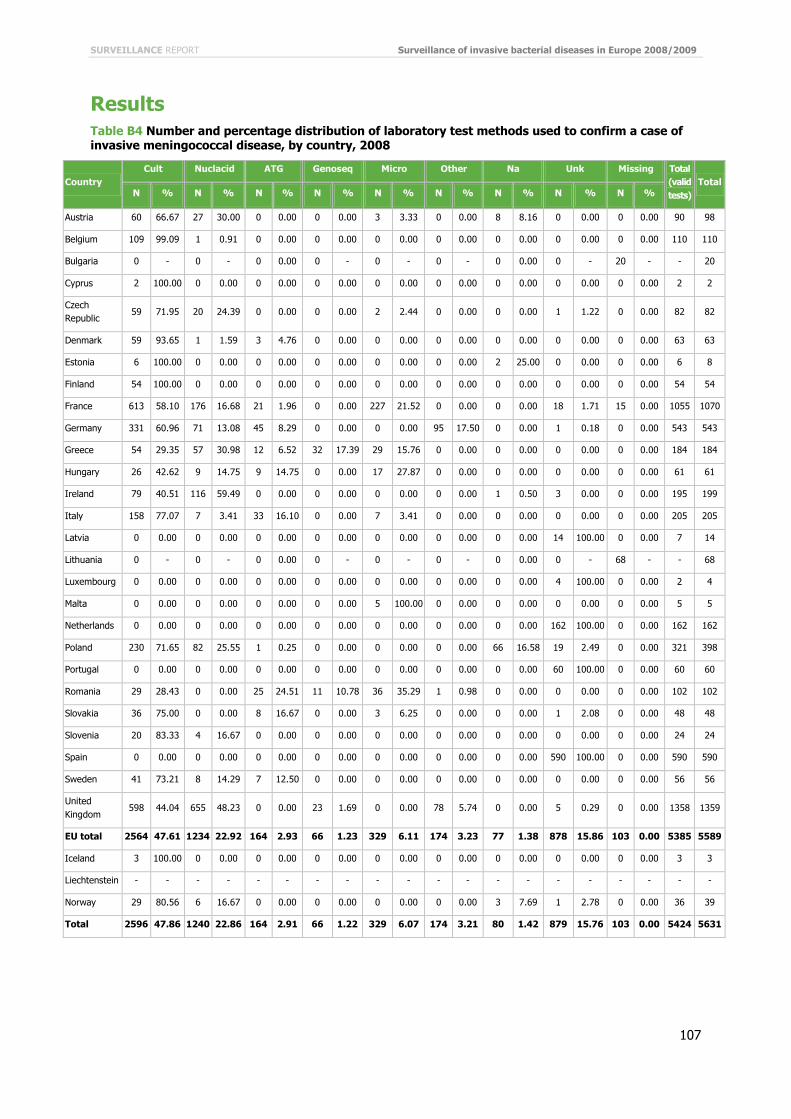
SURVEILLANCE REPORT Surveillance of invasive bacterial diseases in Europe 2008/2009
107
Results Table B4 Number and percentage distribution of laboratory test methods used to confirm a case of invasive meningococcal disease, by country, 2008
Country Cult Nuclacid ATG Genoseq Micro Other Na Unk Missing Total
(valid tests)
Total N % N % N % N % N % N % N % N % N %
Austria 60 66.67 27 30.00 0 0.00 0 0.00 3 3.33 0 0.00 8 8.16 0 0.00 0 0.00 90 98
Belgium 109 99.09 1 0.91 0 0.00 0 0.00 0 0.00 0 0.00 0 0.00 0 0.00 0 0.00 110 110
Bulgaria 0 - 0 - 0 0.00 0 - 0 - 0 - 0 0.00 0 - 20 - - 20
Cyprus 2 100.00 0 0.00 0 0.00 0 0.00 0 0.00 0 0.00 0 0.00 0 0.00 0 0.00 2 2
Czech Republic
59 71.95 20 24.39 0 0.00 0 0.00 2 2.44 0 0.00 0 0.00 1 1.22 0 0.00 82 82
Denmark 59 93.65 1 1.59 3 4.76 0 0.00 0 0.00 0 0.00 0 0.00 0 0.00 0 0.00 63 63
Estonia 6 100.00 0 0.00 0 0.00 0 0.00 0 0.00 0 0.00 2 25.00 0 0.00 0 0.00 6 8
Finland 54 100.00 0 0.00 0 0.00 0 0.00 0 0.00 0 0.00 0 0.00 0 0.00 0 0.00 54 54
France 613 58.10 176 16.68 21 1.96 0 0.00 227 21.52 0 0.00 0 0.00 18 1.71 15 0.00 1055 1070
Germany 331 60.96 71 13.08 45 8.29 0 0.00 0 0.00 95 17.50 0 0.00 1 0.18 0 0.00 543 543
Greece 54 29.35 57 30.98 12 6.52 32 17.39 29 15.76 0 0.00 0 0.00 0 0.00 0 0.00 184 184
Hungary 26 42.62 9 14.75 9 14.75 0 0.00 17 27.87 0 0.00 0 0.00 0 0.00 0 0.00 61 61
Ireland 79 40.51 116 59.49 0 0.00 0 0.00 0 0.00 0 0.00 1 0.50 3 0.00 0 0.00 195 199
Italy 158 77.07 7 3.41 33 16.10 0 0.00 7 3.41 0 0.00 0 0.00 0 0.00 0 0.00 205 205
Latvia 0 0.00 0 0.00 0 0.00 0 0.00 0 0.00 0 0.00 0 0.00 14 100.00 0 0.00 7 14
Lithuania 0 - 0 - 0 0.00 0 - 0 - 0 - 0 0.00 0 - 68 - - 68
Luxembourg 0 0.00 0 0.00 0 0.00 0 0.00 0 0.00 0 0.00 0 0.00 4 100.00 0 0.00 2 4
Malta 0 0.00 0 0.00 0 0.00 0 0.00 5 100.00 0 0.00 0 0.00 0 0.00 0 0.00 5 5
Netherlands 0 0.00 0 0.00 0 0.00 0 0.00 0 0.00 0 0.00 0 0.00 162 100.00 0 0.00 162 162
Poland 230 71.65 82 25.55 1 0.25 0 0.00 0 0.00 0 0.00 66 16.58 19 2.49 0 0.00 321 398
Portugal 0 0.00 0 0.00 0 0.00 0 0.00 0 0.00 0 0.00 0 0.00 60 100.00 0 0.00 60 60
Romania 29 28.43 0 0.00 25 24.51 11 10.78 36 35.29 1 0.98 0 0.00 0 0.00 0 0.00 102 102
Slovakia 36 75.00 0 0.00 8 16.67 0 0.00 3 6.25 0 0.00 0 0.00 1 2.08 0 0.00 48 48
Slovenia 20 83.33 4 16.67 0 0.00 0 0.00 0 0.00 0 0.00 0 0.00 0 0.00 0 0.00 24 24
Spain 0 0.00 0 0.00 0 0.00 0 0.00 0 0.00 0 0.00 0 0.00 590 100.00 0 0.00 590 590
Sweden 41 73.21 8 14.29 7 12.50 0 0.00 0 0.00 0 0.00 0 0.00 0 0.00 0 0.00 56 56
United Kingdom
598 44.04 655 48.23 0 0.00 23 1.69 0 0.00 78 5.74 0 0.00 5 0.29 0 0.00 1358 1359
EU total 2564 47.61 1234 22.92 164 2.93 66 1.23 329 6.11 174 3.23 77 1.38 878 15.86 103 0.00 5385 5589
Iceland 3 100.00 0 0.00 0 0.00 0 0.00 0 0.00 0 0.00 0 0.00 0 0.00 0 0.00 3 3
Liechtenstein - - - - - - - - - - - - - - - - - - - -
Norway 29 80.56 6 16.67 0 0.00 0 0.00 0 0.00 0 0.00 3 7.69 1 2.78 0 0.00 36 39
Total 2596 47.86 1240 22.86 164 2.91 66 1.22 329 6.07 174 3.21 80 1.42 879 15.76 103 0.00 5424 5631

Surveillance of invasive bacterial diseases in Europe 2008/2009 SURVEILLANCE REPORT
108
Table B5 Number and percentage distribution of laboratory test methods used to confirm a case of invasive meningococcal disease, by country, 2009
Country Culture Nuclacid ATG GENOSEQ Microscopy Other
Not applicable
Unk Missing Total (valid tests)
Total
N % N % N % N % N % N % N % N % N %
Austria 54 57.45 37 39.36 0 0 0 0 0 0 3 3.19 0 0 0 0 0 0 94 94
Belgium 103 99.04 0 0 0 0 1 0.96 0 0 0 0 0 0 0 0 0 0 104 104
Bulgaria 0 - 0 - 0 - 0 - 0 - 0 - 0 0 0 - 16 - - 16
Cyprus 1 100 0 0 0 0 0 0 0 0 0 0 0 0 0 0 0 0 1 1
Czech Republic
58 72.5 19 23.75 1 1.25 0 0 2 2.5 0 0 0 0 0 0 0 0 80 80
Denmark 58 81.69 4 5.63 3 4.23 0 0 2 2.82 1 1.41 0 0 3 4.23 0 0 71 71
Estonia 7 100 0 0 0 0 0 0 0 0 0 0 0 0 3 0 0 0 7 10
Finland 65 100 0 0 0 0 0 0 0 0 0 0 0 0 0 0 0 0 65 65
France 486 50.26 216 22.34 20 2.07 0 0 224 23.16 0 0 0 0 21 2.17 11 0 967 978
Germany 310 55.56 94 16.85 40 7.17 0 0 0 0 108 19.35 0 0 6 1.08 0 0 558 558
Greece 32 22.07 62 42.76 5 3.45 28 19.31 18 12.41 0 0 0 0 0 0 0 0 145 145
Hungary 25 34.25 16 21.92 10 13.7 5 6.85 17 23.29 0 0 0 0 0 0 0 0 73 73
Ireland 70 40.46 101 58.38 0 0 0 0 0 0 0 0 0 0 5 1.16 0 0 173 176
Italy 164 80.79 16 7.88 21 10.3 0 0 2 0.99 0 0 0 0 0 0 0 0 203 203
Latvia 0 0 0 0 0 0 0 0 0 0 0 0 0 0 10 100 0 0 5 10
Lithuania 36 65.45 0 0 0 0 0 0 0 0 19 34.55 0 0 0 0 0 0 55 55
Luxembourg 0 0 0 0 0 0 0 0 0 0 0 0 0 0 6 100 0 0 3 6
Malta 0 0 0 0 0 0 0 0 5 100 0 0 0 0 0 0 0 0 5 5
Netherlands 0 0 0 0 0 0 0 0 0 0 0 0 0 0 150 100 0 0 150 150
Poland 206 66.88 87 28.25 14 4.55 0 0 0 0 0 0 40 11.49 1 0.32 0 0 308 348
Portugal 0 0 0 0 0 0 0 0 0 0 0 0 0 0 65 100 0 0 65 65
Romania 24 22.86 0 0 21 20 15 14.29 45 42.86 0 0 0 0 0 0 0 0 105 105
Slovakia 34 87.18 1 2.56 3 7.69 0 0 1 2.56 0 0 0 0 0 0 0 0 39 39
Slovenia 11 73.33 4 26.67 0 0 0 0 0 0 0 0 0 0 0 0 0 0 15 15
Spain 0 0 0 0 0 0 0 0 0 0 0 0 0 0 533 100 0 0 533 533
Sweden 53 67.95 22 28.21 3 3.85 0 0 0 0 0 0 0 0 0 0 0 0 78 78
United Kingdom
463 38.84 615 51.59 1 0.08 29 2.43 0 0 83 6.96 0 0 1 0.08 0 0 1192 1192
EU total 2260 44.37 1294 25.4 142 2.79 78 1.53 316 6.2 214 4.2 40 0.77 804 15.51 27 0 5094 5175
Iceland 3 60 2 40 0 0 0 0 0 0 0 0 0 0 0 0 0 0 5 5
Liechtenstein - - - - - - - - - - - - - - - - - - - -
Norway 38 86.36 6 13.64 0 0 0 0 0 0 0 0 3 6.38 0 0 0 0 44 47
Total 2301 44.74 1302 25.32 142 2.76 78 1.52 316 6.14 214 4.16 43 0.82 804 15.36 27 0 5143 5227

SURVEILLANCE REPORT Surveillance of invasive bacterial diseases in Europe 2008/2009
109
Table B6 Notification rate (per 100 000 population) and total number of cases on invasive meningococcal disease cases by classification, by country, 2008
Country Number of cases
Population Incidence
Confirmed Probable Other Total Confirmed Probable Other Total
Austria 84 0 11 95 8 318 592 1.01 0.00 0.13 1.14
Belgium 110 0 1 111 10 666 866 1.03 0.00 0.01 1.04
Bulgaria 20 0 9 29 7 640 238 0.26 0.00 0.12 0.38
Cyprus 2 0 0 2 789 269 0.25 0.00 0.00 0.25
Czech Republic 82 2 0 84 10 381 130 0.79 0.02 0.00 0.81
Denmark 63 0 5 68 5 475 791 1.15 0.00 0.09 1.24
Estonia 6 0 0 6 1 340 935 0.45 0.00 0.00 0.45
Finland 28 0 0 28 5 300 484 0.53 0.00 0.00 0.53
France 673 0 6 679 63 982 881 1.05 0.00 0.01 1.06
Germany 452 0 0 452 82 217 837 0.55 0.00 0.00 0.55
Greece 78 1 2 81 11 213 785 0.70 0.01 0.02 0.72
Hungary 30 0 0 30 10 045 401 0.30 0.00 0.00 0.30
Ireland 152 0 10 162 4 401 335 3.45 0.00 0.23 3.68
Italy 178 0 5 183 59 619 290 0.30 0.00 0.01 0.31
Latvia 7 1 6 14 2 270 894 0.31 0.04 0.26 0.62
Lithuania 48 0 20 68 3 366 357 1.43 0.00 0.59 2.02
Luxembourg 2 0 0 2 483 799 0.41 0.00 0.00 0.41
Malta 3 0 0 3 410 290 0.73 0.00 0.00 0.73
Netherlands 162 0 0 162 16 405 399 0.99 0.00 0.00 0.99
Poland 321 0 52 373 38 115 641 0.84 0.00 0.14 0.98
Portugal 60 0 17 77 10 617 575 0.57 0.00 0.16 0.73
Romania 99 16 0 115 21 528 627 0.46 0.07 0.00 0.53
Slovakia 48 2 1 51 5 400 998 0.89 0.04 0.02 0.94
Slovenia 24 0 0 24 2 010 269 1.19 0.00 0.00 1.19
Spain 590 0 0 590 45 283 259 1.30 0.00 0.00 1.30
Sweden 49 0 0 49 9 182 927 0.53 0.00 0.00 0.53
United Kingdom 1 355 0 47 1 402 61 179 256 2.21 0.00 0.08 2.29
EU total 4 726 22 192 4 940 497 649 125 0.95 0.00 0.04 0.99
Iceland 2 0 0 2 315 459 0.63 0.00 0.00 0.63
Liechtenstein - - - - 35 356 - - - -
Norway 36 0 0 36 473 7171 0.76 0.00 0.00 0.76
Total 4 764 22 192 4 978 502 737 111 0.95 0.00 0.04 0.99
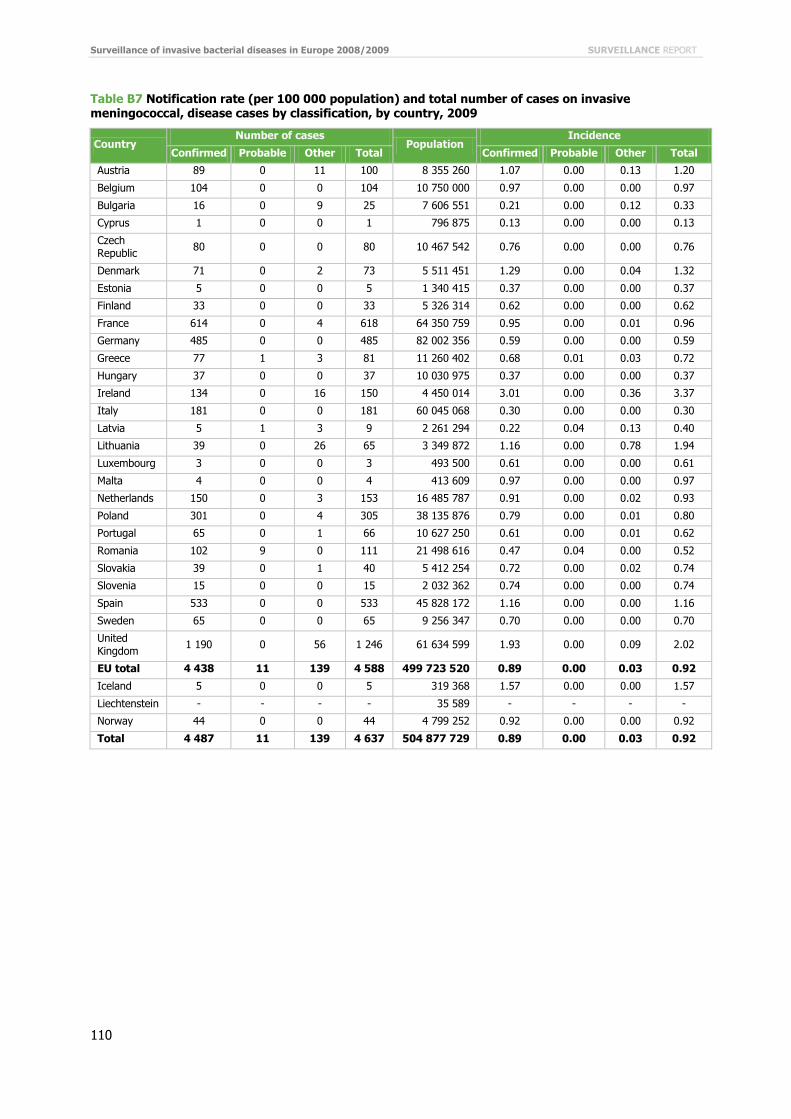
Surveillance of invasive bacterial diseases in Europe 2008/2009 SURVEILLANCE REPORT
110
Table B7 Notification rate (per 100 000 population) and total number of cases on invasive meningococcal, disease cases by classification, by country, 2009
Country Number of cases
Population Incidence
Confirmed Probable Other Total Confirmed Probable Other Total
Austria 89 0 11 100 8 355 260 1.07 0.00 0.13 1.20
Belgium 104 0 0 104 10 750 000 0.97 0.00 0.00 0.97
Bulgaria 16 0 9 25 7 606 551 0.21 0.00 0.12 0.33
Cyprus 1 0 0 1 796 875 0.13 0.00 0.00 0.13
Czech Republic 80 0 0 80 10 467 542 0.76 0.00 0.00 0.76
Denmark 71 0 2 73 5 511 451 1.29 0.00 0.04 1.32
Estonia 5 0 0 5 1 340 415 0.37 0.00 0.00 0.37
Finland 33 0 0 33 5 326 314 0.62 0.00 0.00 0.62
France 614 0 4 618 64 350 759 0.95 0.00 0.01 0.96
Germany 485 0 0 485 82 002 356 0.59 0.00 0.00 0.59
Greece 77 1 3 81 11 260 402 0.68 0.01 0.03 0.72
Hungary 37 0 0 37 10 030 975 0.37 0.00 0.00 0.37
Ireland 134 0 16 150 4 450 014 3.01 0.00 0.36 3.37
Italy 181 0 0 181 60 045 068 0.30 0.00 0.00 0.30
Latvia 5 1 3 9 2 261 294 0.22 0.04 0.13 0.40
Lithuania 39 0 26 65 3 349 872 1.16 0.00 0.78 1.94
Luxembourg 3 0 0 3 493 500 0.61 0.00 0.00 0.61
Malta 4 0 0 4 413 609 0.97 0.00 0.00 0.97
Netherlands 150 0 3 153 16 485 787 0.91 0.00 0.02 0.93
Poland 301 0 4 305 38 135 876 0.79 0.00 0.01 0.80
Portugal 65 0 1 66 10 627 250 0.61 0.00 0.01 0.62
Romania 102 9 0 111 21 498 616 0.47 0.04 0.00 0.52
Slovakia 39 0 1 40 5 412 254 0.72 0.00 0.02 0.74
Slovenia 15 0 0 15 2 032 362 0.74 0.00 0.00 0.74
Spain 533 0 0 533 45 828 172 1.16 0.00 0.00 1.16
Sweden 65 0 0 65 9 256 347 0.70 0.00 0.00 0.70
United Kingdom 1 190 0 56 1 246 61 634 599 1.93 0.00 0.09 2.02
EU total 4 438 11 139 4 588 499 723 520 0.89 0.00 0.03 0.92
Iceland 5 0 0 5 319 368 1.57 0.00 0.00 1.57
Liechtenstein - - - - 35 589 - - - -
Norway 44 0 0 44 4 799 252 0.92 0.00 0.00 0.92
Total 4 487 11 139 4 637 504 877 729 0.89 0.00 0.03 0.92

SURVEILLANCE REPORT Surveillance of invasive bacterial diseases in Europe 2008/2009
111
Table B8 Seasonal distribution of total number of invasive meningococcal disease cases, by country, 2008
Cou
ntr
y
Mon
th 1
Mon
th 2
Mon
th 3
Mon
th 4
Mon
th 5
Mon
th 6
Mon
th 7
Mon
th 8
Mon
th 9
Mon
th 1
0
Mon
th 1
1
Mon
th 1
2
Un
k
Tota
l
Austria 8 15 16 8 4 9 6 1 4 5 4 15 0 95
Belgium 16 12 12 10 6 8 6 6 7 7 8 13 0 111
Bulgaria 4 6 2 2 2 2 3 0 1 2 1 4 0 29
Cyprus 0 0 1 0 0 0 1 0 0 0 0 0 0 2
Czech Republic 15 6 8 12 8 4 7 5 3 2 5 9 0 84
Denmark 4 7 9 4 4 4 0 2 8 8 7 11 0 68
Estonia 1 1 0 1 0 0 0 0 1 0 0 2 0 6
Finland 3 5 5 2 0 4 1 0 2 0 4 2 0 28
France 95 62 65 75 54 46 45 38 36 54 52 57 0 679
Germany 49 56 51 31 35 41 21 23 32 28 40 45 0 452
Greece 11 13 10 10 5 2 4 3 1 6 5 11 0 81
Hungary 7 0 5 4 2 2 0 0 1 7 2 0 0 30
Ireland 25 17 10 10 13 8 16 8 10 7 15 23 0 162
Italy 27 24 29 18 9 8 9 3 5 14 17 20 0 183
Latvia 0 0 0 0 0 0 0 0 0 0 0 0 14 14
Lithuania 5 5 5 9 9 6 3 2 8 8 7 1 0 68
Luxembourg 0 0 0 0 0 0 0 0 1 0 0 1 0 2
Malta 0 1 0 0 0 1 0 1 0 0 0 0 0 3
Netherlands 21 10 11 24 12 0 17 12 13 14 12 16 0 162
Poland 32 43 40 35 30 25 20 18 12 31 33 54 0 373
Portugal 9 8 8 7 9 3 4 2 8 5 6 8 0 77
Romania 4 11 8 18 16 10 8 10 5 10 4 11 0 115
Slovakia 3 6 7 7 1 5 4 4 2 4 3 5 0 51
Slovenia 3 6 1 3 1 2 1 2 0 1 2 2 0 24
Spain 106 83 57 53 25 36 39 21 25 43 43 59 0 590
Sweden 8 1 0 5 3 6 3 4 6 4 6 3 0 49
United Kingdom 234 111 103 135 95 69 89 74 57 121 96 218 0 1 402
EU total 690 509 463 483 343 301 307 239 248 381 372 590 14 4 940
Iceland 0 0 1 0 0 0 0 0 0 1 0 0 0 2
Liechtenstein - - - - - - - - - - - - - -
Norway 0 3 4 2 5 0 4 4 6 4 0 4 0 36
Total 690 512 468 485 348 301 311 243 254 386 372 594 14 4 978

Surveillance of invasive bacterial diseases in Europe 2008/2009 SURVEILLANCE REPORT
112
Table B9 Seasonal distribution of total number of invasive meningococcal disease cases, by country, 2009
Cou
ntr
y
Mon
th 1
Mon
th 2
Mon
th 3
Mon
th 4
Mon
th 5
Mon
th 6
Mon
th 7
Mon
th 8
Mon
th 9
Mon
th 1
0
Mon
th 1
1
Mon
th 1
2
Un
k
Tota
l
Austria 15 10 8 7 11 7 8 5 5 4 13 7 0 100
Belgium 15 17 13 8 9 3 5 7 4 8 4 11 0 104
Bulgaria 4 4 2 2 2 1 3 2 0 1 3 1 0 25
Cyprus 0 0 0 1 0 0 0 0 0 0 0 0 0 1
Czech Republic 10 6 10 5 2 2 10 3 4 11 10 7 0 80
Denmark 11 9 5 6 5 8 7 2 3 4 6 7 0 73
Estonia 0 0 2 0 1 1 0 0 0 0 0 1 0 5
Finland 3 2 5 1 3 2 3 5 1 4 3 1 0 33
France 95 73 65 60 49 33 38 34 26 46 52 47 0 618
Germany 78 56 78 37 33 34 23 24 23 23 37 39 0 485
Greece 9 15 11 10 5 5 6 1 3 4 5 7 0 81
Hungary 10 2 5 2 4 3 3 1 0 3 0 4 0 37
Ireland 21 23 12 11 9 12 11 7 13 12 5 14 0 150
Italy 27 24 29 24 11 13 6 4 7 10 17 9 0 181
Latvia 0 0 0 0 0 0 0 0 0 0 0 0 9 9
Lithuania 6 3 5 6 9 4 6 4 6 3 6 7 0 65
Luxembourg 0 0 0 0 0 0 1 0 0 0 2 0 0 3
Malta 0 2 2 0 0 0 0 0 0 0 0 0 0 4
Netherlands 0 24 23 16 6 10 26 15 7 12 10 4 0 153
Poland 35 40 32 17 36 21 21 12 12 24 29 26 0 305
Portugal 20 7 8 4 4 2 1 5 3 1 5 6 0 66
Romania 21 19 12 13 8 2 0 5 7 6 7 11 0 111
Slovakia 4 6 3 4 2 2 4 4 0 1 6 4 0 40
Slovenia 4 0 1 1 0 1 3 0 0 3 0 2 0 15
Spain 110 65 50 35 48 25 28 26 26 34 42 44 0 533
Sweden 10 9 5 1 4 3 7 5 9 5 5 2 0 65
United Kingdom 234 109 110 99 84 94 68 52 52 129 112 103 0 1 246
EU total 742 525 496 370 345 288 288 223 211 348 379 364 9 4 588
Iceland 1 0 1 0 1 0 0 0 0 1 1 0 0 5
Liechtenstein - - - - - - - - - - - - - -
Norway 5 5 3 2 3 5 1 4 3 6 1 6 0 44
Total 748 530 500 372 349 293 289 227 214 355 381 370 9 4 637
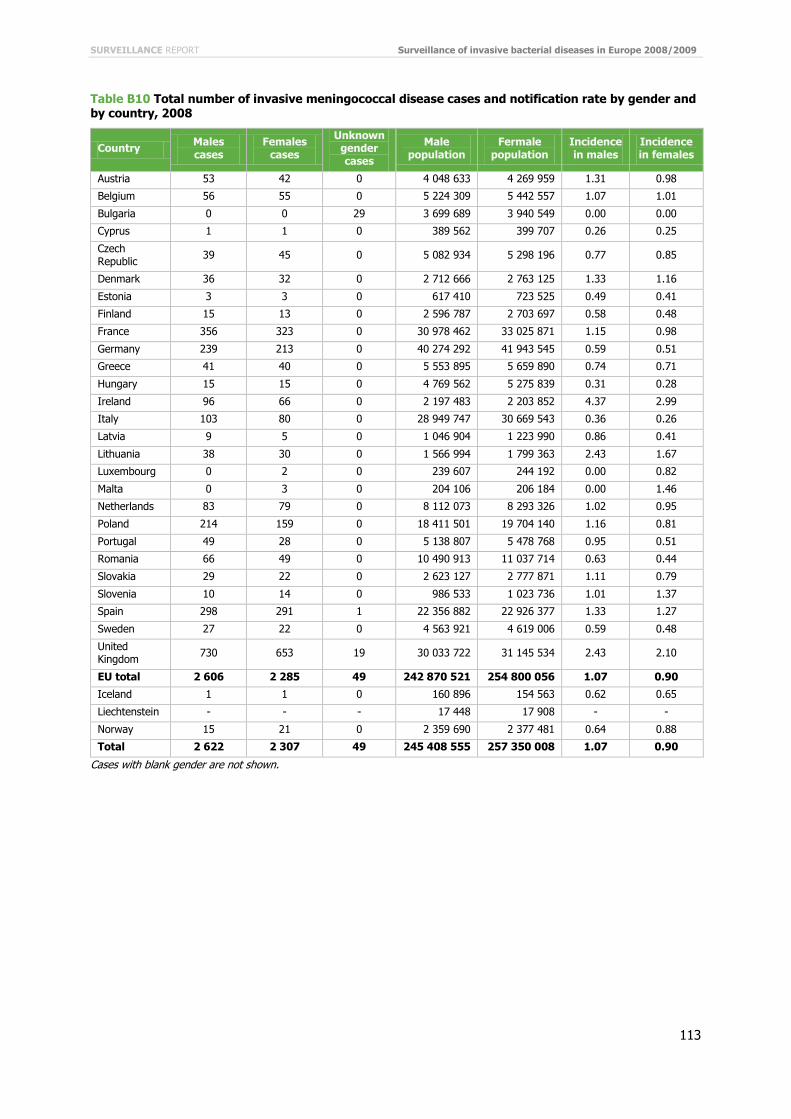
SURVEILLANCE REPORT Surveillance of invasive bacterial diseases in Europe 2008/2009
113
Table B10 Total number of invasive meningococcal disease cases and notification rate by gender and by country, 2008
Country Males cases
Females cases
Unknown gender cases
Male population
Fermale population
Incidence in males
Incidence in females
Austria 53 42 0 4 048 633 4 269 959 1.31 0.98
Belgium 56 55 0 5 224 309 5 442 557 1.07 1.01
Bulgaria 0 0 29 3 699 689 3 940 549 0.00 0.00
Cyprus 1 1 0 389 562 399 707 0.26 0.25
Czech Republic 39 45 0 5 082 934 5 298 196 0.77 0.85
Denmark 36 32 0 2 712 666 2 763 125 1.33 1.16
Estonia 3 3 0 617 410 723 525 0.49 0.41
Finland 15 13 0 2 596 787 2 703 697 0.58 0.48
France 356 323 0 30 978 462 33 025 871 1.15 0.98
Germany 239 213 0 40 274 292 41 943 545 0.59 0.51
Greece 41 40 0 5 553 895 5 659 890 0.74 0.71
Hungary 15 15 0 4 769 562 5 275 839 0.31 0.28
Ireland 96 66 0 2 197 483 2 203 852 4.37 2.99
Italy 103 80 0 28 949 747 30 669 543 0.36 0.26
Latvia 9 5 0 1 046 904 1 223 990 0.86 0.41
Lithuania 38 30 0 1 566 994 1 799 363 2.43 1.67
Luxembourg 0 2 0 239 607 244 192 0.00 0.82
Malta 0 3 0 204 106 206 184 0.00 1.46
Netherlands 83 79 0 8 112 073 8 293 326 1.02 0.95
Poland 214 159 0 18 411 501 19 704 140 1.16 0.81
Portugal 49 28 0 5 138 807 5 478 768 0.95 0.51
Romania 66 49 0 10 490 913 11 037 714 0.63 0.44
Slovakia 29 22 0 2 623 127 2 777 871 1.11 0.79
Slovenia 10 14 0 986 533 1 023 736 1.01 1.37
Spain 298 291 1 22 356 882 22 926 377 1.33 1.27
Sweden 27 22 0 4 563 921 4 619 006 0.59 0.48
United Kingdom 730 653 19 30 033 722 31 145 534 2.43 2.10
EU total 2 606 2 285 49 242 870 521 254 800 056 1.07 0.90
Iceland 1 1 0 160 896 154 563 0.62 0.65
Liechtenstein - - - 17 448 17 908 - -
Norway 15 21 0 2 359 690 2 377 481 0.64 0.88
Total 2 622 2 307 49 245 408 555 257 350 008 1.07 0.90
Cases with blank gender are not shown.

Surveillance of invasive bacterial diseases in Europe 2008/2009 SURVEILLANCE REPORT
114
Table B11 Total number of invasive meningococcal disease cases and notification rate by gender and by countries, 2009
Country Mele cases Female cases
Unknown gender cases
Male population
Female population
Incidence in
males
Incidence in females
Austria 53 47 0 4 068 047 4 287 213 1.30 1.10
Belgium 40 64 0 5 224 309 5 442 557 0.77 1.18
Bulgaria 0 0 25 3 681 280 3 925 271 0.00 0.00
Cyprus 0 1 0 395 001 401 874 0.00 0.25
Czech Republic 40 40 0 5 136 377 5 331 165 0.78 0.75
Denmark 40 33 0 2 732 020 2 779 431 1.46 1.19
Estonia 5 0 0 617 299 723 116 0.81 0.00
Finland 19 14 0 2 611 653 2 714 661 0.73 0.52
France 336 281 0 31 158 647 33 208 315 1.08 0.85
Germany 264 221 0 40 184 283 41 818 073 0.66 0.53
Greece 43 38 0 5 576 740 5 683 662 0.77 0.67
Hungary 22 15 0 4 763 050 5 267 925 0.46 0.28
Ireland 84 65 1 2 214 847 2 235 183 3.79 2.91
Italy 92 85 4 29 152 423 30 892 645 0.32 0.28
Latvia 5 4 0 1 043 120 1 218 174 0.48 0.33
Lithuania 35 30 0 1 559 247 1 790 625 2.24 1.68
Luxembourg 2 1 0 244 835 248 665 0.82 0.40
Malta 4 0 0 205 873 207 736 1.94 0.00
Netherlands 73 80 0 8 156 396 8 329 391 0.90 0.96
Poland 0 139 166 18 414 926 19 720 950 0.00 0.70
Portugal 43 23 0 5 142 566 5 484 684 0.84 0.42
Romania 64 47 0 10 472 812 11 025 804 0.61 0.43
Slovakia 27 13 0 2 629 804 2 782 450 1.03 0.47
Slovenia 11 4 0 1 003 945 1 028 417 1.10 0.39
Spain 262 271 0 22 628 444 23 199 728 1.16 1.17
Sweden 30 35 0 4 603 710 4 652 637 0.65 0.75
United Kingdom 633 585 28 30 033 722 31 145 534 2.11 1.88
EU total 2 227 2 136 224 243 655 376 255545886 0.91 0.84
Iceland 1 4 0 162 068 157 300 0.62 2.54
Liechtenstein - - - 17 591 17 998 - -
Norway 22 22 0 2 395 053 2 404 199 0.92 0.92
Total 2 250 2 162 224 246 230 088 258 125 383 0.91 0.84
Cases with blank gender are not shown.

SURVEILLANCE REPORT Surveillance of invasive bacterial diseases in Europe 2008/2009
115
Table B12 Notification rate (per 100 000) and total number of reported invasive meningococcal disease cases by age group and country, 2008
Country
< 1 year
1–4 years
5–9 years
10–14 years
15–19 years
20–24 years
25–44 years
45–64 years
65+ years Unk
Rate (n)
Rate (n)
Rate (n)
Rate (n)
Rate (n)
Rate (n)
Rate (n)
Rate (n)
Rate (n) n
Austria 14.53 (11)
4.68 (15)
1.94 (8)
1.70 (8)
4.20 (21)
2.12 (11)
0.37 (9)
0.63 (9)
0.21 (3) 0
Belgium 19.01 (23)
5.84 (28)
1.36 (8)
0.33 (2)
2.45 (16)
0.16 (1)
0.41 (12)
0.60 (11)
0.55 (10) 0
Bulgaria 0.00 (0)
0.00 (0)
0.00 (0)
0.00 (0)
0.00 (0)
0.00 (0)
0.00 (0)
0.00 (0)
0.00 (0) 29
Cyprus 0.00 (0)
2.95 (1)
0.00 (0)
0.00 (0)
1.76 (1)
0.00 (0)
0.00 (0)
0.00 (0)
0.00 (0) 0
Czech Republic
9.61 (11)
2.99 (12)
1.98 (9)
1.19 (6)
3.09 (20)
1.29 (9)
0.31 (10)
0.33 (5)
0.13 (2) 0
Denmark 18.63 (12)
4.98 (13)
2.11 (7)
1.14 (4)
4.19 (14)
0.99 (3)
0.07 (1)
0.47 (4)
1.17 (10) 0
Estonia 6.36 (1)
1.79 (1)
1.61 (1)
0.00 (0)
1.03 (1)
0.00 (0)
0.27 (1)
0.43 (1)
0.00 (0) 0
Finland 6.80 (4)
1.29 (3)
0.00 (0)
0.63 (2)
1.21 (4)
0.31 (1)
0.29 (4)
0.34 (3)
0.80 (7) 0
France 13.00 (106)
4.81 (152)
1.31 (52)
0.86 (33)
2.41 (99)
1.74 (71)
0.36 (62)
0.48 (50)
0.51 (54) 0
Germany 10.36 (71)
2.77 (77)
0.84 (32)
0.57 (23)
2.15 (100)
0.58 (28)
0.21 (48)
0.27 (45)
0.17 (28) 0
Greece 0.00 (0)
2.55 (11)
1.75 (9)
1.29 (7)
1.20 (7)
1.05 (7)
0.35 (12)
0.19 (4)
0.14 (3) 21
Hungary 3.12 (3)
2.84 (11)
0.41 (2)
0.37 (2)
0.32 (2)
0.15 (1)
0.07 (2)
0.25 (4)
0.18 (3) 0
Ireland 59.71 (42)
22.47 (57)
3.32 (10)
3.22 (9)
5.27 (15)
3.56 (12)
0.49 (7)
1.67 (8)
0.42 (2) 0
Italy 3.94 (22)
1.11 (25)
0.61 (17)
0.47 (13)
0.94 (28)
0.52 (16)
0.13 (24)
0.23 (27)
0.09 (11) 0
Latvia 8.46 (2)
8.15 (7)
0.00 (0)
0.94 (1)
0.00 (0)
0.00 (0)
0.47 (3)
0.00 (0)
0.26 (1) 0
Lithuania 62.16 (20)
18.93 (23)
3.66 (6)
1.00 (2)
1.91 (5)
0.00 (0)
0.53 (5)
0.94 (5)
0.38 (2) 0
Luxembourg 0.00 (0)
4.43 (1)
0.00 (0)
0.00 (0)
0.00 (0)
0.00 (0)
0.00 (0)
1.48 (1)
0.00 (0) 0
Malta 0.00 (0)
0.00 (0)
0.00 (0)
0.00 (0)
0.00 (0)
3.42 (1)
0.00 (0)
3.52 (2)
0.00 (0) 0
Netherlands 9.96 (18)
6.67 (51)
1.78 (18)
0.92 (9)
1.29 (13)
0.51 (5)
0.22 (10)
0.83 (20)
0.75 (18) 0
Poland 17.87 (69)
5.98 (86)
1.93 (36)
0.99 (22)
1.96 (53)
0.84 (27)
0.37 (41)
0.55 (28)
0.21 (11) 0
Portugal 19.58 (20)
7.83 (34)
1.81 (10)
0.19 (1)
0.51 (3)
0.00 (0)
0.09 (3)
0.22 (4)
0.11 (2) 0
Romania 10.35 (22)
3.16 (27)
1.66 (18)
0.53 (6)
0.54 (8)
0.36 (6)
0.17 (11)
0.22 (7)
0.31 (10) 0
Slovakia 16.61 (9)
4.71 (10)
3.37 (9)
1.58 (5)
1.28 (5)
0.69 (3)
0.36 (6)
0.46 (3)
0.15 (1) 0

Surveillance of invasive bacterial diseases in Europe 2008/2009 SURVEILLANCE REPORT
116
Country
< 1 year
1–4 years
5–9 years
10–14 years
15–19 years
20–24 years
25–44 years
45–64 years
65+ years Unk
Rate (n)
Rate (n)
Rate (n)
Rate (n)
Rate (n)
Rate (n)
Rate (n)
Rate (n)
Rate (n) n
Slovenia 20.50 (4)
5.46 (4)
2.21 (2)
0.00 (0)
4.39 (5)
2.27 (3)
0.00 (0)
0.61 (2)
1.22 (4) 0
Spain 25.37 (124)
7.52 (141)
2.40 (52)
0.91 (19)
1.93 (44)
1.15 (32)
0.45 (68)
0.65 (49)
0.73 (55) 6
Sweden 1.86 (2)
0.72 (3)
0.21 (1)
0.37 (2)
1.88 (12)
1.26 (7)
0.16 (4)
0.44 (7)
0.68 (11) 0
United Kingdom
48.71 (376)
14.51 (417)
2.40 (82)
1.60 (59)
3.72 (149)
1.31 (55)
0.46 (78)
1.17 (115)
0.72 (71) 0
EU total 18.49 (972)
5.90 (1 210)
1.52 (389)
0.88 (235)
2.08 (625)
0.93 (299)
0.29 (421)
0.49 (414)
0.38 (319) 56
Iceland 0.00 (0)
0.00 (0)
0.00 (0)
0.00 (0)
0.00 (0)
4.42 (1)
0.00 (0)
2.75 (1)
0.00 (0) 0
Liechtenstein - (-)
- (-)
- (-)
- (-)
- (-)
- (-)
- (-)
- (-)
- (-) -
Norway 6.82 (4)
2.13 (5)
0.00 (0)
0.64 (2)
3.17 (10)
1.05 (3)
0.08 (1)
0.58 (4)
1.01 (7) 0
Total 18.34 (976)
5.85 (1 215)
1.50 (389)
0.88 (237)
2.09 (635)
0.94 (303)
0.29 (422)
0.49 (419)
0.38 (326) 56
Age class for Bulgaria is missing due to implausible age classification.
Table B13 Notification rate (per 100 000) and total number of reported invasive meningococcal disease cases by age group and country, 2009
Country
< 1 year
1–4 years
5–9 years
10–14 years
15–19 years
20–24 years
25–44 years
45–64 years
65+ years Unk
Rate (n)
Rate (n)
Rate (n)
Rate (n)
Rate (n)
Rate (n)
Rate (n)
Rate (n)
Rate (n) n
Austria 10.36 (8)
4.38 (14)
3.44 (14)
2.40 (11)
5.37 (27)
0.58 (3)
0.33 (8)
0.41 (6)
0.62 (9) 0
Belgium 11.57 (14)
5.00 (24)
1.19 (7)
0.66 (4)
2.61 (17)
0.47 (3)
0.34 (10)
0.33 (6)
1.04 (19)
0
Bulgaria 0.00 (0)
0.00 (0)
0.00 (0)
0.00 (0)
0.00 (0)
0.00 (0)
0.00 (0)
0.00 (0)
0.00 (0)
25
Cyprus 0.00 (0)
0.00 (0)
0.00 (0)
0.00 (0)
1.76 (1)
0.00 (0)
0.00 (0)
0.00 (0)
0.00 (0)
0
Czech Republic
6.67 (8)
5.91 (25)
1.30 (6)
0.42 (2)
2.35 (15)
0.14 (1)
0.40 (13)
0.58 (9)
0.06 (1)
0
Denmark 13.78 (9)
9.56 (25)
0.91 (3)
1.71 (6)
2.92 (10)
1.90 (6)
0.13 (2)
0.57 (5)
0.80 (7) 0
Estonia 6.27 (1)
1.71 (1)
0.00 (0)
0.00 (0)
0.00 (0)
0.00 (0)
0.27 (1)
0.87 (2)
0.00 (0) 0
Finland 10.07 (6)
0.42 (1)
0.35 (1)
0.00 (0)
1.80 (6)
1.23 (4)
0.22 (3)
0.67 (6)
0.67 (6)
0
France 11.20 (93)
4.07 (130)
1.23 (49)
0.77 (30)
2.53 (102)
1.43 (59)
0.33 (57)
0.55 (59)
0.37 (39)
0
Germany 8.93 (61)
3.19 (88)
0.65 (24)
0.96 (38)
2.10 (94)
1.02 (50)
0.16 (35)
0.27 (46)
0.29 (49)
0

SURVEILLANCE REPORT Surveillance of invasive bacterial diseases in Europe 2008/2009
117
Country
< 1 year
1–4 years
5–9 years
10–14 years
15–19 years
20–24 years
25–44 years
45–64 years
65+ years Unk
Rate (n)
Rate (n)
Rate (n)
Rate (n)
Rate (n)
Rate (n)
Rate (n)
Rate (n)
Rate (n) n
Greece 0.00 (0)
1.59 (7)
2.12 (11)
1.49 (8)
1.57 (9)
0.77 (5)
0.26 (9)
0.24 (5)
0.19 (4)
23
Hungary 6.18 (6)
2.31 (9)
0.42 (2)
0.38 (2)
0.82 (5)
0.62 (4)
0.20 (6)
0.18 (3)
0.00 (0)
0
Ireland 56.08 (41)
15.09 (40)
3.91 (12)
2.10 (6)
7.86 (22)
3.20 (10)
0.49 (7)
0.81 (4)
1.63 (8)
0
Italy 2.77 (16)
1.50 (34)
0.64 (18)
0.50 (14)
0.84 (25)
0.55 (17)
0.14 (25)
0.19 (23)
0.07 (9) 0
Latvia 4.28 (1)
4.51 (4)
1.01 (1)
0.00 (0)
0.00 (0)
0.00 (0)
0.31 (2)
0.00 (0)
0.26 (1) 0
Lithuania 40.14 (14)
18.66 (23)
3.16 (5)
3.18 (6)
1.97 (5)
1.10 (3)
0.32 (3)
0.93 (5)
0.19 (1)
0
Luxembourg 0.00 (0)
0.00 (0)
3.37 (1)
3.29 (1)
3.43 (1)
0.00 (0)
0.00 (0)
0.00 (0)
0.00 (0)
0
Malta 0.00 (0)
12.54 (2)
4.82 (1)
0.00 (0)
0.00 (0)
0.00 (0)
0.00 (0)
1.72 (1)
0.00 (0)
0
Netherlands 10.85 (20)
6.69 (50)
1.78 (18)
0.71 (7)
1.39 (14)
0.80 (8)
0.15 (7)
0.49 (12)
0.69 (17)
0
Poland 15.97 (66)
5.69 (84)
1.05 (19)
1.08 (23)
1.34 (35)
0.72 (22)
0.26 (29)
0.33 (17)
0.19 (10) 0
Portugal 18.23 (19)
5.18 (22)
1.25 (7)
0.19 (1)
1.04 (6)
0.16 (1)
0.12 (4)
0.21 (4)
0.05 (1) 1
Romania 13.64 (30)
4.08 (35)
0.93 (10)
0.54 (6)
0.22 (3)
0.18 (3)
0.12 (8)
0.38 (12)
0.13 (4)
0
Slovakia 17.50 (10)
4.64 (10)
0.00 (0)
1.00 (3)
1.57 (6)
0.93 (4)
0.30 (5)
0.31 (2)
0.00 (0)
0
Slovenia 22.83 (5)
6.55 (5)
2.22 (2)
1.05 (1)
0.00 (0)
0.75 (1)
0.16 (1)
0.00 (0)
0.00 (0)
0
Spain 20.23 (101)
7.03 (135)
2.45 (55)
1.48 (31)
1.59 (36)
0.85 (23)
0.29 (44)
0.72 (55)
0.67 (51)
2
Sweden 5.47 (6)
0.47 (2)
0.41 (2)
0.97 (5)
2.34 (15)
1.03 (6)
0.24 (6)
0.61 (10)
0.79 (13) 0
United Kingdom
41.97 (324)
12.04 (346)
3.37 (115)
1.30 (48)
3.25 (130)
1.29 (54)
0.42 (71)
0.91 (90)
0.69 (68) 0
EU total 15.99 (859)
5.39 (1 116)
1.50 (383)
0.96 (253)
1.98 (584)
0.90 (287)
0.25 (356)
0.45 (382)
0.37 (317) 51
Iceland 0.00 (0)
5.54 (1)
4.68 (1)
0.00 (0)
8.38 (2)
0.00 (0)
0.00 (0)
0.00 (0)
2.69 (1)
0
Liechtenstein -
(-) -
(-) -
(-) -
(-) -
(-) -
(-) -
(-) -
(-) -
(-) -
Norway 9.89 (6)
1.68 (4)
0.00 (0)
0.64 (2)
4.07 (13)
0.68 (2)
0.30 (4)
0.71 (5)
1.14 (8)
0
Total 15.91 (865)
5.35 (1 121)
1.48 (384)
0.95 (255)
2.01 (599)
0.90 (289)
0.25 (360)
0.45 (387)
0.38 (326) 51
Age class for Bulgaria is missing due to implausible age classification.
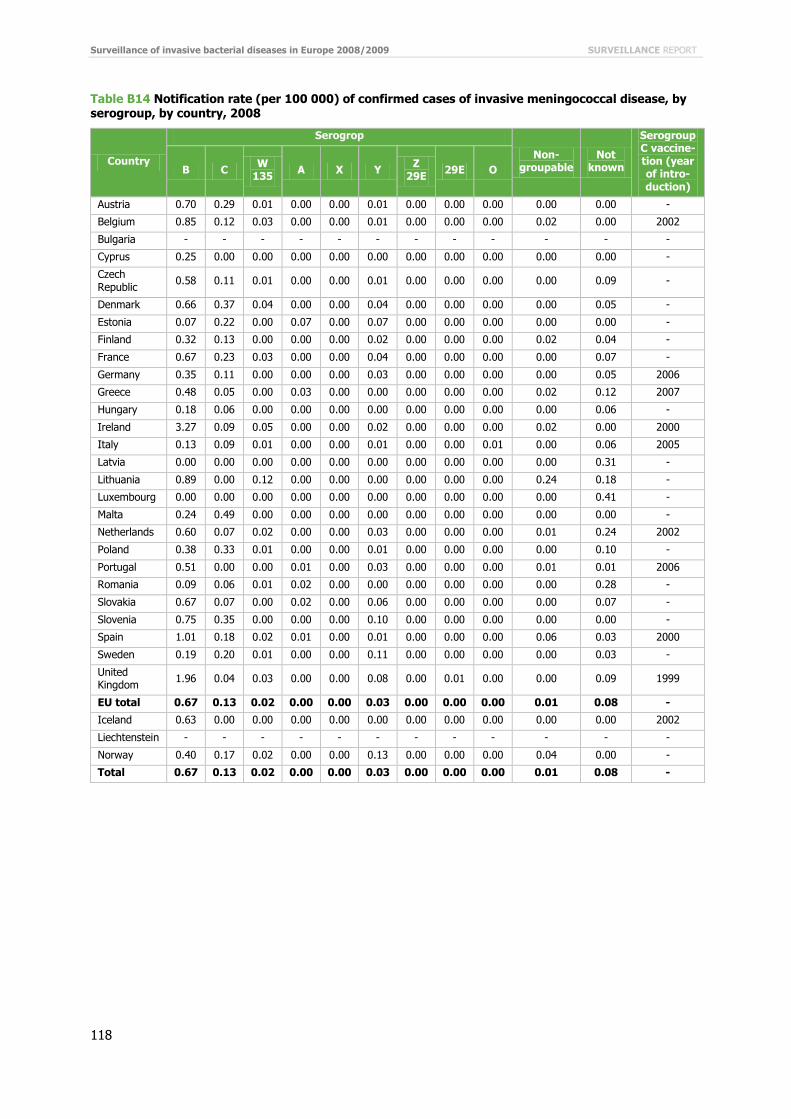
Surveillance of invasive bacterial diseases in Europe 2008/2009 SURVEILLANCE REPORT
118
Table B14 Notification rate (per 100 000) of confirmed cases of invasive meningococcal disease, by serogroup, by country, 2008
Country
Serogrop
Non-groupable
Not known
Serogroup C vaccine-tion (year of intro-duction)
B C W 135 A X Y Z
29E 29E O
Austria 0.70 0.29 0.01 0.00 0.00 0.01 0.00 0.00 0.00 0.00 0.00 -
Belgium 0.85 0.12 0.03 0.00 0.00 0.01 0.00 0.00 0.00 0.02 0.00 2002
Bulgaria - - - - - - - - - - - -
Cyprus 0.25 0.00 0.00 0.00 0.00 0.00 0.00 0.00 0.00 0.00 0.00 -
Czech Republic 0.58 0.11 0.01 0.00 0.00 0.01 0.00 0.00 0.00 0.00 0.09 -
Denmark 0.66 0.37 0.04 0.00 0.00 0.04 0.00 0.00 0.00 0.00 0.05 -
Estonia 0.07 0.22 0.00 0.07 0.00 0.07 0.00 0.00 0.00 0.00 0.00 -
Finland 0.32 0.13 0.00 0.00 0.00 0.02 0.00 0.00 0.00 0.02 0.04 -
France 0.67 0.23 0.03 0.00 0.00 0.04 0.00 0.00 0.00 0.00 0.07 -
Germany 0.35 0.11 0.00 0.00 0.00 0.03 0.00 0.00 0.00 0.00 0.05 2006
Greece 0.48 0.05 0.00 0.03 0.00 0.00 0.00 0.00 0.00 0.02 0.12 2007
Hungary 0.18 0.06 0.00 0.00 0.00 0.00 0.00 0.00 0.00 0.00 0.06 -
Ireland 3.27 0.09 0.05 0.00 0.00 0.02 0.00 0.00 0.00 0.02 0.00 2000
Italy 0.13 0.09 0.01 0.00 0.00 0.01 0.00 0.00 0.01 0.00 0.06 2005
Latvia 0.00 0.00 0.00 0.00 0.00 0.00 0.00 0.00 0.00 0.00 0.31 -
Lithuania 0.89 0.00 0.12 0.00 0.00 0.00 0.00 0.00 0.00 0.24 0.18 -
Luxembourg 0.00 0.00 0.00 0.00 0.00 0.00 0.00 0.00 0.00 0.00 0.41 -
Malta 0.24 0.49 0.00 0.00 0.00 0.00 0.00 0.00 0.00 0.00 0.00 -
Netherlands 0.60 0.07 0.02 0.00 0.00 0.03 0.00 0.00 0.00 0.01 0.24 2002
Poland 0.38 0.33 0.01 0.00 0.00 0.01 0.00 0.00 0.00 0.00 0.10 -
Portugal 0.51 0.00 0.00 0.01 0.00 0.03 0.00 0.00 0.00 0.01 0.01 2006
Romania 0.09 0.06 0.01 0.02 0.00 0.00 0.00 0.00 0.00 0.00 0.28 -
Slovakia 0.67 0.07 0.00 0.02 0.00 0.06 0.00 0.00 0.00 0.00 0.07 -
Slovenia 0.75 0.35 0.00 0.00 0.00 0.10 0.00 0.00 0.00 0.00 0.00 -
Spain 1.01 0.18 0.02 0.01 0.00 0.01 0.00 0.00 0.00 0.06 0.03 2000
Sweden 0.19 0.20 0.01 0.00 0.00 0.11 0.00 0.00 0.00 0.00 0.03 -
United Kingdom 1.96 0.04 0.03 0.00 0.00 0.08 0.00 0.01 0.00 0.00 0.09 1999
EU total 0.67 0.13 0.02 0.00 0.00 0.03 0.00 0.00 0.00 0.01 0.08 -
Iceland 0.63 0.00 0.00 0.00 0.00 0.00 0.00 0.00 0.00 0.00 0.00 2002
Liechtenstein - - - - - - - - - - - -
Norway 0.40 0.17 0.02 0.00 0.00 0.13 0.00 0.00 0.00 0.04 0.00 -
Total 0.67 0.13 0.02 0.00 0.00 0.03 0.00 0.00 0.00 0.01 0.08 -
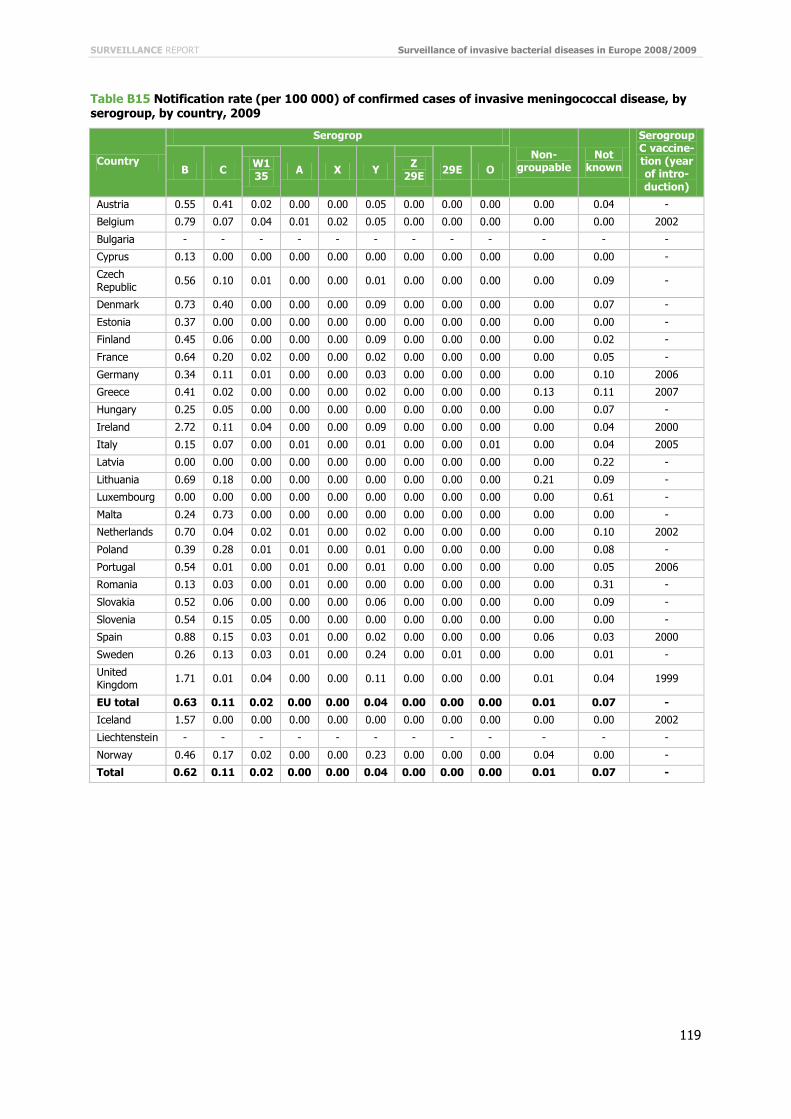
SURVEILLANCE REPORT Surveillance of invasive bacterial diseases in Europe 2008/2009
119
Table B15 Notification rate (per 100 000) of confirmed cases of invasive meningococcal disease, by serogroup, by country, 2009
Country
Serogrop
Non-groupable
Not known
Serogroup C vaccine-tion (year of intro-duction)
B C W135 A X Y Z
29E 29E O
Austria 0.55 0.41 0.02 0.00 0.00 0.05 0.00 0.00 0.00 0.00 0.04 -
Belgium 0.79 0.07 0.04 0.01 0.02 0.05 0.00 0.00 0.00 0.00 0.00 2002
Bulgaria - - - - - - - - - - - -
Cyprus 0.13 0.00 0.00 0.00 0.00 0.00 0.00 0.00 0.00 0.00 0.00 -
Czech Republic 0.56 0.10 0.01 0.00 0.00 0.01 0.00 0.00 0.00 0.00 0.09 -
Denmark 0.73 0.40 0.00 0.00 0.00 0.09 0.00 0.00 0.00 0.00 0.07 -
Estonia 0.37 0.00 0.00 0.00 0.00 0.00 0.00 0.00 0.00 0.00 0.00 -
Finland 0.45 0.06 0.00 0.00 0.00 0.09 0.00 0.00 0.00 0.00 0.02 -
France 0.64 0.20 0.02 0.00 0.00 0.02 0.00 0.00 0.00 0.00 0.05 -
Germany 0.34 0.11 0.01 0.00 0.00 0.03 0.00 0.00 0.00 0.00 0.10 2006
Greece 0.41 0.02 0.00 0.00 0.00 0.02 0.00 0.00 0.00 0.13 0.11 2007
Hungary 0.25 0.05 0.00 0.00 0.00 0.00 0.00 0.00 0.00 0.00 0.07 -
Ireland 2.72 0.11 0.04 0.00 0.00 0.09 0.00 0.00 0.00 0.00 0.04 2000
Italy 0.15 0.07 0.00 0.01 0.00 0.01 0.00 0.00 0.01 0.00 0.04 2005
Latvia 0.00 0.00 0.00 0.00 0.00 0.00 0.00 0.00 0.00 0.00 0.22 -
Lithuania 0.69 0.18 0.00 0.00 0.00 0.00 0.00 0.00 0.00 0.21 0.09 -
Luxembourg 0.00 0.00 0.00 0.00 0.00 0.00 0.00 0.00 0.00 0.00 0.61 -
Malta 0.24 0.73 0.00 0.00 0.00 0.00 0.00 0.00 0.00 0.00 0.00 -
Netherlands 0.70 0.04 0.02 0.01 0.00 0.02 0.00 0.00 0.00 0.00 0.10 2002
Poland 0.39 0.28 0.01 0.01 0.00 0.01 0.00 0.00 0.00 0.00 0.08 -
Portugal 0.54 0.01 0.00 0.01 0.00 0.01 0.00 0.00 0.00 0.00 0.05 2006
Romania 0.13 0.03 0.00 0.01 0.00 0.00 0.00 0.00 0.00 0.00 0.31 -
Slovakia 0.52 0.06 0.00 0.00 0.00 0.06 0.00 0.00 0.00 0.00 0.09 -
Slovenia 0.54 0.15 0.05 0.00 0.00 0.00 0.00 0.00 0.00 0.00 0.00 -
Spain 0.88 0.15 0.03 0.01 0.00 0.02 0.00 0.00 0.00 0.06 0.03 2000
Sweden 0.26 0.13 0.03 0.01 0.00 0.24 0.00 0.01 0.00 0.00 0.01 -
United Kingdom 1.71 0.01 0.04 0.00 0.00 0.11 0.00 0.00 0.00 0.01 0.04 1999
EU total 0.63 0.11 0.02 0.00 0.00 0.04 0.00 0.00 0.00 0.01 0.07 -
Iceland 1.57 0.00 0.00 0.00 0.00 0.00 0.00 0.00 0.00 0.00 0.00 2002
Liechtenstein - - - - - - - - - - - -
Norway 0.46 0.17 0.02 0.00 0.00 0.23 0.00 0.00 0.00 0.04 0.00 -
Total 0.62 0.11 0.02 0.00 0.00 0.04 0.00 0.00 0.00 0.01 0.07 -

Surveillance of invasive bacterial diseases in Europe 2008/2009 SURVEILLANCE REPORT
120
Table B16 Number of cases and percentage distribution of confirmed invasive meningococcal disease cases, by age group, EU/EEA countries, 1999–2009
Age group 1999 2000 2001 2002 2003 2004 2005 2006 2007 2008 2009 Numbers of cases < 1 year 1155 1384 1208 1096 1068 990 1009 916 888 976 865 01–04 years 2170 2167 1826 1662 1559 1299 1412 1241 1457 1215 1121 05–09 years 997 904 767 649 546 443 481 437 487 389 384 10–14 years 718 605 583 468 506 310 353 240 307 237 255 15–19 years 1181 1012 1008 869 803 740 687 675 702 635 599 20–24 years 444 441 397 361 331 270 330 298 316 303 289 25–44 years 543 673 666 619 532 476 525 409 485 422 360 45–64 years 477 556 516 470 424 422 438 391 412 419 387 65+ years 359 359 354 402 310 334 369 299 336 326 326 Unk 102 22 33 12 20 13 23 24 174 56 51 Total 8 146 8 123 7 358 6 608 6 099 5 297 5 627 4 930 5 564 4 978 4 637 % distribution <1 year 14% 17% 16% 17% 18% 19% 18% 19% 16% 20% 19% 01–04 years 27% 27% 25% 25% 26% 25% 25% 25% 26% 24% 24% 05–09 years 12% 11% 10% 10% 9% 8% 9% 9% 9% 8% 8% 10–14 years 9% 7% 8% 7% 8% 6% 6% 5% 6% 5% 5% 15–19 years 14% 12% 14% 13% 13% 14% 12% 14% 13% 13% 13% 20–24 years 5% 5% 5% 5% 5% 5% 6% 6% 6% 6% 6% 25–44 years 7% 8% 9% 9% 9% 9% 9% 8% 9% 8% 8% 45–64 years 6% 7% 7% 7% 7% 8% 8% 8% 7% 8% 8% 65+ years 4% 4% 5% 6% 5% 6% 7% 6% 6% 7% 7% Unk 1% 0% 0% 0% 0% 0% 0% 0% 3% 1% 1%
Table B17 Number of cases and percentage distribution of serogroup B invasive meningococcal disease cases, by age group, EU/EEA countries, 1999–2009
Age group 1999 2000 2001 2002 2003 2004 2005 2006 2007 2008 2009 Numbers of cases < 1 year 775 976 890 807 801 780 819 747 670 773 683 01–04 years 1201 1218 1202 1105 1065 935 1063 937 1026 936 869 05–09 years 519 427 417 364 333 267 320 311 274 253 262 10–14 years 343 254 320 256 295 173 201 132 144 143 149 15–19 years 604 537 552 473 475 451 450 440 414 408 402 20–24 years 202 215 195 179 159 173 218 190 188 187 196 25–44 years 259 311 314 286 273 223 298 215 248 235 208 45–64 years 235 304 258 251 239 235 251 215 222 255 224 65+ years 174 157 144 166 140 168 163 147 144 156 145 Unk 48 13 16 8 7 12 16 16 76 22 16 Total 4 360 4 412 4 308 3 895 3 787 3 417 3 799 3 350 3 406 3 368 3 154 % distribution < 1 year 18% 22% 21% 21% 21% 23% 22% 22% 20% 23% 22% 01–04 years 28% 28% 28% 28% 28% 27% 28% 28% 30% 28% 28% 05–09 years 12% 10% 10% 9% 9% 8% 8% 9% 8% 8% 8% 10–14 years 8% 6% 7% 7% 8% 5% 5% 4% 4% 4% 5% 15–19 years 14% 12% 13% 12% 13% 13% 12% 13% 12% 12% 13% 20–24 years 5% 5% 5% 5% 4% 5% 6% 6% 6% 6% 6% 25–44 years 6% 7% 7% 7% 7% 7% 8% 6% 7% 7% 7% 45–64 years 5% 7% 6% 6% 6% 7% 7% 6% 7% 8% 7% 65+ years 4% 4% 3% 4% 4% 5% 4% 4% 4% 5% 5% Unk 1% 0% 0% 0% 0% 0% 0% 0% 2% 1% 1%

SURVEILLANCE REPORT Surveillance of invasive bacterial diseases in Europe 2008/2009
121
Table B18 Number of cases and percentage distribution of serogroup C invasive meningococcal disease cases, by age group, EU/EEA countries, 1999–2009
Age group 1999 2000 2001 2002 2003 2004 2005 2006 2007 2008 2009 Numbers of cases < 1 year 200 148 116 113 67 68 56 53 50 58 55 01–04 years 550 503 276 232 168 154 123 124 128 98 96 05–09 years 231 212 131 120 62 70 55 47 56 55 43 10–14 years 224 168 124 116 97 63 68 52 60 40 58 15–19 years 404 288 286 242 151 158 126 124 130 132 88 20–24 years 141 146 126 110 76 48 70 60 57 66 52 25–44 years 150 210 197 189 118 117 96 82 100 101 75 45–64 years 150 136 168 133 77 86 80 71 53 73 61 65+ years 95 120 102 125 63 56 72 44 46 53 48 Unk 17 6 9 1 4 1 3 3 4 1 1 Total 2 162 1 937 1 535 1 381 883 821 749 660 684 677 577 % distribution < 1 year 9% 8% 8% 8% 8% 8% 7% 8% 7% 9% 10% 01–04 years 25% 26% 18% 17% 19% 19% 16% 19% 19% 14% 17% 05–09 years 11% 11% 9% 9% 7% 9% 7% 7% 8% 8% 7% 10–14 years 10% 9% 8% 8% 11% 8% 9% 8% 9% 6% 10% 15–19 years 19% 15% 19% 18% 17% 19% 17% 19% 19% 19% 15% 20–24 years 7% 8% 8% 8% 9% 6% 9% 9% 8% 10% 9% 25–44 years 7% 11% 13% 14% 13% 14% 13% 12% 15% 15% 13% 45–64 years 7% 7% 11% 10% 9% 10% 11% 11% 8% 11% 11% 65+ years 4% 6% 7% 9% 7% 7% 10% 7% 7% 8% 8% Unk 1% 0% 1% 0% 0% 0% 0% 0% 1% 0% 0%
Table B19 Distribution of confirmed serogroup B cases of invasive meningococcal disease, by age group, countries with and without MCC vaccination, 2008
Age group With MCC (% in each age group)
Without MCC (% in each age group)
Total (% of B cases)
< 1 year 590 (76.3%) 183 (23.7%) 773 (23.0%)
1–4 years 732 (78.2%) 204 (21.8%) 936 (27.8%)
5–9 years 186 (73.5%) 67 (26.5%) 253 (7.5%)
10–14 years 103 (72.0%) 40 (28.0%) 143 (4.2%)
15–19 years 277 (67.9%) 131 (32.1%) 408 (12.1%)
20–24 years 106 (56.7%) 81 (43.3%) 187 (5.6%)
25–44 years 160 (68.1%) 75 (31.9%) 235 (7.0%)
45–64 years 182 (71.4%) 73 (28.6%) 255 (7.6%)
65+ years 109 (69.9%) 47 (30.1%) 156 (4.6%)
Unk 22 (100%)
22 (0.7%)
Total 2 467 901 3 368 (100%)

Surveillance of invasive bacterial diseases in Europe 2008/2009 SURVEILLANCE REPORT
122
Table B20 Distribution of confirmed serogroup B cases of invasive meningococcal disease, by age group, countries with and without MCC vaccination, 2009
Age group With MCC (% in each age group)
Without MCC (% in each age group)
Total (% of B cases)
< 1 year 509 (74.5%) 174 (25.5%) 683 (21.7%)
1–4 years 648 (74.6%) 221 (25.4%) 869 (27.6%)
5–9 years 200 (76.3%) 62 (23.7%) 262 (8.3%)
10–14 years 106 (71.1%) 43 (28.9%) 149 (4.7%)
15–19 years 263 (65.4%) 139 (34.6%) 402 (12.7%)
20–24 years 125 (63.8%) 71 (36.2%) 196 (6.2%)
25–44 years 130 (62.5%) 78 (37.5%) 208 (6.6%)
45–64 years 154 (68.8%) 70 (31.3%) 224 (7.1%)
65+ years 106 (73.1%) 39 (26.9%) 145 (4.6%)
Unk 16 (100%)
16 (0.5%)
Total 2 257 897 3 154 (100%)
Table B21 Distribution of confirmed serogroup C cases of invasive meningococcal disease, by age group, countries with and without MCC vaccination, 2008
Age group With MCC (% in each age group)
Without MCC (% in each age group)
Total (% of B cases)
< 1 year 19 (32.8%) 39 (67.2%) 58 (8.6%)
1–4 years 27 (27.6%) 71 (72.4%) 98 (14.5%)
5–9 years 16 (29.1%) 39 (70.9%) 55 (8.1%)
10–14 years 14 (35.0%) 26 (65.0%) 40 (5.9%)
15–19 years 46 (34.8%) 86 (65.2%) 132 (19.5%)
20–24 years 28 (42.4%) 38 (57.6%) 66 (9.7%)
25–44 years 60 (59.4%) 41 (40.6%) 101 (14.9%)
45–64 years 45 (61.6%) 28 (38.4%) 73 (10.8%)
65+ years 28 (52.8%) 25 (47.2%) 53 (7.8%)
Unk 1 (100%)
1 (0.1%)
Total 284 393 677 (100%)
Table B22 Distribution of confirmed serogroup C cases of invasive meningococcal disease, by age group, countries with and without MCC vaccination, 2009
Age group With MCC (% in each age group)
Without MCC (% in each age group)
Total (% of B cases)
< 1 year 17 (30.9%) 38 (69.1%) 55 (9.5%)
1–4 years 27 (28.1%) 69 (71.9%) 96 (16.6%)
5–9 years 18 (41.9%) 25 (58.1%) 43 (7.5%)
10–14 years 24 (41.4%) 34 (58.6%) 58 (10.1%)
15–19 years 29 (33.0%) 59 (67.0%) 88 (15.3%)
20–24 years 23 (44.2%) 29 (55.8%) 52 (9.0%)
25–44 years 37 (49.3%) 38 (50.7%) 75 (13.0%)
45–64 years 25 (41.0%) 36 (59.0%) 61 (10.6%)
65+ years 27 (56.3%) 21 (43.8%) 48 (8.3%)
Unk 1 (100%)
1 (0.2%)
Total 228 349 577 (100%)

SURVEILLANCE REPORT Surveillance of invasive bacterial diseases in Europe 2008/2009
123
Table B23 Proportion of meningitis in confirmed invasive meningococcal disease cases, reporting countries, 1999–2009
1999 2000 2001 2002 2003 2004 2005 2006 2007 2008 2009 <50% Germany Germany Germany Germany Lithuania Iceland Iceland Ireland Austria Cyprus Cyprus
Greece Hungary Hungary Hungary Spain Ireland Ireland Spain Belgium Czech Republic
Czech Republic
Hungary Ireland Ireland Ireland Sweden Malta Spain Sweden Czech Republic
Spain Spain
Ireland Latvia Latvia Latvia Spain Estonia Finland Finland Latvia Lithuania Slovakia Slovakia Finland France France Lithuania Slovakia Sweden Spain France UK UK Malta Sweden UK Sweden Greece Ireland Ireland
Slovakia UK UK Iceland Luxem-bourg Malta
Sweden Ireland Malta Netherlands
UK Latvia Nether-lands Portugal
Lithuania Portugal Sweden
Luxem-bourg Sweden Slovenia
Malta Slovenia
Nether-lands
Norway Poland Portugal Slovenia Spain
Sweden
UK 50–70%
Belgium Belgium Belgium Belgium Austria Austria Austria Belgium Germany Austria Austria Estonia Finland Finland Denmark Belgium Belgium Belgium Denmark Hungary Belgium Belgium
Iceland Greece Iceland Finland Denmark Czech Republic Denmark Estonia Italy Germany Germany
Nether-lands Iceland Lithuania France Finland Finland Finland Finland Romania Denmark Denmark
Norway Malta Norway Malta Germany Greece Greece Italy Estonia Lithuania
Slovenia Portugal Spain Netherlands
Iceland Latvia Latvia Latvia
Italy Norway
Spain Norway Ireland Lithuania Lithuania Lithuania Lithuania Poland
Portugal Latvia Nether-lands Norway Norway Norway
Slovenia Malta Norway Portugal Poland Poland
Switzer-land
Nether-lands Slovenia Slovenia Portugal
UK Sweden Sweden Switzer-land
UK Switzer-land UK
UK
>70% Austria Austria Austria Austria Czech
Republic Denmark Czech Republic Austria Cyprus Greece Estonia
Czech Republic
Czech Republic
Czech Republic
Czech Republic Estonia Estonia Estonia Czech
Republic Denmark Hungary Greece
Denmark Denmark Denmark Estonia France France France France Slovakia Iceland Hungary Finland Estonia Estonia Greece Greece Germany Germany Germany
Latvia Iceland
France France France Iceland Hungary Hungary Hungary Greece Romania Italy
Italy Italy Greece Italy Italy Italy Italy Hungary Slovakia Luxem-bourg
Poland Nether-lands Italy Lithuania Norway Poland Malta Iceland Latvia
Portugal Norway Malta Poland Poland Portugal Netherlands Malta Romania
Switzer-land Poland Netherla
nds Portugal Slovakia Poland Nether-lands Slovakia
Slovenia Poland Slovakia Switzer-land Slovakia Slovakia
Spain Portugal Slovenia Slovenia
Switzer-land
Slovenia
Switzer-land
Switzer-land

Surveillance of invasive bacterial diseases in Europe 2008/2009 SURVEILLANCE REPORT
124
Table B24 Total number of invasive meningococcal disease cases and percentage distribution, by clinical presentation, 2008
Country Meningitis Meningitis and
septicaemia Septicaemia Other Unknown
Cases (%) Cases (%) Cases (%) Cases (%) Cases (%)
Austria 39 41 27 28 29 31 0 0 0 0
Belgium 38 34 29 26 36 32 0 0 8 7
Bulgaria - - - - - - - - - -
Cyprus 0 0 0 0 0 0 0 0 2 100
Czech Republic 0 0 0 0 0 0 0 0 1 100
Denmark 17 25 26 38 20 29 4 6 1 1
Estonia 1 17 2 33 3 50 0 0 0 0
Finland 0 0 0 0 0 0 0 0 28 100
France 0 0 0 0 0 0 0 0 679 100
Germany 238 53 38 8 144 32 0 0 32 7
Greece 40 49 40 49 1 1 0 0 0 0
Hungary 17 57 10 33 3 10 0 0 0 0
Ireland 35 22 38 23 74 46 0 0 15 9
Italy 87 48 27 15 62 34 4 2 3 2
Latvia 5 36 8 57 0 0 1 7 0 0
Lithuania 10 15 29 43 24 35 5 7 0 0
Luxembourg 0 0 0 0 0 0 0 0 2 100
Malta 1 33 0 0 2 67 0 0 0 0
Netherlands 0 0 0 0 0 0 0 0 162 100
Poland 112 30 108 29 140 38 13 3 0 0
Portugal 20 26 7 9 38 49 1 1 11 14
Romania 82 71 6 5 7 6 20 17 0 0
Slovakia 39 76 0 0 9 18 0 0 3 6
Slovenia 0 0 0 0 0 0 0 0 24 100
Spain 184 31 88 15 286 48 6 1 26 4
Sweden 0 0 0 0 0 0 0 0 49 100
United Kingdom 38 3 31 2 38 3 18 1 1277 91
EU total 1 003 21 514 11 916 19 72 1 2 323 48
Iceland 1 50 1 50 0 0 0 0 0 0
Liechtenstein - - - - - - - - - -
Norway 13 36 5 14 9 25 8 22 1 3
Total 1 017 21 520 11 925 19 80 2 2 324 48
Cases with blank value for clinical presentation are not shown.
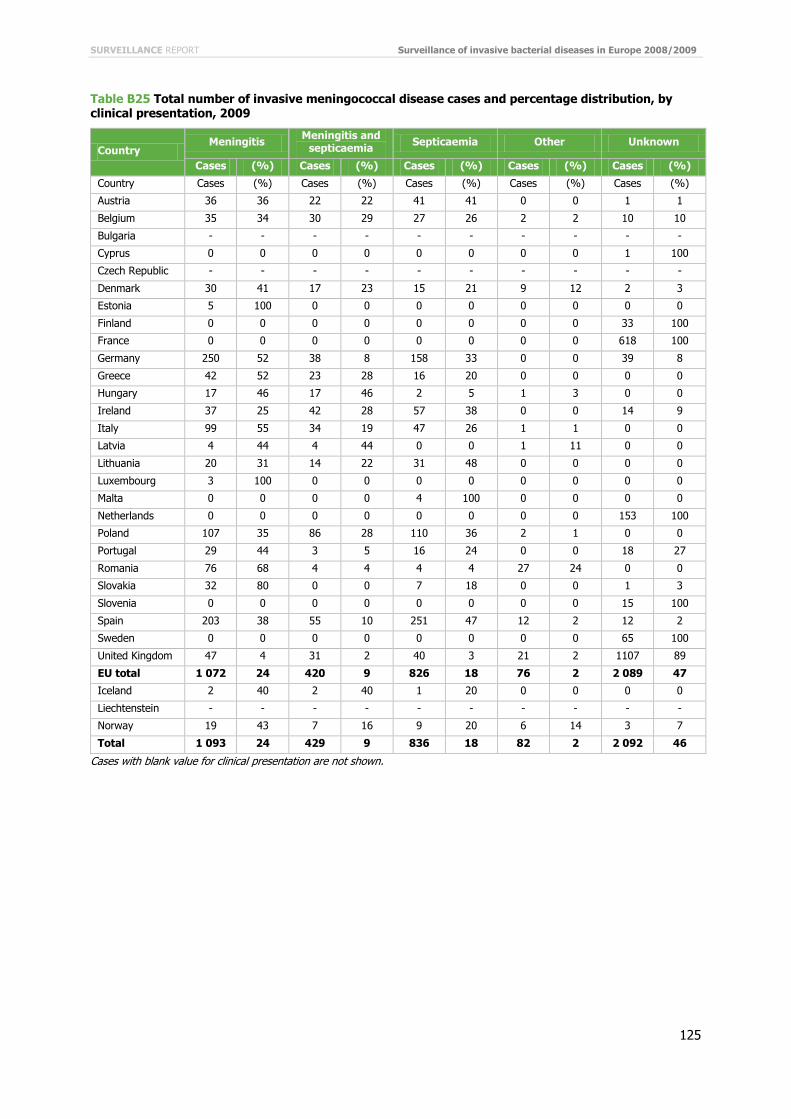
SURVEILLANCE REPORT Surveillance of invasive bacterial diseases in Europe 2008/2009
125
Table B25 Total number of invasive meningococcal disease cases and percentage distribution, by clinical presentation, 2009
Country Meningitis Meningitis and
septicaemia Septicaemia Other Unknown
Cases (%) Cases (%) Cases (%) Cases (%) Cases (%)
Country Cases (%) Cases (%) Cases (%) Cases (%) Cases (%)
Austria 36 36 22 22 41 41 0 0 1 1
Belgium 35 34 30 29 27 26 2 2 10 10
Bulgaria - - - - - - - - - -
Cyprus 0 0 0 0 0 0 0 0 1 100
Czech Republic - - - - - - - - - -
Denmark 30 41 17 23 15 21 9 12 2 3
Estonia 5 100 0 0 0 0 0 0 0 0
Finland 0 0 0 0 0 0 0 0 33 100
France 0 0 0 0 0 0 0 0 618 100
Germany 250 52 38 8 158 33 0 0 39 8
Greece 42 52 23 28 16 20 0 0 0 0
Hungary 17 46 17 46 2 5 1 3 0 0
Ireland 37 25 42 28 57 38 0 0 14 9
Italy 99 55 34 19 47 26 1 1 0 0
Latvia 4 44 4 44 0 0 1 11 0 0
Lithuania 20 31 14 22 31 48 0 0 0 0
Luxembourg 3 100 0 0 0 0 0 0 0 0
Malta 0 0 0 0 4 100 0 0 0 0
Netherlands 0 0 0 0 0 0 0 0 153 100
Poland 107 35 86 28 110 36 2 1 0 0
Portugal 29 44 3 5 16 24 0 0 18 27
Romania 76 68 4 4 4 4 27 24 0 0
Slovakia 32 80 0 0 7 18 0 0 1 3
Slovenia 0 0 0 0 0 0 0 0 15 100
Spain 203 38 55 10 251 47 12 2 12 2
Sweden 0 0 0 0 0 0 0 0 65 100
United Kingdom 47 4 31 2 40 3 21 2 1107 89
EU total 1 072 24 420 9 826 18 76 2 2 089 47
Iceland 2 40 2 40 1 20 0 0 0 0
Liechtenstein - - - - - - - - - -
Norway 19 43 7 16 9 20 6 14 3 7
Total 1 093 24 429 9 836 18 82 2 2 092 46
Cases with blank value for clinical presentation are not shown.

Surveillance of invasive bacterial diseases in Europe 2008/2009 SURVEILLANCE REPORT
126
Table B26 Serogroup-specific case fatality ratio (CSF) of confirmed invasive meningococcal disease cases, 2008
Country Serogroup B Serogroup C Other serogroups/
non-groupable
Deaths Cases CFR (%) Deaths Cases CFR
(%) Deaths Cases CFR (%)
Austria 7 58 12 3 24 13 0 2 0
Belgium 3 91 3 1 13 8 0 6 0
Bulgaria - - - - - - - - -
Cyprus 0 2 0 - - - - - -
Czech Republic 4 60 7 1 11 9 1 11 9
Denmark 3 36 8 4 20 20 0 7 0
Estonia 0 1 0 1 3 33 1 2 50
Finland 2 17 12 0 7 0 0 4 0
France 38 427 9 26 145 18 9 91 10
Germany 27 291 9 10 91 11 7 70 10
Greece 5 54 9 0 6 0 0 18 0
Hungary 4 18 22 1 6 17 1 6 17
Ireland 6 144 4 1 4 25 1 4 25
Italy 7 76 9 8 54 15 5 48 10
Latvia - - - - - - 1 7 14
Lithuania 1 30 3 - - - 1 18 6
Luxembourg - - - - - - 0 2 0
Malta 1 1 100 1 2 50 - - -
Netherlands 3 98 3 3 11 27 0 48 0
Poland 20 145 14 11 126 9 8 48 17
Portugal 1 54 2 - - - 0 6 0
Romania 2 19 11 1 12 8 7 68 10
Slovakia 2 36 6 0 4 0 0 8 0
Slovenia 0 15 0 0 7 0 0 2 0
Spain 45 456 10 13 81 16 2 53 4
Sweden 3 17 18 2 18 11 2 14 14
United Kingdom 63 1201 5 3 24 13 11 130 8
EU total 247 3 347 7 90 669 13 57 673 8
Iceland 0 2 0 - - - - - -
Liechtenstein - - - - - - - - -
Norway 2 19 11 1 8 13 0 9 0
Total 249 3 368 7 91 677 13 57 682 8
Cases with blank serogruop are not included.

SURVEILLANCE REPORT Surveillance of invasive bacterial diseases in Europe 2008/2009
127
Table B27 Serogroup-specific case fatality ratio (CFR) of confirmed invasive meningococcal disease cases, 2009
Country Serogroup B Serogroup C Other serogroups/
non-groupable
Deaths Cases CFR (%) Deaths Cases CFR
(%) Deaths Cases CFR (%)
Austria 6 46 13 3 34 9 0 9 0
Belgium 4 85 5 1 7 14 0 12 0
Bulgaria - - - - - - - - -
Cyprus 0 1 0 - - - - - -
Czech Republic 4 59 7 2 10 20 1 11 9
Denmark 2 40 5 1 22 5 0 9 0
Estonia 1 5 20 - - - - - -
Finland 1 24 4 1 3 33 1 6 17
France 38 412 9 12 126 10 5 66 8
Germany 22 280 8 5 87 6 8 118 7
Greece 4 46 9 0 2 0 0 29 0
Hungary 2 25 8 0 5 0 3 7 43
Ireland 6 121 5 0 5 0 0 8 0
Italy 8 89 9 3 44 7 3 48 6
Latvia - - - - - - 0 5 0
Lithuania 2 23 9 0 6 0 0 10 0
Luxembourg - - - - - - 0 3 0
Malta 1 1 100 2 3 67 - - -
Netherlands 6 116 5 1 6 17 0 26 0
Poland 16 149 11 12 108 11 2 38 5
Portugal 3 57 5 0 1 0 0 7 0
Romania 0 27 0 0 6 0 5 69 7
Slovakia 3 28 11 0 3 0 1 8 13
Slovenia 0 11 0 0 3 0 0 1 0
Spain 41 403 10 11 67 16 2 63 3
Sweden 3 24 13 1 12 8 1 28 4
United Kingdom 56 1055 5 1 9 11 7 126 6
EU total 229 3 127 7 56 569 10 39 707 6
Iceland 0 5 0 - - - - - -
Liechtenstein - - - - - - - - -
Norway 3 22 14 0 8 0 3 14 21
Total 232 3 154 7 56 577 10 42 721 6

Surveillance of invasive bacterial diseases in Europe 2008/2009 SURVEILLANCE REPORT
128
Table B28 Percentage distribution of virulent meningococcal clonal complexes, by serogroup, EU/EEA countries, 2008–2009
MLST Clonal complex
A B C NGA O W135 Y Total
n % n % n % n % n % n % n % n %
ST-41/44 complex/ Lineage 3
0 0.0 228 23.6 19 2.0 0 0.0 0 0.0 5 0.5 3 0.3 255 26.4
ST-11 complex/ ET-37 complex
0 0.0 41 4.2 156 16.1 0 0.0 0 0.0 3 0.3 2 0.2 202 20.9
ST-32 complex/ ET-5 complex 0 0.0 146 15.1 11 1.1 0 0.0 0 0.0 0 0.0 2 0.2 159 16.4
ST-269 complex 0 0.0 78 8.1 9 0.9 6 0.6 0 0.0 3 0.3 1 0.1 97 10.0
ST-23 complex/ Cluster A3
1 0.1 8 0.8 2 0.2 0 0.0 0 0.0 0 0.0 28 2.9 39 4.0
ST-461 complex 0 0.0 29 3.0 4 0.4 0 0.0 0 0.0 0 0.0 0 0.0 33 3.4
ST-213 complex 0 0.0 24 2.5 8 0.8 0 0.0 0 0.0 0 0.0 0 0.0 32 3.3
ST-162 complex 0 0.0 29 3.0 1 0.1 0 0.0 0 0.0 0 0.0 0 0.0 30 3.1
ST-103 complex 0 0.0 4 0.4 12 1.2 0 0.0 0 0.0 0 0.0 1 0.1 17 1.8
ST-18 complex 0 0.0 13 1.3 2 0.2 0 0.0 0 0.0 0 0.0 1 0.1 16 1.7
ST-22 complex 0 0.0 5 0.5 0 0.0 0 0.0 0 0.0 10 1.0 1 0.1 16 1.7
ST-8 complex/ Cluster A4
0 0.0 0 0.0 14 1.4 0 0.0 0 0.0 0 0.0 0 0.0 14 1.4
ST-865 complex 0 0.0 9 0.9 2 0.2 0 0.0 0 0.0 1 0.1 1 0.1 13 1.3
ST-35 complex 0 0.0 10 1.0 1 0.1 0 0.0 0 0.0 0 0.0 0 0.0 11 1.1
ST-60 complex 0 0.0 8 0.8 0 0.0 0 0.0 1 0.1 0 0.0 0 0.0 9 0.9
ST-334 complex 0 0.0 4 0.4 2 0.2 0 0.0 0 0.0 0 0.0 0 0.0 6 0.6
ST-5 complex/ subgroup III 5 0.5 0 0.0 0 0.0 0 0.0 0 0.0 0 0.0 0 0.0 5 0.5
ST-254 complex 0 0.0 1 0.1 2 0.2 0 0.0 0 0.0 0 0.0 0 0.0 3 0.3
ST-167 complex 0 0.0 1 0.1 1 0.1 0 0.0 0 0.0 0 0.0 0 0.0 2 0.2
ST-174 complex 0 0.0 1 0.1 1 0.1 0 0.0 0 0.0 0 0.0 0 0.0 2 0.2
ST-226 complex 0 0.0 1 0.1 0 0.0 0 0.0 0 0.0 0 0.0 0 0.0 1 0.1
ST-37 complex 0 0.0 1 0.1 0 0.0 0 0.0 0 0.0 0 0.0 0 0.0 1 0.1
ST-1157 complex
0 0.0 1 0.1 0 0.0 0 0.0 0 0.0 0 0.0 0 0.0 1 0.1
ST-198 complex 0 0.0 1 0.1 0 0.0 0 0.0 0 0.0 0 0.0 0 0.0 1 0.1
ST-4821 complex
0 0.0 1 0.1 0 0.0 0 0.0 0 0.0 0 0.0 0 0.0 1 0.1
ST-53 complex 0 0.0 0 0.0 0 0.0 1 0.1 0 0.0 0 0.0 0 0.0 1 0.1
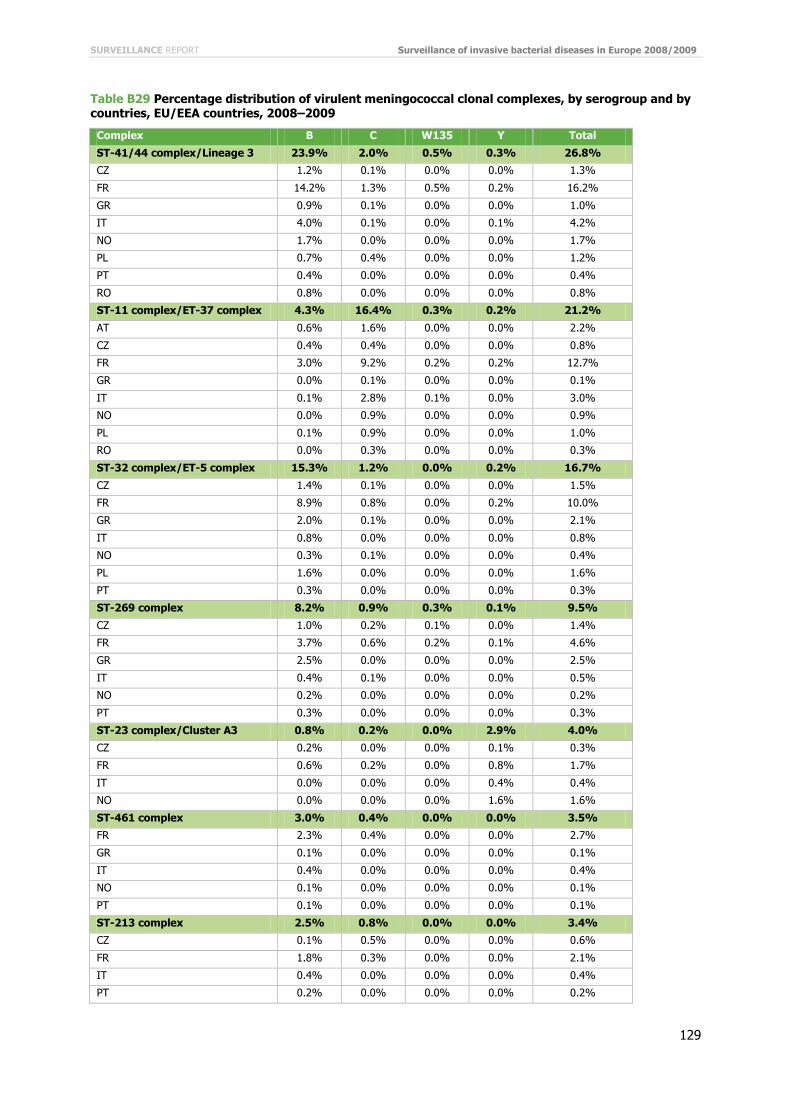
SURVEILLANCE REPORT Surveillance of invasive bacterial diseases in Europe 2008/2009
129
Table B29 Percentage distribution of virulent meningococcal clonal complexes, by serogroup and by countries, EU/EEA countries, 2008–2009
Complex B C W135 Y Total
ST-41/44 complex/Lineage 3 23.9% 2.0% 0.5% 0.3% 26.8%
CZ 1.2% 0.1% 0.0% 0.0% 1.3%
FR 14.2% 1.3% 0.5% 0.2% 16.2%
GR 0.9% 0.1% 0.0% 0.0% 1.0%
IT 4.0% 0.1% 0.0% 0.1% 4.2%
NO 1.7% 0.0% 0.0% 0.0% 1.7%
PL 0.7% 0.4% 0.0% 0.0% 1.2%
PT 0.4% 0.0% 0.0% 0.0% 0.4%
RO 0.8% 0.0% 0.0% 0.0% 0.8%
ST-11 complex/ET-37 complex 4.3% 16.4% 0.3% 0.2% 21.2%
AT 0.6% 1.6% 0.0% 0.0% 2.2%
CZ 0.4% 0.4% 0.0% 0.0% 0.8%
FR 3.0% 9.2% 0.2% 0.2% 12.7%
GR 0.0% 0.1% 0.0% 0.0% 0.1%
IT 0.1% 2.8% 0.1% 0.0% 3.0%
NO 0.0% 0.9% 0.0% 0.0% 0.9%
PL 0.1% 0.9% 0.0% 0.0% 1.0%
RO 0.0% 0.3% 0.0% 0.0% 0.3%
ST-32 complex/ET-5 complex 15.3% 1.2% 0.0% 0.2% 16.7%
CZ 1.4% 0.1% 0.0% 0.0% 1.5%
FR 8.9% 0.8% 0.0% 0.2% 10.0%
GR 2.0% 0.1% 0.0% 0.0% 2.1%
IT 0.8% 0.0% 0.0% 0.0% 0.8%
NO 0.3% 0.1% 0.0% 0.0% 0.4%
PL 1.6% 0.0% 0.0% 0.0% 1.6%
PT 0.3% 0.0% 0.0% 0.0% 0.3%
ST-269 complex 8.2% 0.9% 0.3% 0.1% 9.5%
CZ 1.0% 0.2% 0.1% 0.0% 1.4%
FR 3.7% 0.6% 0.2% 0.1% 4.6%
GR 2.5% 0.0% 0.0% 0.0% 2.5%
IT 0.4% 0.1% 0.0% 0.0% 0.5%
NO 0.2% 0.0% 0.0% 0.0% 0.2%
PT 0.3% 0.0% 0.0% 0.0% 0.3%
ST-23 complex/Cluster A3 0.8% 0.2% 0.0% 2.9% 4.0%
CZ 0.2% 0.0% 0.0% 0.1% 0.3%
FR 0.6% 0.2% 0.0% 0.8% 1.7%
IT 0.0% 0.0% 0.0% 0.4% 0.4%
NO 0.0% 0.0% 0.0% 1.6% 1.6%
ST-461 complex 3.0% 0.4% 0.0% 0.0% 3.5%
FR 2.3% 0.4% 0.0% 0.0% 2.7%
GR 0.1% 0.0% 0.0% 0.0% 0.1%
IT 0.4% 0.0% 0.0% 0.0% 0.4%
NO 0.1% 0.0% 0.0% 0.0% 0.1%
PT 0.1% 0.0% 0.0% 0.0% 0.1%
ST-213 complex 2.5% 0.8% 0.0% 0.0% 3.4%
CZ 0.1% 0.5% 0.0% 0.0% 0.6%
FR 1.8% 0.3% 0.0% 0.0% 2.1%
IT 0.4% 0.0% 0.0% 0.0% 0.4%
PT 0.2% 0.0% 0.0% 0.0% 0.2%

Surveillance of invasive bacterial diseases in Europe 2008/2009 SURVEILLANCE REPORT
130
Complex B C W135 Y Total
ST-162 complex 3.0% 0.1% 0.0% 0.0% 3.1%
CZ 0.1% 0.0% 0.0% 0.0% 0.1%
FR 1.5% 0.1% 0.0% 0.0% 1.6%
GR 0.7% 0.0% 0.0% 0.0% 0.7%
IT 0.4% 0.0% 0.0% 0.0% 0.4%
NO 0.2% 0.0% 0.0% 0.0% 0.2%
PT 0.1% 0.0% 0.0% 0.0% 0.1%
ST-103 complex 0.4% 1.3% 0.0% 0.1% 1.8%
CZ 0.1% 0.2% 0.0% 0.0% 0.3%
FR 0.2% 0.0% 0.0% 0.1% 0.3%
NO 0.0% 0.1% 0.0% 0.0% 0.1%
PL 0.0% 0.9% 0.0% 0.0% 0.9%
PT 0.1% 0.0% 0.0% 0.0% 0.1%
ST-22 complex 0.5% 0.0% 1.0% 0.1% 1.7%
FR 0.5% 0.0% 0.7% 0.1% 1.4%
IT 0.0% 0.0% 0.1% 0.0% 0.1%
NO 0.0% 0.0% 0.2% 0.0% 0.2%
ST-18 complex 1.4% 0.2% 0.0% 0.1% 1.7%
CZ 0.4% 0.0% 0.0% 0.1% 0.5%
FR 0.2% 0.0% 0.0% 0.0% 0.2%
PL 0.6% 0.2% 0.0% 0.0% 0.8%
PT 0.1% 0.0% 0.0% 0.0% 0.1%
ST-8 complex/Cluster A4 0.0% 1.5% 0.0% 0.0% 1.5%
IT 0.0% 1.3% 0.0% 0.0% 1.3%
PL 0.0% 0.2% 0.0% 0.0% 0.2%
ST-865 complex 0.9% 0.2% 0.1% 0.1% 1.4%
CZ 0.1% 0.0% 0.0% 0.0% 0.1%
FR 0.4% 0.2% 0.0% 0.1% 0.7%
IT 0.2% 0.0% 0.0% 0.0% 0.2%
RO 0.2% 0.0% 0.1% 0.0% 0.3%
ST-35 complex 1.0% 0.1% 0.0% 0.0% 1.2%
CZ 0.6% 0.0% 0.0% 0.0% 0.6%
FR 0.2% 0.1% 0.0% 0.0% 0.3%
GR 0.1% 0.0% 0.0% 0.0% 0.1%
IT 0.1% 0.0% 0.0% 0.0% 0.1%
ST-60 complex 0.8% 0.0% 0.0% 0.0% 0.8%
CZ 0.2% 0.0% 0.0% 0.0% 0.2%
FR 0.1% 0.0% 0.0% 0.0% 0.1%
GR 0.3% 0.0% 0.0% 0.0% 0.3%
IT 0.1% 0.0% 0.0% 0.0% 0.1%
NO 0.1% 0.0% 0.0% 0.0% 0.1%
ST-334 complex 0.4% 0.2% 0.0% 0.0% 0.6%
FR 0.4% 0.2% 0.0% 0.0% 0.6%
ST-254 complex 0.1% 0.2% 0.0% 0.0% 0.3%
FR 0.1% 0.2% 0.0% 0.0% 0.3%
ST-174 complex 0.1% 0.1% 0.0% 0.0% 0.2%
FR 0.1% 0.1% 0.0% 0.0% 0.2%
ST-167 complex 0.1% 0.1% 0.0% 0.0% 0.2%
FR 0.1% 0.1% 0.0% 0.0% 0.2%
ST-4821 complex 0.1% 0.0% 0.0% 0.0% 0.1%
FR 0.1% 0.0% 0.0% 0.0% 0.1%

SURVEILLANCE REPORT Surveillance of invasive bacterial diseases in Europe 2008/2009
131
Complex B C W135 Y Total
ST-1157 complex 0.1% 0.0% 0.0% 0.0% 0.1%
PT 0.1% 0.0% 0.0% 0.0% 0.1%
ST-37 complex 0.1% 0.0% 0.0% 0.0% 0.1%
GR 0.1% 0.0% 0.0% 0.0% 0.1%
ST-226 complex 0.1% 0.0% 0.0% 0.0% 0.1%
NO 0.1% 0.0% 0.0% 0.0% 0.1%
ST-198 complex 0.1% 0.0% 0.0% 0.0% 0.1%
CZ 0.1% 0.0% 0.0% 0.0% 0.1%
Total 67.6% 25.9% 2.3% 4.2% 100.0%
Table B30 Vaccination status of reported invasive meningococcal disease cases, by country, 2008
Country Fully vaccinated
Partly vaccinated
Not vaccinated Unknown Total
Fully vaccinated
(%)
Partly vaccinated
(%)
Not vaccinated
(%)
Austria 0 0 0 95 95 0 0 0
Belgium 9 0 27 74 111 8.18 0 24.54
Bulgaria 0 0 0 0 29 - - -
Cyprus 0 0 0 2 2 0 0 0
Czech Republic 0 4 76 4 84 0 4.76 90.47
Denmark 2 0 49 17 68 2.94 0 72.05
Estonia 0 0 6 0 6 0 0 100
Finland 0 0 0 0 28 - - -
France 0 0 0 0 679 - - -
Germany 0 0 0 452 452 0 0 0
Greece 13 14 28 26 81 16.04 17.28 34.56
Hungary 0 0 30 0 30 0 0 100
Ireland 1 0 146 15 162 0.61 0 90.12
Italy 8 0 86 89 183 4.37 0 46.99
Latvia 0 0 14 0 14 0 0 100
Lithuania 1 0 58 9 68 1.47 0 85.29
Luxembourg 0 0 0 2 2 0 0 0
Malta 0 0 3 0 3 0 0 100
Netherlands 78 0 66 18 162 48.14 0 40.74
Poland 4 0 369 0 373 1.07 0 98.924
Portugal 0 0 0 77 77 0 0 0
Romania 0 0 115 0 115 0 0 100
Slovakia 0 0 47 4 51 0 0 92.15
Slovenia 0 0 0 0 24 - - -
Spain 230 0 129 231 590 38.98 0 21.86
Sweden 0 0 0 49 49 0 0 0
United Kingdom 43 17 46 1296 1402 3.06 1.21 3.28
EU total 389 35 1 295 2 460 4 940 9.30 0.83 30.98
Iceland 0 0 0 2 2 0 0 0
Liechtenstein - - - - - - - -
Norway 1 0 20 15 36 2.77 0 55.555556
Total 390 35 1 315 2 477 4 978 9.24 0.82 31.18

Surveillance of invasive bacterial diseases in Europe 2008/2009 SURVEILLANCE REPORT
132
Table B31 Vaccination status of reported invasive meningococcal disease cases, by country, 2009
Country Fully vacci-nated
Partly vacci-nated
Not vacci-nated
Unk Total
Fully vacci-nated (%)
Partly vacci-nated (%)
Not vacci-nated (%)
Unknown (%)
Austria 0 0 0 100 100 0 0 0 100
Belgium 11 0 20 73 104 10.57 0 19.23 70.192308
Bulgaria 0 0 0 0 25 - - - -
Cyprus 0 0 0 1 1 0 0 0 100
Czech Republic 0 4 74 2 80 0 5 92.5 2.5
Denmark 0 0 69 4 73 0 0 94.52 5.47
Estonia 0 0 5 0 5 0 0 100 0
Finland 0 0 0 0 33 - - - -
France 0 0 0 0 618 - - - -
Germany 0 0 0 485 485 0 0 0 100
Greece 19 8 21 33 81 23.45 9.87 25.92 40.74
Hungary 0 0 36 1 37 0 0 97.29 2.70
Ireland 3 0 123 24 150 2 0 82 16
Italy 10 0 84 87 181 5.52 0 46.40 48.06
Latvia 0 0 9 0 9 0 0 100 0
Lithuania 0 0 50 15 65 0 0 76.92 23.07
Luxembourg 0 0 0 3 3 0 0 0 100
Malta 0 0 4 0 4 0 0 100 0
Netherlands 68 0 67 18 153 44.44 0 43.79 11.76
Poland 1 0 304 0 305 0.32 0 99.67 0
Portugal 29 0 37 0 66 43.93 0 56.06 0
Romania 0 0 111 0 111 0 0 100 0
Slovakia 0 0 36 4 40 0 0 90 10
Slovenia 0 0 0 0 15 - - - -
Spain 203 0 143 187 533 38.08 0 26.82 35.08
Sweden 0 0 0 65 65 0 0 0 100
United Kingdom 40 21 37 1148 1246 3.21 1.68 2.96 92.13
EU total 384 33 1230 2250 4588 9.85 0.84 31.56 57.73
Iceland 0 0 0 5 5 0 0 0 100
Liechtenstein - - - - - - - - -
Norway 0 0 21 23 44 0 0 47.72 52.27
Total 384 33 1251 2278 4637 9.73 0.83 31.70 57.72

SURVEILLANCE REPORT Surveillance of invasive bacterial diseases in Europe 2008/2009
133
Table B32 Countries with routine conjugate meningococcal group C vaccination programmes in European countries
Country Routine schedule Year introduced Catch-up Year undertaken
Belgium ¤ 13–18 months 2002 1 year–17 years 2001–2004
Cyprus 12–13 months 2008 - -
Germany 12–13 months, 2006 General recommendation to complete all outstanding vaccinations, including MCC in older children one dose in the 2nd year
of life
Greece 2, 4, 15–18 months 2007 No information
one dose in the 2nd year of life
Iceland 6–8 months 2002 6 month–19 years Oct 2002–Oct 2003
Italy ¤ Between 2 months and 2 years
2005 - -
Ireland ¤ 4, 6 and 13 months 2000 < 23 years Oct 2000–March 2002
one dose in the 2nd year of life
Luxembourg 13 months 2007 No information
Netherlands 14 months 2002 1 year–18 years June 2002–Nov 2002
Portugal 3, 5 and 15 months 2006 < 10 years Jan 2006–Dec 2006
10 years–18 years Jan 2007–Dec 2007
Spain ¤ 2, 6 months 2000 7 month–19 years 2001–2004
booster dose from the age of 12 months
UK ¤ 3, 4, 12 months 1999 < 18 years November 1999–2000
December 2001–2002 19 years–25 years
Source: EUVAC.NET (22 January 2009); Report EU-IBIS 2006. Historical changes: BE: 2002–2006: 12 months; IR: 2000–2006: 2, 4, 6 months; UK: 1999–2006: 2, 3, 4 months; ES: 2000–2006: 2, 4, 6 months; IT: vaccination for specific groups.
Table B33 Conjugate meningococcal group C vaccination programmes in European countries, countries with voluntary vaccination, 2008–2009
Country Given to travellers
Contacts of cases
Outbreak control
Underlying conditions Other Year
introduced
Austria Yes Yes Yes Yes On request -
Czeck Republic Yes Yes Yes On request 2001
Hungary Yes Yes Yes On request 2000
Norway Yes Yes -
Poland Yes Yes Yes Generally recommended -
Sweden Yes On request -
Source: EUVAC.NET; Report EU-IBIS 2006; countries specific comments.

Surveillance of invasive bacterial diseases in Europe 2008/2009 SURVEILLANCE REPORT
134
Table B34 Antibiotic susceptibility of N. meningitidis, EU/EAA countries, 2008
Antibiotic n %
Ciprofloxacin
0.002 487 32.7
0.004 726 48.7
0.008 266 17.9
0.016 4 0.3
0.032 4 0.3
0.125 3 0.2
Unk/NT/Non-numeric 2 166 –
Blank 1 295 –
Resistant (> 0.064) 3 0.2*
Ceftriaxone/Cefotaxime
0.002 319 55.9
0.004 152 26.6
0.008 73 12.8
0.016 21 3.7
0.032 2 0.4
0.125 1 0.2
2 1 0.2
16 2 0.4
Resistant (> 0.125) 3 0.5*
Penicillin
0.002 427 28.4
0.004 3 0.2
0.008 8 0.5
0.016 73 4.9
0.032 285 18.9
0.064 431 28.6
0.125 179 11.9
0.25 91 6.0
0.5 4 0.3
1 1 0.1
32 2 0.1
64 1 0.1
Unk/NT/Non-numeric 2 163 –
Rifampicin
0.002 448 31.3
0.004 142 9.9
0.008 364 25.4
0.016 239 16.7
0.032 118 8.2
0.064 61 4.3
0.125 31 2.2
0.25 20 1.4
0.5 4 0.3
1 1 0.1
16 1 0.1
64 3 0.2
Unk/NT/Non-numeric 2 225 –
Blank 1 294 –
*Proportion of resistant strains out of all cases with numeric value.

SURVEILLANCE REPORT Surveillance of invasive bacterial diseases in Europe 2008/2009
135
Table B35 Antibiotic susceptibility of N. meningitidis, EU/EAA countries, 2009
Antibiotic n % Ciprofloxacin 0.002 97 9.3 0.004 734 70.6 0.008 189 18.2 0.016 16 1.5 0.064 1 0.1 0.125 1 0.1 0.25 1 0.1 2 1 0.1 Unk/NT/Non-numeric 2 255 . Blank 1 319 . Resistant (> 0.064) 2 0.3* Ceftriaxone/Cefotaxime 0.002 198 36.9 0.004 207 38.6 0.008 98 18.3 0.016 25 4.7 0.032 3 0.6 0.064 2 0.4 16 3 0.6 Unk/NT/Non-numeric 2 758 . Blank 1 320 . Resistant (> 0.125) 3 0.6* Penicillin 0.002 3 0.3 0.008 16 1.5 0.016 66 6.2 0.032 311 29.4 0.064 371 35.0 0.125 218 20.6 0.25 56 5.3 0.5 14 1.3 1 1 0.1 32 2 0.2 64 1 0.1 Unk/NT/Non-numeric 2 256 . Blank 1 299 . Rifampicin 0.002 29 3.0 0.004 193 19.6 0.008 315 32.0 0.016 245 24.9 0.032 103 10.5 0.064 53 5.4 0.125 29 3.0 0.25 7 0.7 0.5 2 0.2 2 1 0.1 16 2 0.2 64 4 0.4 Unk/NT/Non-numeric 2 317 . Blank 1 314 .
*Proportion of resistant strains out of all cases with numeric value.

Surveillance of invasive bacterial diseases in Europe 2008/2009 SURVEILLANCE REPORT
136
Table B36 Proportion of resistant invasive meningococcal disease cases to ciprofloxacin out of all cases with numeric value by country, 2008
Country Ciprofloxacin N %
AT Resistant (> 0.064) 2 3.5
BE Resistant (> 0.064) 0 0.0
CZ Resistant (> 0.064) 0 0.0
DK Resistant (> 0.064) 0 0.0
GB Resistant (> 0.064) 0 0.0
HU Resistant (> 0.064) 0 0.0
IT Resistant (> 0.064) 0 0.0
MT Resistant (> 0.064) 0 0.0
NO Resistant (> 0.064) 0 0.0
PL Resistant (> 0.064) 0 0.0
SE Resistant (> 0.064) 0 0.0
SK Resistant (> 0.064) 1 3.2
Table B37 Proportion of resistant invasive meningococcal disease cases to ciprofloxacin out of all cases with numeric value by country, 2009
Country Ciprofloxacin N %
AT Resistant (> 0.064) 0 0.0
BE Resistant (> 0.064) 0 0.0
CZ Resistant (> 0.064) 0 0.0
DK Resistant (> 0.064) 0 0.0
GB Resistant (> 0.064) 0 0.0
HU Resistant (> 0.064) 0 0.0
IT Resistant (> 0.064) 1 1.1
MT Resistant (> 0.064) 0 0.0
NO Resistant (> 0.064) 0 0.0
PL Resistant (> 0.064) 0 0.0
SE Resistant (> 0.064) 1 1.9
SK Resistant (> 0.064) 0 0.0