Embed Size (px)
Citation preview
1
Celanese CorporationSeptember 2008
2
Forward looking statements; Reconciliation and use of non-GAAP measures to U.S. GAAP This presentation may contain “forward-looking statements,” which include information concerning the company’s plans, objectives, goals, strategies, future revenues or performance, capital expenditures, financing needs and other information that is not historical information. When used in this presentation, the words “outlook,”“forecast,” “estimates,” “expects,” “anticipates,” “projects,” “plans,” “intends,” “believes,” and variations of such words or similar expressions are intended to identify forward-looking statements. All forward-looking statements are based upon current expectations and beliefs and various assumptions. There can be no assurance that the company will realize these expectations or that these beliefs will prove correct. There are a number of risks and uncertainties that could cause actual results to differ materially from the forward-looking statements contained in this release. Numerous factors, many of which are beyond the company’s control, could cause actual results to differ materially from those expressed as forward-looking statements. Certain of these risk factors are discussed in the company’s filings with the Securities and Exchange Commission. Any forward-looking statement speaks only as of the date on which it is made, and the company undertakes no obligation to update any forward-looking statements to reflect events or circumstances after the date on which it is made or to reflect the occurrence of anticipated or unanticipated events or circumstances.
This presentation reflects three performance measures, operating EBITDA, adjusted earnings per share and adjusted free cash flow as non-U.S. GAAP measures. The most directly comparable financial measure presented in accordance with U.S. GAAP in our consolidated financial statements for operating EBITDA is operating profit; for adjusted earnings per share is earnings per common share-diluted; and for adjusted free cash flow is cash flow from operations.
►Operating EBITDA, a measure used by management to measure performance, is defined as operating profit from continuing operations, plus equity in net earnings from affiliates, other income and depreciation and amortization, and further adjusted for other charges and adjustments. We provide guidance on operating EBITDA and are unable to reconcile forecasted operating EBITDA to a GAAP financial measure because a forecast of other charges and other adjustments is not practical. Our management believes operating EBITDA is useful to investors because it is one of the primary measures our management uses for its planning and budgeting processes and to monitor and evaluate financial and operating results. Operating EBITDA is not a recognized term under U.S. GAAP and does not purport to be an alternative to operating profit as a measure of operating performance or to cash flow from operations as a measure of liquidity. Because not all companies use identical calculations, this presentation of operating EBITDA may not be comparable to other similarly titled measures of other companies. Additionally, operating EBITDA is not intended to be a measure of free cash flow for management’s discretionary use, as it does not consider certain cash requirements such as interest payments, tax payments and debt service requirements nor does it represent the amount used in our debt covenants.
►Adjusted earnings per share is a measure used by management to measure performance. It is defined as net earnings (loss) available to common shareholders plus preferred dividends, adjusted for other charges and adjustments, and divided by the number of basic common shares, diluted preferred shares, and options valued using the treasury method. We provide guidance on an adjusted earnings per share basis and are unable to reconcile forecasted adjusted earnings per share to a GAAP financial measure because a forecast of other charges and other adjustments is not practical. We believe that the presentation of this non-U.S. GAAP measure provides useful information to management and investors regarding various financial and business trends relating to our financial condition and results of operations, and that when U.S. GAAP information is viewed in conjunction with non-U.S. GAAP information, investors are provided with a more meaningful understanding of our ongoing operating performance. This non-U.S. GAAP information is not intended to be considered in isolation or as a substitute for U.S. GAAP financial information.
►The tax rate used for adjusted earnings per share is the tax rate based on our initial guidance, less changes in uncertain tax positions. We adjust this tax rate during the year only if there is a substantial change in our underlying operations; an updated forecast would not necessarily result in a change to our tax rate used for adjusted earnings per share. The adjusted tax rate may differ significantly from the tax rate used for U.S. GAAP reporting in any given reporting period. It is not practical to reconcile our prospective adjusted tax rate to the actual U.S. GAAP tax rate in any future period.
►Adjusted free cash flow is defined as cash flow from operations less capital expenditures, other productive asset purchases, operating cash from discontinued operations and certain other charges and adjustments. We believe that the presentation of this non-U.S. GAAP measure provides useful information to management and investors regarding changes to the company’s cash flow. Our management and credit analysts use adjusted free cash flow to evaluate the company’s liquidity and assess credit quality. This non-U.S. GAAP measure is not intended to be considered in isolation or as a substitute for U.S. GAAP financial information.
3
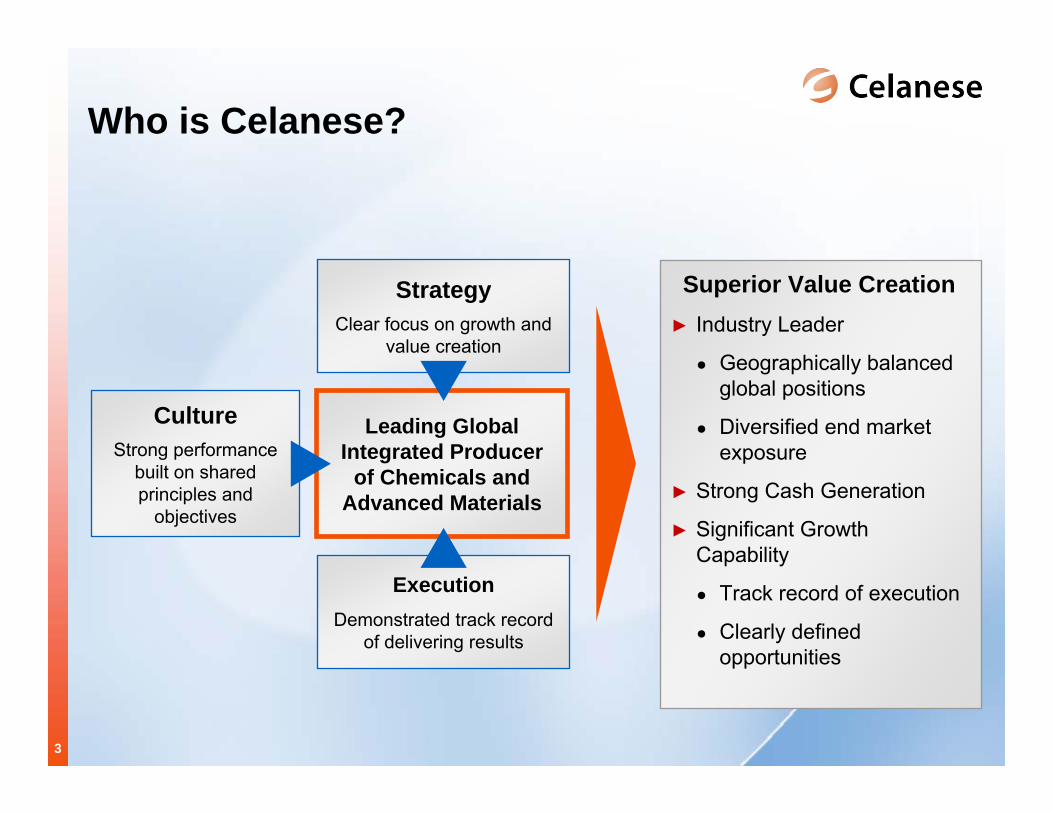
Who is Celanese?
Leading Global Integrated Producer
of Chemicals and Advanced Materials
ExecutionDemonstrated track record
of delivering results
StrategyClear focus on growth and
value creation
CultureStrong performance
built on shared principles and
objectives
Superior Value Creation► Industry Leader
● Geographically balanced global positions
● Diversified end market exposure
► Strong Cash Generation
► Significant Growth Capability
● Track record of execution
● Clearly defined opportunities
4
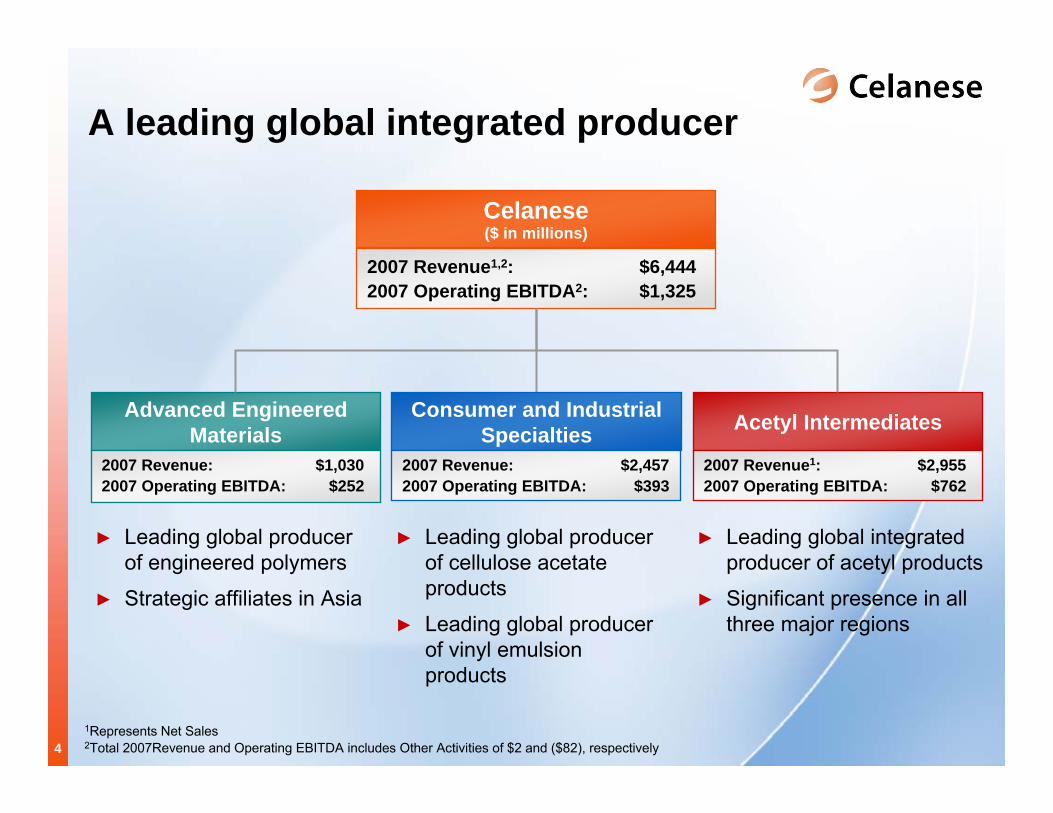
A leading global integrated producer
Celanese($ in millions)
2007 Revenue1,2: $6,444 2007 Operating EBITDA2: $1,325
Acetyl IntermediatesConsumer and Industrial Specialties
Advanced Engineered Materials
► Leading global producer of engineered polymers
► Strategic affiliates in Asia
► Leading global producer of cellulose acetate products
► Leading global producer of vinyl emulsion products
► Leading global integrated producer of acetyl products
► Significant presence in all three major regions
2007 Revenue1: $2,9552007 Operating EBITDA: $762
2007 Revenue: $2,4572007 Operating EBITDA: $393
2007 Revenue: $1,0302007 Operating EBITDA: $252
1Represents Net Sales2Total 2007Revenue and Operating EBITDA includes Other Activities of $2 and ($82), respectively
5
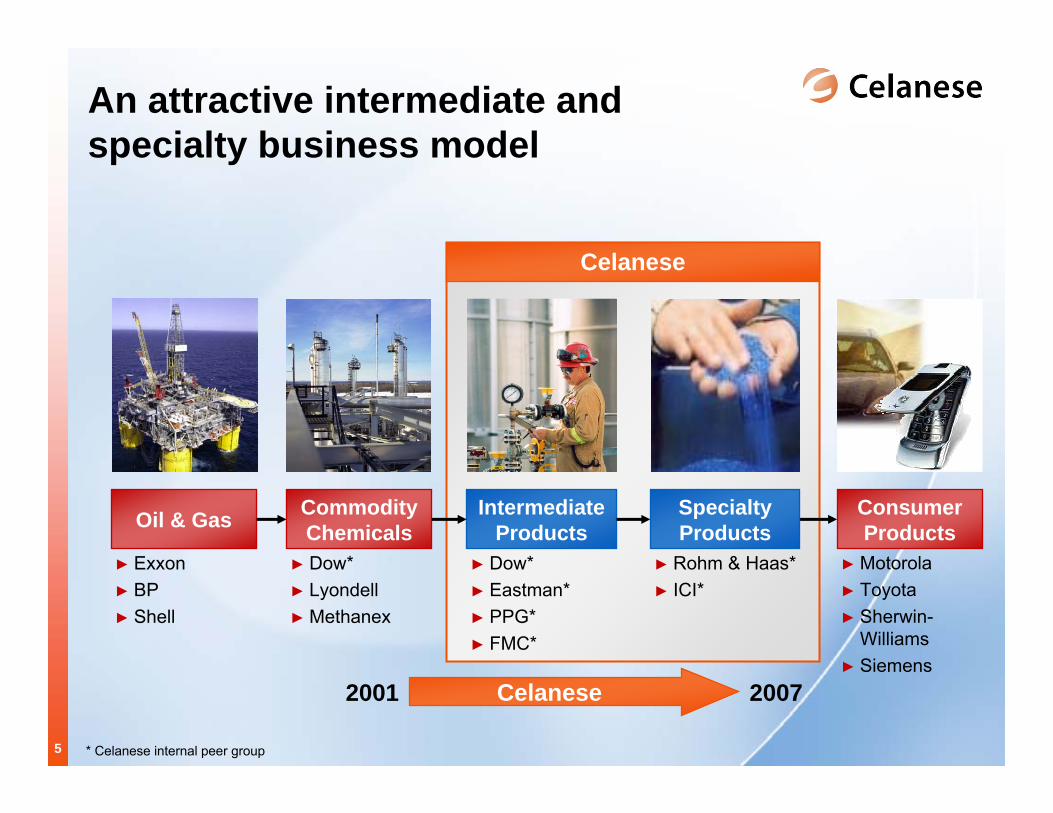
An attractive intermediate and specialty business model
Commodity Chemicals
Intermediate ProductsOil & Gas Consumer
Products► Motorola► Toyota► Sherwin-
Williams► Siemens
► Dow*► Lyondell► Methanex
► Rohm & Haas*► ICI*
Specialty Products
► Dow* ► Eastman*► PPG*► FMC*
* Celanese internal peer group
► Exxon► BP► Shell
Celanese
2001 2007Celanese
6
29% 43% 28%
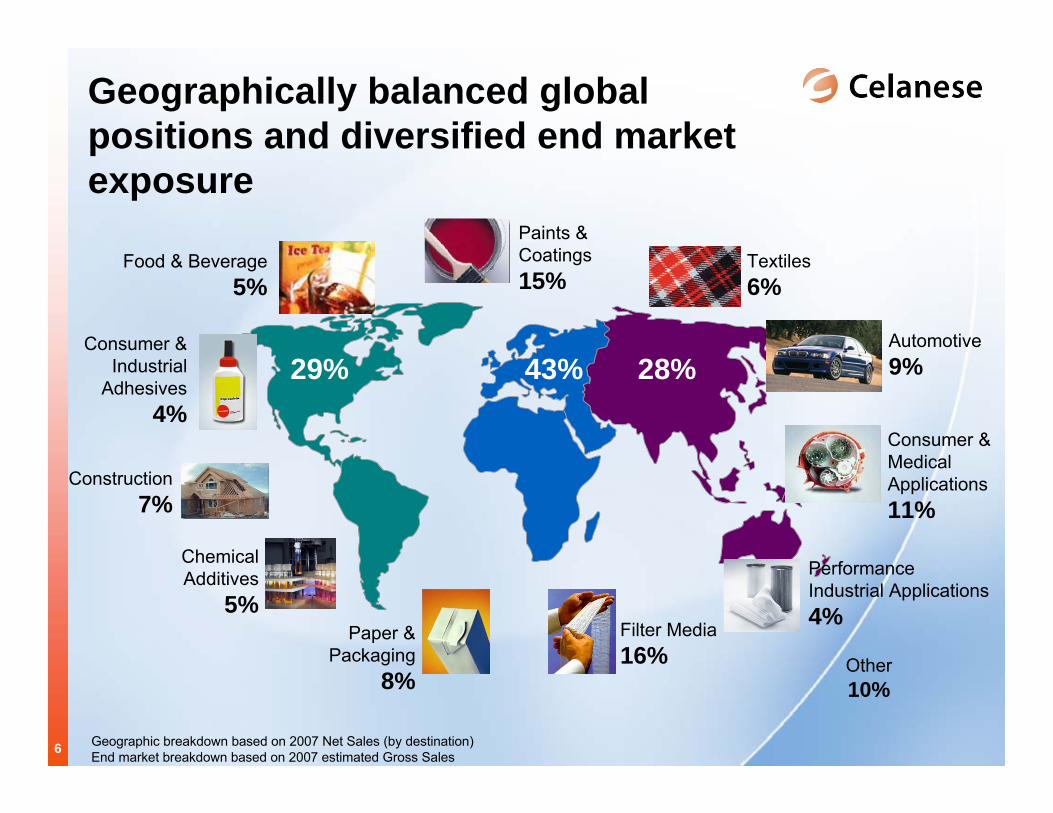
Geographically balanced global positions and diversified end market exposure
Geographic breakdown based on 2007 Net Sales (by destination)End market breakdown based on 2007 estimated Gross Sales
Other10%
Construction7%
Paints & Coatings15%
Automotive9%
Consumer & MedicalApplications11%
Filter Media16%
Consumer & Industrial
Adhesives4%
Textiles6%
Food & Beverage5%
Chemical Additives
5%Paper &
Packaging8%
Performance Industrial Applications4%
7
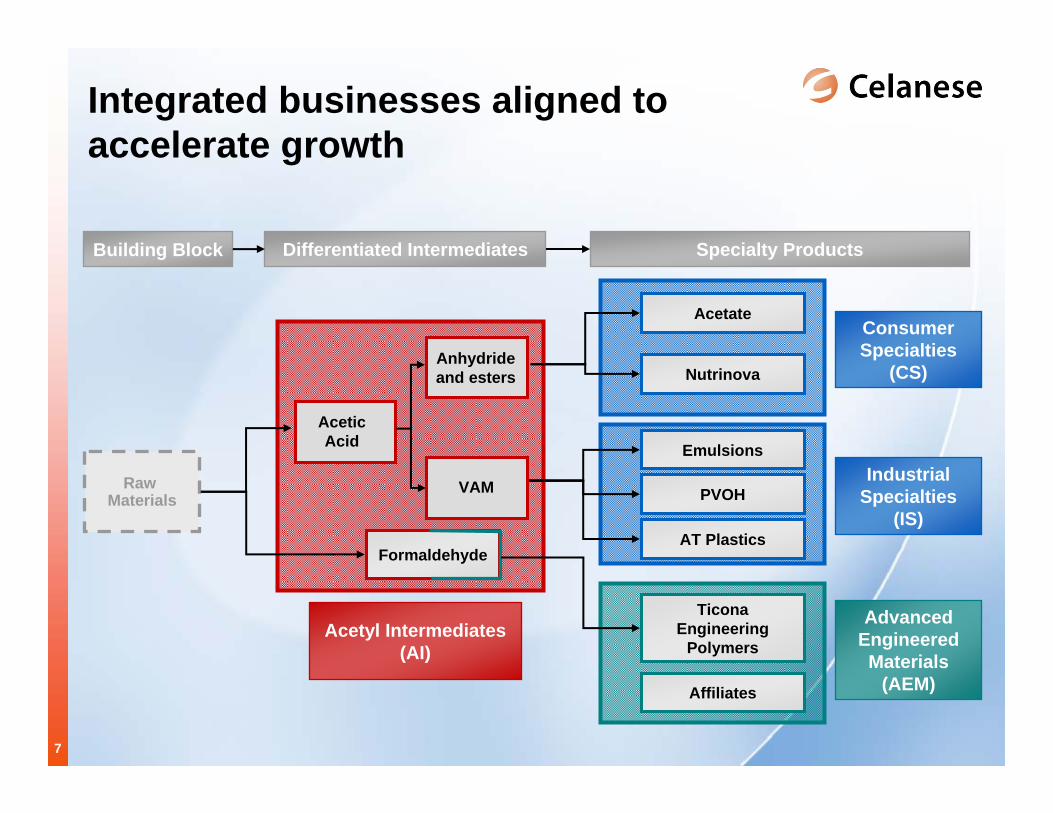
Integrated businesses aligned to accelerate growth
Acetyl Intermediates (AI)
Formaldehyde
Differentiated Intermediates Specialty ProductsBuilding Block
Raw Materials
Advanced Engineered Materials
(AEM)
Industrial Specialties
(IS)
Consumer Specialties
(CS)
Ticona Engineering
Polymers
Emulsions
Acetate
AT Plastics
Nutrinova
PVOH
Affiliates
Acetic Acid
Anhydride and esters
VAM
8
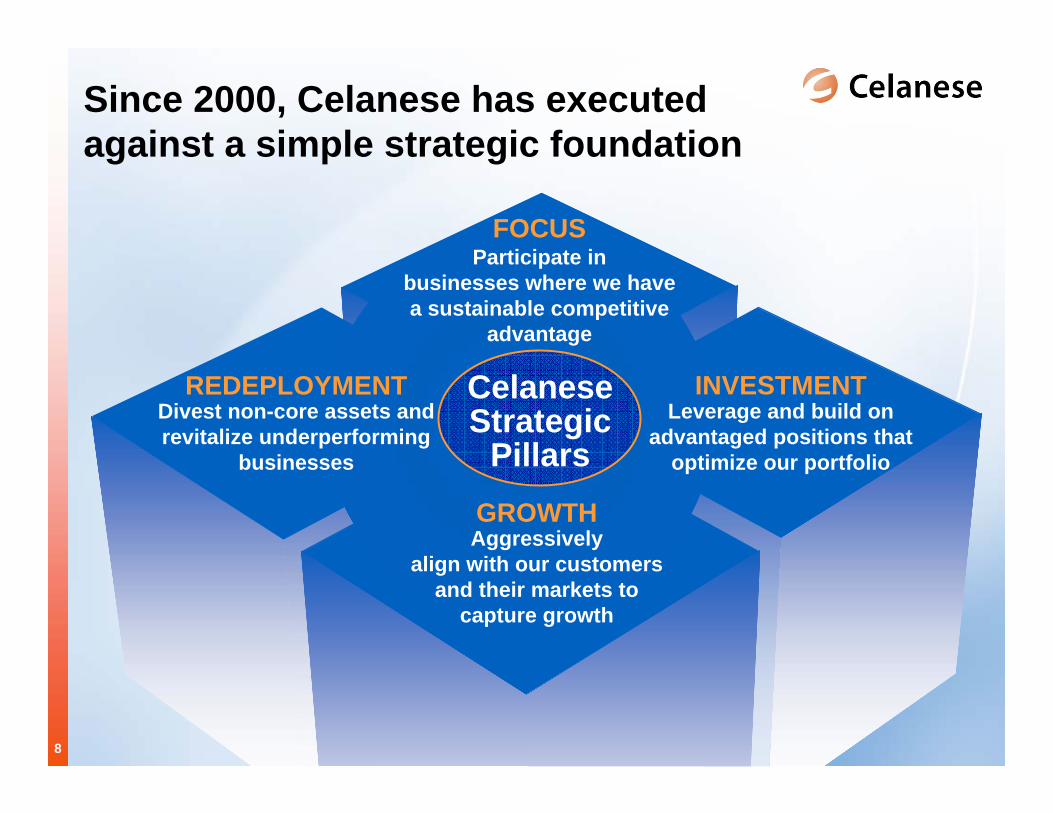
Since 2000, Celanese has executed against a simple strategic foundation
Divest non-core assets and revitalize underperforming
businesses
Aggressively align with our customers
and their markets to capture growth
Participate in businesses where we have a sustainable competitive
advantage
Leverage and build on advantaged positions that
optimize our portfolio
FOCUS
GROWTH
REDEPLOYMENT INVESTMENTCelaneseStrategic
Pillars
9
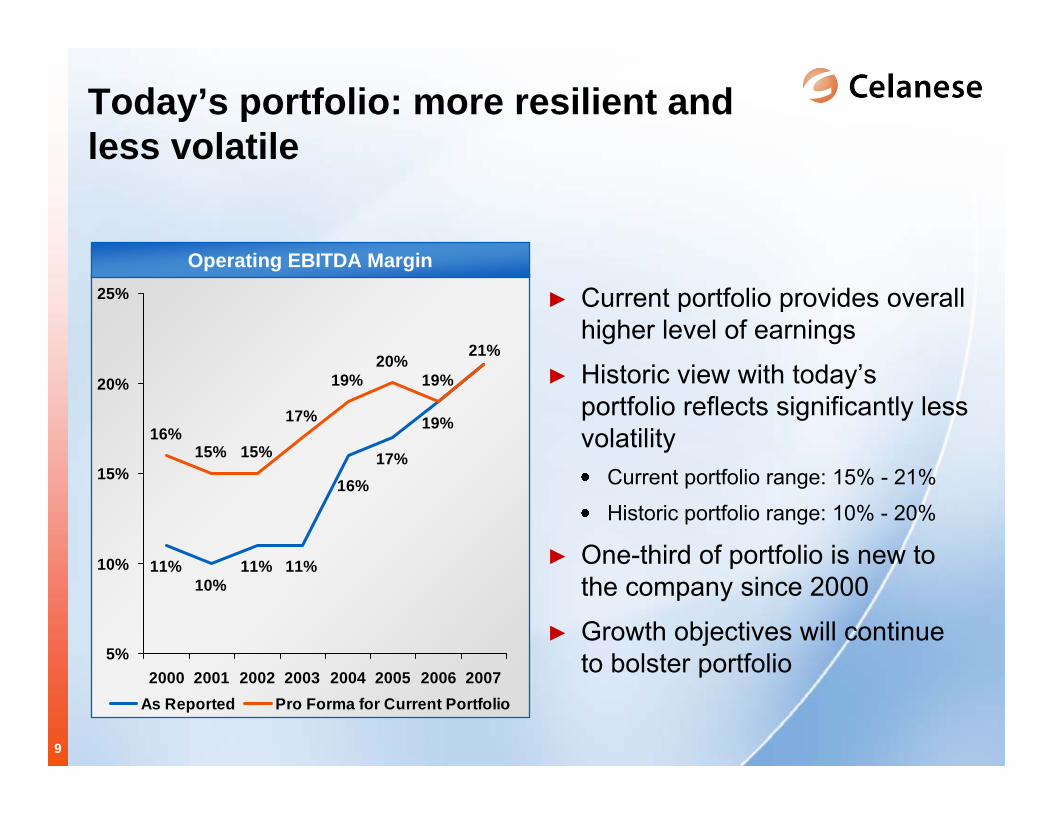
11%10%
11% 11%
17%
19%16%15% 15%
17%
19%20%
19%
16%
21%
5%
10%
15%
20%
25%
2000 2001 2002 2003 2004 2005 2006 2007As Reported Pro Forma for Current Portfolio
Operating EBITDA Margin
Today’s portfolio: more resilient and less volatile
► Current portfolio provides overall higher level of earnings
► Historic view with today’s portfolio reflects significantly less volatility
Current portfolio range: 15% - 21%
Historic portfolio range: 10% - 20%
► One-third of portfolio is new to the company since 2000
► Growth objectives will continue to bolster portfolio
10
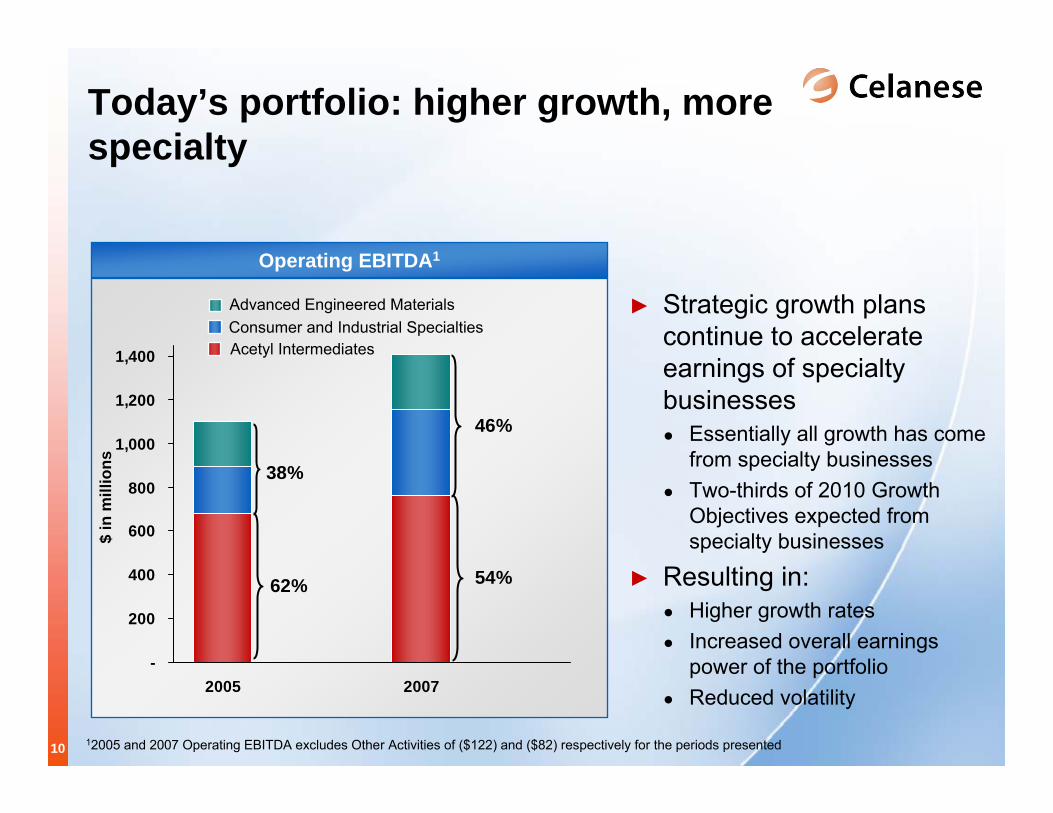
Operating EBITDA1
Today’s portfolio: higher growth, more specialty
► Strategic growth plans continue to accelerate earnings of specialty businesses● Essentially all growth has come
from specialty businesses● Two-thirds of 2010 Growth
Objectives expected from specialty businesses
► Resulting in:● Higher growth rates● Increased overall earnings
power of the portfolio● Reduced volatility
-
200
400
600
800
1,000
1,200
1,400
2005 2007
12005 and 2007 Operating EBITDA excludes Other Activities of ($122) and ($82) respectively for the periods presented
62%
38%
54%
46%
Acetyl IntermediatesConsumer and Industrial SpecialtiesAdvanced Engineered Materials
$ in
mill
ions
11
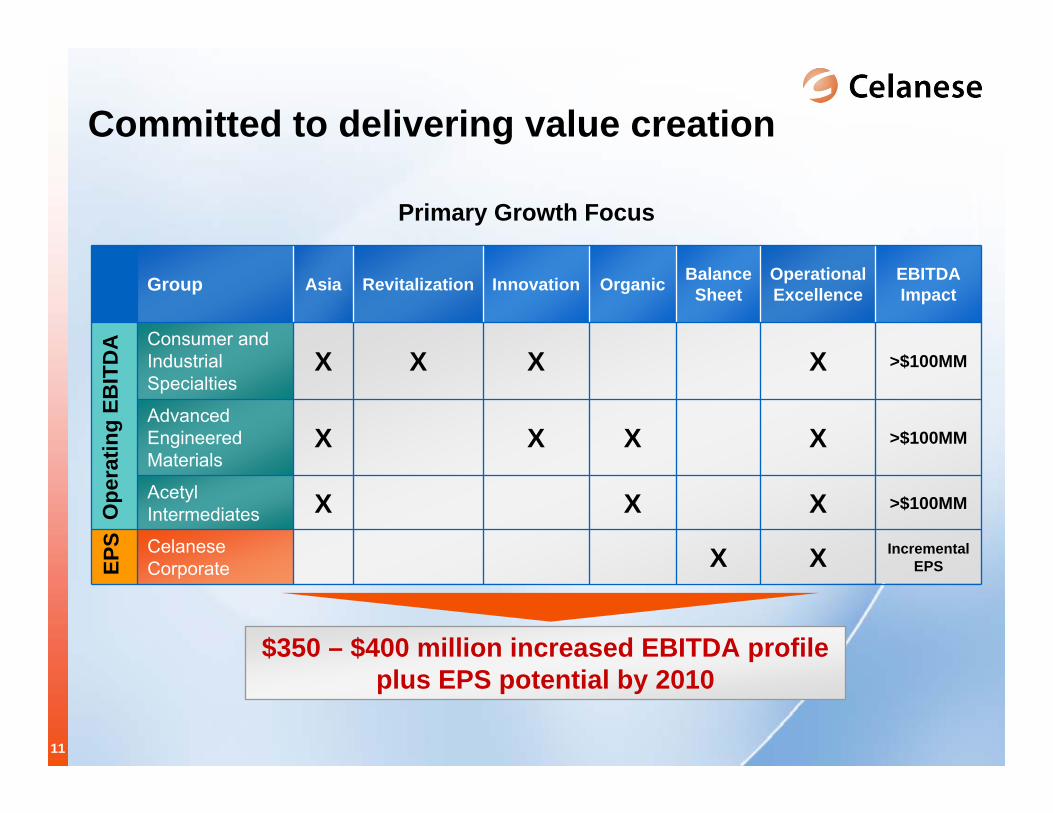
Committed to delivering value creation
$350 – $400 million increased EBITDA profile plus EPS potential by 2010
Group Asia Revitalization Innovation Organic Balance Sheet
Operational Excellence
EBITDA Impact
Consumer and Industrial Specialties
X X X X >$100MM
Advanced Engineered Materials
X X X X >$100MM
Acetyl Intermediates X X X >$100MM
Celanese Corporate X X Incremental
EPS
Primary Growth Focus
Ope
ratin
g EB
ITD
AEP
S
12
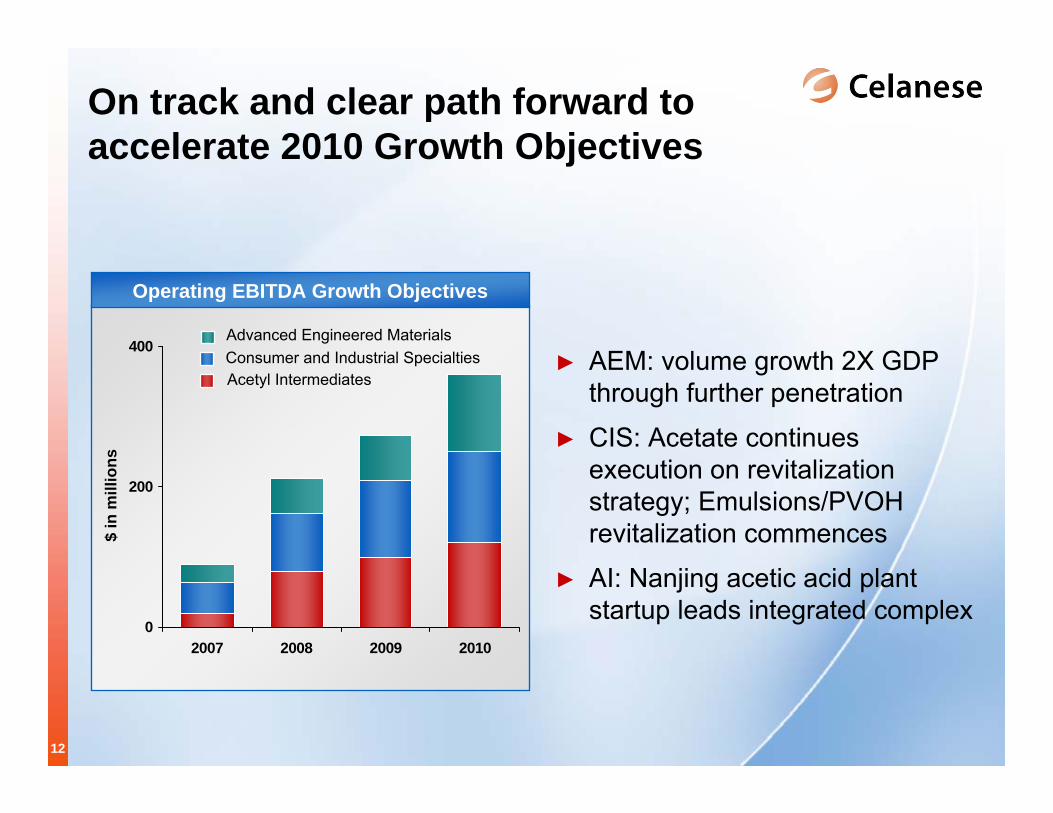
0
200
400
2007 2008 2009 2010
Operating EBITDA Growth Objectives
On track and clear path forward to accelerate 2010 Growth Objectives
► AEM: volume growth 2X GDP through further penetration
► CIS: Acetate continues execution on revitalization strategy; Emulsions/PVOH revitalization commences
► AI: Nanjing acetic acid plant startup leads integrated complex
Acetyl IntermediatesConsumer and Industrial SpecialtiesAdvanced Engineered Materials
$ in
mill
ions
13
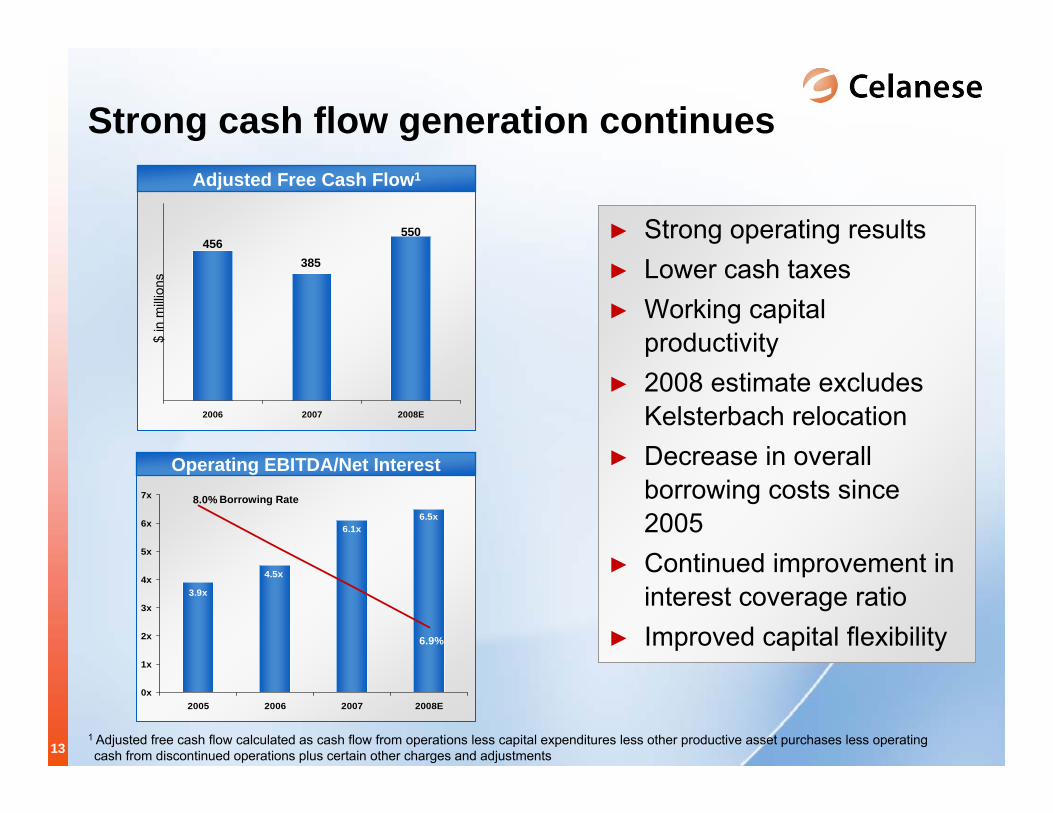
Strong cash flow generation continues
► Strong operating results► Lower cash taxes► Working capital
productivity► 2008 estimate excludes
Kelsterbach relocation► Decrease in overall
borrowing costs since 2005
► Continued improvement in interest coverage ratio
► Improved capital flexibility
1 Adjusted free cash flow calculated as cash flow from operations less capital expenditures less other productive asset purchases less operating cash from discontinued operations plus certain other charges and adjustments
Adjusted Free Cash Flow1
2006 2007 2008E
456385
550
$ in
milli
ons
3.9x
6.5x6.1x
4.5x
0x
1x
2x
3x
4x
5x
6x
7x
2005 2006 2007 2008E
Operating EBITDA/Net Interest
6.9%
8.0% Borrowing Rate
14
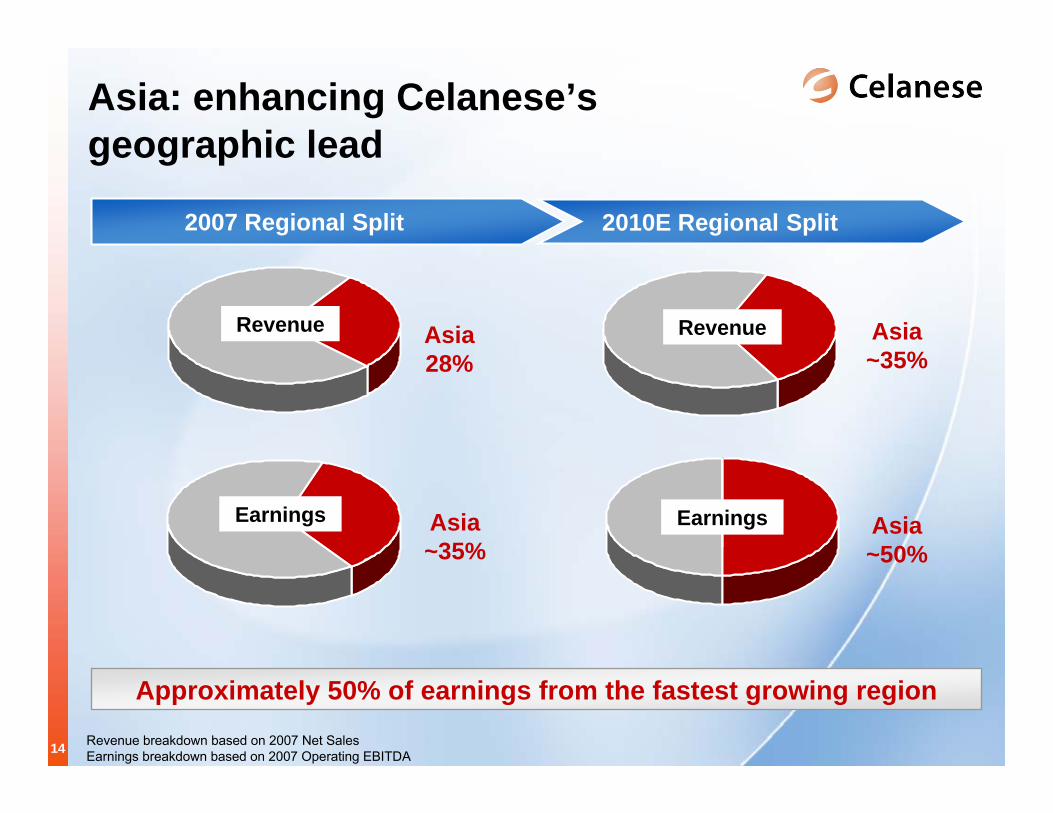
Asia: enhancing Celanese’s geographic lead
Revenue breakdown based on 2007 Net SalesEarnings breakdown based on 2007 Operating EBITDA
Approximately 50% of earnings from the fastest growing region
2007 Regional Split
Asia~35%
Asia28%
Revenue
Earnings
2010E Regional Split
Asia~50%
Asia~35%
Revenue
Earnings
15
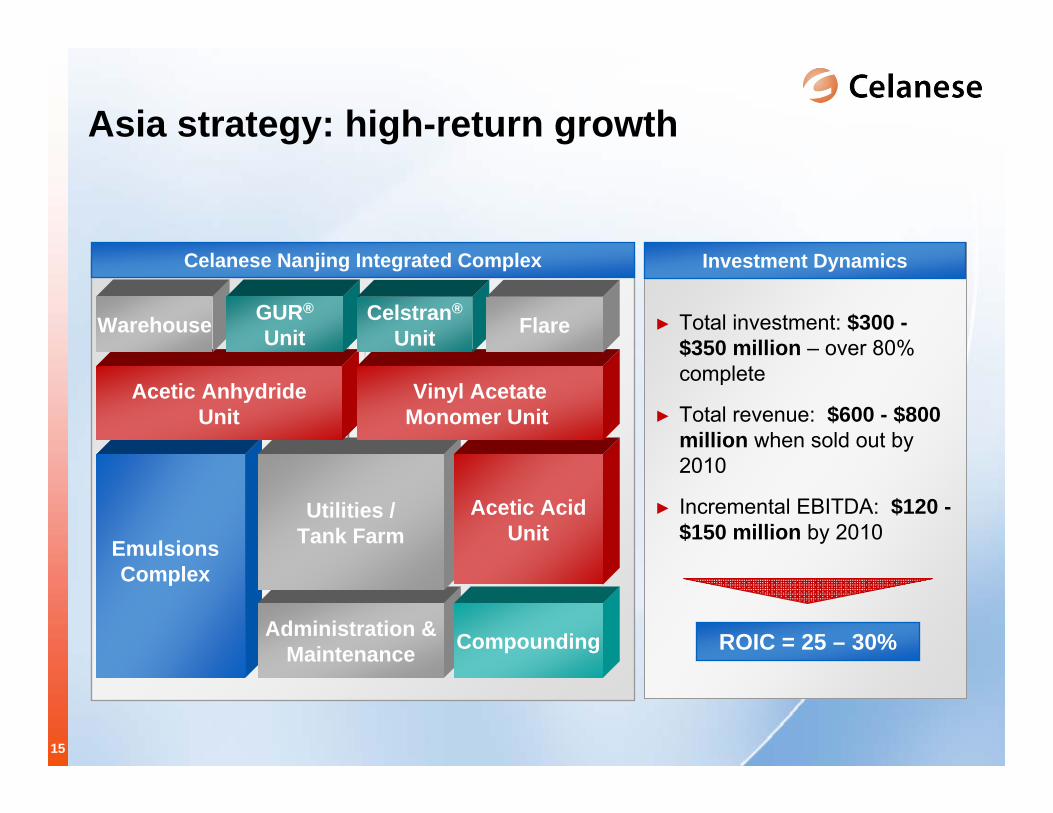
Asia strategy: high-return growth
► Total investment: $300 -$350 million – over 80% complete
► Total revenue: $600 - $800 million when sold out by 2010
► Incremental EBITDA: $120 -$150 million by 2010
ROIC = 25 – 30%
Investment Dynamics
EmulsionsComplex
Administration &Maintenance
Utilities /Tank Farm
Compounding
Acetic AcidUnit
Acetic AnhydrideUnit
Vinyl AcetateMonomer Unit
Warehouse GUR®
UnitCelstran®
Unit Flare
Celanese Nanjing Integrated Complex
16
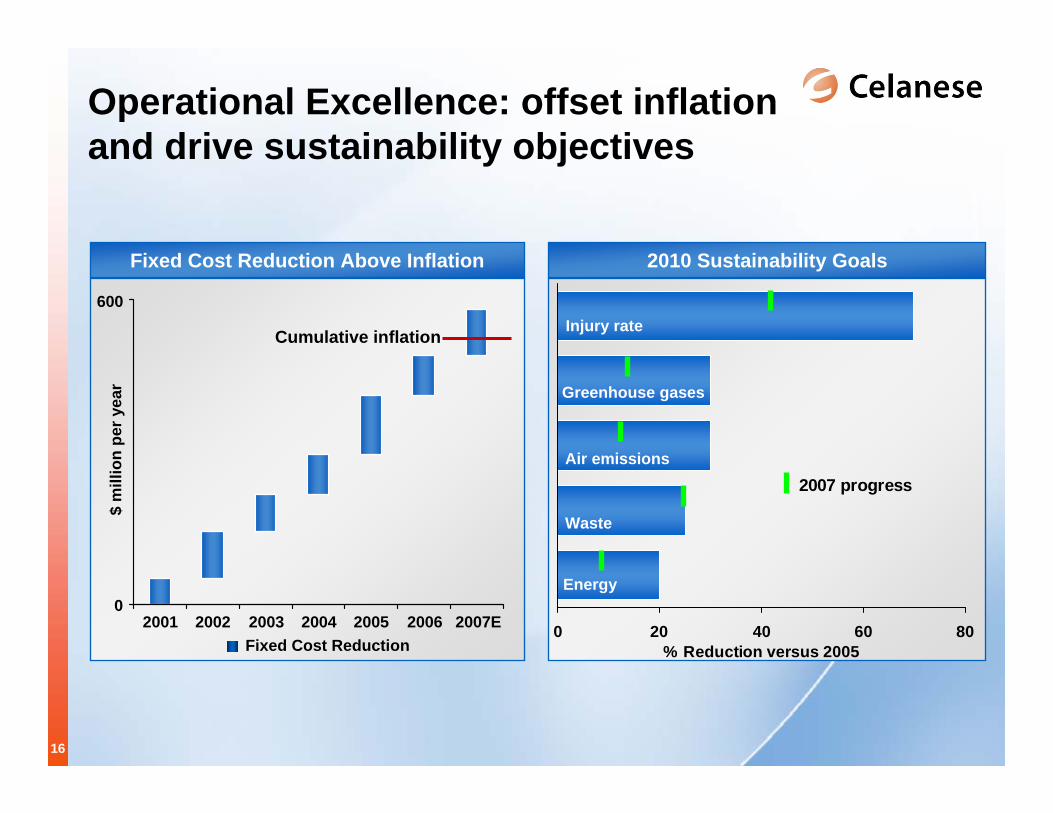
Operational Excellence: offset inflation and drive sustainability objectives
2010 Sustainability Goals
0 20 40 60 80% Reduction versus 2005
2007 progress
Fixed Cost Reduction Above Inflation
0
600
2001 2002 2003 2004 2005 2006 2007E
$ m
illio
n pe
r yea
r
Cumulative inflation Injury rate
Greenhouse gases
Air emissions
Waste
Energy
Fixed Cost Reduction
17
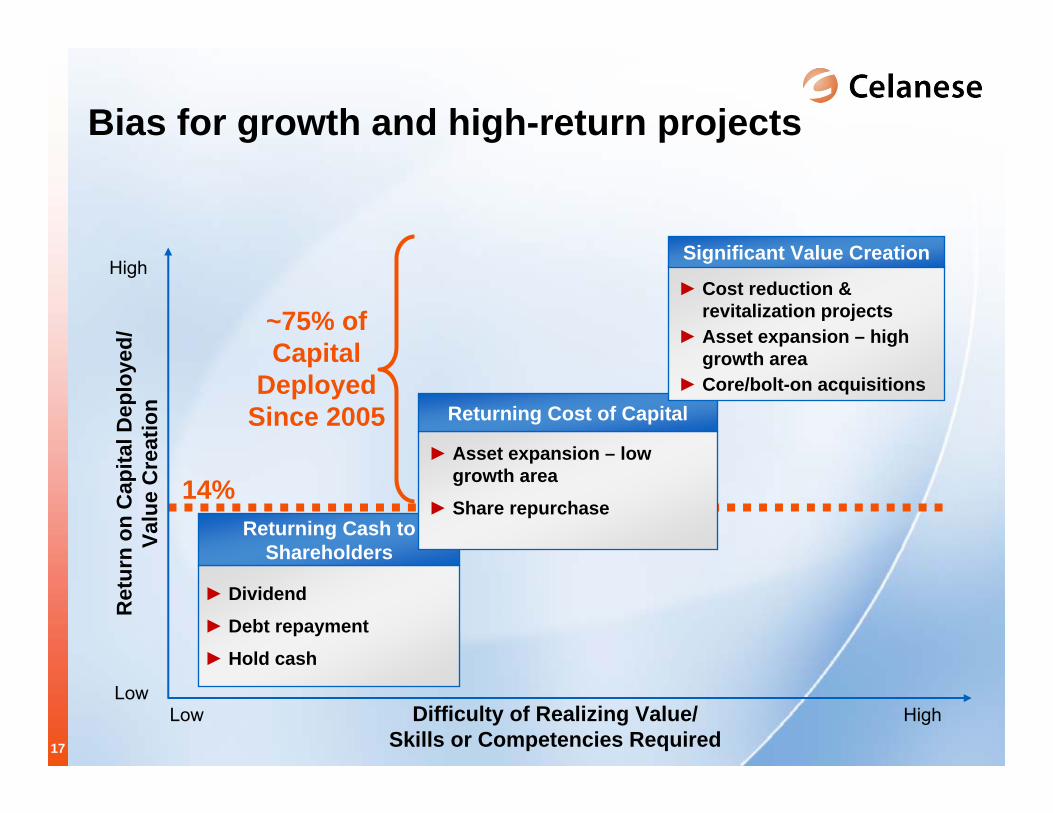
14%
Low HighLow
High
Bias for growth and high-return projects
► Dividend
► Debt repayment
► Hold cash
Returning Cash to Shareholders
► Asset expansion – low growth area
► Share repurchase
Returning Cost of Capital
► Cost reduction & revitalization projects
► Asset expansion – high growth area
► Core/bolt-on acquisitions
Significant Value Creation
~75% of Capital
Deployed Since 2005
Ret
urn
on C
apita
l Dep
loye
d/Va
lue
Cre
atio
n
Difficulty of Realizing Value/Skills or Competencies Required
18
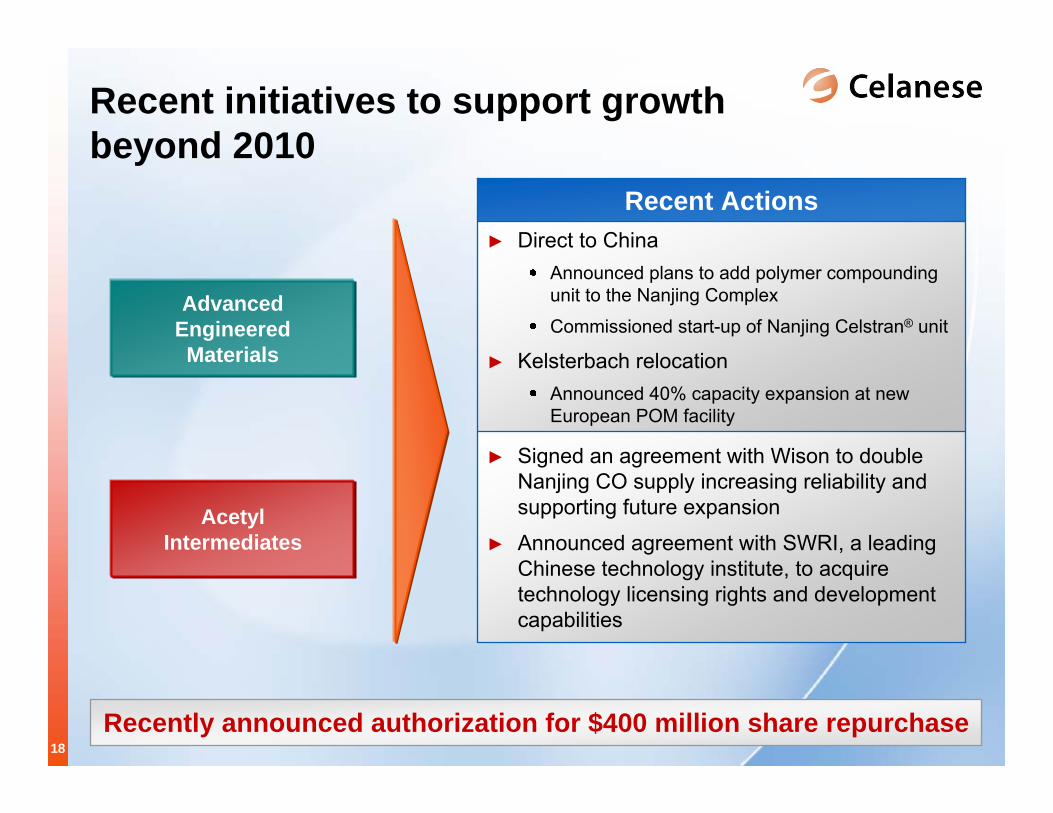
Recent initiatives to support growth beyond 2010
► Signed an agreement with Wison to double Nanjing CO supply increasing reliability and supporting future expansion
► Announced agreement with SWRI, a leading Chinese technology institute, to acquire technology licensing rights and development capabilities
► Direct to ChinaAnnounced plans to add polymer compounding unit to the Nanjing Complex
Commissioned start-up of Nanjing Celstran® unit
► Kelsterbach relocationAnnounced 40% capacity expansion at new European POM facility
Recent Actions
Advanced Engineered Materials
Acetyl Intermediates
Recently announced authorization for $400 million share repurchase

19
Celanese core values: our DNA
19
► …a precondition…► …highest standards…
► …attract, develop and retain…► …continuously learn…
► …think globally…► …create growth opportunities…
► …sense of urgency…► …performance driven…

20
Advanced Engineered Materials
21
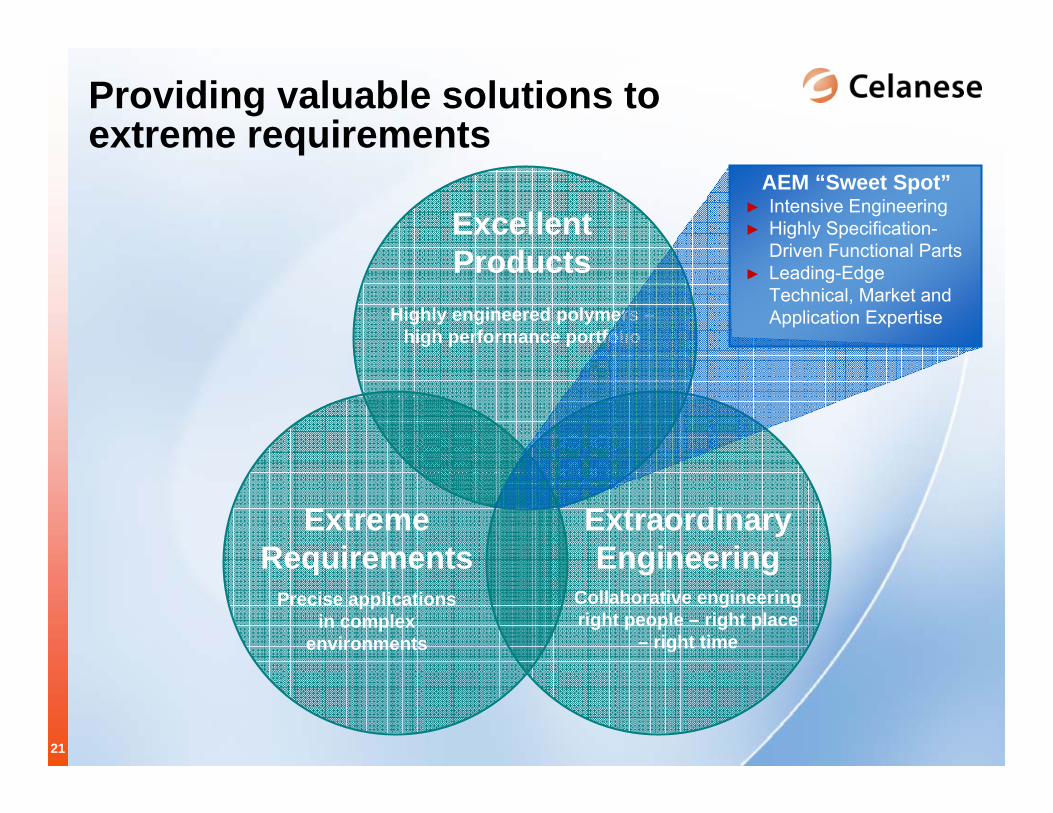
Providing valuable solutions to extreme requirements
Precise applications in complex
environments
Extreme Requirements
Highly engineered polymers –high performance portfolio
Excellent Products
Collaborative engineering right people – right place
– right time
ExtraordinaryEngineering
AEM “Sweet Spot”► Intensive Engineering ► Highly Specification-
Driven Functional Parts► Leading-Edge
Technical, Market and Application Expertise
22
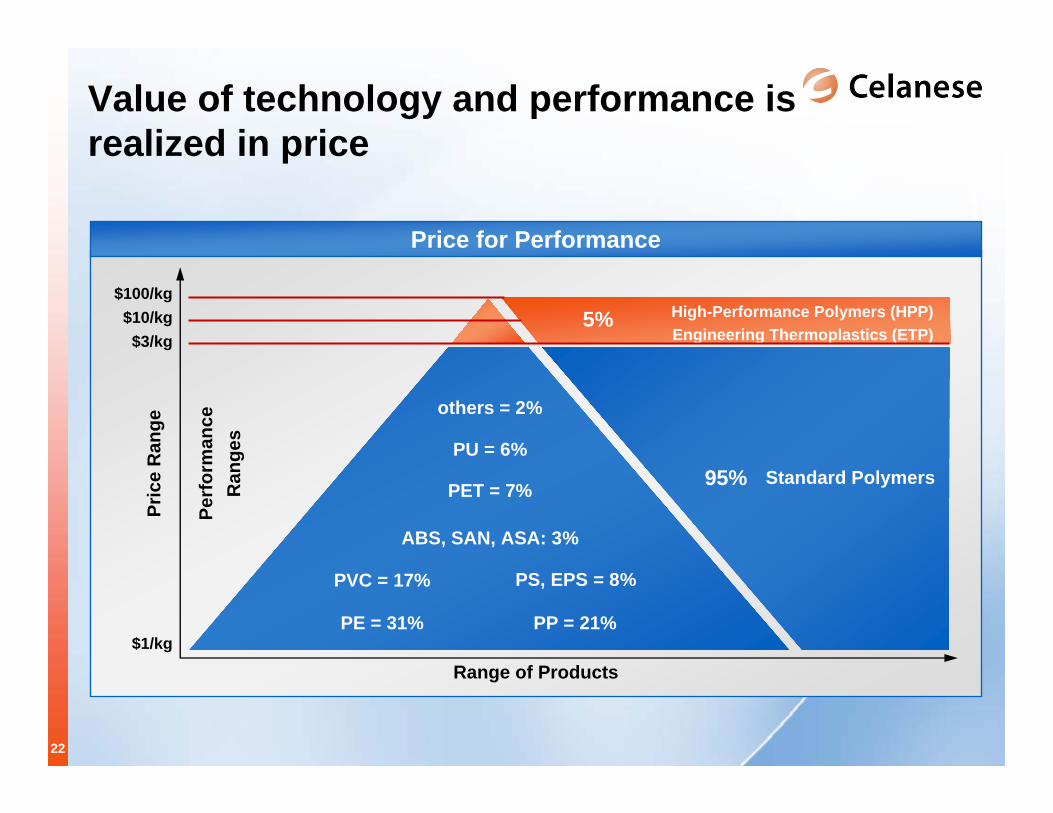
Value of technology and performance is realized in price
$1/ kg
$100 / kg$10 / kg$3 / kg
Price for Performance
95%
5%
Standard Polymers
High-Performance Polymers (HPP)Engineering Thermoplastics (ETP)
ABS, SAN, ASA: 3%
PE = 31% PP = 21%
PET = 7%
PU = 6%
PVC = 17% PS, EPS = 8%
others = 2%
Range of Products$1/kg
$100/kg$10/kg$3/kg
Pric
e R
ange
Perf
orm
ance
Ran
ges
23
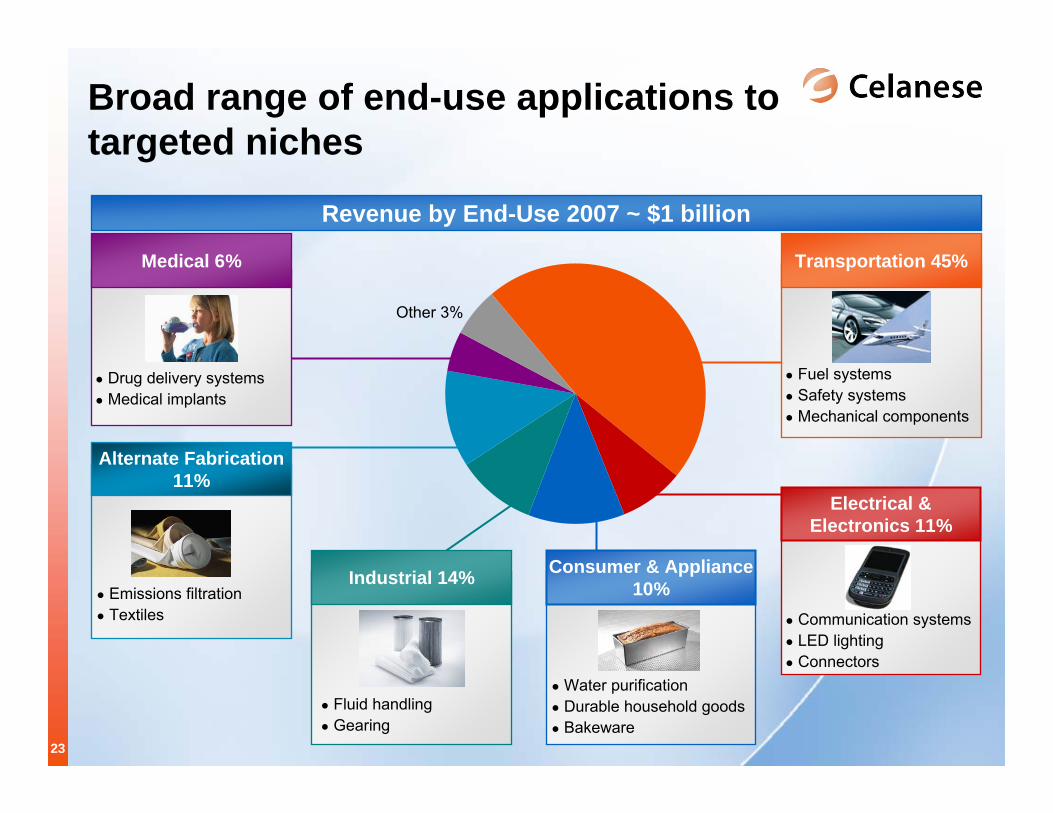
Other 3%
Broad range of end-use applications to targeted niches
Revenue by End-Use 2007 ~ $1 billion
Alternate Fabrication11%
Transportation 45%
● Fuel systems● Safety systems● Mechanical components
Electrical & Electronics 11%
● Communication systems● LED lighting● Connectors
Consumer & Appliance 10%
● Water purification● Durable household goods● Bakeware
Industrial 14%
● Fluid handling● Gearing
● Drug delivery systems● Medical implants
Medical 6%
● Emissions filtration● Textiles
24
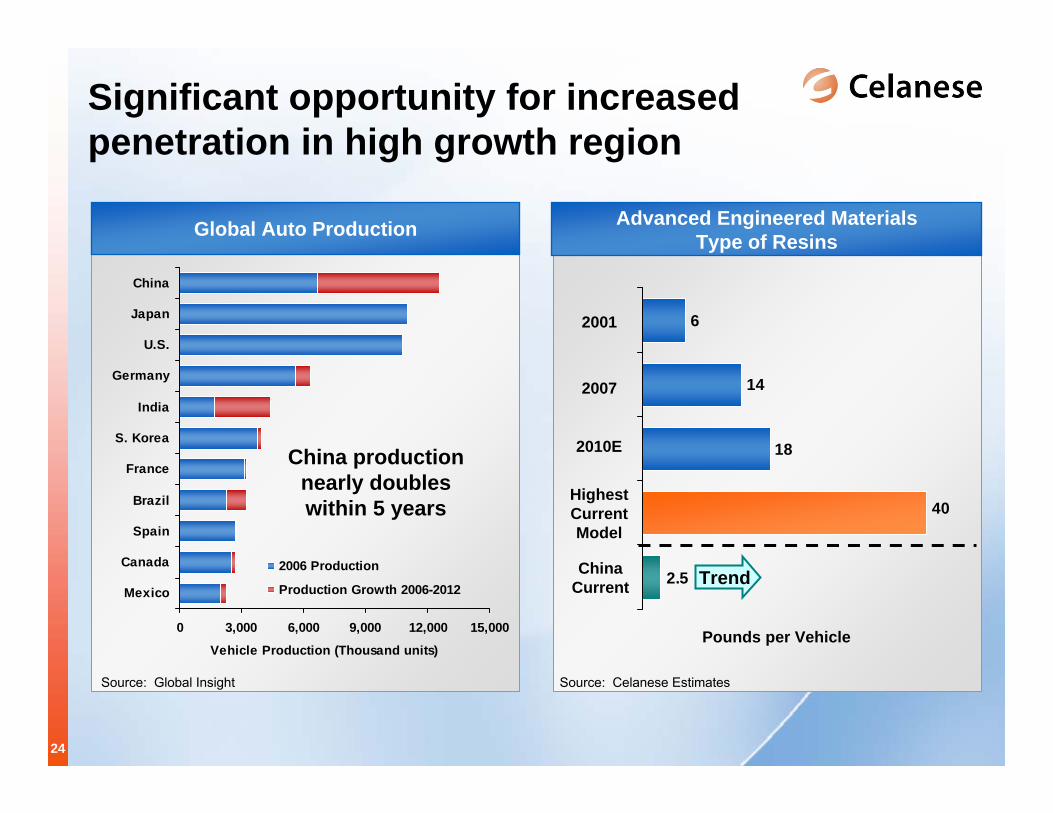
14
6
2.5
40
18
Source: Global Insight
Pounds per Vehicle
Source: Celanese Estimates
Significant opportunity for increased penetration in high growth region
0 3,000 6,000 9,000 12,000 15,000
Mexico
Canada
Spain
Brazil
France
S. Korea
India
Germany
U.S.
Japan
China
Vehicle Production (Thousand units)
2006 Production
Production Growth 2006-2012
China production nearly doubles within 5 years
Trend
Global Auto Production
2001
2010E
Highest Current Model
China Current
2007
Advanced Engineered Materials Type of Resins

25
Consumer and Industrial Specialties
26
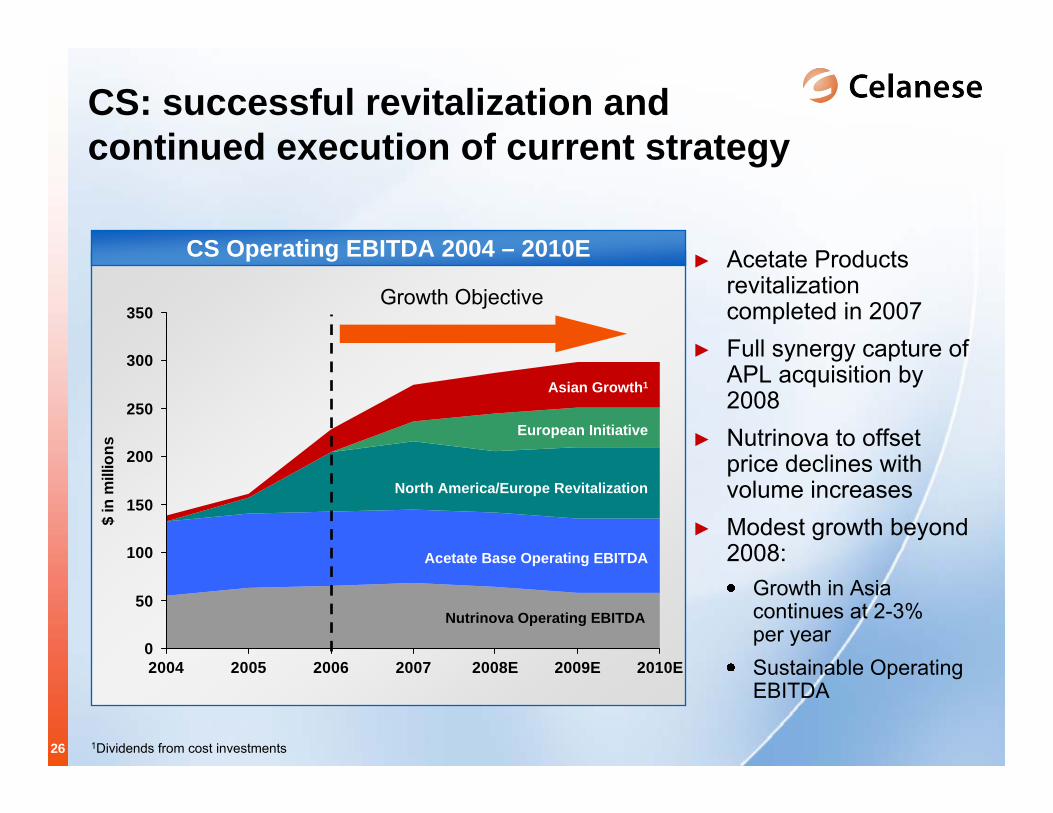
CS Operating EBITDA 2004 – 2010E
0
50
100
150
200
250
300
350
2004 2005 2006 2007 2008E 2009E 2010E
$ in
mill
ions
CS: successful revitalization and continued execution of current strategy
► Acetate Products revitalization completed in 2007
► Full synergy capture of APL acquisition by 2008
► Nutrinova to offset price declines with volume increases
► Modest growth beyond 2008:
Growth in Asia continues at 2-3%per yearSustainable Operating EBITDA
1Dividends from cost investments
Asian Growth1
Growth Objective
Nutrinova Operating EBITDA
Acetate Base Operating EBITDA
European Initiative
North America/Europe Revitalization
27
0.0
1.0
2.0
3.0
4.0
2006 2010E
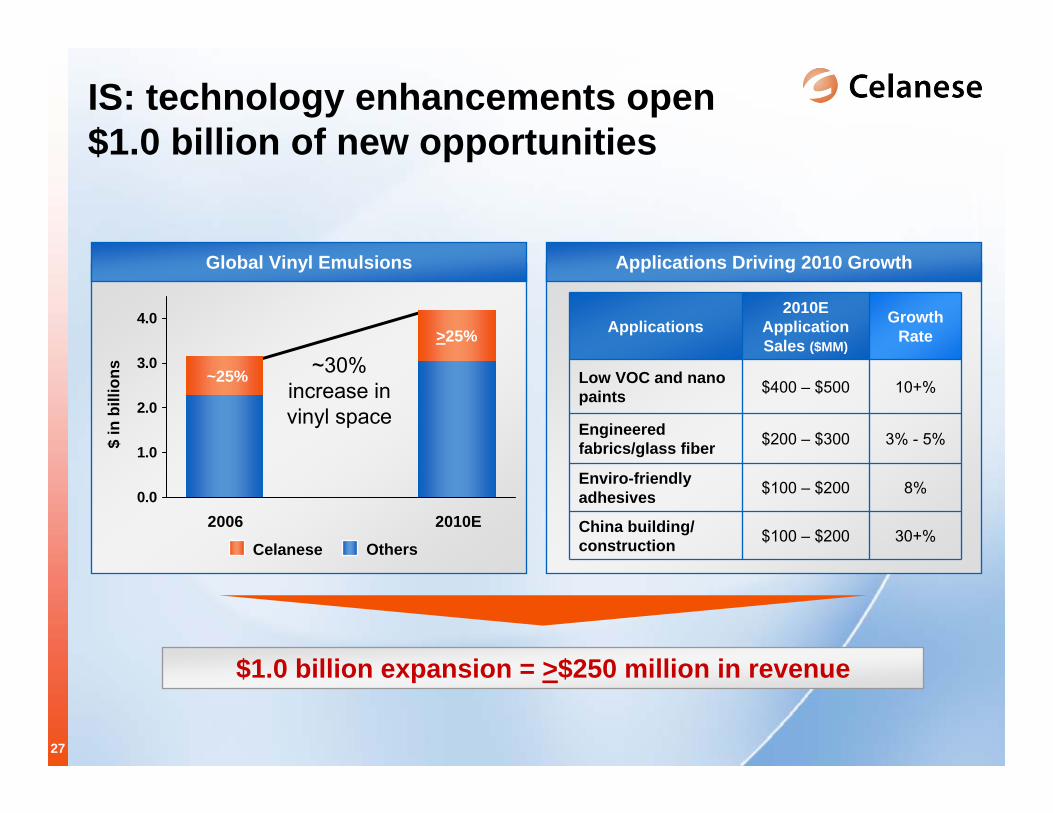
Global Vinyl Emulsions Applications Driving 2010 Growth
OthersCelanese
IS: technology enhancements open $1.0 billion of new opportunities
$ in
bill
ions
Applications2010E
Application Sales ($MM)
Growth Rate
Low VOC and nanopaints $400 – $500 10+%
Engineered fabrics/glass fiber $200 – $300 3% - 5%
Enviro-friendly adhesives $100 – $200 8%
China building/construction $100 – $200 30+%
~25%
$1.0 billion expansion = >$250 million in revenue
~30% increase in vinyl space
>25%
28
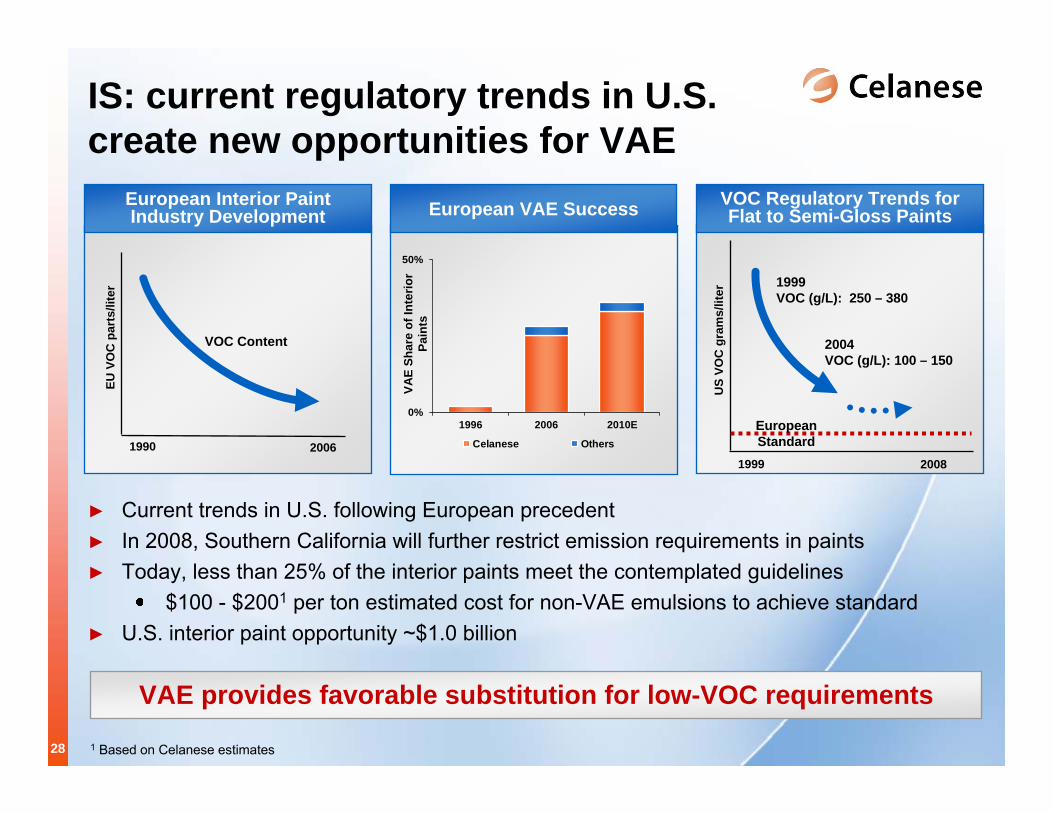
IS: current regulatory trends in U.S. create new opportunities for VAE
► Current trends in U.S. following European precedent► In 2008, Southern California will further restrict emission requirements in paints► Today, less than 25% of the interior paints meet the contemplated guidelines
$100 - $2001 per ton estimated cost for non-VAE emulsions to achieve standard► U.S. interior paint opportunity ~$1.0 billion
0%
50%
1996 2006 2010E
Celanese Others
European VAE Success
VAE
Shar
e of
Inte
rior
Pain
ts
European Interior Paint Industry Development
1990 2006
VOC Content
EU V
OC
par
ts/li
ter
1999 2008
US
VOC
gra
ms/
liter
1999VOC (g/L): 250 – 380
2004VOC (g/L): 100 – 150
VOC Regulatory Trends for Flat to Semi-Gloss Paints
European Standard
VAE provides favorable substitution for low-VOC requirements
1 Based on Celanese estimates

29
Acetyl Intermediates
30
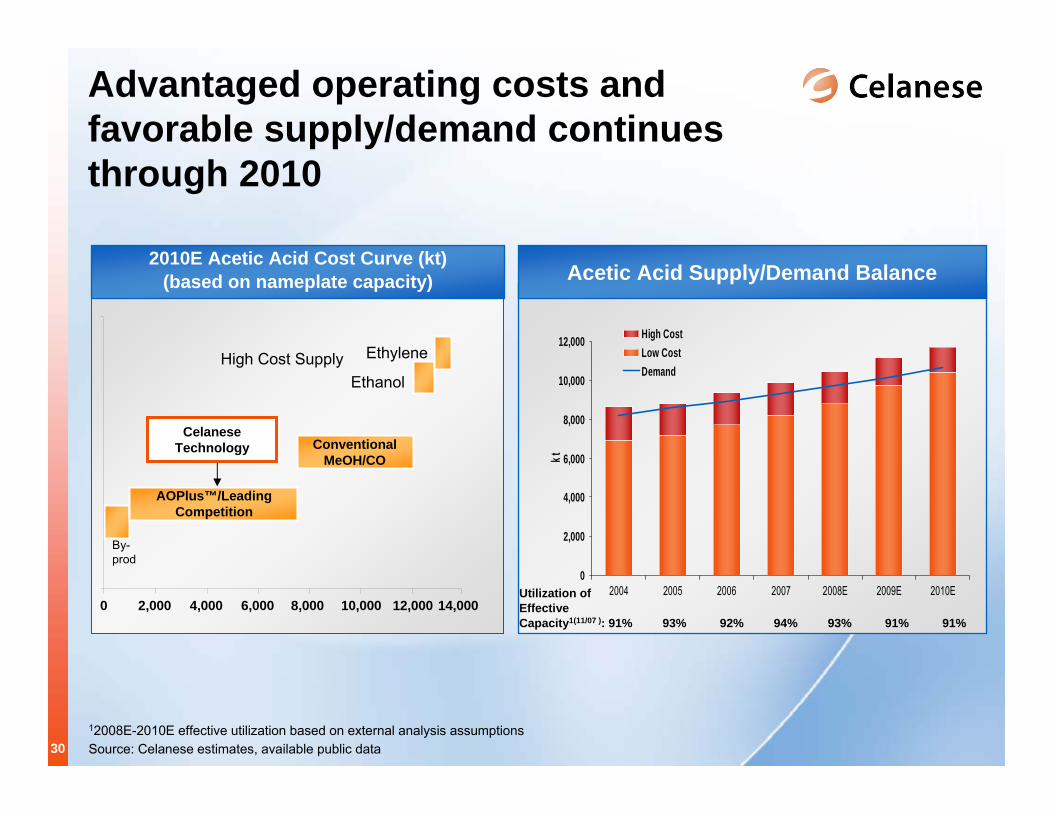
Advantaged operating costs and favorable supply/demand continues through 2010
2010E Acetic Acid Cost Curve (kt) (based on nameplate capacity)
By-prod
High Cost Supply
Celanese Technology
0 2,000 4,000 6,000 8,000 10,000 14,000
Conventional MeOH/CO
AOPlus™/Leading Competition
Ethanol
Ethylene
12,000Utilization of EffectiveCapacity1(11/07 ): 91% 93% 92% 94% 93% 91% 91%
Acetic Acid Supply/Demand Balance
12008E-2010E effective utilization based on external analysis assumptionsSource: Celanese estimates, available public data
0
2,000
4,000
6,000
8,000
10,000
12,000
2004 2005 2006 2007 2008E 2009E 2010E
kt
High CostLow CostDemand
31
600ktSopo (expansion)
200kt
350kt
Tianjin Bohei
Lunan Cathay (expansion)
A
A
A
200ktDaqing
200ktHualu Hensheng A
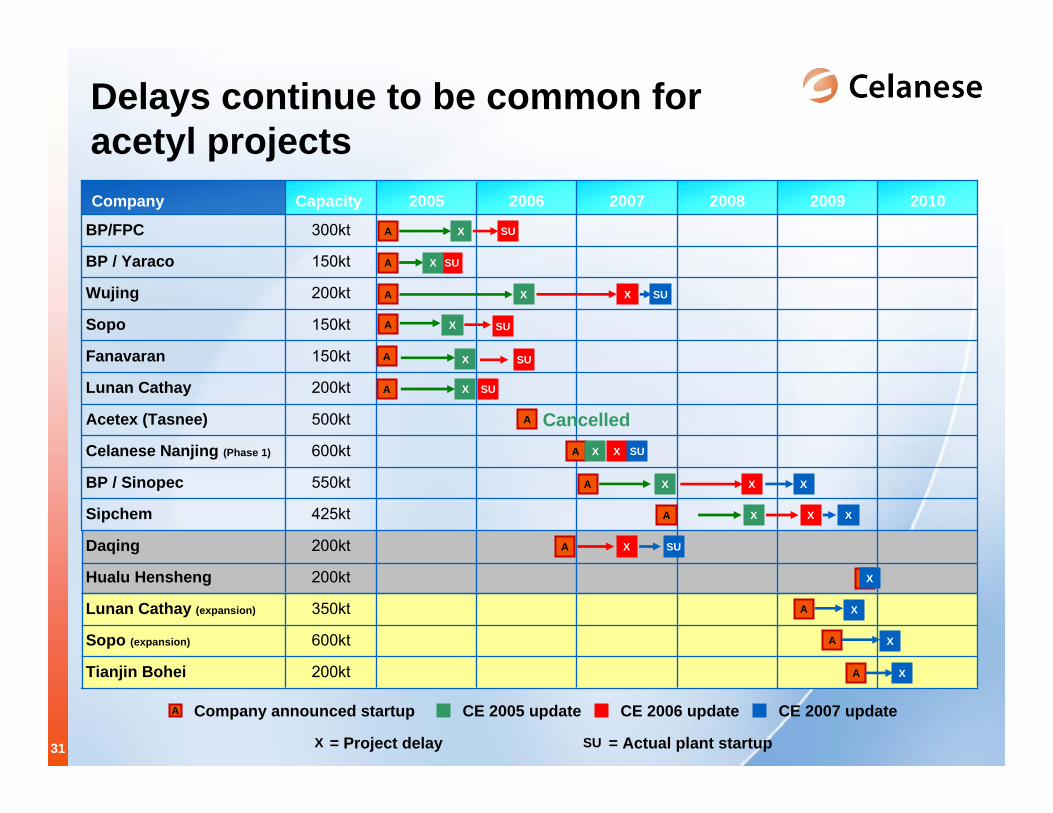
Delays continue to be common for acetyl projects
= Project delay
Company announced startup A CE 2005 update CE 2006 update CE 2007 update
500ktAcetex (Tasnee)
150ktSopo
150ktFanavaran
200ktLunan Cathay
200ktWujing
150ktBP / Yaraco
300ktBP/FPC
2008200720062005
425kt
550kt
600kt
Capacity
BP / Sinopec
Celanese Nanjing (Phase 1)
Sipchem
20102009Company
A
A
A
A
A
A
A
A
A
A
A
SU
X
SU
SU
X
X
X
X
SU
SU
Cancelled
X
X
X
X
X
X
X
X
X
SU
SU
X
SU
X
X
X
X
X
= Actual plant startupSUX
32
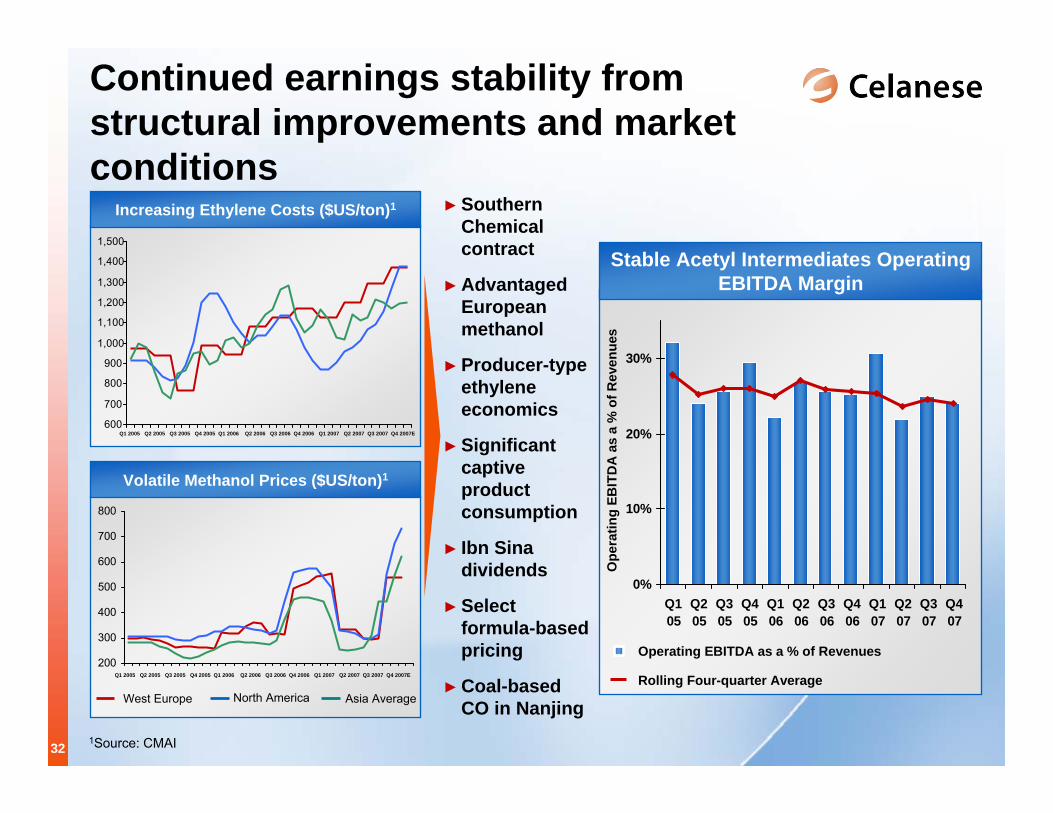
Increasing Ethylene Costs ($US/ton)1
Volatile Methanol Prices ($US/ton)1
Continued earnings stability from structural improvements and market conditions
►Southern Chemical contract
►Advantaged European methanol
►Producer-type ethylene economics
►Significant captive product consumption
► Ibn Sinadividends
►Select formula-based pricing
►Coal-based CO in NanjingAsia AverageWest Europe North America
1Source: CMAI
200
300
400
500
600
700
800
Q1 2005 Q2 2005 Q3 2005 Q4 2005 Q1 2006 Q2 2006 Q3 2006 Q4 2006 Q1 2007 Q2 2007 Q3 2007 Q4 2007E
Q1 2005 Q2 2005 Q3 2005 Q4 2005 Q1 2006 Q2 2006 Q3 2006 Q4 2006 Q1 2007 Q2 2007 Q3 2007 Q4 2007E
0%
10%
20%
30%
Q105
Q205
Q305
Q405
Q106
Q206
Q306
Q406
Q107
Q207
Q307
Q407
Rolling Four-quarter Average
Operating EBITDA as a % of Revenues
Ope
ratin
g EB
ITD
A a
s a
% o
f Rev
enue
s
Stable Acetyl Intermediates Operating EBITDA Margin
600
700
800
900
1,000
1,100
1,200
1,300
1,400
1,500

33
Value Creation
34
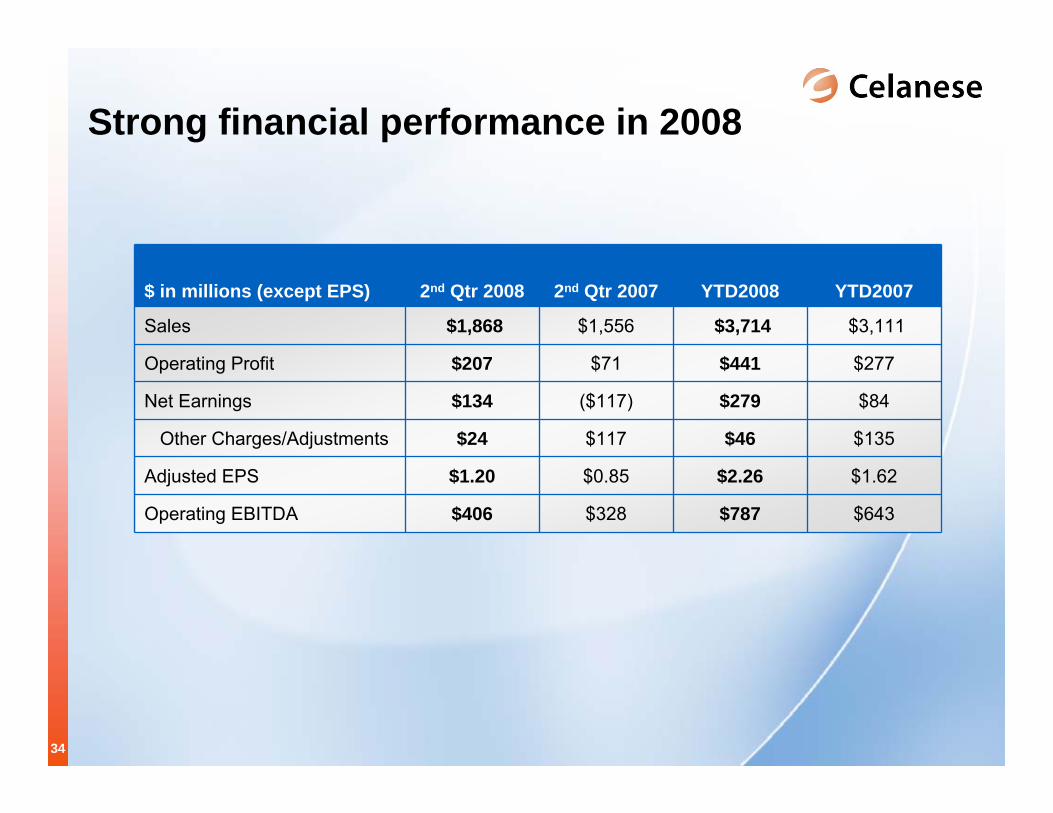
Strong financial performance in 2008
$277$441$71$207Operating Profit
$84$279($117)$134Net Earnings
$135$46$117$24Other Charges/Adjustments
$787
$2.26
$3,714
YTD2008
$328
$0.85
$1,556
2nd Qtr 2007$ in millions (except EPS) 2nd Qtr 2008 YTD2007
Sales $1,868 $3,111
Adjusted EPS $1.20 $1.62
Operating EBITDA $406 $643
35
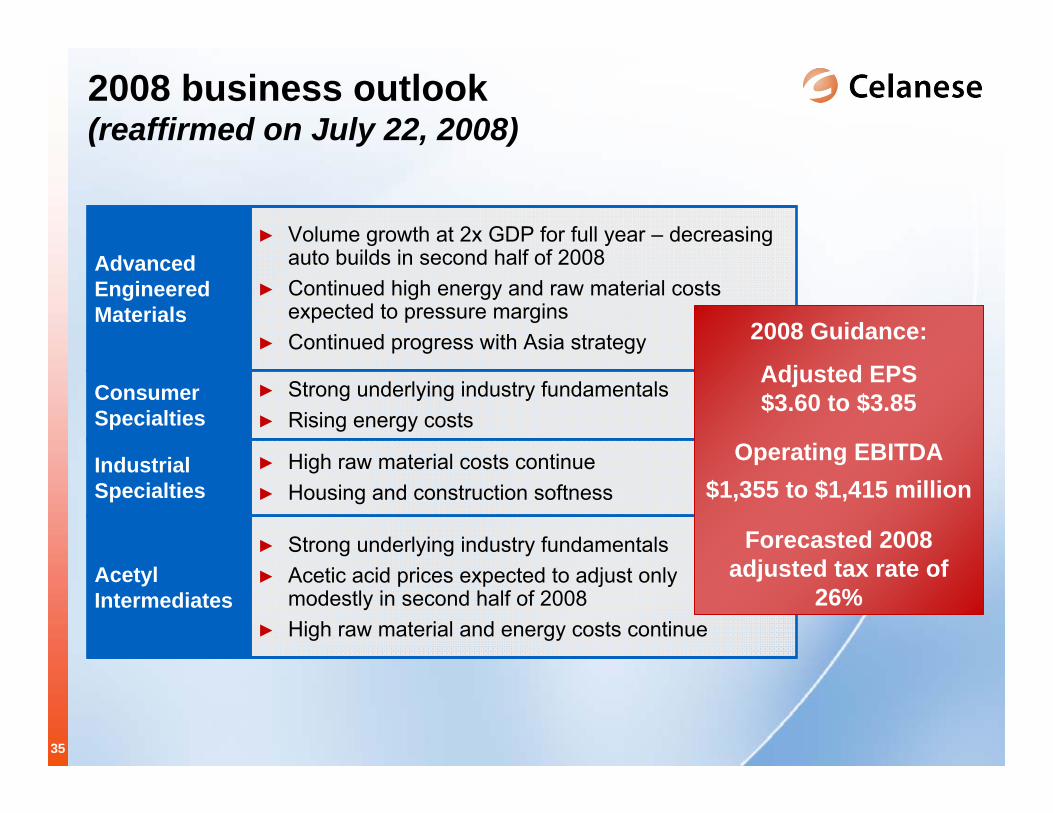
2008 business outlook (reaffirmed on July 22, 2008)
► Strong underlying industry fundamentals► Acetic acid prices expected to adjust only
modestly in second half of 2008► High raw material and energy costs continue
Acetyl Intermediates
► Volume growth at 2x GDP for full year – decreasing auto builds in second half of 2008
► Continued high energy and raw material costs expected to pressure margins
► Continued progress with Asia strategy
Advanced Engineered Materials
► Strong underlying industry fundamentals ► Rising energy costs
Consumer Specialties
► High raw material costs continue► Housing and construction softness
Industrial Specialties
2008 Guidance:
Adjusted EPS $3.60 to $3.85
Operating EBITDA$1,355 to $1,415 million
Forecasted 2008 adjusted tax rate of
26%
36
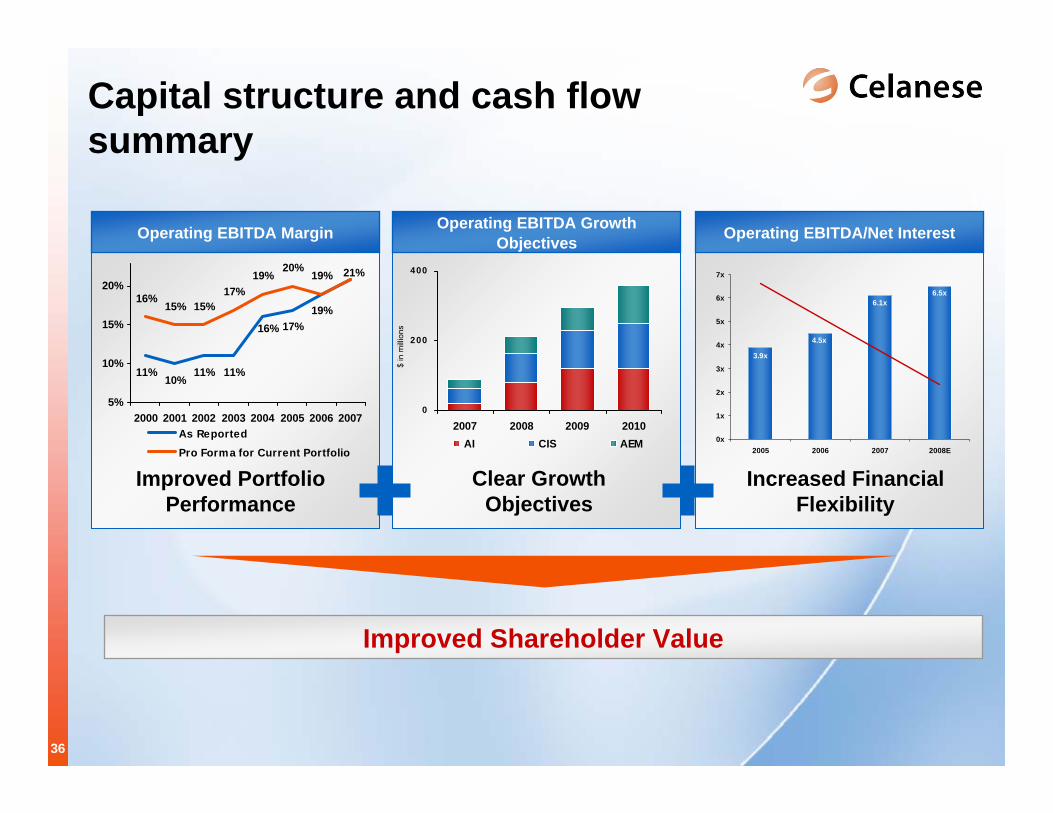
Capital structure and cash flow summary
Operating EBITDA Growth Objectives
0
200
400
2007 2008 2009 2010AI CIS AEM
Clear Growth Objectives
Improved Shareholder Value
Operating EBITDA/Net Interest
Increased Financial Flexibility
Operating EBITDA Margin
Improved Portfolio Performance
11%10%
11% 11%
17%19%
16%15% 15%
17%19%
20%19%
16%
21%
5%
10%
15%
20%
2000 2001 2002 2003 2004 2005 2006 2007As ReportedPro Forma for Current Portfolio
3.9x
6.5x6.1x
4.5x
0x
1x
2x
3x
4x
5x
6x
7x
2005 2006 2007 2008E
$ in
mill
ions
37
Appendix
38
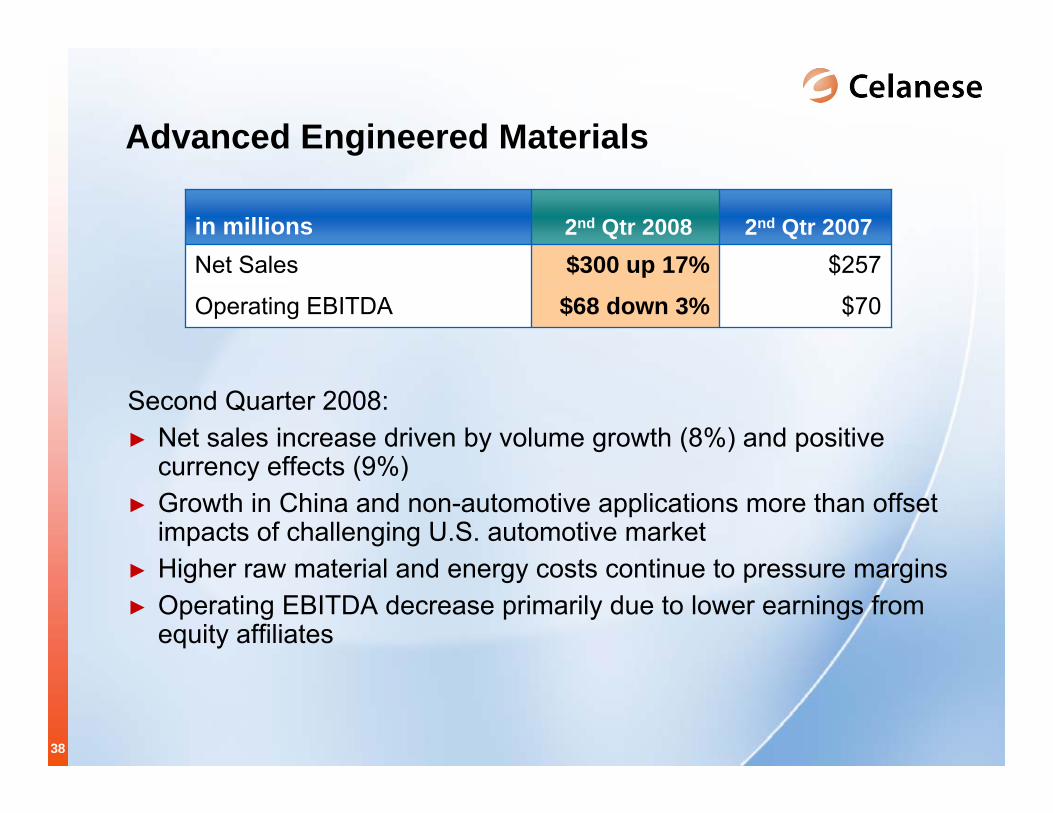
$70
$2572nd Qtr 2007
$68 down 3%$300 up 17%2nd Qtr 2008
Operating EBITDA
Net Salesin millions
Advanced Engineered Materials
Second Quarter 2008:► Net sales increase driven by volume growth (8%) and positive
currency effects (9%) ► Growth in China and non-automotive applications more than offset
impacts of challenging U.S. automotive market ► Higher raw material and energy costs continue to pressure margins► Operating EBITDA decrease primarily due to lower earnings from
equity affiliates
39
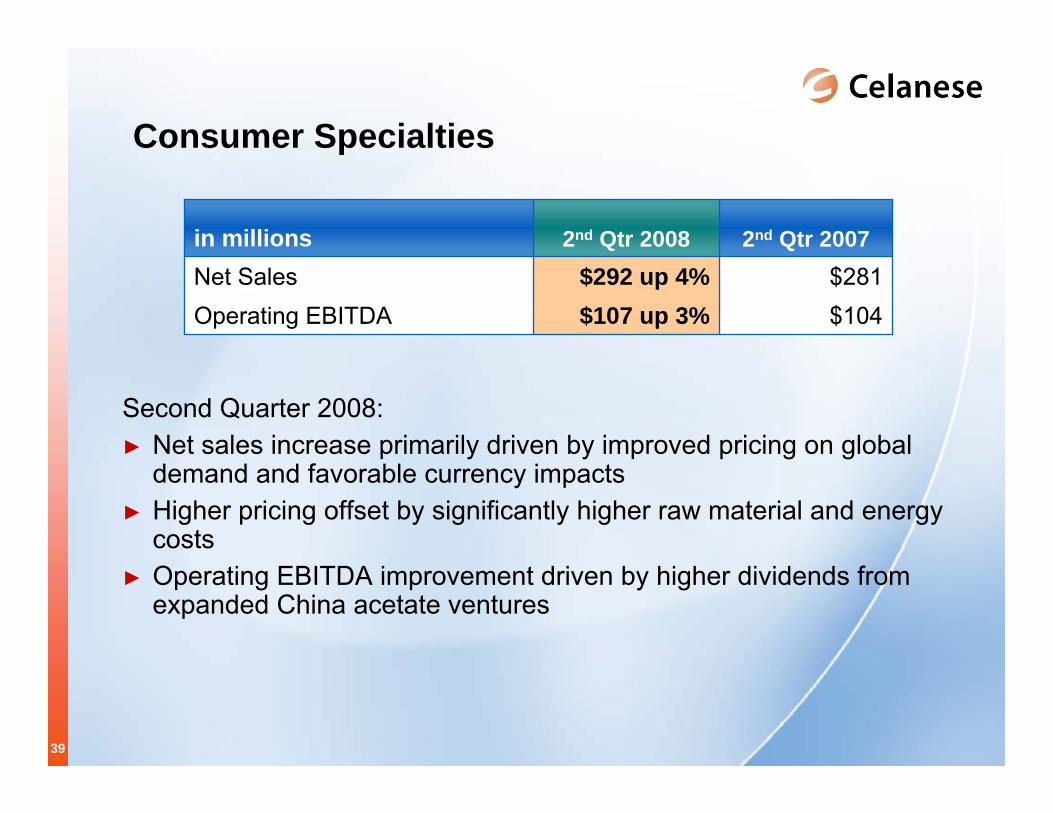
Second Quarter 2008:► Net sales increase primarily driven by improved pricing on global
demand and favorable currency impacts ► Higher pricing offset by significantly higher raw material and energy
costs► Operating EBITDA improvement driven by higher dividends from
expanded China acetate ventures
Consumer Specialties
$104$281
2nd Qtr 2007
$107 up 3% $292 up 4%
2nd Qtr 2008
Operating EBITDANet Salesin millions
40
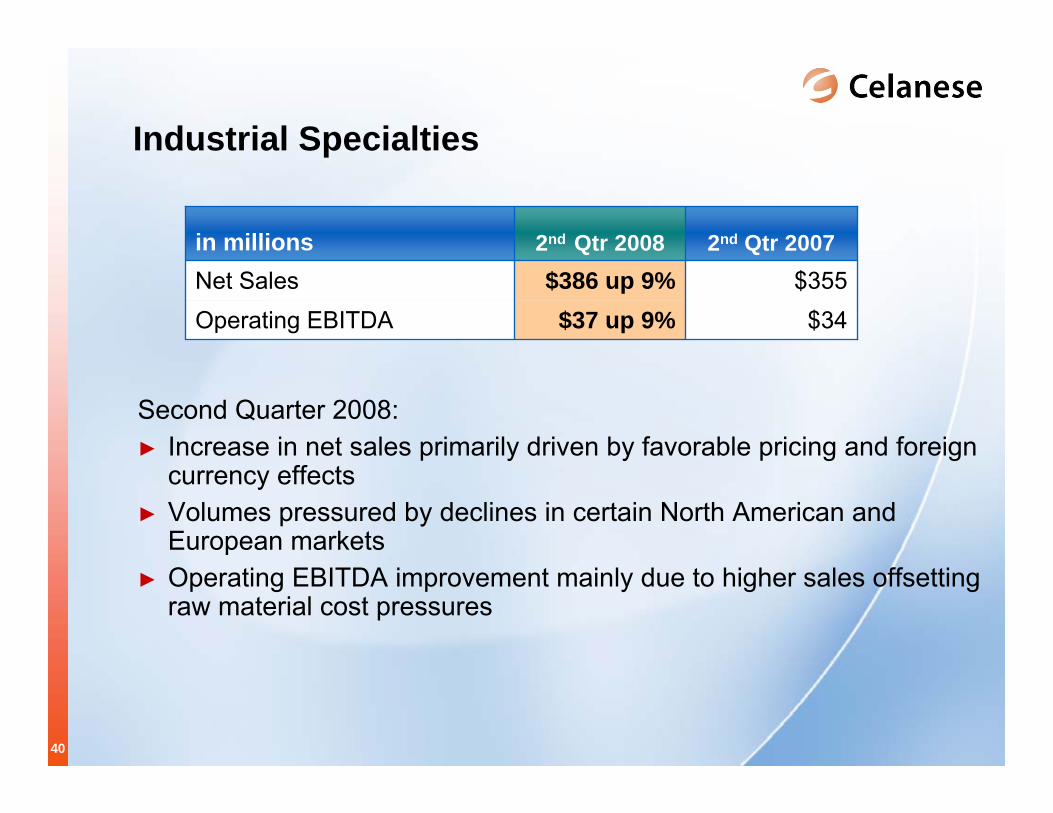
Second Quarter 2008:► Increase in net sales primarily driven by favorable pricing and foreign
currency effects► Volumes pressured by declines in certain North American and
European markets► Operating EBITDA improvement mainly due to higher sales offsetting
raw material cost pressures
Industrial Specialties
$34$355
2nd Qtr 2007
$37 up 9%$386 up 9%
2nd Qtr 2008
Operating EBITDANet Salesin millions
41
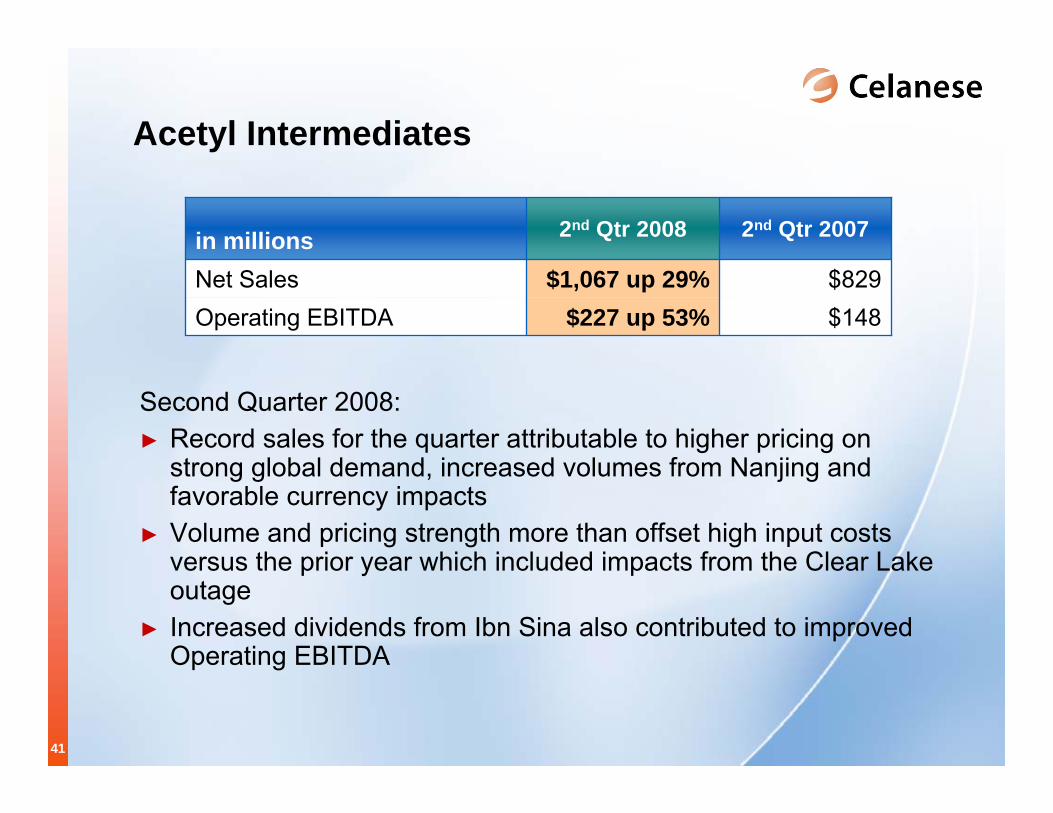
Acetyl Intermediates
$148$829
2nd Qtr 2007
$227 up 53%$1,067 up 29%
2nd Qtr 2008
Operating EBITDANet Salesin millions
Second Quarter 2008:► Record sales for the quarter attributable to higher pricing on
strong global demand, increased volumes from Nanjing and favorable currency impacts
► Volume and pricing strength more than offset high input costs versus the prior year which included impacts from the Clear Lakeoutage
► Increased dividends from Ibn Sina also contributed to improved Operating EBITDA
42
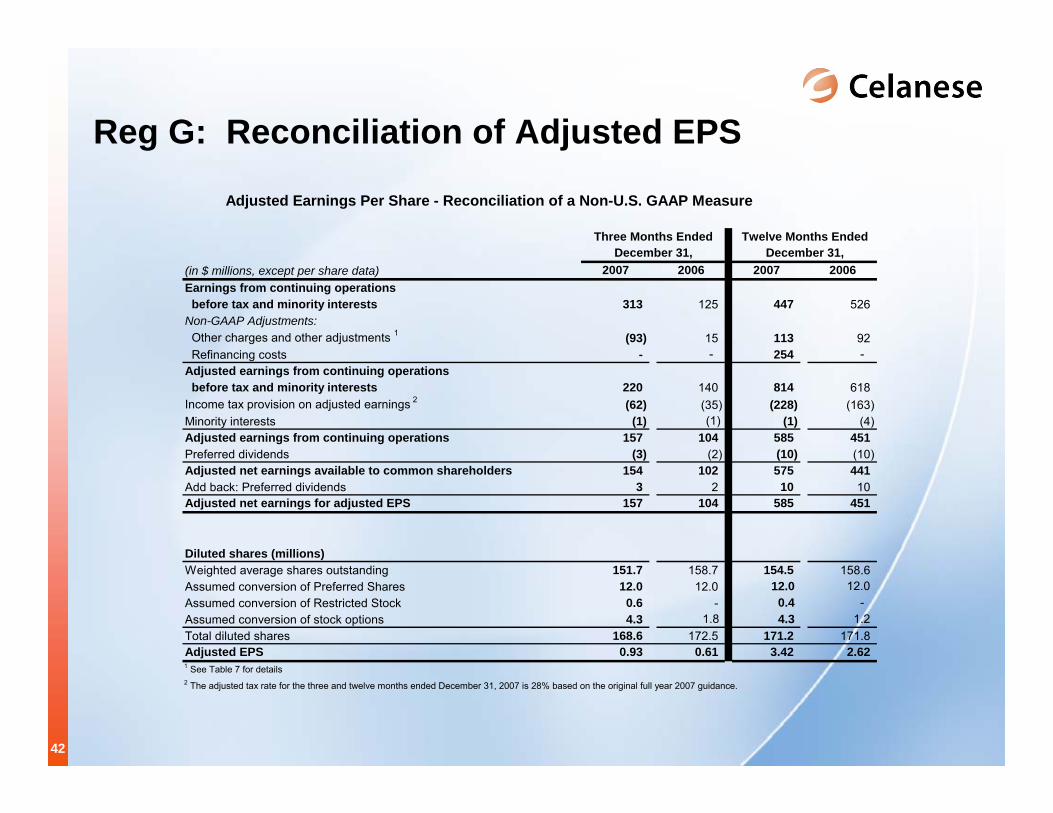
Reg G: Reconciliation of Adjusted EPS
Adjusted Earnings Per Share - Reconciliation of a Non-U.S. GAAP Measure
(in $ millions, except per share data) 2007 2006 2007 2006Earnings from continuing operations before tax and minority interests 313 125 447 526 Non-GAAP Adjustments: Other charges and other adjustments 1 (93) 15 113 92 Refinancing costs - - 254 - Adjusted earnings from continuing operations before tax and minority interests 220 140 814 618 Income tax provision on adjusted earnings 2 (62) (35) (228) (163)Minority interests (1) (1) (1) (4)Adjusted earnings from continuing operations 157 104 585 451Preferred dividends (3) (2) (10) (10)Adjusted net earnings available to common shareholders 154 102 575 441Add back: Preferred dividends 3 2 10 10Adjusted net earnings for adjusted EPS 157 104 585 451
Diluted shares (millions)Weighted average shares outstanding 151.7 158.7 154.5 158.6Assumed conversion of Preferred Shares 12.0 12.0 12.0 12.0 Assumed conversion of Restricted Stock 0.6 - 0.4 - Assumed conversion of stock options 4.3 1.8 4.3 1.2 Total diluted shares 168.6 172.5 171.2 171.8Adjusted EPS 0.93 0.61 3.42 2.621 See Table 7 for details2 The adjusted tax rate for the three and twelve months ended December 31, 2007 is 28% based on the original full year 2007 guidance.
Twelve Months EndedDecember 31,
Three Months EndedDecember 31,

43
Reg G: Reconciliation of Adjusted EPS
Adjusted Earnings (Loss) Per Share - Reconciliation of a Non-U.S. GAAP Measure
(in $ millions, except per share data) 2008 2007 2008 2007Earnings (loss) from continuing operations before tax and minority interests 247 (168) 465 3 Non-GAAP Adjustments: Other charges and other adjustments 1 24 117 46 135 Refinancing costs - 256 - 254 Adjusted Earnings (loss) from continuing operations before tax and minority interests 271 205 511 392 Income tax (provision) benefit on adjusted earnings 2 (70) (57) (133) (110)Minority interests 1 - 1 0Adjusted Earnings (loss) from continuing operations 202 148 379 282Preferred dividends (2) (3) (5) (5)Adjusted net earnings (loss) available to common shareholders 200 145 374 277Add back: Preferred dividends 2 3 5 5Adjusted net earnings (loss) for adjusted EPS 202 148 379 282
Diluted shares (millions)Weighted average shares outstanding 150.9 156.9 151.4 158.1Assumed conversion of Preferred Shares 12.1 12.0 12.1 12.0 Assumed conversion of Restricted Stock 0.8 0.5 0.6 0.2 Assumed conversion of stock options 4.1 5.2 3.4 4.2 Total diluted shares 167.8 174.6 167.6 174.5Adjusted EPS 1.20$ 0.85$ 2.26 1.621 See Table 7 for details2 The adjusted tax rate for the three months ended June 30, 2008 is 26% based on the forecasted adjusted tax rate for 2008.
Six Months EndedJune 30,
Three Months EndedJune 30,
44
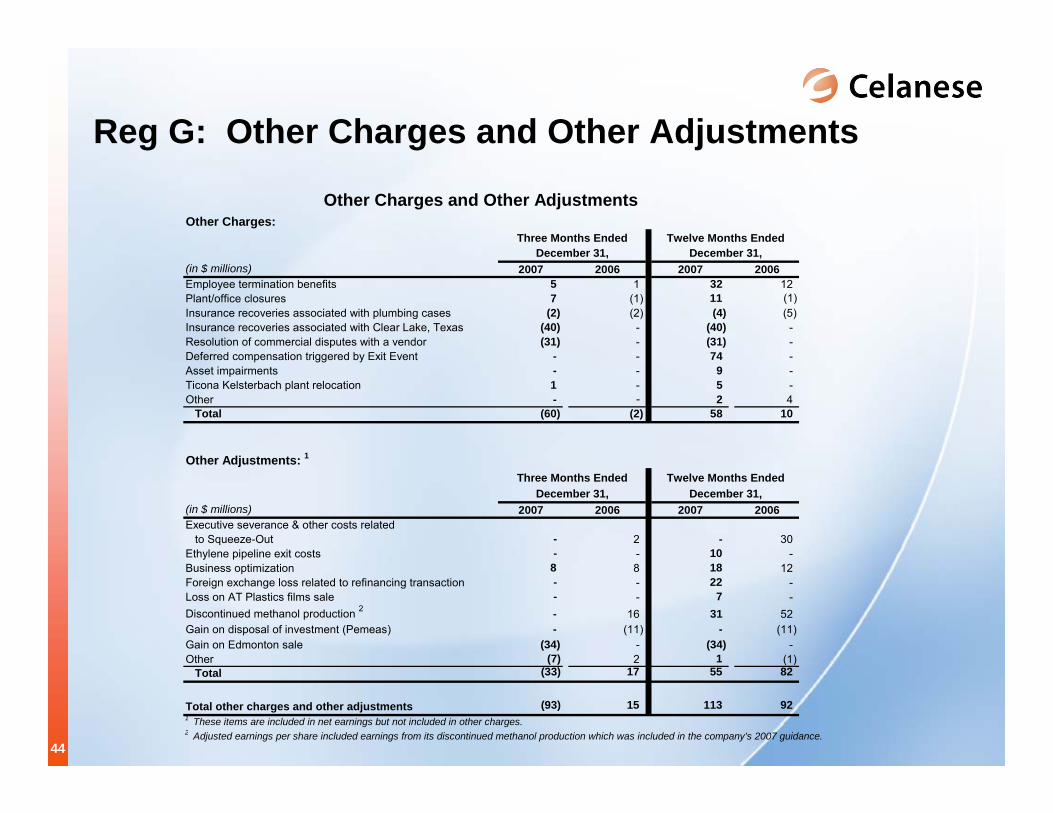
Other Charges:
(in $ millions) 2007 2006 2007 2006Employee termination benefits 5 1 32 12 Plant/office closures 7 (1) 11 (1)Insurance recoveries associated with plumbing cases (2) (2) (4) (5)Insurance recoveries associated with Clear Lake, Texas (40) - (40) - Resolution of commercial disputes with a vendor (31) - (31) - Deferred compensation triggered by Exit Event - - 74 - Asset impairments - - 9 - Ticona Kelsterbach plant relocation 1 - 5 - Other - - 2 4 Total (60) (2) 58 10
Other Adjustments: 1
(in $ millions) 2007 2006 2007 2006Executive severance & other costs related to Squeeze-Out - 2 - 30 Ethylene pipeline exit costs - - 10 - Business optimization 8 8 18 12 Foreign exchange loss related to refinancing transaction - - 22 - Loss on AT Plastics films sale - - 7 - Discontinued methanol production 2 - 16 31 52 Gain on disposal of investment (Pemeas) - (11) - (11) Gain on Edmonton sale (34) - (34) - Other (7) 2 1 (1) Total (33) 17 55 82
Total other charges and other adjustments (93) 15 113 92 1 These items are included in net earnings but not included in other charges.2 Adjusted earnings per share included earnings from its discontinued methanol production which was included in the company's 2007 guidance.
December 31, December 31,
Three Months Ended Twelve Months Ended
Three Months Ended Twelve Months Ended
December 31, December 31,
Reg G: Other Charges and Other Adjustments
Other Charges and Other Adjustments
45
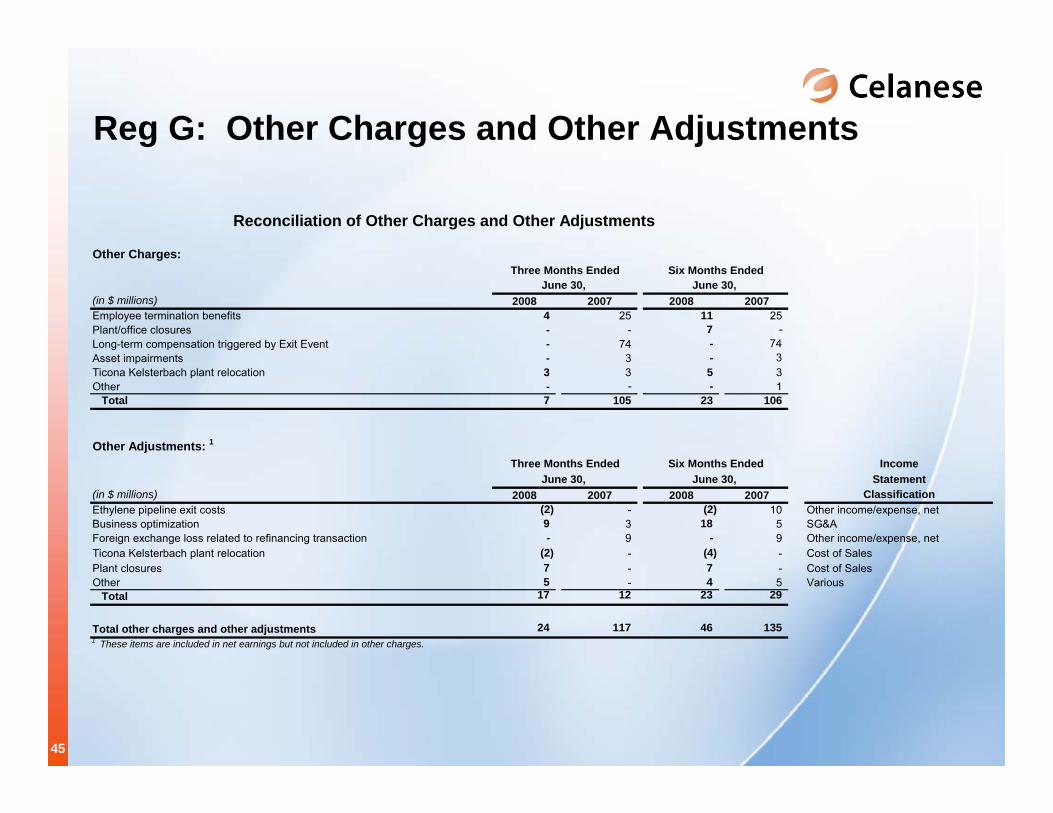
Reg G: Other Charges and Other Adjustments
Reconciliation of Other Charges and Other Adjustments
Other Charges:
(in $ millions) 2008 2007 2008 2007Employee termination benefits 4 25 11 25 Plant/office closures - - 7 - Long-term compensation triggered by Exit Event - 74 - 74 Asset impairments - 3 - 3 Ticona Kelsterbach plant relocation 3 3 5 3 Other - - - 1 Total 7 105 23 106
Other Adjustments: 1
IncomeStatement
(in $ millions) 2008 2007 2008 2007 ClassificationEthylene pipeline exit costs (2) - (2) 10 Other income/expense, netBusiness optimization 9 3 18 5 SG&AForeign exchange loss related to refinancing transaction - 9 - 9 Other income/expense, netTicona Kelsterbach plant relocation (2) - (4) - Cost of SalesPlant closures 7 - 7 - Cost of SalesOther 5 - 4 5 Various Total 17 12 23 29
Total other charges and other adjustments 24 117 46 135 1 These items are included in net earnings but not included in other charges.
June 30, June 30,
Three Months Ended Six Months Ended
Three Months Ended Six Months Ended
June 30, June 30,
46 Segm
ent D
ata
and
Rec
onci
liatio
n of
Ope
ratin
g Pr
ofit
(Los
s) to
Ope
ratin
g EB
ITD
A -
a
Non
-U.S
. GAA
P M
easu
re
(in $
mill
ions
) 20
0720
0620
0720
06N
et S
ales
Adv
ance
d En
gine
ered
Mat
eria
ls25
322
41,
030
91
5
Con
sum
er S
peci
altie
s27
9
22
4
1,11
1
876
I
ndus
trial
Spe
cial
ties
331
309
1,34
6
1,28
1
A
cety
l Int
erm
edia
tes
1,08
383
13,
615
3,
351
Oth
er A
ctiv
ities
1-
62
22
Int
erse
gmen
t elim
inat
ions
(186
)(1
64)
(660
)
(6
67)
Tota
l1,
760
1,43
06,
444
5,
778
Ope
ratin
g Pr
ofit
(Los
s) A
dvan
ced
Engi
neer
ed M
ater
ials
30
29
133
14
5
Con
sum
er S
peci
altie
s69
41
19
9
165
I
ndus
trial
Spe
cial
ties
26
9
28
44
A
cety
l Int
erm
edia
tes
276
10
7
616
45
6
Oth
er A
ctiv
ities
1(7
7)
(46)
(2
28)
(190
)
To
tal
324
14
0
748
62
0
Equi
ty E
arni
ngs
and
Oth
er In
com
e/(E
xpen
se) 2
Adv
ance
d En
gine
ered
Mat
eria
ls7
13
55
55
Con
sum
er S
peci
altie
s3
2
40
24
I
ndus
trial
Spe
cial
ties
-
-
-
(1
)
Ace
tyl I
nter
med
iate
s27
23
78
63
O
ther
Act
iviti
es 1
8
12
-
22
Tota
l45
50
17
3
163
Oth
er C
harg
es a
nd O
ther
Adj
ustm
ents
3
Adv
ance
d En
gine
ered
Mat
eria
ls(1
0)
(1)
(5)
(5)
C
onsu
mer
Spe
cial
ties
(27)
-
(16)
-
Ind
ustri
al S
peci
altie
s(1
)
2
32
16
Ace
tyl I
nter
med
iate
s(9
7)
16
(38)
52
O
ther
Act
iviti
es 1
42
(2)
140
29
To
tal
(93)
15
11
3
92
Dep
reci
atio
n an
d Am
ortiz
atio
n Ex
pens
e A
dvan
ced
Engi
neer
ed M
ater
ials
18
17
69
65
Con
sum
er S
peci
altie
s12
10
51
39
I
ndus
trial
Spe
cial
ties
16
14
59
59
Ace
tyl I
nter
med
iate
s25
23
10
6
101
O
ther
Act
iviti
es 1
2
-
6
5
Tota
l73
64
29
1
269
Ope
ratin
g EB
ITD
A A
dvan
ced
Engi
neer
ed M
ater
ials
45
58
252
26
0
Con
sum
er S
peci
altie
s57
53
27
4
228
I
ndus
trial
Spe
cial
ties
41
25
119
11
8
Ace
tyl I
nter
med
iate
s23
1
169
76
2
672
O
ther
Act
iviti
es 1
(25)
(3
6)
(82)
(1
34)
Tota
l34
9
269
1,
325
1,14
4
1 O
ther
Act
iviti
es p
rimar
ily in
clud
es c
orpo
rate
sel
ling,
gen
eral
and
adm
inis
trativ
e ex
pens
es a
nd th
e re
sults
from
cap
tive
insu
ranc
e co
mpa
nies
.
T
he 2
007
Ope
ratin
g P
rofit
(Los
s) a
nd O
ther
Cha
rges
and
Oth
er A
djus
tmen
ts a
mou
nts
incl
ude
dedu
ctib
le a
ssoc
iate
d w
ith in
sura
nce
reco
very
.2 I
nclu
des
equi
ty e
arni
ngs
from
affi
liate
s, d
ivid
ends
from
cos
t inv
estm
ents
and
oth
er in
com
e/(e
xpen
se).
3 E
xclu
des
adju
stm
ents
to m
inor
ity in
tere
st, n
et in
tere
st, t
axes
, dep
reci
atio
n, a
mor
tizat
ion
and
disc
ontin
ued
oper
atio
ns (S
ee T
able
7).
Thre
e M
onth
s En
ded
Dec
embe
r 31,
Twel
ve M
onth
s En
ded
Dec
embe
r 31,
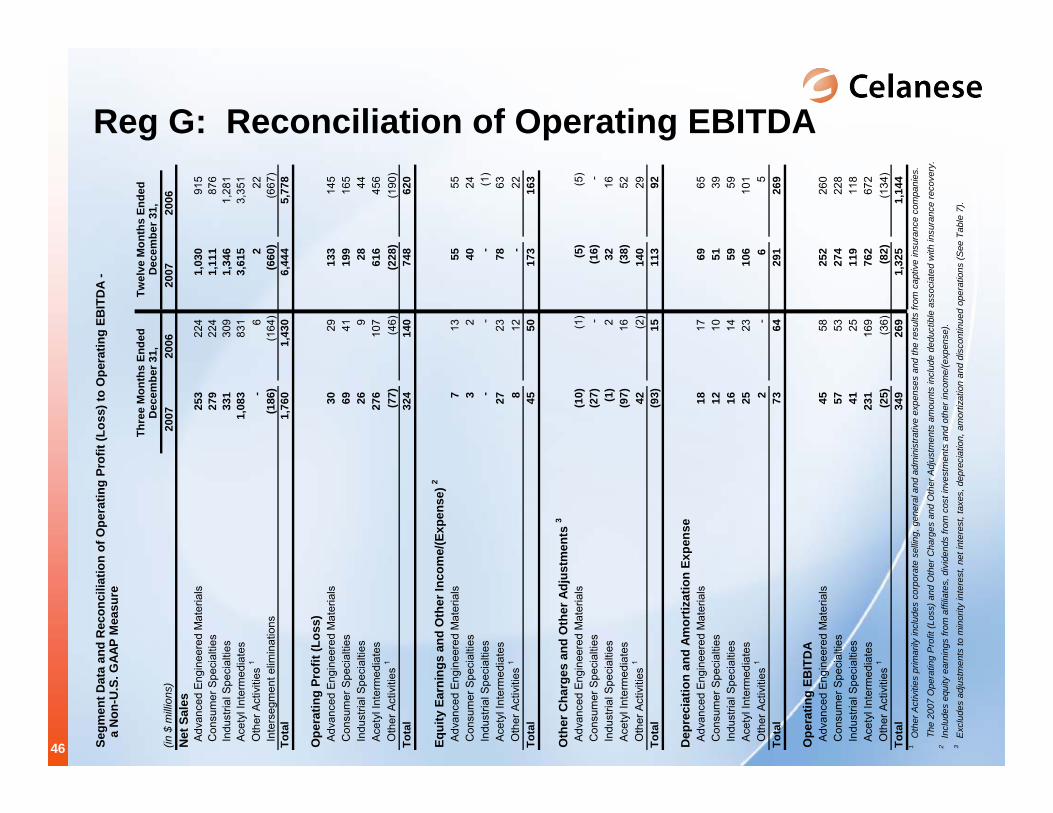
Reg G: Reconciliation of Operating EBITDA
47
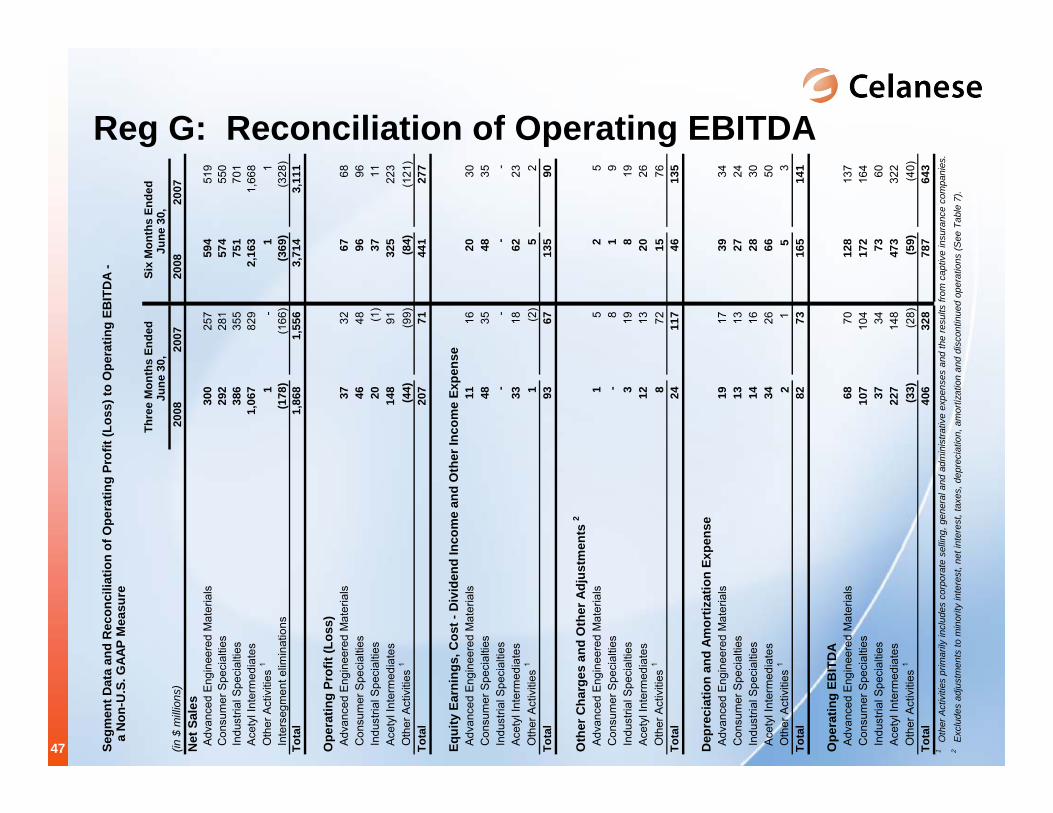
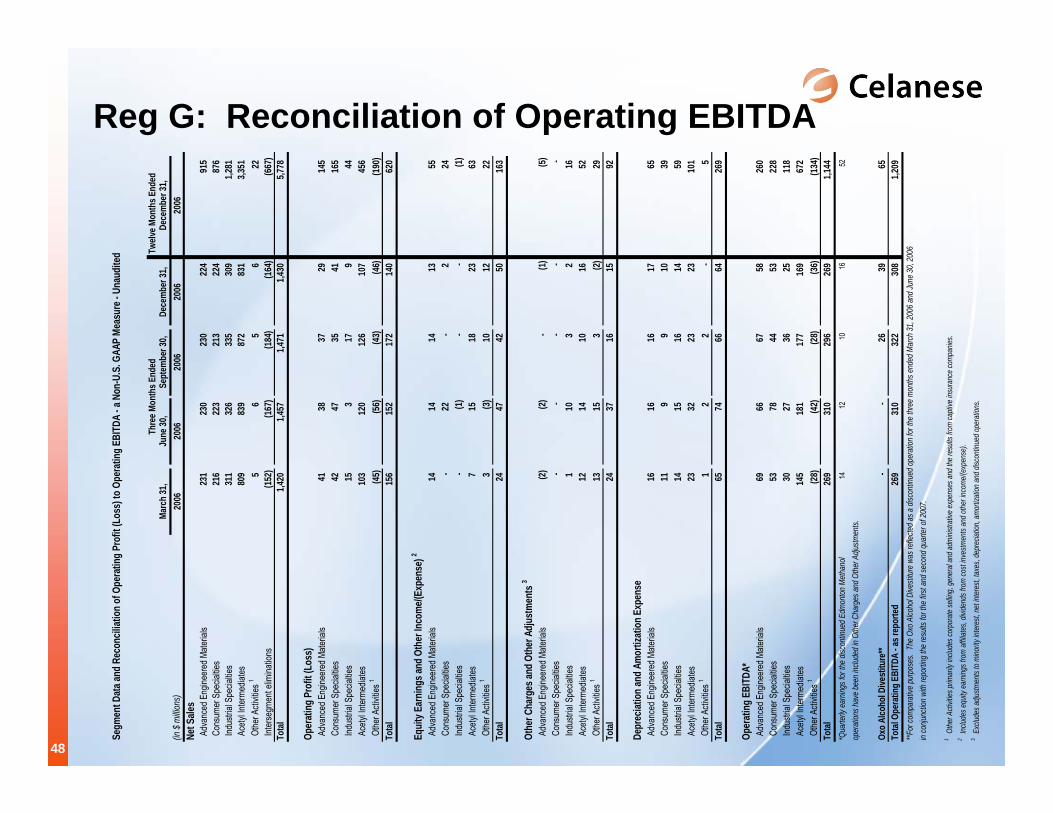
Reg G: Reconciliation of Operating EBITDASe
gmen
t Dat
a an
d R
econ
cilia
tion
of O
pera
ting
Prof
it (L
oss)
to O
pera
ting
EBIT
DA
-
a N
on-U
.S. G
AAP
Mea
sure
(in $
mill
ions
) 20
0820
0720
0820
07N
et S
ales
Adv
ance
d E
ngin
eere
d M
ater
ials
300
257
594
519
C
onsu
mer
Spe
cial
ties
292
281
57
4
55
0
Ind
ustri
al S
peci
altie
s38
6
35
575
1
70
1
Ace
tyl I
nter
med
iate
s1,
067
829
2,16
3
1,66
8
O
ther
Act
iviti
es 1
1
-
1
1
Int
erse
gmen
t elim
inat
ions
(178
)
(1
66)
(369
)
(3
28)
Tota
l1,
868
1,55
63,
714
3,
111
Ope
ratin
g Pr
ofit
(Los
s) A
dvan
ced
Eng
inee
red
Mat
eria
ls37
32
67
68
C
onsu
mer
Spe
cial
ties
46
48
96
96
Ind
ustri
al S
peci
altie
s20
(1
)
37
11
A
cety
l Int
erm
edia
tes
148
91
32
5
223
O
ther
Act
iviti
es 1
(44)
(9
9)
(84)
(1
21)
Tota
l20
7
71
441
27
7
Equi
ty E
arni
ngs,
Cos
t - D
ivid
end
Inco
me
and
Oth
er In
com
e Ex
pens
e A
dvan
ced
Eng
inee
red
Mat
eria
ls11
16
20
30
C
onsu
mer
Spe
cial
ties
48
35
48
35
Ind
ustri
al S
peci
altie
s-
-
-
-
A
cety
l Int
erm
edia
tes
33
18
62
23
Oth
er A
ctiv
ities
11
(2)
5
2
Tota
l93
67
13
5
90
Oth
er C
harg
es a
nd O
ther
Adj
ustm
ents
2
Adv
ance
d E
ngin
eere
d M
ater
ials
1
5
2
5
Con
sum
er S
peci
altie
s-
8
1
9
I
ndus
trial
Spe
cial
ties
3
19
8
19
Ace
tyl I
nter
med
iate
s12
13
20
26
O
ther
Act
iviti
es 1
8
72
15
76
To
tal
24
117
46
13
5
Dep
reci
atio
n an
d Am
ortiz
atio
n Ex
pens
e A
dvan
ced
Eng
inee
red
Mat
eria
ls19
17
39
34
C
onsu
mer
Spe
cial
ties
13
13
27
24
Ind
ustri
al S
peci
altie
s14
16
28
30
A
cety
l Int
erm
edia
tes
34
26
66
50
Oth
er A
ctiv
ities
12
1
5
3
To
tal
82
73
165
14
1
Ope
ratin
g EB
ITD
A A
dvan
ced
Eng
inee
red
Mat
eria
ls68
70
12
8
137
C
onsu
mer
Spe
cial
ties
107
10
4
172
16
4
Ind
ustri
al S
peci
altie
s37
34
73
60
A
cety
l Int
erm
edia
tes
227
14
8
473
32
2
Oth
er A
ctiv
ities
1(3
3)
(28)
(5
9)
(40)
To
tal
406
32
8
787
64
3
1 O
ther
Act
iviti
es p
rimar
ily in
clud
es c
orpo
rate
sel
ling,
gen
eral
and
adm
inis
trativ
e ex
pens
es a
nd th
e re
sults
from
cap
tive
insu
ranc
e co
mpa
nies
.2 E
xclu
des
adju
stm
ents
to m
inor
ity in
tere
st, n
et in
tere
st, t
axes
, dep
reci
atio
n, a
mor
tizat
ion
and
disc
ontin
ued
oper
atio
ns (S
ee T
able
7).
Thre
e M
onth
s En
ded
June
30,
Si
x M
onth
s En
ded
June
30,
48
Reg G: Reconciliation of Operating EBITDASe
gmen
t Dat
a and
Rec
oncil
iatio
n of
Ope
ratin
g Pr
ofit
(Los
s) to
Ope
ratin
g EBI
TDA
- a N
on-U
.S. G
AAP
Meas
ure -
Una
udite
d Twelv
e Mon
ths E
nded
Marc
h 31
,Ju
ne 30
,Se
ptem
ber 3
0,De
cem
ber 3
1,De
cem
ber 3
1,(in
$ mi
llions
) 20
0620
0620
0620
0620
06Ne
t Sale
s A
dvan
ced E
ngine
ered
Mate
rials
231
23
0
230
22
4
91
5
Con
sume
r Spe
cialtie
s21
6
223
21
3
224
876
In
dustr
ial S
pecia
lties
311
32
6
335
30
9
1,2
81
Ace
tyl In
terme
diates
809
83
9
872
83
1
3,3
51
Othe
r Acti
vities
15
6
5
6
22
Inter
segm
ent e
limina
tions
(152
)
(167
)
(1
84)
(164
)
(667
)
Tota
l1,4
20
1,457
1,4
71
1,430
5,7
78
Oper
atin
g Pr
ofit
(Los
s) A
dvan
ced E
ngine
ered
Mate
rials
41
38
37
29
145
Con
sume
r Spe
cialtie
s42
47
35
41
16
5
In
dustr
ial S
pecia
lties
15
3
17
9
44
A
cetyl
Inter
media
tes10
3
12
0
12
6
10
7
45
6
O
ther A
ctivit
ies 1
(45)
(56)
(43)
(46)
(190
)
Tota
l15
6
15
2
17
2
14
0
62
0
Equi
ty E
arni
ngs a
nd O
ther
Inco
me/(
Expe
nse)
2
Adv
ance
d Eng
ineer
ed M
ateria
ls14
14
14
13
55
Con
sume
r Spe
cialtie
s-
22
-
2
24
In
dustr
ial S
pecia
lties
-
(1)
-
-
(1
)
A
cetyl
Inter
media
tes7
15
18
23
63
O
ther A
ctivit
ies 1
3
(3)
10
12
22
Tota
l24
47
42
50
16
3
Othe
r Cha
rges
and
Othe
r Adj
ustm
ents
3
Adv
ance
d Eng
ineer
ed M
ateria
ls(2
)
(2)
-
(1
)
(5)
Con
sume
r Spe
cialtie
s-
-
-
-
-
In
dustr
ial S
pecia
lties
1
10
3
2
16
Ace
tyl In
terme
diates
12
14
10
16
52
O
ther A
ctivit
ies 1
13
15
3
(2)
29
Tota
l24
37
16
15
92
Depr
eciat
ion
and
Amor
tizat
ion
Expe
nse
Adv
ance
d Eng
ineer
ed M
ateria
ls16
16
16
17
65
Con
sume
r Spe
cialtie
s11
9
9
10
39
Indu
strial
Spe
cialtie
s14
15
16
14
59
Ace
tyl In
terme
diates
23
32
23
23
101
Othe
r Acti
vities
11
2
2
-
5
To
tal
65
74
66
64
269
Oper
atin
g EB
ITDA
* A
dvan
ced E
ngine
ered
Mate
rials
69
66
67
58
260
Con
sume
r Spe
cialtie
s53
78
44
53
22
8
In
dustr
ial S
pecia
lties
30
27
36
25
118
Ace
tyl In
terme
diates
145
181
177
169
672
Othe
r Acti
vities
1(2
8)
(4
2)
(2
8)
(3
6)
(1
34)
To
tal
269
310
296
269
1,144
*Q
uarte
rly ea
rning
s for
the d
iscon
tinue
d Edm
onton
Meth
anol
14
12
10
16
52
op
erati
ons h
ave b
een i
nclud
ed in
Othe
r Cha
rges
and O
ther A
djustm
ents.
Oxo
Alco
hol D
ivest
iture
**-
-
26
39
65
Tota
l Ope
ratin
g EB
ITDA
- as
repo
rted
269
310
322
308
1,209
**F
or co
mpar
ative
purp
oses
. Th
e Oxo
Alco
hol D
ivesti
ture w
as re
flecte
d as a
disc
ontin
ued o
pera
tion f
or th
e thr
ee m
onths
ende
d Mar
ch 31
, 200
6 and
June
30, 2
006
in co
njunc
tion w
ith re
portin
g the
resu
lts fo
r the
first
and s
econ
d qua
rter o
f 200
7.
1 Oth
er A
ctivit
ies pr
imar
ily in
clude
s cor
pora
te se
lling,
gen
eral
and
admi
nistra
tive e
xpen
ses a
nd th
e re
sults
from
capti
ve in
sura
nce
comp
anies
.2 In
clude
s equ
ity e
arnin
gs fr
om af
filiat
es, d
ivide
nds f
rom
cost
inves
tmen
ts an
d oth
er in
come
/(exp
ense
).3 E
xclud
es a
djustm
ents
to m
inorit
y int
eres
t, ne
t inte
rest,
taxe
s, de
prec
iation
, amo
rtizati
on a
nd d
iscon
tinue
d op
erat
ions.
Thre
e Mon
ths E
nded
49
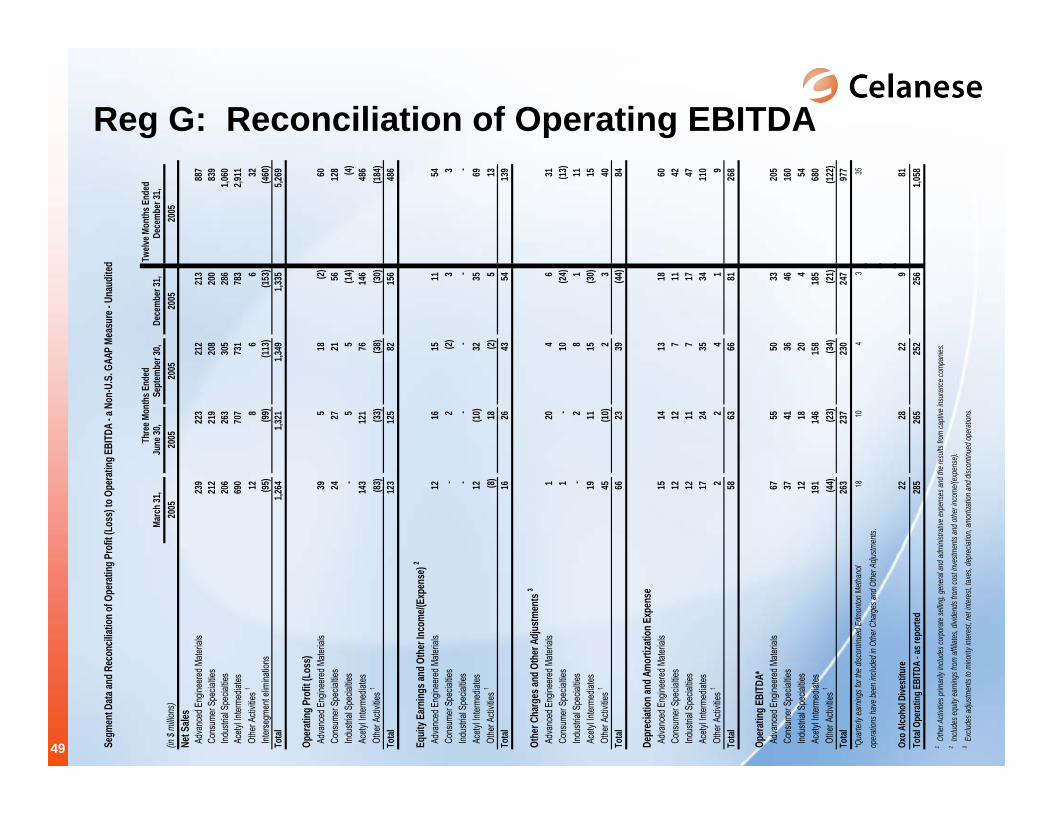
Reg G: Reconciliation of Operating EBITDASe
gmen
t Data
and R
econ
ciliat
ion of
Ope
ratin
g Pro
fit (L
oss)
to O
pera
ting E
BITD
A - a
Non
-U.S
. GAA
P Me
asur
e - U
naud
ited Tw
elve M
onth
s End
edMa
rch 3
1,Ju
ne 30
,Se
ptem
ber 3
0,De
cemb
er 31
,De
cemb
er 31
,(in
$ mi
llions
) 20
0520
0520
0520
0520
05Ne
t Sale
s A
dvan
ced E
ngine
ered
Mate
rials
239
223
21
2
21
3
887
Con
sume
r Spe
cialtie
s21
2
21
9
208
200
83
9
In
dustr
ial S
pecia
lties
206
263
30
5
28
6
1,060
A
cetyl
Inter
media
tes69
0
70
7
731
783
2,9
11
Othe
r Acti
vities
112
8
6
6
32
In
terse
gmen
t elim
inatio
ns(95
)
(99
)
(11
3)
(153)
(46
0)
Total
1,264
1,3
21
1,349
1,3
35
5,269
Oper
ating
Pro
fit (L
oss)
Adv
ance
d Eng
ineer
ed M
ateria
ls39
5
18
(2)
60
Con
sume
r Spe
cialtie
s24
27
21
56
12
8
In
dustr
ial S
pecia
lties
-
5
5
(14)
(4)
A
cetyl
Inter
media
tes14
3
12
1
76
146
486
Othe
r Acti
vities
1(83
)
(33
)
(38
)
(30
)
(18
4)
Total
123
125
82
15
6
48
6
Equit
y Ear
nings
and O
ther
Inco
me/(E
xpen
se) 2
Adv
ance
d Eng
ineer
ed M
ateria
ls12
16
15
11
54
Con
sume
r Spe
cialtie
s-
2
(2)
3
3
In
dustr
ial S
pecia
lties
-
-
-
-
-
Ace
tyl In
terme
diates
12
(10
)
32
35
69
Othe
r Acti
vities
1(8)
18
(2)
5
13
To
tal16
26
43
54
13
9
Othe
r Cha
rges
and O
ther
Adju
stmen
ts 3
Adv
ance
d Eng
ineer
ed M
ateria
ls1
20
4
6
31
C
onsu
mer S
pecia
lties
1
-
10
(24
)
(13
)
In
dustr
ial S
pecia
lties
-
2
8
1
11
A
cetyl
Inter
media
tes19
11
15
(30)
15
O
ther A
ctivit
ies 1
45
(10
)
2
3
40
Total
66
23
39
(44
)
84
Depr
eciat
ion an
d Amo
rtiza
tion E
xpen
se A
dvan
ced E
ngine
ered
Mate
rials
15
14
13
18
60
C
onsu
mer S
pecia
lties
12
12
7
11
42
Indu
strial
Spe
cialtie
s12
11
7
17
47
A
cetyl
Inter
media
tes17
24
35
34
11
0
O
ther A
ctivit
ies 1
2
2
4
1
9
Total
58
63
66
81
268
Oper
ating
EBI
TDA*
Adv
ance
d Eng
ineer
ed M
ateria
ls67
55
50
33
20
5
C
onsu
mer S
pecia
lties
37
41
36
46
160
Indu
strial
Spe
cialtie
s12
18
20
4
54
A
cetyl
Inter
media
tes19
1
14
6
15
8
18
5
68
0
O
ther A
ctivit
ies 1
(44)
(23)
(34)
(21)
(122)
To
tal26
3
23
7
23
0
24
7
97
7
*Q
uarte
rly ea
rning
s for
the d
iscon
tinue
d Edm
onton
Meth
anol
18
10
4
3
35
oper
ation
s hav
e bee
n inc
luded
in O
ther C
harg
es an
d Othe
r Adju
stmen
ts.
Oxo A
lcoho
l Dive
stitu
re22
28
22
9
81
To
tal O
pera
ting E
BITD
A - a
s rep
orted
285
265
252
256
1,058
1 Othe
r Acti
vities
prim
arily
inclu
des c
orpo
rate
sellin
g, ge
nera
l and
admi
nistra
tive e
xpen
ses a
nd th
e res
ults f
rom
capti
ve in
sura
nce c
ompa
nies.
2 Inclu
des e
quity
earn
ings f
rom
affilia
tes, d
ivide
nds f
rom
cost
inves
tmen
ts an
d othe
r inco
me/(e
xpen
se).
3 Exc
ludes
adjus
tmen
ts to
mino
rity in
teres
t, net
inter
est, t
axes
, dep
recia
tion,
amor
tizati
on an
d disc
ontin
ued o
pera
tions
.
Thre
e Mon
ths E
nded
50
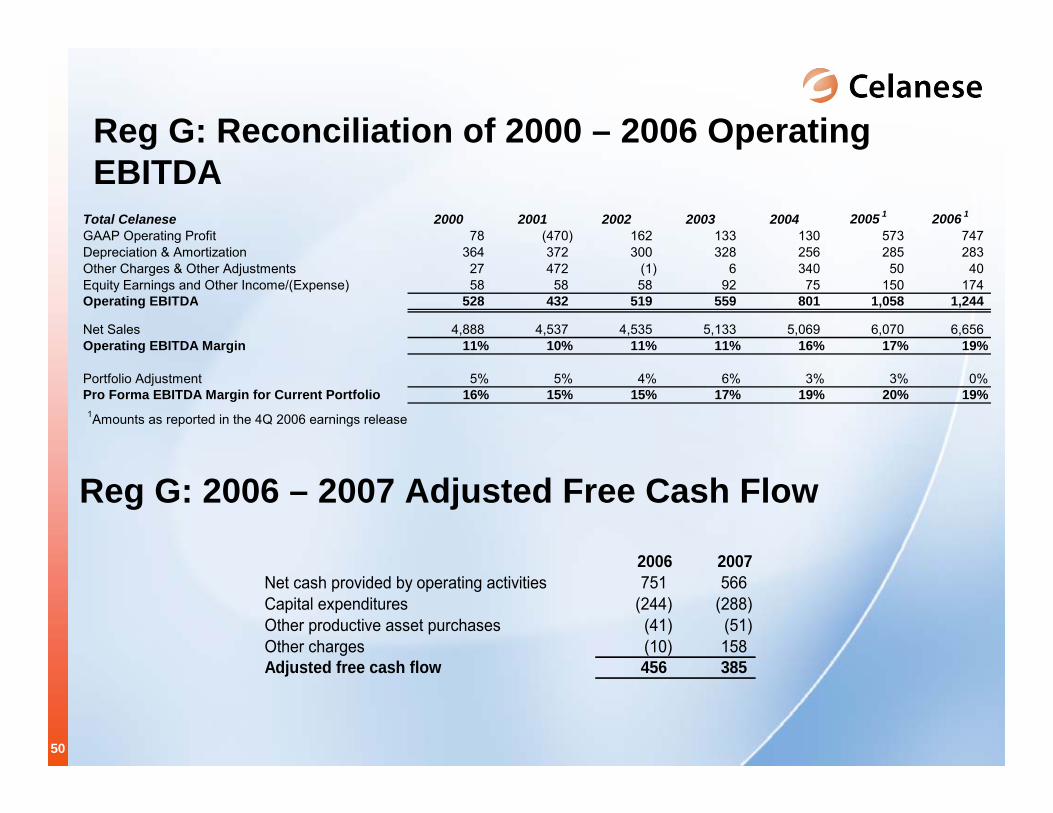
Reg G: Reconciliation of 2000 – 2006 Operating EBITDA
Total Celanese 2000 2001 2002 2003 2004 2005 1 2006 1
GAAP Operating Profit 78 (470) 162 133 130 573 747 Depreciation & Amortization 364 372 300 328 256 285 283 Other Charges & Other Adjustments 27 472 (1) 6 340 50 40 Equity Earnings and Other Income/(Expense) 58 58 58 92 75 150 174 Operating EBITDA 528 432 519 559 801 1,058 1,244
Net Sales 4,888 4,537 4,535 5,133 5,069 6,070 6,656 Operating EBITDA Margin 11% 10% 11% 11% 16% 17% 19%
Portfolio Adjustment 5% 5% 4% 6% 3% 3% 0%Pro Forma EBITDA Margin for Current Portfolio 16% 15% 15% 17% 19% 20% 19%1Amounts as reported in the 4Q 2006 earnings release
Reg G: 2006 – 2007 Adjusted Free Cash Flow
2006 2007Net cash provided by operating activities 751 566 Capital expenditures (244) (288) Other productive asset purchases (41) (51) Other charges (10) 158 Adjusted free cash flow 456 385