Embed Size (px)
Citation preview

2008 Minerals Yearbook
U.S. Department of the Interior U.S. Geological Survey
Latin aMerica and canada [advance reLease]
August 2010
Latin america and canada—2008 [advance reLease] 1.1
The Mineral indusTries of laTin aMerica and canada
By Philip M. Mobbs, David R. Wilburn, Susan Wacaster, Glenn J. Wallace, Steven T. Anderson, Omayra Bermúdez-Lugo, Alfredo C. Gurmendi,
and Alberto Alexander Perez
The countries and territories in Latin America (which includes the Caribbean) and Canada covered in this volume encompass an area of about 30.5 million square kilometers. Excluding the United States and its territories, the region had a population of 607 million, or 9.1% of the world total, in 2008.
Regional economic organizations include the Caribbean Community (CARICOM), which was composed of 15 Caribbean basin countries. The member states of the Sistema de la Integración Centroamericana (Central American Integration System), which included the Central American Bank for Economic Integration and the Central American Common Market, were Belize, Costa Rica, El Salvador, Guatemala, Honduras, Nicaragua, and Panama. The Dominican Republic-Central America Free Trade Agreement (CAFTA-DR) promoted trade between Costa Rica, the Dominican Republic, El Salvador, Guatemala, Honduras, Nicaragua, and the United States. Argentina, Brazil, Paraguay, and Uruguay were members of the Mercado Común del Sur (MERCOSUR) [Southern Common Market]; and Bolivia, Colombia, Ecuador, and Peru were members of the Andean Community, which was attempting to develop from a customs union into a common market. Venezuela’s entry into MERCOSUR remained pending at yearend 2008. Canada and Mexico were part of the free trade area created by the North American Free Trade Agreement (NAFTA), together with the United States. Eighteen Caribbean Basin countries were members of the Petrocaribe energy cooperation arrangement, which allowed participating countries to purchase refined Venezuelan oil at a discount or to finance shipments of Venezuelan petroleum products at a low interest rate. Guatemala joined Petrocaribe in 2008.
Canada and a number of countries in Latin America were major producers and exporters of metallic and industrial minerals, mineral fuels, and related materials, mostly in crude form. With respect to 2008 mineral production, Bolivia was one of the top five producers of tin ore in the world. Brazil was one of the top five producers of bauxite, iron ore (Fe content), and tin ore. Canada was the leading producer of potash and uranium ore in the world, and one of the top five producers of aluminum, cobalt, gem-quality diamond, and ores of nickel, palladium, platinum, and zinc. Chile was the leading producer of copper ore in the world. Mexico was one of the top five producers of lead ore, and Peru was one of the top five producers of copper, gold, lead, tin, and zinc ore (Bray, 2010a, b; Carlin, 2010; Edelstein, 2010; George, 2010; Guberman, 2010; Jasinski, 2010; Jorgenson, 2010; Kuck, 2010; Loferski, 2010; Olson, 2010; Shedd, 2010; Tolcin, 2010; World Nuclear Association, 2010).
Colombia (13th) and Canada (15th) were among the top 15 coal producers in the world. Canada was one of the top five
producers of natural gas, and Canada (6th), Mexico (7th), Venezuela (10th) and Brazil (15th) were among the top 15 crude oil producers in the world (BP p.l.c., 2009, p. 8, 24, 34).
Acknowledgments
The U.S. Geological Survey (USGS) acknowledges and thanks the following organizations for providing mineral-production statistics, basic economic data, and exploration and mineral-related information:
• Argentina—Secretaría de Minería de la Nación and Dirección Nacional de Minería;
• The Bahamas—Department of Statistics;• Belize—Geology and Petroleum Department;• Bolivia—Viceministerio de Minería y Metalurgia and
Asociación Nacional de Mineros Medianos;• Brazil—Departamento Nacional de Produção Mineral;• Canada—Natural Resources Canada;• Chile—Corporación Nacional del Cobre de Chile
(CODELCO), Comisión Chilena de Cobre, and Servicio Nacional de Geología y Minería;
• Colombia—Unidad de Planeación Minero Energética and Instituto Colombiano de Geología y Minería;
• Costa Rica—Dirección de Geología y Minas;• Dominican Republic—Dirección General de Minería;• Ecuador—Ministerio de Energía y Minas and Dirección
Nacional de Minería;• Guatemala—Ministerio de Energía y Minas, Dirección
General de Minería, and Departamento de Desarrollo Minero;• Guyana—Guyana Geology and Mines Commission;• Jamaica—Mines and Geology Division of the Ministry of
Agriculture and Lands;• Mexico—Servicio Geológico Mexicano and Secretaría de
Economía;• Nicaragua—Administració de Recursos Geológicos and
Dirección de Minas;• Peru—Ministerio de Energía y Minas; and• Trinidad and Tobago—Ministry of Energy and Energy
Industries.
General Economic Conditions
The global economic expansion of the past few years continued into 2008; however, by yearend 2008, a contraction of external demand and the tightening of available credit began to affect economic activity in the Latin America and Canada region. Export volumes of goods, including minerals and mineral products, fell sharply. The economic and financial
1.2 [ADVANCE RELEASE] u.s. geoLogicaL survey mineraLs yearbook—2008
crisis, which resulted in a global recession, continued into 2009, although not all countries would be affected equally. Mineral importing countries, especially mineral-fuel importers in the Caribbean and Central America that had been adversely affected by the increased commodity prices, were expected to benefit from lower mineral commodity prices.
The boom in mineral commodity prices, which began in mid-2003 and escalated in 2005, finally peaked in mid-2008. During the boom, many of the mineral-exporting countries in the region had enjoyed additional economic benefits among which were low inflation, low interest rates, a low unemployment rate, and an increase in their export values and volumes. Revenues for already active mineral producers in the region increased exponentially during the commodity price boom, and many Governments were able to obtain corresponding increases in revenues from the mineral industries in their countries. By 2008, the production and export of mineral commodities, including mineral fuels, accounted for a notable percentage of the gross domestic products (GDPs) and export revenues in Canada and many countries in South America (International Monetary Fund, 2009, p. 13; United Nations, 2009, p. 10; United Nations Economic Commission for Latin America and the Caribbean and International Labor Organization, 2009, p. 5).
The United States was still the largest single (country) destination for the Latin America and Canada region’s total exports, although the continuing growth in China’s (and other emerging economies’) demand for minerals was expected to draw an increased volume of goods from the region. For the period January to June 2009, the United States accounted for 37% of the total trade flow (exports and imports) from Latin America and the Caribbean. Intra-regional trade within Latin America and the Caribbean accounted for 19% of the region’s total trade flow; trade with the European Union, 15%; and with China, 10%. The GDPs of mineral producing countries in Latin America and Canada were expected to be benefit from the revenue gained from the potential increase in exports of minerals and mineral products to China (United Nations Economic Commission for Latin America and the Caribbean, 2009b, p. 56).
By yearend, owing to the global economic and fiscal crisis, many mineral producers were affected by the lack of demand for their products. Capital-intensive mineral exploration, development, and processing-facility expansion projects were being affected by the lack of available funding.
Investment Data and Political Risk
According to the United Nations Economic Commission for Latin America and the Caribbean (ECLAC) (2009a, p. 25-26), within Latin America and the Caribbean (excluding the financial centers of Bermuda, British Virgin Islands, Cayman Islands, and the U.S. Virgin Islands), foreign direct investment (FDI) was $128.3 billion in 2008, despite the international financial crisis. Brazil received $45.1 billion, which was about 35% of the FDI that flowed to Latin America and the Caribbean in 2008. About $22 billion was directed to Mexico, $16.8 billion to Chile, $10.6 billion to Colombia, and $8 billion to Argentina.
In 2008, FDI inflow to Mexico and the countries in the Caribbean Basin and Central America decreased by 5% with
respect to that of 2007 to $38.4 billion. FDI received by South American countries in 2008 increased by 24% with respect to that of 2007 to about $89.9 billion. The disparity was attributed to the economic crisis in the United States, which resulted in a sharp decrease in the export of manufactured goods to the United States from Mexico and the countries in the Caribbean Basin and Central America. South American FDI was directed to the mineral commodity sector, especially the metals sector (the prices of metals did not decline significantly until the fourth quarter of 2008) (United Nations Economic Commission for Latin America and the Caribbean, 2009a, p. 25, 31).
Within the mineral industry of Latin America and the Caribbean, FDI in the solid mineral (mining) sector increased significantly more rapidly during the commodities price boom than did FDI in the hydrocarbon (natural gas and petroleum) sector. One cause of this disparity was the relatively higher presence of state-owned companies in the hydrocarbon sector. Investments were expected to decrease significantly in 2009 as companies scale back exploration and production activity in response to lower international mineral commodity demand and prices.
Total FDI in Canada was about $469 billion1 in 2008, of which $71 billion was invested in hydrocarbon extraction and support, $28 billion in primary metal manufacturing, $23 billion in mining, and $22 billion in coal and petroleum processing. Total FDI inflow to Canada in 2008 was $40.2 billion. FDI in hydrocarbon production and support increased by $4.7 billion compared with that of 2007; mining increased by $3.2 billion; and coal and petroleum processing increased by $3 billion. In 2008, FDI in primary metal manufacturing decreased by $1.7 billion compared with that of 2007 (Foreign Affairs and International Trade Canada, 2009, p. 5, 68, 72).
Legislation
In Argentina, the law of minimum budgets for the protection of glaciers and the periglacial environment was vetoed in November. The proposed legislation would have restricted mining and oil drilling in a glaciated area between Argentina and Chile. In Colombia, the Ministry of Mines and Energy established at least three indigenous mining zones. In April, the Government of Ecuador issued a mandate that suspended metal-mine exploration and development activity in the country and revoked most mining concessions, claiming that they had been illegally granted without the consent of local communities. A new Ecuadorian mining law was passed in January 2009. Peru passed legislation that would change how mining royalties are distributed. Under the new legislation, royalties are assigned based on mineral production values. Venezuela announced a new policy to limit mining and mine development in its Imataca Forest Reserves, effectively stopping development of Las Cristinas and Las Brisas gold projects. Nationalization of the Venezuelan cement industry continued in 2008 (Ecclestone, 2008; Engineering and Mining Journal, 2008; Kosich, 2008b; Mineweb, 2008; Suggett, 2008).
1Where necessary, values have been converted from canadian dollars (can$) to u.s. dollars (us$) at an average rate of can$1.077=us$1.00 for 2008 and can$1.074=us$1.00 for 2007.

Latin america and canada—2008 [advance reLease] 1.3
Mineral exploration in Canada has been influenced by recent legislation directed at the mining industry. Approximately $93 million (to be disbursed during a 5-year period) was allocated for a Geo-mapping for Energy and Minerals program to provide the information necessary to guide investment decisions leading to the discovery and development of new resources, with emphasis on arctic areas in the Nunavut and the Northwest Territories. The New Brunswick Government approved up to $2.8 million during the course of 3 years to support mineral exploration at the Caribou mining camp. The Province of Saskatchewan approved a reintroduction of a 10% nonrefundable investment tax credit for mineral exploration following the eligibility rules of the Federal program (Canadian Mining Journal, 2008; CBC News, 2008; Geological Survey of Canada, 2010).
Across Canada, the debate on whether to permit uranium exploration and mining continued. British Columbia confirmed a ban on uranium exploration and mining in the Province. In the Province of Newfoundland and Labrador, a uranium mining ban was imposed on Inuit lands in Labrador by the Nunatsiavut Assembly. The Province of New Brunswick suspended all mining claims activity and imposed a ban on uranium exploration and mining within 300 meters of residential or institutional buildings and watershed areas designed for public water supply (Kosich, 2008a, c, d).
First Nation issues continue to affect mineral legislation in Canada. The Province of Ontario’s Mining Act was under review for the purpose of updating regulations on how companies stake and explore their claims, and to establish consultation guidelines among Provincial governments, exploration companies, and First Nation authorities (Hill, 2008; Kirwin, 2008).
Exploration
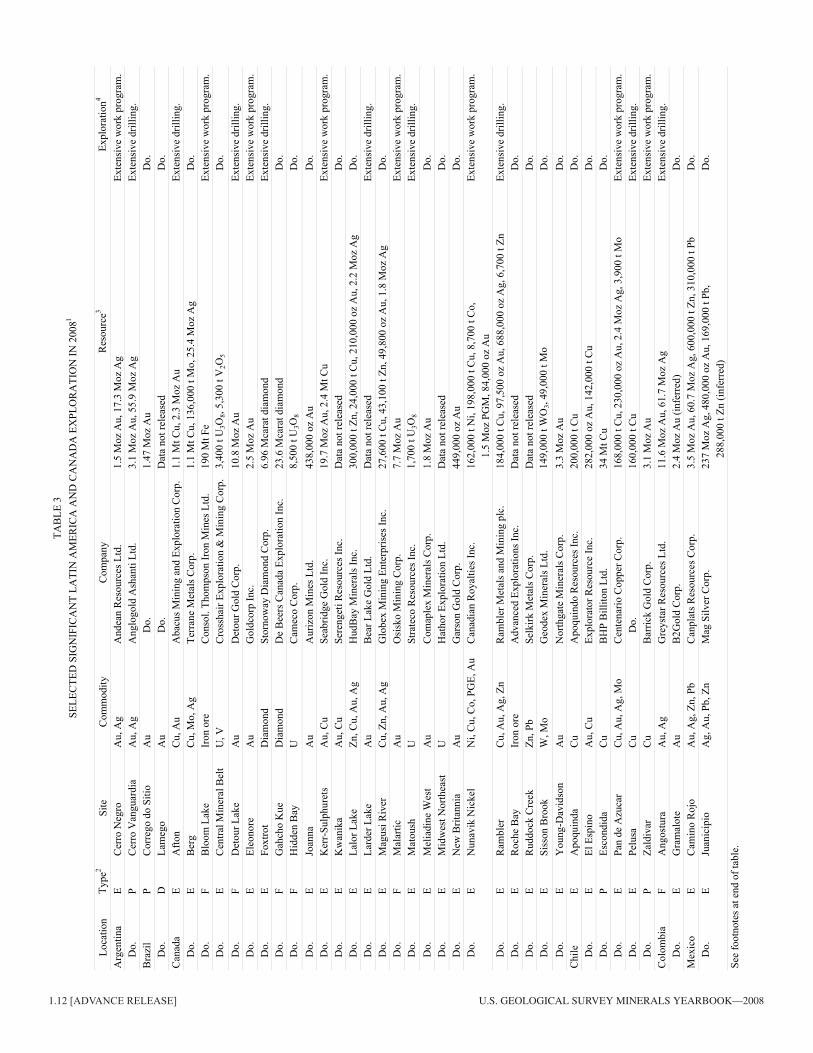
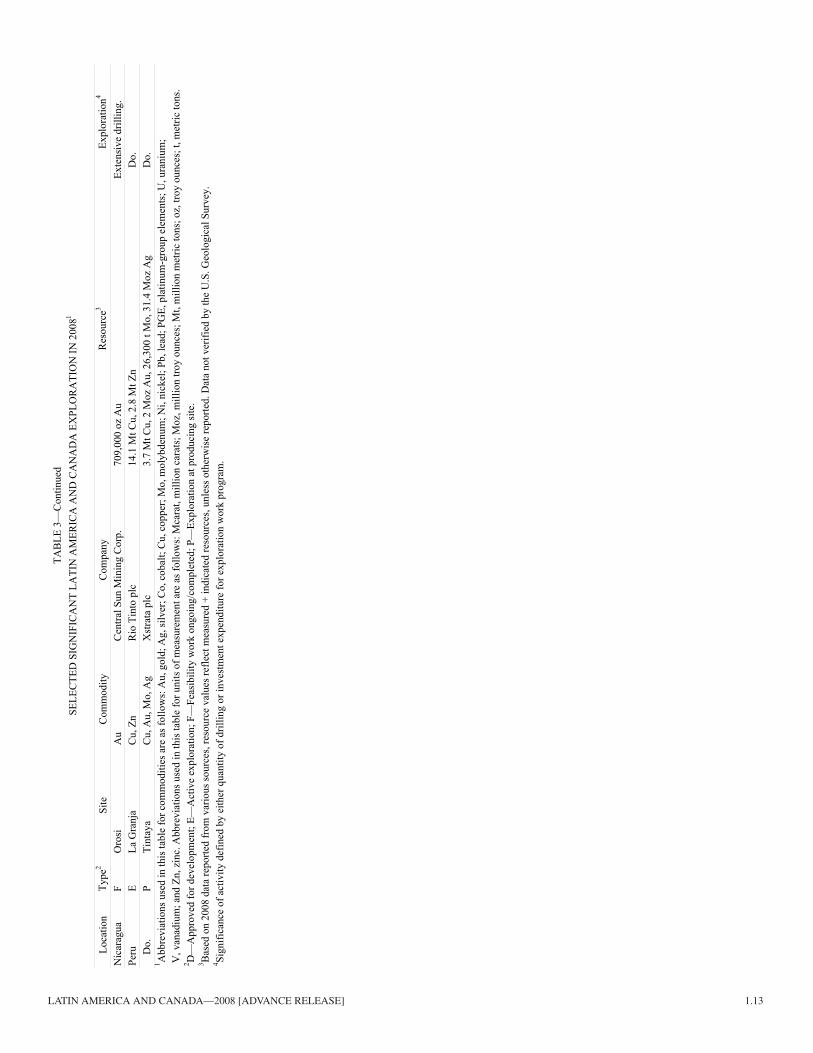
On the basis of data compiled by the USGS, Latin American countries with the greatest exploration activity were, in descending order by number of sites for which data were compiled, Mexico, Peru, Chile, Brazil, and Argentina. According to the Metals Economics Group (MEG) (2008, p. 7-8), Latin America maintained its leading position as a destination for exploration capital (based on MEG estimates of proposed budget data) and Latin America’s share of the world’s mineral exploration budget increased slightly to about 25%. Brazil, Chile, Mexico, and Peru were ranked in MEG’s top 10 country list for anticipated exploration spending in 2008. Gold attracted about 45% of total exploration activity; base metals, 36%; and silver, about 8% of the total. In 2008, investment in mineral exploration was used primarily to define newly discovered resources (56%), to conduct exploration at a producing site (22%), to conduct feasibility studies of promising discoveries (14%), and to explore further for resources adjacent to deposits under development (8%).
For many years, mineral exploration activity in Mexico has focused on gold and silver projects, which accounted for about 76% of the currently active exploration projects in Mexico. High base-metals prices in 2007 and the beginning of 2008 increased interest in base-metal deposits; polymetallic base-metal deposits
accounted for an additional 23% of the active exploration projects. In recent years, precious metal exploration, principally by Canadian junior exploration companies, has been focused on the Sierra Madre mineral belt in central and western Mexico.
Chinese investment in Latin American increased in 2008 as Chinese companies secured interests in a number of large late-stage mineral projects. The 2008 results of the Fraser Institute’s annual survey of exploration companies’ assessment of the attractiveness of exploration in numerous countries, which is based on mineral occurrences and public policy factors, show a continued decline in the ranking of many Latin American countries, although Chile remains one of the top 10 destinations for investment according to the survey (McMahon and Cervantes, 2009).
Canada continued to be a focal point of global minerals exploration interest. The MEG (2008, p. 7) reported that $2.5 billion was budgeted for exploration spending in Canada in 2008, or about 19% of the estimated overall worldwide exploration budget. Statistics (as of February 2010) released by the Canadian Government’s Natural Resources Canada (2009a-c) show that actual 2008 exploration expenditures (for projects through the feasibility study level) increased by 19% in terms of U.S. dollars [16% in terms of Canadian dollars (C$)] to about $3.1 billion from a total expenditure of $2.6 billion in 2007. Canadian Government statistics include expenditures for coal, industrial minerals, and uranium exploration, which are excluded from the MEG estimates. In 2008, precious metals (gold and silver) exploration expenditures accounted for $1.1 billion of the $2.5 billion exploration expenditure total; base metals accounted for about $782 million; diamond, $206 million; and uranium, $380 million. Junior exploration companies accounted for about 65% of total expenditures in 2008 compared with 61% in 2005, 65% in 2006, and 67% in 2007.
Based on data compiled by the USGS on the location of exploration activity in 2008, exploration for gold took place at approximately 32% of the Canadian exploration sites listed as active in 2008; copper, about 13%; uranium, 13%; lead and zinc, 10%; nickel, 9%; and diamond, 4%. Approximately 82% of all reported exploration sites were considered early-stage operations. Based on the number of sites in 2008 for which data were collected, Canadian gold exploration activity took place primarily in the Provinces of Ontario, Quebec, and British Columbia, respectively, and base metals exploration took place mainly in British Columbia, Ontario, Quebec, and Manitoba, respectively. Diamond exploration was focused in the Northwest Territories, Nunavut Territory, and the Province of Quebec and uranium exploration took place primarily in the Provinces of Saskatchewan, Quebec, Ontario, and Newfoundland, respectively, based on the number of sites in 2008 for which data were collected.
Commodity Overview
This section summarizes the supply and demand trends and potential developments for the leading mineral commodities in Latin America and Canada. The region’s share of world production of selected mineral commodities is listed by

1.4 [ADVANCE RELEASE] u.s. geoLogicaL survey mineraLs yearbook—2008
commodity in table 4. Estimates for production of major mineral commodities for 2009 and beyond have been based upon supply-side assumptions, such as announced plans for increased production/new capacity construction, announced plans to reduce production and close production facilities either temporarily or permanently, and bankable feasibility studies. The outlook tables in this summary chapter show historic and projected production fluctuations and trends; therefore, no indication is made about whether the data are estimated or reported, and revisions are not identified. Data on individual mineral commodities in tables in the individual country chapters are labeled to indicate estimates and revisions. The outlook segments of the mineral commodity tables are based on current (2010) producing facilities and on planned new facilities that operating companies, consortia, or Governments have projected to come online within indicated timeframes. Forward-looking information, which includes estimates of future production, exploration, and mine development; cost of capital projects; and timing of the start or closure of operations, are subject to a variety of risks and uncertainties that could cause actual events or results to differ significantly from expected outcomes. Projects listed in the following section are presented as an indication of industry plans and are not a USGS prediction of what will occur.
Metals
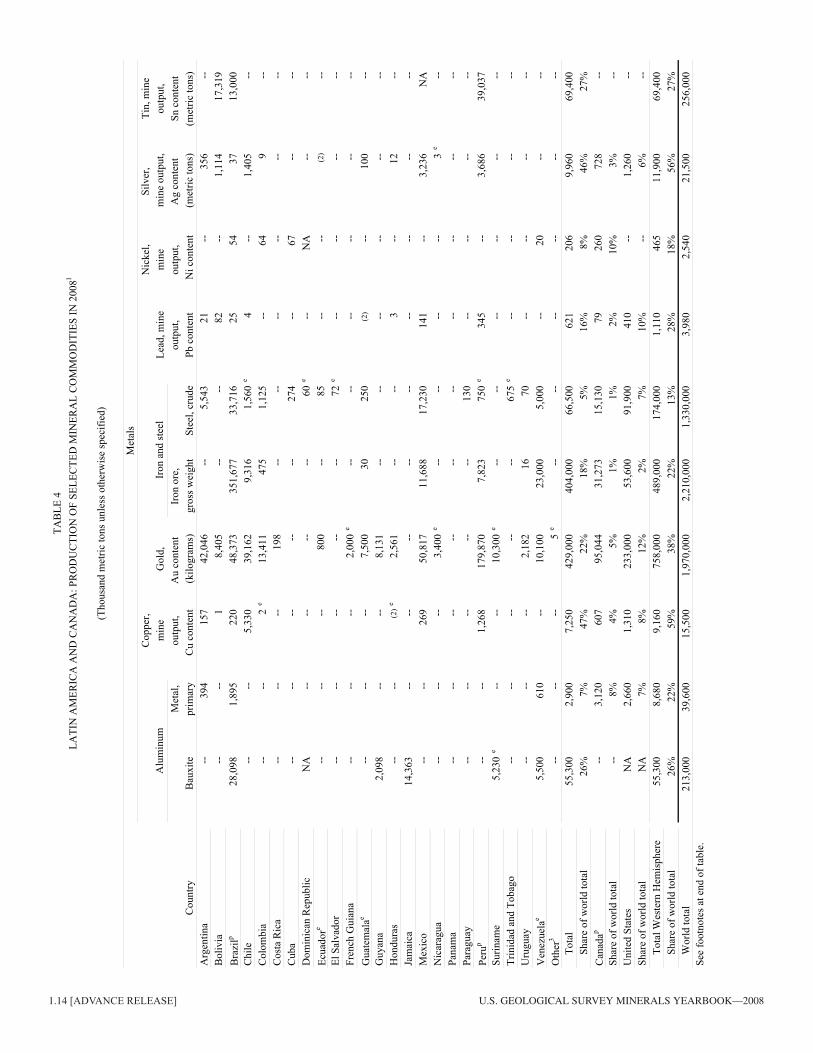
Aluminum and Bauxite and Alumina.—Aluminum.—Latin America accounted for 26% of the world’s production of bauxite. Canada, which processed imported raw material, was the leading producer of aluminum in the region, accounting for about 8% of the world’s production of primary aluminum metal. Latin America (mainly Brazil) accounted for 7% of the world’s primary aluminum metal. Other aluminum producers in the region included Argentina, Mexico, and Venezuela. Regional aluminum production was expected to decrease in 2009. A rebound in aluminum output would depend upon the world’s recovery from the economic crisis.
The apparent consumption of aluminum in Brazil and Mexico more than doubled between 2000 and 2008. During the same time period, the apparent consumption decreased by 62% in Canada. Notable consumers of aluminum included manufacturers of vehicles for the transportation industry, the food packaging industry, and the construction industry (table 23; Bray, 2010a).
In November 2008, Alcoa Inc. of the United States announced that it would partially or fully curtail production of aluminum metal at some of the company’s smelters in response to decreases in global demand for aluminum. In Brazil, production of primary aluminum was expected to be lower than that of 2008 owing to a decrease in the production of primary aluminum by Alcoa Alumínio S.A.’s Poços de Caldas plant. In November, the Valesul Alumínio S.A. smelter in Brazil, which was owned by Companhia Vale do Rio Doce (Vale), began to reduce production; by December, it was operating at one-half of capacity. Valesul was not expected to resume operations at full capacity during the economic downturn (tables 4, 6; Alcoa Inc., 2008; Associação Brasileira do Alumínio, 2009a, b).
In Canada, Alcoa permanently closed one 53,000-metric-ton-per-year (t/yr)-capacity potline at the Baie Comeau smelter in November partially in response to the economic downturn, and Rio Tinto Alcan Inc. announced cutbacks in the production of alumina and primary aluminum at some locations, including the permanent closure of the Beauharnois aluminum smelter [which produced about 50,000 metric tons (t) of aluminum in 2008]. Rio Tinto Alcan also deferred the expansion of the Alma smelter and the modernization of the Kitimat smelter in 2008 (Rio Tinto plc, 2009, p. 71, 74; Alcoa Inc., 2010, p. 10).
Bauxite and Alumina.—Brazil was the leading producer of bauxite in the region and accounted for about 13% of the world’s production. Other bauxite producers included Guyana, Jamaica, Suriname, and Venezuela. Production of bauxite in Latin America was expected to decrease in 2009 in response to the expected decrease in global demand for aluminum. In December, the West Indies Alumina Co. (WINDALCO) in Jamaica announced a 35% reduction in output (Jamaica Gleaner, 2008).
Copper.—Ore.—Production of copper ore in Latin America and Canada contributed more than 51% of the world output. Based on announced company plans, the region was expected to increase its copper ore production capacity by about 12% in 2015 compared with that of 2008 in response to continued growth in consumption of copper globally, especially in China and India (tables 4, 7).
The Escondida Mine in Chile was the leading single copper mine in the world, and Chile was the leading producer in the world, accounting for about 34% of global production of copper in 2008. In May, Corporación Nacional del Cobre de Chile started production from the 150,000-t/yr-capacity Gabriela Mistral (Gaby) Mine (Jordan, 2008).
In Brazil, copper ore production capacity was expected to increase significantly by 2015 compared with that of 2008 because Vale planned to complete the development of the company’s Salobo copper project by 2012. Copper ore production capacity in Peru was expected to continue to increase gradually through 2015 mainly owing to expansions at the Cerro Verde, the Cuajone, and the Toquepala Mines (table 7).
Refined Copper.—In Latin America and Canada, refined copper production capacity was expected to increase by 2015 compared with that of 2008. Chile was the world’s leading producer of primary refined copper in 2008. In 2009, total production of refined copper in Chile was expected to increase significantly compared with that of 2008 mostly owing to a full year’s production of solvent extraction-electrowon (SX-EW) cathodes from the Gaby Mine and the continued rampup of production of SX-EW cathodes at the Spence Mine.
Between 2000 and 2008, the apparent consumption of copper increased in Brazil by 22% and in Peru by 33%. During the same time period, the apparent consumption of copper decreased in many countries, which included Argentina, Canada, Chile, Colombia, and Mexico (table 23).
In Peru, the Ilo copper smelter and refinery complex (operated by Southern Peru Copper Corp.) was the leading copper refinery in the country. An expansion of the Ilo copper refinery was expected to be completed sometime in 2012. SX-EW plants associated with copper mines accounted for more than 40%
Latin america and canada—2008 [advance reLease] 1.5
of Peru’s production of refined copper. Production of refined copper in Peru was expected to increase substantially by 2011 compared with that of 2008 mostly owing to capacity expansions at SX-EW plants.
In Brazil, after the restructuring of Paranapanema S.A. in August, plans were advanced for its subsidiary, Caraíba Metais S.A., to expand its production capacity to 277,000 t/yr by 2012. In December, Vale completed the construction of the 10,000-t/yr-capacity (of copper cathode) Usina Hidrometalúrgica de Carajás pilot plant at the Sossego Mine (Companhia Vale do Rio Doce, 2009, p. 42; Paranapanama S.A., 2010, section 6l).
Gold.—In 2008, Latin America and Canada accounted for about 27% of the world’s production of gold. Peru and Canada were the first and second ranked producers, respectively, in the region and accounted for about 50% of the regional production (tables 4, 9).
A new mill began operating in 2008 at the Yanacocha Mine in Peru, which was owned by Newmont Mining Corp. of the United States and partners Cia. de Minas Buenaventura, S.A.A. of Peru and the International Finance Corp. Mine output was expected to increase substantially in the short term to feed the mill. Gold production from the mine was expected to increase by between 6 and 7 t/yr (Newmont Mining Corp., 2010a, p. 6; 2010b, p. 64).
In Canada, gold output decreased again in 2008. A number of polymetallic mines were placed on care-and-maintenance status owing to the international economic and financial crisis. Gold production was expected to increase by 2013 compared with that of 2008 as operations resume at suspended mines. Additional output was expected from the planned development of potential gold-producing properties, which included the Black Fox Mine of Apollo Gold Corp., the McGarry project of Armistice Resources Corp., San Gold Corp.’s Cartwright and Hinge zone deposits near the Rice Lake Mine, and the Timmins Mine of Lake Shore Gold Corp.
In 2009, Barrick Gold Corp. was expected to begin the construction of the Pascua-Lama project, which straddled the Argentinean-Chilean border (about 75% of the Pascua-Lama ore body was thought to be located in Chile). Barrick expected that the initial production of gold would take place in 2013, and that the production capacity would be ramped up to about 24 t/yr of gold and 1,000 t/yr of silver (Barrick Gold Corp., 2009, p. 8, 12).
Iron Ore and Iron and Steel.—Iron Ore.—In 2008, Latin America and Canada accounted for about 20% of the world’s iron ore output in terms of gross weight. In terms of iron content, Brazil was the leading producer in the region and accounted for about 81% of the region’s production of iron ore. Canada and Venezuela were ranked a distant second and third to Brazil, respectively, in the production of iron ore in the region. Production of iron ore in Latin America and Canada was expected to decrease in 2009 compared with that of 2008 mostly owing to an expected decrease in production by Vale in Brazil in response to the global economic crisis (tables 4, 10).
During 2010, Vale expected to expand the iron ore production capacity at the Carajas Mine in Brazil. In Canada, Consolidated Thompson Iron Mines Ltd.’s ongoing development of the
company’s Bloom Lake project was expected to start production by yearend 2009. The Bloom Lake project was expected to have a capacity to produce 7 million metric tons per year (Mt/yr) of iron ore concentrate. Also in Canada, iron ore production capacity could increase substantially by 2011 compared with that of 2008, with the resumption of an $800 million expansion program by Iron Ore Co. (IOC) of Canada, which would increase IOC’s production capacity to 22.8 Mt/yr of iron ore concentrate from 17.5 Mt/yr in 2008. This expansion program was suspended in December 2008 (table 10; Dumont, 2009, p. 22.3; Consolidated Thompson Iron Mines Ltd., 2010).
Vale, Rio Tinto plc, and BHP Billiton Ltd., in order of the volume of iron ore shipped, accounted for much of the seaborne shipments of iron ore. About 57% of the shipments from Vale’s Brazilian mines went to China; another 16% was shipped to other Asian counties, primarily Japan and the Republic of Korea. Rio Tinto shipped iron ore from mines in Brazil and Canada, which supplemented the company’s shipments from Australia. BHP Billiton shipped iron ore from Brazilian operations, which supplemented the company’s shipments from Australia (Sergeant, 2009).
Steel.—In 2008, Latin America and Canada accounted for more than 6% of the world’s production of crude steel. The leading producers in the region were Brazil, Canada, and Mexico. Regional production of crude steel was expected to decrease in 2009 owing to decreases in capacity utilization. In response to an expected increase in global demand by 2010, production of crude steel in Latin America and Canada was expected to increase substantially by 2011, mostly owing to the resumption of expansion projects in Brazil and increased capacity utilization in the region (table 11).
Notable increases in the apparent consumption of finished steel for the period from 2000 to 2008 were calculated for Argentina, Brazil, Chile, and Colombia. Peru posted a more modest increase. In Canada, a decrease in apparent consumption of finished steel of 20% was noted for the same period (table 23).
Nickel.—Canada was by far the leading producer of nickel in the region and accounted for about 10% of the world mine output of nickel in 2008. The international economic crisis, which resulted in a significant decrease in the world nickel prices in late 2008 (and increasing inventories of nickel worldwide), was expected to result in a notable decrease in the production of nickel in the region in 2009. A production rebound in 2010 and beyond would be dependent upon market conditions, especially the recovery of the global steel sector (table 12).
In Brazil during 2008, Vale indefinitely postponed the 48,000-t/yr-capacity (nickel content of ferronickel) Niquel do Vermelho project, temporarily deferred the startup of the 58,000-t/yr-capacity (nickel content of ferronickel) Onca Puma project, and transferred the management of both projects to a subsidiary, Vale Inco Ltd. of Canada. In Canada, Crowflight Minerals Inc. completed construction of the Bucko Lake Mine in October. Commissioning of the mine and mill was expected to be completed in early 2009. Mining operations at the Lac des Iles, the Levack/McCreedy West, the Liberty, the Lockerby, the McWatters, and the Redstone nickel mines were closed or suspended in 2008, and the Copper Cliff South, the Craig, and
1.6 [ADVANCE RELEASE] u.s. geoLogicaL survey mineraLs yearbook—2008
the Thayer-Lindsley nickel mines were expected to be closed in 2009 (Companhia Vale do Rio Doce, 2009, p. 35, 60, 82).
In Cuba, damage to nickel facilities caused by Hurricane Ike was expected to be repaired quickly. The Moa joint venture of General Nickel S.A. of Cuba and Sherritt International Corp. of Canada completed an initial 4,000-t/yr expansion of the Pedro Soto Alba Mine in Cuba, which increased the mine’s capacity to about 37,000 t/yr of cobalt and nickel contained in mixed sulfides. The second phase of the capacity expansion program, which would result in an additional 9,000 t/yr of capacity, was postponed in late 2008 owing to economic conditions. In the Dominican Republic, Xstrata plc of Switzerland suspended operations at the 28,500-t/yr-capacity Falcondo nickel mine and ferronickel plant (Sherritt International Corp., 2009, p. 8-9; Xstrata plc, 2010, p. 81, 95).
Future facility expansions or new nickel mines included the 41,000-t/yr-capacity Barro Alto project in Brazil, which Anglo American plc of the United Kingdom planned to start up in 2011. In Canada, Vale Inco planned to complete an expansion at the company’s Clarabelle mill and to complete development of the 8,200-t/yr-capacity (contained nickel) Totten Mine in 2011. Xstrata’s 18,000-t/yr-capacity (contained nickel) Nickel Rim South Mine was expected to begin mining operations in 2009 (Anglo American plc, 2010, p. 19; Xstrata plc, 2010, p. 82).
Platinum-Group Metals.—Only two countries, Canada and Colombia, produced platinum-group metals (PGM) in the Latin America and Canada region in 2008. Canada produced 7% of the world’s output of palladium and about 4% of the world’s output of platinum. In the region, Canada accounted for 100% of the palladium output and much of the region’s estimated output of platinum. Much of Canada’s PGM ore production came from the underground Roby zone at the Lac des Iles Mine of North American Palladium Ltd., or was recovered as a coproduct of nickel ore mined by Vale Inco and Xstrata in the Sudbury district, as well as from nickel ore from Xstrata’s Raglan Mine. The Podolsky Mine of FNX Mining Company Inc. started production in 2008. The copper-nickel mine also produced some PGM (tables 13, 14; Loferski, 2010).
A significant lack of demand for PGM, as expressed in the decline of the price of platinum metal that began in mid-2008, was attributed to the international economic crisis. According to Johnson Matthey Plc (2010), the average monthly price of platinum peaked in May at $2,060 per troy ounce, then declined to an average of $844 per troy ounce in November, before rebounding slightly in December. In response to the price decline, PGM production from the Lac des Iles Mine was temporarily (but indefinitely) suspended in late 2008. Coproduct PGM from the Vale nickel mines was expected to be reduced in 2009 owing to the announced temporary suspensions of mining operations. Xstrata’s output of coproduct PGM also was expected to be reduced as two nickel mines were scheduled to be closed in 2009.
The planned development of the underground Offset zone at the Lac des Iles Mine by 2012 was expected to more than compensate for the decrease of the mine’s PGM production as the reserves at the Roby zone were depleted. Additional PGM was expected to be recovered from the output from Xstrata’s Nickel Rim South Mine, which was scheduled to begin mining operations in 2009, and Vale Inco’s Totten Mine.
Tin.—In 2008, Peru was the leading producer of tin of the countries in Latin America and Canada that produced tin and accounted for 16% of the world’s production of tin ore; Bolivia produced about 7%, and Brazil, 5%. Minsur S.A., which was Peru’s principal tin miner and refiner, was expected to decrease production in 2009 in response to the international economic recession. In late 2008, Serra da Madeira Participações Ltda., which was a subsidiary of Minsur, acquired the assets of Mineração Taboca S.A., which was the leading tin producer in Brazil (table 15).
Zinc.—Ore.—In 2008, Peru was the leading producer of zinc ore in the Latin America and Canada region, accounting for 14% of the world’s output of zinc ore. Increased zinc ore production capacity in Peru (and the region) in the near term was expected to come mainly from an expansion of copper and zinc production capacity at the Antamina Mine in Peru by Cia. Minera Antamina S.A.; the rampup to full production of Xstrata’s Perseverance Mine in Canada, which started commercial mining in July; and the development of the Wolverine zinc deposit in Canada by Yukon Zinc Corp. (tables 4, 17).
Votorantim Metais Zinco S.A. (a subsidiary of Votorantim Participações S.A. of Brazil) was the leading producer of zinc ore in Latin America. According to the Departamento Nacional de Produção Mineral (2009, p. 28), Brazil’s production of zinc decreased in 2008 compared with that of 2007 at least partially owing to decreased production by Votorantim, which restrained production and program investments owing to decreases in zinc demand and prices. In September, Prometálica Mineração Ltda. closed the Monte Cristo zinc mine in Brazil because of decreased zinc prices and the lack of funding to continue operations. Prometálica subsequently filed a restructuring plan with the courts (Brazilian Resources, Inc., 2009, p. 3-4).
Refined.—Canada was the leading producer of refined zinc in the region, and Teck Cominco Ltd., which owned the Trail smelter and refinery complex, was the leading producer of refined zinc in Canada. In November 2008, Teck reduced production of refined zinc by about 5,000 metric tons per month at Trail in response to market conditions, and the cutback was expected to continue until mid-2009. Similar to steel consumption, about 70% of zinc use in Canada is by the automotive and construction sectors. Because the Government expected some recovery in those sectors by the end of 2010, production of zinc (both contained in concentrate and refined) in Canada was expected to increase substantially in 2011 compared with that of 2008 (table 18; Panagapko, 2009, p. 56.6, 56.11).
In Peru, Votorantim took advantage of the temporarily reduced demand for zinc to increase the production capacity at the Cajamarquilla zinc refinery. The capacity expansion to 320,000 t/yr from 160,000 t/yr was scheduled to be completed in 2009 (Votorantim Participações S.A., 2009, p. 42).
Industrial Minerals
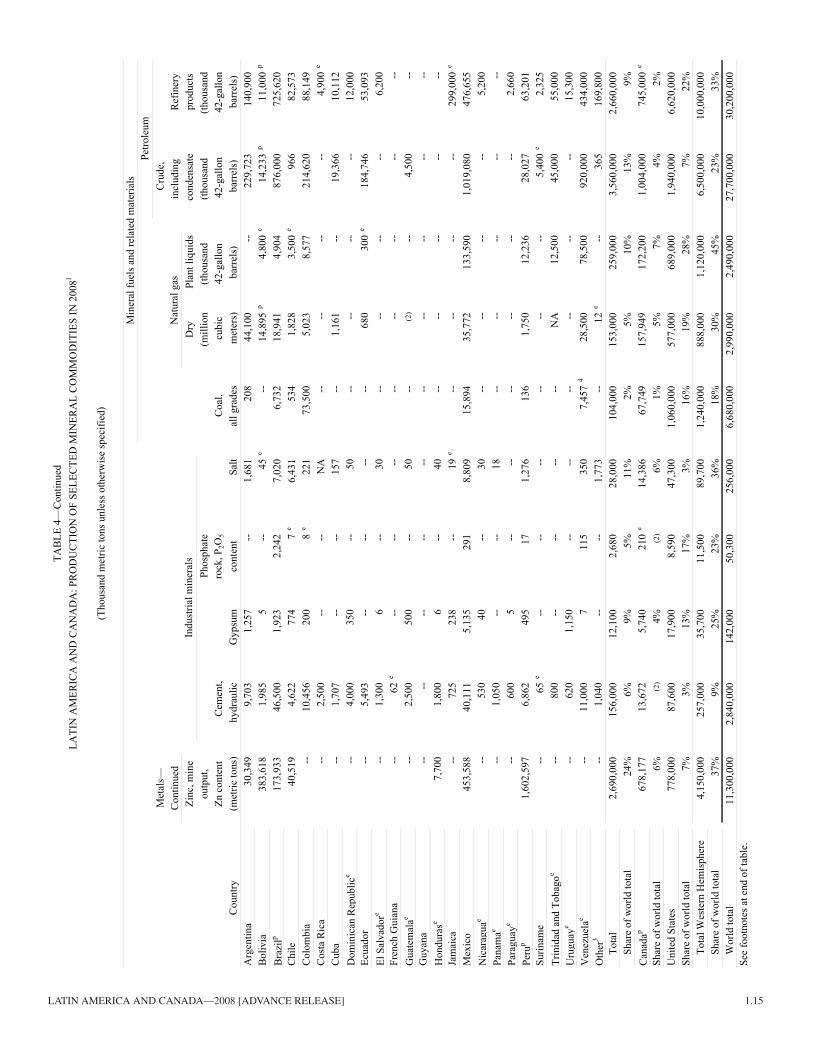
Unlike the variability of apparent consumption of aluminum, copper, and steel, the apparent consumption of portland cement increased in Argentina, Brazil, Canada, Chile, Colombia, Mexico, and Peru between 2000 and 2008. Increases were noted
Latin america and canada—2008 [advance reLease] 1.7
in Peru, 86%; Colombia, 70%; Argentina, 56%; Chile, 38%; Canada, 37%; Mexico, 33%; and Brazil, 16% (table 23).
Diamond.—Canada was by far the leading producer of diamond in the region; the world’s third ranked diamond producer (by value) after Botswana and Russia; and the world’s fifth ranked producer of natural diamond (by volume) after Russia, the Democratic Republic of Congo [Congo (Kinshasa)], Botswana, and Australia. Other regional producers included Brazil, Guyana, and Venezuela (table 19; Kimberley Process, 2009).
Canada’s diamond production was recovered primarily from the Diavik Mine and the Ekati Mine. In 2008, De Beers Canada Inc. officially opened the 1.4-million-carat-per-year-capacity Snap Lake underground mine and the 730,000-carat-per-year-capacity Victor open pit mine. Tahera Diamond Corp.’s bankruptcy resulted in the closure of the 500,000-carat-per-year-capacity Jericho Mine (Perron, 2009, p. 17.1-17.3).
Lithium.—Lithium was recovered as lithium carbonate from subsurface brines and as lithium minerals from hard-rock ores. In 2008, production by Sociedad Chilena del Litio Ltda. and Sociedad Quimica y Minera de Chile S.A. (SQM) made Chile the leading producer of lithium carbonate. In Argentina, Minera del Altiplano S.A. produced lithium carbonate from brine. Cia. Brasileira de Lítio in Brazil and Tantalum Mining Corp. of Canada, Ltd. in Canada produced lithium minerals from ore. In 2008, the Latin America and Canada region accounted for about 58% of world production (excluding production from the United States) (table 20; Jaskula, 2010).
In 2008, energy shortages in Argentina again affected the delivery of natural gas to Chile, which adversely affected the generation of electricity and other industrial uses. Because of the lack of gas, SQM primarily used higher cost diesel and fuel oil to power its equipment in 2008. In October, SQM completed the expansion of its lithium carbonate capacity to 40,000 t/yr from 30,000 t/yr (Sociedad Quimica y Minera de Chile S.A., 2009, p. 3).
An anticipated increase in the production of rechargeable lithium-ion batteries for automobiles was expected to increase the demand for lithium significantly by 2015. In 2008, exploration for additional lithium deposits (both hard rock and lake brines) was underway in Argentina, Australia, Canada, and China. Exploration was expected to increase in the near term (Coons, 2008).
Mineral Fuels and Related Materials
Coal.—In the Latin America and Canada region, Colombia was the leading producer of coal followed closely by Canada. Production in the region was expected to increase substantially by 2011 compared with that of 2008. The majority of the increase was expected to come from Drummond Ltd.’s El Descanso Mine in Colombia, which was expected to produce more than 20 Mt/yr. The 6-Mt/yr-capacity Isla Riesco project, which is located in Region XII, Chile, was expected to begin production in 2012 (table 21; Drummond Ltd., 2009, p. 26; Diario Financiero, 2010).
Uranium.—Canada remained the leading producer of uranium in the world in 2008, despite the continued decline in
Canadian uranium output. In the region, Brazil also produced uranium. The development of the Cigar Lake underground mine in Canada again was delayed by flooding in 2008, but construction was scheduled to be completed by 2013. The output from the Cigar Lake Mine was expected to increase Canada’s uranium production significantly, and would more than offset the loss of production from the Rabbit Lake Mine, which was expected to close in 2015 (table 22; Cameco Corp., undated a, b).
The price of uranium had peaked in 2007, but there were a number of ongoing exploration projects in Argentina, Bolivia, Brazil, Canada, Chile, Colombia, Guyana, Paraguay, Peru, and Venezuela. In Canada, the uranium rush was such that British Columbia banned uranium exploration and mining in the Province. In the Province of Newfoundland and Labrador, a ban was imposed on proposed uranium mining on Inuit lands in Labrador, and a ban also was imposed on uranium exploration and mining within 300 meters of residential or institutional buildings and watershed areas designed for public water supply in the Province of New Brunswick (Kosich, 2008a, c, d).
References Cited
Alcoa Inc., 2008, Alcoa to curtail additional 350,000 mtpy of aluminum production across its global smelting system: Pittsburgh, Pennsylvania, Alcoa Inc., November 10, 2 p.
Alcoa Inc., 2010, Form 10-K for the fiscal year ended December 31, 2009: Washington, DC, U.S. Securities and Exchange Commission, 158 p.
Anglo American plc, 2010, Analyst visit October 2009: London, United Kingdom, Anglo American plc., 38 p. (Accessed June 10, 2010, at http://www.angloamerican.co.uk/aa/investors/presentations/2009pres/barro_alto_visit/barro_alto_visit.pdf.)
Associação Brasileira do Alumínio, 2009a, Primary aluminum production grows by 0.4% in 2008: Sao Paulo, Brazil, Associação Brasileira do Alumínio, January, 1 p.
Associação Brasileira do Alumínio, 2009b, Primary aluminum production reaches 770.7 thousand ton in the first semester: Sao Paulo, Brazil, Associação Brasileira do Alumínio, July, 1 p.
Barrick Gold Corp., 2009, Beyond borders—A special report on Pascua Lama: Toronto, Ontario, Canada, Barrick Gold Corp., September, 31 p.
BP p.l.c., 2009, Statistical review of world energy: London, United Kingdom, BP p.l.c., June, 45 p.
Bray, E.L., 2010a, Aluminum: U.S. Geological Survey Mineral Commodity Summaries 2010, p. 16-17.
Bray, E.L., 2010b, Bauxite and alumina: U.S. Geological Survey Mineral Commodity Summaries 2010, p. 26-27.
Brazilian Resources, Inc., 2009, Management’s discussion and analysis of financial condition and results of operations in respect of the year ended December 31, 2008: Concord, New Hampshire, Brazilian Resources, Inc., 13 p.
Cameco Corp., [undated]a, Cigar Lake: Cameco Corp. (Accessed June 8, 2010, at http://www.cameco.com/mining/cigar_lake.)
Cameco Corp., [undated]b, Rabbit Lake: Cameco Corp. (Accessed June 8, 2010, at http://www.cam eco.com/mining/rabbit_lake.)
Canadian Mining Journal, 2008, Flow-through credit—Saskatchewan reintroduces program: Canadian Mining Journal, November 23. (Accessed November 24, 2008, at http://www.canadianminingjournal.com/issues/ISArticle.asp?id=92506&issue=11232008.)
Carlin, J.F., Jr., 2010, Tin: U.S. Geological Survey Mineral Commodity Summaries 2010, p. 170-171.
CBC News, 2008, N.B. government invests $3M in mineral exploration: Canadian Broadcasting Corp., Toronto, Ontario, Canada, April 7. (Accessed April 8, 2008, at http://www.cbc.ca/canada/new-brunswick/story/2008/04/07/mine-funding.html.)
Companhia Vale do Rio Doce, 2009, Annual report on Form 20-F for the fiscal year ended December 31, 2008: Rio de Janeiro, Brazil, Companhia Vale do Rio Doce, April 28, 167 p.

1.8 [ADVANCE RELEASE] u.s. geoLogicaL survey mineraLs yearbook—2008
Consolidated Thompson Iron Mines Ltd., 2010, Consolidated Thompson completes feasibility study to increase production from 8.0 to 16.0 million tonnes of iron ore concentrate per year at the Bloom Lake project: Toronto, Ontario, Canada, Consolidated Thompson Iron Mines Ltd. press release, May 19, 5 p.
Coons, Rebecca, 2008, Lithium—Charging up the hybrids: Chemical Week, July 22. (Accessed June 18, 2010, at http://www.britannica.com/bps/additionalcontent/18/33383820/Lithium.)
Departamento Nacional de Produção Mineral, 2009, Informe mineral—Desenvolvimento e Economia Mineral: Brasilia, Brazil, Primeiro Semestre 2009, v. 8, 45 p.
Diario Financiero, 2010, Ejecutivos de Minera Isla Riesco hablan sobre el avance del proyecto: MundoMaritimo Ltda., February 26. (Accessed June 8, 2010, at http://www.mundomaritimo.cl/noticias/ ejecutivos-de-minera-isla-riesco-hablan-sobre-el-avance-del-proyecto.)
Drummond Ltd., 2009, Drummond Ltd.: Primera Convención Nacional Minera, Bogota, Colombia, February 3-4, 2009, Presentation, 44 p. (Accessed June 8, 2010, at http://www.llanosoil.com/wp-content/uploads/2009/08/drummond-mine.pdf.)
Dumont, Michel, 2009, Iron ore, in Canadian minerals yearbook—2008 review and outlook: Ottawa, Ontario, Canada, Natural Resources Canada, p. 22.1-22.9.
Ecclestone, Christopher, 2008, Minefields in LatAm—Not everything that ticks goes “boom”!: Mineweb.com, August 7. (Accessed August 8, 2008, at http://www.mineweb.com/mineweb/view/mineweb/en/page67?oid=59031&sn=Detail.)
Edelstein, D.L., 2010, Copper: U.S. Geological Survey Mineral Commodity Summaries 2010, p. 48-49.
Engineering and Mining Journal, 2008, Mandate halts Ecuador projects until new mining law is in place: Engineering and Mining Journal, v. 209, no. 5, June, p. 4.
Foreign Affairs and International Trade Canada, 2009, Canada’s state of trade—Trade and investment update—2009: Ottawa, Ontario, Canada, Foreign Affairs and International Trade Canada, 110 p.
Geological Survey of Canada, 2010, GEM—Geo-mapping for energy and minerals: Ottawa, Canada, Natural Resources Canada, March 30. (Accessed July 28, 2010, at http://gsc.nrcan.gc.ca/gem/index_e.php.)
George, M.W., 2010, Gold: U.S. Geological Survey Mineral Commodity Summaries 2010, p. 66-67.
Guberman, D.E., 2010, Lead: U.S. Geological Survey Mineral Commodity Summaries 2010, p. 88-89.
Hill, Liezel, 2008, Ontario fast-tracks mining law revamp to bring much-needed clarity, “balance”—Minister: Creamer Media’s Mining Weekly, September 9. (Accessed September 9, 2008, at www.miningweekly.com/print_version.php?a_id=142695.)
International Monetary Fund, 2009, Regional economic outlook—Western Hemisphere: Washington, DC, International Monetary Fund, May, 79 p.
Jamaica Gleaner, 2008, Bauxite blow—Economic climate forces Windalco to send home 150 workers: Jamaica Gleaner, December 16. (Accessed June 11, 2010, at http://www.jamaica-gleaner.com/gleaner/20081216/lead.lead1.html.)
Jasinski, S.M., 2010, Potash: U.S. Geological Survey Mineral Commodity Summaries 2010, p. 122-123.
Jaskula, B.W., 2010, Lithium: U.S. Geological Survey Mineral Commodity Summaries 2010, p. 92-93.
Johnson Matthey Plc, 2010, Data tables for platinum: Johnson Matthey Plc. (Accessed June 19, 2010, at http://www.platinum.matthey.com/cgi-bin/graphing/jmpreset.pl?&act=Text+Display&metal=Pl&timeperiod=L5Y.)
Jordan, Pav, 2008, Chile’s new Gaby copper mine steps into the future: Thomson Reuters, May 21. (Accessed June 13, 2010, at http://uk.reuters.com/article/idUKN2133325020080521.)
Jorgenson, J.D., 2010, Iron ore: U.S. Geological Survey Mineral Commodity Summaries 2010, p. 78-79.
Kimberley Process, 2009, Annual global summary—2008 production, imports, exports and KPC counts: Kimberley Process, July 30, 1 p. (Accessed June 8, 2010, at https://kimberleyprocessstatistics.org/static/pdfs/AnnualTables/2008GlobalSummary.pdf.)
Kirwin, Susan, 2008, Ontario’s Mining Act under fire: Northern Miner, v. 94, no. 15, June 2-8, p. 1.
Kosich, Dorothy, 2008a, As BC government bans uranium prospecting, explorers seek clarification: Mineweb.com, April 28. (Accessed April 28, 2008, at http://www.mineweb.com/mineweb/view/mineweb/en/page38?oid=51829&sn=Detail.)
Kosich, Dorothy, 2008b, Ecuador takes control of more mining concessions, Petrobas oil field: Mineweb.com, September 23. (Accessed September 23, 2008, at http://www.mineweb.com/mineweb/view/mineweb/en/page66?oid=63115&sn=Detail.)
Kosich, Dorothy, 2008c, Labrador Inuit Lands uranium mining ban has immediate chilling effect on exploration: Mineweb.com, April 10. (Accessed April 10, 2008, at http://www.mineweb.com/mineweb/view/mineweb/en/page38?oid=50493&sn=Detail.)
Kosich, Dorothy, 2008d, New Brunswick suspends all mining claims activity, restricts uranium mining, exploration: Mineweb.com, July 7. (Accessed July 7, 2008, at http://www.mineweb.com/mineweb/view/mineweb/en/page66?oid=56260&sn=Detail.)
Kuck, P.H., 2010, Nickel: U.S. Geological Survey Mineral Commodity Summaries 2010, p. 108-109.
Loferski, P.J., 2010, Platinum-group metals: U.S. Geological Survey Mineral Commodity Summaries 2010, p. 120-121.
McMahon, Fred, and Cervantes, Miguel, 2009, Fraser Institute annual survey of mining companies 2008/2009: Vancouver, British Columbia, Canada, Fraser Institute, 92 p. (Accessed February 26, 2009, at http://www.fraserinstitute.org/researchandpublications/publications/6534.aspx.)
Metals Economics Group, 2008, Overview of 2008 worldwide exploration budgets—Locations, targets, and stages of development: Strategic Report, v. 21, no. 6, November/December, p. 7-15.
Mineweb, 2008, Protest generating Peruvian mining royalty distribution law signed: Mineweb.com, November 26. (Accessed November 26, 2008, at http://www.mineweb.com/mineweb/view/mineweb/en/page72068?oid=73813&sn=Detail.)
Natural Resources Canada, 2009a, Exploration and deposit appraisal expenditures, by junior and senior companies, by Province and Territory, 2005-2010: Ottawa, Ontario, Canada, Natural Resources Canada. (Accessed June 3, 2010, at http://mmsd.mms.nrcan.gc.ca/stat-stat/expl-expl/6-eng.aspx.)
Natural Resources Canada, 2009b, Exploration plus deposit appraisal expenditures, by Province and Territory, by mineral commodity sought, 2008: Ottawa, Ontario, Canada, Natural Resources Canada. (Accessed June 3, 2010, at http://mmsd.mms.nrcan.gc.ca/stat-stat/expl-expl/8-eng.aspx.)
Natural Resources Canada, 2009c, Total mineral resource development investments, 2007-2008: Ottawa, Ontario, Canada, Natural Resources Canada. (Accessed June 3, 2010, at http://mmsd.mms.nrcan.gc.ca/stat-stat/expl-expl/2-eng.aspx.)
Newmont Mining Corp., 2010a, Annual report 2009: Greenwood Village, Colorado, Newmont Mining Corp., 8 p.
Newmont Mining Corp., 2010b, Form 10-K for the fiscal year ended December 31, 2009: Washington, DC, U.S. Securities and Exchange Commission, 175 p.
Olson, D.W., 2010, Gemstones: U.S. Geological Survey Mineral Commodity Summaries 2010, p. 62-63.
Panagapko, Doug, 2009, Zinc, in Canadian minerals yearbook—2008 review and outlook: Ottawa, Ontario, Canada, Natural Resources Canada, p. 56.1-56.24.
Paranapanama S.A., 2010, Financial statements: Dias d’Avila, Brazil, Paranapanama S.A., 53 p.
Perron, Louis, 2009, Diamonds, in Canadian minerals yearbook—2008 review and outlook: Ottawa, Ontario, Canada, Natural Resources Canada, p. 17.1-17.19.
Rio Tinto plc, 2009, Form 20-F—Annual report for the financial year ended December 31, 2008: London, United Kingdom, Rio Tinto plc, April 2, 200 p.
Sergeant, Barry, 2009, Seaborne iron ore—The world’s quietest, greatest, franchise: Mineweb.com, June 5. (Accessed June 16, 2010, at http://www.mineweb.com/mineweb/view/mineweb/en/page39?oid=84442&sn=Detail.)
Shedd, K.B., 2010, Cobalt: U.S. Geological Survey Mineral Commodity Summaries 2010, p. 46-47.
Sherritt International Corp., 2009, Annual report 2008: Toronto, Ontario, Canada, Sherritt International Corp., 124 p.
Sociedad Quimica y Minera de Chile S.A., 2009, Annual report 08: Santiago, Chile, Sociedad Quimica y Minera de Chile S.A., 147 p.
Suggett, James, 2008, Venezuela halts mining in forest preserve, but renews permit discussions: Caracas, Venezuela, Venezuelanalysis.com, June 26. (Accessed January 30, 2009, at http://www.venezuelanalysis.com/print/3593.)
Tolcin, A.C., 2010, Zinc: U.S. Geological Survey Mineral Commodity Summaries 2010, p. 184-185.
United Nations, 2009, World economic situation and prospects 2009: New York, New York, United Nations, 19 p.
Latin america and canada—2008 [advance reLease] 1.9
United Nations Economic Commission for Latin America and the Caribbean, 2009a, Foreign Investment in Latin America and the Caribbean 2008: Santiago, Chile, United Nations Economic Commission for Latin America and the Caribbean, June, 143 p.
United Nations Economic Commission for Latin America and the Caribbean, 2009b, Latin America and the Caribbean in the world economy: Santiago, Chile, United Nations Economic Commission for Latin America and the Caribbean, December, 104 p.
United Nations Economic Commission for Latin America and the Caribbean and International Labor Organization, 2009, Crisis in the labour markets and countercyclical responses: New York, New York, United Nations Economic Commission for Latin America and the Caribbean and International Labor Organization bulletin no. 2, September, 20 p.
Votorantim Participações S.A., 2009, Annual report 2008: Sao Paulo, Brazil, Votorantim Participações S.A., 108 p.
World Nuclear Association, 2010, Uranium production figures—1999-2009: London, United Kingdom, World Nuclear Association, April, 2 p.
Xstrata plc, 2010, Annual report 2010: Zug, Switzerland, Xstrata plc, 228 p.

1.10 [ADVANCE RELEASE] u.s. geoLogicaL survey mineraLs yearbook—2008
TABLE 1THE AMERICAS: AREA AND POPULATION IN 2008
Area1 Estimated population2
Region and country (square kilometers) (thousands)North America:
Canada 9,984,670 33,311Mexico 1,964,375 106,350United States3 9,826,675 304,060
Total 21,775,720 443,721Central America and the Caribbean:
Antigua and Barbuda 443 86Aruba 193 105Bahamas, The 13,940 335Barbados 431 255Belize 22,966 310Bermuda 53 64Costa Rica 51,100 4,527Cuba 110,860 11,247Dominica 754 73Dominican Republic 48,730 9,838El Salvador 21,040 6,134Grenada 344 106Guadeloupe 1,780 448Guatemala 108,890 13,676Haiti 27,750 9,780Honduras 112,090 7,242Jamaica 10,991 2,689Martinique 1,100 402Montserrat 102 5,100 1
Netherlands Antilles 960 194Nicaragua 129,494 5,678Panama 78,200 3,395Saint Kitts and Nevis 261 49Saint Lucia 616 170Saint Vincent and the Grenadines 389 109Trinidad and Tobago 5,128 1,338Other4 17,154 4,187
Total 765,759 87,537South America:
Argentina 2,780,400 39,876Bolivia 1,098,580 9,684Brazil 8,514,875 191,972Chile 756,950 16,758Colombia 1,138,915 44,534Ecuador 283,560 13,479French Guiana 83,534 222Guyana 214,970 763Paraguay 406,750 6,227Peru 1,285,215 28,837Suriname 163,820 515Uruguay 176,215 3,334Venezuela 912,050 27,943
Total 17,815,834 384,144Americas total 40,357,313 915,402World total 148,940,000 6,692,0301Source: U.S. Central Intelligence Agency, The World Factbook 2009.2Source: The World Bank, 2008 World Development Indicators Database.3Excludes Puerto Rico and U.S. Virgin Islands4Includes Anguilla, British Virgin Islands, Cayman Islands, Puerto Rico, Turks and Caicos Islands, and U.S. Virgin Islands.
Latin america and canada—2008 [advance reLease] 1.11
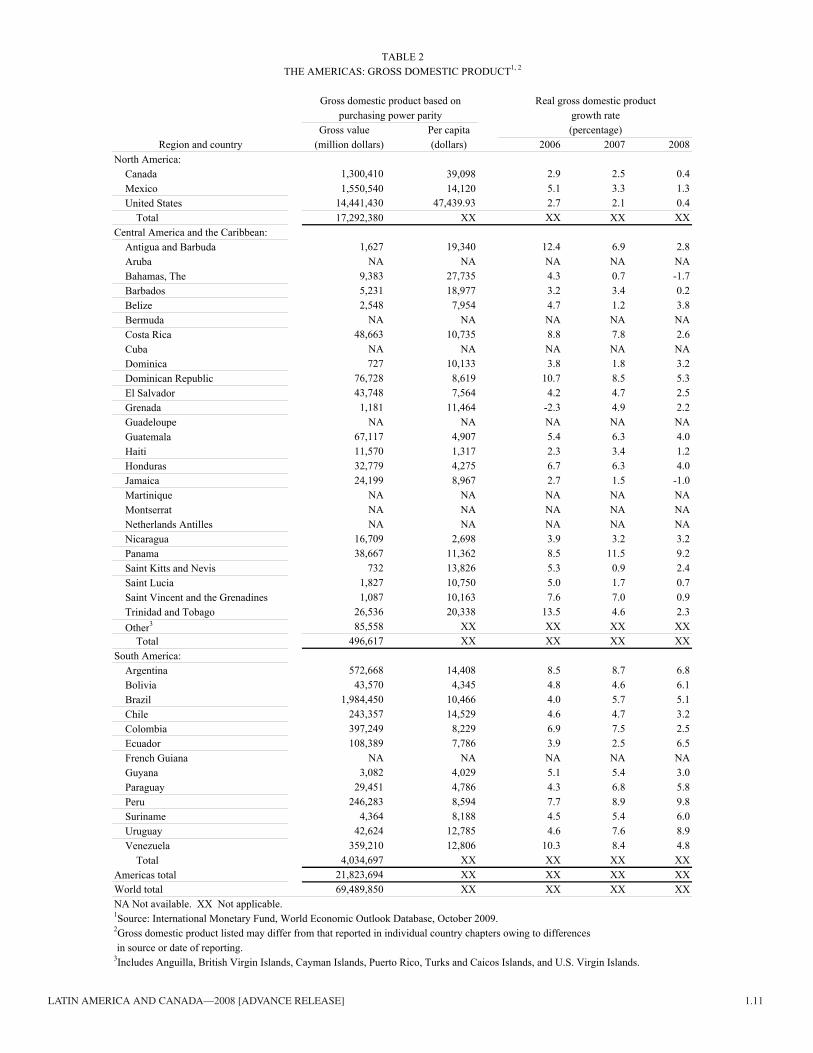
TABLE 2THE AMERICAS: GROSS DOMESTIC PRODUCT1, 2
Gross domestic product based on Real gross domestic productpurchasing power parity growth rate
Gross value Per capita (percentage)Region and country (million dollars) (dollars) 2006 2007 2008
North America:Canada 1,300,410 39,098 2.9 2.5 0.4Mexico 1,550,540 14,120 5.1 3.3 1.3United States 14,441,430 47,439.93 2.7 2.1 0.4
Total 17,292,380 XX XX XX XXCentral America and the Caribbean:
Antigua and Barbuda 1,627 19,340 12.4 6.9 2.8Aruba NA NA NA NA NABahamas, The 9,383 27,735 4.3 0.7 -1.7Barbados 5,231 18,977 3.2 3.4 0.2Belize 2,548 7,954 4.7 1.2 3.8Bermuda NA NA NA NA NACosta Rica 48,663 10,735 8.8 7.8 2.6Cuba NA NA NA NA NADominica 727 10,133 3.8 1.8 3.2Dominican Republic 76,728 8,619 10.7 8.5 5.3El Salvador 43,748 7,564 4.2 4.7 2.5Grenada 1,181 11,464 -2.3 4.9 2.2Guadeloupe NA NA NA NA NAGuatemala 67,117 4,907 5.4 6.3 4.0Haiti 11,570 1,317 2.3 3.4 1.2Honduras 32,779 4,275 6.7 6.3 4.0Jamaica 24,199 8,967 2.7 1.5 -1.0Martinique NA NA NA NA NAMontserrat NA NA NA NA NANetherlands Antilles NA NA NA NA NANicaragua 16,709 2,698 3.9 3.2 3.2Panama 38,667 11,362 8.5 11.5 9.2Saint Kitts and Nevis 732 13,826 5.3 0.9 2.4Saint Lucia 1,827 10,750 5.0 1.7 0.7Saint Vincent and the Grenadines 1,087 10,163 7.6 7.0 0.9Trinidad and Tobago 26,536 20,338 13.5 4.6 2.3Other3 85,558 XX XX XX XX
Total 496,617 XX XX XX XXSouth America:
Argentina 572,668 14,408 8.5 8.7 6.8Bolivia 43,570 4,345 4.8 4.6 6.1Brazil 1,984,450 10,466 4.0 5.7 5.1Chile 243,357 14,529 4.6 4.7 3.2Colombia 397,249 8,229 6.9 7.5 2.5Ecuador 108,389 7,786 3.9 2.5 6.5French Guiana NA NA NA NA NAGuyana 3,082 4,029 5.1 5.4 3.0Paraguay 29,451 4,786 4.3 6.8 5.8Peru 246,283 8,594 7.7 8.9 9.8Suriname 4,364 8,188 4.5 5.4 6.0Uruguay 42,624 12,785 4.6 7.6 8.9Venezuela 359,210 12,806 10.3 8.4 4.8
Total 4,034,697 XX XX XX XXAmericas total 21,823,694 XX XX XX XXWorld total 69,489,850 XX XX XX XXNA Not available. XX Not applicable.1Source: International Monetary Fund, World Economic Outlook Database, October 2009.2Gross domestic product listed may differ from that reported in individual country chapters owing to differences in source or date of reporting.3Includes Anguilla, British Virgin Islands, Cayman Islands, Puerto Rico, Turks and Caicos Islands, and U.S. Virgin Islands.
1.12 [ADVANCE RELEASE] u.s. geoLogicaL survey mineraLs yearbook—2008
Loca
tion
Type
2Si
teC
omm
odity
Com
pany
Res
ourc
e3Ex
plor
atio
n4
TAB
LE 3
SELE
CTE
D S
IGN
IFIC
AN
T LA
TIN
AM
ERIC
A A
ND
CA
NA
DA
EX
PLO
RA
TIO
N IN
200
81
Arg
entin
aE
Cer
ro N
egro
Au,
Ag
And
ean
Res
ourc
es L
td.
1.5
Moz
Au,
17.
3 M
oz A
gEx
tens
ive
wor
k pr
ogra
m.
Do.
PC
erro
Van
guar
dia
Au,
Ag
Ang
logo
ld A
shan
ti Lt
d.3.
1 M
oz A
u, 5
5.9
Moz
Ag
Exte
nsiv
e dr
illin
g.B
razi
lP
Cor
rego
do
Sitio
Au
Do.
1.47
Moz
Au
Do.
Do.
DLa
meg
oA
uD
o.D
ata
not r
elea
sed
Do.
Can
ada
EA
fton
Cu,
Au
Aba
cus M
inin
g an
d Ex
plor
atio
n C
orp.
1.1
Mt C
u, 2
.3 M
oz A
uEx
tens
ive
drill
ing.
Do.
EB
erg
Cu,
Mo,
Ag
Terr
ane
Met
als C
orp.
1.1
Mt C
u, 1
36,0
00 t
Mo,
25.
4 M
oz A
gD
o.D
o.F
Blo
om L
ake
Iron
ore
Con
sol.
Thom
pson
Iron
Min
es L
td.
190
Mt F
eEx
tens
ive
wor
k pr
ogra
m.
Do.
EC
entra
l Min
eral
Bel
tU
, VC
ross
hair
Expl
orat
ion
& M
inin
g C
orp.
3,40
0 t U
3O8,
5,30
0 t V
2O5
Do.
Do.
Do.
Do.
Do.
F E E F
Det
our L
ake
Eleo
nore
Foxt
rot
Gah
cho
Kue
Au
Au
Dia
mon
dD
iam
ond
Det
our G
old
Cor
p.G
oldc
orp
Inc.
Stor
now
ay D
iam
ond
Cor
p.D
e B
eers
Can
ada
Expl
orat
ion
Inc.
10.8
Moz
Au
2.5
Moz
Au
6.96
Mca
rat d
iam
ond
23.6
Mca
rat d
iam
ond
Exte
nsiv
e dr
illin
g.Ex
tens
ive
wor
k pr
ogra
m.
Exte
nsiv
e dr
illin
g.D
o.D
o.D
o.D
o.D
o.
F E E E
Hid
den
Bay
Joan
naK
err-
Sulp
hure
tsK
wan
ika
U Au
Au,
Cu
Au,
Cu
Cam
eco
Cor
p.A
uriz
on M
ines
Ltd
.Se
abrid
ge G
old
Inc.
Sere
nget
i Res
ourc
es In
c.
8,50
0 t U
3O8
438,
000
oz A
u19
.7 M
oz A
u, 2
.4 M
t Cu
Dat
a no
t rel
ease
d
Do.
Do.
Exte
nsiv
e w
ork
prog
ram
.D
o.D
o.D
o.D
o.D
o.
E E E F
Lalo
r Lak
eLa
rder
Lak
eM
agus
i Riv
erM
alar
tic
Zn, C
u, A
u, A
gA
uC
u, Z
n, A
u, A
gA
u
Hud
Bay
Min
eral
s Inc
.B
ear L
ake
Gol
d Lt
d.G
lobe
x M
inin
g En
terp
rises
Inc.
Osi
sko
Min
ing
Cor
p.
300,
000
t Zn,
24,
000
t Cu,
210
,000
oz
Au,
2.2
Moz
Ag
Dat
a no
t rel
ease
d27
,600
t C
u, 4
3,10
0 t Z
n, 4
9,80
0 oz
Au,
1.8
Moz
Ag
7.7
Moz
Au
Do.
Exte
nsiv
e dr
illin
g.D
o.Ex
tens
ive
wor
k pr
ogra
m.
Do.
Do.
Do.
Do.
E E E E
Mat
oush
Mel
iadi
ne W
est
Mid
wes
t Nor
thea
stN
ew B
ritan
nia
U Au
U Au
Stra
teco
Res
ourc
es In
c.C
omap
lex
Min
eral
s Cor
p.H
atho
r Exp
lora
tion
Ltd.
Gar
son
Gol
d C
orp.
1,70
0 t U
3O8
1.8
Moz
Au
Dat
a no
t rel
ease
d44
9,00
0 oz
Au
Exte
nsiv
e dr
illin
g.D
o.D
o.D
o.D
o.E
Nun
avik
Nic
kel
Ni,
Cu,
Co,
PG
E, A
uC
anad
ian
Roy
altie
s Inc
.16
2,00
0 t N
i, 19
8,00
0 t C
u, 8
,700
t C
o,Ex
tens
ive
wor
k pr
ogra
m.
1.5
Moz
PG
M, 8
4,00
0 oz
Au
Do.
ER
ambl
erC
u, A
u, A
g, Z
nR
ambl
er M
etal
s and
Min
ing
plc.
184,
000
t Cu,
97,
500
oz A
u, 6
88,0
00 o
z A
g, 6
,700
t Zn
Exte
nsiv
e dr
illin
g.D
o.E
Roc
he B
ayIr
on o
reA
dvan
ced
Expl
orat
ions
Inc.
Dat
a no
t rel
ease
dD
o.D
o.E
Rud
dock
Cre
ekZn
, Pb
Selk
irk M
etal
s Cor
p.D
ata
not r
elea
sed
Do.
Do.
ESi
sson
Bro
okW
, Mo
Geo
dex
Min
eral
s Ltd
.14
9,00
0 t W
O3,
49,0
00 t
Mo
Do.
Do.
EY
oung
-Dav
idso
nA
uN
orth
gate
Min
eral
s Cor
p.3.
3 M
oz A
uD
o.C
hile
EA
poqu
inda
Cu
Apo
quin
do R
esou
rces
Inc.
200,
000
t Cu
Do.
Do.
EEl
Esp
ino
Au,
Cu
Expl
orat
or R
esou
rce
Inc.
282,
000
oz A
u, 1
42,0
00 t
Cu
Do.
Do.
PEs
cond
ida
Cu
BH
P B
illito
n Lt
d.34
Mt C
uD
o.D
o.E
Pan
de A
zuca
rC
u, A
u, A
g, M
oC
ente
nario
Cop
per C
orp.
168,
000
t Cu,
230
,000
oz
Au,
2.4
Moz
Ag,
3,9
00 t
Mo
Exte
nsiv
e w
ork
prog
ram
.D
o.E
Pelu
saC
uD
o.16
0,00
0 t C
uEx
tens
ive
drill
ing.
Do.
PZa
ldiv
arC
uB
arric
k G
old
Cor
p.3.
1 M
oz A
uEx
tens
ive
wor
k pr
ogra
m.
Col
ombi
aF
Ang
ostu
raA
u, A
gG
reys
tar R
esou
rces
Ltd
.11
.6 M
oz A
u, 6
1.7
Moz
Ag
Exte
nsiv
e dr
illin
g.D
o.E
Gra
mal
ote
Au
B2G
old
Cor
p.2.
4 M
oz A
u (in
ferr
ed)
Do.
Mex
ico
EC
amin
o R
ojo
Au,
Ag,
Zn,
Pb
Can
plat
s Res
ourc
es C
orp.
3.5
Moz
Au,
60.
7 M
oz A
g, 6
00,0
00 t
Zn, 3
10,0
00 t
PbD
o.D
o.E
Juan
icip
ioA
g, A
u, P
b, Z
nM
ag S
ilver
Cor
p.23
7 M
oz A
g, 4
80,0
00 o
z A
u, 1
69,0
00 t
Pb,
Do.
288,
000
t Zn
(infe
rred
)Se
e fo
otno
tes a
t end
of t
able
.
Latin america and canada—2008 [advance reLease] 1.13
TAB
LE 3
—C
ontin
ued
1SE
LEC
TED
SIG
NIF
ICA
NT
LATI
N A
MER
ICA
AN
D C
AN
AD
A E
XPL
OR
ATI
ON
IN 2
008
23
4Lo
catio
nTy
peSi
teC
omm
odity
Com
pany
Res
ourc
eEx
plor
atio
nN
icar
agua
FO
rosi
Au
Cen
tral S
un M
inin
g C
orp.
709,
000
oz A
uEx
tens
ive
drill
ing.
Peru
ELa
Gra
nja
Cu,
Zn
Rio
Tin
to p
lc14
.1 M
t Cu,
2.8
Mt Z
nD
o.D
o.P
Tint
aya
Cu,
Au,
Mo,
Ag
Xst
rata
plc
3.7
Mt C
u, 2
Moz
Au,
26,
300
t Mo,
31.
4 M
oz A
gD
o.1 A
bbre
viat
ions
use
d in
this
tabl
e fo
r com
mod
ities
are
as f
ollo
ws:
Au,
gol
d; A
g, si
lver
; Co,
cob
alt;
Cu,
cop
per;
Mo,
mol
ybde
num
; Ni,
nick
el; P
b, le
ad; P
GE,
pla
tinum
-gro
up e
lem
ents
; U, u
rani
um;
V, v
anad
ium
; and
Zn,
zin
c. A
bbre
viat
ions
use
d in
this
tabl
e fo
r uni
ts o
f mea
sure
men
t are
as f
ollo
ws:
Mca
rat,
mill
ion
cara
ts; M
oz, m
illio
n tro
y ou
nces
; Mt,
mill
ion
met
ric to
ns; o
z, tr
oy o
unce
s; t,
met
ric to
ns.
2 D—
App
rove
d fo
r dev
elop
men
t; E—
Act
ive
expl
orat
ion;
F—
Feas
ibili
ty w
ork
ongo
ing/
com
plet
ed; P
—Ex
plor
atio
n at
pro
duci
ng si
te.
3 Bas
ed o
n 20
08 d
ata
repo
rted
from
var
ious
sour
ces,
reso
urce
val
ues r
efle
ct m
easu
red
+ in
dica
ted
reso
urce
s, un
less
oth
erw
ise
repo
rted.
Dat
a no
t ver
ified
by
the
U.S
. Geo
logi
cal S
urve
y.4 Si
gnifi
canc
e of
act
ivity
def
ined
by
eith
er q
uant
ity o
f dril
ling
or in
vest
men
t exp
endi
ture
for e
xplo
ratio
n w
ork
prog
ram
.
1.14 [ADVANCE RELEASE] u.s. geoLogicaL survey mineraLs yearbook—2008
C
oppe
r,
Nic
kel,
Met
als
TAB
LE 4
LATI
N A
MER
ICA
AN
D C
AN
AD
A: P
RO
DU
CTI
ON
OF
SELE
CTE
D M
INER
AL
CO
MM
OD
ITIE
S IN
200
81
(Tho
usan
d m
etric
tons
unl
ess o
ther
wis
e sp
ecifi
ed)
Silv
er,
Ti
n, m
ine
m
ine
Gol
d,
Lead
, min
e
min
em
ine
outp
ut,
ou
tput
,A
lum
inum
Iron
and
stee
l
M
etal
,
out
put,
Au
cont
ent
Iron
ore
,
outp
ut,
ou
tput
, A
g co
nten
t
Sn c
onte
ntC
ount
ryB
auxi
tepr
imar
yC
u co
nten
t(k
ilogr
ams)
gros
s wei
ght
Stee
l, cr
ude
Pb c
onte
ntN
i con
tent
(met
ric to
ns)
(met
ric to
ns)
Arg
entin
a--
394
157
42,0
46--
5,54
321
--35
6--
Bol
ivia
----
18,
405
----
82--
1,11
417
,319
Bra
zilp
28,0
981,
895
220
48,3
7335
1,67
733
,716
2554
3713
,000
Chi
le--
--5,
330
39,1
629,
316
1,56
0e
4--
1,40
5--
Col
ombi
a--
--2
e13
,411
475
1,12
5--
649
--C
osta
Ric
a--
----
198
----
----
----
Cub
a--
----
----
274
--67
----
Dom
inic
an R
epub
licN
A--
----
--60
e--
NA
----
Ecua
dore
----
--80
0--
85--
--(2
)--
El S
alva
dor
----
----
--72
e--
----
--Fr
ench
Gui
ana
----
--2,
000
e--
----
----
--G
uate
mal
ae--
----
7,50
030
250
(2)
--10
0--
Guy
ana
2,09
8--
--8,
131
----
----
----
Hon
dura
s--
--(2
)e
2,56
1--
--3
--12
--Ja
mai
ca14
,363
----
----
----
----
--M
exic
o--
--26
950
,817
11,6
8817
,230
141
--3,
236
NA
Nic
arag
ua--
----
3,40
0e
----
----
3e
--Pa
nam
a--
----
----
----
----
--Pa
ragu
ay--
----
----
130
----
----
Peru
p--
--1,
268
179,
870
7,82
375
0e
345
--3,
686
39,0
37Su
rinam
e5,
230
e--
--10
,300
e--
----
----
--Tr
inid
ad a
nd T
obag
o--
----
----
675
e--
----
--U
rugu
ay--
----
2,18
216
70--
----
--V
enez
uela
e5,
500
610
--10
,100
23,0
005,
000
--20
----
Oth
e r3
----
--5
e--
----
----
--To
tal
55,3
002,
900
7,25
042
9,00
040
4,00
066
,500
621
206
9,96
069
,400
Shar
e of
wor
ld to
tal
26%
7%47
%22
%18
%5%
16%
8%46
%27
%C
anad
ap--
3,12
060
795
,044
31,2
7315
,130
7926
072
8--
Shar
e of
wor
ld to
tal
--8%
4%5%
1%1%
2%10
%3%
--U
nite
d St
ates
NA
2,66
01,
310
233,
000
53,6
0091
,900
410
--1,
260
--Sh
are
of w
orld
tota
lN
A7%
8%12
%2%
7%10
%--
6%--
Tota
l Wes
tern
Hem
isph
ere
55,3
008,
680
9,16
075
8,00
048
9,00
017
4,00
01,
110
465
11,9
0069
,400
Shar
e of
wor
ld to
tal
26%
22%
59%
38%
22%
13%
28%
18%
56%
27%
Wor
ld to
tal
213,
000
39,6
0015
,500
1,97
0,00
02,
210,
000
1,33
0,00
03,
980
2,54
021
,500
256,
000
See
foot
note
s at e
nd o
f tab
le.
Latin america and canada—2008 [advance reLease] 1.15
TAB
LE 4
—C
ontin
ued
LATI
N A
MER
ICA
AN
D C
AN
AD
A: P
RO
DU
CTI
ON
OF
SELE
CTE
D M
INER
AL
CO
MM
OD
ITIE
S IN
200
81
(Tho
usan
d m
etric
tons
unl
ess o
ther
wis
e sp
ecifi
ed)
Min
eral
fuel
s and
rela
ted
mat
eria
ls
Met
als—
Cru
de,
Con
tinue
d
incl
udin
g
R
efin
ery
Zi
nc, m
ine
Dry
Plan
t liq
uids
cond
ensa
te
p
rodu
cts
ou
tput
,Ph
osph
ate
(mill
ion
(thou
sand
(t
hous
and
(thou
sand
Zn
con
tent
Cem
ent,
rock
, P2O
5
Coa
l,
c
ubic
42-g
allo
n
42-
gallo
n42
-gal
lon
Petro
leum
Nat
ural
gas
Indu
stria
l min
eral
s
Cou
ntry
(met
ric to
ns)
hydr
aulic
Gyp
sum
c
onte
ntSa
ltal
l gra
des
met
ers)
bar
rels
)
ba
rrel
s)
b
arre
ls)
Arg
entin
a30
,349
9,70
31,
257
--1,
681
208
44,1
00--
229,
723
140,
900
Bol
ivia
383,
618
1,98
55
--45
e--
14,8
95p
4,80
0e
14,2
33p
11,0
00p
Bra
zilp
173,
933
46,5
001,
923
2,24
27,
020
6,73
218
,941
4,90
487
6,00
072
5,62
0C
hile
40,5
194,
622
774
7e
6,43
153
41,
828
3,50
0e
966
82,5
73C
olom
bia
--10
,456
200
8e
221
73,5
005,
023
8,57
721
4,62
088
,149
Cos
ta R
ica
--2,
500
----
NA
----
----
4,90
0e
Cub
a--
1,70
7--
--15
7--
1,16
1--
19,3
6610
,112
Dom
inic
an R
e pub
lice
--4,
000
350
--50
----
----
12,0
00Ec
uado
r--
5,49
3--
----
--68
030
0e
184,
746
53,0
93El
Sal
vado
re--
1,30
06
--30
----
----
6,20
0Fr
ench
Gui
ana
--62
e--
----
----
----
--G
uate
mal
ae--
2,50
050
0--
50--
(2)
--4,
500
--G
uyan
a--
----
----
----
----
--H
ondu
rase
7,70
01,
800
6--
40--
----
----
Jam
aica
--72
523
8--
19e
----
----
299,
000
e
Mex
ico
453,
588
40,1
115,
135
291
8,80
915
,894
35,7
7213
3,59
01,
019,
080
476,
655
Nic
ara g
uae
--53
040
--30
----
----
5,20
0Pa
nam
ae--
1,05
0--
--18
----
----
--Pa
ragu
aye
--60
05
----
----
----
2,66
0Pe
rup
1,60
2,59
76,
862
495
171,
276
136
1,75
012
,236
28,0
2763
,201
Surin
ame
--65
e--
----
----
--5,
400
e2,
325
Trin
idad
and
Tob
a goe
--80
0--
----
--N
A12
,500
45,0
0055
,000
Uru
guay
e--
620
1,15
0--
----
----
--15
,300
Ven
ezue
lae
--11
,000
711
535
07,
457
428
,500
78,5
0092
0,00
043
4,00
0O
the r
3--
1,04
0--
--1,
773
--12
e--
365
169,
800
Tota
l2,
690,
000
156,
000
12,1
002,
680
28,0
0010
4,00
015
3,00
025
9,00
03,
560,
000
2,66
0,00
0Sh
are
of w
orld
tota
l24
%6%
9%5%
11%
2%5%
10%
13%
9%C
anad
ap67
8,17
713
,672
5,74
021
0e
14,3
8667
,749
157,
949
172,
200
1,00
4,00
074
5,00
0e
Shar
e of
wor
ld to
tal
6%(2
)4%
(2)
6%1%
5%7%
4%2%
Uni
ted
Stat
es77
8,00
087
,600
17,9
008,
590
47,3
001,
060,
000
577,
000
689,
000
1,94
0,00
06,
620,
000
Shar
e of
wor
ld to
tal
7%3%
13%
17%
3%16
%19
%28
%7%
22%
Tota
l Wes
tern
Hem
isph
ere
4,15
0,00
025
7,00
035
,700
11,5
0089
,700
1,24
0,00
088
8,00
01,
120,
000
6,50
0,00
010
,000
,000
Shar
e of
wor
ld to
tal
37%
9%25
%23
%36
%18
%30
%45
%23
%33
%W
orld
tota
l11
,300
,000
2,84
0,00
014
2,00
050
,300
256,
000
6,68
0,00
02,
990,
000
2,49
0,00
027
,700
,000
30,2
00,0
00Se
e fo
otno
tes a
t end
of t
able
.
1.16 [ADVANCE RELEASE] u.s. geoLogicaL survey mineraLs yearbook—2008
p
1
Prel
imin
ary.
NA
Not
ava
ilabl
e. -
- Zer
o or
zer
o pe
rcen
t.of
June
21,
201
0.
TAB
LE 4
—C
ontin
ued
LATI
N A
MER
ICA
AN
D C
AN
AD
A: P
RO
DU
CTI
ON
OF
SELE
CTE
D M
INER
AL
CO
MM
OD
ITIE
S IN
200
8
Tota
ls m
ay n
ot a
dd d
ue to
inde
pend
ent r
ound
ing.
Per
cent
ages
are
cal
cula
ted
on u
nrou
nded
dat
a. T
able
incl
udes
dat
a av
aila
ble
as
Estim
ated
; est
imat
ed d
ata,
U.S
. dat
a, a
nd w
orld
tota
ls a
re ro
unde
d to
no
mor
e th
an th
ree
sign
ifica
nt d
igits
.
Incl
udes
Aru
ba, B
arba
dos,
Bel
ize,
Gua
delo
upe,
Hai
ti, M
artin
ique
, and
the
Net
herla
nds A
ntill
es.
1 2 Less
than
1/2
uni
t.3 4 R
epor
ted
figur
e.
e
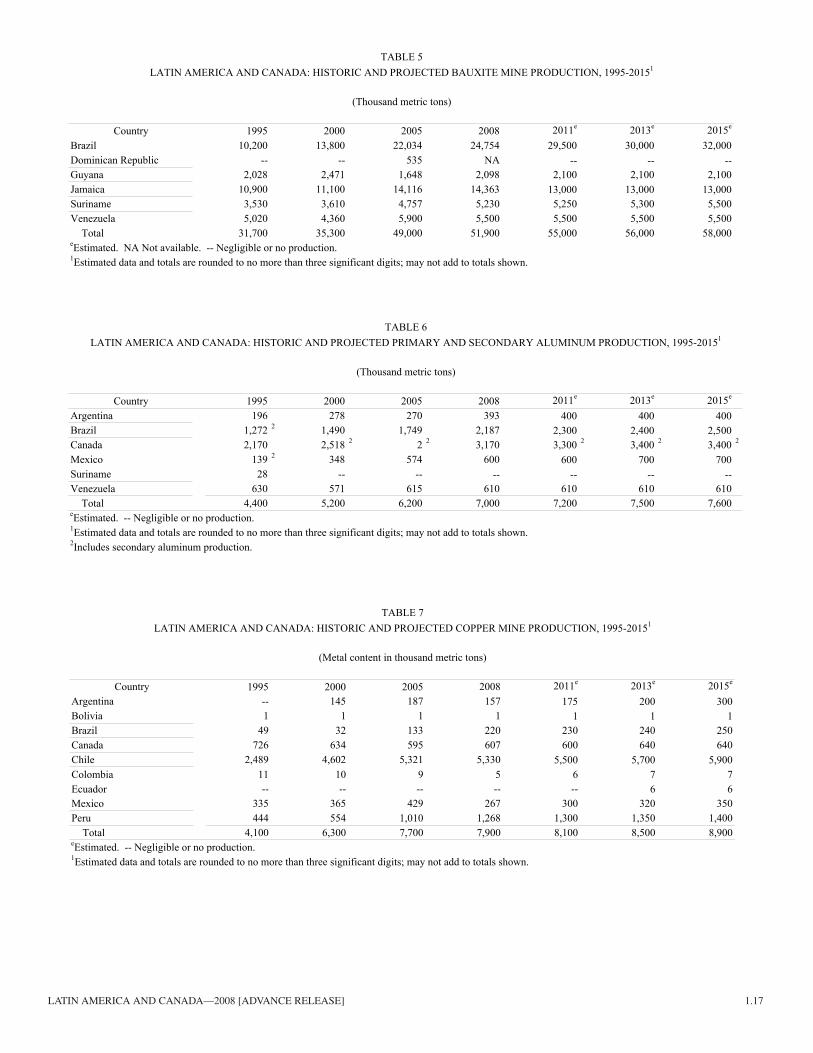
Latin america and canada—2008 [advance reLease] 1.17
TABLE 5LATIN AMERICA AND CANADA: HISTORIC AND PROJECTED BAUXITE MINE PRODUCTION, 1995-20151
(Thousand metric tons)
Country 1995 2000 2005 2008 2011e 2013e 2015e
Brazil 10,200 13,800 22,034 24,754 29,500 30,000 32,000Dominican Republic -- -- 535 NA -- -- --Guyana 2,028 2,471 1,648 2,098 2,100 2,100 2,100Jamaica 10,900 11,100 14,116 14,363 13,000 13,000 13,000Suriname 3,530 3,610 4,757 5,230 5,250 5,300 5,500Venezuela 5,020 4,360 5,900 5,500 5,500 5,500 5,500
Total 31,700 35,300 49,000 51,900 55,000 56,000 58,000eEstimated. NA Not available. -- Negligible or no production.1Estimated data and totals are rounded to no more than three significant digits; may not add to totals shown.
TABLE 6LATIN AMERICA AND CANADA: HISTORIC AND PROJECTED PRIMARY AND SECONDARY ALUMINUM PRODUCTION, 1995-20151
(Thousand metric tons)
e e eCountry 1995 2000 2005 2008 2011 2013 2015Argentina 196 278 270 393 400 400 400Brazil 1,272 2 1,490 1,749 2,187 2,300 2,400 2,500Canada 2,170 2,518 2 2 2 3,170 3,300 2 3,400 2 3,400 2
Mexico 139 2 348 574 600 600 700 700Suriname 28 -- -- -- -- -- --Venezuela 630 571 615 610 610 610 610
Total 4,400 5,200 6,200 7,000 7,200 7,500 7,600eEstimated. -- Negligible or no production.1Estimated data and totals are rounded to no more than three significant digits; may not add to totals shown. 2Includes secondary aluminum production.
TABLE 7LATIN AMERICA AND CANADA: HISTORIC AND PROJECTED COPPER MINE PRODUCTION, 1995-20151
(Metal content in thousand metric tons)
Country 1995 2000 2005 2008 2011e 2013e 2015e
Argentina -- 145 187 157 175 200 300Bolivia 1 1 1 1 1 1 1Brazil 49 32 133 220 230 240 250Canada 726 634 595 607 600 640 640Chile 2,489 4,602 5,321 5,330 5,500 5,700 5,900ColombiaEcuador
11--
10--
9--
5--
6--
76
76
Mexico 335 365 429 267 300 320 350Peru 444 554 1,010 1,268 1,300 1,350 1,400
Total 4,100 6,300 7,700 7,900 8,100 8,500 8,900eEstimated. -- Negligible or no production.1Estimated data and totals are rounded to no more than three significant digits; may not add to totals shown.
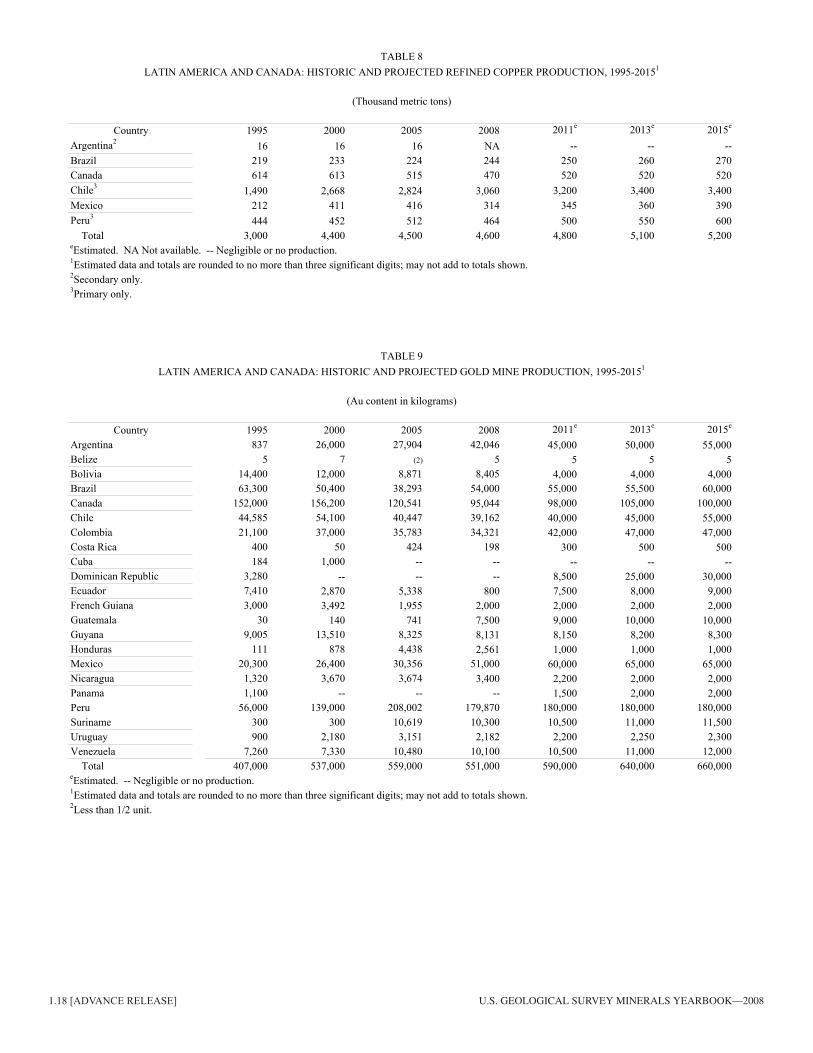
1.18 [ADVANCE RELEASE] u.s. geoLogicaL survey mineraLs yearbook—2008
TABLE 8LATIN AMERICA AND CANADA: HISTORIC AND PROJECTED REFINED COPPER PRODUCTION, 1995-20151
(Thousand metric tons)
e e eCountry 1995 2000 2005 2008 2011 2013 20152Argentina 16 16 16 NA -- -- --
Brazil 219 233 224 244 250 260 270Canada 614 613 515 470 520 520 520
3Chile 1,490 2,668 2,824 3,060 3,200 3,400 3,400Mexico 212 411 416 314 345 360 390
3Peru 444 452 512 464 500 550 600Total 3,000 4,400 4,500 4,600 4,800 5,100 5,200
eEstimated. NA Not available. -- Negligible or no production.1Estimated data and totals are rounded to no more than three significant digits; may not add to totals shown.2Secondary only.3Primary only.
TABLE 91LATIN AMERICA AND CANADA: HISTORIC AND PROJECTED GOLD MINE PRODUCTION, 1995-2015
(Au content in kilograms)
Country 1995 2000 2005 2008 2011e 2013e 2015e
Argentina 837 26,000 27,904 42,046 45,000 50,000 55,000BelizeBolivia
514,400
712,000
(2)
8,8715
8,4055
4,0005
4,0005
4,000Brazil 63,300 50,400 38,293 54,000 55,000 55,500 60,000CanadaChile
152,00044,585
156,20054,100
120,54140,447
95,04439,162
98,000 105,000 100,000
Colombia 21,100 37,000 35,783 34,32140,00042,000
45,00047,000
55,00047,000
Costa Rica 400 50 424 198 300 500 500CubaDominican Republic
1843,280
1,000--
----
----
--8,500
--25,000
--30,000
Ecuador 7,410 2,870 5,338 800 7,500 8,000 9,000French GuianaGuatemala
3,00030
3,492140
1,955741
2,0007,500
2,0009,000
2,00010,000
2,00010,000
Guyana 9,005 13,510 8,325 8,131 8,150 8,200 8,300HondurasMexico
11120,300
87826,400
4,43830,356
2,56151,000
1,00060,000
1,00065,000
1,00065,000
Nicaragua 1,320 3,670 3,674 3,400 2,200 2,000 2,000PanamaPeru
1,10056,000
--139,000
--208,002
--179,870
1,500180,000
2,000180,000
2,000180,000
Suriname 300 300 10,619 10,300 10,500 11,000 11,500Uruguay 900 2,180 3,151 2,182 2,200 2,250 2,300Venezuela 7,260 7,330 10,480 10,100 10,500 11,000 12,000
Total 407,000 537,000 559,000 551,000 590,000 640,000 660,000eEstimated. -- Negligible or no production.1
2Less than 1/2 unit.Estimated data and totals are rounded to no more than three significant digits; may not add to totals shown.
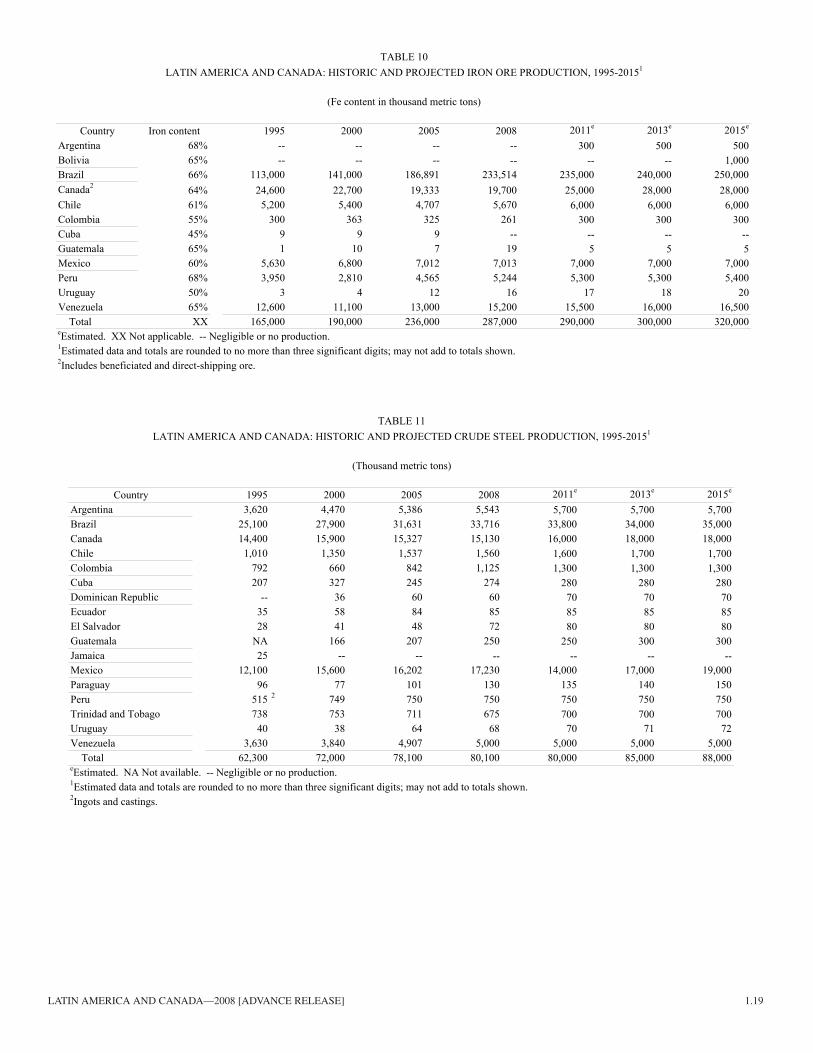
Latin america and canada—2008 [advance reLease] 1.19
e
0--0000
0
70
TABLE 10LATIN AMERICA AND CANADA: HISTORIC AND PROJECTED IRON ORE PRODUCTION, 1995-20151
(Fe content in thousand metric tons)
Country Iron content 1995 2000 2005 2008 2011 2013e 2015e
Argentina 68% -- -- -- -- 30 500 500Bolivia 65% -- -- -- -- -- 1,000Brazil 66% 113,000 141,000 186,891 233,514 235,00 240,000 250,000Canada2 64% 24,600 22,700 19,333 19,700 25,00 28,000 28,000Chile 61% 5,200 5,400 4,707 5,670 6,00 6,000 6,000Colombia 55% 300 363 325 261 30 300 300Cuba 45% 9 9 9 -- -- -- --Guatemala 65% 1 10 7 19 5 5 5Mexico 60% 5,630 6,800 7,012 7,013 7,00 7,000 7,000Peru 68% 3,950 2,810 4,565 5,244 5,300 5,300 5,400Uruguay 50% 3 4 12 16 1 18 20Venezuela 65% 12,600 11,100 13,000 15,200 15,50 16,000 16,500
Total XX 165,000 190,000 236,000 287,000 290,000 300,000 320,000eEstimated. XX Not applicable. -- Negligible or no production.1Estimated data and totals are rounded to no more than three significant digits; may not add to totals shown.2Includes beneficiated and direct-shipping ore.
TABLE 11LATIN AMERICA AND CANADA: HISTORIC AND PROJECTED CRUDE STEEL PRODUCTION, 1995-20151
(Thousand metric tons)
e e eCountry 1995 2000 2005 2008 2011 2013 2015Argentina 3,620 4,470 5,386 5,543 5,700 5,700 5,700Brazil 25,100 27,900 31,631 33,716 33,800 34,000 35,000Canada 14,400 15,900 15,327 15,130 16,000 18,000 18,000ChileColombia
1,010792
1,350660
1,537842
1,5601,125
1,6001,300
1,7001,300
1,7001,300
CubaDominican Republic
207--
32736
24560
27460
280 280 280
Ecuador 35 58 84 857085
7085
7085
El SalvadorGuatemala
28NA
41166
48207
72250
80250
80300
80300
JamaicaMexico
2512,100
--15,600
--16,202
--17,230
--14,000
--17,000
--19,000
ParaguayPeru
96515
772 749
101750
130750
135750
140750
150750
Trinidad and Tobago 738 753 711 675 700 700 700UruguayVenezuela
403,630
383,840
644,907
685,000
705,000
715,000
725,000
Total 62,300 72,000 78,100 80,100 80,000 85,000 88,000eEstimated. NA Not available. -- Negligible or no production.1Estimated data and totals are rounded to no more than three significant digits; may not add to totals shown.2Ingots and castings.
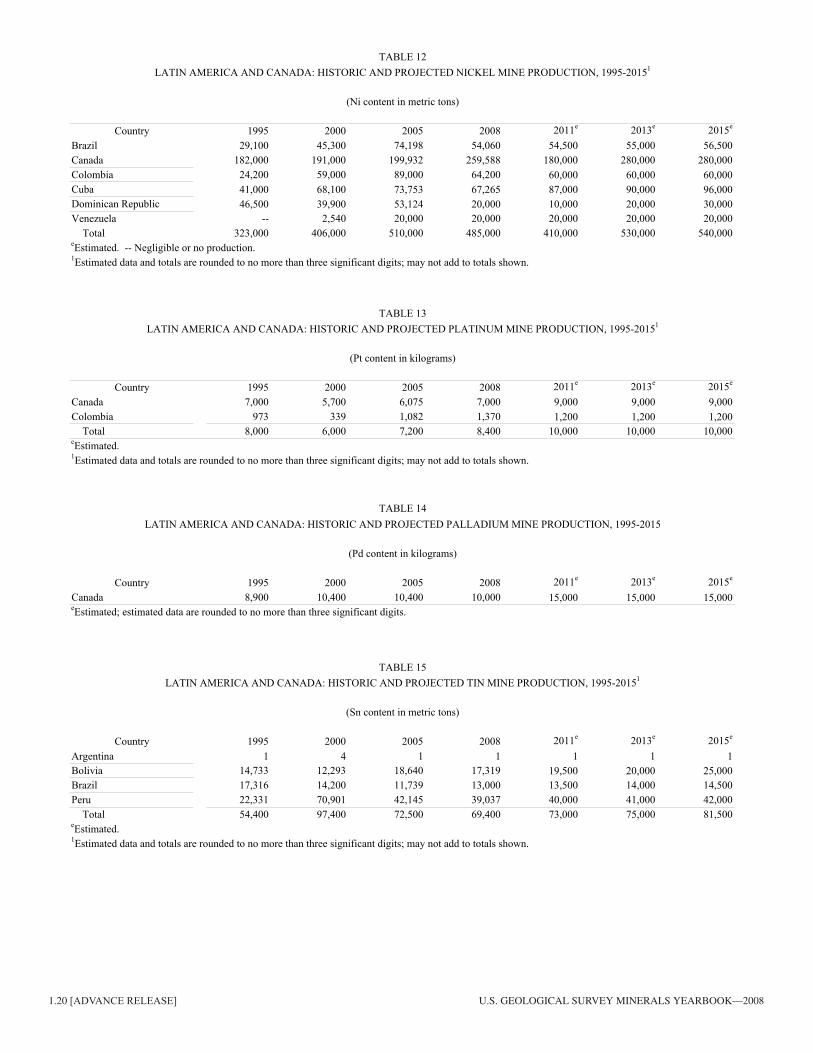
1.20 [ADVANCE RELEASE] u.s. geoLogicaL survey mineraLs yearbook—2008
TABLE 121LATIN AMERICA AND CANADA: HISTORIC AND PROJECTED NICKEL MINE PRODUCTION, 1995-2015
(Ni content in metric tons)
e e eCountry 1995 2000 2005 2008 2011 2013 2015Brazil 29,100 45,300 74,198 54,060 54,500 55,000 56,500Canada 182,000 191,000 199,932 259,588 180,000 280,000 280,000Colombia 24,200 59,000 89,000 64,200 60,000 60,000 60,000CubaDominican Republic
41,00046,500
68,10039,900
73,75353,124
67,26520,000
87,00010,000
90,00020,000
96,00030,000
Venezuela -- 2,540 20,000 20,000 20,000 20,000 20,000Total 323,000 406,000 510,000 485,000 410,000 530,000 540,000
eEstimated. -- Negligible or no production.1Estimated data and totals are rounded to no more than three significant digits; may not add to totals shown.
TABLE 131LATIN AMERICA AND CANADA: HISTORIC AND PROJECTED PLATINUM MINE PRODUCTION, 1995-2015
(Pt content in kilograms)
e e eCountry 1995 2000 2005 2008 2011 2013 2015Canada 7,000 5,700 6,075 7,000 9,000 9,000 9,000Colombia 973 339 1,082 1,370 1,200 1,200 1,200
Totale
8,000 6,000 7,200 8,400 10,000 10,000 10,000
1Estimated data and totals are rounded to no more than three significant digits; may not add to totals shown. Estimated.
TABLE 14LATIN AMERICA AND CANADA: HISTORIC AND PROJECTED PALLADIUM MINE PRODUCTION, 1995-2015
(Pd content in kilograms)
e e eCountry 1995 2000 2005 2008 2011 2013 2015Canada 8,900 10,400 10,400 10,000 15,000 15,000 15,000eEstimated; estimated data are rounded to no more than three significant digits.
TABLE 15LATIN AMERICA AND CANADA: HISTORIC AND PROJECTED TIN MINE PRODUCTION, 1995-20151
(Sn content in metric tons)
e e eCountry 1995 2000 2005 2008 2011 2013 2015Argentina 1 4 1 1 1 1 1Bolivia 14,733 12,293 18,640 17,319 19,500 20,000 25,000Brazil 17,316 14,200 11,739 13,000 13,500 14,000 14,500Peru 22,331 70,901 42,145 39,037 40,000 41,000 42,000
Total 54,400 97,400 72,500 69,400 73,000 75,000 81,500eEstimated.1Estimated data and totals are rounded to no more than three significant digits; may not add to totals shown.

Latin america and canada—2008 [advance reLease] 1.21
TABLE 161LATIN AMERICA AND CANADA: HISTORIC AND PROJECTED TIN METAL PRODUCTION, 1995-2015
(Metric tons)
2011e 2013e 2015eCountry 1995 2000 2005 2008Argentina -- -- 120 -- 150 150 150Brazil 17,039 14,023 9,236 10,558 11,000 11,500 12,000Bolivia 17,664 9,353 13,841 12,666 15,000 18,000 20,000Mexico 770 1,200 17 15 17 19 19Peru 22,262 37,410 36,733 38,865 39,000 39,500 40,000
Total 57,700 62,000 59,800 62,100 65,000 69,000 72,000eEstimated. -- Negligible or no production.1Estimated data and totals are rounded to no more than three significant digits; may not add to totals shown.
TABLE 17LATIN AMERICA AND CANADA: HISTORIC AND PROJECTED ZINC MINE PRODUCTION, 1995-20151
(Zn content in thousand metric tons)
Country 1995 2000 2005 2008 2011e 2013e 2015e
Argentina 32 35 30 30 30 30 30BoliviaBrazil
146189
149100
160171
384174
400180
390185
380190
Canada 1,120 1,000 667 678 800 800 800Chile 35 31 29 41 30 35 35Colombia -- 40 -- -- -- -- --EcuadorHonduras
(2)
27(2)
31--
43--
28--
33--
33--
33Mexico 364 393 456 454 455 455 455Peru 692 910 1,202 1,603 1,650 1,700 1,750
Total 2,610 2,690 2,760 3,390 3,600 3,600 3,700e
1Estimated data and totals are rounded to no more than three significant digits; may not add to totals shown. Estimated. -- Negligible or no production.
2Less than 1/2 unit.
TABLE 18LATIN AMERICA AND CANADA: HISTORIC AND PROJECTED ZINC METAL PRODUCTION, 1995-20151
(Thousand metric tons)
Country 1995 2000 2005 2008 2011e 2013e 2015e
Argentina 36 39 40 43 40 40 40BoliviaBrazil
--206
--199
--267
--249
--250
--300
30350
Canada2 720 780 724 764 850 850 850Mexico2 223 235 327 305 320 350 350Peru2 159 200 162 190 200 250 300
Totale
1,300 1,500 1,500 1,600 1,700 1,800 1,900Estimated. -- Negligible or no production.
1Estimated data and totals are rounded to no more than three significant digits; may not add to totals shown. 2Primary only.
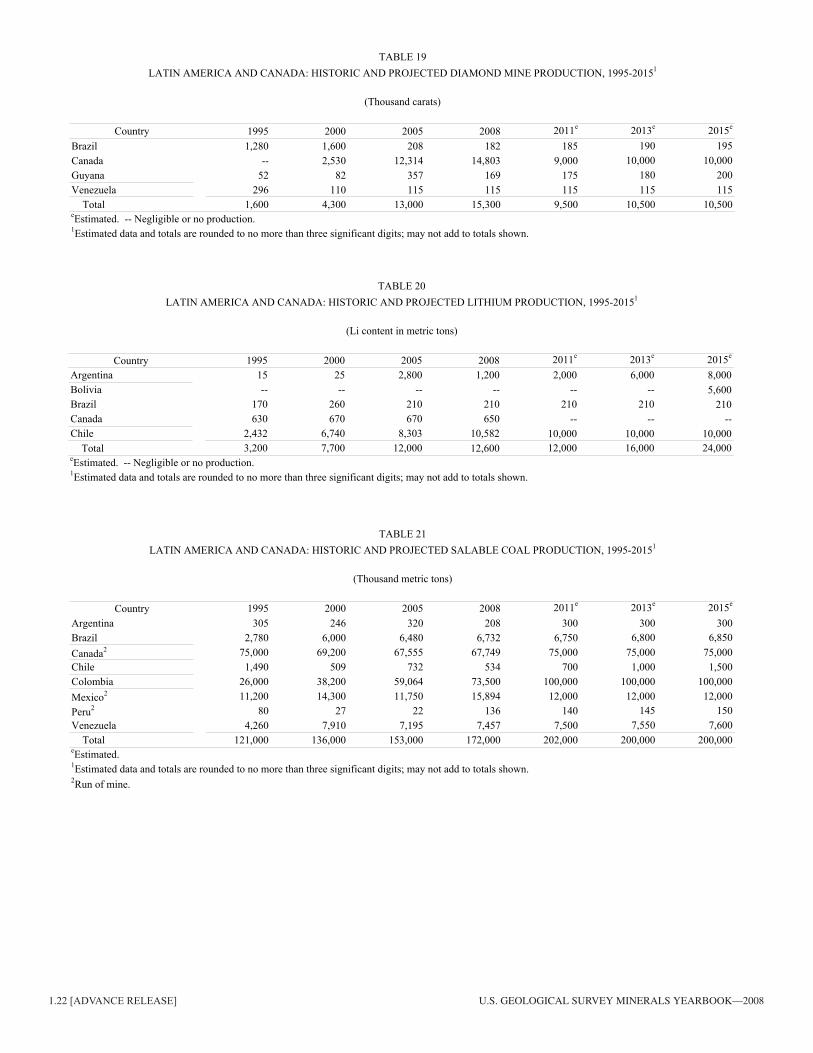
1.22 [ADVANCE RELEASE] u.s. geoLogicaL survey mineraLs yearbook—2008
TABLE 19LATIN AMERICA AND CANADA: HISTORIC AND PROJECTED DIAMOND MINE PRODUCTION, 1995-20151
(Thousand carats)
e e eCountry 1995 2000 2005 2008 2011 2013 2015Brazil 1,280 1,600 208 182 185 190 195Canada -- 2,530 12,314 14,803 9,000 10,000 10,000Guyana 52 82 357 169 175 180 200Venezuela 296 110 115 115 115 115 115
Total 1,600 4,300 13,000 15,300 9,500 10,500 10,500eEstimated. -- Negligible or no production.1Estimated data and totals are rounded to no more than three significant digits; may not add to totals shown.
TABLE 201LATIN AMERICA AND CANADA: HISTORIC AND PROJECTED LITHIUM PRODUCTION, 1995-2015
(Li content in metric tons)
e e eCountry 1995 2000 2005 2008 2011 2013 2015Argentina 15 25 2,800 1,200 2,000 6,000 8,000Bolivia -- -- -- -- -- -- 5,600Brazil 170 260 210 210 210 210 210Canada 630 670 670 650 -- -- --Chile 2,432 6,740 8,303 10,582 10,000 10,000 10,000
Total 3,200 7,700 12,000 12,600 12,000 16,000 24,000eEstimated. -- Negligible or no production.1Estimated data and totals are rounded to no more than three significant digits; may not add to totals shown.
Brazil 2,780 6,000 6,480 6,732 6,750 6,800 6,850Canada2 75,000 69,200 67,555 67,749 75,000 75,000 75,000Chile 1,490 509 732 534 700 1,000 1,500Colombia 26,000 38,200 59,064 73,500 100,000 100,000 100,000Mexico2 11,200 14,300 11,750 15,894 12,000 12,000 12,000Peru2 80 27 22 136 140 145 150Venezuela 4,260 7,910 7,195 7,457 7,500 7,550 7,600
Total 121,000 136,000 153,000 172,000 202,000 200,000 200,000eEstimated.
2Run of mine.
1Estimated data and totals are rounded to no more than three significant digits; may not add to totals shown.
TABLE 21LATIN AMERICA AND CANADA: HISTORIC AND PROJECTED SALABLE COAL PRODUCTION, 1995-20151
(Thousand metric tons)
e e eCountry 1995 2000 2005 2008 2011 2013 2015Argentina 305 246 320 208 300 300 300

Latin america and canada—2008 [advance reLease] 1.23
TABLE 22LATIN AMERICA AND CANADA: HISTORIC AND PROJECTED URANIUM PRODUCTION, 1995-20151
(U3O8 content in metric tons)
e e eCountry 1995 2000 2005 2008 2011 2013 2015Argentina 68 -- -- -- -- -- --
2 -- 20 129 130 130 130 130BrazilCanada 12,400 12,600 14,854 10,261 10,000 12,000 17,000
Total 12,500 12,600 15,000 10,400 10,000 12,000 17,000eEstimated. -- Negligible or no production.1Estimated data and totals are rounded to no more than three significant digits; may not add to totals shown. 2Source: Anuário Mineral Brasileiro 2001-2006.
Commodity and country 2000 2008 Percent changeAluminum, unwrought:
Argentina 105 148 41%Brazil 743 1,548 108%Canada 948 357 -62%Chile 15 16 10%Colombia 32 43 34%Mexico 375 998 166%Peru NA -1 NA
Cement, portland, other than white: Argentina 6,221 9,688 56%Brazil 39,710 46,121 16%Canada 8,271 11,300 37%Chile 3,469 4,800 38%Colombia 5,469 9,310 70%Mexico 29,400 38,965 33%Peru 3,646 6,799 86%
Copper, refined: Argentina 49 14 -71%Brazil 331 403 22%Canada 2,272 199 -91%Chile 84 56 -33%Colombia 5 -8 -278%Mexico 464 311 -33%Peru 55 73 33%
Steel, finished and semifinished: Argentina 2,970 4,790 61%Brazil 15,760 24,000 52%Canada 17,800 14,279 -20%Chile 1,465 2,572 76%Colombia 1,695 2,937 73%Mexico 14,143 16,268 15%Peru 825 2,159 162%
Sources: United Nations Commodity Trade Statistics Database; U.S. Geological Survey Minerals Yearbook 2008, Area reports—International—Latin America and Canada; World Steel Association, 2010, Steel statistical yearbook 2009, p. 95.
TABLE 23LATIN AMERICA AND CANADA: APPARENT CONSUMPTION FOR SELECTED COUNTRIES
(Thousand metric tons)
NA Not available.