Embed Size (px)
Citation preview
2008 ANNUAL SUMMARY OF QUALITY & PERFORMANCE IMPROVEMENT INITIATIVES
2
INTRODUCTION
• Highlight performance improvement accomplishments• Opportunities for further improvement.• Planned Interventions for improvement.• 2009 Quality and Performance Improvement Activities • Provide External Regulatory Update
3
2008 HOSPITAL-WIDE
QUALITY AND PERFORMANCE IMPROVEMENT INITIATIVES
4
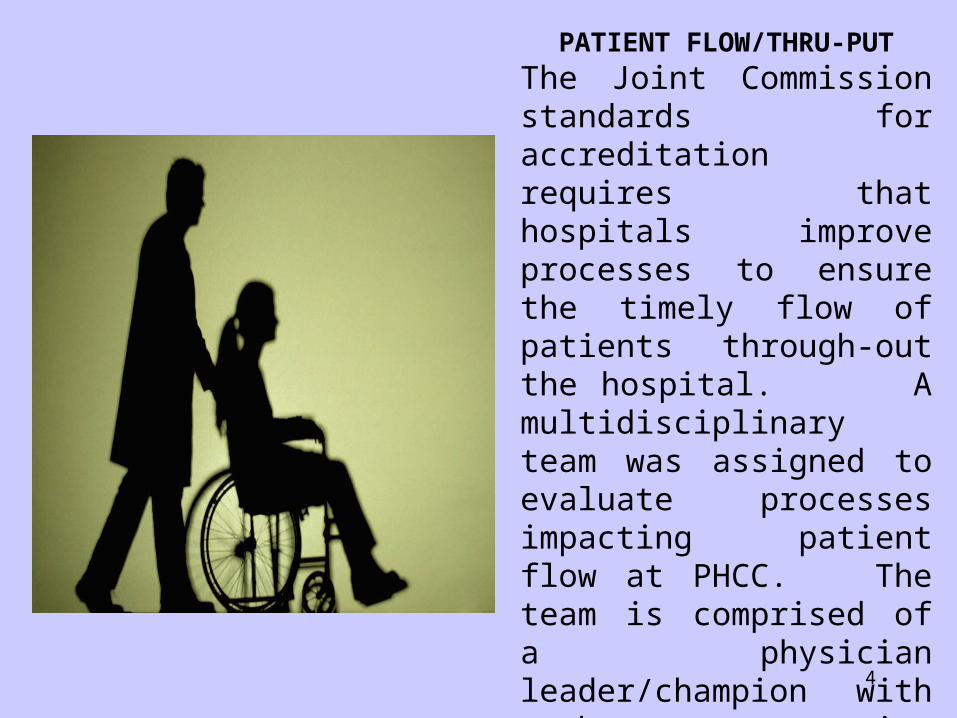
PATIENT FLOW/THRU-PUT
The Joint Commission standards for accreditation requires that hospitals improve processes to ensure the timely flow of patients through-out the hospital. A multidisciplinary team was assigned to evaluate processes impacting patient flow at PHCC. The team is comprised of a physician leader/champion with members representing nursing and physician staff, and the ancillary support areas of Laboratory, Respiratory, Radiology, Social Services, etc.
5
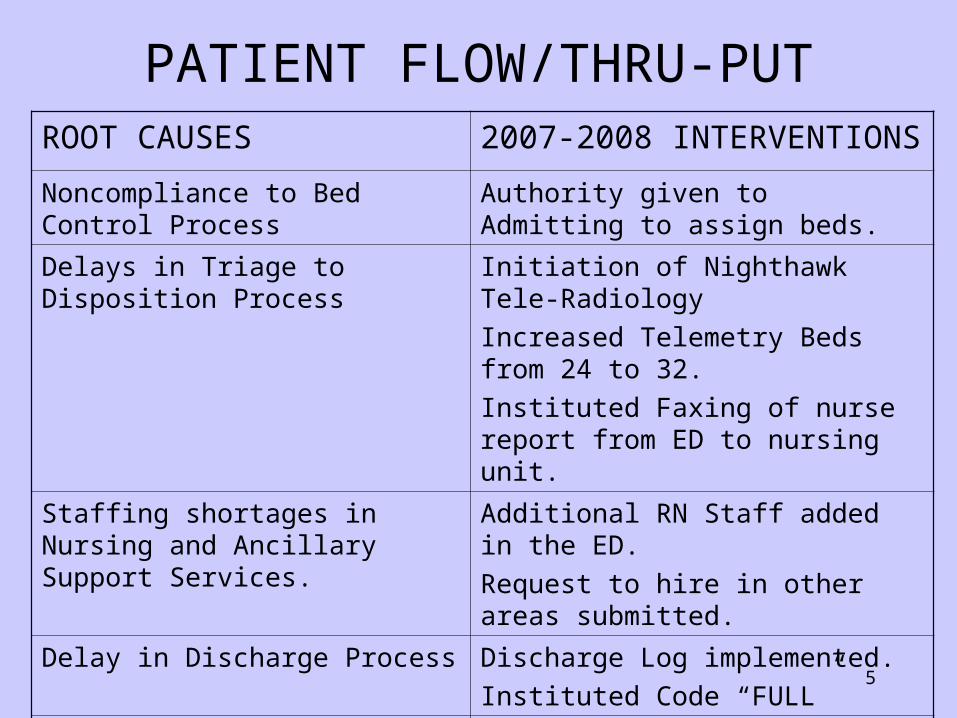
PATIENT FLOW/THRU-PUTROOT CAUSES 2007-2008 INTERVENTIONS
Noncompliance to Bed Control Process
Authority given to Admitting to assign beds.
Delays in Triage to Disposition Process
Initiation of Nighthawk Tele-Radiology
Increased Telemetry Beds from 24 to 32.
Instituted Faxing of nurse report from ED to nursing unit.
Staffing shortages in Nursing and Ancillary Support Services.
Additional RN Staff added in the ED.
Request to hire in other areas submitted.
Delay in Discharge Process Discharge Log implemented.
Instituted Code “FULL”
Manual Processes Cerner implementation pending.
6
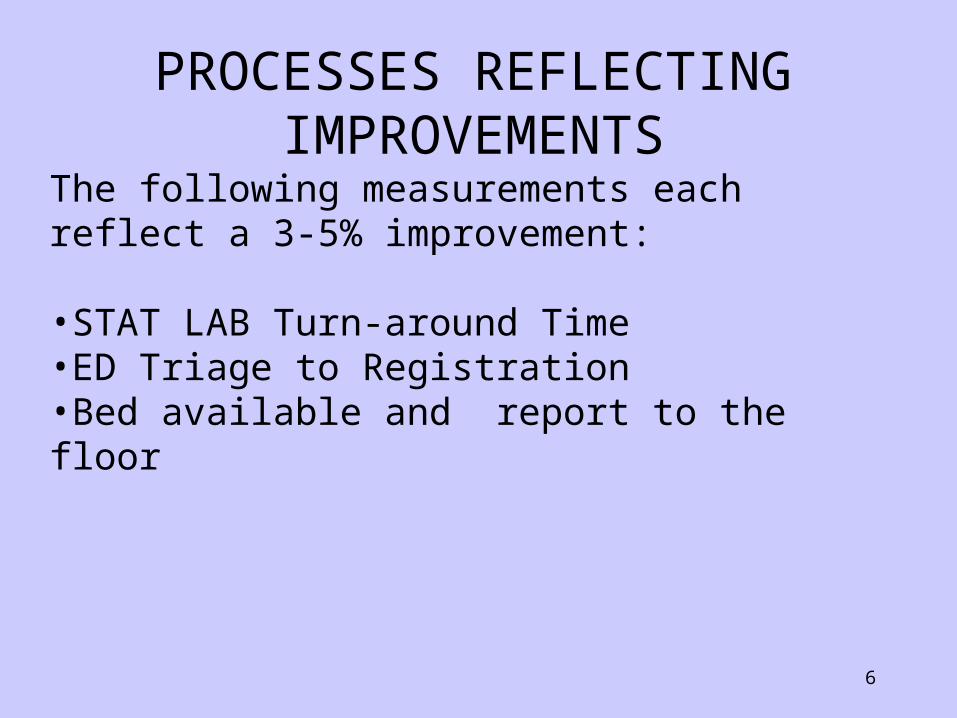
PROCESSES REFLECTING IMPROVEMENTS
The following measurements each reflect a 3-5% improvement:
•STAT LAB Turn-around Time •ED Triage to Registration •Bed available and report to the floor
7
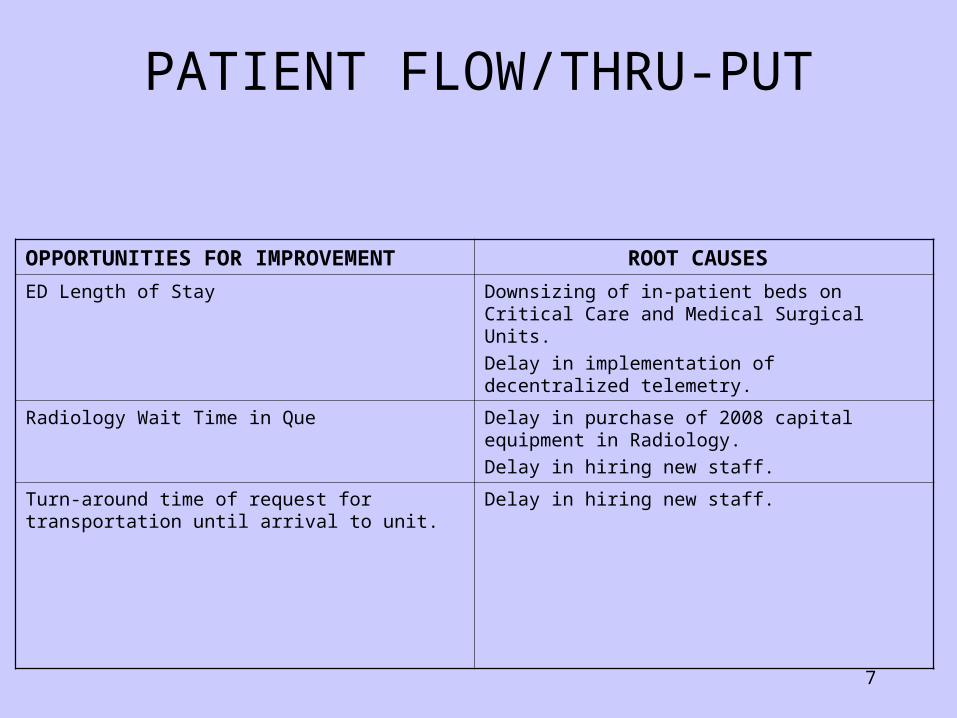
PATIENT FLOW/THRU-PUT
OPPORTUNITIES FOR IMPROVEMENT ROOT CAUSES
ED Length of Stay Downsizing of in-patient beds on Critical Care and Medical Surgical Units.
Delay in implementation of decentralized telemetry.
Radiology Wait Time in Que Delay in purchase of 2008 capital equipment in Radiology.
Delay in hiring new staff.
Turn-around time of request for transportation until arrival to unit.
Delay in hiring new staff.
8
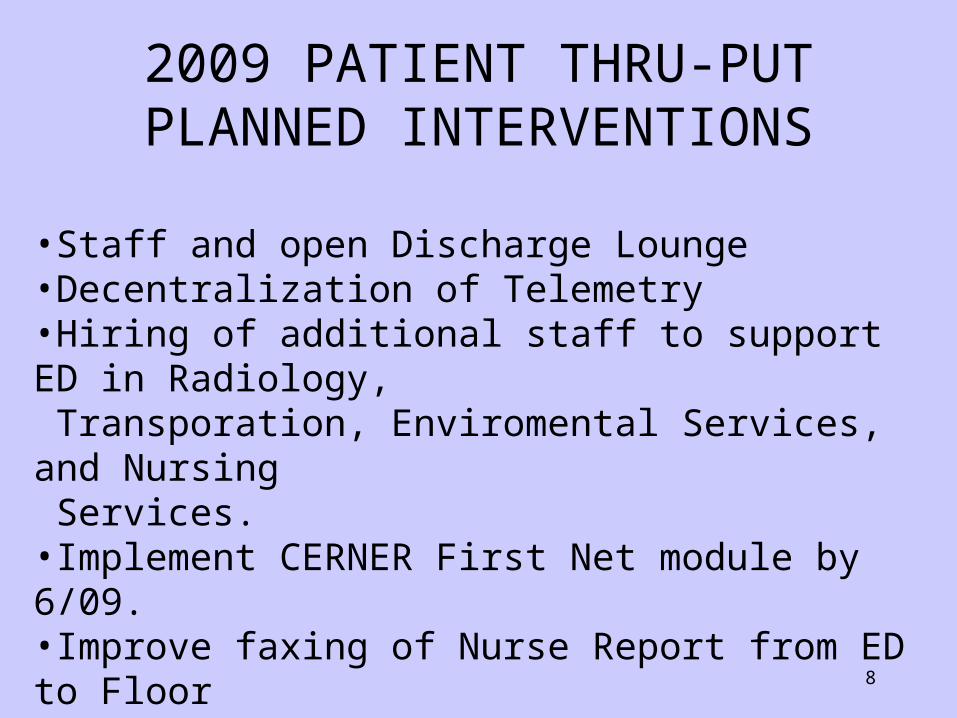
2009 PATIENT THRU-PUTPLANNED INTERVENTIONS
•Staff and open Discharge Lounge•Decentralization of Telemetry•Hiring of additional staff to support ED in Radiology, Transporation, Enviromental Services, and Nursing Services.•Implement CERNER First Net module by 6/09.•Improve faxing of Nurse Report from ED to Floor•Purchase and installation of Digital Radiology Equipment
9
CORE MEASURES
A set of diagnosed based criteria adopted by CMS and JCAHO to improve patient outcomes. Core Measures are called ORYX by Joint Commission. The rationale for these National Core Measures is to improve patient care outcomes for Acute Myocardial Infarction Heart Failure, Community Acquired Pneumonia, Surgical Improvement.
A multi-disciplinary team comprised of a physician team leader/champion, nursing, medical staff, and ancillary support services, has been addressing this ongoing project.
10
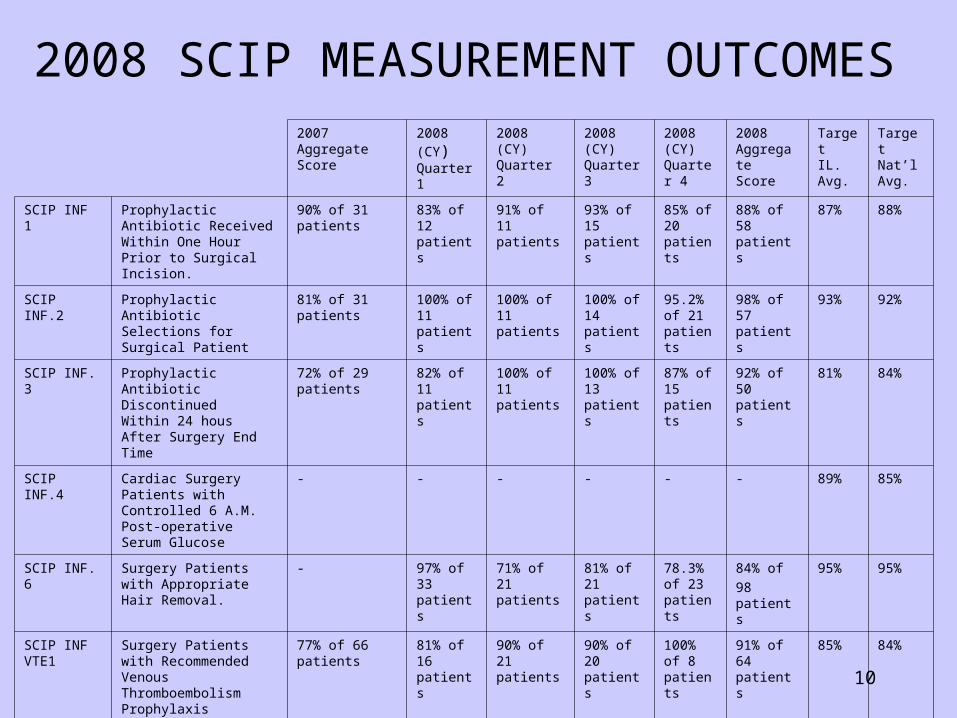
2008 SCIP MEASUREMENT OUTCOMES
2007 Aggregate Score
2008 (CY)Quarter 1
2008 (CY)Quarter 2
2008 (CY)Quarter 3
2008 (CY)Quarter 4
2008 Aggregate Score
TargetIL. Avg.
TargetNat’lAvg.
SCIP INF 1 Prophylactic Antibiotic Received Within One Hour Prior to Surgical Incision.
90% of 31 patients
83% of 12 patients
91% of 11 patients
93% of 15 patients
85% of 20 patients
88% of 58 patients
87% 88%
SCIP INF.2 Prophylactic Antibiotic Selections for Surgical Patient
81% of 31 patients 100% of 11 patients
100% of 11 patients
100% of 14 patients
95.2% of 21 patients
98% of 57 patients
93% 92%
SCIP INF. 3 Prophylactic Antibiotic DiscontinuedWithin 24 hous After Surgery End Time
72% of 29 patients 82% of 11 patients
100% of 11 patients
100% of 13 patients
87% of 15 patients
92% of 50 patients
81% 84%
SCIP INF.4 Cardiac Surgery Patients with Controlled 6 A.M. Post-operative Serum Glucose
- - - - - - 89% 85%
SCIP INF. 6 Surgery Patients with Appropriate Hair Removal.
- 97% of 33 patients
71% of 21 patients
81% of 21 patients
78.3% of 23 patients
84% of
98 patients
95% 95%
SCIP INF VTE1
Surgery Patients with RecommendedVenous Thromboembolism Prophylaxis Ordered.
77% of 66 patients 81% of 16 patients
90% of 21 patients
90% of 20 patients
100% of 8 patients
91% of 64 patients
85% 84%
SCIP INF.VTE2
Surgery Patient Who Received Appropriate Venous Thromboembolism Prophylaxis Within 24 hours Prior to Surgery to 24 Hours After Surgery
77% of 66 patient 81% of 16 patients
90% of 21 patients
90% of 21 patients
100% of 8 patients
89% of 65 patients
81% 81%
11
BARRIERS TO IMPROVEMENTS IN SURGICAL IMPROVEMENT PROJECT
(SCIP)
•Lack of appropriate resources (razors vs clippers)•Physicians deviating from practice parameters.
INTERVENTIONS FOR IMPROVEMENT
•Continue to review criteria with appropriate staff.•Review deficient charts with responsible providers.•Requested as an automatic order set in Cerner.
12
2007 AggregateScore
2008 (CY)Quarter 2
2008 (CY)Quarter 3
2008 (CY)Quarter 4
Aggregate Rate for Four Quarters
TargetIL. Avg.
TargetNat’lAvg.
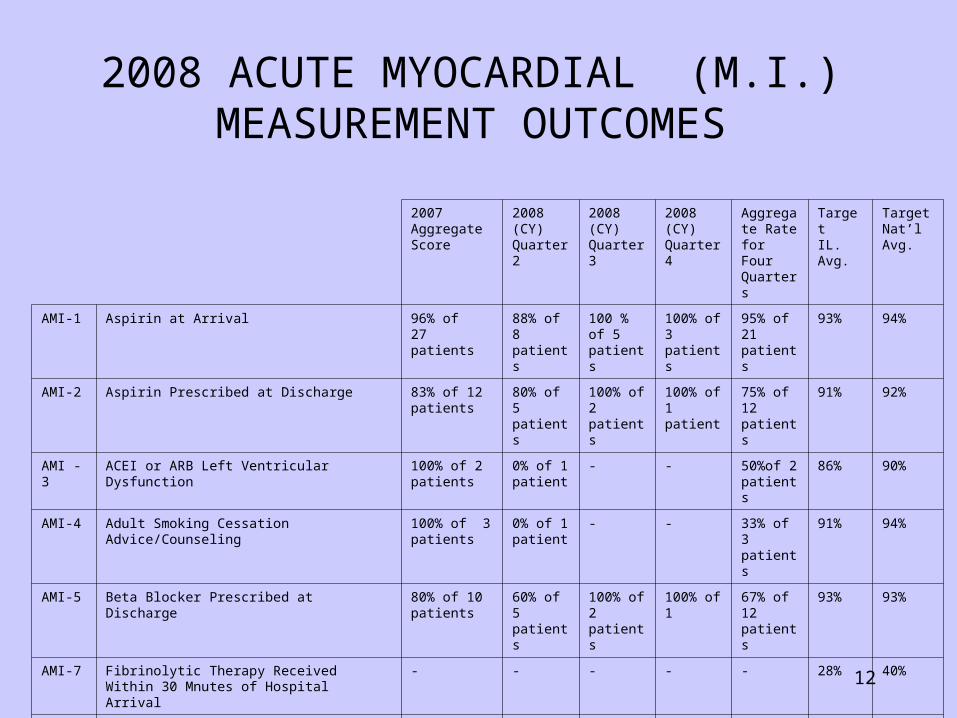
AMI-1 Aspirin at Arrival 96% of 27 patients
88% of 8 patients
100 % of 5 patients
100% of 3 patients
95% of 21 patients
93% 94%
AMI-2 Aspirin Prescribed at Discharge 83% of 12 patients
80% of 5 patients
100% of 2 patients
100% of 1 patient
75% of 12 patients
91% 92%
AMI -3 ACEI or ARB Left Ventricular Dysfunction 100% of 2 patients
0% of 1 patient
- - 50%of 2 patients
86% 90%
AMI-4 Adult Smoking Cessation Advice/Counseling 100% of 3 patients
0% of 1 patient
- - 33% of 3 patients
91% 94%
AMI-5 Beta Blocker Prescribed at Discharge 80% of 10 patients
60% of 5 patients
100% of 2 patients
100% of 1 67% of 12 patients
93% 93%
AMI-7 Fibrinolytic Therapy Received Within 30 Mnutes of Hospital Arrival
- - - - - 28% 40%
AMI-8a Primary PCI Received Within 90 Minutes of Hospital Arrival
- - - - - 67% 72%
2008 ACUTE MYOCARDIAL (M.I.)MEASUREMENT OUTCOMES
13
BARRIERS TO IMPROVEMENT FOR ACUTE M.I.
• Data abstraction errors during the 1ST. & 2nd. Qtrs. 2008.• Timeliness of identification of cases for -concurrent review -and intervention
INTERVENTIONS TO IMPROVE OUTCOMES
• Increased oversight of validation of data entry process.• Developed process for timely identification and concurrent intervention.• Written reminders placed on charts.• Continuous re-education of physicians and nursing staff.
14
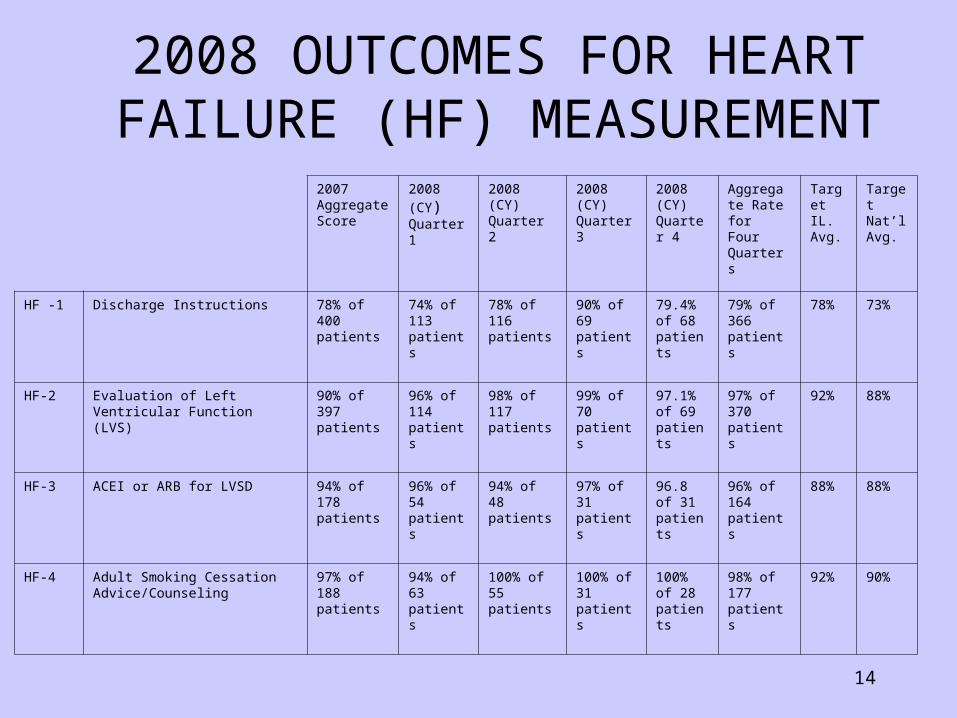
2007 Aggregate Score
2008 (CY)Quarter 1
2008 (CY)Quarter 2
2008 (CY)Quarter 3
2008 (CY)Quarter 4
Aggregate Rate for Four Quarters
TargetIL. Avg.
TargetNat’lAvg.
HF -1 Discharge Instructions 78% of 400 patients
74% of 113 patients
78% of 116 patients
90% of 69 patients
79.4% of 68 patients
79% of 366 patients
78% 73%
HF-2 Evaluation of Left Ventricular Function (LVS)
90% of 397 patients
96% of 114 patients
98% of 117 patients
99% of 70 patients
97.1% of 69 patients
97% of 370 patients
92% 88%
HF-3 ACEI or ARB for LVSD 94% of 178 patients
96% of 54 patients
94% of 48 patients
97% of 31 patients
96.8 of 31 patients
96% of 164 patients
88% 88%
HF-4 Adult Smoking Cessation Advice/Counseling
97% of 188 patients
94% of 63 patients
100% of 55 patients
100% of 31 patients
100% of 28 patients
98% of 177 patients
92% 90%
2008 OUTCOMES FOR HEART FAILURE (HF) MEASUREMENT
15
BARRIERS TO 100% COMPLIANCE
• Lack of Pre-Printed Orders.• Cumbersome documentation process.• Behavior
INTERVENTIONS FOR IMPROVEMENT
• Implementation of Pre-Printed Orders • Continue concurrent monitoring/intervention. • Departmental peer review for non-compliant physicians.• Revision of Nursing Discharge Instruction Form• Counseling for non-compliant nursing staff.• Requested automatic order sets in Cerner.
16
HEART FAILURE PROGRAM
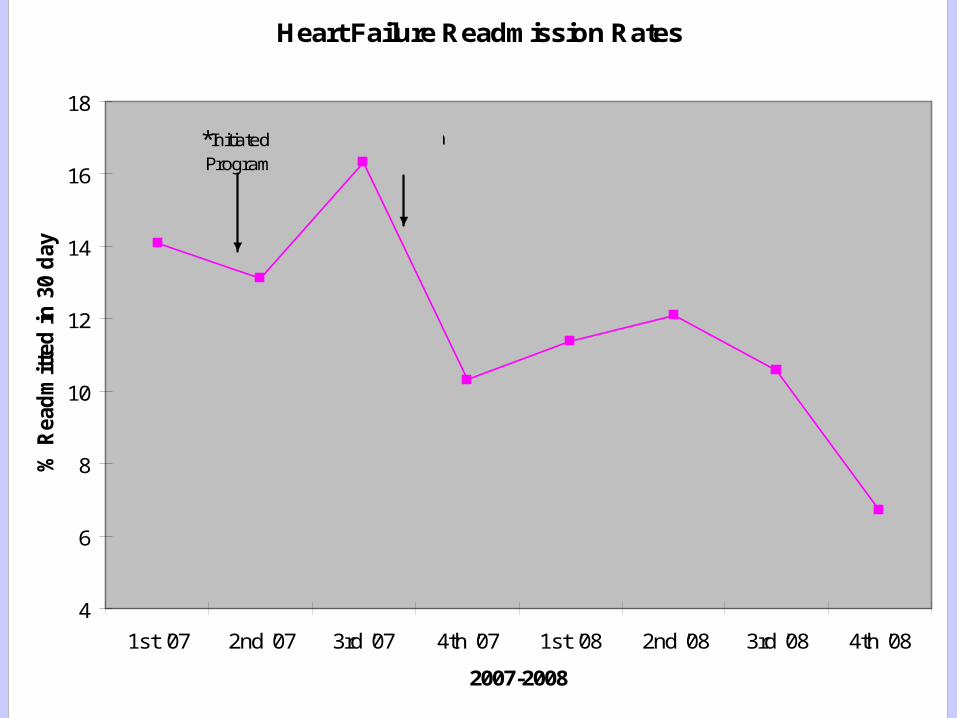
• Despite excellent core measure compliance, readmission Despite excellent core measure compliance, readmission rates for heart failure exceeded the national recognized rates for heart failure exceeded the national recognized benchmark of 4.45%.benchmark of 4.45%.
• Data analysis utilizing quality tools identified root causes:Data analysis utilizing quality tools identified root causes:
-Patient non-compliance-Patient non-compliance
-Clinic Appointment availability-Clinic Appointment availability
-Patient and family education -Patient and family education
-No dedicated provider -No dedicated provider
17
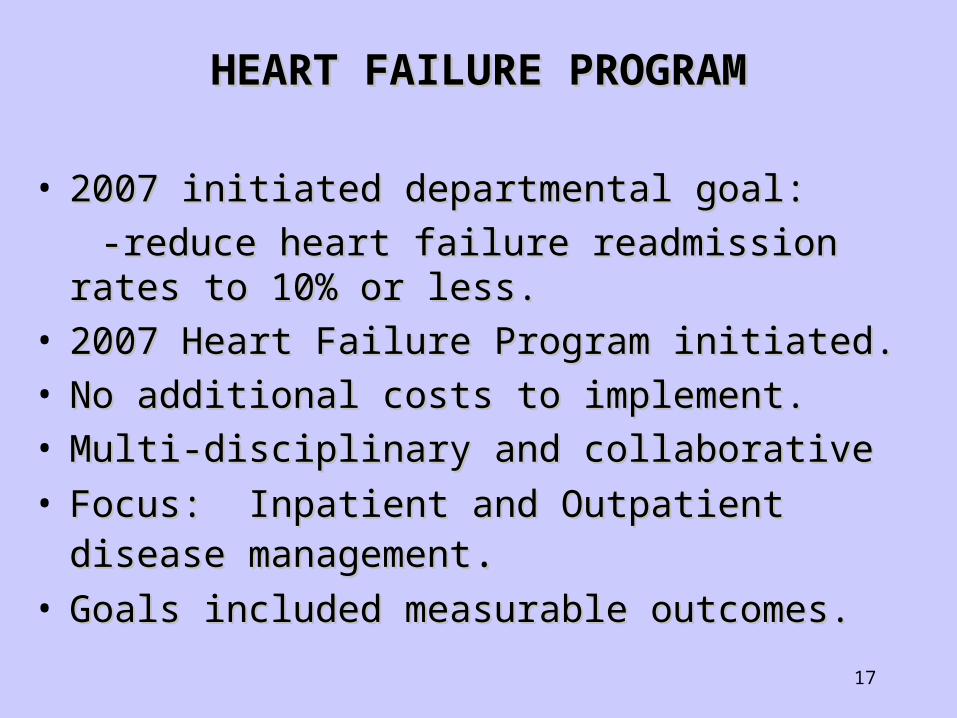
HEART FAILURE PROGRAMHEART FAILURE PROGRAM
• 2007 initiated departmental goal:2007 initiated departmental goal:
-reduce heart failure readmission rates to 10% or less.-reduce heart failure readmission rates to 10% or less.• 2007 Heart Failure Program initiated.2007 Heart Failure Program initiated.• No additional costs to implement.No additional costs to implement.• Multi-disciplinary and collaborativeMulti-disciplinary and collaborative
• Focus: Inpatient and Outpatient disease managementFocus: Inpatient and Outpatient disease management..• Goals included measurable outcomes.Goals included measurable outcomes.
18
Heart Failure Readmission Rates
4
6
8
10
12
14
16
18
1st '07 2nd '07 3rd '07 4th '07 1st '08 2nd '08 3rd '08 4th '08
2007-2008
% R
ead
mit
ted
in
30
day
s
*Initiated Program
Clinic &
EducationClasses
19
2007 Aggregate Score
2008 (CY)Quarter 1
2008 (CY)Quarter 2
2008 (CY)Quarter 3
2008 (CY)Quarter 4
2008Aggregate Score
TargetIL. Avg.
TargetNat’lAvg.
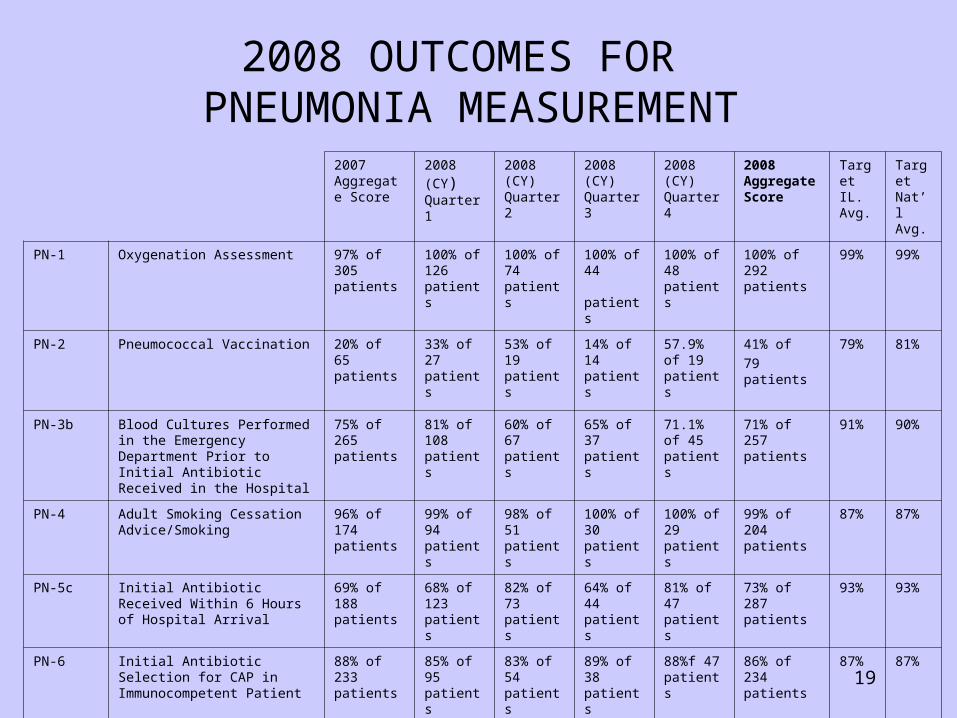
PN-1 Oxygenation Assessment 97% of 305 patients
100% of 126 patients
100% of 74 patients
100% of 44 patients
100% of 48 patients
100% of 292 patients
99% 99%
PN-2 Pneumococcal Vaccination 20% of 65 patients
33% of 27 patients
53% of 19 patients
14% of 14 patients
57.9% of 19 patients
41% of
79 patients
79% 81%
PN-3b Blood Cultures Performed in the Emergency Department Prior to Initial Antibiotic Received in the Hospital
75% of 265 patients
81% of 108 patients
60% of 67 patients
65% of 37 patients
71.1% of 45 patients
71% of 257 patients
91% 90%
PN-4 Adult Smoking Cessation Advice/Smoking
96% of 174 patients
99% of 94 patients
98% of 51 patients
100% of 30 patients
100% of 29 patients
99% of 204 patients
87% 87%
PN-5c Initial Antibiotic Received Within 6 Hours of Hospital Arrival
69% of 188 patients
68% of 123 patients
82% of 73 patients
64% of 44 patients
81% of 47 patients
73% of 287 patients
93% 93%
PN-6 Initial Antibiotic Selection for CAP in Immunocompetent Patient
88% of 233 patients
85% of 95 patients
83% of 54 patients
89% of 38 patients
88%f 47 patients
86% of 234 patients
87% 87%
PN-7 Influenza Vaccination 18% of 39 patients
32% of 91 patients
- - 62% of 39 patients
41% of 130 patients
77% 77%
2008 OUTCOMES FOR PNEUMONIA MEASUREMENT
20
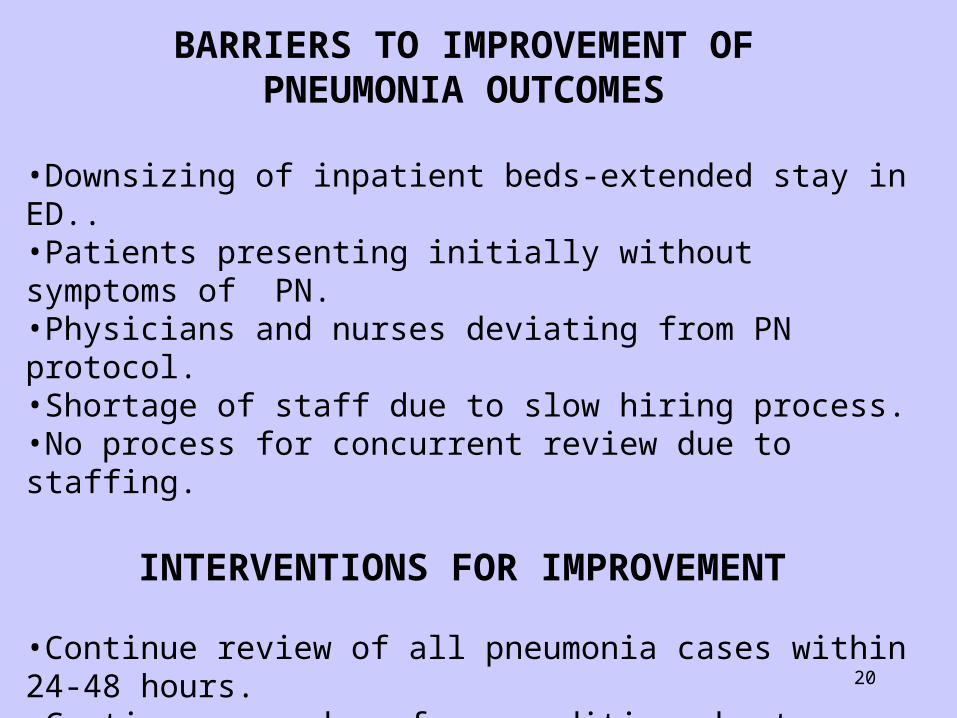
BARRIERS TO IMPROVEMENT OF PNEUMONIA OUTCOMES
•Downsizing of inpatient beds-extended stay in ED..•Patients presenting initially without symptoms of PN.•Physicians and nurses deviating from PN protocol. •Shortage of staff due to slow hiring process.•No process for concurrent review due to staffing.
INTERVENTIONS FOR IMPROVEMENT
•Continue review of all pneumonia cases within 24-48 hours.•Continue procedure for expediting chest xray tests and results.•Continue monthly internal review to • -identify deficiencies • -and utilize quality tools to analyze root causes.

21
IMPROVE CUSTOMER SERVICE
22
INTERVENTIONS TO IMPROVE CUSTOMER SERVICE
• Re-engineering of Customer Service Committee• Revisions of Customer Service Policies & Procedures.• Feedback to Nursing, Medical and Ancillary Staff.• Patient Advocate makes daily visits to new patients.• Daily visits to all patients by Nurse Managers.
23
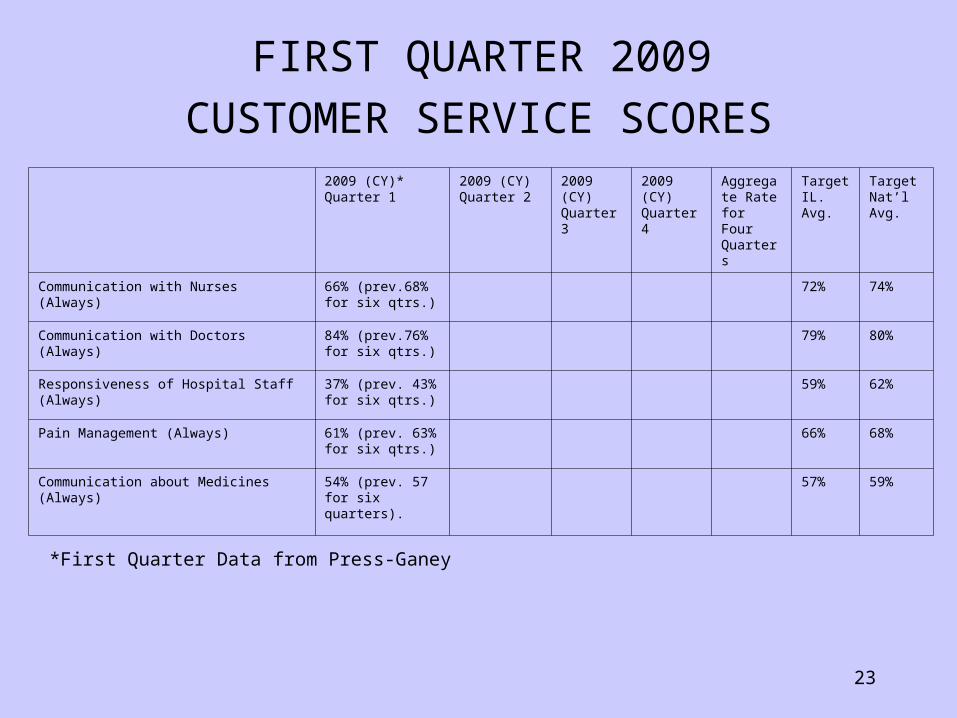
2009 (CY)*Quarter 1
2009 (CY)Quarter 2
2009 (CY)Quarter 3
2009 (CY)Quarter 4
Aggregate Rate for Four Quarters
TargetIL. Avg.
TargetNat’lAvg.
Communication with Nurses (Always) 66% (prev.68% for six qtrs.)
72% 74%
Communication with Doctors (Always) 84% (prev.76% for six qtrs.)
79% 80%
Responsiveness of Hospital Staff (Always) 37% (prev. 43% for six qtrs.)
59% 62%
Pain Management (Always) 61% (prev. 63% for six qtrs.)
66% 68%
Communication about Medicines (Always) 54% (prev. 57 for six quarters).
57% 59%
FIRST QUARTER 2009
CUSTOMER SERVICE SCORES
*First Quarter Data from Press-Ganey
24
NATIONAL PATIENT SAFETY GOALS
25
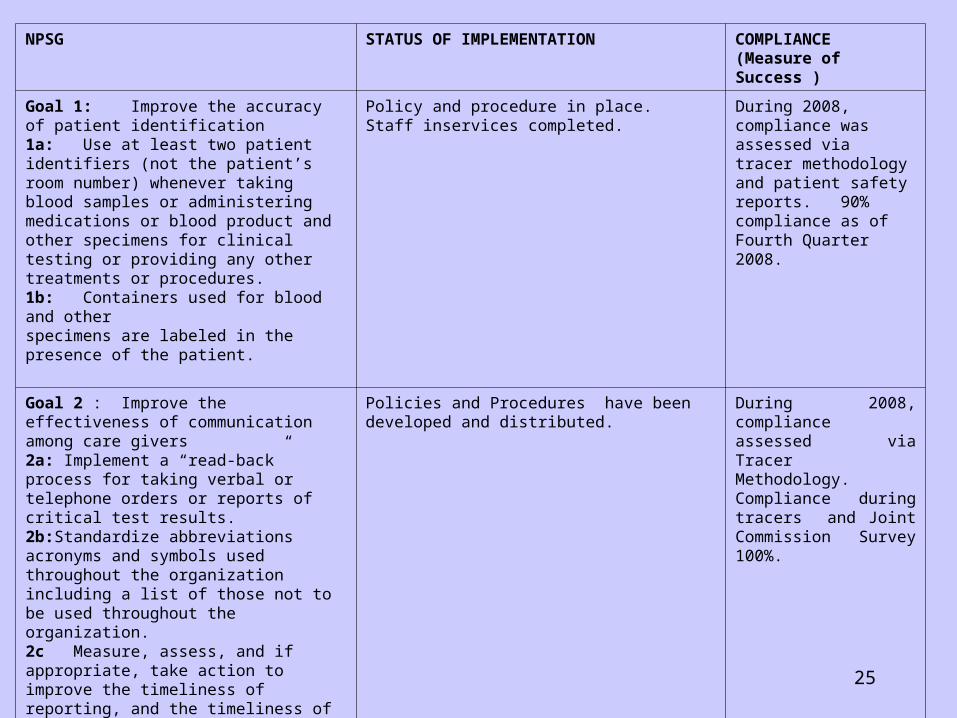
NPSG STATUS OF IMPLEMENTATION COMPLIANCE (Measure of Success )
Goal 1: Improve the accuracy of patient identification1a: Use at least two patient identifiers (not the patient’s room number) whenever taking blood samples or administering medications or blood product and other specimens for clinical testing or providing any other treatments or procedures.1b: Containers used for blood and other specimens are labeled in the presence of the patient.
Policy and procedure in place.Staff inservices completed.
During 2008, compliance was assessed via tracer methodology and patient safety reports. 90% compliance as of Fourth Quarter 2008.
Goal 2 : Improve the effectiveness of communication among care givers2a: Implement a “read-back” process for taking verbal or telephone orders or reports of critical test results.2b:Standardize abbreviations acronyms and symbols used throughout the organization including a list of those not to be used throughout the organization.2c Measure, assess, and if appropriate, take action to improve the timeliness of reporting, and the timeliness of receipt by the responsible licensed caregiver, of critical tests results and values.2d: Not applicable.2e: Implement a standardized approach to “hand-off” communications, including an opportunity to ask and respond to questions.
Policies and Procedures have been developed and distributed.
During 2008, compliance assessed via Tracer Methodology. Compliance during tracers and Joint Commission Survey 100%.
26
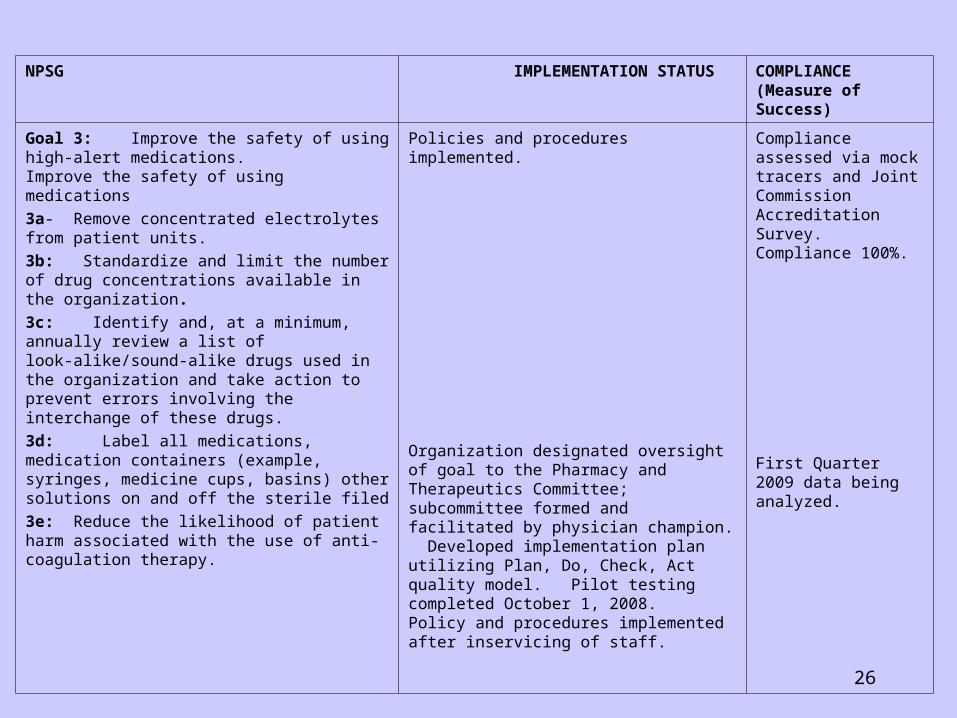
NPSG IMPLEMENTATION STATUS COMPLIANCE (Measure of Success)
Goal 3: Improve the safety of using high-alert medications.Improve the safety of using medications
3a- Remove concentrated electrolytes from patient units.
3b: Standardize and limit the number of drug concentrations available in the organization.
3c: Identify and, at a minimum, annually review a list of look-alike/sound-alike drugs used in the organization and take action to prevent errors involving the interchange of these drugs.
3d: Label all medications, medication containers (example, syringes, medicine cups, basins) other solutions on and off the sterile filed
3e: Reduce the likelihood of patient harm associated with the use of anti-coagulation therapy.
Policies and procedures implemented.
Organization designated oversight of goal to the Pharmacy and Therapeutics Committee; subcommittee formed and facilitated by physician champion. Developed implementation plan utilizing Plan, Do, Check, Act quality model. Pilot testing completed October 1, 2008.Policy and procedures implemented after inservicing of staff.
Compliance assessed via mock tracers and Joint Commission Accreditation Survey. Compliance 100%.
First Quarter 2009 data being analyzed.
27
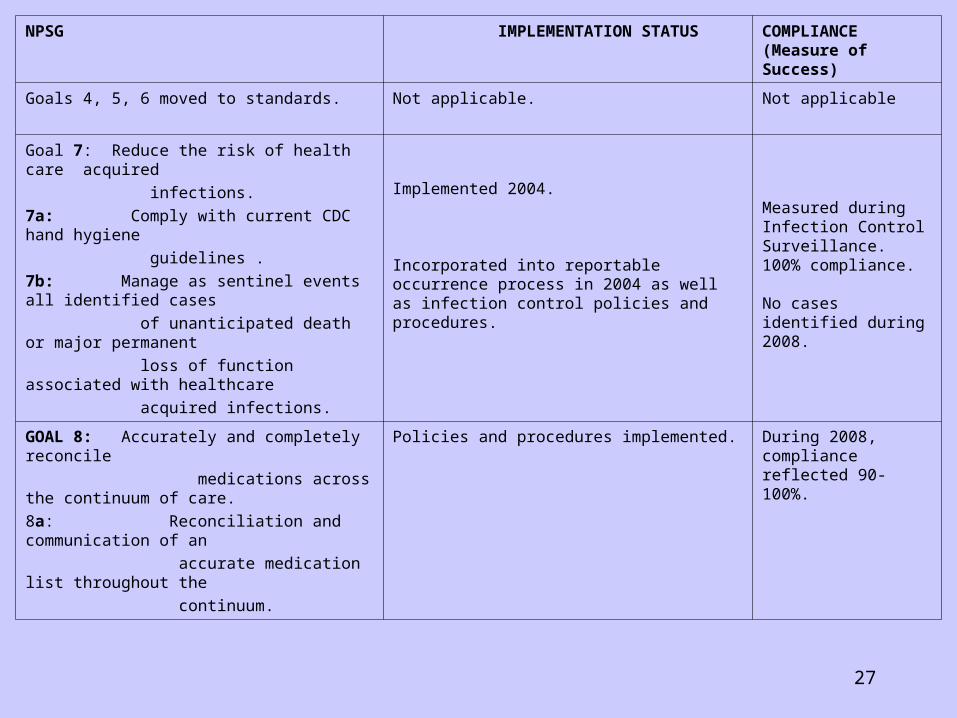
NPSG IMPLEMENTATION STATUS COMPLIANCE (Measure of Success)
Goals 4, 5, 6 moved to standards. Not applicable. Not applicable
Goal 7: Reduce the risk of health care acquired
infections.
7a: Comply with current CDC hand hygiene
guidelines .
7b: Manage as sentinel events all identified cases
of unanticipated death or major permanent
loss of function associated with healthcare
acquired infections.
Implemented 2004.
Incorporated into reportable occurrence process in 2004 as well as infection control policies and procedures.
Measured during Infection Control Surveillance. 100% compliance.
No cases identified during 2008.
GOAL 8: Accurately and completely reconcile
medications across the continuum of care.
8a: Reconciliation and communication of an
accurate medication list throughout the
continuum.
Policies and procedures implemented. During 2008, compliance reflected 90-100%.
28
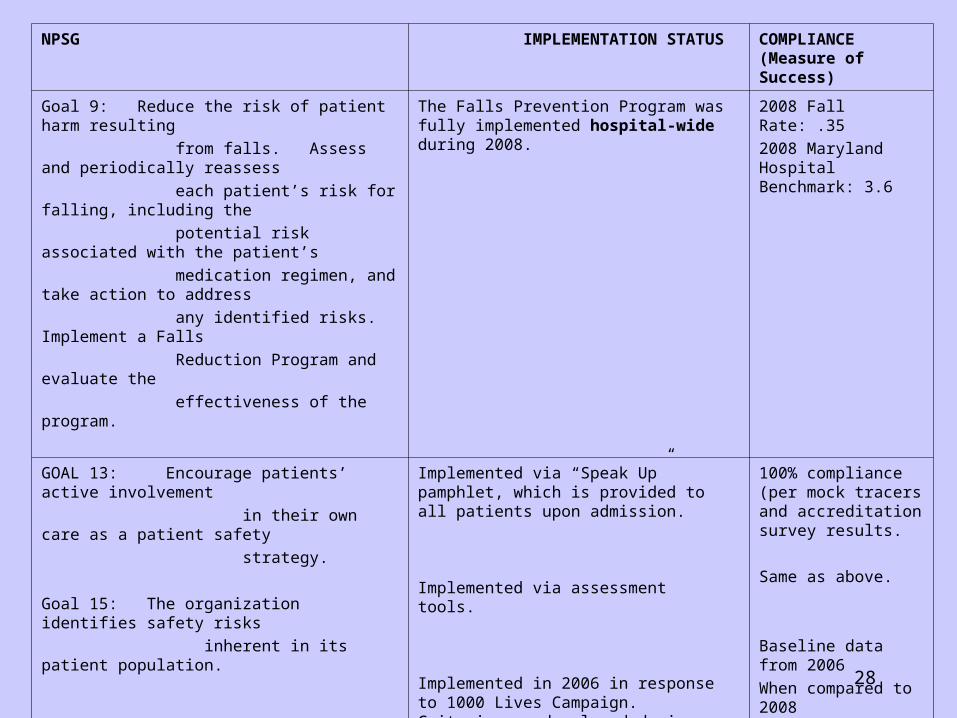
NPSG IMPLEMENTATION STATUS COMPLIANCE (Measure of Success)
Goal 9: Reduce the risk of patient harm resulting
from falls. Assess and periodically reassess
each patient’s risk for falling, including the
potential risk associated with the patient’s
medication regimen, and take action to address
any identified risks. Implement a Falls
Reduction Program and evaluate the
effectiveness of the program.
The Falls Prevention Program was fully implemented hospital-wide during 2008.
2008 Fall Rate: .35
2008 Maryland Hospital Benchmark: 3.6
GOAL 13: Encourage patients’ active involvement
in their own care as a patient safety
strategy.
Goal 15: The organization identifies safety risks
inherent in its patient population.
Goal 16: Improve recognition and response to
changes in patient condition.
Implemented via “Speak Up” pamphlet, which is provided to all patients upon admission.
Implemented via assessment tools.
Implemented in 2006 in response to 1000 Lives Campaign. Criteria was developed during 2006.During 2008, policy and procedure was revised as well as data collection process.
100% compliance (per mock tracers and accreditation survey results.
Same as above.
Baseline data from 2006
When compared to 2008
data does not show any
significant change in
patients’ outcomes.
Data reflects that process
is utilized when
Indicated
29
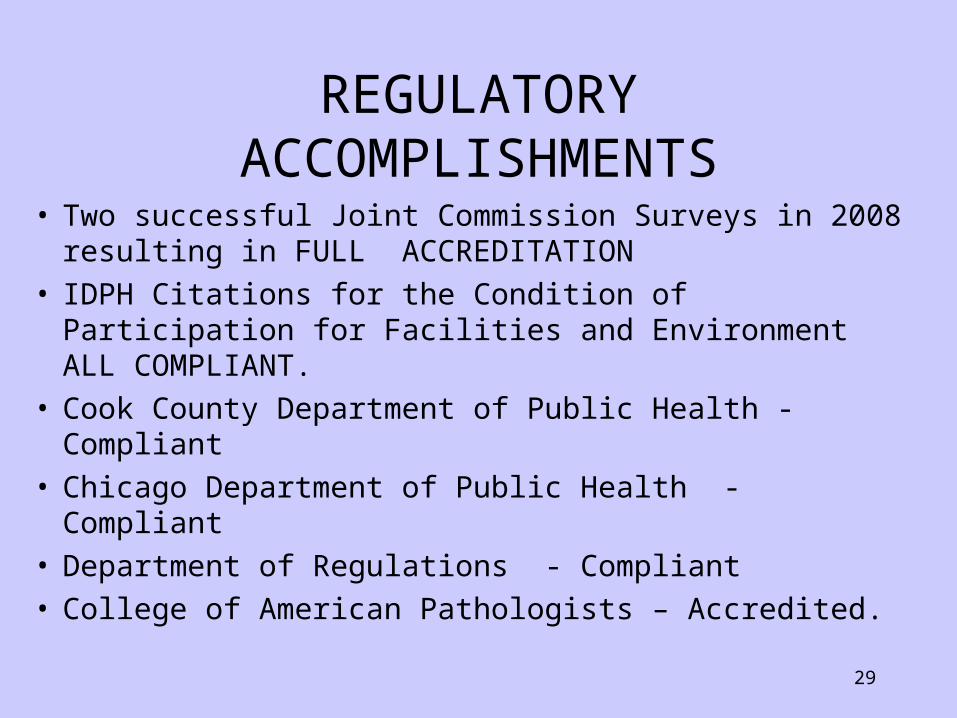
REGULATORY ACCOMPLISHMENTS
• Two successful Joint Commission Surveys in 2008 resulting in FULL ACCREDITATION
• IDPH Citations for the Condition of Participation for Facilities and Environment ALL COMPLIANT.
• Cook County Department of Public Health -Compliant• Chicago Department of Public Health - Compliant• Department of Regulations - Compliant• College of American Pathologists – Accredited.
30
2009 HOSPITAL-WIDE PROJECTS
• National Patient Safety Goals• Customer Service• Processing of Physician Orders• Improve STAT Medication Turn-around Time• Processing of Physician Orders