Embed Size (px)
Citation preview
SL3: Design and
Evaluation of
Improvement initiatives
December 10, 2017
These presenters have
nothing to disclose
Gareth Parry, Amrita Dasgupta, Don Goldmann

IHI Faculty 2
Amrita Dasgupta,
Senior Research
Associate
Gareth Parry
Senior Scientist
@GJParry03
Don Goldmann
Chief Medical and
Scientific Officer
@DAGoldmann
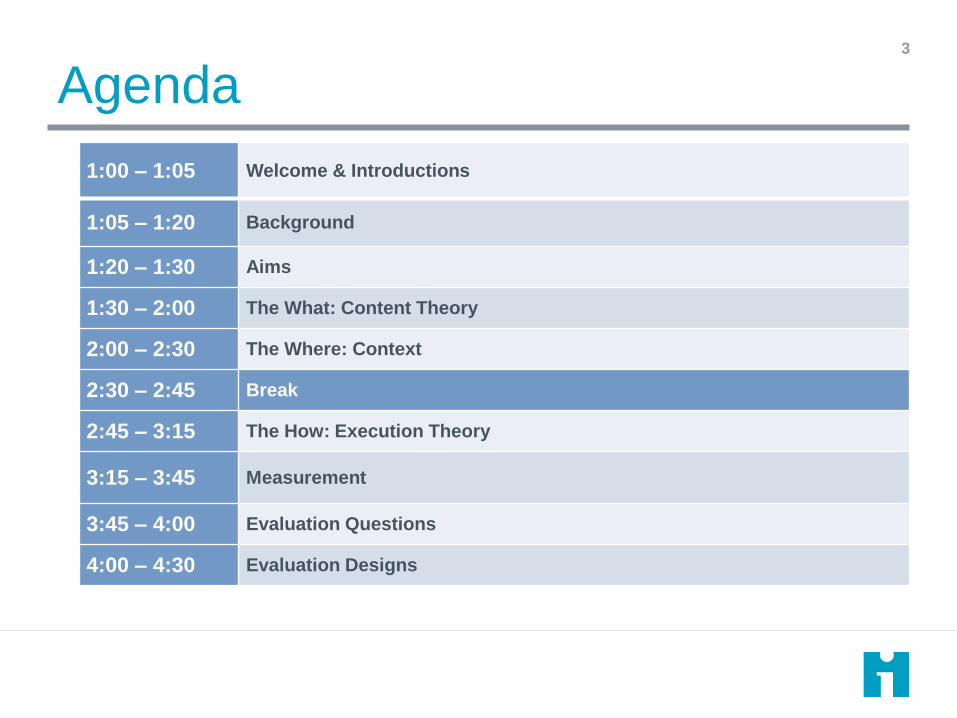
Agenda3
1:00 – 1:05 Welcome & Introductions
1:05 – 1:20 Background
1:20 – 1:30 Aims
1:30 – 2:00 The What: Content Theory
2:00 – 2:30 The Where: Context
2:30 – 2:45 Break
2:45 – 3:15 The How: Execution Theory
3:15 – 3:45 Measurement
3:45 – 4:00 Evaluation Questions
4:00 – 4:30 Evaluation Designs
Talk to your neighbor:What have you tried to improve this
week?

Background
December 10, 2017
These presenters have
nothing to disclose
Gareth Parry
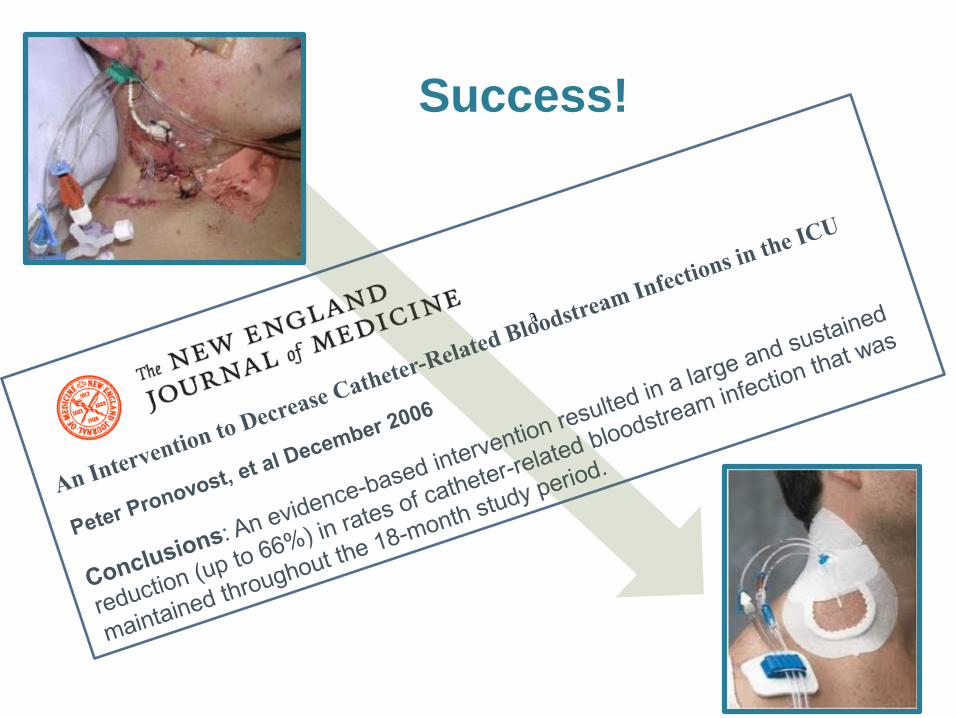
Success!
7
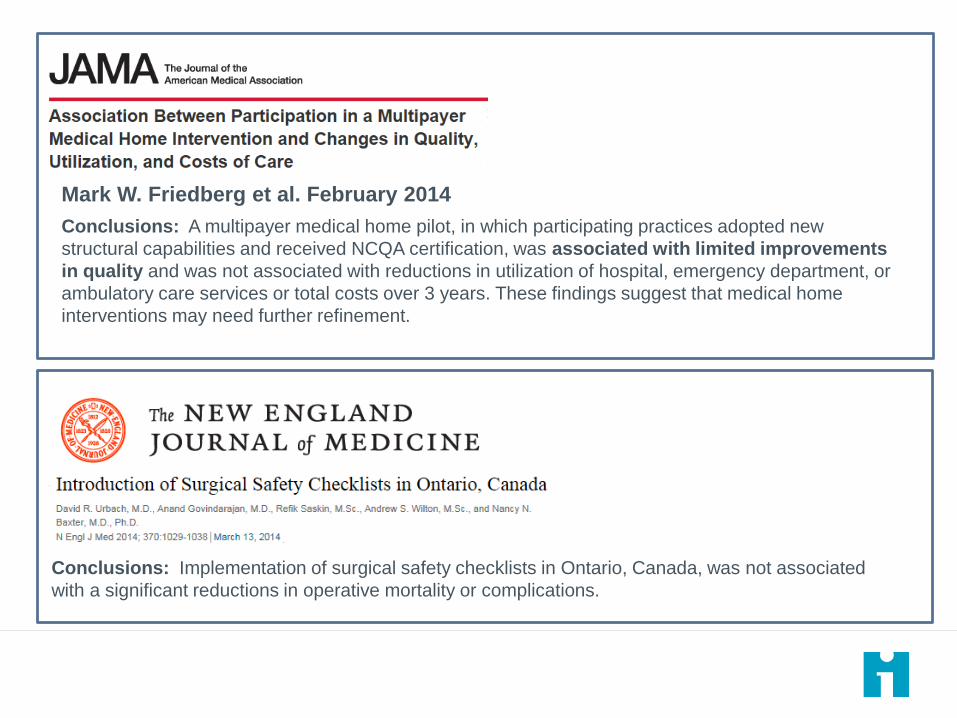
Conclusions: A multipayer medical home pilot, in which participating practices adopted new
structural capabilities and received NCQA certification, was associated with limited improvements
in quality and was not associated with reductions in utilization of hospital, emergency department, or
ambulatory care services or total costs over 3 years. These findings suggest that medical home
interventions may need further refinement.
Mark W. Friedberg et al. February 2014
Conclusions: Implementation of surgical safety checklists in Ontario, Canada, was not associated
with a significant reductions in operative mortality or complications.
8
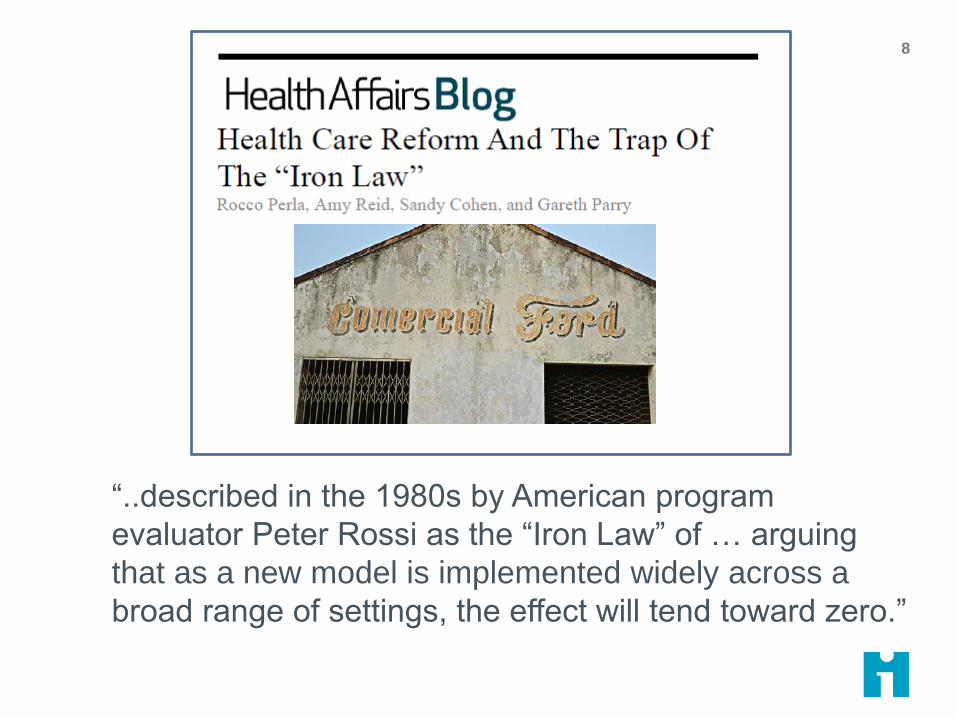
“..described in the 1980s by American program
evaluator Peter Rossi as the “Iron Law” of … arguing
that as a new model is implemented widely across a
broad range of settings, the effect will tend toward zero.”
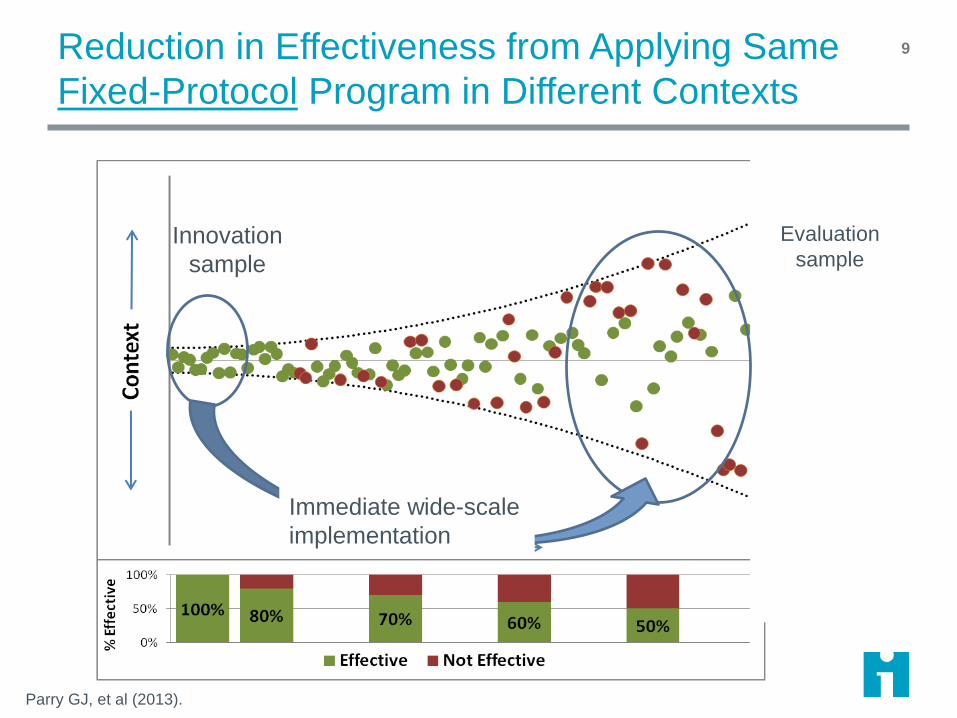
Innovation
sample
Evaluation
sample
Immediate wide-scale
implementation
9Reduction in Effectiveness from Applying Same
Fixed-Protocol Program in Different Contexts
Parry GJ, et al (2013).
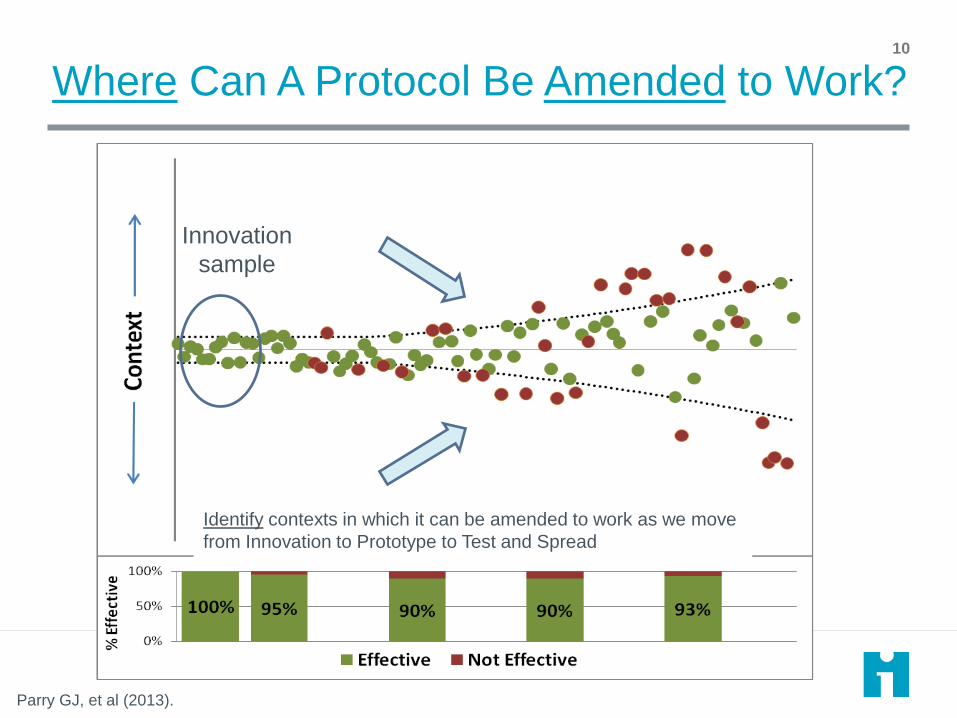
Where Can A Protocol Be Amended to Work?10
Identify contexts in which it can be amended to work as we move
from Innovation to Prototype to Test and Spread
Innovation
sample
Parry GJ, et al (2013).
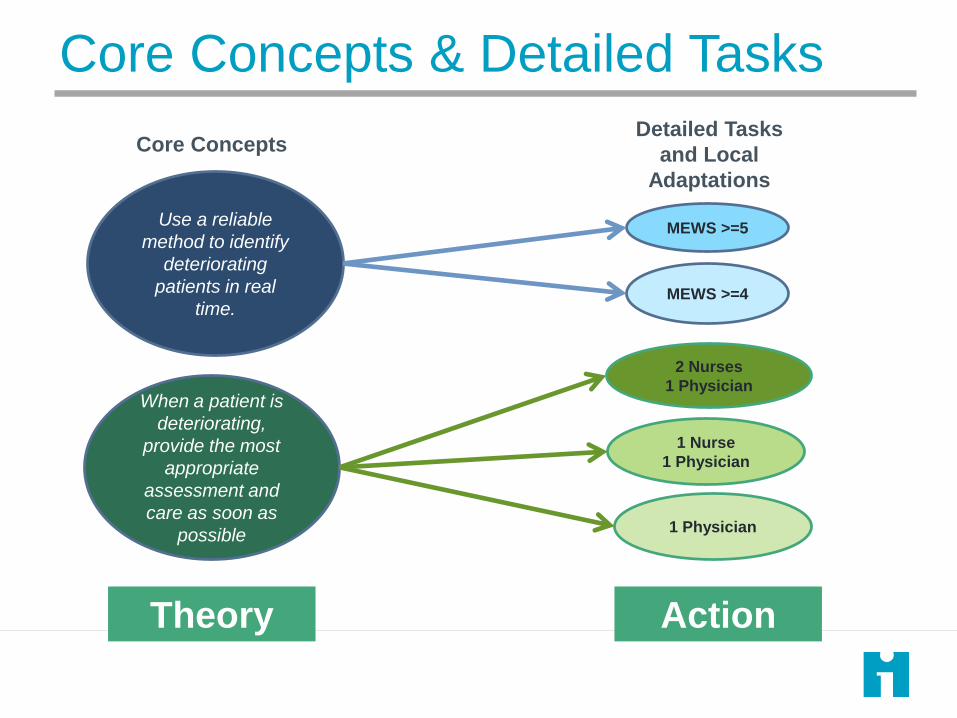
Core Concepts & Detailed Tasks
MEWS >=5Use a reliable
method to identify
deteriorating
patients in real
time.
When a patient is
deteriorating,
provide the most
appropriate
assessment and
care as soon as
possible
MEWS >=4
2 Nurses
1 Physician
1 Nurse
1 Physician
1 Physician
ActionTheory
Core ConceptsDetailed Tasks
and Local
Adaptations

Degree of Belief12
ActEvidence
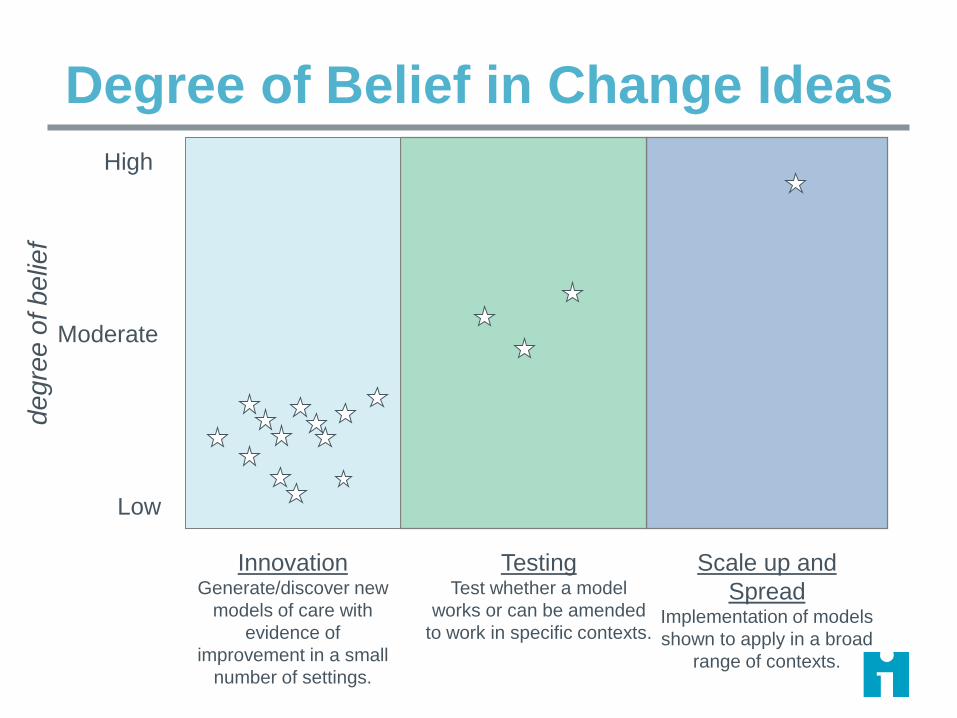
Degree of Belief in Change Ideasd
eg
ree
of b
elie
f
InnovationGenerate/discover new
models of care with
evidence of
improvement in a small
number of settings.
TestingTest whether a model
works or can be amended
to work in specific contexts.
Scale up and
SpreadImplementation of models
shown to apply in a broad
range of contexts.
High
Moderate
Low
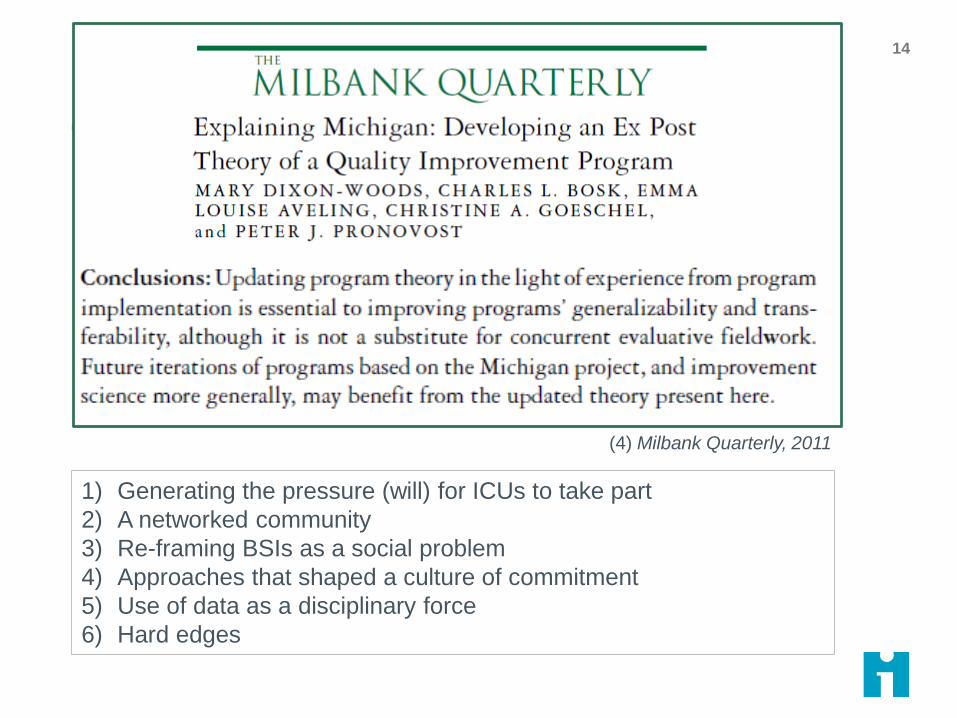
1) Generating the pressure (will) for ICUs to take part
2) A networked community
3) Re-framing BSIs as a social problem
4) Approaches that shaped a culture of commitment
5) Use of data as a disciplinary force
6) Hard edges
(4) Milbank Quarterly, 2011
14
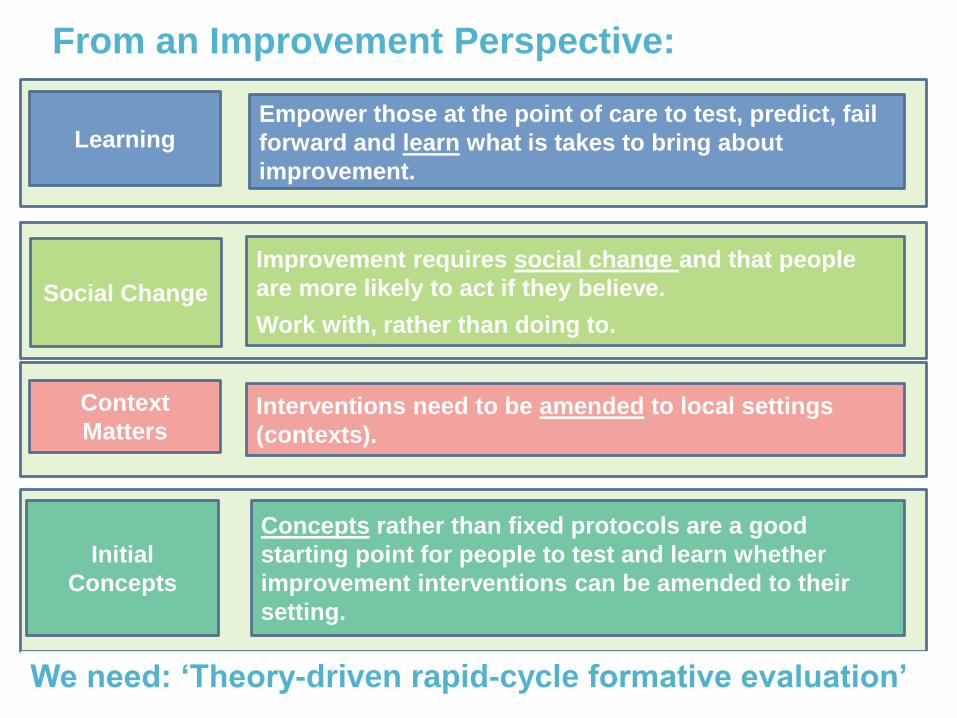
From an Improvement Perspective:
Initial
Concepts
Concepts rather than fixed protocols are a good
starting point for people to test and learn whether
improvement interventions can be amended to their
setting.
Social Change
Improvement requires social change and that people
are more likely to act if they believe.
Work with, rather than doing to.
Context
MattersInterventions need to be amended to local settings
(contexts).
LearningEmpower those at the point of care to test, predict, fail
forward and learn what is takes to bring about
improvement.
We need: ‘Theory-driven rapid-cycle formative evaluation’

Salzburg Global Seminar Session 565
Improvers and Evaluators as best friends
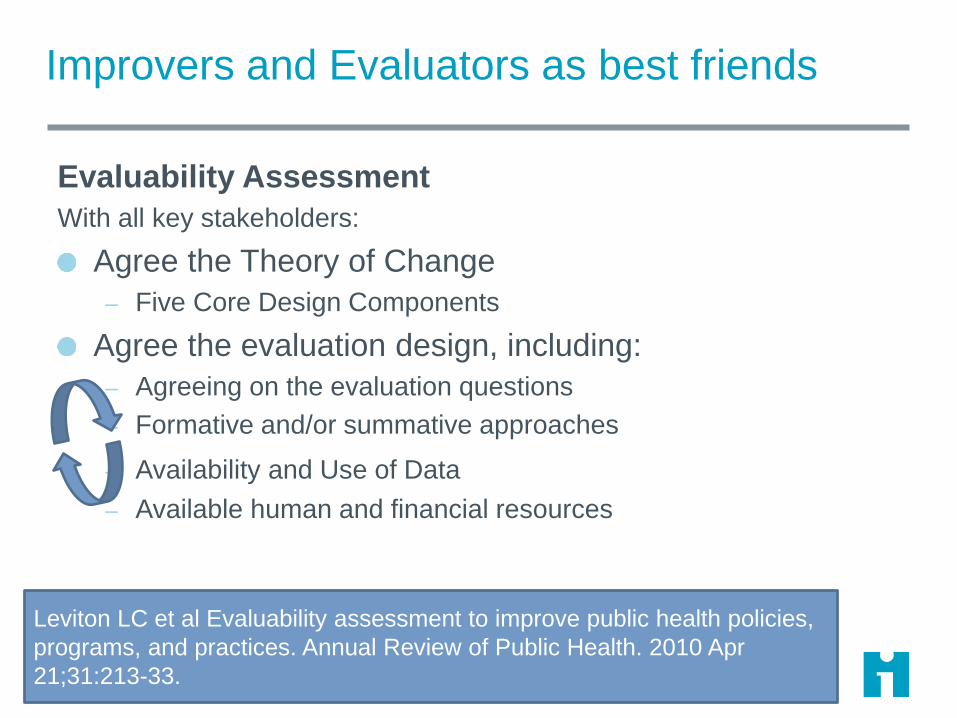
Evaluability Assessment
With all key stakeholders:
Agree the Theory of Change
– Five Core Design Components
Agree the evaluation design, including:
– Agreeing on the evaluation questions
– Formative and/or summative approaches
– Availability and Use of Data
– Available human and financial resources
Leviton LC et al Evaluability assessment to improve public health policies,
programs, and practices. Annual Review of Public Health. 2010 Apr
21;31:213-33.
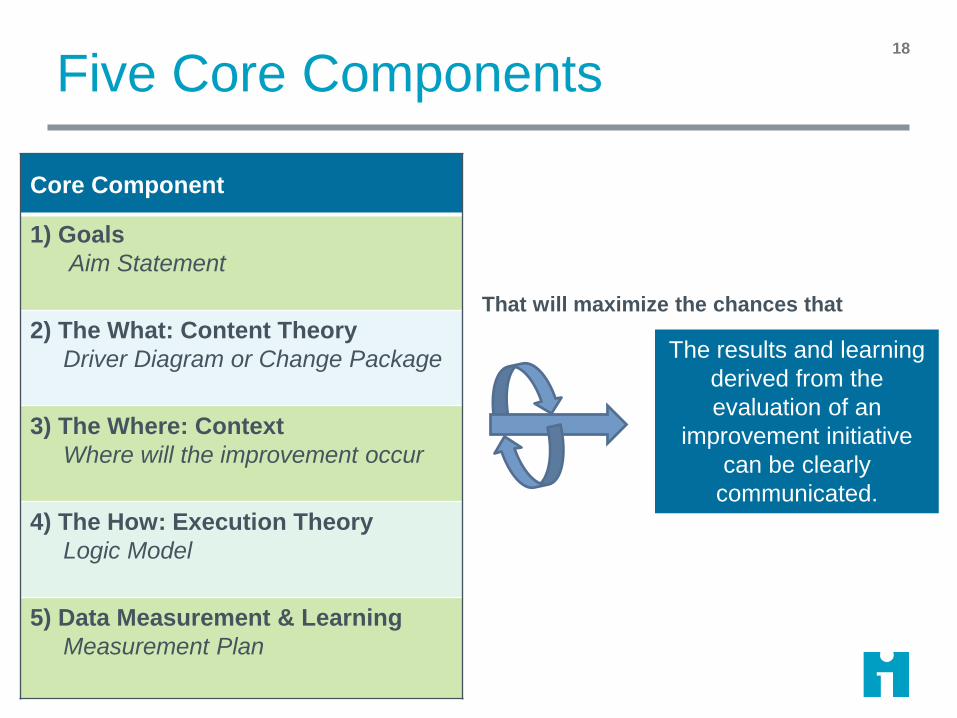
Five Core Components18
Core Component
1) Goals
Aim Statement
2) The What: Content Theory
Driver Diagram or Change Package
3) The Where: Context
Where will the improvement occur
4) The How: Execution Theory
Logic Model
5) Data Measurement & Learning
Measurement Plan
The results and learning
derived from the
evaluation of an
improvement initiative
can be clearly
communicated.
That will maximize the chances that
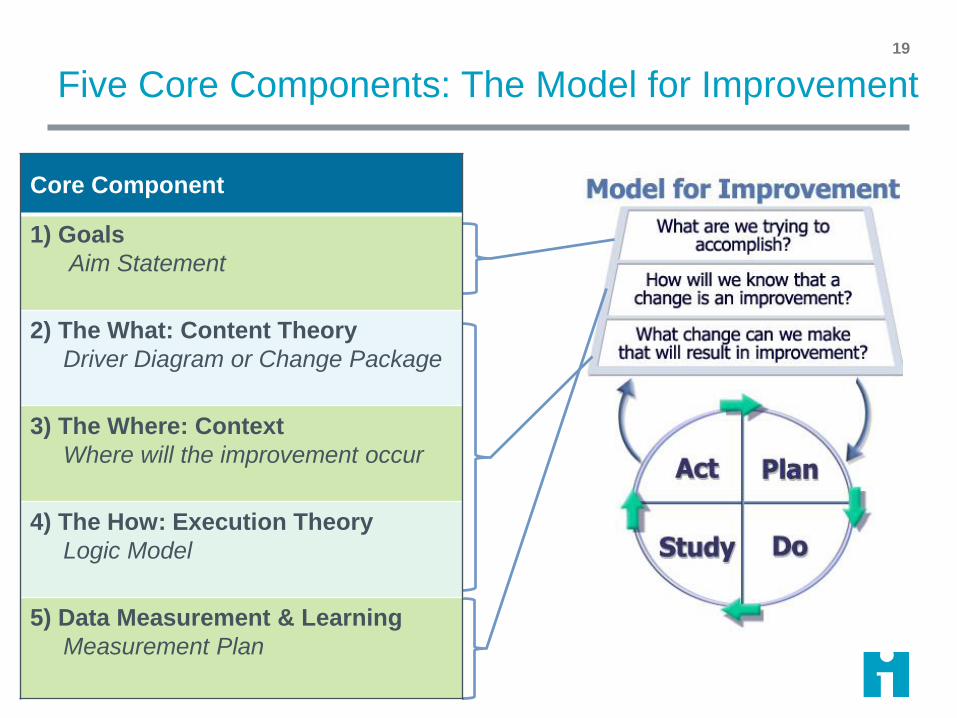
Five Core Components: The Model for Improvement19
Core Component
1) Goals
Aim Statement
2) The What: Content Theory
Driver Diagram or Change Package
3) The Where: Context
Where will the improvement occur
4) The How: Execution Theory
Logic Model
5) Data Measurement & Learning
Measurement Plan

Five Core Components

1) AimsAmrita Dasgupta
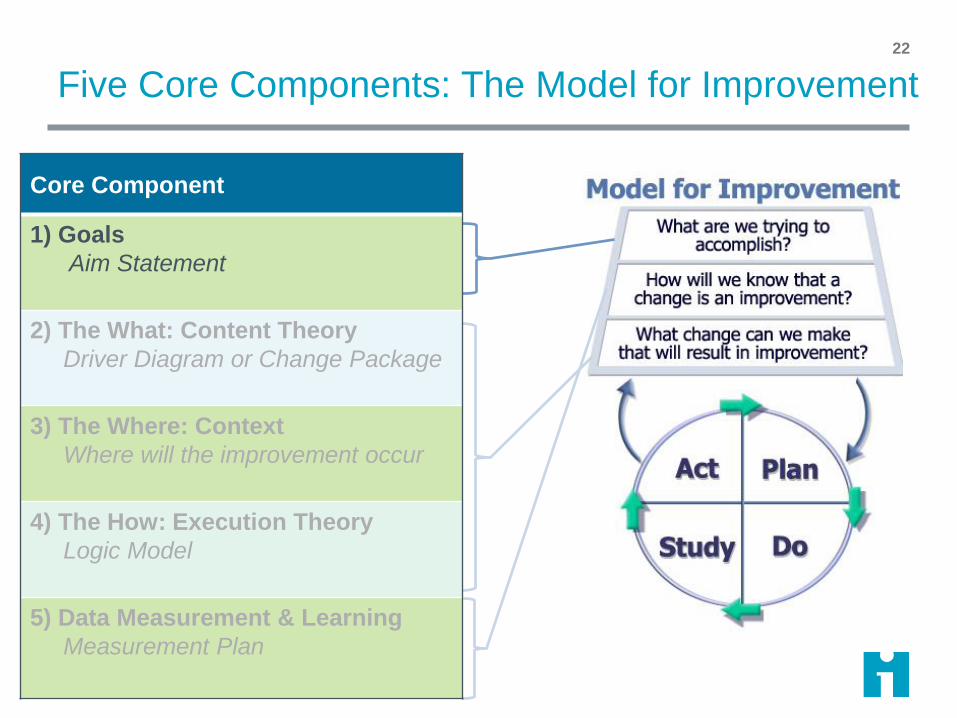
Five Core Components: The Model for Improvement22
Core Component
1) Goals
Aim Statement
2) The What: Content Theory
Driver Diagram or Change Package
3) The Where: Context
Where will the improvement occur
4) The How: Execution Theory
Logic Model
5) Data Measurement & Learning
Measurement Plan
23
Hope is not a plan.
Some is not a number.
Soon is not a time.
-Don Berwick, MD
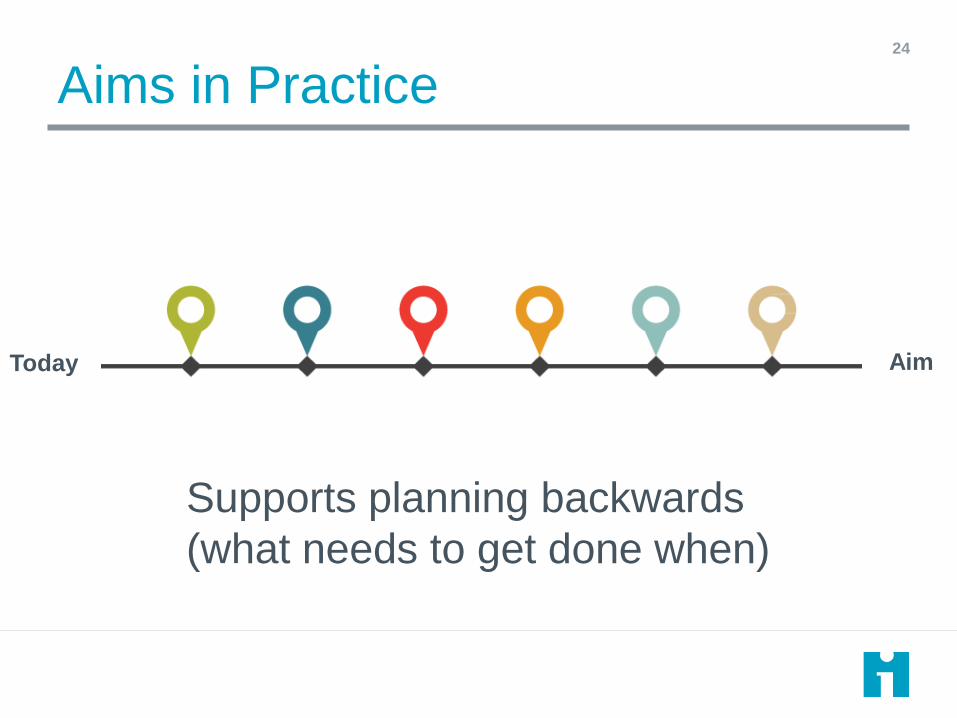
Aims in Practice24
Supports planning backwards
(what needs to get done when)
Today Aim
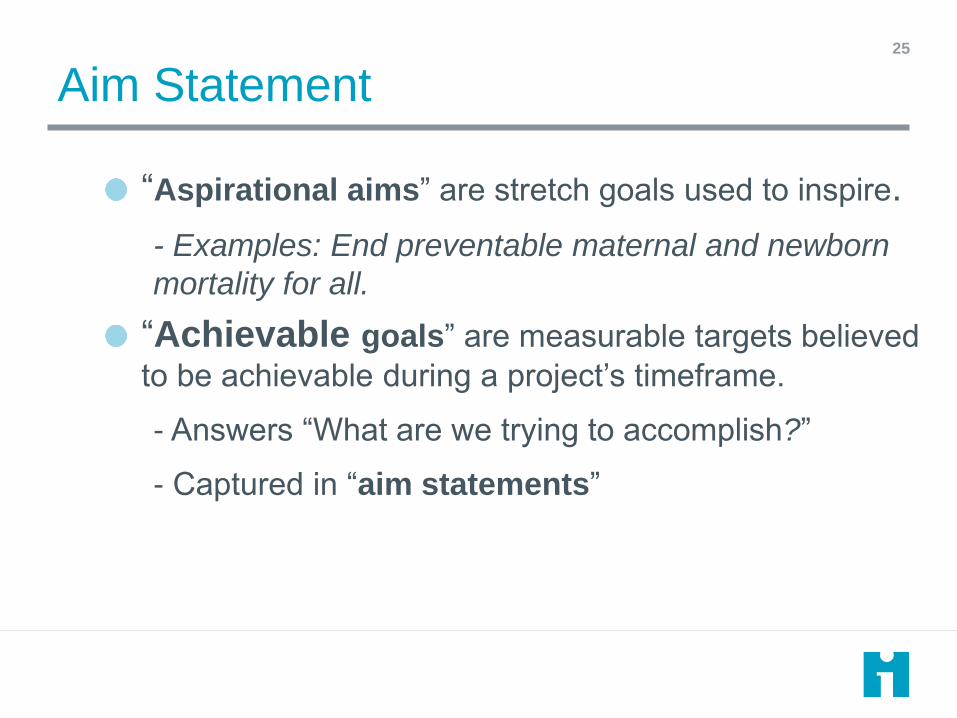
Aim Statement25
“Aspirational aims” are stretch goals used to inspire.
- Examples: End preventable maternal and newborn
mortality for all.
“Achievable goals” are measurable targets believed
to be achievable during a project’s timeframe.
- Answers “What are we trying to accomplish?”
- Captured in “aim statements”
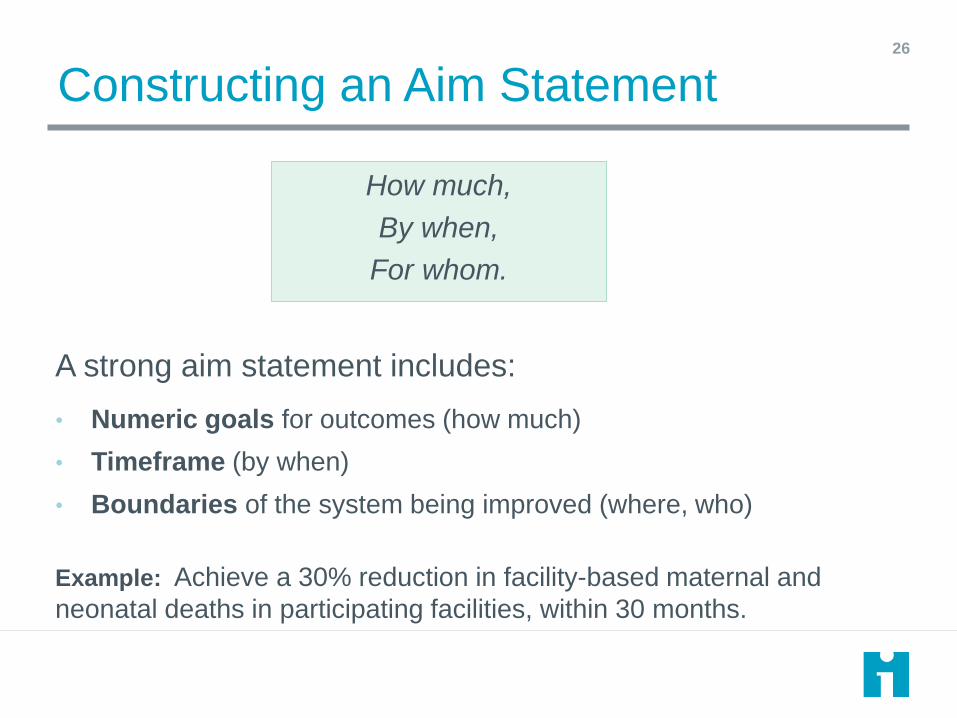
Constructing an Aim Statement26
How much,
By when,
For whom.
A strong aim statement includes:
• Numeric goals for outcomes (how much)
• Timeframe (by when)
• Boundaries of the system being improved (where, who)
Example: Achieve a 30% reduction in facility-based maternal and
neonatal deaths in participating facilities, within 30 months.
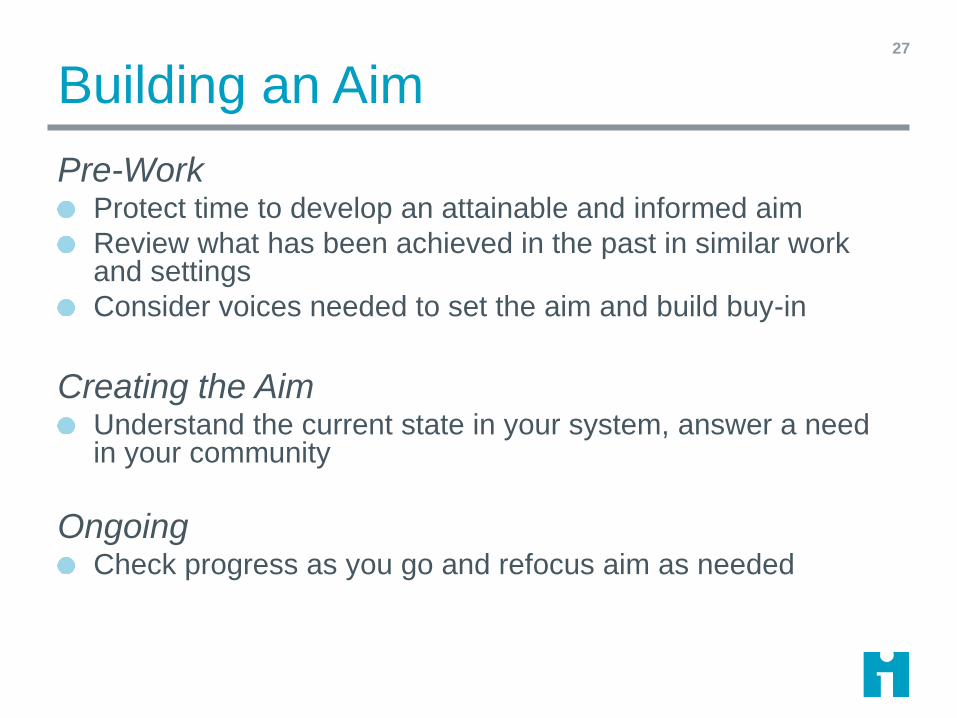
Building an Aim
Pre-Work Protect time to develop an attainable and informed aim
Review what has been achieved in the past in similar work and settings
Consider voices needed to set the aim and build buy-in
Creating the Aim Understand the current state in your system, answer a need in your community
Ongoing Check progress as you go and refocus aim as needed
27
Which of these steps in building an aim have
you done well?
Which could you do better?
Reflection: Building an Aim
P29
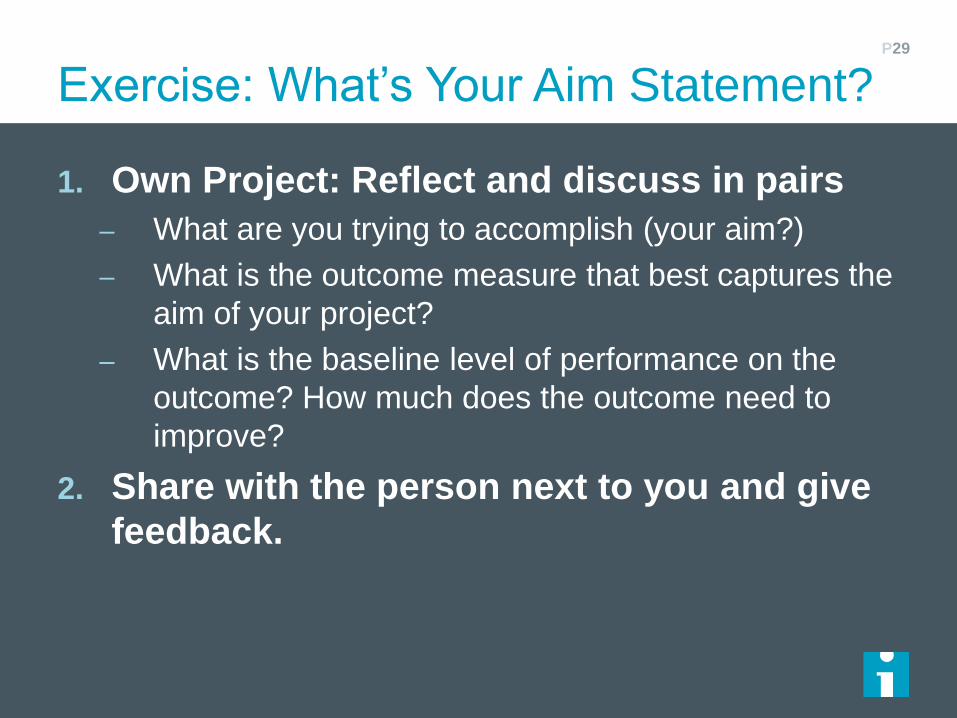
1. Own Project: Reflect and discuss in pairs
– What are you trying to accomplish (your aim?)
– What is the outcome measure that best captures the
aim of your project?
– What is the baseline level of performance on the
outcome? How much does the outcome need to
improve?
2. Share with the person next to you and give
feedback.
Exercise: What’s Your Aim Statement?

2) Content TheoryAmrita Dasgupta
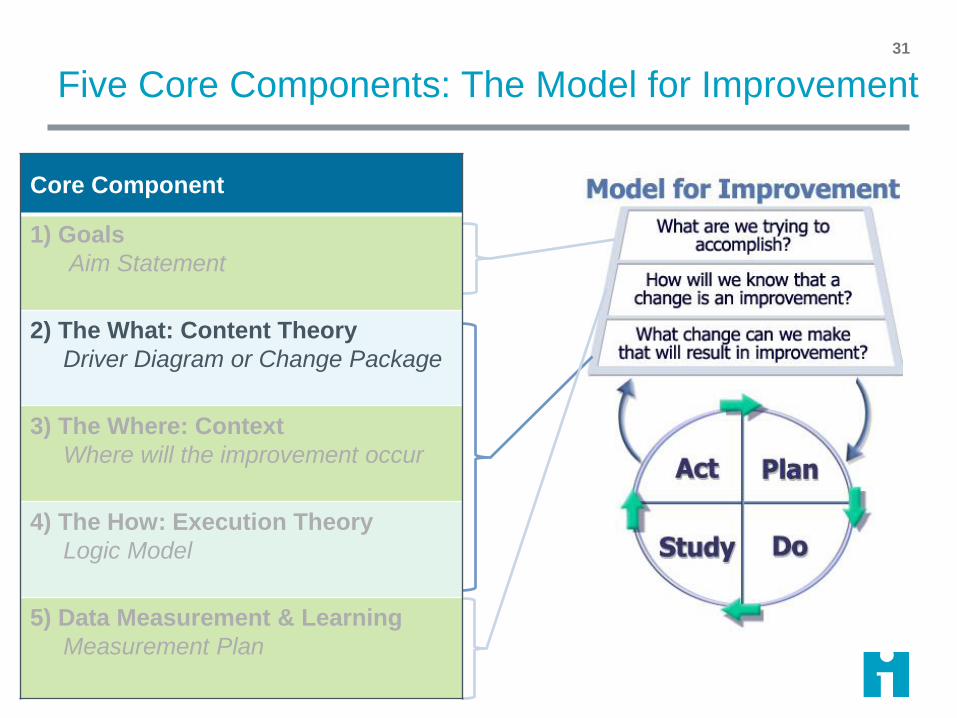
Five Core Components: The Model for Improvement31
Core Component
1) Goals
Aim Statement
2) The What: Content Theory
Driver Diagram or Change Package
3) The Where: Context
Where will the improvement occur
4) The How: Execution Theory
Logic Model
5) Data Measurement & Learning
Measurement Plan
Content Theory (The What)
What changes will be made that result in
improved outcomes?
The processes we predict will improve
patient/community outcomes.
A driver diagram is a visualization of this theory.
32
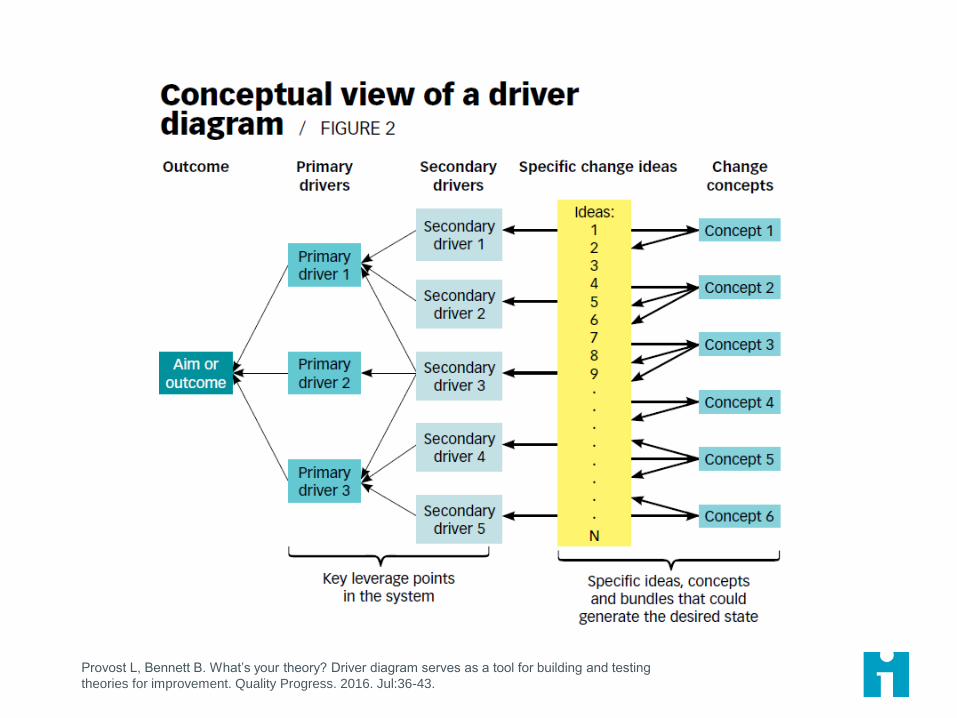
Provost L, Bennett B. What’s your theory? Driver diagram serves as a tool for building and testing
theories for improvement. Quality Progress. 2016. Jul:36-43.
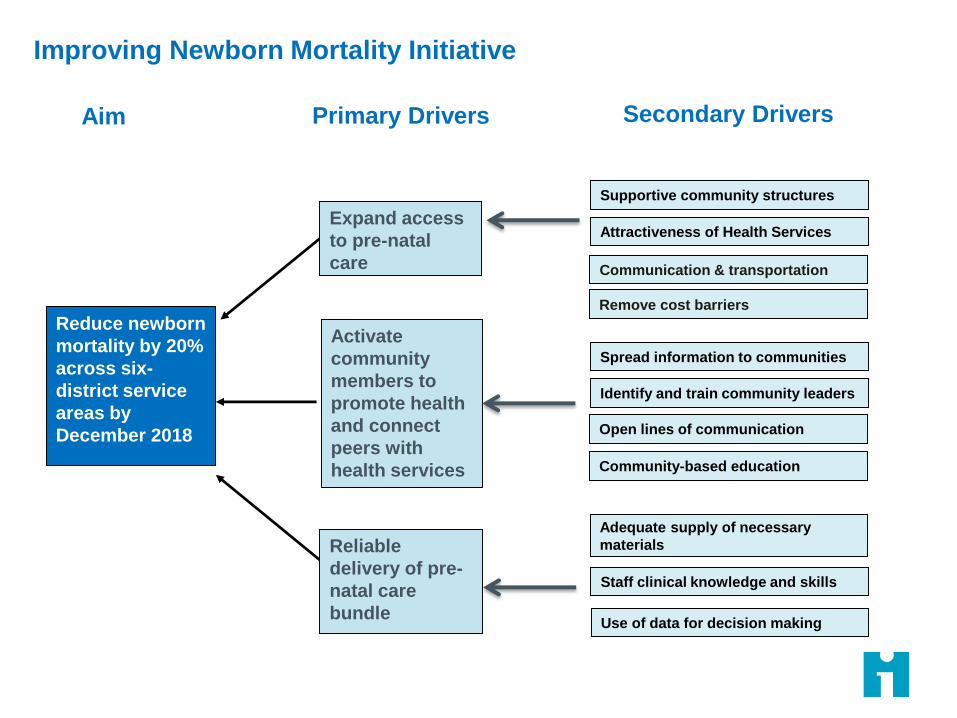
Primary Drivers Secondary DriversAim
Reduce newborn
mortality by 20%
across six-
district service
areas by
December 2018
Staff clinical knowledge and skills
Adequate supply of necessary
materials
Use of data for decision making
Expand access
to pre-natal
care
Activate
community
members to
promote health
and connect
peers with
health services
Reliable
delivery of pre-
natal care
bundle
Supportive community structures
Attractiveness of Health Services
Communication & transportation
Remove cost barriers
Spread information to communities
Identify and train community leaders
Open lines of communication
Community-based education
Improving Newborn Mortality Initiative
Exercise: Prioritizing Drivers
Brainstorm a list of drivers that impact your aim.
– Which drivers do we believe will deliver the biggest
impact?
– Which ones will be easiest to work on? (Factors
include personnel, culture, resources)
– What is our current level of performance on these
drivers?
Select 3 as your “primary drivers.”

3) The Where: ContextGareth Parry
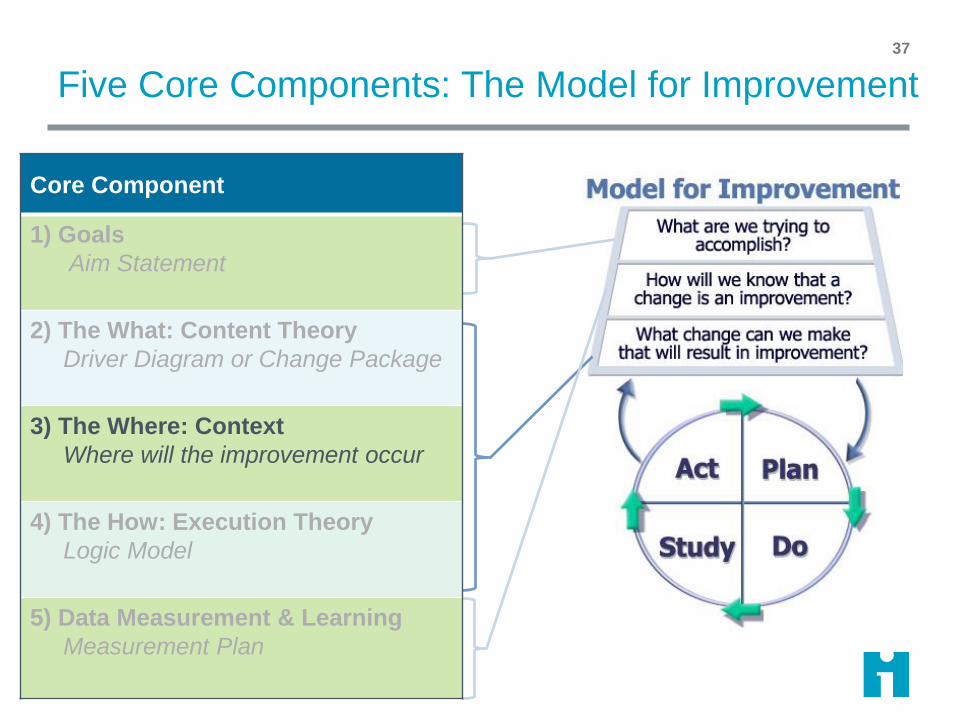
Five Core Components: The Model for Improvement37
Core Component
1) Goals
Aim Statement
2) The What: Content Theory
Driver Diagram or Change Package
3) The Where: Context
Where will the improvement occur
4) The How: Execution Theory
Logic Model
5) Data Measurement & Learning
Measurement Plan
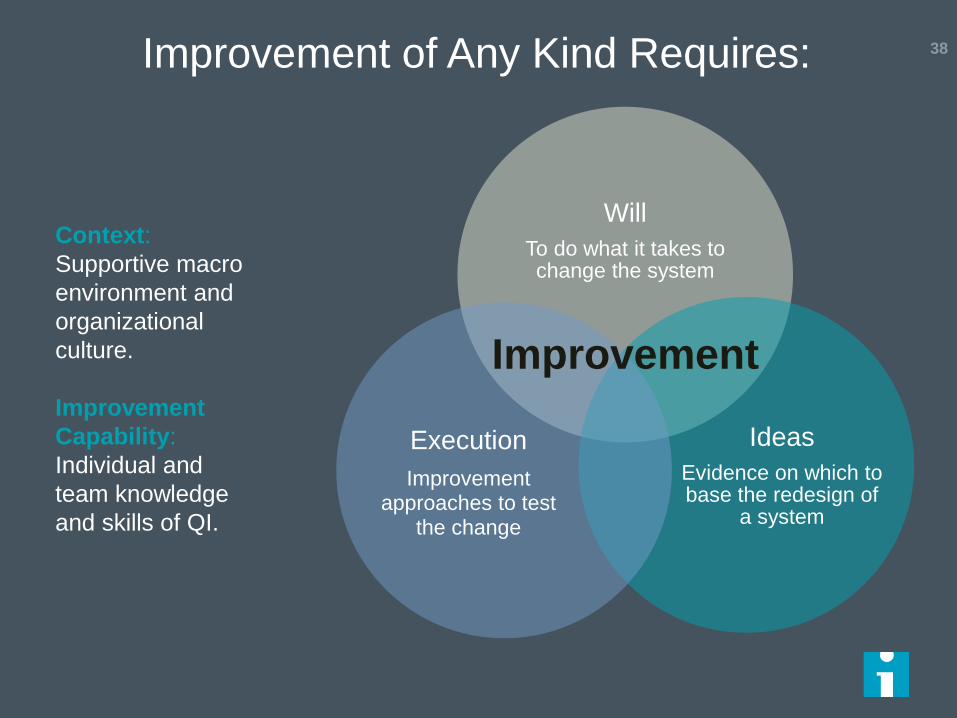
38
Will
To do what it takes to change the system
Ideas
Evidence on which to base the redesign of
a system
Execution
Improvement approaches to test
the change
Improvement
Context:
Supportive macro
environment and
organizational
culture.
Improvement
Capability:
Individual and
team knowledge
and skills of QI.
Improvement of Any Kind Requires:
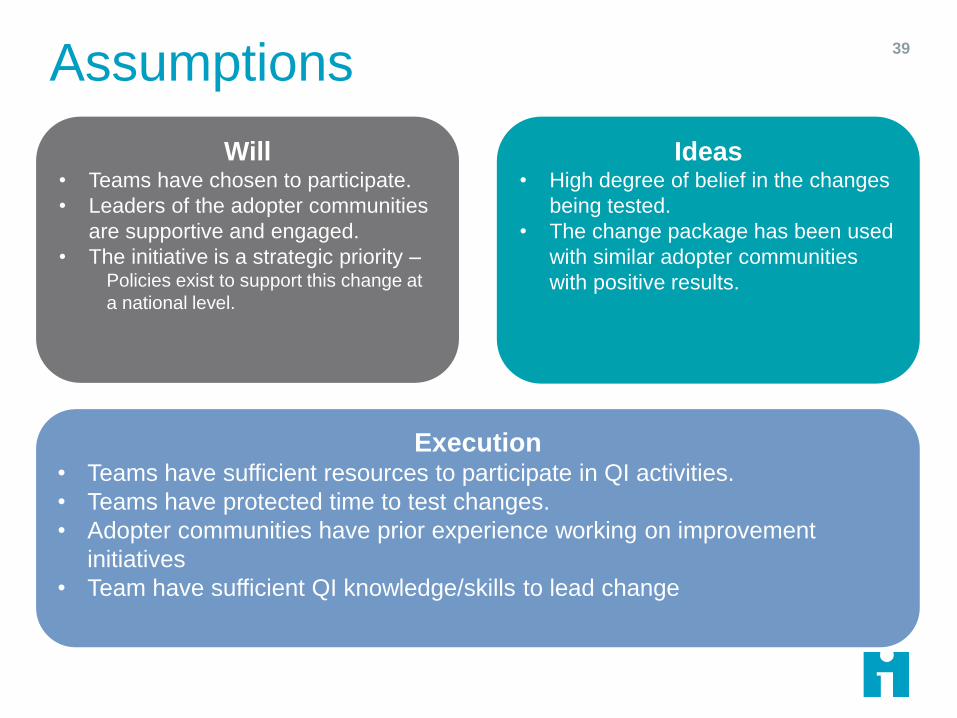
39
Assumptions
Will• Teams have chosen to participate.
• Leaders of the adopter communities
are supportive and engaged.
• The initiative is a strategic priority –Policies exist to support this change at
a national level.
Ideas• High degree of belief in the changes
being tested.
• The change package has been used
with similar adopter communities
with positive results.
Execution• Teams have sufficient resources to participate in QI activities.
• Teams have protected time to test changes.
• Adopter communities have prior experience working on improvement
initiatives
• Team have sufficient QI knowledge/skills to lead change
40
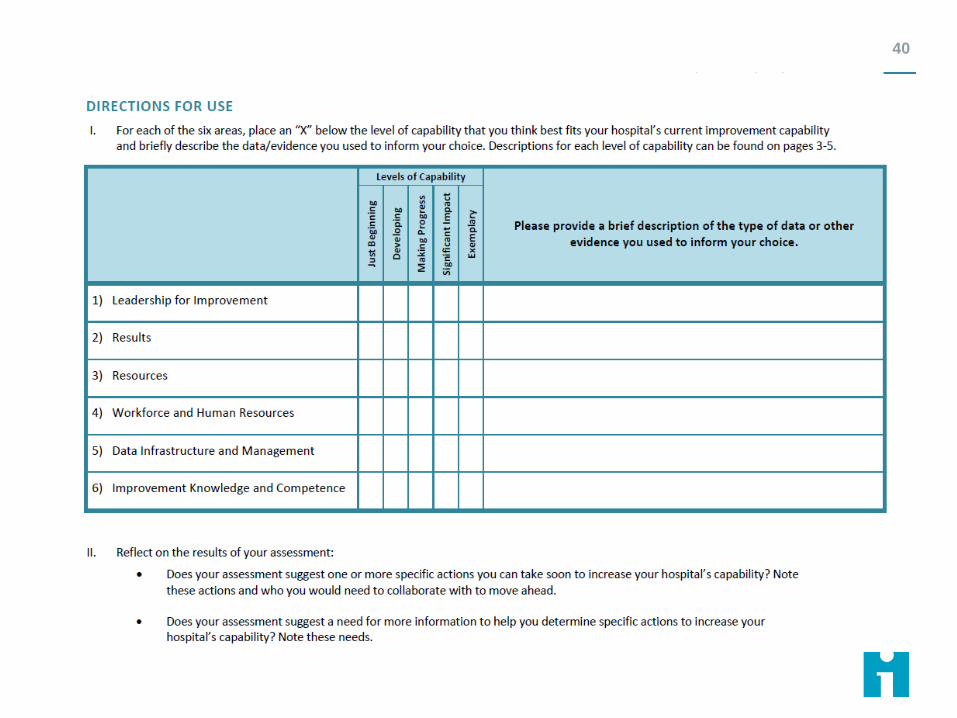
Improvement Capability Self-Assessment 41
1. Leadership for Improvement
2. Results
3. Resources
4. Workforce and Human Resources
5. Data Infrastructure and Management
6. Improvement Knowledge & Competence
How can we use this tool?42
To stimulate discussion about areas of strength and
weakness;
To better understand your health system’s improvement
capability; and
To help you reflect on and evaluate specific
improvement efforts.
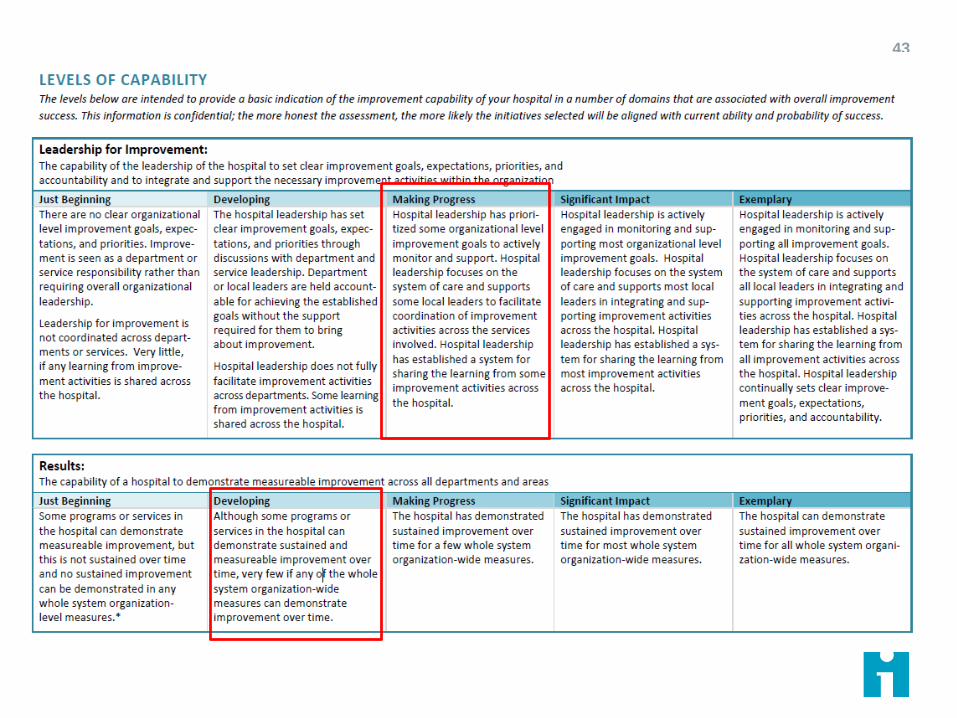
43
Complete the assessment
Choose an organization you are working with in your
improvement initiative:
1. Assess where the organization falls on one of the
domains of the assessment.
2. Reflect on the following:
• How does your assessment impact on the design of your
improvement imitative?
• What activities may you need to include and in what order?
P44

Break
4) Execution TheoryAmrita Dasgupta
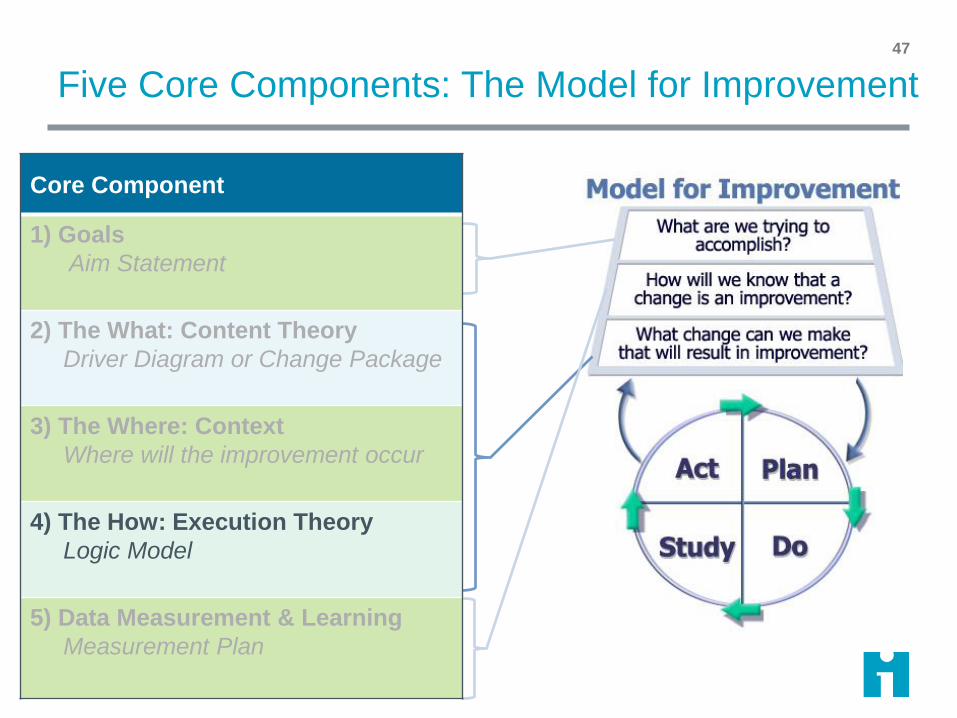
Five Core Components: The Model for Improvement47
Core Component
1) Goals
Aim Statement
2) The What: Content Theory
Driver Diagram or Change Package
3) The Where: Context
Where will the improvement occur
4) The How: Execution Theory
Logic Model
5) Data Measurement & Learning
Measurement Plan
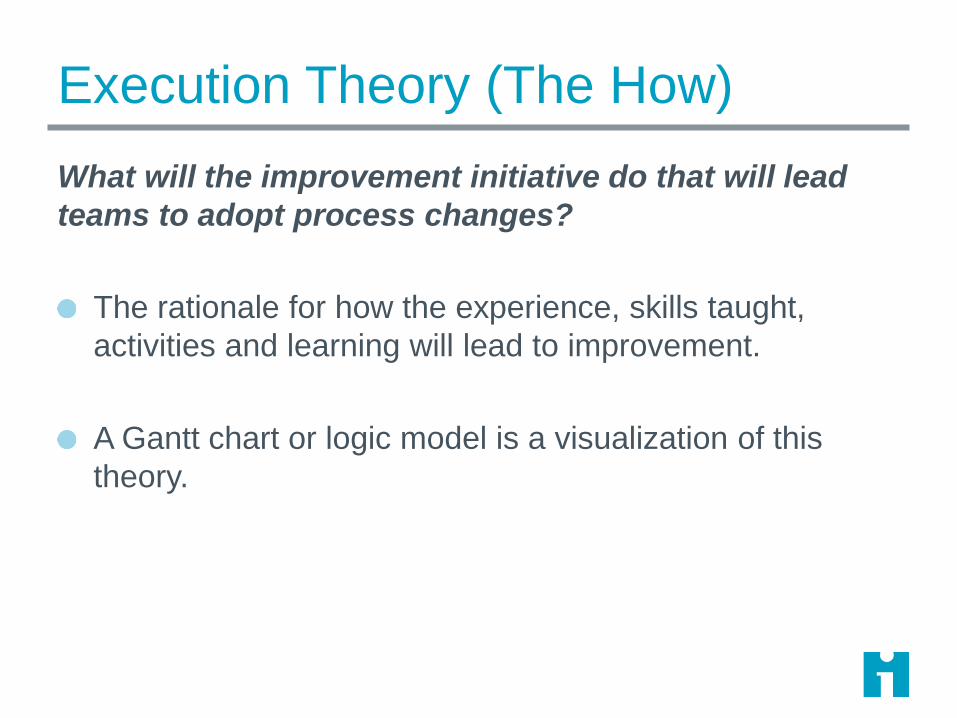
Execution Theory (The How)
What will the improvement initiative do that will lead
teams to adopt process changes?
The rationale for how the experience, skills taught,
activities and learning will lead to improvement.
A Gantt chart or logic model is a visualization of this
theory.
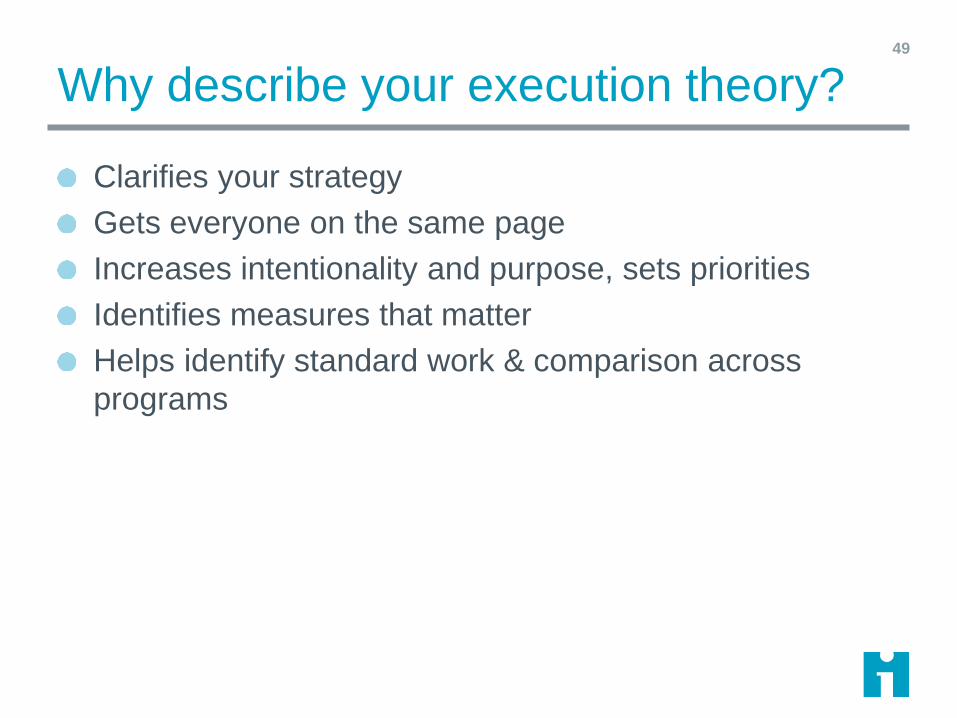
Why describe your execution theory?
Clarifies your strategy
Gets everyone on the same page
Increases intentionality and purpose, sets priorities
Identifies measures that matter
Helps identify standard work & comparison across
programs
49
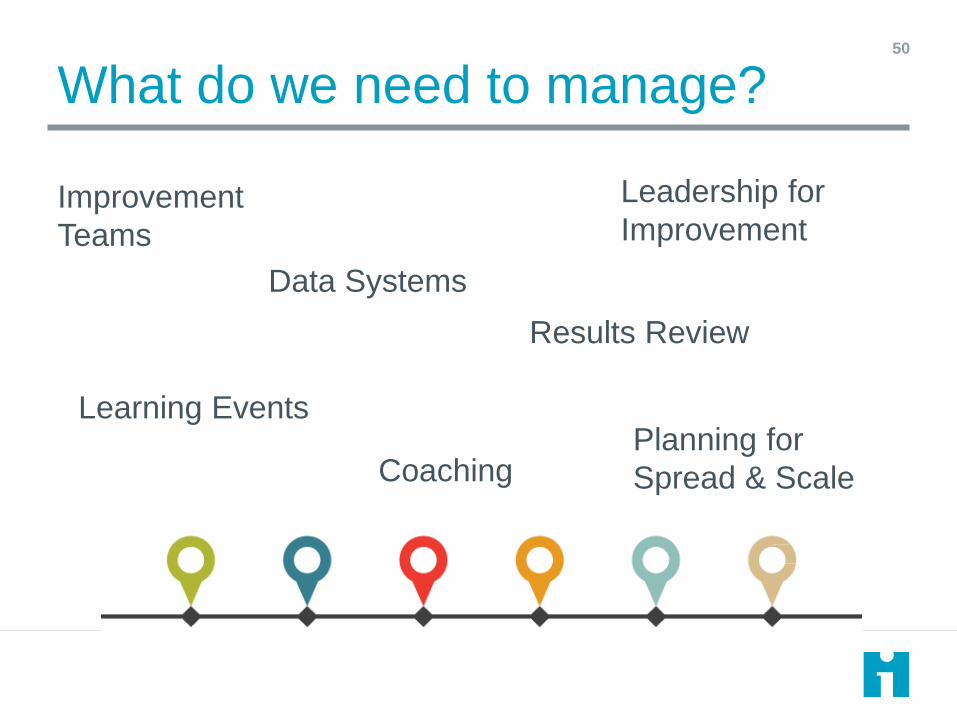
What do we need to manage?50
Data Systems
Results Review
Improvement
Teams
Learning Events
CoachingPlanning for
Spread & Scale
Leadership for
Improvement
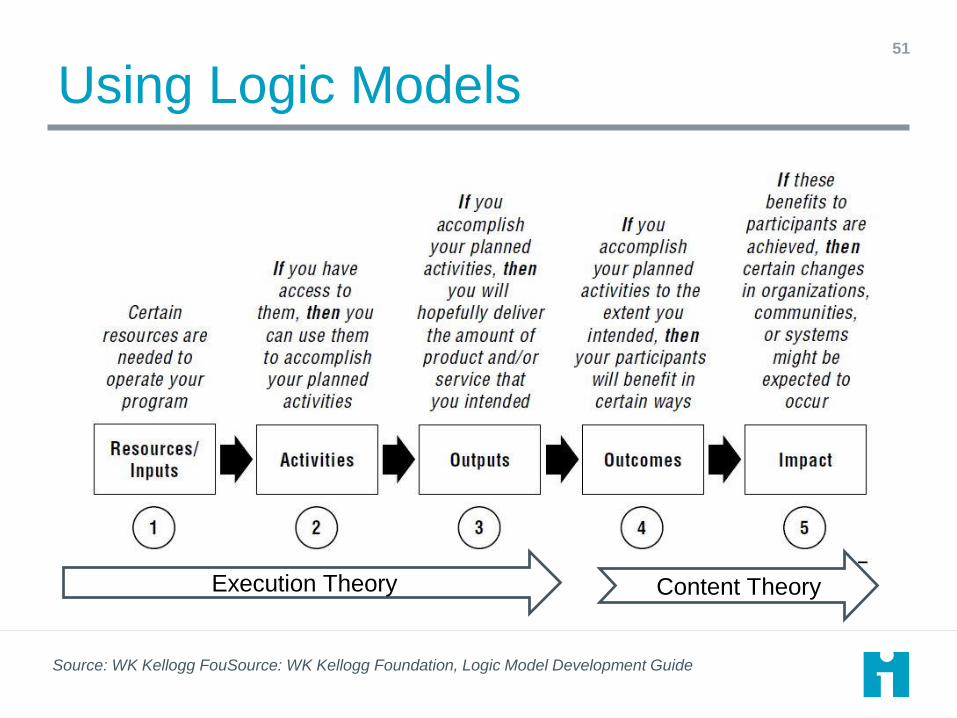
Using Logic Models51
Source: WK Kellogg FouSource: WK Kellogg Foundation, Logic Model Development Guide
Execution Theory Content Theory
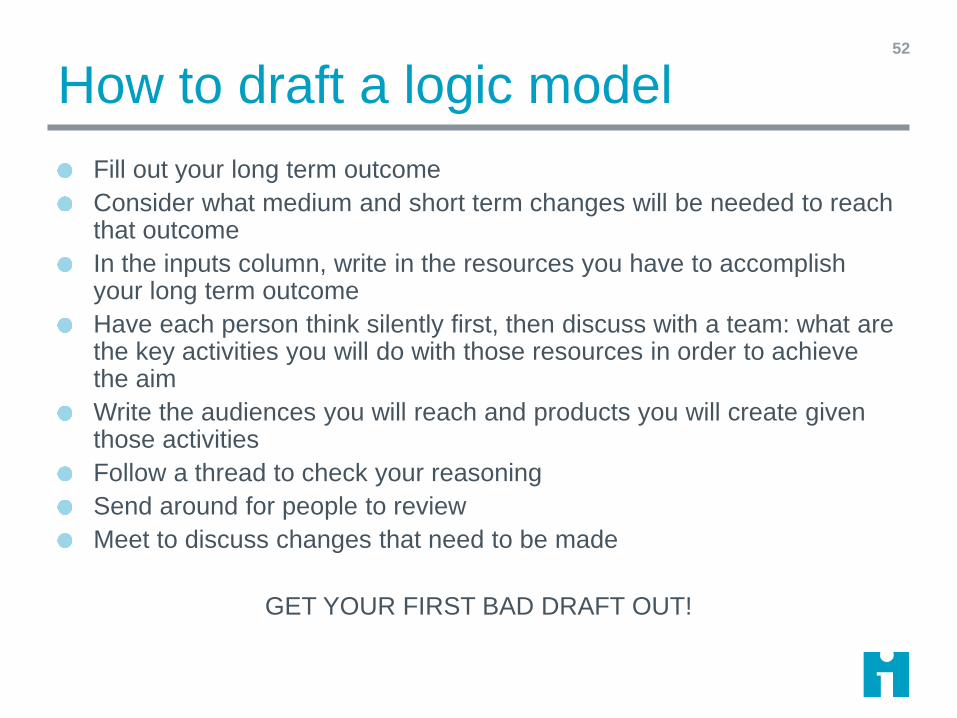
How to draft a logic model
Fill out your long term outcome
Consider what medium and short term changes will be needed to reach that outcome
In the inputs column, write in the resources you have to accomplish your long term outcome
Have each person think silently first, then discuss with a team: what are the key activities you will do with those resources in order to achieve the aim
Write the audiences you will reach and products you will create given those activities
Follow a thread to check your reasoning
Send around for people to review
Meet to discuss changes that need to be made
GET YOUR FIRST BAD DRAFT OUT!
52
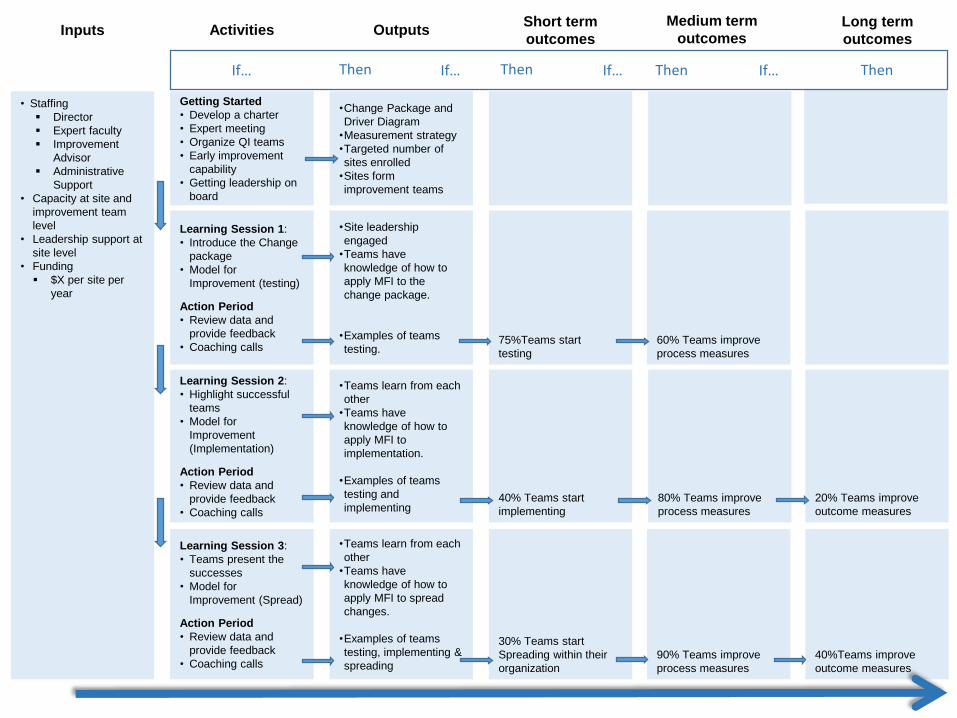
Getting Started
• Develop a charter
• Expert meeting
• Organize QI teams
• Early improvement
capability
• Getting leadership on
board
Learning Session 1:
• Introduce the Change
package
• Model for
Improvement (testing)
Action Period
• Review data and
provide feedback
• Coaching calls
Learning Session 2:
• Highlight successful
teams
• Model for
Improvement
(Implementation)
Action Period
• Review data and
provide feedback
• Coaching calls
•Site leadership
engaged
•Teams have
knowledge of how to
apply MFI to the
change package.
•Examples of teams
testing.
•Change Package and
Driver Diagram
•Measurement strategy
•Targeted number of
sites enrolled
•Sites form
improvement teams
Learning Session 3:
• Teams present the
successes
• Model for
Improvement (Spread)
Action Period
• Review data and
provide feedback
• Coaching calls
75%Teams start
testing
•Teams learn from each
other
•Teams have
knowledge of how to
apply MFI to spread
changes.
•Examples of teams
testing, implementing &
spreading
•Teams learn from each
other
•Teams have
knowledge of how to
apply MFI to
implementation.
•Examples of teams
testing and
implementing
30% Teams start
Spreading within their
organization
40% Teams start
implementing
60% Teams improve
process measures
80% Teams improve
process measures
90% Teams improve
process measures
40%Teams improve
outcome measures
20% Teams improve
outcome measures
• Staffing
Director
Expert faculty
Improvement
Advisor
Administrative
Support
• Capacity at site and
improvement team
level
• Leadership support at
site level
• Funding
$X per site per
year
Inputs Activities OutputsShort term
outcomes
Medium term
outcomes Long term
outcomes
Then If…If… If… If…Then Then Then
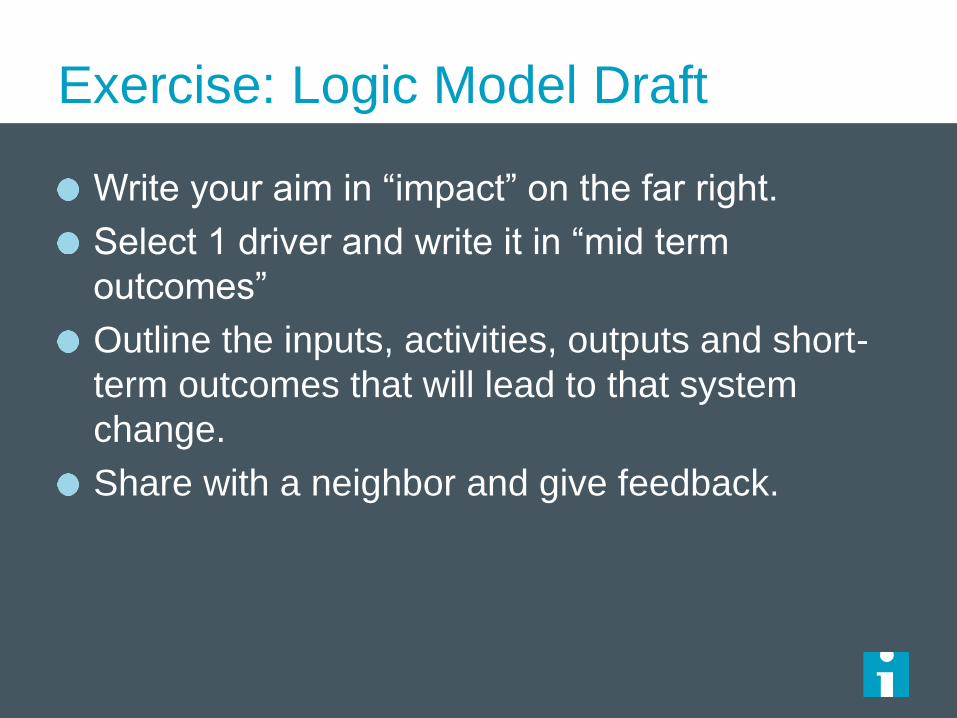
Exercise: Logic Model Draft
Write your aim in “impact” on the far right.
Select 1 driver and write it in “mid term
outcomes”
Outline the inputs, activities, outputs and short-
term outcomes that will lead to that system
change.
Share with a neighbor and give feedback.

5) Data, Measurement & LearningGareth Parry
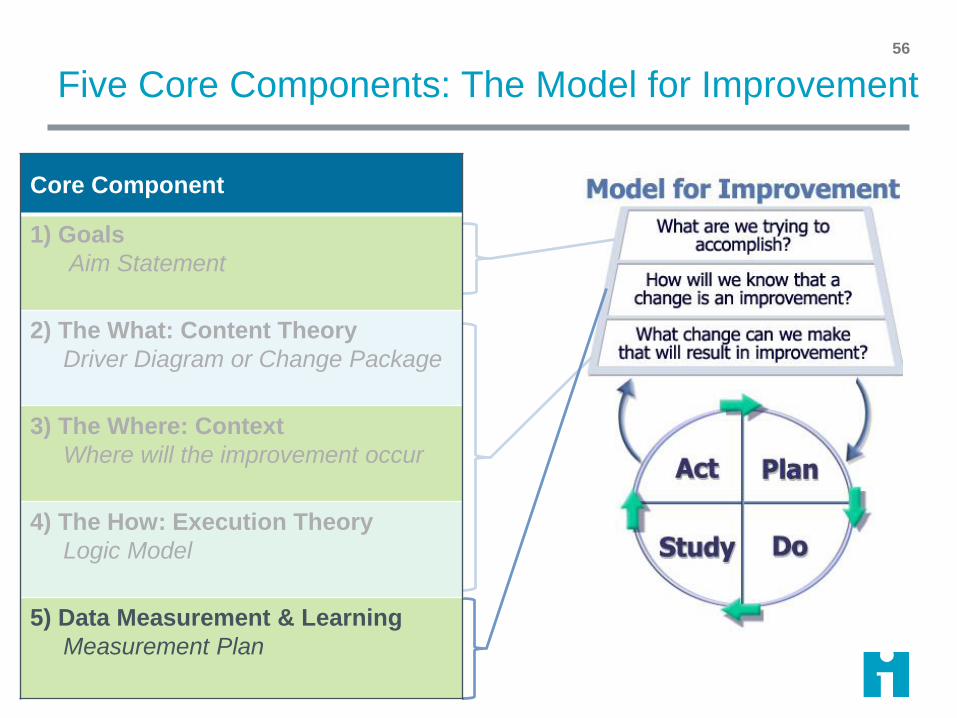
Five Core Components: The Model for Improvement56
Core Component
1) Goals
Aim Statement
2) The What: Content Theory
Driver Diagram or Change Package
3) The Where: Context
Where will the improvement occur
4) The How: Execution Theory
Logic Model
5) Data Measurement & Learning
Measurement Plan
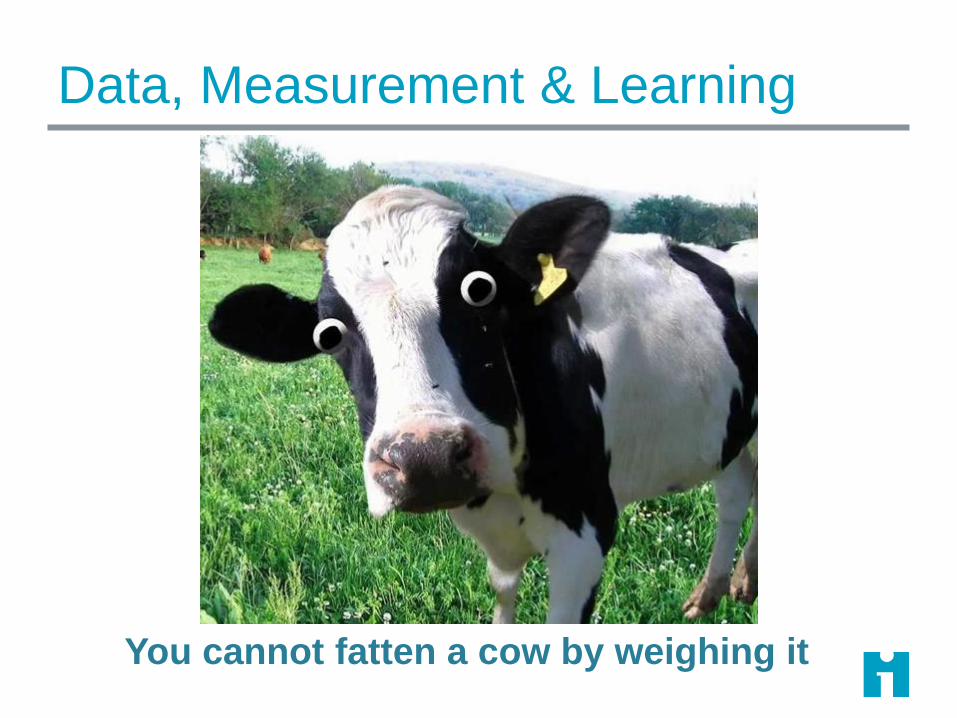
Data, Measurement & Learning
You cannot fatten a cow by weighing it
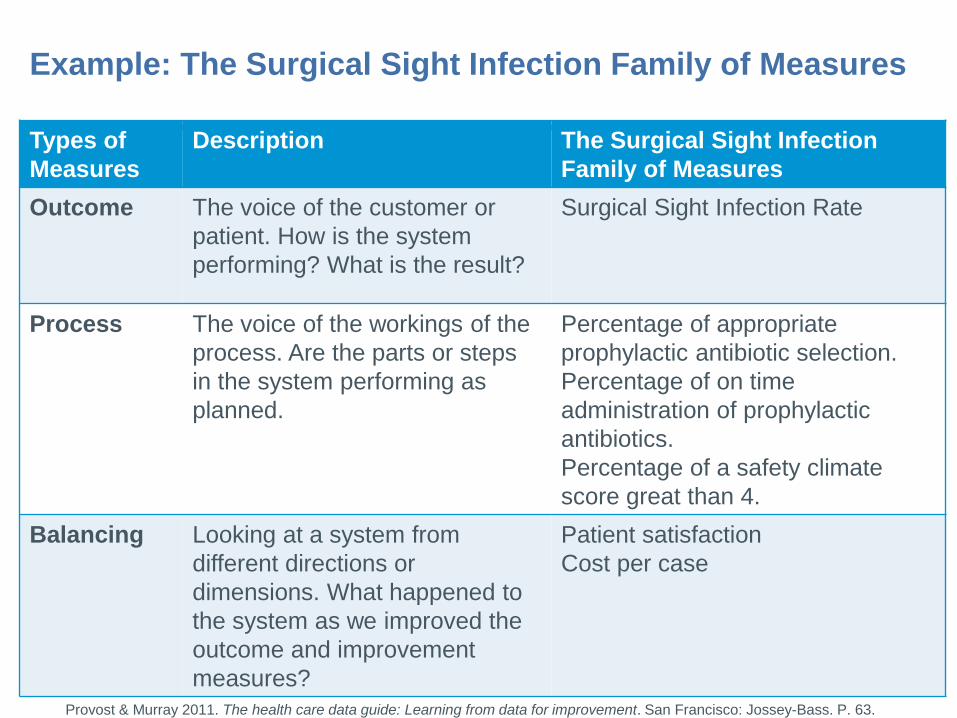
Types of
Measures
Description The Surgical Sight Infection
Family of Measures
Outcome The voice of the customer or
patient. How is the system
performing? What is the result?
Surgical Sight Infection Rate
Process The voice of the workings of the
process. Are the parts or steps
in the system performing as
planned.
Percentage of appropriate
prophylactic antibiotic selection.
Percentage of on time
administration of prophylactic
antibiotics.
Percentage of a safety climate
score great than 4.
Balancing Looking at a system from
different directions or
dimensions. What happened to
the system as we improved the
outcome and improvement
measures?
Patient satisfaction
Cost per case
Example: The Surgical Sight Infection Family of Measures
Provost & Murray 2011. The health care data guide: Learning from data for improvement. San Francisco: Jossey-Bass. P. 63.
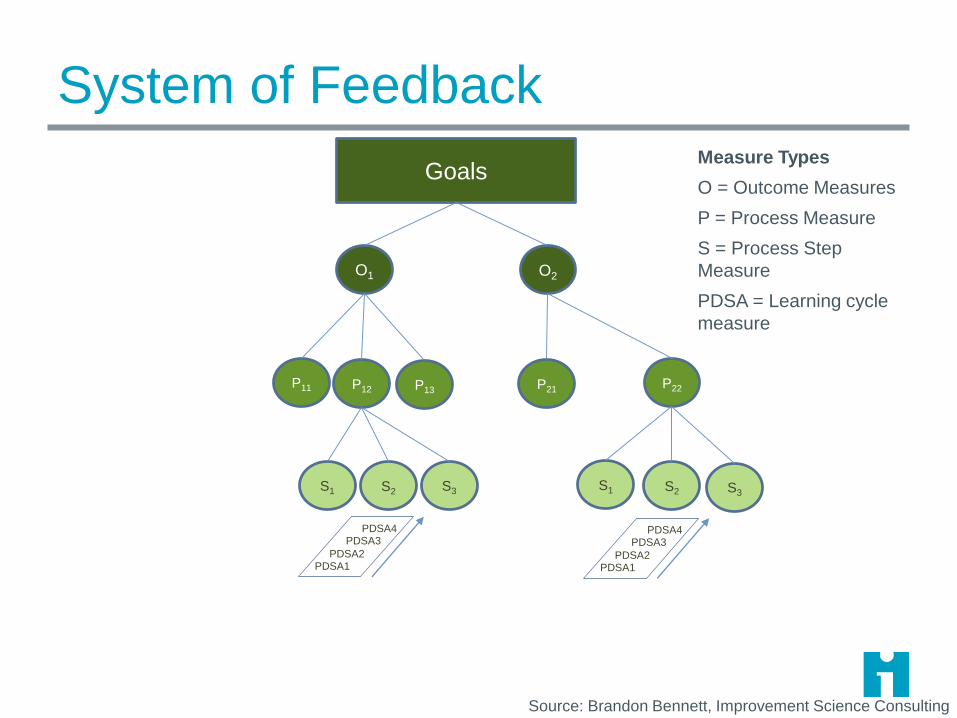
System of Feedback
Goals
O1 O2
P11 P12 P22P13 P21
S3S1 S2 S1 S2 S3
PDSA4PDSA3
PDSA2PDSA1
PDSA4PDSA3
PDSA2PDSA1
Measure Types
O = Outcome Measures
P = Process Measure
S = Process Step
Measure
PDSA = Learning cycle
measure
Source: Brandon Bennett, Improvement Science Consulting
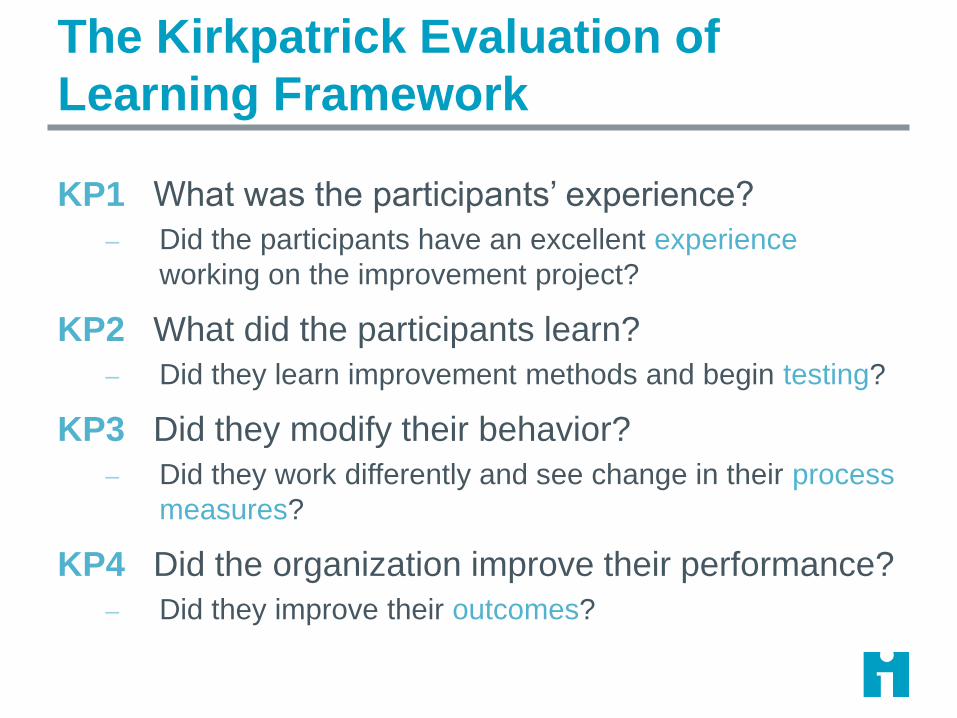
The Kirkpatrick Evaluation of
Learning Framework
KP1 What was the participants’ experience?
– Did the participants have an excellent experience
working on the improvement project?
KP2 What did the participants learn?
– Did they learn improvement methods and begin testing?
KP3 Did they modify their behavior?
– Did they work differently and see change in their process
measures?
KP4 Did the organization improve their performance?
– Did they improve their outcomes?
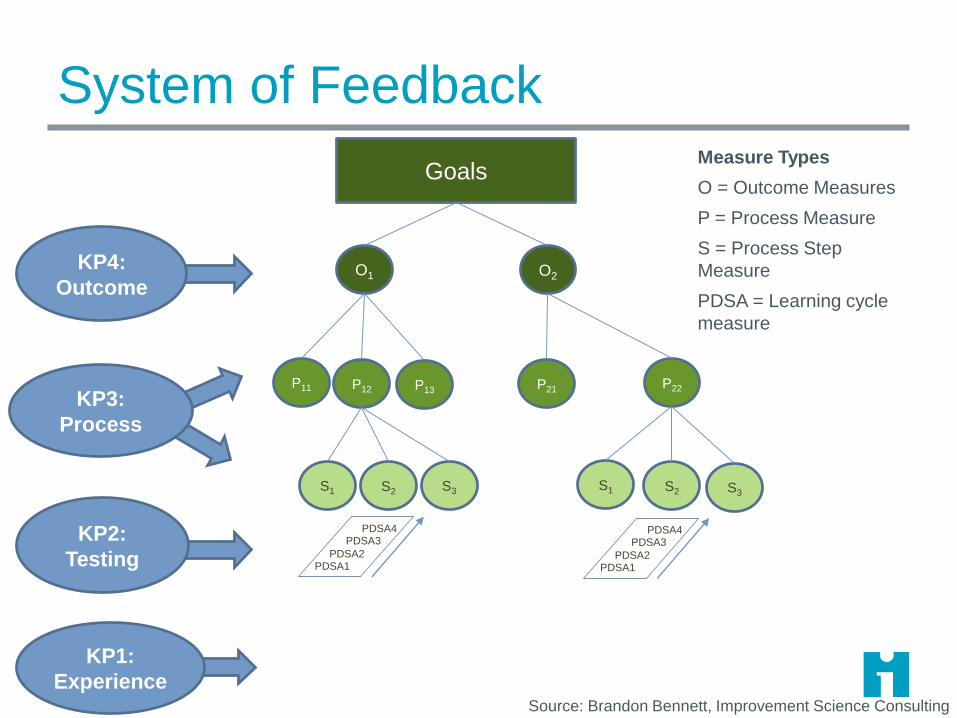
System of Feedback
Goals
O1 O2
P11 P12 P22P13 P21
S3S1 S2 S1 S2 S3
PDSA4PDSA3
PDSA2PDSA1
PDSA4PDSA3
PDSA2PDSA1
Measure Types
O = Outcome Measures
P = Process Measure
S = Process Step
Measure
PDSA = Learning cycle
measure
KP1:
Experience
KP2:
Testing
KP3:
Process
KP4:
Outcome
Source: Brandon Bennett, Improvement Science Consulting
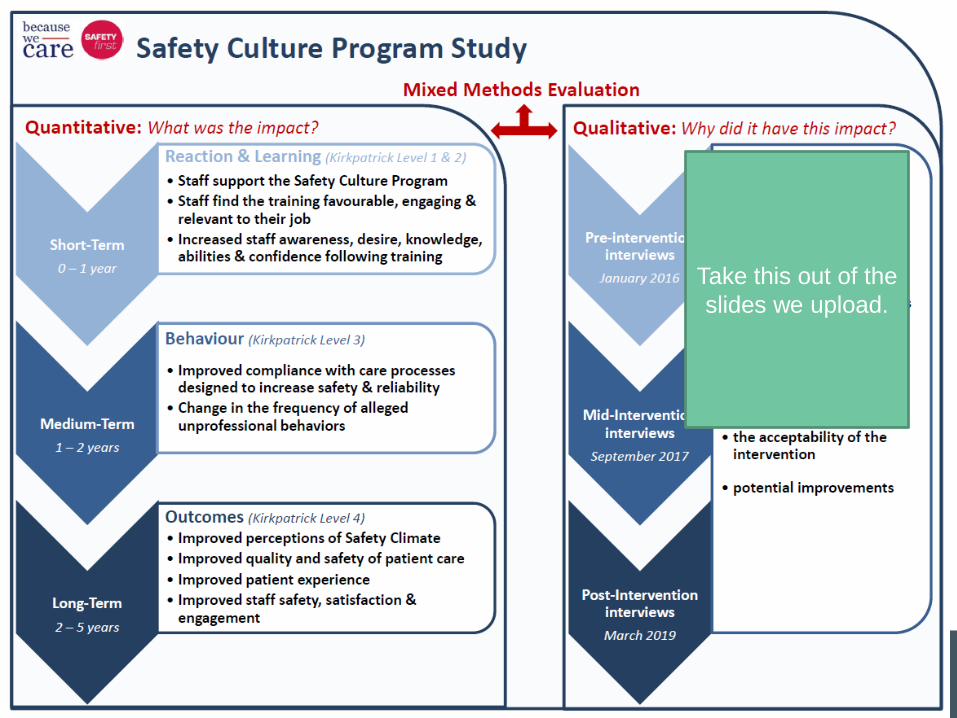
Take this out of the
slides we upload.
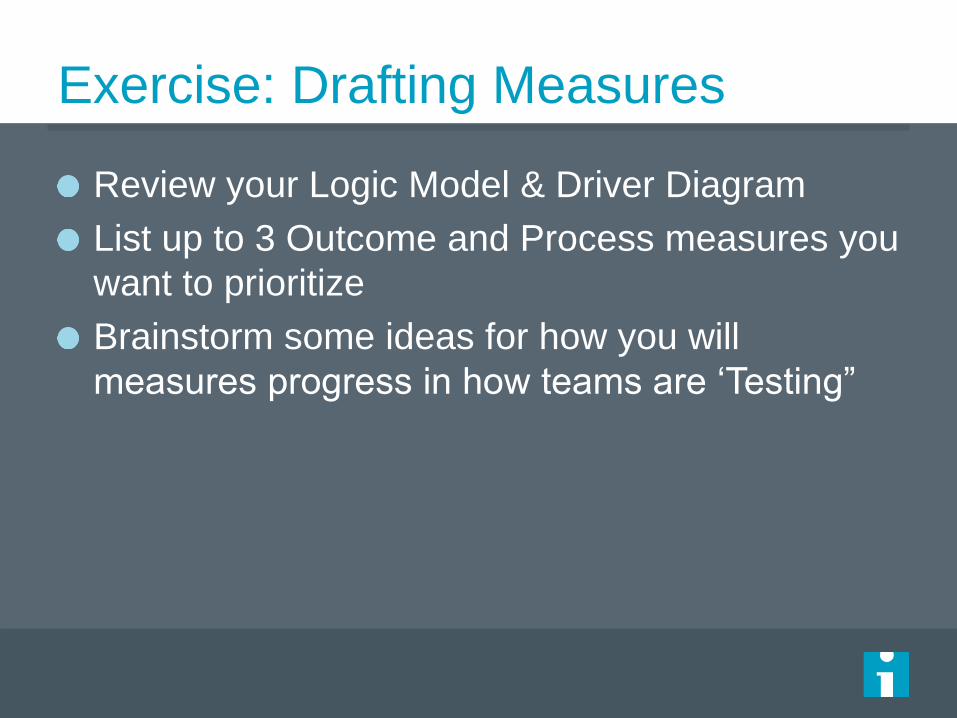
Exercise: Drafting Measures
Review your Logic Model & Driver Diagram
List up to 3 Outcome and Process measures you
want to prioritize
Brainstorm some ideas for how you will
measures progress in how teams are ‘Testing”

Evaluation QuestionsAmrita Dasgupta
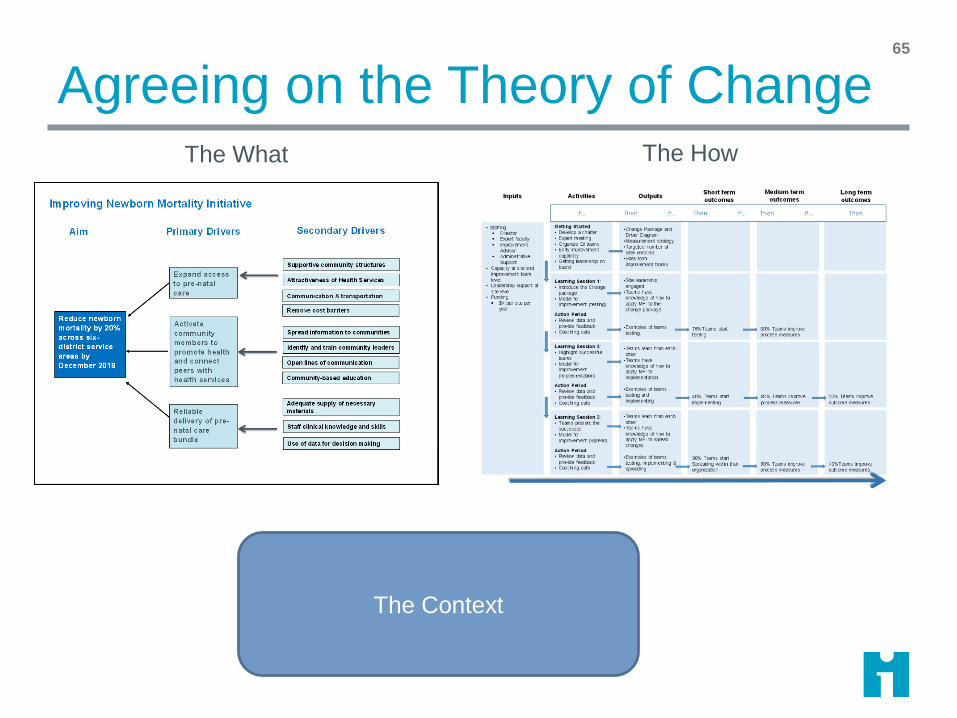
Agreeing on the Theory of Change65
The What The How
The Context
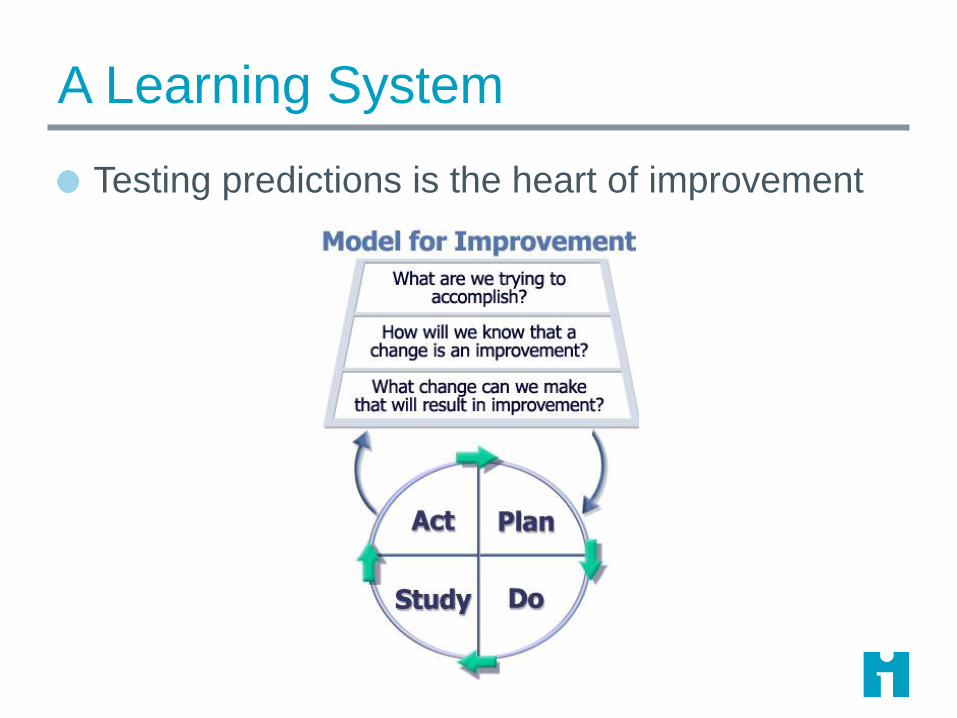
A Learning System
Testing predictions is the heart of improvement
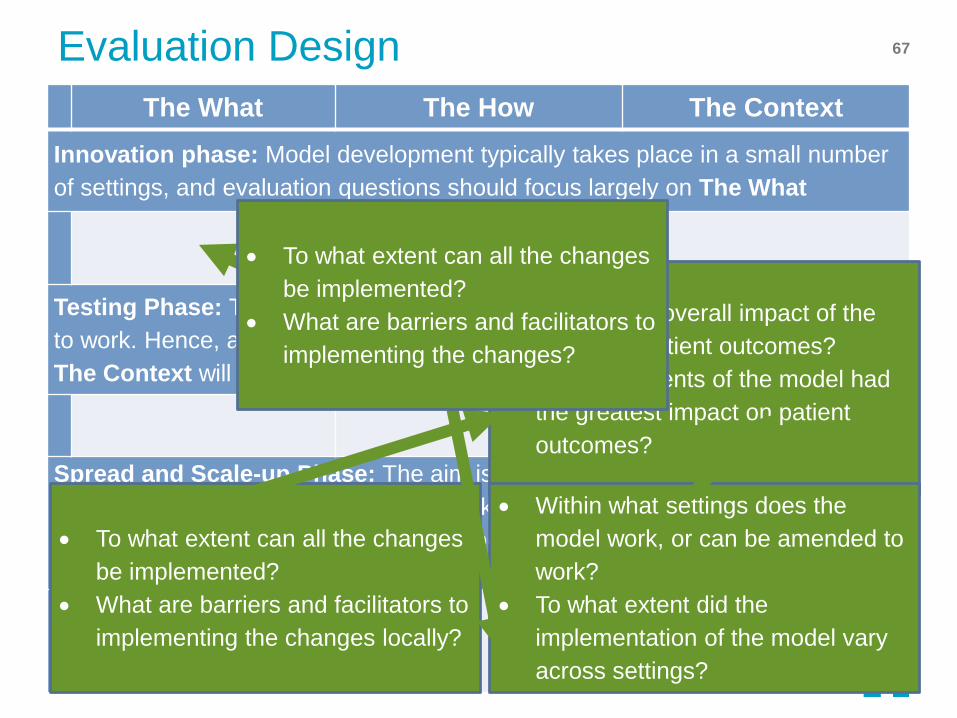
Evaluation Design 67
The What The How The Context
Innovation phase: Model development typically takes place in a small number
of settings, and evaluation questions should focus largely on The What
Testing Phase: The aim is to identify where a model works, or can be amended
to work. Hence, although refining The What will occur, developing The How and
The Context will also be important.
Spread and Scale-up Phase: The aim is to spread or scaling up the model in
contexts earlier work has indicated it is likely to work or be amended to work.
Here, the What and the Context should be well developed, and the focus will be
primarily on The How.
What is the overall impact of the
model on patient outcomes?
Which elements of the model had
the greatest impact on patient
outcomes?
To what extent can all the changes
be implemented?
What are barriers and facilitators to
implementing the changes locally?
Within what settings does the
model work, or can be amended to
work?
To what extent did the
implementation of the model vary
across settings?
To what extent can all the changes
be implemented?
What are barriers and facilitators to
implementing the changes?
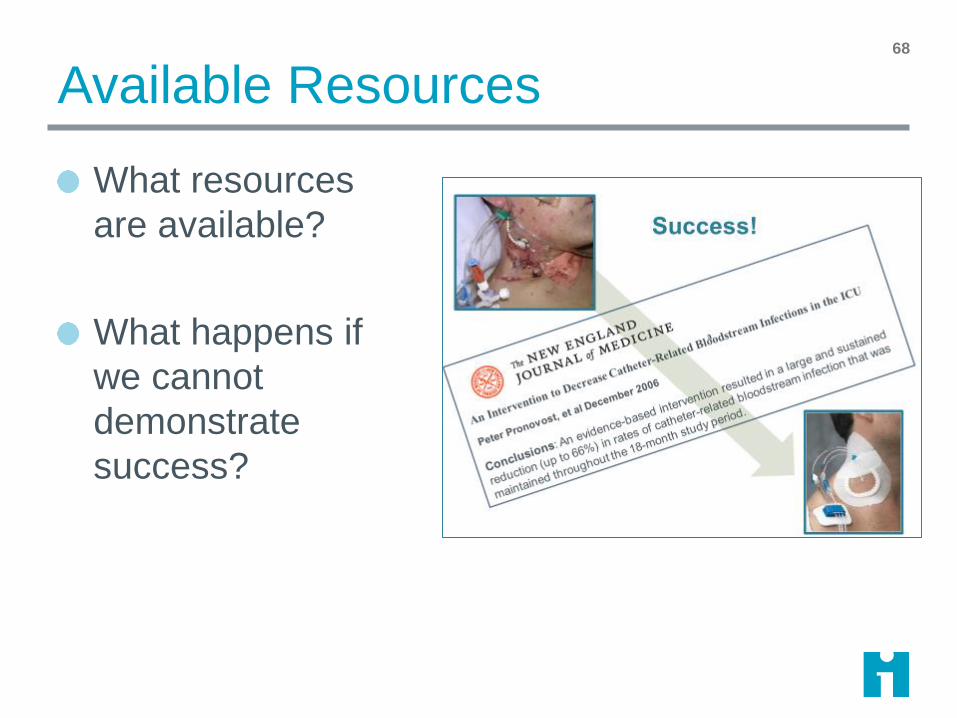
Available Resources
What resources
are available?
What happens if
we cannot
demonstrate
success?
68
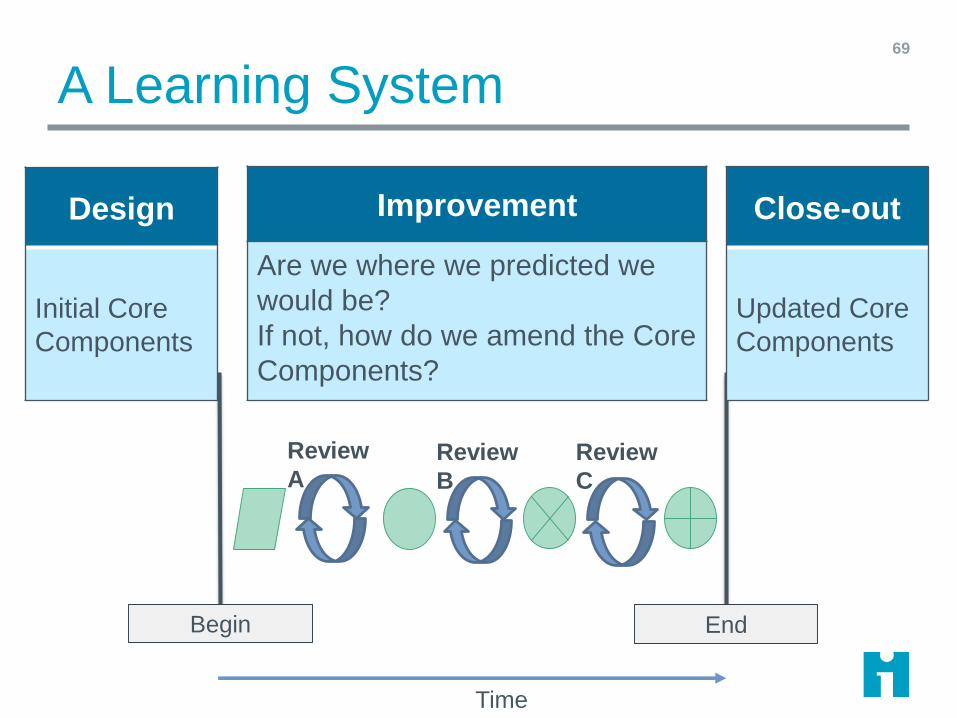
A Learning System69
Begin End
Review
AReview
B
Review
C
Design
Initial Core
Components
Improvement
Are we where we predicted we
would be?
If not, how do we amend the Core
Components?
Close-out
Updated Core
Components
Time
Exercise: Evaluation Questions70
Brainstorm evaluation questions that fit your
project.
Do the measures you outlined in the previous
exercise answer these questions?
– How might you change or add to these, if not?
What resources do you have available to you for
evaluation?
Evaluation DesignDon Goldmann
A Worthy Goal for Improvers: Design studies that will determine if
observed effects can be attributed
to QI interventions.
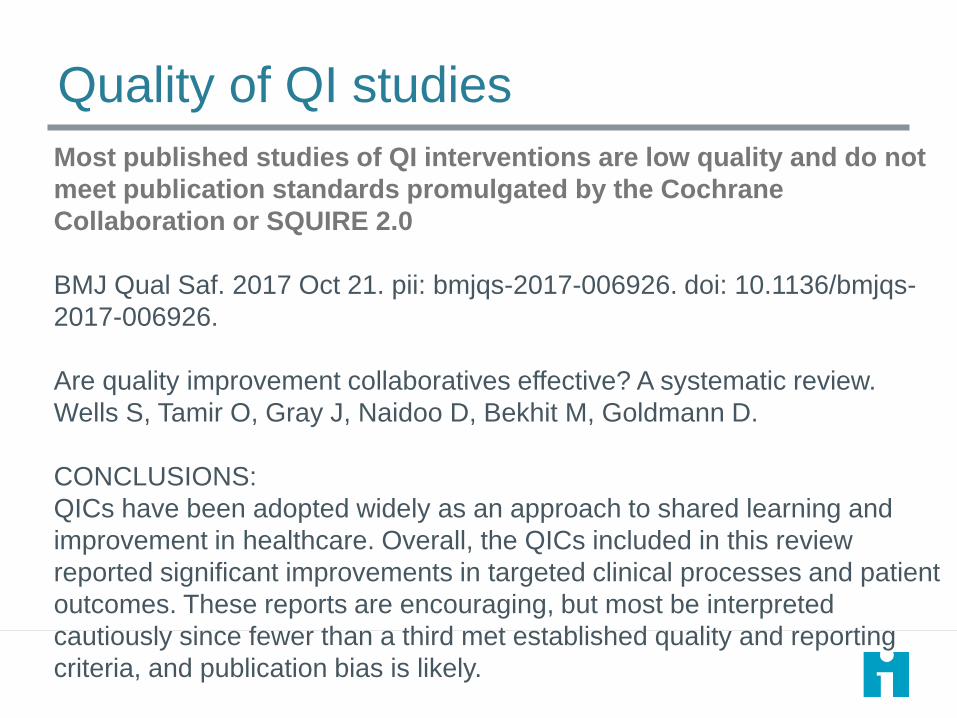
Quality of QI studies
Most published studies of QI interventions are low quality and do not
meet publication standards promulgated by the Cochrane
Collaboration or SQUIRE 2.0
BMJ Qual Saf. 2017 Oct 21. pii: bmjqs-2017-006926. doi: 10.1136/bmjqs-
2017-006926.
Are quality improvement collaboratives effective? A systematic review.
Wells S, Tamir O, Gray J, Naidoo D, Bekhit M, Goldmann D.
CONCLUSIONS:
QICs have been adopted widely as an approach to shared learning and
improvement in healthcare. Overall, the QICs included in this review
reported significant improvements in targeted clinical processes and patient
outcomes. These reports are encouraging, but most be interpreted
cautiously since fewer than a third met established quality and reporting
criteria, and publication bias is likely.
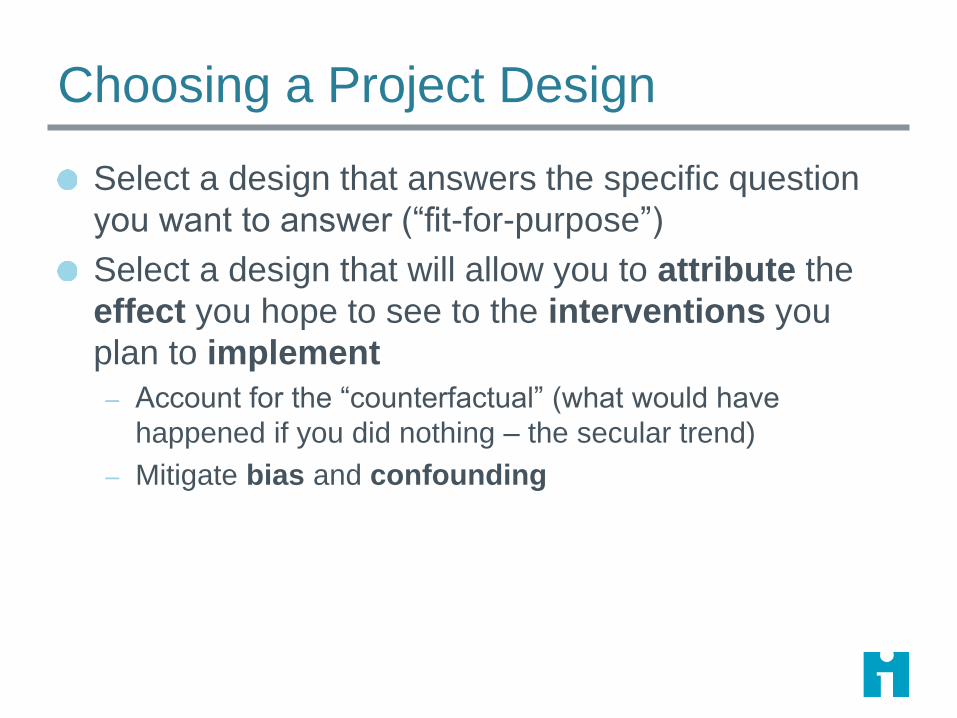
Choosing a Project Design
Select a design that answers the specific question
you want to answer (“fit-for-purpose”)
Select a design that will allow you to attribute the
effect you hope to see to the interventions you
plan to implement
– Account for the “counterfactual” (what would have
happened if you did nothing – the secular trend)
– Mitigate bias and confounding
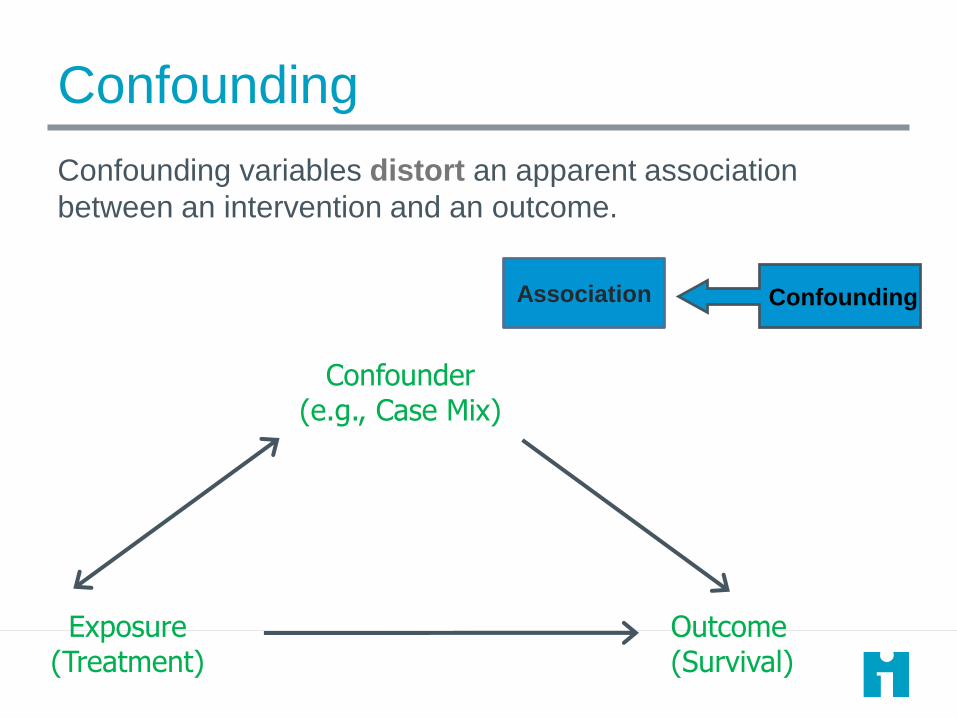
Confounding
Confounder(e.g., Case Mix)
Outcome(Survival)
Exposure(Treatment)
Confounding
Confounding variables distort an apparent association
between an intervention and an outcome.
Association
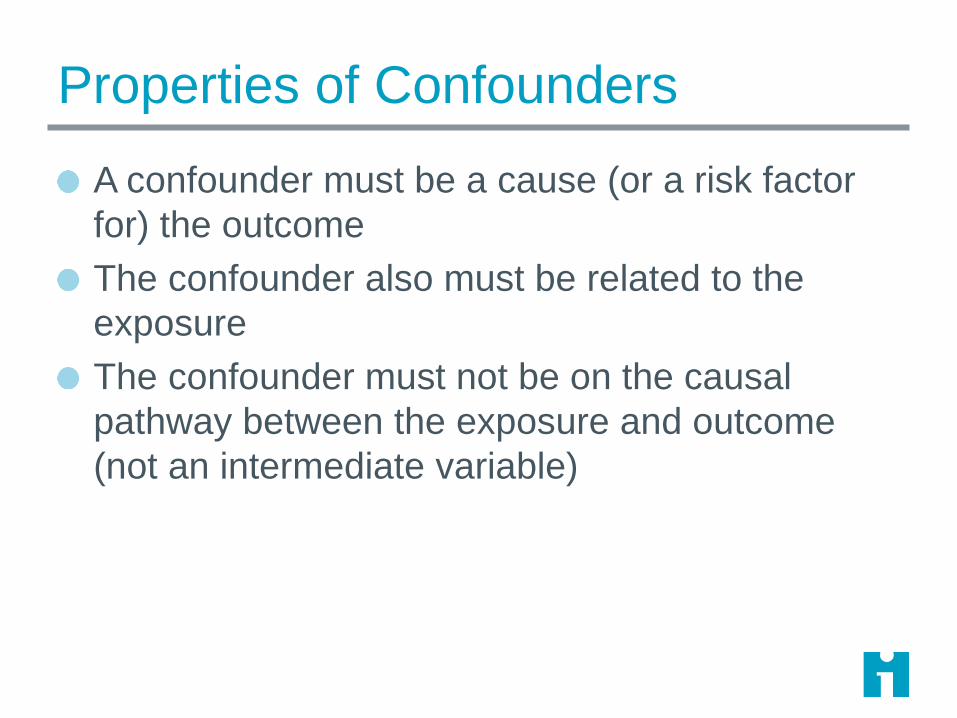
Properties of Confounders
A confounder must be a cause (or a risk factor
for) the outcome
The confounder also must be related to the
exposure
The confounder must not be on the causal
pathway between the exposure and outcome
(not an intermediate variable)
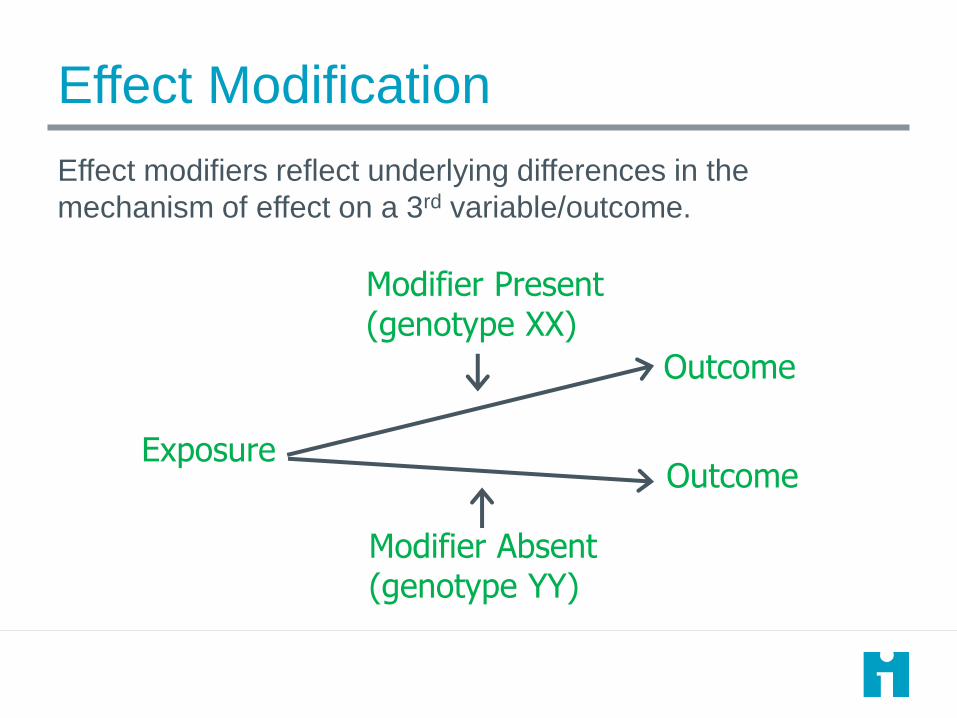
Effect Modification
Effect modifiers reflect underlying differences in the
mechanism of effect on a 3rd variable/outcome.
Modifier Absent(genotype YY)
Outcome
Exposure
Modifier Present (genotype XX)
Outcome
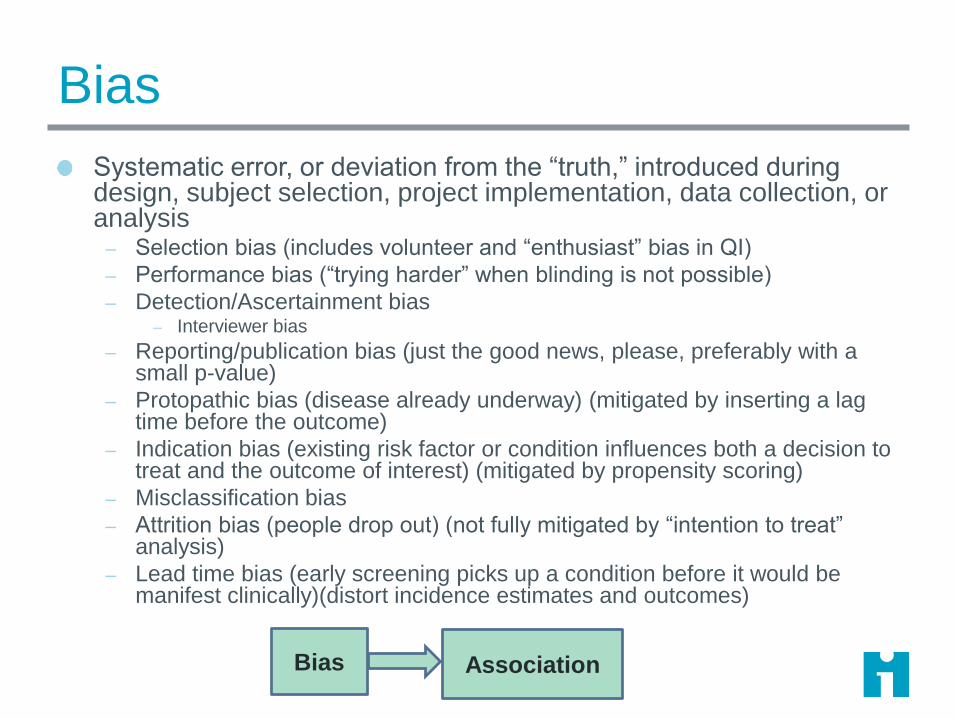
Bias
Systematic error, or deviation from the “truth,” introduced during design, subject selection, project implementation, data collection, or analysis
– Selection bias (includes volunteer and “enthusiast” bias in QI)
– Performance bias (“trying harder” when blinding is not possible)
– Detection/Ascertainment bias– Interviewer bias
– Reporting/publication bias (just the good news, please, preferably with a small p-value)
– Protopathic bias (disease already underway) (mitigated by inserting a lag time before the outcome)
– Indication bias (existing risk factor or condition influences both a decision to treat and the outcome of interest) (mitigated by propensity scoring)
– Misclassification bias
– Attrition bias (people drop out) (not fully mitigated by “intention to treat” analysis)
– Lead time bias (early screening picks up a condition before it would be manifest clinically)(distort incidence estimates and outcomes)
Cochrane Handbook for Systematic Reviews of Interventions
http://handbook.cochrane.org/Bias Association
Association is Not the Same as Causality.
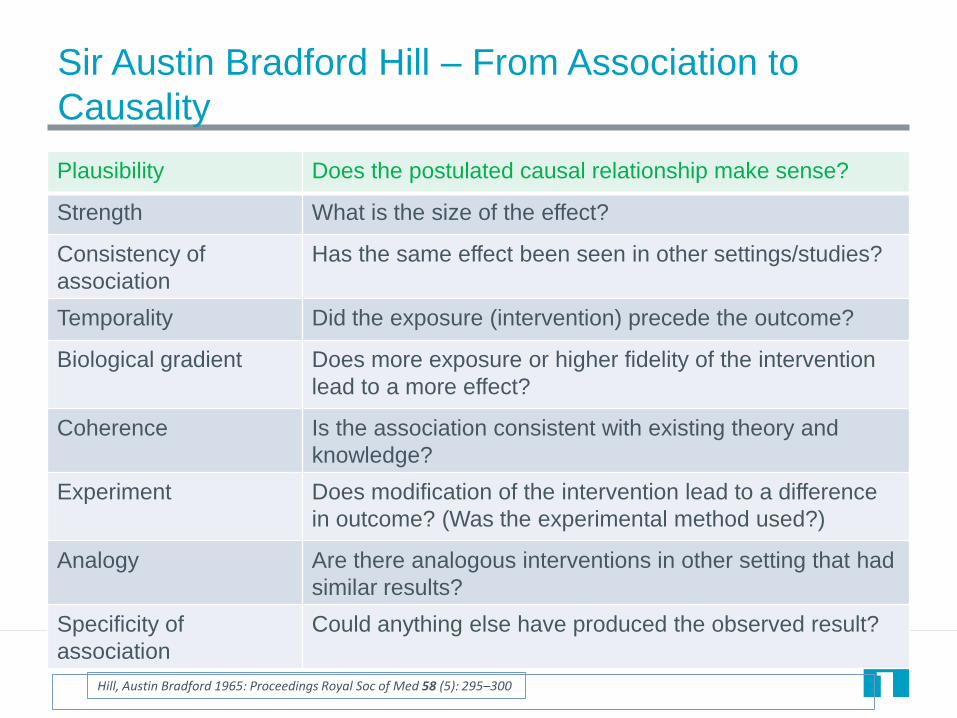
Sir Austin Bradford Hill – From Association to
Causality
Plausibility Does the postulated causal relationship make sense?
Strength What is the size of the effect?
Consistency of
association
Has the same effect been seen in other settings/studies?
Temporality Did the exposure (intervention) precede the outcome?
Biological gradient Does more exposure or higher fidelity of the intervention
lead to a more effect?
Coherence Is the association consistent with existing theory and
knowledge?
Experiment Does modification of the intervention lead to a difference
in outcome? (Was the experimental method used?)
Analogy Are there analogous interventions in other setting that had
similar results?
Specificity of
association
Could anything else have produced the observed result?
Updated by Fadek, E et al: https://www.ncbi.nlm.nih.gov/pmc/articles/PMC4589117/Hill, Austin Bradford 1965: Proceedings Royal Soc of Med 58 (5): 295–300
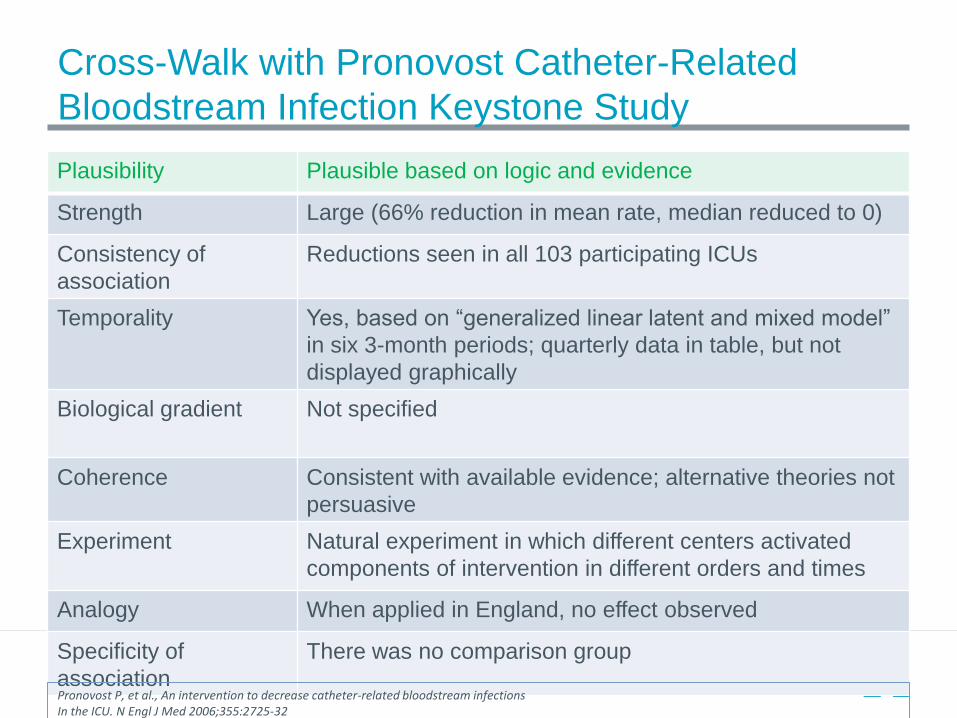
Cross-Walk with Pronovost Catheter-Related
Bloodstream Infection Keystone Study
Plausibility Plausible based on logic and evidence
Strength Large (66% reduction in mean rate, median reduced to 0)
Consistency of
association
Reductions seen in all 103 participating ICUs
Temporality Yes, based on “generalized linear latent and mixed model”
in six 3-month periods; quarterly data in table, but not
displayed graphically
Biological gradient Not specified
Coherence Consistent with available evidence; alternative theories not
persuasive
Experiment Natural experiment in which different centers activated
components of intervention in different orders and times
Analogy When applied in England, no effect observed
Specificity of
association
There was no comparison group
Pronovost P, et al., An intervention to decrease catheter-related bloodstream infectionsIn the ICU. N Engl J Med 2006;355:2725-32
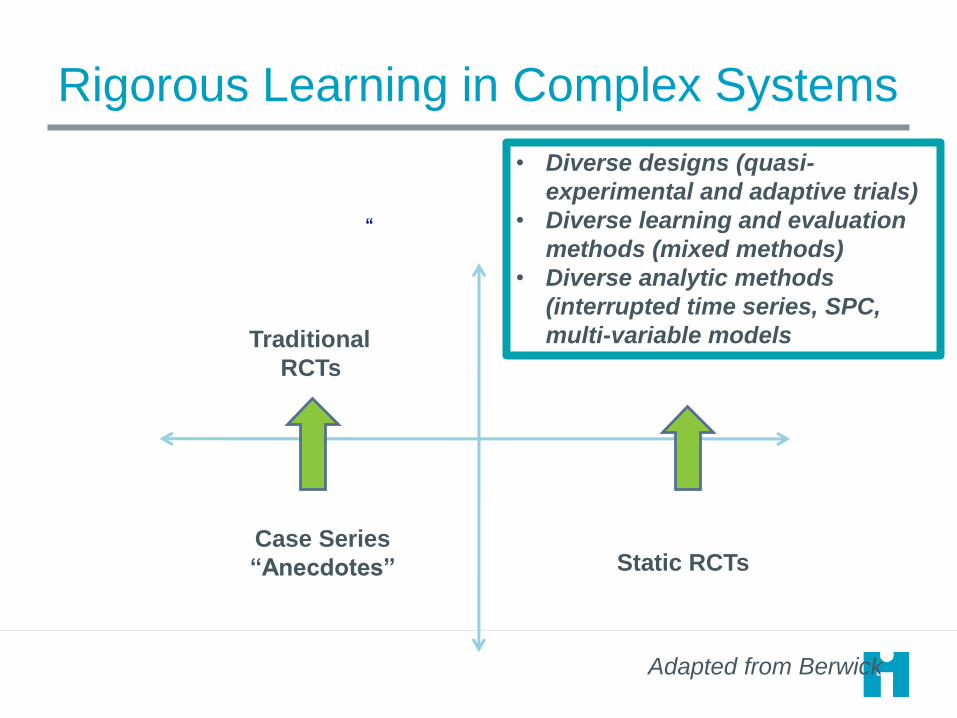
Rigorous Learning in Complex Systems
Simple
Linear
Cause-and
-Effect
Complex
Non-Linear
Chaotic
“Rigorous
Learning
Poor Learning
Traditional
RCTs
Case Series
“Anecdotes” Static RCTs
• Diverse designs (quasi-
experimental and adaptive trials)
• Diverse learning and evaluation
methods (mixed methods)
• Diverse analytic methods
(interrupted time series, SPC,
multi-variable models
Adapted from Berwick
Approaches to assess attribution 83
http://www.academyhealth.org/evaluationguide
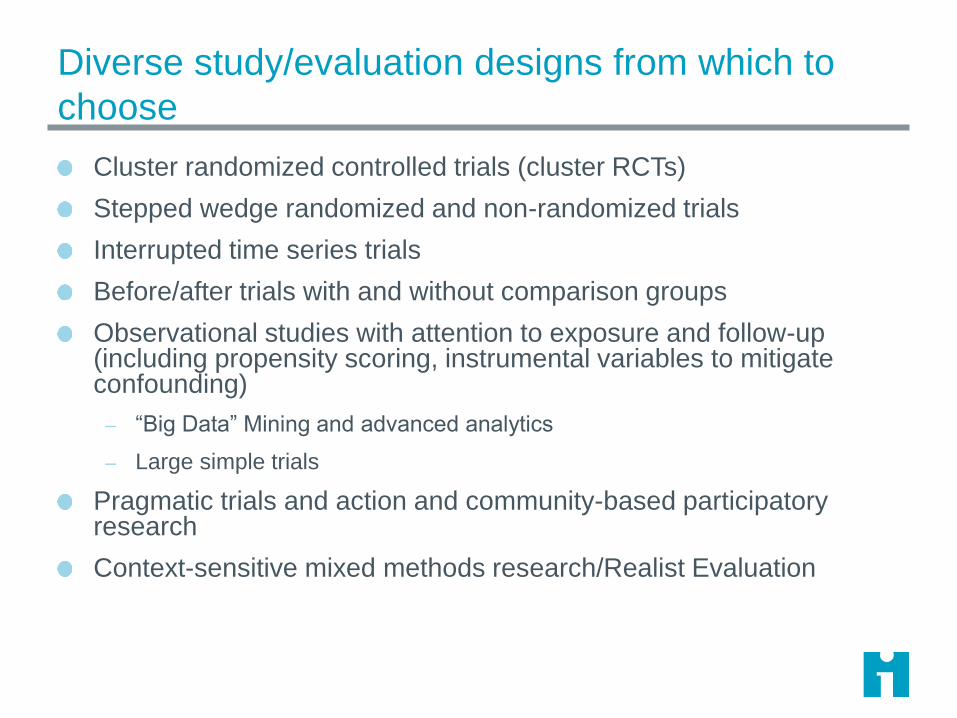
Diverse study/evaluation designs from which to
choose
Cluster randomized controlled trials (cluster RCTs)
Stepped wedge randomized and non-randomized trials
Interrupted time series trials
Before/after trials with and without comparison groups
Observational studies with attention to exposure and follow-up (including propensity scoring, instrumental variables to mitigate confounding)
– “Big Data” Mining and advanced analytics
– Large simple trials
Pragmatic trials and action and community-based participatory research
Context-sensitive mixed methods research/Realist Evaluation
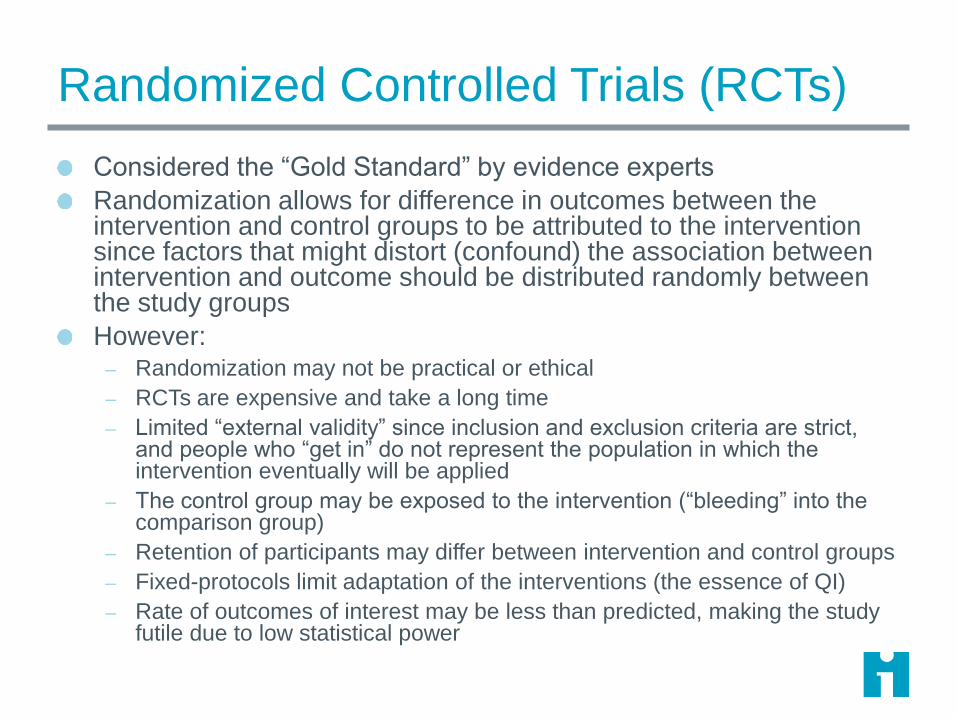
Randomized Controlled Trials (RCTs)
Considered the “Gold Standard” by evidence experts
Randomization allows for difference in outcomes between the intervention and control groups to be attributed to the intervention since factors that might distort (confound) the association between intervention and outcome should be distributed randomly between the study groups
However: – Randomization may not be practical or ethical
– RCTs are expensive and take a long time
– Limited “external validity” since inclusion and exclusion criteria are strict, and people who “get in” do not represent the population in which the intervention eventually will be applied
– The control group may be exposed to the intervention (“bleeding” into the comparison group)
– Retention of participants may differ between intervention and control groups
– Fixed-protocols limit adaptation of the interventions (the essence of QI)
– Rate of outcomes of interest may be less than predicted, making the study futile due to low statistical power
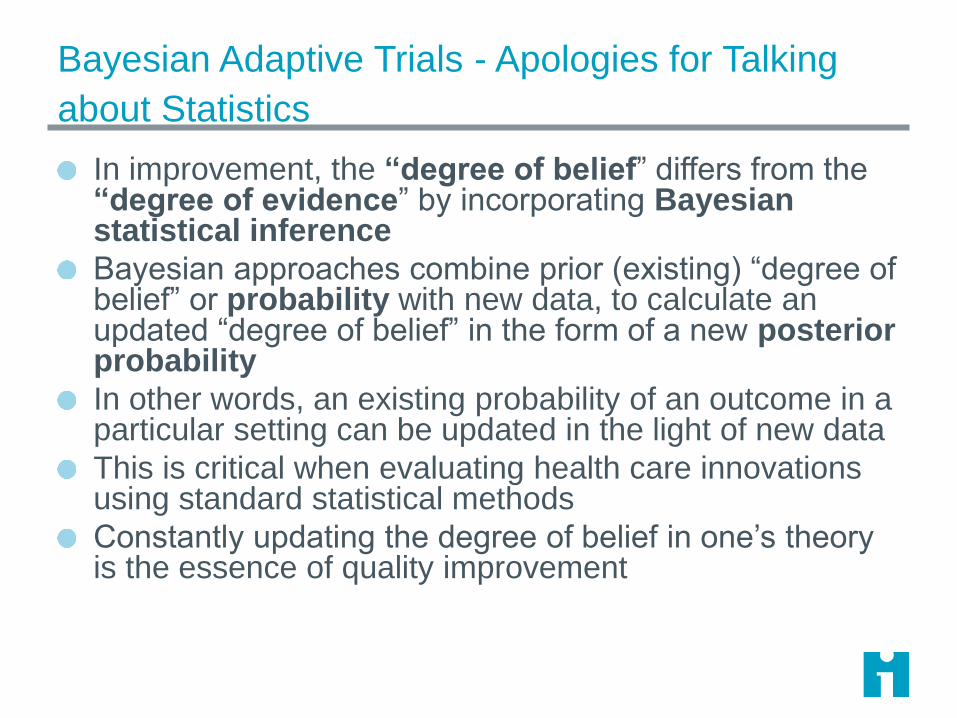
Bayesian Adaptive Trials - Apologies for Talking
about Statistics
In improvement, the “degree of belief” differs from the “degree of evidence” by incorporating Bayesian statistical inference
Bayesian approaches combine prior (existing) “degree of belief” or probability with new data, to calculate an updated “degree of belief” in the form of a new posterior probability
In other words, an existing probability of an outcome in a particular setting can be updated in the light of new data
This is critical when evaluating health care innovations using standard statistical methods
Constantly updating the degree of belief in one’s theory is the essence of quality improvement
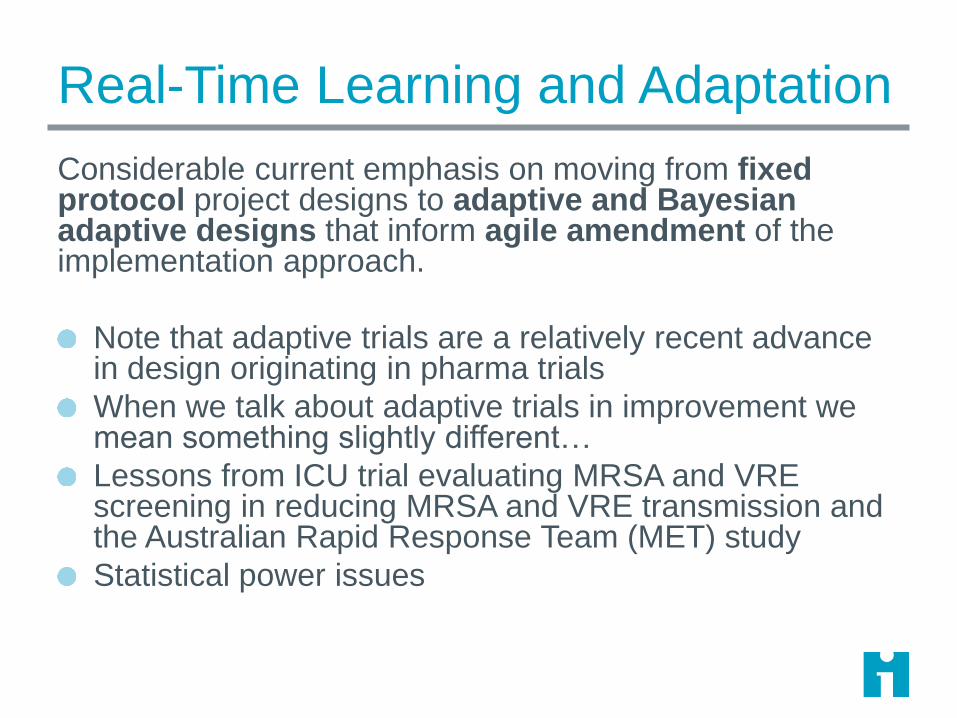
Real-Time Learning and Adaptation
Considerable current emphasis on moving from fixed protocol project designs to adaptive and Bayesian adaptive designs that inform agile amendment of the implementation approach.
Note that adaptive trials are a relatively recent advance in design originating in pharma trials
When we talk about adaptive trials in improvement we mean something slightly different…
Lessons from ICU trial evaluating MRSA and VRE screening in reducing MRSA and VRE transmission and the Australian Rapid Response Team (MET) study
Statistical power issues
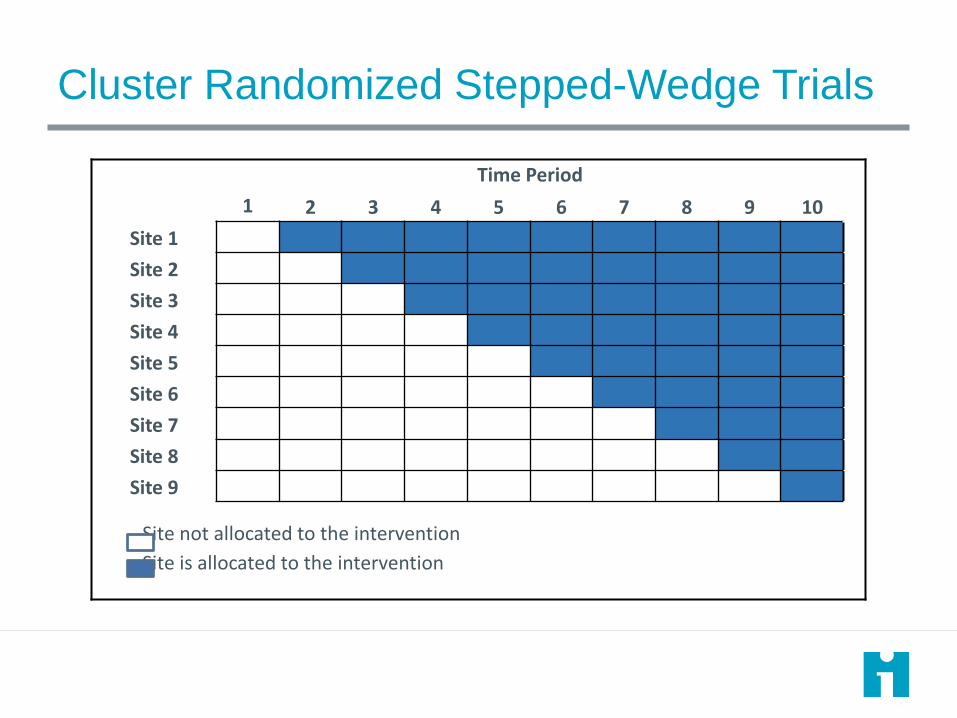
Cluster Randomized Stepped-Wedge Trials
Time Period
1 2 3 4 5 6 7 8 9 10
Site 1
Site 2
Site 3
Site 4
Site 5
Site 6
Site 7
Site 8
Site 9
Site not allocated to the intervention
Site is allocated to the intervention
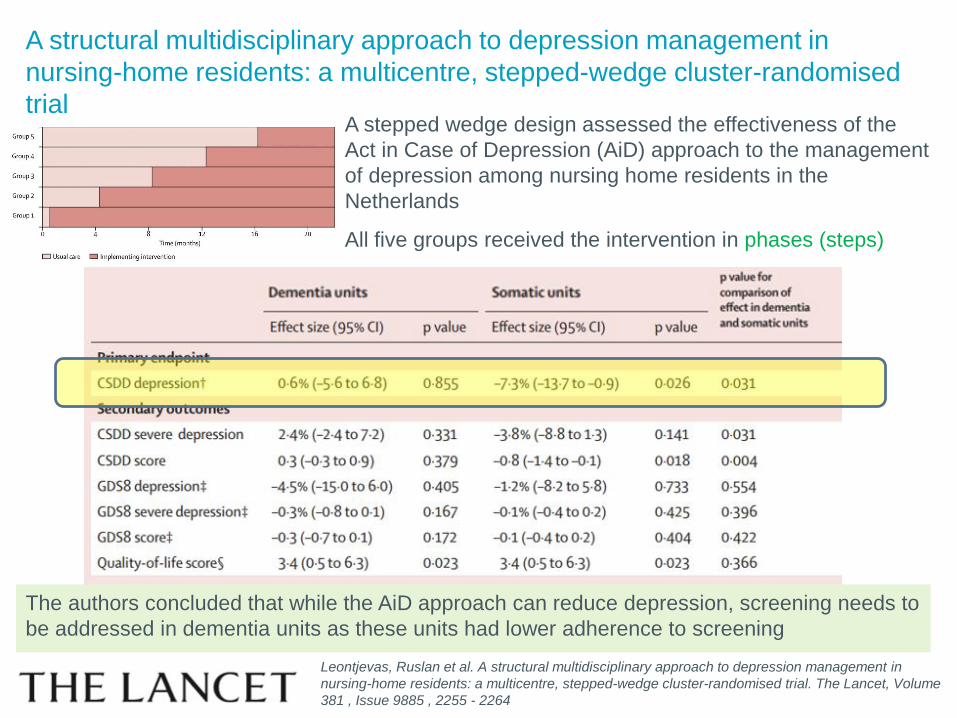
A structural multidisciplinary approach to depression management in
nursing-home residents: a multicentre, stepped-wedge cluster-randomised
trialA stepped wedge design assessed the effectiveness of the
Act in Case of Depression (AiD) approach to the management
of depression among nursing home residents in the
Netherlands
All five groups received the intervention in phases (steps)
Leontjevas, Ruslan et al. A structural multidisciplinary approach to depression management in
nursing-home residents: a multicentre, stepped-wedge cluster-randomised trial. The Lancet, Volume
381 , Issue 9885 , 2255 - 2264
The authors concluded that while the AiD approach can reduce depression, screening needs to
be addressed in dementia units as these units had lower adherence to screening
Ethical and Statistical Issues in Stepped-Wedge
Designs
Stepped-wedge trials allow “learning” between the
“steps,” leading to helpful adaptations in implementation
– This raises statistical power and analysis issues
QI stepped-wedge trials generally do not have data
safety and monitoring boards and tend to be carried to
conclusion for continued learning rather than recognizing
significant improvement and allowing all patients to
benefit more quickly
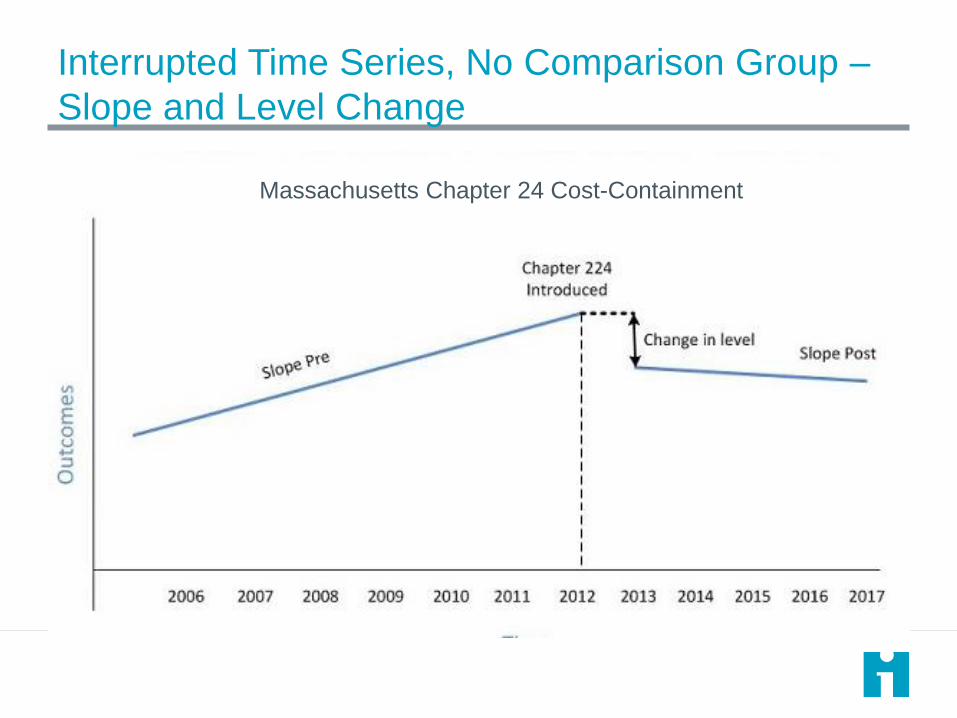
Interrupted Time Series, No Comparison Group –
Slope and Level Change
Massachusetts Chapter 24 Cost-Containment
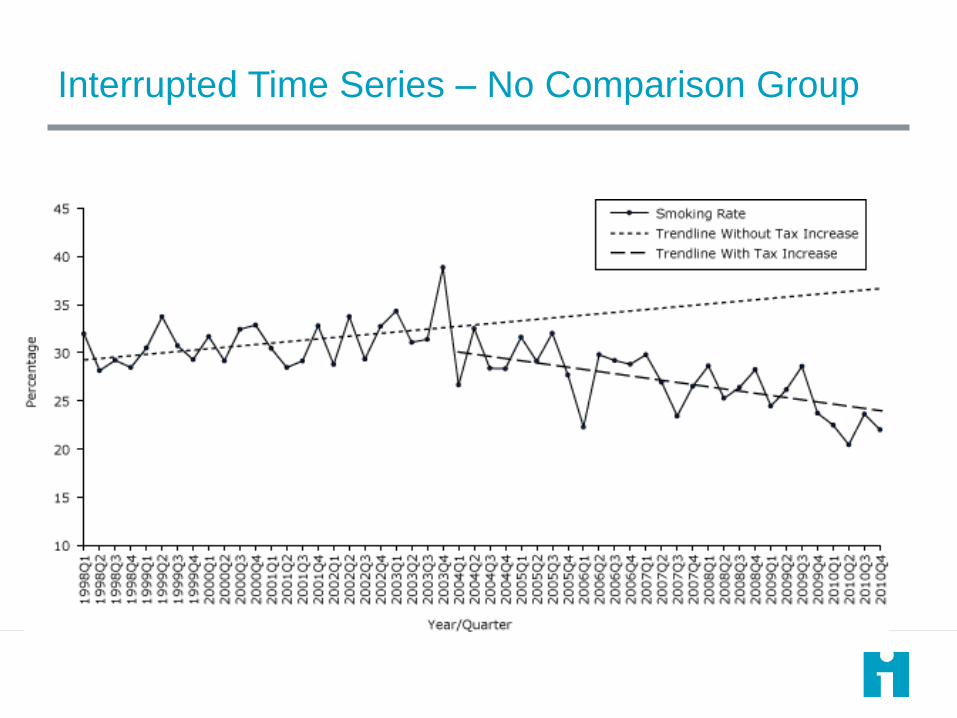
Interrupted Time Series – No Comparison Group
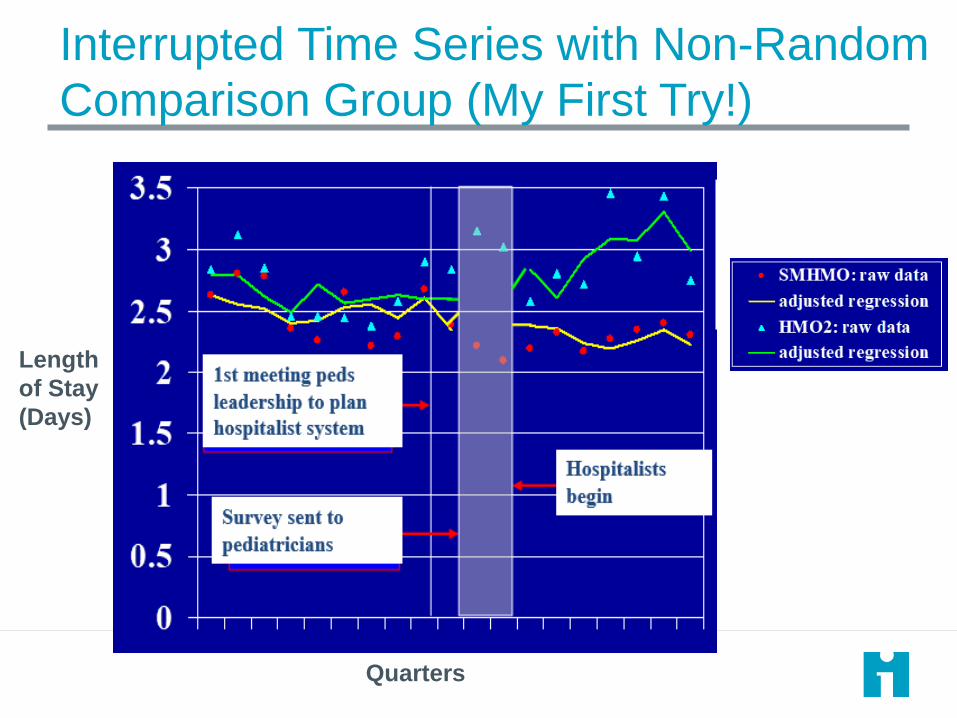
Interrupted Time Series with Non-Random
Comparison Group (My First Try!)
Length
of Stay
(Days)
Quarters
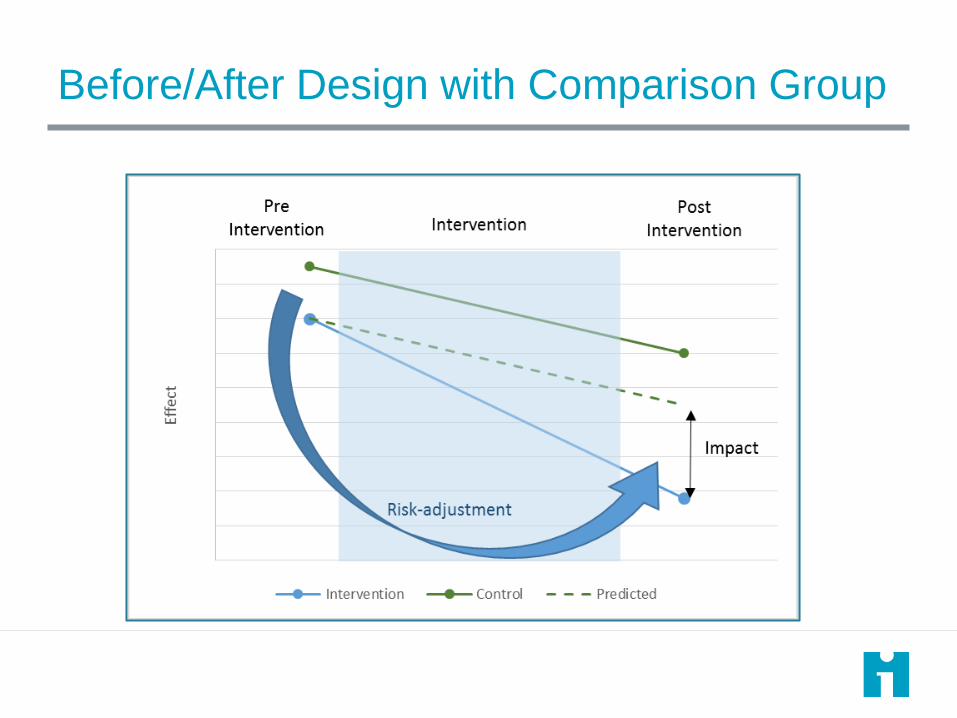
Before/After Design with Comparison Group
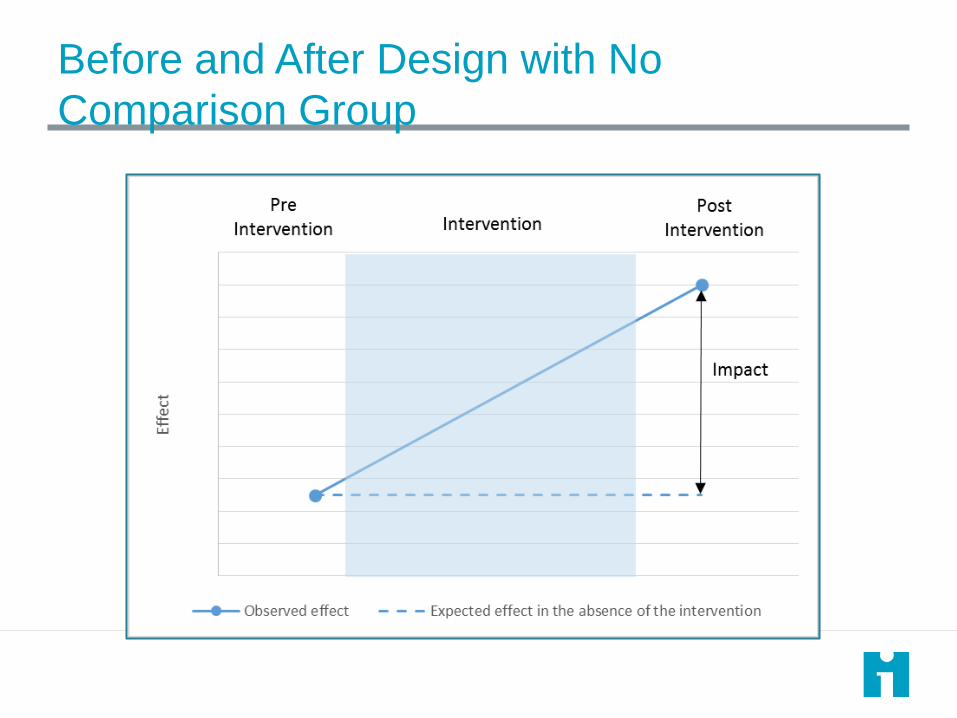
Before and After Design with No
Comparison Group
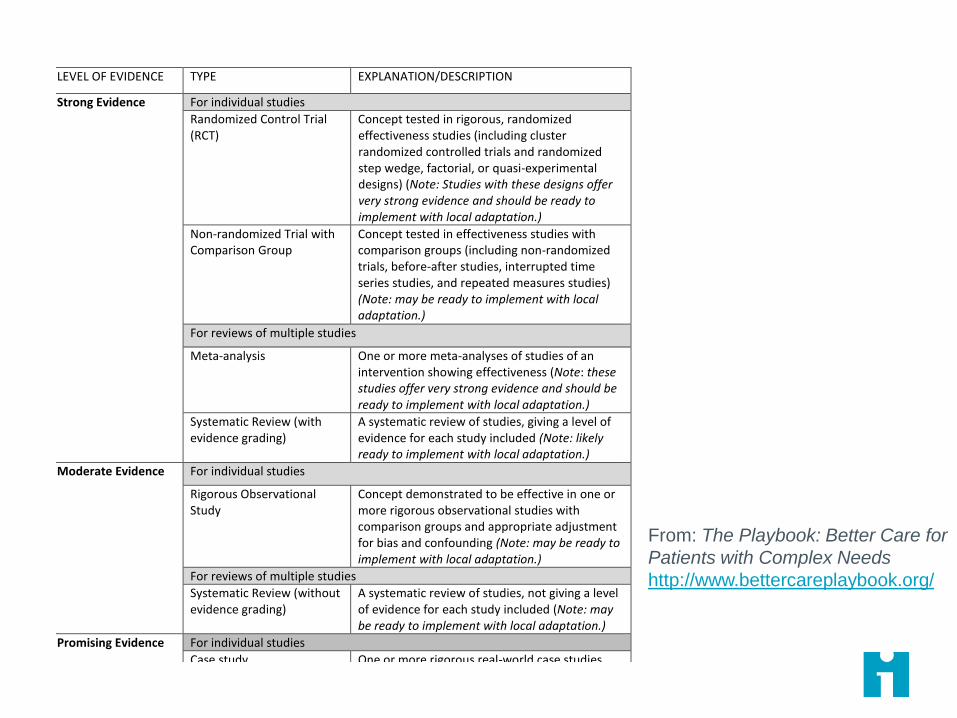
LEVEL OF EVIDENCE TYPE EXPLANATION/DESCRIPTION
Strong Evidence For individual studies
Randomized Control Trial (RCT)
Concept tested in rigorous, randomized effectiveness studies (including cluster randomized controlled trials and randomized step wedge, factorial, or quasi-experimental designs) (Note: Studies with these designs offer very strong evidence and should be ready to implement with local adaptation.)
Non-randomized Trial with Comparison Group
Concept tested in effectiveness studies with comparison groups (including non-randomized trials, before-after studies, interrupted time series studies, and repeated measures studies) (Note: may be ready to implement with local adaptation.)
For reviews of multiple studies
Meta-analysis One or more meta-analyses of studies of an intervention showing effectiveness (Note: these studies offer very strong evidence and should be ready to implement with local adaptation.)
Systematic Review (with evidence grading)
A systematic review of studies, giving a level of evidence for each study included (Note: likely ready to implement with local adaptation.)
Moderate Evidence For individual studies
Rigorous Observational Study
Concept demonstrated to be effective in one or more rigorous observational studies with comparison groups and appropriate adjustment for bias and confounding (Note: may be ready to implement with local adaptation.)
For reviews of multiple studies
Systematic Review (without evidence grading)
A systematic review of studies, not giving a level of evidence for each study included (Note: may be ready to implement with local adaptation.)
Promising Evidence
For individual studies
Case study One or more rigorous real-world case studies (Note: promising idea ready for further testing and small-scale implementation with local adaptation.)
For reviews of multiple studies
Non-systematic Review (with evidence grading)
A non-systematic review of studies, with evidence grading (Note: promising ideas ready for further testing and small-scale implementation with local adaptation.)
Expert Opinion For individual reports
Individual report, commentary or perspective
Expert or group of experts who, based on their experience, present a new idea, concept or model, which has not been formally evaluated (Note: promising idea needing further testing or research)
For reviews of multiple studies
A non-systematic review of studies, without evidence grading
Non-systematic review of studies without evidence grading (Note: promising Ideas needing further testing or research)
From: The Playbook: Better Care for
Patients with Complex Needs
http://www.bettercareplaybook.org/
Exercise98
How will you design the improvement
initiative in such a way that you can answer
your evaluation questions?
Brainstorm some ideas for how you will
choose your evaluation design.
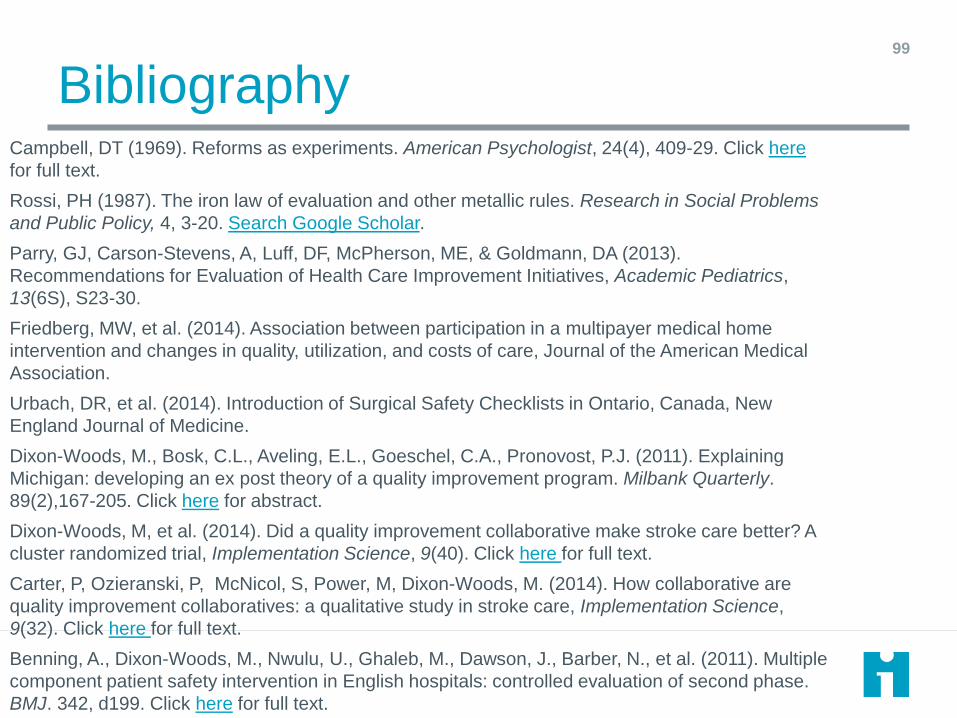
Bibliography99
Campbell, DT (1969). Reforms as experiments. American Psychologist, 24(4), 409-29. Click here
for full text.
Rossi, PH (1987). The iron law of evaluation and other metallic rules. Research in Social Problems
and Public Policy, 4, 3-20. Search Google Scholar.
Parry, GJ, Carson-Stevens, A, Luff, DF, McPherson, ME, & Goldmann, DA (2013).
Recommendations for Evaluation of Health Care Improvement Initiatives, Academic Pediatrics,
13(6S), S23-30.
Friedberg, MW, et al. (2014). Association between participation in a multipayer medical home
intervention and changes in quality, utilization, and costs of care, Journal of the American Medical
Association.
Urbach, DR, et al. (2014). Introduction of Surgical Safety Checklists in Ontario, Canada, New
England Journal of Medicine.
Dixon-Woods, M., Bosk, C.L., Aveling, E.L., Goeschel, C.A., Pronovost, P.J. (2011). Explaining
Michigan: developing an ex post theory of a quality improvement program. Milbank Quarterly.
89(2),167-205. Click here for abstract.
Dixon-Woods, M, et al. (2014). Did a quality improvement collaborative make stroke care better? A
cluster randomized trial, Implementation Science, 9(40). Click here for full text.
Carter, P, Ozieranski, P, McNicol, S, Power, M, Dixon-Woods, M. (2014). How collaborative are
quality improvement collaboratives: a qualitative study in stroke care, Implementation Science,
9(32). Click here for full text.
Benning, A., Dixon-Woods, M., Nwulu, U., Ghaleb, M., Dawson, J., Barber, N., et al. (2011). Multiple
component patient safety intervention in English hospitals: controlled evaluation of second phase.
BMJ. 342, d199. Click here for full text.
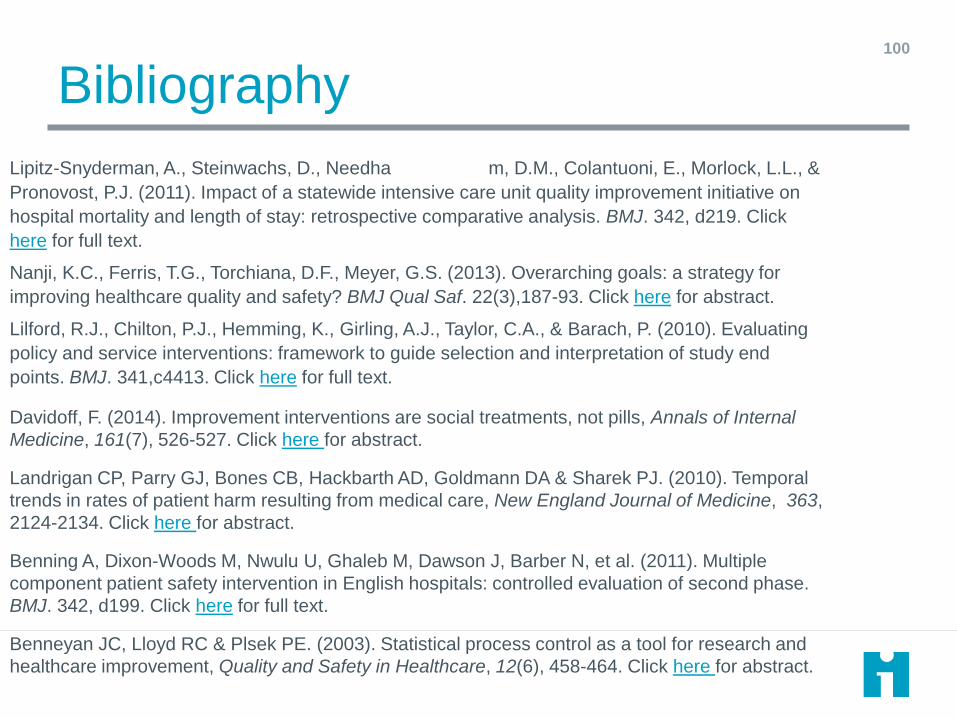
Bibliography100
Lipitz-Snyderman, A., Steinwachs, D., Needha m, D.M., Colantuoni, E., Morlock, L.L., &
Pronovost, P.J. (2011). Impact of a statewide intensive care unit quality improvement initiative on
hospital mortality and length of stay: retrospective comparative analysis. BMJ. 342, d219. Click
here for full text.
Nanji, K.C., Ferris, T.G., Torchiana, D.F., Meyer, G.S. (2013). Overarching goals: a strategy for
improving healthcare quality and safety? BMJ Qual Saf. 22(3),187-93. Click here for abstract.
Lilford, R.J., Chilton, P.J., Hemming, K., Girling, A.J., Taylor, C.A., & Barach, P. (2010). Evaluating
policy and service interventions: framework to guide selection and interpretation of study end
points. BMJ. 341,c4413. Click here for full text.
Davidoff, F. (2014). Improvement interventions are social treatments, not pills, Annals of Internal
Medicine, 161(7), 526-527. Click here for abstract.
Landrigan CP, Parry GJ, Bones CB, Hackbarth AD, Goldmann DA & Sharek PJ. (2010). Temporal
trends in rates of patient harm resulting from medical care, New England Journal of Medicine, 363,
2124-2134. Click here for abstract.
Benning A, Dixon-Woods M, Nwulu U, Ghaleb M, Dawson J, Barber N, et al. (2011). Multiple
component patient safety intervention in English hospitals: controlled evaluation of second phase.
BMJ. 342, d199. Click here for full text.
Benneyan JC, Lloyd RC & Plsek PE. (2003). Statistical process control as a tool for research and
healthcare improvement, Quality and Safety in Healthcare, 12(6), 458-464. Click here for abstract.


![Improvement & Evaluation of contact erosion & … · Title: Microsoft PowerPoint - Improvement & Evaluation of contact erosion & corrosion (PPTminimizer) [Compatibility Mode] Author:](https://img.pdfslide.us/doc/110x75/5b9710db09d3f206218c1fe6/improvement-evaluation-of-contact-erosion-title-microsoft-powerpoint-.jpg)