Embed Size (px)
Citation preview
2008. Annual Report and Proxy.
In a changed environment Esterline’s strategy, capabilities, culture and the highly engineered solutions we offer are proving even more significant.
ES
TE
RL
INE
2008. AN
NU
AL
RE
PO
RT
AN
D P
RO
XY.
173074_COVER_R1.indd 1173074_COVER_R1.indd 1 1/14/09 6:40:37 PM1/14/09 6:40:37 PM
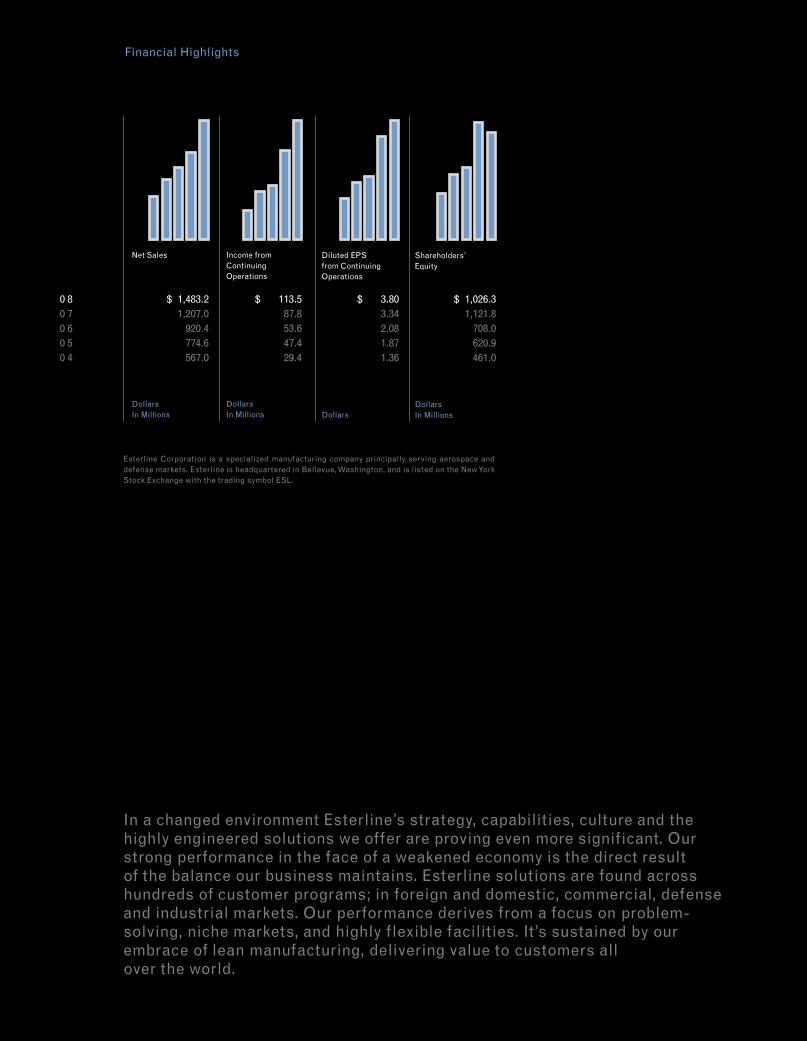
0 8 $ 1,483.2 $ 113.5 $ 3.80 $ 1,026.30 7 1,207.0 87.8 3.34 1,121.80 6 920.4 53.6 2.08 708.00 5 774.6 47.4 1.87 620.90 4 567.0 29.4 1.36 461.0
Net Sales
Dollars In Millions
Income fromContinuing Operations
DollarsIn Millions
Diluted EPS from Continuing Operations
Dollars
Shareholders’ Equity
DollarsIn Millions
In a changed environment Esterline’s strategy, capabilities, culture and the highly engineered solutions we offer are proving even more significant. Our strong performance in the face of a weakened economy is the direct result of the balance our business maintains. Esterline solutions are found across hundreds of customer programs; in foreign and domestic, commercial, defense and industrial markets. Our performance derives from a focus on problem-solving, niche markets, and highly flexible facilities. It’s sustained by our embrace of lean manufacturing, delivering value to customers all over the world.
Financial Highlights
Esterline Corporation is a specialized manufacturing company principally serving aerospace and defense markets. Esterline is headquartered in Bellevue, Washington, and is listed on the New York Stock Exchange with the trading symbol ESL.
2 1
3
4
56 7
89
1211
10
16
1718
19
United States
1 Arkansas East Camden 2 California Brea; Buena Park; Coachella; Pomona; Rancho Santa Margarita; Sylmar; Valencia 3 Idaho Coeur d’ Alene
4 Illinois Chicago; Rockford
5 Massachusetts Taunton
6 Michigan Frankenmuth
7 New York Norwich
8 North Carolina Lillington
9 Tennessee Milan
10 Virginia Hampton 11 Washington Kent; Seattle
12 Wisconsin Platteville
Canada
13 Quebec Montreal
14 Ontario Ottawa
Mexico
15 Baja California Tijuana
Worldwide Locations
European Union
16 France Bourges; Niort; Sarralbe; Toulouse
17 Germany Munich; Nördlingen 18 United Kingdom Enfi eld; Farnborough; Gloucester; London; Middle Wallop; Portsmouth; Ringwood; Stockton-on-Tees
Far East
19 China Beijing; Hong Kong; Shanghai; Zunyi
15
1413
173074_COVER_R1.indd 2173074_COVER_R1.indd 2 1/14/09 6:41:50 PM1/14/09 6:41:50 PM
E sterline had an outstanding year —the best ever in terms of sales, cash fl ow, and practically every metric by which we measure our success. On a continuing opera- tions basis, total sales for fi scal 2008 were up 23% to $1.48 billion, with net earnings of $114 million, or $3.80 per share. Importantly, the growth was generated from each of our three busi-ness segments, led by a 32% year-over-year improve-ment in Avionics & Controls, and growth of 21% and 14% in Sensors & Systems and Advanced Materials respectively. With this past year’s performance, and the nearly 27% compound annual growth rate over the past fi ve years, we are building a history of success that speaks for itself. And there is strength in our numbers:
To our shareholders
173074_NARR 1173074_NARR 1 1/12/09 2:13:16 PM1/12/09 2:13:16 PM
• Top-line organic growth jumped 17% over 2007;
• Gross profi t was up 31%.
While we expect modest growth in fi s-cal 2009, Esterline’s strategy, capabilities, culture and highly engineered solutions will prove increasingly valuable to our custom-ers. And, our consistent track record lays a foundation for growth for years to come.
Sticking to the Strategy
Fundamentally, our recent successes are the result of a strategy set in motion a decade ago. That strategy combines an en-trepreneurial culture that excels in innova-tion and a relentless attention to improved execution across the entire company. In 1997, we began to build a global enter-prise focused primarily on aerospace and defense. Since then we have methodically attained leadership roles in a number of targeted niches. This critical mass enables us to compete at a higher level, affords us
improved bargaining power and helps us deliver more value to our customers, while the diversity helps insulate Esterline from industry cycles.
At the heart of the strategy is the ability to seek out and acquire best-in-class, com-plementary businesses that enhance our technological competency, market reach, and substantially elevate our competitive strengths throughout the industry. Since January 2003, the company has acquired more than 15 companies. In addition, subsequent to year end, we fi nalized the acquisition of NMC Group and entered into a defi nitive agreement to purchase Racal Acoustics. NMC extends our Advanced Materials prod-uct offering to include specialized lightweight plastic and composite-adhesive-bonded fasteners. Racal leverages our expertise in secure communications by adding high-tech-nology ruggedized personal communications equipment, ranging from lightweight noise-reducing headsets to advanced battlefi eld secure telephone networks. Some of our
Page 2 . Letter to Shareholders
173074_NARR 2173074_NARR 2 1/12/09 2:13:16 PM1/12/09 2:13:16 PM
acquisitions have been small but strategi-cally signifi cant, as was the case with fi scal 2004’s AVISTA, which brought us embedded software development capabilities for mis-sion-critical applications. Other acquisitions were sizeable, like last year’s CMC Electron-ics, which has transformed Esterline from principally a components manufacturer to a full avionics systems company.
Collectively, these acquisitions have helped Esterline to grow annual revenues from $494 million in 2003 to $1.48 billion in 2008. More importantly, these acquisitions brought to Esterline new product lines, ad-vanced technologies, and skilled engineers and managers that expanded our customer base into new global markets. Clearly, these acquisitions remain a compelling example of the whole becoming greater than the sum of the parts.
Converting Innovation into Growth
Whether acquired or developed in house, technological innovation remains a keystone
to Esterline’s future success. In recent years, research and development investments have been signifi cant, reaching a peak in fi scal 2008 of $87 million, or nearly 6% of annual sales. Though R&D spending will moderate in 2009, the surge allowed us to obtainTier designations on several signifi cant new platforms, including such important military programs as the T-6B trainer and the Joint Strike Fighter and, on the commercial side of things, Boeing’s innovative 787 and its Airbus counterpart, the A350. These wins not only raised our profi le within the industry but sig-nifi cantly expanded our customer base. With our R&D investments on these programs largely expensed, we will begin to see signifi -cant benefi t in coming years as we move into production.
Our persistent focus on R&D investment also enables us to realize embedded value by leveraging the core technologies developed for aerospace and defense and applying them to other markets such as medical, high-speed rail and the gaming industry.
Page 3 . Letter to Shareholders
1
173074_NARR 3173074_NARR 3 1/12/09 2:13:16 PM1/12/09 2:13:16 PM
Focused Execution Across
Operations and Geographies
With Esterline’s global reach, remarkably di-verse customer base, and a focus on excelling in complex high-mix / low-volume manufactur-ing, I am constantly encouraged by gains we are making by removing ineffi ciencies from our operations and systems. Our success in this area is due broadly to the Esterline Per-formance System, a business system created in concert with employees that focuses on key performance standards and actively engages people in developing new ways for Esterline’s operations to excel at what they do.
There’s real value in this process. We’ve been able to uncover “hidden lift” in our busi-ness model that was otherwise unavailable. A clear example is evident in our work to ratchet back SG&A expense, which is now declining steadily as a percentage of sales. Continuous improvements are occurring all across Esterline—improvements that not only advance our performance, but our cus-tomers’ as well.
Although it’s clear that economic conditions around the world have changed, I believe Esterline’s approach to business is prov-ing signifi cant in this new environment. Our strategy is proven and our capabilities are highly valued. We are beginning the year with a record backlog and a solid balance sheet. These strong fundamentals set the stage for 2009 and beyond, and I am optimistic about the opportunities we see.
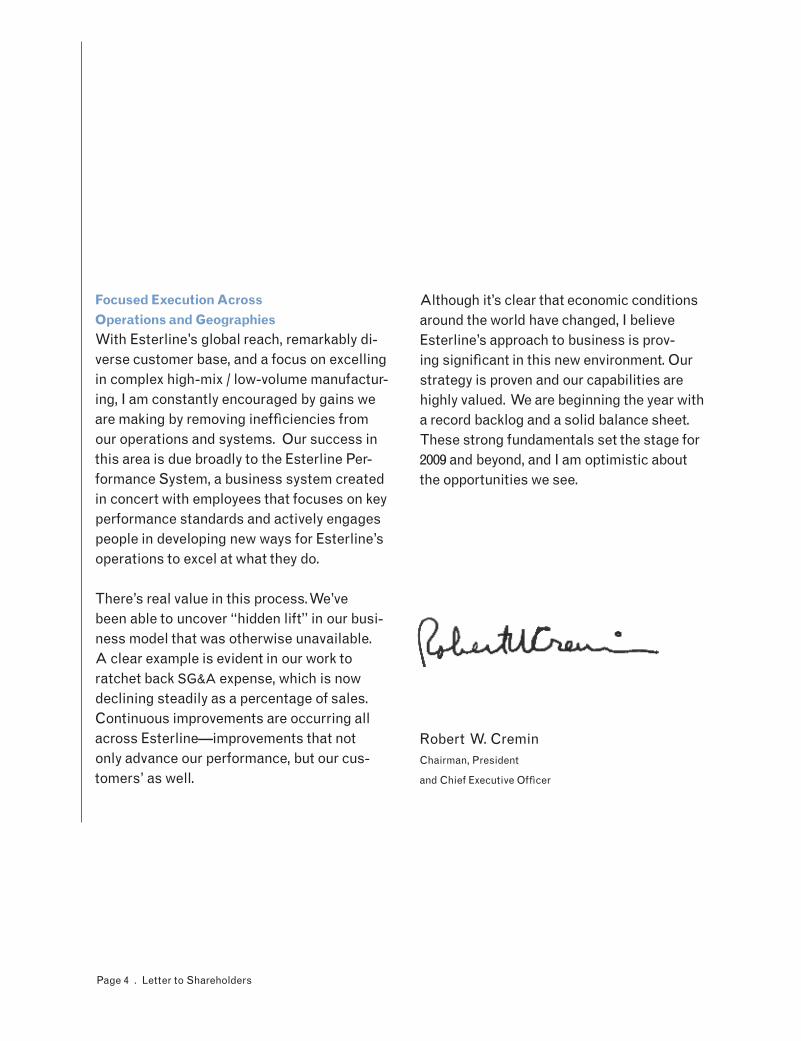
Robert W. CreminChairman, President
and Chief Executive Offi cer
Page 4 . Letter to Shareholders
173074_NARR 4173074_NARR 4 1/12/09 2:13:16 PM1/12/09 2:13:16 PM

Esterline. 2008. Annual Report. Form 10-K.
Focused Execution Across
Operations and Geographies
With Esterline’s global reach, remarkably di-verse customer base, and a focus on excelling in complex high-mix / low-volume manufactur-ing, I am constantly encouraged by gains we are making by removing inefficiencies from our operations and systems. Our success in this area is due broadly to the Esterline Per-formance System, a business system created in concert with employees that focuses on key performance standards and actively engages people in developing new ways for Esterline’s operations to excel at what they do.
There’s real value in this process. We’ve been able to uncover “hidden lift” in our busi-ness model that was otherwise unavailable. A clear example is evident in our work to ratchet back SG&A expense, which is now declining steadily as a percentage of sales. Continuous improvements are occurring all across Esterline—improvements that not only advance our performance, but our cus-tomers’ as well.
Although it’s clear that economic conditions around the world have changed, I believe Esterline’s approach to business is prov-ing significant in this new environment. Our strategy is proven and our capabilities are highly valued. We are beginning the year with a record backlog and a solid balance sheet. These strong fundamentals set the stage for 2009 and beyond, and I am optimistic about the opportunities we see.
Robert W. CreminChairman, President
and Chief Executive Officer
Page 4 . Letter to Shareholders

Esterlin
e. 2008. Form
10-K
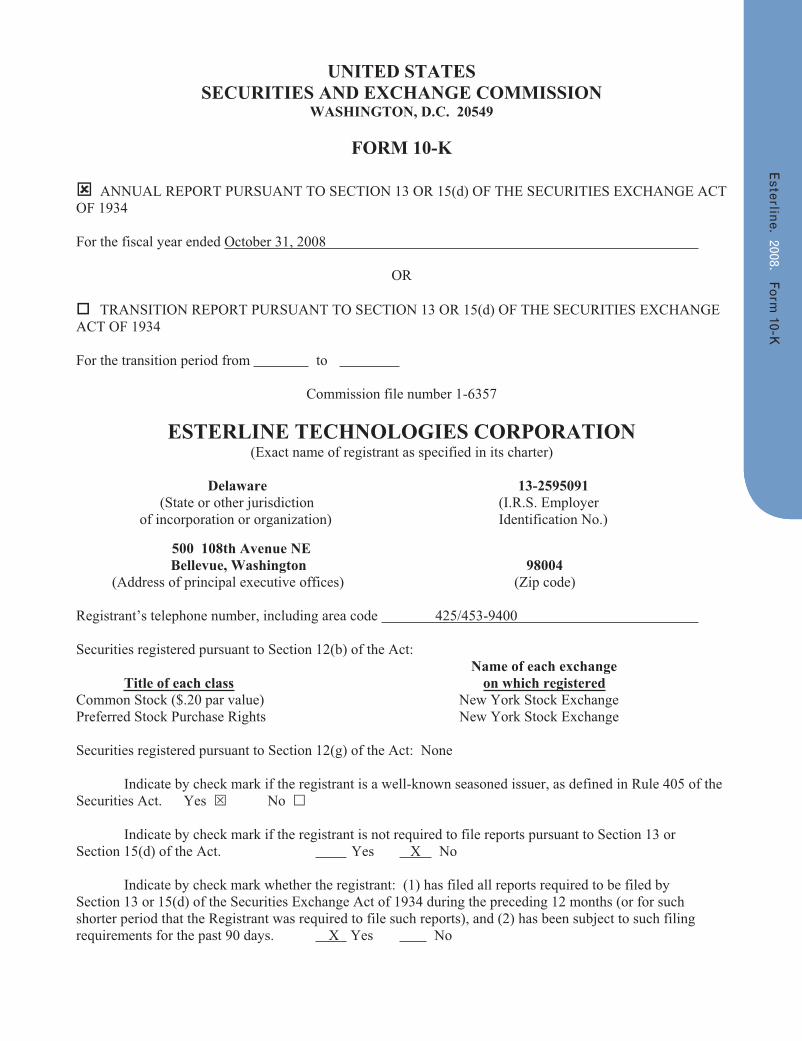
UNITED STATES SECURITIES AND EXCHANGE COMMISSION
WASHINGTON, D.C. 20549
FORM 10-K
ANNUAL REPORT PURSUANT TO SECTION 13 OR 15(d) OF THE SECURITIES EXCHANGE ACT OF 1934
For the fiscal year ended October 31, 2008
OR
TRANSITION REPORT PURSUANT TO SECTION 13 OR 15(d) OF THE SECURITIES EXCHANGE ACT OF 1934
For the transition period from to
Commission file number 1-6357
ESTERLINE TECHNOLOGIES CORPORATION (Exact name of registrant as specified in its charter)
Delaware 13-2595091 (State or other jurisdiction (I.R.S. Employer of incorporation or organization) Identification No.)
500 108th Avenue NE Bellevue, Washington 98004 (Address of principal executive offices) (Zip code)
Registrant’s telephone number, including area code 425/453-9400
Securities registered pursuant to Section 12(b) of the Act: Name of each exchange
Title of each class on which registered Common Stock ($.20 par value) New York Stock Exchange Preferred Stock Purchase Rights New York Stock Exchange
Securities registered pursuant to Section 12(g) of the Act: None
Indicate by check mark if the registrant is a well-known seasoned issuer, as defined in Rule 405 of the Securities Act. Yes No
Indicate by check mark if the registrant is not required to file reports pursuant to Section 13 or Section 15(d) of the Act. Yes X No
Indicate by check mark whether the registrant: (1) has filed all reports required to be filed by Section 13 or 15(d) of the Securities Exchange Act of 1934 during the preceding 12 months (or for such shorter period that the Registrant was required to file such reports), and (2) has been subject to such filing requirements for the past 90 days. X Yes No
2
Indicate by check mark if disclosure of delinquent filers pursuant to Item 405 of Regulation S-K is not contained herein, and will not be contained, to the best of registrant’s knowledge, in definitive proxy or information statements incorporated by reference in Part III of this Form 10-K or any amendment to this Form 10-K.
Indicate by check mark whether the registrant is a large accelerated filer, an accelerated filer, or a non-accelerated filer. See definition of “accelerated filer and large accelerated filer” in Rule 12b-2 of the Exchange Act. (Check one):
Large accelerated filer Accelerated filer Non-accelerated filer
Indicate by check mark whether the registrant is a shell company (as defined in Rule 12b-2 of the Exchange Act). Yes X No
As of December 19, 2008, 29,689,453 shares of the Registrant’s common stock were outstanding. The aggregate market value of shares of common stock held by non-affiliates as of May 2, 2008 was $1,651,288 (based upon the closing sales price of $55.99 per share).
3
PART I
This Report includes a number of forward-looking statements that reflect the Company’s current views with respect to future events and financial performance. Please refer to the section addressing forward-looking information on page 12 for further discussion. In this report, “we,” “our,” “us,” “Company,” and “Esterline” refer to Esterline Technologies Corporation and subsidiaries, unless otherwise noted or context otherwise indicates. Item 1. Business (a) General Development of Business. Esterline, a Delaware corporation formed in 1967, is a leading specialized manufacturing company principally serving aerospace and defense customers. We design, manufacture and market highly engineered products and systems for application within the industries we serve. Our strategy is to maintain a leadership position in niche markets for the development and manufacture of highly engineered products that are essential to our customers. We are concentrating our efforts to expand selectively our capabilities in these markets, to anticipate the global needs of our customers and to respond to such needs with comprehensive solutions. Our current business and strategic growth plan focuses on the continuous development of these products in three key technology segments – avionics and controls, sensors and systems, and advanced materials including thermally engineered components and specialized high-performance elastomers and other complex materials, principally for aerospace and defense markets. Our products are often mission-critical equipment, which have been designed into particular military and commercial platforms and in certain cases can only be replaced by products of other manufacturers following a formal certification process. As part of our implementation of this growth plan, we focus on, among other things, expansion of our capabilities as a more comprehensive supplier to our customers, which in fiscal 2007 included the acquisition of CMC Electronics (CMC). In addition, subsequent to October 31, 2008, we acquired NMC Group, Inc. and disposed of a non-core business operating as Muirhead Aerospace and Traxsys Input Products. On December 15, 2008, we acquired NMC Group, Inc. (NMC) for approximately $90.0 million in cash. NMC designs and manufactures specialized light weight fasteners principally for commercial aviation applications. On December 21, 2008, we entered into a Share Sale and Purchase Agreement to acquire Racal Acoustics Global Ltd. (Racal) for U.K. £115.0 million or $172.0 million, subject to certain governmental approvals and customary closing conditions. Racal develops and manufactures high technology ruggedized personal communication equipment for the defense and avionics market segment. These acquisitions and divestiture are described in more detail in the “Overview” section of Management’s Discussion and Analysis of Financial Condition and Results of Continuing Operations contained Item 7 of this report. Our products have a long history in the aerospace and defense industry and are found on most military and commercial aircraft, helicopters, and land-based systems. For example, our products are used on the majority of active and in-production U.S. military aircraft and on every Boeing commercial aircraft platform manufactured in the past 65 years. In addition, our products are supplied to Airbus, all of the major regional and business jet manufacturers, and the major aircraft engine manufacturers. We differentiate ourselves through our engineering and manufacturing capabilities and our reputation for quality, on-time delivery, reliability, and innovation – all embodied in the Esterline Performance System, our way of approaching business that ensures all employees are
4
focused on continuous improvement. We work closely with original equipment manufacturers (OEMs) on new, highly engineered product designs which often results in our products being designed into their platforms; this integration often results in sole-source positions for OEM production and aftermarket business. In fiscal 2008, we estimate that 35% of our sales to commercial and military aerospace customers were derived from aftermarket business. Our aftermarket sales, including retrofits, spare parts, and repair services, historically carry a higher gross margin and have more stability than sales to OEMs. In many cases, aftermarket sales extend well beyond the OEM production period, supporting the platform during its entire life cycle. Our sales are diversified across three broad markets: defense, commercial aerospace, and general industrial. For fiscal 2008, we estimate we derived approximately 40% of our sales from the defense market, 45% from the commercial aerospace market and 15% from the general industrial market. (b) Financial Information About Industry Segments. A summary of net sales to unaffiliated customers, operating earnings and identifiable assets attributable to our business segments for fiscal years 2008, 2007 and 2006 is reported in Note 15 to the Company’s Consolidated Financial Statements for the fiscal year ended October 31, 2008, and appears in Item 8 of this report. (c) Narrative Description of Business. Avionics & Controls Our Avionics & Controls business segment designs and manufactures high technology electronics systems for military and commercial aircraft and land- and sea-based military vehicles, secure communications systems, specialized medical equipment, and other industrial applications. We are a market leader in global positioning systems (GPS), head-up displays, enhanced vision systems, and electronic flight management systems that are used in a broad variety of control and display applications. For example, our high-performance GPS systems are installed on over 16,500 aircraft world-wide. In addition, we develop, manufacture and market sophisticated high reliability technology interface systems for commercial and military aircraft. These products include lighted push-button and rotary switches, keyboards, lighted indicators, panels and displays. Over the years, our products have been integrated into many existing aircraft designs, including every Boeing commercial aircraft platform currently in production. Our large installed base provides us with a significant spare parts and retrofit business. We are a Tier 1 supplier on the Boeing 787 program to design and manufacture all of the cockpit overhead panels and embedded software for these systems. We manufacture control sticks, grips and wheels, as well as specialized switching systems. In this area, we primarily serve commercial and military aviation, and airborne and ground-based military equipment manufacturing customers. For example, we are a leading manufacturer of pilot control grips for most types of military fighter jets and helicopters. Additionally, our software engineering center supports our customers’ needs with such applications as primary flight displays, flight management systems, air data computers and engine control systems. Our proprietary products meet critical operational requirements and provide customers with significant technological advantages in such areas as night vision compatibility and active-matrix liquid-crystal displays (a technology enabling pilots to read display screens in a variety of light conditions as well as from extreme angles). Our products are incorporated in a wide variety of platforms ranging from military helicopters, fighters and transports, to commercial wide-body,
5
regional and business jets. In fiscal 2008, some of our largest customers for these products included The Boeing Company, Sikorsky, Honeywell, Lockheed Martin, Rockwell Collins, BAE Systems, U.S. Department of Defense, and General Electric. We are also a supplier in custom input integration with a full line of keyboard, switch and input technologies for specialized medical equipment, communications systems and comparable equipment for military applications. These products include custom keyboards, keypads, and input devices that integrate cursor control devices, bar-code scanners, displays, video, and voice activation. We also produce instruments that are used for point-of-use and point-of-care in vitro diagnostics. We have developed a wide variety of technologies, including plastic and vinyl membranes that protect high-use switches and fully depressible buttons, and backlit elastomer switch coverings that are resistant to exposure from harsh chemicals. These technologies now serve as the foundation for a small but growing portion of our product line. In fiscal 2008, some of our largest customers for these products included General Electric, Philips, IDEXX Laboratories, Inc., Roche, Siemens, DRS, and Biosite. Sensors & Systems Our Sensors & Systems business segment produces high-precision temperature, pressure and speed sensors, electrical power switching, control and data communication devices, and other related systems principally for aerospace and defense customers. We are a market leader for these products in Europe with growing positions in the United States. For example, we are the sole-source supplier of temperature probes for use on all versions of the General Electric/Snecma CFM-56 jet engine. The CFM-56 has an installed base of nearly 19,000 engines, is standard equipment on new generation Boeing 737 aircraft and was selected as the engine for approximately 45% of all Airbus aircraft delivered to date. We are contracted to design and manufacture the 787’s sensors for the environmental control system and the primary power distribution assembly for the new Airbus A400M military transport. Additionally, we have secured a Tier 1 position with Rolls Royce for the complete suite of sensors for the engine that will power the A400M. The principal customers for our products in this business segment are jet engine manufacturers and airframe manufacturers. In fiscal 2008, some of our largest customers for these products included SAFRAN, Flame, The Boeing Company, Dassault, Honeywell, Pratt & Whitney, Bombardier, and Eurocopter. Advanced Materials Our Advanced Materials business segment develops and manufactures high-performance elastomer products used in a wide range of commercial aerospace, space, and military applications, and combustible ordnance for military applications. We also develop and manufacture highly engineered thermal components for commercial aerospace and industrial applications. Specialized High-Performance Applications. We specialize in the development of proprietary formulations for silicone rubber and other elastomer products. Our elastomer products are engineered to address specific customer requirements where superior performance in high temperature, high pressure, caustic, abrasive and other difficult environments is critical. These products include clamping devices, thermal fire barrier insulation products, sealing systems, tubing and coverings designed in custom-molded shapes. Some of the products include proprietary elastomers that are specifically designed for use on or near a jet engine. We are a leading U.S. supplier of high-performance elastomer products to the aerospace industry, with our primary customers for these products being jet and rocket engine manufacturers, commercial and military airframe manufacturers, as well as commercial airlines. In fiscal 2008, some of the largest customers for these products included The Boeing Company, Alliant Techsystems, KAPCO, Honeywell,
6
Northrop Grumman, Lockheed Martin, and Pattonair. We also develop and manufacture high temperature lightweight insulation systems for aerospace and marine applications. Our commercial aerospace programs include the 737, A320, and A380 series aircraft and the V2500 and BR710 engines. Our insulation material is used on diesel engine manifolds for earthmover and agricultural applications. In addition, we specialize in the development of thermal protection for petrochemical fire protection systems and nuclear insulation. We design and manufacture high temperature components for industrial and marine markets. Our manufacturing processes consist of cutting, pressing, welding stainless steel, Inconel and titanium fabrications. In fiscal 2008, some of the largest customers of these products included Rolls Royce, Airbus, and Spirit AeroSystems. Other Defense Applications. We develop and manufacture combustible ordnance and electronic warfare countermeasure devices for military customers. We manufacture molded fiber cartridge cases, mortar increments, igniter tubes and other combustible ordnance components primarily for the U.S. Department of Defense. We are currently the sole supplier of combustible casings utilized by the U.S. Armed Forces. Sales are made either directly to the U.S. Department of Defense or through prime contractors, Alliant Techsystems and General Dynamics. These products include the combustible case for the U.S. Army’s new generation 155mm Modular Artillery Charge System, the 120mm combustible case used with the main armament system on the U.S. Army and Marine Corps’ M1-A1/2 tanks, and the 60mm, 81mm and 120mm combustible mortar increments. We are currently the only U.S. supplier of radar countermeasure chaff and one of two suppliers to the U.S. Army of infrared decoy flares used by aircraft to help protect against radar and infrared guided missiles. A summary of product lines contributing sales of 10% or more of total sales for fiscal years 2008, 2007 and 2006 is reported in Note 15 to the Consolidated Financial Statements for the fiscal year ended October 31, 2008, and appears in Item 8 of this report. Marketing and Distribution We believe that a key to continued success is our ability to meet customer requirements both domestically and internationally. We have and will continue to improve our world-wide sales and distribution channels in order to provide wider market coverage and to improve the effectiveness of our customers’ supply chain. For example, our medical device assembly operation in Shanghai, China, serves our global medical customers. In addition, our service center in Singapore has improved our capabilities in Asia for our temperature sensor customers. Other enhancements include combining sales and marketing forces of our operating units where appropriate, cross-training our sales representatives on multiple product lines, and cross-stocking our spares and components. In the technical and highly engineered product segments in which we compete, relationship selling is particularly appropriate in targeted marketing segments where customer and supplier design and engineering inputs need to be tightly integrated. Participation in industry trade shows is an effective method of meeting customers, introducing new products, and exchanging technical specifications. In addition to technical and industry conferences, our products are supported through direct internal international sales efforts, as well as through manufacturer representatives and selected distributors. As of October 31, 2008, 234 sales people, 277 representatives, and 170 distributors support our operations internationally.
7
Backlog
Backlog at October 31, 2008 was $1.1 billion, compared with $958.0 million at October 26, 2007. We estimate that approximately $388.1 million of backlog is scheduled to be shipped after fiscal 2009.
Backlog is subject to cancellation until delivered, and therefore, we cannot assure that our backlog will be converted into revenue in any particular period or at all. Backlog does not include the total contract value of cost-plus reimbursable contracts, which are funded as we incur the costs. Except for the released portion, backlog also does not include fixed-price multi-year contracts. Competition
Our products and services are affected by varying degrees of competition. We compete with other companies in most markets we serve, many of which have far greater sales volumes and financial resources. Some of our competitors are also our customers on certain programs. The principal competitive factors in the commercial markets in which we participate are product performance, on-time delivery, service and price. Part of product performance requires expenditures in research and development that lead to product improvement. The market for many of our products may be affected by rapid and significant technological changes and new product introductions. Our principal competitors include Eaton, ECE, EMS, Gables Engineering, GE Aerospace, Honeywell, Otto Controls, Rockwell Collins, Thales, Ultra Electronics, Telephonics, and Universal Avionics Systems Corporation in our Avionics & Controls segment; Ametek, Meggitt, Tyco, MPC Products, ECE and Goodrich in our Sensors & Systems segment; and Kmass, ULVA, Doncasters, Hitemp, Meggitt (including Dunlop Standard Aerospace Group), Chemring, JPR Hutchinson, and Parker in our Advanced Materials segment.
Research and Development
Our product development and design programs utilize an extensive base of professional engineers, technicians and support personnel, supplemented by outside engineering and consulting firms when needed. In fiscal 2008, approximately $86.8 million was expended for research, development and engineering, compared with $66.9 million in fiscal 2007 and $49.1 million in fiscal 2006. We believe continued product development is key to our long-term growth, and consequently, we consistently invest in research and development. Examples include research and development projects relating to a ground fault interrupter for aircraft applications, insulation material for various rocket and missile programs, high temperature, low observable material for military applications, and kinematic countermeasure flares for military applications. Our more recent aerospace program wins have resulted in increased company-funded research and development. These programs included the A400M power distribution assembly, TP400 engine sensors, 787 overhead control panel and 787 environmental control system programs. As a result of the acquisition of CMC in fiscal 2007, we are funding the development of the integrated avionics system for the T-6B. In addition, we actively participate in customer-funded research and development programs, including applications on the new MMA aircraft, joint strike fighter, UH-60M Blackhawk, VH-71 Presidential Helicopter and Russian Regional Jet.
Foreign Operations
Our principal foreign operations consist of manufacturing facilities located in France, Germany, Canada, the United Kingdom, Mexico and China, and include sales and service operations located in
8
Singapore and China. For further information regarding foreign operations, see Note 15 to the Consolidated Financial Statements under Item 8 of this report.
U.S. Government Contracts and Subcontracts
As a contractor and subcontractor to the U.S. government (primarily the U.S. Department of Defense), we are subject to various laws and regulations that are more restrictive than those applicable to private sector contractors. Approximately 10% of our sales were made directly to the U.S. government in fiscal 2008. In addition, we estimate that our subcontracting activities to contractors for the U.S. government accounted for approximately 16% of sales during fiscal 2008. Therefore, we estimate that approximately 26% of our sales during the fiscal year were subject to U.S. government contracting regulations. Such contracts may be subject to termination, reduction or modification in the event of changes in government requirements, reductions in federal spending, and other factors.
Historically, our U.S. government contracts and subcontracts have been predominately fixed-price contracts. Generally, fixed-price contracts offer higher margins than cost-plus contracts in return for accepting the risk that increased or unexpected costs may reduce anticipated profits or cause us to sustain losses on the contracts. The accuracy and appropriateness of certain costs and expenses used to substantiate our direct and indirect costs for the U.S. government under both cost-plus and fixed-price contracts are subject to extensive regulation and audit by the Defense Contract Audit Agency, an arm of the U.S. Department of Defense. The contracts and subcontracts to which we are a party are also subject to profit and cost controls and standard provisions for termination at the convenience of the U.S. government. Upon termination, other than for our default, we will normally be entitled to reimbursement for allowable costs and to an allowance for profit. To date, none of our significant fixed-price contracts have been terminated.
Patents and Licenses
Although we hold a number of patents and licenses, we do not believe that our operations are dependent on our patents and licenses. In general, we rely on technical superiority, continual product improvement, exclusive product features, superior lead-time, on-time delivery performance, quality and customer relationships to maintain competitive advantage.
Seasonality The timing of our revenues is impacted by the purchasing patterns of our customers and as a result we do not generate revenues evenly throughout the year. Moreover, our first fiscal quarter, November through January, includes significant holiday vacation periods in both Europe and North America. This leads to decreased order and shipment activity; consequently, first quarter results are typically weaker than other quarters and not necessarily indicative of our performance in subsequent quarters. Sources and Availability of Raw Materials and Components
Due to our diversification, the sources and availability of certain raw materials and components are not as critical as they would be for manufacturers of a single product line. However, certain components, supplies and raw materials for our operations are purchased from single sources. In such instances, we strive to develop alternative sources and design modifications to minimize the effect of business interruptions.
9
Environmental Matters We are subject to federal, state, local and foreign laws, regulations and ordinances that (i) govern activities or operations that may have adverse environmental effects, such as discharges to air and water, as well as handling and disposal practices for solid and hazardous waste, and (ii) impose liability for the costs of cleaning up, and certain damages resulting from, sites or past spills, disposals or other releases of hazardous substances. At various times we have been identified as a potentially responsible party pursuant to the Comprehensive Environmental Response, Compensation, and Liability Act of 1980 (CERCLA), and analogous state environmental laws, for the cleanup of contamination resulting from past disposals of hazardous wastes at certain sites to which we, among others, sent wastes in the past. CERCLA requires potentially responsible persons to pay for cleanup of sites from which there has been a release or threatened release of hazardous substances. Courts have interpreted CERCLA to impose strict, joint and several liability on all persons liable for cleanup costs. As a practical matter, however, at sites where there are multiple potentially responsible persons, the costs of cleanup typically are allocated among the parties according to a volumetric or other standard. We have accrued liabilities for environmental remediation costs expected to be incurred by our operating facilities. Environmental exposures are provided for at the time they are known to exist or are considered reasonably probable and estimable. No provision has been recorded for environmental remediation costs that could result from changes in laws or other circumstances we have not currently contemplated. Employees We had 9,699 employees at October 31, 2008, of which 5,042 were based in the United States, 3,009 in Europe, 1,148 in Canada, 381 in Mexico and 119 in Asia. Approximately 17% of the U.S.-based employees were represented by a labor union. Our European operations are subject to national trade union agreements and to local regulations governing employment. (d) Financial Information About Foreign and Domestic Operations and Export Sales. See risk factor below entitled “Political and economic changes in foreign countries and markets, including foreign currency fluctuations, may have a material adverse impact on our operating results” under Item 1A of this report and Note 15 to the Consolidated Financial Statements under Item 8 of this report. (e) Available Information of the Registrant. You can access financial and other information on our website, www.esterline.com. We make available through our website, free of charge, copies of our annual report on Form 10-K, quarterly reports on Form 10-Q, current reports on Form 8-K and amendments to those reports filed or furnished pursuant to Section 13(a) or Section 15(d) of the Securities Exchange Act of 1934, as amended (the “Exchange Act”), as soon as reasonably practicable after filing such material electronically or otherwise furnishing it to the Securities and Exchange Commission. Our Corporate Governance Guidelines and charters for our board committees are available on our website, www.esterline.com/governance/default.stm and our Code of Business Conduct and Ethics, which includes a code of ethics applicable to our accounting and financial employees, including our Chief Executive Officer and Chief Financial Officer, is available on our website at

10
www.esterline.com/governance/ethics.stm. Each of these documents is also available in print (at no charge) to any shareholder upon request. Our website and the information contained therein or connected thereto are not incorporated by reference into this Form 10-K.

11
Executive Officers of the Registrant
The names and ages of all executive officers of the Company and the positions and offices held by such persons as of December 22, 2008 are as follows:
Name Position with the Company Age Robert W. Cremin Chairman, President and Chief Executive Officer 68 Robert D. George Vice President, Chief Financial Officer, 52 Secretary and Treasurer Marcia J. M. Greenberg Vice President, Human Resources 56 Frank E. Houston Group Vice President 57 Larry A. Kring Group Vice President 68 Stephen R. Larson Vice President, Strategy & Technology 64 Richard B. Lawrence Group Vice President 61
Mr. Cremin has been Chairman since January 2001. In addition, he has served as Chief Executive Officer and President since January 1999 and September 1997, respectively. Mr. Cremin has an M.B.A. from the Harvard Business School and a B.S. degree in Metallurgical Engineering from Polytechnic Institute of Brooklyn. He has been a director of the Company since 1998.
Mr. George has been Vice President, Chief Financial Officer, Secretary and Treasurer since July 1999. Mr. George has an M.B.A. from the Fuqua School of Business at Duke University and a B.A. degree in Economics from Drew University.
Ms. Greenberg has been Vice President, Human Resources since March 1993. Ms. Greenberg has a J.D. degree from Northwestern University School of Law and a B.A. degree in Political Science from Portland State University.
Mr. Houston has been Group Vice President since March 2005. Previously, he was President of Korry Electronics Co., part of Esterline’s Avionics & Controls segment, since October 2002. Mr. Houston has an M.B.A. from the University of Washington and a B.A. degree in Political Science from Seattle Pacific University.
Mr. Kring will retire from the Company effective December 31, 2008, as Group Vice President. Previously, he was Senior Group Vice President from February 2005 to March 2008 and Group Vice President from August 1993 to February 2005. Mr. Kring has an M.B.A. from California State University at Northridge and a B.S. degree in Aeronautical Engineering from Purdue University.
Mr. Larson has been Vice President, Strategy & Technology since January 2000. Mr. Larson has an M.B.A. from the University of Chicago and a B.S. degree in Electrical Engineering from Northwestern University.
Mr. Lawrence has been Group Vice President since January 2007. From September 2002 to January 2007, he was President of Advanced Input Systems, part of Esterline’s Avionics & Controls segment. Mr. Lawrence has an M.B.A from the University of Pittsburgh and a B.S. degree in Business Administration from Pennsylvania State University.
12
Forward-Looking Statements This annual report on Form 10-K includes forward-looking statements. These statements may be identified by the use of forward-looking terminology such as “anticipate,” “believe,” “continue,” “could,” “estimate,” “expect,” “intend,” “may,” “might,” “plan,” “potential,” “predict,” “should” or “will” or the negative thereof or other variations thereon or comparable terminology. In particular, statements about our expectations, beliefs, plans, objectives, assumptions or future events or performance contained in this report under the headings “Risks Relating to Our Business,” “Management’s Discussion and Analysis of Financial Condition and Results of Continuing Operations” and “Business” are forward-looking statements.
We have based these forward-looking statements on our current expectations, assumptions, estimates and projections. While we believe these expectations, assumptions, estimates and projections are reasonable, such forward-looking statements are only predictions and involve known and unknown risks and uncertainties, many of which are beyond our control. These and other important factors, including those discussed in this report under the headings “Risks Relating to Our Business and Our Industry,” “Management’s Discussion and Analysis of Financial Condition and Results of Continuing Operations” and “Business” may cause our actual results, performance or achievements to differ materially from any future results, performance or achievements expressed or implied by these forward-looking statements. Some of the key factors that could cause actual results to differ from our expectations are:
A significant downturn in the aerospace industry; A significant reduction in defense spending; A decrease in demand for our products as a result of competition, technological innovation or
otherwise; Our inability to integrate acquired operations or complete acquisitions; and Loss of a significant customer or defense program.
Given these risks and uncertainties, you are cautioned not to place undue reliance on such forward-looking statements. The forward-looking statements included or incorporated by reference into this report are made only as of the date hereof. We do not undertake and specifically decline any obligation to update any such statements or to publicly announce the results of any revisions to any such statements to reflect future events or developments.
Item 1A. Risk Factors Risks Relating to Our Business and Our Industry The current capital and credit market conditions may adversely affect our access to capital, cost of capital and business operations. Recently, the general economic and capital market conditions in the United States and other parts of the world have deteriorated significantly and have adversely affect access to capital and increased the cost of capital. If these conditions continue or become worse, our future cost of debt and equity capital and access to capital markets could be adversely affected. Any inability to obtain adequate financing from debt and equity sources could force us to self-fund strategic initiatives or even forgo some opportunities, potentially harming our financial position, results of operations and liquidity.
13
Economic conditions may impair our customers’ business and markets, which could adversely affect our business operations. As a result of the current economic downturn and macro-economic challenges currently affecting the economy of the Unit States and other parts of the world, the businesses of some of our customers may not generate sufficient revenues. Customers may choose to delay or postpone purchases from us until the economy and their businesses strengthen. Decisions by current or future customers to forego or defer purchases and/or our customers’ inability to pay us for our products may adversely affect our earnings and cash flow.
Implementing our acquisition strategy involves risks, and our failure to successfully implement this strategy could have a material adverse effect on our business. One of our key strategies is to grow our business by selectively pursuing acquisitions. Since 1996 we have completed over 30 acquisitions, and we are continuing to actively pursue additional acquisition opportunities, some of which may be material to our business and financial performance. Although we have been successful with this strategy in the past, we may not be able to grow our business in the future through acquisitions for a number of reasons, including:
Acquisition financing not being available on acceptable terms or at all; Encountering difficulties identifying and executing acquisitions; Increased competition for targets, which may increase acquisition costs; Consolidation in our industry reducing the number of acquisition targets; and Competition laws and regulations preventing us from making certain acquisitions.
In addition, there are potential risks associated with growing our business through acquisitions, including the failure to successfully integrate and realize the expected benefits of an acquisition. For example, with any past or future acquisition, there is the possibility that:
The business culture of the acquired business may not match well with our culture; Technological and product synergies, economies of scale and cost reductions may not occur
as expected; Management may be distracted from overseeing existing operations by the need to integrate
acquired businesses; We may acquire or assume unexpected liabilities; Unforeseen difficulties may arise in integrating operations and systems; We may fail to retain and assimilate employees of the acquired business; We may experience problems in retaining customers and integrating customer bases; and Problems may arise in entering new markets in which we may have little or no experience.
Failure to continue implementing our acquisition strategy, including successfully integrating acquired businesses, could have a material adverse effect on our business, financial condition and results of operations.
Our future financial results could be adversely impacted by asset impairment charges.
Under Statement of Financial Accounting Standards No. 142, “Goodwill and Other Intangible Assets” (Statement No. 142), we are required to test both acquired goodwill and other indefinite-lived intangible assets for impairment on an annual basis based upon a fair value approach, rather than amortizing them over time. We have chosen to perform our annual impairment reviews of goodwill
14
and other indefinite-lived intangible assets during the fourth quarter of each fiscal year. We also are required to test goodwill for impairment between annual tests if events occur or circumstances change that would more likely than not reduce our enterprise fair value below its book value. These events or circumstances could include a significant change in the business climate, including a significant sustained decline in an entity’s market value, legal factors, operating performance indicators, competition, sale or disposition of a significant portion of the business, or other factors. If the fair market value is less than the book value of goodwill, we could be required to record an impairment charge. The valuation of reporting units requires judgment in estimating future cash flows, discount rates and estimated product life cycles. In making these judgments, we evaluate the financial health of the business, including such factors as industry performance, changes in technology and operating cash flows. As we have grown through acquisitions, we have accumulated $576.9 million of goodwill, and have $50.1 million of indefinite-lived intangible assets, out of total assets of $1.9 billion at October 31, 2008. As a result, the amount of any annual or interim impairment could be significant and could have a material adverse effect on our reported financial results for the period in which the charge is taken. We performed our impairment review for fiscal 2008 as of August 1, 2008, and our Step One analysis indicates that no impairment of goodwill and other indefinite-lived assets exist at any of our reporting units. Our CMC reporting unit’s margin in passing the Step One analysis was not as large as our other reporting units. CMC’s operating performance has been impacted by the effect of the weakening U.S. dollar relative to the Canadian dollar for most of the period we have owned the business. In addition, operating results have been impacted by higher than expected costs related to certain long-term development contracts, including the T-6B. During the fourth quarter of fiscal 2008, the U.S. dollar has strengthened against the Canadian dollar and if this relationship continues, CMC’s results of operations will be favorably impacted. We expect that the T-6B development will be successful and that CMC’s operations will continue to improve due to recent contract wins, operational productivity improvements and a continued stronger U.S. dollar relative to the Canadian dollar. It is possible, however, that as a result of events or circumstances, we could conclude at a later date that goodwill of $203.3 million at CMC may be considered impaired. We also may be required to record an earnings charge or incur unanticipated expense if, due to a change in strategy or other reason, we determine the value of other assets has been impaired. These other assets include net deferred income tax assets of $9.4 million, trade names of $22.6 million and intangible assets of $72.1 million.
We account for the impairment of long-lived assets to be held and used in accordance with Financial Accounting Standards No. 144, “Accounting for the Impairment or Disposal of Long-lived Assets” (Statement No. 144). Statement No. 144 requires that a long-lived asset to be disposed of be reported at the lower of its carrying amount or fair value less cost to sell. An asset (other than goodwill and indefinite-lived intangible assets) is considered impaired when estimated future cash flows are less than the carrying amount of the asset. In the event the carrying amount of such asset is not deemed recoverable, the asset is adjusted to its estimated fair value. Fair value is generally determined based upon estimated discounted future cash flows. As we have grown through acquisitions, we have accumulated $240.4 million of definite-lived intangible assets. As a result, the amount of any annual or interim impairment could be significant and could have a material adverse effect on our reported financial results for the period in which the charge is taken.
The amount of debt we have outstanding, as well as any debt we may incur in the future, could have an adverse effect on our operational and financial flexibility. As of October 31, 2008, we had $401.8 million of debt outstanding, of which $388.2 million is long-term debt. Our primary U.S. dollar credit facility as of October 31, 2008, totaled $200.0 million and is made available through a group of banks. In fiscal 2006, we borrowed U.K. £57.0 million under
15
our credit facility, of which U.K. £21.7 million or $34.9 million was outstanding at October 31, 2008.Up to $50.0 million in letters of credit may be drawn in U.K. pounds or euros in addition to U.S. dollars. The credit agreement is secured by substantially all of the Company’s assets and interest is based on standard inter-bank offering rates. In addition, we have unsecured foreign currency credit facilities that have been extended by foreign banks for up to $27.7 million. Available credit under the above credit facilities was $212.6 million at October 31, 2008, when reduced by outstanding foreign bank borrowings of $5.2 million and letters of credit of $9.9 million.
The indentures governing our outstanding $175.0 million 7.75% senior subordinated notes and $175.0 million 6.625% senior notes and other debt agreements limit, but do not prohibit, us from incurring additional debt in the future. Our level of debt could have significant consequences to our business, including the following:
Depending on interest rates and debt maturities, a substantial portion of our cash flow from operations could be dedicated to paying principal and interest on our debt, thereby reducing funds available for our acquisition strategy, capital expenditures or other purposes;
A significant amount of debt could make us more vulnerable to changes in economic conditions or increases in prevailing interest rates;
Our ability to obtain additional financing for acquisitions, capital expenditures or for other purposes could be impaired;
The increase in the amount of debt we have outstanding increases the risk of non-compliance with some of the covenants in our debt agreements which require us to maintain specified financial ratios; and
We may be more leveraged than some of our competitors, which may result in a competitive disadvantage.
The loss of a significant customer or defense program could have a material adverse effect on our operating results.
Some of our operations are dependent on a relatively small number of customers and defense programs, which change from time to time. Significant customers in fiscal 2008 included the U.S. Department of Defense, The Boeing Company, General Dynamics, Flame, Rolls Royce, Honeywell, Lockheed Martin and GE Aerospace. There can be no assurance that our current significant customers will continue to buy our products at current levels. The loss of a significant customer or the cancellation of orders related to a sole-source defense program could have a material adverse effect on our operating results if we were unable to replace the related sales.
Our operating results are subject to fluctuations that may cause our revenues to decline.
Our business is susceptible to seasonality and economic cycles, and as a result, our operating results have fluctuated widely in the past and are likely to continue to do so. Our revenue tends to fluctuate based on a number of factors, including domestic and foreign economic conditions and developments affecting the specific industries and customers we serve. For example, it is possible that the current recession could result in a downturn in commercial aviation and defense. It is also possible that in the future our operating results in a particular quarter or quarters will not meet the expectations of securities analysts or investors, causing the market price of our common stock, senior subordinated notes or senior notes to decline. We believe that quarter-to-quarter comparisons of our operating results are not a good indication of our future performance and should not be relied upon to predict our future performance.
16
Political and economic changes in foreign countries and markets, including foreign currency fluctuations, may have a material effect on our operating results.
Foreign sales were approximately 54% of our total sales in fiscal 2008, and we have manufacturing facilities in a number of foreign countries. A substantial portion of our Avionics & Controls operations are based in Canada, and a substantial portion of our Sensors & Systems operations are based in the U.K. and France. We also have manufacturing operations in Mexico and China. Doing business in foreign countries is subject to numerous risks, including political and economic instability, restrictive trade policies of foreign governments, economic conditions in local markets, health concerns, inconsistent product regulation or unexpected changes in regulatory and other legal requirements by foreign agencies or governments, the imposition of product tariffs and the burdens of complying with a wide variety of international and U.S. export laws and differing regulatory requirements. To the extent that foreign sales are transacted in a foreign currency, we are subject to the risk of losses due to foreign currency fluctuations. In addition, we have substantial assets denominated in foreign currencies, primarily the Canadian dollar, U.K. pound and euro, that are not offset by liabilities denominated in those foreign currencies. These net foreign currency investments are subject to material changes in the event of fluctuations in foreign currencies against the U.S. dollar.
Among other things, we are subject to the Foreign Corrupt Practices Act, or FCPA, which generally prohibits U.S. companies and their intermediaries from bribing foreign officials for the purpose of obtaining or keeping business or otherwise obtaining favorable treatment. In particular, we may be held liable for actions taken by our strategic or local partners even though our partners are not subject to the FCPA. Any determination that we have violated the FCPA could result in sanctions that could have a material adverse effect on our business, financial condition and results of operations.
A downturn in the aircraft market could adversely affect our business. The aerospace industry is cyclical in nature and affected by periodic downturns that are beyond our control. The principal markets for manufacturers of commercial aircraft are the commercial and regional airlines, which are adversely affected by a number of factors, including the current recession, fuel and labor costs, intense price competition, outbreak of infectious disease and terrorist attacks, as well as economic cycles, all of which can be unpredictable and are outside our control. Commercial aircraft production may increase or decrease in response to changes in customer demand caused by the current recession and the perceived safety and ease of airline travel.
The military aircraft industry is dependent upon the level of equipment expenditures by the armed forces of countries throughout the world, and especially those of the United States. Although the war on terror has increased the level of equipment expenditures by the U.S. armed forces, this level of spending may not be sustainable in light of government spending priorities by the U.S. In addition, in the past this industry has been adversely affected by a number of factors, including the reduction in military spending since the end of the Cold War. Decreases in military spending could depress demand for military aircraft.
Any decrease in demand for new aircraft or use of existing aircraft will likely result in a decrease in demand of our products and services, and correspondingly, our revenues, thereby adversely affecting our business, financial condition and results of operations.
17
We may not be able to compete effectively.
Our products and services are affected by varying degrees of competition. We compete with other companies and divisions and units of larger companies in most markets we serve, many of which have greater sales volumes or financial, technological or marketing resources than we do. Our principal competitors include: Eaton, ECE, EMS, Gables Engineering, GE Aerospace, Honeywell, Otto Controls, Rockwell Collins, Thales, Ultra Electronics, Telephonics, and Universal Avionics Systems Corporation in our Avionics & Controls segment; Ametek, Meggitt, Tyco, MPC Products, ECE and Goodrich in our Sensors & Systems segment; and Kmass, ULVA, Doncasters, Hitemp, Meggitt (including Dunlop Standard Aerospace Group), Chemring and Parker in our Advanced Materials segment. The principal competitive factors in the commercial markets in which we participate are product performance, service and price. Maintaining product performance requires expenditures in research and development that lead to product improvement and new product introduction. Companies with more substantial financial resources may have a better ability to make such expenditures. We cannot assure that we will be able to continue to successfully compete in our markets, which could adversely affect our business, financial condition and results of operations.
Our backlog is subject to modification or termination, which may reduce our sales in future periods.
We currently have a backlog of orders based on our contracts with customers. Under many of our contracts, our customers may unilaterally modify or terminate their orders at any time. In addition, the maximum contract value specified under a government contract awarded to us is not necessarily indicative of the sales that we will realize under that contract. For example, we are a sole-source prime contractor for many different military programs with the U.S. Department of Defense. We depend heavily on the government contracts underlying these programs. Over its lifetime, a program may be implemented by the award of many different individual contracts and subcontracts. The funding of government programs is subject to congressional appropriation.
Changes in defense procurement models may make it more difficult for us to successfully bid on projects as a prime contractor and limit sole-source opportunities available to us. In recent years, the trend in combat system design and development appears to be evolving towards the technological integration of various battlefield components, including combat vehicles, command and control network communications, advanced technology artillery systems and robotics. If the U.S. military procurement approach continues to require this kind of overall battlefield combat system integration, we expect to be subject to increased competition from aerospace and defense companies who have significantly greater resources than we do. This trend could create a role for a prime contractor with broader capabilities that would be responsible for integrating various battlefield component systems and potentially eliminating or reducing the role of sole-source providers or prime contractors of component weapon systems.
If we were unable to protect our intellectual property rights adequately, the value of our products could be diminished. Our success is dependent in part on obtaining, maintaining and enforcing our proprietary rights and our ability to avoid infringing on the proprietary rights of others. While we take precautionary steps to protect our technological advantages and intellectual property and rely in part on patent, trademark, trade secret and copyright laws, we cannot assure that the precautionary steps we have taken will completely protect our intellectual property rights. Because patent applications in the
18
United States are maintained in secrecy until either the patent application is published or a patent is issued, we may not be aware of third-party patents, patent applications and other intellectual property relevant to our products that may block our use of our intellectual property or may be used in third-party products that compete with our products and processes. In the event a competitor successfully challenges our products, processes, patents or licenses or claims that we have infringed upon their intellectual property, we could incur substantial litigation costs defending against such claims, be required to pay royalties, license fees or other damages or be barred from using the intellectual property at issue, any of which could have a material adverse effect on our business, operating results and financial condition.
In addition to our patent rights, we also rely on unpatented technology, trade secrets and confidential information. Others may independently develop substantially equivalent information and techniques or otherwise gain access to or disclose our technology. We may not be able to protect our rights in unpatented technology, trade secrets and confidential information effectively. We require each of our employees and consultants to execute a confidentiality agreement at the commencement of an employment or consulting relationship with us. However, these agreements may not provide effective protection of our information or, in the event of unauthorized use or disclosure, they may not provide adequate remedies.
We may lose money or generate less than expected profits on our fixed-price contracts. Our customers set demanding specifications for product performance, reliability and cost. Some of our government contracts and subcontracts provide for a predetermined, fixed price for the products we make regardless of the costs we incur. Therefore, we must absorb cost overruns, notwithstanding the difficulty of estimating all of the costs we will incur in performing these contracts and in projecting the ultimate level of sales that we may achieve. Our failure to anticipate technical problems, estimate costs accurately, integrate technical processes effectively or control costs during performance of a fixed-price contract may reduce the profitability of a fixed-price contract or cause a loss. While we believe that we have recorded adequate provisions in our financial statements for losses on our fixed-price contracts as required under GAAP, we cannot assure that our contract loss provisions will be adequate to cover all actual future losses. Therefore, we may incur losses on fixed-price contracts that we had expected to be profitable, or such contracts may be less profitable than expected.
We depend on the continued contributions of our executive officers and other key management, each of whom would be difficult to replace.
Our future success depends to a significant degree upon the continued contributions of our senior management and our ability to attract and retain other highly qualified management personnel. We face competition for management from other companies and organizations. Therefore, we may not be able to retain our existing management personnel or fill new management positions or vacancies created by expansion or turnover at our existing compensation levels. Although we have entered into change of control agreements with some members of senior management, we do not have employment contracts with our key executives, nor have we purchased “key-person” insurance on the lives of any of our key officers or management personnel to reduce the impact to our company that the loss of any of them would cause. Specifically, the loss of any of our executive officers would disrupt our operations and divert the time and attention of our remaining officers. Additionally, failure to attract and retain highly qualified management personnel would damage our business prospects.
19
The market for our products may be affected by our ability to adapt to technological change.
The rapid change of technology is a key feature of all of the markets in which our businesses operate.To succeed in the future, we will need to design, develop, manufacture, assemble, test, market, and support new products and enhancements to our existing products in a timely and cost-effective manner. Historically, our technology has been developed through internal research and development expenditures, as well as customer-sponsored research and development programs. There is no guarantee that we will continue to maintain, or benefit from, comparable levels of research and development in the future. In addition, our competitors may develop technologies and products that are more effective than those we develop or that render our technology and products obsolete or noncompetitive. Furthermore, our products could become unmarketable if new industry standards emerge. We cannot assure that our existing products will not require significant modifications in the future to remain competitive or that new products we introduce will be accepted by our customers, nor can we assure that we will successfully identify new opportunities and continue to have the needed financial resources to develop new products in a timely or cost-effective manner.
Our business is subject to government contracting regulations, and our failure to comply with such laws and regulations could harm our operating results and prospects. We estimate that approximately 26% of our sales in fiscal 2008 were attributable to contracts in which we were either the prime contractor to, or a subcontractor to a prime contractor to, the U.S. government. As a contractor and subcontractor to the U.S. government, we must comply with laws and regulations relating to the formation, administration and performance of federal government contracts that affect how we do business with our clients and may impose added costs on our business. For example, these regulations and laws include provisions that contracts we have been awarded are subject to:
Protest or challenge by unsuccessful bidders; and Unilateral termination, reduction or modification in the event of changes in government
requirements.
The accuracy and appropriateness of certain costs and expenses used to substantiate our direct and indirect costs for the U.S. government under both cost-plus and fixed-price contracts are subject to extensive regulation and audit by the Defense Contract Audit Agency, an arm of the U.S. Department of Defense. Responding to governmental audits, inquiries or investigations may involve significant expense and divert management attention. Our failure to comply with these or other laws and regulations could result in contract termination, suspension or debarment from contracting with the federal government, civil fines and damages, and criminal prosecution and penalties, any of which could have a material adverse effect on our operating results.
A significant portion of our business depends on U.S. government contracts, which contracts are often subject to competitive bidding, and a failure to compete effectively or accurately anticipate the success of future projects could adversely affect our business.
We obtain many of our U.S. government contracts through a competitive bidding process that subjects us to risks associated with:
The frequent need to bid on programs in advance of the completion of their design, which may result in unforeseen technological difficulties and/or cost overruns;
20
The substantial time and effort, including design, development and marketing activities, required to prepare bids and proposals for contracts that may not be awarded to us; and
The design complexity and rapid rate of technological advancement of defense-related products.
In addition, in order to win the award of developmental programs, we must be able to align our research and development and product offerings with the government’s changing concepts of national defense and defense systems. The government’s termination of, or failure to fully fund, one or more of the contracts for our programs would have a negative impact on our operating results and financial condition. Furthermore, we serve as a subcontractor on several military programs that, in large part, involve the same risks as prime contracts.
Overall, we rely on key contracts with U.S. government entities for a significant portion of our sales and business. A substantial reduction in these contracts would materially adversely affect our operating results and financial position.
The airline industry is heavily regulated and if we fail to comply with applicable requirements, our results of operations could suffer.
Governmental agencies throughout the world, including the U.S. Federal Aviation Administration, or the FAA, prescribe standards and qualification requirements for aircraft components, including virtually all commercial airline and general aviation products, as well as regulations regarding the repair and overhaul of aircraft engines. Specific regulations vary from country to country, although compliance with FAA requirements generally satisfies regulatory requirements in other countries. We include, with the replacement parts that we sell to our customers, documentation certifying that each part complies with applicable regulatory requirements and meets applicable standards of airworthiness established by the FAA or the equivalent regulatory agencies in other countries. In order to sell our products, we and the products we manufacture must also be certified by our individual OEM customers. If any of the material authorizations or approvals qualifying us to supply our products is revoked or suspended, then the sale of the subject product would be prohibited by law, which would have an adverse effect on our business, financial condition and results of operations.
From time to time, the FAA or equivalent regulatory agencies in other countries propose new regulations or changes to existing regulations, which are usually more stringent than existing regulations. If these proposed regulations are adopted and enacted, we may incur significant additional costs to achieve compliance, which could have a material adverse effect on our business, financial condition and results of operations. Future asbestos claims could harm our business. We are subject to potential liabilities relating to certain products we manufactured containing asbestos. To date, our insurance has covered claims against us relating to those products. Commencing November 1, 2003, insurance coverage for asbestos claims has been unavailable. However, we continue to have some insurance coverage for exposure to asbestos contained in our products prior to that date.
We continue to manufacture for one customer a product that contains asbestos. We have an agreement with the customer for indemnification for certain losses we may incur as a result of
21
asbestos claims relating to that product, but we cannot assure that this indemnification agreement will fully protect us from losses arising from asbestos claims.
To the extent we are not insured or indemnified for losses from asbestos claims relating to our products, asbestos claims could adversely affect our operating results and our financial condition.
Environmental laws and regulations may subject us to significant liability.
Our business and our facilities are subject to a number of federal, state, local and foreign laws, regulations and ordinances governing, among other things, the use, manufacture, storage, handling and disposal of hazardous materials and certain waste products. Among these environmental laws are rules by which a current or previous owner or operator of land may be liable for the costs of investigation, removal or remediation of hazardous materials at such property. In addition, these laws typically impose liability regardless of whether the owner or operator knew of, or was responsible for, the presence of any hazardous materials. Persons who arrange for the disposal or treatment of hazardous materials may be liable for the costs of investigation, removal or remediation of such substances at the disposal or treatment site, regardless of whether the affected site is owned or operated by them.
Because we own and operate a number of facilities that use, manufacture, store, handle or arrange for the disposal of various hazardous materials, we may incur costs for investigation, removal and remediation, as well as capital costs, associated with compliance with environmental laws. At the time of the acquisition of Wallop Defence Systems Limited, we and the seller agreed that some environmental remedial activities may need to be carried out and these activities are currently on-going. Under the terms of the Stock Purchase Agreement, a portion of the costs of any environmental remedial activities will be reimbursed by the seller if the cost is incurred within five years of the consummation of the acquisition. Additionally, at the time of our asset acquisition of the Electronic Warfare Passive Expendables Division of BAE Systems North America, certain environmental remedial activities were required under a Part B Permit issued to the infrared decoy flare facility by the Arkansas Department of Environmental Quality under the Federal Resource Conservation and Recovery Act. The Part B Permit was transferred to our subsidiary, Armtec, along with the remedial obligations. Under the terms of the asset purchase agreement, BAE Systems agreed to perform and pay for these remedial obligations at the infrared decoy flare facility up to a maximum amount of $25.0 million. Although environmental costs have not been material in the past, we cannot assure that these matters, or any similar liabilities that arise in the future, will not exceed our resources, nor can we completely eliminate the risk of accidental contamination or injury from these materials. We may be required to defend lawsuits or pay damages in connection with the alleged or actual harm caused by our products.
We face an inherent business risk of exposure to product liability claims in the event that the use of our products is alleged to have resulted in harm to others or to property. For example, our operations expose us to potential liabilities for personal injury or death as a result of the failure of an aircraft component that has been designed, manufactured or serviced by us. We may incur significant liability if product liability lawsuits against us are successful. While we believe our current general liability and product liability insurance is adequate to protect us from future product liability claims, we cannot assure that coverage will be adequate to cover all claims that may arise. Additionally, we may not be able to maintain insurance coverage in the future at an acceptable cost. Any liability not covered by insurance or for which third-party indemnification is not available could have a material adverse effect on our business, financial condition and results of operations.
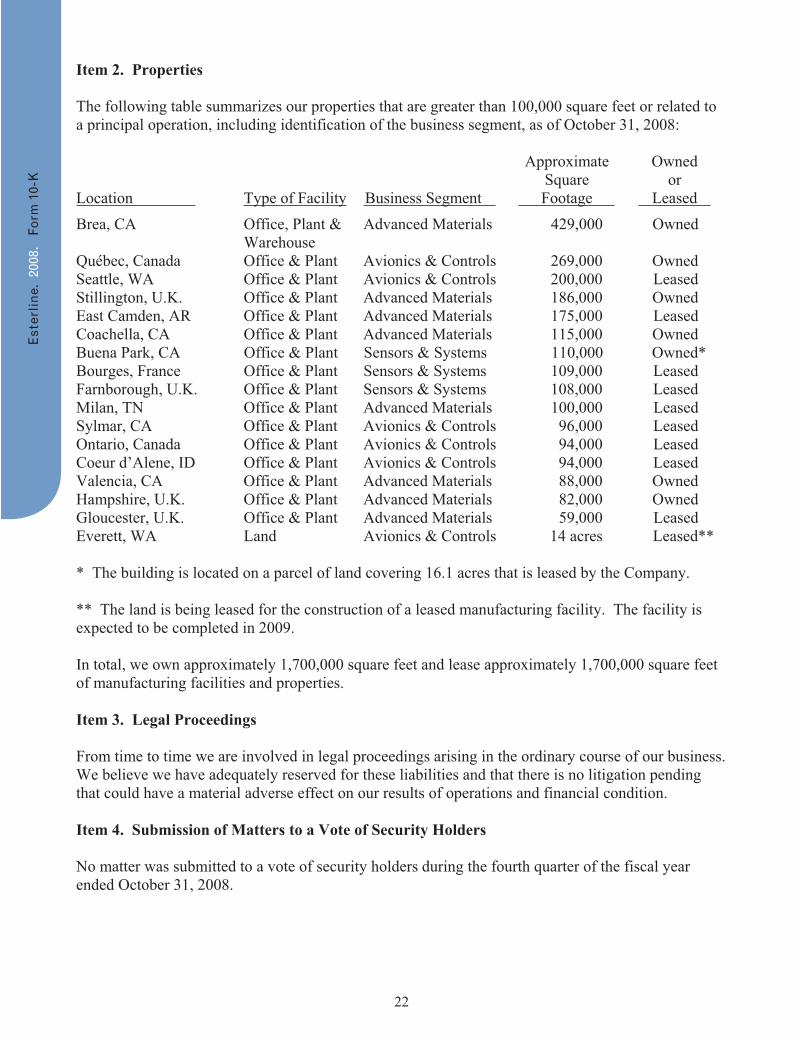
22
Item 2. Properties The following table summarizes our properties that are greater than 100,000 square feet or related to a principal operation, including identification of the business segment, as of October 31, 2008:
Approximate Owned Square or Location Type of Facility Business Segment Footage Leased Brea, CA Office, Plant & Advanced Materials 429,000 Owned Warehouse Québec, Canada Office & Plant Avionics & Controls 269,000 Owned Seattle, WA Office & Plant Avionics & Controls 200,000 Leased Stillington, U.K. Office & Plant Advanced Materials 186,000 Owned East Camden, AR Office & Plant Advanced Materials 175,000 Leased Coachella, CA Office & Plant Advanced Materials 115,000 Owned Buena Park, CA Office & Plant Sensors & Systems 110,000 Owned* Bourges, France Office & Plant Sensors & Systems 109,000 Leased Farnborough, U.K. Office & Plant Sensors & Systems 108,000 Leased Milan, TN Office & Plant Advanced Materials 100,000 Leased Sylmar, CA Office & Plant Avionics & Controls 96,000 Leased Ontario, Canada Office & Plant Avionics & Controls 94,000 Leased Coeur d’Alene, ID Office & Plant Avionics & Controls 94,000 Leased Valencia, CA Office & Plant Advanced Materials 88,000 Owned Hampshire, U.K. Office & Plant Advanced Materials 82,000 Owned Gloucester, U.K. Office & Plant Advanced Materials 59,000 Leased Everett, WA Land Avionics & Controls 14 acres Leased**
* The building is located on a parcel of land covering 16.1 acres that is leased by the Company.
** The land is being leased for the construction of a leased manufacturing facility. The facility is expected to be completed in 2009.
In total, we own approximately 1,700,000 square feet and lease approximately 1,700,000 square feet of manufacturing facilities and properties.
Item 3. Legal Proceedings From time to time we are involved in legal proceedings arising in the ordinary course of our business.We believe we have adequately reserved for these liabilities and that there is no litigation pending that could have a material adverse effect on our results of operations and financial condition.
Item 4. Submission of Matters to a Vote of Security Holders No matter was submitted to a vote of security holders during the fourth quarter of the fiscal year ended October 31, 2008.
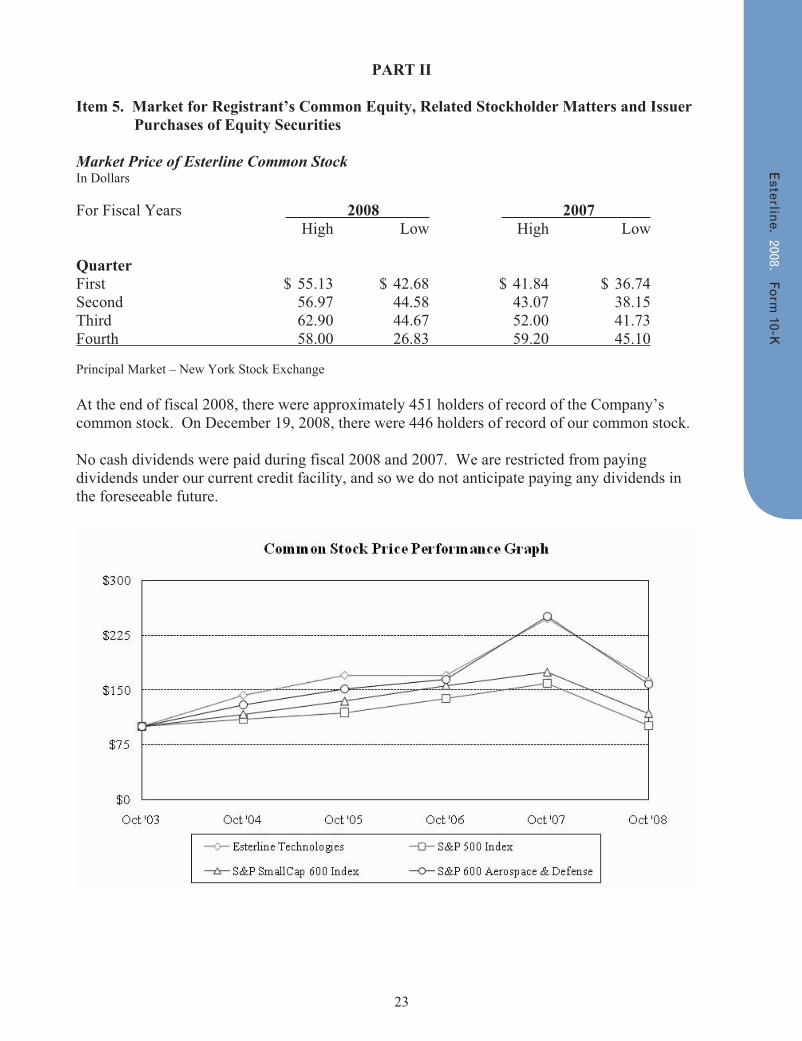
23
PART II
Item 5. Market for Registrant’s Common Equity, Related Stockholder Matters and Issuer Purchases of Equity Securities
Market Price of Esterline Common Stock In Dollars For Fiscal Years 2008 2007 High Low High Low Quarter First $ 55.13 $ 42.68 $ 41.84 $ 36.74 Second 56.97 44.58 43.07 38.15 Third 62.90 44.67 52.00 41.73 Fourth 58.00 26.83 59.20 45.10
Principal Market – New York Stock Exchange At the end of fiscal 2008, there were approximately 451 holders of record of the Company’s common stock. On December 19, 2008, there were 446 holders of record of our common stock. No cash dividends were paid during fiscal 2008 and 2007. We are restricted from paying dividends under our current credit facility, and so we do not anticipate paying any dividends in the foreseeable future.
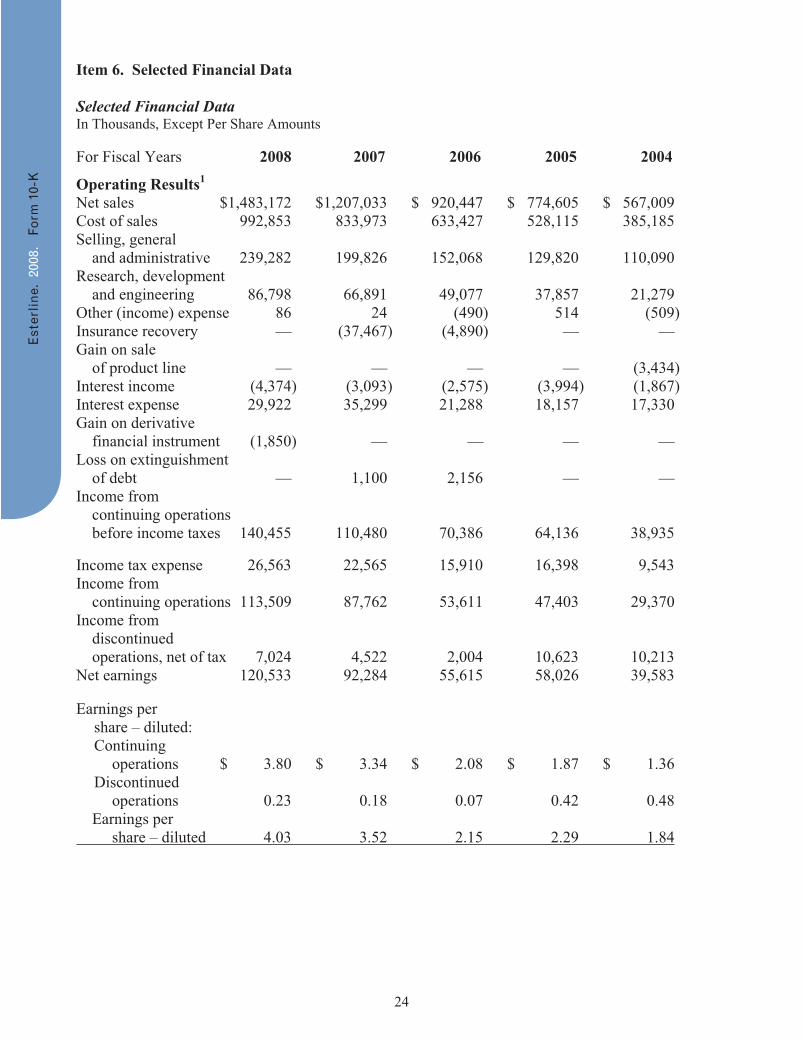
24
Item 6. Selected Financial Data Selected Financial Data In Thousands, Except Per Share Amounts
For Fiscal Years 2008 2007 2006 2005 2004
Operating Results1 Net sales $1,483,172 $1,207,033 $ 920,447 $ 774,605 $ 567,009 Cost of sales 992,853 833,973 633,427 528,115 385,185 Selling, general and administrative 239,282 199,826 152,068 129,820 110,090 Research, development and engineering 86,798 66,891 49,077 37,857 21,279 Other (income) expense 86 24 (490) 514 (509) Insurance recovery — (37,467) (4,890) — — Gain on sale of product line — — — — (3,434) Interest income (4,374) (3,093) (2,575) (3,994) (1,867) Interest expense 29,922 35,299 21,288 18,157 17,330 Gain on derivative financial instrument (1,850) — — — — Loss on extinguishment of debt — 1,100 2,156 — — Income from continuing operations before income taxes 140,455 110,480 70,386 64,136 38,935 Income tax expense 26,563 22,565 15,910 16,398 9,543 Income from continuing operations 113,509 87,762 53,611 47,403 29,370 Income from discontinued operations, net of tax 7,024 4,522 2,004 10,623 10,213 Net earnings 120,533 92,284 55,615 58,026 39,583
Earnings per share – diluted: Continuing operations $ 3.80 $ 3.34 $ 2.08 $ 1.87 $ 1.36 Discontinued operations 0.23 0.18 0.07 0.42 0.48 Earnings per share – diluted 4.03 3.52 2.15 2.29 1.84
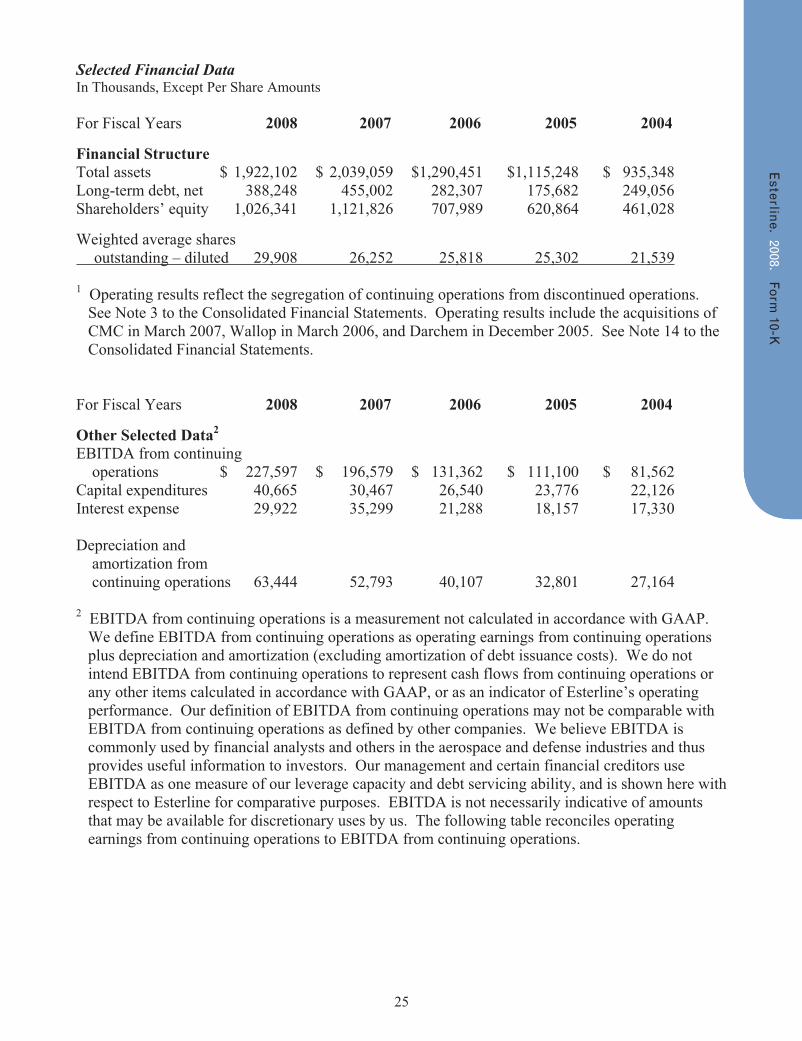
25
Selected Financial Data In Thousands, Except Per Share Amounts
For Fiscal Years 2008 2007 2006 2005 2004 Financial Structure Total assets $ 1,922,102 $ 2,039,059 $1,290,451 $1,115,248 $ 935,348 Long-term debt, net 388,248 455,002 282,307 175,682 249,056 Shareholders’ equity 1,026,341 1,121,826 707,989 620,864 461,028 Weighted average shares outstanding – diluted 29,908 26,252 25,818 25,302 21,539 1 Operating results reflect the segregation of continuing operations from discontinued operations.
See Note 3 to the Consolidated Financial Statements. Operating results include the acquisitions of CMC in March 2007, Wallop in March 2006, and Darchem in December 2005. See Note 14 to the Consolidated Financial Statements.
For Fiscal Years 2008 2007 2006 2005 2004 Other Selected Data2 EBITDA from continuing operations $ 227,597 $ 196,579 $ 131,362 $ 111,100 $ 81,562 Capital expenditures 40,665 30,467 26,540 23,776 22,126 Interest expense 29,922 35,299 21,288 18,157 17,330 Depreciation and amortization from continuing operations 63,444 52,793 40,107 32,801 27,164 2 EBITDA from continuing operations is a measurement not calculated in accordance with GAAP.
We define EBITDA from continuing operations as operating earnings from continuing operations plus depreciation and amortization (excluding amortization of debt issuance costs). We do not intend EBITDA from continuing operations to represent cash flows from continuing operations or any other items calculated in accordance with GAAP, or as an indicator of Esterline’s operating performance. Our definition of EBITDA from continuing operations may not be comparable with EBITDA from continuing operations as defined by other companies. We believe EBITDA is commonly used by financial analysts and others in the aerospace and defense industries and thus provides useful information to investors. Our management and certain financial creditors use EBITDA as one measure of our leverage capacity and debt servicing ability, and is shown here with respect to Esterline for comparative purposes. EBITDA is not necessarily indicative of amounts that may be available for discretionary uses by us. The following table reconciles operating earnings from continuing operations to EBITDA from continuing operations.
26
In Thousands
For Fiscal Years 2008 2007 2006 2005 2004
Operating earnings from continuing operations $ 164,153 $ 143,786 $ 91,255 $ 78,299 $ 54,398 Depreciation and amortization from continuing operations 63,444 52,793 40,107 32,801 27,164EBITDA from continuing operations $ 227,597 $ 196,579 $ 131,362 $ 111,100 $ 81,562
Item 7. Management’s Discussion and Analysis of Financial Condition and Results of Continuing Operations
OVERVIEW
We operate our businesses in three segments: Avionics & Controls, Sensors & Systems and Advanced Materials. The Avionics & Controls segment designs and manufactures integrated cockpit systems, technology interface systems for military and commercial aircraft and land- and sea-based military vehicles, secure communications systems, specialized medical equipment, and other industrial applications. The Sensors & Systems segment produces high-precision temperature and pressure sensors, electrical power switching, and other related systems, principally for aerospace and defense customers. The Advanced Materials segment develops and manufactures thermally engineered components and high-performance elastomer products used in a wide range of commercial aerospace and military applications, combustible ordnance components and electronic warfare countermeasure devices for military customers. All segments include sales to domestic and international, defense and commercial customers.
Our current business and strategic plan focuses on the continued development of our products principally for aerospace and defense markets. We are concentrating our efforts to expand our capabilities in these markets and to anticipate the global needs of our customers and respond to such needs with comprehensive solutions. These efforts focus on continuous research and new product development, acquisitions and establishing strategic realignments of operations to expand our capabilities as a more comprehensive supplier to our customers across our entire product offering. On March 14, 2007, we acquired CMC Electronics Inc. (CMC) a manufacturer of high technology avionics including global positioning systems, head-up displays, enhanced vision systems and electronic flight management systems. The acquisition significantly expands the scale of our existing Avionics & Controls business. CMC is included in the Avionics & Controls segment and the results of its operations were included from the effective date of the acquisition. We acquired Wallop Defence Systems Limited (Wallop) and FR Countermeasures on March 24, 2006 and December 23, 2005, respectively. Wallop and FR Countermeasures are manufacturers of military pyrotechnic countermeasure devices. The acquisitions strengthen our international and U.S. position in countermeasure devices. Wallop and FR Countermeasures are included in our Advanced Materials segment. On December 16, 2005, we acquired Darchem Holdings Limited (Darchem), a manufacturer of thermally engineered components for critical aerospace, marine and petro-chemical
27
applications. Darchem holds a leading position in its niche market and fits our engineered-to-order model and is included in our Advanced Materials segment.
On November 3, 2008, we sold Muirhead Aerospace (Muirhead) and Traxsys Input Products Limited (Traxsys) for $64.4 million, which resulted in an after tax gain of approximately $15.8 million. Muirhead and Traxsys were included in the Sensors & Systems segment. The results of operations of Muirhead and Traxsys were accounted for as a discontinued operation in the consolidated financial statements.
On December 15, 2008, the Company acquired NMC Group, Inc. (NMC) for approximately $90.0 million in cash. NMC designs and manufactures specialized light-weight fasteners principally for commercial aviation applications. NMC will be included in our Advanced Materials segment. On December 21, 2008, we entered into a Share Sale and Purchase Agreement to acquire Racal Acoustics Global Ltd. (Racal) for U.K. £115.0 million or $172.0 million, subject to certain governmental approvals and customary closing conditions. Racal develops and manufactures high technology ruggedized personal communication equipment for the defense and avionics market segment. Racal will be included in our Avionics & Controls segment.
Income from continuing operations for fiscal 2008 was $113.5 million, or $3.80 per diluted share, compared with $87.8 million, or $3.34 per diluted share in fiscal 2007. Income from continuing operations in fiscal 2007 included a $26.2 million, net of tax, or $1.00 per diluted share, insurance recovery. In fiscal 2008, Avionics & Controls performance was robust compared to the prior-year period, reflecting the effect of a stronger U.S. dollar compared to the Canadian dollar and solid results across all operating units. Results in Sensors & Systems improved and Advanced Materials earnings reflected strong sales and earnings in fiscal 2008 over the prior-year period, offset by the insurance recovery recorded in fiscal 2007. Interest expense decreased $5.4 million over the prior-year period, reflecting reduced borrowings. Income from continuing operations for fiscal 2008 reflected an effective tax rate of 18.9% compared to 20.4% for the prior-year period. Net earnings for fiscal 2008 were $120.5 million or $4.03 per diluted share compared to $92.3 million or $3.52 per diluted share in fiscal 2007.
28
Results of Continuing Operations
Fiscal 2008 Compared with Fiscal 2007
Sales for fiscal 2008 increased 22.9% over the prior year reflecting incremental sales from the CMC acquisition in the second quarter of fiscal 2007, strong sales across all segments and a 53 week year in fiscal 2008 compared to a 52 week year in fiscal 2007. Sales by segment were as follows:
Increase (Decrease) Dollars In Thousands From Prior Year 2008 2007
Avionics & Controls 32.4% $ 611,467 $ 461,990 Sensors & Systems 21.4% 384,180 316,485 Advanced Materials 13.8% 487,525 428,558 Total $1,483,172 $1,207,033
The 32.4% increase in Avionics & Controls reflected incremental sales from the CMC acquisition and higher sales of cockpit controls and medical equipment devices from new OEM programs as well as strong after-market sales. Comparing the fourth fiscal quarter of 2008 to the prior-year period, Avionics & Controls sales increased 14.4%, reflecting increased sales of cockpit avionics, controls and medical control panels.
The 21.4% increase in Sensors & Systems principally reflected growth in OEM programs for power distribution devices and strong after-market sales of temperature and pressure sensors, as well as the effect of exchange rates. Sales through much of fiscal 2008 reflected a stronger euro relative to the U.S. dollar. The average exchange rate for the euro increased from 1.34 in fiscal 2007 to 1.50 in fiscal 2008. This relationship changed significantly in the fourth fiscal quarter of 2008 when the spot rate declined from 1.55 at August 1, 2008, to 1.27 at October 31, 2008. Comparing the fourth fiscal quarter of 2008 to the prior-year period, Sensors & Systems sales increased 6.7%, principally reflecting increased sales of power distribution devices.
The 13.8% increase in Advanced Materials reflected strong sales across the segment and reflected higher sales at our thermally engineered components and elastomer operations due to increased demand from commercial aviation customers. Additionally, sales of combustible ordnance and flare countermeasure devices at our U.K. operations were strong in fiscal 2008. These increases were partially offset by lower sales of flare countermeasure devices at our U.S. operations. Comparing the fourth quarter of fiscal 2008 to the prior-year period, Advanced Materials sales increased 17.7%, reflecting strong sales of combustible ordnance and flare countermeasure devices.
Sales to foreign customers, including export sales by domestic operations, totaled $808.0 million and $612.9 million, and accounted for 54.5% and 50.8% of our sales for fiscal 2008 and 2007, respectively.
Overall, gross margin as a percentage of sales was 33.1% and 30.9% in fiscal 2008 and 2007, respectively. Avionics & Controls segment gross margin was 35.0% and 32.2% for fiscal 2008 and 2007, respectively, principally reflecting the effect of exchange rates on our Canadian operations in the fourth fiscal quarter of 2008.
29
The U.S. dollar strengthened against the Canadian dollar from 1.03 at the end of our third fiscal quarter of 2008 to 1.21 at the end of our fourth fiscal quarter. Changes in exchange rates mainly affected CMC’s U.S. dollar-denominated accounts receivable, foreign exchange contracts and backlog. The impact of exchange rates on U.S. dollar-denominated accounts receivable, backlog and forward exchange contracts favorably impacted gross margin in the fourth fiscal quarter of 2008 by approximately $5.0 million compared to a $2.0 million loss in the prior-year period. The effect of foreign exchange on CMC’s gross margin was a gain of approximately $7.0 million in fiscal 2008 and a loss in fiscal 2007 of approximately $5.0 million.
Approximately $213.4 million of CMC’s U.S. dollar-denominated backlog at October 31, 2008 is covered by forward exchange contracts, which are accounted for as a cash flow hedge. Approximately $54.1 million of backlog covered by forward exchange contracts were executed before the strengthening of the U.S. dollar against the Canadian dollar. Accordingly, the strengthening of the U.S. dollar against the Canadian dollar will not be realized on U.S. dollar-denominated sales covered by forward contracts executed before the dollar began to strengthen against the Canadian dollar.
CMC’s gross margins in fiscal 2008 were also enhanced by an improved recovery of fixed overhead due to higher sales volumes, cost reductions and productivity improvements. The increase in CMC’s gross margin was partially offset by a $5.0 million ($3.4 million, net of tax, or $0.11 per diluted share) estimate to complete adjustment for long-term contracts recorded in the third fiscal quarter of 2008. The adjustment was principally due to higher engineering costs as a result of resource constraints, increased scope and additional certification requirements to develop upgraded commercial aviation flight management systems. Excluding CMC, Avionics & Controls gross margin was 35.6% and 35.4% for fiscal 2008 and 2007, respectively, reflecting increased after-market spares sales and pricing strength on certain cockpit control devices, partially offset by an increase in excess and obsolete inventory reserves and a $1.2 million and a $2.0 million unfavorable estimate to complete adjustment on certain firm fixed-price long-term contracts for the development and manufacture of secure military communications products in fiscal 2008 and 2007, respectively.
Sensors & Systems segment gross margin was 35.3% and 35.1% for fiscal 2008 and 2007, respectively. Gross margins mainly reflected strong after-market sales, partially offset by the effect of a weaker U.S. dollar compared with the euro on U.S.-denominated sales and euro-denominated cost of sales for most of fiscal 2008. The impact of exchange rates on forward foreign exchange contracts impacted gross margin at our euro-based operations by a gain of approximately $2.8 million and $3.0 million in fiscal 2008 and 2007, respectively. Forward exchange contracts at our non-U.S. Sensor & Systems units are principally accounted for as a cash flow hedge and, accordingly, unrealized gains or losses are recognized upon settlement of the forward exchange contract.
Advanced Materials segment gross margin was 28.9% and 26.5% for fiscal 2008 and 2007, respectively. The increase in Advanced Materials gross margin was due to increased gross margins at our combustible ordnance and U.K.-flare operations as well as our elastomer and thermally engineered component operations resulting from pricing strength on certain products and an improved recovery of overhead due to higher product sales and a more favorable mix of product shipments.
Selling, general and administrative expenses (which include corporate expenses) increased to $239.3 million in fiscal 2008 compared with $199.8 million in fiscal 2007. The increase in selling, general and administrative expenses mainly reflected incremental selling, general and administrative expenses from the CMC acquisition, which was acquired in March 2007, higher incentive
30
compensation expense, and the effect of exchange rates at our non-U.S. operations. The effect of exchange rates on cash held by the corporate office and certain intercompany advances denominated in currencies other than the U.S. dollar resulted in an exchange loss of $1.4 million in fiscal 2008 compared to a $0.6 million gain in fiscal 2007. As a percentage of sales, selling, general and administrative expenses were 16.1% and 16.6% in fiscal 2008 and 2007, respectively.
Research, development and related engineering spending increased to $86.8 million, or 5.9% of sales, in fiscal 2008 compared with $66.9 million, or 5.5% of sales, in fiscal 2007. The increase in research, development and engineering principally reflected incremental spending from the CMC acquisition and increased spending on the development of the integrated cockpit system for the T-6B military trainer. Research, development and engineering expense in fiscal 2008 and 2007 is net of $5.2 million and $6.7 million, respectively, in government assistance. CMC is currently negotiating a new government assistance arrangement with Canada, which will likely be accounted for as a loan rather than a reduction in research, development and related engineering expense.
Segment earnings (which exclude corporate expenses and other income and expense) increased 12.7% during fiscal 2008 to $200.0 million compared to $177.5 million in the prior year. Segment earnings as a percent of sales were 13.5% and 14.7% in fiscal 2008 and 2007, respectively. The decrease in segment earnings as a percent of sales from fiscal 2007 reflects business insurance recoveries of $37.5 million recorded in fiscal 2007.
Avionics & Controls segment earnings were $77.9 million or 12.7% of sales in fiscal 2008 compared with $47.8 million or 10.4% of sales in fiscal 2007, reflecting strong earnings from our avionics, cockpit control and medical equipment devices operations, partially offset by the shipment in fiscal 2007 of acquired inventory of CMC, which was valued at fair value at acquisition. In addition, CMC’s earnings in fiscal 2008 were favorably affected by the effect of a stronger U.S. dollar compared with the Canadian dollar, particularly in the fourth quarter, which resulted in a foreign currency transaction gain on U.S. dollar-denominated accounts receivable and backlog in the fourth quarter of fiscal 2008. Avionics & Controls earnings were impacted by significant research and development expenses, principally related to the development of the T-6B at CMC, and a gross profit reduction of $6.2 million due to an estimate to complete adjustment on long-term contracts accounted for under SOP 81-1 compared to a $2.0 million adjustment in the prior-year period. The prior year period was also impacted by $3.4 million in contract overruns and additional research and development expense at a small unit which manufactures precision gears and data concentrators.
CMC’s results of operations are not in accordance with our expectations since acquisition. As indicated above, CMC’s results of operations were impacted by the weak U.S. dollar relative to the Canadian dollar for most of the period since our acquisition of the business and higher than expected research and development expenses related to the T-6B development. Recognizing the impact of these issues, management is focused on a broad array of initiatives designed to improve CMC’s results of operations.
Sensors & Systems segment earnings were $43.4 million or 11.3% of sales in fiscal 2008 compared with $32.4 million or 10.2% of sales in fiscal 2007. The increase in Sensors & Systems earnings reflected strong results across all operations helped by increased sales from new OEM programs, as well as strong after-market sales. Sensors & Systems segment earnings in the fourth quarter for fiscal 2008 and 2007 were $8.6 million and $9.2 million, respectively. The decrease in segment earnings principally reflected lower gross margin due to start-up costs of a manufacturing operation in a low-cost country, a less favorable product mix and the purchase of a technology license, which was recorded as research and development expense. Certain temperature, pressure, and speed sensors are
31
not achieving profit margins the Company projects for the long term. Management is focused on improving its operational efficiency and negotiating with customers to increase pricing where price increases can be justified. The impact of exchange rates on U.S. dollar-denominated accounts receivable and foreign exchange contracts impacted Sensors & Systems earnings by a gain of approximately $2.5 million and $4.0 million in fiscal 2008 and 2007, respectively.
Advanced Materials segment earnings were $78.6 million or 16.1% of sales in fiscal 2008 compared with $97.3 million or 22.7% of sales in fiscal 2007, principally reflecting $37.5 million in business interruption insurance recoveries in fiscal 2007. The impact of exchange rates on U.S. dollar-denominated accounts receivable and forward foreign exchange contracts impacted Advanced Material earnings at our U.K. operations by a loss of approximately $2.9 million and $1.2 million in fiscal 2008 and 2007, respectively.
On June 26, 2006, an explosion occurred at the Company’s Wallop facility, which resulted in one fatality and several minor injuries. The incident destroyed an oven complex for the production of advanced flares and significantly damaged a portion of the facility. The advanced flare facility has been closed due to the requirements of the Health and Safety Executive (HSE) to review the cause of the accident, but normal operations are continuing at unaffected portions of the facility. The HSE investigation will not be completed until the Coroner’s Inquest is filed. Although it is not possible to determine the results of the HSE investigation or how the Coroner will rule, management does not expect to be found in breach of the Health and Safety at Work Act related to the accident and, accordingly, no amounts have been recorded for any potential fines that may be assessed by the HSE.The construction of the new flare facility is expected to be completed and in full production, following customary start-up and commissioning activities, late in fiscal 2009.
Excluding the business insurance recovery, results of operations at our U.K. flare countermeasure operation improved by $7.4 million over fiscal 2007. This trend is expected to continue; however, poor product mix in fiscal 2008 resulted in our U.S. and U.K. flare countermeasure operations recording an operating loss. Accordingly, management is focused on completing the advanced flare facility in the U.K., developing more advanced flares with higher gross margins and improving margins on existing products. The decrease in earnings described above was partially offset by strong earnings from our thermally engineered components, elastomer and combustible ordnance operations.
Interest expense decreased to $29.9 million during fiscal 2008 compared with $35.3 million in the prior year, reflecting reduced borrowings.
Non-operating expenses included a $1.9 million gain from a terminated interest rate swap on our £57.0 million term loan, resulting from a £33.2 million or $68.0 million repayment.
Non-operating expenses in fiscal 2007 included a $1.1 million write off of debt issuance costs as a result of the prepayment of our $100.0 million U.S. term loan.
The effective income tax rate for fiscal 2008 was 18.9% compared with 20.4% in fiscal 2007. The effective tax rate was lower than the statutory rate, as both years benefited from various tax credits and certain foreign interest expense deductions. In addition, in fiscal 2008, we recognized $6.5 million in discrete tax benefits. The $6.5 million in discrete tax adjustments were the result of five items. The first item was the settlement of an examination of the U.S. income tax returns for fiscal years 2003 through 2005, which resulted in a $2.8 million reduction of previously estimated income tax liabilities. The second item was the enactment of tax laws reducing the Canadian
32
statutory corporate income tax rate, which resulted in a $4.1 million net reduction of deferred income tax liabilities. The third item was the accrual of $0.7 million of tax reserves and interest related to the finalization of CMC’s FIN 48 analysis. The fourth item was recording $0.8 million of tax expense associated with the reconciliation of fiscal 2007’s U.S. income tax return provision for income taxes. The fifth item was the recording of $1.2 million of tax benefits associated with the extension of the U.S. Research Experimentation tax credit. In fiscal 2007, we recognized $2.6 million in net discrete tax benefits. The $2.6 million in net discrete tax benefits were the result of three items. The first item was the enactment of tax laws reducing U.K., Canadian, and German statutory corporate income tax rates which resulted in a $2.8 million net reduction in deferred income tax liabilities. The second item was the retroactive extension of the U.S. Research Experimentation tax credit, which resulted in a $1.0 million tax benefit. The third item was recording $1.2 million of additional income tax resulting from the reconciliation of fiscal 2007’s U.S. and foreign income tax returns to the provisions for income taxes.
New orders for fiscal 2008 were $1.6 billion compared with $1.5 billion for fiscal 2007. Avionics & Controls orders for fiscal 2008 increased 3.4% from the prior-year period. Avionics & Controls orders in fiscal 2007 included CMC’s acquired backlog at March 14, 2007 of $264.8 million. Sensors & Systems orders for fiscal 2008 increased 16.8% from the prior-year period. Advanced Materials orders for fiscal 2008 decreased 0.4% from the prior-year period due to the timing of receiving defense system orders. Backlog at the end of fiscal 2008 was $1.1 billion compared with $958.0 million at the end of the prior year. Approximately $388.1 million is scheduled to be delivered after fiscal 2009. Backlog is subject to cancellation until delivery.
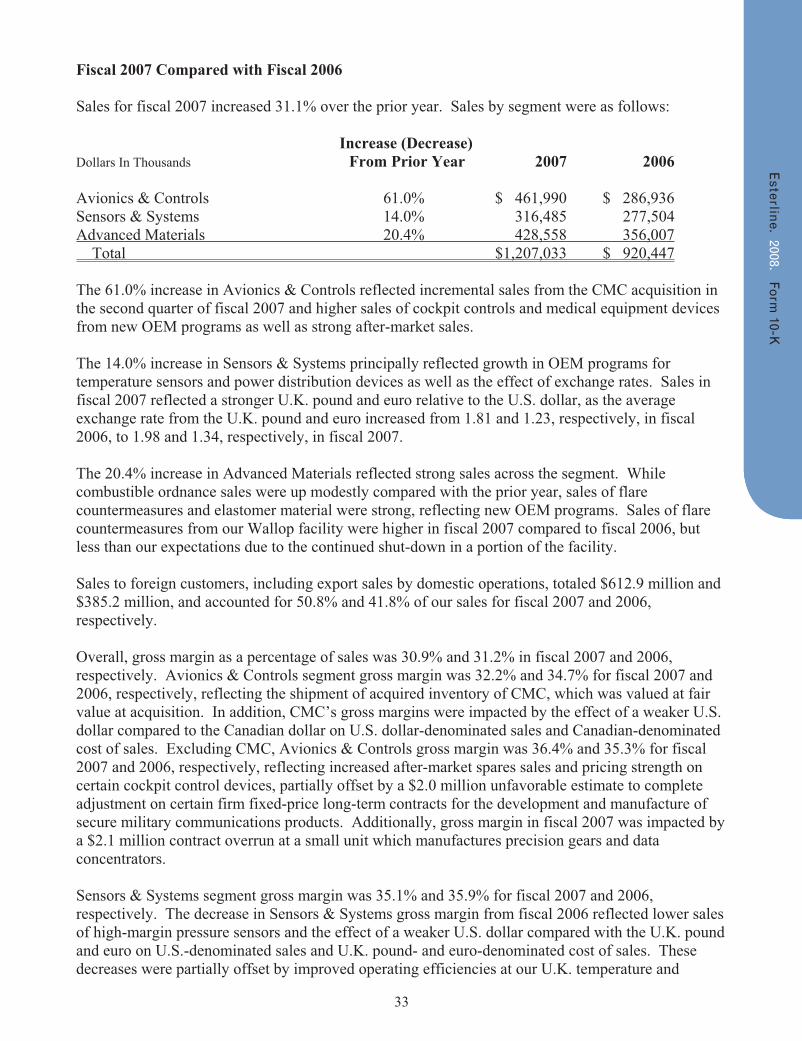
33
Fiscal 2007 Compared with Fiscal 2006
Sales for fiscal 2007 increased 31.1% over the prior year. Sales by segment were as follows:
Increase (Decrease) Dollars In Thousands From Prior Year 2007 2006
Avionics & Controls 61.0% $ 461,990 $ 286,936 Sensors & Systems 14.0% 316,485 277,504 Advanced Materials 20.4% 428,558 356,007 Total $1,207,033 $ 920,447
The 61.0% increase in Avionics & Controls reflected incremental sales from the CMC acquisition in the second quarter of fiscal 2007 and higher sales of cockpit controls and medical equipment devices from new OEM programs as well as strong after-market sales.
The 14.0% increase in Sensors & Systems principally reflected growth in OEM programs for temperature sensors and power distribution devices as well as the effect of exchange rates. Sales in fiscal 2007 reflected a stronger U.K. pound and euro relative to the U.S. dollar, as the average exchange rate from the U.K. pound and euro increased from 1.81 and 1.23, respectively, in fiscal 2006, to 1.98 and 1.34, respectively, in fiscal 2007.
The 20.4% increase in Advanced Materials reflected strong sales across the segment. While combustible ordnance sales were up modestly compared with the prior year, sales of flare countermeasures and elastomer material were strong, reflecting new OEM programs. Sales of flare countermeasures from our Wallop facility were higher in fiscal 2007 compared to fiscal 2006, but less than our expectations due to the continued shut-down in a portion of the facility.
Sales to foreign customers, including export sales by domestic operations, totaled $612.9 million and $385.2 million, and accounted for 50.8% and 41.8% of our sales for fiscal 2007 and 2006, respectively.
Overall, gross margin as a percentage of sales was 30.9% and 31.2% in fiscal 2007 and 2006, respectively. Avionics & Controls segment gross margin was 32.2% and 34.7% for fiscal 2007 and 2006, respectively, reflecting the shipment of acquired inventory of CMC, which was valued at fair value at acquisition. In addition, CMC’s gross margins were impacted by the effect of a weaker U.S. dollar compared to the Canadian dollar on U.S. dollar-denominated sales and Canadian-denominated cost of sales. Excluding CMC, Avionics & Controls gross margin was 36.4% and 35.3% for fiscal 2007 and 2006, respectively, reflecting increased after-market spares sales and pricing strength on certain cockpit control devices, partially offset by a $2.0 million unfavorable estimate to complete adjustment on certain firm fixed-price long-term contracts for the development and manufacture of secure military communications products. Additionally, gross margin in fiscal 2007 was impacted by a $2.1 million contract overrun at a small unit which manufactures precision gears and data concentrators.
Sensors & Systems segment gross margin was 35.1% and 35.9% for fiscal 2007 and 2006, respectively. The decrease in Sensors & Systems gross margin from fiscal 2006 reflected lower sales of high-margin pressure sensors and the effect of a weaker U.S. dollar compared with the U.K. pound and euro on U.S.-denominated sales and U.K. pound- and euro-denominated cost of sales. These decreases were partially offset by improved operating efficiencies at our U.K. temperature and
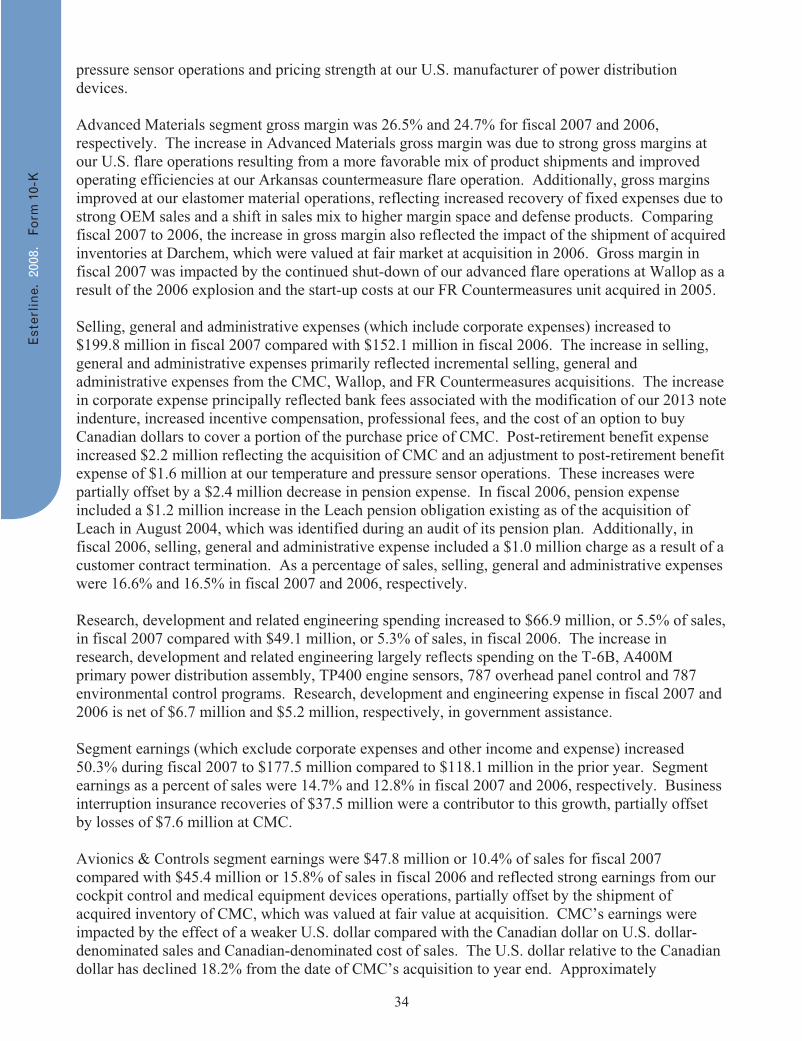
34
pressure sensor operations and pricing strength at our U.S. manufacturer of power distribution devices.
Advanced Materials segment gross margin was 26.5% and 24.7% for fiscal 2007 and 2006, respectively. The increase in Advanced Materials gross margin was due to strong gross margins at our U.S. flare operations resulting from a more favorable mix of product shipments and improved operating efficiencies at our Arkansas countermeasure flare operation. Additionally, gross margins improved at our elastomer material operations, reflecting increased recovery of fixed expenses due to strong OEM sales and a shift in sales mix to higher margin space and defense products. Comparing fiscal 2007 to 2006, the increase in gross margin also reflected the impact of the shipment of acquired inventories at Darchem, which were valued at fair market at acquisition in 2006. Gross margin in fiscal 2007 was impacted by the continued shut-down of our advanced flare operations at Wallop as a result of the 2006 explosion and the start-up costs at our FR Countermeasures unit acquired in 2005.
Selling, general and administrative expenses (which include corporate expenses) increased to $199.8 million in fiscal 2007 compared with $152.1 million in fiscal 2006. The increase in selling, general and administrative expenses primarily reflected incremental selling, general and administrative expenses from the CMC, Wallop, and FR Countermeasures acquisitions. The increase in corporate expense principally reflected bank fees associated with the modification of our 2013 note indenture, increased incentive compensation, professional fees, and the cost of an option to buy Canadian dollars to cover a portion of the purchase price of CMC. Post-retirement benefit expense increased $2.2 million reflecting the acquisition of CMC and an adjustment to post-retirement benefit expense of $1.6 million at our temperature and pressure sensor operations. These increases were partially offset by a $2.4 million decrease in pension expense. In fiscal 2006, pension expense included a $1.2 million increase in the Leach pension obligation existing as of the acquisition of Leach in August 2004, which was identified during an audit of its pension plan. Additionally, in fiscal 2006, selling, general and administrative expense included a $1.0 million charge as a result of a customer contract termination. As a percentage of sales, selling, general and administrative expenses were 16.6% and 16.5% in fiscal 2007 and 2006, respectively.
Research, development and related engineering spending increased to $66.9 million, or 5.5% of sales, in fiscal 2007 compared with $49.1 million, or 5.3% of sales, in fiscal 2006. The increase in research, development and related engineering largely reflects spending on the T-6B, A400M primary power distribution assembly, TP400 engine sensors, 787 overhead panel control and 787 environmental control programs. Research, development and engineering expense in fiscal 2007 and 2006 is net of $6.7 million and $5.2 million, respectively, in government assistance.
Segment earnings (which exclude corporate expenses and other income and expense) increased 50.3% during fiscal 2007 to $177.5 million compared to $118.1 million in the prior year. Segment earnings as a percent of sales were 14.7% and 12.8% in fiscal 2007 and 2006, respectively. Business interruption insurance recoveries of $37.5 million were a contributor to this growth, partially offset by losses of $7.6 million at CMC.
Avionics & Controls segment earnings were $47.8 million or 10.4% of sales for fiscal 2007 compared with $45.4 million or 15.8% of sales in fiscal 2006 and reflected strong earnings from our cockpit control and medical equipment devices operations, partially offset by the shipment of acquired inventory of CMC, which was valued at fair value at acquisition. CMC’s earnings were impacted by the effect of a weaker U.S. dollar compared with the Canadian dollar on U.S. dollar-denominated sales and Canadian-denominated cost of sales. The U.S. dollar relative to the Canadian dollar has declined 18.2% from the date of CMC’s acquisition to year end. Approximately
35
$94.0 million of CMC’s sales of $128.0 million were denominated in U.S. dollars. Additionally, CMC’s earnings were impacted by significant research and development expenses, principally related to the T-6B program. Avionics & Controls earnings were also impacted by $3.4 million in contract overruns and additional research and development expense at a small unit which manufactures precision gears and data concentrators.
Sensors & Systems segment earnings were $32.4 million or 10.2% of sales for fiscal 2007 compared with $26.3 million or 9.5% of sales in fiscal 2006. Operating earnings at our power distribution operation reflected improved results from increased sales from new OEM programs, a $1.0 million reimbursement of research, development and engineering expense negotiated with a customer and price increases, which were partially offset by higher research, development and engineering expenses on the A400M program. Earnings at our temperature and pressure sensors operations increased from 2006, reflecting the benefit of reduced indirect labor and research, development and engineering costs, and improved operating efficiencies, partially offset by a post-retirement benefit adjustment of $1.6 million. Comparing fiscal 2007 to 2006, Sensors & Systems earnings in fiscal 2006 were impacted by a $1.2 million increase in the Leach pension obligation explained above and manufacturing inefficiencies and incremental direct labor costs incurred to reduce delinquent shipments at our temperature and pressure sensors operations. Sensors & Systems earnings also reflected the impact of a weaker U.S. dollar relative to the euro and the U.K. pound on U.S. dollar-denominated sales and euro- and U.K. pound-based operating expenses.
Advanced Materials segment earnings were $97.3 million or 22.7% of sales for fiscal 2007 compared with $46.5 million or 13.1% of sales for fiscal 2006, principally reflecting $37.5 million in business interruption insurance recoveries, incremental earnings from our Darchem acquisition and improved earnings from our elastomer and Arkansas countermeasure flare operations. Earnings in both years were impacted by start-up costs at our FR Countermeasures unit and low sales at our Wallop operations. The $37.5 million recovery was related to an explosion that occurred at Wallop on June 26, 2006. Although a portion of the facility is expected to be closed for about two years due to the requirements of the Health Safety Executive (HSE) to review the cause of the accident, normal operations are continuing at unaffected portions of the facility. The $37.5 million insurance recovery reimbursed the Company for the loss of earnings and damage to a portion of the facility.
Interest expense increased to $35.3 million during fiscal 2007 compared with $21.3 million in the prior year, reflecting increased borrowings to finance the CMC acquisition.
Non-operating expenses in the fourth fiscal quarter of 2007 included a $1.1 million write off of debt issuance costs as a result of the prepayment of our $100.0 million U.S. term loan. Non-operating expense in the first fiscal quarter of 2006 included a $2.2 million prepayment penalty arising from the $40.0 million prepayment of our 6.77% Senior Notes. Both prepayments were recorded as a loss on extinguishment of debt.
The effective income tax rate for fiscal 2007 was 20.4% compared with 22.6% in fiscal 2006. The effective tax rate was lower than the statutory rate, as both years benefited from various tax credits and certain foreign interest expense deductions. In addition, in fiscal 2007, we recognized a $2.6 million reduction of previously estimated income tax liabilities, which was the result of the following items: a $2.8 million net reduction in deferred income tax liabilities as a result of the enactment of tax laws reducing U.K., Canadian and German statutory corporate income tax rates and a $1.0 million tax benefit as a result of the retroactive extension of the U.S. Research and Experimentation tax credit that was signed into law on December 21, 2006. These benefits were offset by $1.2 million of additional income tax resulting from the reconciliation of prior-years’ U.S.
36
and foreign income tax returns to the provisions for income taxes. The effective tax rate for fiscal 2007 also reflected CMC’s tax credits and other tax efficiencies. In fiscal 2006, we recognized a $4.5 million reduction of previously estimated tax liabilities, which was the result of the following items: $1.6 million due to the expiration of the statute of limitations and adjustments resulting from a reconciliation of the prior year’s U.S. income tax return to the U.S. provision for income taxes, $2.0 million as a result of receiving a Notice of Proposed Adjustment (NOPA) from the State of California Franchise Tax Board covering, among other items, the examination of research and development tax credits for fiscal years 1997 through 2002, and $0.9 million as a result of a favorable conclusion of a tax examination.
New orders for fiscal 2007 were $1.5 billion compared with $1.1 billion for fiscal 2006. Avionics & Controls orders for fiscal 2007 increased 118.7% from the prior-year period, principally reflecting the CMC acquisition. Sensors & Systems orders for fiscal 2007 increased 28.8% from the prior-year period. Advanced Materials orders for fiscal 2007 decreased 4.0% from the prior-year period due to the timing of receiving orders. Backlog at the end of fiscal 2007 was $958.0 million compared with $631.7 million at the end of the prior year.
37
Liquidity and Capital Resources Working Capital and Statement of Cash Flows Cash and cash equivalents at the end of fiscal 2008 totaled $160.6 million, an increase of $13.6 million from the prior year. Net working capital increased to $456.2 million at the end of fiscal 2008 from $417.7 million at the end of the prior year. Sources of cash flows from operating activities principally consist of cash received from the sale of products offset by cash payments for material, labor and operating expenses. Cash flows from operating activities were $118.9 million and $121.7 million in fiscal 2008 and 2007, respectively. The decrease principally reflected lower cash receipts from customers and higher payments for inventory and income taxes. Additionally, cash flow from operating activities in fiscal 2007 included cash received from our insurance carrier. This decrease was partially offset by an increase in net earnings and lower payments for interest on our debt. Cash flows used by investing activities were $30.1 million and $382.3 million in fiscal 2008 and 2007, respectively. The decrease in the use of cash for investing activities mainly reflected cash paid for acquisitions in fiscal 2007. Cash flows used by financing activities were $63.3 million in fiscal 2008 and cash flows provided by financing activities were $361.9 million in fiscal 2007. Cash used by financing activities in fiscal 2008 principally reflected a $68.0 million or U.K. £33.2 million principal payment on our GBP term loan. Cash provided by financing activities in fiscal 2007 reflected the issuance of $175.0 million Senior Notes due 2017, a $100.0 million U.S. term loan, and the sale of $187.1 million of common stock. Capital Expenditures Net property, plant and equipment was $204.5 million at the end of fiscal 2008 compared with $217.4 million at the end of the prior year. Capital expenditures for fiscal 2008 and 2007 were $40.7 million and $30.5 million, respectively (excluding acquisitions) and included machinery and equipment and enhancements to information technology systems. Capital expenditures are anticipated to approximate $100.0 million for fiscal 2009. Fiscal 2009 capital expenditures will include the construction of a new factory for Korry Electronics, which is included in our Avionics & Controls segment, and a new factory at our U.K. countermeasure operations. We will continue to support expansion through investments in infrastructure including machinery, equipment, buildings and information systems. Acquisitions On December 15, 2008, we acquired NMC Group, Inc. (NMC) for approximately $90.0 million in cash. NMC designs and manufactures specialized light weight fasteners principally for commercial aviation applications. NMC will be included in our Advanced Materials segment. On December 21, 2008, we entered into a Share Sale and Purchase Agreement to acquire Racal Acoustics Global Ltd. (Racal) for U.K. £115.0 million or $172.0 million, subject to certain governmental approvals and customary closing conditions. Racal develops and manufactures high technology ruggedized personal communication equipment for the defense and avionics market segment. Racal will be included in our Avionics & Controls segment.
38
Debt Financing Total debt decreased $74.0 million from the prior year to $401.8 million at the end of fiscal 2008. Total debt outstanding, including the fair value of the interest rate swap at the end of fiscal 2008, consisted of $175.0 million of Senior Notes due in 2017, $176.6 million of Senior Subordinated Notes due in 2013, $34.9 million of the GBP Term Loan and $15.3 million in borrowings under our credit facility and various foreign currency debt agreements, including capital lease obligations. The Senior Notes are due March 1, 2017 and bear an interest rate of 6.625%. The Senior Notes are general unsecured senior obligations of the Company. The Senior Notes are guaranteed, jointly and severally on a senior basis, by all the existing and future domestic subsidiaries of the Company unless designated as an “unrestricted subsidiary,” and those foreign subsidiaries that executed related subsidiary guarantees under the indenture covering the Senior Notes. The Senior Notes are subject to redemption at the option of the Company at any time prior to March 1, 2012 at a price equal to 100% of the principal amount, plus any accrued interest to the date of redemption and a make-whole provision. In addition, before March 1, 2010 the Company may redeem up to 35% of the principal amount at 106.625% plus accrued interest with proceeds of one or more Public Equity Offerings. The Senior Notes are also subject to redemption at the option of the Company, in whole or in part, on or after March 1, 2012 at redemption prices starting at 103.3125% of the principal amount plus accrued interest during the period beginning March 1, 2007 and declining annually to 100% of principal and accrued interest on or after March 1, 2015. The Senior Subordinated Notes are general unsecured obligations of the Company and are subordinated to all existing and future senior debt of the Company. In addition, the Senior Subordinated Notes are effectively subordinated to all existing and future senior debt and other liabilities (including trade payables) of the Company’s foreign subsidiaries. The Senior Subordinated Notes are guaranteed, jointly and severally, by all the existing and future domestic subsidiaries of the Company unless designated as an “unrestricted subsidiary” under the indenture covering the Senior Subordinated Notes. The Senior Subordinated Notes are subject to redemption at the option of the Company, in whole or in part, on or after June 15, 2008, at redemption prices starting at 103.875% of the principal amount plus accrued interest during the period beginning June 11, 2003 and declining annually to 100% of principal and accrued interest on June 15, 2011. In September 2003, we entered into an interest rate swap agreement on $75.0 million of our Senior Subordinated Notes due in 2013. The swap agreement exchanged the fixed interest rate for a variable interest rate on $75.0 million of the $175.0 million principal amount outstanding. On February 10, 2006, we borrowed U.K. £57.0 million, or approximately $100.0 million, under the GBP term loan facility. We used the proceeds from the loan as working capital for our U.K. operations and to repay a portion of our outstanding borrowings under the revolving credit facility. The principal amount of the loan is payable quarterly commencing on March 31, 2007 through the termination date of November 14, 2010, according to a payment schedule by which 1.25% of the principal amount is paid in each quarter of 2007, 2.50% in each quarter of 2008, 5.00% in each quarter of 2009 and 16.25% in each quarter of 2010. The loan accrues interest at a variable rate based on the British Bankers Association Interest Settlement Rate for deposits in U.K. pounds plus an additional margin amount that ranges from 1.13% to 0.50% depending upon the Company’s leverage ratio. As of October 31, 2008, the interest rate on the term loan was 6.49%. During fiscal 2008 we paid down £33.2 million, or $68.0 million, on the GBP £57.0 million term loan and terminated an interest rate swap for a gain of $1.9 million. The interest rate swap exchanged the variable interest rate for a fixed interest rate of 4.75% plus an additional margin amount determined by reference to our leverage ratio. On March 14, 2007, we acquired CMC for approximately $344.5 million in cash, including acquisition costs. The acquisition was financed in part with the proceeds of the $175 million Senior Notes due March 1, 2017. In addition, on March 13, 2007, we amended our credit agreement to
39
increase the existing revolving credit facility to $200.0 million and to provide an additional $100.0 million U.S. term loan facility. On March 13, 2007, we borrowed $60.0 million under the revolving credit facility and $100.0 million under the U.S. term loan facility to pay a portion of the purchase price of the acquisition of CMC. On October 12, 2007, we completed an underwritten public offering of 3.45 million shares of common stock, generating net proceeds of $187.1 million. Proceeds from the offering were used to pay off our $100.0 million U.S. term loan facility and pay down our revolving credit facility. We wrote off $1.1 million in debt issuance costs related to the $100.0 million term loan in fiscal 2007 as a result of its pay-off. In fiscal 2008, we entered into a land and building lease for a 216,000 square-foot manufacturing facility to be constructed in fiscal 2009 for our Korry Electronics operation. The land lease has a fixed term of 55 years and lease payments began in fiscal 2008. The land lease is accounted for as an operating lease. The building lease has a fixed term of 30 years and includes an option to purchase the building at fair market value five years after construction is complete. The expected minimum lease payments, including a 2% annual rent increase, related to the building are $1.2 million in 2009, $2.3 million in 2010, $2.4 million in 2011, $2.4 million in 2012, $2.5 million in 2013, and $83.5 million thereafter. The fair value of the building is expected to be $26.5 million and the building lease will be accounted for as a capital lease. We believe cash on hand, funds generated from operations and other available debt facilities are sufficient to fund operating cash requirements and capital expenditures through fiscal 2009; however, we may periodically utilize our lines of credit for working capital requirements. Current conditions in the capital markets are uncertain; however, we believe we will have adequate access to capital markets to fund future acquisitions. Pension and Other Post-Retirement Benefit Obligations Our pension plans principally include a U.S. pension plan maintained by Esterline, non-U.S. plans maintained by Leach, and non-U.S. plans maintained by CMC. A U.S. plan maintained by Leach was merged into the U.S. pension plan maintained by Esterline as of March 31, 2008. Our principal post-retirement plans include non-U.S. plans maintained by CMC, which are non-contributory health care and life insurance plans. We account for pension expense using the end of the fiscal year as our measurement date and we make actuarially computed contributions to our pension plans as necessary to adequately fund benefits. Our funding policy is consistent with the minimum funding requirements of ERISA. In fiscal 2008 and 2007, operating cash flow included $4.8 million and $9.7 million, respectively, of cash funding to these pension plans. We expect pension funding requirements to be approximately $2.5 million in fiscal 2009 for the plans maintained by CMC. There is no minimum funding requirements for fiscal 2009 for the U.S. pension plan maintained by Esterline. We may decide to make a discretionary contribution in fiscal 2009. The rate of increase in future compensation levels is consistent with our historical experience and salary administration policies. The expected long-term rate of return on plan assets is based on long-term target asset allocations of 70% equity and 30% fixed income. We periodically review allocations of plan assets by investment type and evaluate external sources of information regarding long-term historical returns and expected future returns for each investment type and, accordingly, believe a 7.0 – 8.25% assumed long-term rate of return on plan assets is appropriate. Current allocations are consistent with the long-term targets.
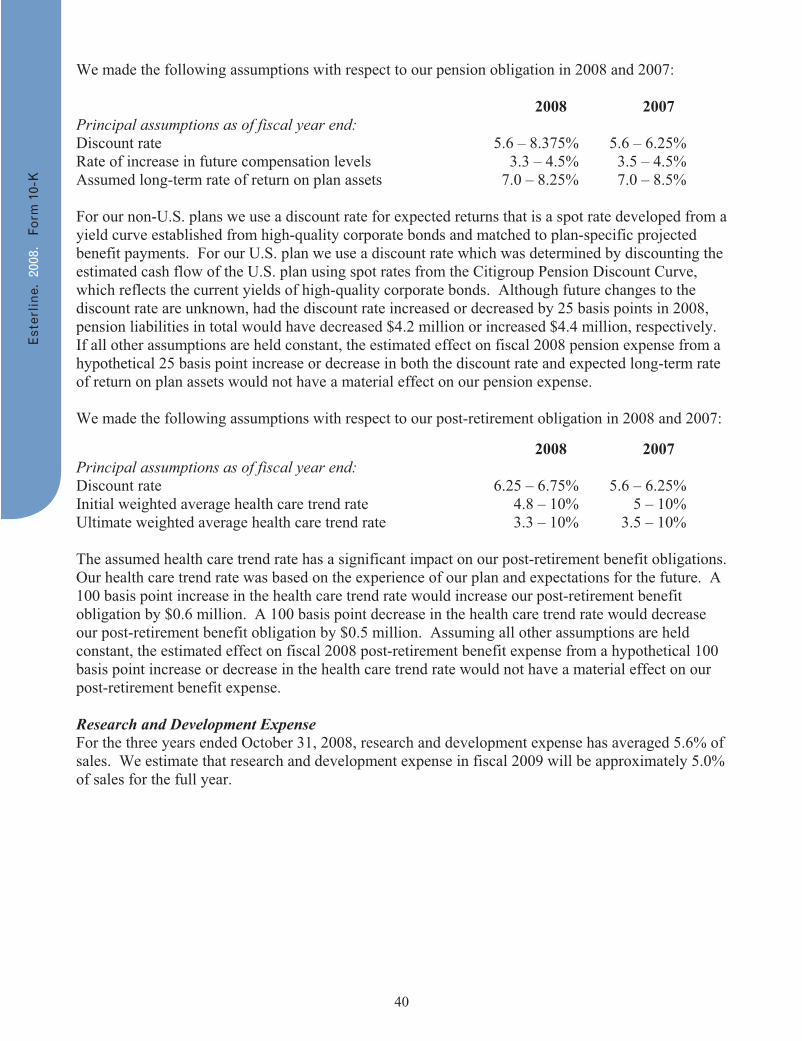
40
We made the following assumptions with respect to our pension obligation in 2008 and 2007: 2008 2007 Principal assumptions as of fiscal year end: Discount rate 5.6 – 8.375% 5.6 – 6.25% Rate of increase in future compensation levels 3.3 – 4.5% 3.5 – 4.5% Assumed long-term rate of return on plan assets 7.0 – 8.25% 7.0 – 8.5% For our non-U.S. plans we use a discount rate for expected returns that is a spot rate developed from a yield curve established from high-quality corporate bonds and matched to plan-specific projected benefit payments. For our U.S. plan we use a discount rate which was determined by discounting the estimated cash flow of the U.S. plan using spot rates from the Citigroup Pension Discount Curve, which reflects the current yields of high-quality corporate bonds. Although future changes to the discount rate are unknown, had the discount rate increased or decreased by 25 basis points in 2008, pension liabilities in total would have decreased $4.2 million or increased $4.4 million, respectively. If all other assumptions are held constant, the estimated effect on fiscal 2008 pension expense from a hypothetical 25 basis point increase or decrease in both the discount rate and expected long-term rate of return on plan assets would not have a material effect on our pension expense. We made the following assumptions with respect to our post-retirement obligation in 2008 and 2007: 2008 2007 Principal assumptions as of fiscal year end: Discount rate 6.25 – 6.75% 5.6 – 6.25% Initial weighted average health care trend rate 4.8 – 10% 5 – 10% Ultimate weighted average health care trend rate 3.3 – 10% 3.5 – 10% The assumed health care trend rate has a significant impact on our post-retirement benefit obligations. Our health care trend rate was based on the experience of our plan and expectations for the future. A 100 basis point increase in the health care trend rate would increase our post-retirement benefit obligation by $0.6 million. A 100 basis point decrease in the health care trend rate would decrease our post-retirement benefit obligation by $0.5 million. Assuming all other assumptions are held constant, the estimated effect on fiscal 2008 post-retirement benefit expense from a hypothetical 100 basis point increase or decrease in the health care trend rate would not have a material effect on our post-retirement benefit expense. Research and Development Expense For the three years ended October 31, 2008, research and development expense has averaged 5.6% of sales. We estimate that research and development expense in fiscal 2009 will be approximately 5.0% of sales for the full year.
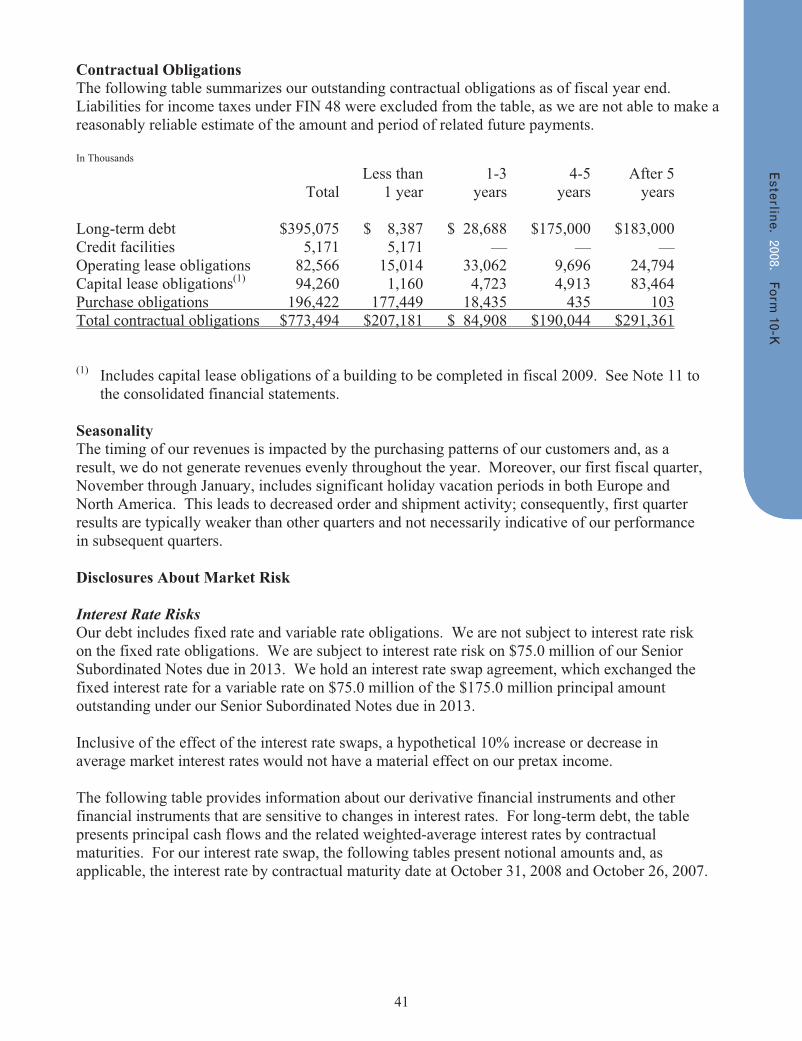
41
Contractual Obligations The following table summarizes our outstanding contractual obligations as of fiscal year end. Liabilities for income taxes under FIN 48 were excluded from the table, as we are not able to make a reasonably reliable estimate of the amount and period of related future payments. In Thousands Less than 1-3 4-5 After 5 Total 1 year years years years Long-term debt $395,075 $ 8,387 $ 28,688 $175,000 $183,000 Credit facilities 5,171 5,171 — — — Operating lease obligations 82,566 15,014 33,062 9,696 24,794 Capital lease obligations(1) 94,260 1,160 4,723 4,913 83,464 Purchase obligations 196,422 177,449 18,435 435 103 Total contractual obligations $773,494 $207,181 $ 84,908 $190,044 $291,361 (1) Includes capital lease obligations of a building to be completed in fiscal 2009. See Note 11 to
the consolidated financial statements. Seasonality The timing of our revenues is impacted by the purchasing patterns of our customers and, as a result, we do not generate revenues evenly throughout the year. Moreover, our first fiscal quarter, November through January, includes significant holiday vacation periods in both Europe and North America. This leads to decreased order and shipment activity; consequently, first quarter results are typically weaker than other quarters and not necessarily indicative of our performance in subsequent quarters. Disclosures About Market Risk Interest Rate Risks Our debt includes fixed rate and variable rate obligations. We are not subject to interest rate risk on the fixed rate obligations. We are subject to interest rate risk on $75.0 million of our Senior Subordinated Notes due in 2013. We hold an interest rate swap agreement, which exchanged the fixed interest rate for a variable rate on $75.0 million of the $175.0 million principal amount outstanding under our Senior Subordinated Notes due in 2013. Inclusive of the effect of the interest rate swaps, a hypothetical 10% increase or decrease in average market interest rates would not have a material effect on our pretax income. The following table provides information about our derivative financial instruments and other financial instruments that are sensitive to changes in interest rates. For long-term debt, the table presents principal cash flows and the related weighted-average interest rates by contractual maturities. For our interest rate swap, the following tables present notional amounts and, as applicable, the interest rate by contractual maturity date at October 31, 2008 and October 26, 2007.
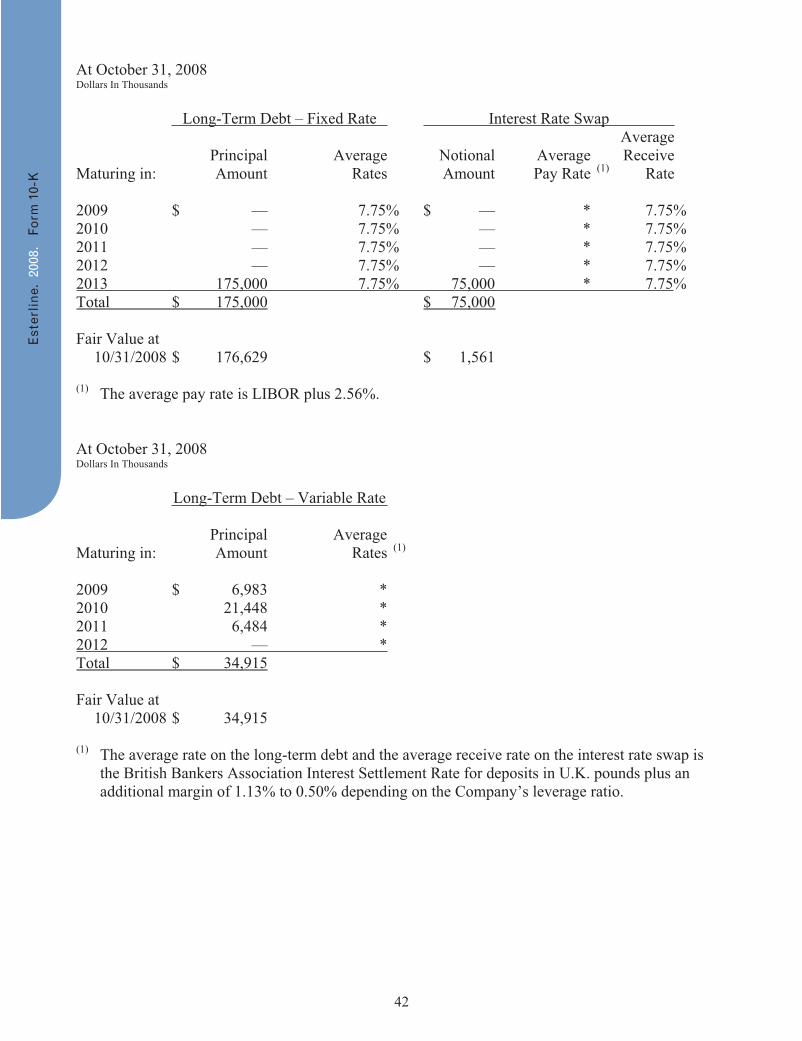
42
At October 31, 2008 Dollars In Thousands Long-Term Debt – Fixed Rate Interest Rate Swap
Average Principal Average Notional Average Receive Maturing in: Amount Rates Amount Pay Rate (1) Rate
2009 $ — 7.75% $ — * 7.75% 2010 — 7.75% — * 7.75% 2011 — 7.75% — * 7.75% 2012 — 7.75% — * 7.75% 2013 175,000 7.75% 75,000 * 7.75%Total $ 175,000 $ 75,000
Fair Value at 10/31/2008 $ 176,629 $ 1,561
(1) The average pay rate is LIBOR plus 2.56%.
At October 31, 2008 Dollars In Thousands Long-Term Debt – Variable Rate
Principal Average Maturing in: Amount Rates (1)
2009 $ 6,983 * 2010 21,448 * 2011 6,484 * 2012 — *Total $ 34,915
Fair Value at 10/31/2008 $ 34,915
(1) The average rate on the long-term debt and the average receive rate on the interest rate swap is the British Bankers Association Interest Settlement Rate for deposits in U.K. pounds plus an additional margin of 1.13% to 0.50% depending on the Company’s leverage ratio.
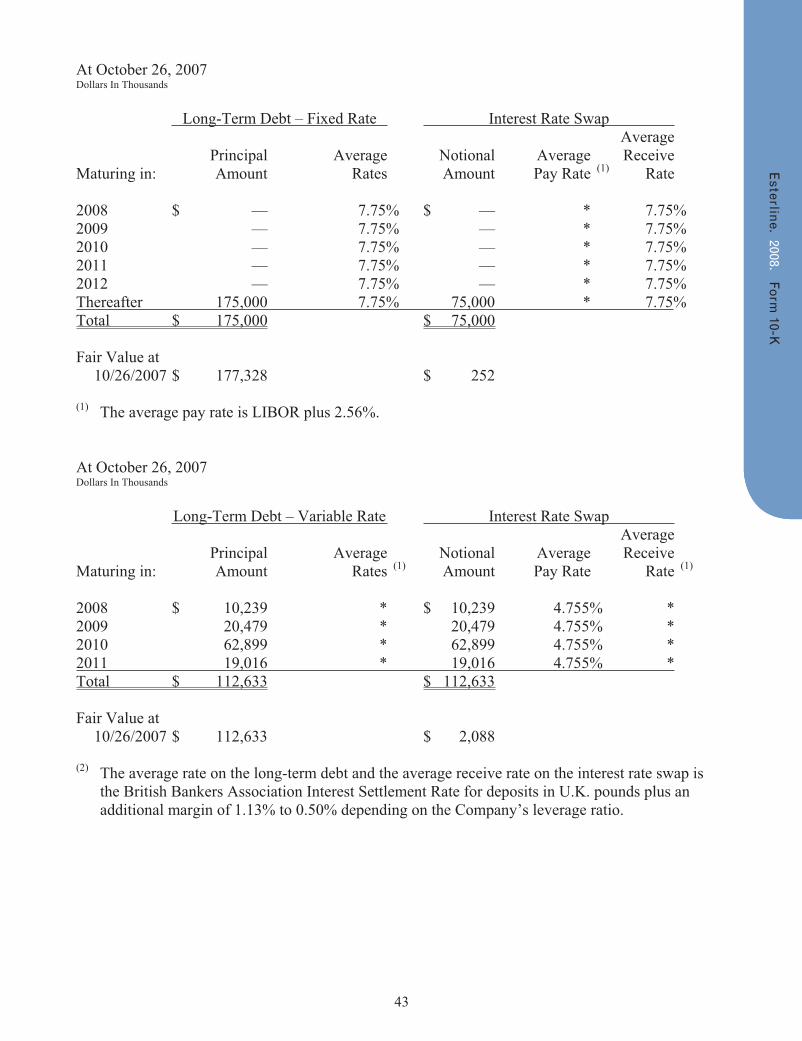
43
At October 26, 2007 Dollars In Thousands Long-Term Debt – Fixed Rate Interest Rate Swap Average Principal Average Notional Average Receive Maturing in: Amount Rates Amount Pay Rate (1) Rate 2008 $ — 7.75% $ — * 7.75% 2009 — 7.75% — * 7.75% 2010 — 7.75% — * 7.75% 2011 — 7.75% — * 7.75% 2012 — 7.75% — * 7.75% Thereafter 175,000 7.75% 75,000 * 7.75% Total $ 175,000 $ 75,000 Fair Value at 10/26/2007 $ 177,328 $ 252 (1) The average pay rate is LIBOR plus 2.56%. At October 26, 2007 Dollars In Thousands Long-Term Debt – Variable Rate Interest Rate Swap Average Principal Average Notional Average Receive Maturing in: Amount Rates (1) Amount Pay Rate Rate (1) 2008 $ 10,239 * $ 10,239 4.755% * 2009 20,479 * 20,479 4.755% * 2010 62,899 * 62,899 4.755% * 2011 19,016 * 19,016 4.755% * Total $ 112,633 $ 112,633 Fair Value at 10/26/2007 $ 112,633 $ 2,088 (2) The average rate on the long-term debt and the average receive rate on the interest rate swap is
the British Bankers Association Interest Settlement Rate for deposits in U.K. pounds plus an additional margin of 1.13% to 0.50% depending on the Company’s leverage ratio.
44
Currency Risks We own significant operations in Canada, France and the United Kingdom. To the extent that sales are transacted in a foreign currency, we are subject to foreign currency fluctuation risk. Furthermore, we have assets denominated in foreign currencies that are not offset by liabilities in such foreign currencies. At October 31, 2008, we had the following monetary assets subject to foreign currency fluctuation risk: Cash denominated in U.K. pounds; U.S. dollar-denominated backlog with customers whose functional currency is other than the U.S. dollar; U.S. dollar-denominated accounts receivable and payable; and certain forward contracts, which are not accounted for as a cash flow hedge. The foreign exchange rate for the dollar relative to the euro increased to .785 at October 31, 2008, from .695 at October 26, 2007; the dollar relative to the U.K. pound increased to .621 from .487; and the dollar relative to the Canadian dollar increased to 1.21 from .962. During fiscal 2008 we recorded $5.1 million in foreign currency transaction gains and $1.6 million in foreign currency transaction losses in fiscal 2007. Foreign currency transaction gains or losses were not material in fiscal 2006. Including cash proceeds denominated in U.K. pounds from the sale of Muirhead/Traxsys on November 3, 2008, a 5% increase or decrease in the euro, Canadian dollar and U.K. pound relative to the U.S. dollar from October 31, 2008, would result in an unrealized gain or loss of approximately $2.2 million on our monetary assets. Our policy is to hedge a portion of our forecasted transactions using forward exchange contracts with maturities up to fifteen months. The Company does not enter into any forward contracts for trading purposes. At October 31, 2008 and October 26, 2007, the notional value of foreign currency forward contracts was $313.4 million and $72.9 million, respectively. The fair value of these contracts was a $24.1 million liability and a $2.9 million asset at October 31, 2008 and October 26, 2007, respectively. If the U.S. dollar increased or decreased by a hypothetical 5%, the effect on the fair value of the foreign currency contracts would be $14.1 million. The following tables provide information about our derivative financial instruments, including foreign currency forward exchange agreements and certain firmly committed sales transactions denominated in currencies other than the functional currency at October 31, 2008 and October 26, 2007. The information about certain firmly committed sales contracts and derivative financial instruments is in U.S. dollar equivalents. For forward foreign currency exchange agreements, the following tables present the notional amounts at the current exchange rate and weighted-average contractual foreign currency exchange rates by contractual maturity dates.

45
Firmly Committed Sales Contracts Operations with Foreign Functional Currency
At October 31, 2008
Principal Amount by Expected Maturity
In Thousands Firmly Committed Sales Contracts in United States Dollar Fiscal Years Canadian Dollar Euro U.K. Pound
2009 $ 179,233 $ 64,749 $ 35,036 2010 61,688 7,759 5,628 2011 51,349 126 — 2012 8,083 — 108 2013 23,729 — 464Total $ 324,082 $ 72,634 $ 41,236
Derivative Contracts Operations with Foreign Functional Currency
At October 31, 2008
Notional Amount by Expected Maturity Average Foreign Currency Exchange Rate (USD/Foreign Currency) (1)
Related Forward Contracts to Sell U.S. Dollar for Euro
Dollars in Thousands, Except for Average Contract Rate United States Dollar Fiscal Years Notional Amount Avg. Contract Rate
2009 $ 40,855 1.4545 2010 3,760 1.4044Total $ 44,615
Fair Value at 10/31/2008 $ (5,324)
1 The Company has no derivative contracts maturing after fiscal 2010.
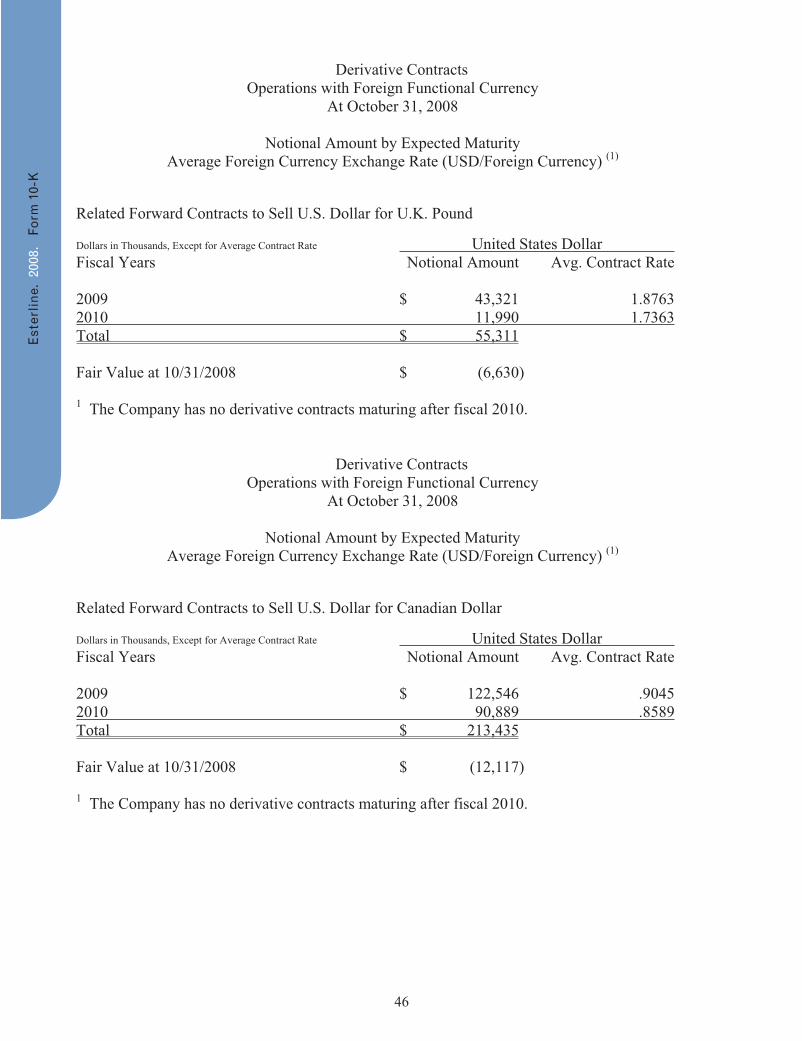
46
Derivative Contracts Operations with Foreign Functional Currency
At October 31, 2008
Notional Amount by Expected Maturity Average Foreign Currency Exchange Rate (USD/Foreign Currency) (1)
Related Forward Contracts to Sell U.S. Dollar for U.K. Pound
Dollars in Thousands, Except for Average Contract Rate United States Dollar Fiscal Years Notional Amount Avg. Contract Rate
2009 $ 43,321 1.8763 2010 11,990 1.7363Total $ 55,311
Fair Value at 10/31/2008 $ (6,630)
1 The Company has no derivative contracts maturing after fiscal 2010.
Derivative Contracts Operations with Foreign Functional Currency
At October 31, 2008
Notional Amount by Expected Maturity Average Foreign Currency Exchange Rate (USD/Foreign Currency) (1)
Related Forward Contracts to Sell U.S. Dollar for Canadian Dollar
Dollars in Thousands, Except for Average Contract Rate United States Dollar Fiscal Years Notional Amount Avg. Contract Rate
2009 $ 122,546 .9045 2010 90,889 .8589Total $ 213,435
Fair Value at 10/31/2008 $ (12,117)
1 The Company has no derivative contracts maturing after fiscal 2010.
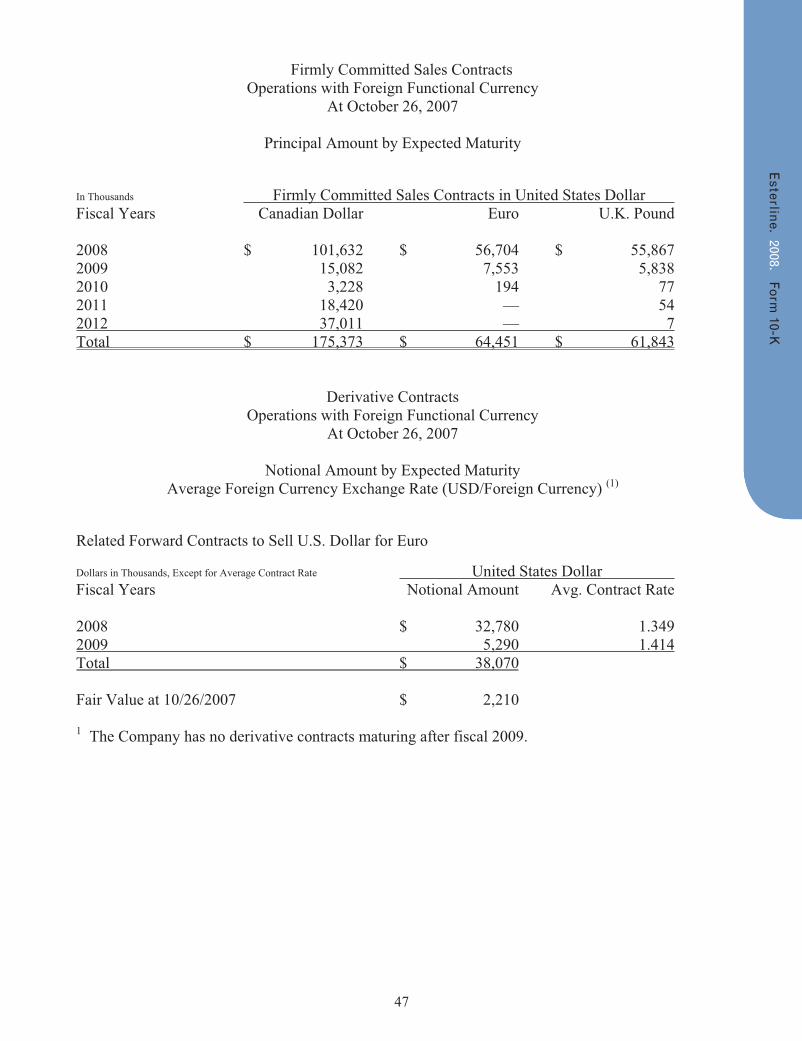
47
Firmly Committed Sales Contracts Operations with Foreign Functional Currency
At October 26, 2007
Principal Amount by Expected Maturity
In Thousands Firmly Committed Sales Contracts in United States Dollar Fiscal Years Canadian Dollar Euro U.K. Pound
2008 $ 101,632 $ 56,704 $ 55,867 2009 15,082 7,553 5,838 2010 3,228 194 77 2011 18,420 — 54 2012 37,011 — 7Total $ 175,373 $ 64,451 $ 61,843
Derivative Contracts Operations with Foreign Functional Currency
At October 26, 2007
Notional Amount by Expected Maturity Average Foreign Currency Exchange Rate (USD/Foreign Currency) (1)
Related Forward Contracts to Sell U.S. Dollar for Euro
Dollars in Thousands, Except for Average Contract Rate United States Dollar Fiscal Years Notional Amount Avg. Contract Rate
2008 $ 32,780 1.349 2009 5,290 1.414Total $ 38,070
Fair Value at 10/26/2007 $ 2,210
1 The Company has no derivative contracts maturing after fiscal 2009.
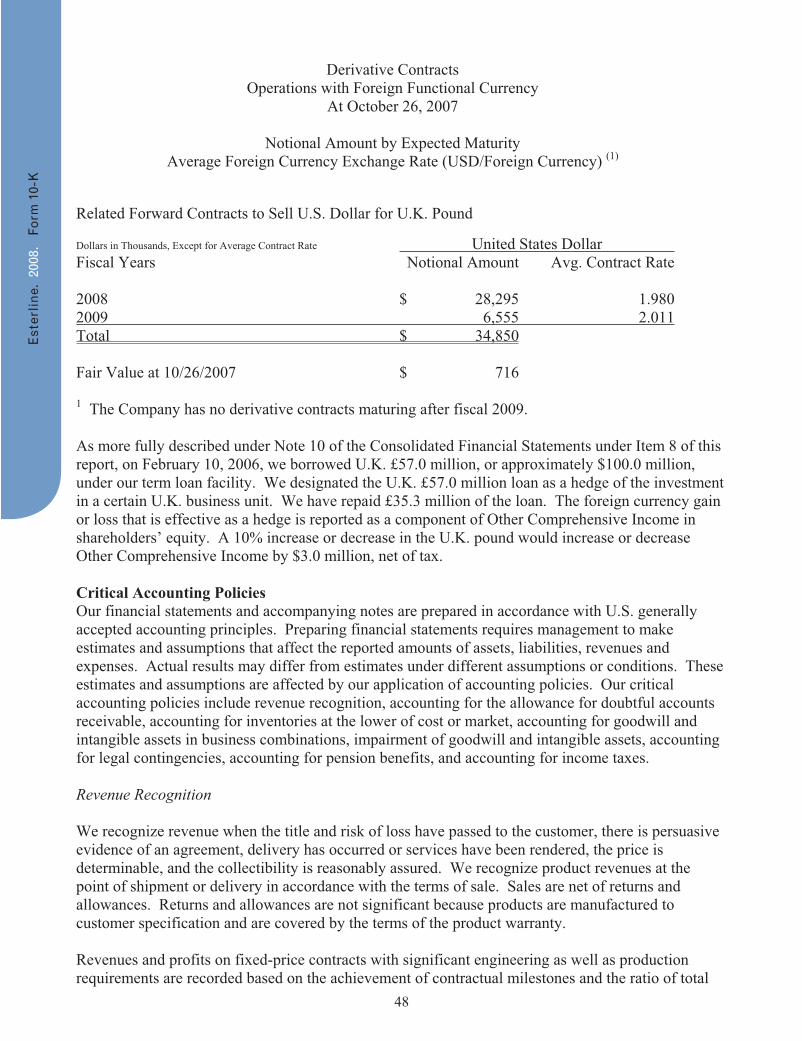
48
Derivative Contracts Operations with Foreign Functional Currency
At October 26, 2007
Notional Amount by Expected Maturity Average Foreign Currency Exchange Rate (USD/Foreign Currency) (1)
Related Forward Contracts to Sell U.S. Dollar for U.K. Pound Dollars in Thousands, Except for Average Contract Rate United States Dollar Fiscal Years Notional Amount Avg. Contract Rate 2008 $ 28,295 1.980 2009 6,555 2.011 Total $ 34,850 Fair Value at 10/26/2007 $ 716 1 The Company has no derivative contracts maturing after fiscal 2009. As more fully described under Note 10 of the Consolidated Financial Statements under Item 8 of this report, on February 10, 2006, we borrowed U.K. £57.0 million, or approximately $100.0 million, under our term loan facility. We designated the U.K. £57.0 million loan as a hedge of the investment in a certain U.K. business unit. We have repaid £35.3 million of the loan. The foreign currency gain or loss that is effective as a hedge is reported as a component of Other Comprehensive Income in shareholders’ equity. A 10% increase or decrease in the U.K. pound would increase or decrease Other Comprehensive Income by $3.0 million, net of tax. Critical Accounting Policies Our financial statements and accompanying notes are prepared in accordance with U.S. generally accepted accounting principles. Preparing financial statements requires management to make estimates and assumptions that affect the reported amounts of assets, liabilities, revenues and expenses. Actual results may differ from estimates under different assumptions or conditions. These estimates and assumptions are affected by our application of accounting policies. Our critical accounting policies include revenue recognition, accounting for the allowance for doubtful accounts receivable, accounting for inventories at the lower of cost or market, accounting for goodwill and intangible assets in business combinations, impairment of goodwill and intangible assets, accounting for legal contingencies, accounting for pension benefits, and accounting for income taxes. Revenue Recognition We recognize revenue when the title and risk of loss have passed to the customer, there is persuasive evidence of an agreement, delivery has occurred or services have been rendered, the price is determinable, and the collectibility is reasonably assured. We recognize product revenues at the point of shipment or delivery in accordance with the terms of sale. Sales are net of returns and allowances. Returns and allowances are not significant because products are manufactured to customer specification and are covered by the terms of the product warranty. Revenues and profits on fixed-price contracts with significant engineering as well as production requirements are recorded based on the achievement of contractual milestones and the ratio of total
49
actual incurred costs to date to total estimated costs for each contract (cost-to-cost method) in accordance with the American Institute of Certified Public Accountants Statement of Position 81-1, “Accounting for Performance of Construction-Type and Certain Production-Type Contracts.” We review cost performance and estimates to complete on our ongoing contracts at least quarterly. The impact of revisions of profit estimates are recognized on a cumulative catch-up basis in the period in which the revisions are made. Provisions for anticipated losses on contracts are recorded in the period they become evident. Amounts representing contract change orders are included in revenue only when they can be reliably estimated and realization is probable, and are determined on a percentage-of-completion basis measured by the cost-to-cost method. Claims are included in revenue only when they are probable of collection. Allowance for Doubtful Accounts We establish an allowance for doubtful accounts for losses expected to be incurred on accounts receivable balances. Judgment is required in estimation of the allowance and is based upon specific identification, collection history and creditworthiness of the debtor. Inventories We account for inventories on a first-in, first-out or average cost method of accounting at the lower of its cost or market. The determination of market requires judgment in estimating future demand, selling prices and cost of disposal. Judgment is required when determining inventory reserves. These reserves are provided when inventory is considered to be excess or obsolete based upon an analysis of actual on-hand quantities on a part level basis to forecasted product demand and historical usage. Inventory reserves are released based upon adjustments to forecasted demand. Goodwill and Intangible Assets in Business Combinations We account for business combinations, goodwill and intangible assets in accordance with Financial Accounting Standards No. 141, “Business Combinations,” (Statement No. 141) and Financial Accounting Standards No. 142, “Goodwill and Other Intangible Assets,” (Statement No. 142). Statement No. 141 specifies the types of acquired intangible assets that are required to be recognized and reported separately from goodwill. Impairment of Goodwill and Intangible Assets Statement No. 142 requires goodwill and indefinite-lived intangible assets to be tested for impairment at least annually. We are also required to test goodwill for impairment between annual tests if events occur or circumstances change that would more likely than not reduce our enterprise fair value below its book value. These events or circumstances could include a significant change in the business climate, including a significant sustained decline in an entity’s market value, legal factors, operating performance indicators, competition, sale or disposition of a significant portion of the business, or other factors. The valuation of reporting units requires judgment in estimating future cash flows, discount rates and estimated product life cycles. In making these judgments, we evaluate the financial health of the business, including such factors as industry performance, changes in technology and operating cash flows.
50
Statement No. 142 outlines a two-step process for testing goodwill for impairment. The first step (Step One) of the goodwill impairment test involves estimating the fair value of a reporting unit. Statement No. 142 defines fair value (Fair Value) as “the amount at which an asset (or liability) could be bought (or incurred) or sold (or settled) in a current transaction between willing parties, that is, other than in a forced liquidation sale.” A reporting unit is generally defined at the operating segment level or at the component level one level below the operating segment, if said component constitutes a business. The Fair Value of a reporting unit is then compared to its carrying value, which is defined as the book basis of total assets less total liabilities. In the event a reporting unit’s carrying value exceeds its estimated Fair Value, evidence of potential impairment exists. In such a case, the second step (Step Two) of the impairment test is required, which involves allocating the Fair Value of the reporting unit to all of the assets and liabilities of that unit, with the excess of Fair Value over allocated net assets representing the Fair Value of goodwill. An impairment loss is measured as the amount by which the carrying value of the reporting unit’s goodwill exceeds the estimated Fair Value of goodwill. As we have grown through acquisitions, we have accumulated $576.9 million of goodwill and $50.1 million of indefinite-lived intangible assets out of total assets of $1.9 billion at October 31, 2008. The amount of any annual or interim impairment could be significant and could have a material adverse effect on our reported financial results for the period in which the charge is taken. We performed our impairment review for fiscal 2008 as of August 1, 2008, and our Step One analysis indicates that no impairment of goodwill or other indefinite-lived assets exists at any of our reporting units. Our CMC reporting unit’s margin in passing the Step One analysis was not as large as our other reporting units. CMC’s operating performance has been impacted by the effect of the weakening U.S. dollar relative to the Canadian dollar for most of the period we have owned the business. In addition, operating results have been impacted by higher than expected costs related to certain long-term development contracts, including the T-6B. During the fourth quarter of fiscal 2008, the U.S. dollar has strengthened against the Canadian dollar and if this relationship continues, CMC’s results of operations will be favorably impacted. We expect that the T-6B development will be successful and that CMC’s operations will continue to improve due to recent contract wins, operational productivity improvements and a continued stronger U.S. dollar relative to the Canadian dollar. It is possible, however, that as a result of events or circumstances, we could conclude at a later date that goodwill of $203.3 million at CMC may be considered impaired. We also may be required to record an earnings charge or incur unanticipated expenses if, due to a change in strategy or other reason, we determined the value of other assets has been impaired. These other assets include net deferred income tax assets of $9.4 million, trade names of $22.6 million and intangible assets of $72.1 million. Impairment of Long-lived Assets We account for the impairment of long-lived assets to be held and used in accordance with Financial Accounting Standards No. 144, “Accounting for the Impairment or Disposal of Long-Lived Assets,” (Statement No. 144). Statement No. 144 requires that a long-lived asset to be disposed of be reported at the lower of its carrying amount or fair value less cost to sell. An asset (other than goodwill and indefinite-lived intangible assets) is considered impaired when estimated future cash flows are less than the carrying amount of the asset. In the event the carrying amount of such asset is not deemed recoverable, the asset is adjusted to its estimated fair value. Fair value is generally determined based upon estimated discounted future cash flows. As we have grown through acquisitions, we have accumulated $290.4 million of definite-lived intangible assets. The amount of any annual or interim impairment could be significant and could have a material adverse effect on our reported financial results for the period in which the charge is taken.
51
Contingencies We are party to various lawsuits and claims, both as plaintiff and defendant, and have contingent liabilities arising from the conduct of business. We are covered by insurance for general liability, product liability, workers’ compensation and certain environmental exposures, subject to certain deductible limits. We are self-insured for amounts less than our deductible and where no insurance is available. Financial Accounting Standards No. 5, “Accounting for Contingencies,” requires that an estimated loss from a contingency should be accrued by a charge to income if it is probable that an asset has been impaired or a liability has been incurred and the amount of the loss can be reasonably estimated. Disclosure of a contingency is required if there is at least a reasonable possibility that a loss has been incurred. We evaluate, among other factors, the degree of probability of an unfavorable outcome and the ability to make a reasonable estimate of the amount of loss. Pension and Other Post-Retirement Benefits We account for employee pension and post-retirement benefit costs in accordance with the applicable statements issued by the Financial Accounting Standards Board. In accordance with these statements, we select appropriate assumptions including discount rate, rate of increase in future compensation levels and assumed long-term rate of return on plan assets and expected annual increases in costs of medical and other health care benefits in regard to our post-retirement benefit obligations. Our assumptions are based upon historical results, the current economic environment and reasonable expectations of future events. Actual results which vary from our assumptions are accumulated and amortized over future periods and, accordingly, are recognized in expense in these periods. Significant differences between our assumptions and actual experience or significant changes in assumptions could impact the pension costs and the pension obligation. Income Taxes We account for income taxes in accordance with Financial Accounting Standards No. 109, “Accounting for Income Taxes,” and account for reserves for income taxes in accordance with FIN 48. The objectives of accounting for income taxes are to recognize the amount of taxes payable or refundable for the current year and deferred tax liabilities and assets for the future tax consequences of events that have been recognized in our financial statements or tax returns. Judgment is required in assessing the future tax consequences of events that have been recognized in our financial statements or tax returns. Variations in the actual outcome of these future tax consequences could materially impact our financial position and results of operations.
52
Recent Accounting Pronouncements
In May 2008, the Financial Accounting Standards Board issued Statement of Financial Accounting Standard No. 162, “The Hierarchy of Generally Accepted Accounting Principles (GAAP),” (Statement No. 162). The purpose of the new standard is to provide a consistent framework for determining what accounting principles should be used when preparing U.S. GAAP financial statements. The new standard is effective 60 days following the Securities and Exchange Commission’s approval of the Public Company Accounting Oversight Board amendments to AU Section 411, “The Meaning of Present Fairly in Conformity With Generally Accepted Accounting Principles.” The adoption of Statement No. 162 is not expected to have a material effect on the Company’s financial statements.
In March 2008, the Financial Accounting Standards Board issued Financial Accounting Standard No. 161, “Disclosure About Derivative Instruments and Hedging Activities, an amendment to Financial Accounting Standards Board Financial Accounting Standard No. 133,” (Statement No. 161). Statement No. 161 requires among other things, enhanced disclosure about the volume and nature of derivative and hedging activities and a tabular summary showing the fair value of derivative instruments included in the statement of financial position and statement of operations. Statement No. 161 also requires expanded disclosure of contingencies included in derivative instruments related to credit risk. Statement No. 161 is effective for fiscal 2009. The Company is currently evaluating the impact of Statement No. 161 on the Company’s financial statements.
On December 4, 2007, the Financial Accounting Standards Board issued Financial Accounting Standard No. 141(R), “Business Combinations,” (Statement No. 141(R)) and Statement No. 160, “Accounting and Reporting of Non-controlling Interest in Consolidated Financial Statements, an amendment of ARB No. 51,” (Statement No. 160). These new standards will significantly change the accounting for and reporting of business combination transactions and non-controlling (minority) interests in consolidated financial statements. Statement No. 141(R) and Statement No. 160 are required to be adopted simultaneously and are effective for fiscal 2010.
The significant changes in the accounting for business combination transactions under Statement No. 141(R) include:
Recognition, with certain exceptions, of 100% of the fair values of assets acquired, liabilities assumed, and non-controlling interests of acquired businesses.
Measurement of all acquirer shares issued in consideration for a business combination at fair value on the acquisition date. With the effectiveness of Statement No. 141(R), the “agreement and announcement date” measurement principles in EITF Issue 99-12 will be nullified.
Recognition of contingent consideration arrangements at their acquisition-date fair values, with subsequent changes in fair value generally reflected in earnings.
With the one exception described in the last sentence of this section, recognition of pre-acquisition gain and loss contingencies at their acquisition-date fair values. Subsequent accounting for pre-acquisition loss contingencies is based on the greater of acquisition-date fair value or the amount calculated pursuant to FASB Statement No. 5, “Accounting for Contingencies,” (Statement No. 5). Subsequent accounting for pre-acquisition gain contingencies is based on the lesser of acquisition-date fair value or the best estimate of
53
the future settlement amount. Adjustments after the acquisition date are made only upon the receipt of new information on the possible outcome of the contingency, and changes to the measurement of pre-acquisition contingencies are recognized in ongoing results of operations. Absent new information, no adjustments to the acquisition-date fair value are made until the contingency is resolved. Pre-acquisition contingencies that are both (1) non-contractual and (2) as of the acquisition date are “not more likely than not” of materializing are not recognized in acquisition accounting and, instead, are accounted for based on the guidance in Statement No. 5, “Accounting for Contingencies.”
Capitalization of in-process research and development (IPR&D) assets acquired at acquisition date fair value. After acquisition, apply the indefinite-lived impairment model (lower of basis or fair value) through the development period to capitalized IPR&D without amortization. Charge development costs incurred after acquisition to results of operations. Upon completion of a successful development project, assign an estimated useful life to the amount then capitalized, amortize over that life, and consider the asset a definite-lived asset for impairment accounting purposes.
Recognition of acquisition-related transaction costs as expense when incurred.
Recognition of acquisition-related restructuring cost accruals in acquisition accounting only if the criteria in Statement No. 146 are met as of the acquisition date. With the effectiveness of Statement No. 141(R), the EITF Issue 95-3 concepts of “assessing, formulating, finalizing and committing/communicating” that currently pertain to recognition in purchase accounting of an acquisition-related restructuring plan will be nullified.
Recognition of changes in the acquirer’s income tax valuation allowance resulting from the business combination separately from the business combination as adjustments to income tax expense. Also, changes after the acquisition date in an acquired entity’s valuation allowance or tax uncertainty established at the acquisition date are accounted for as adjustments to income tax expense.
The Company is currently evaluating the impact of Statement No. 141(R) and Statement No. 160 on our financial statements.
In September 2006, the Financial Accounting Standards Board issued Statement of Financial Accounting Standards No. 157, “Fair Value Measurements,” (Statement No. 157). Statement No. 157 defines fair value, establishes a framework for measuring fair value in generally accepted accounting principles, and expands disclosures about fair value measurements. Statement No. 157 applies under other accounting pronouncements that require or permit fair value measurements. Statement No. 157 indicates, among other things, that a fair value measurement assumes the transaction to sell the asset or transfer the liability occurs in the principal market for the asset or liability or, in the absence of a principal market, the most advantageous market for the asset or liability. Statement No. 157 is effective for the Company’s year ending October 29, 2010, for all non-financial assets and liabilities. For those items that are recognized or disclosed at fair value in the financial statements, the effective date is October 30, 2009. The Company is currently evaluating the impact of Statement No. 157 on the Company’s financial statements.
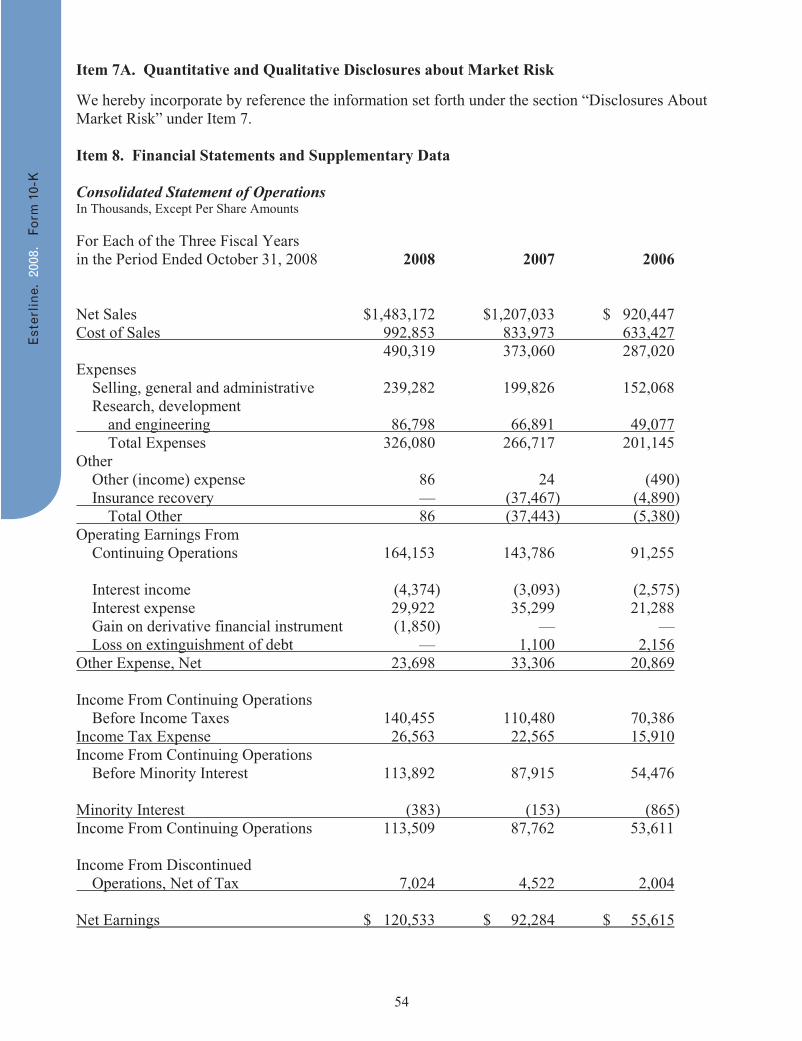
54
Item 7A. Quantitative and Qualitative Disclosures about Market Risk We hereby incorporate by reference the information set forth under the section “Disclosures About Market Risk” under Item 7. Item 8. Financial Statements and Supplementary Data Consolidated Statement of Operations In Thousands, Except Per Share Amounts For Each of the Three Fiscal Years in the Period Ended October 31, 2008 2008 2007 2006 Net Sales $1,483,172 $1,207,033 $ 920,447 Cost of Sales 992,853 833,973 633,427 490,319 373,060 287,020 Expenses Selling, general and administrative 239,282 199,826 152,068 Research, development and engineering 86,798 66,891 49,077 Total Expenses 326,080 266,717 201,145 Other Other (income) expense 86 24 (490) Insurance recovery — (37,467) (4,890) Total Other 86 (37,443) (5,380) Operating Earnings From Continuing Operations 164,153 143,786 91,255 Interest income (4,374) (3,093) (2,575) Interest expense 29,922 35,299 21,288 Gain on derivative financial instrument (1,850) — — Loss on extinguishment of debt — 1,100 2,156 Other Expense, Net 23,698 33,306 20,869 Income From Continuing Operations Before Income Taxes 140,455 110,480 70,386 Income Tax Expense 26,563 22,565 15,910 Income From Continuing Operations Before Minority Interest 113,892 87,915 54,476 Minority Interest (383) (153) (865) Income From Continuing Operations 113,509 87,762 53,611 Income From Discontinued Operations, Net of Tax 7,024 4,522 2,004 Net Earnings $ 120,533 $ 92,284 $ 55,615
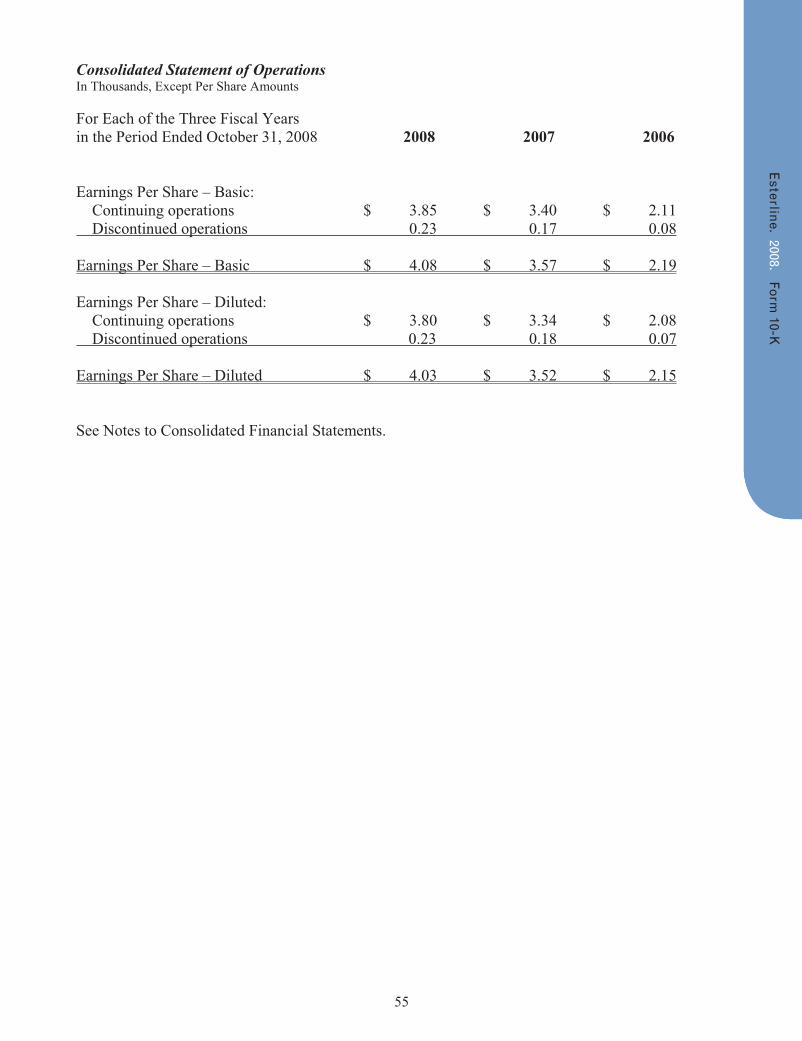
55
Consolidated Statement of Operations In Thousands, Except Per Share Amounts For Each of the Three Fiscal Years in the Period Ended October 31, 2008 2008 2007 2006 Earnings Per Share – Basic: Continuing operations $ 3.85 $ 3.40 $ 2.11 Discontinued operations 0.23 0.17 0.08 Earnings Per Share – Basic $ 4.08 $ 3.57 $ 2.19 Earnings Per Share – Diluted: Continuing operations $ 3.80 $ 3.34 $ 2.08 Discontinued operations 0.23 0.18 0.07 Earnings Per Share – Diluted $ 4.03 $ 3.52 $ 2.15 See Notes to Consolidated Financial Statements.
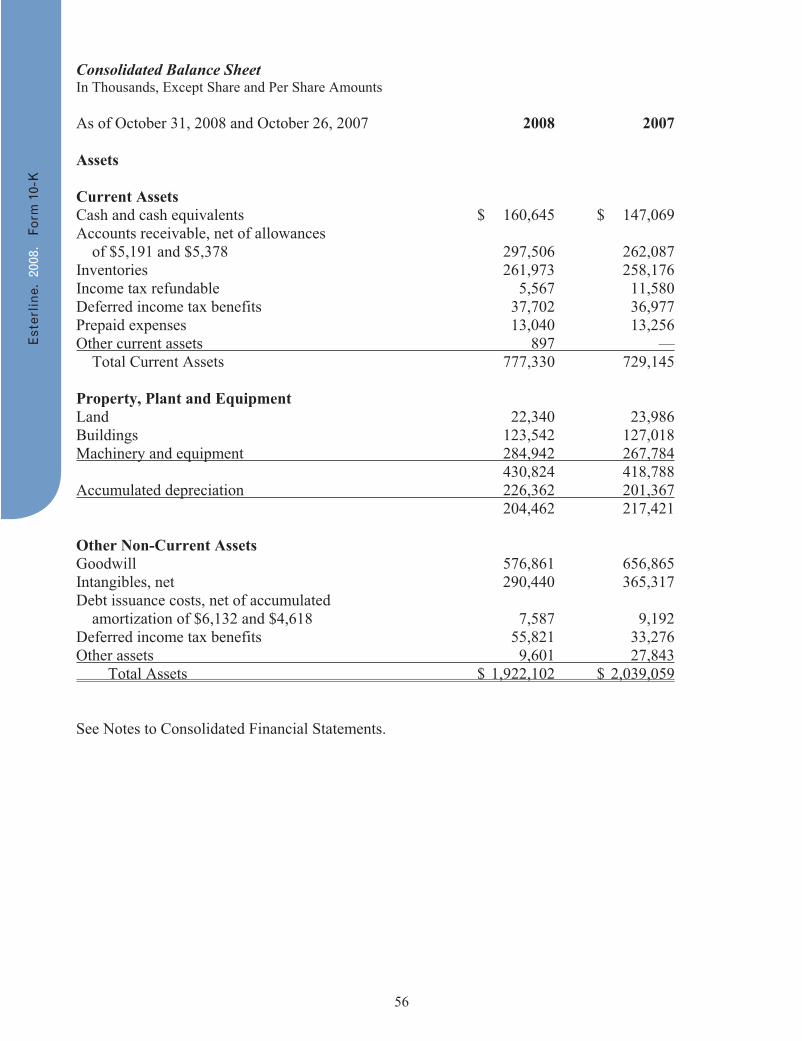
56
Consolidated Balance Sheet In Thousands, Except Share and Per Share Amounts As of October 31, 2008 and October 26, 2007 2008 2007 Assets Current Assets Cash and cash equivalents $ 160,645 $ 147,069 Accounts receivable, net of allowances of $5,191 and $5,378 297,506 262,087 Inventories 261,973 258,176 Income tax refundable 5,567 11,580 Deferred income tax benefits 37,702 36,977 Prepaid expenses 13,040 13,256 Other current assets 897 — Total Current Assets 777,330 729,145 Property, Plant and Equipment Land 22,340 23,986 Buildings 123,542 127,018 Machinery and equipment 284,942 267,784 430,824 418,788 Accumulated depreciation 226,362 201,367 204,462 217,421 Other Non-Current Assets Goodwill 576,861 656,865 Intangibles, net 290,440 365,317 Debt issuance costs, net of accumulated amortization of $6,132 and $4,618 7,587 9,192 Deferred income tax benefits 55,821 33,276 Other assets 9,601 27,843 Total Assets $ 1,922,102 $ 2,039,059 See Notes to Consolidated Financial Statements.
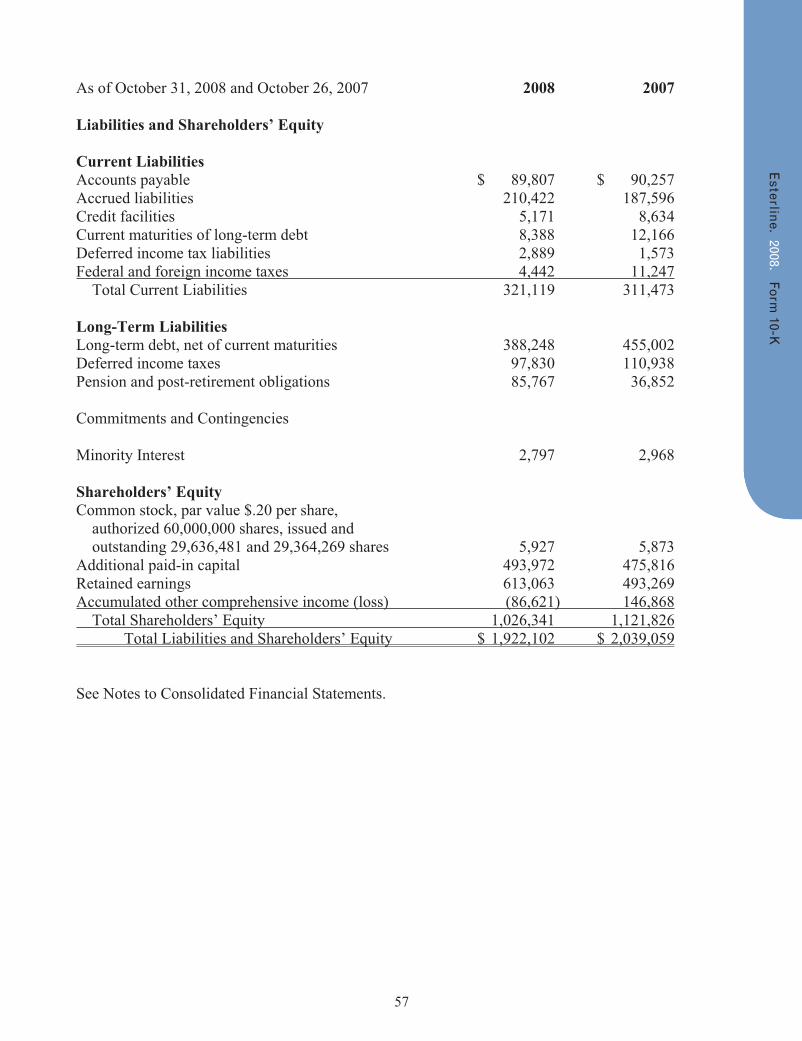
57
As of October 31, 2008 and October 26, 2007 2008 2007
Liabilities and Shareholders’ Equity
Current Liabilities Accounts payable $ 89,807 $ 90,257 Accrued liabilities 210,422 187,596 Credit facilities 5,171 8,634 Current maturities of long-term debt 8,388 12,166 Deferred income tax liabilities 2,889 1,573 Federal and foreign income taxes 4,442 11,247 Total Current Liabilities 321,119 311,473
Long-Term Liabilities Long-term debt, net of current maturities 388,248 455,002 Deferred income taxes 97,830 110,938 Pension and post-retirement obligations 85,767 36,852
Commitments and Contingencies
Minority Interest 2,797 2,968
Shareholders’ Equity Common stock, par value $.20 per share, authorized 60,000,000 shares, issued and outstanding 29,636,481 and 29,364,269 shares 5,927 5,873 Additional paid-in capital 493,972 475,816 Retained earnings 613,063 493,269 Accumulated other comprehensive income (loss) (86,621) 146,868 Total Shareholders’ Equity 1,026,341 1,121,826 Total Liabilities and Shareholders’ Equity $ 1,922,102 $ 2,039,059
See Notes to Consolidated Financial Statements.
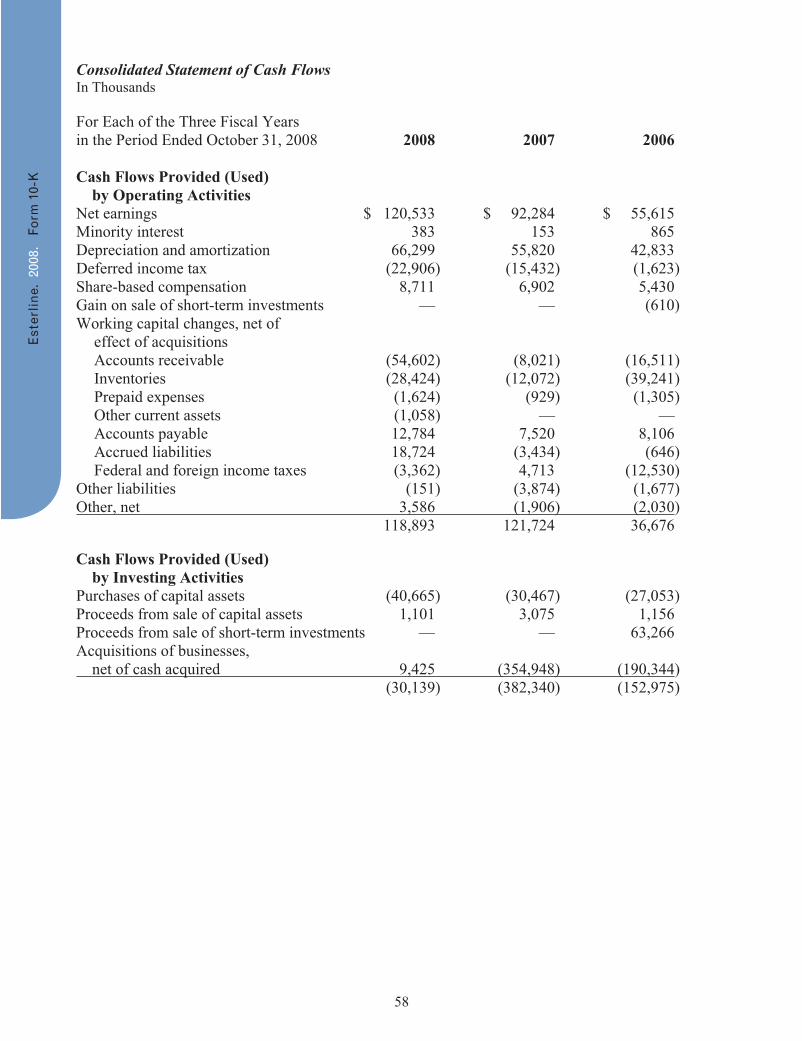
58
Consolidated Statement of Cash Flows In Thousands For Each of the Three Fiscal Years in the Period Ended October 31, 2008 2008 2007 2006
Cash Flows Provided (Used) by Operating Activities Net earnings $ 120,533 $ 92,284 $ 55,615 Minority interest 383 153 865 Depreciation and amortization 66,299 55,820 42,833 Deferred income tax (22,906) (15,432) (1,623) Share-based compensation 8,711 6,902 5,430 Gain on sale of short-term investments — — (610) Working capital changes, net of effect of acquisitions Accounts receivable (54,602) (8,021) (16,511) Inventories (28,424) (12,072) (39,241) Prepaid expenses (1,624) (929) (1,305) Other current assets (1,058) — — Accounts payable 12,784 7,520 8,106 Accrued liabilities 18,724 (3,434) (646) Federal and foreign income taxes (3,362) 4,713 (12,530) Other liabilities (151) (3,874) (1,677) Other, net 3,586 (1,906) (2,030) 118,893 121,724 36,676 Cash Flows Provided (Used) by Investing Activities Purchases of capital assets (40,665) (30,467) (27,053) Proceeds from sale of capital assets 1,101 3,075 1,156 Proceeds from sale of short-term investments — — 63,266 Acquisitions of businesses, net of cash acquired 9,425 (354,948) (190,344) (30,139) (382,340) (152,975)
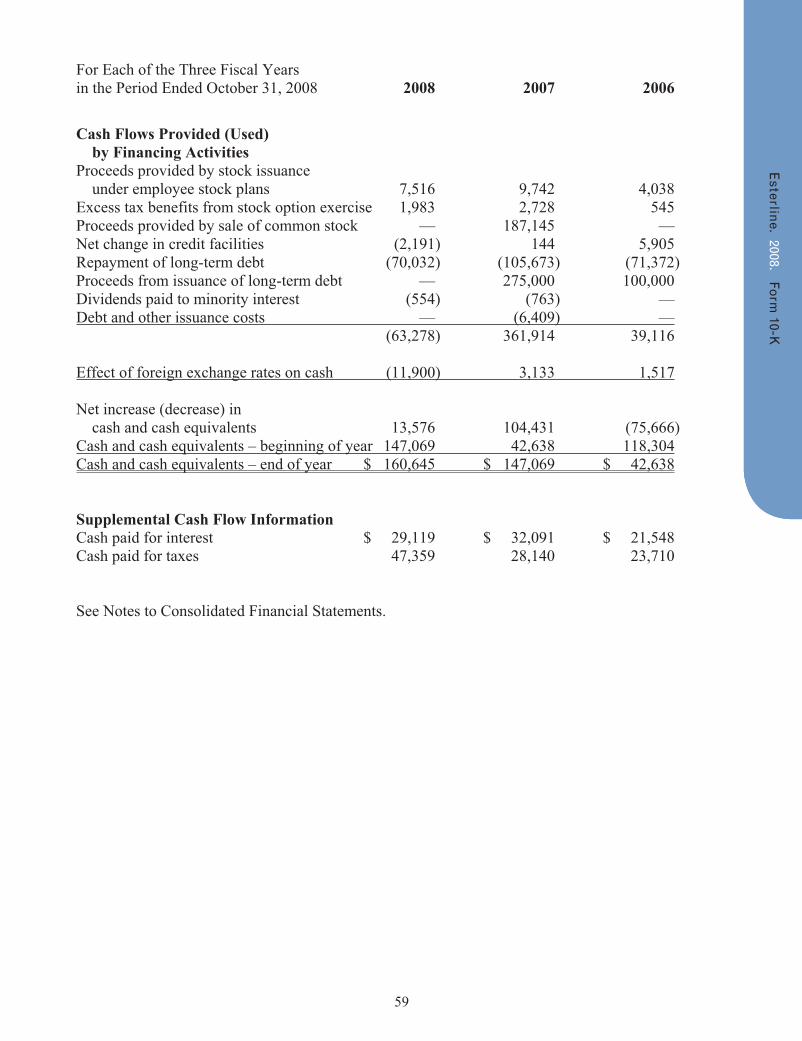
59
For Each of the Three Fiscal Years in the Period Ended October 31, 2008 2008 2007 2006
Cash Flows Provided (Used) by Financing Activities Proceeds provided by stock issuance under employee stock plans 7,516 9,742 4,038 Excess tax benefits from stock option exercise 1,983 2,728 545 Proceeds provided by sale of common stock — 187,145 — Net change in credit facilities (2,191) 144 5,905 Repayment of long-term debt (70,032) (105,673) (71,372) Proceeds from issuance of long-term debt — 275,000 100,000 Dividends paid to minority interest (554) (763) — Debt and other issuance costs — (6,409) — (63,278) 361,914 39,116
Effect of foreign exchange rates on cash (11,900) 3,133 1,517
Net increase (decrease) in cash and cash equivalents 13,576 104,431 (75,666) Cash and cash equivalents – beginning of year 147,069 42,638 118,304Cash and cash equivalents – end of year $ 160,645 $ 147,069 $ 42,638
Supplemental Cash Flow Information Cash paid for interest $ 29,119 $ 32,091 $ 21,548 Cash paid for taxes 47,359 28,140 23,710
See Notes to Consolidated Financial Statements.
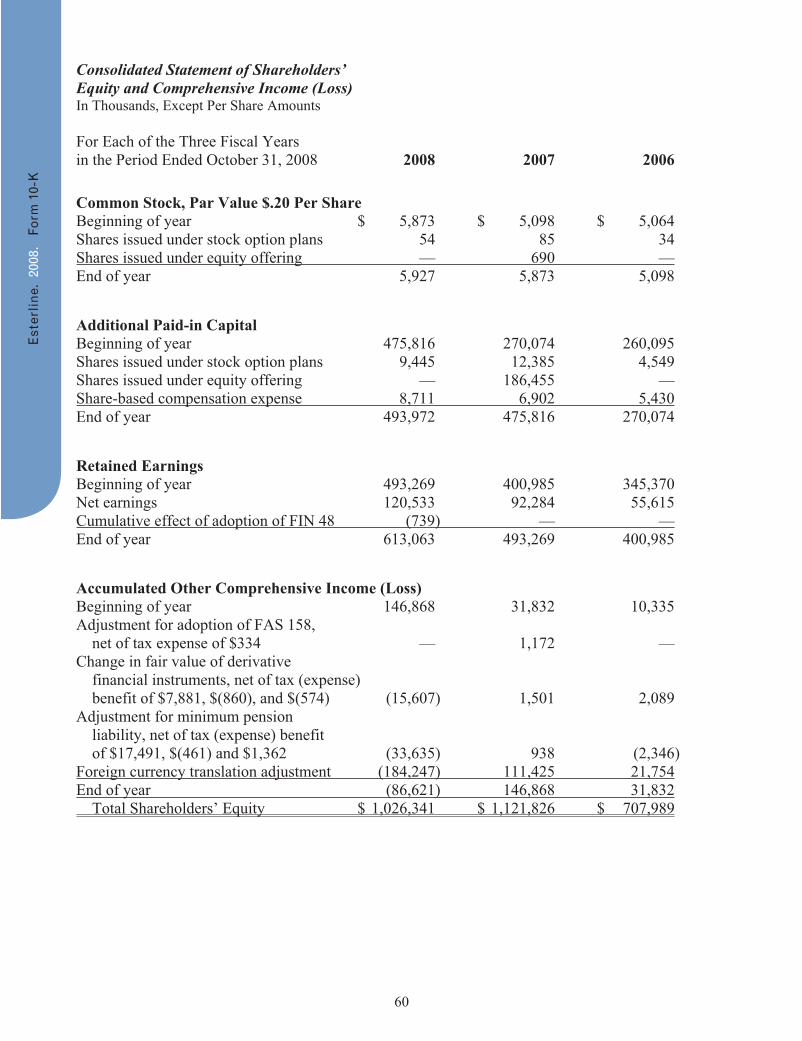
60
Consolidated Statement of Shareholders’ Equity and Comprehensive Income (Loss) In Thousands, Except Per Share Amounts For Each of the Three Fiscal Years in the Period Ended October 31, 2008 2008 2007 2006 Common Stock, Par Value $.20 Per Share Beginning of year $ 5,873 $ 5,098 $ 5,064 Shares issued under stock option plans 54 85 34 Shares issued under equity offering — 690 — End of year 5,927 5,873 5,098 Additional Paid-in Capital Beginning of year 475,816 270,074 260,095 Shares issued under stock option plans 9,445 12,385 4,549 Shares issued under equity offering — 186,455 — Share-based compensation expense 8,711 6,902 5,430 End of year 493,972 475,816 270,074 Retained Earnings Beginning of year 493,269 400,985 345,370 Net earnings 120,533 92,284 55,615 Cumulative effect of adoption of FIN 48 (739) — — End of year 613,063 493,269 400,985 Accumulated Other Comprehensive Income (Loss) Beginning of year 146,868 31,832 10,335 Adjustment for adoption of FAS 158, net of tax expense of $334 — 1,172 — Change in fair value of derivative financial instruments, net of tax (expense) benefit of $7,881, $(860), and $(574) (15,607) 1,501 2,089 Adjustment for minimum pension liability, net of tax (expense) benefit of $17,491, $(461) and $1,362 (33,635) 938 (2,346) Foreign currency translation adjustment (184,247) 111,425 21,754 End of year (86,621) 146,868 31,832 Total Shareholders’ Equity $ 1,026,341 $ 1,121,826 $ 707,989
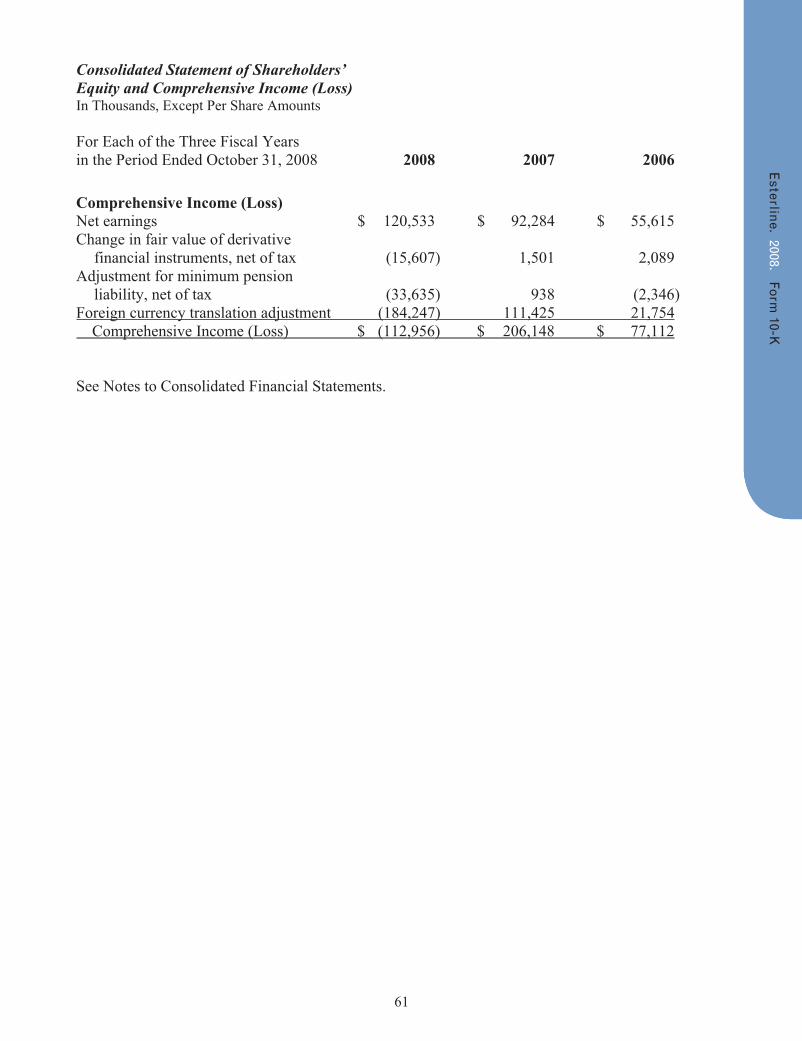
61
Consolidated Statement of Shareholders’ Equity and Comprehensive Income (Loss) In Thousands, Except Per Share Amounts For Each of the Three Fiscal Years in the Period Ended October 31, 2008 2008 2007 2006 Comprehensive Income (Loss) Net earnings $ 120,533 $ 92,284 $ 55,615 Change in fair value of derivative financial instruments, net of tax (15,607) 1,501 2,089 Adjustment for minimum pension liability, net of tax (33,635) 938 (2,346) Foreign currency translation adjustment (184,247) 111,425 21,754 Comprehensive Income (Loss) $ (112,956) $ 206,148 $ 77,112 See Notes to Consolidated Financial Statements.
62
Notes to Consolidated Financial Statements NOTE 1: Accounting Policies Nature of Operations Esterline Technologies Corporation (the Company) designs, manufactures and markets highly engineered products. The Company serves the aerospace and defense industry, primarily in the United States and Europe. The Company also serves the industrial/commercial and medical markets. Principles of Consolidation and Basis of Presentation The consolidated financial statements include the accounts of the Company and all subsidiaries. All significant intercompany accounts and transactions have been eliminated. Classifications have been changed for certain amounts in prior periods to conform with the current year’s presentation. The Company’s fiscal year ends on the last Friday of October. The fiscal year ended October 31, 2008 contained 53 weeks, while the prior-year period contained 52 weeks. Management Estimates To prepare financial statements in conformity with U.S. generally accepted accounting principles, management is required to make estimates and assumptions that affect the reported amounts of assets and liabilities, disclosure of contingent assets and liabilities at the date of the financial statements, and the reported amounts of revenues and expenses during the reporting period. Actual results could differ from those estimates. Concentration of Risks The Company’s products are principally focused on the aerospace and defense industry, which includes military and commercial aircraft original equipment manufacturers and their suppliers, commercial airlines, and the United States and foreign governments. Accordingly, the Company’s current and future financial performance is dependent on the economic condition of the aerospace and defense industry. The commercial aerospace market has historically been subject to cyclical downturns during periods of weak economic conditions or material changes arising from domestic or international events. Management believes that the Company’s sales are fairly well balanced across its customer base, which includes not only aerospace and defense customers but also medical and industrial commercial customers. However, material changes in the economic conditions of the aerospace industry could have a material effect on the Company’s results of operations, financial position or cash flows. Revenue Recognition The Company recognizes revenue when the title and risk of loss have passed to the customer, there is persuasive evidence of an agreement, delivery has occurred or services have been rendered, the price is determinable, and the collectibility is reasonably assured. The Company recognizes product revenues at the point of shipment or delivery in accordance with the terms of sale. Sales are net of returns and allowances. Returns and allowances are not significant because products are manufactured to customer specification and are covered by the terms of the product warranty.
63
Revenues and profits on fixed-price contracts with significant engineering as well as production requirements are recorded based on the achievement of contractual milestones and the ratio of total actual incurred costs to date to total estimated costs for each contract (cost-to-cost method) in accordance with the American Institute of Certified Public Accountants Statement of Position 81-1, “Accounting for Performance of Construction-Type and Certain Production-Type Contracts.” Types of milestones include design review and prototype completion. The Company reviews cost performance and estimates to complete on its ongoing contracts at least quarterly. The impact of revisions of profit estimates are recognized on a cumulative catch-up basis in the period in which the revisions are made. Provisions for anticipated losses on contracts are recorded in the period they become evident. Amounts representing contract change orders are included in revenue only when they can be reliably estimated and realization is probable, and are determined on a percentage-of-completion basis measured by the cost-to-cost method. Claims are included in revenue only when they are probable of collection. Research and Development Expenditures for internally-funded research and development are expensed as incurred. Customer-funded research and development projects performed under contracts are accounted for as work in process as work is performed and recognized as cost of sales and sales when contract milestones are achieved. Research and development expenditures are net of government assistance and tax subsidies, which are not contingent upon paying income tax. Financial Instruments Fair Value of Financial Instruments The Company’s financial instruments consist primarily of cash and cash equivalents, accounts receivable, accounts payable, short-term borrowings, long-term debt, foreign currency forward contracts, and interest rate swap agreements. The carrying amounts of cash and cash equivalents, accounts receivable, and accounts payable approximate their respective fair values because of the short-term maturities or expected settlement dates of these instruments. The fair market value of the Company’s long-term debt and short-term borrowings was estimated at $393.0 million and $469.5 million at fiscal year end 2008 and 2007, respectively. These estimates were derived using discounted cash flows with interest rates currently available to the Company for issuance of debt with similar terms and remaining maturities. Foreign Currency Exchange Risk Management The Company is subject to risks associated with fluctuations in foreign currency exchange rates from the sale of products in currencies other than its functional currency. Furthermore, the Company has assets denominated in foreign currencies that are not offset by liabilities in such foreign currencies. We own significant operations in Canada, France, Germany and the United Kingdom and, accordingly, we may experience gains or losses due to foreign exchange fluctuations. The Company’s policy is to hedge a portion of its forecasted transactions using forward exchange contracts, with maturities up to fifteen months. These forward contracts have been designated as cash flow hedges. The portion of the net gain or loss on a derivative instrument that is effective as a hedge is reported as a component of other comprehensive income in shareholders’ equity and is reclassified into earnings in the same period during which the hedged transaction affects earnings. The remaining net gain or loss on the derivative in excess of the present value of the expected cash flows of the hedged transaction is recorded in earnings immediately. If a derivative does not qualify for hedge accounting, or a portion of the hedge is deemed ineffective, the change in fair
64
value is recorded in earnings. The amount of hedge ineffectiveness has not been material in any of the three fiscal years in the period ended October 31, 2008. At October 31, 2008 and October 26, 2007, the notional value of foreign currency forward contracts accounted for as a cash flow hedge was $273.0 million and $54.2 million, respectively. The fair value of these contracts was a $19.3 million liability and a $2.6 million asset at October 31, 2008 and October 26, 2007, respectively. The Company does not enter into any forward contracts for trading purposes. In February 2006, the Company entered into a term loan for U.K. £57.0 million. The Company designated the term loan as a hedge of the investment in a certain U.K. business unit. The foreign currency gain or loss that is effective as a hedge is reported as a component of other comprehensive income in shareholders’ equity. The amount of foreign currency translation included in Other Comprehensive Income was a gain of $6.1 million and a loss of $5.6 million net of taxes at October 31, 2008 and October 26, 2007, respectively. To the extent that this hedge is ineffective, the foreign currency gain or loss is recorded in earnings. There was no ineffectiveness in 2008. Interest Rate Risk Management Depending on the interest rate environment, the Company may enter into interest rate swap agreements to convert the fixed interest rates on notes payable to variable interest rates or terminate any swap agreements in place. These interest rate swap agreements have been designated as fair value hedges. Accordingly, gain or loss on swap agreements as well as the offsetting loss or gain on the hedged portion of notes payable are recognized in interest expense during the period of the change in fair values. The Company attempts to manage exposure to counterparty credit risk by only entering into agreements with major financial institutions which are expected to be able to fully perform under the terms of the agreement. In September 2003, the Company entered into an interest rate swap agreement on $75.0 million of its Senior Subordinated Notes due in 2013. The swap agreement exchanged the fixed interest rate for a variable interest rate on $75.0 million of the $175.0 million principal amount outstanding. The fair market value of the Company’s interest rate swap was an asset of $1.6 million and $0.3 million at October 31, 2008 and October 26, 2007, respectively. Depending on the interest rate environment, the Company may enter into interest rate swap agreements to convert the variable interest rates on notes payable to fixed interest rates. These swap agreements are accounted for as cash flow hedges and the fair market value of the hedge instrument is included in Other Comprehensive Income. In February 2006, the Company entered into an interest rate swap agreement on the full principal amount of its U.K. £57.0 million term loan facility. The swap agreement exchanged the variable interest rate for a fixed interest rate of 4.75% plus an additional margin amount determined by reference to the Company’s leverage ratio. The fair value of the interest rate swap was an asset of $2.1 million at October 26, 2007. The swap was terminated in 2008 for a gain of $1.9 million. The fair market value of the interest rate swaps was estimated by discounting expected cash flows using quoted market interest rates. Foreign Currency Translation Foreign currency assets and liabilities are translated into their U.S. dollar equivalents based on year end exchange rates. Revenue and expense accounts are translated at average exchange rates. Aggregate exchange gains and losses arising from the translation of foreign assets and liabilities are included in shareholders’ equity as a component of comprehensive income. Accumulated gain
65
or (loss) on foreign currency translation adjustment was $(39.2) million, $145.1 million and $33.7 million as of the fiscal years ended October 31, 2008, October 26, 2007 and October 27, 2006, respectively. Foreign Currency Transaction Gains and Losses Foreign currency transaction gains and losses are included in results of operations. These foreign currency transactions resulted in a $5.1 million gain in fiscal 2008 and a $1.6 million loss in fiscal 2007. Foreign currency transaction gains and losses were not material in fiscal 2006.
Including cash proceeds denominated in U.K. pounds from the sale of Muirhead/Traxsys on November 3, 2008, a 5% increase or decrease in the exchange rate for the euro, U.K. pound and Canadian dollar relative to the U.S. dollar from October 31, 2008, would result in an unrealized gain or loss of approximately $2.2 million on our monetary assets.
Cash Equivalents and Cash in Escrow Cash equivalents consist of highly liquid investments with maturities of three months or less at the date of purchase. Fair value of cash equivalents approximates carrying value. Cash in escrow represents amounts held in escrow pending finalization of a purchase transaction. Cash equivalents included $10.0 million in cash under a letter of credit facility at October 31, 2008 and October 26, 2007.
Accounts Receivable Accounts receivable are recorded at the net invoice price for sales billed to customers. Accounts receivable are considered past due when outstanding more than normal trade terms allow. An allowance for doubtful accounts is established when losses are expected to be incurred. Accounts receivable are written off to the allowance for doubtful accounts when the balance is considered to be uncollectible.
Inventories Inventories are stated at the lower of cost or market using the first-in, first-out (FIFO) or average cost method. Inventory cost includes material, labor and factory overhead. The Company defers pre-production engineering costs as work-in-process inventory in connection with long-term supply arrangements that include contractual guarantees for reimbursement from the customer. Inventory reserves are provided when inventory is considered to be excess or obsolete based upon an analysis of actual on-hand quantities on a part level basis to forecasted product demand and historical usage. Inventory reserves are released based upon adjustments to forecasted demand.
66
Property, Plant and Equipment, and Depreciation Property, plant and equipment is carried at cost and includes expenditures for major improvements. Depreciation is generally provided on the straight-line method based upon estimated useful lives ranging from 15 to 30 years for buildings, and 3 to 10 years for machinery and equipment. Depreciation expense was $41,095,000, $34,273,000 and $26,757,000 for fiscal years 2008, 2007 and 2006, respectively. The fair value of liabilities related to the retirement of property is recorded when there is a legal or contractual obligation to incur asset retirement costs and the costs can be estimated. The Company records the asset retirement cost by increasing the carrying cost of the underlying property by the amount of the asset retirement obligation. The asset retirement cost is depreciated over the estimated useful life of the underlying property.
Debt Issuance Costs Costs incurred to issue debt are deferred and amortized as interest expense over the term of the related debt using a method that approximates the effective interest method.
Long-lived Assets The carrying amount of long-lived assets is reviewed periodically for impairment. An asset (other than goodwill and indefinite-lived intangible assets) is considered impaired when estimated future cash flows are less than the carrying amount of the asset. In the event the carrying amount of such asset is not deemed recoverable, the asset is adjusted to its estimated fair value. Fair value is generally determined based upon estimated discounted future cash flows.
Goodwill and Intangibles Goodwill is not amortized under Statement No. 142, but is tested for impairment at least annually. A reporting unit is generally defined at the operating segment level or at the component level one level below the operating segment, if said component constitutes a business. Goodwill and intangible assets are allocated to reporting units based upon the purchase price of the acquired unit, the valuation of acquired tangible and intangible assets, and liabilities assumed. When a reporting unit’s carrying value exceeds its estimated fair value, an impairment test is required. This test involves allocating the fair value of the reporting unit to all of the assets and liabilities of that unit, with the excess of fair value over allocated net assets representing the fair value of goodwill. An impairment loss is measured as the amount by which the carrying value of goodwill exceeds the estimated fair value of goodwill.
Intangible assets are amortized using the straight-line method over their estimated period of benefit, ranging from 2 to 20 years. The Company periodically evaluates the recoverability of intangible assets and takes into account events or circumstances that warrant revised estimates of useful lives or that indicate that an impairment exists.
Indefinite-lived intangible assets (other than goodwill) are tested annually for impairment or more frequently on an interim basis if circumstances require. This test is comparable to the impairment test for goodwill described above. Environmental Environmental exposures are provided for at the time they are known to exist or are considered probable and reasonably estimable. No provision has been recorded for environmental remediation
67
costs which could result from changes in laws or other circumstances currently not contemplated by the Company. Costs provided for future expenditures on environmental remediation are not discounted to present value.
Pension Plan and Post-Retirement Benefit Plan Obligations The Company accounts for the obligations of its employee pension benefit costs and post-retirement benefits in accordance with the applicable statements issued by the Financial Accounting Standards Board. In accordance with these statements, management selects appropriate assumptions including discount rate, rate of increase in future compensation levels and assumed long-term rate of return on plan assets and expected annual increases in costs of medical and other health care benefits in regard to the Company’s post-retirement benefit obligations. These assumptions are based upon historical results, the current economic environment and reasonable expectations of future events. Actual results which vary from assumptions are accumulated and amortized over future periods and, accordingly, are recognized in expense in these periods. Significant differences between our assumptions and actual experience or significant changes in assumptions could impact the pension costs and the pension obligation.
Share-Based CompensationEffective October 29, 2005, the Company adopted Statement of Financial Accounting Standards No. 123 (revised 2004), “Share-Based Payment” (Statement No. 123(R)), which requires the Company to measure the cost of employee services received in exchange for an award of equity instruments based on the grant-date fair value of the award. The Company adopted Statement No. 123(R) using the modified prospective method effective October 29, 2005. The cumulative effect of the change in accounting principle upon adoption of Statement No. 123(R) was included in selling, general and administrative expense as the amount was not significant.
Product Warranties Estimated product warranty expenses are recorded when the covered products are shipped to customers and recognized as revenue. Product warranty expense is estimated based upon the terms of the warranty program.
Income Taxes Income taxes are accounted for in accordance with Financial Accounting Standards No. 109, “Accounting for Income Taxes,” and reserves for income taxes are accounted for in accordance with FIN 48. The objective of accounting for income taxes are to recognize the amount of taxes payable or refundable for the current year and deferred tax liabilities and assets for the future tax consequences of events that have been recognized in our financial statements or tax returns. Earnings Per Share Basic earnings per share is computed on the basis of the weighted average number of common shares outstanding during the year. Diluted earnings per share also includes the dilutive effect of stock options. Common shares issuable from stock options that are excluded from the calculation of diluted earnings per share because they were anti-dilutive were 499,850, 96,048, and 356,349 for fiscal 2008, 2007 and 2006, respectively. The weighted average number of shares outstanding used to compute basic earnings per share was 29,507,000, 25,824,000, and 25,413,000 for fiscal
68
years 2008, 2007 and 2006, respectively. The weighted average number of shares outstanding used to compute diluted earnings per share was 29,908,000, 26,252,000, and 25,818,000 for fiscal years 2008, 2007 and 2006, respectively. Recent Accounting Pronouncements In May 2008, the Financial Accounting Standards Board issued Statement of Financial Accounting Standard No. 162, “The Hierarchy of Generally Accepted Accounting Principles (GAAP),” (Statement No. 162). The purpose of the new standard is to provide a consistent framework for determining what accounting principles should be used when preparing U.S. GAAP financial statements. The new standard is effective 60 days following the Securities and Exchange Commission’s approval of the Public Company Accounting Oversight Board amendments to AU Section 411, “The Meaning of Present Fairly in Conformity With Generally Accepted Accounting Principles.” The adoption of Statement No. 162 is not expected to have a material effect on the Company’s financial statements.
In March 2008, the Financial Accounting Standards Board issued Financial Accounting Standard No. 161, “Disclosure About Derivative Instruments and Hedging Activities, an amendment to Financial Accounting Standards Board Financial Accounting Standard No. 133,” (Statement No. 161). Statement No. 161 requires among other things, enhanced disclosure about the volume and nature of derivative and hedging activities and a tabular summary showing the fair value of derivative instruments included in the statement of financial position and statement of operations. Statement No. 161 also requires expanded disclosure of contingencies included in derivative instruments related to credit risk. Statement No. 161 is effective for fiscal 2009. The Company is currently evaluating the impact of Statement No. 161 on the Company’s financial statements.
On December 4, 2007, the Financial Accounting Standards Board issued Financial Accounting Standard No. 141(R), “Business Combinations,” (Statement No. 141(R)) and Statement No. 160, “Accounting and Reporting of Non-controlling Interest in Consolidated Financial Statements, an amendment of ARB No. 51,” (Statement No. 160). These new standards will significantly change the accounting for and reporting of business combination transactions and non-controlling (minority) interests in consolidated financial statements. Statement No. 141(R) and Statement No. 160 are required to be adopted simultaneously and are effective for fiscal 2010.
The significant changes in the accounting for business combination transactions under Statement No. 141(R) include:
Recognition, with certain exceptions, of 100% of the fair values of assets acquired, liabilities assumed, and non-controlling interests of acquired businesses.
Measurement of all acquirer shares issued in consideration for a business combination at fair value on the acquisition date. With the effectiveness of Statement No. 141(R), the “agreement and announcement date” measurement principles in EITF Issue 99-12 will be nullified.
Recognition of contingent consideration arrangements at their acquisition-date fair values, with subsequent changes in fair value generally reflected in earnings.
With the one exception described in the last sentence of this section, recognition of pre-acquisition gain and loss contingencies at their acquisition-date fair values. Subsequent
69
accounting for pre-acquisition loss contingencies is based on the greater of acquisition-date fair value or the amount calculated pursuant to FASB Statement No. 5, “Accounting for Contingencies,” (Statement No. 5). Subsequent accounting for pre-acquisition gain contingencies is based on the lesser of acquisition-date fair value or the best estimate of the future settlement amount. Adjustments after the acquisition date are made only upon the receipt of new information on the possible outcome of the contingency, and changes to the measurement of pre-acquisition contingencies are recognized in ongoing results of operations. Absent new information, no adjustments to the acquisition-date fair value are made until the contingency is resolved. Pre-acquisition contingencies that are both (1) non-contractual and (2) as of the acquisition date are “not more likely than not” of materializing are not recognized in acquisition accounting and, instead, are accounted for based on the guidance in Statement No. 5, “Accounting for Contingencies.”
Capitalization of in-process research and development (IPR&D) assets acquired at acquisition date fair value. After acquisition, apply the indefinite-lived impairment model (lower of basis or fair value) through the development period to capitalized IPR&D without amortization. Charge development costs incurred after acquisition to results of operations. Upon completion of a successful development project, assign an estimated useful life to the amount then capitalized, amortize over that life, and consider the asset a definite-lived asset for impairment accounting purposes.
Recognition of acquisition-related transaction costs as expense when incurred.
Recognition of acquisition-related restructuring cost accruals in acquisition accounting only if the criteria in Statement No. 146 are met as of the acquisition date. With the effectiveness of Statement No. 141(R), the EITF Issue 95-3 concepts of “assessing, formulating, finalizing and committing/communicating” that currently pertain to recognition in purchase accounting of an acquisition-related restructuring plan will be nullified.
Recognition of changes in the acquirer’s income tax valuation allowance resulting from the business combination separately from the business combination as adjustments to income tax expense. Also, changes after the acquisition date in an acquired entity’s valuation allowance or tax uncertainty established at the acquisition date are accounted for as adjustments to income tax expense.
The Company is currently evaluating the impact of Statement No. 141(R) and Statement No. 160 on the Company’s financial statements.
In February 2007, the Financial Accounting Standards Board issued Statement of Financial Accounting Standards No. 159, “The Fair Value Option for Financial Assets and Financial Liabilities,” (Statement No. 159). Statement No. 159 permits entities to choose to measure certain eligible financial assets and financial liabilities at fair value (the fair value option). Statement No. 159 also establishes presentation and disclosure requirements designed to facilitate comparisons between entities that choose different measurement attributes for similar types of assets and liabilities. Unrealized gains and losses on items for which the fair value option is elected would be reported in earnings. Statement No. 159 is effective for the Company’s fiscal year ending October 30, 2009. The Company is currently evaluating the impact, if any, of Statement No. 159 on the Company’s financial statements.
70
In September 2006, the Financial Accounting Standards Board issued Statement of Financial Accounting Standards No. 157, “Fair Value Measurements,” (Statement No. 157). Statement No. 157 defines fair value, establishes a framework for measuring fair value in generally accepted accounting principles, and expands disclosures about fair value measurements. Statement No. 157 applies under other accounting pronouncements that require or permit fair value measurements. Statement No. 157 indicates, among other things, that a fair value measurement assumes the transaction to sell the asset or transfer the liability occurs in the principal market for the asset or liability or, in the absence of a principal market, the most advantageous market for the asset or liability. Statement No. 157 is effective for the Company’s year ending October 30, 2009. The Company is currently evaluating the impact of Statement No. 157 on the Company’s financial statements.
NOTE 2: Recovery of Insurance Claims
On June 26, 2006, an explosion occurred at the Company’s Wallop facility, which resulted in one fatality and several minor injuries. The incident destroyed an oven complex for the production of advanced flares and significantly damaged a portion of the facility. The advanced flare facility has been closed due to the requirements of the Health and Safety Executive (HSE) to review the cause of the accident, but normal operations are continuing at unaffected portions of the facility. The HSE investigation will not be completed until the Coroner’s Inquest is filed. Although it is not possible to determine the results of the HSE investigation or how the Coroner will rule, management does not expect to be found in breach of the Health and Safety at Work Act related to the accident and, accordingly, no amounts have been recorded for any potential fines that may be assessed by the HSE.The construction of the new flare facility is expected to be completed and in full production, following customary start-up and commissioning activities, late in fiscal 2009.
The operation was insured under a property, casualty and business interruption insurance policy and in June 2007, the Company settled its insurance claim for U.K. £24.0 million, including payments already received. In fiscal 2007, insurance recoveries totaled $37.5 million, net of the write-off of the damaged facility. The Company recorded business interruption insurance recoveries of $4.9 million for losses incurred in fiscal 2006.
NOTE 3: Discontinued Operations
In the fourth quarter of fiscal 2008, the Company’s Board of Directors approved the sale of the Company’s U.K.-based Muirhead Aerospace and Traxsys Input Products Limited businesses which were included in the Sensors & Systems segment. As a result, the consolidated financial statements present Muirhead Aerospace and Traxsys Input Products Limited as a discontinued operation.
Subsequent to October 31, 2008, the Company sold Muirhead Aerospace and Traxsys Input Products Limited for approximately U.K. £40.0 million or $64.4 million resulting in a gain of approximately $15.8 million, net of taxes of $11.4 million, which will be recorded in the first quarter of fiscal year 2009.
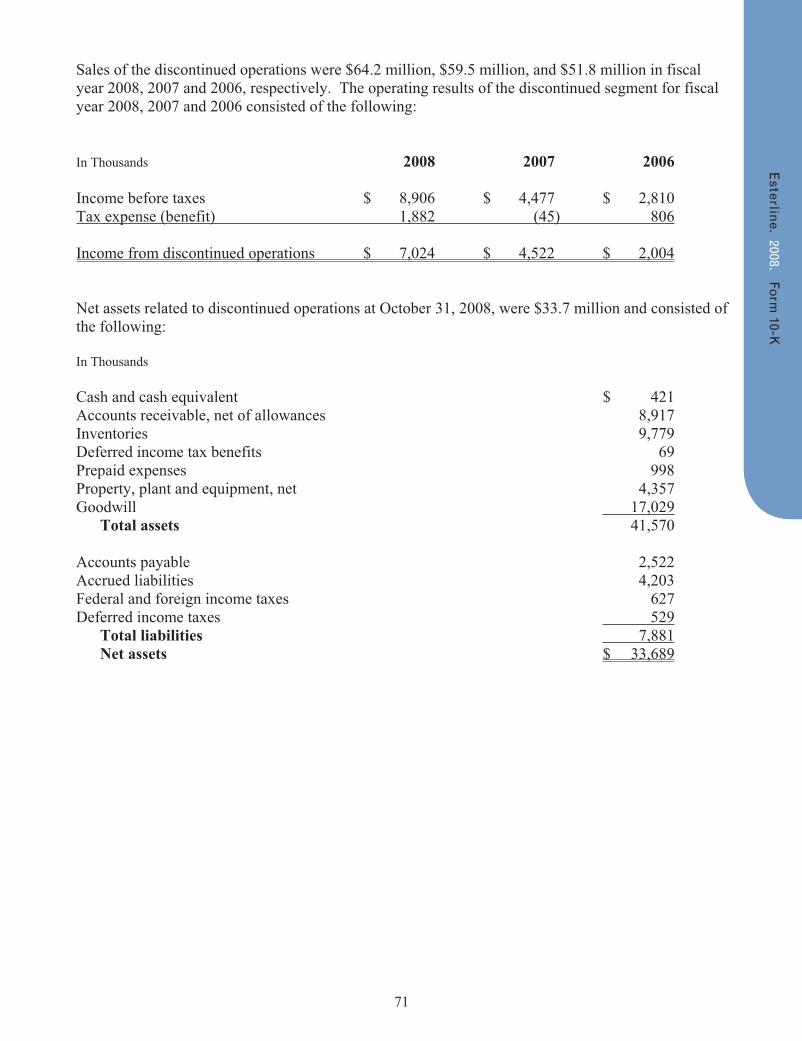
71
Sales of the discontinued operations were $64.2 million, $59.5 million, and $51.8 million in fiscal year 2008, 2007 and 2006, respectively. The operating results of the discontinued segment for fiscal year 2008, 2007 and 2006 consisted of the following: In Thousands 2008 2007 2006 Income before taxes $ 8,906 $ 4,477 $ 2,810 Tax expense (benefit) 1,882 (45) 806 Income from discontinued operations $ 7,024 $ 4,522 $ 2,004 Net assets related to discontinued operations at October 31, 2008, were $33.7 million and consisted of the following: In Thousands Cash and cash equivalent $ 421 Accounts receivable, net of allowances 8,917 Inventories 9,779 Deferred income tax benefits 69 Prepaid expenses 998 Property, plant and equipment, net 4,357 Goodwill 17,029 Total assets 41,570 Accounts payable 2,522 Accrued liabilities 4,203 Federal and foreign income taxes 627 Deferred income taxes 529 Total liabilities 7,881 Net assets $ 33,689
72
NOTE 4: Inventories
Inventories, net of reserves, at the end of fiscal 2008 and 2007 consisted of the following:
In Thousands 2008 2007
Raw materials and purchased parts $ 110,984 $ 111,998 Work in process 89,936 83,870 Inventory costs under long-term contracts 15,650 15,233 Finished goods 45,403 47,075 $ 261,973 $ 258,176
Inventory Reserve Rollforward:
In Thousands 2008 2007
Beginning balance $ 31,888 $ 18,175 Reserves related to acquisitions — 9,768 Accruals 6,918 5,711 Write-offs (3,805) (4,119) Release of reserves on shipments (566) (631) Release of other reserves (503) — Currency translation adjustment (4,226) 2,984 $ 29,706 $ 31,888
NOTE 5: Goodwill
The following table summarizes the changes in goodwill by segment for fiscal 2008 and 2007:
Avionics & Sensors & AdvancedIn Thousands Controls Systems Materials Total
Balance, October 27, 2006 $ 98,087 $ 87,898 $ 180,170 $ 366,155 Goodwill from acquisitions 209,982 — 11,965 221,947 Goodwill adjustments — 6,860 (678) 6,182 Foreign currency translation adjustment 48,769 5,744 8,068 62,581
Balance, October 26, 2007 356,838 100,502 199,525 656,865 Goodwill from acquisitions 219 — — 219 Goodwill adjustments (6,302) 20,016 (669) 13,045 Foreign currency translation adjustment (53,741) (14,567) (24,960) (93,268)Balance, October 31, 2008 $ 297,014 $ 105,951 $ 173,896 $ 576,861
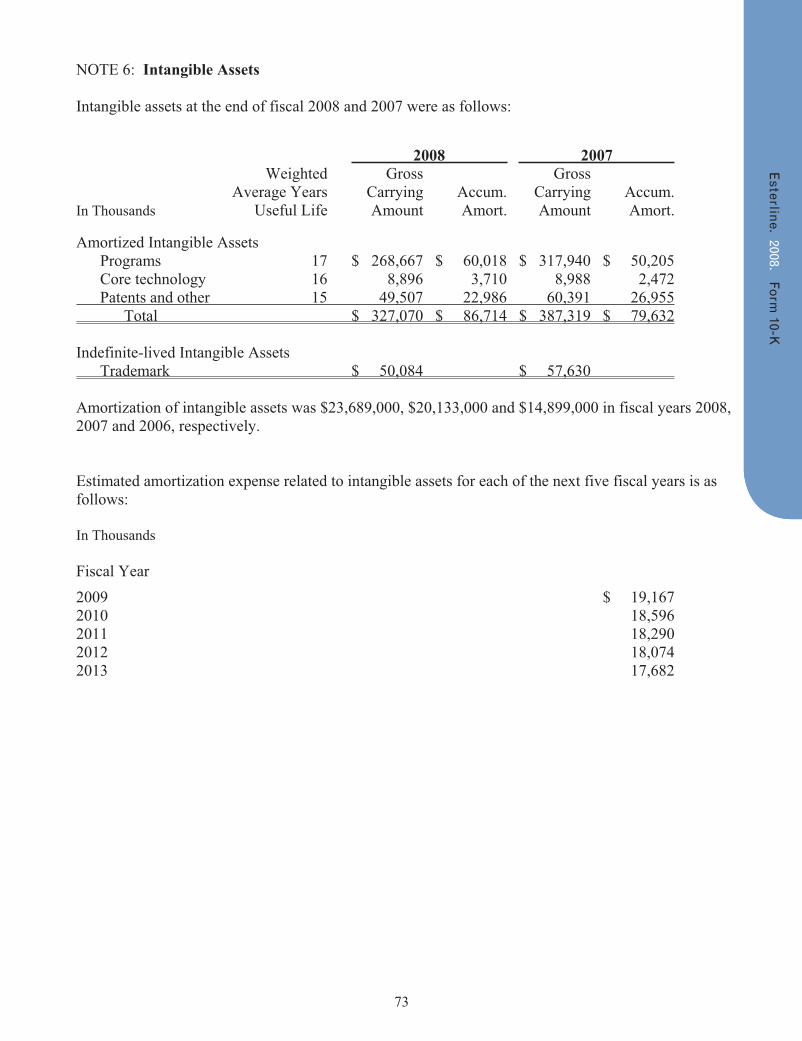
73
NOTE 6: Intangible Assets Intangible assets at the end of fiscal 2008 and 2007 were as follows:
2008 2007 Weighted Gross Gross Average Years Carrying Accum. Carrying Accum. In Thousands Useful Life Amount Amort. Amount Amort.
Amortized Intangible Assets Programs 17 $ 268,667 $ 60,018 $ 317,940 $ 50,205 Core technology 16 8,896 3,710 8,988 2,472 Patents and other 15 49,507 22,986 60,391 26,955 Total $ 327,070 $ 86,714 $ 387,319 $ 79,632
Indefinite-lived Intangible Assets Trademark $ 50,084 $ 57,630
Amortization of intangible assets was $23,689,000, $20,133,000 and $14,899,000 in fiscal years 2008, 2007 and 2006, respectively.
Estimated amortization expense related to intangible assets for each of the next five fiscal years is as follows:
In Thousands
Fiscal Year 2009 $ 19,167 2010 18,5962011 18,2902012 18,0742013 17,682
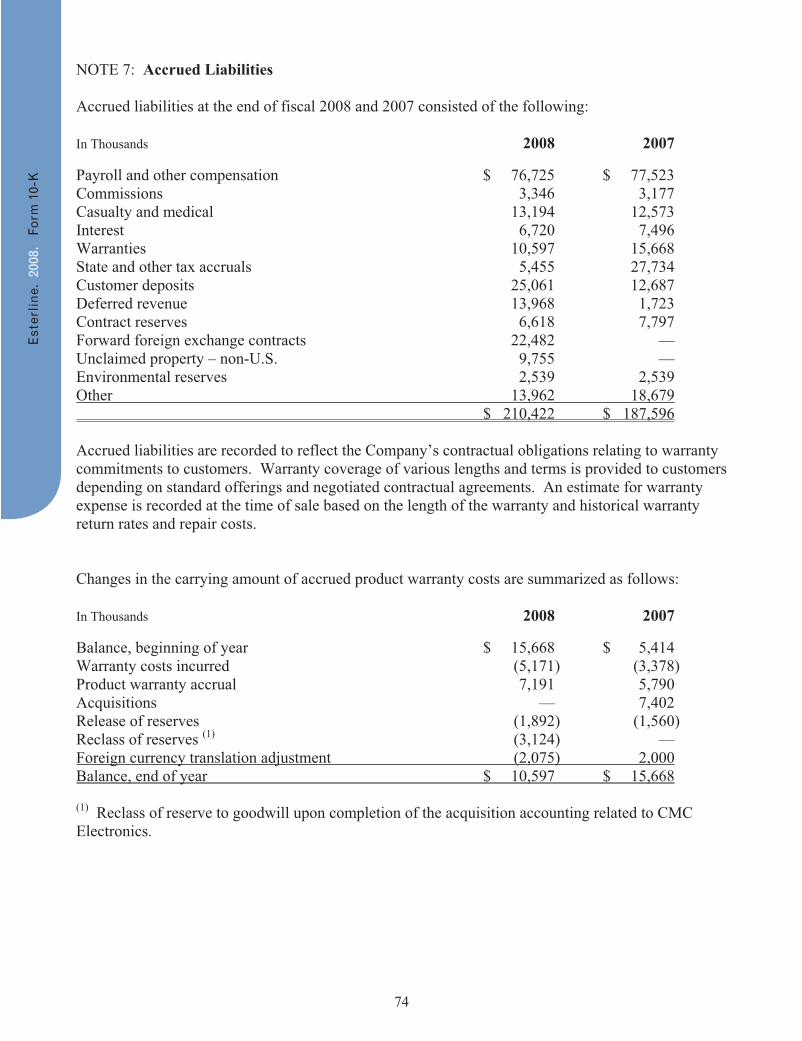
74
NOTE 7: Accrued Liabilities
Accrued liabilities at the end of fiscal 2008 and 2007 consisted of the following:
In Thousands 2008 2007
Payroll and other compensation $ 76,725 $ 77,523 Commissions 3,346 3,177 Casualty and medical 13,194 12,573 Interest 6,720 7,496 Warranties 10,597 15,668 State and other tax accruals 5,455 27,734 Customer deposits 25,061 12,687 Deferred revenue 13,968 1,723 Contract reserves 6,618 7,797 Forward foreign exchange contracts 22,482 — Unclaimed property – non-U.S. 9,755 — Environmental reserves 2,539 2,539 Other 13,962 18,679 $ 210,422 $ 187,596
Accrued liabilities are recorded to reflect the Company’s contractual obligations relating to warranty commitments to customers. Warranty coverage of various lengths and terms is provided to customers depending on standard offerings and negotiated contractual agreements. An estimate for warranty expense is recorded at the time of sale based on the length of the warranty and historical warranty return rates and repair costs.
Changes in the carrying amount of accrued product warranty costs are summarized as follows:
In Thousands 2008 2007
Balance, beginning of year $ 15,668 $ 5,414 Warranty costs incurred (5,171) (3,378) Product warranty accrual 7,191 5,790 Acquisitions — 7,402 Release of reserves (1,892) (1,560) Reclass of reserves (1) (3,124) — Foreign currency translation adjustment (2,075) 2,000Balance, end of year $ 10,597 $ 15,668
(1) Reclass of reserve to goodwill upon completion of the acquisition accounting related to CMC Electronics.
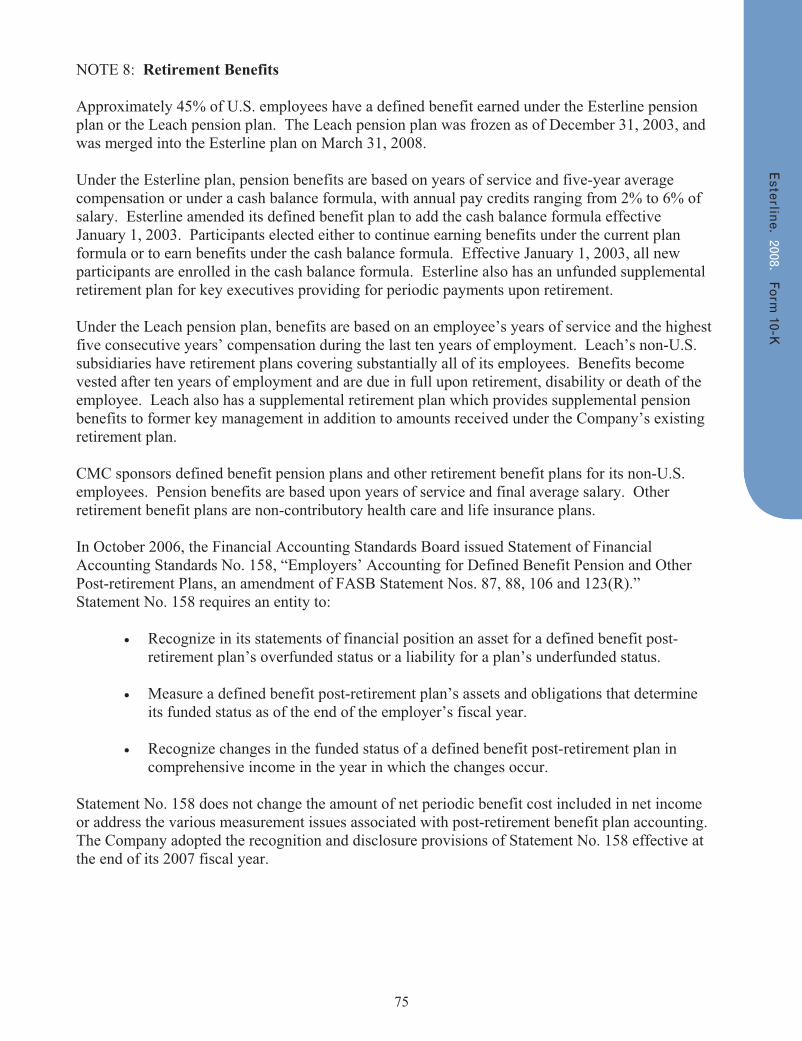
75
NOTE 8: Retirement Benefits
Approximately 45% of U.S. employees have a defined benefit earned under the Esterline pension plan or the Leach pension plan. The Leach pension plan was frozen as of December 31, 2003, and was merged into the Esterline plan on March 31, 2008.
Under the Esterline plan, pension benefits are based on years of service and five-year average compensation or under a cash balance formula, with annual pay credits ranging from 2% to 6% of salary. Esterline amended its defined benefit plan to add the cash balance formula effective January 1, 2003. Participants elected either to continue earning benefits under the current plan formula or to earn benefits under the cash balance formula. Effective January 1, 2003, all new participants are enrolled in the cash balance formula. Esterline also has an unfunded supplemental retirement plan for key executives providing for periodic payments upon retirement.
Under the Leach pension plan, benefits are based on an employee’s years of service and the highest five consecutive years’ compensation during the last ten years of employment. Leach’s non-U.S. subsidiaries have retirement plans covering substantially all of its employees. Benefits become vested after ten years of employment and are due in full upon retirement, disability or death of the employee. Leach also has a supplemental retirement plan which provides supplemental pension benefits to former key management in addition to amounts received under the Company’s existing retirement plan.
CMC sponsors defined benefit pension plans and other retirement benefit plans for its non-U.S. employees. Pension benefits are based upon years of service and final average salary. Other retirement benefit plans are non-contributory health care and life insurance plans.
In October 2006, the Financial Accounting Standards Board issued Statement of Financial Accounting Standards No. 158, “Employers’ Accounting for Defined Benefit Pension and Other Post-retirement Plans, an amendment of FASB Statement Nos. 87, 88, 106 and 123(R).” Statement No. 158 requires an entity to:
Recognize in its statements of financial position an asset for a defined benefit post-retirement plan’s overfunded status or a liability for a plan’s underfunded status.
Measure a defined benefit post-retirement plan’s assets and obligations that determine its funded status as of the end of the employer’s fiscal year.
Recognize changes in the funded status of a defined benefit post-retirement plan in comprehensive income in the year in which the changes occur.
Statement No. 158 does not change the amount of net periodic benefit cost included in net income or address the various measurement issues associated with post-retirement benefit plan accounting.The Company adopted the recognition and disclosure provisions of Statement No. 158 effective at the end of its 2007 fiscal year.
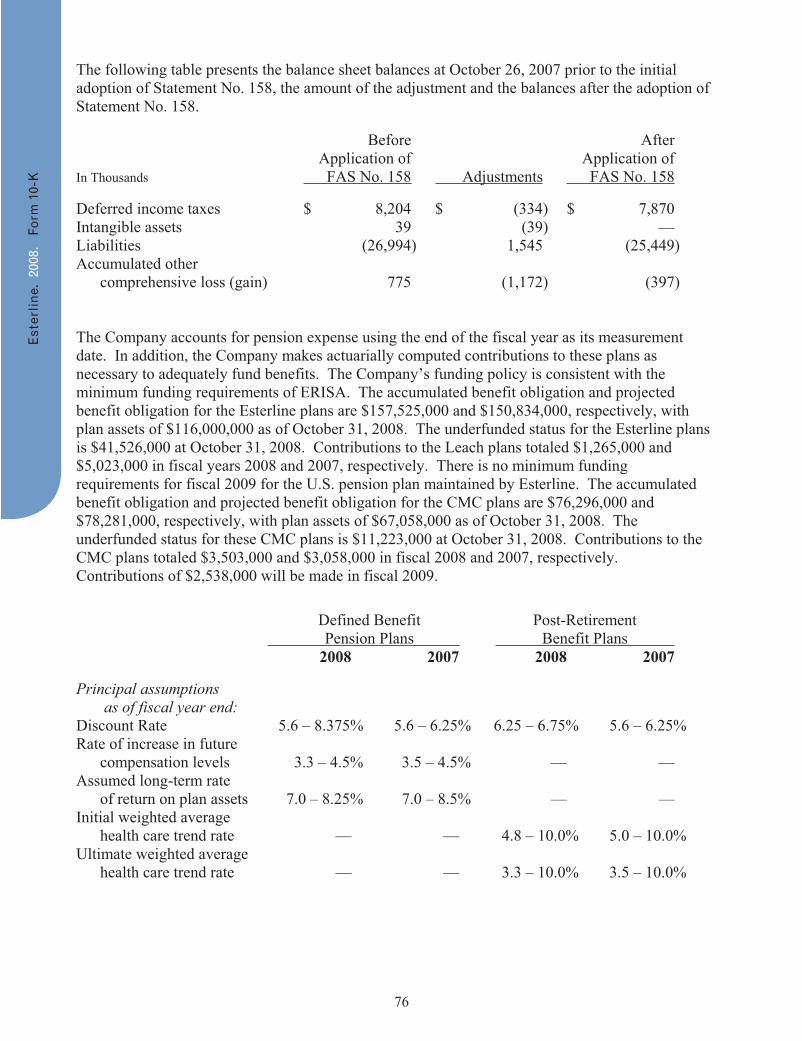
76
The following table presents the balance sheet balances at October 26, 2007 prior to the initial adoption of Statement No. 158, the amount of the adjustment and the balances after the adoption of Statement No. 158. Before After Application of Application of In Thousands FAS No. 158 Adjustments FAS No. 158 Deferred income taxes $ 8,204 $ (334) $ 7,870 Intangible assets 39 (39) — Liabilities (26,994) 1,545 (25,449) Accumulated other comprehensive loss (gain) 775 (1,172) (397) The Company accounts for pension expense using the end of the fiscal year as its measurement date. In addition, the Company makes actuarially computed contributions to these plans as necessary to adequately fund benefits. The Company’s funding policy is consistent with the minimum funding requirements of ERISA. The accumulated benefit obligation and projected benefit obligation for the Esterline plans are $157,525,000 and $150,834,000, respectively, with plan assets of $116,000,000 as of October 31, 2008. The underfunded status for the Esterline plans is $41,526,000 at October 31, 2008. Contributions to the Leach plans totaled $1,265,000 and $5,023,000 in fiscal years 2008 and 2007, respectively. There is no minimum funding requirements for fiscal 2009 for the U.S. pension plan maintained by Esterline. The accumulated benefit obligation and projected benefit obligation for the CMC plans are $76,296,000 and $78,281,000, respectively, with plan assets of $67,058,000 as of October 31, 2008. The underfunded status for these CMC plans is $11,223,000 at October 31, 2008. Contributions to the CMC plans totaled $3,503,000 and $3,058,000 in fiscal 2008 and 2007, respectively. Contributions of $2,538,000 will be made in fiscal 2009. Defined Benefit Post-Retirement Pension Plans Benefit Plans 2008 2007 2008 2007 Principal assumptions as of fiscal year end: Discount Rate 5.6 – 8.375% 5.6 – 6.25% 6.25 – 6.75% 5.6 – 6.25% Rate of increase in future compensation levels 3.3 – 4.5% 3.5 – 4.5% — — Assumed long-term rate of return on plan assets 7.0 – 8.25% 7.0 – 8.5% — — Initial weighted average health care trend rate — — 4.8 – 10.0% 5.0 – 10.0% Ultimate weighted average health care trend rate — — 3.3 – 10.0% 3.5 – 10.0%
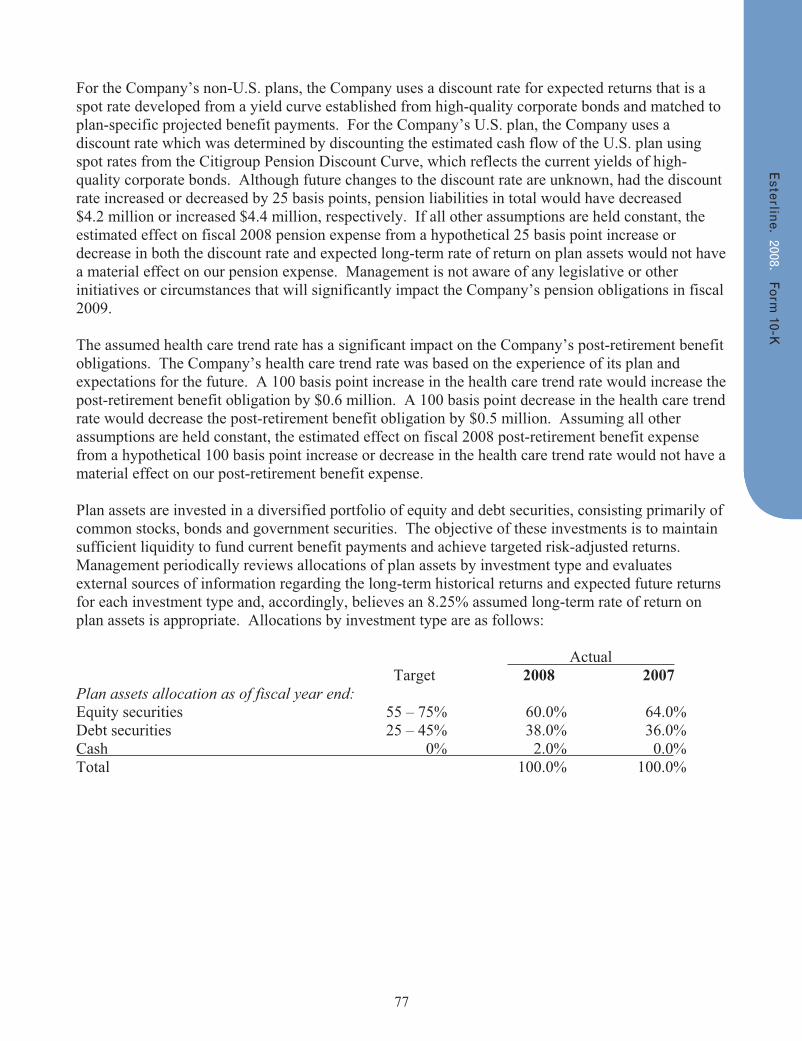
77
For the Company’s non-U.S. plans, the Company uses a discount rate for expected returns that is a spot rate developed from a yield curve established from high-quality corporate bonds and matched to plan-specific projected benefit payments. For the Company’s U.S. plan, the Company uses a discount rate which was determined by discounting the estimated cash flow of the U.S. plan using spot rates from the Citigroup Pension Discount Curve, which reflects the current yields of high-quality corporate bonds. Although future changes to the discount rate are unknown, had the discount rate increased or decreased by 25 basis points, pension liabilities in total would have decreased $4.2 million or increased $4.4 million, respectively. If all other assumptions are held constant, the estimated effect on fiscal 2008 pension expense from a hypothetical 25 basis point increase or decrease in both the discount rate and expected long-term rate of return on plan assets would not have a material effect on our pension expense. Management is not aware of any legislative or other initiatives or circumstances that will significantly impact the Company’s pension obligations in fiscal 2009. The assumed health care trend rate has a significant impact on the Company’s post-retirement benefit obligations. The Company’s health care trend rate was based on the experience of its plan and expectations for the future. A 100 basis point increase in the health care trend rate would increase the post-retirement benefit obligation by $0.6 million. A 100 basis point decrease in the health care trend rate would decrease the post-retirement benefit obligation by $0.5 million. Assuming all other assumptions are held constant, the estimated effect on fiscal 2008 post-retirement benefit expense from a hypothetical 100 basis point increase or decrease in the health care trend rate would not have a material effect on our post-retirement benefit expense. Plan assets are invested in a diversified portfolio of equity and debt securities, consisting primarily of common stocks, bonds and government securities. The objective of these investments is to maintain sufficient liquidity to fund current benefit payments and achieve targeted risk-adjusted returns. Management periodically reviews allocations of plan assets by investment type and evaluates external sources of information regarding the long-term historical returns and expected future returns for each investment type and, accordingly, believes an 8.25% assumed long-term rate of return on plan assets is appropriate. Allocations by investment type are as follows: Actual Target 2008 2007 Plan assets allocation as of fiscal year end: Equity securities 55 – 75% 60.0% 64.0% Debt securities 25 – 45% 38.0% 36.0% Cash 0% 2.0% 0.0% Total 100.0% 100.0%
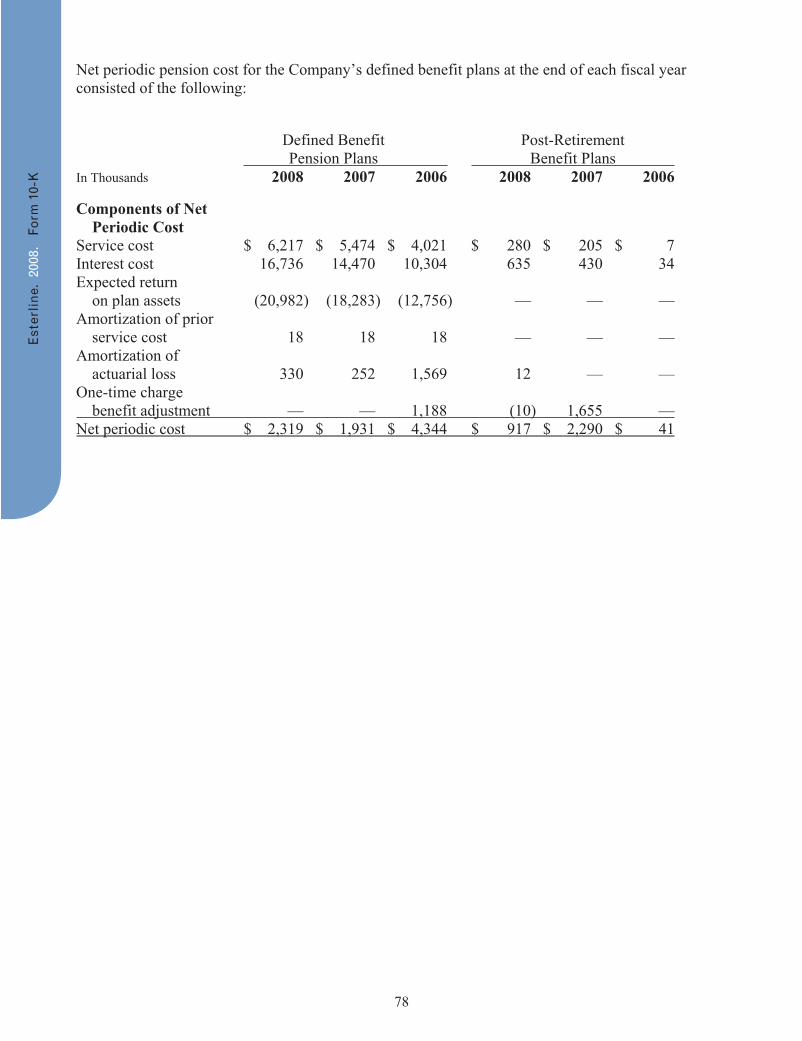
78
Net periodic pension cost for the Company’s defined benefit plans at the end of each fiscal year consisted of the following:
Defined Benefit Post-Retirement Pension Plans Benefit Plans In Thousands 2008 2007 2006 2008 2007 2006
Components of Net Periodic Cost Service cost $ 6,217 $ 5,474 $ 4,021 $ 280 $ 205 $ 7 Interest cost 16,736 14,470 10,304 635 430 34 Expected return on plan assets (20,982) (18,283) (12,756) — — — Amortization of prior service cost 18 18 18 — — — Amortization of actuarial loss 330 252 1,569 12 — — One-time charge benefit adjustment — — 1,188 (10) 1,655 —Net periodic cost $ 2,319 $ 1,931 $ 4,344 $ 917 $ 2,290 $ 41
79
The funded status of the defined benefit pension and post-retirement plans at the end of fiscal 2008 and 2007 were as follows:
Defined Benefit Post-Retirement Pension Plans Benefit Plans In Thousands 2008 2007 2008 2007
Benefit Obligation Beginning balance $ 301,101 $ 188,588 $ 13,864 $ 656 Currency translation adjustment (23,320) 940 (2,537) — Service cost 6,217 5,474 280 205 Interest cost 16,736 14,469 635 430 One-time charge benefit adjustment 1,650 — 71 1,655 Plan participants contributions 162 31 — — Actuarial loss (41,479) (10,917) (684) (1,278) Acquisitions — 116,455 — 12,695 Benefits paid (16,262) (13,939) (609) (499)Ending balance $ 244,805 $ 301,101 $ 11,020 $ 13,864
Plan Assets – Fair Value Beginning balance $ 289,516 $ 168,066 $ — $ — Currency translation adjustment (21,978) 182 — — Realized and unrealized gain (loss) on plan assets (71,579) 17,592 — — Acquisitions — 107,454 — — Plan participants contributions 162 31 — — Company contributions 5,621 10,413 609 499 Expenses paid (743) (283) — — Benefits paid (16,262) (13,939) (609) (499)Ending balance $ 184,737 $ 289,516 $ — $ —
Funded Status Fair value of plan assets $ 184,737 $ 289,516 $ — $ — Benefit obligations (244,805) (301,101) (11,020) (13,864)Net amount recognized $ (60,068) $ (11,585) $ (11,020) $ (13,864)
80
Defined Benefit Post-Retirement Pension Plans Benefit Plans In Thousands 2008 2007 2008 2007
Amount Recognized in the Consolidated Balance Sheet Non-current asset $ — $ 13,903 $ — $ — Current liability (714) (511) (733) (1,989) Non-current liability (59,354) (24,977) (10,287) (11,875)Net amount recognized $ (60,068) $ (11,585) $ (11,020) $ (13,864)
Amounts Recognized in Accumulated Other Comprehensive Income Net actuarial loss (gain) $ 55,081 $ 3,717 $ (1,766) $ (1,285) Prior service cost (20) 57 — —Ending balance $ 55,061 $ 3,774 $ (1,766) $ (1,285)
The accumulated benefit obligation for all pension plans was $235,102,000 at October 31, 2008 and $292,492,000 at October 26, 2007.
Estimated future benefit payments expected to be paid from the plan or from the Company’s assets are as follows: In Thousands
Fiscal Year
2009 $ 19,528 2010 20,5752011 21,5542012 22,8652013 23,5012014 – 2018 128,722
Employees may participate in certain defined contribution plans. The Company’s contribution expense under these plans totaled $12,095,000, $10,323,000 and $8,107,000 in fiscal 2008, 2007 and 2006, respectively.
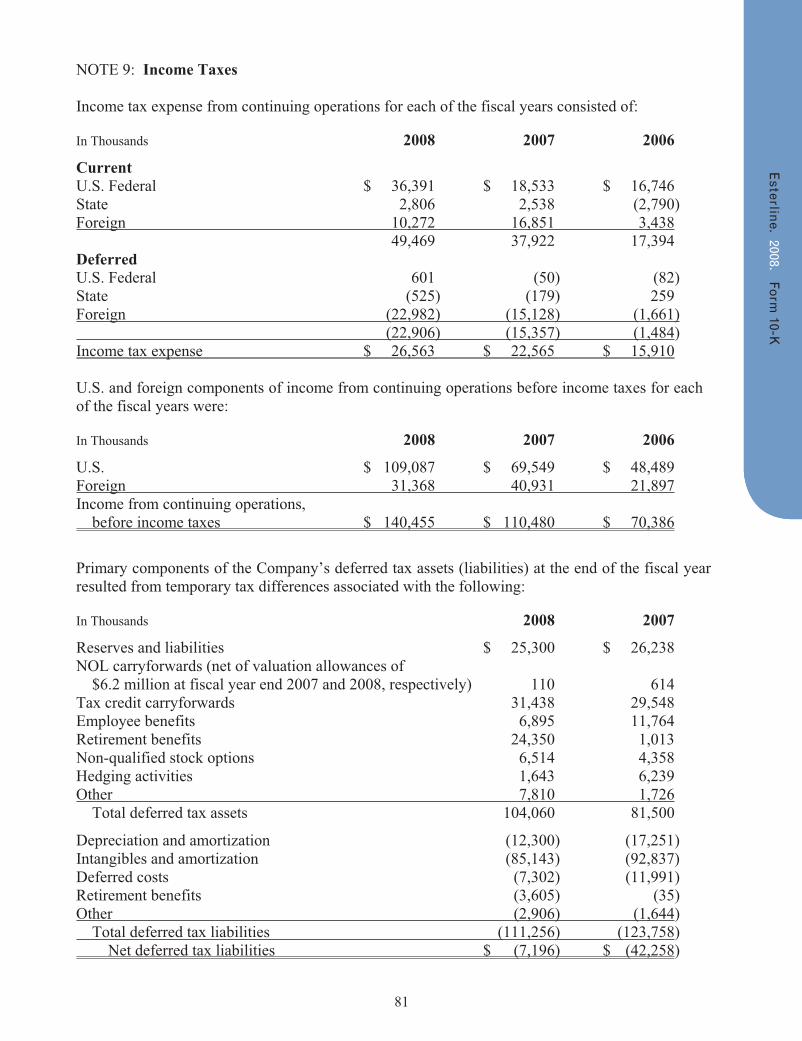
81
NOTE 9: Income Taxes
Income tax expense from continuing operations for each of the fiscal years consisted of:
In Thousands 2008 2007 2006
Current U.S. Federal $ 36,391 $ 18,533 $ 16,746 State 2,806 2,538 (2,790) Foreign 10,272 16,851 3,438 49,469 37,922 17,394 Deferred U.S. Federal 601 (50) (82) State (525) (179) 259 Foreign (22,982) (15,128) (1,661) (22,906) (15,357) (1,484)Income tax expense $ 26,563 $ 22,565 $ 15,910
U.S. and foreign components of income from continuing operations before income taxes for each of the fiscal years were:
In Thousands 2008 2007 2006
U.S. $ 109,087 $ 69,549 $ 48,489 Foreign 31,368 40,931 21,897Income from continuing operations, before income taxes $ 140,455 $ 110,480 $ 70,386
Primary components of the Company’s deferred tax assets (liabilities) at the end of the fiscal year resulted from temporary tax differences associated with the following:
In Thousands 2008 2007
Reserves and liabilities $ 25,300 $ 26,238 NOL carryforwards (net of valuation allowances of $6.2 million at fiscal year end 2007 and 2008, respectively) 110 614 Tax credit carryforwards 31,438 29,548 Employee benefits 6,895 11,764 Retirement benefits 24,350 1,013 Non-qualified stock options 6,514 4,358 Hedging activities 1,643 6,239 Other 7,810 1,726 Total deferred tax assets 104,060 81,500
Depreciation and amortization (12,300) (17,251) Intangibles and amortization (85,143) (92,837) Deferred costs (7,302) (11,991) Retirement benefits (3,605) (35) Other (2,906) (1,644) Total deferred tax liabilities (111,256) (123,758) Net deferred tax liabilities $ (7,196) $ (42,258)
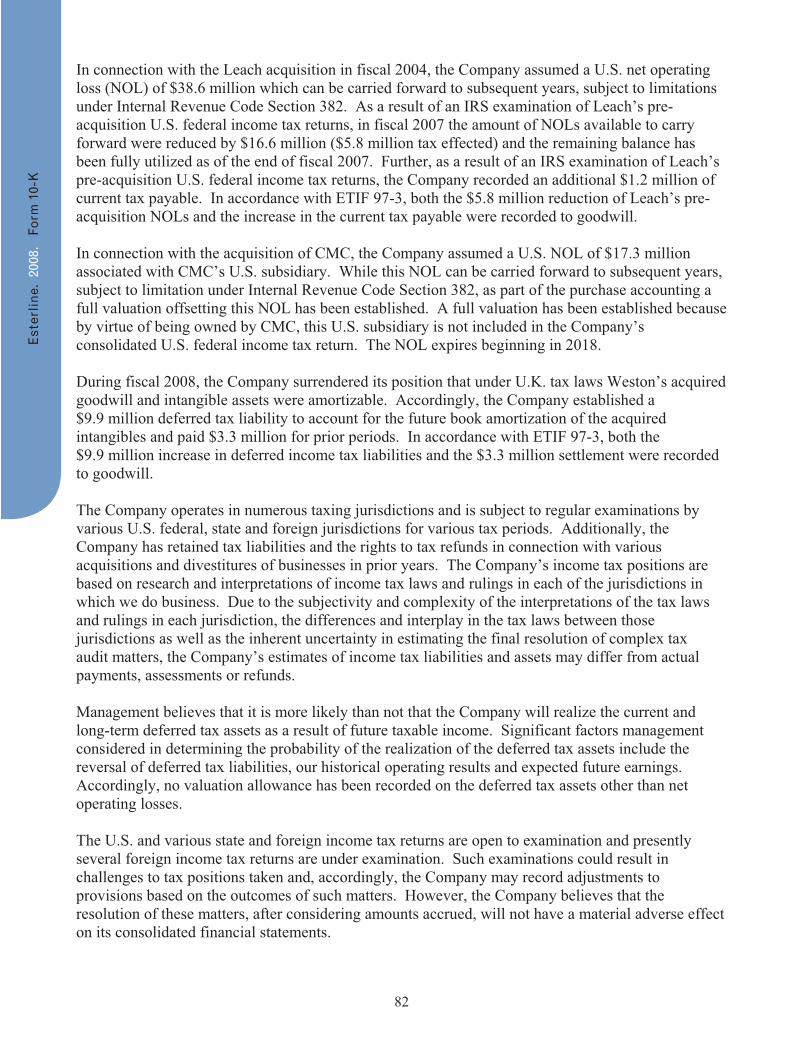
82
In connection with the Leach acquisition in fiscal 2004, the Company assumed a U.S. net operating loss (NOL) of $38.6 million which can be carried forward to subsequent years, subject to limitations under Internal Revenue Code Section 382. As a result of an IRS examination of Leach’s pre-acquisition U.S. federal income tax returns, in fiscal 2007 the amount of NOLs available to carry forward were reduced by $16.6 million ($5.8 million tax effected) and the remaining balance has been fully utilized as of the end of fiscal 2007. Further, as a result of an IRS examination of Leach’s pre-acquisition U.S. federal income tax returns, the Company recorded an additional $1.2 million of current tax payable. In accordance with ETIF 97-3, both the $5.8 million reduction of Leach’s pre-acquisition NOLs and the increase in the current tax payable were recorded to goodwill.
In connection with the acquisition of CMC, the Company assumed a U.S. NOL of $17.3 million associated with CMC’s U.S. subsidiary. While this NOL can be carried forward to subsequent years, subject to limitation under Internal Revenue Code Section 382, as part of the purchase accounting a full valuation offsetting this NOL has been established. A full valuation has been established because by virtue of being owned by CMC, this U.S. subsidiary is not included in the Company’s consolidated U.S. federal income tax return. The NOL expires beginning in 2018.
During fiscal 2008, the Company surrendered its position that under U.K. tax laws Weston’s acquired goodwill and intangible assets were amortizable. Accordingly, the Company established a $9.9 million deferred tax liability to account for the future book amortization of the acquired intangibles and paid $3.3 million for prior periods. In accordance with ETIF 97-3, both the $9.9 million increase in deferred income tax liabilities and the $3.3 million settlement were recorded to goodwill.
The Company operates in numerous taxing jurisdictions and is subject to regular examinations by various U.S. federal, state and foreign jurisdictions for various tax periods. Additionally, the Company has retained tax liabilities and the rights to tax refunds in connection with various acquisitions and divestitures of businesses in prior years. The Company’s income tax positions are based on research and interpretations of income tax laws and rulings in each of the jurisdictions in which we do business. Due to the subjectivity and complexity of the interpretations of the tax laws and rulings in each jurisdiction, the differences and interplay in the tax laws between those jurisdictions as well as the inherent uncertainty in estimating the final resolution of complex tax audit matters, the Company’s estimates of income tax liabilities and assets may differ from actual payments, assessments or refunds.
Management believes that it is more likely than not that the Company will realize the current and long-term deferred tax assets as a result of future taxable income. Significant factors management considered in determining the probability of the realization of the deferred tax assets include the reversal of deferred tax liabilities, our historical operating results and expected future earnings.Accordingly, no valuation allowance has been recorded on the deferred tax assets other than net operating losses.
The U.S. and various state and foreign income tax returns are open to examination and presently several foreign income tax returns are under examination. Such examinations could result in challenges to tax positions taken and, accordingly, the Company may record adjustments to provisions based on the outcomes of such matters. However, the Company believes that the resolution of these matters, after considering amounts accrued, will not have a material adverse effect on its consolidated financial statements.
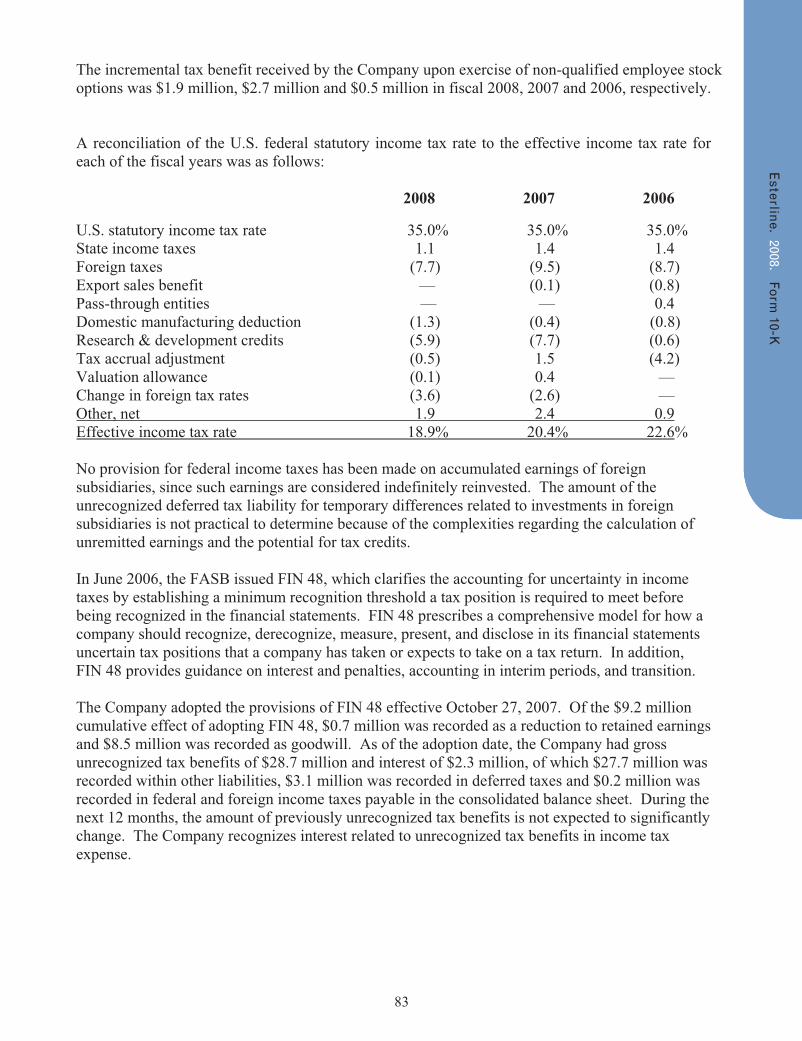
83
The incremental tax benefit received by the Company upon exercise of non-qualified employee stock options was $1.9 million, $2.7 million and $0.5 million in fiscal 2008, 2007 and 2006, respectively.
A reconciliation of the U.S. federal statutory income tax rate to the effective income tax rate for each of the fiscal years was as follows:
2008 2007 2006
U.S. statutory income tax rate 35.0% 35.0% 35.0% State income taxes 1.1 1.4 1.4 Foreign taxes (7.7) (9.5) (8.7) Export sales benefit — (0.1) (0.8) Pass-through entities — — 0.4 Domestic manufacturing deduction (1.3) (0.4) (0.8) Research & development credits (5.9) (7.7) (0.6) Tax accrual adjustment (0.5) 1.5 (4.2) Valuation allowance (0.1) 0.4 — Change in foreign tax rates (3.6) (2.6) — Other, net 1.9 2.4 0.9Effective income tax rate 18.9% 20.4% 22.6%
No provision for federal income taxes has been made on accumulated earnings of foreign subsidiaries, since such earnings are considered indefinitely reinvested. The amount of the unrecognized deferred tax liability for temporary differences related to investments in foreign subsidiaries is not practical to determine because of the complexities regarding the calculation of unremitted earnings and the potential for tax credits.
In June 2006, the FASB issued FIN 48, which clarifies the accounting for uncertainty in income taxes by establishing a minimum recognition threshold a tax position is required to meet before being recognized in the financial statements. FIN 48 prescribes a comprehensive model for how a company should recognize, derecognize, measure, present, and disclose in its financial statements uncertain tax positions that a company has taken or expects to take on a tax return. In addition, FIN 48 provides guidance on interest and penalties, accounting in interim periods, and transition.
The Company adopted the provisions of FIN 48 effective October 27, 2007. Of the $9.2 million cumulative effect of adopting FIN 48, $0.7 million was recorded as a reduction to retained earnings and $8.5 million was recorded as goodwill. As of the adoption date, the Company had gross unrecognized tax benefits of $28.7 million and interest of $2.3 million, of which $27.7 million was recorded within other liabilities, $3.1 million was recorded in deferred taxes and $0.2 million was recorded in federal and foreign income taxes payable in the consolidated balance sheet. During the next 12 months, the amount of previously unrecognized tax benefits is not expected to significantly change. The Company recognizes interest related to unrecognized tax benefits in income tax expense.
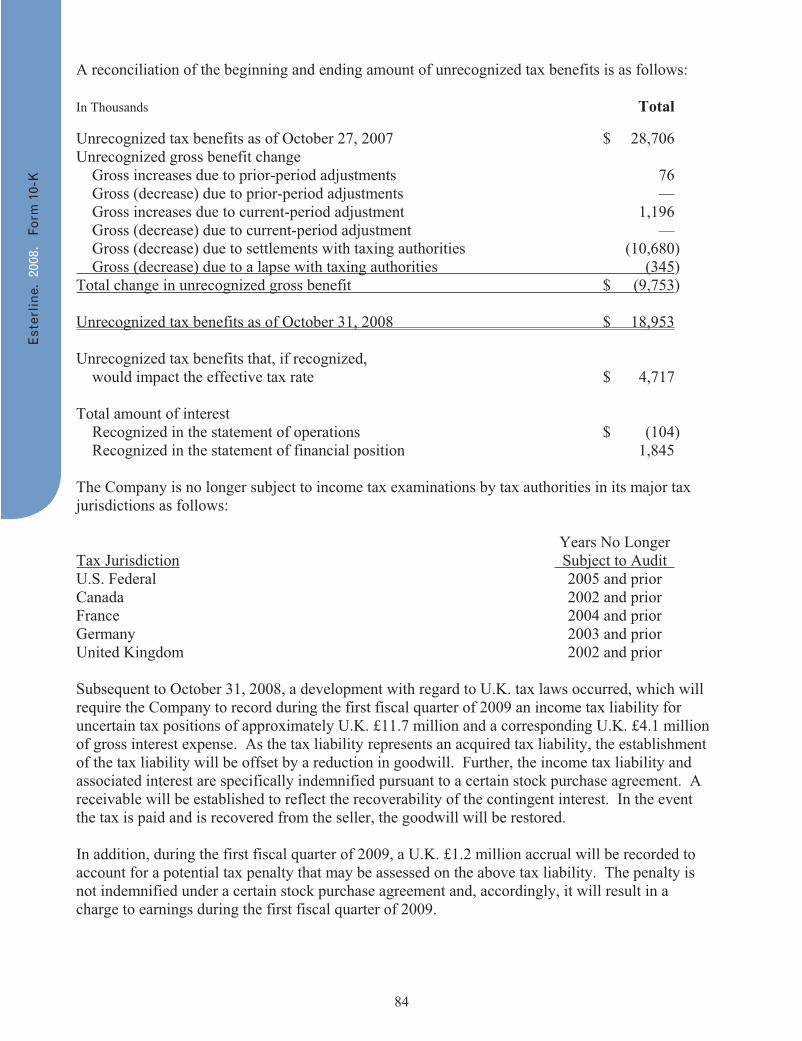
84
A reconciliation of the beginning and ending amount of unrecognized tax benefits is as follows:
In Thousands Total
Unrecognized tax benefits as of October 27, 2007 $ 28,706 Unrecognized gross benefit change Gross increases due to prior-period adjustments 76 Gross (decrease) due to prior-period adjustments — Gross increases due to current-period adjustment 1,196 Gross (decrease) due to current-period adjustment — Gross (decrease) due to settlements with taxing authorities (10,680) Gross (decrease) due to a lapse with taxing authorities (345)Total change in unrecognized gross benefit $ (9,753)
Unrecognized tax benefits as of October 31, 2008 $ 18,953
Unrecognized tax benefits that, if recognized, would impact the effective tax rate $ 4,717
Total amount of interest Recognized in the statement of operations $ (104) Recognized in the statement of financial position 1,845
The Company is no longer subject to income tax examinations by tax authorities in its major tax jurisdictions as follows:
Years No Longer Tax Jurisdiction Subject to Audit U.S. Federal 2005 and prior Canada 2002 and prior France 2004 and prior Germany 2003 and prior United Kingdom 2002 and prior
Subsequent to October 31, 2008, a development with regard to U.K. tax laws occurred, which will require the Company to record during the first fiscal quarter of 2009 an income tax liability for uncertain tax positions of approximately U.K. £11.7 million and a corresponding U.K. £4.1 million of gross interest expense. As the tax liability represents an acquired tax liability, the establishment of the tax liability will be offset by a reduction in goodwill. Further, the income tax liability and associated interest are specifically indemnified pursuant to a certain stock purchase agreement. A receivable will be established to reflect the recoverability of the contingent interest. In the event the tax is paid and is recovered from the seller, the goodwill will be restored.
In addition, during the first fiscal quarter of 2009, a U.K. £1.2 million accrual will be recorded to account for a potential tax penalty that may be assessed on the above tax liability. The penalty is not indemnified under a certain stock purchase agreement and, accordingly, it will result in a charge to earnings during the first fiscal quarter of 2009.
85
NOTE 10: Debt
Long-term debt at the end of fiscal 2008 and 2007 consisted of the following:
In Thousands 2008 2007
GBP Term Loan, due November 2010 $ 34,915 $ 112,633 7.75% Senior Subordinated Notes, due June 2013 175,000 175,000 6.625% Senior Notes, due March 2017 175,000 175,000 Obligations under Capital Leases and Other 10,160 4,283 395,075 466,916
Fair value of interest rate swap agreement 1,561 252 Less current maturities 8,388 12,166Carrying amount of long-term debt $ 388,248 $ 455,002
In June 2003, the Company sold $175.0 million of 7.75% Senior Subordinated Notes due in 2013 and requiring semi-annual interest payments in December and June of each year until maturity. The net proceeds from this offering were used to acquire the Weston Group from The Roxboro Group PLC for U.K. £55.0 million (approximately $94.6 million based on the closing exchange rate and including acquisition costs) and for general corporate purposes, including the repayment of debt and possible future acquisitions. The Senior Subordinated Notes are general unsecured obligations of the Company and are subordinated to all existing and future senior debt of the Company. In addition, the Senior Subordinated Notes are effectively subordinated to all existing and future senior debt and other liabilities (including trade payables) of the Company’s foreign subsidiaries. The Senior Subordinated Notes are guaranteed, jointly and severally, by all the existing and future domestic subsidiaries of the Company unless designated as an “unrestricted subsidiary” under the indenture covering the Senior Subordinated Notes. The Senior Subordinated Notes are subject to redemption at the option of the Company, in whole or in part, on or after June 15, 2008 at redemption prices starting at 103.875% of the principal amount plus accrued interest during the period beginning June 11, 2003 and declining annually to 100% of principal and accrued interest on June 15, 2011.
In September 2003, the Company entered into an interest rate swap agreement on $75.0 million of its Senior Subordinated Notes due in 2013. The swap agreement exchanged the fixed interest rate for a variable interest rate on $75.0 million of the $175.0 million principal amount outstanding. The variable interest rate is based upon LIBOR plus 2.56% and was 5.83% at October 31, 2008.The fair market value of the Company’s interest rate swap was a $1,561,000 asset at October 31, 2008 and was estimated by discounting expected cash flows using quoted market interest rates.
On February 10, 2006, the Company borrowed U.K. £57.0 million, or approximately $100.0 million, under a $100.0 million term loan facility. The Company used the proceeds from the loan as working capital for its U.K. operations and to repay a portion of its outstanding borrowings under the revolving credit facility. The principal amount of the loan is payable quarterly commencing on March 31, 2007 through the termination date of November 14, 2010, according to a payment schedule by which 1.25% of the principal amount is paid in each quarter of 2007, 2.50% in each quarter of 2008, 5.00% in each quarter of 2009 and 16.25% in each quarter of 2010. The loan accrues interest at a variable rate based on the British Bankers Association Interest Settlement Rate for deposits in U.K. pounds plus an additional margin amount that ranges from 1.13% to 0.50% depending upon the Company’s leverage ratio. As of October 31, 2008, the
86
interest rate on the term loan was 6.49%. During the year the Company paid down U.K. £33.2 million or $68.0 million on the U.K. £57.0 million term loan and terminated an interest rate swap for a gain of $1.9 million. The interest rate swap exchanged the variable interest rate for a fixed interest rate of 4.75% plus an additional margin amount determined by reference to the Company’s leverage ratio.
On March 1, 2007, the Company issued $175.0 million in 6.625% Senior Notes due March 1, 2017 and requiring semi-annual interest payments in March and September of each year until maturity. The net proceeds from this offering were used to pay a portion of the purchase price of the acquisition of CMC for approximately $344.5 million. The Senior Notes are general unsecured senior obligations of the Company. The Senior Notes are guaranteed, jointly and severally on a senior basis, by all the existing and future domestic subsidiaries of the Company unless designated as an “unrestricted subsidiary,” and those foreign subsidiaries that executed related subsidiary guarantees under the indenture covering the Senior Notes. The Senior Notes are subject to redemption at the option of the Company at any time prior to March 1, 2012 at a price equal to 100% of the principal amount, plus any accrued interest to the date of redemption and a make-whole provision. In addition, before March 1, 2010 the Company may redeem up to 35% of the principal amount at 106.625% plus accrued interest with proceeds of one or more Public Equity Offerings. The Senior Notes are also subject to redemption at the option of the Company, in whole or in part, on or after March 1, 2012 at redemption prices starting at 103.3125% of the principal amount plus accrued interest during the period beginning March 1, 2007 and declining annually to 100% of principal and accrued interest on or after March 1, 2015.
On March 13, 2007, the company amended its credit agreement to increase the existing revolving credit facility from $100.0 million to $200.0 million.
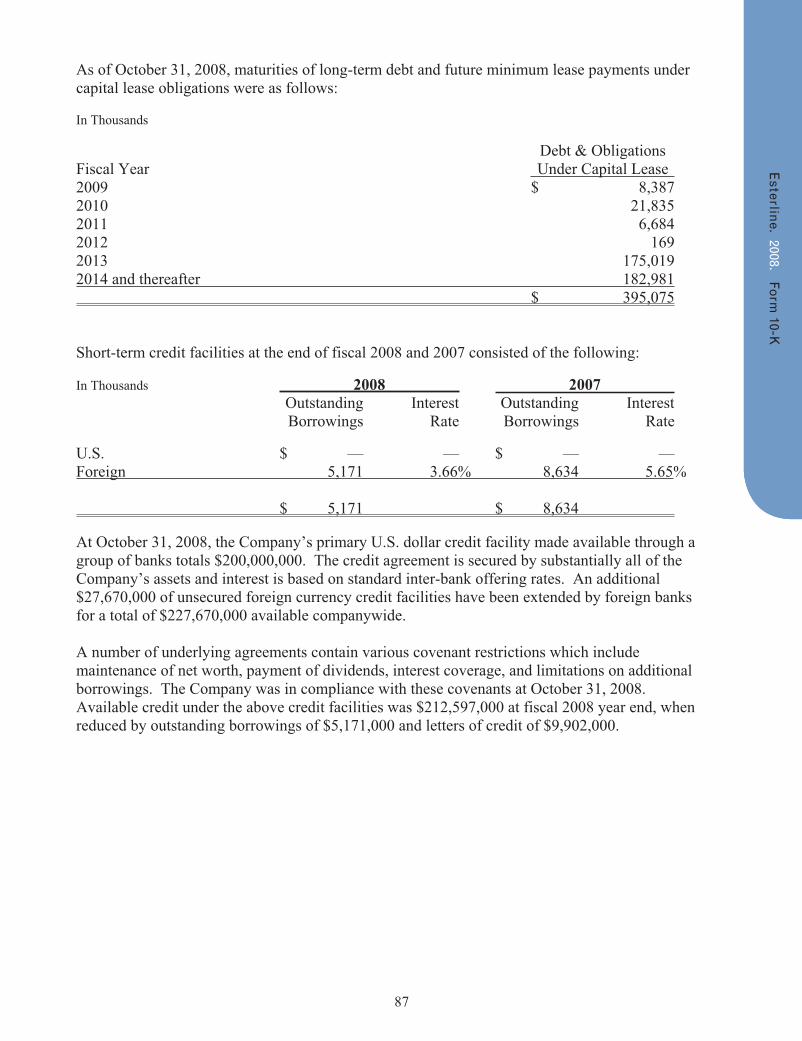
87
As of October 31, 2008, maturities of long-term debt and future minimum lease payments under capital lease obligations were as follows:
In Thousands
Debt & Obligations Fiscal Year Under Capital Lease 2009 $ 8,387 2010 21,835 2011 6,684 2012 169 2013 175,019 2014 and thereafter 182,981 $ 395,075
Short-term credit facilities at the end of fiscal 2008 and 2007 consisted of the following:
In Thousands 2008 2007 Outstanding Interest Outstanding Interest Borrowings Rate Borrowings Rate
U.S. $ — — $ — — Foreign 5,171 3.66% 8,634 5.65%
$ 5,171 $ 8,634
At October 31, 2008, the Company’s primary U.S. dollar credit facility made available through a group of banks totals $200,000,000. The credit agreement is secured by substantially all of the Company’s assets and interest is based on standard inter-bank offering rates. An additional $27,670,000 of unsecured foreign currency credit facilities have been extended by foreign banks for a total of $227,670,000 available companywide.
A number of underlying agreements contain various covenant restrictions which include maintenance of net worth, payment of dividends, interest coverage, and limitations on additional borrowings. The Company was in compliance with these covenants at October 31, 2008.Available credit under the above credit facilities was $212,597,000 at fiscal 2008 year end, when reduced by outstanding borrowings of $5,171,000 and letters of credit of $9,902,000.
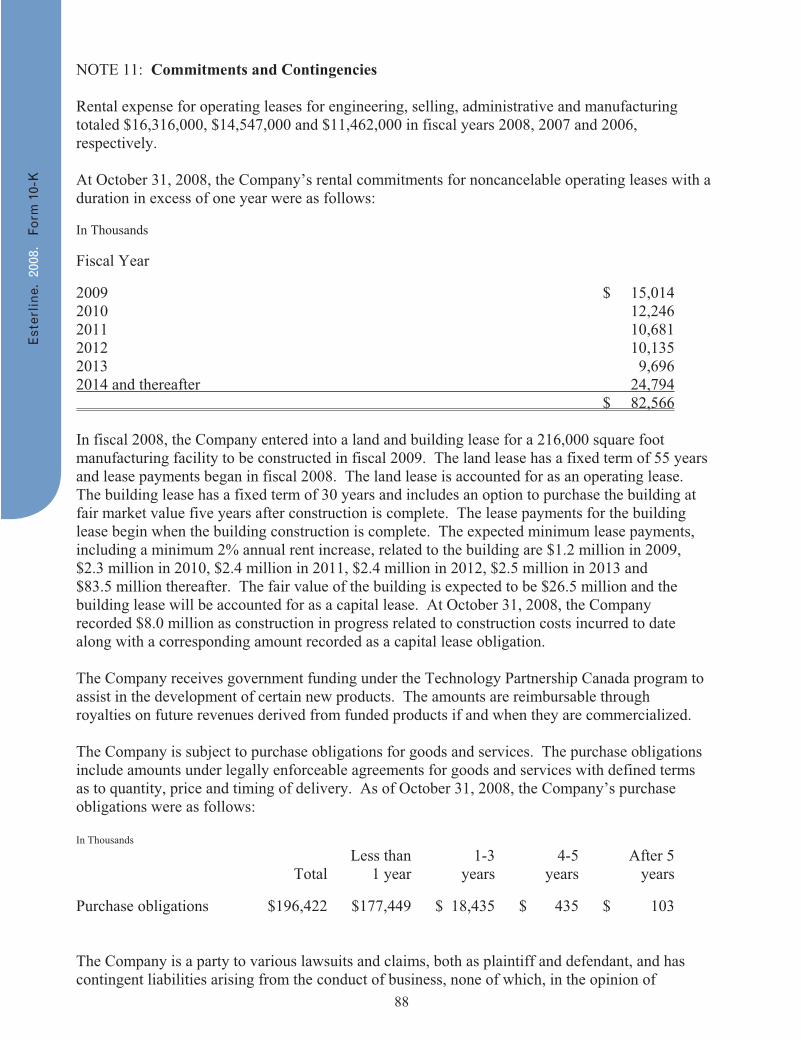
88
NOTE 11: Commitments and Contingencies
Rental expense for operating leases for engineering, selling, administrative and manufacturing totaled $16,316,000, $14,547,000 and $11,462,000 in fiscal years 2008, 2007 and 2006, respectively.
At October 31, 2008, the Company’s rental commitments for noncancelable operating leases with a duration in excess of one year were as follows:
In Thousands
Fiscal Year
2009 $ 15,014 2010 12,2462011 10,6812012 10,1352013 9,6962014 and thereafter 24,794 $ 82,566
In fiscal 2008, the Company entered into a land and building lease for a 216,000 square foot manufacturing facility to be constructed in fiscal 2009. The land lease has a fixed term of 55 years and lease payments began in fiscal 2008. The land lease is accounted for as an operating lease.The building lease has a fixed term of 30 years and includes an option to purchase the building at fair market value five years after construction is complete. The lease payments for the building lease begin when the building construction is complete. The expected minimum lease payments, including a minimum 2% annual rent increase, related to the building are $1.2 million in 2009, $2.3 million in 2010, $2.4 million in 2011, $2.4 million in 2012, $2.5 million in 2013 and $83.5 million thereafter. The fair value of the building is expected to be $26.5 million and the building lease will be accounted for as a capital lease. At October 31, 2008, the Company recorded $8.0 million as construction in progress related to construction costs incurred to date along with a corresponding amount recorded as a capital lease obligation.
The Company receives government funding under the Technology Partnership Canada program to assist in the development of certain new products. The amounts are reimbursable through royalties on future revenues derived from funded products if and when they are commercialized.
The Company is subject to purchase obligations for goods and services. The purchase obligations include amounts under legally enforceable agreements for goods and services with defined terms as to quantity, price and timing of delivery. As of October 31, 2008, the Company’s purchase obligations were as follows:
In Thousands Less than 1-3 4-5 After 5 Total 1 year years years years
Purchase obligations $196,422 $177,449 $ 18,435 $ 435 $ 103
The Company is a party to various lawsuits and claims, both as plaintiff and defendant, and has contingent liabilities arising from the conduct of business, none of which, in the opinion of

89
management, is expected to have a material effect on the Company’s financial position or results of operations. The Company believes that it has made appropriate and adequate provisions for contingent liabilities.
Approximately 820 U.S.-based employees or 17% of total U.S.-based employees were represented by various labor unions. In April 2008, a collective bargaining agreement covering about 130 employees expired and a successor agreement was reached with the labor union. A second agreement covering about 150 employees expired in August 2008 and a successor agreement covering 100 employees was reached. Management believes that the Company has established a good relationship with these employees and their union. The Company’s European operations are subject to national trade union agreements and to local regulations governing employment.
NOTE 12: Employee Stock Plans
The Company has two share-based compensation plans, which are described below. The compensation cost that has been charged against income for those plans for fiscal 2008 and 2007 was $8.7 million and $6.9 million, respectively. The total income tax benefit recognized in the income statement for the share-based compensation arrangement for fiscal 2008 and 2007 was $2.6 million and $2.0 million, respectively.
In March 2002, the Company’s shareholders approved the establishment of an Employee Stock Purchase Plan (ESPP) under which 300,000 shares of the Company’s common stock are reserved for issuance to employees. On March 5, 2008, the Company’s shareholders authorized an additional 250,000 shares of the Company’s stock under the ESPP. The plan qualifies as a noncompensatory employee stock purchase plan under Section 423 of the Internal Revenue Code.Employees are eligible to participate through payroll deductions subject to certain limitations.
At the end of each offering period, usually six months, shares are purchased by the participants at 85% of the lower of the fair market value on the first day of the offering period or the purchase date. During fiscal 2008, employees purchased 77,881 shares at a fair market value price of $49.54 per share, leaving a balance of 295,010 shares available for issuance in the future. As of October 31, 2008, deductions aggregating $1,312,167 were accrued for the purchase of shares on December 15, 2008. The Company converted the ESPP to a “safe harbor” design on December 16, 2008. Under the safe harbor design, shares are purchased by participants at 95% of the fair market value on the purchase date.
The fair value of the awards under the employee stock purchase plan was estimated using a Black-Scholes pricing model which uses the assumptions noted in the following table. The Company uses historical data to estimate volatility of the Company’s common stock. The risk-free rate for the contractual life of the option is based on the U.S. Treasury zero coupon issues in effect the time of grant. 2008 2007 2006
Volatility 21.4 – 34.8% 21.4 – 39.9% 30.0 – 30.7% Risk-free interest rate 3.32 – 5.15% 5.15% 3.20 – 5.15% Expected life (months) 6 6 6 Dividends
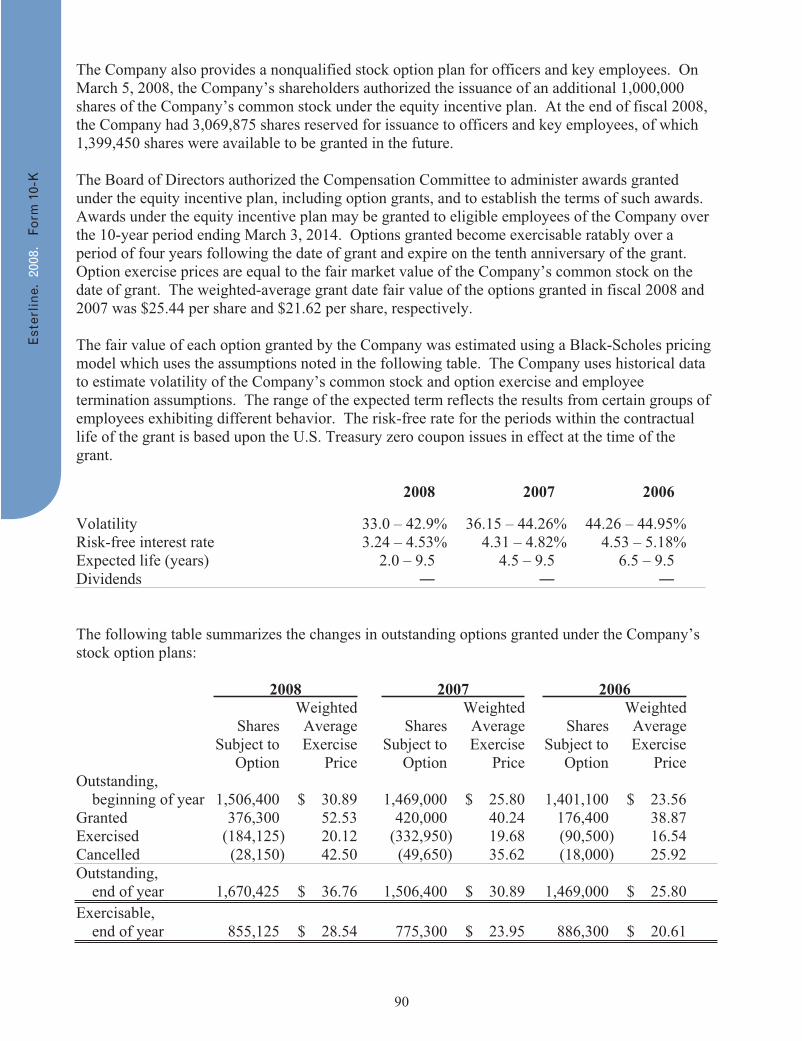
90
The Company also provides a nonqualified stock option plan for officers and key employees. On March 5, 2008, the Company’s shareholders authorized the issuance of an additional 1,000,000 shares of the Company’s common stock under the equity incentive plan. At the end of fiscal 2008, the Company had 3,069,875 shares reserved for issuance to officers and key employees, of which 1,399,450 shares were available to be granted in the future.
The Board of Directors authorized the Compensation Committee to administer awards granted under the equity incentive plan, including option grants, and to establish the terms of such awards.Awards under the equity incentive plan may be granted to eligible employees of the Company over the 10-year period ending March 3, 2014. Options granted become exercisable ratably over a period of four years following the date of grant and expire on the tenth anniversary of the grant.Option exercise prices are equal to the fair market value of the Company’s common stock on the date of grant. The weighted-average grant date fair value of the options granted in fiscal 2008 and 2007 was $25.44 per share and $21.62 per share, respectively.
The fair value of each option granted by the Company was estimated using a Black-Scholes pricing model which uses the assumptions noted in the following table. The Company uses historical data to estimate volatility of the Company’s common stock and option exercise and employee termination assumptions. The range of the expected term reflects the results from certain groups of employees exhibiting different behavior. The risk-free rate for the periods within the contractual life of the grant is based upon the U.S. Treasury zero coupon issues in effect at the time of the grant.
2008 2007 2006
Volatility 33.0 – 42.9% 36.15 – 44.26% 44.26 – 44.95% Risk-free interest rate 3.24 – 4.53% 4.31 – 4.82% 4.53 – 5.18% Expected life (years) 2.0 – 9.5 4.5 – 9.5 6.5 – 9.5 Dividends
The following table summarizes the changes in outstanding options granted under the Company’s stock option plans:
2008 2007 2006 Weighted Weighted Weighted Shares Average Shares Average Shares Average Subject to Exercise Subject to Exercise Subject to Exercise Option Price Option Price Option Price Outstanding, beginning of year 1,506,400 $ 30.89 1,469,000 $ 25.80 1,401,100 $ 23.56 Granted 376,300 52.53 420,000 40.24 176,400 38.87 Exercised (184,125) 20.12 (332,950) 19.68 (90,500) 16.54 Cancelled (28,150) 42.50 (49,650) 35.62 (18,000) 25.92 Outstanding, end of year 1,670,425 $ 36.76 1,506,400 $ 30.89 1,469,000 $ 25.80 Exercisable, end of year 855,125 $ 28.54 775,300 $ 23.95 886,300 $ 20.61
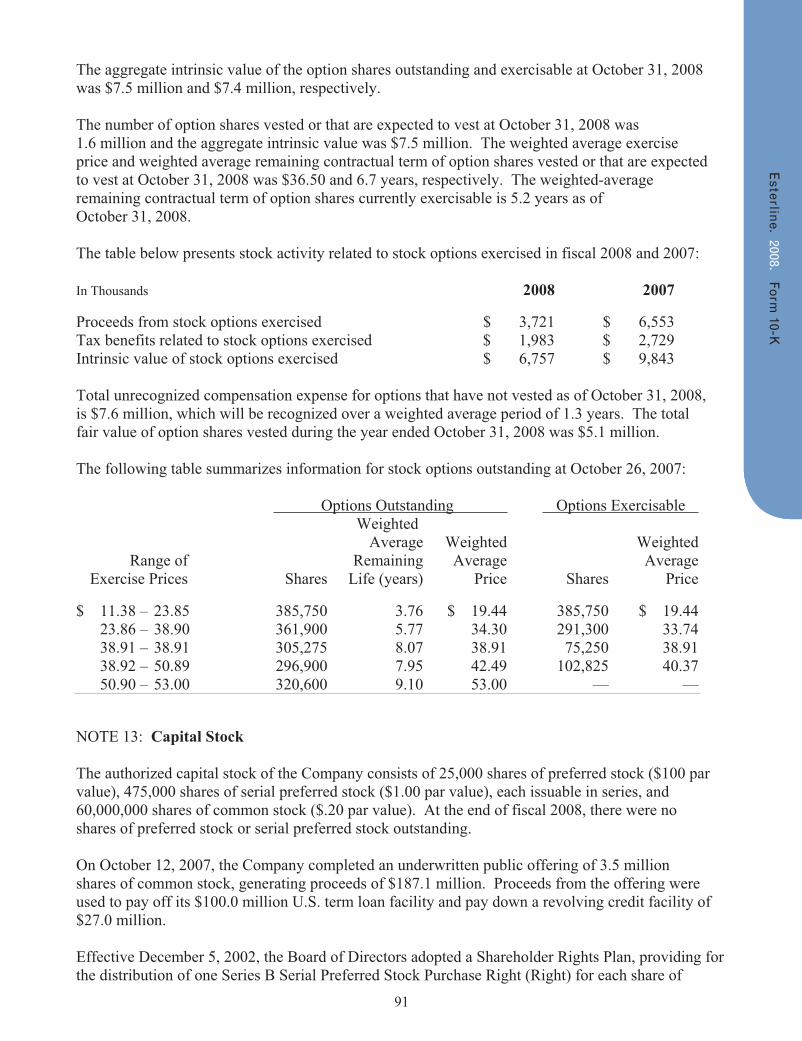
91
The aggregate intrinsic value of the option shares outstanding and exercisable at October 31, 2008 was $7.5 million and $7.4 million, respectively.
The number of option shares vested or that are expected to vest at October 31, 2008 was 1.6 million and the aggregate intrinsic value was $7.5 million. The weighted average exercise price and weighted average remaining contractual term of option shares vested or that are expected to vest at October 31, 2008 was $36.50 and 6.7 years, respectively. The weighted-average remaining contractual term of option shares currently exercisable is 5.2 years as of October 31, 2008.
The table below presents stock activity related to stock options exercised in fiscal 2008 and 2007:
In Thousands 2008 2007
Proceeds from stock options exercised $ 3,721 $ 6,553 Tax benefits related to stock options exercised $ 1,983 $ 2,729 Intrinsic value of stock options exercised $ 6,757 $ 9,843
Total unrecognized compensation expense for options that have not vested as of October 31, 2008, is $7.6 million, which will be recognized over a weighted average period of 1.3 years. The total fair value of option shares vested during the year ended October 31, 2008 was $5.1 million.
The following table summarizes information for stock options outstanding at October 26, 2007:
Options Outstanding Options Exercisable Weighted Average Weighted Weighted Range of Remaining Average Average Exercise Prices Shares Life (years) Price Shares Price
$ 11.38 – 23.85 385,750 3.76 $ 19.44 385,750 $ 19.44 23.86 – 38.90 361,900 5.77 34.30 291,300 33.74 38.91 – 38.91 305,275 8.07 38.91 75,250 38.91 38.92 – 50.89 296,900 7.95 42.49 102,825 40.37 50.90 – 53.00 320,600 9.10 53.00 — — NOTE 13: Capital Stock
The authorized capital stock of the Company consists of 25,000 shares of preferred stock ($100 par value), 475,000 shares of serial preferred stock ($1.00 par value), each issuable in series, and 60,000,000 shares of common stock ($.20 par value). At the end of fiscal 2008, there were no shares of preferred stock or serial preferred stock outstanding.
On October 12, 2007, the Company completed an underwritten public offering of 3.5 million shares of common stock, generating proceeds of $187.1 million. Proceeds from the offering were used to pay off its $100.0 million U.S. term loan facility and pay down a revolving credit facility of $27.0 million.
Effective December 5, 2002, the Board of Directors adopted a Shareholder Rights Plan, providing for the distribution of one Series B Serial Preferred Stock Purchase Right (Right) for each share of
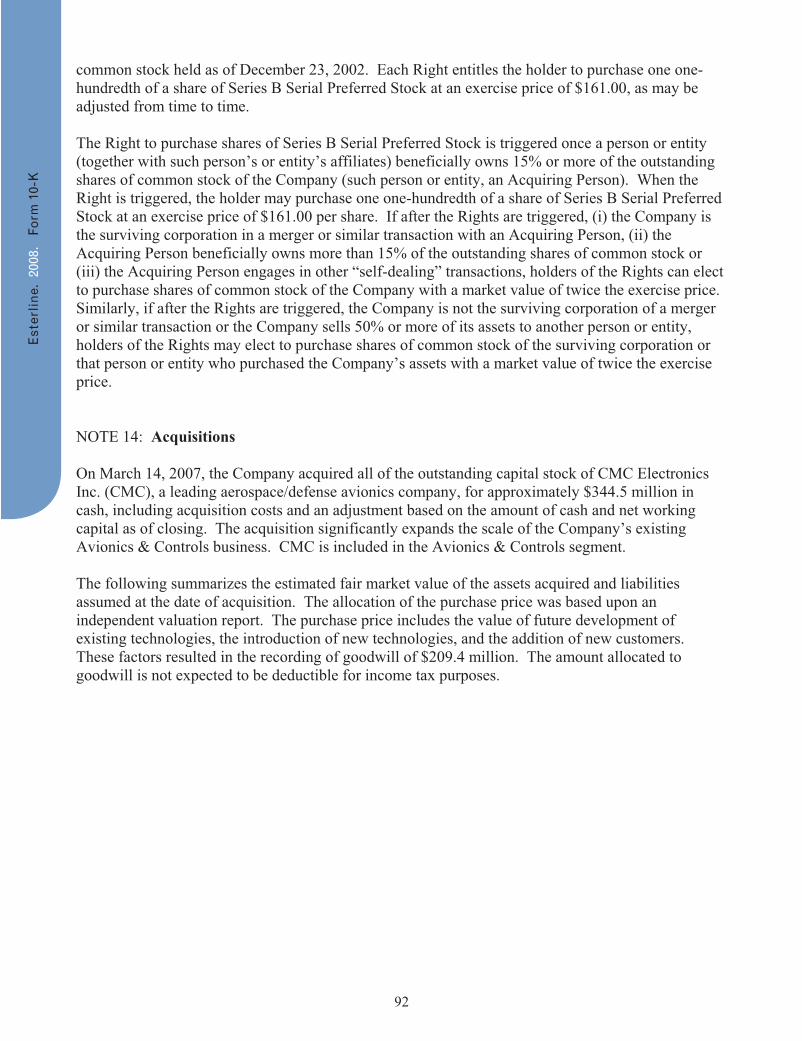
92
common stock held as of December 23, 2002. Each Right entitles the holder to purchase one one-hundredth of a share of Series B Serial Preferred Stock at an exercise price of $161.00, as may be adjusted from time to time.
The Right to purchase shares of Series B Serial Preferred Stock is triggered once a person or entity (together with such person’s or entity’s affiliates) beneficially owns 15% or more of the outstanding shares of common stock of the Company (such person or entity, an Acquiring Person). When the Right is triggered, the holder may purchase one one-hundredth of a share of Series B Serial Preferred Stock at an exercise price of $161.00 per share. If after the Rights are triggered, (i) the Company is the surviving corporation in a merger or similar transaction with an Acquiring Person, (ii) the Acquiring Person beneficially owns more than 15% of the outstanding shares of common stock or (iii) the Acquiring Person engages in other “self-dealing” transactions, holders of the Rights can elect to purchase shares of common stock of the Company with a market value of twice the exercise price. Similarly, if after the Rights are triggered, the Company is not the surviving corporation of a merger or similar transaction or the Company sells 50% or more of its assets to another person or entity, holders of the Rights may elect to purchase shares of common stock of the surviving corporation or that person or entity who purchased the Company’s assets with a market value of twice the exercise price.
NOTE 14: Acquisitions
On March 14, 2007, the Company acquired all of the outstanding capital stock of CMC Electronics Inc. (CMC), a leading aerospace/defense avionics company, for approximately $344.5 million in cash, including acquisition costs and an adjustment based on the amount of cash and net working capital as of closing. The acquisition significantly expands the scale of the Company’s existing Avionics & Controls business. CMC is included in the Avionics & Controls segment.
The following summarizes the estimated fair market value of the assets acquired and liabilities assumed at the date of acquisition. The allocation of the purchase price was based upon an independent valuation report. The purchase price includes the value of future development of existing technologies, the introduction of new technologies, and the addition of new customers. These factors resulted in the recording of goodwill of $209.4 million. The amount allocated to goodwill is not expected to be deductible for income tax purposes.
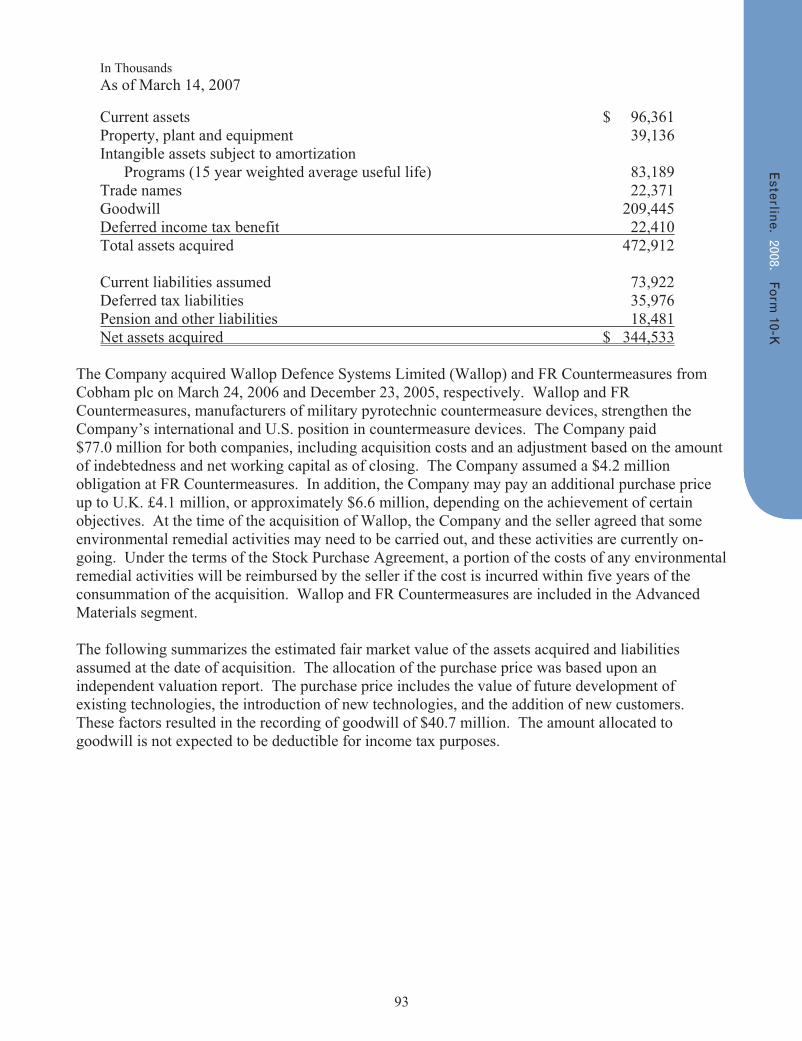
93
In Thousands As of March 14, 2007
Current assets $ 96,361 Property, plant and equipment 39,136 Intangible assets subject to amortization Programs (15 year weighted average useful life) 83,189 Trade names 22,371 Goodwill 209,445 Deferred income tax benefit 22,410Total assets acquired 472,912
Current liabilities assumed 73,922 Deferred tax liabilities 35,976 Pension and other liabilities 18,481Net assets acquired $ 344,533
The Company acquired Wallop Defence Systems Limited (Wallop) and FR Countermeasures from Cobham plc on March 24, 2006 and December 23, 2005, respectively. Wallop and FR Countermeasures, manufacturers of military pyrotechnic countermeasure devices, strengthen the Company’s international and U.S. position in countermeasure devices. The Company paid $77.0 million for both companies, including acquisition costs and an adjustment based on the amount of indebtedness and net working capital as of closing. The Company assumed a $4.2 million obligation at FR Countermeasures. In addition, the Company may pay an additional purchase price up to U.K. £4.1 million, or approximately $6.6 million, depending on the achievement of certain objectives. At the time of the acquisition of Wallop, the Company and the seller agreed that some environmental remedial activities may need to be carried out, and these activities are currently on-going. Under the terms of the Stock Purchase Agreement, a portion of the costs of any environmental remedial activities will be reimbursed by the seller if the cost is incurred within five years of the consummation of the acquisition. Wallop and FR Countermeasures are included in the Advanced Materials segment.
The following summarizes the estimated fair market value of the assets acquired and liabilities assumed at the date of acquisition. The allocation of the purchase price was based upon an independent valuation report. The purchase price includes the value of future development of existing technologies, the introduction of new technologies, and the addition of new customers. These factors resulted in the recording of goodwill of $40.7 million. The amount allocated to goodwill is not expected to be deductible for income tax purposes.
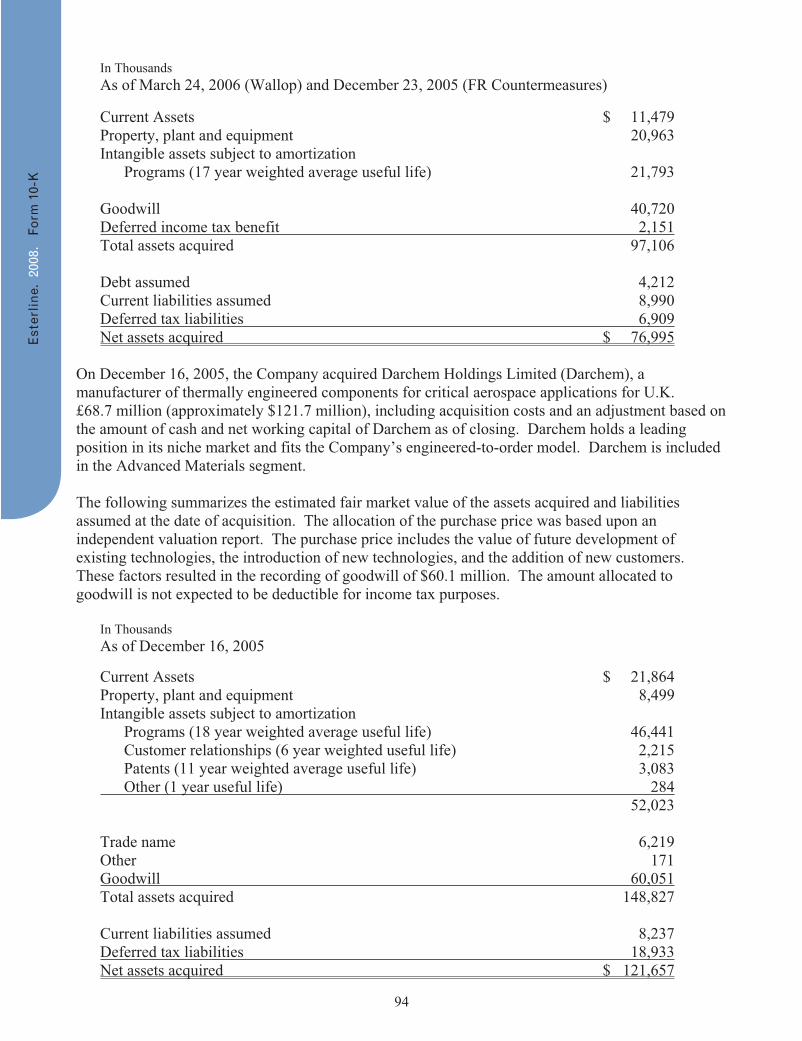
94
In Thousands As of March 24, 2006 (Wallop) and December 23, 2005 (FR Countermeasures)
Current Assets $ 11,479 Property, plant and equipment 20,963 Intangible assets subject to amortization
Programs (17 year weighted average useful life) 21,793
Goodwill 40,720 Deferred income tax benefit 2,151Total assets acquired 97,106
Debt assumed 4,212 Current liabilities assumed 8,990 Deferred tax liabilities 6,909Net assets acquired $ 76,995
On December 16, 2005, the Company acquired Darchem Holdings Limited (Darchem), a manufacturer of thermally engineered components for critical aerospace applications for U.K. £68.7 million (approximately $121.7 million), including acquisition costs and an adjustment based on the amount of cash and net working capital of Darchem as of closing. Darchem holds a leading position in its niche market and fits the Company’s engineered-to-order model. Darchem is included in the Advanced Materials segment.
The following summarizes the estimated fair market value of the assets acquired and liabilities assumed at the date of acquisition. The allocation of the purchase price was based upon an independent valuation report. The purchase price includes the value of future development of existing technologies, the introduction of new technologies, and the addition of new customers. These factors resulted in the recording of goodwill of $60.1 million. The amount allocated to goodwill is not expected to be deductible for income tax purposes.
In Thousands As of December 16, 2005
Current Assets $ 21,864 Property, plant and equipment 8,499 Intangible assets subject to amortization
Programs (18 year weighted average useful life) 46,441 Customer relationships (6 year weighted useful life) 2,215 Patents (11 year weighted average useful life) 3,083
Other (1 year useful life) 28452,023
Trade name 6,219 Other 171 Goodwill 60,051Total assets acquired 148,827
Current liabilities assumed 8,237 Deferred tax liabilities 18,933Net assets acquired $ 121,657

95
The above acquisitions were accounted for under the purchase method of accounting and the results of operations were included from the effective date of each acquisition.
On December 15, 2008, the Company acquired NMC Group, Inc. for approximately $90.0 million in cash. NMC designs and manufactures specialized light-weight fasteners principally for commercial aviation applications. NMC will be included in our Advanced Materials segment.
NOTE 15: Business Segment Information
The Company’s businesses are organized and managed in three reporting segments: Avionics & Controls, Sensors & Systems and Advanced Materials. Operating segments within each reporting segment are aggregated. Operations within the Avionics & Controls segment focus on integrated cockpit systems, technology interface systems for commercial and military aircraft, and similar devices for land- and sea-based military vehicles, secure communications systems, specialized medical equipment and other industrial applications. Sensors & Systems includes operations that produce high-precision temperature and pressure sensors, electrical power switching and other related systems principally for aerospace and defense customers. The Advanced Materials segment focuses on thermally engineered components for critical aerospace applications, high-performance elastomer products used in a wide range of commercial aerospace and military applications, and combustible ordnance and electronic warfare countermeasure devices. All segments include sales to domestic, international, defense and commercial customers.
Geographic sales information is based on product origin. The Company evaluates these segments based on segment profits prior to net interest, other income/expense, corporate expenses and federal/foreign income taxes.
Details of the Company’s operations by business segment for the last three fiscal years were as follows:
In Thousands 2008 2007 2006
Sales Avionics & Controls $ 611,467 $ 461,990 $ 286,936 Sensors & Systems 384,180 316,485 277,504 Advanced Materials 487,525 428,558 356,007 $ 1,483,172 $ 1,207,033 $ 920,447
Income From Continuing Operations Avionics & Controls $ 77,892 $ 47,821 $ 45,354 Sensors & Systems 43,439 32,385 26,256 Advanced Materials 78,633 97,295 46,493 Segment Earnings 199,964 177,501 118,103
Corporate expense (35,725) (33,691) (27,338) Other income (expense) (86) (24) 490 Gain on derivative financial instrument 1,850 — — Loss on extinguishment of debt — (1,100) (2,156) Interest income 4,374 3,093 2,575 Interest expense (29,922) (35,299) (21,288) $ 140,455 $ 110,480 $ 70,386
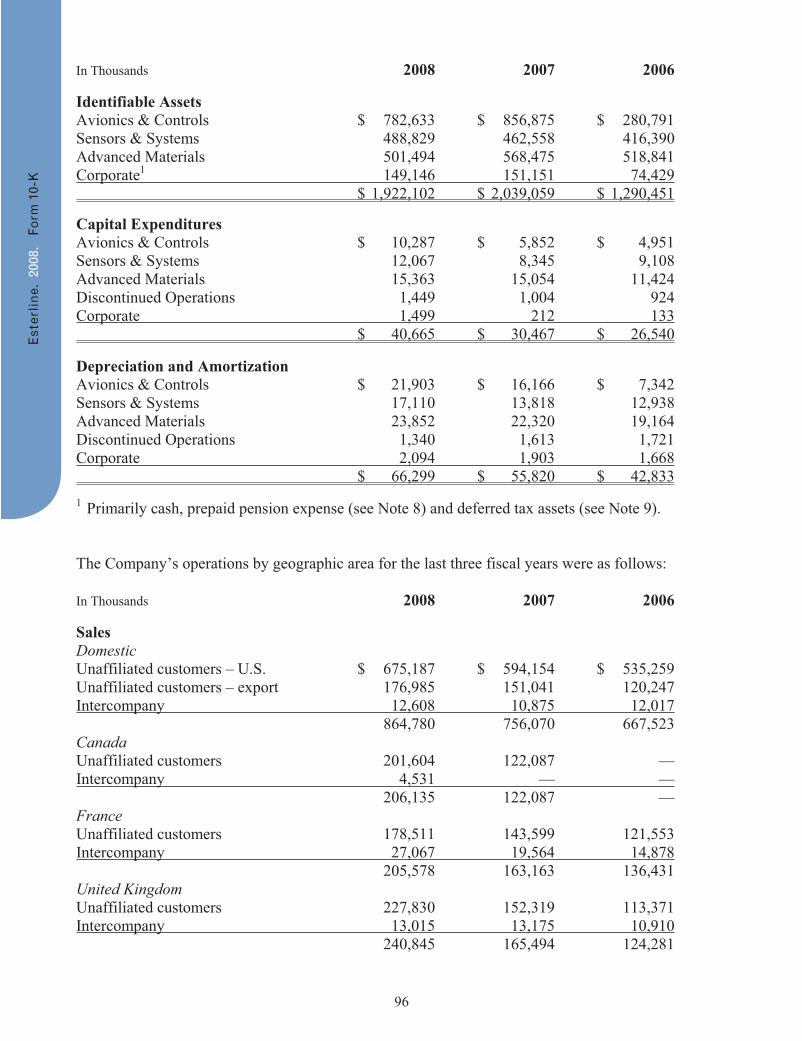
96
In Thousands 2008 2007 2006
Identifiable Assets Avionics & Controls $ 782,633 $ 856,875 $ 280,791 Sensors & Systems 488,829 462,558 416,390 Advanced Materials 501,494 568,475 518,841 Corporate1 149,146 151,151 74,429 $ 1,922,102 $ 2,039,059 $ 1,290,451 Capital Expenditures Avionics & Controls $ 10,287 $ 5,852 $ 4,951 Sensors & Systems 12,067 8,345 9,108 Advanced Materials 15,363 15,054 11,424 Discontinued Operations 1,449 1,004 924 Corporate 1,499 212 133 $ 40,665 $ 30,467 $ 26,540 Depreciation and Amortization Avionics & Controls $ 21,903 $ 16,166 $ 7,342 Sensors & Systems 17,110 13,818 12,938 Advanced Materials 23,852 22,320 19,164 Discontinued Operations 1,340 1,613 1,721 Corporate 2,094 1,903 1,668 $ 66,299 $ 55,820 $ 42,833 1 Primarily cash, prepaid pension expense (see Note 8) and deferred tax assets (see Note 9). The Company’s operations by geographic area for the last three fiscal years were as follows: In Thousands 2008 2007 2006 Sales Domestic Unaffiliated customers – U.S. $ 675,187 $ 594,154 $ 535,259 Unaffiliated customers – export 176,985 151,041 120,247 Intercompany 12,608 10,875 12,017 864,780 756,070 667,523 Canada Unaffiliated customers 201,604 122,087 — Intercompany 4,531 — — 206,135 122,087 — France Unaffiliated customers 178,511 143,599 121,553 Intercompany 27,067 19,564 14,878 205,578 163,163 136,431 United Kingdom Unaffiliated customers 227,830 152,319 113,371 Intercompany 13,015 13,175 10,910 240,845 165,494 124,281
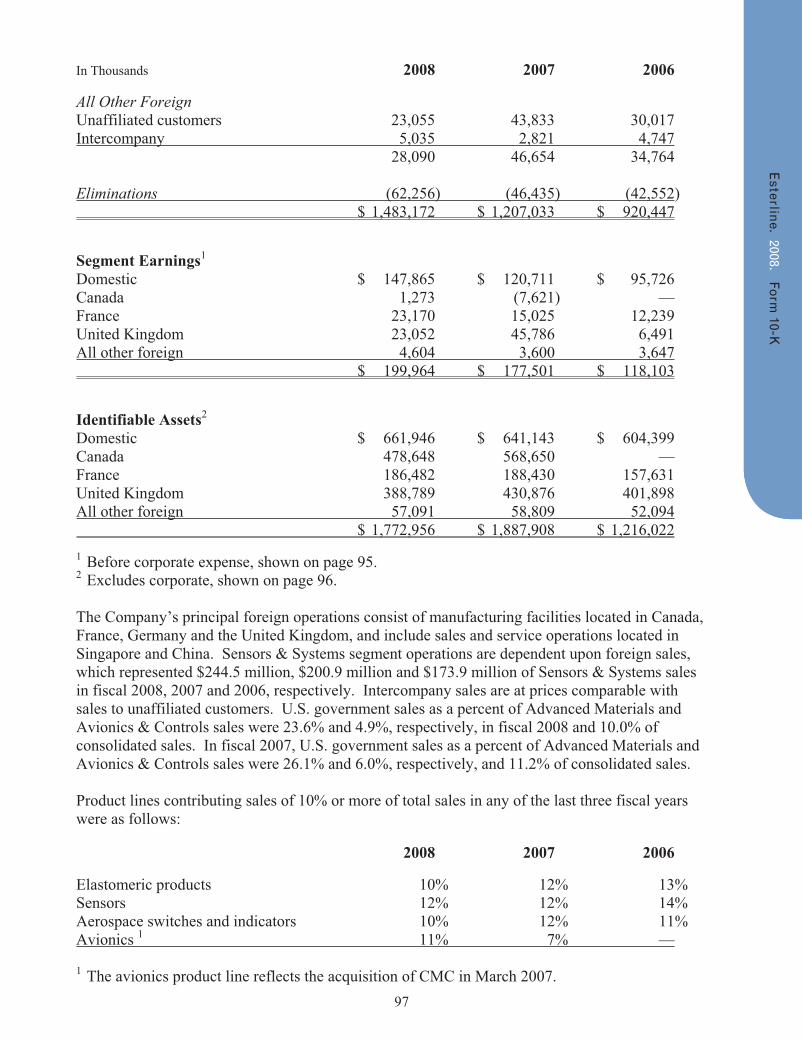
97
In Thousands 2008 2007 2006 All Other Foreign Unaffiliated customers 23,055 43,833 30,017 Intercompany 5,035 2,821 4,747 28,090 46,654 34,764 Eliminations (62,256) (46,435) (42,552) $ 1,483,172 $ 1,207,033 $ 920,447 Segment Earnings1 Domestic $ 147,865 $ 120,711 $ 95,726 Canada 1,273 (7,621) — France 23,170 15,025 12,239 United Kingdom 23,052 45,786 6,491 All other foreign 4,604 3,600 3,647 $ 199,964 $ 177,501 $ 118,103 Identifiable Assets2 Domestic $ 661,946 $ 641,143 $ 604,399 Canada 478,648 568,650 — France 186,482 188,430 157,631 United Kingdom 388,789 430,876 401,898 All other foreign 57,091 58,809 52,094 $ 1,772,956 $ 1,887,908 $ 1,216,022 1 Before corporate expense, shown on page 95. 2 Excludes corporate, shown on page 96. The Company’s principal foreign operations consist of manufacturing facilities located in Canada, France, Germany and the United Kingdom, and include sales and service operations located in Singapore and China. Sensors & Systems segment operations are dependent upon foreign sales, which represented $244.5 million, $200.9 million and $173.9 million of Sensors & Systems sales in fiscal 2008, 2007 and 2006, respectively. Intercompany sales are at prices comparable with sales to unaffiliated customers. U.S. government sales as a percent of Advanced Materials and Avionics & Controls sales were 23.6% and 4.9%, respectively, in fiscal 2008 and 10.0% of consolidated sales. In fiscal 2007, U.S. government sales as a percent of Advanced Materials and Avionics & Controls sales were 26.1% and 6.0%, respectively, and 11.2% of consolidated sales. Product lines contributing sales of 10% or more of total sales in any of the last three fiscal years were as follows: 2008 2007 2006 Elastomeric products 10% 12% 13% Sensors 12% 12% 14% Aerospace switches and indicators 10% 12% 11% Avionics 1 11% 7% — 1 The avionics product line reflects the acquisition of CMC in March 2007.
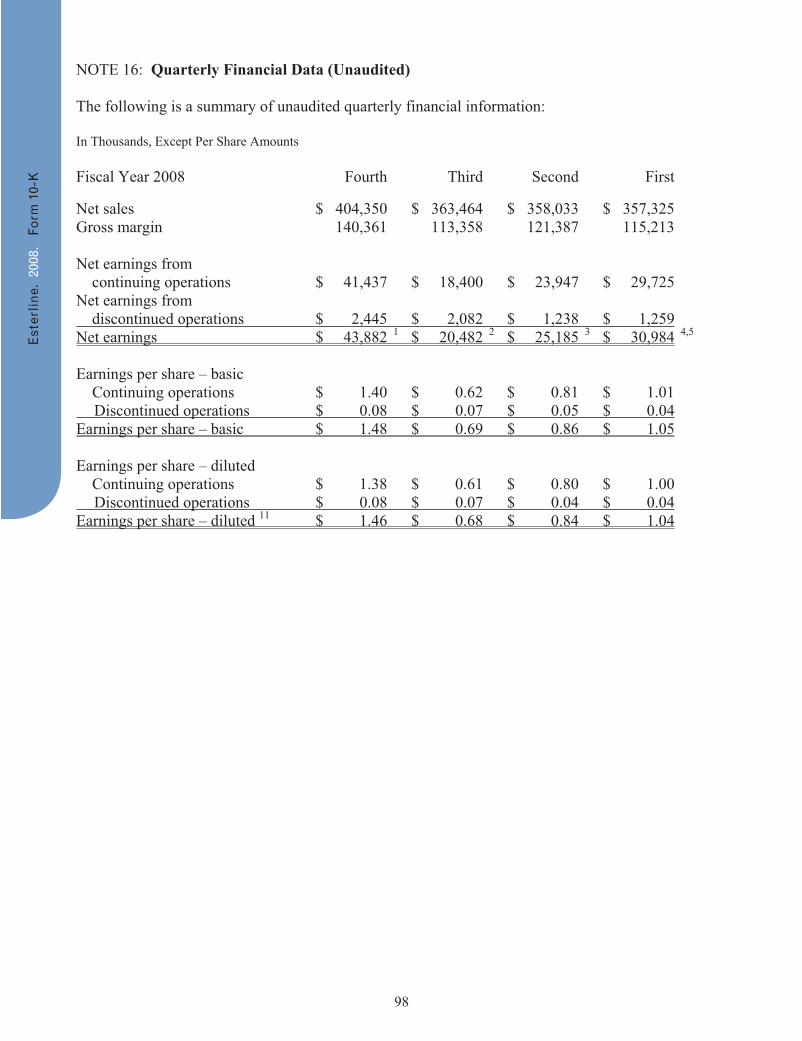
98
NOTE 16: Quarterly Financial Data (Unaudited)
The following is a summary of unaudited quarterly financial information:
In Thousands, Except Per Share Amounts
Fiscal Year 2008 Fourth Third Second First
Net sales $ 404,350 $ 363,464 $ 358,033 $ 357,325 Gross margin 140,361 113,358 121,387 115,213
Net earnings from continuing operations $ 41,437 $ 18,400 $ 23,947 $ 29,725 Net earnings from discontinued operations $ 2,445 $ 2,082 $ 1,238 $ 1,259Net earnings $ 43,882 1 $ 20,482 2 $ 25,185 3 $ 30,984 4,5
Earnings per share – basic Continuing operations $ 1.40 $ 0.62 $ 0.81 $ 1.01 Discontinued operations $ 0.08 $ 0.07 $ 0.05 $ 0.04Earnings per share – basic $ 1.48 $ 0.69 $ 0.86 $ 1.05
Earnings per share – diluted Continuing operations $ 1.38 $ 0.61 $ 0.80 $ 1.00 Discontinued operations $ 0.08 $ 0.07 $ 0.04 $ 0.04Earnings per share – diluted 11 $ 1.46 $ 0.68 $ 0.84 $ 1.04
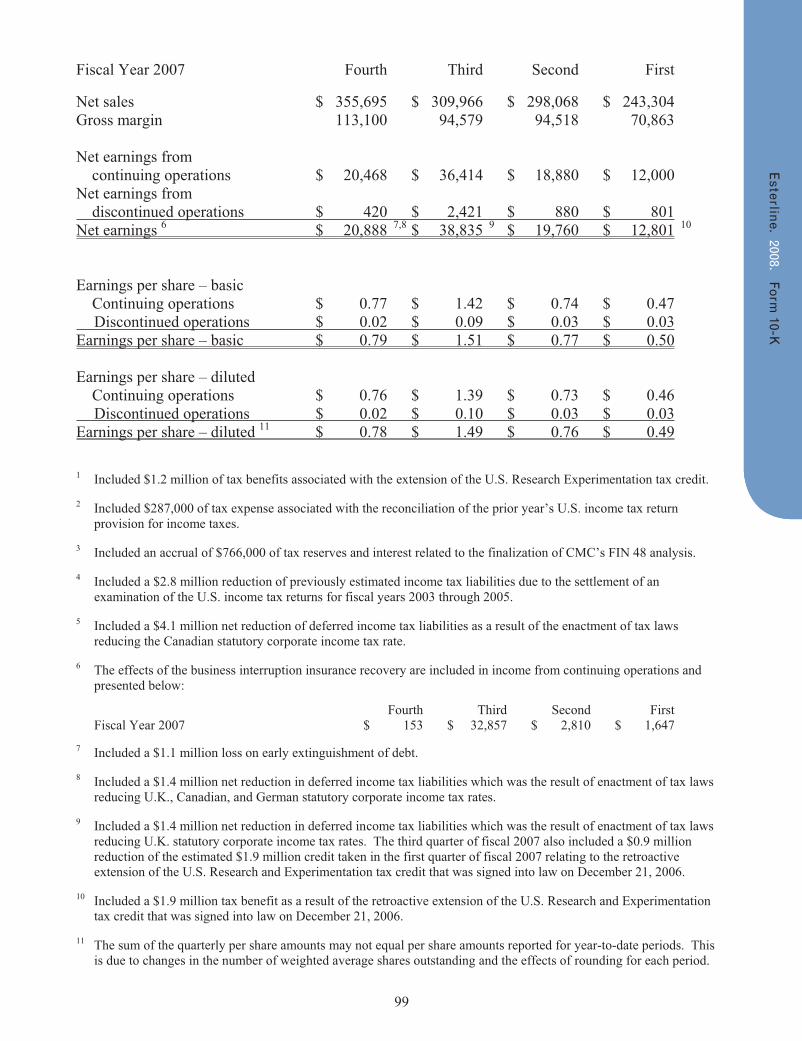
99
Fiscal Year 2007 Fourth Third Second First
Net sales $ 355,695 $ 309,966 $ 298,068 $ 243,304 Gross margin 113,100 94,579 94,518 70,863
Net earnings from continuing operations $ 20,468 $ 36,414 $ 18,880 $ 12,000 Net earnings from discontinued operations $ 420 $ 2,421 $ 880 $ 801Net earnings 6 $ 20,888 7,8 $ 38,835 9 $ 19,760 $ 12,801 10
Earnings per share – basic Continuing operations $ 0.77 $ 1.42 $ 0.74 $ 0.47 Discontinued operations $ 0.02 $ 0.09 $ 0.03 $ 0.03Earnings per share – basic $ 0.79 $ 1.51 $ 0.77 $ 0.50
Earnings per share – diluted Continuing operations $ 0.76 $ 1.39 $ 0.73 $ 0.46 Discontinued operations $ 0.02 $ 0.10 $ 0.03 $ 0.03Earnings per share – diluted 11 $ 0.78 $ 1.49 $ 0.76 $ 0.49
1 Included $1.2 million of tax benefits associated with the extension of the U.S. Research Experimentation tax credit.
2 Included $287,000 of tax expense associated with the reconciliation of the prior year’s U.S. income tax return provision for income taxes.
3 Included an accrual of $766,000 of tax reserves and interest related to the finalization of CMC’s FIN 48 analysis.
4 Included a $2.8 million reduction of previously estimated income tax liabilities due to the settlement of an examination of the U.S. income tax returns for fiscal years 2003 through 2005.
5 Included a $4.1 million net reduction of deferred income tax liabilities as a result of the enactment of tax laws reducing the Canadian statutory corporate income tax rate.
6 The effects of the business interruption insurance recovery are included in income from continuing operations and presented below:
Fourth Third Second First Fiscal Year 2007 $ 153 $ 32,857 $ 2,810 $ 1,647
7 Included a $1.1 million loss on early extinguishment of debt.
8 Included a $1.4 million net reduction in deferred income tax liabilities which was the result of enactment of tax laws reducing U.K., Canadian, and German statutory corporate income tax rates.
9 Included a $1.4 million net reduction in deferred income tax liabilities which was the result of enactment of tax laws reducing U.K. statutory corporate income tax rates. The third quarter of fiscal 2007 also included a $0.9 million reduction of the estimated $1.9 million credit taken in the first quarter of fiscal 2007 relating to the retroactive extension of the U.S. Research and Experimentation tax credit that was signed into law on December 21, 2006.
10 Included a $1.9 million tax benefit as a result of the retroactive extension of the U.S. Research and Experimentation tax credit that was signed into law on December 21, 2006.
11 The sum of the quarterly per share amounts may not equal per share amounts reported for year-to-date periods. This is due to changes in the number of weighted average shares outstanding and the effects of rounding for each period.
100
NOTE 17: Subsequent Event (Unaudited) On December 21, 2008, the Company entered into a Share Sale and Purchase Agreement to acquire Racal Acoustics Global Ltd. (Racal) for U.K. £115.0 million or $172.0 million, subject to certain governmental approvals and customary closing conditions. Racal develops and manufactures high technology ruggedized personal communication equipment for the defense and avionics market segment. Racal will be included in our Avionics & Controls segment
NOTE 18: Guarantors The following schedules set forth condensed consolidating financial information as required by Rule 3-10 of Securities and Exchange Commission Regulation S-X for fiscal 2008, 2007 and 2006 for (a) Esterline Technologies Corporation (the Parent); (b) on a combined basis, the subsidiary guarantors (Guarantor Subsidiaries) of the Senior Subordinated Notes due 2013 (Senior Subordinated Notes) and Senior Notes due 2017 (Senior Notes) which include Advanced Input Devices, Inc., Amtech Automated Manufacturing Technology, Angus Electronics Co., Armtec Countermeasures Co., Armtec Countermeasures TNO Co., Armtec Defense Products Co., AVISTA, Incorporated, BVR Technologies Co., CMC DataComm Inc., CMC Electronics Acton Inc., CMC Electronics Aurora Inc., EA Technologies Corporation, Equipment Sales Co., Esterline Canadian Holding Co., Esterline International Company (China), Esterline Sensors Services Americas, Inc., Esterline Technologies Holdings Limited, Esterline Technologies Ltd. (England), H.A. Sales Co., Hauser Inc., Hytek Finishes Co., Janco Corporation, Kirkhill-TA Co., Korry Electronics Co., Leach Holding Corporation, Leach International Corporation, Leach International Mexico S. de R.L. de C.V. (Mexico), Leach Technology Group, Inc., Mason Electric Co., MC Tech Co., Memtron Technologies Co., Norwich Aero Products, Inc., Palomar Products, Inc., Pressure Systems, Inc., Pressure Systems International, Inc., Surftech Finishes Co., UMM Electronics Inc., and (c) on a combined basis, the subsidiary non-guarantors (Non-Guarantor Subsidiaries), which include Advanced Input Devices Ltd. (U.K.), Auxitrol S.A., BAE Systems Canada/Air TV LLC, Beacon Electronics Inc., CMC Electronics Inc., Darchem Engineering Limited, Darchem Holdings Ltd., Darchem Insulation Systems Limited, Esterline Acquisition Ltd. (U.K.), Esterline Canadian Acquisition Company, Esterline Canadian Limited Partnership, Esterline Foreign Sales Corporation (U.S. Virgin Islands), Esterline Input Devices Asia Ltd. (Barbados), Esterline Input Devices Ltd. (Shanghai), Esterline Mexico S. de R.L. de C.V. (Mexico), Esterline Sensors Services Asia PTE, Ltd. (Singapore), Esterline Technologies Denmark ApS (Denmark), Guizhou Leach-Tianyi Aviation Electrical Company Ltd. (China), Leach International Asia-Pacific Ltd. (Hong Kong), Leach International Europe S.A. (France), Leach International Germany GmbH (Germany), Leach International U.K. (England), Leach Italia Srl. (Italy), LRE Medical GmbH (Germany), Muirhead Aerospace Ltd., Norcroft Dynamics Ltd., Pressure Systems International Ltd., TA Mfg. Limited (U.K.), Wallop Defence Systems Limited, Wallop Industries Limited (U.K.), Weston Aero Ltd. (England), and Weston Aerospace Ltd. (England). The Guarantor Subsidiaries are direct and indirect wholly-owned subsidiaries of Esterline Technologies Corporation and have fully and unconditionally, jointly and severally, guaranteed the Senior Notes and Senior Subordinated Notes. The net assets, net loss and cash flows of CMC DataComm Inc., CMC Electronics Acton Inc. and CMC Electronics Aurora Inc. were previously included with Non-Guarantor Subsidiaries until the valuation of these guarantor subsidiaries was complete. At May 2, 2008, the valuation of these guarantor subsidiaries was completed and, accordingly, the reported consolidating balance sheet, income statement and statement of cash flows for the Guarantor Subsidiaries and Non-Guarantor Subsidiaries for fiscal 2007 and 2006 have been adjusted to reflect the inclusion of CMC DataComm Inc., CMC Electronics Acton Inc. and CMC Electronics Aurora Inc. as Guarantor Subsidiaries.
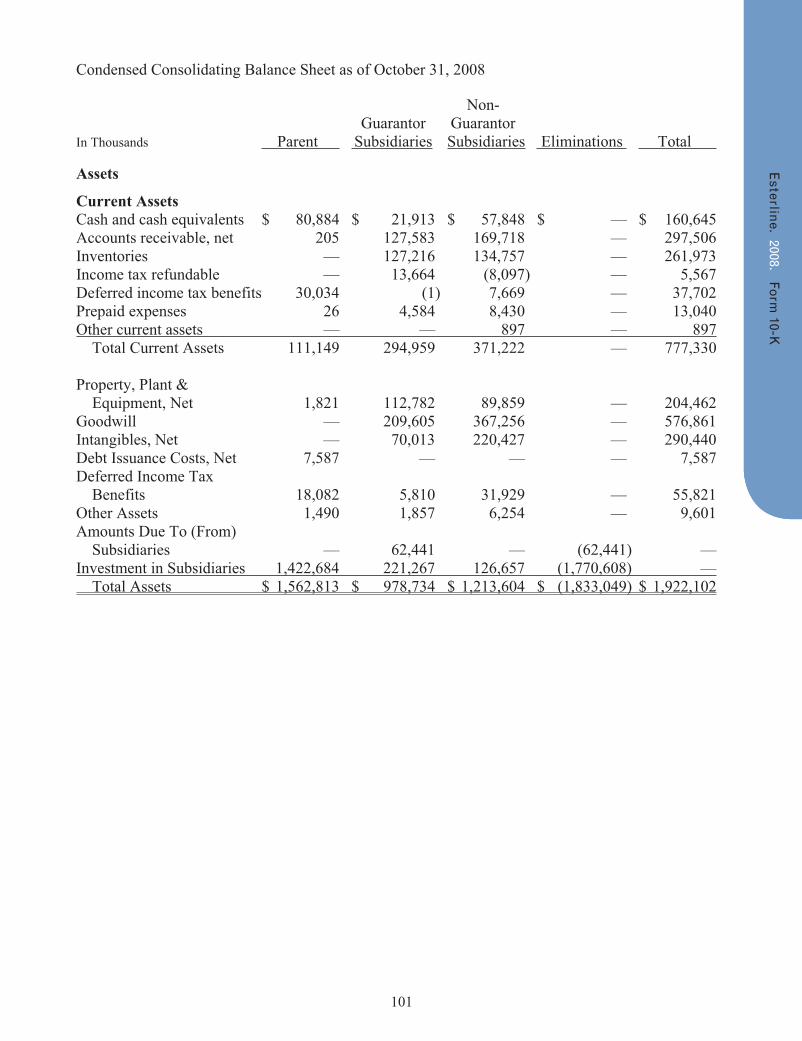
101
Condensed Consolidating Balance Sheet as of October 31, 2008
Non- Guarantor Guarantor In Thousands Parent Subsidiaries Subsidiaries Eliminations Total
Assets
Current Assets Cash and cash equivalents $ 80,884 $ 21,913 $ 57,848 $ — $ 160,645 Accounts receivable, net 205 127,583 169,718 — 297,506 Inventories — 127,216 134,757 — 261,973 Income tax refundable — 13,664 (8,097) — 5,567 Deferred income tax benefits 30,034 (1) 7,669 — 37,702 Prepaid expenses 26 4,584 8,430 — 13,040 Other current assets — — 897 — 897 Total Current Assets 111,149 294,959 371,222 — 777,330
Property, Plant & Equipment, Net 1,821 112,782 89,859 — 204,462 Goodwill — 209,605 367,256 — 576,861 Intangibles, Net — 70,013 220,427 — 290,440 Debt Issuance Costs, Net 7,587 — — — 7,587 Deferred Income Tax Benefits 18,082 5,810 31,929 — 55,821 Other Assets 1,490 1,857 6,254 — 9,601 Amounts Due To (From) Subsidiaries — 62,441 — (62,441) — Investment in Subsidiaries 1,422,684 221,267 126,657 (1,770,608) — Total Assets $ 1,562,813 $ 978,734 $ 1,213,604 $ (1,833,049) $ 1,922,102
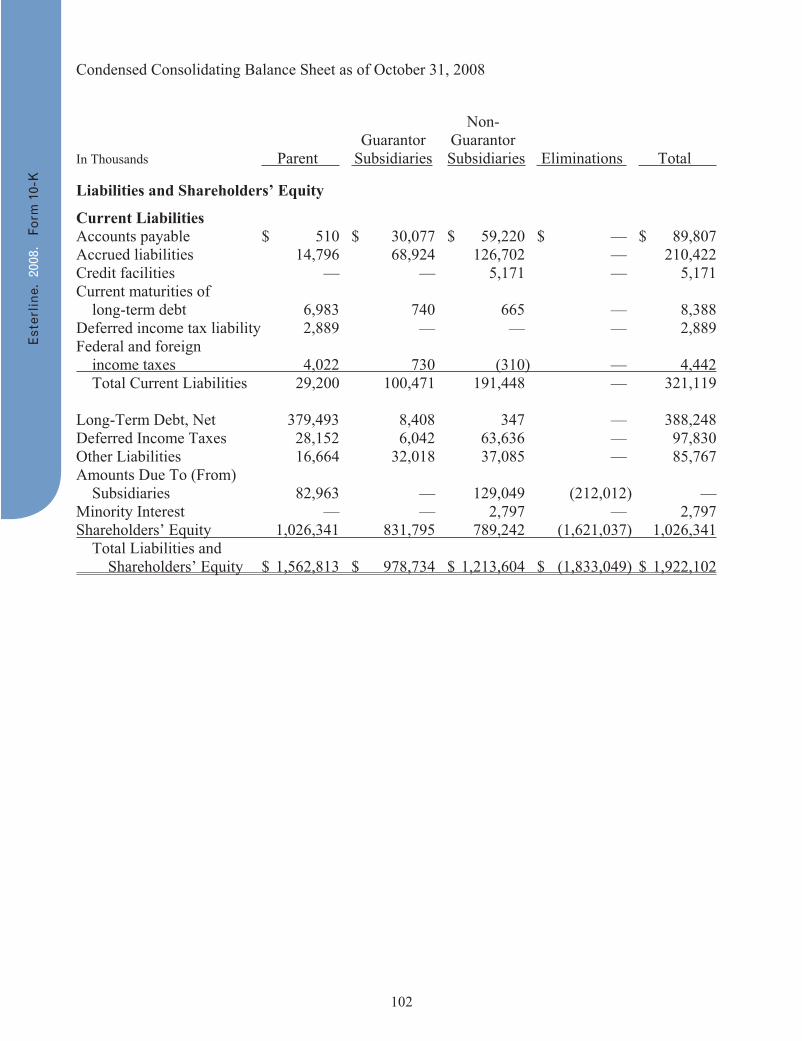
102
Condensed Consolidating Balance Sheet as of October 31, 2008
Non- Guarantor Guarantor In Thousands Parent Subsidiaries Subsidiaries Eliminations Total
Liabilities and Shareholders’ Equity
Current Liabilities Accounts payable $ 510 $ 30,077 $ 59,220 $ — $ 89,807 Accrued liabilities 14,796 68,924 126,702 — 210,422 Credit facilities — — 5,171 — 5,171 Current maturities of long-term debt 6,983 740 665 — 8,388 Deferred income tax liability 2,889 — — — 2,889 Federal and foreign income taxes 4,022 730 (310) — 4,442 Total Current Liabilities 29,200 100,471 191,448 — 321,119
Long-Term Debt, Net 379,493 8,408 347 — 388,248 Deferred Income Taxes 28,152 6,042 63,636 — 97,830 Other Liabilities 16,664 32,018 37,085 — 85,767 Amounts Due To (From) Subsidiaries 82,963 — 129,049 (212,012) — Minority Interest — — 2,797 — 2,797 Shareholders’ Equity 1,026,341 831,795 789,242 (1,621,037) 1,026,341 Total Liabilities and Shareholders’ Equity $ 1,562,813 $ 978,734 $ 1,213,604 $ (1,833,049) $ 1,922,102

103
Condensed Consolidating Statement of Operations for the fiscal year ended October 31, 2008
Non- Guarantor Guarantor In Thousands Parent Subsidiaries Subsidiaries Eliminations Total
Net Sales $ — $ 851,628 $ 654,666 $ (23,122) $ 1,483,172 Cost of Sales — 568,377 447,598 (23,122) 992,853 — 283,251 207,068 — 490,319 Expenses Selling, general and administrative — 119,655 119,627 — 239,282 Research, development and engineering — 26,927 59,871 — 86,798 Total Expenses — 146,582 179,498 — 326,080 Other Other expense (income) 90 — (4) — 86 Total Other 90 — (4) — 86Operating Earnings from Continuing Operations (90) 136,669 27,574 — 164,153
Interest income (22,118) (3,803) (39,699) 61,246 (4,374) Interest expense 28,818 21,921 40,429 (61,246) 29,922 Gain on derivative financial instrument (1,850) — — — (1,850)Other (Income) Expense, Net 4,850 18,118 730 — 23,698
Income (Loss) from Continuing Operations Before Taxes (4,940) 118,551 26,844 — 140,455 Income Tax Expense (Benefit) (1,159) 28,621 (899) — 26,563Income (Loss) From Continuing Operations Before Minority Interest (3,781) 89,930 27,743 — 113,892 Minority Interest — — (383) — (383)Income (Loss) From Continuing Operations (3,781) 89,930 27,360 — 113,509
Gain on Discontinued Operations — — 7,024 — 7,024 Equity in Net Income of Consolidated Subsidiaries 124,314 21,554 779 (146,647) —Net Income (Loss) $ 120,533 $ 111,484 $ 35,163 $ (146,647) $ 120,533
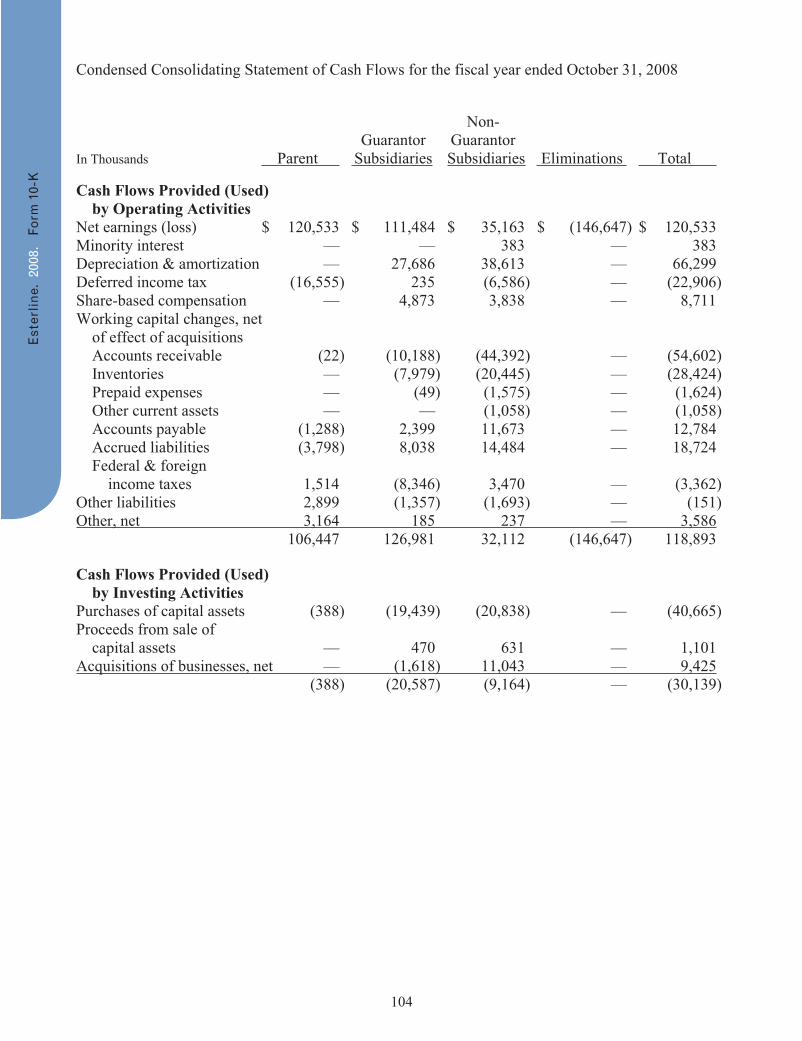
104
Condensed Consolidating Statement of Cash Flows for the fiscal year ended October 31, 2008
Non- Guarantor Guarantor In Thousands Parent Subsidiaries Subsidiaries Eliminations Total
Cash Flows Provided (Used) by Operating Activities Net earnings (loss) $ 120,533 $ 111,484 $ 35,163 $ (146,647) $ 120,533 Minority interest — — 383 — 383 Depreciation & amortization — 27,686 38,613 — 66,299 Deferred income tax (16,555) 235 (6,586) — (22,906) Share-based compensation — 4,873 3,838 — 8,711 Working capital changes, net of effect of acquisitions Accounts receivable (22) (10,188) (44,392) — (54,602) Inventories — (7,979) (20,445) — (28,424) Prepaid expenses — (49) (1,575) — (1,624) Other current assets — — (1,058) — (1,058) Accounts payable (1,288) 2,399 11,673 — 12,784 Accrued liabilities (3,798) 8,038 14,484 — 18,724 Federal & foreign income taxes 1,514 (8,346) 3,470 — (3,362) Other liabilities 2,899 (1,357) (1,693) — (151) Other, net 3,164 185 237 — 3,586 106,447 126,981 32,112 (146,647) 118,893
Cash Flows Provided (Used) by Investing Activities Purchases of capital assets (388) (19,439) (20,838) — (40,665) Proceeds from sale of capital assets — 470 631 — 1,101 Acquisitions of businesses, net — (1,618) 11,043 — 9,425 (388) (20,587) (9,164) — (30,139)
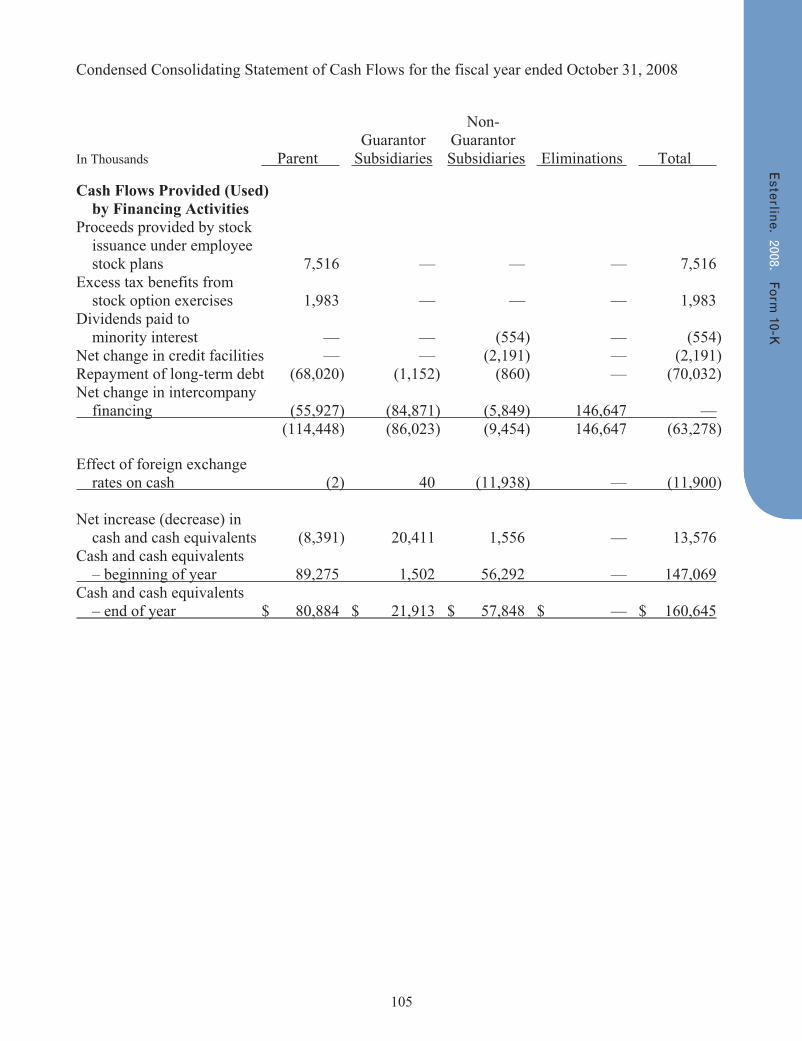
105
Condensed Consolidating Statement of Cash Flows for the fiscal year ended October 31, 2008
Non- Guarantor Guarantor In Thousands Parent Subsidiaries Subsidiaries Eliminations Total
Cash Flows Provided (Used) by Financing Activities Proceeds provided by stock issuance under employee stock plans 7,516 — — — 7,516 Excess tax benefits from stock option exercises 1,983 — — — 1,983 Dividends paid to minority interest — — (554) — (554) Net change in credit facilities — — (2,191) — (2,191) Repayment of long-term debt (68,020) (1,152) (860) — (70,032) Net change in intercompany financing (55,927) (84,871) (5,849) 146,647 — (114,448) (86,023) (9,454) 146,647 (63,278)
Effect of foreign exchange rates on cash (2) 40 (11,938) — (11,900)
Net increase (decrease) in cash and cash equivalents (8,391) 20,411 1,556 — 13,576 Cash and cash equivalents – beginning of year 89,275 1,502 56,292 — 147,069Cash and cash equivalents – end of year $ 80,884 $ 21,913 $ 57,848 $ — $ 160,645
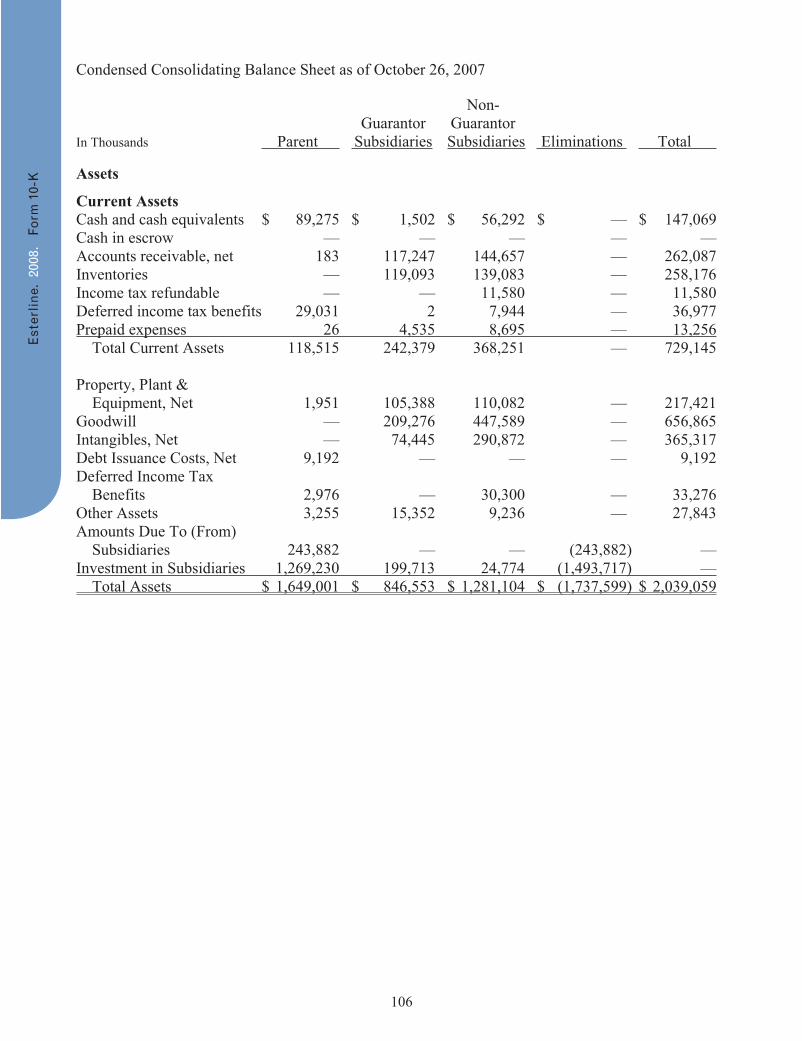
106
Condensed Consolidating Balance Sheet as of October 26, 2007
Non- Guarantor Guarantor In Thousands Parent Subsidiaries Subsidiaries Eliminations Total
Assets
Current Assets Cash and cash equivalents $ 89,275 $ 1,502 $ 56,292 $ — $ 147,069 Cash in escrow — — — — — Accounts receivable, net 183 117,247 144,657 — 262,087 Inventories — 119,093 139,083 — 258,176 Income tax refundable — — 11,580 — 11,580 Deferred income tax benefits 29,031 2 7,944 — 36,977 Prepaid expenses 26 4,535 8,695 — 13,256 Total Current Assets 118,515 242,379 368,251 — 729,145
Property, Plant & Equipment, Net 1,951 105,388 110,082 — 217,421 Goodwill — 209,276 447,589 — 656,865 Intangibles, Net — 74,445 290,872 — 365,317 Debt Issuance Costs, Net 9,192 — — — 9,192 Deferred Income Tax Benefits 2,976 — 30,300 — 33,276 Other Assets 3,255 15,352 9,236 — 27,843 Amounts Due To (From) Subsidiaries 243,882 — — (243,882) — Investment in Subsidiaries 1,269,230 199,713 24,774 (1,493,717) — Total Assets $ 1,649,001 $ 846,553 $ 1,281,104 $ (1,737,599) $ 2,039,059
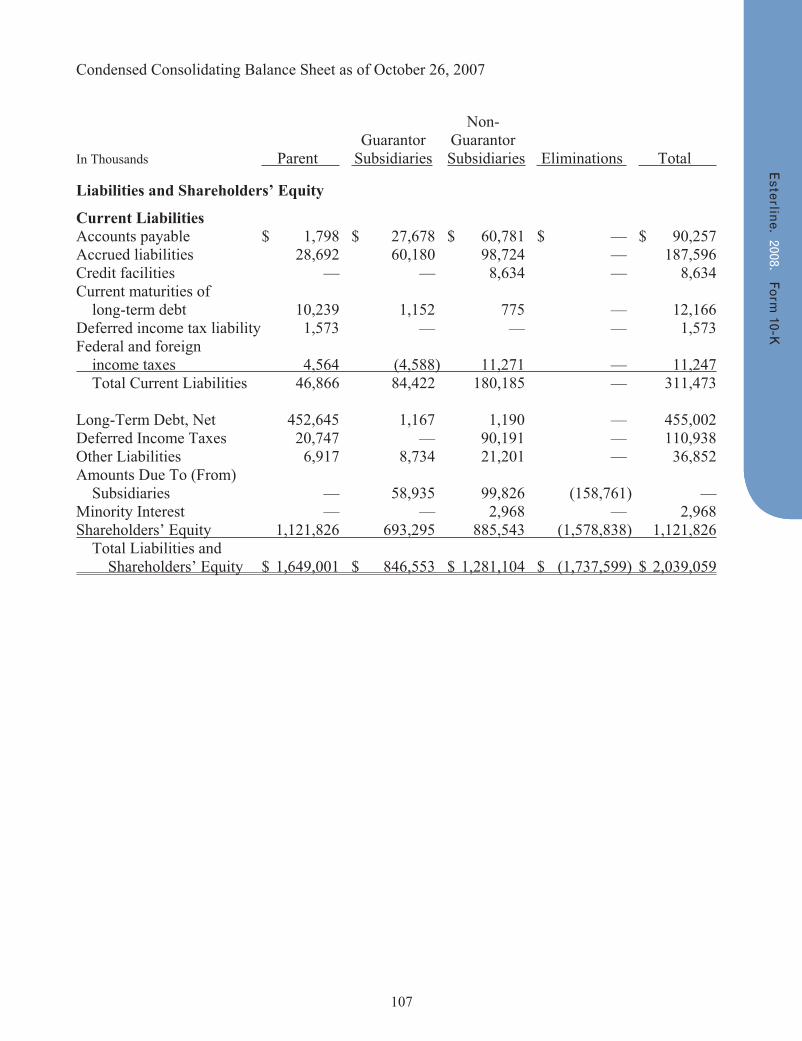
107
Condensed Consolidating Balance Sheet as of October 26, 2007
Non- Guarantor Guarantor In Thousands Parent Subsidiaries Subsidiaries Eliminations Total
Liabilities and Shareholders’ Equity
Current Liabilities Accounts payable $ 1,798 $ 27,678 $ 60,781 $ — $ 90,257 Accrued liabilities 28,692 60,180 98,724 — 187,596 Credit facilities — — 8,634 — 8,634 Current maturities of long-term debt 10,239 1,152 775 — 12,166 Deferred income tax liability 1,573 — — — 1,573 Federal and foreign income taxes 4,564 (4,588) 11,271 — 11,247 Total Current Liabilities 46,866 84,422 180,185 — 311,473
Long-Term Debt, Net 452,645 1,167 1,190 — 455,002 Deferred Income Taxes 20,747 — 90,191 — 110,938 Other Liabilities 6,917 8,734 21,201 — 36,852 Amounts Due To (From) Subsidiaries — 58,935 99,826 (158,761) — Minority Interest — — 2,968 — 2,968 Shareholders’ Equity 1,121,826 693,295 885,543 (1,578,838) 1,121,826 Total Liabilities and Shareholders’ Equity $ 1,649,001 $ 846,553 $ 1,281,104 $ (1,737,599) $ 2,039,059
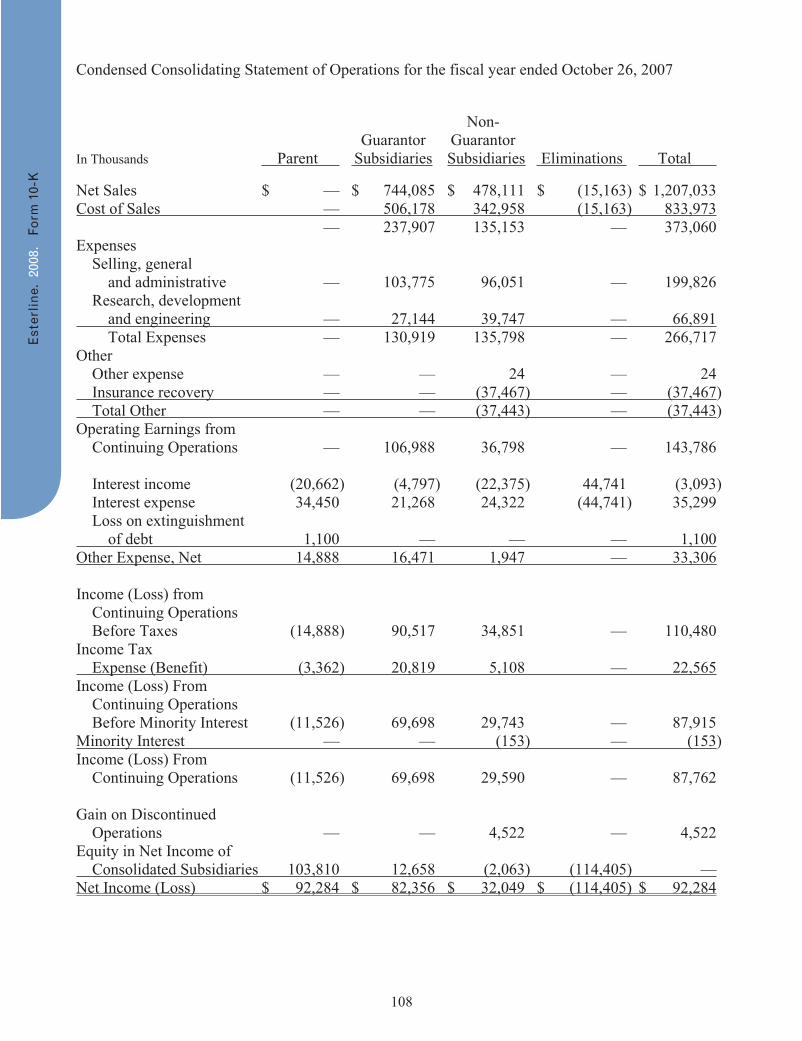
108
Condensed Consolidating Statement of Operations for the fiscal year ended October 26, 2007
Non- Guarantor Guarantor In Thousands Parent Subsidiaries Subsidiaries Eliminations Total
Net Sales $ — $ 744,085 $ 478,111 $ (15,163) $ 1,207,033 Cost of Sales — 506,178 342,958 (15,163) 833,973 — 237,907 135,153 — 373,060 Expenses Selling, general and administrative — 103,775 96,051 — 199,826 Research, development and engineering — 27,144 39,747 — 66,891 Total Expenses — 130,919 135,798 — 266,717 Other Other expense — — 24 — 24 Insurance recovery — — (37,467) — (37,467) Total Other — — (37,443) — (37,443)Operating Earnings from Continuing Operations — 106,988 36,798 — 143,786
Interest income (20,662) (4,797) (22,375) 44,741 (3,093) Interest expense 34,450 21,268 24,322 (44,741) 35,299 Loss on extinguishment of debt 1,100 — — — 1,100Other Expense, Net 14,888 16,471 1,947 — 33,306
Income (Loss) from Continuing Operations Before Taxes (14,888) 90,517 34,851 — 110,480 Income Tax Expense (Benefit) (3,362) 20,819 5,108 — 22,565Income (Loss) From Continuing Operations Before Minority Interest (11,526) 69,698 29,743 — 87,915 Minority Interest — — (153) — (153)Income (Loss) From Continuing Operations (11,526) 69,698 29,590 — 87,762
Gain on Discontinued Operations — — 4,522 — 4,522 Equity in Net Income of Consolidated Subsidiaries 103,810 12,658 (2,063) (114,405) —Net Income (Loss) $ 92,284 $ 82,356 $ 32,049 $ (114,405) $ 92,284
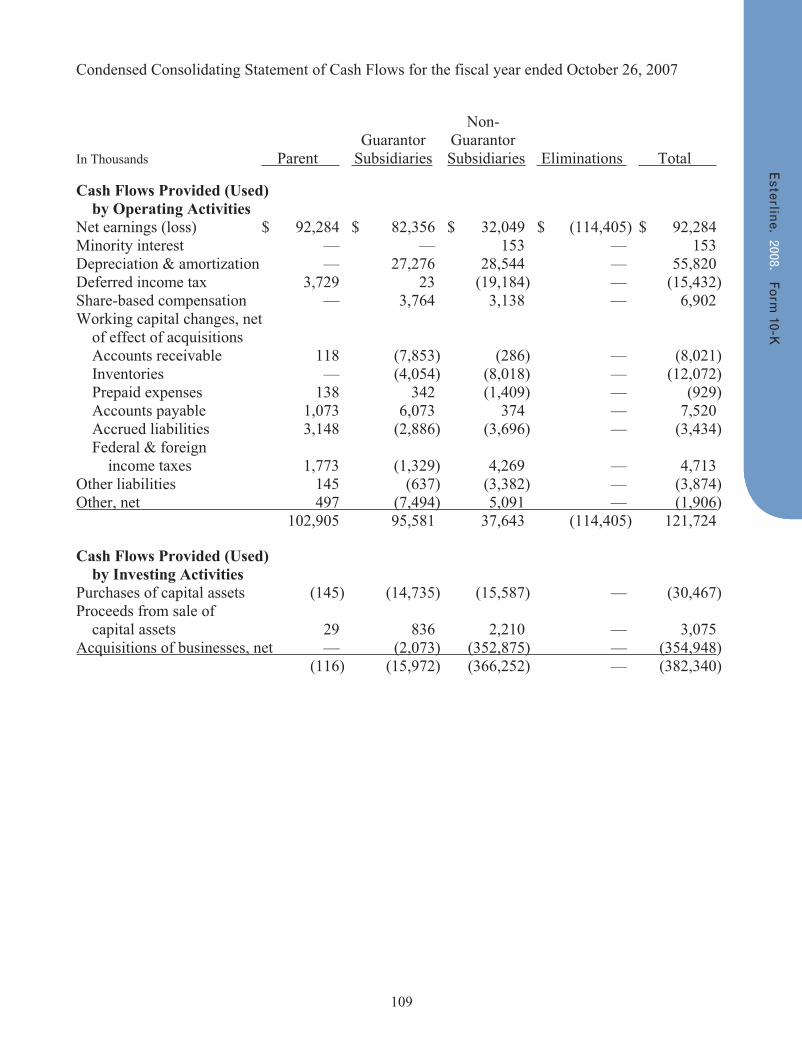
109
Condensed Consolidating Statement of Cash Flows for the fiscal year ended October 26, 2007
Non- Guarantor Guarantor In Thousands Parent Subsidiaries Subsidiaries Eliminations Total
Cash Flows Provided (Used) by Operating Activities Net earnings (loss) $ 92,284 $ 82,356 $ 32,049 $ (114,405) $ 92,284 Minority interest — — 153 — 153 Depreciation & amortization — 27,276 28,544 — 55,820 Deferred income tax 3,729 23 (19,184) — (15,432) Share-based compensation — 3,764 3,138 — 6,902 Working capital changes, net of effect of acquisitions Accounts receivable 118 (7,853) (286) — (8,021) Inventories — (4,054) (8,018) — (12,072) Prepaid expenses 138 342 (1,409) — (929) Accounts payable 1,073 6,073 374 — 7,520 Accrued liabilities 3,148 (2,886) (3,696) — (3,434) Federal & foreign income taxes 1,773 (1,329) 4,269 — 4,713 Other liabilities 145 (637) (3,382) — (3,874) Other, net 497 (7,494) 5,091 — (1,906) 102,905 95,581 37,643 (114,405) 121,724
Cash Flows Provided (Used) by Investing Activities Purchases of capital assets (145) (14,735) (15,587) — (30,467) Proceeds from sale of capital assets 29 836 2,210 — 3,075 Acquisitions of businesses, net — (2,073) (352,875) — (354,948) (116) (15,972) (366,252) — (382,340)
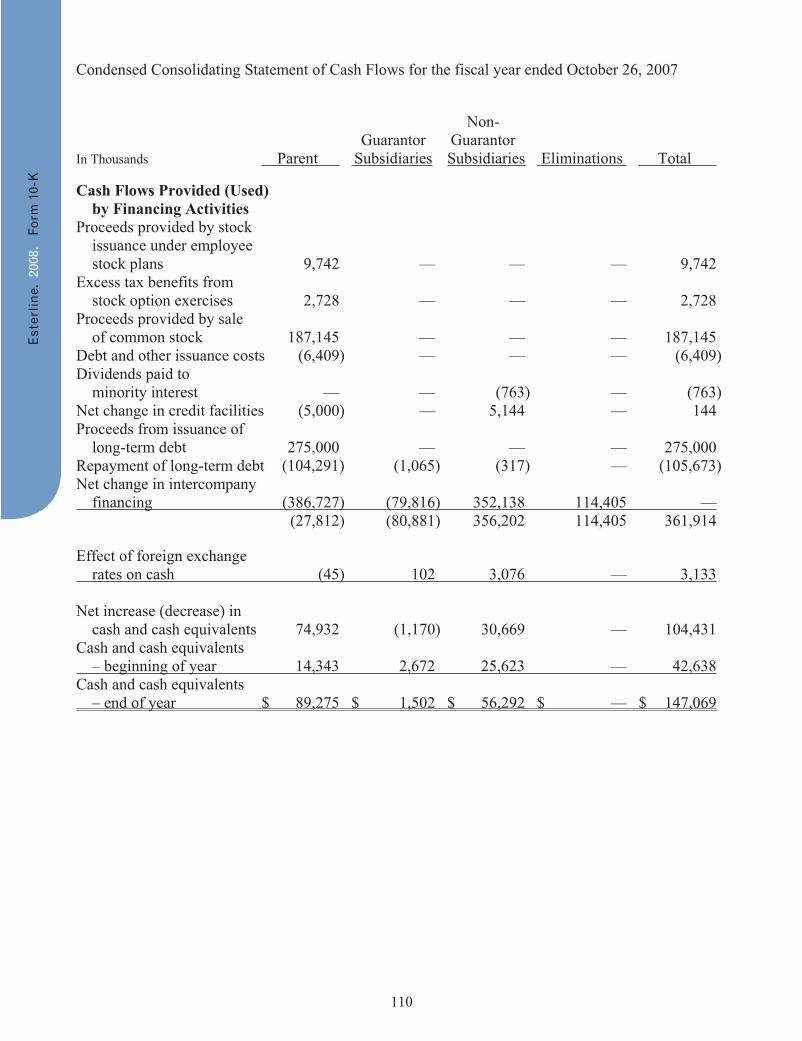
110
Condensed Consolidating Statement of Cash Flows for the fiscal year ended October 26, 2007
Non- Guarantor Guarantor In Thousands Parent Subsidiaries Subsidiaries Eliminations Total
Cash Flows Provided (Used) by Financing Activities Proceeds provided by stock issuance under employee stock plans 9,742 — — — 9,742 Excess tax benefits from stock option exercises 2,728 — — — 2,728 Proceeds provided by sale of common stock 187,145 — — — 187,145 Debt and other issuance costs (6,409) — — — (6,409) Dividends paid to minority interest — — (763) — (763) Net change in credit facilities (5,000) — 5,144 — 144 Proceeds from issuance of long-term debt 275,000 — — — 275,000 Repayment of long-term debt (104,291) (1,065) (317) — (105,673) Net change in intercompany financing (386,727) (79,816) 352,138 114,405 — (27,812) (80,881) 356,202 114,405 361,914
Effect of foreign exchange rates on cash (45) 102 3,076 — 3,133
Net increase (decrease) in cash and cash equivalents 74,932 (1,170) 30,669 — 104,431 Cash and cash equivalents – beginning of year 14,343 2,672 25,623 — 42,638Cash and cash equivalents – end of year $ 89,275 $ 1,502 $ 56,292 $ — $ 147,069
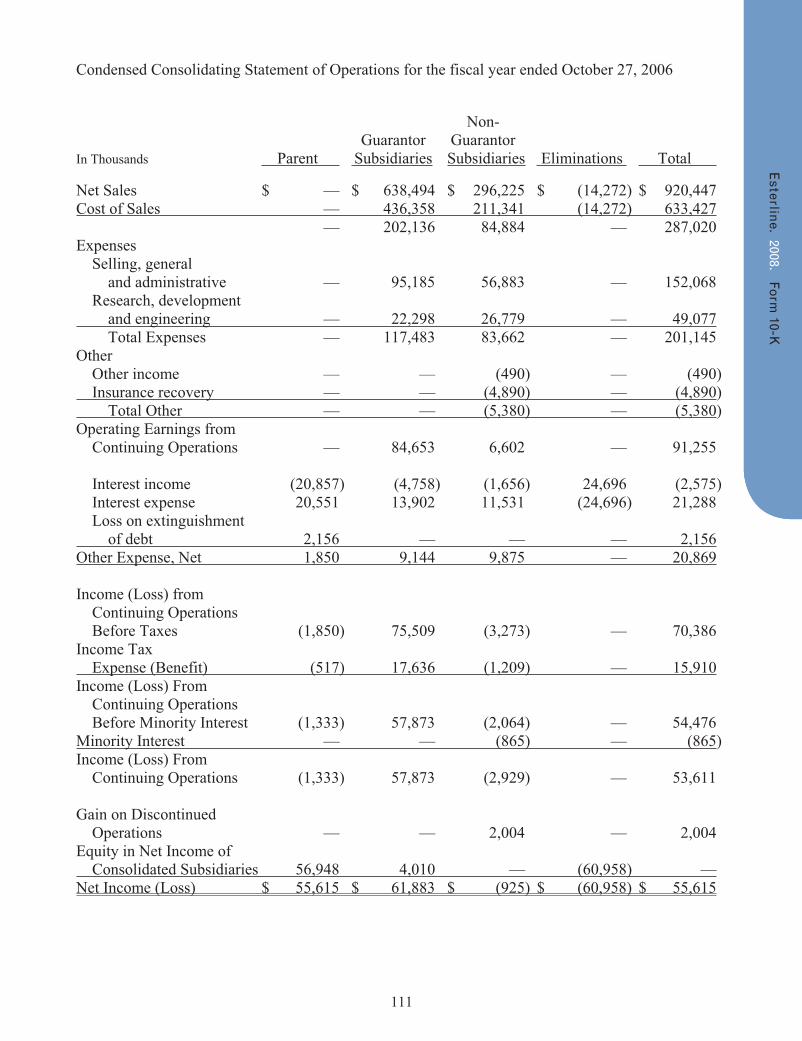
111
Condensed Consolidating Statement of Operations for the fiscal year ended October 27, 2006
Non- Guarantor Guarantor In Thousands Parent Subsidiaries Subsidiaries Eliminations Total
Net Sales $ — $ 638,494 $ 296,225 $ (14,272) $ 920,447 Cost of Sales — 436,358 211,341 (14,272) 633,427 — 202,136 84,884 — 287,020 Expenses Selling, general and administrative — 95,185 56,883 — 152,068 Research, development and engineering — 22,298 26,779 — 49,077 Total Expenses — 117,483 83,662 — 201,145 Other Other income — — (490) — (490) Insurance recovery — — (4,890) — (4,890) Total Other — — (5,380) — (5,380)Operating Earnings from Continuing Operations — 84,653 6,602 — 91,255
Interest income (20,857) (4,758) (1,656) 24,696 (2,575) Interest expense 20,551 13,902 11,531 (24,696) 21,288 Loss on extinguishment of debt 2,156 — — — 2,156Other Expense, Net 1,850 9,144 9,875 — 20,869
Income (Loss) from Continuing Operations Before Taxes (1,850) 75,509 (3,273) — 70,386 Income Tax Expense (Benefit) (517) 17,636 (1,209) — 15,910Income (Loss) From Continuing Operations Before Minority Interest (1,333) 57,873 (2,064) — 54,476 Minority Interest — — (865) — (865)Income (Loss) From Continuing Operations (1,333) 57,873 (2,929) — 53,611
Gain on Discontinued Operations — — 2,004 — 2,004 Equity in Net Income of Consolidated Subsidiaries 56,948 4,010 — (60,958) —Net Income (Loss) $ 55,615 $ 61,883 $ (925) $ (60,958) $ 55,615
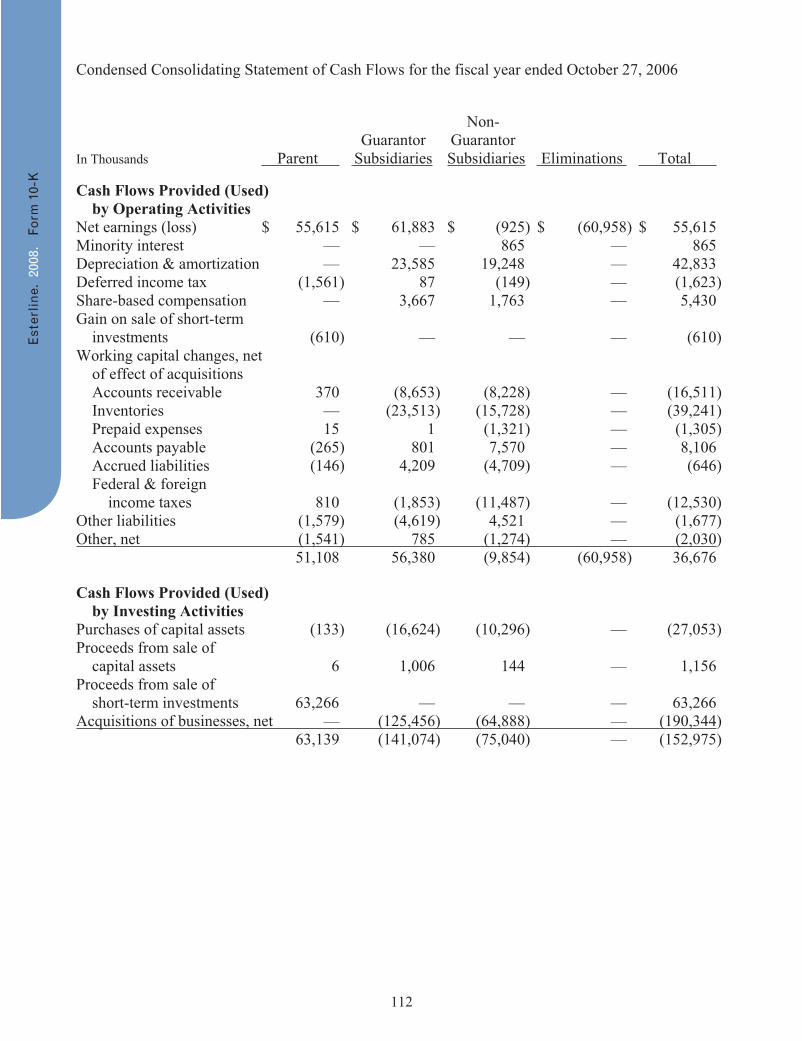
112
Condensed Consolidating Statement of Cash Flows for the fiscal year ended October 27, 2006
Non- Guarantor Guarantor In Thousands Parent Subsidiaries Subsidiaries Eliminations Total
Cash Flows Provided (Used) by Operating Activities Net earnings (loss) $ 55,615 $ 61,883 $ (925) $ (60,958) $ 55,615 Minority interest — — 865 — 865 Depreciation & amortization — 23,585 19,248 — 42,833 Deferred income tax (1,561) 87 (149) — (1,623) Share-based compensation — 3,667 1,763 — 5,430 Gain on sale of short-term investments (610) — — — (610) Working capital changes, net of effect of acquisitions Accounts receivable 370 (8,653) (8,228) — (16,511) Inventories — (23,513) (15,728) — (39,241) Prepaid expenses 15 1 (1,321) — (1,305) Accounts payable (265) 801 7,570 — 8,106 Accrued liabilities (146) 4,209 (4,709) — (646) Federal & foreign income taxes 810 (1,853) (11,487) — (12,530) Other liabilities (1,579) (4,619) 4,521 — (1,677) Other, net (1,541) 785 (1,274) — (2,030) 51,108 56,380 (9,854) (60,958) 36,676
Cash Flows Provided (Used) by Investing Activities Purchases of capital assets (133) (16,624) (10,296) — (27,053) Proceeds from sale of capital assets 6 1,006 144 — 1,156 Proceeds from sale of short-term investments 63,266 — — — 63,266 Acquisitions of businesses, net — (125,456) (64,888) — (190,344) 63,139 (141,074) (75,040) — (152,975)
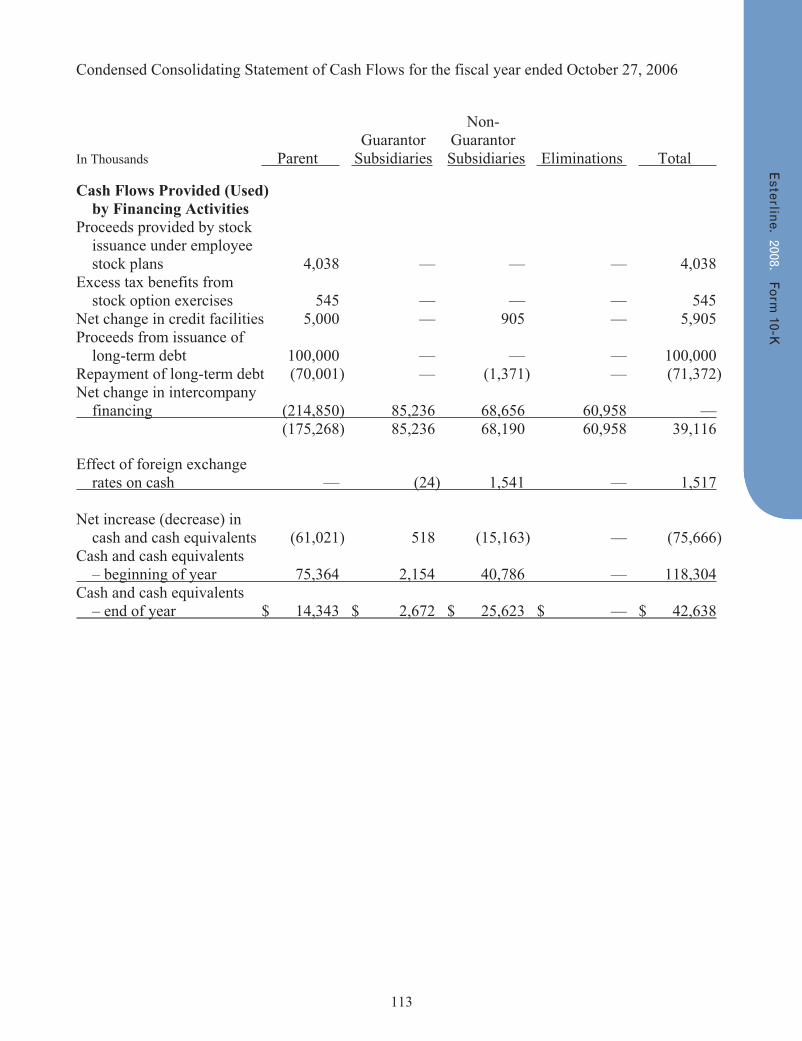
113
Condensed Consolidating Statement of Cash Flows for the fiscal year ended October 27, 2006
Non- Guarantor Guarantor In Thousands Parent Subsidiaries Subsidiaries Eliminations Total
Cash Flows Provided (Used) by Financing Activities Proceeds provided by stock issuance under employee stock plans 4,038 — — — 4,038 Excess tax benefits from stock option exercises 545 — — — 545 Net change in credit facilities 5,000 — 905 — 5,905 Proceeds from issuance of long-term debt 100,000 — — — 100,000 Repayment of long-term debt (70,001) — (1,371) — (71,372) Net change in intercompany financing (214,850) 85,236 68,656 60,958 — (175,268) 85,236 68,190 60,958 39,116
Effect of foreign exchange rates on cash — (24) 1,541 — 1,517
Net increase (decrease) in cash and cash equivalents (61,021) 518 (15,163) — (75,666) Cash and cash equivalents – beginning of year 75,364 2,154 40,786 — 118,304Cash and cash equivalents – end of year $ 14,343 $ 2,672 $ 25,623 $ — $ 42,638
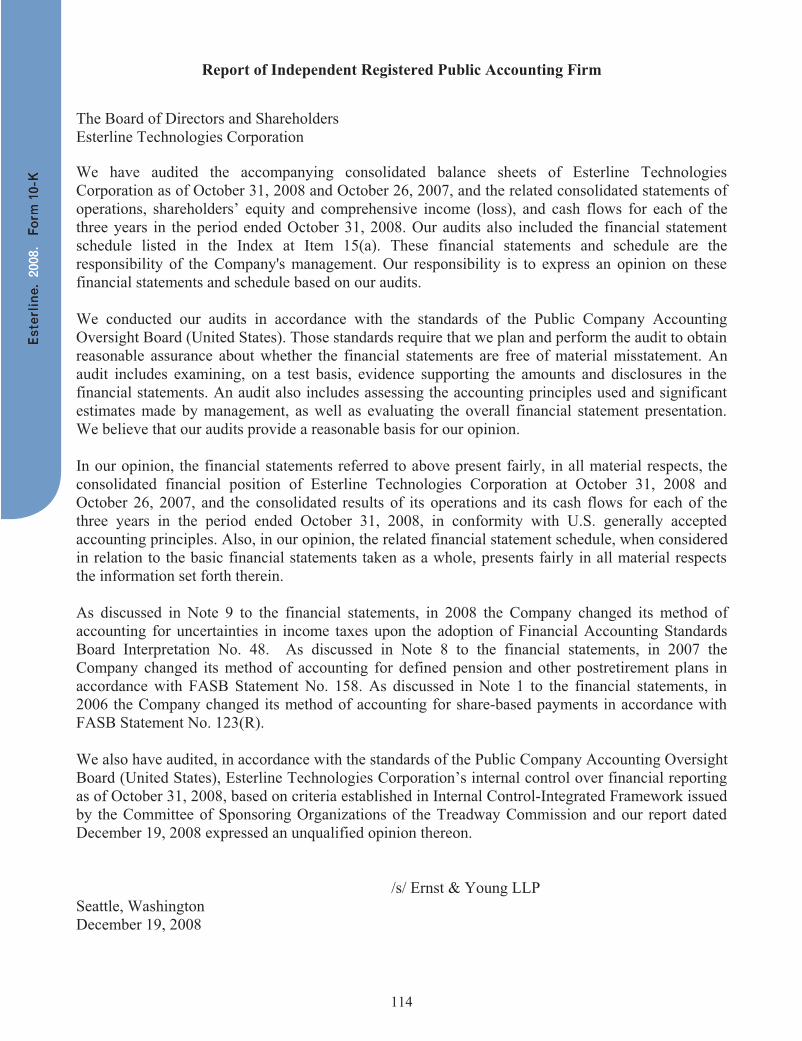
114
Report of Independent Registered Public Accounting Firm
The Board of Directors and Shareholders Esterline Technologies Corporation
We have audited the accompanying consolidated balance sheets of Esterline Technologies Corporation as of October 31, 2008 and October 26, 2007, and the related consolidated statements of operations, shareholders’ equity and comprehensive income (loss), and cash flows for each of the three years in the period ended October 31, 2008. Our audits also included the financial statement schedule listed in the Index at Item 15(a). These financial statements and schedule are the responsibility of the Company's management. Our responsibility is to express an opinion on these financial statements and schedule based on our audits.
We conducted our audits in accordance with the standards of the Public Company Accounting Oversight Board (United States). Those standards require that we plan and perform the audit to obtain reasonable assurance about whether the financial statements are free of material misstatement. An audit includes examining, on a test basis, evidence supporting the amounts and disclosures in the financial statements. An audit also includes assessing the accounting principles used and significant estimates made by management, as well as evaluating the overall financial statement presentation. We believe that our audits provide a reasonable basis for our opinion.
In our opinion, the financial statements referred to above present fairly, in all material respects, the consolidated financial position of Esterline Technologies Corporation at October 31, 2008 and October 26, 2007, and the consolidated results of its operations and its cash flows for each of the three years in the period ended October 31, 2008, in conformity with U.S. generally accepted accounting principles. Also, in our opinion, the related financial statement schedule, when considered in relation to the basic financial statements taken as a whole, presents fairly in all material respects the information set forth therein.
As discussed in Note 9 to the financial statements, in 2008 the Company changed its method of accounting for uncertainties in income taxes upon the adoption of Financial Accounting Standards Board Interpretation No. 48. As discussed in Note 8 to the financial statements, in 2007 the Company changed its method of accounting for defined pension and other postretirement plans in accordance with FASB Statement No. 158. As discussed in Note 1 to the financial statements, in 2006 the Company changed its method of accounting for share-based payments in accordance with FASB Statement No. 123(R).
We also have audited, in accordance with the standards of the Public Company Accounting Oversight Board (United States), Esterline Technologies Corporation’s internal control over financial reporting as of October 31, 2008, based on criteria established in Internal Control-Integrated Framework issued by the Committee of Sponsoring Organizations of the Treadway Commission and our report dated December 19, 2008 expressed an unqualified opinion thereon.
/s/ Ernst & Young LLP Seattle, Washington December 19, 2008
115
Report of Independent Registered Public Accounting Firm The Board of Directors and Shareholders Esterline Technologies Corporation We have audited Esterline Technologies Corporation’s internal control over financial reporting as of October 31, 2008, based on criteria established in Internal Control—Integrated Framework issued by the Committee of Sponsoring Organizations of the Treadway Commission (the COSO criteria). Esterline Technologies Corporation’s management is responsible for maintaining effective internal control over financial reporting, and for its assessment of the effectiveness of internal control over financial reporting included in the accompanying Management’s Report on Internal Control Over Financial Reporting. Our responsibility is to express an opinion on the company’s internal control over financial reporting based on our audit.
We conducted our audit in accordance with the standards of the Public Company Accounting Oversight Board (United States). Those standards require that we plan and perform the audit to obtain reasonable assurance about whether effective internal control over financial reporting was maintained in all material respects. Our audit included obtaining an understanding of internal control over financial reporting, assessing the risk that a material weakness exists, testing and evaluating the design and operating effectiveness of internal control based on the assessed risk, and performing such other procedures as we considered necessary in the circumstances. We believe that our audit provides a reasonable basis for our opinion.
A company’s internal control over financial reporting is a process designed to provide reasonable assurance regarding the reliability of financial reporting and the preparation of financial statements for external purposes in accordance with generally accepted accounting principles. A company’s internal control over financial reporting includes those policies and procedures that (1) pertain to the maintenance of records that, in reasonable detail, accurately and fairly reflect the transactions and dispositions of the assets of the company; (2) provide reasonable assurance that transactions are recorded as necessary to permit preparation of financial statements in accordance with generally accepted accounting principles, and that receipts and expenditures of the company are being made only in accordance with authorizations of management and directors of the company; and (3) provide reasonable assurance regarding prevention or timely detection of unauthorized acquisition, use or disposition of the company’s assets that could have a material effect on the financial statements.
Because of its inherent limitations, internal control over financial reporting may not prevent or detect misstatements. Also, projections of any evaluation of effectiveness to future periods are subject to the risk that controls may become inadequate because of changes in conditions, or that the degree of compliance with the policies or procedures may deteriorate.
In our opinion, Esterline Technologies Corporation maintained, in all material respects, effective internal control over financial reporting as of October 31, 2008, based on the COSO criteria.
116
We also have audited, in accordance with the standards of the Public Company Accounting Oversight Board (United States), the accompanying consolidated balance sheets of Esterline Technologies Corporation as of October 31, 2008 and October 26, 2007, and the related consolidated statements of operations, shareholders’ equity and comprehensive income (loss), and cash flows for each of the three years in the period ended October 31, 2008 of Esterline Technologies Corporation and our report dated December 19, 2008 expressed an unqualified opinion thereon.
/s/ Ernst & Young LLP
Seattle, Washington December 19, 2008
117
Item 9. Changes in and Disagreements with Accountants on Accounting and Financial Disclosure None. Item 9A. Controls and Procedures Disclosure Controls and Procedures Our principal executive and financial officers evaluated our disclosure controls and procedures (as defined in Rules 13a-15(e) and 15d-15(e) under the Exchange Act) as of October 31, 2008. Based upon that evaluation, they concluded as of October 31, 2008, that our disclosure controls and procedures were effective to ensure that information we are required to disclose in the reports that we file under the Exchange Act is recorded, processed, summarized and reported within time periods specified in Securities and Exchange Commission rules and forms. In addition, our principal executive and financial officers concluded as of October 31, 2008 that our disclosure controls and procedures are also effective to ensure that information required to be disclosed in reports that we file or submit under the Exchange Act is accumulated and communicated to our management, including our chief executive officer and chief financial officer, to allow timely decisions regarding required disclosure. Management’s Report on Internal Control Over Financial Reporting Our management is responsible for establishing and maintaining adequate internal control over financial reporting as defined in Rules 13a-15(f) and 15d-15(f) under the Securities Exchange Act of 1934. Our internal control system over financial reporting is designed by, or under the supervision of, our chief executive officer and chief financial officer, and is effected by our board of directors, management and other personnel to provide reasonable assurance regarding the reliability of financial reporting and the preparation of financial statements for external purposes in accordance with generally accepted accounting principles. Our internal control over financial reporting includes those policies and procedures that:
(i) pertain to the maintenance of records that, in reasonable detail, accurately and fairly reflect the assets of the company;
(ii) provide reasonable assurance that transactions are recorded as necessary to permit preparation of financial statements in accordance with U.S. generally accepted accounting principles and that transactions are made only in accordance with the authorization of our management and directors; and
(iii) provide reasonable assurance regarding prevention or timely detection of unauthorized transactions that could have a material effect on the financial statements.
Because of inherent limitations, internal control over financial reporting may not prevent or detect misstatements. Therefore, even those systems determined to be effective can provide only reasonable assurance with respect to financial statement preparation and presentation. Also, projections of any evaluation of effectiveness to future periods are subject to risk that controls may become inadequate because of changes in condition, or that the degree of compliance with the policies or procedures may deteriorate.
Our management assessed the effectiveness of Esterline’s internal control over financial reporting as of October 31, 2008. In making this assessment, our management used the criteria set forth by the Committee of Sponsoring Organizations of the Treadway Commission (COSO) in Internal Control-Integrated Framework. Based on management’s assessment and those criteria, our management concluded that our internal control over financial reporting was effective as of October 31, 2008.
118
Our independent registered public accounting firm, Ernst & Young LLP, has issued an audit report on the effectiveness of our internal control over financial reporting. This report appears on page 115. /s/ Robert W. Cremin Robert W. Cremin Chairman, President and Chief Executive Officer (Principal Executive Officer)
/s/ Robert D. George Robert D. George Vice President, Chief Financial Officer, Secretary and Treasurer (Principal Financial Officer)
/s/ Gary J. Posner Gary J. Posner Corporate Controller and Chief Accounting Officer (Principal Accounting Officer) Changes in Internal Control Over Financial Reporting During the three months ended October 31, 2008, there were no changes in our internal control over financial reporting that materially affected, or are reasonably likely to materially affect, our internal control over financial reporting. Item 9B. Other Information None.
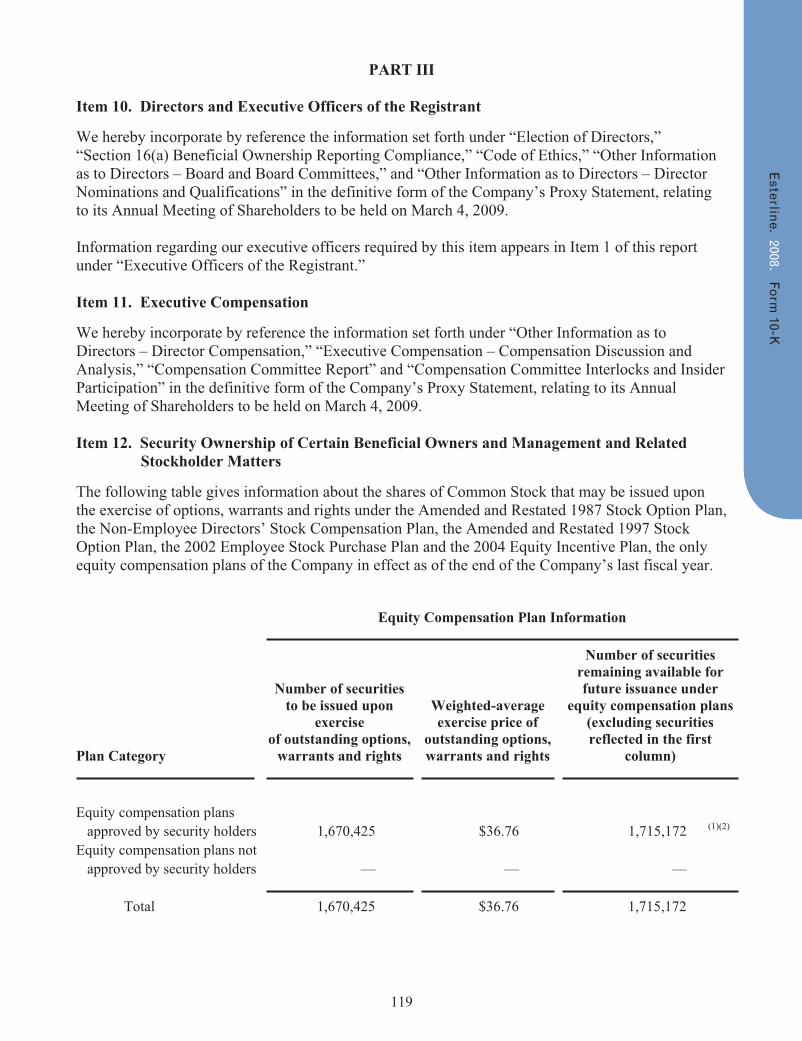
119
PART III
Item 10. Directors and Executive Officers of the Registrant We hereby incorporate by reference the information set forth under “Election of Directors,” “Section 16(a) Beneficial Ownership Reporting Compliance,” “Code of Ethics,” “Other Information as to Directors – Board and Board Committees,” and “Other Information as to Directors – Director Nominations and Qualifications” in the definitive form of the Company’s Proxy Statement, relating to its Annual Meeting of Shareholders to be held on March 4, 2009.
Information regarding our executive officers required by this item appears in Item 1 of this report under “Executive Officers of the Registrant.”
Item 11. Executive Compensation
We hereby incorporate by reference the information set forth under “Other Information as to Directors – Director Compensation,” “Executive Compensation – Compensation Discussion and Analysis,” “Compensation Committee Report” and “Compensation Committee Interlocks and Insider Participation” in the definitive form of the Company’s Proxy Statement, relating to its Annual Meeting of Shareholders to be held on March 4, 2009.
Item 12. Security Ownership of Certain Beneficial Owners and Management and Related Stockholder Matters
The following table gives information about the shares of Common Stock that may be issued upon the exercise of options, warrants and rights under the Amended and Restated 1987 Stock Option Plan, the Non-Employee Directors’ Stock Compensation Plan, the Amended and Restated 1997 Stock Option Plan, the 2002 Employee Stock Purchase Plan and the 2004 Equity Incentive Plan, the only equity compensation plans of the Company in effect as of the end of the Company’s last fiscal year.
Equity Compensation Plan Information
Plan Category
Number of securitiesto be issued upon
exercise of outstanding options,
warrants and rights
Weighted-averageexercise price of
outstanding options,warrants and rights
Number of securities remaining available for future issuance under
equity compensation plans(excluding securities reflected in the first
column)
Equity compensation plans approved by security holders 1,670,425 $36.76 1,715,172 (1)(2)
Equity compensation plans not approved by security holders — — — Total 1,670,425 $36.76 1,715,172
120
(1) Of these shares, 1,399,450 shares are available for issuance under the 2004 Equity Incentive Plan, 295,010 shares are available for purchase under the 2002 Employee Stock Purchase Plan, and 20,712 shares are available for grant under the Non-Employee Directors’ Stock Compensation Plan, as of the end of the Company’s last completed fiscal year.
(2) Pursuant to the Non-Employee Directors’ Stock Compensation Plan effective beginning fiscal 2008, each of the Company’s non-employee directors will receive an automatic grant of shares of Common Stock not subject to any restriction within 45 days of each annual shareholders meeting with an aggregate market value of $60,000 based on the closing price of the Common Stock on that date.
We hereby incorporate by reference the information set forth under “Security Ownership of Certain Beneficial Owners and Management” and “Equity Compensation Plan Information” in the definitive form of the Company’s Proxy Statement, relating to its Annual Meeting of Shareholders to be held on March 4, 2009. Item 13. Certain Relationships and Related Transactions, and Director Independence We hereby incorporate by reference the information set forth under “Certain Relationships and Related Transactions” and “Other Information as to Directors – Board and Board Committees” in the definitive form of the Company’s Proxy Statement, relating to its Annual Meeting of Shareholders to be held on March 4, 2009.
Item 14. Independent Registered Public Accounting Firm Fees and Services We hereby incorporate by reference the information set forth under “Independent Registered Public Accounting Firm’s Fees” in the definitive form of the Company’s Proxy Statement relating to the Annual Meeting of Shareholders to be held on March 4, 2009.
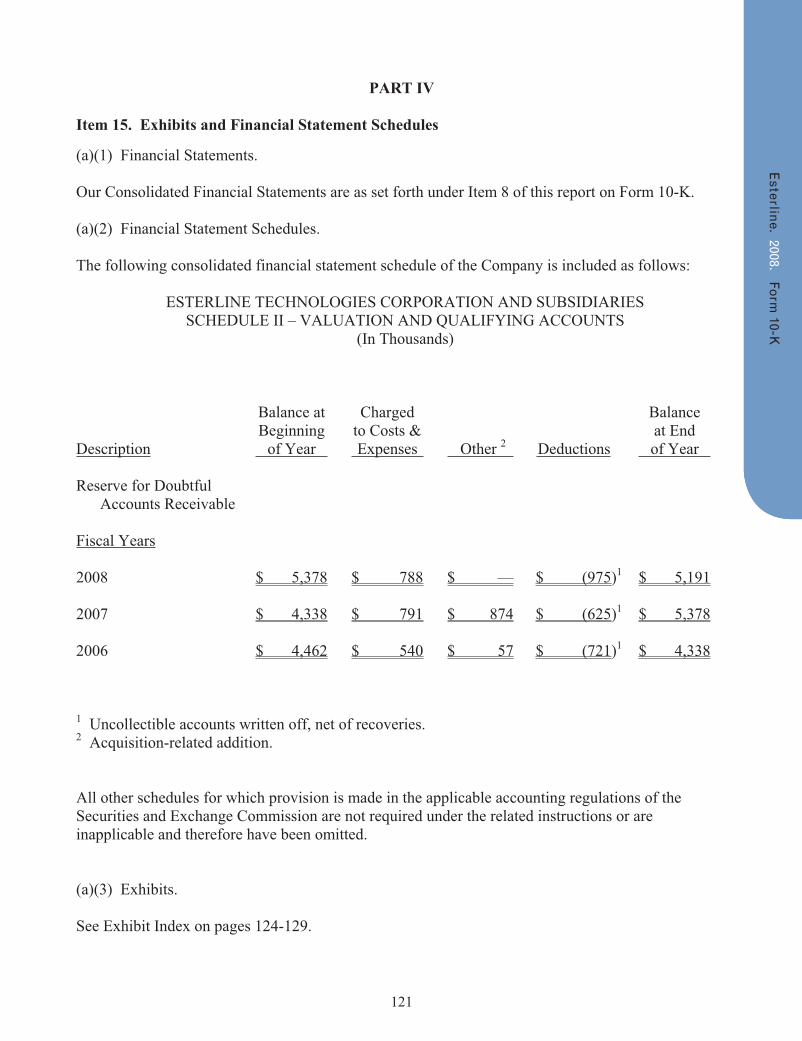
121
PART IV
Item 15. Exhibits and Financial Statement Schedules (a)(1) Financial Statements.
Our Consolidated Financial Statements are as set forth under Item 8 of this report on Form 10-K.
(a)(2) Financial Statement Schedules.
The following consolidated financial statement schedule of the Company is included as follows:
ESTERLINE TECHNOLOGIES CORPORATION AND SUBSIDIARIES SCHEDULE II – VALUATION AND QUALIFYING ACCOUNTS
(In Thousands)
Balance at Charged Balance Beginning to Costs & at End Description of Year Expenses Other 2 Deductions of Year
Reserve for Doubtful Accounts Receivable
Fiscal Years
2008 $ 5,378 $ 788 $ — $ (975)1 $ 5,191
2007 $ 4,338 $ 791 $ 874 $ (625)1 $ 5,378
2006 $ 4,462 $ 540 $ 57 $ (721)1 $ 4,338
1 Uncollectible accounts written off, net of recoveries. 2 Acquisition-related addition.
All other schedules for which provision is made in the applicable accounting regulations of the Securities and Exchange Commission are not required under the related instructions or are inapplicable and therefore have been omitted.
(a)(3) Exhibits.
See Exhibit Index on pages 124-129.
122
SIGNATURES
Pursuant to the requirements of Section 13 or 15(d) of the Securities Exchange Act of 1934, the Company has duly caused this report to be signed on its behalf by the undersigned, thereunto duly authorized. ESTERLINE TECHNOLOGIES CORPORATION (Registrant) By /s/ Robert D. George Robert D. George Vice President, Chief Financial Officer, Secretary and Treasurer (Principal Financial Officer) Dated: December 23, 2008 Pursuant to the requirements of the Securities Exchange Act of 1934, this Report has been signed below by the following persons on behalf of the Registrant and in the capacities and on the dates indicated. /s/ Robert W. Cremin Chairman, President and December 23, 2008 (Robert W. Cremin) Chief Executive Officer Date (Principal Executive Officer) /s/ Robert D. George Vice President, December 23, 2008 (Robert D. George) Chief Financial Officer, Date Secretary and Treasurer (Principal Financial Officer) /s/ Gary J. Posner Corporate Controller and December 23, 2008 (Gary J. Posner) Chief Accounting Officer Date (Principal Accounting Officer) /s/ Lewis E. Burns Director December 23, 2008 (Lewis E. Burns) Date /s/ John F. Clearman Director December 23, 2008 (John F. Clearman) Date
123
/s/ Robert S. Cline Director December 23, 2008 (Robert S. Cline) Date
/s/ Anthony P. Franceschini Director December 23, 2008 (Anthony P. Franceschini) Date
/s/ Paul V. Haack Director December 23, 2008 (Paul V. Haack) Date
/s/ Charles R. Larson Director December 23, 2008 (Charles R. Larson) Date
/s/ Jerry D. Leitman Director December 23, 2008 (Jerry D. Leitman) Date
/s/ James J. Morris Director December 23, 2008 (James J. Morris) Date
/s/ James L. Pierce Director December 23, 2008 (James L. Pierce) Date
124
ExhibitNumber Exhibit Index
2.1 Share Purchase Agreement among Cobham plc, Esterline Acquisition Limited and Esterline Technologies Corporation dated March 8, 2006. (Incorporated by reference to Exhibit 2.1 to the Company’s Annual Report on Form 10-K for the year ended October 27, 2006 [Commission File Number 1-6357].)
2.2 Share Purchase Agreement among ONCAP L.P., ONCAP (Cayman) L.P., Onex Corporation, the other vendors, CMC Electronics Holdings Inc., CMC Electronics Inc., CMC Electronics Aurora Inc., and Esterline Technologies Corporation dated as of January 31, 2007. (Incorporated by reference to Exhibit 10.45 to the Company’s Quarterly Report on Form 10-Q for the quarter ended January 26, 2007 [Commission File Number 1-6357].)
3.1 Restated Certificate of Incorporation for Esterline Technologies Corporation, dated June 6, 2002. (Incorporated by reference to Exhibit 3.1 to the Company’s Quarterly Report on Form 10-Q for the quarter ended April 26, 2002 [Commission File Number 1-6357], with Form of Certificate of Designation, dated December 11, 2002.) (Incorporated by reference to Exhibit 4.1 to Esterline’s Registration of Securities on Form 8-A filed December 12, 2002 [Commission File Number 1-6357].)
3.2 By-laws of the Company, as amended and restated September 8, 2005. (Incorporated by reference to Exhibit 3.2 to the Company’s Current Report on Form 8-K dated September 9, 2005 [Commission File Number 1-6357].)
4.1 Rights Agreement dated as of December 11, 2002, between Esterline Technologies Corporation and Mellon Investor Services LLC, as Rights Agent, which includes as Exhibit A the Form of Certificate of Designation of Series B Serial Preferred Stock, as Exhibit B the Form of Rights Certificate and as Exhibit C the Summary of Rights to Purchase Preferred Shares. (Incorporated by reference to Exhibit 4.1 to the Company’s Registration Statement on Form 8-A, as amended, filed on December 12, 2002 [Commission File Number 1-6357].)
4.2 Indenture relating to Esterline Technologies Corporation’s 7.75% Senior Subordinated Notes due 2013, dated as of June 11, 2003. (Incorporated by reference to Exhibit 4.1 to the Company’s Quarterly Report on Form 10-Q for the quarter ended August 1, 2003 [Commission File Number 1-6357].)
4.3 Form of Exchange Note for the 7.75% Senior Subordinated Notes due 2013.(Incorporated by reference to Exhibit 4.3 to the Company’s Form S-4, as amended, filed on September 30, 2003 [Commission File Number 333-109325].)
4.4 Registration Rights Agreement among Esterline Technologies Corporation, its subsidiaries listed on Schedule 1 thereto, Wachovia Capital Markets, LLC, Banc of Americas Securities LLC, KeyBanc Capital Markets, a division of McDonald Investments and Wells Fargo Securities, LLC, dated March 1, 2007 (“2007 Registration Rights Agreement”). (Incorporated by reference to Exhibit 10.47 to the Company’s Current Report on Form 8-K filed on March 7, 2007 [Commission File Number 1-6357].)
125
ExhibitNumber Exhibit Index
4.5 Indenture relating to Esterline Technologies Corporation’s 6.625% Senior Notes due 2017, dated as of March 1, 2007. (Incorporated by reference to Exhibit 4.2 to the Company’s Current Report on Form 8-K filed on March 7, 2007 [Commission File Number 1-6357].)
4.6 Form of Exchange Note for the 6.625% Senior Notes due 2017. (Incorporated by reference to Exhibit 4.3 to the Company’s Registration Statement on Form S-4 filed on June 29, 2007 [Commission File Number 333-144161].)
4.7 Supplemental Indenture, relating to Esterline Technologies Corporation’s 7.75% Senior Subordinated Notes due 2013, dated as of June 27, 2007. (Incorporated by reference to Exhibit 4.1 to the Company’s Current Report on Form 8-K filed on June 28, 2007 [Commission File Number 1-6357].)
4.8 Amendment dated as of July 31, 2007 to 2007 Registration Rights Agreement. (Incorporated by reference to Exhibit 4.5 to the Company’s Registration Statement on Form S-4/A filed on August 6, 2007 [Commission File Number 333-144161].)
4.9 Supplemental Indenture, relating to Esterline Technologies Corporation’s 6.625% Senior Notes due 2017, dated as of July 26, 2007. (Incorporated by reference to Exhibit 4.4 to the Company’s Registration Statement on Form S-4/A filed on August 6, 2007 [Commission File Number 333-144161].)
10.1 Amendment No. 5 Credit Agreement, dated as of March 13, 2007, among Esterline Technologies Corporation, the financial institutions referred to therein and Wachovia Bank, National Association, as Administrative Agent. (Incorporated by reference to Exhibit 10.2 to the Company’s Current Report on Form 8-K dated March 19, 2007 [Commission File Number 1-6357].)
10.2 Industrial Lease dated July 17, 1984, between 901 Dexter Associates and Korry Electronics Co., First Amendment to Lease dated May 10, 1985, Second Amendment to Lease dated June 20, 1986, Third Amendment to Lease dated September 1, 1987, and Notification of Option Exercise dated January 7, 1991, relating to the manufacturing facility of Korry Electronics at 901 Dexter Avenue N., Seattle, Washington. (Incorporated by reference to Exhibit 10.4 to the Company’s Annual Report on Form 10-K for the year ended October 28, 2005 [Commission File Number 1-6357].)
10.2a Fourth Amendment dated July 27, 1994, to Industrial Lease dated July 17, 1984 between Houg Family Partnership, as successor to 901 Dexter Associates, and Korry Electronics Co. (Incorporated by reference to Exhibit 10.4a to the Company’s Annual Report on Form 10-K for the year ended October 28, 2005 [Commission File Number 1-6357].)
126
ExhibitNumber Exhibit Index
10.3 Industrial Lease dated July 17, 1984, between 801 Dexter Associates and Korry Electronics Co., First Amendment to Lease dated May 10, 1985, Second Amendment to Lease dated June 20, 1986, Third Amendment to Lease dated September 1, 1987, and Notification of Option Exercise dated January 7, 1991, relating to the manufacturing facility of Korry Electronics at 801 Dexter Avenue N., Seattle, Washington. (Incorporated by reference to Exhibit 10.5 to the Company’s Annual Report on Form 10-K for the year ended October 28, 2005 [Commission File Number 1-6357].)
10.3a Fourth Amendment dated March 28, 1994, to Industrial Lease dated July 17, 1984, between Michael Maloney and the Bancroft & Maloney general partnership, as successor to 801 Dexter Associates, and Korry Electronics Co. (Incorporated by reference to Exhibit 10.5a to the Company’s Annual Report on Form 10-K for the year ended October 28, 2005 [Commission File Number 1-6357].)
10.4* Compensation of Directors for fiscal year ended October 31, 2008.
10.6* Esterline Technologies Corporation Supplemental Retirement Income Plan. (Incorporated by reference to Exhibit 10.15 to the Company’s Annual Report on Form 10-K for the year ended October 27, 2006 [Commission File Number 1-6357].)
10.7* Esterline Technologies Corporation Long-Term Incentive Plan. (Incorporated by reference to Exhibit 10.2 to the Company’s Quarterly Report on Form 10-Q for the quarter ended February 1, 2008 [Commission File Number 1-6357].)
10.8* Executive Officer Termination Protection Agreement. (Incorporated by reference to Exhibit 10.19 to the Company’s Annual Report on Form 10-K for the year ended October 28, 2005 [Commission File Number 1-6357].)
10.9a* Offer Letter from Esterline Technologies Corporation to Richard Wood dated February 2, 2005. (Incorporated by reference to Exhibit 10.19b to the Company’s Quarterly Report on Form 10-Q for the quarter ended January 28, 2005 [Commission File Number 1-6357].)
10.9b* Severance Protection Agreement between Richard Wood and Esterline Technologies Corporation, dated February 23, 2005. (Incorporated by reference to Exhibit 10.19c to the Company’s Quarterly Report on Form 10-Q for the quarter ended January 28, 2005 [Commission File Number 1-6357].)
10.10* Offer Letter from Esterline Technologies Corporation to Frank Houston dated March 4, 2005. (Incorporated by reference to Exhibit 10.19e to the Company’s Current Report on Form 8-K dated March 29, 2005 [Commission File Number 1-6357].)
10.11* Offer Letter from Esterline Technologies Corporation to Brad Lawrence dated December 11, 2006. (Incorporated by reference to Exhibit 10.19f to the Company’s Current Report on Form 8-K dated January 23, 2007 [Commission File Number 1-6357].)
127
ExhibitNumber Exhibit Index
10.12 Real Property Lease and Sublease, dated June 28, 1996, between 810 Dexter L.L.C. and Korry Electronics Co. (Incorporated by reference to Exhibit 10.22 to the Company’s Annual Report on Form 10-K for the year ended October 28, 2005 [Commission File Number 1-6357].)
10.13* Esterline Technologies Corporation Amended and Restated 1997 Stock Option Plan.(Incorporated by reference to Exhibit 99.1 to the Company’s Registration Statement on Form S-8 filed March 14, 2003 [Commission File Number 333-103846].)
10.14 Property lease between Slibail Immobilier and Norbail Immobilier and Auxitrol S.A., dated April 29, 1997, relating to the manufacturing facility of Auxitrol at 5, allée Charles Pathé, 18941 Bourges Cedex 9, France, effective on the construction completed date (December 5, 1997). (Incorporated by reference to Exhibit 10.25 to the Company’s Annual Report on Form 10-K for the year ended October 28, 2005 [Commission File Number 1-6357].)
10.15 Industrial and Build-to-Suit Purchase and Sale Agreement between The Newhall Land and Farming Company, Esterline Technologies Corporation and TA Mfg. Co., dated February 13, 1997 including Amendments, relating to premises located at 28065 West Franklin Parkway, Valencia, CA. (Incorporated by reference to Exhibit 10.26 to the Company’s Annual Report on Form 10-K for the year ended October 28, 2005 [Commission File Number 1-6357].)
10.16 Lease Agreement, dated as of February 27, 1998, between Glacier Partners and Advanced Input Devices, Inc., Lease Amendment #1, dated February 27, 1998. (Incorporated by reference to Exhibit 10.31 to the Company’s Annual Report on Form 10-K for the year ended October 27, 2000 [Commission File Number 1-6357].)
10.17* Esterline Technologies Corporation 2002 Employee Stock Purchase Plan, as amended on March 5, 2008. (Incorporated by reference to Annex D of the Registrant’s Definitive Proxy Statement on Schedule 14A, filed on February 4, 2008 [Commission File Number 1-6357].)
10.18 Lease Agreement, dated as of August 6, 2003, by and between the Prudential Insurance Company of America and Mason Electric Co., relating to premises located at Sylmar, California. (Incorporated by reference to Exhibit 10.34 to the Company’s Annual Report on Form 10-K for the year ended October 31, 2003 [Commission File Number 1-6357].)
10.19 Occupation Lease of Buildings known as Phases 3 and 4 on the Solartron Site at Victoria Road, Farnborough, Hampshire between J Sainsbury Developments Limited and Weston Aerospace Limited, dated July 21, 2000. (Incorporated by reference to Exhibit 10.35 to the Company’s Annual Report on Form 10-K for the year ended October 31, 2003 [Commission File Number 1-6357].)
128
ExhibitNumber Exhibit Index
10.20a* Esterline Technologies Corporation 2004 Equity Incentive Plan, as amended on March 5, 2008. (Incorporated by reference to Annex C of the Registrant’s Definitive Proxy Statement on Schedule 14A, filed on February 4, 2008 [Commission File Number 1-6357].)
10.20b* Form of Stock Option Agreement. (Incorporated by reference to Exhibit 10.36a to the Company’s Quarterly Report on Form 10-Q for the quarter ended January 28, 2005 [Commission File Number 1-6357].)
10.21 Lease Agreement dated as of March 19, 1969, as amended, between Leach Corporation and Gin Gor Ju, Trustee of Ju Family Trust, relating to premises located in Orange County. (Incorporated by reference to Exhibit 10.37 to the Company’s Annual Report on Form 10-K for the year ended October 29, 2004 [Commission File Number 1-6357].)
10.22 Lease Agreement, dated November 29, 2005 between Lordbay Investments Limited, Darchem Engineering Limited and Darchem Holdings Limited relating to premises located at Units 4 and 5 Eastbrook Road, London Borough of Gloucestershire Gloucester. (Incorporated by reference to Exhibit 10.38 to the Company’s Quarterly Report on Form 10-Q for the quarter ended April 28, 2006 [Commission File Number 1-6357].)
10.23* Esterline Technologies Corporation Amended and Restated Non-Employee Directors’ Stock Compensation Plan. (Incorporated by reference to Exhibit 10.40 to the Company’s Quarterly Report on Form 10-Q for the quarter ended January 28, 2005 [Commission File Number 1-6357].)
10.24 Amendment No. 1 dated as of November 23, 2005 to Lease Agreement dated as of March 1, 1994 between Highland Industrial Park, Inc. and Armtec Countermeasures Company. (Incorporated by reference to Exhibit 10.41 to the Company’s Quarterly Report on Form 10-Q for the quarter ended April 28, 2006 [Commission File Number 1-6357].)
10.25* Esterline Technologies Corporation Fiscal Year 2008 Annual Incentive Compensation Plan. (Incorporated by reference to Exhibit 10.1 to the Company’s Quarterly Report on Form 10-Q for the quarter ended February 1, 2008 [Commission File Number 1-6357].)
10.26* Esterline Technologies Supplemental Executive Retirement and Deferred Compensation Plan. (Incorporated by reference to Exhibit 10.43 to the Company’s Annual Report on Form 10-K for the year ended October 27, 2006 [Commission File Number 1-6357].)
10.27 Lease Agreement dated November 4, 2002, between American Ordnance LLC and FR Countermeasures, relating to premises located at 25A Ledbetter Gate Road, Milan, Tennessee. (Incorporated by reference to Exhibit 10.44 to the Company’s Annual Report on Form 10-K for the year ended October 27, 2006 [Commission File Number 1-6357].)
129
ExhibitNumber Exhibit Index
10.28 Lease Agreement between Capstone PF LLC and Korry Electronics Co. dated as of March 26, 2008. (Incorporated by reference to Exhibit 10.1 to the Company’s Quarterly Report on Form 10-Q for the quarter ended May 2, 2008 [Commission File Number 1-6357].)
10.29 Exhibit C to Lease Agreement between Capstone PF LLC and Korry Electronics Co. dated as of March 26, 2008. (Incorporated by reference to Exhibit 10.2 to the Company’s Quarterly Report on Form 10-Q for the quarter ended August 1, 2008 [Commission File Number 1-6357].)
10.30 First Amendment to Building Lease and Sublease, dated June 25, 2008, between Capstone PF LLC and Korry Electronics Co. (Incorporated by reference to Exhibit 10.3 to the Company’s Quarterly Report on Form 10-Q for the quarter ended August 1, 2008 [Commission File Number 1-6357].)
10.31 Second Amendment to Building Lease and Sublease, dated July 30, 2008, between Capstone PF LLC and Korry Electronics Co. (Incorporated by reference to Exhibit 10.4 to the Company’s Quarterly Report on Form 10-Q for the quarter ended August 1, 2008 [Commission File Number 1-6357].)
10.32 Subordination, Nondisturbance and Attornment Agreement and Estoppel Certificate, dated July 30, 2008, between Keybank National Assocation and Korry Electronics Co.(Incorporated by reference to Exhibit 10.5 to the Company’s Quarterly Report on Form 10-Q for the quarter ended August 1, 2008 [Commission File Number 1-6357].)
10.33 Agreement for the sale and purchase of the entire issued share capital of Muirhead Aerospace Limited between Esterline Technologies Limited, Esterline Technologies Corporation, EMA Holding UK Limited, and Ametek, Inc. dated November 3, 2008.
10.34 Stock Purchase Agreement between NMC Group, Inc. and Esterline Technologies Corporation dated November 17, 2008.
11.1 Schedule setting forth computation of earnings per share for the five fiscal years ended October 31, 2008.
12.1 Statement of Computation of Ratio of Earnings to Fixed Charges.
21.1 List of subsidiaries.
23.1 Consent of Independent Registered Public Accounting Firm.
31.1 Certification of Chief Executive Officer.
31.2 Certification of Chief Financial Officer.
130
ExhibitNumber Exhibit Index
32.1 Certification (of Robert W. Cremin) pursuant to 18 U.S.C. Section 1350, as adopted pursuant to Section 906 of the Sarbanes-Oxley Act of 2002.
32.2 Certification (of Robert D. George) pursuant to 18 U.S.C. Section 1350, as adopted pursuant to Section 906 of the Sarbanes-Oxley Act of 2002.
* Indicates management contract or compensatory plan or arrangement.
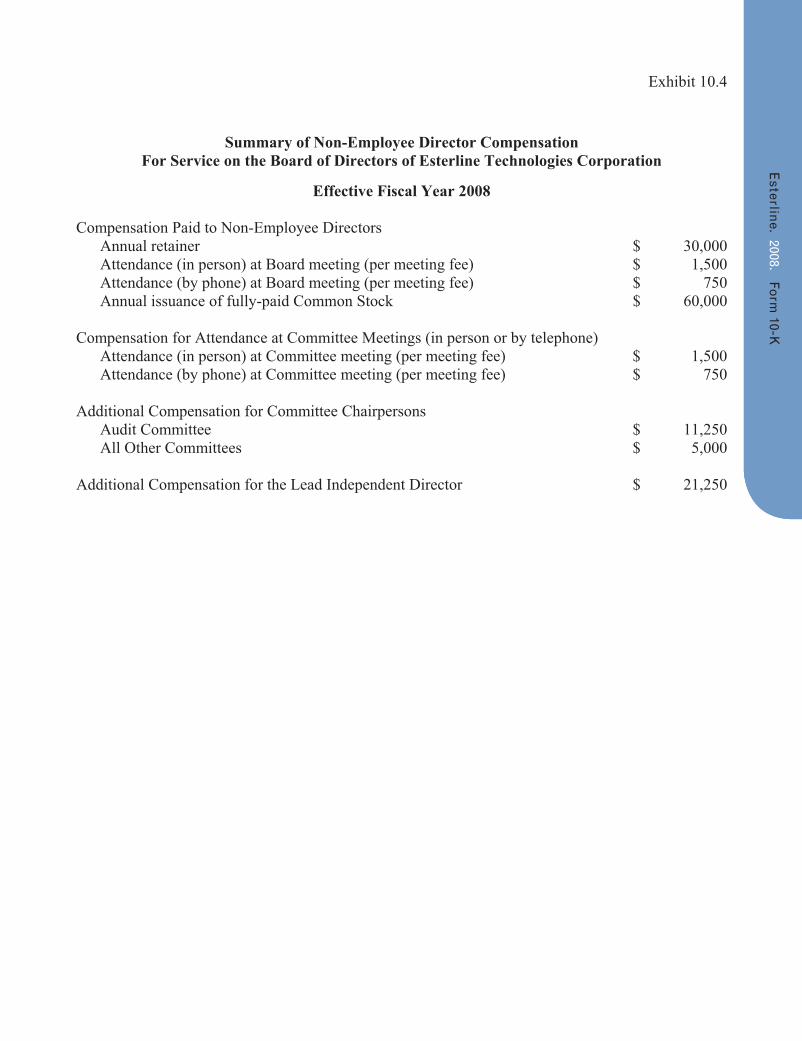
Exhibit 10.4
Summary of Non-Employee Director CompensationFor Service on the Board of Directors of Esterline Technologies Corporation
Effective Fiscal Year 2008
Compensation Paid to Non-Employee Directors Annual retainer $ 30,000 Attendance (in person) at Board meeting (per meeting fee) $ 1,500 Attendance (by phone) at Board meeting (per meeting fee) $ 750 Annual issuance of fully-paid Common Stock $ 60,000
Compensation for Attendance at Committee Meetings (in person or by telephone) Attendance (in person) at Committee meeting (per meeting fee) $ 1,500 Attendance (by phone) at Committee meeting (per meeting fee) $ 750
Additional Compensation for Committee Chairpersons Audit Committee $ 11,250 All Other Committees $ 5,000
Additional Compensation for the Lead Independent Director $ 21,250
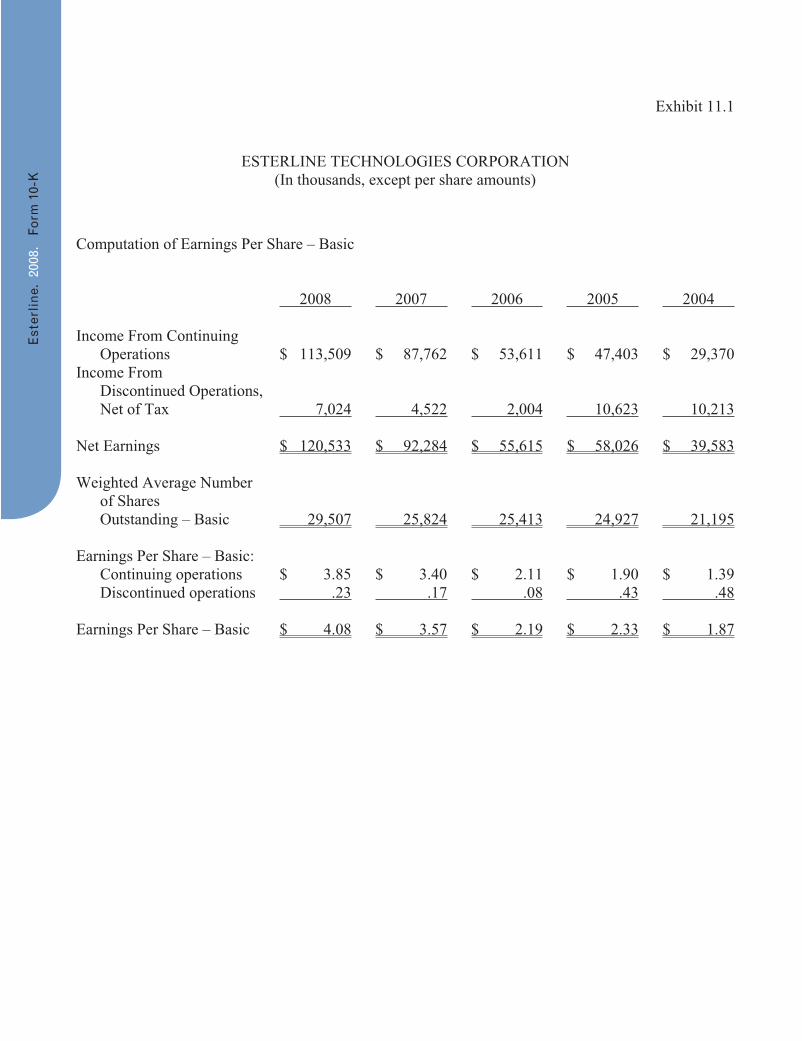
Exhibit 11.1
ESTERLINE TECHNOLOGIES CORPORATION (In thousands, except per share amounts)
Computation of Earnings Per Share – Basic
2008 2007 2006 2005 2004
Income From Continuing Operations $ 113,509 $ 87,762 $ 53,611 $ 47,403 $ 29,370
Income From Discontinued Operations, Net of Tax 7,024 4,522 2,004 10,623 10,213
Net Earnings $ 120,533 $ 92,284 $ 55,615 $ 58,026 $ 39,583
Weighted Average Number of Shares Outstanding – Basic 29,507 25,824 25,413 24,927 21,195
Earnings Per Share – Basic: Continuing operations $ 3.85 $ 3.40 $ 2.11 $ 1.90 $ 1.39 Discontinued operations .23 .17 .08 .43 .48
Earnings Per Share – Basic $ 4.08 $ 3.57 $ 2.19 $ 2.33 $ 1.87
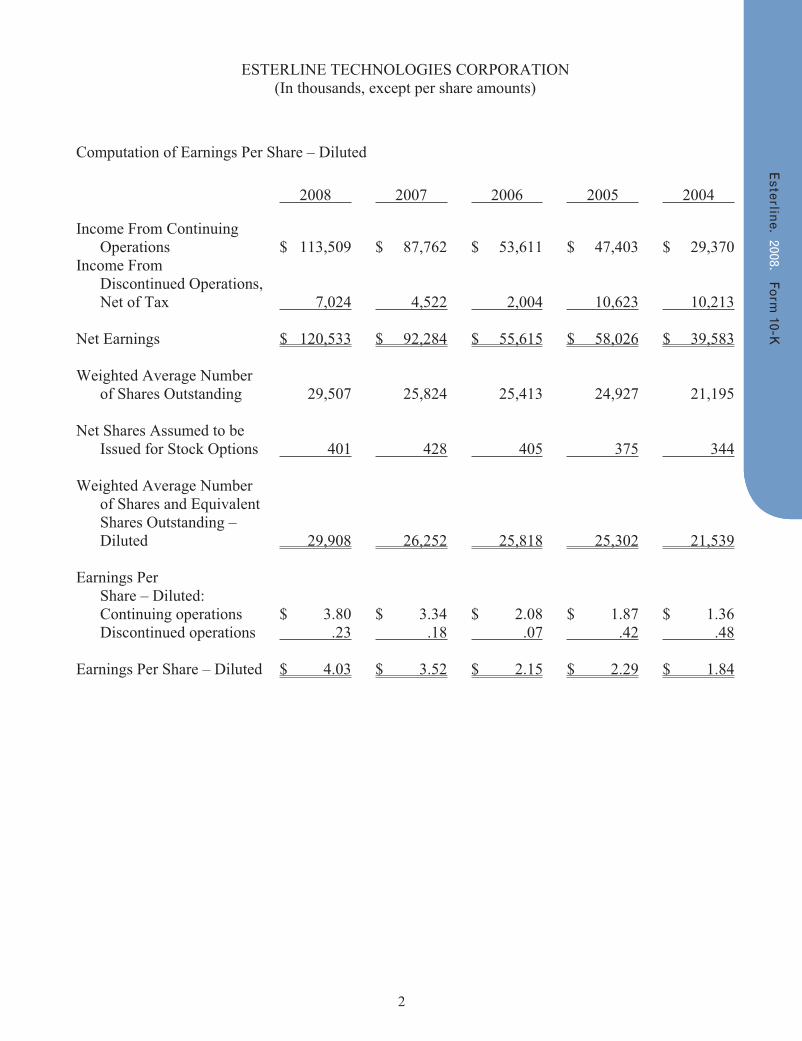
2
ESTERLINE TECHNOLOGIES CORPORATION (In thousands, except per share amounts)
Computation of Earnings Per Share – Diluted
2008 2007 2006 2005 2004
Income From Continuing Operations $ 113,509 $ 87,762 $ 53,611 $ 47,403 $ 29,370
Income From Discontinued Operations, Net of Tax 7,024 4,522 2,004 10,623 10,213
Net Earnings $ 120,533 $ 92,284 $ 55,615 $ 58,026 $ 39,583
Weighted Average Number of Shares Outstanding 29,507 25,824 25,413 24,927 21,195
Net Shares Assumed to be Issued for Stock Options 401 428 405 375 344
Weighted Average Number of Shares and Equivalent Shares Outstanding – Diluted 29,908 26,252 25,818 25,302 21,539
Earnings Per Share – Diluted: Continuing operations $ 3.80 $ 3.34 $ 2.08 $ 1.87 $ 1.36 Discontinued operations .23 .18 .07 .42 .48
Earnings Per Share – Diluted $ 4.03 $ 3.52 $ 2.15 $ 2.29 $ 1.84
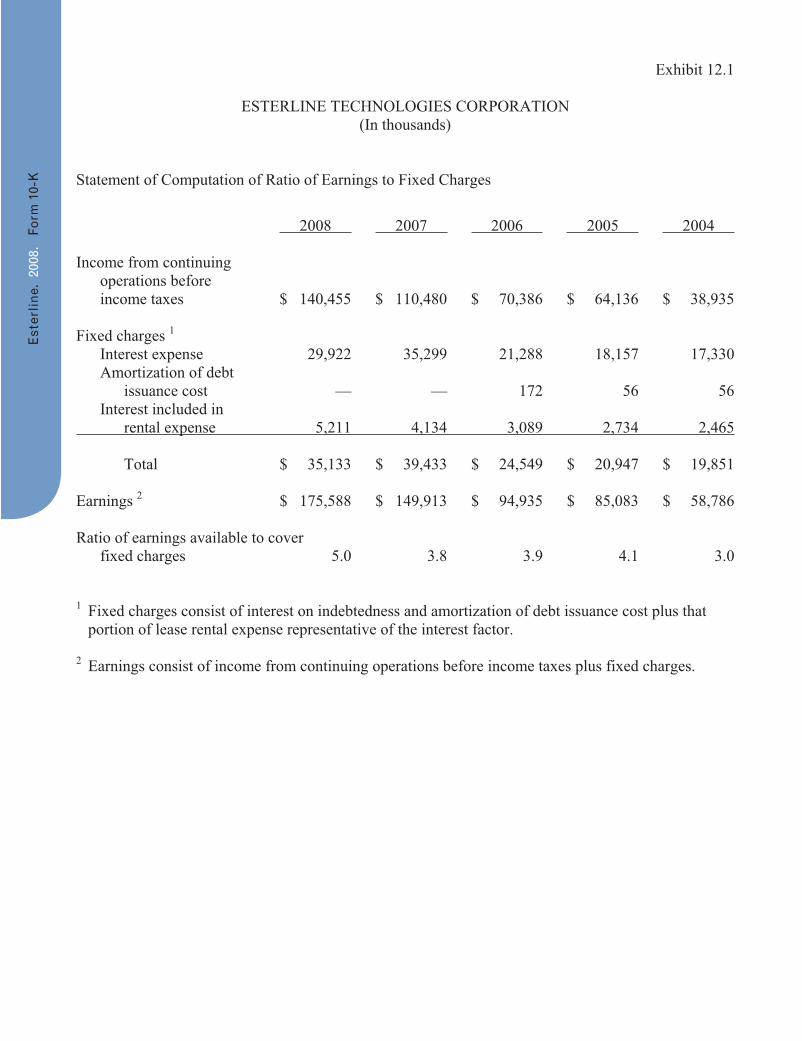
Exhibit 12.1
ESTERLINE TECHNOLOGIES CORPORATION (In thousands)
Statement of Computation of Ratio of Earnings to Fixed Charges
2008 2007 2006 2005 2004
Income from continuing operations before
income taxes $ 140,455 $ 110,480 $ 70,386 $ 64,136 $ 38,935
Fixed charges 1 Interest expense 29,922 35,299 21,288 18,157 17,330 Amortization of debt issuance cost — — 172 56 56 Interest included in rental expense 5,211 4,134 3,089 2,734 2,465
Total $ 35,133 $ 39,433 $ 24,549 $ 20,947 $ 19,851
Earnings 2 $ 175,588 $ 149,913 $ 94,935 $ 85,083 $ 58,786
Ratio of earnings available to cover fixed charges 5.0 3.8 3.9 4.1 3.0
1 Fixed charges consist of interest on indebtedness and amortization of debt issuance cost plus that portion of lease rental expense representative of the interest factor.
2 Earnings consist of income from continuing operations before income taxes plus fixed charges.
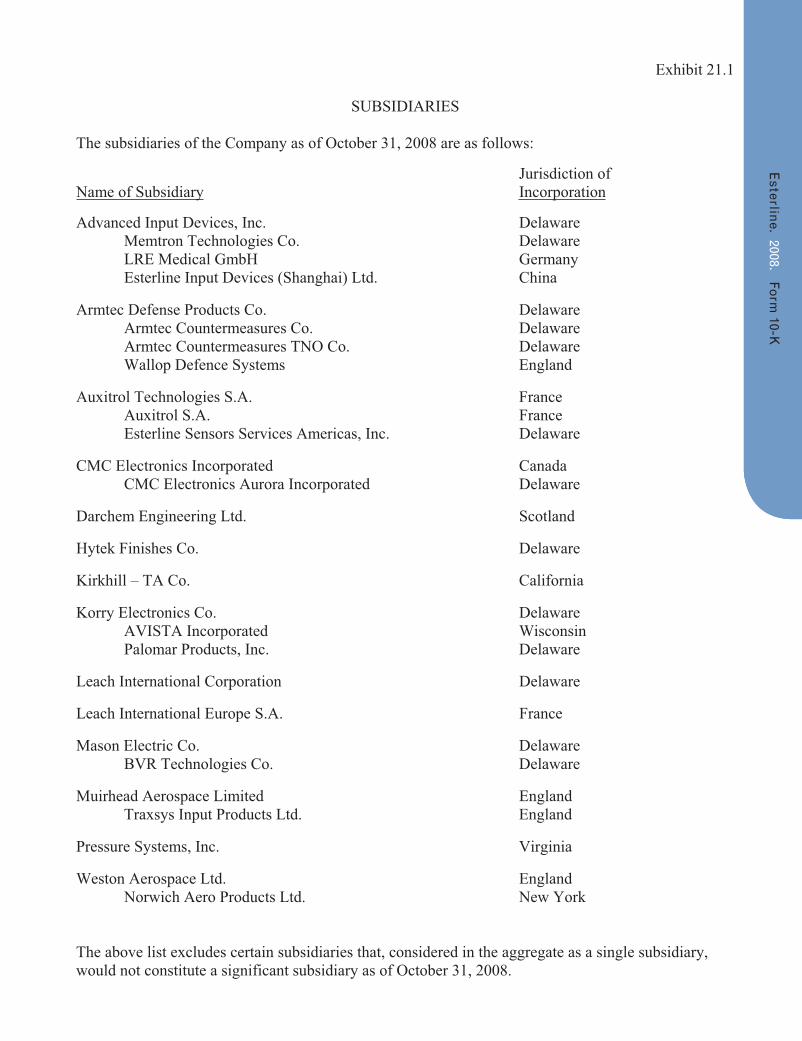
Exhibit 21.1
SUBSIDIARIES
The subsidiaries of the Company as of October 31, 2008 are as follows:
Jurisdiction of Name of Subsidiary Incorporation
Advanced Input Devices, Inc. Delaware Memtron Technologies Co. Delaware LRE Medical GmbH Germany Esterline Input Devices (Shanghai) Ltd. China
Armtec Defense Products Co. Delaware Armtec Countermeasures Co. Delaware Armtec Countermeasures TNO Co. Delaware Wallop Defence Systems England
Auxitrol Technologies S.A. France Auxitrol S.A. France Esterline Sensors Services Americas, Inc. Delaware
CMC Electronics Incorporated Canada CMC Electronics Aurora Incorporated Delaware
Darchem Engineering Ltd. Scotland
Hytek Finishes Co. Delaware
Kirkhill – TA Co. California
Korry Electronics Co. Delaware AVISTA Incorporated Wisconsin Palomar Products, Inc. Delaware
Leach International Corporation Delaware
Leach International Europe S.A. France
Mason Electric Co. Delaware BVR Technologies Co. Delaware
Muirhead Aerospace Limited England Traxsys Input Products Ltd. England
Pressure Systems, Inc. Virginia
Weston Aerospace Ltd. England Norwich Aero Products Ltd. New York
The above list excludes certain subsidiaries that, considered in the aggregate as a single subsidiary, would not constitute a significant subsidiary as of October 31, 2008.

Exhibit 23.1
Consent of Independent Registered Public Accounting Firm
We consent to the incorporation by reference in the following Registration Statements:
(1) Registration Statement (Form S-8 No. 333-43843) pertaining to the Esterline Technologies Corporation 1997 Stock Option Plan;
(2) Registration Statement (Form S-8 No. 33-58375) pertaining to the Esterline Technologies Corporation Non-Employee Directors’ Stock Compensation Plan;
(3) Registration Statement (Form S-8 No. 333-62650) pertaining to the Esterline Technologies Corporation Amended and Restated 1997 Stock Option Plan;
(4) Registration Statement (Form S-8 No. 333-85440) pertaining to the Esterline Technologies Corporation 2002 Employee Stock Purchase Plan;
(5) Registration Statement (Form S-8 No. 333-103846) pertaining to the Esterline Technologies Corporation Amended and Restated 1997 Stock Option Plan;
(6) Registration Statement (Form S-8 No. 333-113475) pertaining to the Esterline Technologies Corporation 2004 Equity Incentive Plan;
(7) Registration Statement (Form S-8 No. 333-135025) pertaining to the Esterline Technologies Corporation 2004 Equity Incentive Plan and the Esterline Technologies Corporation 2002 Employee Stock Purchase Plan;
(8) Registration Statement (Form S-8 No. 333-151823) pertaining to the Esterline
Technologies Corporation 2004 Equity Incentive Plan and the Esterline Technologies Corporation 2002 Employee Stock Purchase Plan;
of our reports dated December 19, 2008, with respect to the consolidated financial statements and schedule of Esterline Technologies Corporation, and the effectiveness of internal control over financial reporting of Esterline Technologies Corporation, included in this Annual Report (Form 10-K), for the year ended October 31, 2008. Ernst & Young LLP Seattle, Washington December 19, 2008
/s/
Exhibit 31.1
CERTIFICATIONS I, Robert W. Cremin, certify that: 1. I have reviewed this annual report on Form 10-K of Esterline Technologies Corporation; 2. Based on my knowledge, this report does not contain any untrue statement of a material fact or omit to state a material fact necessary to make the statements made, in light of the circumstances under which such statements were made, not misleading with respect to the period covered by this report; 3. Based on my knowledge, the financial statements, and other financial information included in this report, fairly present in all material respects the financial condition, results of operations and cash flows of the registrant as of, and for, the periods presented in this report; 4. The registrant’s other certifying officer(s) and I are responsible for establishing and maintaining disclosure controls and procedures (as defined in Exchange Act Rules 13a-15(e) and 15d-15(e)) and internal control over financial reporting (as defined in Exchange Act Rules 13a-15(f) and 15d-15(f)) for the registrant and have:
a) Designed such disclosure controls and procedures, or caused such disclosure controls and procedures to be designed under our supervision, to ensure that material information relating to the registrant, including its consolidated subsidiaries, is made known to us by others within those entities, particularly during the period in which this report is being prepared;
b) Designed such internal control over financial reporting, or caused such internal control over
financial reporting to be designed under our supervision, to provide reasonable assurance regarding the reliability of financial reporting and the preparation of financial statements for external purposes in accordance with generally accepted accounting principles;
c) Evaluated the effectiveness of the registrant’s disclosure controls and procedures and presented in
this report our conclusions about the effectiveness of the disclosure controls and procedures, as of the end of the period covered by this report based on such evaluation; and
d) Disclosed in this report any change in the registrant’s internal control over financial reporting that
occurred during the registrant’s most recent fiscal quarter (the registrant’s fourth quarter in the case of an annual report) that has materially affected, or is reasonably likely to materially affect, the registrant’s internal control over financial reporting; and
5. The registrant’s other certifying officer(s) and I have disclosed, based on our most recent evaluation of internal control over financial reporting, to the registrant’s auditors and the audit committee of registrant’s board of directors (or persons performing the equivalent functions):
a) All significant deficiencies and material weaknesses in the design or operation of internal control over financial reporting which are reasonably likely to adversely affect the registrant’s ability to record, process, summarize and report financial information; and
b) Any fraud, whether or not material, that involves management or other employees who have a
significant role in the registrant’s internal control over financial reporting. Dated: December 23, 2008 By: /s/ Robert W. Cremin Robert W. Cremin Chairman, President and Chief Executive Officer (Principal Executive Officer)
Exhibit 31.2
CERTIFICATIONS
I, Robert D. George, certify that: 1. I have reviewed this annual report on Form 10-K of Esterline Technologies Corporation; 2. Based on my knowledge, this report does not contain any untrue statement of a material fact or omit to state a material fact necessary to make the statements made, in light of the circumstances under which such statements were made, not misleading with respect to the period covered by this report; 3. Based on my knowledge, the financial statements, and other financial information included in this report, fairly present in all material respects the financial condition, results of operations and cash flows of the registrant as of, and for, the periods presented in this report; 4. The registrant’s other certifying officer(s) and I are responsible for establishing and maintaining disclosure controls and procedures (as defined in Exchange Act Rules 13a-15(e) and 15d-15(e)) and internal control over financial reporting (as defined in Exchange Act Rules 13a-15(f) and 15d-15(f)) for the registrant and have:
a) Designed such disclosure controls and procedures, or caused such disclosure controls and procedures to be designed under our supervision, to ensure that material information relating to the registrant, including its consolidated subsidiaries, is made known to us by others within those entities, particularly during the period in which this report is being prepared;
b) Designed such internal control over financial reporting, or caused such internal control over
financial reporting to be designed under our supervision, to provide reasonable assurance regarding the reliability of financial reporting and the preparation of financial statements for external purposes in accordance with generally accepted accounting principles;
c) Evaluated the effectiveness of the registrant’s disclosure controls and procedures and presented in
this report our conclusions about the effectiveness of the disclosure controls and procedures, as of the end of the period covered by this report based on such evaluation; and
d) Disclosed in this report any change in the registrant’s internal control over financial reporting that
occurred during the registrant’s most recent fiscal quarter (the registrant’s fourth quarter in the case of an annual report) that has materially affected, or is reasonably likely to materially affect, the registrant’s internal control over financial reporting; and
5. The registrant’s other certifying officer(s) and I have disclosed, based on our most recent evaluation of internal control over financial reporting, to the registrant’s auditors and the audit committee of registrant’s board of directors (or persons performing the equivalent functions):
a) All significant deficiencies and material weaknesses in the design or operation of internal control over financial reporting which are reasonably likely to adversely affect the registrant’s ability to record, process, summarize and report financial information; and
b) Any fraud, whether or not material, that involves management or other employees who have a
significant role in the registrant’s internal control over financial reporting. Dated: December 23, 2008 By: /s/ Robert D. George Robert D. George Vice President, Chief Financial Officer, Secretary and Treasurer (Principal Financial Officer)
Exhibit 32.1
CERTIFICATION PURSUANT TO 18 U.S.C. SECTION 1350,
AS ADOPTED PURSUANT TO SECTION 906 OF THE SARBANES-OXLEY ACT OF 2002
In connection with the Annual Report of Esterline Technologies Corporation (the “Company”) on Form 10-K for the fiscal year ended October 31, 2008 as filed with the Securities and Exchange Commission on the date hereof (the “Form 10-K”), I, Robert W. Cremin, Chief Executive Officer of the Company, certify, pursuant to 18 U.S.C. §1350, as adopted pursuant to §906 of the Sarbanes-Oxley Act of 2002, that:
(1) The Form 10-K fully complies with the requirements of Section 13(a) or 15(d) of the Securities Exchange Act of 1934 (15 U.S.C. 78m or 78o(d)); and
(2) The information contained in the Form 10-K fairly presents, in all material respects,
the financial condition and results of operations of the Company.
Dated: December 23, 2008
By: /s/ Robert W. Cremin Robert W. Cremin Chairman, President and Chief Executive Officer
Exhibit 32.2
CERTIFICATION PURSUANT TO 18 U.S.C. SECTION 1350,
AS ADOPTED PURSUANT TO SECTION 906 OF THE SARBANES-OXLEY ACT OF 2002
In connection with the Annual Report of Esterline Technologies Corporation (the “Company”) on Form 10-K for the fiscal year ended October 31, 2008 as filed with the Securities and Exchange Commission on the date hereof (the “the Form 10-K”), I, Robert D. George, Chief Financial Officer of the Company, certify, pursuant to 18 U.S.C. §1350, as adopted pursuant to §906 of the Sarbanes-Oxley Act of 2002, that:
(1) The Form 10-K fully complies with the requirements of Section 13(a) or 15(d) of the Securities Exchange Act of 1934 (15 U.S.C. 78m or 78o(d)); and
(2) The information contained in the Form 10-K fairly presents, in all material respects,
the financial condition and results of operations of the Company.
Dated: December 23, 2008
By: /s/ Robert D. George Robert D. George Vice President, Chief Financial Officer, Secretary and Treasurer


NOTICE OF ANNUAL MEETING AND PROXY STATEMENT
ESTERLINE TECHNOLOGIES CORPORATION
500 108th Avenue NE Bellevue, Washington 98004
___________
NOTICE OF ANNUAL MEETING OF SHAREHOLDERS To Be Held March 4, 2009
___________ To the Shareholders of Esterline Technologies Corporation: NOTICE IS HEREBY GIVEN that the 2009 annual meeting of shareholders for ESTERLINE TECHNOLOGIES CORPORATION, a Delaware corporation (the “Company”), will be held on Wednesday, March 4, 2009, at 10:00 a.m. (local time), at the Harbor Club - Bellevue, Bellevue, Washington, for the following purposes:
(1) to elect as directors of the Company the four nominees named in the attached proxy statement;
(2) to ratify the selection of Ernst & Young LLP as the Company’s independent registered public accounting firm for the fiscal year ending October 30, 2009;
(3) to transact such other business as may properly come before the meeting or any adjournment or
postponement thereof. The Board of Directors has fixed the close of business on January 6, 2009, as the record date for determination of shareholders entitled to notice of and to vote at the meeting or any adjournment or postponement thereof. The Company’s Annual Report for fiscal year 2008 is provided for your convenience. By order of the Board of Directors ROBERT D. GEORGE Vice President, Chief Financial Officer, Secretary and Treasurer January 23, 2009

PROXY STATEMENT
ANNUAL MEETING OF SHAREHOLDERS To Be Held March 4, 2009
___________
This proxy statement, which is first being provided to shareholders on or about January 23, 2009, has been prepared in connection with the solicitation by the Board of Directors of Esterline Technologies Corporation (the “Company”) of proxies in the accompanying form to be voted at the 2009 annual meeting of shareholders of the Company to be held on Wednesday, March 4, 2009, at 10:00 a.m (local time)., at the Harbor Club - Bellevue, 777 108th Avenue NE, Bellevue, Washington 98004, and at any adjournment or postponement thereof. The Company’s principal executive office is at 500 108th Avenue NE, Bellevue, Washington 98004. The cost of this solicitation will be borne by the Company. In addition to solicitation by mail, officers and employees of the Company may, without additional compensation, solicit the return of proxies by telephone, telegram, messenger, facsimile transmission or personal interview. Arrangements may also be made with brokerage houses and other custodians, nominees and fiduciaries to send proxies and proxy material to their principals and the Company may reimburse such persons for their expenses in so doing. Registered shareholders can vote in person, by telephone, by the Internet, by telephone or by mail, as described below. If you are a beneficial shareholder, please refer to the information forwarded by your broker, bank or other holder of record to see what options are available to you. Registered shareholders may cast their vote by:
(1) Attending and voting in person at the annual meeting; (2) Accessing the Internet website specified in the Notice of Internet Availability and following the
instructions provided on the website (or if printed copies of the proxy materials were requested, as specified in the printed proxy card);
(3) Calling the telephone number specified in the Notice of Internet Availability and voting by following the
instructions provided on the phone line (or if copies of the proxy materials were requested, as specified in the printed proxy card); or
(4) Requesting a printed proxy card and completing, signing, dating and promptly mailing the proxy card in
the envelope provided. Any proxy given pursuant to the solicitation may be revoked at any time prior to being voted. A proxy may be revoked by the record holder or other person entitled to vote (a) by attending the meeting in person and voting the shares, (b) by executing another proxy dated as of a later date or (c) by notifying the Secretary of the Company in writing, at the Company’s address set forth on the notice of the meeting, provided that such notice is received by the Secretary prior to the meeting date. All shares represented by valid proxies will be voted at the meeting. Proxies will be voted in accordance with the specification made therein or, in the absence of specification, in accordance with the provisions of the proxy. The Board of Directors has fixed the close of business on January 6, 2009, as the record date for determining the holders of common stock of the Company (the “Common Stock”) entitled to notice of and to vote at the annual meeting. The Common Stock is listed for trading on the New York Stock Exchange. At the close of business on the record date there were outstanding and entitled to vote 29,689,453 shares of Common Stock, which are entitled to one vote per share on all matters which properly come before the annual meeting. The presence in person or by proxy of the holders of a majority of the outstanding shares of Common Stock entitled to vote is required to constitute a quorum for the transaction of business at the meeting. The inspector of elections, who determines whether or not a quorum is present at the annual meeting, will count abstentions or withheld votes and broker non-votes, which are discussed further below, as shares of Common Stock that are present and entitled to vote for purposes of determining the presence of a quorum. There must be a quorum for the
1
meeting to be held. The Company has appointed BNY Mellon Shareowner Services as the inspector of elections for the annual meeting. Votes cast by proxy or in person at the annual meeting will be tabulated by the inspector of election appointed for the annual meeting. The inspector of election will treat abstentions as shares of Common Stock that are present and entitled to vote for purposes of determining the presence of a quorum. A plurality of the shares of Common Stock present in person or represented by proxy at the meeting is required for the election of directors. Shareholders are not entitled to cumulate votes in electing directors. An affirmative vote of a majority of the shares of Common Stock present in person or represented by proxy and entitled to vote at the meeting is required for approval of the proposal to ratify the selection of Ernst & Young LLP as the Company’s independent registered public accounting firm for fiscal year 2009. Broker non-votes will not be considered votes cast or shares entitled to vote at the meeting and as a result, they will have no effect on the vote relating to the election of directors or the ratification of the selection of the Company’s independent registered public accounting firm. Broker non-votes occur when a person holding shares through a bank or brokerage account does not provide instructions as to how his or her shares should be voted and the broker does not exercise discretion to vote those shares on a particular matter. Brokers may exercise discretion to vote shares as to which instructions are not given with respect to the election of directors and ratification of the selection of Ernst & Young LLP as the Company’s independent registered public accounting firm.
ELECTION OF DIRECTORS
The Company’s By-Laws, as amended and restated, provide for a board of directors that consists of not less than seven (7) or more than twelve (12) members, as may be fixed from time to time by the Board of Directors. The authorized size of the board is currently set at ten. The Company’s Restated Certificate of Incorporation provides that the directors will be divided into three classes, with the classes serving for staggered, three-year terms such that approximately one-third of the directors are elected each year. In accordance with the Company’s Corporate Governance Guidelines, which requires directors to tender their resignation prior to the annual meeting of shareholders following their 72nd birthday, Admiral Charles R. Larson and Mr. James L. Pierce have both advised the Board that they will retire as directors at the conclusion of the 2009 annual meeting. In light of the retirements of Admiral Larson and Mr. Pierce, by resolution of the Board of Directors effective at the end of the 2009 annual meeting, the number of authorized members of the Board of Directors will be reduced to eight. In addition, in order to allocate such decrease among the three classes of directors so as to make them as nearly equal in number as possible, Mr. Lewis E. Burns has been reclassed into the class of directors whose term expires at the 2009 annual meeting and Mr. Paul V. Haack has been reclassed into the
The Board of Directors recommends a vote FOR its director nominees named below. Information as to each nominee and each director whose term will continue after the 2009 annual meeting is provided below. Unless otherwise instructed, it is the intention of the persons named in the accompanying proxy to vote shares represented by properly executed proxies FOR the election of the nominees named below. The Board of Directors knows of no reason why any of its nominees will be unable or unwilling to serve. If any nominee becomes unavailable to serve, the Board of Directors intends for the persons named as proxies to vote for the election of such other persons, if any, as the Board of Directors may recommend. Nominees to the class of directors whose term will expire at the 2012 annual meeting: Lewis E. Burns President and Chief Executive Officer (Retired), Dover Industries, Inc. Age 70. Prior to January 2005, Mr. Burns was a Director/Consultant of Dover Industries, Inc. (a diversified manufacturing company), having held such positions since July 2003. Prior to that time, he was President, Chief Executive Officer and Director of Dover Industries, Inc. since 1985. He has been a director of the Company since 2003.
2
class of directors whose term expires at the 2010 annual meeting.
Robert S. Cline Chairman and Chief Executive Officer (Retired), Airborne Freight Corporation. Age 71. Prior to January 2003, Mr. Cline was the Chairman and Chief Executive Officer of Airborne Freight Corporation (an air express company), having held such positions since 1984. He has been a director of the Company since 1999. Jerry D. Leitman Chairman (Retired), FuelCell Energy, Inc. Age 66. Mr. Leitman was the Chairman of the Board of FuelCell Energy, Inc. (a fuel cell company) from January 2006 to January 2007. Previously, he was Chairman and Chief Executive Officer of FuelCell Energy, Inc. since September 2005 and Chairman, President and Chief Executive Officer since June 2002. He has been a director of the Company since 1998. Nominees to the class of directors whose term will expire at the 2010 annual meeting: Paul V. Haack Senior Partner (Retired), Deloitte & Touche LLP. Age 57. Prior to 2006, Mr. Haack was a Senior Partner with Deloitte & Touche LLP (a public accounting firm) on the Boeing and United Airlines accounts in their Chicago office, having held such positions since 2001 and 2002, respectively. He is also a director of SonoSite, Inc. He has been a director of the Company since 2006. Continuing directors: John F. Clearman Special Advisor to the Board (Retired), Milliman USA. Age 71. Prior to January 2003, Mr. Clearman was a Special Advisor to the Board of Milliman USA (an actuarial consulting firm), having held such position since August 2001. He is also a director for several other companies including Oberto Sausage, Inc., Washington Federal Savings, Inc., and Barclay Dean Interiors. He has been a director of the Company since 1989, and his current term expires in 2010. Robert W. Cremin Chairman, President and Chief Executive Officer, Esterline Technologies Corporation. Age 68. Mr. Cremin has been Chairman since January 2001. In addition, he has served as Chief Executive Officer and President since January 1999 and September 1997, respectively. He has been a director of the Company since 1998, and his current term expires in 2011. Anthony P. Franceschini Director, President and Chief Executive Officer, Stantec Inc. Age 57. Mr. Franceschini has been the Director, President and Chief Executive Officer of Stantec Inc. (an engineering, architecture and related professional services design firm) since June 1998. He is also a director of Alberta Health Services. He has been a director of the Company since 2002, and his current term expires in 2011. James J. Morris Vice President, Engineering and Manufacturing (Retired), The Boeing Company. Age 60. Prior to 2007, Mr. Morris was the Vice President, Engineering and Manufacturing, of The Boeing Company, having held that position since 2005. Prior to that time, he was Vice President, Supplier Management, of The Boeing Company since 2000. He is also a director of LORD Corporation and 2Source Manufacturing Inc. Since 2007, he has been a consultant to Thales S.A. and since 2008, a consultant to Héroux-Devtek, Inc. He has been a director of the Company since 2007, and his current term expires in 2011.
3
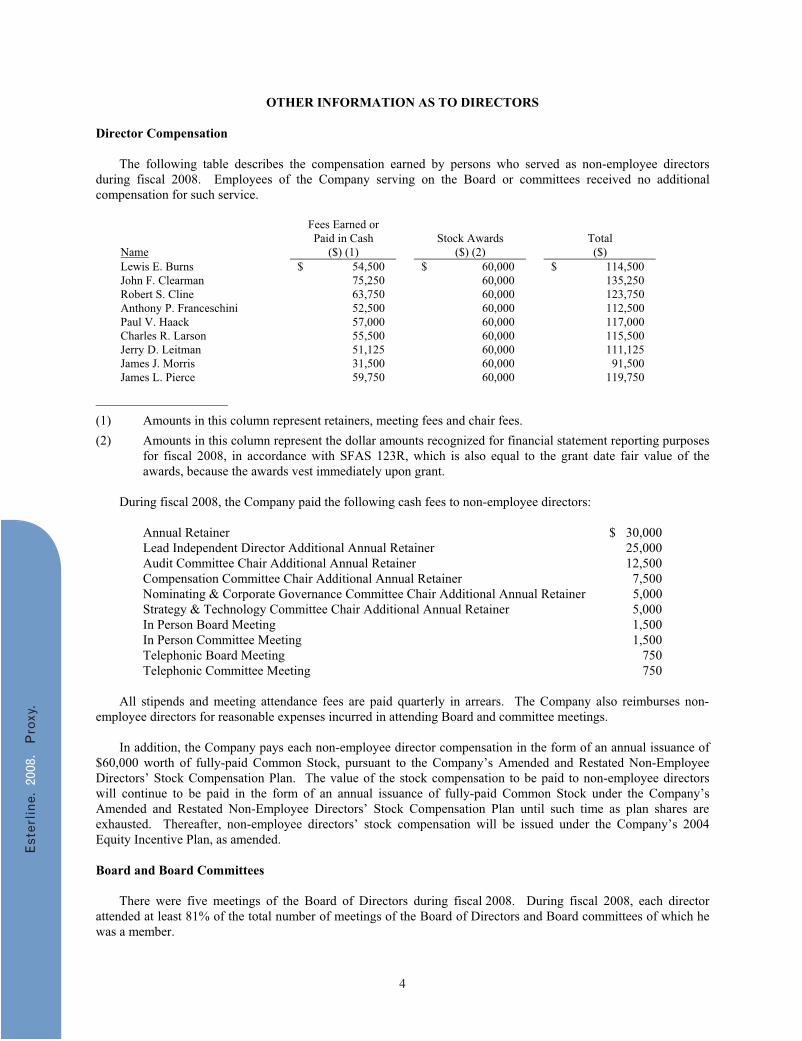
OTHER INFORMATION AS TO DIRECTORS Director Compensation The following table describes the compensation earned by persons who served as non-employee directors during fiscal 2008. Employees of the Company serving on the Board or committees received no additional compensation for such service.
Name
Fees Earned or Paid in Cash
($) (1)
Stock Awards
($) (2)
Total ($)
Lewis E. Burns $ 54,500 $ 60,000 $ 114,500 John F. Clearman 75,250 60,000 135,250 Robert S. Cline 63,750 60,000 123,750 Anthony P. Franceschini 52,500 60,000 112,500 Paul V. Haack 57,000 60,000 117,000 Charles R. Larson 55,500 60,000 115,500 Jerry D. Leitman 51,125 60,000 111,125 James J. Morris 31,500 60,000 91,500 James L. Pierce 59,750 60,000 119,750
____________________
(1) Amounts in this column represent retainers, meeting fees and chair fees.
(2) Amounts in this column represent the dollar amounts recognized for financial statement reporting purposes for fiscal 2008, in accordance with SFAS 123R, which is also equal to the grant date fair value of the awards, because the awards vest immediately upon grant.
During fiscal 2008, the Company paid the following cash fees to non-employee directors: Annual Retainer $ 30,000 Lead Independent Director Additional Annual Retainer 25,000 Audit Committee Chair Additional Annual Retainer 12,500 Compensation Committee Chair Additional Annual Retainer 7,500 Nominating & Corporate Governance Committee Chair Additional Annual Retainer 5,000 Strategy & Technology Committee Chair Additional Annual Retainer 5,000 In Person Board Meeting 1,500 In Person Committee Meeting 1,500 Telephonic Board Meeting 750 Telephonic Committee Meeting 750 All stipends and meeting attendance fees are paid quarterly in arrears. The Company also reimburses non-employee directors for reasonable expenses incurred in attending Board and committee meetings. In addition, the Company pays each non-employee director compensation in the form of an annual issuance of $60,000 worth of fully-paid Common Stock, pursuant to the Company’s Amended and Restated Non-Employee Directors’ Stock Compensation Plan. The value of the stock compensation to be paid to non-employee directors will continue to be paid in the form of an annual issuance of fully-paid Common Stock under the Company’s Amended and Restated Non-Employee Directors’ Stock Compensation Plan until such time as plan shares are exhausted. Thereafter, non-employee directors’ stock compensation will be issued under the Company’s 2004 Equity Incentive Plan, as amended. Board and Board Committees There were five meetings of the Board of Directors during fiscal 2008. During fiscal 2008, each director attended at least 81% of the total number of meetings of the Board of Directors and Board committees of which he was a member.
4
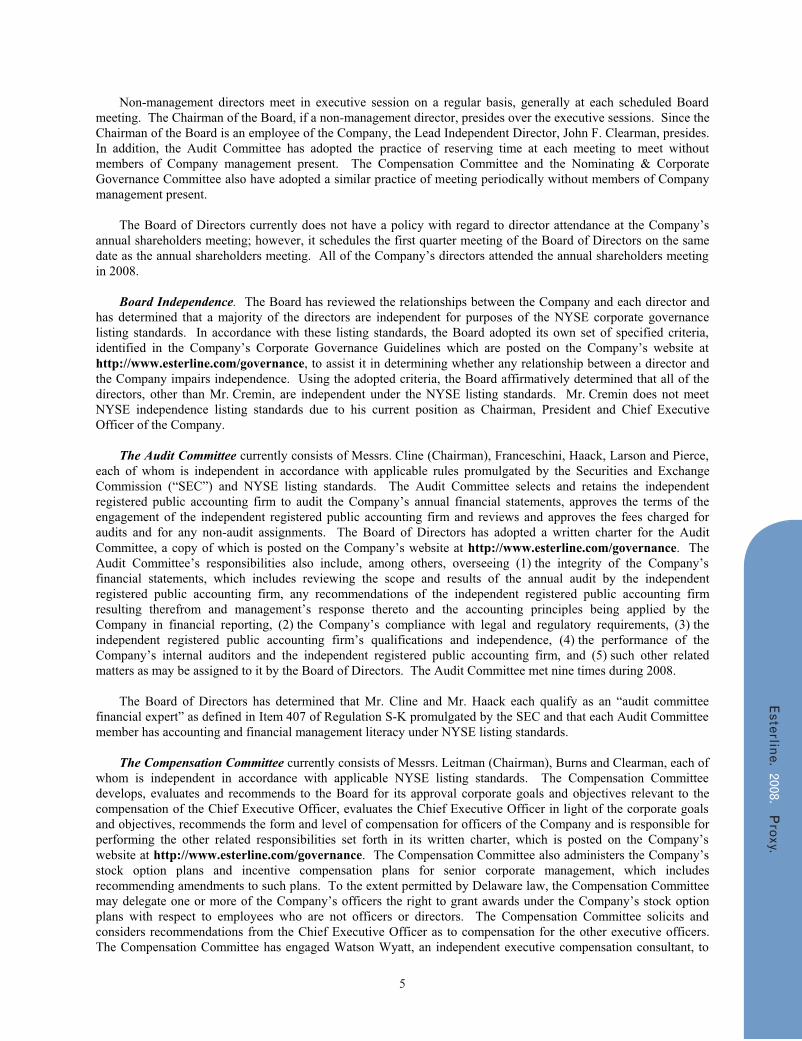
Non-management directors meet in executive session on a regular basis, generally at each scheduled Board meeting. The Chairman of the Board, if a non-management director, presides over the executive sessions. Since the Chairman of the Board is an employee of the Company, the Lead Independent Director, John F. Clearman, presides. In addition, the Audit Committee has adopted the practice of reserving time at each meeting to meet without members of Company management present. The Compensation Committee and the Nominating & Corporate Governance Committee also have adopted a similar practice of meeting periodically without members of Company management present. The Board of Directors currently does not have a policy with regard to director attendance at the Company’s annual shareholders meeting; however, it schedules the first quarter meeting of the Board of Directors on the same date as the annual shareholders meeting. All of the Company’s directors attended the annual shareholders meeting in 2008. Board Independence. The Board has reviewed the relationships between the Company and each director and has determined that a majority of the directors are independent for purposes of the NYSE corporate governance listing standards. In accordance with these listing standards, the Board adopted its own set of specified criteria, identified in the Company’s Corporate Governance Guidelines which are posted on the Company’s website at http://www.esterline.com/governance, to assist it in determining whether any relationship between a director and the Company impairs independence. Using the adopted criteria, the Board affirmatively determined that all of the directors, other than Mr. Cremin, are independent under the NYSE listing standards. Mr. Cremin does not meet NYSE independence listing standards due to his current position as Chairman, President and Chief Executive Officer of the Company. The Audit Committee currently consists of Messrs. Cline (Chairman), Franceschini, Haack, Larson and Pierce, each of whom is independent in accordance with applicable rules promulgated by the Securities and Exchange Commission (“SEC”) and NYSE listing standards. The Audit Committee selects and retains the independent registered public accounting firm to audit the Company’s annual financial statements, approves the terms of the engagement of the independent registered public accounting firm and reviews and approves the fees charged for audits and for any non-audit assignments. The Board of Directors has adopted a written charter for the Audit Committee, a copy of which is posted on the Company’s website at http://www.esterline.com/governance. The Audit Committee’s responsibilities also include, among others, overseeing (1) the integrity of the Company’s financial statements, which includes reviewing the scope and results of the annual audit by the independent registered public accounting firm, any recommendations of the independent registered public accounting firm resulting therefrom and management’s response thereto and the accounting principles being applied by the Company in financial reporting, (2) the Company’s compliance with legal and regulatory requirements, (3) the independent registered public accounting firm’s qualifications and independence, (4) the performance of the Company’s internal auditors and the independent registered public accounting firm, and (5) such other related matters as may be assigned to it by the Board of Directors. The Audit Committee met nine times during 2008. The Board of Directors has determined that Mr. Cline and Mr. Haack each qualify as an “audit committee financial expert” as defined in Item 407 of Regulation S-K promulgated by the SEC and that each Audit Committee member has accounting and financial management literacy under NYSE listing standards. The Compensation Committee currently consists of Messrs. Leitman (Chairman), Burns and Clearman, each of whom is independent in accordance with applicable NYSE listing standards. The Compensation Committee develops, evaluates and recommends to the Board for its approval corporate goals and objectives relevant to the compensation of the Chief Executive Officer, evaluates the Chief Executive Officer in light of the corporate goals and objectives, recommends the form and level of compensation for officers of the Company and is responsible for performing the other related responsibilities set forth in its written charter, which is posted on the Company’s website at http://www.esterline.com/governance. The Compensation Committee also administers the Company’s stock option plans and incentive compensation plans for senior corporate management, which includes recommending amendments to such plans. To the extent permitted by Delaware law, the Compensation Committee may delegate one or more of the Company’s officers the right to grant awards under the Company’s stock option plans with respect to employees who are not officers or directors. The Compensation Committee solicits and considers recommendations from the Chief Executive Officer as to compensation for the other executive officers. The Compensation Committee has engaged Watson Wyatt, an independent executive compensation consultant, to
5
Committee met seven times during 2008. The Executive Committee currently consists of Messrs. Cremin (Chairman), Clearman, Franceschini and Leitman. The Executive Committee reviews situations that might, at some future time, become items for consideration of the entire Board of Directors and acts on behalf of the entire Board of Directors between its meetings. The Executive Committee did not meet during 2008. The Nominating & Corporate Governance Committee currently consists of Messrs. Burns (Chairman), Cline and Franceschini, each of whom is independent in accordance with applicable NYSE listing standards. The Nominating & Corporate Governance Committee recommends director candidates to the entire Board, oversees the evaluation of the Board of Directors and Company management, develops and monitors corporate governance principles, practices and guidelines for the Board of Directors and the Company, and is responsible for performing the other related responsibilities set forth in its written charter, which is posted on the Company’s website at http://www.esterline.com/governance. The Nominating & Corporate Governance Committee met four times during 2008. The Strategy & Technology Committee currently consists of Messrs. Pierce (Chairman), Haack, Larson and Morris. The Technology Committee reviews and makes recommendations to the Board of Directors regarding business and technology acquisition opportunities, monitors and evaluates the execution and performance of significant new product and technology launches, and monitors and evaluates the Company’s research and development programs. The Technology Committee met eight times during 2008. Director Nominations and Qualifications In accordance with the Company’s By-Laws, as amended and restated, any shareholder entitled to vote for the election of directors at the annual meeting may nominate persons for election as directors at the 2010 annual shareholders meeting only if the Corporate Secretary receives written notice of any such nominations no earlier than October 4, 2009, and no later than November 3, 2009. Such nominations should be sent to: Esterline Technologies Corporation, Attn: Corporate Secretary, 500 108th Avenue NE, Suite 1500, Bellevue, WA 98004. Any shareholder notice of intention to nominate a director shall include:
� the name and address of the shareholder;
� a representation that the shareholder is entitled to vote at the meeting at which directors will be elected;
� the number of shares of the Company that are beneficially owned by the shareholder;
� a representation that the shareholder intends to appear in person or by proxy at the meeting to nominate the person or persons specified in the notice;
� the following information with respect to the person nominated by the shareholder:
� name and address;
� other information regarding such nominee as would be required in a proxy statement filed pursuant to applicable rules promulgated by the SEC; and
� a description of any arrangements or understandings between the shareholder and the nominee and any other persons (including their names), pursuant to which the nomination is made; and
� the consent of each such nominee to serve as a director if elected. The Chairman of the Board, other directors or senior management of the Company may also recommend director nominees. The Nominating & Corporate Governance Committee will evaluate recommended director nominees, including those that are submitted to the Company by a shareholder, taking into consideration certain criteria such as business and community service skills and experience, policy-making experience, record of accomplishments, personal integrity and high moral responsibility, capacity to evaluate strategy and reach sound conclusions and current Board composition. In addition, prospective directors must have time available to devote to Board activities and be able to work well with the Chief Executive Officer and other members of the Board.
6
help the Committee develop and review compensation programs for Company executives. The Compensation
The Company did not receive any shareholder nominations for director to be considered by the Nominating & Corporate Governance Committee for the 2009 annual shareholders meeting. Communications with the Board Shareholders, and other interested parties, may contact Mr. Clearman, as the Lead Independent Director, the non-management directors as a group, the Board of Directors as a group or an individual director by the following means: Email: [email protected] Mail: Board of Directors Attn: Lead Independent Director or Corporate Secretary Esterline Technologies Corporation 500 108th Avenue NE, Suite 1500 Bellevue, WA 98004 Each communication should clearly specify the name of the individual director or group of directors to whom the communication is addressed. Communications sent by email are delivered directly to the Lead Independent Director and to the Corporate Secretary, who will promptly forward such communications to the specified director addressees. Communications sent by mail will be promptly forwarded by the Corporate Secretary to the specified director addressee or, if such communication is addressed to the full Board of Directors, to the Chairman of the Board and the Lead Independent Director, who will promptly forward such communication to the full Board of Directors. Shareholders wishing to submit proposals for inclusion in the proxy statement relating to the 2010 annual shareholders meeting should follow the procedures specified under “Shareholder Proposals for 2010” below. Shareholders wishing to nominate or recommend directors should follow the procedures specified under “Other Information as to Directors—Director Nominations and Qualifications” above.
CODE OF ETHICS The Company has adopted a code of ethics that applies to its accounting and financial employees, including the Chief Executive Officer and Chief Financial Officer. This code of ethics, which is included as part of the Company’s Code of Business Conduct and Ethics that applies to the Company’s employees and directors, is posted on the Company’s website at http://www.esterline.com/governance. The Company intends to satisfy the disclosure requirement under Item 5.05 of Form 8-K regarding an amendment to or waiver from application of the code of ethics provisions of the Code of Business Conduct and Ethics that applies to the Chief Executive Officer or the Chief Financial Officer, and any other applicable accounting and financial employee, by posting such information on its website at http://www.esterline.com/governance.
SECURITY OWNERSHIP OF CERTAIN BENEFICIAL OWNERS AND MANAGEMENT The following table sets forth certain information regarding beneficial ownership of shares of Common Stock as of January 6, 2009, by (i) each person or entity who is known by the Company to own beneficially more than 5% of the Common Stock, (ii) each of the Company’s directors, (iii) each of the Company’s Named Executive Officers and (iv) all directors and executive officers of the Company as a group.
7
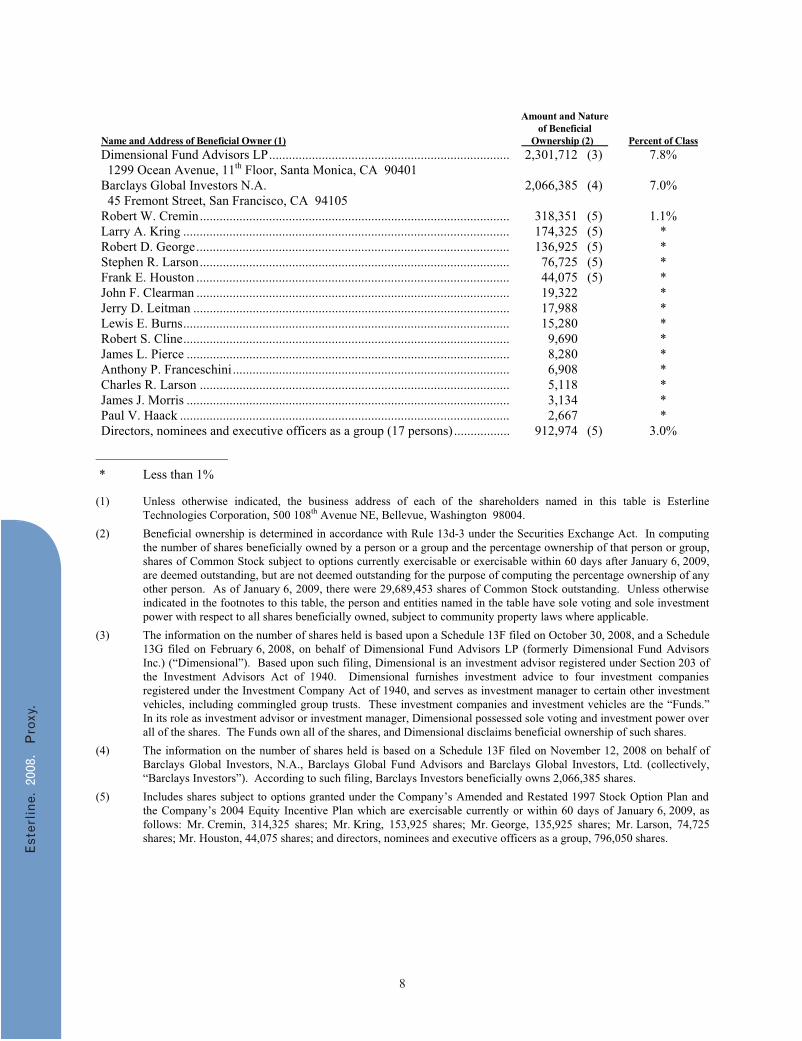
Name and Address of Beneficial Owner (1)
Amount and Nature of Beneficial
Ownership (2) Percent of Class Dimensional Fund Advisors LP.......................................................................... 2,301,712 (3) 7.8% 1299 Ocean Avenue, 11th Floor, Santa Monica, CA 90401 Barclays Global Investors N.A. 2,066,385 (4) 7.0% 45 Fremont Street, San Francisco, CA 94105 Robert W. Cremin............................................................................................... 318,351 (5) 1.1% Larry A. Kring .................................................................................................... 174,325 (5) * Robert D. George................................................................................................ 136,925 (5) * Stephen R. Larson............................................................................................... 76,725 (5) * Frank E. Houston ................................................................................................ 44,075 (5) * John F. Clearman ................................................................................................ 19,322 * Jerry D. Leitman ................................................................................................. 17,988 * Lewis E. Burns.................................................................................................... 15,280 * Robert S. Cline.................................................................................................... 9,690 * James L. Pierce ................................................................................................... 8,280 * Anthony P. Franceschini..................................................................................... 6,908 * Charles R. Larson ............................................................................................... 5,118 * James J. Morris ................................................................................................... 3,134 * Paul V. Haack ..................................................................................................... 2,667 * Directors, nominees and executive officers as a group (17 persons) .................. 912,974 (5) 3.0%
____________________
* Less than 1%
(1) Unless otherwise indicated, the business address of each of the shareholders named in this table is Esterline Technologies Corporation, 500 108th Avenue NE, Bellevue, Washington 98004.
(2) Beneficial ownership is determined in accordance with Rule 13d-3 under the Securities Exchange Act. In computing the number of shares beneficially owned by a person or a group and the percentage ownership of that person or group, shares of Common Stock subject to options currently exercisable or exercisable within 60 days after January 6, 2009, are deemed outstanding, but are not deemed outstanding for the purpose of computing the percentage ownership of any other person. As of January 6, 2009, there were 29,689,453 shares of Common Stock outstanding. Unless otherwise indicated in the footnotes to this table, the person and entities named in the table have sole voting and sole investment power with respect to all shares beneficially owned, subject to community property laws where applicable.
(3) The information on the number of shares held is based upon a Schedule 13F filed on October 30, 2008, and a Schedule 13G filed on February 6, 2008, on behalf of Dimensional Fund Advisors LP (formerly Dimensional Fund Advisors Inc.) (“Dimensional”). Based upon such filing, Dimensional is an investment advisor registered under Section 203 of the Investment Advisors Act of 1940. Dimensional furnishes investment advice to four investment companies registered under the Investment Company Act of 1940, and serves as investment manager to certain other investment vehicles, including commingled group trusts. These investment companies and investment vehicles are the “Funds.” In its role as investment advisor or investment manager, Dimensional possessed sole voting and investment power over all of the shares. The Funds own all of the shares, and Dimensional disclaims beneficial ownership of such shares.
(4) The information on the number of shares held is based on a Schedule 13F filed on November 12, 2008 on behalf of Barclays Global Investors, N.A., Barclays Global Fund Advisors and Barclays Global Investors, Ltd. (collectively, “Barclays Investors”). According to such filing, Barclays Investors beneficially owns 2,066,385 shares.
(5) Includes shares subject to options granted under the Company’s Amended and Restated 1997 Stock Option Plan and the Company’s 2004 Equity Incentive Plan which are exercisable currently or within 60 days of January 6, 2009, as follows: Mr. Cremin, 314,325 shares; Mr. Kring, 153,925 shares; Mr. George, 135,925 shares; Mr. Larson, 74,725 shares; Mr. Houston, 44,075 shares; and directors, nominees and executive officers as a group, 796,050 shares.
8
EXECUTIVE COMPENSATION
COMPENSATION DISCUSSION AND ANALYSIS The Compensation Committee of the Board of Directors works to provide our executives with competitive compensation opportunities that reward good performance and promote shareholder interests. The Committee currently consists of Messrs. Leitman (Chairman), Burns and Clearman, each of whom is independent in accordance with applicable NYSE listing standards and rules of the Securities and Exchange Commission. We base our executive compensation practices on principles designed to align executive compensation with Company business strategy, management initiatives, financial objectives and performance. In applying these principles, the Committee has established an executive compensation program to:
� Attract and retain key executives critical to the success of the Company;
� Support a performance-oriented environment that rewards both the Company’s annual financial results and its longer-term achievements as compared to market benchmarks; and
� Reward executives for long-term strategic management and the enhancement of shareholder value.
The Committee applies the same philosophy, objectives, and methods for establishing the CEO’s compensation as it does for all other executive officers. The Committee and the full Board approve all officer compensation programs and they establish individual pay levels for all executive officers. Compensation Program Components We believe the components of our compensation program provide an appropriate mix of fixed and variable pay; balance shorter-term operational performance with long-term increases in shareholder value; reinforce a performance-oriented environment; and encourage recruitment and retention of our key executives. The Committee reviews the executive compensation program annually and makes adjustments as appropriate to meet Company objectives. In fiscal 2008, our executive compensation program had the following principal components:
� Base salary, which is fixed annual cash compensation that is competitive with market salary levels for the skills and experience necessary to lead the Company.
� Annual cash incentive, which provides cash incentive awards based on Company performance against specific targets, with the purpose of motivating and rewarding achievement of our critical yearly strategic and financial goals, thus fostering a performance-oriented environment.
� Long-term incentives through the combination of stock option grants and a cash-based long-term incentive program, which align officers’ interests with those of our shareholders, motivate and reward profitable Company growth over the long-term, and provide a retention incentive.
� Retirement earnings opportunities through a 401(k) savings plan, a traditional pension plan, and two supplemental executive retirement and deferred compensation programs which provide competitive retirement benefits, encourage retention and allow executives to save for their retirement and to defer taxation.
� Limited perquisites mainly involving automobile allowances and financial planning advisory services that are common in the marketplace and that allow executives to focus more of their time on achieving the Company’s goals and objectives.
� Change in control agreements with common terms that encourage officers to remain focused on Company business in the event of rumored or actual change in corporate control.
9
Determination of Compensation Levels Competitiveness
To attract and retain key executives, the Committee annually reviews the executive labor market in which we compete for talent. With the help of Watson Wyatt Worldwide, an independent executive compensation consultant, the Committee compares compensation levels for our executives to the compensation paid to executives of comparable companies in the market in which we compete for employees. In determining fiscal 2008 compensation, the Committee relied on the following published surveys to gain an understanding of the market for positions of comparable responsibility:
� 2007/2008 Watson Wyatt Top Management Compensation Report – Durable Goods Manufacturing Data. This survey covers 440 companies. Regression (trend-line) analysis is used to extrapolate compensation salary and annual incentive values for revenues comparable to those managed by our executives.
� 2007 Mercer Executive Survey – Durable Goods Manufacturing Data. This survey covers 274 companies. Regression (trend-line) analysis is used to extrapolate compensation values for revenues comparable to those managed by our executives.
�
The Committee reviewed and compared the executives’ aggregate target direct compensation (base salary, short- and long-term incentives) against the aggregate compensation offered to executives in the market surveys. In doing so the Committee reviews 25th, 50th and 75th percentile values. For further information as to the Committee’s use of these market reference points, see the discussion below concerning each compensation component. Components of Executive Officer Compensation When the Committee evaluates any significant component of an executive officer’s total compensation, it considers the aggregate amounts and mix of all components in making its decision. For fiscal 2008, the Committee reviewed all components of compensation for each executive officer to get a complete picture of the total compensation opportunities awarded, including base salary, short-term incentive compensation, long-term incentive compensation, retirement earnings opportunities, the dollar value to the executive and cost to the Company of all perquisites and other personal benefits, and the earnings and the potential payout obligations under change in control scenarios. Based on this review, the Committee determined that the executive officers’ total compensation opportunities were competitive, reasonable and not excessive.
The Committee believes the executive compensation program should be structured so that the payouts from the annual incentive plan and the cash-based long-term incentive plan relate closely to the Company’s performance. Accordingly, in fiscal 2008, the Committee provided executives with compensation packages that, in addition to base salary, would pay cash incentives of up to 114.8% of base salary for achieving target Company performance.
10
2007/2008 Watson Wyatt Top Management Compensation Report – General Industry Long Term Incentives annual multiple tables. This survey covers 223 companies and reports long-term incentive values for 2,236 executives as a multiple of base salary for various base salary levels.
In developing and reviewing the Company’s executive incentive programs, the Committee has analyzed the business risks inherent in program designs to ensure they do not induce executives to take unacceptable levels of business risk for the purpose of increasing their incentive plan awards at the expense of shareholder interests. The Committee is satisfied that the plan designs are conservative in this respect and that together the compensation components work as a check and balance to ensure executive incentives are fully consistent with shareholder interests. For example, the annual incentive compensation plan’s goal to maximize current year earnings per share is balanced
by stock option grants that vest incrementally over four years, and that have the potential to increase in value over the full ten-year term of the grant. Thus, these longer term programs deter any appreciable risk that executives would maximize current year earnings in a manner that would impair the Company’s future results.
by the Company’s long-term incentive plan that measures growth in earnings per share over a three-year period, and
Base Salary The Committee targets base salaries to be competitive in light of relative performance of other organizations in the marketplaces in which we compete for key executive officers. Based on the salary surveys listed above, and with the assistance of Watson Wyatt Worldwide, the Committee has developed and maintains a salary structure for the executive positions that defines a range of salary opportunities for each position. The range takes into account competitive norms, scope and complexity of responsibilities, internal equity, and the Company’s financial condition.
Annual Incentive Compensation Plan We provide executives with annual incentive award opportunities contingent upon meeting pre-defined financial goals for the year. The purpose of the annual incentive plan is to encourage our officers to make prudent decisions that will strengthen current year financial results for shareholders. For fiscal 2008, the Committee identified a target award amount of annual incentive compensation for each participant expressed as a percentage of base salary. This percentage varied in proportion to the level of the individual executive’s responsibility within the Company and took into account the comparative median (50th percentile) incentive compensation percentages from compensation surveys. The target award amount was not guaranteed, but reflected what would be payable if targeted results were achieved. The following table shows the fiscal 2008 target award amount for each named executive officer under our annual incentive plan:
Executive Title Target Annual Incentive
Compensation as % of Base Salary Robert W. Cremin Chairman, President and Chief
Executive Officer 60%
Robert D. George Vice President, Chief Financial Officer, Secretary and Treasurer
40%
Frank E. Houston Group Vice President 35% Larry A. Kring Group Vice President 40% Stephen R. Larson Vice President, Strategy and
Technology 40%
No executive was eligible to receive annual incentive compensation unless the Company achieved a minimum level of performance recommended by the Committee and approved by the Board. Upon achievement of the minimum performance level, each executive would earn 25% of his target award amount, which amount increased in correlation with Company performance up to a maximum of 200% of the target award. After award amounts were computed for fiscal 2008, the Committee had discretion under plan terms to adjust the actual amount paid to each executive upward or downward by as much as 25% of the greater of the executive’s computed award and the executive’s target award amount to reflect the executive’s individual contribution to the achievement of the Company’s performance goals. The Committee seldom makes such adjustments and did not make any to the award amounts for fiscal 2008. This discretionary adjustment authority does not apply to CEO awards or those for any other executive if the award is intended to qualify as performance-based compensation under Section 162(m) of the Internal Revenue Code.
11
Actual salaries are based on the qualifications, experience and sustained individual performance of the executive. The Committee also solicits and considers the CEO’s recommendations for salary decisions concerning other executive officers. The Board sets all executive base salaries, including that of the CEO, based on the factors outlined in this section and on the Committee’s recommendations. In addition, the Board conducts an annual performance evaluation of the CEO, the results of which significantly contribute to Board decisions concerning CEO compensation. Due to the significant experience of our executive group, aggregate base salaries fall about halfway between the 50th and 75th percentiles of competitive reference point values. For fiscal 2008, the Board approved base salary increases for executives ranging from 3.83% to 8.77%. In March 2008, Mr. Kring announced his intention to retire at the end of the calendar year and the Board approved a phased transition plan for him. Accordingly, Mr. Kring’s base salary was reduced by 40% in April 2008 to correspond with his reduced responsibilities.
For fiscal 2008, the Committee selected earnings per share as the sole financial performance goal for the annual incentive compensation plan, because earnings performance is the primary criterion on which short-term Company success is measured by shareholders and stock market analysts. The earnings per share calculation for purposes of the plan is based on all operating earnings, thus earnings related to a discontinued operation that was divested in November 2008 were included. The plan’s earnings per share goal was $3.02. The Committee recommended and the Board approved a minimum performance level of 70% of the earning per share goal before any executive would earn an award, and a maximum ceiling of 130% of the earnings per share goal, above which no further award would be earned. Actual earnings per share achieved was $4.03, which was equal to 133% of the earnings per share goal, resulting in a payout of 200% of the targeted amounts. These amounts are reflected in the Summary Compensation Table for Fiscal 2008 included in this proxy statement. Mr. Kring’s annual incentive compensation award was proportionate to his base salary change, as explained in the section above. Long-Term Incentives We believe that the combination of a cash-based long-term incentive plan (LTIP) and stock option grants provide executives with competitive long-term incentive opportunities. The LTIP and stock option grants are designed to work in concert with other executive compensation elements to:
� Focus executives on increasing total shareholder returns over the long term by concentrating on key drivers of share price;
� Encourage executives to take reasonable, long-term business investment risks by measuring performance over multiple years; and
� Encourage profitable growth and effective use of assets in achieving growth goals. Based on compensation survey data and Committee recommendations, the Board assigned each participating executive a target award value to be delivered through options and the LTIP. This value varies in proportion to the level of the individual executive’s responsibility within the Company and takes into account the comparative median (50th percentile) incentive compensation percentages from compensation surveys. Those survey values have generally increased since last year and prior years, due to the strong trend toward performance-based compensation for corporate executives. Accordingly, for fiscal 2008, the Committee recommended and the Board approved higher target award values for each of the persons listed in the Summary Compensation Table in this Proxy Statement (the “Named Executive Officers”) with increases ranging from 10% to 21%. The long-term incentive target award values to be delivered through options and the LTIP for each of our Named Executive Officers for fiscal 2008 were as follows:
Executive Title Target Annual Award Value for Options
and Cash LTIP as % of Base Salary Robert W. Cremin Chairman, President and Chief
Executive Officer 245%
Robert D. George Vice President, Chief Financial Officer, Secretary and Treasurer
140%
Frank E. Houston Group Vice President 105% Larry A. Kring Group Vice President 175% Stephen R. Larson Vice President, Strategy &
Technology 130%
For Mr. Cremin and Mr. Kring, the allocation of the long-term incentive target award value for fiscal 2008 was 70% to stock options and 30% to LTIP. For other executives, the allocation for fiscal 2008 was 60% to stock options and 40% to LTIP. Based on advice from Watson Wyatt, the Committee determined the number of options for each grant by dividing the dollar value of the award by the appropriate Black-Scholes value of our stock options on the date of grant. The Black-Scholes value was $19.90 per share. The stock options granted to the Named Executive Officers in fiscal 2008 are disclosed in the Grants of Plan-Based Awards Table for Fiscal 2008 included in this proxy statement.
12
Cash-Based Long-Term Incentive Plan For fiscal 2008, the Board continued the LTIP first adopted in fiscal 2005, pursuant to Committee recommendation. In this plan, a new LTIP performance period begins with each fiscal year and extends for three years. Accordingly, there are three overlapping LTIP performance periods running at any given time: one in the first year of a plan cycle, another in the second year of an earlier cycle, and a third in the final year of an earlier cycle. In December 2007, the Board assigned each participating executive a target award value for the 2008-2010 performance cycle based on compensation survey data and on Committee recommendations, as discussed above. The target award value is not guaranteed, but reflects what will be payable if the Company achieves established performance goals. Actual awards paid may be larger or smaller than target awards depending on Company performance results measured over the three-year period. Earning opportunities range from 0% to 400% of target award values. Payments are made in cash. There are two performance goals under the LTIP: (1) growth in earnings per share (10% target for the 2006-2008 performance cycle); and (2) return on invested capital (6.0% target for the 2006-2008 performance cycle). Payout amounts under the LTIP are determined based on the level of achievement of each of these two performance goals relative to each other, pursuant to a matrix where earnings per share growth is one axis and return on invested capital is the other axis. For purposes of the LTIP, (1) growth in earnings per share is calculated as the compound annual growth rate measured from the beginning of the base year to the end of the last year in a given performance cycle; and (2) return on invested capital is calculated as net income (before extraordinary items) divided by the monthly average invested capital during the corresponding fiscal year, averaged over the applicable performance period and expressed as a percentage. The Board selected these two goals for the LTIP based on the results of a 2005 study performed by an independent executive compensation consulting firm that showed a strong correlation between these two measures and sustained shareholder returns for companies in the S&P SmallCap 600 Index, such as ours. Similarly, the performance targets established by the Board for the 2008-2010 performance cycle are consistent with long-term market median performance, inclusive of SFAS 123R option expenses: 10% earnings per share growth and 6.0% return on invested capital. LTIP payments were made in early fiscal 2009 for the 2006-2008 performance cycle. For awards under the 2006-2008 performance cycle to have equaled 400% of target amounts, earnings per share would have needed to grow by 32% and return on invested capital would have needed to equal 10%. Actual achievement of the growth in earnings per share goal was 25.9% and actual achievement of the return on invested capital goal was 7.1%. The earnings growth component was calculated based on all operating earnings including those of a discontinued operation, as detailed in the Annual Incentive Compensation section above. Accordingly, executives were paid 225.3% of their respective target amounts. These amounts are reflected in the Summary Compensation Table for Fiscal 2008 in this proxy statement. Stock Options The Board grants options based on Committee recommendations, with an exercise price equal to the closing price of our Common Stock on the date of grant, and the options become exercisable over time. Typically, each grant vests on an annual basis ratably over four years, and continues to be exercisable until ten years from the date granted. The options provide incentive for the creation of shareholder value over the long term, because the executives cannot realize the full benefit of the options unless our Common Stock price appreciates during the option term. Generally, the Board grants stock options to executives once per year in December when it reviews other aspects of executive compensation. The Committee may also recommend option grants at other appropriate times, such as in connection with promotions. On March 20, 2008, pursuant to delegation from the Board, the Committee made a special grant to Mr. Kring in recognition of his many contributions to the Company’s success and of his announced intention to retire. The grant was for 20,000 shares all of which vested on his last day of service, which was December 31, 2008. The grant provides a post-retirement exercise period of five years.
13
Other Benefits and Programs Executive officers are allowed to participate in the Company’s standard benefit programs that are generally available to other employees, including medical, dental, life, disability, pension, 401(k), employee assistance, and similar retirement and health and group insurance plans. In addition, each of our executive officers is eligible to participate in a supplemental executive retirement pension plan that permits benefits to be earned on compensation that is in excess of certain statutory limits that apply to the pension plan, as more fully described in the Pension Benefits section of this proxy statement. Executive officers are also eligible to participate in an executive supplemental retirement and deferred compensation plan that allows participants to defer compensation in excess of certain statutory limits in the tax-qualified 401(k) plan and provides a Company match on deferred compensation amounts that exceed certain limits in the tax-qualified 401(k) plan, allowing executives to earn an equivalent portion in Company matching funds as that available to the general workforce in the tax-qualified plan, as more fully described in the Nonqualified Deferred Compensation Section of this proxy statement. Executive officers also receive automobile allowances based on competitive market benchmarks, as do the Company’s subsidiary presidents and certain sales personnel. Similarly, some executive officers have qualified for relocation benefits under standard Company policy. In certain cases, those benefits have been enhanced somewhat to expedite an officer’s relocation or to take advantage of certain tax management opportunities pertaining to real estate closing costs. These enhancements are also available to other management employees, when appropriate. Certain executive officers and other senior managers also receive limited financial planning services at Company expense. The value of these items is disclosed in the Summary Compensation Table for Fiscal 2008 and accompanying notes. Termination Protection Agreements
2004 Equity Incentive Plan All options held by our officers, including the Named Executive Officers, issued pursuant to the Company’s 2004 Equity Incentive Plan will become immediately vested and exercisable upon the consummation of certain events constituting a change in control of the Company. In addition, such options will become immediately vested and exercisable if not assumed or continued, in the event of certain corporate transactions. Stock Ownership Guidelines The Committee believes its performance-based compensation programs strongly align executive interests with those of Company shareholders and that requiring further investment by the executive officers in the Company is neither necessary nor desirable. Accordingly, we have not implemented formal stock ownership guidelines for our executives. The Committee periodically reconsiders this subject to ensure the executives’ interests are consistent with the Company’s shareholders.
14
In order to ensure key officers will always have their full energy and attention focused on the best interests of the Company’s stakeholders, we have entered into change in control termination protection agreements with our officers, including the Named Executive Officers, as more fully described in the Termination of Employment and Change in Control Arrangements section of this proxy statement. These are designed to induce them to remain in the employ of the Company or any successor company in the event of certain changes in ownership or control by assuring compensation benefits if an officer is terminated without cause or resigns for good reason, as those terms are defined in the agreements. In preparing the compensation disclosure for the 2008 proxy statement, the Company discovered an error in the agreements’ Formulation of payment to the executive for the balance of the year in which a change of control event occurs. It subsequently corrected the faulty language with authorization from the Board, the effect of which was to increase potential payments to the executives in accordance with the Board’s original intent. See the Termination of Employment and Change in Control Arrangements section that follows for further detail.
be reduced so that the payments will not be treated as “excess parachute payments.” However, this payment reduction will only take place if the reduction would provide to the officer a greater net, after-tax benefit than he or she would receive if the payments were not subject to the reduction. In addition, we considered the impact of Section 409A of the Internal Revenue Code on our compensation programs. Section 409A imposes tax penalties on certain nonqualified deferred compensation arrangements. We operate our covered arrangements in a manner intended to avoid the adverse tax treatment under Section 409A. Certain amendments have been made to covered arrangements in this regard.
COMPENSATION COMMITTEE REPORT
The Compensation Committee of the Board of Directors has reviewed and discussed with management the above Compensation Discussion and Analysis. Based on that review and discussion, the Committee has recommended to the Board that this Compensation Discussion and Analysis be included in this proxy statement. Respectfully submitted, JERRY D. LEITMAN, CHAIRMAN LEWIS E. BURNS JOHN F. CLEARMAN
COMPENSATION COMMITTEE INTERLOCKS AND INSIDER PARTICIPATION All members of the Compensation Committee during the 2008 fiscal year, each of who was listed in “Board and Board Committees - Compensation Committee” were independent directors and no member was an employee or former employee. No Compensation Committee member had any relationship requiring disclosure under Item 404 of Regulation S-K. No executive officer of the Company has served on the board of directors or compensation committee of any other entity that has or has had one or more executive officers who served as a member of the Board of Directors or the Compensation Committee during the 2008 fiscal year.
ADDITIONAL INFORMATION REGARDING EXECUTIVE COMPENSATION The following tables and accompanying narrative disclosure should be read in conjunction with the Compensation Discussion and Analysis, which presents the objectives of our executive compensation and benefits programs.
15
Tax Considerations We considered the tax ramifications of the change in control termination protection agreements with our officers under Section 280G and Section 4999 of the Internal Revenue Code. To preserve our tax deduction in connection with the payments payable under these agreements and to avoid an excise tax for our officers, the agreements generally provide that in the event any payments under the agreements are considered to be “excess parachute payments” under Section 280G, either alone or together with other payments from us, the payments will
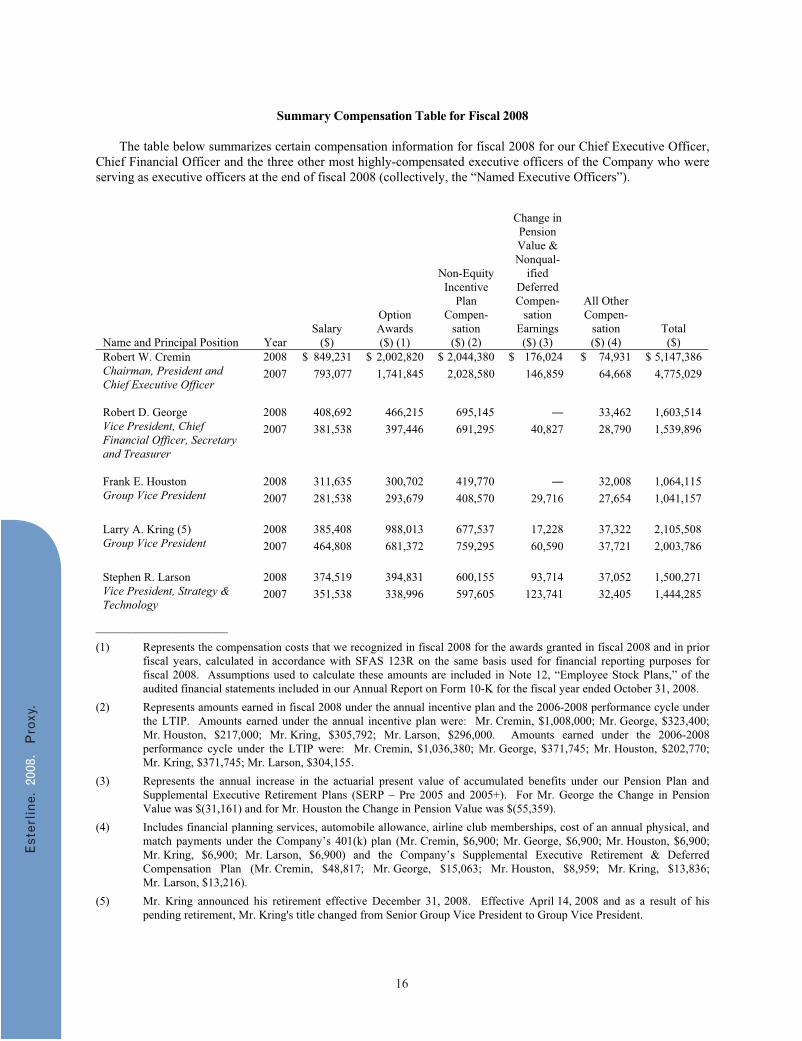
Name and Principal Position Year Salary
($)
Option Awards ($) (1)
Non-Equity Incentive
Plan Compen-
sation ($) (2)
Change in Pension Value & Nonqual-
ified Deferred Compen-
sation Earnings ($) (3)
All Other Compen-
sation ($) (4)
Total ($)
2008 $ 849,231 $ 2,002,820 $ 2,044,380 $ 176,024 $ 74,931 $ 5,147,386 Robert W. Cremin Chairman, President and Chief Executive Officer
2007 793,077 1,741,845 2,028,580 146,859 64,668 4,775,029
2008 408,692 466,215 695,145 � 33,462 1,603,514 Robert D. George
Vice President, Chief Financial Officer, Secretary and Treasurer
2007 381,538 397,446 691,295 40,827 28,790 1,539,896
2008 311,635 300,702 419,770 � 32,008 1,064,115 Frank E. Houston
Group Vice President 2007 281,538 293,679 408,570 29,716 27,654 1,041,157
2008 385,408 988,013 677,537 17,228 37,322 2,105,508 Larry A. Kring (5) Group Vice President 2007 464,808 681,372 759,295 60,590 37,721 2,003,786
2008 374,519 394,831 600,155 93,714 37,052 1,500,271 Stephen R. Larson Vice President, Strategy & Technology
2007 351,538 338,996 597,605 123,741 32,405 1,444,285
____________________ (1) Represents the compensation costs that we recognized in fiscal 2008 for the awards granted in fiscal 2008 and in prior
fiscal years, calculated in accordance with SFAS 123R on the same basis used for financial reporting purposes for fiscal 2008. Assumptions used to calculate these amounts are included in Note 12, “Employee Stock Plans,” of the audited financial statements included in our Annual Report on Form 10-K for the fiscal year ended October 31, 2008.
(2) Represents amounts earned in fiscal 2008 under the annual incentive plan and the 2006-2008 performance cycle under the LTIP. Amounts earned under the annual incentive plan were: Mr. Cremin, $1,008,000; Mr. George, $323,400; Mr. Houston, $217,000; Mr. Kring, $305,792; Mr. Larson, $296,000. Amounts earned under the 2006-2008 performance cycle under the LTIP were: Mr. Cremin, $1,036,380; Mr. George, $371,745; Mr. Houston, $202,770; Mr. Kring, $371,745; Mr. Larson, $304,155.
(3) Represents the annual increase in the actuarial present value of accumulated benefits under our Pension Plan and Supplemental Executive Retirement Plans (SERP – Pre 2005 and 2005+). For Mr. George the Change in Pension Value was $(31,161) and for Mr. Houston the Change in Pension Value was $(55,359).
(4) Includes financial planning services, automobile allowance, airline club memberships, cost of an annual physical, and match payments under the Company’s 401(k) plan (Mr. Cremin, $6,900; Mr. George, $6,900; Mr. Houston, $6,900; Mr. Kring, $6,900; Mr. Larson, $6,900) and the Company’s Supplemental Executive Retirement & Deferred Compensation Plan (Mr. Cremin, $48,817; Mr. George, $15,063; Mr. Houston, $8,959; Mr. Kring, $13,836; Mr. Larson, $13,216).
(5) Mr. Kring announced his retirement effective December 31, 2008. Effective April 14, 2008 and as a result of his pending retirement, Mr. Kring's title changed from Senior Group Vice President to Group Vice President.
16
Summary Compensation Table for Fiscal 2008 The table below summarizes certain compensation information for fiscal 2008 for our Chief Executive Officer, Chief Financial Officer and the three other most highly-compensated executive officers of the Company who were serving as executive officers at the end of fiscal 2008 (collectively, the “Named Executive Officers”).
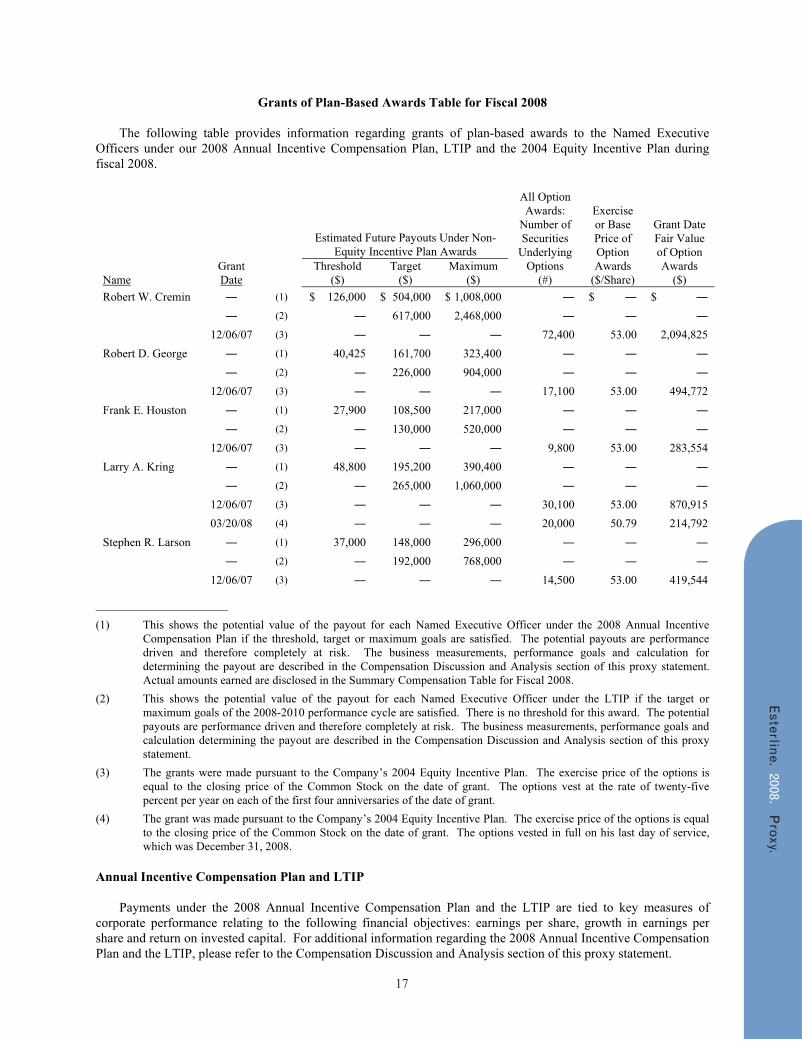
Grants of Plan-Based Awards Table for Fiscal 2008 The following table provides information regarding grants of plan-based awards to the Named Executive Officers under our 2008 Annual Incentive Compensation Plan, LTIP and the 2004 Equity Incentive Plan during fiscal 2008.
Estimated Future Payouts Under Non-Equity Incentive Plan Awards
Name Grant Date
Threshold ($)
Target ($)
Maximum ($)
All Option Awards:
Number of Securities
Underlying Options
(#)
Exercise or Base Price of Option Awards
($/Share)
Grant Date Fair Value of Option Awards
($) Robert W. Cremin � (1) $ 126,000 $ 504,000 $ 1,008,000 � $ � $ � � (2) � 617,000 2,468,000 � � � 12/06/07 (3) � � � 72,400 53.00 2,094,825 Robert D. George � (1) 40,425 161,700 323,400 � � � � (2) � 226,000 904,000 � � � 12/06/07 (3) � � � 17,100 53.00 494,772 Frank E. Houston � (1) 27,900 108,500 217,000 � � � � (2) � 130,000 520,000 � � � 12/06/07 (3) � � � 9,800 53.00 283,554 Larry A. Kring � (1) 48,800 195,200 390,400 � � � � (2) � 265,000 1,060,000 � � � 12/06/07 (3) � � � 30,100 53.00 870,915 03/20/08 (4) � � � 20,000 50.79 214,792 Stephen R. Larson � (1) 37,000 148,000 296,000 � � � � (2) � 192,000 768,000 � � � 12/06/07 (3) � � � 14,500 53.00 419,544
____________________ (1) This shows the potential value of the payout for each Named Executive Officer under the 2008 Annual Incentive
Compensation Plan if the threshold, target or maximum goals are satisfied. The potential payouts are performance driven and therefore completely at risk. The business measurements, performance goals and calculation for determining the payout are described in the Compensation Discussion and Analysis section of this proxy statement. Actual amounts earned are disclosed in the Summary Compensation Table for Fiscal 2008.
(2) This shows the potential value of the payout for each Named Executive Officer under the LTIP if the target or maximum goals of the 2008-2010 performance cycle are satisfied. There is no threshold for this award. The potential payouts are performance driven and therefore completely at risk. The business measurements, performance goals and calculation determining the payout are described in the Compensation Discussion and Analysis section of this proxy statement.
(3) The grants were made pursuant to the Company’s 2004 Equity Incentive Plan. The exercise price of the options is equal to the closing price of the Common Stock on the date of grant. The options vest at the rate of twenty-five percent per year on each of the first four anniversaries of the date of grant.
(4) The grant was made pursuant to the Company’s 2004 Equity Incentive Plan. The exercise price of the options is equal to the closing price of the Common Stock on the date of grant. The options vested in full on his last day of service, which was December 31, 2008.
Annual Incentive Compensation Plan and LTIP
Payments under the 2008 Annual Incentive Compensation Plan and the LTIP are tied to key measures of corporate performance relating to the following financial objectives: earnings per share, growth in earnings per share and return on invested capital. For additional information regarding the 2008 Annual Incentive Compensation Plan and the LTIP, please refer to the Compensation Discussion and Analysis section of this proxy statement.
17
2004 Equity Incentive Plan
Equity awards to our executive officers consist of stock options granted under the Company’s 2004 Equity Incentive Plan. Stock options have a term of ten years and typically vest in equal annual installments over the period from the date of grant until the fourth anniversary of the date of grant. On March 20, 2008, pursuant to delegation from the Board, the Committee made a special grant to Mr. Kring in recognition of his many contributions to the Company’s success and of his announced plan to retire. The grant was for 20,000 shares all of which vested on his last day of service, which was December 31, 2008. The grant provides a post-retirement exercise period of five years. The exercise price for all stock options is equal to the closing price of the Common Stock on the date of grant. Fixed Cash Compensation in Proportion to Total Compensation
The proportion of fixed cash compensation (salary plus certain benefits) compared to total compensation varies somewhat among the Named Executive Officers. Specifically, allocation among the different components of compensation varies based on the position and level of responsibility, and on market data provided by Watson Wyatt that reflects the practices of other companies. For example, those Named Executive Officers with the greater ability to influence our performance will have a higher level of at-risk compensation in the form of an increased percentage of total compensation in stock options and cash-based incentive plan target awards. The lower the level of influence of an executive, the higher the percentage of their total compensation is in the form of base salary with a correspondingly lower percentage of stock options and cash-based incentive plan target awards. In general, the proportion of at-risk compensation increases with base salary level, which usually indicates relative scope and level of responsibility, such that those with higher salaries also have more of their total compensation at risk. Accordingly, executive compensation for higher-level executives is set to align closely with shareholder and Company long-term shared interests. In fiscal 2008, the percentage of fixed cash compensation as compared to total compensation was 18% and 21% for the Chief Executive Officer and the most senior Group Vice President, respectively. For the other Named Executive Officers, the percentage of fixed cash compensation as compared to total compensation ranged between 28% and 32%.
18
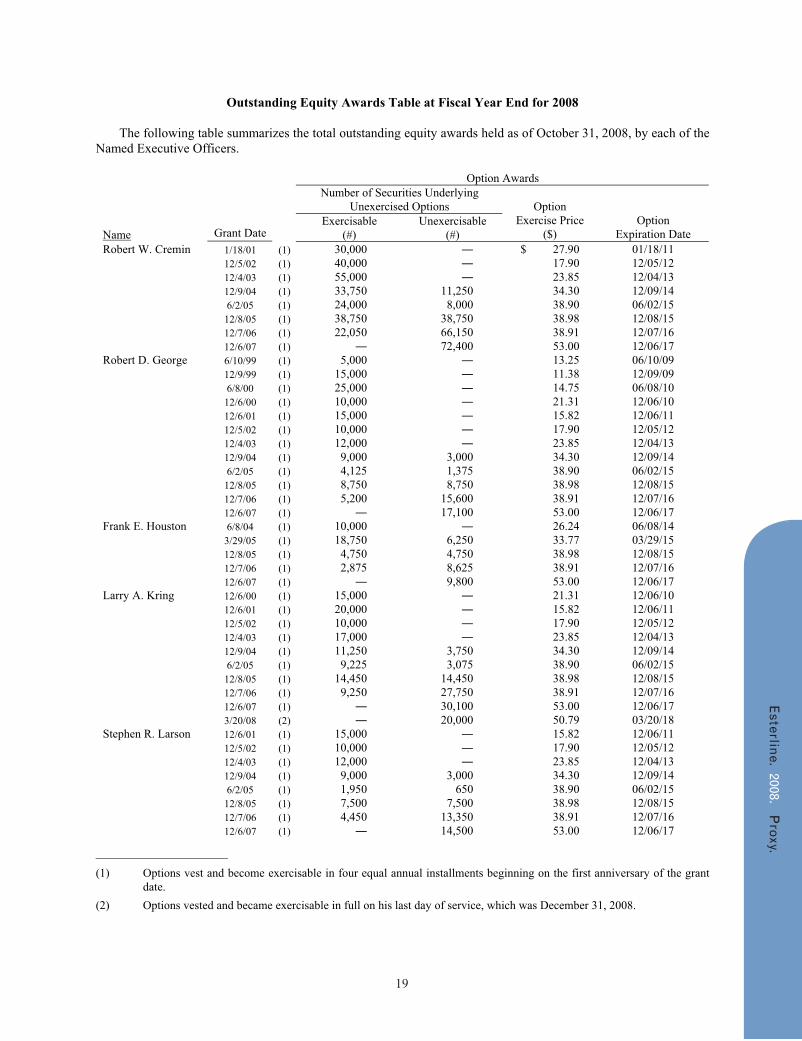
Outstanding Equity Awards Table at Fiscal Year End for 2008 The following table summarizes the total outstanding equity awards held as of October 31, 2008, by each of the Named Executive Officers.
Option Awards Number of Securities Underlying
Unexercised Options
Name Grant Date
Exercisable (#)
Unexercisable (#)
Option Exercise Price
($) Option
Expiration Date Robert W. Cremin 1/18/01 (1) 30,000 � $ 27.90 01/18/11 12/5/02 (1) 40,000 � 17.90 12/05/12 12/4/03 (1) 55,000 � 23.85 12/04/13 12/9/04 (1) 33,750 11,250 34.30 12/09/14 6/2/05 (1) 24,000 8,000 38.90 06/02/15 12/8/05 (1) 38,750 38,750 38.98 12/08/15 12/7/06 (1) 22,050 66,150 38.91 12/07/16 12/6/07 (1) � 72,400 53.00 12/06/17 Robert D. George 6/10/99 (1) 5,000 � 13.25 06/10/09 12/9/99 (1) 15,000 � 11.38 12/09/09 6/8/00 (1) 25,000 � 14.75 06/08/10 12/6/00 (1) 10,000 � 21.31 12/06/10 12/6/01 (1) 15,000 � 15.82 12/06/11 12/5/02 (1) 10,000 � 17.90 12/05/12 12/4/03 (1) 12,000 � 23.85 12/04/13 12/9/04 (1) 9,000 3,000 34.30 12/09/14 6/2/05 (1) 4,125 1,375 38.90 06/02/15 12/8/05 (1) 8,750 8,750 38.98 12/08/15 12/7/06 (1) 5,200 15,600 38.91 12/07/16 12/6/07 (1) � 17,100 53.00 12/06/17 Frank E. Houston 6/8/04 (1) 10,000 � 26.24 06/08/14 3/29/05 (1) 18,750 6,250 33.77 03/29/15 12/8/05 (1) 4,750 4,750 38.98 12/08/15 12/7/06 (1) 2,875 8,625 38.91 12/07/16 12/6/07 (1) � 9,800 53.00 12/06/17 Larry A. Kring 12/6/00 (1) 15,000 � 21.31 12/06/10 12/6/01 (1) 20,000 � 15.82 12/06/11 12/5/02 (1) 10,000 � 17.90 12/05/12 12/4/03 (1) 17,000 � 23.85 12/04/13 12/9/04 (1) 11,250 3,750 34.30 12/09/14 6/2/05 (1) 9,225 3,075 38.90 06/02/15 12/8/05 (1) 14,450 14,450 38.98 12/08/15 12/7/06 (1) 9,250 27,750 38.91 12/07/16 12/6/07 (1) � 30,100 53.00 12/06/17 3/20/08 (2) � 20,000 50.79 03/20/18 Stephen R. Larson 12/6/01 (1) 15,000 � 15.82 12/06/11 12/5/02 (1) 10,000 � 17.90 12/05/12 12/4/03 (1) 12,000 � 23.85 12/04/13 12/9/04 (1) 9,000 3,000 34.30 12/09/14 6/2/05 (1) 1,950 650 38.90 06/02/15 12/8/05 (1) 7,500 7,500 38.98 12/08/15 12/7/06 (1) 4,450 13,350 38.91 12/07/16 12/6/07 (1) � 14,500 53.00 12/06/17
____________________ (1) Options vest and become exercisable in four equal annual installments beginning on the first anniversary of the grant
date.
(2) Options vested and became exercisable in full on his last day of service, which was December 31, 2008.
19
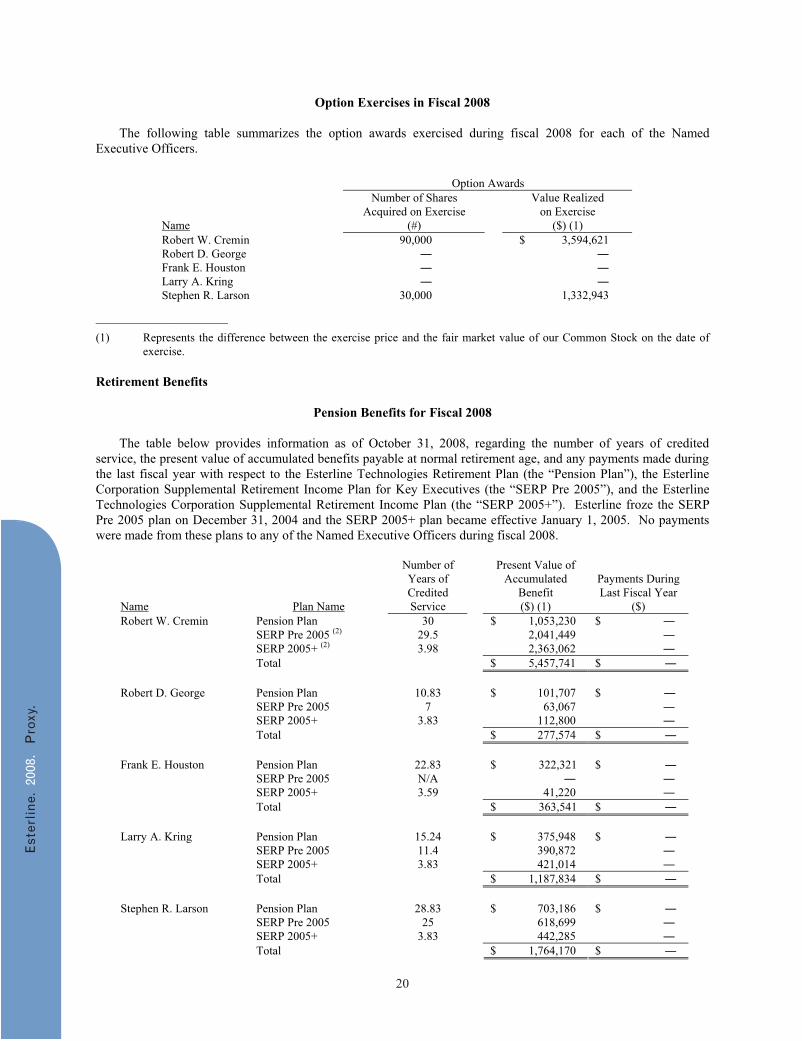
Option Exercises in Fiscal 2008 The following table summarizes the option awards exercised during fiscal 2008 for each of the Named Executive Officers.
Option Awards
Name
Number of Shares Acquired on Exercise
(#)
Value Realized on Exercise
($) (1) Robert W. Cremin 90,000 $ 3,594,621 Robert D. George � � Frank E. Houston � � Larry A. Kring � � Stephen R. Larson 30,000 1,332,943
____________________ (1) Represents the difference between the exercise price and the fair market value of our Common Stock on the date of
exercise. Retirement Benefits
Pension Benefits for Fiscal 2008 The table below provides information as of October 31, 2008, regarding the number of years of credited service, the present value of accumulated benefits payable at normal retirement age, and any payments made during the last fiscal year with respect to the Esterline Technologies Retirement Plan (the “Pension Plan”), the Esterline Corporation Supplemental Retirement Income Plan for Key Executives (the “SERP Pre 2005”), and the Esterline Technologies Corporation Supplemental Retirement Income Plan (the “SERP 2005+”). Esterline froze the SERP Pre 2005 plan on December 31, 2004 and the SERP 2005+ plan became effective January 1, 2005. No payments were made from these plans to any of the Named Executive Officers during fiscal 2008.
Name Plan Name
Number of Years of Credited Service
Present Value of Accumulated
Benefit ($) (1)
Payments During Last Fiscal Year
($) Pension Plan 30 $ 1,053,230 $ � SERP Pre 2005 (2) 29.5 2,041,449 � SERP 2005+ (2) 3.98 2,363,062 �
Robert W. Cremin
Total $ 5,457,741 $ �
Pension Plan 10.83 $ 101,707 $ � SERP Pre 2005 7 63,067 � SERP 2005+ 3.83 112,800 �
Robert D. George
Total $ 277,574 $ �
Pension Plan 22.83 $ 322,321 $ � SERP Pre 2005 N/A � � SERP 2005+ 3.59 41,220 �
Frank E. Houston
Total $ 363,541 $ �
Pension Plan 15.24 $ 375,948 $ � SERP Pre 2005 11.4 390,872 � SERP 2005+ 3.83 421,014 �
Larry A. Kring
Total $ 1,187,834 $ �
Pension Plan 28.83 $ 703,186 $ � SERP Pre 2005 25 618,699 � SERP 2005+ 3.83 442,285 �
Stephen R. Larson
Total $ 1,764,170 $ �
20

____________________ (1) The assumptions and methodology used in calculating the estimated present values shown in this column are generally
consistent with those used and disclosed in the Company’s Annual Report on Form 10-K for the fiscal year ended October 31, 2008, except that the Named Executive Officers are assumed to retire at their earliest unreduced retirement age (age 65) or their current age, if later, and no pre-retirement terminations or deaths are assumed to occur. Also, no additional compensation or service is assumed beyond the October 31, 2008, calculation date. The specific relevant assumptions include a discount rate of 8.375% and post-retirement mortality based on the 1994 Group Annuity Mortality tables.
(2) Pursuant to the SERPs, Mr. Cremin received 1.28 years of credited service for each year of service after September 29, 1996 until he reached age 65 in July 2005. For service after age 65, he receives 1.0 years of credit for each year of subsequent service up to a maximum of 35 years credit.
Esterline’s Pension Plan is a broad based, tax-qualified defined benefit pension plan that provides a benefit to eligible employees of the Company. Approximately 39% of all U.S. employees are eligible to participate in the Pension Plan. Qualified pension benefits are based on a final average pay formula, which takes into account years of service and highest five-year average earnings, or a cash balance formula, with annual pay credits ranging from 2% to 6% of earnings plus an additional 2% of earnings in excess of the annual Social Security Taxable Wage Base, and interest credits which vary annually based on certain external indices. Earnings include base pay and annual and long term incentive pay subject to statutory limitations. As of January 1, 2003, participants were given the option of continuing to accrue benefits under the final average pay formula, or to earn benefits under the cash balance formula. Since that date, all new participants are enrolled in the cash balance formula. Participants earning benefits under the final average pay formula must contribute 1% of after-tax compensation each year, while no employee contributions are required under the cash balance formula. The standard form of benefit payment is a single life annuity for participants who are not married and a 50% joint and surviving spouse annuity for married participants. Alternatively, participants may elect a joint and surviving spouse annuity with a continuation percentage of 75% or 100%, or a life annuity with payments guaranteed for a 5-year, 10-year or 15-year period. Benefits earned under the cash balance formula may also be paid as a lump sum. The annual benefit at normal retirement (age 65) under the final average pay formula is the participant’s highest five-year average pay less the participant’s primary Social Security benefit times 1.6%, times the participant’s credited service up to 30 years. Participants are eligible to receive early retirement benefits when they have completed five years of plan participation and their age plus service equals 65 years. For participants who elect to receive benefits prior to age 65, benefits are reduced by 6 2/3% per year between ages 60 and 65, 3 1/3% per year between ages 55 and 60, 3% per year between ages 50 and 55, and 2% per year below age 50. The Supplemental Executive Retirement Plans (SERP – Pre 2005 and 2005+) provide benefit formulas that are similar to the final average pay formula and the cash balance formula in the Pension Plan, but permit benefits to be earned on compensation that is in excess of certain statutory limits that apply to the Pension Plan. However, amounts earned under the long-term incentive compensation plan are excluded from earnings used in the benefit formulas of the SERPs.
21
Nonqualified Deferred Compensation Table for Fiscal 2008 The table below provides information as of October 31, 2008, regarding each Named Executive Officer’s activity in the Esterline Technologies Supplemental Executive Retirement & Deferred Compensation Plan (the “DC SERP”). It includes information on executive voluntary contributions, Company contributions and aggregate earnings during the fiscal year. There were no distributions from the DC SERP in fiscal 2008.
Name
Executive Contributions in Last Fiscal Year
($) (1)
Registrant Contributions in Last Fiscal Year
($) (2)
Aggregate Earnings in Last
Fiscal Year ($) (3)
Aggregate Withdrawals / Distributions
($)
Aggregate Balance at Last Fiscal Year End
($) (4) Robert W. Cremin $ 107,483 $ 48,817 $ 2,503 $ � $ 158,803 Robert D. George 42,486 15,063 875 � 58,424 Frank E. Houston 15,370 8,959 1,025 � 25,354 Larry A. Kring 198,138 13,836 4,506 � 216,480 Stephen R. Larson 26,031 13,216 1,706 � 40,953
____________________ (1) Represents elective deferrals of compensation that are also reported as compensation earned in fiscal 2008 in the
Summary Compensation Table.
(2) Represents Company matching contributions to the DC SERP earned in fiscal 2008. Company contributions are also reported in the All Other Compensation column of the Summary Compensation Table for Fiscal 2008 in this proxy statement.
(3) Represents increases/decreases due to dividends, earnings, fees and investment gains/losses.
(4) Includes Company contributions earned in fiscal 2008 that will not be made until early 2009 following calendar and qualified plan year closing activities.
The DC SERP became effective on January 1, 2007. The new plan provides an opportunity for participants to defer a portion of their cash compensation to be paid as a lump sum or in 10 annual installments upon retirement or at another future date. The executives may defer up to 75% of base pay and annual incentive compensation and up to 100% of long-term incentive compensation. Investment earnings are pursuant to each executive’s individual elections from among available investment options, substantially similar to those in the Company’s tax-qualified 401(k) plan, and are subject to daily valuation. The DC SERP provides a Company match on part of the deferred compensation based on a formula that is substantially the same as that in the Company’s tax-qualified 401(k) plan. The Company match applies to deferred compensation amounts that exceed certain statutory limits in the tax-qualified 401(k) plan. However, amounts earned under the long-term incentive compensation plan are excluded from earnings used in the match calculation of the DC SERP. Termination of Employment and Change in Control Arrangements Termination Protection Agreements. The Company has entered into termination protection agreements with the Named Executive Officers which are designed to induce them to remain in the employ of the Company or any successor company in the event of a “Change in Control Event” by assuring compensation benefits if an officer is terminated without “Cause” or resigns for “Good Reason,” as defined in the agreements. In the event of such termination within two years after a Change in Control Event, the agreements provide for:
� a lump sum payment equal to all other earned, but unpaid amounts;
22
• a pro rata amount of the average compensation received during the prior two years, calculated as follows: the average compensation received during the prior two years multiplied by a fraction, the numerator of which is the number of days the executive was employed during the fiscal year in which termination occurs and the denominator of which is 365, with the product reduced (but not below zero) by the base salary and car allowance paid to the executive with respect to his/her employment during the fiscal year in which termination occurs;
� continuation of life insurance, health and accident and disability benefits for the remainder of the initial two-year period or until other full-time employment is accepted, unless participation in the Company’s plans or programs is not practicable, in which case the Company may provide executive with substantially similar benefits or cash compensation on an after-tax basis sufficient for the executive to purchase such benefits.
In the event any payments under the termination protection agreements are considered to be “excess parachute payments” under Section 280G of the Internal Revenue Code, either alone or together with other Company payments, the payments will be reduced so that the payments will not be treated as “excess parachute payments.” However, this payment reduction will only take place if the reduction would provide to the officer a greater net, after-tax benefit than he or she would receive if the payments were not subject to the reduction. For purposes of the termination protection agreements, the following definitions apply: “Cause” is generally defined as:
� the willful and continued failure by the executive to substantially perform his duties and obligations to the Company (other than any such failure resulting from illness, sickness, or physical or mental incapacity) which failure continues after the Company has given notice to the executive; or
� the willful engaging by the executive in misconduct that is significantly injurious to the Company, monetarily or otherwise.
“Good Reason” is generally defined as:
� a material diminution in the executive’s authority, duties, or responsibilities, including, for example, assignment to the executive of any duties inconsistent with, or the reduction of powers or functions associated with, his positions, duties, responsibilities and status with the Company immediately prior to the transaction or any removal of the executive from or any failure to re-elect the executive to any positions or offices the executive held immediately prior to the transaction, except in connection with the termination of the executive’s employment by the Company for cause or for disability, or a material negative change in the employment relationship, such as the failure to maintain a working environment conducive to the performance of the executives’ duties or the effective exercise of the powers or functions associated with the executive’s position, responsibilities and status with the Company immediately prior to the transaction;
� the Company’s failure to pay the executive a monthly base salary at least equal to the then applicable minimum base salary provided for in the agreement;
� the Company’s failure to pay the executive, within 75 days following the end of a fiscal year, compensation with respect to each such fiscal year ending after the transaction in an amount at least equal to the minimum total compensation provided for in the agreement;
� the Company’s mandatory transfer of the executive to another geographic location, without the executive’s consent, outside of a twenty (20) mile radius from the executive’s current location;
� Company action or omission, in its capacity as a plan administrator or otherwise, that would adversely affect the executive’s participation in any fringe benefit program in effect at the time of the transaction, or materially reduce the value of his benefits under any such program; or
� failure by the Company to obtain an assumption of the obligations of the Company to perform the agreement by any successor.
“Change in Control Event” is generally defined as:
� an acquisition by any individual, entity or group of beneficial ownership of 30% or more of either (1) the then outstanding shares of Common Stock of the Company or (2) the combined voting power of the then
23
� a lump sum payment equal to three times the average compensation paid during the prior two years;
� reimbursement of certain legal fees and expenses associated with enforcing the agreement; and
� a change in the composition of the Board during any two-year period such that the individuals who, as of the beginning of such two-year period, constitute the Board cease for any reason to constitute at least a majority of the Board.
2004 Equity Incentive Plan. All options held by the Named Executive Officers issued pursuant to the Company’s 2004 Equity Incentive Plan become fully and immediately vested and exercisable immediately prior to a "Company Transaction" that is not a "Change in Control" or a "Related Party Transaction," unless such awards are converted, assumed, or replaced by the successor company. All options held by the Named Executive Officers issued pursuant to the Company’s 2004 Equity Incentive Plan become fully and immediately vested and exercisable immediately prior to a "Change in Control."
For purposes of the 2004 Equity Incentive Plan, the following definitions apply:
"Company Transaction" is generally defined as the consummation of any of the following:
� a merger or consolidation of the Company with or into any other company or other entity;
� a sale in one transaction or a series of transactions undertaken with a common purpose of at least 50% of the Company’s outstanding voting securities; or
� a sale, lease, exchange or other transfer in one transaction or a series of related transactions undertaken with a common purpose of at least 50% of the Company’s assets.
"Related Party Transaction" is generally defined as a Company Transaction pursuant to which:
� the beneficial ownership of the Company or the resulting company remains the same with respect to at least 70% of the voting power of the outstanding voting securities in substantially the same proportions as immediately prior to such Company Transaction;
� no entity (other than the Company or an affiliate) will beneficially own 30% or more of the outstanding shares of Common Stock of the resulting company or the voting power of the outstanding voting securities; and
� the Company’s incumbent board will, after the Company Transaction, constitute at least a majority of the board of the company resulting from such Company Transaction.
"Change in Control" is generally defined as the occurrence of any of the following events:
� an acquisition of beneficial ownership of 30% or more of either (a) the then outstanding shares of Common Stock of the Company or (b) the combined voting power of the then outstanding voting securities of the Company entitled to vote generally in the election of directors (excluding any acquisition directly from the Company, any acquisition by the Company, any acquisition by any employee benefit plan of the Company, or a Related Party Transaction); or
� a change in the composition of the Board during any two-year period such that the incumbent board members cease to constitute at least a majority (not including directors whose election was approved by at least two-thirds of the incumbent board).
1997 Stock Option Plan. All options held by the Named Executive Officers issued pursuant to the Company’s 1997 Stock Option Plan become 100% vested and exercisable in connection with the following events generally described:
� any person is or becomes the beneficial owner of securities of the Company representing 30% or more of the combined voting power of the Company’s then outstanding securities;
� the following individuals cease for any reason to constitute a majority of the number of directors then serving: individuals who, on the effective date of the plan, constitute the Board and any new director whose appointment or election by the Board or nomination for election by the Company’s shareholders
24
outstanding voting securities of the Company entitled to vote generally in the election of directors, excluding, certain acquisitions involving the Company or a related company; or
� consummation of a merger or consolidation of the Company or any direct or indirect subsidiary of the Company with any other corporation, other than (1) a merger or consolidation which would result in the voting securities of the Company outstanding immediately prior to such merger or consolidation continuing to represent at least 70% of the combined voting power of the securities of the Company or such surviving entity or any parent thereof outstanding immediately after such merger or consolidation, or (2) a merger or consolidation effected to implement a recapitalization of the Company in which no person is or becomes the beneficial owner of securities of the Company representing 30% or more of the combined voting power of the Company’s then outstanding securities;
� the consummation of a plan of complete liquidation or dissolution of the Company or there is consummated an agreement for the sale or disposition by the Company of all or substantially all of the Company’s assets, other than a sale or disposition by the Company to certain related entities; or
� consummation of a sale or other disposition which, when aggregated with any other such sale(s) or disposition(s) occurring within 12 months of such sale or disposition, relates to 30% or more of the equity book value of the Company as measured as of the fiscal month-end immediately preceding the first such sale or disposition.
Annual Incentive Compensation Plan. Under the terms of the 2008 Annual Incentive Compensation Plan, participants must remain employed by the Company through the entire fiscal year and through the payment date (within 60 days following fiscal year-end) to be entitled to receive payment, unless termination is due to retirement, disability or death, in which case the participant will be entitled to a pro-rata amount based on the participant’s period of active employment. Long-Term Incentive Plan. Under the terms of the LTIP, participants must be actively employed by the Company through the entire performance period and through the payment date (on or before January 10 following the end of each performance period) to be entitled to receive payment, unless termination is due to retirement, disability or death, in which case the participant will be entitled to the actual award for the full performance period in the normal course so long as the participant completed at least one year of continuous employment during the performance period. Pension Plans. Under the terms of the Pension Plan and SERPs (Pre 2005 and 2005+), a participant must earn five years of service to receive a termination benefit. Disability benefits are available to any active participant who becomes totally and permanently disabled and remains so until normal retirement age. The disability benefit is calculated assuming the rate of pay at disability continues in effect until normal retirement age, and includes service from the date of disability until normal retirement age. Normal retirement age is 65, with 5 years of service, and early retirement can occur once a participant’s age plus years of service equal at least 65 years.
Potential Payments Upon Termination of Employment or Change in Control The estimated potential incremental payments and benefits for the Named Executive Officers under each termination scenario are outlined in the following table, except with respect to Mr. Kring for whom only actual amounts are reflected as a result of his retirement as of December 31, 2008. The table does not include amounts payable under the DC SERP and benefits generally available to all employees on a non-discriminatory basis or earned benefits, which are payments and benefits that the Named Executive Officers would have already earned during their employment with us whether or not a termination or change in control event had occurred. Actual amounts payable can only be determined at the time of termination or change in control.
25
was approved or recommended by a vote of at least two-thirds (2/3) of the directors then still in office who either were directors on the date hereof or whose appointment, election or nomination for election was previously so approved or recommended;
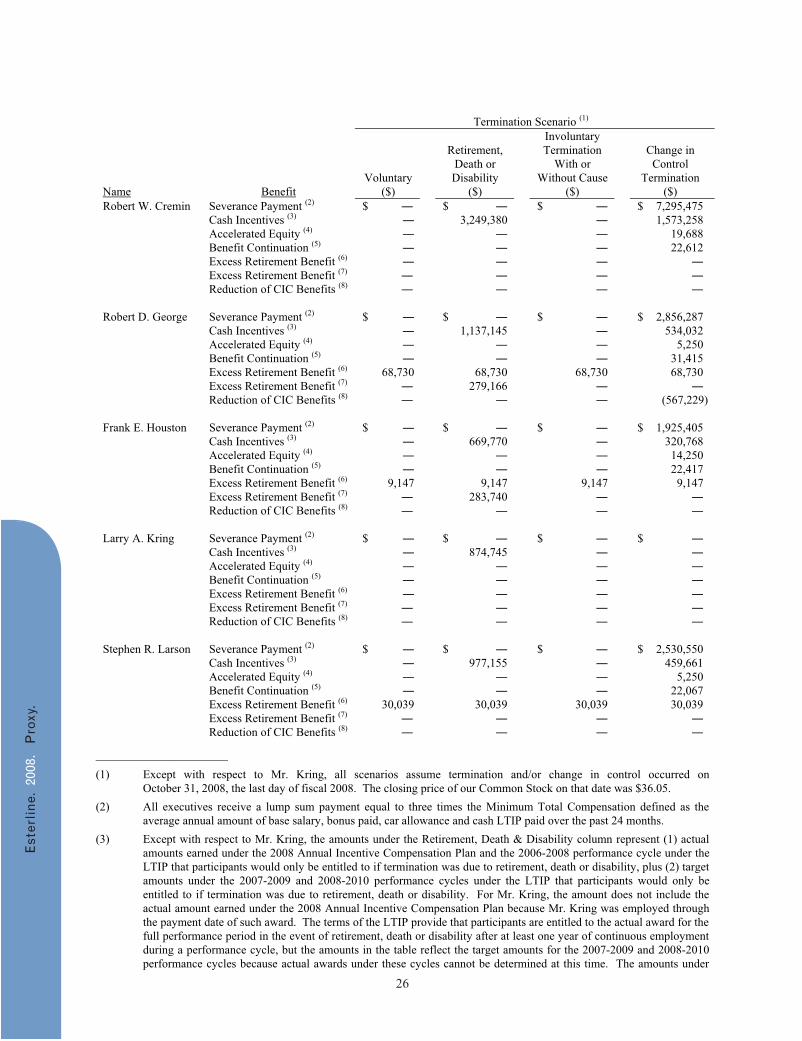
Termination Scenario (1)
Name Benefit Voluntary
($)
Retirement, Death or Disability
($)
Involuntary Termination
With or Without Cause
($)
Change in Control
Termination ($)
Robert W. Cremin Severance Payment (2) $ � $ � $ � $ 7,295,475 Cash Incentives (3) � 3,249,380 � 1,573,258 Accelerated Equity (4) � � � 19,688 Benefit Continuation (5) � � � 22,612 Excess Retirement Benefit (6) � � � � Excess Retirement Benefit (7) � � � � Reduction of CIC Benefits (8) � � � � Robert D. George Severance Payment (2) $ � $ � $ � $ 2,856,287 Cash Incentives (3) � 1,137,145 � 534,032 Accelerated Equity (4) � � � 5,250 Benefit Continuation (5) � � � 31,415 Excess Retirement Benefit (6) 68,730 68,730 68,730 68,730 Excess Retirement Benefit (7) � 279,166 � � Reduction of CIC Benefits (8) � � � (567,229) Frank E. Houston Severance Payment (2) $ � $ � $ � $ 1,925,405 Cash Incentives (3) � 669,770 � 320,768 Accelerated Equity (4) � � � 14,250 Benefit Continuation (5) � � � 22,417 Excess Retirement Benefit (6) 9,147 9,147 9,147 9,147 Excess Retirement Benefit (7) � 283,740 � � Reduction of CIC Benefits (8) � � � � Larry A. Kring Severance Payment (2) $ � $ � $ � $ � Cash Incentives (3) � 874,745 � � Accelerated Equity (4) � � � � Benefit Continuation (5) � � � � Excess Retirement Benefit (6) � � � � Excess Retirement Benefit (7) � � � � Reduction of CIC Benefits (8) � � � � Stephen R. Larson Severance Payment (2) $ � $ � $ � $ 2,530,550 Cash Incentives (3) � 977,155 � 459,661 Accelerated Equity (4) � � � 5,250 Benefit Continuation (5) � � � 22,067 Excess Retirement Benefit (6) 30,039 30,039 30,039 30,039 Excess Retirement Benefit (7) � � � � Reduction of CIC Benefits (8) � � � �
____________________ (1) Except with respect to Mr. Kring, all scenarios assume termination and/or change in control occurred on
October 31, 2008, the last day of fiscal 2008. The closing price of our Common Stock on that date was $36.05.
(2) All executives receive a lump sum payment equal to three times the Minimum Total Compensation defined as the average annual amount of base salary, bonus paid, car allowance and cash LTIP paid over the past 24 months.
(3) Except with respect to Mr. Kring, the amounts under the Retirement, Death & Disability column represent (1) actual amounts earned under the 2008 Annual Incentive Compensation Plan and the 2006-2008 performance cycle under the LTIP that participants would only be entitled to if termination was due to retirement, death or disability, plus (2) target amounts under the 2007-2009 and 2008-2010 performance cycles under the LTIP that participants would only be entitled to if termination was due to retirement, death or disability. For Mr. Kring, the amount does not include the actual amount earned under the 2008 Annual Incentive Compensation Plan because Mr. Kring was employed through the payment date of such award. The terms of the LTIP provide that participants are entitled to the actual award for the full performance period in the event of retirement, death or disability after at least one year of continuous employment during a performance cycle, but the amounts in the table reflect the target amounts for the 2007-2009 and 2008-2010 performance cycles because actual awards under these cycles cannot be determined at this time. The amounts under
26
the Change in Control Termination column represent an amount equal to Minimum Total Compensation minus base salary and car allowance received during the year.
(4) Represents the difference between the closing price of the Company’s Common Stock on October 31, 2008, and the exercise price of the accelerated options. Options accelerate even if the executive’s employment is not terminated. For purposes of stock options granted under the 2004 Equity Incentive Plan, this assumes the stock options are not assumed or substituted for by the successor company in a company transaction.
(5) Represents the cost of continuation of benefits for two years after the transaction, which is the longest period provided for under the termination protection agreements. These benefits include medical, dental, accident, disability and life insurance.
(6) Represents the value of additional benefits due to early retirement or death for reasons other than disability in excess of what is shown in the Pension Benefits for Fiscal 2008 table in this proxy statement.
(7) Represents the value of additional benefits due to termination of employment as a result of disability in excess of what is shown in the Pension Benefits for Fiscal 2008 table in this proxy statement.
(8) Represents the reduction estimated to be necessary to avoid excise taxes under Section 280G of the Internal Revenue Code of 1986, as amended, on payments related to a change in control. Under the terms of the termination protection agreements, payments are only reduced if the reduction would provide the executive a greater net, after-tax benefit than he or she would receive if the payments were not subject to the reduction.
CERTAIN RELATIONSHIPS AND RELATED TRANSACTIONS
The Company reviews related party transactions. Related party transactions are transactions that involve the Company’s directors, executive officers, director nominees, 5% or more beneficial owners of the Company’s Common Stock, immediate family members of these persons, or entities in which one of these persons has a direct or indirect material interest. Transactions that are reviewed as related party transactions by the Company are transactions that involve amounts that would exceed $120,000 (the current threshold required to be disclosed in the proxy statement under SEC regulations and certain other similar transactions). Pursuant to the Company’s Code of Business Conduct and Ethics, employees and directors have a duty to report any potential conflicts of interest to the appropriate level of management or to the Board of Directors, in the case of directors. The Company evaluates these reports along with responses to the Company’s annual director and officer questionnaires for any indication of possible related party transactions. If a transaction is deemed by the Company to be a related party transaction, the information regarding the transaction is forwarded to the Audit Committee for review and approval. Pursuant to the Audit Committee’s charter, it has been delegated the authority to review and approve all related party transactions.
27
AUDIT COMMITTEE REPORT
The Audit Committee of the Company’s Board of Directors consists of five non-employee directors, each of whom the Board has determined (i) meets the independence criteria specified by the SEC and the requirements of Sections 303A.02 and other applicable sections of the NYSE listing standards and (ii) is financially literate in accordance with the requirements of Section 303A.07 of the NYSE listing standards. The Audit Committee annually reviews and reassesses its written charter. Management has the primary responsibility for the financial statements and the reporting process, including the systems of internal controls for financial reporting. The Audit Committee is responsible for overseeing the Company’s financial reporting processes on behalf of the Board of Directors. In fulfilling its oversight responsibilities, the Audit Committee reviewed and discussed with management the audited financial statements relating to the fiscal year ended October 31, 2008, and discussed with management the quality, not just the acceptability, of the accounting principles, the reasonableness of significant judgments, and the clarity of disclosures in the financial statements. The Audit Committee selects and retains the Company’s independent registered public accounting firm. The Audit Committee discussed with the independent registered public accounting firm, who is responsible for expressing an opinion on the conformity of those audited financial statements with generally accepted accounting principles, their judgments as to the quality, not just the acceptability, of the Company’s accounting principles and such other matters relating to the audit required to be discussed by Statements of Auditing Standards No. 114 (as amended). In addition, the Audit Committee has discussed with the independent registered public accounting firm the accounting firm’s independence from management and the Company and received the written disclosures from the independent registered public accounting firm required by the Independence Standards Board Standard No. 1. The Audit Committee discussed with the Company’s internal auditors and the independent registered public accounting firm the overall scope and plans for their respective audits. The Audit Committee met with the internal auditors and the independent registered public accounting firm, with and without management present, to discuss the results of their examinations, their evaluations of the Company’s internal controls, and the overall quality of the Company’s financial reporting. In reliance on the reviews and discussions referred to above, the Audit Committee recommended to the Board of Directors (and the Board has approved) that the audited financial statements be included in the Annual Report on Form 10-K for the year ended October 31, 2008, for filing with the Securities and Exchange Commission. Respectfully submitted, ROBERT S. CLINE, CHAIRMAN ANTHONY P. FRANCESCHINI PAUL V. HAACK CHARLES R. LARSON JAMES L. PIERCE
28
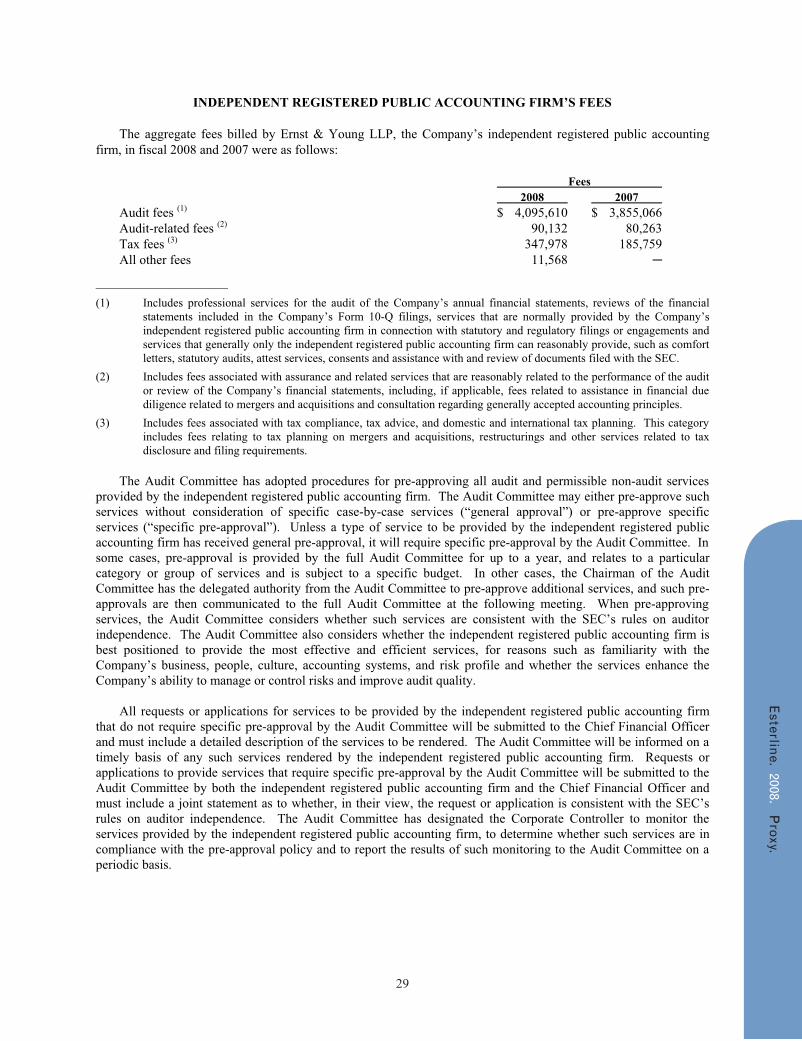
INDEPENDENT REGISTERED PUBLIC ACCOUNTING FIRM’S FEES
The aggregate fees billed by Ernst & Young LLP, the Company’s independent registered public accounting firm, in fiscal 2008 and 2007 were as follows:
Fees 2008 2007 Audit fees (1) $ 4,095,610 $ 3,855,066 Audit-related fees (2) 90,132 80,263 Tax fees (3) 347,978 185,759 All other fees 11,568 �
____________________ (1) Includes professional services for the audit of the Company’s annual financial statements, reviews of the financial
statements included in the Company’s Form 10-Q filings, services that are normally provided by the Company’s independent registered public accounting firm in connection with statutory and regulatory filings or engagements and services that generally only the independent registered public accounting firm can reasonably provide, such as comfort letters, statutory audits, attest services, consents and assistance with and review of documents filed with the SEC.
(2) Includes fees associated with assurance and related services that are reasonably related to the performance of the audit or review of the Company’s financial statements, including, if applicable, fees related to assistance in financial due diligence related to mergers and acquisitions and consultation regarding generally accepted accounting principles.
(3) Includes fees associated with tax compliance, tax advice, and domestic and international tax planning. This category includes fees relating to tax planning on mergers and acquisitions, restructurings and other services related to tax disclosure and filing requirements.
The Audit Committee has adopted procedures for pre-approving all audit and permissible non-audit services
provided by the independent registered public accounting firm. The Audit Committee may either pre-approve such services without consideration of specific case-by-case services (“general approval”) or pre-approve specific services (“specific pre-approval”). Unless a type of service to be provided by the independent registered public accounting firm has received general pre-approval, it will require specific pre-approval by the Audit Committee. In some cases, pre-approval is provided by the full Audit Committee for up to a year, and relates to a particular category or group of services and is subject to a specific budget. In other cases, the Chairman of the Audit Committee has the delegated authority from the Audit Committee to pre-approve additional services, and such pre-approvals are then communicated to the full Audit Committee at the following meeting. When pre-approving services, the Audit Committee considers whether such services are consistent with the SEC’s rules on auditor independence. The Audit Committee also considers whether the independent registered public accounting firm is best positioned to provide the most effective and efficient services, for reasons such as familiarity with the Company’s business, people, culture, accounting systems, and risk profile and whether the services enhance the Company’s ability to manage or control risks and improve audit quality.
All requests or applications for services to be provided by the independent registered public accounting firm that do not require specific pre-approval by the Audit Committee will be submitted to the Chief Financial Officer and must include a detailed description of the services to be rendered. The Audit Committee will be informed on a timely basis of any such services rendered by the independent registered public accounting firm. Requests or applications to provide services that require specific pre-approval by the Audit Committee will be submitted to the Audit Committee by both the independent registered public accounting firm and the Chief Financial Officer and must include a joint statement as to whether, in their view, the request or application is consistent with the SEC’s rules on auditor independence. The Audit Committee has designated the Corporate Controller to monitor the services provided by the independent registered public accounting firm, to determine whether such services are in compliance with the pre-approval policy and to report the results of such monitoring to the Audit Committee on a periodic basis.
29
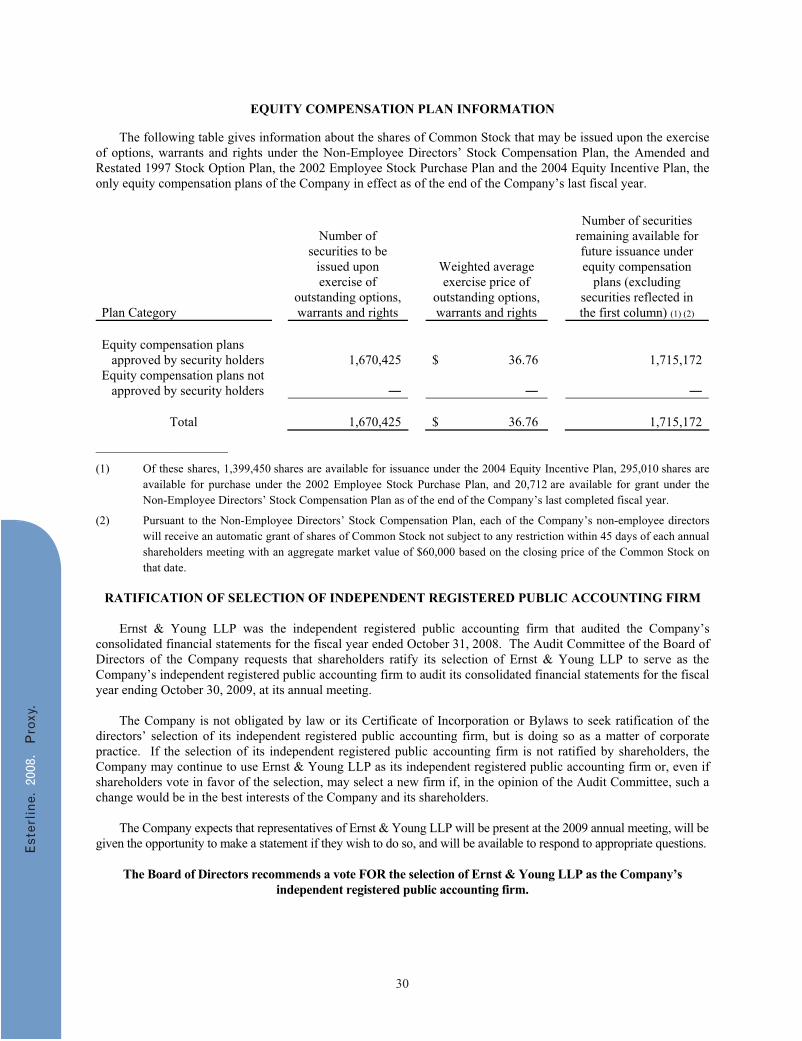
EQUITY COMPENSATION PLAN INFORMATION
The following table gives information about the shares of Common Stock that may be issued upon the exercise of options, warrants and rights under the Non-Employee Directors’ Stock Compensation Plan, the Amended and Restated 1997 Stock Option Plan, the 2002 Employee Stock Purchase Plan and the 2004 Equity Incentive Plan, the only equity compensation plans of the Company in effect as of the end of the Company’s last fiscal year.
Plan Category
Number of securities to be
issued upon exercise of
outstanding options, warrants and rights
Weighted average exercise price of
outstanding options, warrants and rights
Number of securities remaining available for future issuance under equity compensation
plans (excluding securities reflected in the first column) (1) (2)
Equity compensation plans approved by security holders 1,670,425 $ 36.76 1,715,172 Equity compensation plans not approved by security holders � � �
Total 1,670,425 $ 36.76 1,715,172
____________________
(1) Of these shares, 1,399,450 shares are available for issuance under the 2004 Equity Incentive Plan, 295,010 shares are available for purchase under the 2002 Employee Stock Purchase Plan, and 20,712 are available for grant under the Non-Employee Directors’ Stock Compensation Plan as of the end of the Company’s last completed fiscal year.
(2) Pursuant to the Non-Employee Directors’ Stock Compensation Plan, each of the Company’s non-employee directors will receive an automatic grant of shares of Common Stock not subject to any restriction within 45 days of each annual shareholders meeting with an aggregate market value of $60,000 based on the closing price of the Common Stock on that date.
RATIFICATION OF SELECTION OF INDEPENDENT REGISTERED PUBLIC ACCOUNTING FIRM
Ernst & Young LLP was the independent registered public accounting firm that audited the Company’s consolidated financial statements for the fiscal year ended October 31, 2008. The Audit Committee of the Board of Directors of the Company requests that shareholders ratify its selection of Ernst & Young LLP to serve as the Company’s independent registered public accounting firm to audit its consolidated financial statements for the fiscal year ending October 30, 2009, at its annual meeting. The Company is not obligated by law or its Certificate of Incorporation or Bylaws to seek ratification of the directors’ selection of its independent registered public accounting firm, but is doing so as a matter of corporate practice. If the selection of its independent registered public accounting firm is not ratified by shareholders, the Company may continue to use Ernst & Young LLP as its independent registered public accounting firm or, even if shareholders vote in favor of the selection, may select a new firm if, in the opinion of the Audit Committee, such a change would be in the best interests of the Company and its shareholders. The Company expects that representatives of Ernst & Young LLP will be present at the 2009 annual meeting, will be given the opportunity to make a statement if they wish to do so, and will be available to respond to appropriate questions.
The Board of Directors recommends a vote FOR the selection of Ernst & Young LLP as the Company’s independent registered public accounting firm.
30
SECTION 16(a) BENEFICIAL OWNERSHIP REPORTING COMPLIANCE Section 16(a) of the Securities Exchange Act of 1934, as amended, generally requires the Company’s directors, executive officers and 10% or greater shareholders to file electronically reports of their ownership of Common Stock and of changes in such ownership to the SEC. SEC regulations also require the Company to identify in this proxy statement any person subject to this requirement who did not file a Section 16 report on a timely basis. Based solely upon a review of such reports furnished to the Company and written representations from the executive officers and directors that no other reports were required, the Company believes that all such reports were filed on a timely basis during fiscal 2008.
OTHER MATTERS As of the date of this proxy statement, the only matters which management intends to present at the meeting are those set forth in the notice of meeting and in this proxy statement. Management knows of no other matters that may come before the meeting. However, if any other matters properly come before the meeting, it is intended that proxies in the accompanying form will be voted in respect thereof in accordance with the judgment of the person or persons voting as proxies.
FORM 10-K AND OTHER CORPORATE GOVERNANCE INFORMATION The 2008 Annual Report of the Company was provided to shareholders with this proxy statement. The Company will furnish without charge a copy of the Company’s Annual Report on Form 10-K for the fiscal year ended October 31, 2008, including the consolidated financial statements and the financial statement schedules, to any shareholder who makes a request. Contact Esterline Technologies Corporation, Attn: Corporate Communications, 500 108th Avenue NE, Suite 1500, Bellevue, WA 98004 or call (425) 453-9400. This proxy statement, the 2008 Annual Report and the Annual Report on Form 10-K for the fiscal year ended October 31, 2008, are also available on the Company’s website, http://www.esterline.com/investor/sec.stm. In addition, shareholders may find information relating to the Company’s corporate governance posted on the Company’s website, http://www.esterline.com/governance. Documents located in this section include the charter for the Audit, Compensation and Nominating & Corporate Governance Committees, Corporate Governance Guidelines and the Code of Business Conduct and Ethics. This information is available in print to any shareholder who makes a request at the address or phone number above.
SHAREHOLDER PROPOSALS FOR 2010 Proposals of shareholders of the Company that are intended to be included in the Company’s proxy statement and presented by such shareholders at the Company’s 2010 annual meeting must be received at the Company’s principal executive office no later than Friday, September 25, 2009. In order for a shareholder’s proposal to be eligible for inclusion in the Company’s proxy statement for the 2010 annual meeting, among other things, the shareholder must own at least one percent of the outstanding shares of Common Stock or shares of Common Stock with a market value of $2,000 for at least one year prior to submitting the proposal, and the shareholder must continue to own such stock through the date of the 2010 annual meeting. Shareholder proposals submitted to the Company outside the processes required for inclusion in the proxy statement for the 2010 annual meeting after December 9, 2009, will be considered untimely by the Company. In addition, if the Company receives notice of a shareholder proposal after December 9, 2009, the persons named as proxies in the proxy statement for the 2010 annual meeting will have discretionary voting authority to vote on such proposal at the 2010 annual meeting. By order of the Board of Directors ROBERT D. GEORGE Vice President, Chief Financial Officer, Secretary and Treasurer January 23, 2009
31

(This page intentionally left blank.)

(This page intentionally left blank.) (This page intentionally left blank.)

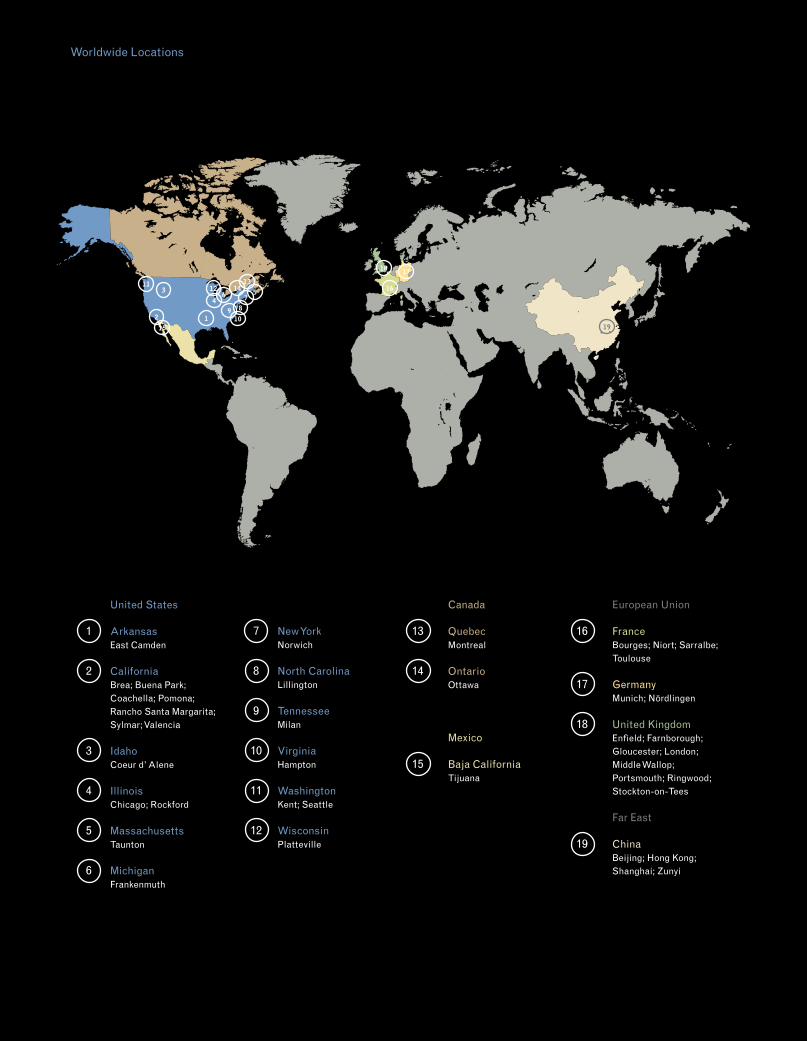
0 8 $ 1,483.2 $ 113.5 $ 3.80 $ 1,026.30 7 1,207.0 87.8 3.34 1,121.80 6 920.4 53.6 2.08 708.00 5 774.6 47.4 1.87 620.90 4 567.0 29.4 1.36 461.0
Net Sales
Dollars In Millions
Income fromContinuing Operations
DollarsIn Millions
Diluted EPS from Continuing Operations
Dollars
Shareholders’ Equity
DollarsIn Millions
In a changed environment Esterline’s strategy, capabilities, culture and the highly engineered solutions we offer are proving even more significant. Our strong performance in the face of a weakened economy is the direct result of the balance our business maintains. Esterline solutions are found across hundreds of customer programs; in foreign and domestic, commercial, defense and industrial markets. Our performance derives from a focus on problem-solving, niche markets, and highly flexible facilities. It’s sustained by our embrace of lean manufacturing, delivering value to customers all over the world.
Financial Highlights
Esterline Corporation is a specialized manufacturing company principally serving aerospace and defense markets. Esterline is headquartered in Bellevue, Washington, and is listed on the New York Stock Exchange with the trading symbol ESL.
2 1
3
4
56 7
89
1211
10
16
1718
19
United States
1 Arkansas East Camden 2 California Brea; Buena Park; Coachella; Pomona; Rancho Santa Margarita; Sylmar; Valencia 3 Idaho Coeur d’ Alene
4 Illinois Chicago; Rockford
5 Massachusetts Taunton
6 Michigan Frankenmuth
7 New York Norwich
8 North Carolina Lillington
9 Tennessee Milan
10 Virginia Hampton 11 Washington Kent; Seattle
12 Wisconsin Platteville
Canada
13 Quebec Montreal
14 Ontario Ottawa
Mexico
15 Baja California Tijuana
Worldwide Locations
European Union
16 France Bourges; Niort; Sarralbe; Toulouse
17 Germany Munich; Nördlingen 18 United Kingdom Enfi eld; Farnborough; Gloucester; London; Middle Wallop; Portsmouth; Ringwood; Stockton-on-Tees
Far East
19 China Beijing; Hong Kong; Shanghai; Zunyi
15
1413
173074_COVER_R1.indd 2173074_COVER_R1.indd 2 1/14/09 6:41:50 PM1/14/09 6:41:50 PM

2008. Annual Report and Proxy.
In a changed environment Esterline’s strategy, capabilities, culture and the highly engineered solutions we offer are proving even more significant.
ES
TE
RL
INE
2008. AN
NU
AL
RE
PO
RT
AN
D P
RO
XY.
173074_COVER_R1.indd 1173074_COVER_R1.indd 1 1/14/09 6:40:37 PM1/14/09 6:40:37 PM