Embed Size (px)
Citation preview
Take the steps...
Transportation Research
Research...Knowledge...Innovative Solutions!
2008-06
Pavement Rehabilitation Selection
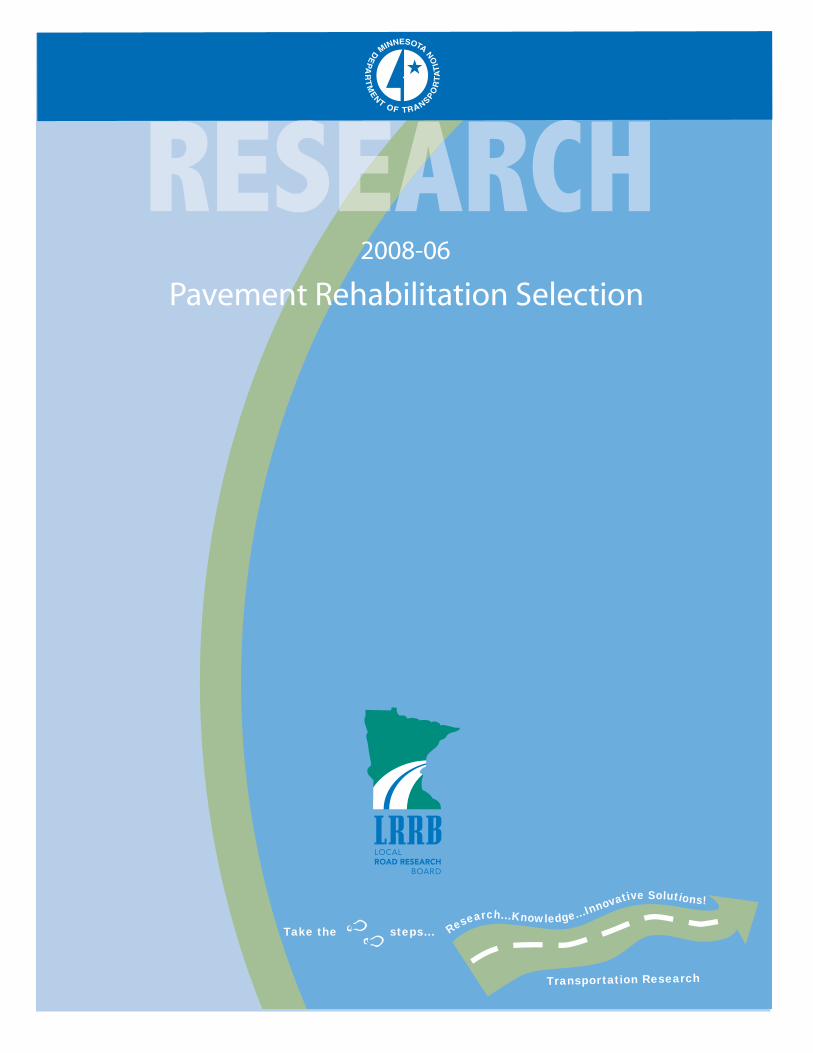
Technical Report Documentation Page 1. Report No. 2. 3. Recipients Accession No. MN/RC 2008-06 4. Title and Subtitle 5. Report Date
January 2008 6.
Pavement Rehabilitation Selection
7. Author(s) 8. Performing Organization Report No. Shongtao Dai, Gene Skok, Thomas Westover, Joseph Labuz, and Erland Lukanen
9. Performing Organization Name and Address 10. Project/Task/Work Unit No. 11. Contract (C) or Grant (G) No.
Department of Civil Engineering University of Minnesota 500 Pillsbury Dr. SE Minneapolis, Minnesota 55455
(c) 81655 (wo) 135
12. Sponsoring Organization Name and Address 13. Type of Report and Period Covered Final Report 14. Sponsoring Agency Code
Minnesota Department of Transportation 395 John Ireland Boulevard Mail Stop 330 St. Paul, Minnesota 55155 15. Supplementary Notes http://www.lrrb.org/PDF/200806.pdf 16. Abstract (Limit: 200 words) The objective of the project was to outline best practices for the selection of asphalt pavement recycling techniques from the many choices that are available. The report specifically examines cold-in-place recycling (CIR), plain full depth reclamation (FDR), and mill & overlay (M&O). Interviews, surveys, and site visits were conducted at both Mn/DOT districts and counties, where relevant rehabilitation information was supplied on over 120 projects. A database was constructed to organize the details of these projects, and the parameters in the database included (1) cracking, (2) ride, (3) rutting, (4) age, and (5) traffic volume. From studying the existing rehabilitation projects in the State, Ride Quality Index (RQI) and Surface Rating (SR) were selected as the descriptors of pavement surface condition. A decision procedure based on the analysis of all available projects was developed. The decision procedure included (1) consideration of road geometrics; (2) pavement condition survey; and (3) structural adequacy evaluation. Furthermore, a step-by-step checklist was developed to provide local engineers with a simple and useful tool to follow the decision procedures. The procedure includes selection of rehabilitation method, pavement thickness design, materials mixture design, and construction.
17. Document Analysis/Descriptors 18. Availability Statement Pavement, rehabilitation, selection, mill & overlay (M&O), cold-in-place recycling (CIR), plain full depth reclamation (FDR)
No restrictions. Document available from: National Technical Information Services, Springfield, Virginia 22161
19. Security Class (this report) 20. Security Class (this page) 21. No. of Pages 22. Price Unclassified Unclassified 143
Pavement Rehabilitation Selection
Final Report
Prepared by:
Gene Skok Thomas Westover
Joseph Labuz
Department of Civil Engineering University of Minnesota
Shongtao Dai Erland Lukanen
Office of Materials
Minnesota Department of Transportation
January 2008
Published by:
Minnesota Department of Transportation Research Services Section
395 John Ireland Boulevard, MS 330 St. Paul, Minnesota 55155-1899
This report represents the results of research conducted by the authors and does not necessarily represent the views or policies of the Minnesota Department of Transportation and/or the Center for Transportation Studies. This report does not contain a standard or specified technique. The authors and the Minnesota Department of Transportation and/or Center for Transportation Studies do not endorse products or manufacturers. Trade or manufacturers’ names appear herein solely because they are considered essential to this report.

Acknowledgements
Support was provided by the Local Road Research Board. Special thanks are extended to the Technical Liaison, Brad Wentz of Beck County, for his technical assistance and reviews. The following people participated in an evaluation of the process and provided valuable comments: Brian Noetzelman, Pope County; Darrell Pettis, Lesueur County; Kathy Jaschke, Ramsey County; Michael Sheehan, Olmsted County; Wayne Olson, Carlton County. Finally, Dave Janisch of Mn/DOT is acknowledged for supplying pavement performance data.
Table of Contents
Chapter 1 Evaluation of Current Reclaimed Roads and Information Gathering......... 1 1.1 Literature Review................................................................................................ 1
1.1.1 Basic Asphalt Recycling Manual (BARM) ................................................ 1 1.1.2 Nevada Experience ..................................................................................... 4 1.1.3 Ontario Experience (Reference 4) .............................................................. 8 1.1.4 Pennsylvania Experience .......................................................................... 12 1.1.5 Ramsey County (MN) Experience (Reference 10)................................... 14 1.1.6 Minnesota DOT, County and City Experience ......................................... 15
1.2 Database............................................................................................................ 16 1.3 Interviews and Site Visits ................................................................................. 17 1.4 Preliminary Data Analysis ................................................................................ 18 1.5 Summary ........................................................................................................... 24
Chapter 2 Definition of Decision Process Parameters............................................... 25 2.1 Introduction....................................................................................................... 25 2.2 System Level Analysis...................................................................................... 27
2.2.1 Present Serviceability Rating (PSR) ......................................................... 27 2.2.2 Surface Rating (SR) .................................................................................. 28 2.2.3 Pavement Quality Index (PQI).................................................................. 30 2.2.4 Use of Pavement Condition Indices for Pavement Management ............. 31
2.3 Project Level Analysis ...................................................................................... 31 2.3.1 Surface Rating (SR) for Project Analysis ................................................. 31 2.3.2 Rut Depth Evaluation................................................................................ 34 2.3.3 Structural Adequacy of a Bituminous Pavement Section ......................... 35
2.3.3.1 Tonnage................................................................................................. 36 2.3.3.2 Pavement Thickness Design ................................................................. 36
2.4 Summary ........................................................................................................... 36 Chapter 3 Development of Decision Procedures....................................................... 38
3.1 Introduction....................................................................................................... 38 3.2 System and Project Analysis Definition ........................................................... 40 3.3 Criteria for System Analysis............................................................................. 41 3.4 Criteria for Project Analysis ............................................................................. 41
3.4.1 Geometric Considerations......................................................................... 41 3.4.2 Review of Individual Weighted Distresses (IWD) ................................... 42 3.4.3 Review of Structural Adequacy ................................................................ 43
3.4.3.1 Pavement Thickness Design ................................................................. 43 3.4.3.2 Tonnage Determination ........................................................................ 43 3.4.3.3 Conduct Falling Weight Deflectometer (FWD) testing........................ 43 3.4.3.4 Constructability..................................................................................... 43
3.5 Relationships Suggested from Data Analysis ................................................... 44 3.5.1 Critical SR value ....................................................................................... 45 3.5.2 Critical Transverse Cracking .................................................................... 45 3.5.3 Surface Rating Degradation...................................................................... 46 3.5.4 Recurrence of Individual Distresses ......................................................... 47 3.5.5 Multiple Cracking IWD ............................................................................ 49
3.5.6 Ride Considerations ...................................................................................49 3.6 Recommended Decision Checklists...................................................................49
3.6.1 Geometrics Checklist .................................................................................49 3.6.2 Pavement Condition Checklist.................................................................. 52 3.6.3 Structural Adequacy Checklist ................................................................. 54
3.7 Summary ........................................................................................................... 56 Chapter 4 Trial Implementation .................................................................................58
4.1 Introduction........................................................................................................58 4.2 Summary of Discussions....................................................................................59
Chapter 5 Development of Best Practices ................................................................. 61 5.1 Introduction....................................................................................................... 61 5.2 Selection Criteria .............................................................................................. 61 5.3 Pavement Thickness Design ............................................................................. 63
5.3.1 Thickness Design for Mill and Overlay Projects...................................... 63 5.3.2 Thickness Design for Cold in Place Recycling (CIR) .............................. 63 5.3.3 Thickness Design for Full Depth Reclamation (FDR) ............................. 64
5.4 Mixture Design and Construction Requirements.............................................. 64 5.4.1 Mill and Overlay Mixture Design............................................................. 65 5.4.2 Cold In-Place Recycling (CIR)..................................................................66
5.5 Construction Requirements............................................................................... 67 5.5.1 Equipment ................................................................................................. 67 5.5.2 Construction Methods................................................................................68 5.5.3 Quality and Workmanship .........................................................................68
5.6 Summary ............................................................................................................69 Chapter 6 Summary and Recommendations ............................................................. 70 References………………………………………………………………………………………………..72 Appendix A Thickness Design Procedures
A.1 Soil Factor Design........................................................................................... A-1 A.2 Stabilometer R–Value Design......................................................................... A-3 A.3 MnPAVE Design ............................................................................................ A-5
Appendix B Definitions and Determination of Pavement Rideability in Minnesota Appendix C Discussion of FWD Testing and Analysis for Potential CIR, FDR and
Mill and Overlay Projects C.1 Introduction..................................................................................................... C-1 C.2 Forward Calculation for Subgrade.................................................................. C-1 C.3 Comparison of Subgrade Moduli Calculations............................................... C-2 C.4 Calculations for effective granular equivalent thickness ................................ C-7 C.5 Calibration of the EGE in Lukanen’s Method .............................................. C-10 C.6 Comparison of Before and After Deflection Results.................................... C-10 C.7 Summary ....................................................................................................... C-15
C.7.1 TH 6 from RP 13.996 to 17.993 (W Jct. TH210 to S. end of Bridge 18002) ....................................................................................... C-15
C.7.2 TH 6 from RP 119.996 to 128.471 (RP 128.471 near W Jct. TH 1) .... C-16 C.7.3 TH 23 from RP 30.555 to 45.583 (Jct TH75 (Pipestone) to CSAH10
near Ruthton) ........................................................................................ C-17 C.7.4 TH 23 from RP 50 to 61 (Near Florence to Jct TH 91 near Russell) ... C-18
C.7.5 TH 27 from RP 0 to 12.9 (TH 28 in Browns Valley to near CSAH 3) ………………………………………………………………………..….C-20
C.7.6 TH 27 from RP 12.9 to 24 (RP 0 is at TH 28 in Browns Valley and ends near Wheaton)........................................................................ C-21
C.7.7 TH 30 from RP 235.784 to 239.804 (Ends at TH 52 in Chatfield)....... C-22 C.7.8 TH 34 from RP 65.02 to 74.59 (Osage to Park Rapids) ....................... C-23 C.7.9 TH 56 from RP 14.77 to 31.167 (Wykoff Jct TH52 in Fountain) ........ C-24 C.7.10 TH 59 from RP 359.83 to 376.98 (W Jct. TH 1 to Newfolden) ........... C-25 C.7.11 TH 71 from RP 65.815 to 74.75 (From about 9 miles south of
TH 19 in Redwood Falls to TH 19) ...................................................... C-26 C.7.12 TH 71 from RP 260.666 to 280.153 (From N. Lmts of
Park Rapids to TH 200) ........................................................................ C-27 C.7.13 TH 71 from RP 294.000 to 303.875 (From 0.317 mi W of
E jct TH200 to S of Jct CSAH 9).......................................................... C-29 C.7.14 TH 71 from RP 375.482 to 385.800 (From Margie to Big Falls
in Koochiching County)........................................................................ C-29 C.7.15 TH 72 from RP 62.000 to 74.684 (Jct TH 11&72 to about
12 miles South) ..................................................................................... C-30 C.7.16 TH 80 from RP 1.566 to 8.443 (Wykoff to Jct TH52 in Fountain) ...... C-31 C.7.17 TH 89 from RP 74.001 to 81.386 (From about 7 miles east of
Grygla to Grygla).................................................................................. C-32 C.7.18 TH 172 from RP 0.000 to 11.587 (TH 11 north – along
SW shore of Lake of the Woods).......................................................... C-33 C.7.19 TH 200 from RP 31.885 to 46.674 (TH 32 to TH 59) .......................... C-34
C.8 References..................................................................................................... C-36 Appendix D Pre-rehabilitation SR Values for Projects to be rehabilitated Appendix E Checklist for Pavement Rehabilitation Decision Procedure
E.1 Geometrics Checklist .......................................................................................E-1 E.2 Pavement Condition Checklist.........................................................................E-3 E.3 Structural Adequacy Checklist ........................................................................E-5 E.4 A step-by-step procedure .................................................................................E-7
List of Figures
Figure 1.4: Cracking pattern of TH 23 in District 8 for CIR and FDR projects............... 17 Figure 1.5: PQI analysis for Mn/DOT CIR projects in District 1..................................... 19 Figure 1.6: PQI analysis for Mn/DOT FDR projects in District 1.................................... 19 Figure 1.7: PQI analysis for state projects in District 1.................................................... 20 Figure 1.8: The effective subgrade modulus determined by YONAPAVE...................... 21 Figure 1.9: The effective structural number determined by Hoffman’s method. ............. 21 Figure 1.10: The effective GE estimated from FWD deflections. .................................... 22 Figure 1.11: The effective subgrade modulus estimated by YONAPAVE. ..................... 22 Figure 1.12: The effective structural number determined by Hoffman’s method. ........... 23 Figure 1.13: The effective GE estimated from FWD deflections. .................................... 23 Figure 3.1: Pre-rehabilitation SR value for Full Depth Reclamation projects.................. 45 Figure 3.2: Contribution of Transverse Cracking to total SR........................................... 46 Figure 3.3: Surface rating for pre- and post-rehabilitation years...................................... 47 Figure 3.4: Transverse crack IWD recurrence. ................................................................. 48 Figure 3.5: Rutting IWD recurrence. ................................................................................ 48 Figure 3.6: Geometric Considerations. ............................................................................. 51 Figure 3.7: Selection of Rehabilitation Procedures. ......................................................... 53 Figure A.1: Flexible Pavement Design Using Soil Factors. ........................................... A-2 Figure A.2: R-Value Design Chart. ................................................................................ A-4 Figure C.1: Excerpt from Hoffman's paper describing the Hogg Model........................ C-2 Figure C.2: Illustration of the deflections used to calculate the AREA deflection
basin factor.................................................................................................... C-3 Figure C.3: Comparison of subgrade moduli from FWD tests in August 2006 on
TH 71 between Reference Posts 375 and 385. ............................................. C-4 Figure C.4: Subgrade modulus - effective R-value relationship derived from
Investigation 201........................................................................................... C-5 Figure C.5: Relationship between backcalculated subgrade moduli and R-value from
Investigation 201........................................................................................... C-6 Figure C.6: Comparison of Wiseman's and YANOPAVE subgrade effective R-value. C-7 Figure C.7: Comparison of effective G.E for 2006 FWD data on TH 71 from
Reference Post 375 to 385. ........................................................................... C-9 Figure C.8: Comparison of calculated EGE profile for 2006 FWD deflections on
TH 71. ........................................................................................................... C-9 Figure C.9: Comparison of before and after deflections before and after CIR and
FDR............................................................................................................. C-13 Figure C.10: Comparison of Effective R-values before and after FDR and CIR. ........ C-13 Figure C.11: Comparison of before and after Effective Granular Equivalent (EGE)
thickness before and after CIR and FDR. ................................................... C-14 Figure C.12: Comparison of deflection basin AREA factor before and after CIR and
FDR............................................................................................................. C-15 Figure D.1: Pre-rehabilitation SR value for Mill and Overlay projects.......................... D-1 Figure D.2: Pre-rehabilitation SR values for Cold-In-Place recycled projects............... D-1 Figure D.3: SR values for individual CIR projects......................................................... D-2 Figure D.4: SR values for individual FDR projects........................................................ D-2

Figure D.5: Transverse Cracking for CIR projects. ........................................................ D-3 Figure D.6: Transverse Cracking for FDR projects........................................................ D-3 Figure D.7: Longitudinal Distress for CIR projects........................................................ D-4 Figure D.8: Longitudinal Distress for FDR projects. ..................................................... D-4 Figure E.1: Geometric considerations (includes geometric requirements for state aid)..E-2 Figure E.2: Selection of Rehabilitation Procedures.........................................................E-4
List of Tables
Table 1.1: Pavement Rating Scale according to Mn/DOT Procedures............................. 18 Table 1.2: Summary of pavement design parameters calculated from FWD Tests on
TH 73 and TH 23 using YONAPAVE predictions............................................... 24 Table 2.1: Distress Types used for definition of Surface Rating...................................... 28 Table 2.2: Bituminous Pavement SR Weighting Factors. ................................................ 29 Table 2.3: Example of SR Calculation. ............................................................................ 30 Table 2.4a: Bituminous Pavement Transverse Cracking Weighting Factors. .................. 32 Table 2.4b: Example of Transverse Cracking Weighted Distress. ................................... 32 Table 2.5a: Bituminous Pavement Longitudinal Cracking and Joint Deterioration
Factors................................................................................................................... 33 Table 2.5b: Bituminous Pavement Longitudinal Cracking and Joint Deterioration
Factors................................................................................................................... 33 Table 2.6a: Bituminous Pavement Patterned Cracking. ................................................... 33 Table 2.6b: Example of Bituminous Pavement Patterned Cracking IWD Calculation. ... 33 Table 2.7: Recommended Severity Levels and Weighting Factors for Rutting. .............. 34 Table 2.8a: Bituminous Pavement Rutting Weighted Distress......................................... 35 Table 2.8b: Example of the Calculation of Bituminous Pavement Rutting Weighted
Distress IWD......................................................................................................... 35 Table 3.1: Rehabilitation Procedures................................................................................ 39 Table 3.2: Calculated Individual Weighted Distresses for 100 Percent Distresses. ......... 42 Table 3.3: Degradation Rate for various Rehabilitation Techniques................................ 47 Table 3.4: Effect of Mill and Overlay thickness on ride quality. ..................................... 49 Table 3.5: Checklist for Geometrics. ................................................................................ 50 Table 3.6: Pavement Condition Checklist. ....................................................................... 52 Table 3.7: Summary of Structure Adequacy..................................................................... 54 Table 5.1: CIR Mixture Design Criteria. .......................................................................... 67 Table B.1: Numerical Definitions of Ride. ..................................................................... B-2 Table C.1: Before and After Deflection Response Measures. ...................................... C-12 Table E.1: Pavement Condition Checklist .......................................................................E-3 Table E.2: Summary of Structure Adequacy. ..................................................................E-5
Executive Summary
The objective of the project is to outline best practices for the selection of asphalt pavement recycling techniques from the many choices that are available. The report specifically examines cold-in-place recycling (CIR), plain full depth reclamation (FDR), and mill & overlay (M&O). To accomplish the overall objective, the project was divided into five tasks: 1. Gather Information/Evaluate Current Reclaimed Roads 2. Define Decision Process Parameters 3. Develop Decision Tree (checklist)/Process 4. Implement Trial Checklist 5. Develop Best Practices The previous work done by entities both within and outside of the State of Minnesota were reviewed. Interviews, surveys, and site visits were conducted at both Mn/DOT districts and counties, where relevant rehabilitation information was supplied on over 120 projects. A database was constructed to organize the details of these projects. As part of the decision procedure, several parameters and indices were identified and used to determine when a pavement should be maintained and with what procedure. The parameters in the database include: (1) cracking, (2) ride, (3) rutting, (4) age, and (5) traffic volume. From studying the existing rehabilitation projects in the State, Ride Quality Index (RQI) and Surface Rating (SR) were selected as the descriptors of pavement surface condition. These values can be obtained using Mn/DOT pavement management van. A decision procedure based on the analysis of all available projects was developed. The decision procedure includes (1) consideration of road geometrics; (2) pavement condition survey; and (3) structural adequacy evaluation. Furthermore, a step-by-step checklist was developed to provide local engineers with a simple and useful tool to follow the decision procedures.
Trial implementations of the decision procedure were conducted through visits to several counties and districts. Actual projects from the counties were used as examples for the implementation. Finally, from feedback received during the visits, a best practice procedure on pavement rehabilitation was developed. The procedure includes selection of rehabilitation method, pavement thickness design, materials mixture design, and construction.
1
Chapter 1
Evaluation of Current Reclaimed Roads and Information Gathering
1.1 Literature Review In the late 1970’s and throughout the 1980’s recycling became integral part of hot-mix and cold mix asphalt construction and rehabilitation. In this section, the various types of recycling are briefly reviewed. For this project, the use of Cold-In-Place Recycling (CIR) and Full Depth Reclamation (FDR) are emphasized. The first few references help define the recycling processes and generally how the mixtures are designed and constructed. 1.1.1 Basic Asphalt Recycling Manual (BARM) Reference 1 is a manual developed by the Asphalt and Reclaiming Association (ARRA), and the manual covers all types of asphalt pavement recycling, including hot-mix asphalt recycling (both batch and drum plants), asphalt surface recycling, hot-in-place recycling, cold-mix asphalt recycling, and full depth reclamation. Materials and mix design, construction methods and equipment, case histories, and quality control assurance are discussed. The chapters that review procedures of interest are:
• Chapter 14-Cold-Mix Asphalt Recycling-Central Plant (Construction Methods and Equipment)
• Chapter 15-Cold-Mix Asphalt Recycling (In-Place) (Construction Methods and Equipment)
• Chapter 16-Cold-Mix Asphalt Recycling (Materials and Mix Design) • Chapter 17-Cold-Mix Recycling (Case Histories and QC/QA) • Chapter 18-Full Depth Reclamation • Chapter 19-Full Depth Reclamation (Case Histories and QC/QA) • Chapter 20-Structural Design of Recycled Pavements
The following terms that pertain to this study are included in the Glossary in Reference 1. • Rehabilitation-Work undertaken to extend the service life of an existing facility.
This includes placement of additional surfacing material and/or other work necessary to return an existing roadway (including shoulders) to a condition of structural or functional adequacy.
• Recycling-Reuse of existing materials to produce new materials • Cold-Mix Recycling-A method in which the existing pavement material is reused
without the application of heat. The process can be carried out in-place (cold in-place recycling) or at a central plant.
• Full Depth Reclamation-A recycling method in which all of the asphalt section and a predetermined amount of underlying material are treated to produce a base course.
2
The purpose of cold-mix recycling is to correct pavement distress that involves both surface and base courses. Materials such as asphalt emulsions, foamed asphalt, cutbacks, hydrated lime and/or fly ash have been used. One advantage of this process is that significant structural improvements can be made without altering the horizontal or vertical geometry of the pavement. Although cold recycled mixes can produce stable surfaces, a wearing surface over the recycled mix is normally required. Cold in-Place Recycling (CIR) is defined as a rehabilitation technique in which the existing pavement materials are reused in place. CIR can be used to restore the old pavement to the desired profile, eliminating existing wheel ruts, restoring the crown and cross slope, and eliminating pothole, irregularities and rough areas. It can also eliminate transverse, reflective, and longitudinal cracks. The Asphalt Recycling and Reclaiming Association (ARRA) defines cold in-place recycling as a partial depth recycling process involving 3 - 4 in. of the existing pavement and defines full depth reclamation as a separate procedure. The steps for CIR consist of
• preparation of construction area, • milling the existing pavement, • addition of recycling agent and virgin materials, • laydown, • compaction and, • placement of a surface course.
Two primary methods have been defined for CIR construction: 1. Single Machine- Single machine or single-pass equipment is capable of breaking,
pulverizing and adding recycling agents in a single pass. Volumetric proportioning and aggregate oversize are two of the major drawbacks of this method.
2. Equipment Train-The train consists of a series of machines, each capable of a particular operation. The usual components are a cold milling machine, portable crusher, travel-plant mixer and laydown machine.
The crushing and screening unit in the Equipment Train method crushes and screens the oversized material from the milling machine, and deposits the processed material into a pug mill, where the recycling agent is added. After mixing, the material is either deposited into the hopper of a self-propelled laydown machine or deposited in a windrow. If the mix is placed in a windrow, it is then picked up by a paver for laydown. Optimum moisture and emulsion contents from laboratory mix designs can be used as a starting point in the field. Adjustments may be made in the field. After the surface dries, the coating of the recycled material can be checked. If the coating is not 75%, the moisture content is adjusted before the emulsion content is increased. The mixture should not be friable; if it is friable, the emulsion and/or moisture should be increased. If
3
a sample of the mixture completely stains the hand, the mixture contains an excessive amount of asphalt. A standard national method for designing cold recycled mixes is not available. However, Figure 16-1 in Reference 1 is a flow chart for Mix Design of Cold Recycled Mixes. The steps listed are
• Obtain samples of RAP • Determine RAP gradation, binder content, aggregate gradation and aged asphalt
binder properties • Select amount and gradation of new aggregate, if required • Estimate asphalt binder demand • Select type and grade of new asphalt binder • Determine pre-mix moisture content, if required for adequate coating • Test trial mixtures; initial cure properties and water sensitivity • Establish job mix formula • Adjust mix design during construction
The RAP aggregate gradation may be adjusted using new aggregate. Table 16-2 of Reference 1 lists desired gradations for cold-mix recycling. Mn/DOT gradations are given in Mn/DOT Special Provision 2331. The amount of new binder required for cold in-place recycling generally ranges from 0.5-3.0 % of emulsified asphalts. This is equated to 0.3 - 2 % residual asphalt cement. Various types of asphalt emulsions were used as recycling agents. Four or five asphalt contents are used for laboratory mix design. As a starting point, some agencies use a liquid content of 4.5% in trial mixtures. A number of mix design methods are presented in Reference 1.
• Modified Marshall Method A • Modified Hveem Method B • Oregon Estimation, Method C • California Mix Design Method • Chevron Mix Design Method • Pennsylvania Mix Design Method • Asphalt Institute Mix Design Method • Mn/DOT Design – the current Mn/DOT mix design uses the gyratory compactor
for compaction. Specimens are tested using density and voids, stiffness, indirect tensile strength, moisture susceptibility and abrasion resistance.
Table 17-1of Reference 1 presents the construction material sampling and testing procedures recommended by AASHTO-AGC-ARTBA. The following items should be monitored:
• RAP gradation (maximum size) • Recycling agent (type and amount) • Moisture (amount) • Compacted density
4
• Depth of milling • Spreading depth/cross slope • Mixing equipment (calibration)
The structural design of pavements with recycled materials are essentially the same as pavements with only virgin materials. On the average, the AASHTO Guide indicates there is essentially no difference between hot recycled and virgin HMA mixtures. The AASHTO Guide and Mn/DOT thickness design procedures use the same methodology for recycled layers, using appropriate layer coefficients for calculating the structural number. Drainage coefficients are also included in the calculation of structural number. The SN equation is the following: SN = a1 D1 + a2 D2 m2 + a3D3m3
where, an = layer coefficients representative of surface, base and subbases, respectively. Dn = thickness of surface, base and subbase layers respectively. mn = drainage coefficients for untreated base and subbase layers. The following are typical AASHTO structural layer coefficients obtained from a variety of recycled test sections using several types of recycled materials. Layer coefficients for cold-recycled mixes can be determined from these values:
• Coefficients for foamed-asphalt recycled layers range from 0.20 - 0.42 with a midpoint of 0.31 (6);
• The range for emulsion recycled layers range from 0.17 - 0.41 with a midpoint of 0.29;
• A value between 0.30 - 0.35 are appropriate for cold recycled mixes; • A value of 0.44 for hot mix asphalt concrete.
The structural coefficient of cold recycled mixes is dependent on several other factors such as cure rate, drainage characteristics, etc. 1.1.2 Nevada Experience
Reference 2 presents the experience the Nevada DOT has had with CIR and FDR over the past 20 years. These procedures have saved the DOT millions of dollars while minimizing traffic interruptions during construction. Reference 2 describes how to select, design and construct successful CIR and FDR projects and evaluates short and long term performance. The cost benefit of CIR and FDR over conventional rehabilitations is demonstrated.
5
Why should an agency use CIR and FDR rehabilitation strategies NDOT has used CIR and FDR to improve the structural section, eliminate reflective cracking, and widen roadways by as much as 4 ft. The use of recycling has resulted in NDOT having the highest percentage of roadways in the “Very Smooth” category according to the FHWA functional system data for pavement roughness for the years 1999 and 2001. NDOT has used CIR on over 770 centerline miles or 11% of the system over the past 9 years and used FDR on over 900 centerline miles or 14% of the system in the past 20 years. NDOT’s method is to pulverize the existing pavement, to add and mix 2% mass of material, and to place a hot mix asphalt (HMA) layer and open-graded wearing course over the processed CIR or FDR. How does an agency select a CIR or FDR strategy for projects?
1. Conduct an in-depth pavement distress identification or condition survey. 2. Determine if the cause of pavement distress is functional or structural: Fatigue or
alligator cracking in one or both wheel paths, rutting and patching can show structural inadequacy. Examples of functional distress are longitudinal cracking, block cracking, poor ride, flushing or raveling. Transverse cracking at regular intervals indicate too brittle a binder or reflective cracking. Generally, CIR is used to correct functional deficiencies and FDR is used to correct structural deficiencies. Inadequate drainage is a common cause of pavement deterioration. Drainage must be considered and improved if needed. If the structural adequacy is not evaluated, the rehabilitation could either be under or over designed resulting in a shorter design life or too high a cost.
3. Conduct field testing to validate and quantify field condition observations: If the pavement is experiencing structural deficiencies, the use of FDR is recommended. Cores, depth checks and FWD are the suggested field test methods. If only functional deficiencies exist, the use of CIR is recommended. Cores should be used to ensure there is adequate HMA for the CIR process. If the intent is to perform a 3-in. CIR, then a minimum of 4.5 in. of HMA is required. A minimum intact structural section is required to accommodate the weight of the CIR train. The condition survey should include taking cores to measure HMA and crack depth. Cores should also be taken at variable distances from the centerline to establish cross section.
4. Laboratory Testing: From over 20 years of FDR construction, NDOT has determined that 2% cement is optimum for most conditions in Nevada. NDOT has worked with the University of Nevada, Reno to study mix design. The result of the testing indicated that lime improves moisture sensitivity of the mix considerably when using CMS-2S. Table 1 of Reference 2 shows a summary of the CIR mix design developed at UNR. Currently, NDOT does little laboratory mix design for CIR projects. Typically, field applications rates of CMS-2S are 1.0 - 1.5% by mass. NDOT is working on improvements in construction procedures and recycling agents.
6
How should an agency design the structural section and overlay thickness? Parameters used for structural (thickness) design are:
• Design period • Projected traffic, (volume or ESAL’s) • Reliability • Pavement layer properties • Acceptable structural layer coefficients for CIR and FDR layers. NDOT has
established structural coefficients of 0.28 for a CIR layer and 0.18 for an FDR layer. These values are based on field performance, backcalculations of FWD testing, and R-value testing.
• Two approaches can be used for the design and evaluation of the CIR and FDR with overlay structural sections. (Empirical or Mechanistic-Empirical) NDOT has developed a guide for determining structural sections for pavements using a 3 inches of CIR. Table 2 of Reference 2 is the CIR Structural Section Guide. For 20-year projected ESAL’s from about 100,000 to 2,000,000, CIR depths, plant-mix depths and wearing surfaces are listed.
How can an agency construct successful CIR and FDR projects?
• The most important factor in the design and construction is communication among knowledgeable individuals. NDOT revived its CIR program in 1997 and now requires a 2-hour workshop by all personnel involved with the project. A checklist has been established, and if there are questions, field people can contact NDOT to resolve them.
• Proper CIR train calibration is very important. The amount of lime and asphalt emulsion added must be accurate and consistent. Proper calibration can take up to two days.
• The FDR process is more established. The depth of HMA and base are required and shown on the plans for information only. After the material is pulverized, 2% cement is added with the optimum water content and a curing seal is placed. A 72 hour cure time is used.
• End-result specifications are used for CIR. A knowledgeable contractor’s representative must be on site at all times. End-result specifications help minimize the agency’s risk.
What is the short and long term performance of CIR and FDR? Nevada DOT has experienced some problems with reflective cracking. FDR has been used to overcome reflective cracking. The FDR process includes pulverizing 8 - 12 in. of existing pavement, adding and mixing 2% cement, and placing 3.5 - 5.5 in. of HMA and OG over the processed material. This procedure has been effective in retarding reflective cracking for 10 years; however, it reduces the structural section. The CIR process can be used when a pavement is structurally sound and contains non-load related cracking. Therefore, the overlay thickness over CIR can be reduced by as much as 2 in., which will result in significant savings.
7
Short Term Performance of CIR A total of 38 construction projects on 45 road segments were awarded from 1997 - 2005. Cores and pavement condition for most projects were good if
• there was adequate HMA depth for the CIR process; • adequate surface treatment or HMA overlay was used based on the projected
future traffic; • the correct PG asphalt was used for the HMA overlay; and • good construction techniques were used.
Seven projects experienced distress. These projects did not have adequate HMA depth for the CIR process, had soft subgrade areas, or did not receive adequate HMA overlay for the expected traffic. Based on the condition and ride surveys, NDOT expects 15 - 20 year lives. Because of the performance results, NDOT takes cores on all unknown structural sections to ensure that adequate HMA depth exists across the pavement section. In addition, CIR must be performed full width to eliminate transverse cracking from an adjacent pavement that was not recycled. Long Term Performance of CIR NDOT completed 118 centerline miles of CIR prior to 1997. Of the six projects recycled from 1985 - 1992, three of the projects (68 miles) received a chip seal surface and the remaining three CIR projects (50 miles) received 2.5 in. of HMA with an open-graded surface. Cores and surveys done in 2001 resulted in the following conclusions:
• The average life of CIR is 10 - 12 years without the use of lime slurry. The use of a lime slurry increased the life.
• CIR should receive a structural overlay when the traffic is greater than 300 AADT.
• Based on FWD results, a structural coefficient of 0.25 - 0.28 is used for CIR. • Adequate depth of HMA should be provided throughout the project. The
adequate depth is the specified recycle depth of RIC plus 1.5 in. • The life expectancy of CIR typically exceeds the life expectancy of the HMA
overlay on top of the CIR. With proactive pavement management with functional overlays, CIR will never have to be performed twice on the same section.
• CIR performs better in mild rather than harsh environmental conditions. Lime slurry will help improve performance even in harsh environments.
Short and Long Performance of FDR NDOT and the contractors have had good success with FDR projects. FDR has performed well for 10 years. Long term performance has been mixed. Several projects had transverse and longitudinal cracking. The transverse cracking was due to a relatively stiff base and the longitudinal cracking was due to poor compaction along joints.
8
Life cycle cost of CIR and FDR compared to other rehabilitation strategies. Life cycle analyses were performed using the following parameters:
• 20-year analysis period • Discount rate of 4 % • Treatment strategies—all anticipated future maintenance and rehab operations
required to maintain the roadway at an acceptable level of serviceability through the analysis period.
• Costs of all treatments including construction, maintenance, salvage value, and user costs. User costs in rural Nevada were not considered.
• The present worth method converts all costs to present value costs. Life Cycle Cost Analysis A 20-year life cycle cost analysis was conducted for one centerline mile of roadway with projected 2,000,000 ESAL’s over 20 years. The following scenarios were analyzed:
• 3 in. of CIR, 2.5 in. of HMA and OG with rehabilitation in year 12 ($306K) • 2 in. of HMA and OG with rehabilitation in years 9 and 16. ($418K) • 3 in. of mill, 3 in. of overlay with rehabilitation in year 12 ($415K) • FDR, 4 in. of HMA and OG with rehabilitation in year 15 ($382K) • Reconstruction consisting of removal of 1.5 ft of existing materials and
replacement with 12 in. of base, 5 in. of HMA and OG with rehabilitation in year 12 ($715K)
This life-cycle cost analysis shows that the use of CIR is the most cost effective strategy. The use of FDR and overlay is the second least expensive at $382K. Conclusions NDOT has some of the smoothest roads in the country. Currently, NDOT is rated fourth for overall cost effectiveness without spending more money than it did in 1992. The use of CIR and FDR has made this possible. “ NDOT has saved over $600M by using CIR and FDR over the traditional reconstruction rehabilitation strategy. Effective communication and selecting the right strategy and using it at the right time are the keys to successful recycling projects.” 1.1.3 Ontario Experience (Reference 4) The Ministry of Transportation Ontario has been using CIR to rehabilitate roads for over 10 years. In 2003, the technology for the use of expanded (foamed) asphalt rather than emulsified asphalt became available. The Ministry constructed a trial section of both CIR and CIREAM (Cold-in-place recycled expanded asphalt mix) on 5 km of Highway 7, east of Perth, Ontario in July, 2003. Evaluation of the sections included FWD testing and pavement roughness and rutting.
9
A standard CIR procedure processes up to 5 in. of an existing HMA pavement, sizes it mixes in additional asphalt cement, and lays it back down without off-site hauling and processing. The added material is usually an asphalt emulsion. The mix is then profiled and compacted to form a binder course layer. After 14-30 days, a new HMA surface is placed after the emulsion has set and moisture and compaction requirements are met. In the past three years, the use of expanded (foamed) asphalt has been available. The combination of CIR and foamed asphalt results in 100% recycled material (CIREAM). The major advantage of CIREAM is that a new HMA surface can be applied following a two-day curing period if compaction requirements have been met. The CIREAM process is less dependent on warm, dry weather for placement, which can lead to an extended construction season. A project was constructed on Highway 7, 15.4 km long. A 5-km trial section of CIREAM was constructed along with 7 km of conventional CIR. Highway 7 is a rural arterial undivided roadway. The posted speed is 80 km/h and AADT of 9000 with 8% commercial vehicles. Highway 7 was originally constructed in 1957, then widened and resurfaced in 1967. In 1985, 1.3 in. of the surface course was milled off prior to resurfacing with 3.2 in. of HMA, resulting in an average HMA thickness of 5.5 in. In 2003, the existing pavement had severe, cupped full depth transverse cracks at 10-15 ft intervals, localized severe rutting in both wheel paths, longitudinal cracking in the wheel paths, some centerline cracking, and alligator cracking at the intersection of transverse and longitudinal cracks. The average PCR was 55 out of 100 and the average RCR (Ride Comfort Rating) of 6.2 out of 10. For the easterly portion of the project, the pavement was in better condition with the transverse cracking at 30-60 ft intervals. The field investigation showed the easterly portion to have 10 in. of HMA over 6.5 in. granular base and 18 in. granular subbase. The westerly portion had 12.5 in. of HMA. The existence of many field entrances precluded the use of excessive grade raises. The extensive, severe full depth transverse cracks needed to be addressed, as the cracks would reflect through any overlay. Five rehabilitation alternatives were considered, ranging from complete reconstruction to various thicknesses of mill and overlay. A life cycle cost analysis over 30 years showed CIR to be most cost effective. CIR was also the best option in terms of salvaging existing materials, minimizing the use of new materials, mitigating reflective cracking, and considering shortening the construction time compared to other options. CIR to a depth of 4.5 in. with a 2 in. HMA overlay was the selected strategy. The successful contractor bid the contract as conventional CIR, but a change order was presented to substitute 5 km of CIR with CIREAM. The benefits of CIREAM were:
• Liquid asphalt cement (PGAC 58-28) was used rather than emulsion • CIREAM allows a HMA surface course to be placed in about 2 days rather than
14 days.
10
• CIREAM is not affected by rain • QC procedures for CIREAM provide the contractor with better quality control • After compaction, the CIREAM can immediately be opened to traffic without
restriction • CIREAM will reduce overall construction time • The work would be done at no extra cost.
A four-year warranty was applied to both methods of recycling. The warranty required that the MTO complete a distress survey for the entire length of the project between May and July 31, 2007. CIREAM Mix Design The gradation of the reclaimed material (after extraction) met the requirements of the foamed asphalt specification. The average existing asphalt cement content was 5.3%. A PG 58-28 asphalt cement was used with a water content of 2.75%. Asphalt contents of 0.5-2.5% in 0.5% increments were tested. A foamed AC content of 1.0% and moisture content of 4% resulted. The properties of this mixture are presented in Table 2 of Reference 4. CIR Mix Design The average asphalt content of the reclaimed mix was 5.1% and recovered penetration was 38. The original mix design called for 1.5% emulsion and a moisture content of 3.0%. The mix appeared too rich in the field; therefore, a mix design requiring 1.2% emulsion and a moisture content of 3.5% was revised. An HF 150MP emulsion was used. Placement Both CIR and CIREAM were placed with a CIR train consisting of a milling machine and mobile screenings/crushing deck. The conventional CIR train then fed the processed RAP into a Midland mix paver, which added the emulsion and placed the material. The CIREAM train fed the processed RAP into an on-board pug mill, where the expanded asphalt was added and mixed. The material was then conveyed into a heavy duty paver with dual tamping bars. Eight km of CIR was placed over a nine-day period. The production was slowed because of the change in mix design. Five km of CIREAM was placed in three days. Tensile Strength Testing of CIREAM The minimum tensile strength requirements for the CIREAM were 350 kPa dry tensile strength and 175 kPa wet tensile strength, with a ratio of 50%. There were some discrepancies in the QC results; however, the specifications were essentially met. Compaction of CIR and CIREAM Compaction was accomplished using a pneumatic tire breakdown and a steel wheeled finishing roller. A target density was determined using a standard laboratory density according to LS-300 (7), with material reclaimed from the roadway. The specification required that the material be compacted to a minimum of 96%, with no result falling below 95% of maximum density. Prior to the HMA overlay, the contractor randomly obtained one slab sample from each sub-lot to test for compaction. The slab samples were dry cut 150 x 150 mm and removed intact from the
11
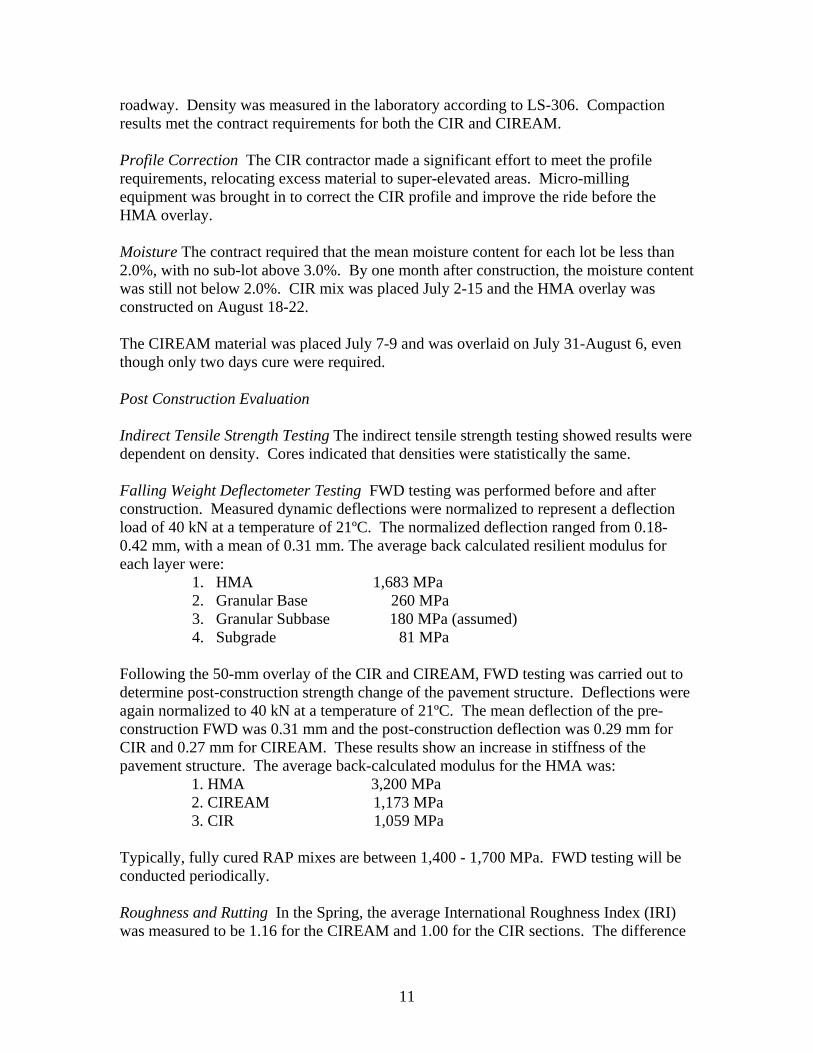
roadway. Density was measured in the laboratory according to LS-306. Compaction results met the contract requirements for both the CIR and CIREAM. Profile Correction The CIR contractor made a significant effort to meet the profile requirements, relocating excess material to super-elevated areas. Micro-milling equipment was brought in to correct the CIR profile and improve the ride before the HMA overlay. Moisture The contract required that the mean moisture content for each lot be less than 2.0%, with no sub-lot above 3.0%. By one month after construction, the moisture content was still not below 2.0%. CIR mix was placed July 2-15 and the HMA overlay was constructed on August 18-22. The CIREAM material was placed July 7-9 and was overlaid on July 31-August 6, even though only two days cure were required. Post Construction Evaluation Indirect Tensile Strength Testing The indirect tensile strength testing showed results were dependent on density. Cores indicated that densities were statistically the same. Falling Weight Deflectometer Testing FWD testing was performed before and after construction. Measured dynamic deflections were normalized to represent a deflection load of 40 kN at a temperature of 21ºC. The normalized deflection ranged from 0.18-0.42 mm, with a mean of 0.31 mm. The average back calculated resilient modulus for each layer were:
1. HMA 1,683 MPa 2. Granular Base 260 MPa 3. Granular Subbase 180 MPa (assumed) 4. Subgrade 81 MPa
Following the 50-mm overlay of the CIR and CIREAM, FWD testing was carried out to determine post-construction strength change of the pavement structure. Deflections were again normalized to 40 kN at a temperature of 21ºC. The mean deflection of the pre-construction FWD was 0.31 mm and the post-construction deflection was 0.29 mm for CIR and 0.27 mm for CIREAM. These results show an increase in stiffness of the pavement structure. The average back-calculated modulus for the HMA was: 1. HMA 3,200 MPa 2. CIREAM 1,173 MPa 3. CIR 1,059 MPa Typically, fully cured RAP mixes are between 1,400 - 1,700 MPa. FWD testing will be conducted periodically. Roughness and Rutting In the Spring, the average International Roughness Index (IRI) was measured to be 1.16 for the CIREAM and 1.00 for the CIR sections. The difference
12
was significant statistically. Both IRIs indicate a very good ride. The average rut depths were 2.6 mm for the CIREAM and 2.9 mm for the CIR, which are both very slight. No distinguishable rutting, distortion or cracking were observed. The ride comfort rating was 9.0 and the overall pavement condition was very good (PCI = 93). It is recommended that FWD, roughness, and rut depth be measured annually to track performance of the CIR and CIREAM sections. Conclusions CIR has been found to mitigate reflective cracking, thereby extending pavement life. By reusing 100% of the existing aggregates and asphalt cement, CIR is both environmentally sustainable and cost-effective. MTO has carried out over 30 CIR contracts since the late 1980’s. CIREAM has now been shown to be a possible alternative. A shorter cure period helps make CIREAM a feasible alternative. CIR and CIREAM result in similar pavements and performance. Based on short-term results, CIREAM appears to provide an acceptable in-place recycling/rehabilitation strategy that conserves resources and provides an economic alternative to conventional CIR, reducing the curing time, and extending the construction season. 1.1.4 Pennsylvania Experience
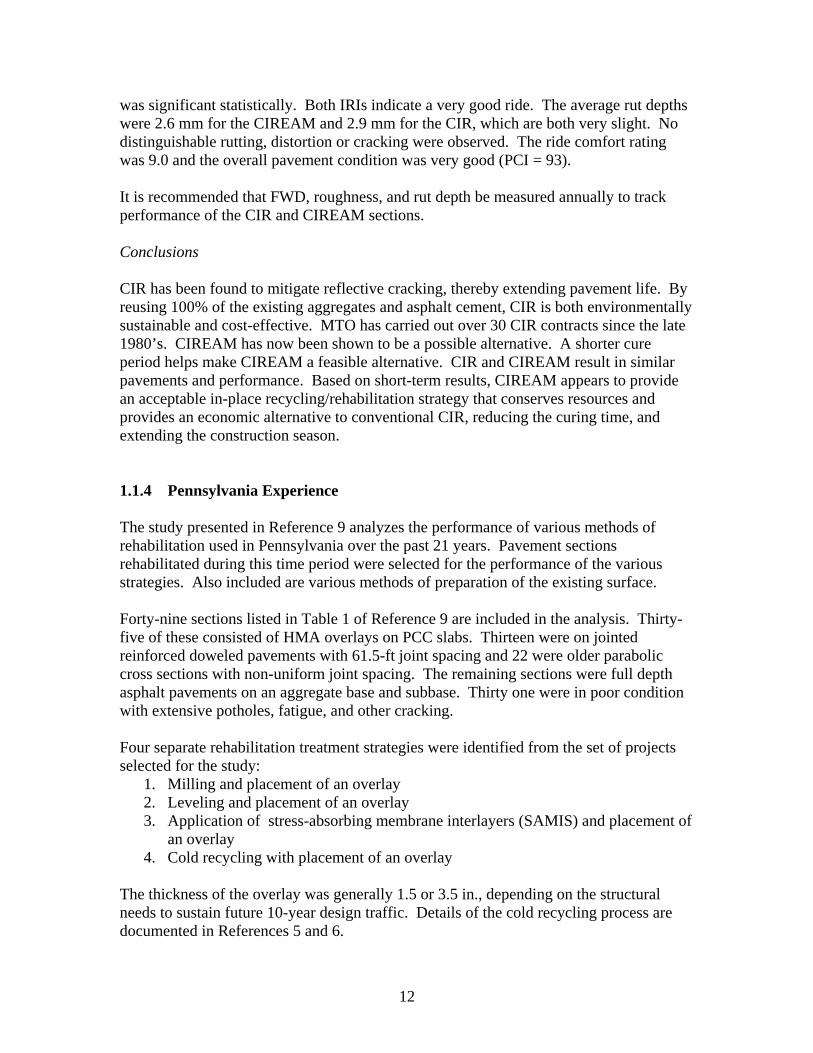
The study presented in Reference 9 analyzes the performance of various methods of rehabilitation used in Pennsylvania over the past 21 years. Pavement sections rehabilitated during this time period were selected for the performance of the various strategies. Also included are various methods of preparation of the existing surface. Forty-nine sections listed in Table 1 of Reference 9 are included in the analysis. Thirty-five of these consisted of HMA overlays on PCC slabs. Thirteen were on jointed reinforced doweled pavements with 61.5-ft joint spacing and 22 were older parabolic cross sections with non-uniform joint spacing. The remaining sections were full depth asphalt pavements on an aggregate base and subbase. Thirty one were in poor condition with extensive potholes, fatigue, and other cracking. Four separate rehabilitation treatment strategies were identified from the set of projects selected for the study:
1. Milling and placement of an overlay 2. Leveling and placement of an overlay 3. Application of stress-absorbing membrane interlayers (SAMIS) and placement of
an overlay 4. Cold recycling with placement of an overlay
The thickness of the overlay was generally 1.5 or 3.5 in., depending on the structural needs to sustain future 10-year design traffic. Details of the cold recycling process are documented in References 5 and 6.
13
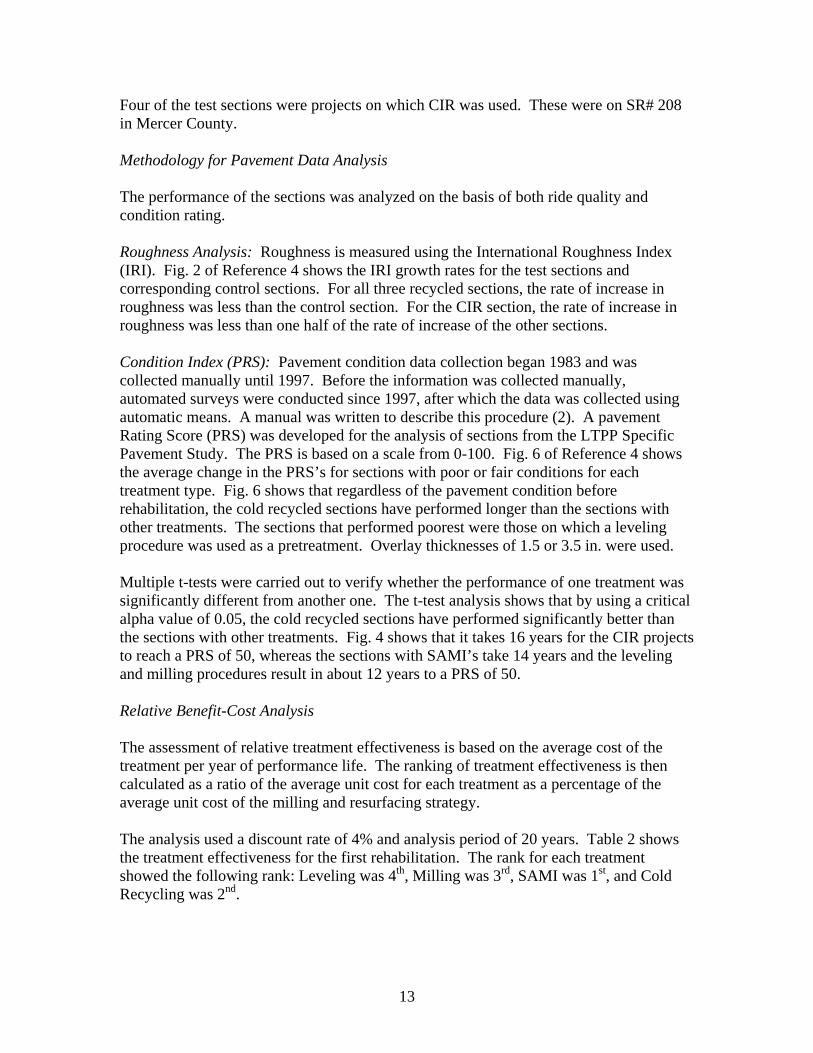
Four of the test sections were projects on which CIR was used. These were on SR# 208 in Mercer County. Methodology for Pavement Data Analysis The performance of the sections was analyzed on the basis of both ride quality and condition rating. Roughness Analysis: Roughness is measured using the International Roughness Index (IRI). Fig. 2 of Reference 4 shows the IRI growth rates for the test sections and corresponding control sections. For all three recycled sections, the rate of increase in roughness was less than the control section. For the CIR section, the rate of increase in roughness was less than one half of the rate of increase of the other sections. Condition Index (PRS): Pavement condition data collection began 1983 and was collected manually until 1997. Before the information was collected manually, automated surveys were conducted since 1997, after which the data was collected using automatic means. A manual was written to describe this procedure (2). A pavement Rating Score (PRS) was developed for the analysis of sections from the LTPP Specific Pavement Study. The PRS is based on a scale from 0-100. Fig. 6 of Reference 4 shows the average change in the PRS’s for sections with poor or fair conditions for each treatment type. Fig. 6 shows that regardless of the pavement condition before rehabilitation, the cold recycled sections have performed longer than the sections with other treatments. The sections that performed poorest were those on which a leveling procedure was used as a pretreatment. Overlay thicknesses of 1.5 or 3.5 in. were used. Multiple t-tests were carried out to verify whether the performance of one treatment was significantly different from another one. The t-test analysis shows that by using a critical alpha value of 0.05, the cold recycled sections have performed significantly better than the sections with other treatments. Fig. 4 shows that it takes 16 years for the CIR projects to reach a PRS of 50, whereas the sections with SAMI’s take 14 years and the leveling and milling procedures result in about 12 years to a PRS of 50. Relative Benefit-Cost Analysis The assessment of relative treatment effectiveness is based on the average cost of the treatment per year of performance life. The ranking of treatment effectiveness is then calculated as a ratio of the average unit cost for each treatment as a percentage of the average unit cost of the milling and resurfacing strategy. The analysis used a discount rate of 4% and analysis period of 20 years. Table 2 shows the treatment effectiveness for the first rehabilitation. The rank for each treatment showed the following rank: Leveling was 4th, Milling was 3rd, SAMI was 1st, and Cold Recycling was 2nd.
14
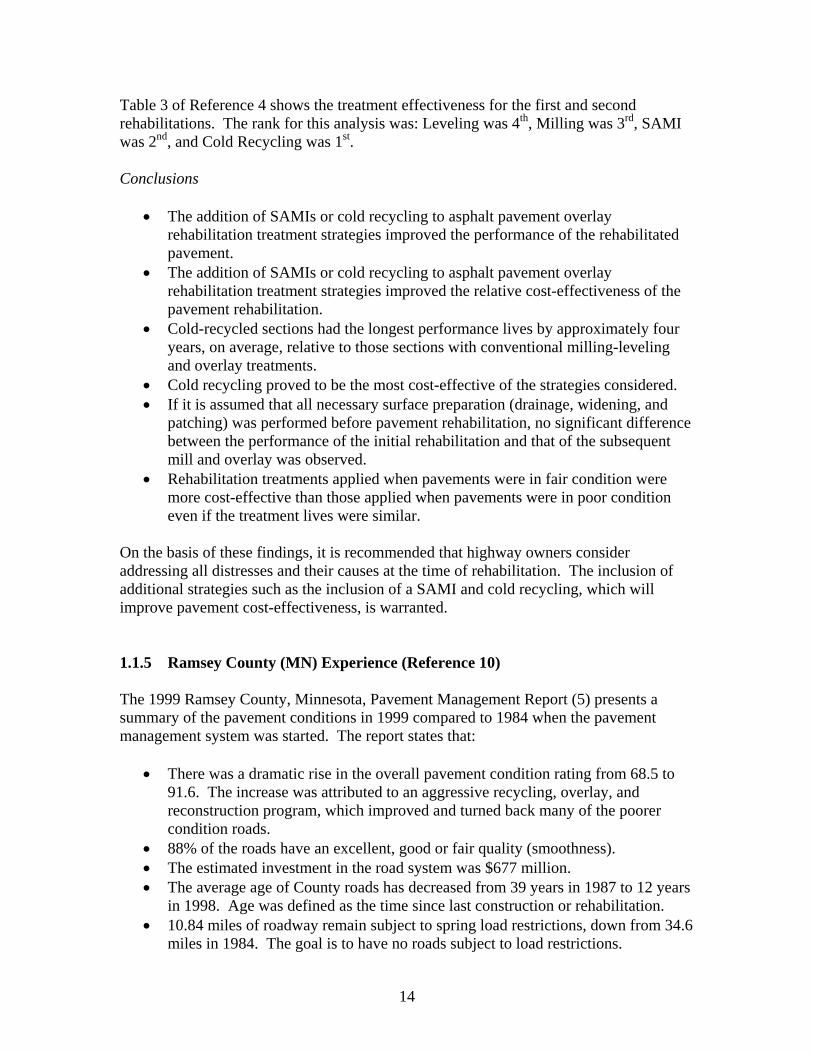
Table 3 of Reference 4 shows the treatment effectiveness for the first and second rehabilitations. The rank for this analysis was: Leveling was 4th, Milling was 3rd, SAMI was 2nd, and Cold Recycling was 1st. Conclusions
• The addition of SAMIs or cold recycling to asphalt pavement overlay rehabilitation treatment strategies improved the performance of the rehabilitated pavement.
• The addition of SAMIs or cold recycling to asphalt pavement overlay rehabilitation treatment strategies improved the relative cost-effectiveness of the pavement rehabilitation.
• Cold-recycled sections had the longest performance lives by approximately four years, on average, relative to those sections with conventional milling-leveling and overlay treatments.
• Cold recycling proved to be the most cost-effective of the strategies considered. • If it is assumed that all necessary surface preparation (drainage, widening, and
patching) was performed before pavement rehabilitation, no significant difference between the performance of the initial rehabilitation and that of the subsequent mill and overlay was observed.
• Rehabilitation treatments applied when pavements were in fair condition were more cost-effective than those applied when pavements were in poor condition even if the treatment lives were similar.
On the basis of these findings, it is recommended that highway owners consider addressing all distresses and their causes at the time of rehabilitation. The inclusion of additional strategies such as the inclusion of a SAMI and cold recycling, which will improve pavement cost-effectiveness, is warranted. 1.1.5 Ramsey County (MN) Experience (Reference 10) The 1999 Ramsey County, Minnesota, Pavement Management Report (5) presents a summary of the pavement conditions in 1999 compared to 1984 when the pavement management system was started. The report states that:
• There was a dramatic rise in the overall pavement condition rating from 68.5 to
91.6. The increase was attributed to an aggressive recycling, overlay, and reconstruction program, which improved and turned back many of the poorer condition roads.
• 88% of the roads have an excellent, good or fair quality (smoothness). • The estimated investment in the road system was $677 million. • The average age of County roads has decreased from 39 years in 1987 to 12 years
in 1998. Age was defined as the time since last construction or rehabilitation. • 10.84 miles of roadway remain subject to spring load restrictions, down from 34.6
miles in 1984. The goal is to have no roads subject to load restrictions.
15
• $19.8 million was needed annually to maintain the County road system. • Total mileage of unimproved and gravel shoulders decreased from 108.6 miles in
1987 to 18.1 miles in 1998. Ramsey County has 291.7 miles of roadway (including 802 lane miles). The age of the roads has decreased from 39 years in 1987, 31 years in 1992 and 12 years in 1998. Since 1992, 53 miles have been reconstructed, 19 miles overlaid, and 20 miles recycled. An adjustment was made in condition rating for different levels of AADT; a road segment with a higher traffic volume will have a lower PCI adjusted score. The stiffness of roadway pavements determines the vehicle axle loadings that it can carry over a long period of time without damage. Spring load restrictions were imposed on 94.45 miles in 1987, 43.62 miles in 1993, and 10.84 miles in 1998. One important way to compare maintenance treatments is to compare the number of transverse cracks developed from 1986-1997. The increase in cracks is plotted on a chart at the bottom of page 12 of Reference 5. The following is a brief summary: Maintenance Procedure Length, Number of Transverse miles Cracks per 1000 feet after 12 years New Pavement 52 19 Cold in-place Recycling 57 48 Mill and Overlay 59 82 The Ramsey County 1999 Pavement Management Report (10) shows how consistent pavement data can be used to establish the most appropriate construction, rehabilitation, and maintenance program. Over a period of time, actual performance results can be observed and used. 1.1.6 Minnesota DOT, County and City Experience
Recycling has been used in Minnesota in various forms over the past 30 years. Recycled Asphalt Pavements (RAP) has been allowed in HMA since about 1976. Up to 30% RAP is now allowed in Mn/DOT 2360 Superpave mixes depending on the layer and traffic (7). Mn/DOT has special provisions for CIR and FDR (Mn/DOT 2331 S-131 and S-132). CIR and FDR have been used in Ramsey and other Minnesota agencies for about 20 years. The FDR procedure has evolved from a single machine to a train type operation; this has resulted in more uniform materials. CIR and FDR projects must be checked for structural adequacy for the predicted traffic. Generally, CIR can be used if the existing structure is adequate and FDR should be used
16
if additional structure support is needed. Structural adequacy can be evaluated by first reviewing the condition survey. Wheel path alligator cracking or rutting are indications of inadequate structure. The existing structure can be determined using:
• Construction and/or pavement management records • Coring and Sampling • Falling Weight Deflection (FWD) testing
The required thickness is then determined using either the Minnesota Soil Factor or R-Value design procedures. The Soil Factor Design is in the Mn/DOT State Aid Manual and the R-Value procedure is in the Mn/DOT Geotechnical Manual. These procedures are presented and summarized in Appendix A. FWD testing is used to measure the in-place stiffness of the embankment soil and Granular Equivalent (GE) thickness of the existing pavement. This project has been setup to collect the parameters needed to measure the conditions and track the performance of pavement sections constructed and maintained by the various procedures and results to specify, design, and construct CIR and FDR projects. The performances of the CIR and FDR projects were compared to the more conventional procedures such as Mill and Overlay (M&O).
1.2 Database Many rehabilitation projects have been constructed in Minnesota over the past 20 years. The condition and performance of the projects have been quite variable. To organize and define the performance of these sections in Minnesota, the data were collected and entered into a spreadsheet. Three methods were used in the collection of the project data. Interviews both by telephone and on-site provided a helpful and visual assessment of rehabilitation information. A survey requesting specific project information was sent to all the Mn/DOT districts, the Minnesota counties, and cities. Throughout this process the database was altered and modified to better describe the important parameters for the specific projects. From August – December, 2005, the staff located some existing CIR and FDR projects. Six Counties (Carlton, Lake, Olmsted, Pope, Ramsey and St. Louis) and five Mn/DOT districts (1, 2, 3, 6 and 8) were visited. Information on more than 120 existing projects were obtained and entered into the database. At the TAP meeting on January 27, 2006, a request for more projects completed on low-volume roads was made along with more local, county and city rehabilitation projects. Following the meeting a project newsletter, questionnaire, and information survey was developed for electronic distribution to all Minnesota cities and counties. A similar survey was sent to each of the Mn/DOT districts to double check the existing project
17
information as well as to add any other additional information. Responses were collected through the beginning of April, 2006. Information on nearly 124 projects was collected. The projects contributed by Ramsey County were not included in the following charts due to the nature of their Pavement Management System. Their system was used to help guide the parameters used in this selection process. The database constructed is a collection of data from road rehabilitation projects throughout Minnesota. The project age ranges from 2 - 20+ years. Information on the original pavement construction, pre-rehabilitation conditions, design specifications, and post-rehabilitation conditions was gathered together. From this information, relevant parameters were looked at in more detail in order to produce a workable decision process for rehabilitation selection. It is important to note that not only projects that were successful, but also projects that were unsuccessful are helpful in setting up the selection process.
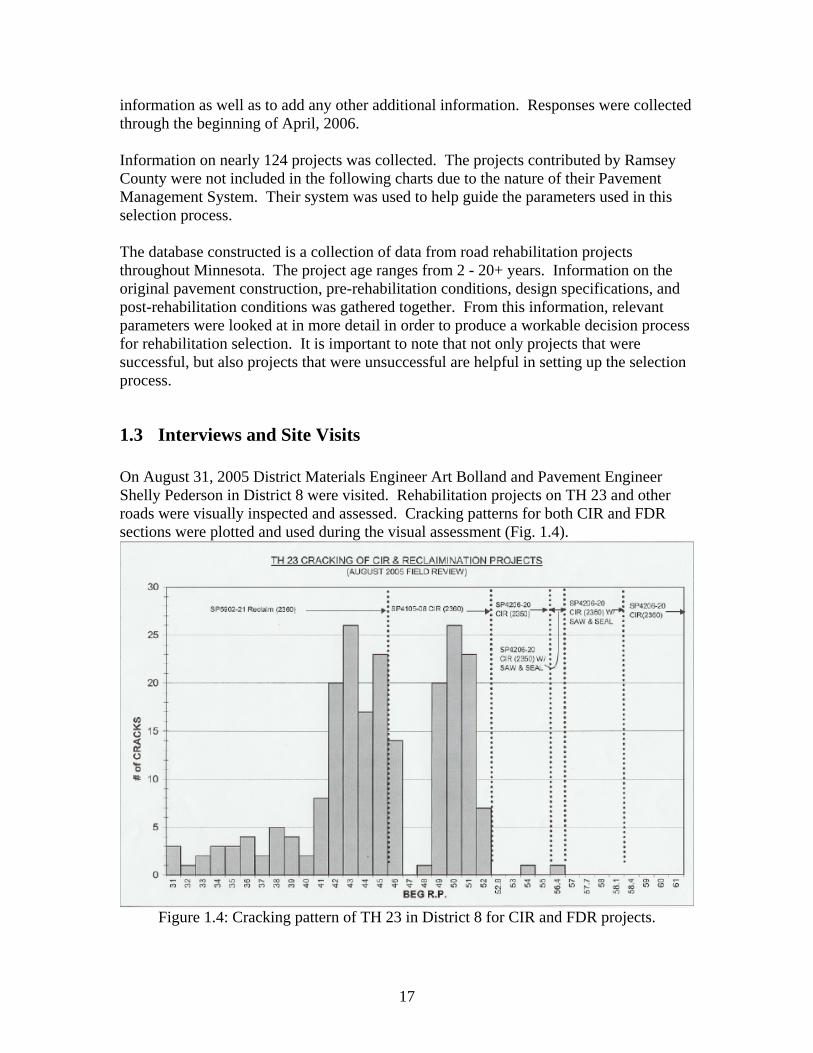
1.3 Interviews and Site Visits On August 31, 2005 District Materials Engineer Art Bolland and Pavement Engineer Shelly Pederson in District 8 were visited. Rehabilitation projects on TH 23 and other roads were visually inspected and assessed. Cracking patterns for both CIR and FDR sections were plotted and used during the visual assessment (Fig. 1.4).
Figure 1.4: Cracking pattern of TH 23 in District 8 for CIR and FDR projects.
18
On September 8, 2005, the County Engineer, Brian Noetzelman, demonstrated pavement performance in Pope County with the use of PG 52-34 asphalts. FDR and straight overlays were considered. The pavements exhibited little transverse cracking and had smooth rides. Some rutting was present near intersections. On September 21, 2005, rehabilitation projects in Olmsted County were considered. County Engineer Michael Sheehan and Construction and Traffic Supervisor Curt Bolles explained different projects done over the last 13 years. On October 12, 2005, District 1 was visited, where Sarah Sonndag had gathered data, reports and other relevant information on CIR and FDR projects. Also on October 12, 2005, St. Louis County was visited and rehabilitation projects were discussed with Carlton’s Assistant County Engineer Milt Hagen, Lake County’s Senior Highway Technician Chauncey Bangs, St. Louis County’s Assistant County Highway Engineer James Foldesi. Also from St. Louis County were Carie Reitsch, Earl Wilkins, Brian Boder, Ross Benedict, Chris Morris, and Jeff Goetzman. On November 16, 2005, Ramsey County’s Highway Maintenance Engineer Dan Schacht and Kathy Jaschke supplied information on over 60 CIR projects over the last 25 years along with their 1999 Pavement Management Report. On December 12, 2005, District Engineer Craig Gilbertson supplied information on CIR, FDR, and M&O projects in District 2.
1.4 Preliminary Data Analysis Several selected projects were analyzed for preliminary evaluation of conditions and performance. Due to the types of projects and the variety of soil and site conditions, District 1 was selected to represent the following FWD and PQI results. The Pavement Quality Index (PQI) is a way to characterize both ride (Ride Quality Index or RQI) and cracking and rutting (Surface Rating or SR). Their relationship is defined as follows:
PSRSRPQI *= (1)
Table 1.1: Pavement Rating Scale according to Mn/DOT Procedures. Index Name Pavement Attribute Measured by Index Rating Scale
Ride Quality Index (RQI) Pavement Roughness 0.0 - 5.0 Surface Rating (SR) Pavement Distress 0.0 - 4.0
Pavement Quality Index (PQI) Overall Pavement Quality 0.0 - 4.5 Table 1.1 shows that a 4.5 is the best PQI rating a road can achieve.
19
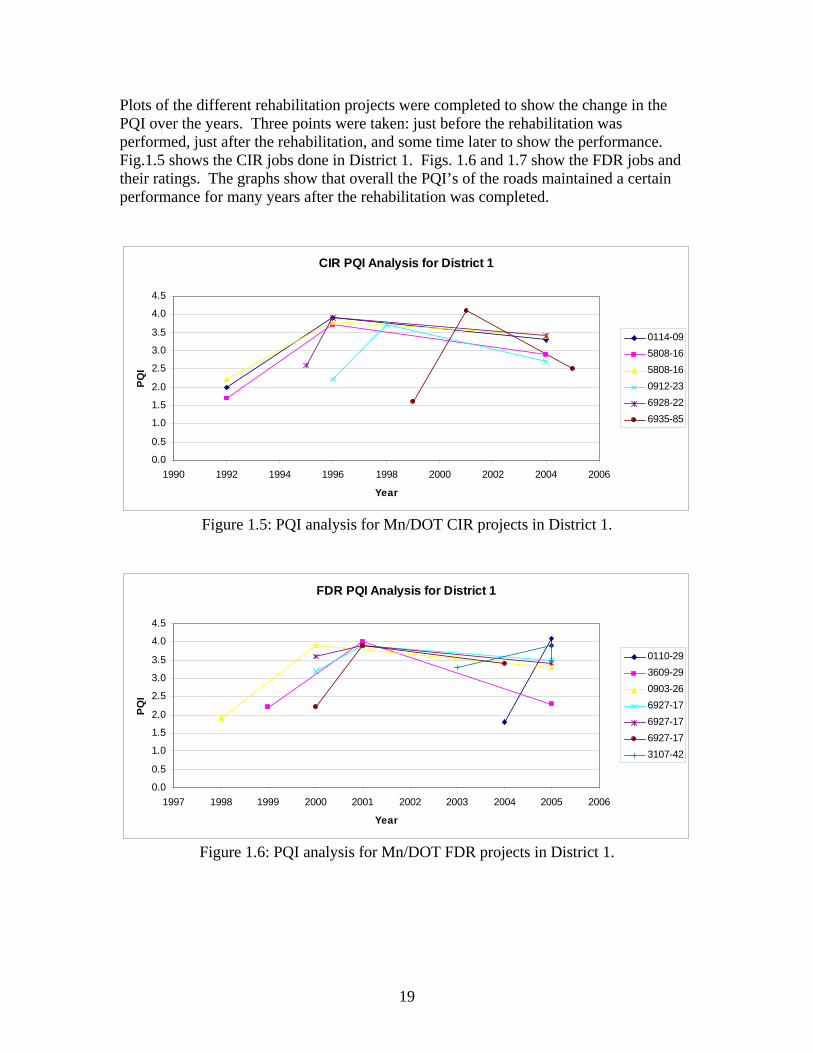
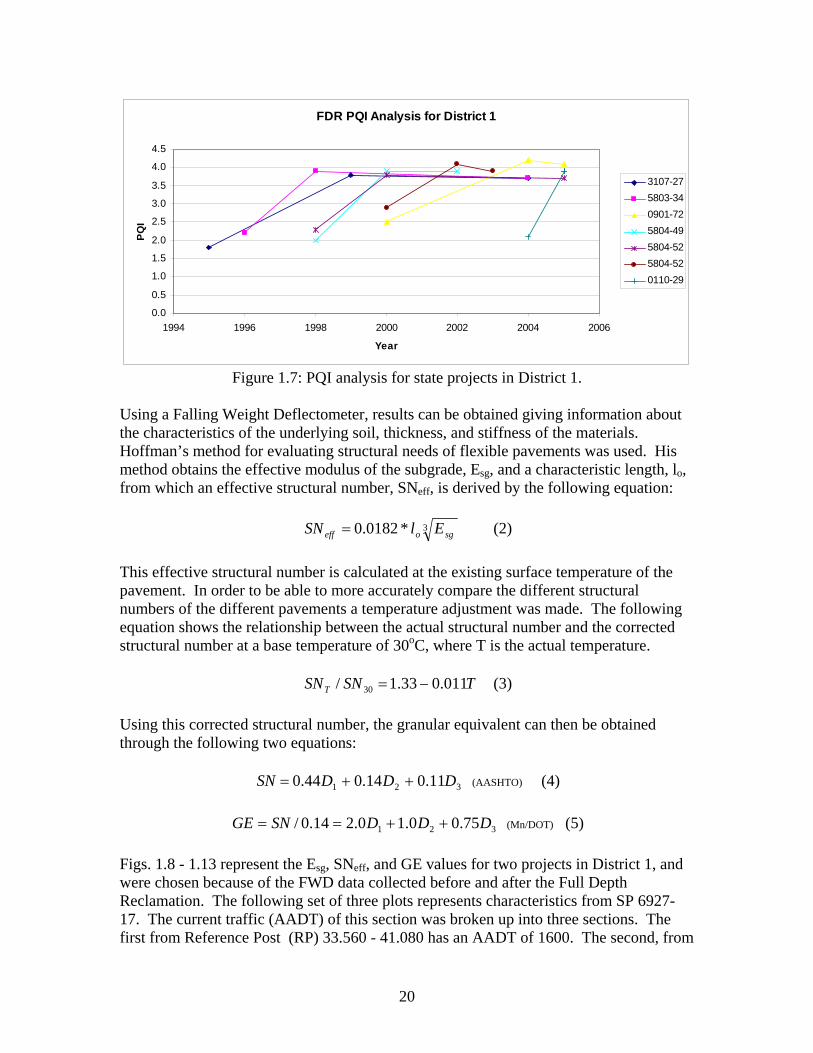
Plots of the different rehabilitation projects were completed to show the change in the PQI over the years. Three points were taken: just before the rehabilitation was performed, just after the rehabilitation, and some time later to show the performance. Fig.1.5 shows the CIR jobs done in District 1. Figs. 1.6 and 1.7 show the FDR jobs and their ratings. The graphs show that overall the PQI’s of the roads maintained a certain performance for many years after the rehabilitation was completed.
CIR PQI Analysis for District 1
0.0
0.5
1.0
1.5
2.0
2.5
3.0
3.5
4.0
4.5
1990 1992 1994 1996 1998 2000 2002 2004 2006
Year
PQI
0114-095808-165808-160912-236928-226935-85
Figure 1.5: PQI analysis for Mn/DOT CIR projects in District 1.
FDR PQI Analysis for District 1
0.0
0.5
1.0
1.5
2.0
2.5
3.0
3.5
4.0
4.5
1997 1998 1999 2000 2001 2002 2003 2004 2005 2006
Year
PQI
0110-293609-290903-266927-176927-176927-173107-42
Figure 1.6: PQI analysis for Mn/DOT FDR projects in District 1.
20
FDR PQI Analysis for District 1
0.0
0.5
1.0
1.5
2.0
2.5
3.0
3.5
4.0
4.5
1994 1996 1998 2000 2002 2004 2006
Year
PQI
3107-275803-340901-725804-495804-525804-520110-29
Figure 1.7: PQI analysis for state projects in District 1.
Using a Falling Weight Deflectometer, results can be obtained giving information about the characteristics of the underlying soil, thickness, and stiffness of the materials. Hoffman’s method for evaluating structural needs of flexible pavements was used. His method obtains the effective modulus of the subgrade, Esg, and a characteristic length, lo, from which an effective structural number, SNeff, is derived by the following equation:
3*0182.0 sgoeff ElSN = (2)
This effective structural number is calculated at the existing surface temperature of the pavement. In order to be able to more accurately compare the different structural numbers of the different pavements a temperature adjustment was made. The following equation shows the relationship between the actual structural number and the corrected structural number at a base temperature of 30oC, where T is the actual temperature.
TSNSNT 011.033.1/ 30 −= (3) Using this corrected structural number, the granular equivalent can then be obtained through the following two equations:
321 11.014.044.0 DDDSN ++= (AASHTO) (4)
321 75.00.10.214.0/ DDDSNGE ++== (Mn/DOT) (5)
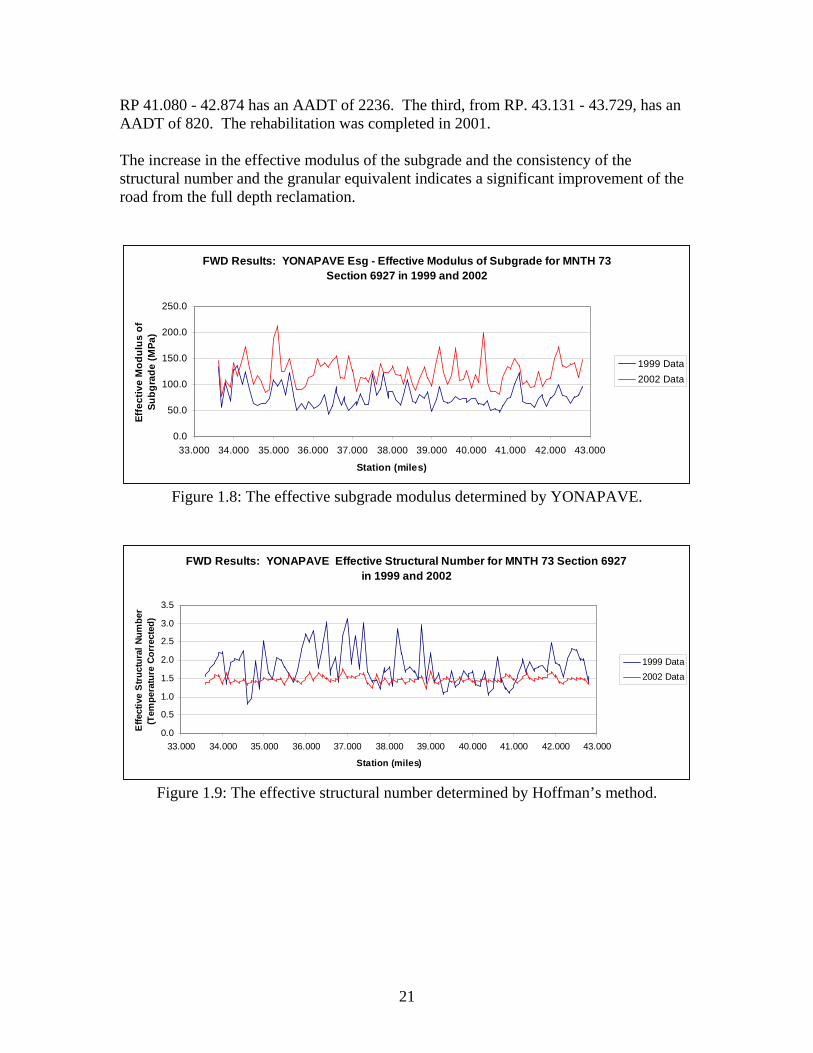
Figs. 1.8 - 1.13 represent the Esg, SNeff, and GE values for two projects in District 1, and were chosen because of the FWD data collected before and after the Full Depth Reclamation. The following set of three plots represents characteristics from SP 6927-17. The current traffic (AADT) of this section was broken up into three sections. The first from Reference Post (RP) 33.560 - 41.080 has an AADT of 1600. The second, from
21
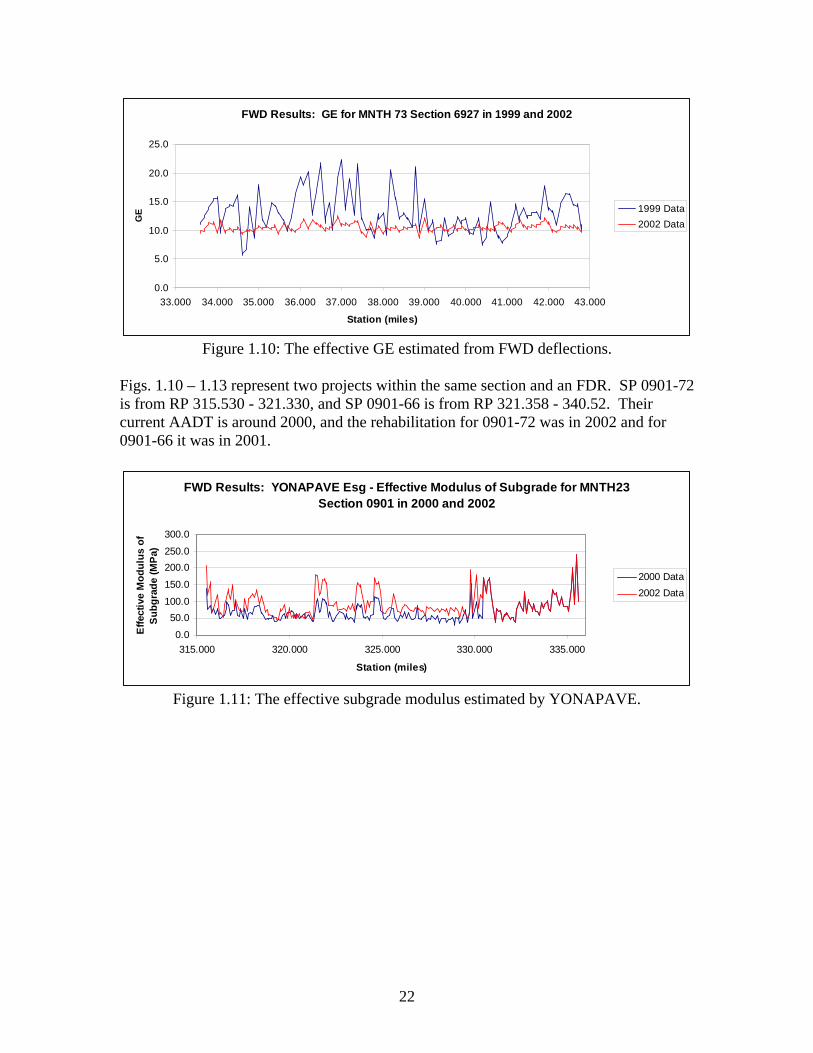
RP 41.080 - 42.874 has an AADT of 2236. The third, from RP. 43.131 - 43.729, has an AADT of 820. The rehabilitation was completed in 2001. The increase in the effective modulus of the subgrade and the consistency of the structural number and the granular equivalent indicates a significant improvement of the road from the full depth reclamation.
FWD Results: YONAPAVE Esg - Effective Modulus of Subgrade for MNTH 73 Section 6927 in 1999 and 2002
0.0
50.0
100.0
150.0
200.0
250.0
33.000 34.000 35.000 36.000 37.000 38.000 39.000 40.000 41.000 42.000 43.000
Station (miles)
Effe
ctiv
e M
odul
us o
f Su
bgra
de (M
Pa)
1999 Data2002 Data
Figure 1.8: The effective subgrade modulus determined by YONAPAVE.
FWD Results: YONAPAVE Effective Structural Number for MNTH 73 Section 6927 in 1999 and 2002
0.0
0.5
1.0
1.5
2.0
2.5
3.0
3.5
33.000 34.000 35.000 36.000 37.000 38.000 39.000 40.000 41.000 42.000 43.000
Station (miles)
Effe
ctiv
e S
truct
ural
Num
ber
(Tem
pera
ture
Cor
rect
ed)
1999 Data2002 Data
Figure 1.9: The effective structural number determined by Hoffman’s method.
22
FWD Results: GE for MNTH 73 Section 6927 in 1999 and 2002
0.0
5.0
10.0
15.0
20.0
25.0
33.000 34.000 35.000 36.000 37.000 38.000 39.000 40.000 41.000 42.000 43.000
Station (miles)
GE 1999 Data
2002 Data
Figure 1.10: The effective GE estimated from FWD deflections.
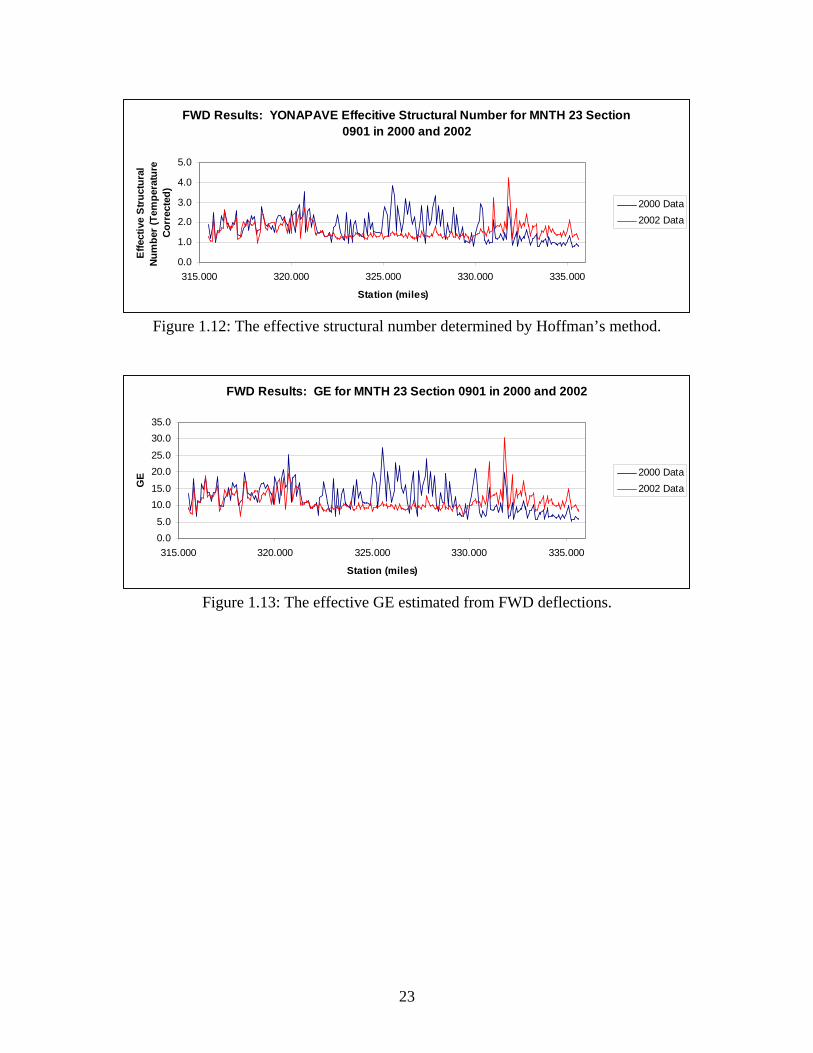
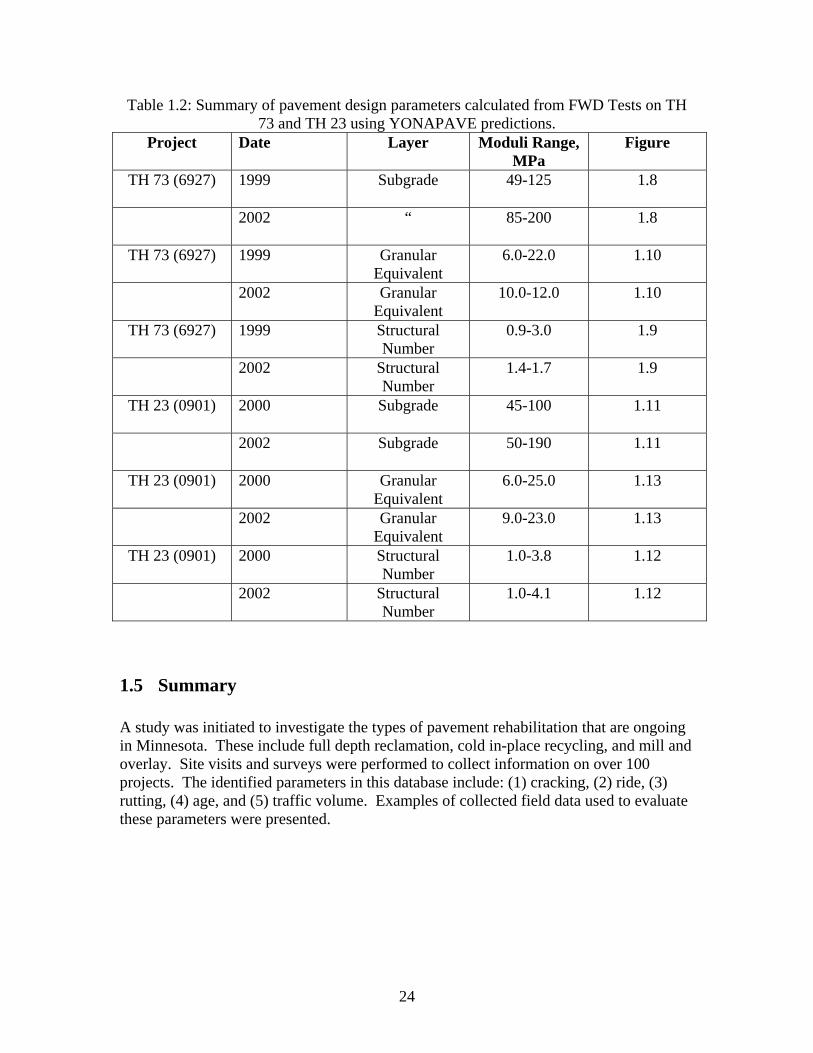
Figs. 1.10 – 1.13 represent two projects within the same section and an FDR. SP 0901-72 is from RP 315.530 - 321.330, and SP 0901-66 is from RP 321.358 - 340.52. Their current AADT is around 2000, and the rehabilitation for 0901-72 was in 2002 and for 0901-66 it was in 2001.
FWD Results: YONAPAVE Esg - Effective Modulus of Subgrade for MNTH23 Section 0901 in 2000 and 2002
0.0
50.0100.0
150.0
200.0250.0
300.0
315.000 320.000 325.000 330.000 335.000
Station (miles)
Effe
ctiv
e M
odul
us o
f S
ubgr
ade
(MPa
)
2000 Data2002 Data
Figure 1.11: The effective subgrade modulus estimated by YONAPAVE.
23
FWD Results: YONAPAVE Effecitive Structural Number for MNTH 23 Section 0901 in 2000 and 2002
0.0
1.0
2.0
3.0
4.0
5.0
315.000 320.000 325.000 330.000 335.000
Station (miles)
Effe
ctiv
e S
truct
ural
N
umbe
r (Te
mpe
ratu
re
Corr
ecte
d)
2000 Data2002 Data
Figure 1.12: The effective structural number determined by Hoffman’s method.
FWD Results: GE for MNTH 23 Section 0901 in 2000 and 2002
0.05.0
10.015.0
20.025.0
30.035.0
315.000 320.000 325.000 330.000 335.000
Station (miles)
GE 2000 Data
2002 Data
Figure 1.13: The effective GE estimated from FWD deflections.
24
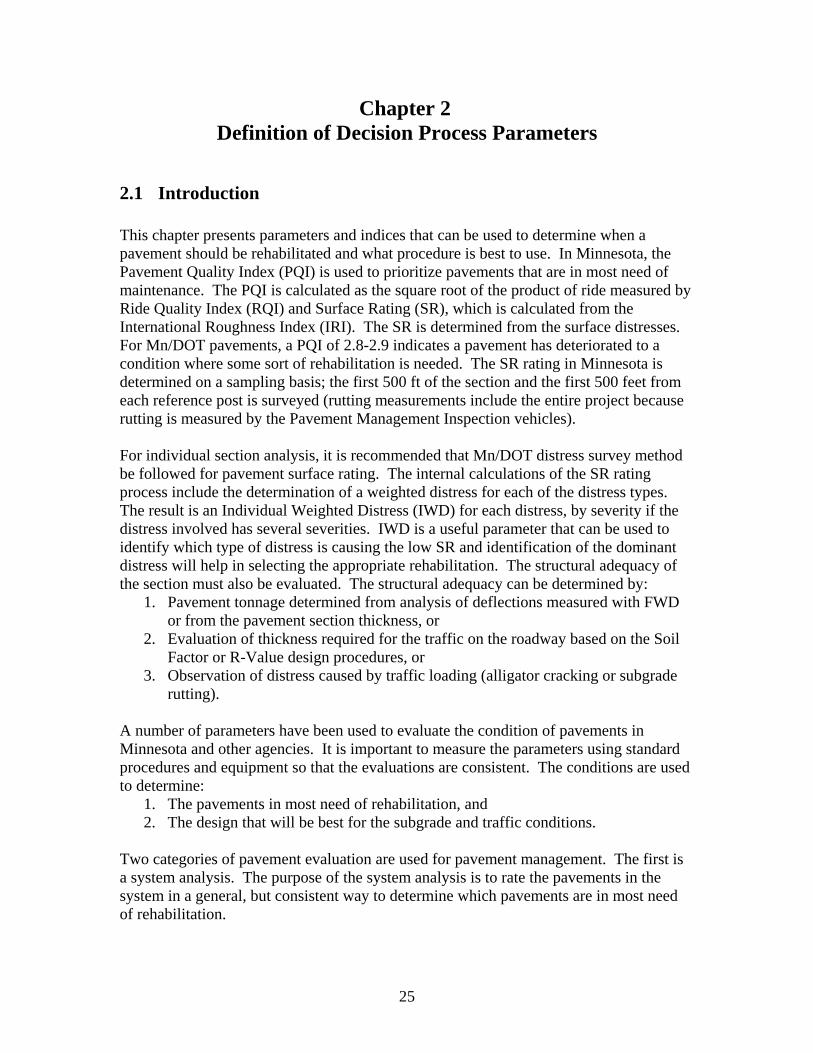
Table 1.2: Summary of pavement design parameters calculated from FWD Tests on TH 73 and TH 23 using YONAPAVE predictions.
Project Date Layer Moduli Range, MPa
Figure
TH 73 (6927) 1999 Subgrade 49-125 1.8
2002 “ 85-200 1.8
TH 73 (6927) 1999 Granular Equivalent
6.0-22.0 1.10
2002 Granular Equivalent
10.0-12.0 1.10
TH 73 (6927) 1999 Structural Number
0.9-3.0 1.9
2002 Structural Number
1.4-1.7 1.9
TH 23 (0901) 2000 Subgrade 45-100 1.11
2002 Subgrade 50-190 1.11
TH 23 (0901) 2000 Granular Equivalent
6.0-25.0 1.13
2002 Granular Equivalent
9.0-23.0 1.13
TH 23 (0901) 2000 Structural Number
1.0-3.8 1.12
2002 Structural Number
1.0-4.1 1.12
1.5 Summary A study was initiated to investigate the types of pavement rehabilitation that are ongoing in Minnesota. These include full depth reclamation, cold in-place recycling, and mill and overlay. Site visits and surveys were performed to collect information on over 100 projects. The identified parameters in this database include: (1) cracking, (2) ride, (3) rutting, (4) age, and (5) traffic volume. Examples of collected field data used to evaluate these parameters were presented.
25
Chapter 2 Definition of Decision Process Parameters
2.1 Introduction This chapter presents parameters and indices that can be used to determine when a pavement should be rehabilitated and what procedure is best to use. In Minnesota, the Pavement Quality Index (PQI) is used to prioritize pavements that are in most need of maintenance. The PQI is calculated as the square root of the product of ride measured by Ride Quality Index (RQI) and Surface Rating (SR), which is calculated from the International Roughness Index (IRI). The SR is determined from the surface distresses. For Mn/DOT pavements, a PQI of 2.8-2.9 indicates a pavement has deteriorated to a condition where some sort of rehabilitation is needed. The SR rating in Minnesota is determined on a sampling basis; the first 500 ft of the section and the first 500 feet from each reference post is surveyed (rutting measurements include the entire project because rutting is measured by the Pavement Management Inspection vehicles). For individual section analysis, it is recommended that Mn/DOT distress survey method be followed for pavement surface rating. The internal calculations of the SR rating process include the determination of a weighted distress for each of the distress types. The result is an Individual Weighted Distress (IWD) for each distress, by severity if the distress involved has several severities. IWD is a useful parameter that can be used to identify which type of distress is causing the low SR and identification of the dominant distress will help in selecting the appropriate rehabilitation. The structural adequacy of the section must also be evaluated. The structural adequacy can be determined by:
1. Pavement tonnage determined from analysis of deflections measured with FWD or from the pavement section thickness, or
2. Evaluation of thickness required for the traffic on the roadway based on the Soil Factor or R-Value design procedures, or
3. Observation of distress caused by traffic loading (alligator cracking or subgrade rutting).
A number of parameters have been used to evaluate the condition of pavements in Minnesota and other agencies. It is important to measure the parameters using standard procedures and equipment so that the evaluations are consistent. The conditions are used to determine:
1. The pavements in most need of rehabilitation, and 2. The design that will be best for the subgrade and traffic conditions.
Two categories of pavement evaluation are used for pavement management. The first is a system analysis. The purpose of the system analysis is to rate the pavements in the system in a general, but consistent way to determine which pavements are in most need of rehabilitation.
26
In Minnesota, the condition for system analysis is defined using the Pavement Quality Index (PQI). The PQI is calculated using the ride defined with the Ride Quality Index (RQI). The RQI is now calculated from the International Ride Index (IRI). The IRI is measured by inertial profilers that are mounted on the pavement management inspection vehicles that travel in both directions on all Mn/DOT roads every year and less frequently on county roads and city streets. An alternate method for measuring PSR is presented the section 2.2.1. The other factor used to calculate the PQI is the Surface Rating (SR), determined by measuring the extent and severity of the visually identifiable distresses (cracking, patching, etc.) according to the Mn/DOT Distress Identification Manual. The distress quantities are weighted according to the weighting factors for the distresses listed in Table 2.2. The factors are based on the experience of pavement engineers over the past 30 years. The PQI is then calculated by taking the square root of the product of the PSR and SR. The PQI is therefore a parameter that uses the various measures of the weighted distresses and ride to determine which pavements are in most need of rehabilitation. Once specific projects have been selected as part of a pavement improvement program, it is necessary to select the type of rehabilitation and to design a specific cross-section. It is suggested that the various weighted distresses be considered individually so that the cause of the distress can be determined. In addition the structural adequacy, requirements for the traffic predicted for the section should be estimated. The PSR, SR and PQI are defined in the next section for the system analysis. The parameters suggested for project analysis are:
• Rut depth • Transverse crack severity • Longitudinal crack severity • Longitudinal joint deterioration • Multiple cracking • Alligator cracking • Raveling and weathering • Patching
Calculation of Individual Weighted Distresses (IWD) to help break out the parameters to make a decision for what procedure is appropriate.
In addition, the structural adequacy will help develop the design of the project. The parameters that can be used to estimate structural adequacy are:
• Tonnage, • Pavement thickness design, • Falling Weight Deflectometer deflection analysis, • Material types, and • Traffic volumes.
27
2.2 System Level Analysis Mn/DOT has three parameters used to describe the condition of pavements: Present Serviceablity Rating (PSR), Surface Rating (SR) and Pavement Quality Index (PQI). The indices are defined for bituminous, concrete, and continuously reinforced pavements. For this summary, only bituminous pavement procedures will be reviewed. 2.2.1 Present Serviceability Rating (PSR) PSR was used by Mn/DOT to define smoothness or ride. Currently, Mn/DOT changed PSR to RQI. These two indexes have the same definition. PSR is defined using a scale from 0.00 - 5.00. A rating of 5.00 is a perfectly smooth road. Newly constructed roads typically have PSR of slightly over 4.0. Design procedures use a terminal PSR of 2.5 (1-5). At this level, the road is still drivable, but uncomfortable. Ride measurement procedures go back many years. A rating process called the Present Serviceability Rating (PSR) had its origin at the AASHO Road Test and it has been used for the AASHTO (AASHO) Design Guides (11-13), the Asphalt Institute Procedure (14) and the Mn/DOT R-Value procedure (15). The PSR is defined as, “How well the pavement is serving the public.” At the AASHO Road Test, PSR was determined by a panel of 11 people. The average of the ratings was correlated with a pavement longitudinal profile characteristic called the Slope Variance (SV), which was measured using the longitudinal profilometer. In Minnesota, the PSR was originally correlated to the Bureau of Public Roads (BPR) roughometer and later with measurements of International Roughness Index (IRI). Currently, the IRI is measured using the Mn/DOT Pathways van, which is also now available for some Minnesota county and city roads. The PSR was renamed to RQI recently to convey more meaning about what the measure represents. Two procedures are available to determine PSR on county or city pavements:
a. Measure the IRI on a given pavement and use the current correlation to calculate RQI.
b. Manually rate the pavement with 3 - 5 people. The average of 3 - 5 ratings has been shown to be adequate for most evaluations (17). Appendix B includes a suggested procedure for a local agency to use if the data from Mn/DOT pavement management van are not available.
The qualitative definitions used by rating panel members to define PSR are:
4-5 Very Good 3-4 Good 2-3 Fair 1-2 Poor 0-1 Very Poor
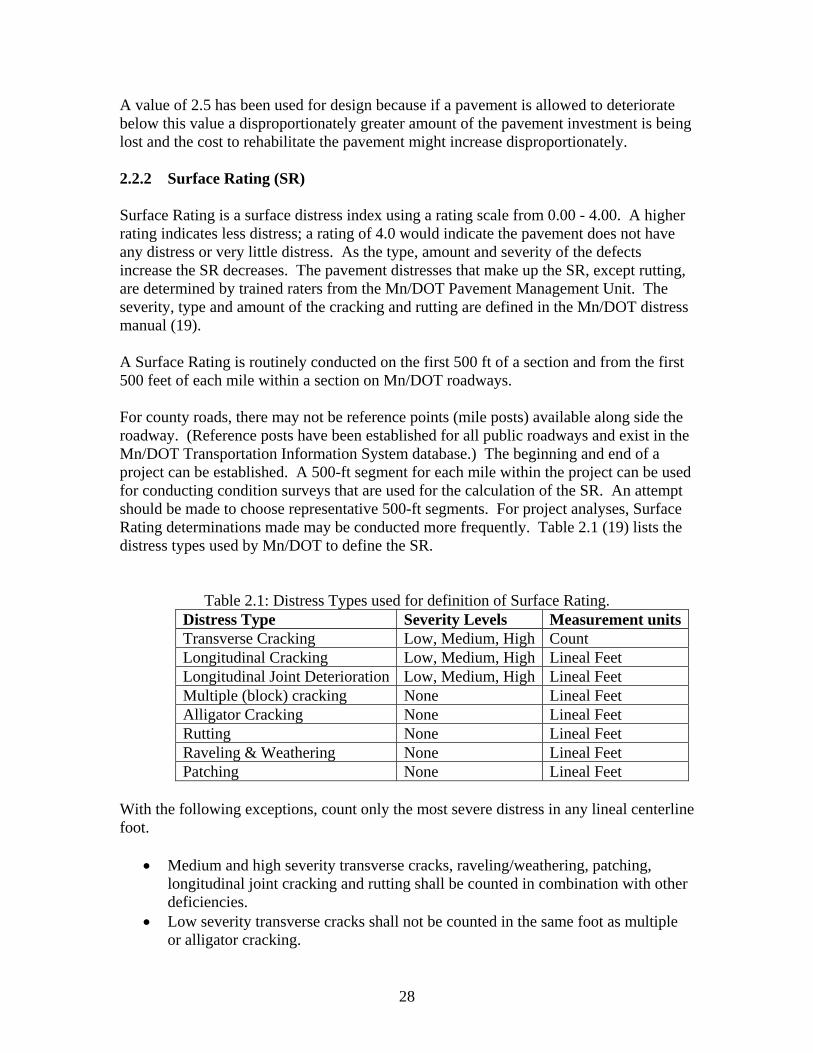
28
A value of 2.5 has been used for design because if a pavement is allowed to deteriorate below this value a disproportionately greater amount of the pavement investment is being lost and the cost to rehabilitate the pavement might increase disproportionately. 2.2.2 Surface Rating (SR) Surface Rating is a surface distress index using a rating scale from 0.00 - 4.00. A higher rating indicates less distress; a rating of 4.0 would indicate the pavement does not have any distress or very little distress. As the type, amount and severity of the defects increase the SR decreases. The pavement distresses that make up the SR, except rutting, are determined by trained raters from the Mn/DOT Pavement Management Unit. The severity, type and amount of the cracking and rutting are defined in the Mn/DOT distress manual (19). A Surface Rating is routinely conducted on the first 500 ft of a section and from the first 500 feet of each mile within a section on Mn/DOT roadways. For county roads, there may not be reference points (mile posts) available along side the roadway. (Reference posts have been established for all public roadways and exist in the Mn/DOT Transportation Information System database.) The beginning and end of a project can be established. A 500-ft segment for each mile within the project can be used for conducting condition surveys that are used for the calculation of the SR. An attempt should be made to choose representative 500-ft segments. For project analyses, Surface Rating determinations made may be conducted more frequently. Table 2.1 (19) lists the distress types used by Mn/DOT to define the SR.
Table 2.1: Distress Types used for definition of Surface Rating. Distress Type Severity Levels Measurement unitsTransverse Cracking Low, Medium, High Count Longitudinal Cracking Low, Medium, High Lineal Feet Longitudinal Joint Deterioration Low, Medium, High Lineal Feet Multiple (block) cracking None Lineal Feet Alligator Cracking None Lineal Feet Rutting None Lineal Feet Raveling & Weathering None Lineal Feet Patching None Lineal Feet
With the following exceptions, count only the most severe distress in any lineal centerline foot.
• Medium and high severity transverse cracks, raveling/weathering, patching, longitudinal joint cracking and rutting shall be counted in combination with other deficiencies.
• Low severity transverse cracks shall not be counted in the same foot as multiple or alligator cracking.
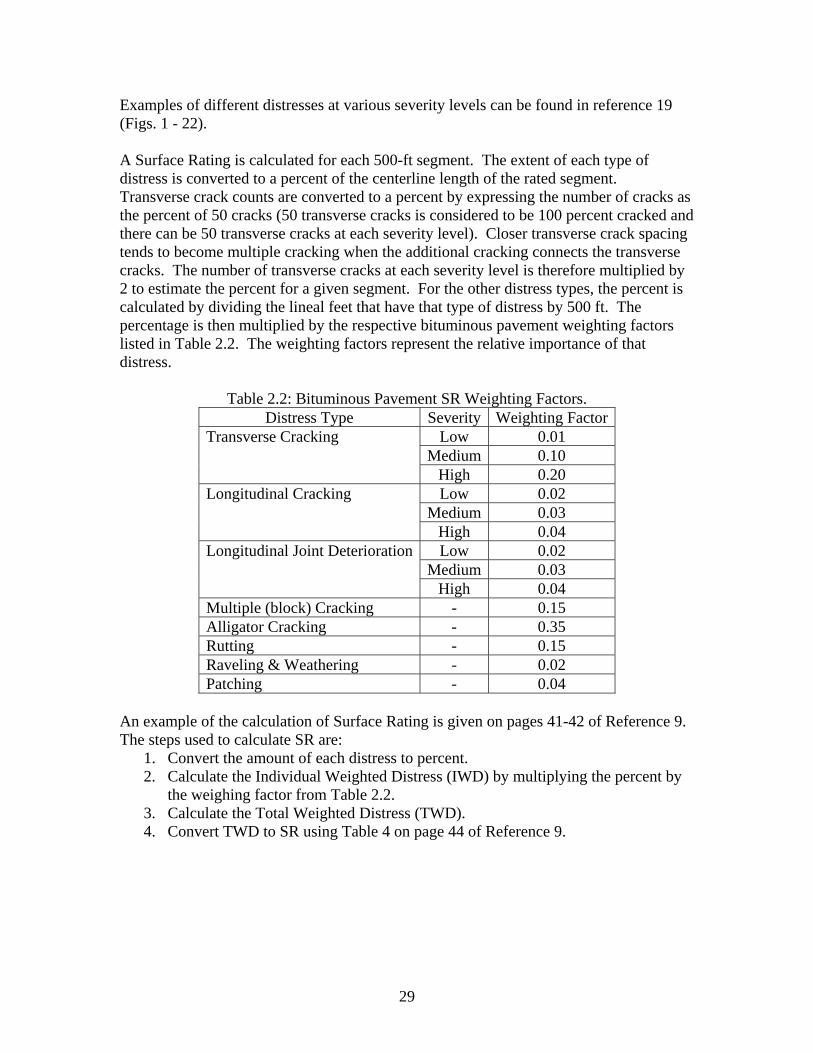
29
Examples of different distresses at various severity levels can be found in reference 19 (Figs. 1 - 22). A Surface Rating is calculated for each 500-ft segment. The extent of each type of distress is converted to a percent of the centerline length of the rated segment. Transverse crack counts are converted to a percent by expressing the number of cracks as the percent of 50 cracks (50 transverse cracks is considered to be 100 percent cracked and there can be 50 transverse cracks at each severity level). Closer transverse crack spacing tends to become multiple cracking when the additional cracking connects the transverse cracks. The number of transverse cracks at each severity level is therefore multiplied by 2 to estimate the percent for a given segment. For the other distress types, the percent is calculated by dividing the lineal feet that have that type of distress by 500 ft. The percentage is then multiplied by the respective bituminous pavement weighting factors listed in Table 2.2. The weighting factors represent the relative importance of that distress.
Table 2.2: Bituminous Pavement SR Weighting Factors. Distress Type Severity Weighting Factor
Low 0.01 Medium 0.10
Transverse Cracking
High 0.20 Low 0.02
Medium 0.03 Longitudinal Cracking
High 0.04 Low 0.02
Medium 0.03 Longitudinal Joint Deterioration
High 0.04 Multiple (block) Cracking - 0.15 Alligator Cracking - 0.35 Rutting - 0.15 Raveling & Weathering - 0.02 Patching - 0.04
An example of the calculation of Surface Rating is given on pages 41-42 of Reference 9. The steps used to calculate SR are:
1. Convert the amount of each distress to percent. 2. Calculate the Individual Weighted Distress (IWD) by multiplying the percent by
the weighing factor from Table 2.2. 3. Calculate the Total Weighted Distress (TWD). 4. Convert TWD to SR using Table 4 on page 44 of Reference 9.
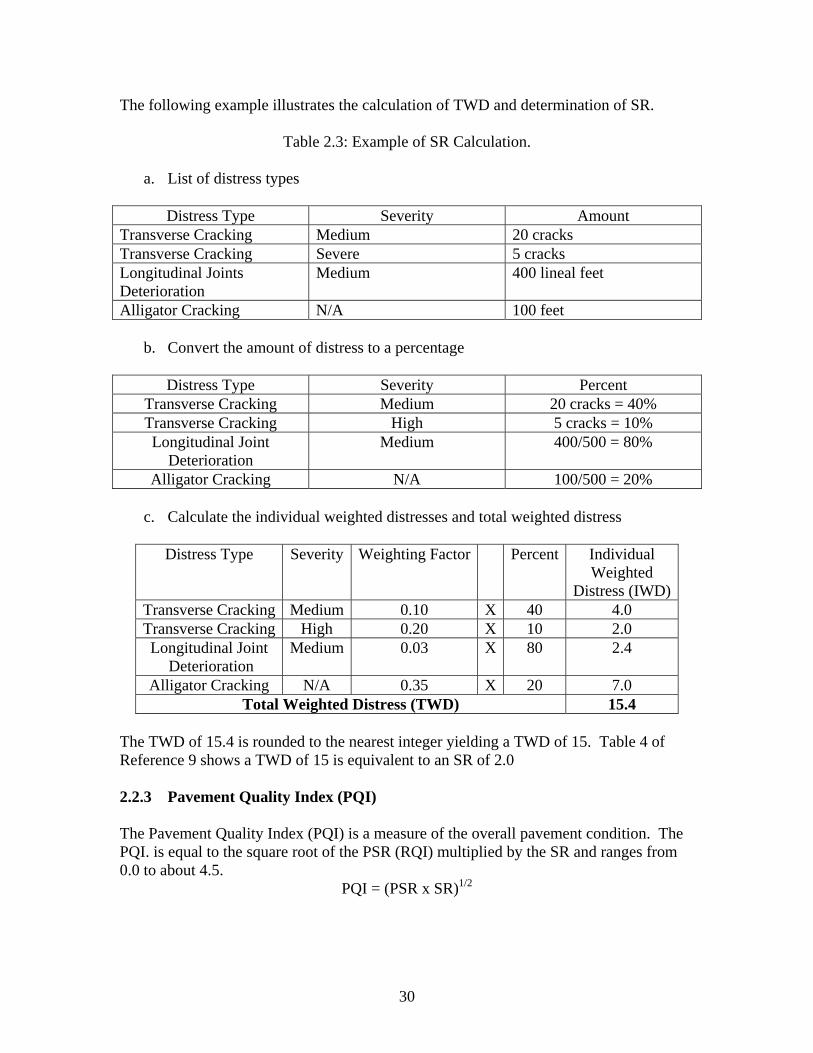
30
The following example illustrates the calculation of TWD and determination of SR.
Table 2.3: Example of SR Calculation.
a. List of distress types
Distress Type Severity Amount Transverse Cracking Medium 20 cracks Transverse Cracking Severe 5 cracks Longitudinal Joints Deterioration
Medium 400 lineal feet
Alligator Cracking N/A 100 feet
b. Convert the amount of distress to a percentage
Distress Type Severity Percent Transverse Cracking Medium 20 cracks = 40% Transverse Cracking High 5 cracks = 10% Longitudinal Joint
Deterioration Medium 400/500 = 80%
Alligator Cracking N/A 100/500 = 20%
c. Calculate the individual weighted distresses and total weighted distress
Distress Type Severity Weighting Factor Percent Individual Weighted
Distress (IWD)Transverse Cracking Medium 0.10 X 40 4.0 Transverse Cracking High 0.20 X 10 2.0 Longitudinal Joint
Deterioration Medium 0.03 X 80 2.4
Alligator Cracking N/A 0.35 X 20 7.0 Total Weighted Distress (TWD) 15.4
The TWD of 15.4 is rounded to the nearest integer yielding a TWD of 15. Table 4 of Reference 9 shows a TWD of 15 is equivalent to an SR of 2.0 2.2.3 Pavement Quality Index (PQI)
The Pavement Quality Index (PQI) is a measure of the overall pavement condition. The PQI. is equal to the square root of the PSR (RQI) multiplied by the SR and ranges from 0.0 to about 4.5.
PQI = (PSR x SR)1/2
31
2.2.4 Use of Pavement Condition Indices for Pavement Management The PSR (RQI) and PSI have been used for making decisions on what pavement sections need maintenance or rehabilitation and when maintenance or rehabilitation procedures need to be done. The following criteria are examples of how these indices have been used:
• The determination of PSR using the average of 3 - 5 people is superior to using individual ratings.
• A PSR or RQI of 2.5 is acceptable for primary roads, and a value between 1.5 - 2.0 may be acceptable for secondary roads.
• Differences between rating panels were insignificant, showing that a rating by a properly instructed panel is a representative rating of a pavement section.
• Mn/DOT roadways are rehabilitated typically at a PQI level of 2.8 - 2.9. The levels are somewhat dependent on the traffic, geometrics, funding, and other factors.
2.3 Project Level Analysis 2.3.1 Surface Rating (SR) for Project Analysis In this section the use of the Surface Rating (SR) for project analysis and rehabilitation design is presented. As currently defined, the SR combines a number of different types of distresses. Some distresses are caused by traffic, some by the environment, and some are caused by an interaction between both. To help develop criteria for selecting the appropriate rehabilitation type, the Individual Weighted Distresses (IWD) used to calculate the SR are used to evaluate the relative importance of the distresses. Critical minimum IWD values will be established for the various distresses to aid in selecting the appropriate rehabilitation based on the performance specifically for Cold-In-Place Recycling (CIR), Full Depth Reclamation (FDR) and Mill and Overlay projects. The distresses used to calculate the Surface Rating (SR) are:
a. Transverse cracking severities i. Low ii. Medium iii. High
b. Longitudinal cracking severities i. Low ii. Medium iii. High
c. Longitudinal joint deterioration i. Low ii. Medium iii. High
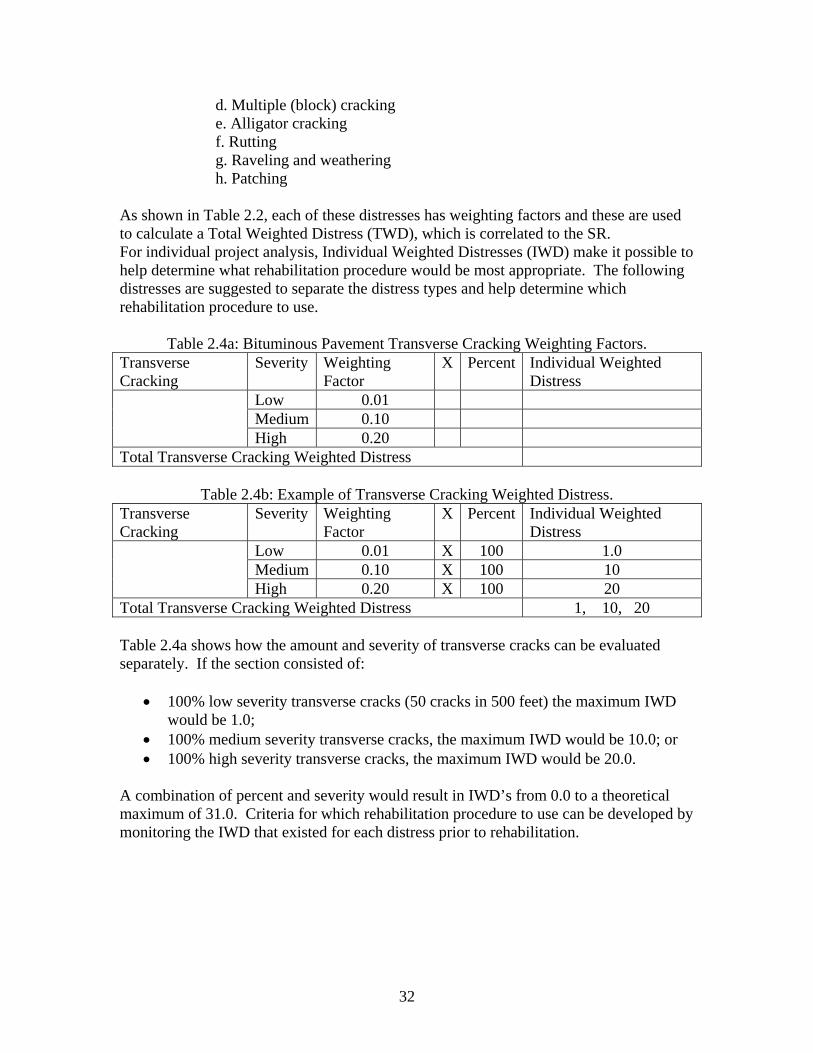
32
d. Multiple (block) cracking e. Alligator cracking f. Rutting g. Raveling and weathering h. Patching
As shown in Table 2.2, each of these distresses has weighting factors and these are used to calculate a Total Weighted Distress (TWD), which is correlated to the SR. For individual project analysis, Individual Weighted Distresses (IWD) make it possible to help determine what rehabilitation procedure would be most appropriate. The following distresses are suggested to separate the distress types and help determine which rehabilitation procedure to use.
Table 2.4a: Bituminous Pavement Transverse Cracking Weighting Factors. Transverse Cracking
Severity Weighting Factor
X Percent Individual Weighted Distress
Low 0.01 Medium 0.10
High 0.20 Total Transverse Cracking Weighted Distress
Table 2.4b: Example of Transverse Cracking Weighted Distress.
Transverse Cracking
Severity Weighting Factor
X Percent Individual Weighted Distress
Low 0.01 X 100 1.0 Medium 0.10 X 100 10
High 0.20 X 100 20 Total Transverse Cracking Weighted Distress 1, 10, 20 Table 2.4a shows how the amount and severity of transverse cracks can be evaluated separately. If the section consisted of:
• 100% low severity transverse cracks (50 cracks in 500 feet) the maximum IWD would be 1.0;
• 100% medium severity transverse cracks, the maximum IWD would be 10.0; or • 100% high severity transverse cracks, the maximum IWD would be 20.0.
A combination of percent and severity would result in IWD’s from 0.0 to a theoretical maximum of 31.0. Criteria for which rehabilitation procedure to use can be developed by monitoring the IWD that existed for each distress prior to rehabilitation.
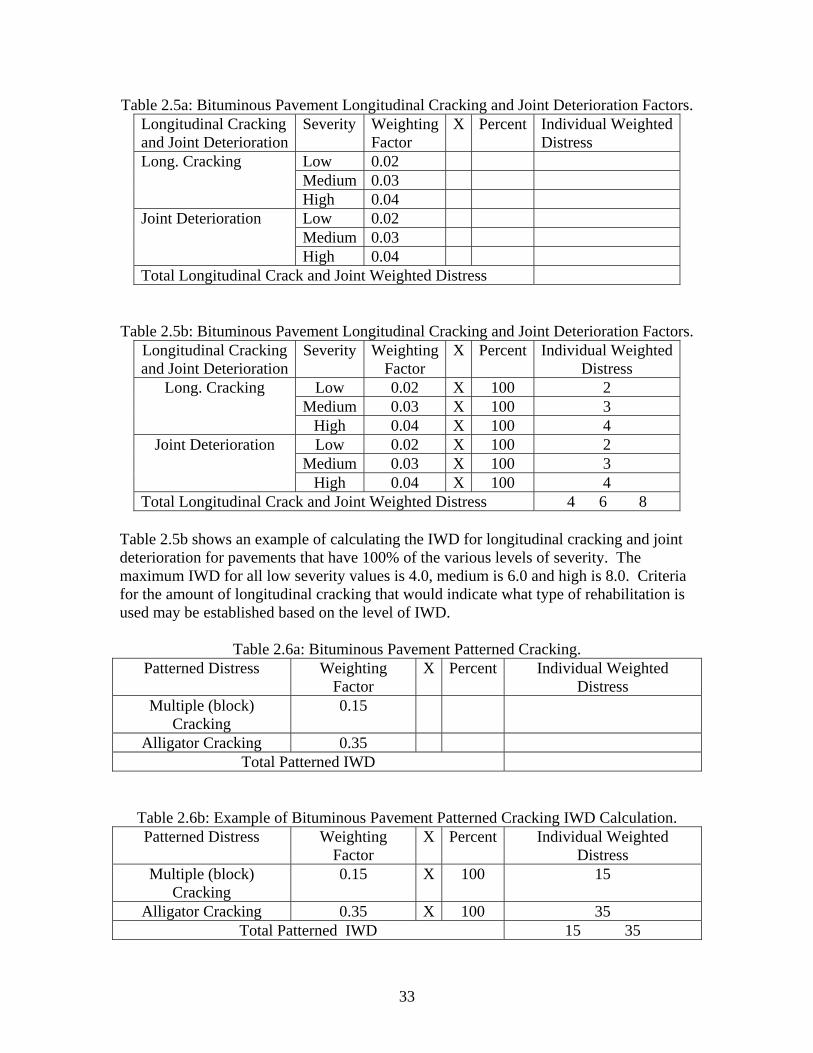
33
Table 2.5a: Bituminous Pavement Longitudinal Cracking and Joint Deterioration Factors. Longitudinal Cracking and Joint Deterioration
Severity Weighting Factor
X Percent Individual WeightedDistress
Low 0.02 Medium 0.03
Long. Cracking
High 0.04 Low 0.02 Medium 0.03
Joint Deterioration
High 0.04 Total Longitudinal Crack and Joint Weighted Distress
Table 2.5b: Bituminous Pavement Longitudinal Cracking and Joint Deterioration Factors.
Longitudinal Cracking and Joint Deterioration
Severity WeightingFactor
X Percent Individual WeightedDistress
Low 0.02 X 100 2 Medium 0.03 X 100 3
Long. Cracking
High 0.04 X 100 4 Low 0.02 X 100 2
Medium 0.03 X 100 3 Joint Deterioration
High 0.04 X 100 4 Total Longitudinal Crack and Joint Weighted Distress 4 6 8
Table 2.5b shows an example of calculating the IWD for longitudinal cracking and joint deterioration for pavements that have 100% of the various levels of severity. The maximum IWD for all low severity values is 4.0, medium is 6.0 and high is 8.0. Criteria for the amount of longitudinal cracking that would indicate what type of rehabilitation is used may be established based on the level of IWD.
Table 2.6a: Bituminous Pavement Patterned Cracking. Patterned Distress Weighting
Factor X Percent Individual Weighted
Distress Multiple (block)
Cracking 0.15
Alligator Cracking 0.35 Total Patterned IWD
Table 2.6b: Example of Bituminous Pavement Patterned Cracking IWD Calculation. Patterned Distress Weighting
Factor X Percent Individual Weighted
Distress Multiple (block)
Cracking 0.15 X 100 15
Alligator Cracking 0.35 X 100 35 Total Patterned IWD 15 35
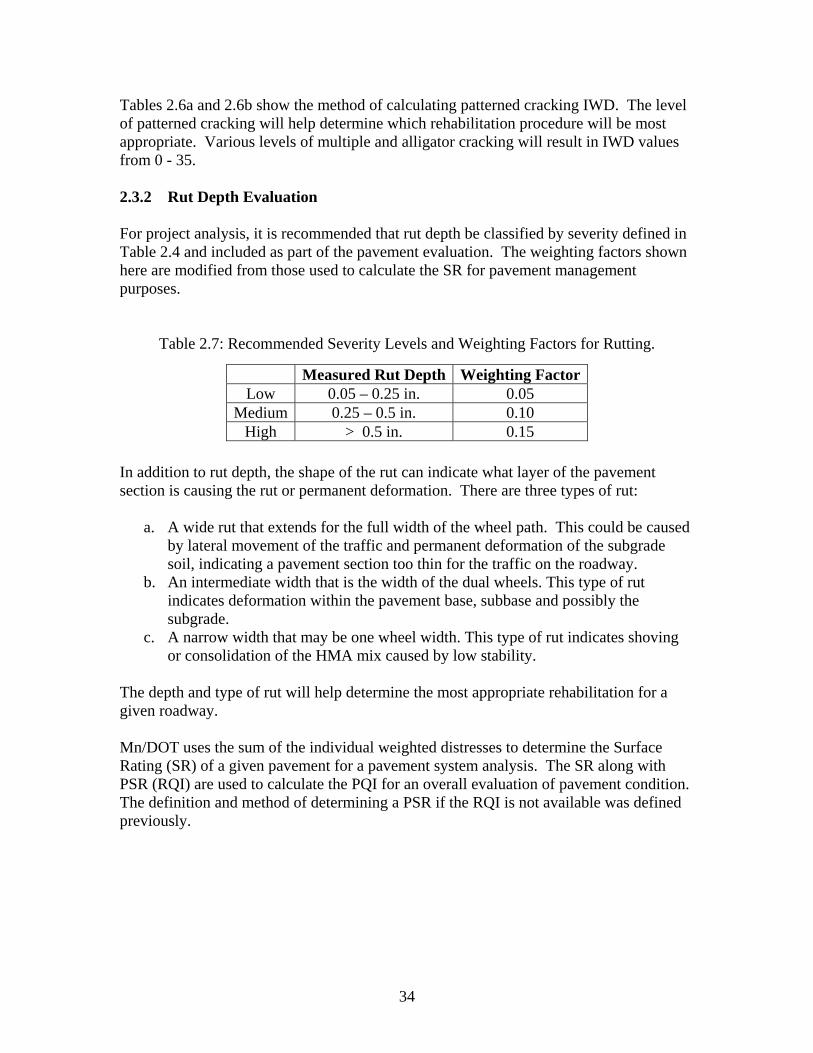
34
Tables 2.6a and 2.6b show the method of calculating patterned cracking IWD. The level of patterned cracking will help determine which rehabilitation procedure will be most appropriate. Various levels of multiple and alligator cracking will result in IWD values from 0 - 35. 2.3.2 Rut Depth Evaluation For project analysis, it is recommended that rut depth be classified by severity defined in Table 2.4 and included as part of the pavement evaluation. The weighting factors shown here are modified from those used to calculate the SR for pavement management purposes.
Table 2.7: Recommended Severity Levels and Weighting Factors for Rutting.
In addition to rut depth, the shape of the rut can indicate what layer of the pavement section is causing the rut or permanent deformation. There are three types of rut:
a. A wide rut that extends for the full width of the wheel path. This could be caused by lateral movement of the traffic and permanent deformation of the subgrade soil, indicating a pavement section too thin for the traffic on the roadway.
b. An intermediate width that is the width of the dual wheels. This type of rut indicates deformation within the pavement base, subbase and possibly the subgrade.
c. A narrow width that may be one wheel width. This type of rut indicates shoving or consolidation of the HMA mix caused by low stability.
The depth and type of rut will help determine the most appropriate rehabilitation for a given roadway. Mn/DOT uses the sum of the individual weighted distresses to determine the Surface Rating (SR) of a given pavement for a pavement system analysis. The SR along with PSR (RQI) are used to calculate the PQI for an overall evaluation of pavement condition. The definition and method of determining a PSR if the RQI is not available was defined previously.
Measured Rut Depth Weighting Factor Low 0.05 – 0.25 in. 0.05
Medium 0.25 – 0.5 in. 0.10 High > 0.5 in. 0.15
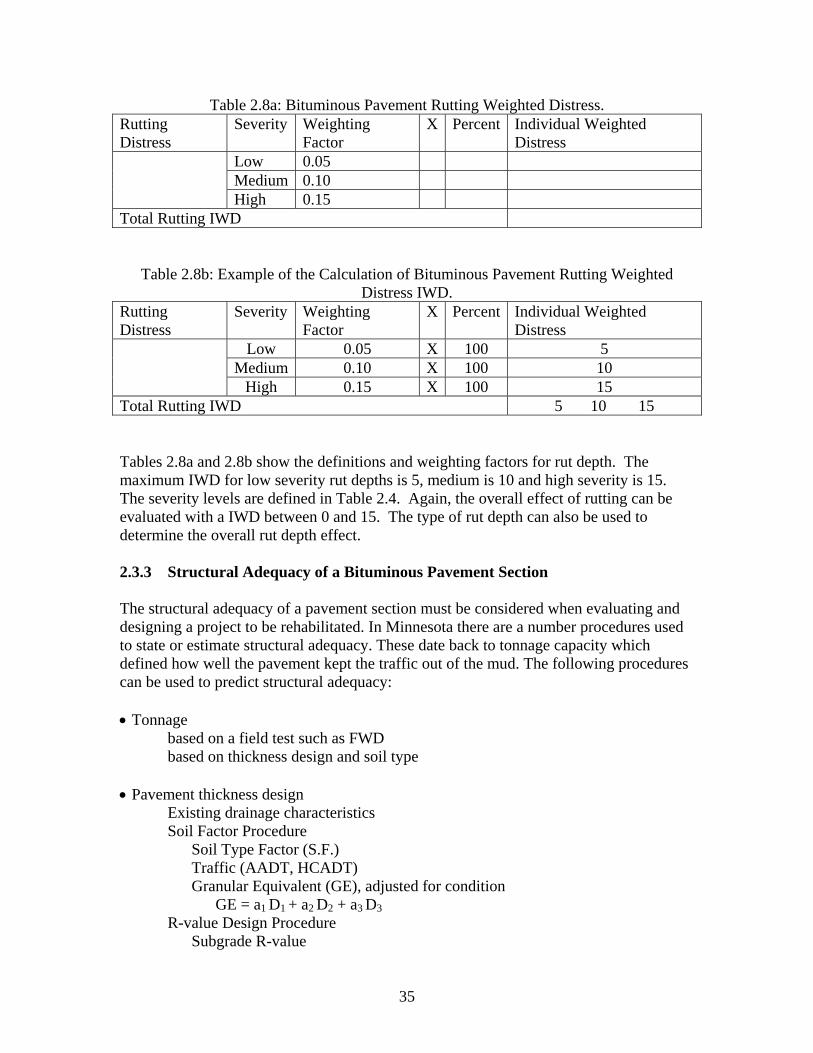
35
Table 2.8a: Bituminous Pavement Rutting Weighted Distress. Rutting Distress
Severity Weighting Factor
X Percent Individual Weighted Distress
Low 0.05 Medium 0.10
High 0.15 Total Rutting IWD
Table 2.8b: Example of the Calculation of Bituminous Pavement Rutting Weighted
Distress IWD. Rutting Distress
Severity Weighting Factor
X Percent Individual Weighted Distress
Low 0.05 X 100 5 Medium 0.10 X 100 10
High 0.15 X 100 15 Total Rutting IWD 5 10 15
Tables 2.8a and 2.8b show the definitions and weighting factors for rut depth. The maximum IWD for low severity rut depths is 5, medium is 10 and high severity is 15. The severity levels are defined in Table 2.4. Again, the overall effect of rutting can be evaluated with a IWD between 0 and 15. The type of rut depth can also be used to determine the overall rut depth effect. 2.3.3 Structural Adequacy of a Bituminous Pavement Section The structural adequacy of a pavement section must be considered when evaluating and designing a project to be rehabilitated. In Minnesota there are a number procedures used to state or estimate structural adequacy. These date back to tonnage capacity which defined how well the pavement kept the traffic out of the mud. The following procedures can be used to predict structural adequacy: • Tonnage
based on a field test such as FWD based on thickness design and soil type
• Pavement thickness design Existing drainage characteristics Soil Factor Procedure
Soil Type Factor (S.F.) Traffic (AADT, HCADT) Granular Equivalent (GE), adjusted for condition
GE = a1 D1 + a2 D2 + a3 D3 R-value Design Procedure
Subgrade R-value
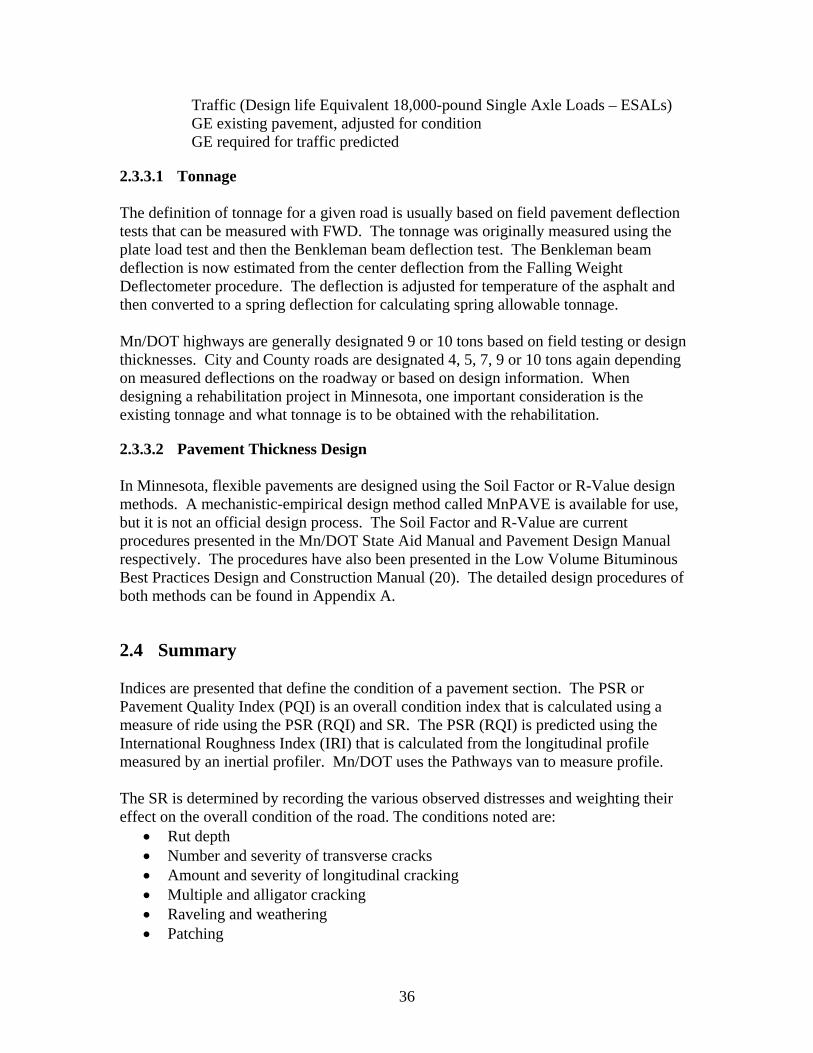
36
Traffic (Design life Equivalent 18,000-pound Single Axle Loads – ESALs) GE existing pavement, adjusted for condition GE required for traffic predicted
2.3.3.1 Tonnage The definition of tonnage for a given road is usually based on field pavement deflection tests that can be measured with FWD. The tonnage was originally measured using the plate load test and then the Benkleman beam deflection test. The Benkleman beam deflection is now estimated from the center deflection from the Falling Weight Deflectometer procedure. The deflection is adjusted for temperature of the asphalt and then converted to a spring deflection for calculating spring allowable tonnage. Mn/DOT highways are generally designated 9 or 10 tons based on field testing or design thicknesses. City and County roads are designated 4, 5, 7, 9 or 10 tons again depending on measured deflections on the roadway or based on design information. When designing a rehabilitation project in Minnesota, one important consideration is the existing tonnage and what tonnage is to be obtained with the rehabilitation.
2.3.3.2 Pavement Thickness Design In Minnesota, flexible pavements are designed using the Soil Factor or R-Value design methods. A mechanistic-empirical design method called MnPAVE is available for use, but it is not an official design process. The Soil Factor and R-Value are current procedures presented in the Mn/DOT State Aid Manual and Pavement Design Manual respectively. The procedures have also been presented in the Low Volume Bituminous Best Practices Design and Construction Manual (20). The detailed design procedures of both methods can be found in Appendix A.
2.4 Summary Indices are presented that define the condition of a pavement section. The PSR or Pavement Quality Index (PQI) is an overall condition index that is calculated using a measure of ride using the PSR (RQI) and SR. The PSR (RQI) is predicted using the International Roughness Index (IRI) that is calculated from the longitudinal profile measured by an inertial profiler. Mn/DOT uses the Pathways van to measure profile. The SR is determined by recording the various observed distresses and weighting their effect on the overall condition of the road. The conditions noted are:
• Rut depth • Number and severity of transverse cracks • Amount and severity of longitudinal cracking • Multiple and alligator cracking • Raveling and weathering • Patching
37
Each of these conditions is weighted and the total weighted distress is related to the SR. The Pavement Quality Index (PQI) is then calculated as the square root of the product of PSR and SR. The PQI is thus an index that shows the overall condition based on the ride and the listed weighted surface conditions. The PQI is used by Mn/DOT to prioritize pavements that are in most need of some type of repair. When a pavement has been selected for repair, a rehabilitation procedure and design must be selected. For this purpose, the six conditions noted above are separated. The Individual Weighted Distresses (IWD) for each of these items are recommended to evaluate that factor. The IWD’s are calculated as shown in this chapter. The minimum and maximum IWD’s for each distress are listed in Tables 2.6-2.9. Structural adequacy of the pavement section must also be evaluated. The structural adequacy can be based on:
• Tonnage measured with the FWD or assumed. • Thickness of the section for the predicted traffic using the Soil Factor or R-Value
design procedure. The required thickness is compared to the in-place thickness, adjusted for condition.
• The condition indices and structural adequacy are factors used to develop a decision tree for pavement rehabilitation choices.
The criteria for the decision tree will require that performance curves be developed to predict the rate of deterioration for specific conditions. The database presented in Chapter 1 is used to help develop these performance curves. The determination of these relationships is described in Chapter 3.
38
Chapter 3 Development of Decision Procedures
3.1 Introduction When a pavement needs rehabilitation, engineers have a range of options—from total reconstruction to doing nothing. What common characteristics lead to the selection of a particular type of rehabilitation, particularly CIR, FDR, or M&O are evaluated and discussed in this chapter. In Chapter 1, over 120 CIR, FDR, and M&O projects were entered into a database. The database documents the conditions before rehabilitation and after rehabilitation for at least four years. This information was used to help set limits for criteria regarding when work needs to be done and which procedure should be used. The project specifically looks at unstabilized full-depth reclamation (FDR), cold in-place recycling (CIR), and mill and overlay (M&O). The table below lists the procedures and generally what they are and why to use each.
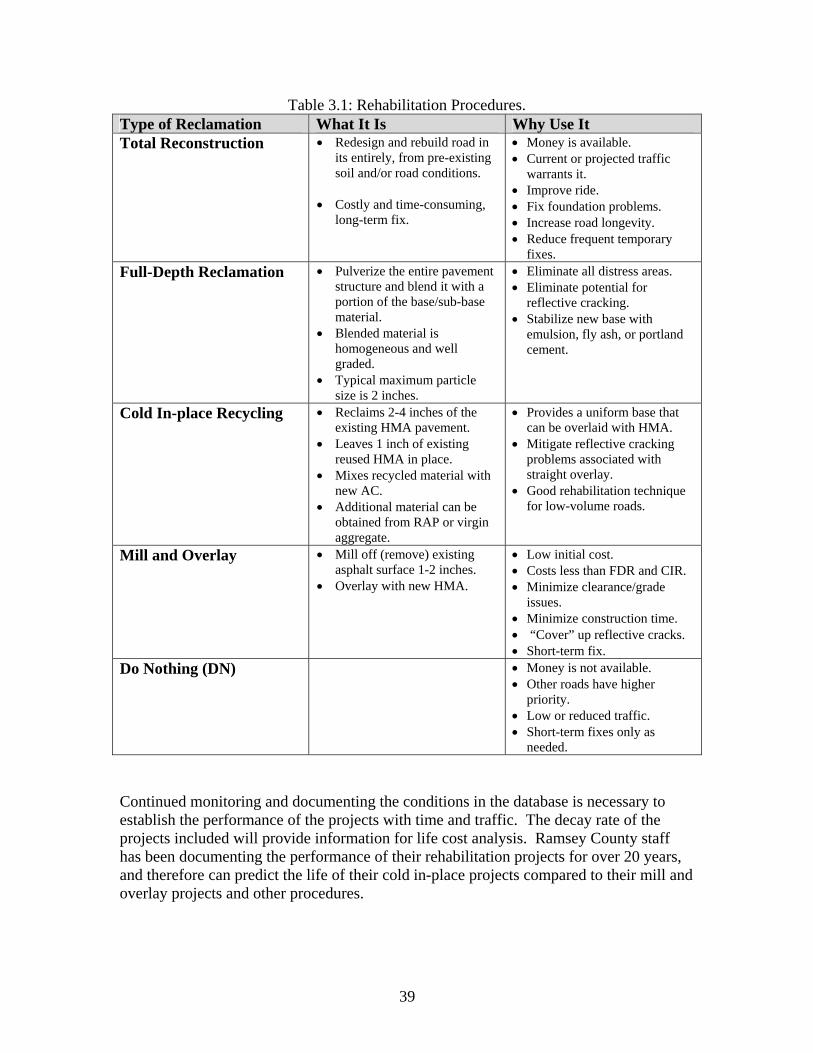
39
Table 3.1: Rehabilitation Procedures. Type of Reclamation What It Is Why Use It Total Reconstruction • Redesign and rebuild road in
its entirely, from pre-existing soil and/or road conditions.
• Costly and time-consuming,
long-term fix.
• Money is available. • Current or projected traffic
warrants it. • Improve ride. • Fix foundation problems. • Increase road longevity. • Reduce frequent temporary
fixes. Full-Depth Reclamation • Pulverize the entire pavement
structure and blend it with a portion of the base/sub-base material.
• Blended material is homogeneous and well graded.
• Typical maximum particle size is 2 inches.
• Eliminate all distress areas. • Eliminate potential for
reflective cracking. • Stabilize new base with
emulsion, fly ash, or portland cement.
Cold In-place Recycling • Reclaims 2-4 inches of the existing HMA pavement.
• Leaves 1 inch of existing reused HMA in place.
• Mixes recycled material with new AC.
• Additional material can be obtained from RAP or virgin aggregate.
• Provides a uniform base that can be overlaid with HMA.
• Mitigate reflective cracking problems associated with straight overlay.
• Good rehabilitation technique for low-volume roads.
Mill and Overlay • Mill off (remove) existing asphalt surface 1-2 inches.
• Overlay with new HMA.
• Low initial cost. • Costs less than FDR and CIR. • Minimize clearance/grade
issues. • Minimize construction time. • “Cover” up reflective cracks. • Short-term fix.
Do Nothing (DN) • Money is not available. • Other roads have higher
priority. • Low or reduced traffic. • Short-term fixes only as
needed.
Continued monitoring and documenting the conditions in the database is necessary to establish the performance of the projects with time and traffic. The decay rate of the projects included will provide information for life cost analysis. Ramsey County staff has been documenting the performance of their rehabilitation projects for over 20 years, and therefore can predict the life of their cold in-place projects compared to their mill and overlay projects and other procedures.
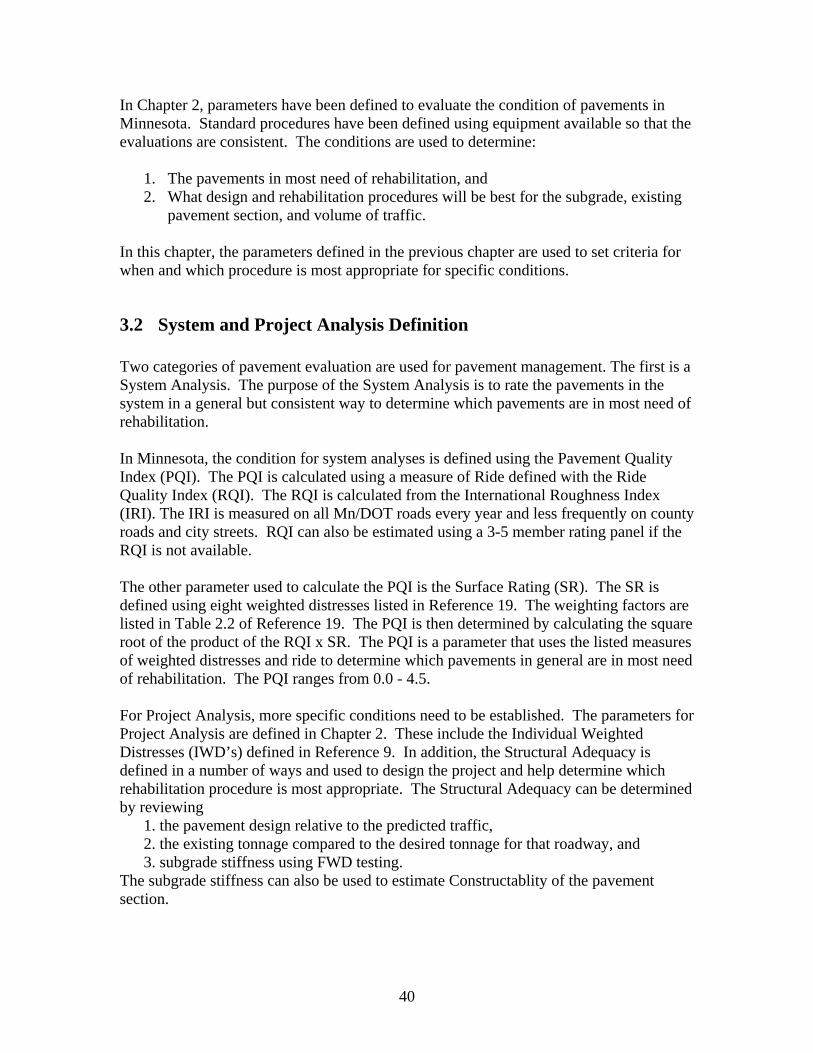
40
In Chapter 2, parameters have been defined to evaluate the condition of pavements in Minnesota. Standard procedures have been defined using equipment available so that the evaluations are consistent. The conditions are used to determine:
1. The pavements in most need of rehabilitation, and 2. What design and rehabilitation procedures will be best for the subgrade, existing
pavement section, and volume of traffic. In this chapter, the parameters defined in the previous chapter are used to set criteria for when and which procedure is most appropriate for specific conditions.
3.2 System and Project Analysis Definition Two categories of pavement evaluation are used for pavement management. The first is a System Analysis. The purpose of the System Analysis is to rate the pavements in the system in a general but consistent way to determine which pavements are in most need of rehabilitation. In Minnesota, the condition for system analyses is defined using the Pavement Quality Index (PQI). The PQI is calculated using a measure of Ride defined with the Ride Quality Index (RQI). The RQI is calculated from the International Roughness Index (IRI). The IRI is measured on all Mn/DOT roads every year and less frequently on county roads and city streets. RQI can also be estimated using a 3-5 member rating panel if the RQI is not available. The other parameter used to calculate the PQI is the Surface Rating (SR). The SR is defined using eight weighted distresses listed in Reference 19. The weighting factors are listed in Table 2.2 of Reference 19. The PQI is then determined by calculating the square root of the product of the RQI x SR. The PQI is a parameter that uses the listed measures of weighted distresses and ride to determine which pavements in general are in most need of rehabilitation. The PQI ranges from 0.0 - 4.5. For Project Analysis, more specific conditions need to be established. The parameters for Project Analysis are defined in Chapter 2. These include the Individual Weighted Distresses (IWD’s) defined in Reference 9. In addition, the Structural Adequacy is defined in a number of ways and used to design the project and help determine which rehabilitation procedure is most appropriate. The Structural Adequacy can be determined by reviewing 1. the pavement design relative to the predicted traffic, 2. the existing tonnage compared to the desired tonnage for that roadway, and 3. subgrade stiffness using FWD testing. The subgrade stiffness can also be used to estimate Constructablity of the pavement section.
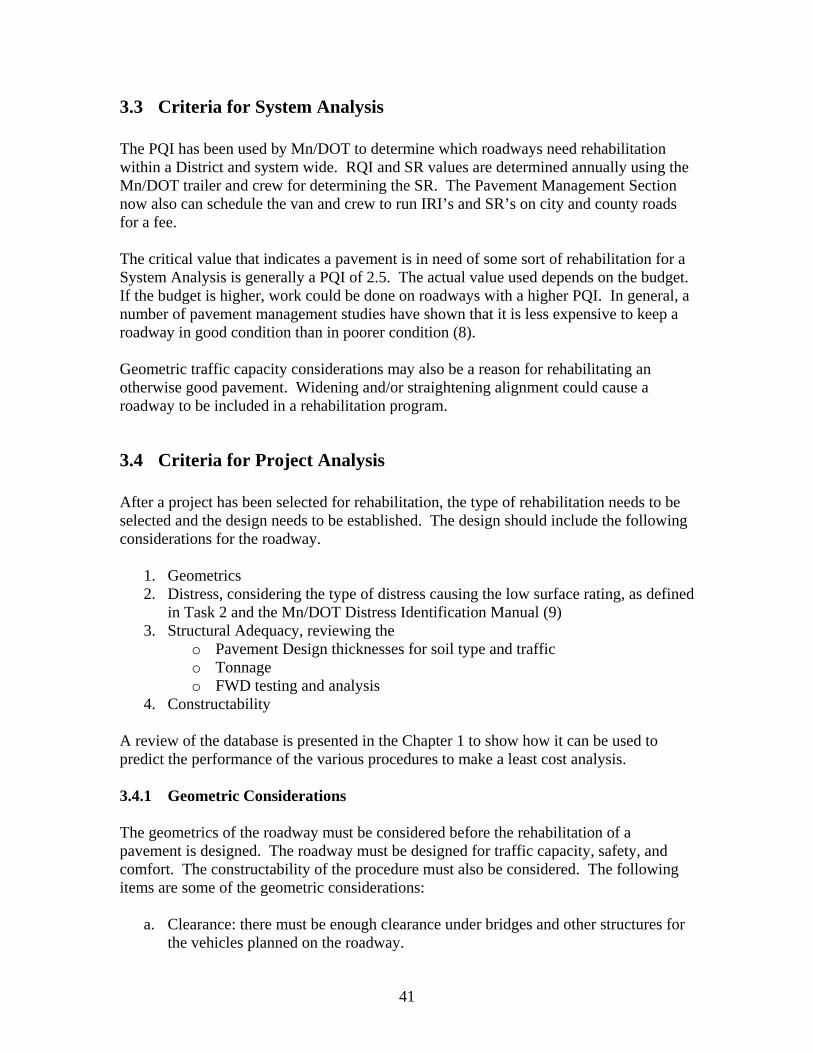
41
3.3 Criteria for System Analysis
The PQI has been used by Mn/DOT to determine which roadways need rehabilitation within a District and system wide. RQI and SR values are determined annually using the Mn/DOT trailer and crew for determining the SR. The Pavement Management Section now also can schedule the van and crew to run IRI’s and SR’s on city and county roads for a fee. The critical value that indicates a pavement is in need of some sort of rehabilitation for a System Analysis is generally a PQI of 2.5. The actual value used depends on the budget. If the budget is higher, work could be done on roadways with a higher PQI. In general, a number of pavement management studies have shown that it is less expensive to keep a roadway in good condition than in poorer condition (8). Geometric traffic capacity considerations may also be a reason for rehabilitating an otherwise good pavement. Widening and/or straightening alignment could cause a roadway to be included in a rehabilitation program.
3.4 Criteria for Project Analysis After a project has been selected for rehabilitation, the type of rehabilitation needs to be selected and the design needs to be established. The design should include the following considerations for the roadway.
1. Geometrics 2. Distress, considering the type of distress causing the low surface rating, as defined
in Task 2 and the Mn/DOT Distress Identification Manual (9) 3. Structural Adequacy, reviewing the
o Pavement Design thicknesses for soil type and traffic o Tonnage o FWD testing and analysis
4. Constructability A review of the database is presented in the Chapter 1 to show how it can be used to predict the performance of the various procedures to make a least cost analysis. 3.4.1 Geometric Considerations The geometrics of the roadway must be considered before the rehabilitation of a pavement is designed. The roadway must be designed for traffic capacity, safety, and comfort. The constructability of the procedure must also be considered. The following items are some of the geometric considerations:
a. Clearance: there must be enough clearance under bridges and other structures for the vehicles planned on the roadway.
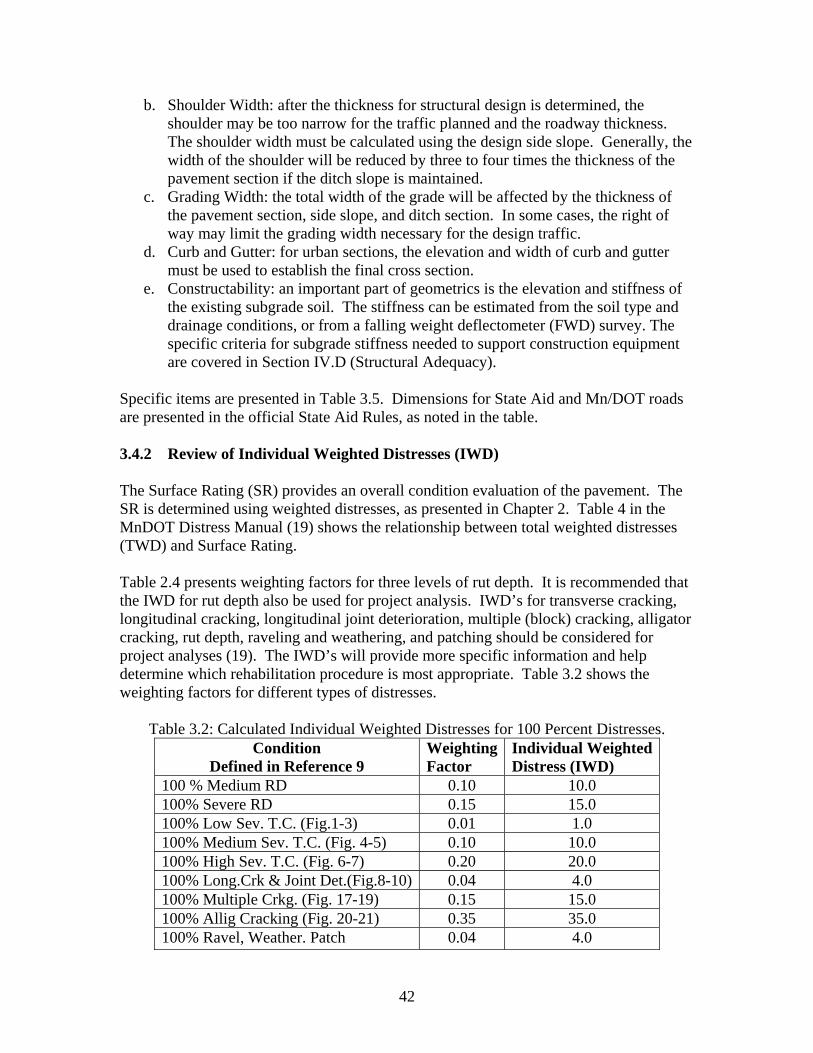
42
b. Shoulder Width: after the thickness for structural design is determined, the shoulder may be too narrow for the traffic planned and the roadway thickness. The shoulder width must be calculated using the design side slope. Generally, the width of the shoulder will be reduced by three to four times the thickness of the pavement section if the ditch slope is maintained.
c. Grading Width: the total width of the grade will be affected by the thickness of the pavement section, side slope, and ditch section. In some cases, the right of way may limit the grading width necessary for the design traffic.
d. Curb and Gutter: for urban sections, the elevation and width of curb and gutter must be used to establish the final cross section.
e. Constructability: an important part of geometrics is the elevation and stiffness of the existing subgrade soil. The stiffness can be estimated from the soil type and drainage conditions, or from a falling weight deflectometer (FWD) survey. The specific criteria for subgrade stiffness needed to support construction equipment are covered in Section IV.D (Structural Adequacy).
Specific items are presented in Table 3.5. Dimensions for State Aid and Mn/DOT roads are presented in the official State Aid Rules, as noted in the table. 3.4.2 Review of Individual Weighted Distresses (IWD) The Surface Rating (SR) provides an overall condition evaluation of the pavement. The SR is determined using weighted distresses, as presented in Chapter 2. Table 4 in the MnDOT Distress Manual (19) shows the relationship between total weighted distresses (TWD) and Surface Rating. Table 2.4 presents weighting factors for three levels of rut depth. It is recommended that the IWD for rut depth also be used for project analysis. IWD’s for transverse cracking, longitudinal cracking, longitudinal joint deterioration, multiple (block) cracking, alligator cracking, rut depth, raveling and weathering, and patching should be considered for project analyses (19). The IWD’s will provide more specific information and help determine which rehabilitation procedure is most appropriate. Table 3.2 shows the weighting factors for different types of distresses.
Table 3.2: Calculated Individual Weighted Distresses for 100 Percent Distresses. Condition
Defined in Reference 9 Weighting Factor
Individual Weighted Distress (IWD)
100 % Medium RD 0.10 10.0 100% Severe RD 0.15 15.0 100% Low Sev. T.C. (Fig.1-3) 0.01 1.0 100% Medium Sev. T.C. (Fig. 4-5) 0.10 10.0 100% High Sev. T.C. (Fig. 6-7) 0.20 20.0 100% Long.Crk & Joint Det.(Fig.8-10) 0.04 4.0 100% Multiple Crkg. (Fig. 17-19) 0.15 15.0 100% Allig Cracking (Fig. 20-21) 0.35 35.0 100% Ravel, Weather. Patch 0.04 4.0
43
3.4.3 Review of Structural Adequacy The structural adequacy can be determined by:
3.4.3.1 Pavement Thickness Design The required thickness of the pavement layers is dependent on the soil type and predicted traffic on the given roadway. The soil factor (Figure A-1) or R-value thickness design (Figure A-2) can be used. The existing thickness, adjusted for condition, can be compared to the required design to determine if additional pavement structure is needed. The design thicknesses are presented as granular equivalents (GE) defined in Chapter 2. The traffic factors for the Soil Factor procedure are the AADT and HCAADT predicted for 20 years into the future. The R-Value procedure requires that Equivalent Standard Axle Loads (ESAL’s) be predicted for 20 years. Procedures for predicting these traffic factors are preresented in Reference 20.
3.4.3.2 Tonnage Determination Measurement of pavement deflection has been related to allowable tonnage on Minnesota roads for many years. The TONN3 program has recently been used to predict Benkelman beam deflections from FWD maximum deflections (11). The current tonnage should be determined and then a decision made if a greater tonnage is desired. Generally, an increase in GE of 2 inches will provide an increase in tonnage from 9 to 10, subject to the design recommended minimum thickness for the asphalt.
3.4.3.3 Conduct Falling Weight Deflectometer (FWD) testing The FWD deflection basin can be used to:
1. Determine tonnage using the TONN program (11) The TONN program uses the maximum deflection under the first sensor to predict a Benkelman beam deflection, which in turn is used to calculate the tonnage of the roadway by comparing the measured deflection to a table of allowable deflections for various traffic levels and asphalt thicknesses.
2. Estimate the subgrade stiffness using the deflection measured by the sensor
farthest from the center of the plate. The stiffness can be in terms of resilient modulus or R-value. Either the Hogg model or other documented back calculation methods can be used to calculate a more representative value for the subgrade, as presented in Appendix C.
3. Estimate pavement layer Granular Equivalent (GE).
3.4.3.4 Constructability The constructability of a pavement section partially depends on the stiffness of the subgrade soil in-place. The resilient modulus of the soil can be estimated with the FWD
44
or the Dynamic Cone Penetrometer (DCP). Appendix C is a discussion of subgrade stiffness and how it affects the construction of FDR and CIR projects. The subgrade moduli or DCP index values considered to be an indication of potential bearing capacity problem for construction equipment are the following:
1. Subgrade Moduli from FWD test (Hogg Model with hard bottom at 10 times characteristic length):
- over 10,000psi; minimal risk of bearing capacity problems during construction - 6000 psi; some risk of bearing capacity problems during construction - 3000 psi; risk of bearing capacity problems during construction
2. DCP Index (highest single blow penetration in upper 2 feet): less than 25 mm/blow; minimal risk of bearing capacity problems during construction.
- 50 mm/blow; some risk of bearing capacity problems during construction - 125 mm/blow; risk of bearing capacity problems during construction The in-place moisture content of the subgrade soil is a possible predictor of construction related bearing capacity problems. Fine-grained soils with moisture contents above optimum moisture or over 80% saturation have a potential to pump during repeated heavy loadings. Visual signs of movement at the surface near a rolling tire or wheel is an indication of potential pumping due to excessive moisture content. It is recommended that rehabilitation sites that have potential for construction bearing capacity issues be evaluated using the above criteria during construction. If the FWD or DCP testing indicates subgrade stiffness problems, FDR can still be considered if there is sufficient undisturbed base material (10 in.) on a subgrade with a modulus of at least 5000 psi to provide support for construction equipment.
3.5 Relationships Suggested from Data Analysis To determine the current state-of-practice regarding recycling methods, a database was developed containing the information collected as part of the project (described in the Chapter 1). The database includes information on over 120 projects. In addition to information gathered from the surveys, FWD and surface distress (SR, Ride) data were gathered on selected state projects from Mn/DOT databases. The Ramsey county information was used to guide the development of the parameters for the database. The database contains information regarding the original pavement construction (when available); pre-rehabilitation information such as traffic and surface distresses; design specifications such as mill/reclaim depth or design HMA thicknesses; and post-rehabilitation conditions such as current distress and qualitative measures of the performance of the rehabilitation. A selection of relationships developed through analysis of the database are presented and briefly discussed.
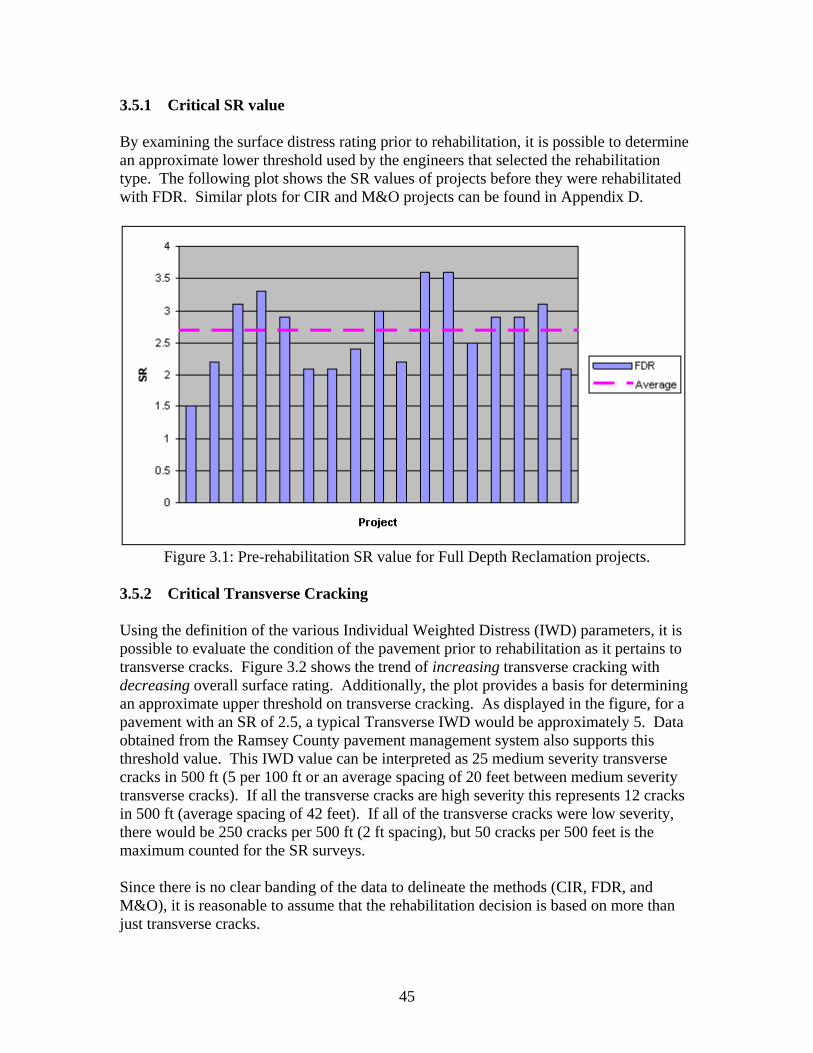
45
3.5.1 Critical SR value By examining the surface distress rating prior to rehabilitation, it is possible to determine an approximate lower threshold used by the engineers that selected the rehabilitation type. The following plot shows the SR values of projects before they were rehabilitated with FDR. Similar plots for CIR and M&O projects can be found in Appendix D.
Figure 3.1: Pre-rehabilitation SR value for Full Depth Reclamation projects.
3.5.2 Critical Transverse Cracking Using the definition of the various Individual Weighted Distress (IWD) parameters, it is possible to evaluate the condition of the pavement prior to rehabilitation as it pertains to transverse cracks. Figure 3.2 shows the trend of increasing transverse cracking with decreasing overall surface rating. Additionally, the plot provides a basis for determining an approximate upper threshold on transverse cracking. As displayed in the figure, for a pavement with an SR of 2.5, a typical Transverse IWD would be approximately 5. Data obtained from the Ramsey County pavement management system also supports this threshold value. This IWD value can be interpreted as 25 medium severity transverse cracks in 500 ft (5 per 100 ft or an average spacing of 20 feet between medium severity transverse cracks). If all the transverse cracks are high severity this represents 12 cracks in 500 ft (average spacing of 42 feet). If all of the transverse cracks were low severity, there would be 250 cracks per 500 ft (2 ft spacing), but 50 cracks per 500 feet is the maximum counted for the SR surveys. Since there is no clear banding of the data to delineate the methods (CIR, FDR, and M&O), it is reasonable to assume that the rehabilitation decision is based on more than just transverse cracks.
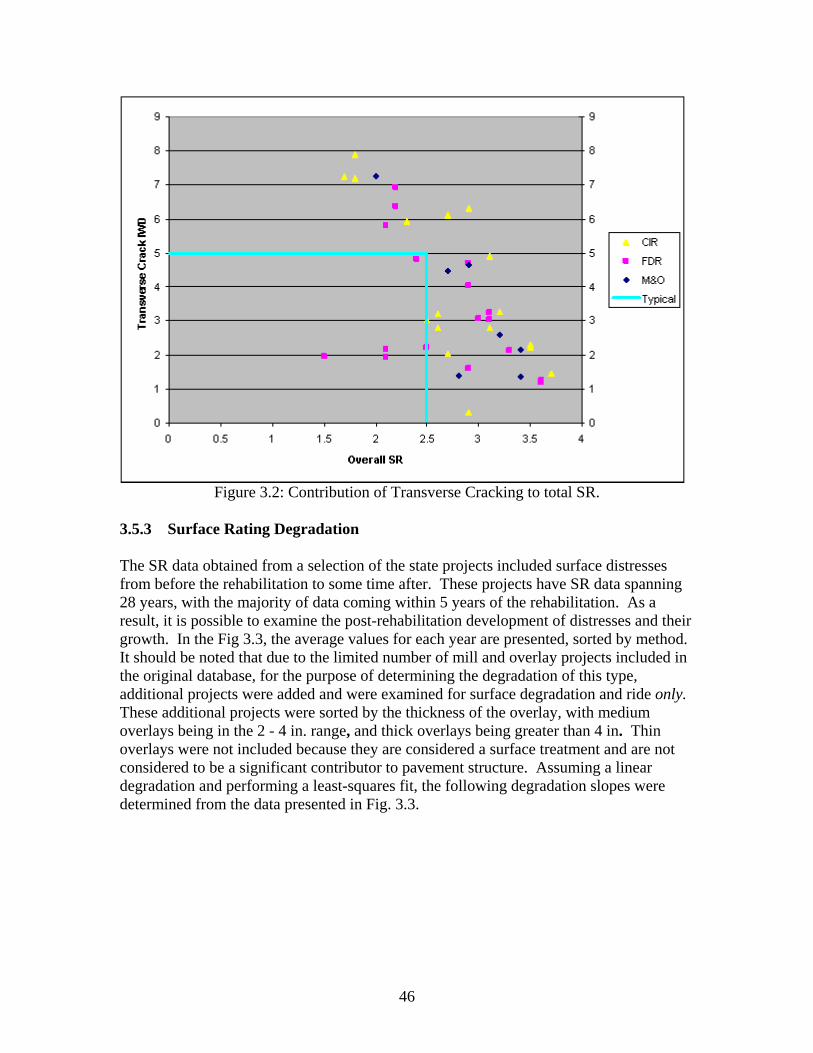
46
Figure 3.2: Contribution of Transverse Cracking to total SR.
3.5.3 Surface Rating Degradation The SR data obtained from a selection of the state projects included surface distresses from before the rehabilitation to some time after. These projects have SR data spanning 28 years, with the majority of data coming within 5 years of the rehabilitation. As a result, it is possible to examine the post-rehabilitation development of distresses and their growth. In the Fig 3.3, the average values for each year are presented, sorted by method. It should be noted that due to the limited number of mill and overlay projects included in the original database, for the purpose of determining the degradation of this type, additional projects were added and were examined for surface degradation and ride only. These additional projects were sorted by the thickness of the overlay, with medium overlays being in the 2 - 4 in. range, and thick overlays being greater than 4 in. Thin overlays were not included because they are considered a surface treatment and are not considered to be a significant contributor to pavement structure. Assuming a linear degradation and performing a least-squares fit, the following degradation slopes were determined from the data presented in Fig. 3.3.
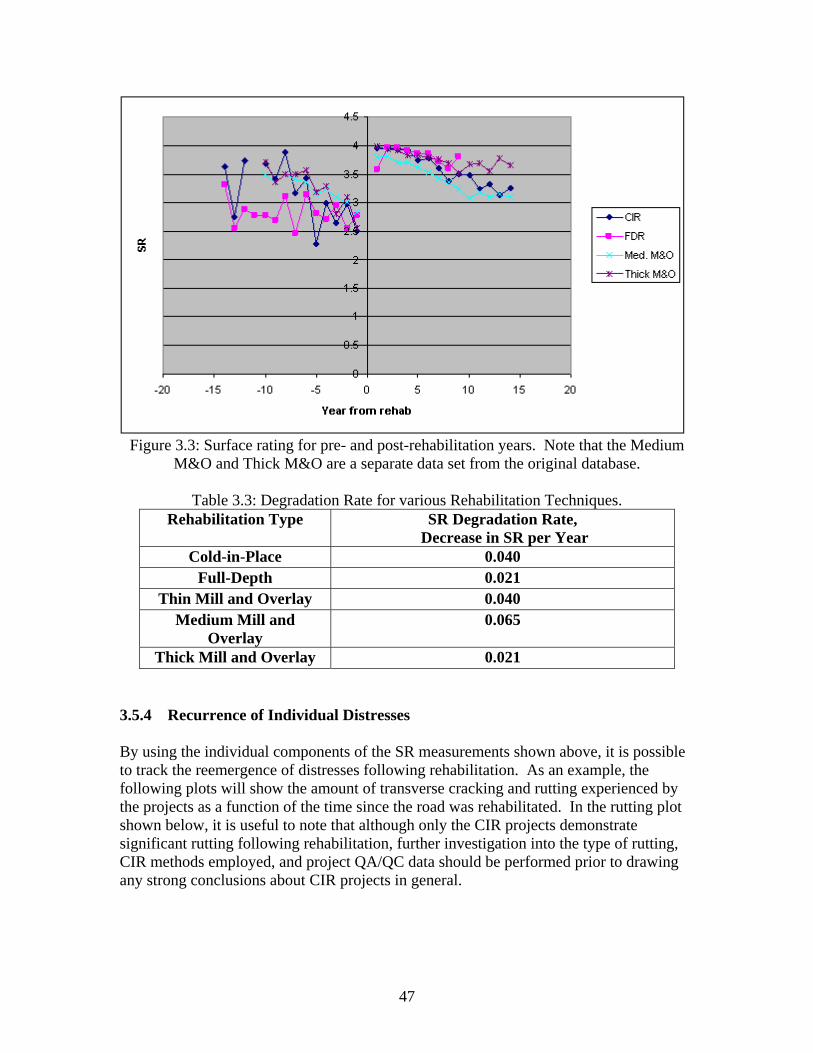
47
Figure 3.3: Surface rating for pre- and post-rehabilitation years. Note that the Medium
M&O and Thick M&O are a separate data set from the original database.
Table 3.3: Degradation Rate for various Rehabilitation Techniques. Rehabilitation Type SR Degradation Rate,
Decrease in SR per Year Cold-in-Place 0.040
Full-Depth 0.021 Thin Mill and Overlay 0.040
Medium Mill and Overlay
0.065
Thick Mill and Overlay 0.021 3.5.4 Recurrence of Individual Distresses By using the individual components of the SR measurements shown above, it is possible to track the reemergence of distresses following rehabilitation. As an example, the following plots will show the amount of transverse cracking and rutting experienced by the projects as a function of the time since the road was rehabilitated. In the rutting plot shown below, it is useful to note that although only the CIR projects demonstrate significant rutting following rehabilitation, further investigation into the type of rutting, CIR methods employed, and project QA/QC data should be performed prior to drawing any strong conclusions about CIR projects in general.
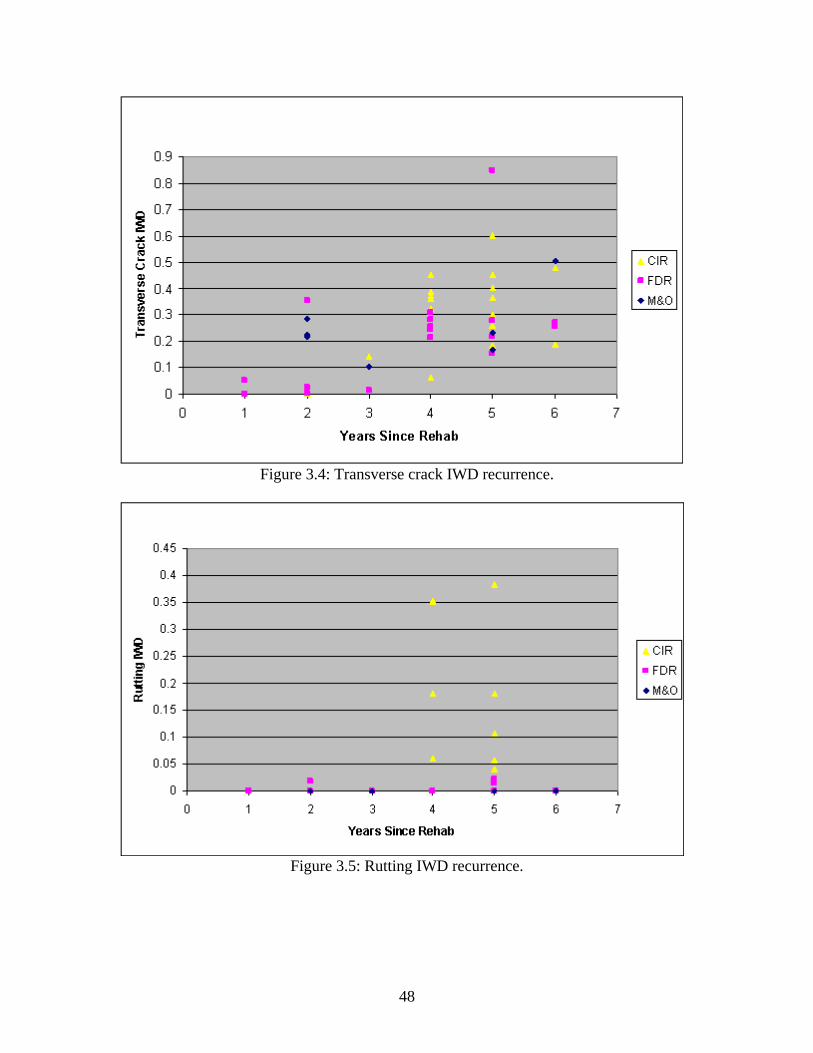
48
Figure 3.4: Transverse crack IWD recurrence.
Figure 3.5: Rutting IWD recurrence.
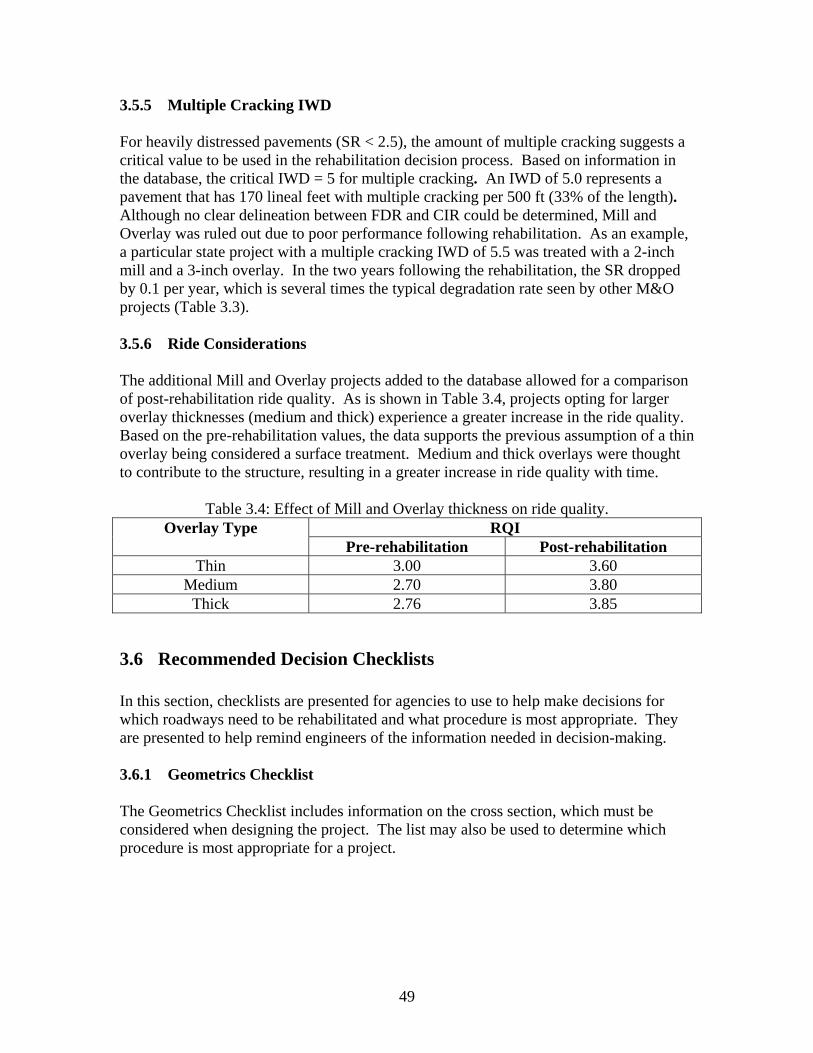
49
3.5.5 Multiple Cracking IWD For heavily distressed pavements (SR < 2.5), the amount of multiple cracking suggests a critical value to be used in the rehabilitation decision process. Based on information in the database, the critical IWD = 5 for multiple cracking. An IWD of 5.0 represents a pavement that has 170 lineal feet with multiple cracking per 500 ft (33% of the length). Although no clear delineation between FDR and CIR could be determined, Mill and Overlay was ruled out due to poor performance following rehabilitation. As an example, a particular state project with a multiple cracking IWD of 5.5 was treated with a 2-inch mill and a 3-inch overlay. In the two years following the rehabilitation, the SR dropped by 0.1 per year, which is several times the typical degradation rate seen by other M&O projects (Table 3.3). 3.5.6 Ride Considerations The additional Mill and Overlay projects added to the database allowed for a comparison of post-rehabilitation ride quality. As is shown in Table 3.4, projects opting for larger overlay thicknesses (medium and thick) experience a greater increase in the ride quality. Based on the pre-rehabilitation values, the data supports the previous assumption of a thin overlay being considered a surface treatment. Medium and thick overlays were thought to contribute to the structure, resulting in a greater increase in ride quality with time.
Table 3.4: Effect of Mill and Overlay thickness on ride quality. RQI Overlay Type
Pre-rehabilitation Post-rehabilitation Thin 3.00 3.60
Medium 2.70 3.80 Thick 2.76 3.85
3.6 Recommended Decision Checklists In this section, checklists are presented for agencies to use to help make decisions for which roadways need to be rehabilitated and what procedure is most appropriate. They are presented to help remind engineers of the information needed in decision-making. 3.6.1 Geometrics Checklist The Geometrics Checklist includes information on the cross section, which must be considered when designing the project. The list may also be used to determine which procedure is most appropriate for a project.

50
Table 3.5: Checklist for Geometrics.
Item Requirement(s) Critical Location(s) Design Solutions Clearances Shoulder Width Grading Width Curb and Gutter Constructability
The cross section requirements are used to determine if a roadway meets safety needs. Greater thicknesses may require a greater width to provide an adequate shoulder for anticipated traffic. To
be filled in using criteria from Fig. 3.6.
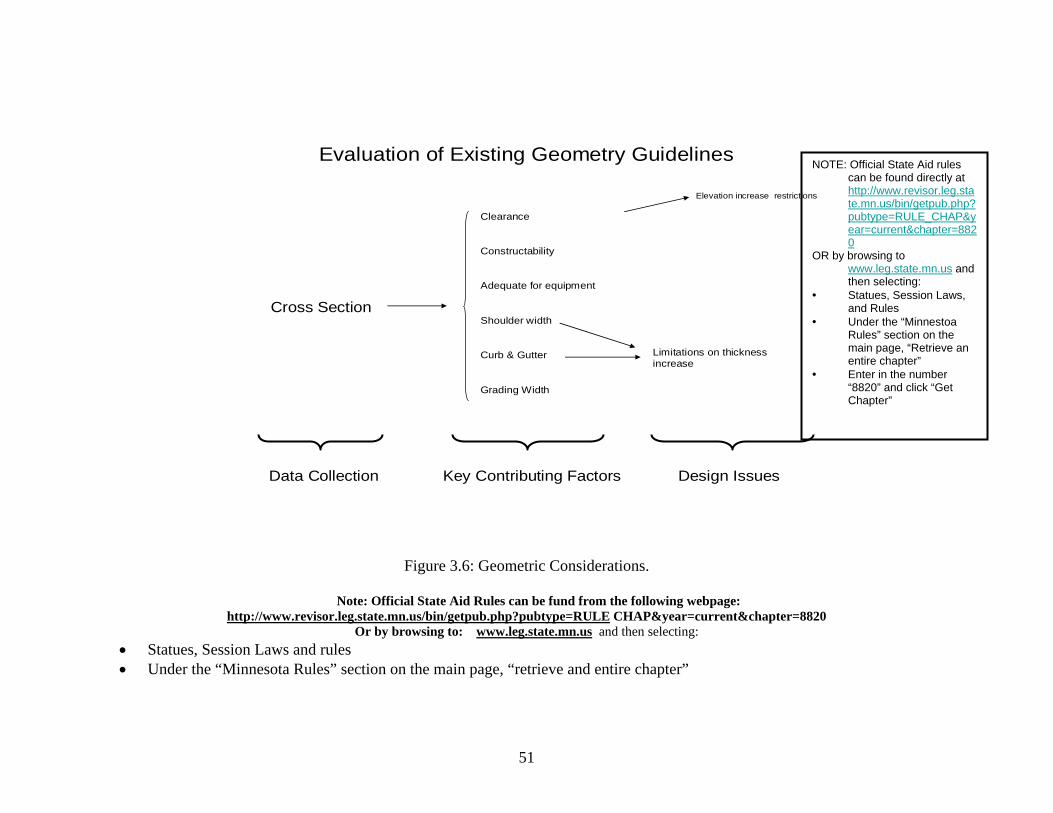
51
Evaluation of Existing Geometry Guidelines
Cross Section
Clearance
Elevation increase restrictions
Constructability
Adequate for equipment
Shoulder width
Curb & Gutter
Grading Width
Data Collection Key Contributing Factors Design Issues
Limitations on thickness increase
Figure 3.6: Geometric Considerations.
Note: Official State Aid Rules can be fund from the following webpage:
http://www.revisor.leg.state.mn.us/bin/getpub.php?pubtype=RULE CHAP&year=current&chapter=8820 Or by browsing to: www.leg.state.mn.us and then selecting:
• Statues, Session Laws and rules • Under the “Minnesota Rules” section on the main page, “retrieve and entire chapter”
NOTE: Official State Aid rules can be found directly at http://www.revisor.leg.state.mn.us/bin/getpub.php?pubtype=RULE_CHAP&year=current&chapter=8820
OR by browsing to www.leg.state.mn.us and then selecting:
• Statues, Session Laws, and Rules
• Under the “Minnestoa Rules” section on the main page, “Retrieve an entire chapter”
• Enter in the number “8820” and click “Get Chapter”
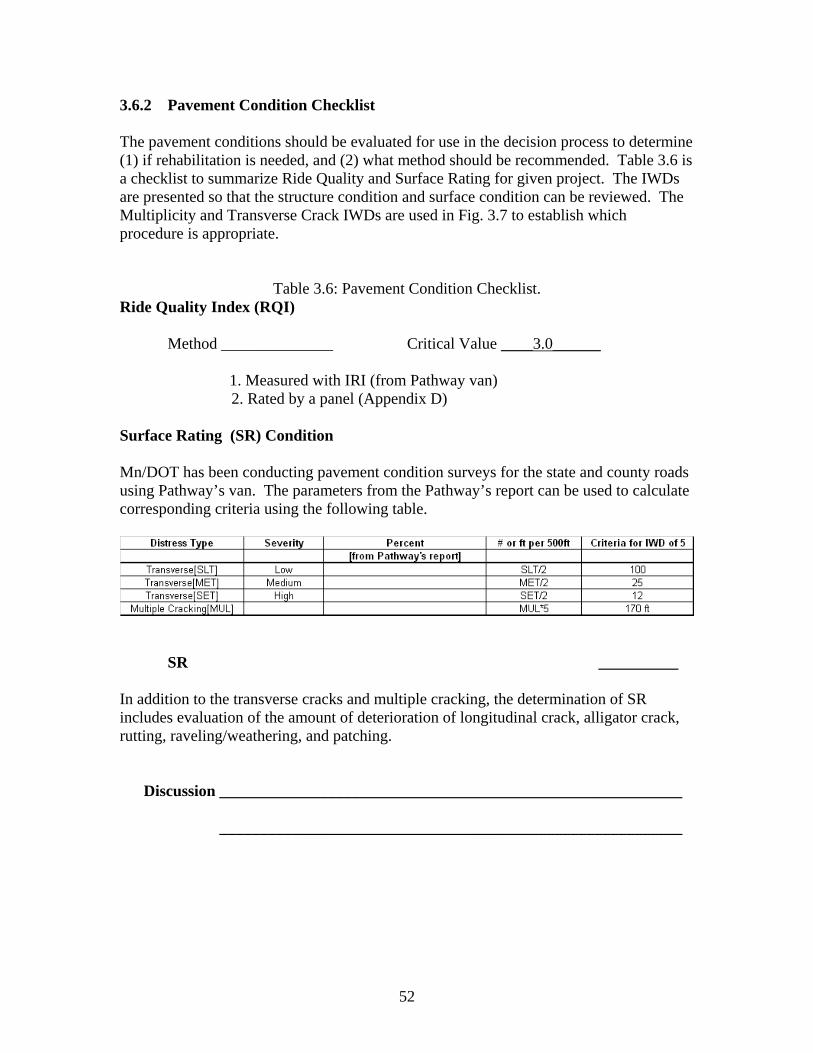
52
3.6.2 Pavement Condition Checklist The pavement conditions should be evaluated for use in the decision process to determine (1) if rehabilitation is needed, and (2) what method should be recommended. Table 3.6 is a checklist to summarize Ride Quality and Surface Rating for given project. The IWDs are presented so that the structure condition and surface condition can be reviewed. The Multiplicity and Transverse Crack IWDs are used in Fig. 3.7 to establish which procedure is appropriate.
Table 3.6: Pavement Condition Checklist. Ride Quality Index (RQI) Method ______________ Critical Value ____3.0______
1. Measured with IRI (from Pathway van) 2. Rated by a panel (Appendix D)
Surface Rating (SR) Condition Mn/DOT has been conducting pavement condition surveys for the state and county roads using Pathway’s van. The parameters from the Pathway’s report can be used to calculate corresponding criteria using the following table.
SR __________
In addition to the transverse cracks and multiple cracking, the determination of SR includes evaluation of the amount of deterioration of longitudinal crack, alligator crack, rutting, raveling/weathering, and patching.
Discussion __________________________________________________________ __________________________________________________________
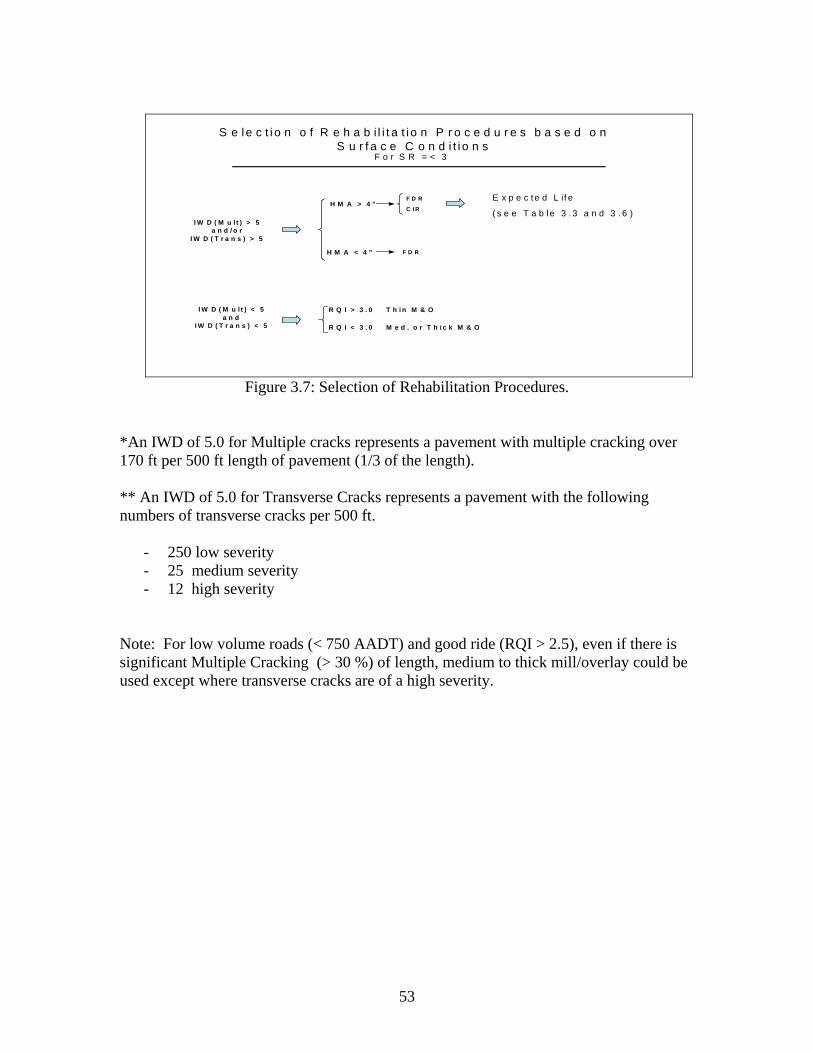
53
S e le c t i o n o f R e h a b i l i t a t i o n P r o c e d u r e s b a s e d o n
S u r f a c e C o n d i t i o n s
I W D ( M u l t ) > 5a n d / o r
I W D ( T r a n s ) > 5
H M A > 4 ”F D R
C IR
H M A < 4 ” F D R
I W D ( M u l t ) < 5a n d
I W D ( T r a n s ) < 5
R Q I > 3 . 0 T h i n M & O
R Q I < 3 . 0 M e d . o r T h i c k M & O
F o r S R = < 3
E x p e c te d L if e
( s e e T a b le 3 .3 a n d 3 . 6 )
Figure 3.7: Selection of Rehabilitation Procedures.
*An IWD of 5.0 for Multiple cracks represents a pavement with multiple cracking over 170 ft per 500 ft length of pavement (1/3 of the length). ** An IWD of 5.0 for Transverse Cracks represents a pavement with the following numbers of transverse cracks per 500 ft.
- 250 low severity - 25 medium severity - 12 high severity
Note: For low volume roads (< 750 AADT) and good ride (RQI > 2.5), even if there is significant Multiple Cracking (> 30 %) of length, medium to thick mill/overlay could be used except where transverse cracks are of a high severity.
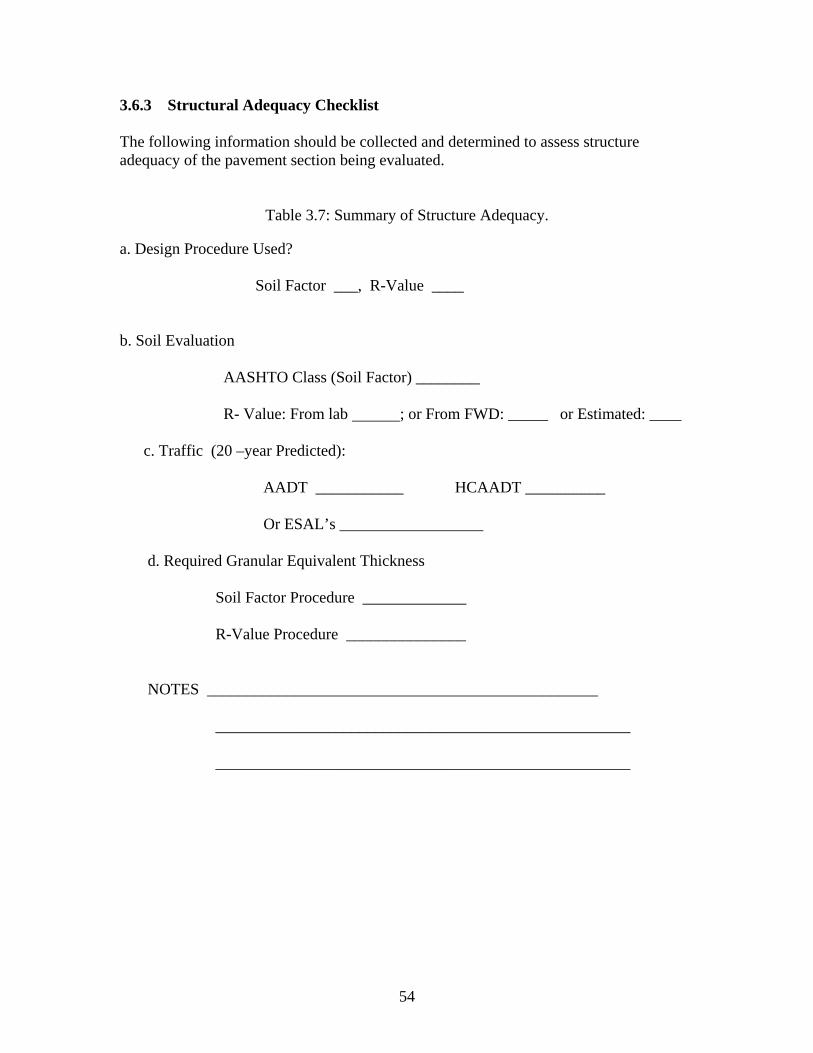
54
3.6.3 Structural Adequacy Checklist
The following information should be collected and determined to assess structure adequacy of the pavement section being evaluated.
Table 3.7: Summary of Structure Adequacy.
a. Design Procedure Used? Soil Factor ___, R-Value ____ b. Soil Evaluation
AASHTO Class (Soil Factor) ________ R- Value: From lab ; or From FWD: _____ or Estimated: ____
c. Traffic (20 –year Predicted):
AADT ___________ HCAADT __________ Or ESAL’s __________________
d. Required Granular Equivalent Thickness
Soil Factor Procedure _____________ R-Value Procedure _______________
NOTES _________________________________________________ ____________________________________________________ ____________________________________________________
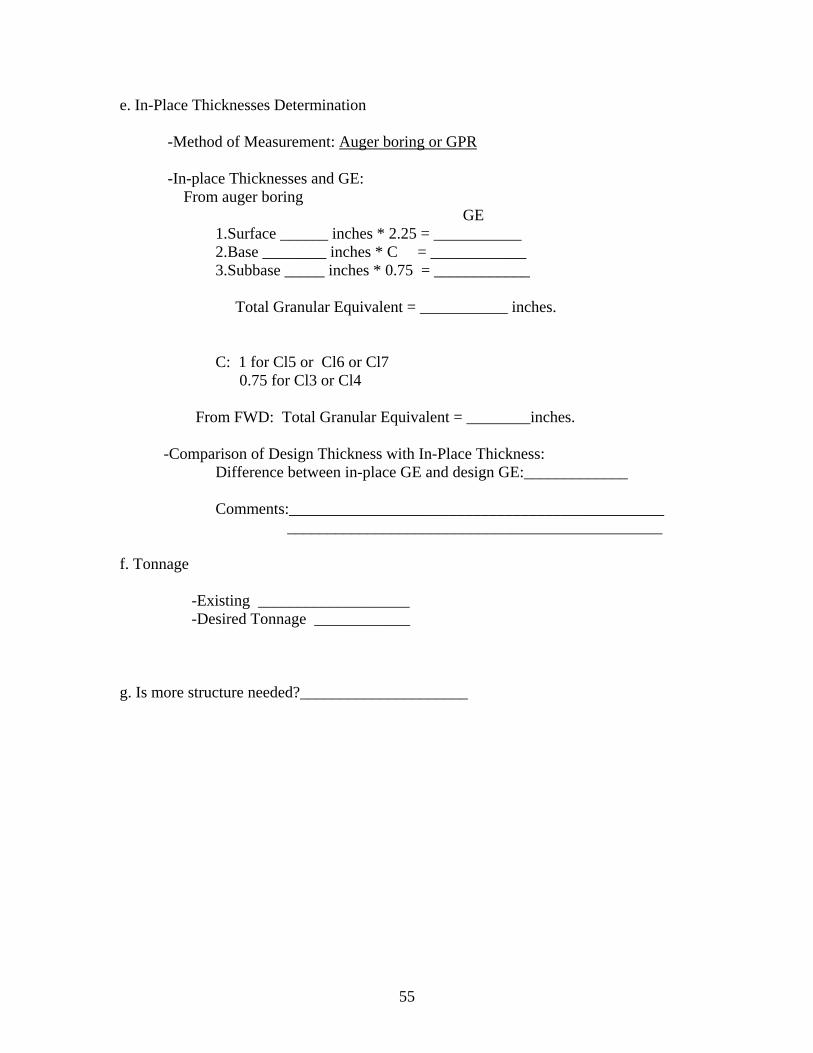
55
e. In-Place Thicknesses Determination
-Method of Measurement: Auger boring or GPR -In-place Thicknesses and GE: From auger boring GE
1.Surface ______ inches * 2.25 = ___________ 2.Base ________ inches * C = ____________ 3.Subbase _____ inches * 0.75 = ____________ Total Granular Equivalent = ___________ inches. C: 1 for Cl5 or Cl6 or Cl7 0.75 for Cl3 or Cl4
From FWD: Total Granular Equivalent = ________inches.
-Comparison of Design Thickness with In-Place Thickness:
Difference between in-place GE and design GE:_____________ Comments:_______________________________________________ _______________________________________________ f. Tonnage
-Existing ___________________ -Desired Tonnage ____________
g. Is more structure needed?_____________________
56
3.7 Summary
This Chapter presents criteria that should be considered when making the decision whether to rehabilitate with:
• Mill and HMA overlay {thin, 0-2in.}, {medium, 2-4 in.}, or {thick, > 4 in.} overlay.
• Cold In-place Recycling (CIR) • Full Depth Reclamation (FDR)
In general, pavement structure and surface conditions should be evaluated before deciding a rehabilitation strategy. For the pavement structure evaluation, it is recommended that the following specific conditions be considered: 1. Is the existing pavement HMA thickness adequate to support CIR construction
equipment (greater than 4.0 in.)? 2. Is the existing subgrade stiffness adequate to support CIR construction equipment
(over 5000 psi)? The structural adequacy of a pavement section normally can be determined by:
i. Obtaining the existing GE and comparing it to the required GE from either the Soil Factor or R-Value design procedures, with thicknesses measured or estimated with predicted traffic.
ii. Measuring pavement section and soil stiffness using Falling Weight Deflectometer (FWD) results on the pavement section. Areas of insufficient stiffness should be noted and special construction procedures should be used.
iii. If the total rut depth is greater than 0.5 in. for over 170 ft in 500 ft, the HMA mixture is not stable enough for the traffic or the pavement section is too thin (Table 3.2).
iv. If alligator cracking occurs over 280 ft in 500 ft, the structure is not adequate. v. The tonnage of the roadway needs to be increased (Table 3.7).
If the pavement section is not structurally adequate, then CIR should not be used for rehabilitation. The structural adequacy can only be increased using Full Depth Reclamation with appropriate thickness of overlay. Cold In-Place Recycling should only be used for improving Functional Conditions such as Rideability (RQI) (Table 3.6), unless an overlay is designed to establish adequate structure. For the pavement surface condition evaluation, the Surface Rating degradation rate plotted in Fig. 3.3 and summarized in Table 3.3 should be considered when deciding which procedure to use. The values indicate the measured decrease in Surface Rating per year for projects in the Rehabilitation Database. It should be noted that the SR degradation curve is determined using a maximum of the past 14 years data. The degradation rates will be more reliable as more data are obtained in subsequent years and
57
performance is measured using construction with up-dated specifications. In general, the following criteria are recommended for selection of rehabilitation method:
1. If the Surface Rating is less than 3 and: a. The IWD of Multiple cracking and/or transverse cracking is greater than 5, then
mill and overlay should not be used; b. If existing HMA thickness is greater than 4 in., use FDR or CIR; c. If existing HMA thickness is less than 4 in., use FDR only. 2. If the Surface Rating is less than 3, but IWD of Multiple cracking and transverse
cracking is less than 5, then thin mill/overlay is recommended if RQI is greater than 3; if RQI is less than 3, medium or thick mill/overlay is recommended.
Note: The critical IWD of Multiple cracking and Transverse cracking rating represent a pavement with:
A. 170 ft of multiple cracking in 500 ft or about 1/3 of the length. Examples of multiple cracking are shown in Figs. 17-19 of Mn/DOT Pavement Distress Manual (19).
B. All low severity transverse cracks representing a crack count of 100 cracks per 500 ft (5- ft spacing).
C. All medium severity transverse cracks representing a crack count of 25 cracks per 500 ft (20 ft spacing).
D. All high severity transverse cracks representing a crack count of 12 cracks per 500 ft (40 ft spacing).
However, for low volume roads (< 750 AADT) and good ride (RQI > 2.5), even if there is significant Multiple Cracking (>30 %) of length, medium to thick mill/overlay could be used except where transverse cracks are of a high severity.
58
Chapter 4 Trial Implementation
4.1 Introduction
Chapter 4 describes a trial implementation of decision procedures developed in Chapter 3. The decision procedure was distributed to the Mn/DOT district materials engineers and presented at the materials engineers’ meeting on April 25, 2007. The procedure and checklists developed previously were included in the discussions. Six county engineers around the State of Minnesota, who have been working with the various rehabilitation options, were contacted and were asked to use 1 or 2 projects as examples for the trial implementation to evaluate the criteria and the checklists. The research team visited six counties from July 26 - August 22, 2007 and received feedback and comments from the county engineers. A number of additional ideas were obtained from each visit. The comments (items) were reviewed and summarized to see what parameters and conditions were missing. Improvement of the selection procedure was the primary goal of the discussions. The following people were contacted: Mn/DOT, Pavement Management Section David Janisch Mn/DOT, Pavement Management Section Erland Lukanen Mn/DOT, District 2 Graig Gilbertson Mn/DOT, District 4 Perry Collins Pope County Brian Noeltzeman Carlton County Wayne Olson Milt Hagen Becker County Brad Wentz Brian Shepard Ramsey County Kathy Jaschke Le Seur County Darrell Pettis Olmsted County Curt Bolles American Engineering and Testing David Rettner SEM Materials DanWegman
59
4.2 Summary of Discussions The checklists for selecting the best procedure to use for a given set of conditions were reviewed. The following is a summary of the comments:
1. When using the database to predict performance, the following precautions should be considered:
- Mn/DOT projects should be noted by District, as each District had some specific differences.
- Old and new projects should be considered separately if specifications have been changed.
- Performance of specific sections may be affected by maintenance patching and other activities that influence ride.
- Preventative maintenance applications such as fog seals may affect performance - Thin mill & overlay (< 2 in.) are considered preventative maintenance, but can
significantly affect ride and crack patterns. Normally, a pavement scheduled for thin mill and overlay was in relatively good condition. Therefore, sections with thin mill and overlay showed relatively good performance compared to medium mill and overlay.
- The individual deterioration rates of projects should be averaged and a standard deviation calculated to present a realistic view of performance.
- Given projects may have been constructed under variable weather or materials conditions. If adverse conditions were encountered, these should be noted in the database because these can affect performance.
2. Some agencies have used a stabilizing agent for FDR projects. Two of the liquid
agents are engineered asphalt emulsions and Base 1. Dry stabilizing agents such as fly ash or lime have also been used. When a stabilizing agent is used, it should be noted. It is suggested that a study be conducted to establish GE factors for stabilized FDR material. The properties of the stabilized base can be measured using the Falling Weight Deflectometer (FWD). The calculated stiffness will indicate what the GE factor of the base course might be. When a stabilizer is used, it should be noted in the database to evaluate the relative performance and GE factor.
3. When making the decision for using mill and overlay versus FDR or CIR,
longitudinal cracking and its severity should be considered in addition to multiple cracking and transverse cracking.
4. For low volume roads (< 750 AADT) and good ride (PSR > 2.5), even if there is
significant Multiple Cracking (>30 %) of length, medium to thick mill/overlay could be used except where transverse cracks are of a high severity.
5. For areas with < 0.5 in. rut depth, either mill between wheel paths or fill ruts with
a fine HMA.
60
6. If there are many driveways or other appurtenances, then mill and overlay may be considered when CIR or FDR are being considered. The time required to match up and pave driveway ends becomes prohibitive.
7. If the pavement is “out of shape,” CIR or FDR will make it easier to reestablish
the crown because the whole section is being reshaped. 8. Reconstruction can cost more than CIR and FDR. Mill and overlay will generally
cost less than CIR or FDR. The construction budgets should be considered when making decisions.
9. When performing FDR or CIR, plan to recycle only once. The structural
adequacy should be evaluated and designed into the initial project. 10. When mill and overlay, CIR or FDR are being considered, check to see if crumb
rubber has been used as a crack sealant. Crumb rubber is very difficult to work with when crushing for CIR or FDR, and almost impossible to break up with recycling machinery.
The checklists were up-dated using these comments and considerations. The comments were also used to develop the “Best Practices” presented in Chapter 5. A checklist for the pavement rehabilitation decision procedure was developed, which is included in Appendix E.

61
Chapter 5 Development of Best Practices
5.1 Introduction The purpose of this Chapter is to document the best practices of rehabilitation for design and construction. Approximately 120 projects, which have used Milling and Overlay (M&O), Cold-in-Place Recycling (CIR) and Full Depth Reclamation (FDR) were located and entered in a database. District material engineers and county staffs were consulted to determine what factors are used to select a given procedure. Parameters to use for selecting the rehabilitation procedure are defined in Chapter 2. The parameters for system analysis are:
• Ride Quality Index (RQI) • Surface Condition (SR)
o Crack Type and Severity o Rut Depth
• Pavement Quality Index (PQI). The PQI is a numerical rating that considers a number of factors to give an overall ranking of a pavement to establish rehabilitation priorities. A PQI of 2.5 is generally considered a level at which some rehabilitation is needed. The selection of an appropriate procedure to use is based on specific distresses for an individual project. The amount and severity of transverse cracking, multiple cracking, and rutting are used to establish the appropriate procedure. It is also necessary to design and construct the project using mixture design and construction procedures that will result in good performance. In this Chapter, the best practices are presented for 1. selection of rehabilitation method, 2. pavement thickness design, 3. materials and mixture design, and 4. construction specifications. Each of these items uses concepts, procedures and parameters that are available to agency engineers in Minnesota.
5.2 Selection Criteria One of the purposes of the project was to develop criteria for engineers to use in selecting which method should be used for rehabilitation. There are several potential methods for rehabilitating a project including:
62
1. Mill & Overlay (M&O) 2. Cold-In-place Recycle (CIR) 3. Full Depth Reclamation (FDR)
The best procedures to use for determining the appropriate rehabilitation method depend on the parameters defined in Chapter 2. The conditions used to determine the appropriate method are (1) the pavements in most need of rehabilitation, and (2) what design will be suitable for the existing subsoil and traffic conditions. First of all, the system analysis should be conducted to rate the existing pavement’s functional adequacy and geometrics (including cross section) and performance in a general but consistent way to determine which pavements are in most need of rehabilitation. The pavement condition and performance should be rated in a systematic and consistent manner. In Minnesota, the parameter used for system analysis is the Pavement Quality Index (PQI). The PQI is the square root of the Ride Quality Index (RQI) multiplied by the Surface Rating (SR). The RQI is defined as the average rating of ride on a scale from 0 - 5. The rating is correlated with the International Roughness Index (IRI) calculated from the longitudinal profile of the pavement that is measured with the Pathway’s van. The parameters for Surface Rating (SR) project analysis are:
1. Transverse cracks (number by severity) 2. Longitudinal cracks (percent of centerline length by severity) 3. Multiple cracking (% of centerline length) 4. Alligator cracking (% of centerline length) 5. Rutting (% of centerline length with >0.5 in.) 6. Raveling and weathering (% of centerline length) 7. Patching (% of centerline length)
These conditions are defined and illustrated in the Mn/DOT Distress Identification Manual (19). The method for calculating the SR by calculating Individual Weighted Distresses (IWD’s) and methods of defining Individual Weighted Distresses (IWD) are presented in the Distress Identification Manual and summarized in Chapter 3. In general, if the SR is less than 3.0, the pavement can be considered as a rehabilitation candidate. Once a pavement rehabilitation candidate is selected, the pavement should be evaluated in terms of structural adequacy, which is defined using the:
1. Tonnage - based on soil type and thickness of pavement (GE) - based on FWD testing with the TONN program 2. Pavement thickness versus required design (in-place GE vs design GE) - based on measured thickness (coring) - based on FWD testing (deflection basin) 3. Falling Weight Deflectometer (FWD) analysis
63
The advantage of using the FWD analysis is the tests can be conducted every 500 ft to show the variation of soil and GE thicknesses along a project. Weak areas may then be improved. Specific criteria for each procedure are presented in Chapter 3.
5.3 Pavement Thickness Design
In Minnesota, flexible pavements are designed using the Soil Factor or R-Value. The mechanistic design (MnPAVE) procedure can be used for verification. The Soil Factor and R-Value are the current procedures, which are presented in the Mn/DOT State Aid Manual and the Pavement Design Manual respectively. The detailed design procedures are included in Appendix A. The following lists are a summary of thickness designs recommended for either the Soil Factor or R-Value procedures. 5.3.1 Thickness Design for Mill and Overlay Projects The following steps and procedures are recommended for thickness design of mill and overlay projects in Minnesota.
a. Conduct GPR testing to determine where changes in asphalt thickness occur. GPR might also detect where changes in materials and/or moisture conditions take place along the project.
b. Conduct FWD tests and use results to calculate an in-place R-Value and GE values to determine the in-place pavement section.
c. Determine the in-place pavement section using auger borings or asphalt coring with DCP testing every 500 ft if GPR and FWD testing is not done or where there are apparent changes in conditions indicated by GPR and FWD testing.
d. Conduct soil classification and/or R-Value tests to determine the soil design parameters for the project.
e. Determine the 20-year projected two-way AADT for soil factor design or 20-year predicted ESAL’s for R-Value design.
f. Use the R-Value design for Mn/DOT and 10-ton county roads. g. Use the Soil Factor design for low volume county 7 and 9-ton roads. h. Calculate the added thickness of HMA overlay using a GE factor of 2.25 for the
HMA thickness if Mn/DOT specification 2360 is used. GE factors listed in the Soil Factor and R-Value design procedures should be used for other layers.
5.3.2 Thickness Design for Cold in Place Recycling (CIR)
The following steps and procedures are recommended for thickness design of CIR projects in Minnesota.
a. Conduct GPR testing to determine where changes in materials and/or moisture conditions occur along a project.
b. Conduct FWD tests and use results to calculate in-place R-Value and GE values to determine in-place pavement section.
64
c. Determine the in-place pavement section using auger borings or asphalt coring with DCP testing every 500 ft if GPR and FWD testing is not done or where there are apparent changes in conditions indicated by GPR and FWD testing.
d. Conduct soil classification and/or R-Value tests to determine the soil design parameters for the project.
e. Determine 20-year projected two-way AADT for soil factor design or 20-year predicted ESAL’s for R-Value design.
f. Use the R-Value for Mn/DOT and 10-ton county roads. g. Use the Soil Factor for low volume county 7 and 9-ton county roads. h. Calculate thickness of HMA required using a GE factor of 2.25 for the HMA
thickness and GE factor of 1.25 - 1.50 for the CIR layer. GE factors for other layers should be as listed on the Soil Factor and R-Value design procedures.
5.3.3 Thickness Design for Full Depth Reclamation (FDR)
The following steps and procedures are recommended for thickness design of FDR projects in Minnesota.
a. Conduct GPR testing to determine where changes in materials and/or moisture
conditions occur along a project. b. Conduct FWD tests and use the results to calculate an in-place R-Value and GE to
determine the in-place pavement section. c. Determine the in-place pavement section thicknesses and soil type using auger
borings or asphalt coring with DCP testing every 500 ft if GPR and FWD testing is not done or where there are apparent changes in conditions indicated by GPR and FWD testing.
d. Conduct soil classification and/or R-Value tests to determine the soil design parameters for the project.
e. Determine the 20-year projected two-way AADT for soil factor design or the 20-year predicted ESAL’s for R-Value design
f. Use the R-Value design for Mn/DOT and 10-ton county roads g. Use the Soil Factor design for low volume county 7 and 9-ton county roads. h. Calculate the thickness of HMA overlay required using a GE factor of 2.25 for the
HMA thickness if Mn/DOT specification 2360 is used. GE factors listed in the Soil Factor and R-Value design procedures should be used for the other layers. A GE factor of 1.0 should be used for the unstabilized reclaimed layer. Note: it is recommended that a field study be conducted to establish what the GE factor for this reclaimed layer.
5.4 Mixture Design and Construction Requirements Recently, more and more stabilization agents (engineering emulsion, fly ash, base one, etc.) have been used in rehabilitation construction. The mixtures used for rehabilitation procedures need to be designed with procedures, which will result in a strong and durable layer. The mixtures include Hot Mix Asphalt for mill and overlay projects, cold-in-place
65
Recycling (CIR) mixtures and recently stabilized full depth reclamation (FDR) mixtures. Currently, Mn/DOT does not have an official mixture design procedure for stabilized FDR; however, a proposed procedure is now being discussed. The procedures being considered include performance tests, including resilient modulus and indirect tension. They are very similar to the performance tests being developed for Superpave mixture design. For each process, the laboratory mixture design serves as an initial job mix formula. Adjustments are generally required during construction for workability, coating and stability. In this section, each of the mixture designs are referenced to Mn/DOT procedures, which are changed somewhat annually. The summaries presented are for the procedures available in 2007. Although the mixture designs for HMA, CIR and FDR materials are appled somewhat differently, the procedures are similar:
1. Obtain samples of RAP (or aggregate and RAP for HMA) from the field. 2. Determine RAP gradation, RAP binder content, gradation of extracted aggregate,
and aged binder properties. 3. Select amount and gradation of additional granular material, if required. 4. Select type and grade of recycling additive. 5. Estimate recycling additive demand. 6. Determine pre-mix moisture content for adequate coating. 7. Test trial mixtures: initial cure properties, final cure properties, and water
sensitivity. 8. Establish job mix formula. 9. Make adjustments in the field.
Samples of RAP must be representative of materials on the project. Standard AASHTO and ASTM procedures should be used for gradation, extraction and other properties. The PG grading of the recovered asphalt should be determined to check on the need for a rejuvenator. If excess asphalt binder is in the mixture, then some aggregate should be added. 5.4.1 Mill and Overlay Mixture Design In Minnesota, Hot Mix Asphalt mixture design is presented in Mn/DOT Specification 2360. The procedure generally follows the Superpave Design using PG graded asphalt cements and the gyratory compactor. The Mn/DOT specifications for Hot Mix Asphalt are available at the following website and improvements in the specifications will occur with time: www.mrr.dot.state.mn.us/pavement/bituminous/bituminous.asp
66
5.4.2 Cold In-Place Recycling (CIR) The Mixture Design procedure for CIR presented herein is a summary of Appendix 1 of Mn/DOT Special Provision 2331.604 (S-133.5). The special provisions for Cold-in-place Recycling can be found on the following website, provided by the Office of Technical Support: www.dot.state.mn.us/tecsup/prov/pdf/sp2005.pdf The mix design serves as an initial job mix formula, the same as for hot mix asphalt (HMA) construction. Field adjustments are generally required for workability, coating and stability. The detailed mixture design procedures can be found in the above document. The following is a brief summary of the current mixture design. Sampling and processing: a core should be taken to obtain representative samples of the material that will be recycled. Specimen preparation for mixture design: specimens should be 2.4 to 2.6 inches in height and be prepared using ASTM D2041 the Rice test. Number of specimens: four specimens per emulsion content for three emulsion contents giving a total of twelve specimens, six for long term stability and six for moisture testing. Two specimens are required for the Rice test at the highest emulsion content. Add moisture that is expected to be added at the milling head (1.5 - 2.5%). Add any other additives that are being considered. Mixing of test specimens shall be performed with a mechanical bucket mixer. Mix CIR/RAP with water first and then add emulsion and mix at ambient temperature. Compaction: specimens are to be compacted using a gyratory compactor in an unheated 100-mm mold at a 1.25 degree angle at 600 kPa ram pressure and 30 gyrations. Specimens should be extruded immediately after compaction. Curing after compaction: specimens are to be cured in a 140ºF oven with ventilation. Rice specimens should be cured to a constant weight. Measurements: determine bulk specific gravity according to ASTM D2726; specimens in water can be recorded after one minute. Determine air voids for each emulsion content. Determine corrected Marshall stability by ASTM D1559 at 40oC (104oF) after 2 hour temperature condition. This testing shall be performed at the same time that the moisture conditioned specimens are tested. Moisture susceptibility: Perform same conditioning and volumetric measurements on moisture-conditioned specimens as on other specimens. Vacuum saturate to 55 - 75% and soak at 77oF for 23 hours. The retained stability is the average moisture conditioned specimen strength divided by the average dry specimen strength.
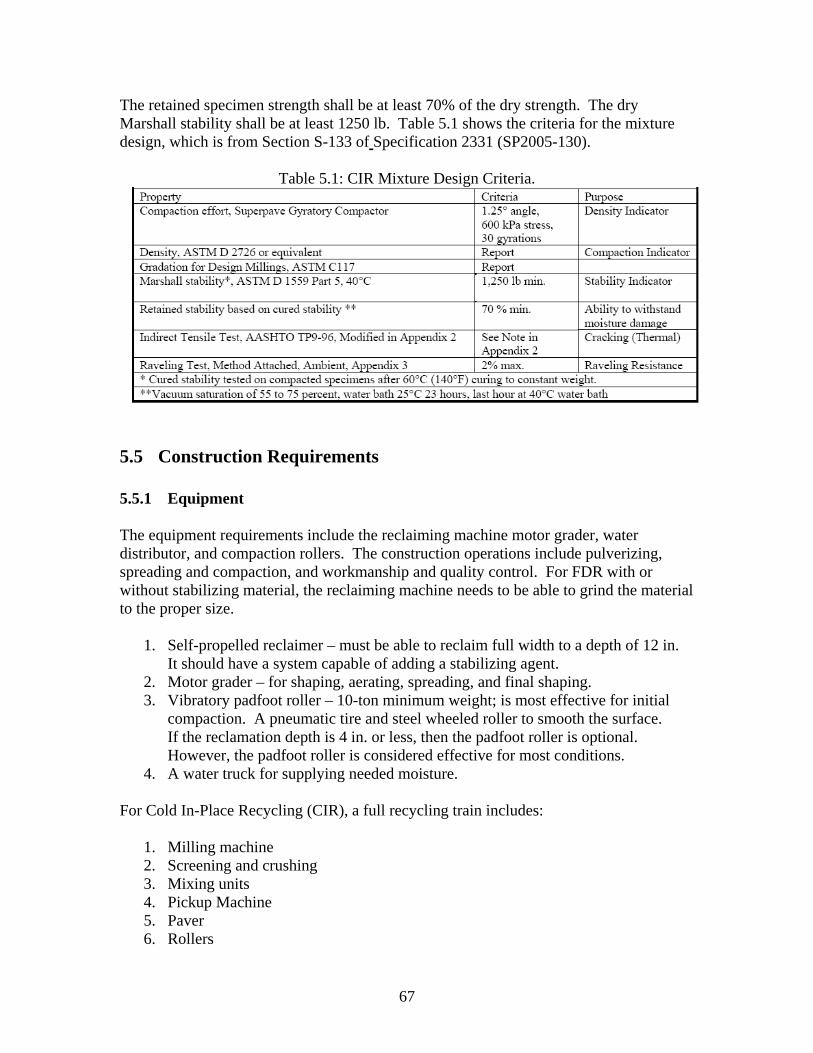
67
The retained specimen strength shall be at least 70% of the dry strength. The dry Marshall stability shall be at least 1250 lb. Table 5.1 shows the criteria for the mixture design, which is from Section S-133 of Specification 2331 (SP2005-130).
Table 5.1: CIR Mixture Design Criteria.
5.5 Construction Requirements
5.5.1 Equipment The equipment requirements include the reclaiming machine motor grader, water distributor, and compaction rollers. The construction operations include pulverizing, spreading and compaction, and workmanship and quality control. For FDR with or without stabilizing material, the reclaiming machine needs to be able to grind the material to the proper size.
1. Self-propelled reclaimer – must be able to reclaim full width to a depth of 12 in. It should have a system capable of adding a stabilizing agent.
2. Motor grader – for shaping, aerating, spreading, and final shaping. 3. Vibratory padfoot roller – 10-ton minimum weight; is most effective for initial
compaction. A pneumatic tire and steel wheeled roller to smooth the surface. If the reclamation depth is 4 in. or less, then the padfoot roller is optional. However, the padfoot roller is considered effective for most conditions.
4. A water truck for supplying needed moisture.
For Cold In-Place Recycling (CIR), a full recycling train includes: 1. Milling machine 2. Screening and crushing 3. Mixing units 4. Pickup Machine 5. Paver 6. Rollers
68
7. Distributor 8. Broom
Construction requirements are presented in Special Provisions 2331,S-131.2 and S133. 5.5.2 Construction Methods Work shall not proceed in rain and weather forecasts shall not call for freezing temperatures for 7 days.
1. Pre-shaping – correct for profile, crown and contour before application of emulsion or add rock. Depth of reclamation shall be monitored regularly. Gradation requirements must also be met.
2. Reclaiming – Moisture content must be within 1% of design. 3. Initial compaction – Initial compaction should be started within 500 ft of the
reclaimer. Compaction should be continued until the vibratory pad foot compacter “walks out” of the material. A test strip with nuclear or other density measurements should be established once per day.
4. Shaping – A motor grader should be used to take out marks from the pad foot roller. A pneumatic or steel-wheeled roller should be used for final compaction. Vibration should not be used for final compaction.
5. The contractor should test the reclaimed layer for adequate compaction using the dynamic cone penetrometer (DCP).
6. Agency QA should include DCP testing according to Mn/DOT 5-692.255 from the Grading and Base Manual. The penetration index should be less than 0.5 inches per blow and the seating value less than 2 in. for the initial (seating) blow. Layer thicknesses for the DCP test shall be 4 in. minimum and 6 in. maximum.
7. Proof rolling should be used for final approval by the Engineer. 8. Before placing HMA surfacing, the reclaimed base should be allowed to cure
until the moisture content is less than 2.5%. The reclaimed base should be covered with the HMA surface before winter.
5.5.3 Quality and Workmanship Procedures for a given project should be set before the start of the project. A representative of the stabilizing agent manufacturer should also be consulted and be available if needed. Quality should include the following activities, which should be reported to the Engineer daily.
1. Stabilizing agent – various agents such as asphalt emulsions, fly ash, lime, base-1 or other material(s).
2. Add rock – spread rate should be checked and conform to quantity in mix design. 3. Maximum material size (2.0 in.). 4. Moisture content – should be checked after compaction. 5. Emulsion content – use mix design unless adjusted in the field. 6. Depth control – check and adjust as needed.

69
7. Compaction – a. no density measurements: use proof rolling with no evidence of consolidation. b. if density measurements are required, use the test strip option or modified
Proctor Density Option as presented in Special Provisions. 8. Reclaimed base contour and profile – methods and tolerances indicated on plans
or as required by the Engineer. Summaries of the Mn/DOT Special Provisions for the Mixture Design and Construction of Full Depth Reclamation and Cold In-place Recycling projects have been presented. The recommendations have been general so that specific conditions and materials can be considered.
5.6 Summary
Best Practices for Pavement Rehabilitation projects in Minnesota have been presented in this chapter. Best Practices are presented for:
1. Selection of rehabilitation method 2. Pavement thickness design 3. Materials mixture design and construction
70
Chapter 6 Summary and Recommendations
Many roadways have been built in Minnesota over the past years and to various degrees need some type of rehabilitation to keep them serviceable. Three methods have been used: (1) mill or no mill and overlay (M&O), (2) cold in-place recycling (CIR), and (3) full depth reclamation (FDR) with or without stabilization. Other choices would be completely rebuilding the roadway or do nothing. The primary objective of this project was to establish best practices for selection of one of the three procedures given a set of conditions; once the procedure is decided, guidelines are outlined to design and build the project. Several tasks were performed to accomplish the goals. About 200 projects were located, and the design, construction, and performance information from these projects were collected and entered into a database. Parameters measured and used by Mn/DOT are:
• Cracking (transverse, longitudinal, block and alligator) • Ride, (RQI) • Rutting • Age • Thicknesses • Traffic
The Ride Quality Index (RQI) and Surface Rating (SR) measured with the Mn/DOT Pathways van are used to calculate the Pavement Quality Index (PQI) and define the condition of the pavement. Alternate procedures are presented for determining the conditions. Procedures for obtaining these parameters are presented in Chapter 2. A decision procedure based on preliminary analysis of information in the database was developed and presented in Chapter 3. The procedure is summarized in the following checklists:
• Geometrics • Pavement conditions • Structural adequacy evaluation
A checklist is presented to provide engineers a tool to follow the decision procedure. Trial implementation of the decision procedure wase conducted by the research team using visits to several counties and Mn/DOT districts. Chapter 4 presents the results of these visits. Chapter 5 discusses best practices for procedure selection, design evaluation, mix design, and construction procedures. Construction procedures have improved over the past few years and these should be documented for comparison with performance. In addition, more stabilized base materials have been used. As a result, the stiffness and strength of the FDR materials could be higher. It is recommended that a study be conducted to
71
determine structural stiffness of both stabilized and unstabilized FDR for pavement design. Continued monitoring of the conditions of pavements with M&O, CIR and FDR will help document performance. Recommendations
1. Continue to document the following: - location; - condition and structural adequacy and conditions before construction; - date of construction; - ride, surface rating, and traffic (periodically) to document performance; - enter this information into the database, which should be compatible with the
Mn/DOT Pavement Management database; and - the information should be obtained using standard Mn/DOT procedures so
that it is interchangeable with current data. 2. The deterioration rate of given parameters for specific projects should be
determined individually. The effectiveness of all M&O (thin, medium and thick), CIR, and FDR projects can be evaluated separately by determining the average and standard deviations of the deterioration rate. Any conditions that could affect performance should be noted. The overall performance of a given procedure can then be determined by noting the relative rates.
3. When a project is being designed, samples of the materials to be recycled should be obtained and mix designs conducted for CIR and stabilized FDR projects. Mixture designs should include measures of stiffness, moisture susceptibility, and resistance to abrasion.
4. Current Mn/DOT procedures and specifications with current special provisions should be used.
5. Only contractors with experience and a good track record constructing CIR and/or FDR projects should be hired for constructing the projects.
6. The Falling Weight Deflectometer (FWD) deflection basins should be used for measuring stiffness of the pavement layers, before and after construction. The results can also be used to evaluate the tonnage capacity of the roadway.
The performance of the in-place projects can then be used to establish the cost effectiveness of the various procedures.
72
References 1. Asphalt Recycling and Reclaiming Association, U.S. Department of Transportation,
and the Federal Highway Administration. Basic Asphalt Recycling Manual.(BARM), 2001
2. Bemanian, S., Polish, P. and Maurer, G. Cold In-Place Recycling and Full Depth
Reclamation in Nevada. Nevada Department of Transportation. July 2005. 15 pgs. 3. Hoffman, M.S. A Direct Method for Evaluating the Structural Needs of Flexible
Pavements Based on FWD Deflections. TRB 2003. 13 pgs. 4. Lane, B. and Kazmierowski, T. Implementation of Cold In-Place Recycling with
Expanded Asphalt Technology in Canada. Ministry of Transportation Ontario. August 2004. 20 pgs.
5. Scullion, T. Implementation Project Summary Report 5-1712-01-S. Texas
Transportation Institute and The Texas A&M University System. July 2005. 6. Kandhal, P.S. and Mallick, R.B. “Pavement Recycling Guidelines for Local
Governments,” NCAT and FHWA, Publication No. FHWA-SA-97, 1997 7. Benanian, S., Polish, P. and Maurer, G. “Cold In-Place Recycling and Full Depth
Reclamation in Nevada,” Paper presented at 2006 Annual TRB Meeting, January, 2006.
8. Lane, B. and Kazmierowski, T. “Implementation of Cold In-Place Recycling with
Expanded Asphalt Technology in Canada,” Transportation Research Record 1905, Transportation Research Board of the National Academies, Washington, D.C. 2005.
9. Morian, D.A., Zhao, Y., Arellano, J., and Hall, D.E. “Asphalt Pavement
Rehabilitation Treatment: Analysis of 20 years of Performance,” Transportation Research Record 1905, Transportation Research Board of the National Academies, Washington, D.C., 2005
10. Jaschke, K. “Ramsey County Public Works Pavement Management Report,”
Published by Ramsey County, MN, February, 1999 11. “AASHO Interim Guide for Design of Pavement Structures,” American Association
of State Highway Officials, 1974. 12. “AASHTO Interim Guide for Design of Pavement Structures,” American
Association of State Highway and Transportation Officials, 1983.
73
13. “AASHTO Interim Guide for Design of Pavement Structures,” American Association of State Highway and Transportation Officials, 1992.
14. The Asphalt Institute Design of Asphalt Pavements, Manual Series No. 1, 1964. 15. Mn/DOT Geotechnical and Pavement Manual, 1994. 16. AASHO Road Test, Pavement Research Report, HRB Special Report 61E, 1962. 17. Kersten, M.S. and Skok, Jr., E.L., “Application of AASHO Road Test Results to
Design of Flexible Pavements in Minnesota,” MHD Investigation No. 183, Interim Report, 1968, University of Minnesota.
18. Haas, R.C.G., Hudson, W. R., and Zaniewski, J., “Modern Pavement Management,”
Krieger Publishing Co. Malabar, FL ,1994 19. Mn/DOT Pavement Management Unit, “Mn/DOT Distress Identification Manual,”
February, 2003. 20. Skok, G. and Clyne, T. “Best Practices for the Design and Construction of Low
Volume Roads,” Internal report, 2003.

Appendix A Thickness Design Procedures
A-1
There are three flexible pavement thickness design procedures now used in Minnesota. In addition, some pavements, especially at the local level, are designed by experience based on what has worked in the past. The three formal thickness design procedures are the Soil Factor Design found in the Mn/DOT State Aid Manual , the Stabilometer R-Value Design found in the Mn/DOT Geotechnical and Pavement Manual and MnPAVE, which is the mechanistic-empirical design procedure currently under development. The Soil Factor procedure was developed in the 1950’s and has been modified somewhat since then. Mn/DOT adopted the R-Value procedure in the early 1970’s. The traffic prediction for each of the procedures can be found from the Mn/DOT State Aid Manual.
A.1 Soil Factor Design Since 1954, some pavements in Minnesota have been designed using a table similar to Fig. A.1. This is the 2001 version from the State Aid Manual that uses English and metric units. The chart uses seven traffic categories based on 20-year projected two-way AADT and HCADT and eight embankment types using the AASHTO classification system. Thickness in terms of Granular Equivalent (GE) is determined for each level of traffic and soil type. Each design also has a specified maximum spring axle load. The traffic factors are Average Daily Traffic (ADT) and Heavy Commercial Average Daily Traffic (HCADT). The ADT and HCADT are both two-way values. The ADT includes all vehicles and the HCADT is defined as all trucks with six or more tires; thus HCADT does not include cars, small pickups, and panel-type trucks. The ADT and HCADT normally used for design are values predicted for 20 years into the future. Local conditions must be considered and the predicted value may either be increased or decreased based on the projected future use of the road.
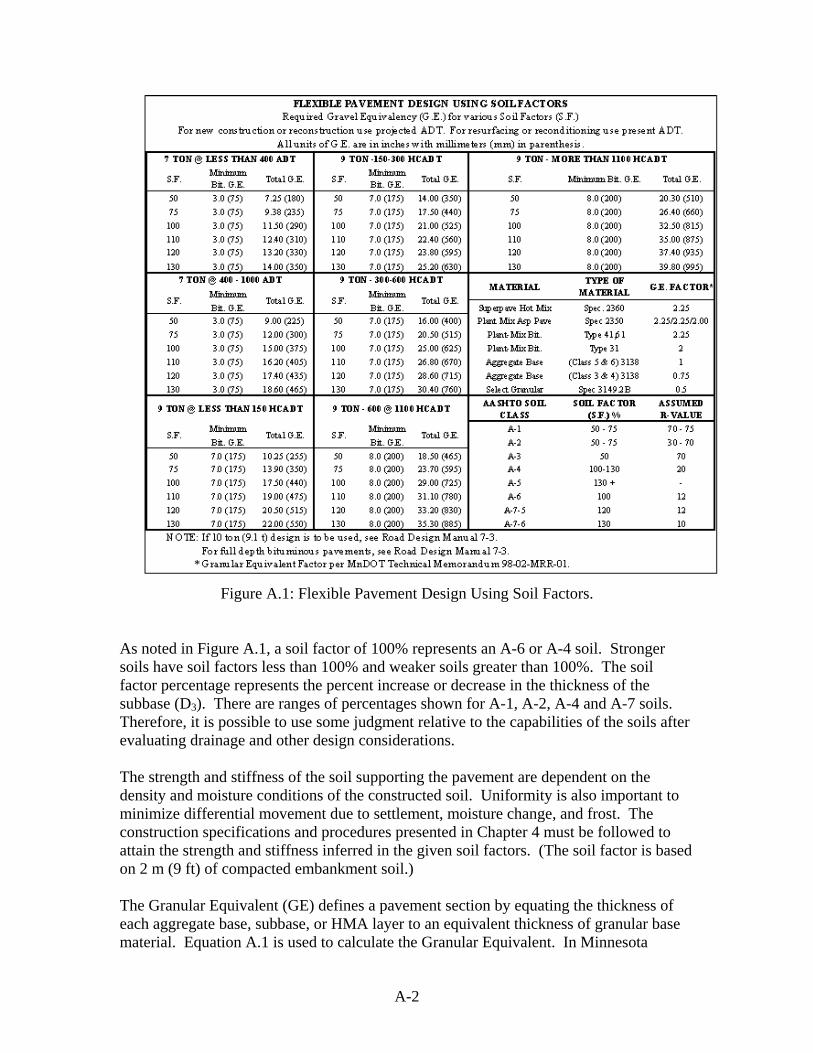
A-2
Figure A.1: Flexible Pavement Design Using Soil Factors.
As noted in Figure A.1, a soil factor of 100% represents an A-6 or A-4 soil. Stronger soils have soil factors less than 100% and weaker soils greater than 100%. The soil factor percentage represents the percent increase or decrease in the thickness of the subbase (D3). There are ranges of percentages shown for A-1, A-2, A-4 and A-7 soils. Therefore, it is possible to use some judgment relative to the capabilities of the soils after evaluating drainage and other design considerations. The strength and stiffness of the soil supporting the pavement are dependent on the density and moisture conditions of the constructed soil. Uniformity is also important to minimize differential movement due to settlement, moisture change, and frost. The construction specifications and procedures presented in Chapter 4 must be followed to attain the strength and stiffness inferred in the given soil factors. (The soil factor is based on 2 m (9 ft) of compacted embankment soil.) The Granular Equivalent (GE) defines a pavement section by equating the thickness of each aggregate base, subbase, or HMA layer to an equivalent thickness of granular base material. Equation A.1 is used to calculate the Granular Equivalent. In Minnesota
A-3
Specification 3139, Class 5 or 6 was assigned a GE of 1.0 and all other materials are referenced to this value. The relevant specifications for the other pavement materials are listed in Fig. A.1. Minimum bituminous and total granular equivalents are also shown for each traffic category. GE = a1D1 + a2D2 + a3D3 + … (A.1)
where D1 = thickness of asphalt mix surface, in. (mm) D2 = thickness of granular base course, in. (mm) D3 = thickness of granular subbase course, in. (mm) a1, a2, and a3 = GE Factors listed in Figure 1.
The required design thicknesses are listed in two categories (minimum bituminous GE and total GE). The maximum granular base thickness can be calculated by subtracting the minimum bituminous GE from the total GE. Other design combinations of bituminous and granular materials can be determined using the GE factors. The respective specifications and construction procedures necessary to attain the material characteristics defined for the soil factor design are presented in the Best Practices Manual.
A.2 Stabilometer R–Value Design The Stabilometer R-Value is the current design procedure used by Mn/DOT to determine the design thickness of an HMA surfaced pavement. This procedure is based on research done in Minnesota during the 1960’s which applied the results from the AASHO Road Test conducted in Illinois between 1958 and 1960.. The basis of the design is limiting spring deflections for a 9-ton design axle load by increasing the strength (stiffness) of the soil or by increasing the strength (stiffness) of the pavement layers for a given level of traffic. Figure A.2 is the R-Value design chart from the Mn/DOT Geotechnical and Pavement Manual . The embankment R-Value can be measured with a Mn/DOT standard laboratory test or estimated from the soil type or classification. An exudation pressure of 1655kPa (240 psi) is used for determining a design R-Value in Minnesota. Predictions of R-Value from soil classification are also presented in Table 4.5 of the Best Practices Manual. The R-Value design chart is based on 1 meter (3 feet) of blended and compacted embankment soil.
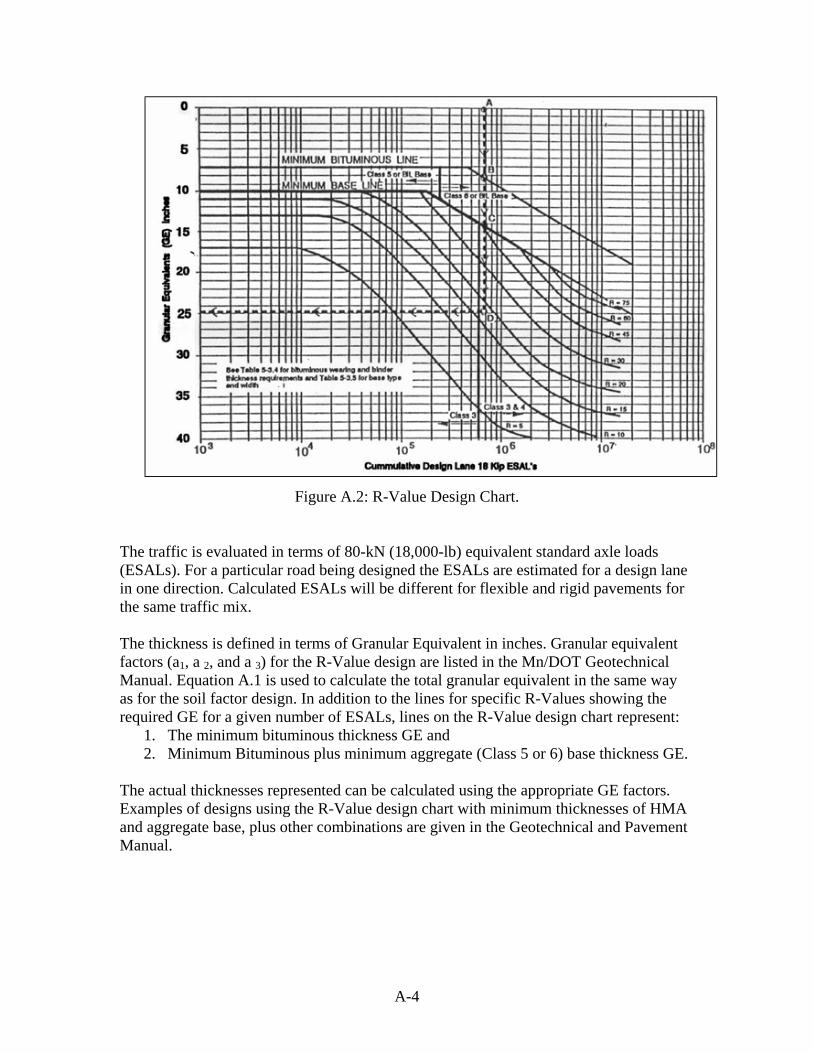
A-4
Figure A.2: R-Value Design Chart.
The traffic is evaluated in terms of 80-kN (18,000-lb) equivalent standard axle loads (ESALs). For a particular road being designed the ESALs are estimated for a design lane in one direction. Calculated ESALs will be different for flexible and rigid pavements for the same traffic mix. The thickness is defined in terms of Granular Equivalent in inches. Granular equivalent factors (a1, a 2, and a 3) for the R-Value design are listed in the Mn/DOT Geotechnical Manual. Equation A.1 is used to calculate the total granular equivalent in the same way as for the soil factor design. In addition to the lines for specific R-Values showing the required GE for a given number of ESALs, lines on the R-Value design chart represent:
1. The minimum bituminous thickness GE and 2. Minimum Bituminous plus minimum aggregate (Class 5 or 6) base thickness GE.
The actual thicknesses represented can be calculated using the appropriate GE factors. Examples of designs using the R-Value design chart with minimum thicknesses of HMA and aggregate base, plus other combinations are given in the Geotechnical and Pavement Manual.
A-5
A.3 MnPAVE Design The Minnesota Department of Transportation and the University of Minnesota have developed a mechanistic-empirical (M-E) design method for flexible pavements. The procedure has been developed as a software package (MnPAVE) because of the great quantity of data and analyses used for design. It is being calibrated for conditions around the state. MnPAVE predicts the structural performance of pavement sections using calculated strains in a simulated elastic layered system:
• The tensile strain in the bottom of the surface layer and • The compressive strain on the top of the subgrade, which is assumed to be
infinite in depth. To use the elastic layered system, moduli and the thickness of each pavement layer must be for the pavement. Up to five (5) layers can be used.
Various combinations of material properties (moduli) are used to simulate the seasons throughout the year. Currently, five seasons are used (winter, early spring, late spring, summer and fall). MnPAVE calculates the percent of damage that occurs in each season, maximum stress, strain and displacement at the critical locations, the allowable axle load repetitions and reliability percentages. The life in years is then predicted using the predicted traffic in ESALs or load spectrum.

Appendix B Definitions and Determination of Pavement Rideability in Minnesota

B-1
Definitions Rideability – How well a pavement is serving the public. Discussion and Use of Present Serviceability The Present Serviceability Rating (PSR) was developed at the AASHO Road Test. (10). The change of Present Serviceability with time and traffic was used to define performance. At the Road Test the average of 11 ratings was correlated with the Slope Variance (SV), Rut Depth (RD) and Cracking & Patching (C&P). The SV was measured using the longitudinal profilometer and CHLOE profilometer. The primary problem with these devices is that they run at 3 mph. The measurements from various other devices have been correlated with PSR. When the Present Serviceability is calculated from a measured roughness it is defined as the Present Serviceabilty Index (PSI). In Minnesota the PSR has been correlated with roughness measured with the FHWA roughometer (RI), PCA Roadmeter, and now the International Roughness Index (IRI) measured with a van. IRI measurements and correlations with PSR are conducted annually for Mn/DOT roadways and periodically for cities and counties. If an agency needs to determine the ride (PSR) on a given section it can be made by a group of individuals who are familiar with the rating procedure. It is recommended that the ratings of 5 or more individuals be used. The following guidelines should be followed when making pavement ratings:
1. minimum length to rate should be ¼ mile 2. maximum length to rate should be 1 mile. 3. if possible the driver should not be a rater. 4. the vehicle used for rating should have a suspension system in good condition 5. practice rating on roadways which have been rated using the IRI.
The following table can be used by individual to rate a pavement.
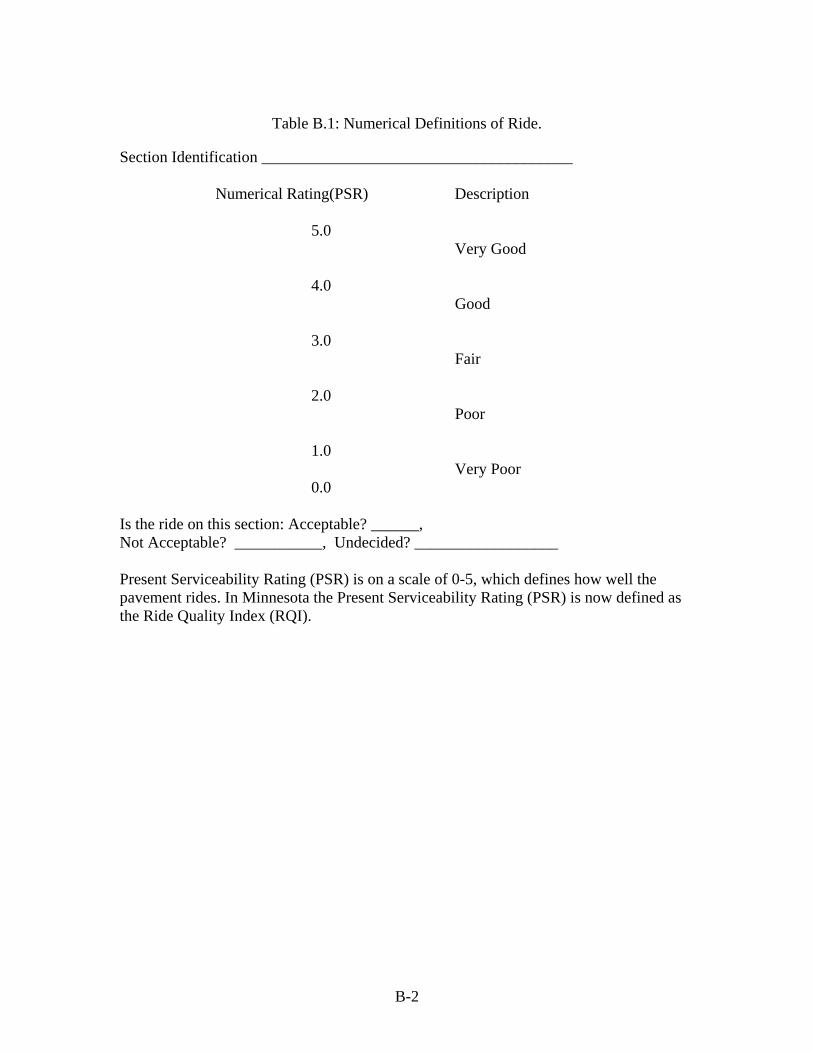
B-2
Table B.1: Numerical Definitions of Ride.
Section Identification _______________________________________
Numerical Rating(PSR) Description 5.0 Very Good 4.0 Good 3.0 Fair 2.0 Poor 1.0 Very Poor 0.0 Is the ride on this section: Acceptable? ______, Not Acceptable? ___________, Undecided? __________________ Present Serviceability Rating (PSR) is on a scale of 0-5, which defines how well the pavement rides. In Minnesota the Present Serviceability Rating (PSR) is now defined as the Ride Quality Index (RQI).

Appendix C Discussion of FWD Testing and Analysis for Potential CIR, FDR and Mill and Overlay Projects.
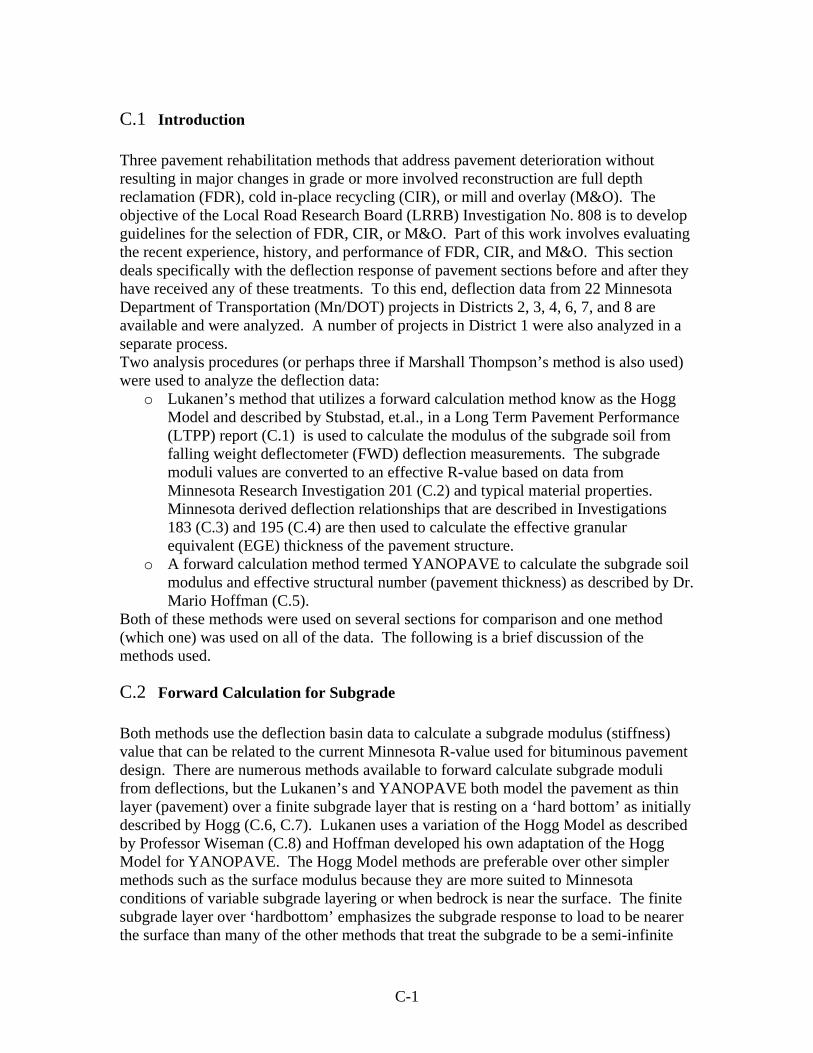
C-1
C.1 Introduction Three pavement rehabilitation methods that address pavement deterioration without resulting in major changes in grade or more involved reconstruction are full depth reclamation (FDR), cold in-place recycling (CIR), or mill and overlay (M&O). The objective of the Local Road Research Board (LRRB) Investigation No. 808 is to develop guidelines for the selection of FDR, CIR, or M&O. Part of this work involves evaluating the recent experience, history, and performance of FDR, CIR, and M&O. This section deals specifically with the deflection response of pavement sections before and after they have received any of these treatments. To this end, deflection data from 22 Minnesota Department of Transportation (Mn/DOT) projects in Districts 2, 3, 4, 6, 7, and 8 are available and were analyzed. A number of projects in District 1 were also analyzed in a separate process. Two analysis procedures (or perhaps three if Marshall Thompson’s method is also used) were used to analyze the deflection data:
o Lukanen’s method that utilizes a forward calculation method know as the Hogg Model and described by Stubstad, et.al., in a Long Term Pavement Performance (LTPP) report (C.1) is used to calculate the modulus of the subgrade soil from falling weight deflectometer (FWD) deflection measurements. The subgrade moduli values are converted to an effective R-value based on data from Minnesota Research Investigation 201 (C.2) and typical material properties. Minnesota derived deflection relationships that are described in Investigations 183 (C.3) and 195 (C.4) are then used to calculate the effective granular equivalent (EGE) thickness of the pavement structure.
o A forward calculation method termed YANOPAVE to calculate the subgrade soil modulus and effective structural number (pavement thickness) as described by Dr. Mario Hoffman (C.5).
Both of these methods were used on several sections for comparison and one method (which one) was used on all of the data. The following is a brief discussion of the methods used.
C.2 Forward Calculation for Subgrade Both methods use the deflection basin data to calculate a subgrade modulus (stiffness) value that can be related to the current Minnesota R-value used for bituminous pavement design. There are numerous methods available to forward calculate subgrade moduli from deflections, but the Lukanen’s and YANOPAVE both model the pavement as thin layer (pavement) over a finite subgrade layer that is resting on a ‘hard bottom’ as initially described by Hogg (C.6, C.7). Lukanen uses a variation of the Hogg Model as described by Professor Wiseman (C.8) and Hoffman developed his own adaptation of the Hogg Model for YANOPAVE. The Hogg Model methods are preferable over other simpler methods such as the surface modulus because they are more suited to Minnesota conditions of variable subgrade layering or when bedrock is near the surface. The finite subgrade layer over ‘hardbottom’ emphasizes the subgrade response to load to be nearer the surface than many of the other methods that treat the subgrade to be a semi-infinite
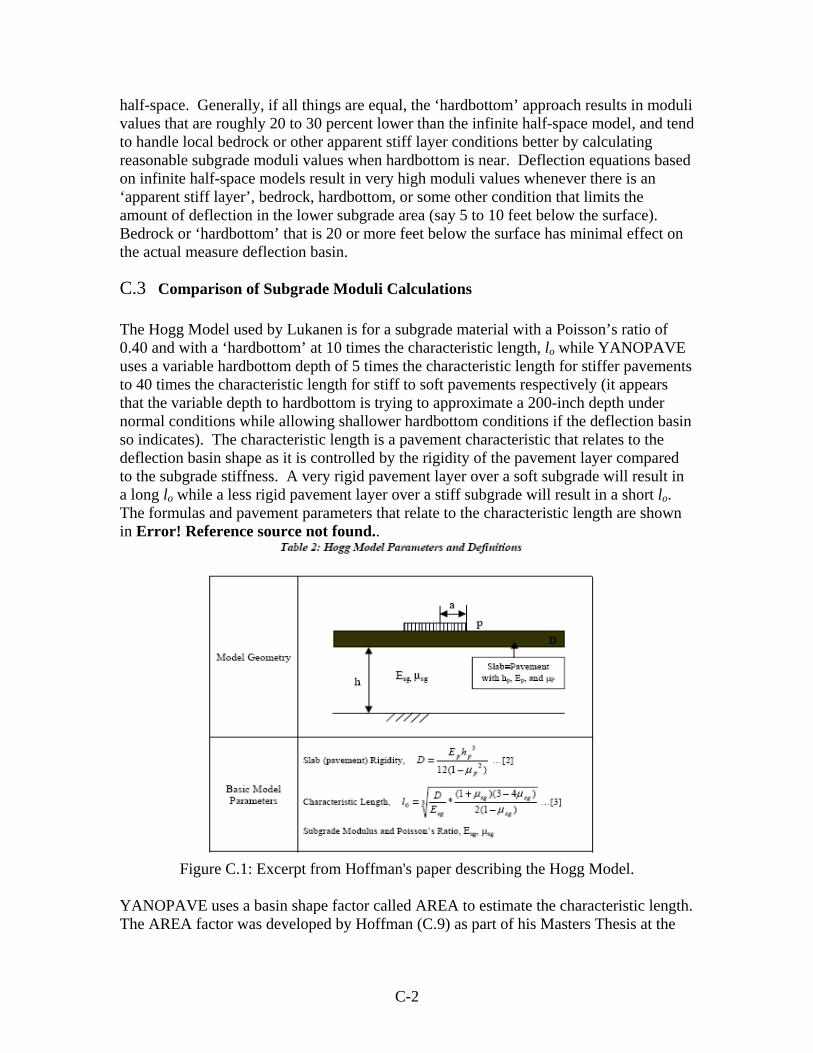
C-2
half-space. Generally, if all things are equal, the ‘hardbottom’ approach results in moduli values that are roughly 20 to 30 percent lower than the infinite half-space model, and tend to handle local bedrock or other apparent stiff layer conditions better by calculating reasonable subgrade moduli values when hardbottom is near. Deflection equations based on infinite half-space models result in very high moduli values whenever there is an ‘apparent stiff layer’, bedrock, hardbottom, or some other condition that limits the amount of deflection in the lower subgrade area (say 5 to 10 feet below the surface). Bedrock or ‘hardbottom’ that is 20 or more feet below the surface has minimal effect on the actual measure deflection basin.
C.3 Comparison of Subgrade Moduli Calculations The Hogg Model used by Lukanen is for a subgrade material with a Poisson’s ratio of 0.40 and with a ‘hardbottom’ at 10 times the characteristic length, lo while YANOPAVE uses a variable hardbottom depth of 5 times the characteristic length for stiffer pavements to 40 times the characteristic length for stiff to soft pavements respectively (it appears that the variable depth to hardbottom is trying to approximate a 200-inch depth under normal conditions while allowing shallower hardbottom conditions if the deflection basin so indicates). The characteristic length is a pavement characteristic that relates to the deflection basin shape as it is controlled by the rigidity of the pavement layer compared to the subgrade stiffness. A very rigid pavement layer over a soft subgrade will result in a long lo while a less rigid pavement layer over a stiff subgrade will result in a short lo. The formulas and pavement parameters that relate to the characteristic length are shown in Error! Reference source not found..
Figure C.1: Excerpt from Hoffman's paper describing the Hogg Model.
YANOPAVE uses a basin shape factor called AREA to estimate the characteristic length. The AREA factor was developed by Hoffman (C.9) as part of his Masters Thesis at the
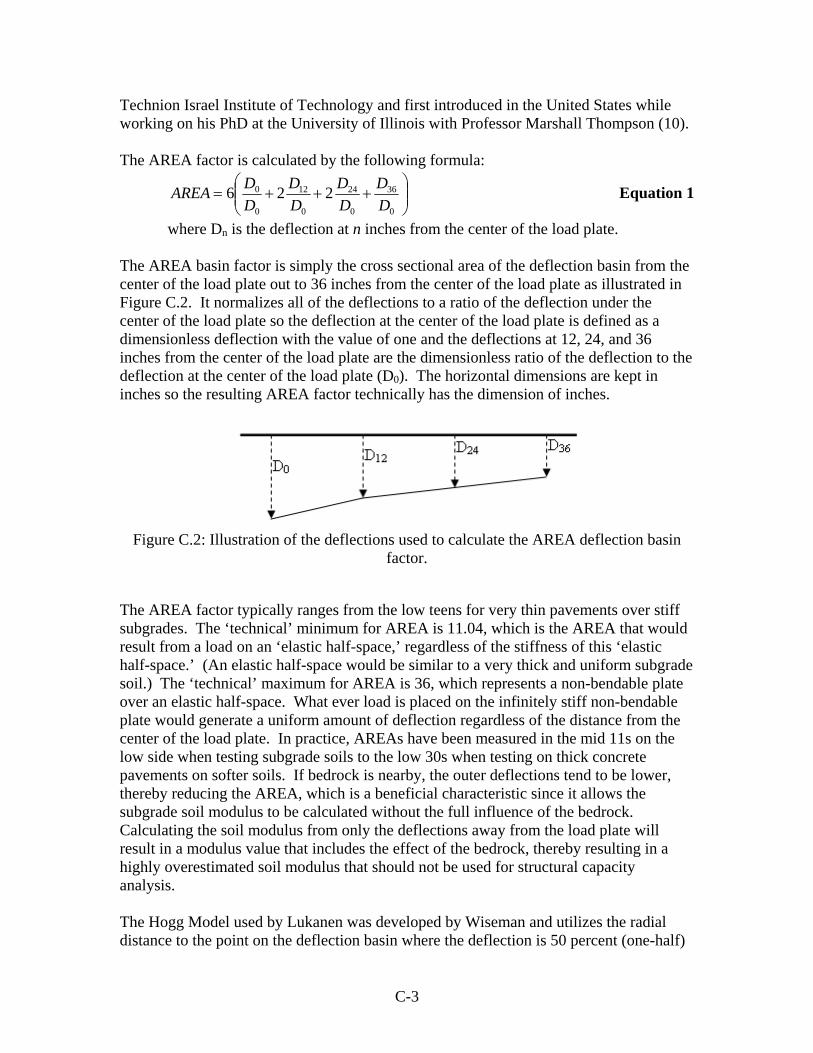
C-3
Technion Israel Institute of Technology and first introduced in the United States while working on his PhD at the University of Illinois with Professor Marshall Thompson (10). The AREA factor is calculated by the following formula:
⎟⎟⎠
⎞⎜⎜⎝
⎛+++=
0
36
0
24
0
12
0
0 226DD
DD
DD
DDAREA Equation 1
where Dn is the deflection at n inches from the center of the load plate. The AREA basin factor is simply the cross sectional area of the deflection basin from the center of the load plate out to 36 inches from the center of the load plate as illustrated in Figure C.2. It normalizes all of the deflections to a ratio of the deflection under the center of the load plate so the deflection at the center of the load plate is defined as a dimensionless deflection with the value of one and the deflections at 12, 24, and 36 inches from the center of the load plate are the dimensionless ratio of the deflection to the deflection at the center of the load plate (D0). The horizontal dimensions are kept in inches so the resulting AREA factor technically has the dimension of inches.
Figure C.2: Illustration of the deflections used to calculate the AREA deflection basin
factor. The AREA factor typically ranges from the low teens for very thin pavements over stiff subgrades. The ‘technical’ minimum for AREA is 11.04, which is the AREA that would result from a load on an ‘elastic half-space,’ regardless of the stiffness of this ‘elastic half-space.’ (An elastic half-space would be similar to a very thick and uniform subgrade soil.) The ‘technical’ maximum for AREA is 36, which represents a non-bendable plate over an elastic half-space. What ever load is placed on the infinitely stiff non-bendable plate would generate a uniform amount of deflection regardless of the distance from the center of the load plate. In practice, AREAs have been measured in the mid 11s on the low side when testing subgrade soils to the low 30s when testing on thick concrete pavements on softer soils. If bedrock is nearby, the outer deflections tend to be lower, thereby reducing the AREA, which is a beneficial characteristic since it allows the subgrade soil modulus to be calculated without the full influence of the bedrock. Calculating the soil modulus from only the deflections away from the load plate will result in a modulus value that includes the effect of the bedrock, thereby resulting in a highly overestimated soil modulus that should not be used for structural capacity analysis. The Hogg Model used by Lukanen was developed by Wiseman and utilizes the radial distance to the point on the deflection basin where the deflection is 50 percent (one-half)
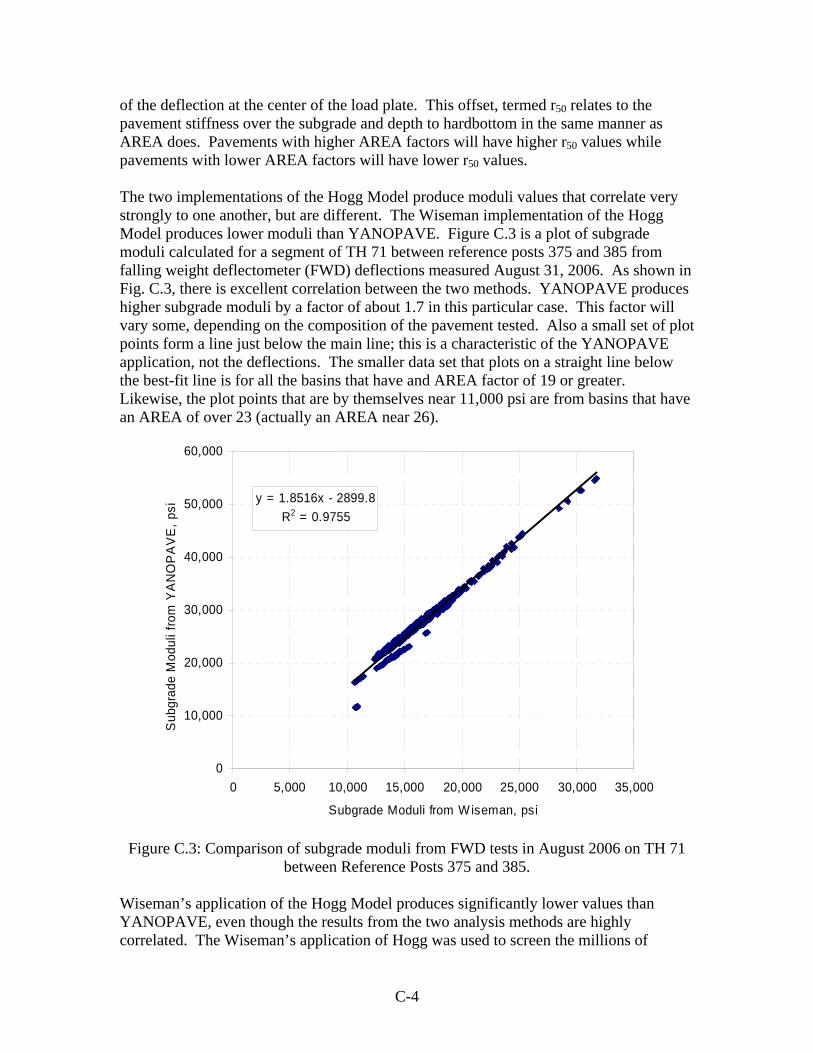
C-4
of the deflection at the center of the load plate. This offset, termed r50 relates to the pavement stiffness over the subgrade and depth to hardbottom in the same manner as AREA does. Pavements with higher AREA factors will have higher r50 values while pavements with lower AREA factors will have lower r50 values. The two implementations of the Hogg Model produce moduli values that correlate very strongly to one another, but are different. The Wiseman implementation of the Hogg Model produces lower moduli than YANOPAVE. Figure C.3 is a plot of subgrade moduli calculated for a segment of TH 71 between reference posts 375 and 385 from falling weight deflectometer (FWD) deflections measured August 31, 2006. As shown in Fig. C.3, there is excellent correlation between the two methods. YANOPAVE produces higher subgrade moduli by a factor of about 1.7 in this particular case. This factor will vary some, depending on the composition of the pavement tested. Also a small set of plot points form a line just below the main line; this is a characteristic of the YANOPAVE application, not the deflections. The smaller data set that plots on a straight line below the best-fit line is for all the basins that have and AREA factor of 19 or greater. Likewise, the plot points that are by themselves near 11,000 psi are from basins that have an AREA of over 23 (actually an AREA near 26).
y = 1.8516x - 2899.8R2 = 0.9755
0
10,000
20,000
30,000
40,000
50,000
60,000
0 5,000 10,000 15,000 20,000 25,000 30,000 35,000
Subgrade Moduli from Wiseman, psi
Sub
grad
e M
odul
i fro
m Y
AN
OP
AV
E, p
si
Figure C.3: Comparison of subgrade moduli from FWD tests in August 2006 on TH 71
between Reference Posts 375 and 385. Wiseman’s application of the Hogg Model produces significantly lower values than YANOPAVE, even though the results from the two analysis methods are highly correlated. The Wiseman’s application of Hogg was used to screen the millions of
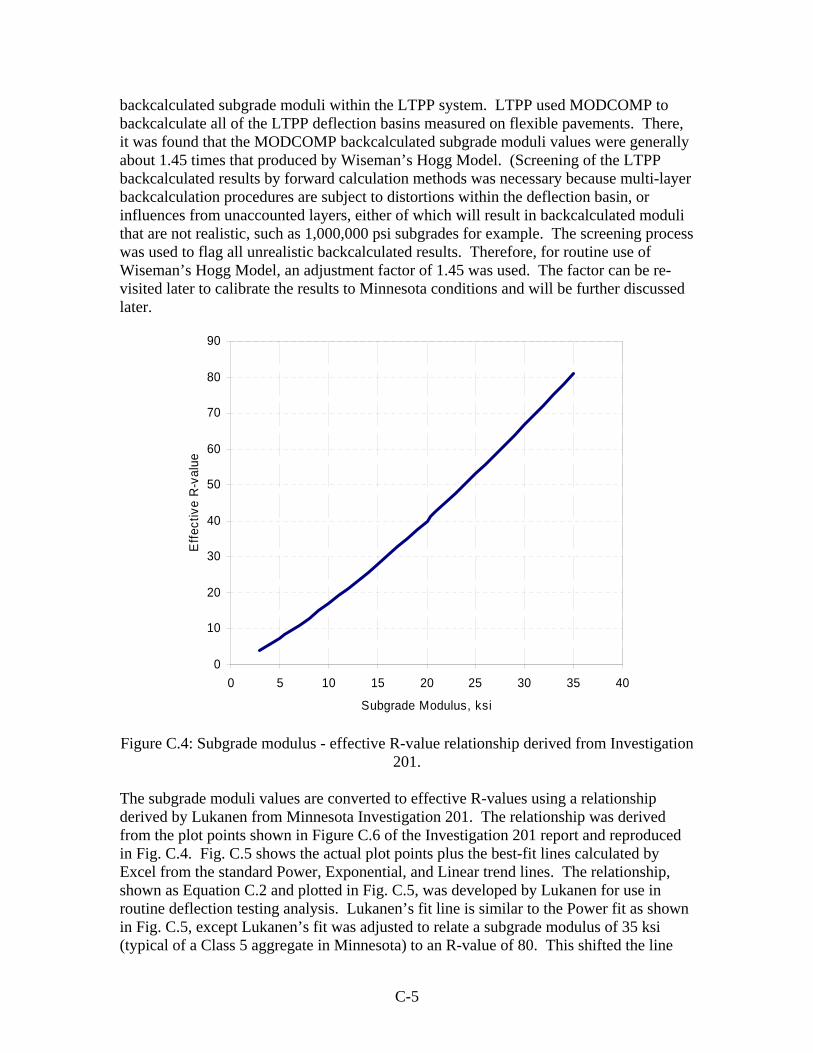
C-5
backcalculated subgrade moduli within the LTPP system. LTPP used MODCOMP to backcalculate all of the LTPP deflection basins measured on flexible pavements. There, it was found that the MODCOMP backcalculated subgrade moduli values were generally about 1.45 times that produced by Wiseman’s Hogg Model. (Screening of the LTPP backcalculated results by forward calculation methods was necessary because multi-layer backcalculation procedures are subject to distortions within the deflection basin, or influences from unaccounted layers, either of which will result in backcalculated moduli that are not realistic, such as 1,000,000 psi subgrades for example. The screening process was used to flag all unrealistic backcalculated results. Therefore, for routine use of Wiseman’s Hogg Model, an adjustment factor of 1.45 was used. The factor can be re-visited later to calibrate the results to Minnesota conditions and will be further discussed later.
0
10
20
30
40
50
60
70
80
90
0 5 10 15 20 25 30 35 40
Subgrade Modulus, ksi
Effe
ctiv
e R
-val
ue
Figure C.4: Subgrade modulus - effective R-value relationship derived from Investigation
201. The subgrade moduli values are converted to effective R-values using a relationship derived by Lukanen from Minnesota Investigation 201. The relationship was derived from the plot points shown in Figure C.6 of the Investigation 201 report and reproduced in Fig. C.4. Fig. C.5 shows the actual plot points plus the best-fit lines calculated by Excel from the standard Power, Exponential, and Linear trend lines. The relationship, shown as Equation C.2 and plotted in Fig. C.5, was developed by Lukanen for use in routine deflection testing analysis. Lukanen’s fit line is similar to the Power fit as shown in Fig. C.5, except Lukanen’s fit was adjusted to relate a subgrade modulus of 35 ksi (typical of a Class 5 aggregate in Minnesota) to an R-value of 80. This shifted the line
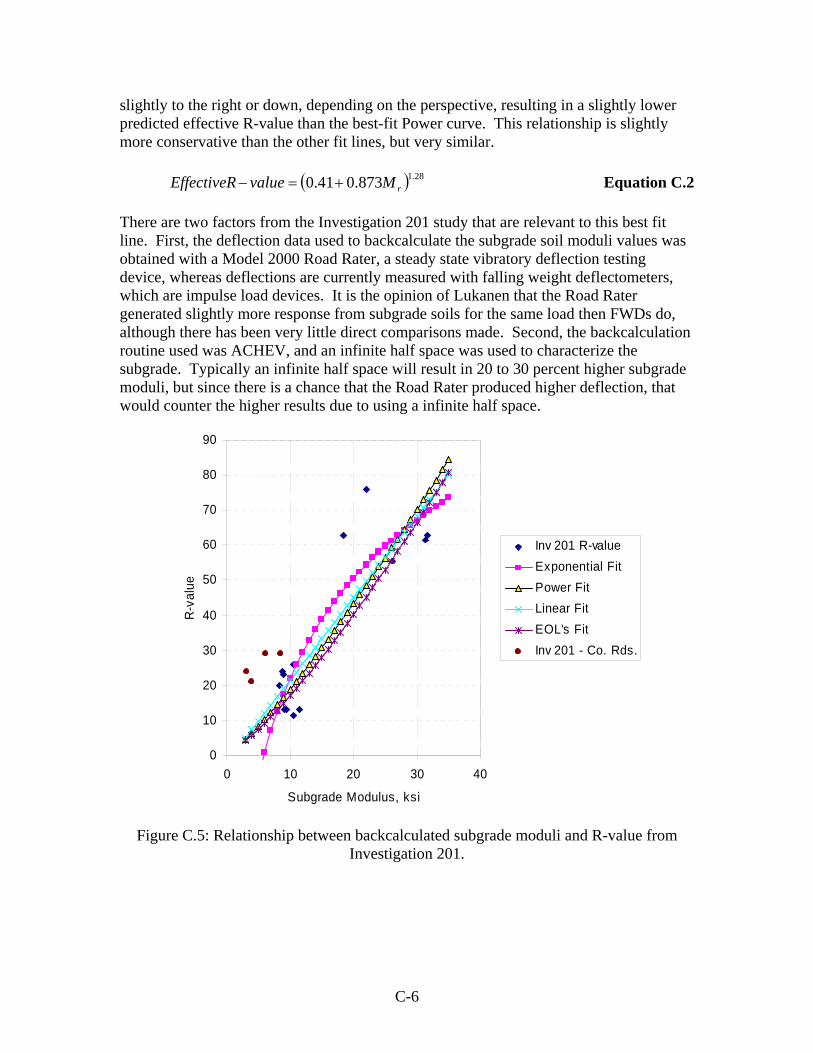
C-6
slightly to the right or down, depending on the perspective, resulting in a slightly lower predicted effective R-value than the best-fit Power curve. This relationship is slightly more conservative than the other fit lines, but very similar.
( ) 28.1873.041.0 rMvalueEffectiveR +=− Equation C.2 There are two factors from the Investigation 201 study that are relevant to this best fit line. First, the deflection data used to backcalculate the subgrade soil moduli values was obtained with a Model 2000 Road Rater, a steady state vibratory deflection testing device, whereas deflections are currently measured with falling weight deflectometers, which are impulse load devices. It is the opinion of Lukanen that the Road Rater generated slightly more response from subgrade soils for the same load then FWDs do, although there has been very little direct comparisons made. Second, the backcalculation routine used was ACHEV, and an infinite half space was used to characterize the subgrade. Typically an infinite half space will result in 20 to 30 percent higher subgrade moduli, but since there is a chance that the Road Rater produced higher deflection, that would counter the higher results due to using a infinite half space.
0
10
20
30
40
50
60
70
80
90
0 10 20 30 40
Subgrade Modulus, ksi
R-v
alue
Inv 201 R-valueExponential FitPower FitLinear FitEOL's FitInv 201 - Co. Rds.
Figure C.5: Relationship between backcalculated subgrade moduli and R-value from
Investigation 201.
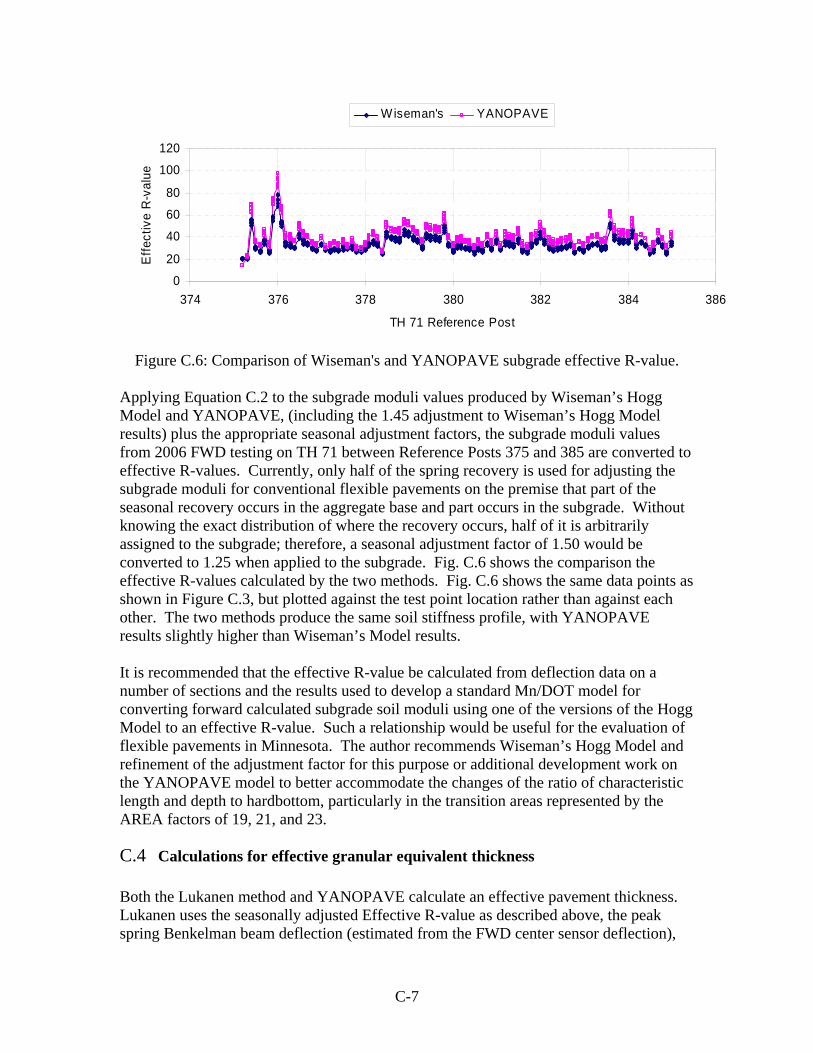
C-7
0
20
40
60
80
100
120
374 376 378 380 382 384 386
TH 71 Reference Post
Effe
ctiv
e R
-val
ue
W iseman's YANOPAVE
Figure C.6: Comparison of Wiseman's and YANOPAVE subgrade effective R-value.
Applying Equation C.2 to the subgrade moduli values produced by Wiseman’s Hogg Model and YANOPAVE, (including the 1.45 adjustment to Wiseman’s Hogg Model results) plus the appropriate seasonal adjustment factors, the subgrade moduli values from 2006 FWD testing on TH 71 between Reference Posts 375 and 385 are converted to effective R-values. Currently, only half of the spring recovery is used for adjusting the subgrade moduli for conventional flexible pavements on the premise that part of the seasonal recovery occurs in the aggregate base and part occurs in the subgrade. Without knowing the exact distribution of where the recovery occurs, half of it is arbitrarily assigned to the subgrade; therefore, a seasonal adjustment factor of 1.50 would be converted to 1.25 when applied to the subgrade. Fig. C.6 shows the comparison the effective R-values calculated by the two methods. Fig. C.6 shows the same data points as shown in Figure C.3, but plotted against the test point location rather than against each other. The two methods produce the same soil stiffness profile, with YANOPAVE results slightly higher than Wiseman’s Model results. It is recommended that the effective R-value be calculated from deflection data on a number of sections and the results used to develop a standard Mn/DOT model for converting forward calculated subgrade soil moduli using one of the versions of the Hogg Model to an effective R-value. Such a relationship would be useful for the evaluation of flexible pavements in Minnesota. The author recommends Wiseman’s Hogg Model and refinement of the adjustment factor for this purpose or additional development work on the YANOPAVE model to better accommodate the changes of the ratio of characteristic length and depth to hardbottom, particularly in the transition areas represented by the AREA factors of 19, 21, and 23.
C.4 Calculations for effective granular equivalent thickness Both the Lukanen method and YANOPAVE calculate an effective pavement thickness. Lukanen uses the seasonally adjusted Effective R-value as described above, the peak spring Benkelman beam deflection (estimated from the FWD center sensor deflection),
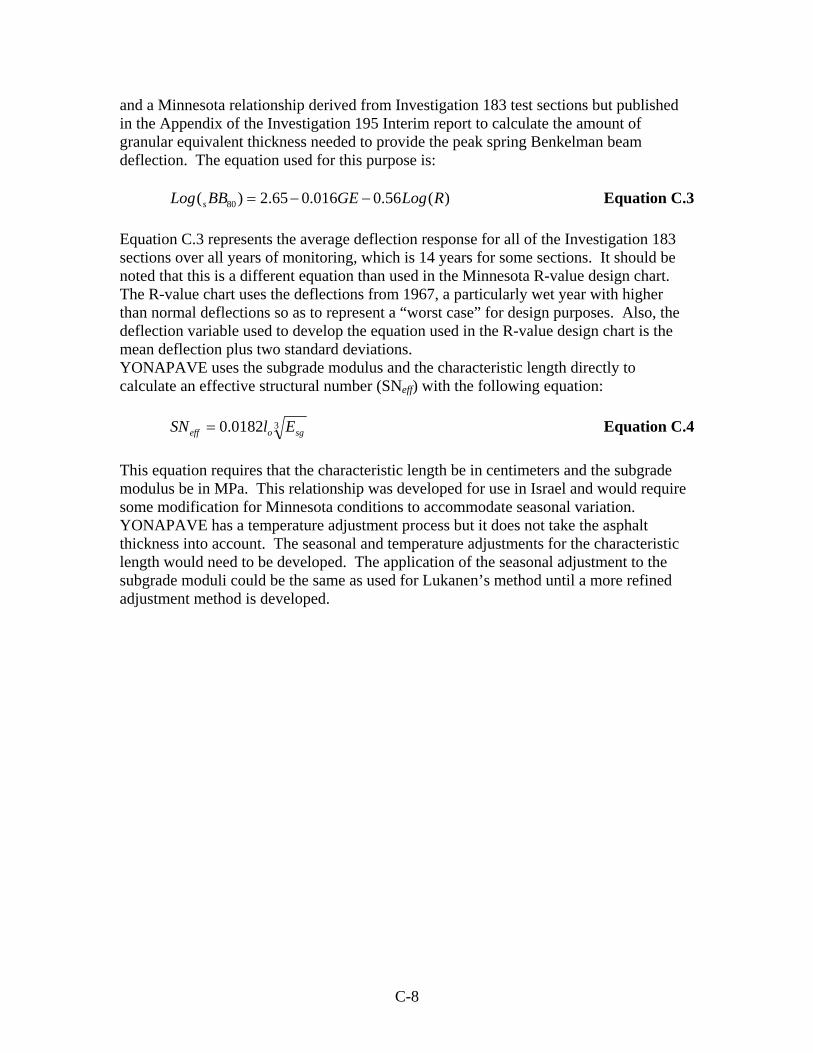
C-8
and a Minnesota relationship derived from Investigation 183 test sections but published in the Appendix of the Investigation 195 Interim report to calculate the amount of granular equivalent thickness needed to provide the peak spring Benkelman beam deflection. The equation used for this purpose is:
)(56.0016.065.2)( 80 RLogGEBBLog s −−= Equation C.3 Equation C.3 represents the average deflection response for all of the Investigation 183 sections over all years of monitoring, which is 14 years for some sections. It should be noted that this is a different equation than used in the Minnesota R-value design chart. The R-value chart uses the deflections from 1967, a particularly wet year with higher than normal deflections so as to represent a “worst case” for design purposes. Also, the deflection variable used to develop the equation used in the R-value design chart is the mean deflection plus two standard deviations. YONAPAVE uses the subgrade modulus and the characteristic length directly to calculate an effective structural number (SNeff) with the following equation:
30182.0 sgoeff ElSN = Equation C.4 This equation requires that the characteristic length be in centimeters and the subgrade modulus be in MPa. This relationship was developed for use in Israel and would require some modification for Minnesota conditions to accommodate seasonal variation. YONAPAVE has a temperature adjustment process but it does not take the asphalt thickness into account. The seasonal and temperature adjustments for the characteristic length would need to be developed. The application of the seasonal adjustment to the subgrade moduli could be the same as used for Lukanen’s method until a more refined adjustment method is developed.
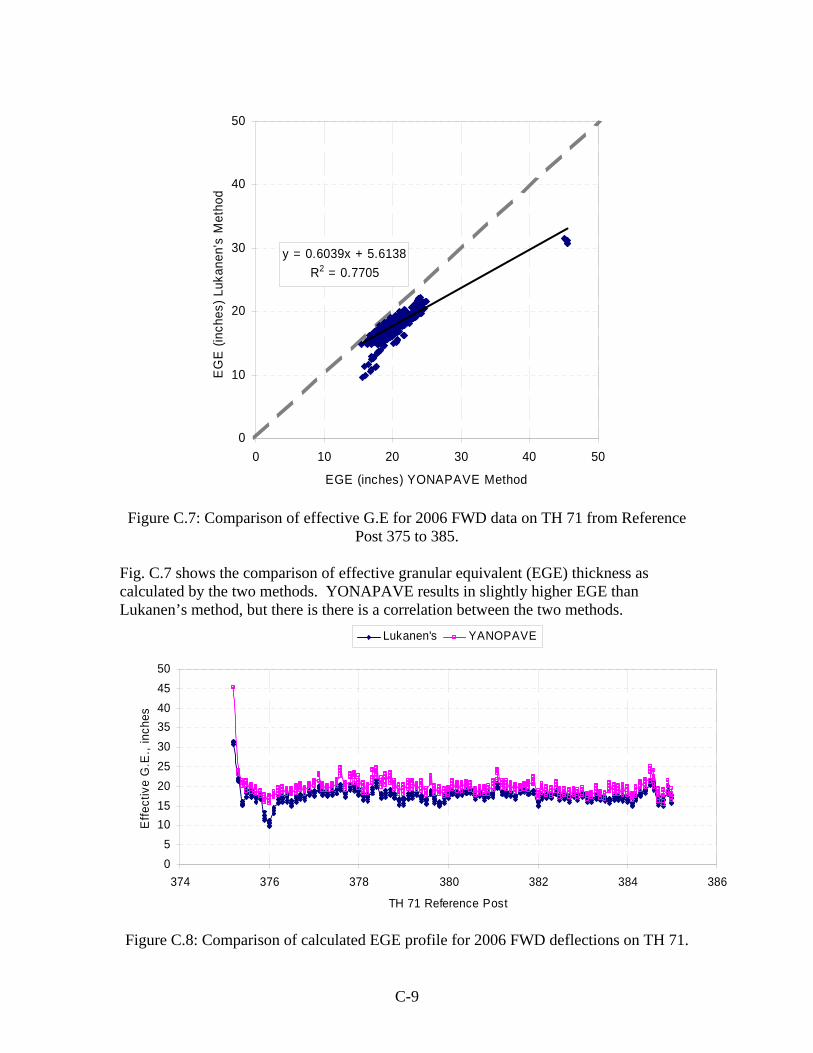
C-9
y = 0.6039x + 5.6138R2 = 0.7705
0
10
20
30
40
50
0 10 20 30 40 50
EGE (inches) YONAPAVE Method
EG
E (i
nche
s) L
ukan
en's
Met
hod
Figure C.7: Comparison of effective G.E for 2006 FWD data on TH 71 from Reference
Post 375 to 385. Fig. C.7 shows the comparison of effective granular equivalent (EGE) thickness as calculated by the two methods. YONAPAVE results in slightly higher EGE than Lukanen’s method, but there is there is a correlation between the two methods.
05
101520253035404550
374 376 378 380 382 384 386
TH 71 Reference Post
Effe
ctiv
e G
.E.,
inch
es
Lukanen's YANOPAVE
Figure C.8: Comparison of calculated EGE profile for 2006 FWD deflections on TH 71.
C-10
Fig. C.8 shows the same data but plotted by location. It shows that both methods produce the same profile and that the YONAPAVE EGE values are consistently a little higher than Lukanen’s method. The average EGEs are 17.8 inches from Lukanen’s method and 20.1 inches from YONAPAVE. The standard deviations and coefficients of variation are 2.1 inches and 12 percent from Lukanen’s method and 3.1 inches and 15 percent from YONAPAVE. Lukanen’s method provides slightly lower coefficients of variation, which typically is a sign of a more robust calculation method.
C.5 Calibration of the EGE in Lukanen’s Method Earlier, it was discussed that the subgrade moduli as calculated using Wiseman’s method was lower than the LTPP MODCOMP backcalculated subgrade moduli and that a factor of 1.45 was used to adjust Wiseman’s Hogg Model moduli to match the subgrade moduli backcalculated by MODCOMP. This adjustment factor also has a direct bearing on the calculated EGE. Equation C.3 is used to calculate the EGE. The sBB80 value is fixed by the deflection at the center of the load plate and the standard temperature and seasonal adjustments. The R-value applied to that equation, however, is calculated from the subgrade modulus and if the 1.45 factor is adjusted, it will change the R-value. In Equation C.3, as the R-value goes up, the EGE goes down, or conversely, if the R-value goes down, the EGE goes up. It is the author’s experience that the Hogg Model does a reasonable job of tracking subgrade moduli over a wide range of soil types and pavement conditions. If the Hogg Model is accepted as the method of calculating subgrade moduli, then the moduli adjustment factor can be varied to provide the base compromise between the effective R-value and EGE. This can be done for Minnesota sections by selecting a number of sections with a variety of soils, calculating the R-value and EGE, and selecting an adjustment factor that provides the best estimate for both R-value and EGE. It needs to be emphasized that the selected sections need to be constructed with consistent subgrade density requirements since density has a huge effect on the effective modulus of the soil.
C.6 Comparison of Before and After Deflection Results As of this date (November 20, 2006) analysis of how the deflection results relate to the in-place structure is limited because of the lack of pavement layer information. There are a variety of sources for pavement layer information that are being used, including the “Construction Project Log Record,” “ROADWAY-HISTORY-FILE,” and Soils Letters. To date, the pavement layer information that has been gathered is minimal and the data gathered is suspect. Comparisons of before and after deflection results, however, can still be made. Also comparisons of the deflections to the available layering information (including design R-values) can be made. One of the objectives for this study is to determine the structural behavior of CIR, FDR, and mill and overlay. The analysis methods used on the deflection data are only slightly sensitive to knowing the layer types and thickness. Temperature adjustment factors are dependent on the thickness of the bituminous layer and the seasonal adjustment factors are dependent on both the bituminous thickness and the subgrade soil plasticity (plastic,
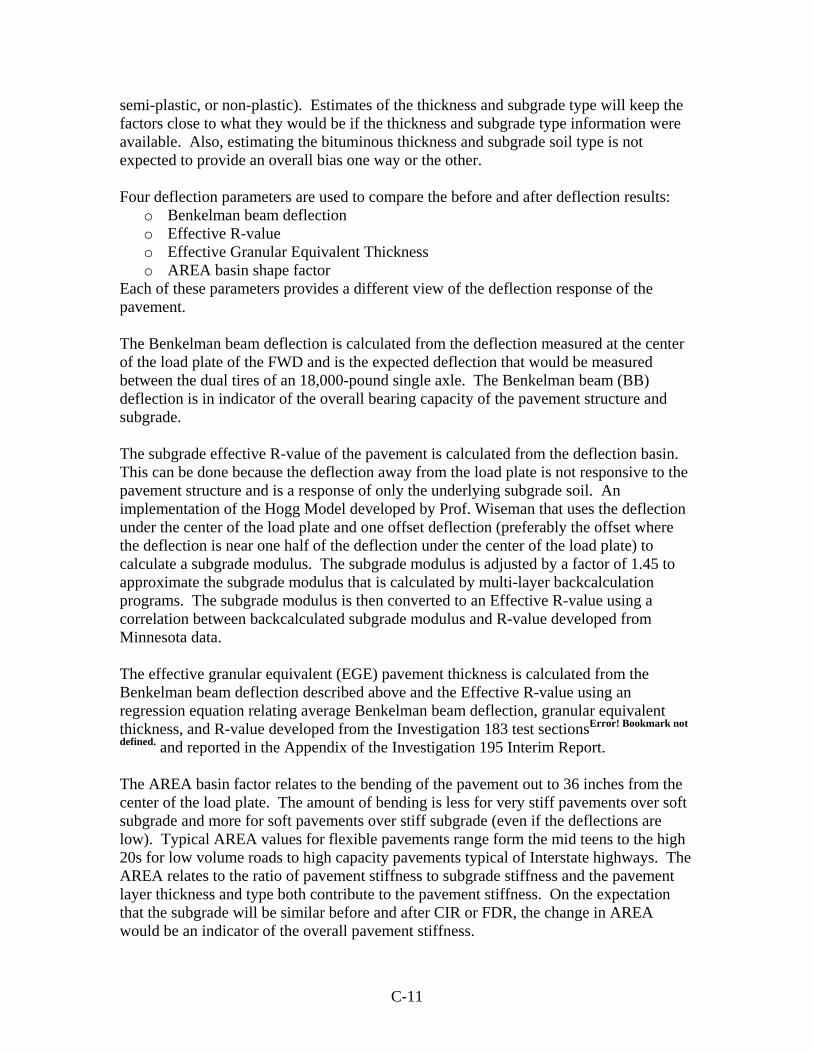
C-11
semi-plastic, or non-plastic). Estimates of the thickness and subgrade type will keep the factors close to what they would be if the thickness and subgrade type information were available. Also, estimating the bituminous thickness and subgrade soil type is not expected to provide an overall bias one way or the other. Four deflection parameters are used to compare the before and after deflection results:
o Benkelman beam deflection o Effective R-value o Effective Granular Equivalent Thickness o AREA basin shape factor
Each of these parameters provides a different view of the deflection response of the pavement. The Benkelman beam deflection is calculated from the deflection measured at the center of the load plate of the FWD and is the expected deflection that would be measured between the dual tires of an 18,000-pound single axle. The Benkelman beam (BB) deflection is in indicator of the overall bearing capacity of the pavement structure and subgrade. The subgrade effective R-value of the pavement is calculated from the deflection basin. This can be done because the deflection away from the load plate is not responsive to the pavement structure and is a response of only the underlying subgrade soil. An implementation of the Hogg Model developed by Prof. Wiseman that uses the deflection under the center of the load plate and one offset deflection (preferably the offset where the deflection is near one half of the deflection under the center of the load plate) to calculate a subgrade modulus. The subgrade modulus is adjusted by a factor of 1.45 to approximate the subgrade modulus that is calculated by multi-layer backcalculation programs. The subgrade modulus is then converted to an Effective R-value using a correlation between backcalculated subgrade modulus and R-value developed from Minnesota data. The effective granular equivalent (EGE) pavement thickness is calculated from the Benkelman beam deflection described above and the Effective R-value using an regression equation relating average Benkelman beam deflection, granular equivalent thickness, and R-value developed from the Investigation 183 test sectionsError! Bookmark not
defined. and reported in the Appendix of the Investigation 195 Interim Report. The AREA basin factor relates to the bending of the pavement out to 36 inches from the center of the load plate. The amount of bending is less for very stiff pavements over soft subgrade and more for soft pavements over stiff subgrade (even if the deflections are low). Typical AREA values for flexible pavements range form the mid teens to the high 20s for low volume roads to high capacity pavements typical of Interstate highways. The AREA relates to the ratio of pavement stiffness to subgrade stiffness and the pavement layer thickness and type both contribute to the pavement stiffness. On the expectation that the subgrade will be similar before and after CIR or FDR, the change in AREA would be an indicator of the overall pavement stiffness.
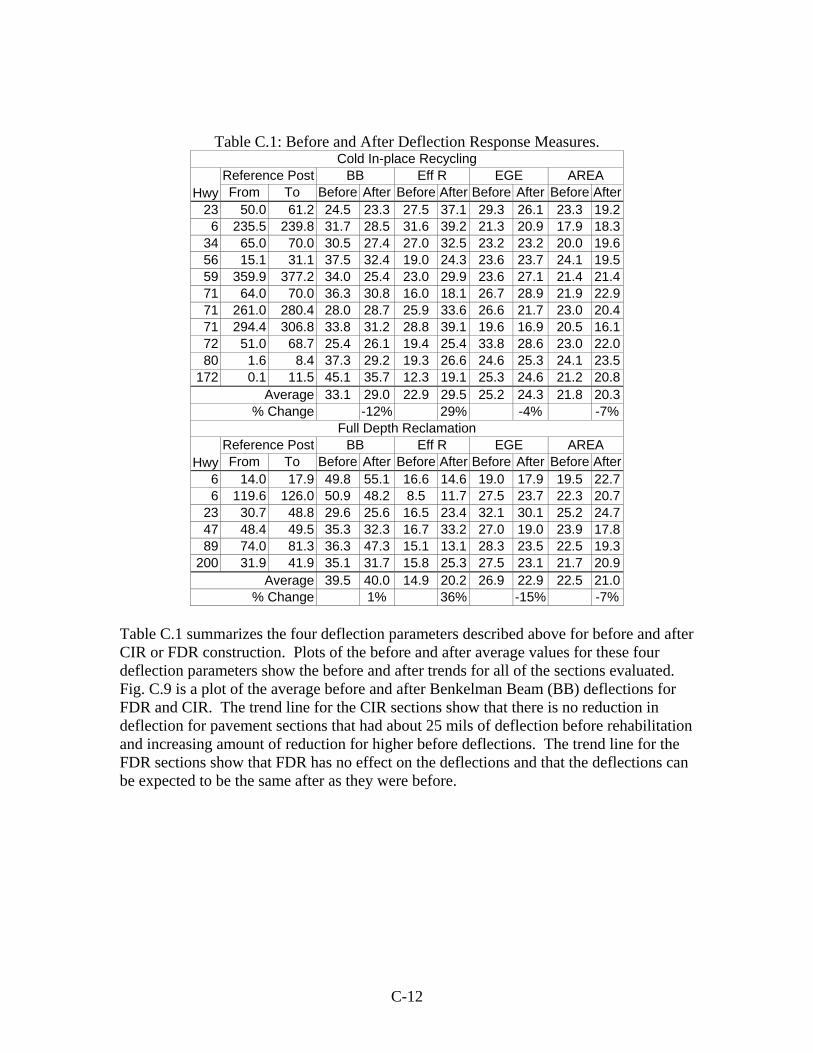
C-12
Table C.1: Before and After Deflection Response Measures. Cold In-place Recycling
Reference Post BB Eff R EGE AREA Hwy From To Before After Before After Before After Before After
23 50.0 61.2 24.5 23.3 27.5 37.1 29.3 26.1 23.3 19.2 6 235.5 239.8 31.7 28.5 31.6 39.2 21.3 20.9 17.9 18.3
34 65.0 70.0 30.5 27.4 27.0 32.5 23.2 23.2 20.0 19.6 56 15.1 31.1 37.5 32.4 19.0 24.3 23.6 23.7 24.1 19.5 59 359.9 377.2 34.0 25.4 23.0 29.9 23.6 27.1 21.4 21.4 71 64.0 70.0 36.3 30.8 16.0 18.1 26.7 28.9 21.9 22.9 71 261.0 280.4 28.0 28.7 25.9 33.6 26.6 21.7 23.0 20.4 71 294.4 306.8 33.8 31.2 28.8 39.1 19.6 16.9 20.5 16.1 72 51.0 68.7 25.4 26.1 19.4 25.4 33.8 28.6 23.0 22.0 80 1.6 8.4 37.3 29.2 19.3 26.6 24.6 25.3 24.1 23.5
172 0.1 11.5 45.1 35.7 12.3 19.1 25.3 24.6 21.2 20.8 Average 33.1 29.0 22.9 29.5 25.2 24.3 21.8 20.3
% Change -12% 29% -4% -7% Full Depth Reclamation
Reference Post BB Eff R EGE AREA Hwy From To Before After Before After Before After Before After
6 14.0 17.9 49.8 55.1 16.6 14.6 19.0 17.9 19.5 22.7 6 119.6 126.0 50.9 48.2 8.5 11.7 27.5 23.7 22.3 20.7
23 30.7 48.8 29.6 25.6 16.5 23.4 32.1 30.1 25.2 24.7 47 48.4 49.5 35.3 32.3 16.7 33.2 27.0 19.0 23.9 17.8 89 74.0 81.3 36.3 47.3 15.1 13.1 28.3 23.5 22.5 19.3
200 31.9 41.9 35.1 31.7 15.8 25.3 27.5 23.1 21.7 20.9 Average 39.5 40.0 14.9 20.2 26.9 22.9 22.5 21.0
% Change 1% 36% -15% -7% Table C.1 summarizes the four deflection parameters described above for before and after CIR or FDR construction. Plots of the before and after average values for these four deflection parameters show the before and after trends for all of the sections evaluated. Fig. C.9 is a plot of the average before and after Benkelman Beam (BB) deflections for FDR and CIR. The trend line for the CIR sections show that there is no reduction in deflection for pavement sections that had about 25 mils of deflection before rehabilitation and increasing amount of reduction for higher before deflections. The trend line for the FDR sections show that FDR has no effect on the deflections and that the deflections can be expected to be the same after as they were before.
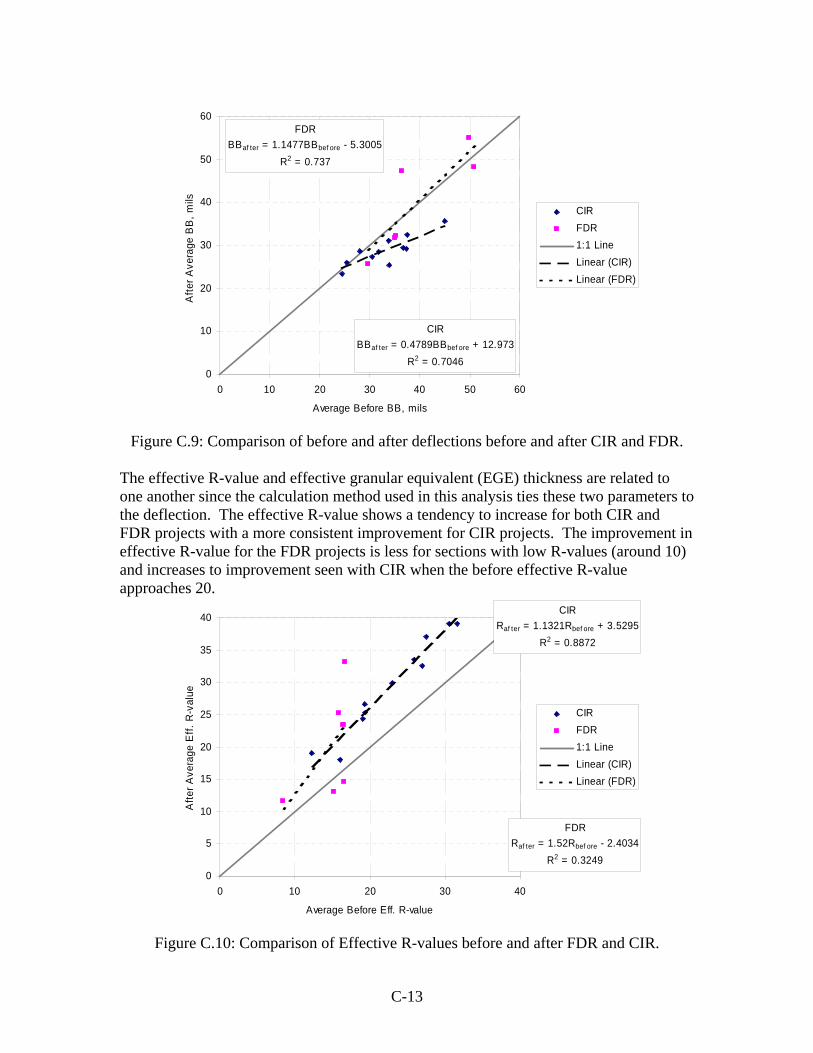
C-13
CIRBBaf ter = 0.4789BBbef ore + 12.973
R2 = 0.7046
FDRBBaf ter = 1.1477BBbef ore - 5.3005
R2 = 0.737
0
10
20
30
40
50
60
0 10 20 30 40 50 60
Average Before BB, mils
Afte
r Ave
rage
BB
, mils
CIRFDR1:1 LineLinear (CIR)Linear (FDR)
Figure C.9: Comparison of before and after deflections before and after CIR and FDR.
The effective R-value and effective granular equivalent (EGE) thickness are related to one another since the calculation method used in this analysis ties these two parameters to the deflection. The effective R-value shows a tendency to increase for both CIR and FDR projects with a more consistent improvement for CIR projects. The improvement in effective R-value for the FDR projects is less for sections with low R-values (around 10) and increases to improvement seen with CIR when the before effective R-value approaches 20.
CIRRaf ter = 1.1321Rbef ore + 3.5295
R2 = 0.8872
FDRRaf ter = 1.52Rbef ore - 2.4034
R2 = 0.32490
5
10
15
20
25
30
35
40
0 10 20 30 40
Average Before Eff. R-value
Afte
r Ave
rage
Eff.
R-v
alue
CIRFDR1:1 LineLinear (CIR)Linear (FDR)
Figure C.10: Comparison of Effective R-values before and after FDR and CIR.
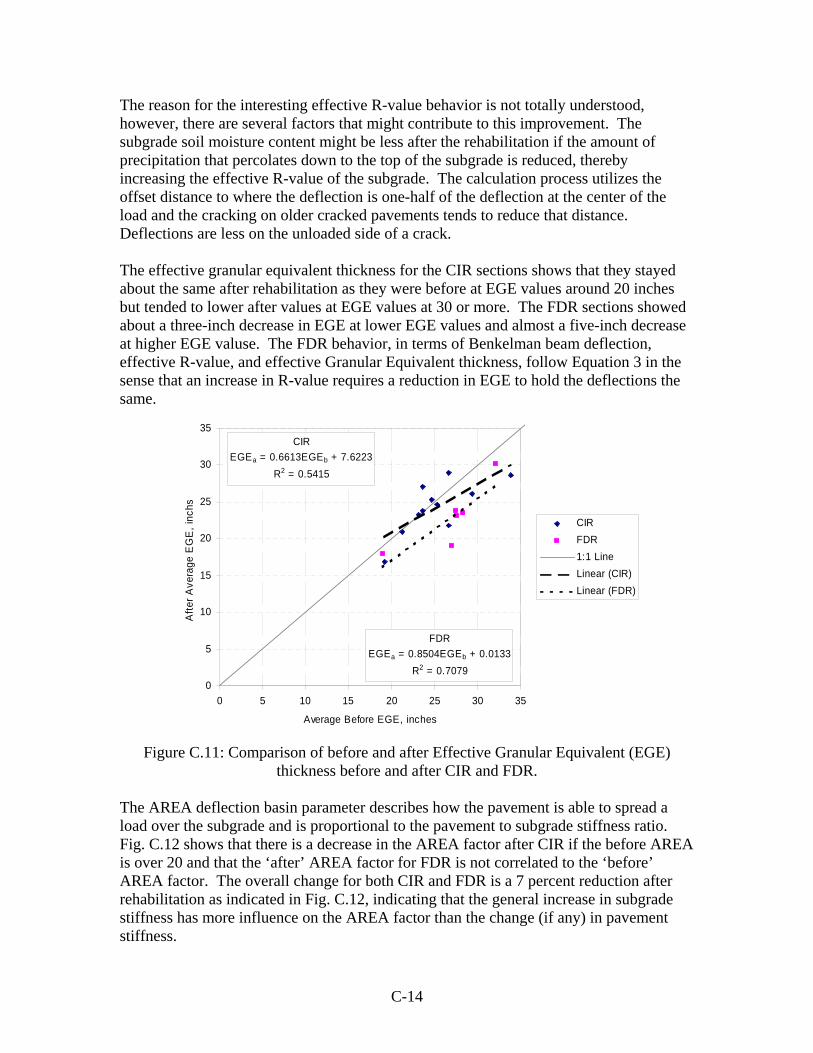
C-14
The reason for the interesting effective R-value behavior is not totally understood, however, there are several factors that might contribute to this improvement. The subgrade soil moisture content might be less after the rehabilitation if the amount of precipitation that percolates down to the top of the subgrade is reduced, thereby increasing the effective R-value of the subgrade. The calculation process utilizes the offset distance to where the deflection is one-half of the deflection at the center of the load and the cracking on older cracked pavements tends to reduce that distance. Deflections are less on the unloaded side of a crack. The effective granular equivalent thickness for the CIR sections shows that they stayed about the same after rehabilitation as they were before at EGE values around 20 inches but tended to lower after values at EGE values at 30 or more. The FDR sections showed about a three-inch decrease in EGE at lower EGE values and almost a five-inch decrease at higher EGE valuse. The FDR behavior, in terms of Benkelman beam deflection, effective R-value, and effective Granular Equivalent thickness, follow Equation 3 in the sense that an increase in R-value requires a reduction in EGE to hold the deflections the same.
CIREGEa = 0.6613EGEb + 7.6223
R2 = 0.5415
FDREGEa = 0.8504EGEb + 0.0133
R2 = 0.70790
5
10
15
20
25
30
35
0 5 10 15 20 25 30 35
Average Before EGE, inches
Afte
r Ave
rage
EG
E, i
nchs
CIRFDR1:1 LineLinear (CIR)Linear (FDR)
Figure C.11: Comparison of before and after Effective Granular Equivalent (EGE)
thickness before and after CIR and FDR. The AREA deflection basin parameter describes how the pavement is able to spread a load over the subgrade and is proportional to the pavement to subgrade stiffness ratio. Fig. C.12 shows that there is a decrease in the AREA factor after CIR if the before AREA is over 20 and that the ‘after’ AREA factor for FDR is not correlated to the ‘before’ AREA factor. The overall change for both CIR and FDR is a 7 percent reduction after rehabilitation as indicated in Fig. C.12, indicating that the general increase in subgrade stiffness has more influence on the AREA factor than the change (if any) in pavement stiffness.
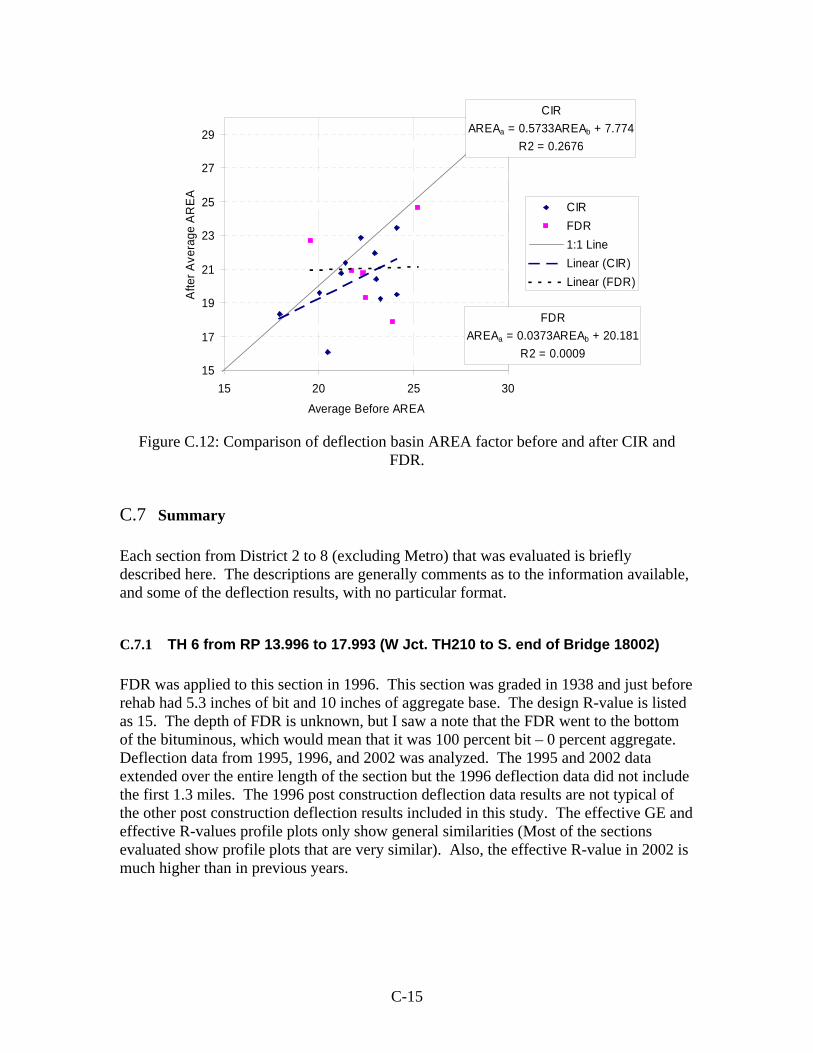
C-15
CIRAREAa = 0.5733AREAb + 7.774
R2 = 0.2676
FDRAREAa = 0.0373AREAb + 20.181
R2 = 0.000915
17
19
21
23
25
27
29
15 20 25 30Average Before AREA
Afte
r Ave
rage
AR
EA
CIRFDR1:1 LineLinear (CIR)Linear (FDR)
Figure C.12: Comparison of deflection basin AREA factor before and after CIR and
FDR.
C.7 Summary Each section from District 2 to 8 (excluding Metro) that was evaluated is briefly described here. The descriptions are generally comments as to the information available, and some of the deflection results, with no particular format.
C.7.1 TH 6 from RP 13.996 to 17.993 (W Jct. TH210 to S. end of Bridge 18002) FDR was applied to this section in 1996. This section was graded in 1938 and just before rehab had 5.3 inches of bit and 10 inches of aggregate base. The design R-value is listed as 15. The depth of FDR is unknown, but I saw a note that the FDR went to the bottom of the bituminous, which would mean that it was 100 percent bit – 0 percent aggregate. Deflection data from 1995, 1996, and 2002 was analyzed. The 1995 and 2002 data extended over the entire length of the section but the 1996 deflection data did not include the first 1.3 miles. The 1996 post construction deflection data results are not typical of the other post construction deflection results included in this study. The effective GE and effective R-values profile plots only show general similarities (Most of the sections evaluated show profile plots that are very similar). Also, the effective R-value in 2002 is much higher than in previous years.
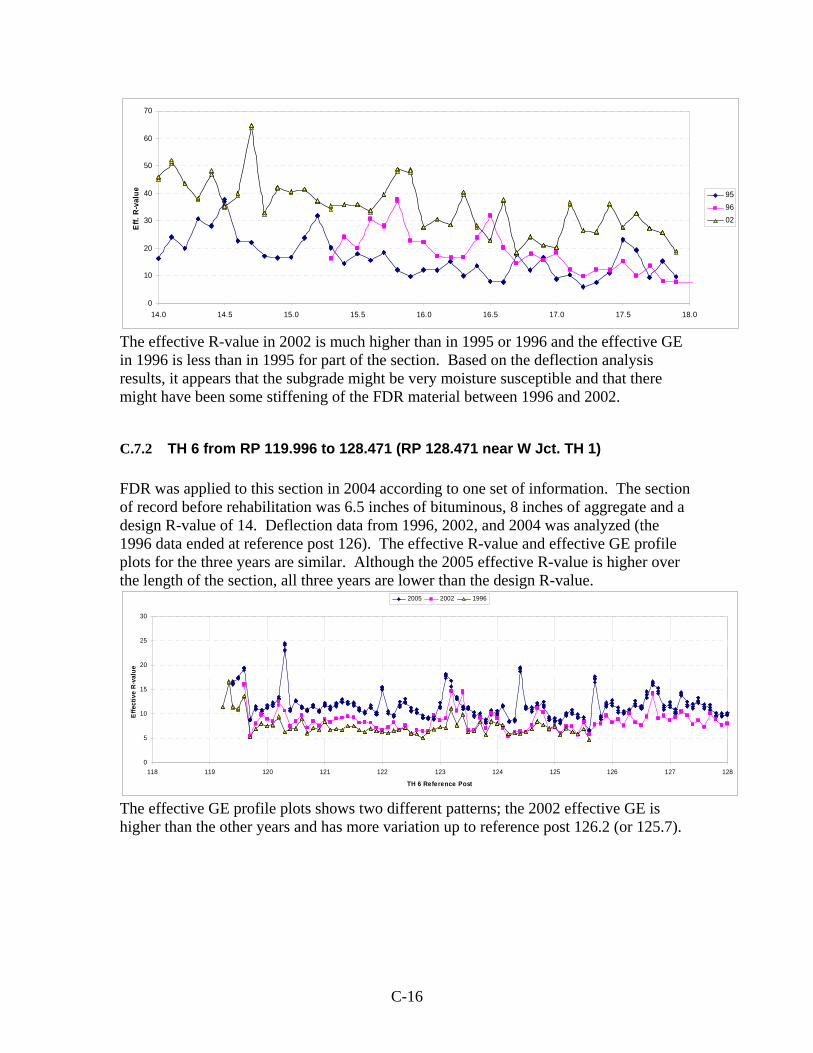
C-16
0
10
20
30
40
50
60
70
14.0 14.5 15.0 15.5 16.0 16.5 17.0 17.5 18.0
Eff.
R-va
lue
959602
The effective R-value in 2002 is much higher than in 1995 or 1996 and the effective GE in 1996 is less than in 1995 for part of the section. Based on the deflection analysis results, it appears that the subgrade might be very moisture susceptible and that there might have been some stiffening of the FDR material between 1996 and 2002.
C.7.2 TH 6 from RP 119.996 to 128.471 (RP 128.471 near W Jct. TH 1) FDR was applied to this section in 2004 according to one set of information. The section of record before rehabilitation was 6.5 inches of bituminous, 8 inches of aggregate and a design R-value of 14. Deflection data from 1996, 2002, and 2004 was analyzed (the 1996 data ended at reference post 126). The effective R-value and effective GE profile plots for the three years are similar. Although the 2005 effective R-value is higher over the length of the section, all three years are lower than the design R-value.
0
5
10
15
20
25
30
118 119 120 121 122 123 124 125 126 127 128
TH 6 Reference Post
Effe
ctiv
e R-
valu
e
2005 2002 1996
The effective GE profile plots shows two different patterns; the 2002 effective GE is higher than the other years and has more variation up to reference post 126.2 (or 125.7).
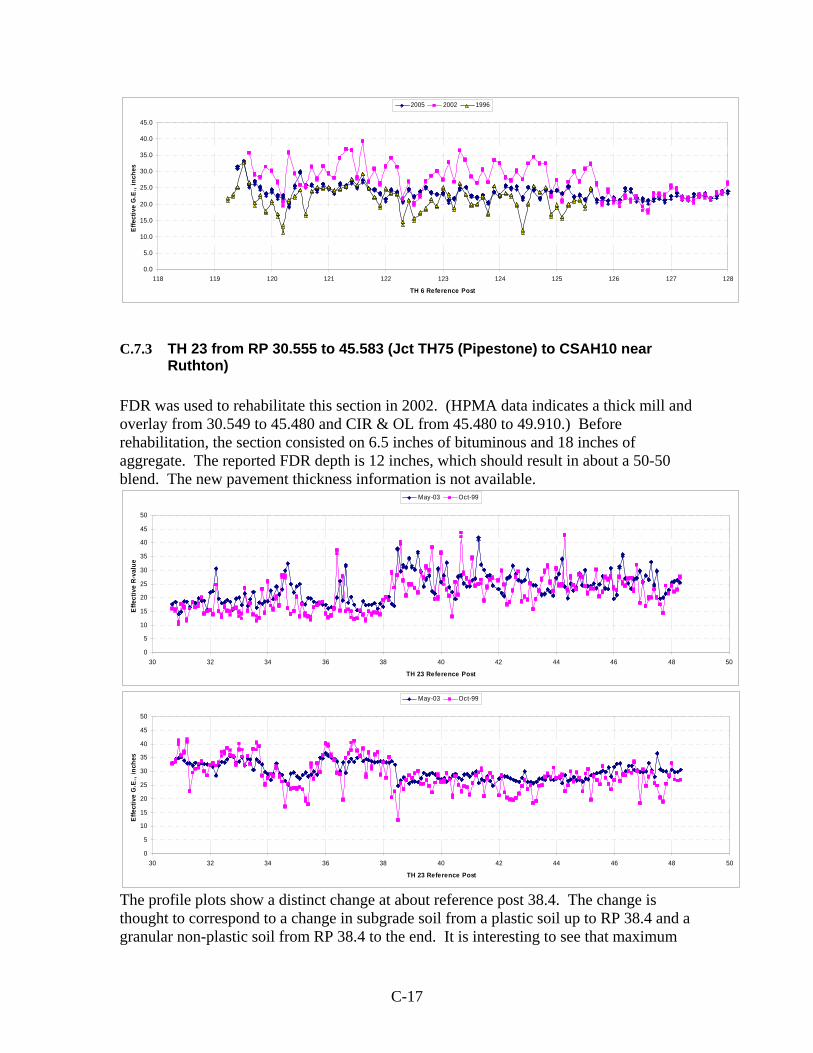
C-17
0.0
5.0
10.0
15.0
20.0
25.0
30.0
35.0
40.0
45.0
118 119 120 121 122 123 124 125 126 127 128
TH 6 Reference Post
Effe
ctiv
e G
.E.,
inch
es
2005 2002 1996
C.7.3 TH 23 from RP 30.555 to 45.583 (Jct TH75 (Pipestone) to CSAH10 near Ruthton)
FDR was used to rehabilitate this section in 2002. (HPMA data indicates a thick mill and overlay from 30.549 to 45.480 and CIR & OL from 45.480 to 49.910.) Before rehabilitation, the section consisted on 6.5 inches of bituminous and 18 inches of aggregate. The reported FDR depth is 12 inches, which should result in about a 50-50 blend. The new pavement thickness information is not available.
0
5
10
15
20
25
30
35
40
45
50
30 32 34 36 38 40 42 44 46 48 50
TH 23 Reference Post
Effe
ctiv
e R
-val
ue
May-03 Oct-99
0
5
10
15
20
25
30
35
40
45
50
30 32 34 36 38 40 42 44 46 48 50
TH 23 Reference Post
Effe
ctiv
e G
.E.,
inch
es
May-03 Oct-99
The profile plots show a distinct change at about reference post 38.4. The change is thought to correspond to a change in subgrade soil from a plastic soil up to RP 38.4 and a granular non-plastic soil from RP 38.4 to the end. It is interesting to see that maximum
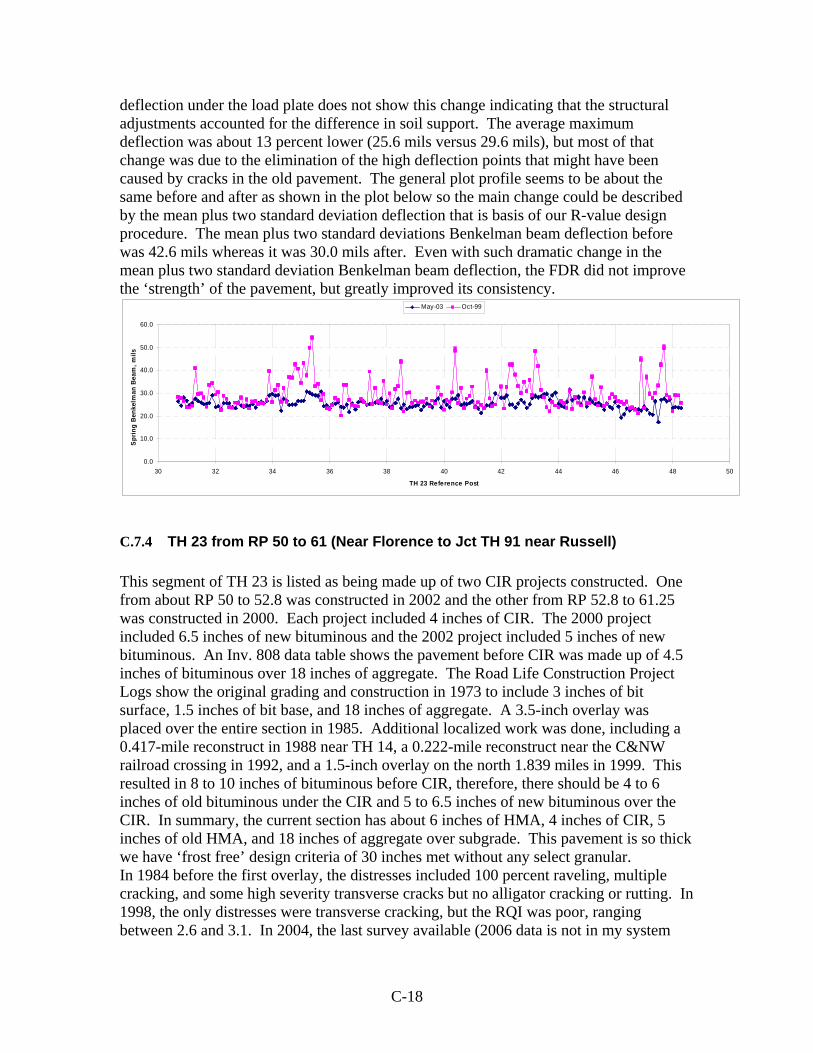
C-18
deflection under the load plate does not show this change indicating that the structural adjustments accounted for the difference in soil support. The average maximum deflection was about 13 percent lower (25.6 mils versus 29.6 mils), but most of that change was due to the elimination of the high deflection points that might have been caused by cracks in the old pavement. The general plot profile seems to be about the same before and after as shown in the plot below so the main change could be described by the mean plus two standard deviation deflection that is basis of our R-value design procedure. The mean plus two standard deviations Benkelman beam deflection before was 42.6 mils whereas it was 30.0 mils after. Even with such dramatic change in the mean plus two standard deviation Benkelman beam deflection, the FDR did not improve the ‘strength’ of the pavement, but greatly improved its consistency.
0.0
10.0
20.0
30.0
40.0
50.0
60.0
30 32 34 36 38 40 42 44 46 48 50
TH 23 Reference Post
Spr
ing
Ben
kelm
an B
eam
, mils
May-03 Oct-99
C.7.4 TH 23 from RP 50 to 61 (Near Florence to Jct TH 91 near Russell) This segment of TH 23 is listed as being made up of two CIR projects constructed. One from about RP 50 to 52.8 was constructed in 2002 and the other from RP 52.8 to 61.25 was constructed in 2000. Each project included 4 inches of CIR. The 2000 project included 6.5 inches of new bituminous and the 2002 project included 5 inches of new bituminous. An Inv. 808 data table shows the pavement before CIR was made up of 4.5 inches of bituminous over 18 inches of aggregate. The Road Life Construction Project Logs show the original grading and construction in 1973 to include 3 inches of bit surface, 1.5 inches of bit base, and 18 inches of aggregate. A 3.5-inch overlay was placed over the entire section in 1985. Additional localized work was done, including a 0.417-mile reconstruct in 1988 near TH 14, a 0.222-mile reconstruct near the C&NW railroad crossing in 1992, and a 1.5-inch overlay on the north 1.839 miles in 1999. This resulted in 8 to 10 inches of bituminous before CIR, therefore, there should be 4 to 6 inches of old bituminous under the CIR and 5 to 6.5 inches of new bituminous over the CIR. In summary, the current section has about 6 inches of HMA, 4 inches of CIR, 5 inches of old HMA, and 18 inches of aggregate over subgrade. This pavement is so thick we have ‘frost free’ design criteria of 30 inches met without any select granular. In 1984 before the first overlay, the distresses included 100 percent raveling, multiple cracking, and some high severity transverse cracks but no alligator cracking or rutting. In 1998, the only distresses were transverse cracking, but the RQI was poor, ranging between 2.6 and 3.1. In 2004, the last survey available (2006 data is not in my system
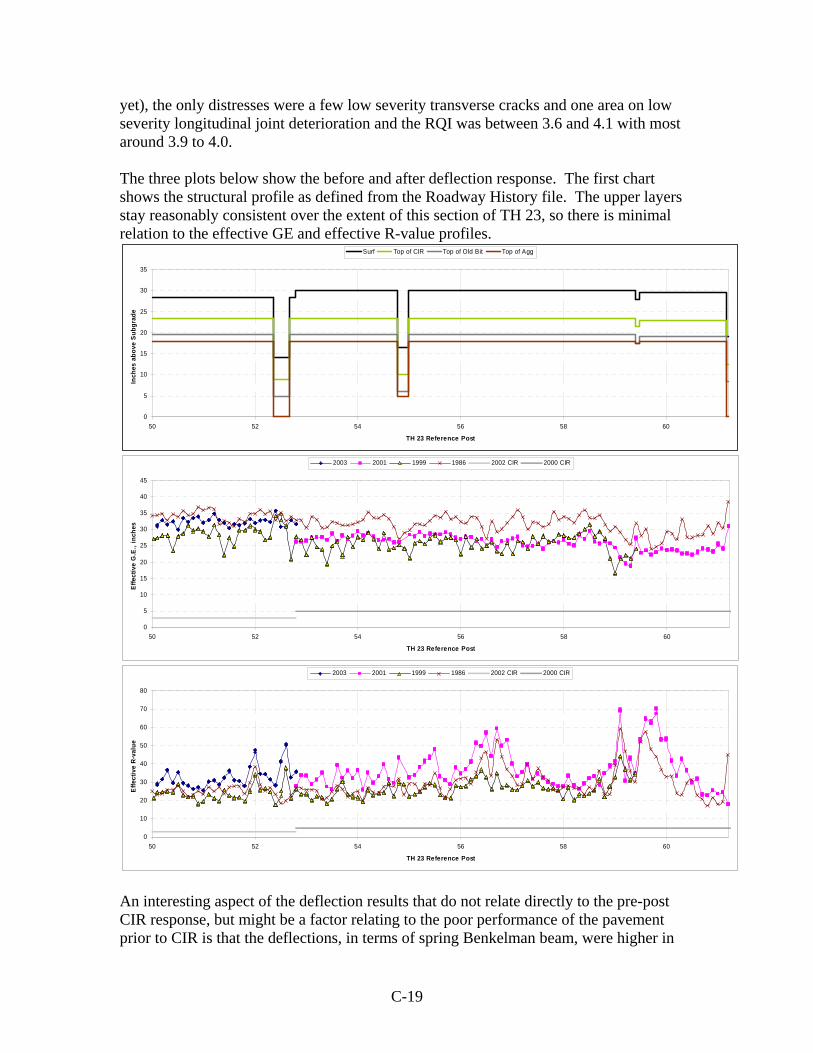
C-19
yet), the only distresses were a few low severity transverse cracks and one area on low severity longitudinal joint deterioration and the RQI was between 3.6 and 4.1 with most around 3.9 to 4.0. The three plots below show the before and after deflection response. The first chart shows the structural profile as defined from the Roadway History file. The upper layers stay reasonably consistent over the extent of this section of TH 23, so there is minimal relation to the effective GE and effective R-value profiles.
0
5
10
15
20
25
30
35
50 52 54 56 58 60
TH 23 Reference Post
Inch
es a
bove
Sub
grad
e
Surf Top of CIR Top of Old Bit Top of Agg
0
5
10
15
20
25
30
35
40
45
50 52 54 56 58 60
TH 23 Reference Post
Effe
ctiv
e G
.E.,
inch
es
2003 2001 1999 1986 2002 CIR 2000 CIR
0
10
20
30
40
50
60
70
80
50 52 54 56 58 60
TH 23 Reference Post
Effe
ctiv
e R-
valu
e
2003 2001 1999 1986 2002 CIR 2000 CIR
An interesting aspect of the deflection results that do not relate directly to the pre-post CIR response, but might be a factor relating to the poor performance of the pavement prior to CIR is that the deflections, in terms of spring Benkelman beam, were higher in
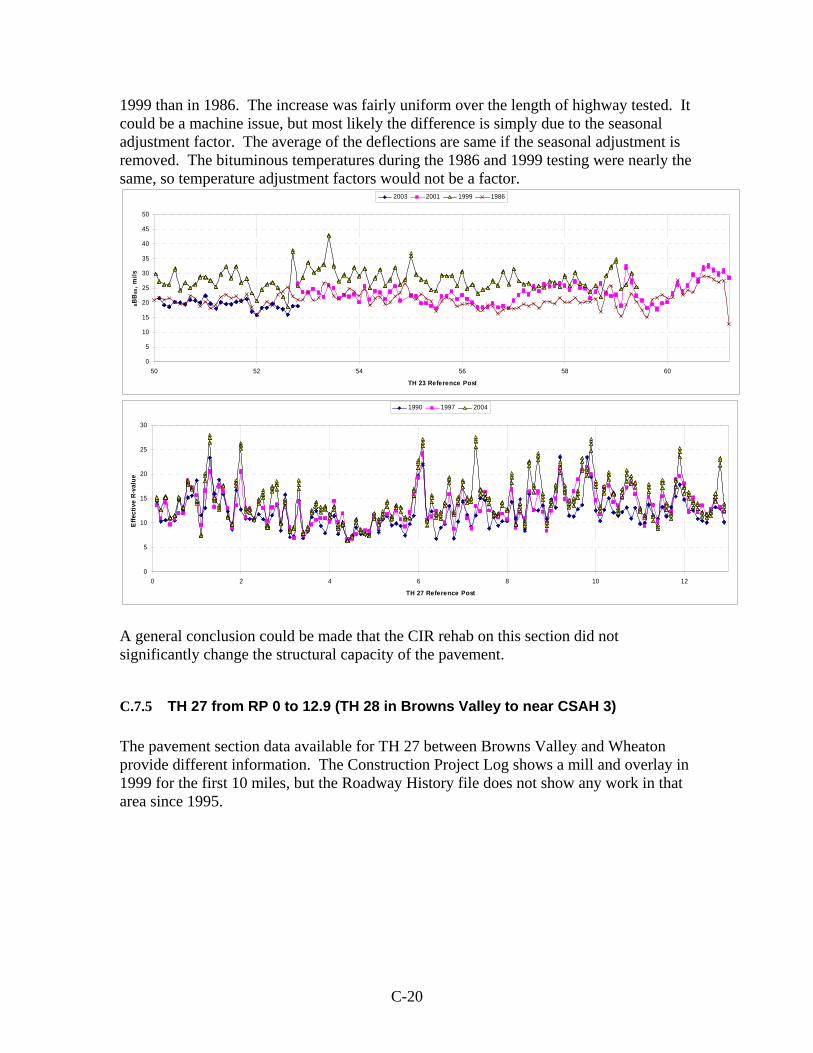
C-20
1999 than in 1986. The increase was fairly uniform over the length of highway tested. It could be a machine issue, but most likely the difference is simply due to the seasonal adjustment factor. The average of the deflections are same if the seasonal adjustment is removed. The bituminous temperatures during the 1986 and 1999 testing were nearly the same, so temperature adjustment factors would not be a factor.
0
5
10
15
20
25
30
35
40
45
50
50 52 54 56 58 60
TH 23 Reference Post
SBB
80, m
ils
2003 2001 1999 1986
0
5
10
15
20
25
30
0 2 4 6 8 10 12
TH 27 Reference Post
Effe
ctiv
e R-
valu
e
1990 1997 2004
A general conclusion could be made that the CIR rehab on this section did not significantly change the structural capacity of the pavement.
C.7.5 TH 27 from RP 0 to 12.9 (TH 28 in Browns Valley to near CSAH 3) The pavement section data available for TH 27 between Browns Valley and Wheaton provide different information. The Construction Project Log shows a mill and overlay in 1999 for the first 10 miles, but the Roadway History file does not show any work in that area since 1995.
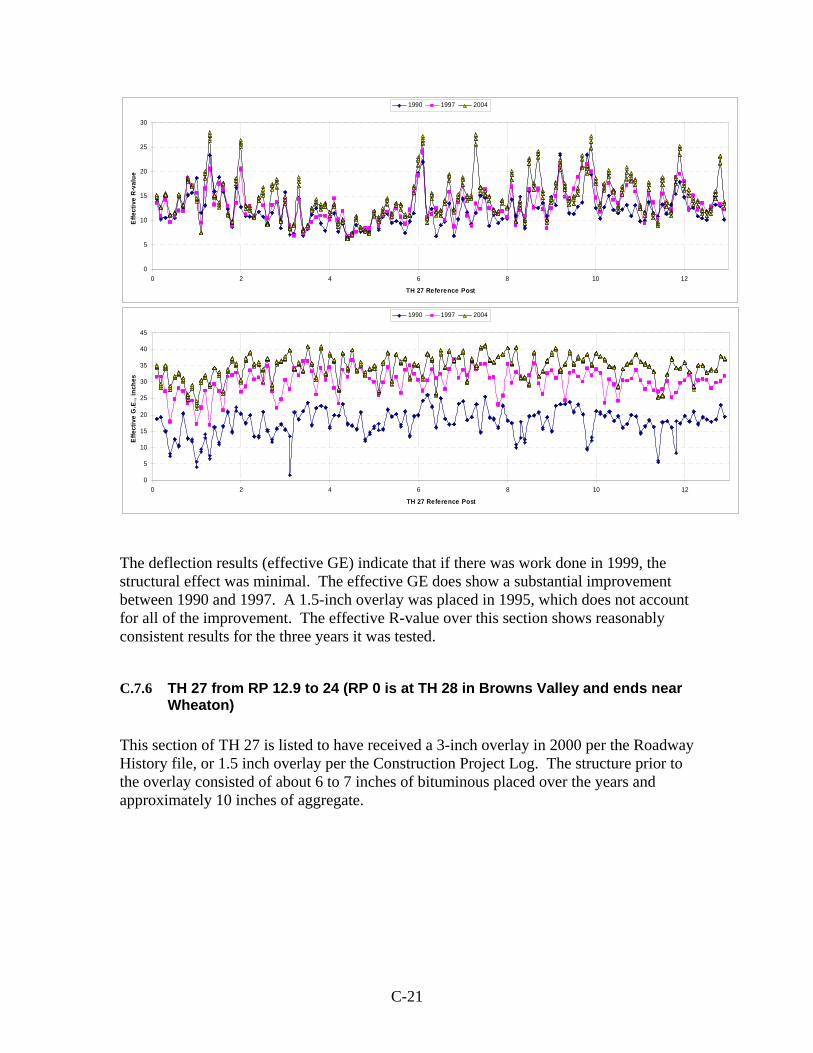
C-21
0
5
10
15
20
25
30
0 2 4 6 8 10 12
TH 27 Reference Post
Effe
ctiv
e R-
valu
e
1990 1997 2004
0
5
10
15
20
25
30
35
40
45
0 2 4 6 8 10 12
TH 27 Reference Post
Effe
ctiv
e G
.E.,
inch
es
1990 1997 2004
The deflection results (effective GE) indicate that if there was work done in 1999, the structural effect was minimal. The effective GE does show a substantial improvement between 1990 and 1997. A 1.5-inch overlay was placed in 1995, which does not account for all of the improvement. The effective R-value over this section shows reasonably consistent results for the three years it was tested.
C.7.6 TH 27 from RP 12.9 to 24 (RP 0 is at TH 28 in Browns Valley and ends near Wheaton)
This section of TH 27 is listed to have received a 3-inch overlay in 2000 per the Roadway History file, or 1.5 inch overlay per the Construction Project Log. The structure prior to the overlay consisted of about 6 to 7 inches of bituminous placed over the years and approximately 10 inches of aggregate.
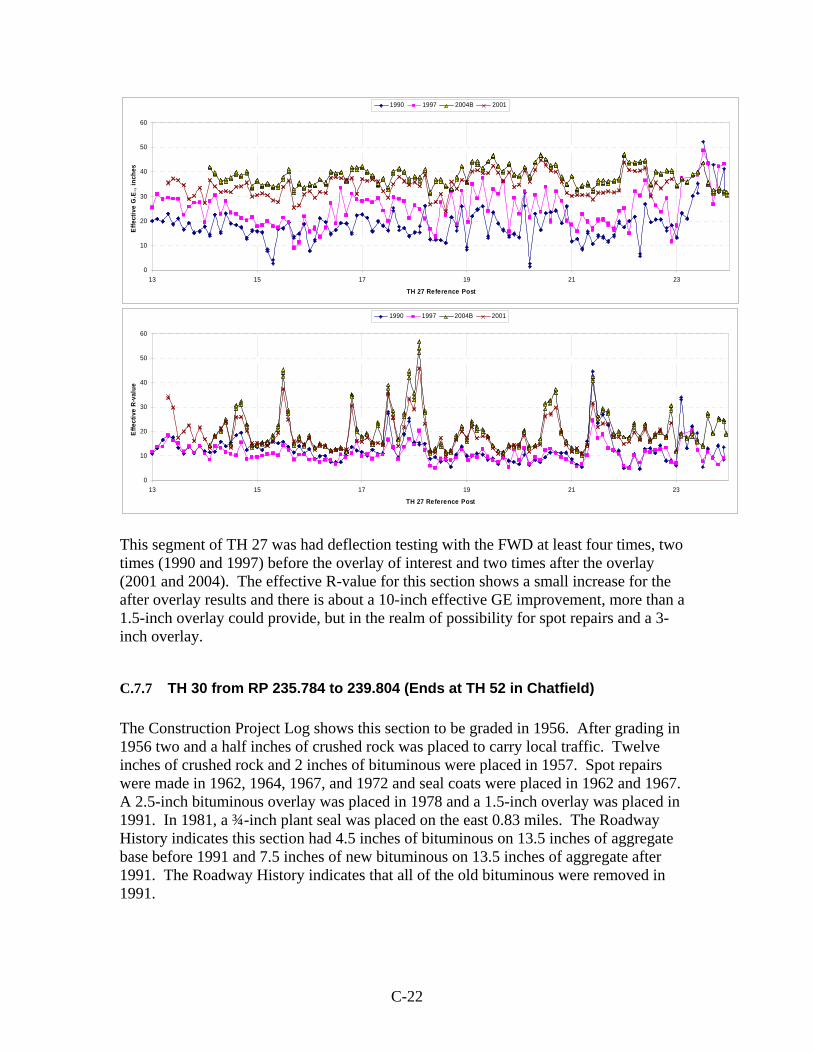
C-22
0
10
20
30
40
50
60
13 15 17 19 21 23
TH 27 Reference Post
Effe
ctiv
e G
.E.,
inch
es
1990 1997 2004B 2001
0
10
20
30
40
50
60
13 15 17 19 21 23
TH 27 Reference Post
Effe
ctiv
e R-
valu
e
1990 1997 2004B 2001
This segment of TH 27 was had deflection testing with the FWD at least four times, two times (1990 and 1997) before the overlay of interest and two times after the overlay (2001 and 2004). The effective R-value for this section shows a small increase for the after overlay results and there is about a 10-inch effective GE improvement, more than a 1.5-inch overlay could provide, but in the realm of possibility for spot repairs and a 3-inch overlay.
C.7.7 TH 30 from RP 235.784 to 239.804 (Ends at TH 52 in Chatfield) The Construction Project Log shows this section to be graded in 1956. After grading in 1956 two and a half inches of crushed rock was placed to carry local traffic. Twelve inches of crushed rock and 2 inches of bituminous were placed in 1957. Spot repairs were made in 1962, 1964, 1967, and 1972 and seal coats were placed in 1962 and 1967. A 2.5-inch bituminous overlay was placed in 1978 and a 1.5-inch overlay was placed in 1991. In 1981, a ¾-inch plant seal was placed on the east 0.83 miles. The Roadway History indicates this section had 4.5 inches of bituminous on 13.5 inches of aggregate base before 1991 and 7.5 inches of new bituminous on 13.5 inches of aggregate after 1991. The Roadway History indicates that all of the old bituminous were removed in 1991.
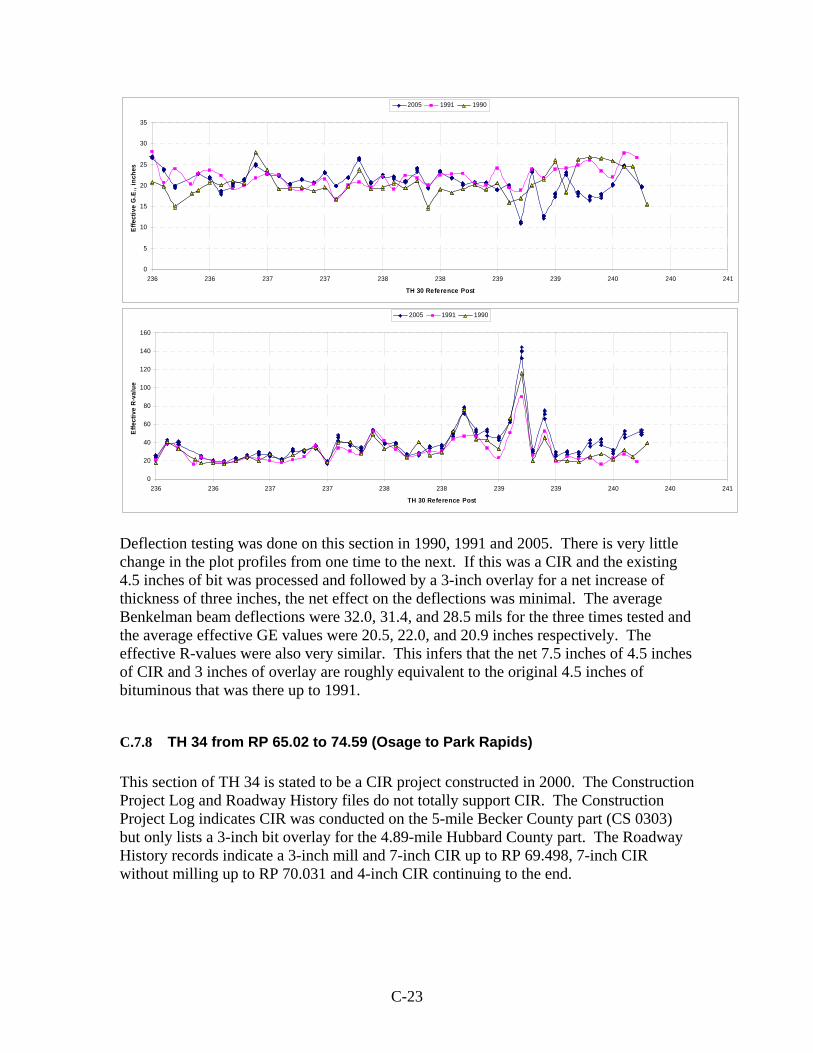
C-23
0
5
10
15
20
25
30
35
236 236 237 237 238 238 239 239 240 240 241
TH 30 Reference Post
Effe
ctiv
e G
.E.,
inch
es
2005 1991 1990
0
20
40
60
80
100
120
140
160
236 236 237 237 238 238 239 239 240 240 241
TH 30 Reference Post
Effe
ctiv
e R-
valu
e
2005 1991 1990
Deflection testing was done on this section in 1990, 1991 and 2005. There is very little change in the plot profiles from one time to the next. If this was a CIR and the existing 4.5 inches of bit was processed and followed by a 3-inch overlay for a net increase of thickness of three inches, the net effect on the deflections was minimal. The average Benkelman beam deflections were 32.0, 31.4, and 28.5 mils for the three times tested and the average effective GE values were 20.5, 22.0, and 20.9 inches respectively. The effective R-values were also very similar. This infers that the net 7.5 inches of 4.5 inches of CIR and 3 inches of overlay are roughly equivalent to the original 4.5 inches of bituminous that was there up to 1991.
C.7.8 TH 34 from RP 65.02 to 74.59 (Osage to Park Rapids) This section of TH 34 is stated to be a CIR project constructed in 2000. The Construction Project Log and Roadway History files do not totally support CIR. The Construction Project Log indicates CIR was conducted on the 5-mile Becker County part (CS 0303) but only lists a 3-inch bit overlay for the 4.89-mile Hubbard County part. The Roadway History records indicate a 3-inch mill and 7-inch CIR up to RP 69.498, 7-inch CIR without milling up to RP 70.031 and 4-inch CIR continuing to the end.
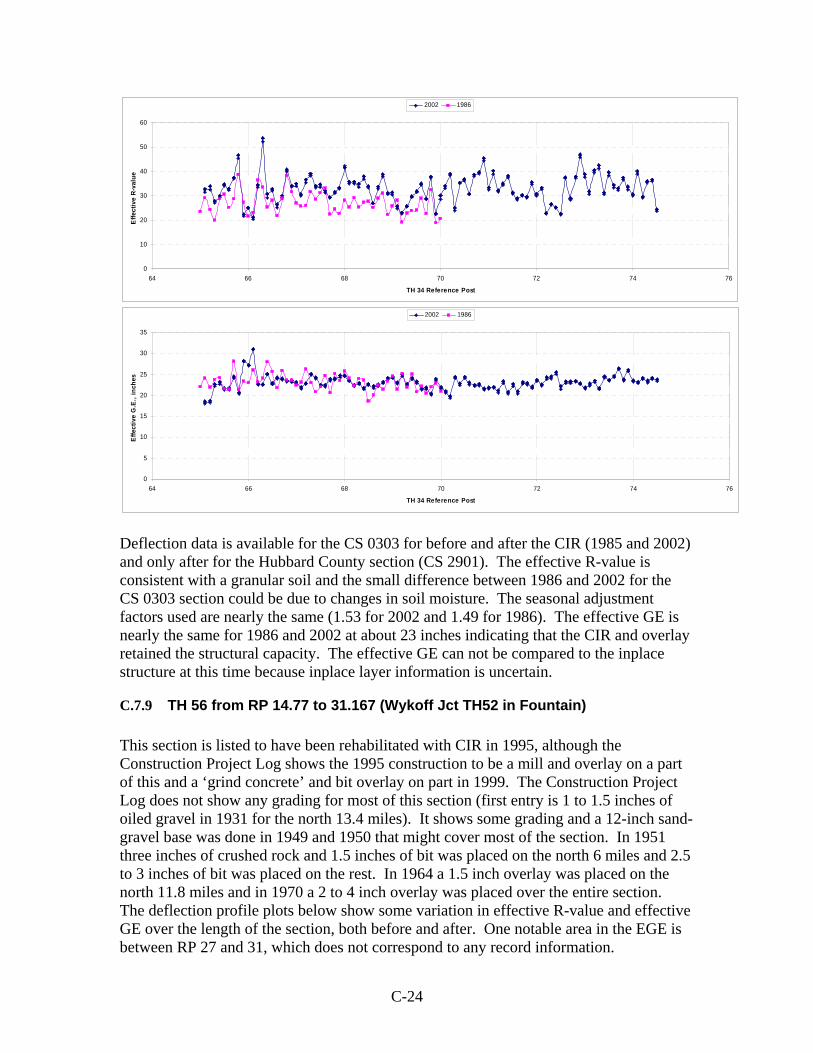
C-24
0
10
20
30
40
50
60
64 66 68 70 72 74 76
TH 34 Reference Post
Effe
ctiv
e R-
valu
e
2002 1986
0
5
10
15
20
25
30
35
64 66 68 70 72 74 76
TH 34 Reference Post
Effe
ctiv
e G
.E.,
inch
es
2002 1986
Deflection data is available for the CS 0303 for before and after the CIR (1985 and 2002) and only after for the Hubbard County section (CS 2901). The effective R-value is consistent with a granular soil and the small difference between 1986 and 2002 for the CS 0303 section could be due to changes in soil moisture. The seasonal adjustment factors used are nearly the same (1.53 for 2002 and 1.49 for 1986). The effective GE is nearly the same for 1986 and 2002 at about 23 inches indicating that the CIR and overlay retained the structural capacity. The effective GE can not be compared to the inplace structure at this time because inplace layer information is uncertain.
C.7.9 TH 56 from RP 14.77 to 31.167 (Wykoff Jct TH52 in Fountain) This section is listed to have been rehabilitated with CIR in 1995, although the Construction Project Log shows the 1995 construction to be a mill and overlay on a part of this and a ‘grind concrete’ and bit overlay on part in 1999. The Construction Project Log does not show any grading for most of this section (first entry is 1 to 1.5 inches of oiled gravel in 1931 for the north 13.4 miles). It shows some grading and a 12-inch sand-gravel base was done in 1949 and 1950 that might cover most of the section. In 1951 three inches of crushed rock and 1.5 inches of bit was placed on the north 6 miles and 2.5 to 3 inches of bit was placed on the rest. In 1964 a 1.5 inch overlay was placed on the north 11.8 miles and in 1970 a 2 to 4 inch overlay was placed over the entire section. The deflection profile plots below show some variation in effective R-value and effective GE over the length of the section, both before and after. One notable area in the EGE is between RP 27 and 31, which does not correspond to any record information.
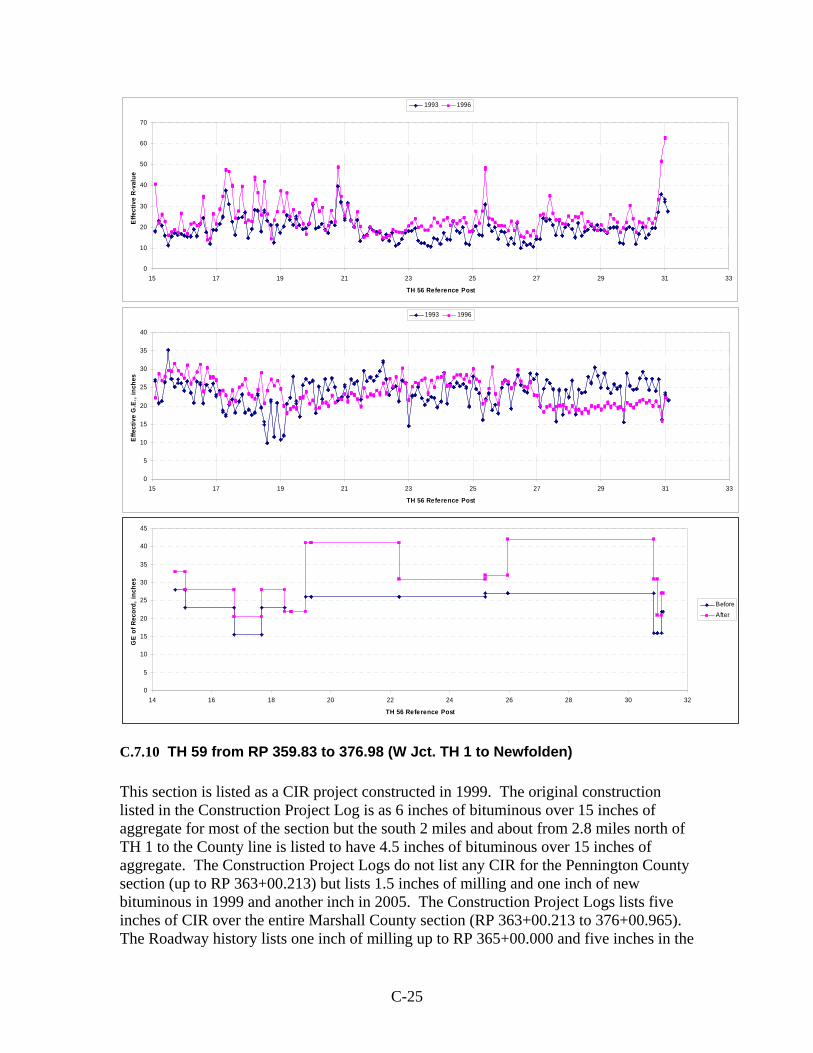
C-25
0
10
20
30
40
50
60
70
15 17 19 21 23 25 27 29 31 33
TH 56 Reference Post
Effe
ctiv
e R-
valu
e
1993 1996
0
5
10
15
20
25
30
35
40
15 17 19 21 23 25 27 29 31 33
TH 56 Reference Post
Effe
ctiv
e G
.E.,
inch
es
1993 1996
0
5
10
15
20
25
30
35
40
45
14 16 18 20 22 24 26 28 30 32
TH 56 Reference Post
GE
of R
ecor
d, in
ches
BeforeAfter
C.7.10 TH 59 from RP 359.83 to 376.98 (W Jct. TH 1 to Newfolden) This section is listed as a CIR project constructed in 1999. The original construction listed in the Construction Project Log is as 6 inches of bituminous over 15 inches of aggregate for most of the section but the south 2 miles and about from 2.8 miles north of TH 1 to the County line is listed to have 4.5 inches of bituminous over 15 inches of aggregate. The Construction Project Logs do not list any CIR for the Pennington County section (up to RP 363+00.213) but lists 1.5 inches of milling and one inch of new bituminous in 1999 and another inch in 2005. The Construction Project Logs lists five inches of CIR over the entire Marshall County section (RP 363+00.213 to 376+00.965). The Roadway history lists one inch of milling up to RP 365+00.000 and five inches in the
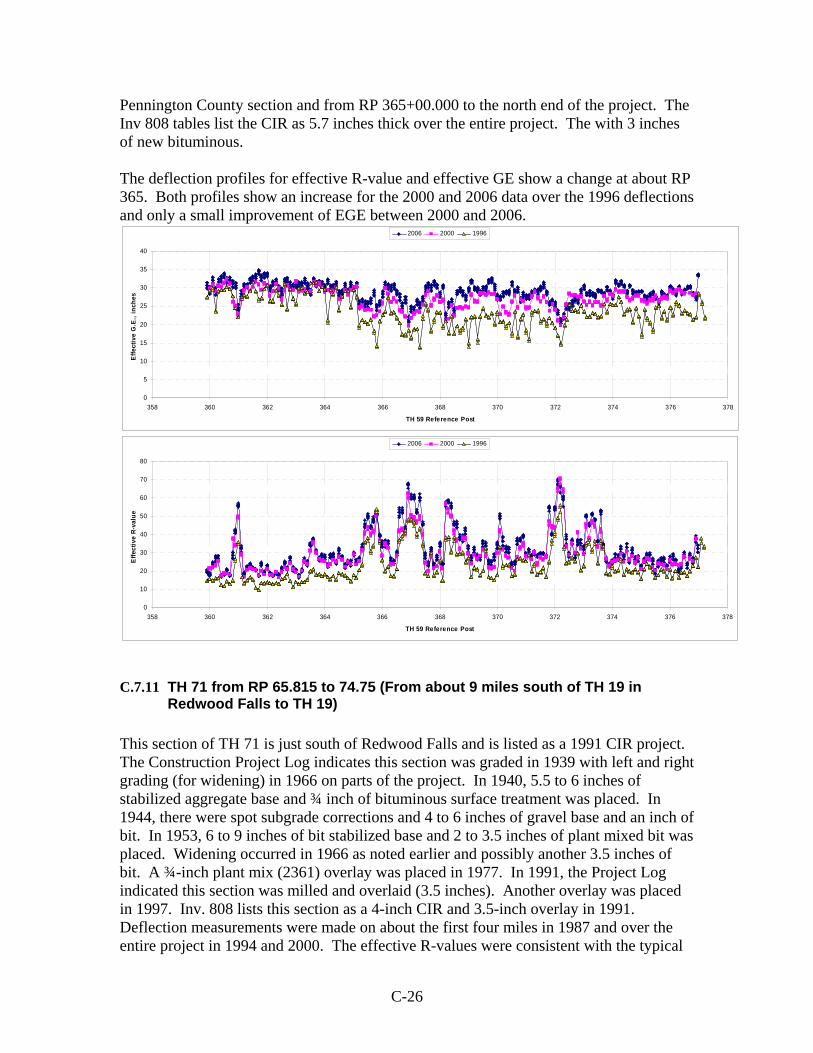
C-26
Pennington County section and from RP 365+00.000 to the north end of the project. The Inv 808 tables list the CIR as 5.7 inches thick over the entire project. The with 3 inches of new bituminous. The deflection profiles for effective R-value and effective GE show a change at about RP 365. Both profiles show an increase for the 2000 and 2006 data over the 1996 deflections and only a small improvement of EGE between 2000 and 2006.
0
5
10
15
20
25
30
35
40
358 360 362 364 366 368 370 372 374 376 378
TH 59 Reference Post
Effe
ctiv
e G
.E.,
inch
es
2006 2000 1996
0
10
20
30
40
50
60
70
80
358 360 362 364 366 368 370 372 374 376 378
TH 59 Reference Post
Effe
ctiv
e R-
valu
e
2006 2000 1996
C.7.11 TH 71 from RP 65.815 to 74.75 (From about 9 miles south of TH 19 in Redwood Falls to TH 19)
This section of TH 71 is just south of Redwood Falls and is listed as a 1991 CIR project. The Construction Project Log indicates this section was graded in 1939 with left and right grading (for widening) in 1966 on parts of the project. In 1940, 5.5 to 6 inches of stabilized aggregate base and ¾ inch of bituminous surface treatment was placed. In 1944, there were spot subgrade corrections and 4 to 6 inches of gravel base and an inch of bit. In 1953, 6 to 9 inches of bit stabilized base and 2 to 3.5 inches of plant mixed bit was placed. Widening occurred in 1966 as noted earlier and possibly another 3.5 inches of bit. A ¾-inch plant mix (2361) overlay was placed in 1977. In 1991, the Project Log indicated this section was milled and overlaid (3.5 inches). Another overlay was placed in 1997. Inv. 808 lists this section as a 4-inch CIR and 3.5-inch overlay in 1991. Deflection measurements were made on about the first four miles in 1987 and over the entire project in 1994 and 2000. The effective R-values were consistent with the typical
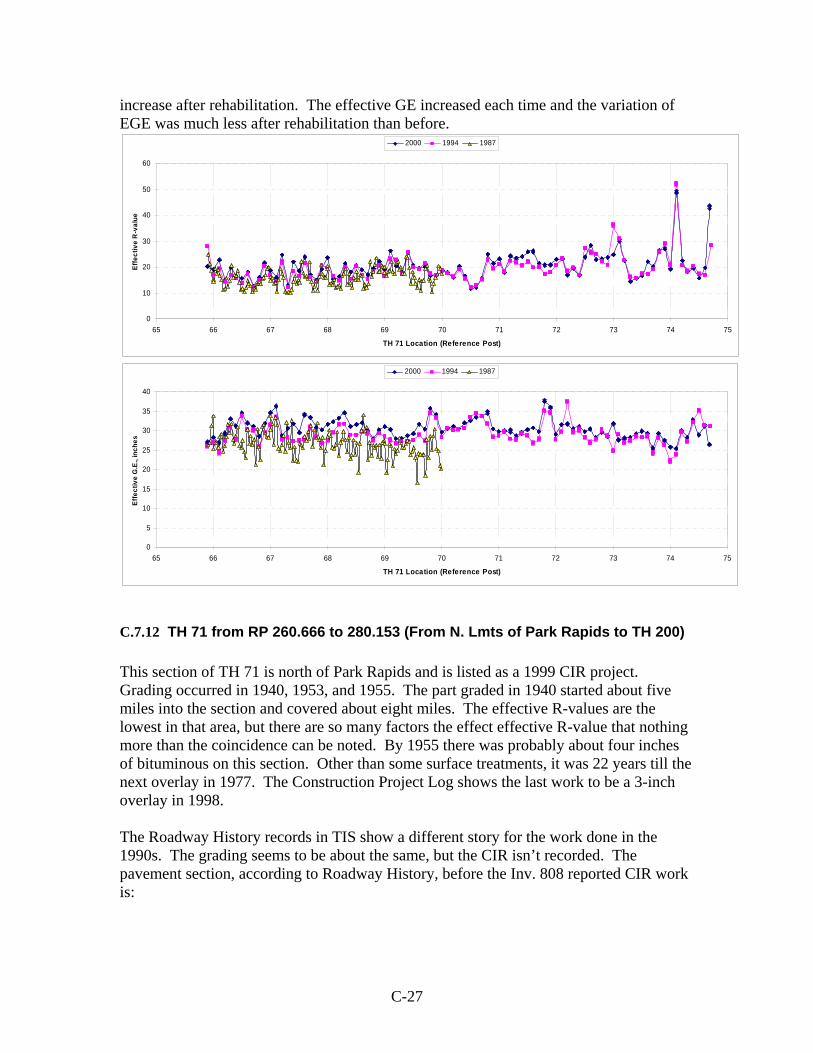
C-27
increase after rehabilitation. The effective GE increased each time and the variation of EGE was much less after rehabilitation than before.
0
10
20
30
40
50
60
65 66 67 68 69 70 71 72 73 74 75
TH 71 Location (Reference Post)
Effe
ctiv
e R
-val
ue2000 1994 1987
0
5
10
15
20
25
30
35
40
65 66 67 68 69 70 71 72 73 74 75
TH 71 Location (Reference Post)
Effe
ctiv
e G
.E.,
inch
es
2000 1994 1987
C.7.12 TH 71 from RP 260.666 to 280.153 (From N. Lmts of Park Rapids to TH 200) This section of TH 71 is north of Park Rapids and is listed as a 1999 CIR project. Grading occurred in 1940, 1953, and 1955. The part graded in 1940 started about five miles into the section and covered about eight miles. The effective R-values are the lowest in that area, but there are so many factors the effect effective R-value that nothing more than the coincidence can be noted. By 1955 there was probably about four inches of bituminous on this section. Other than some surface treatments, it was 22 years till the next overlay in 1977. The Construction Project Log shows the last work to be a 3-inch overlay in 1998. The Roadway History records in TIS show a different story for the work done in the 1990s. The grading seems to be about the same, but the CIR isn’t recorded. The pavement section, according to Roadway History, before the Inv. 808 reported CIR work is:
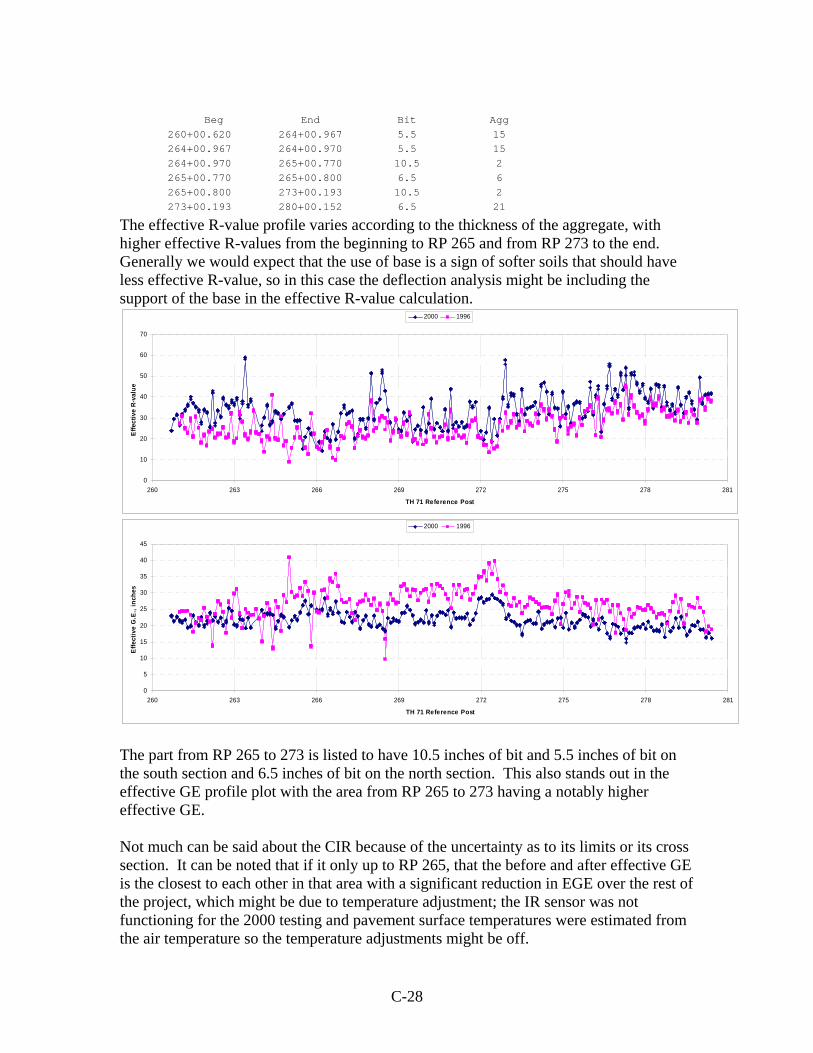
C-28
Beg End Bit Agg
260+00.620 264+00.967 5.5 15 264+00.967 264+00.970 5.5 15 264+00.970 265+00.770 10.5 2 265+00.770 265+00.800 6.5 6 265+00.800 273+00.193 10.5 2 273+00.193 280+00.152 6.5 21
The effective R-value profile varies according to the thickness of the aggregate, with higher effective R-values from the beginning to RP 265 and from RP 273 to the end. Generally we would expect that the use of base is a sign of softer soils that should have less effective R-value, so in this case the deflection analysis might be including the support of the base in the effective R-value calculation.
0
10
20
30
40
50
60
70
260 263 266 269 272 275 278 281
TH 71 Reference Post
Effe
ctiv
e R-
valu
e
2000 1996
0
5
10
15
20
25
30
35
40
45
260 263 266 269 272 275 278 281
TH 71 Reference Post
Effe
ctiv
e G
.E.,
inch
es
2000 1996
The part from RP 265 to 273 is listed to have 10.5 inches of bit and 5.5 inches of bit on the south section and 6.5 inches of bit on the north section. This also stands out in the effective GE profile plot with the area from RP 265 to 273 having a notably higher effective GE. Not much can be said about the CIR because of the uncertainty as to its limits or its cross section. It can be noted that if it only up to RP 265, that the before and after effective GE is the closest to each other in that area with a significant reduction in EGE over the rest of the project, which might be due to temperature adjustment; the IR sensor was not functioning for the 2000 testing and pavement surface temperatures were estimated from the air temperature so the temperature adjustments might be off.
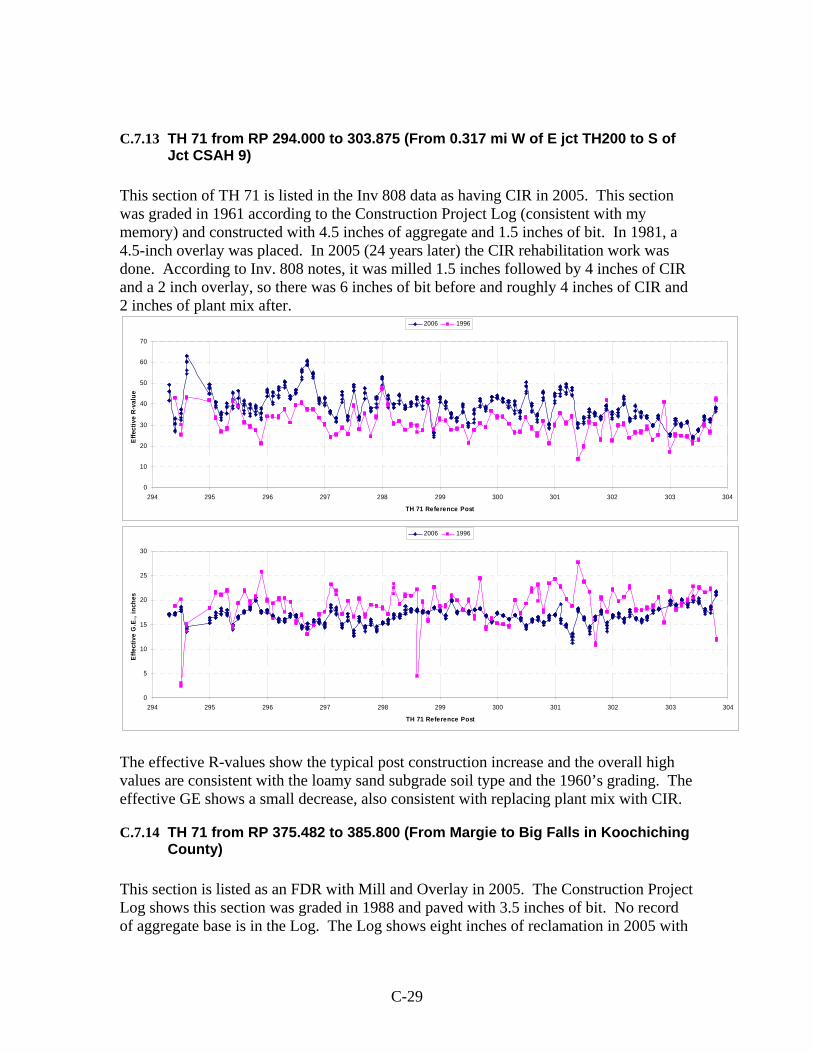
C-29
C.7.13 TH 71 from RP 294.000 to 303.875 (From 0.317 mi W of E jct TH200 to S of Jct CSAH 9)
This section of TH 71 is listed in the Inv 808 data as having CIR in 2005. This section was graded in 1961 according to the Construction Project Log (consistent with my memory) and constructed with 4.5 inches of aggregate and 1.5 inches of bit. In 1981, a 4.5-inch overlay was placed. In 2005 (24 years later) the CIR rehabilitation work was done. According to Inv. 808 notes, it was milled 1.5 inches followed by 4 inches of CIR and a 2 inch overlay, so there was 6 inches of bit before and roughly 4 inches of CIR and 2 inches of plant mix after.
0
10
20
30
40
50
60
70
294 295 296 297 298 299 300 301 302 303 304
TH 71 Reference Post
Effe
ctiv
e R-
valu
e
2006 1996
0
5
10
15
20
25
30
294 295 296 297 298 299 300 301 302 303 304
TH 71 Reference Post
Effe
ctiv
e G
.E.,
inch
es
2006 1996
The effective R-values show the typical post construction increase and the overall high values are consistent with the loamy sand subgrade soil type and the 1960’s grading. The effective GE shows a small decrease, also consistent with replacing plant mix with CIR.
C.7.14 TH 71 from RP 375.482 to 385.800 (From Margie to Big Falls in Koochiching County)
This section is listed as an FDR with Mill and Overlay in 2005. The Construction Project Log shows this section was graded in 1988 and paved with 3.5 inches of bit. No record of aggregate base is in the Log. The Log shows eight inches of reclamation in 2005 with
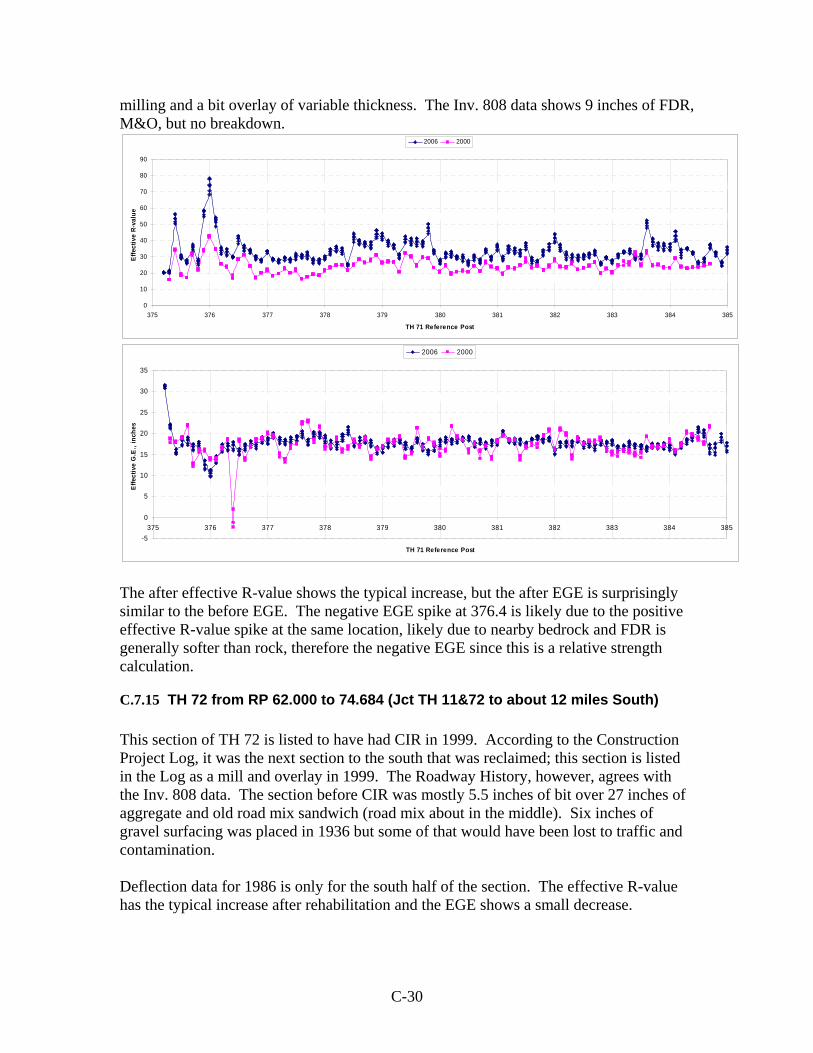
C-30
milling and a bit overlay of variable thickness. The Inv. 808 data shows 9 inches of FDR, M&O, but no breakdown.
0
10
20
30
40
50
60
70
80
90
375 376 377 378 379 380 381 382 383 384 385
TH 71 Reference Post
Effe
ctiv
e R-
valu
e2006 2000
-5
0
5
10
15
20
25
30
35
375 376 377 378 379 380 381 382 383 384 385
TH 71 Reference Post
Effe
ctiv
e G
.E.,
inch
es
2006 2000
The after effective R-value shows the typical increase, but the after EGE is surprisingly similar to the before EGE. The negative EGE spike at 376.4 is likely due to the positive effective R-value spike at the same location, likely due to nearby bedrock and FDR is generally softer than rock, therefore the negative EGE since this is a relative strength calculation.
C.7.15 TH 72 from RP 62.000 to 74.684 (Jct TH 11&72 to about 12 miles South) This section of TH 72 is listed to have had CIR in 1999. According to the Construction Project Log, it was the next section to the south that was reclaimed; this section is listed in the Log as a mill and overlay in 1999. The Roadway History, however, agrees with the Inv. 808 data. The section before CIR was mostly 5.5 inches of bit over 27 inches of aggregate and old road mix sandwich (road mix about in the middle). Six inches of gravel surfacing was placed in 1936 but some of that would have been lost to traffic and contamination. Deflection data for 1986 is only for the south half of the section. The effective R-value has the typical increase after rehabilitation and the EGE shows a small decrease.
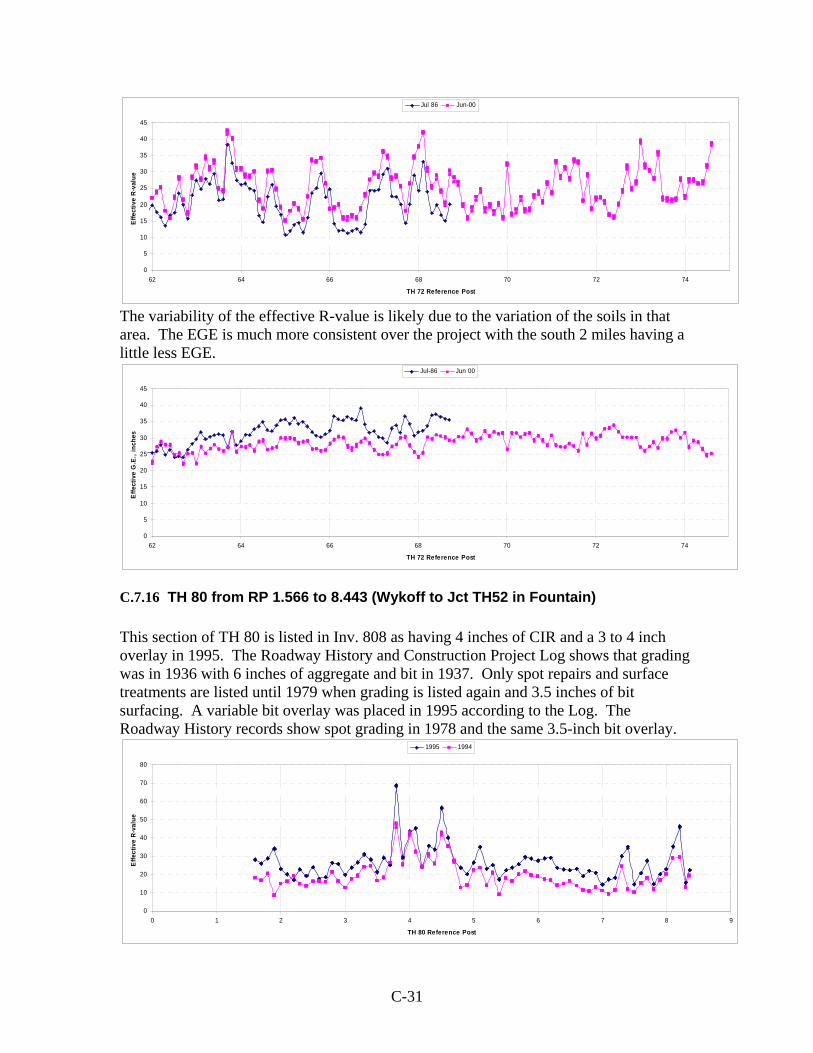
C-31
0
5
10
15
20
25
30
35
40
45
62 64 66 68 70 72 74
TH 72 Reference Post
Effe
ctiv
e R-
valu
e
Jul 86 Jun-00
The variability of the effective R-value is likely due to the variation of the soils in that area. The EGE is much more consistent over the project with the south 2 miles having a little less EGE.
0
5
10
15
20
25
30
35
40
45
62 64 66 68 70 72 74
TH 72 Reference Post
Effe
ctiv
e G
.E.,
inch
es
Jul-86 Jun 00
C.7.16 TH 80 from RP 1.566 to 8.443 (Wykoff to Jct TH52 in Fountain) This section of TH 80 is listed in Inv. 808 as having 4 inches of CIR and a 3 to 4 inch overlay in 1995. The Roadway History and Construction Project Log shows that grading was in 1936 with 6 inches of aggregate and bit in 1937. Only spot repairs and surface treatments are listed until 1979 when grading is listed again and 3.5 inches of bit surfacing. A variable bit overlay was placed in 1995 according to the Log. The Roadway History records show spot grading in 1978 and the same 3.5-inch bit overlay.
0
10
20
30
40
50
60
70
80
0 1 2 3 4 5 6 7 8 9
TH 80 Reference Post
Effe
ctiv
e R-
valu
e
1995 1994
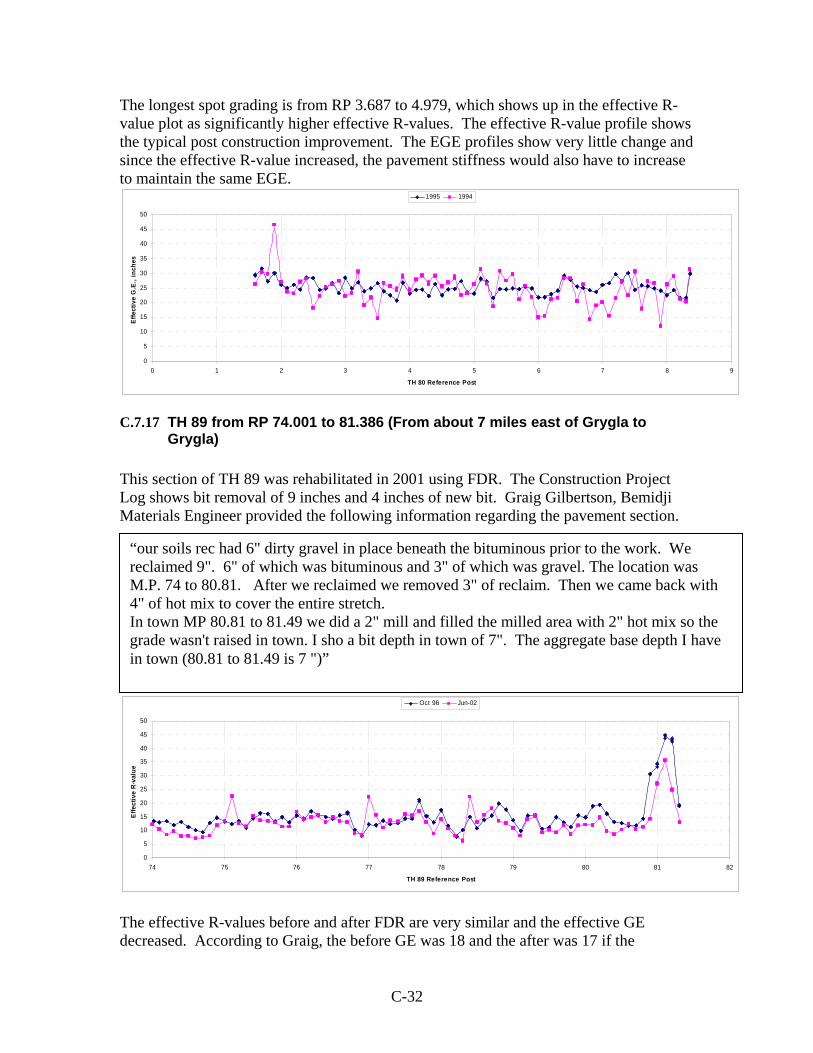
C-32
The longest spot grading is from RP 3.687 to 4.979, which shows up in the effective R-value plot as significantly higher effective R-values. The effective R-value profile shows the typical post construction improvement. The EGE profiles show very little change and since the effective R-value increased, the pavement stiffness would also have to increase to maintain the same EGE.
0
5
10
15
20
25
30
35
40
45
50
0 1 2 3 4 5 6 7 8 9
TH 80 Reference Post
Effe
ctiv
e G
.E.,
inch
es
1995 1994
C.7.17 TH 89 from RP 74.001 to 81.386 (From about 7 miles east of Grygla to Grygla)
This section of TH 89 was rehabilitated in 2001 using FDR. The Construction Project Log shows bit removal of 9 inches and 4 inches of new bit. Graig Gilbertson, Bemidji Materials Engineer provided the following information regarding the pavement section.
0
5
10
15
20
25
30
35
40
45
50
74 75 76 77 78 79 80 81 82
TH 89 Reference Post
Effe
ctiv
e R
-val
ue
Oct 96 Jun-02
The effective R-values before and after FDR are very similar and the effective GE decreased. According to Graig, the before GE was 18 and the after was 17 if the
“our soils rec had 6" dirty gravel in place beneath the bituminous prior to the work. We reclaimed 9". 6" of which was bituminous and 3" of which was gravel. The location was M.P. 74 to 80.81. After we reclaimed we removed 3" of reclaim. Then we came back with 4" of hot mix to cover the entire stretch. In town MP 80.81 to 81.49 we did a 2" mill and filled the milled area with 2" hot mix so the grade wasn't raised in town. I sho a bit depth in town of 7". The aggregate base depth I have in town (80.81 to 81.49 is 7 ")”
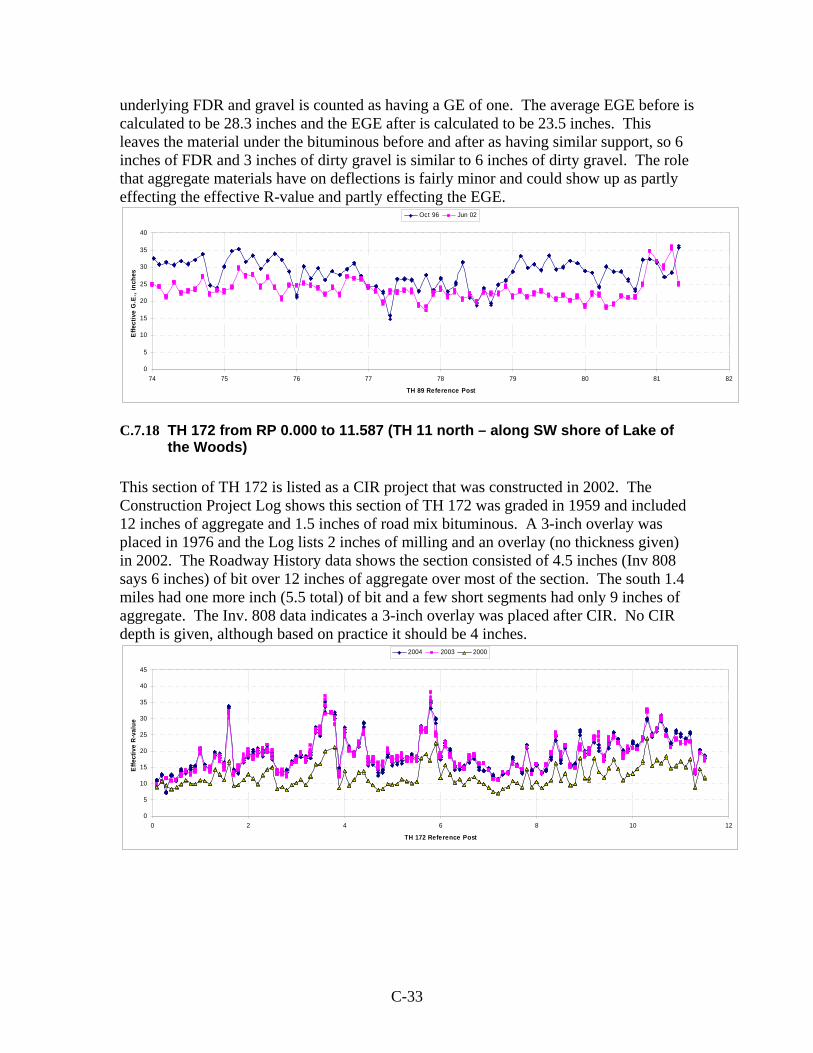
C-33
underlying FDR and gravel is counted as having a GE of one. The average EGE before is calculated to be 28.3 inches and the EGE after is calculated to be 23.5 inches. This leaves the material under the bituminous before and after as having similar support, so 6 inches of FDR and 3 inches of dirty gravel is similar to 6 inches of dirty gravel. The role that aggregate materials have on deflections is fairly minor and could show up as partly effecting the effective R-value and partly effecting the EGE.
0
5
10
15
20
25
30
35
40
74 75 76 77 78 79 80 81 82
TH 89 Reference Post
Effe
ctiv
e G
.E.,
inch
es
Oct 96 Jun 02
C.7.18 TH 172 from RP 0.000 to 11.587 (TH 11 north – along SW shore of Lake of the Woods)
This section of TH 172 is listed as a CIR project that was constructed in 2002. The Construction Project Log shows this section of TH 172 was graded in 1959 and included 12 inches of aggregate and 1.5 inches of road mix bituminous. A 3-inch overlay was placed in 1976 and the Log lists 2 inches of milling and an overlay (no thickness given) in 2002. The Roadway History data shows the section consisted of 4.5 inches (Inv 808 says 6 inches) of bit over 12 inches of aggregate over most of the section. The south 1.4 miles had one more inch (5.5 total) of bit and a few short segments had only 9 inches of aggregate. The Inv. 808 data indicates a 3-inch overlay was placed after CIR. No CIR depth is given, although based on practice it should be 4 inches.
0
5
10
15
20
25
30
35
40
45
0 2 4 6 8 10 12
TH 172 Reference Post
Effe
ctiv
e R-
valu
e
2004 2003 2000
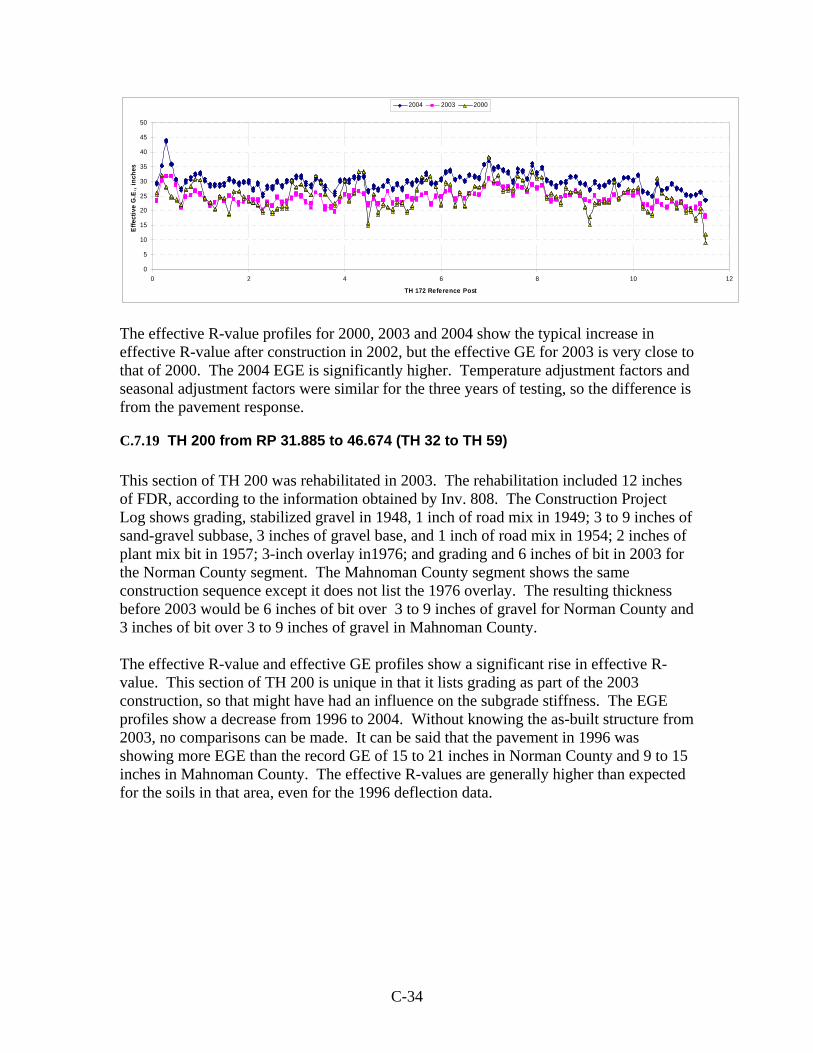
C-34
0
5
10
15
20
25
30
35
40
45
50
0 2 4 6 8 10 12
TH 172 Reference Post
Effe
ctiv
e G
.E.,
inch
es
2004 2003 2000
The effective R-value profiles for 2000, 2003 and 2004 show the typical increase in effective R-value after construction in 2002, but the effective GE for 2003 is very close to that of 2000. The 2004 EGE is significantly higher. Temperature adjustment factors and seasonal adjustment factors were similar for the three years of testing, so the difference is from the pavement response.
C.7.19 TH 200 from RP 31.885 to 46.674 (TH 32 to TH 59) This section of TH 200 was rehabilitated in 2003. The rehabilitation included 12 inches of FDR, according to the information obtained by Inv. 808. The Construction Project Log shows grading, stabilized gravel in 1948, 1 inch of road mix in 1949; 3 to 9 inches of sand-gravel subbase, 3 inches of gravel base, and 1 inch of road mix in 1954; 2 inches of plant mix bit in 1957; 3-inch overlay in1976; and grading and 6 inches of bit in 2003 for the Norman County segment. The Mahnoman County segment shows the same construction sequence except it does not list the 1976 overlay. The resulting thickness before 2003 would be 6 inches of bit over 3 to 9 inches of gravel for Norman County and 3 inches of bit over 3 to 9 inches of gravel in Mahnoman County. The effective R-value and effective GE profiles show a significant rise in effective R-value. This section of TH 200 is unique in that it lists grading as part of the 2003 construction, so that might have had an influence on the subgrade stiffness. The EGE profiles show a decrease from 1996 to 2004. Without knowing the as-built structure from 2003, no comparisons can be made. It can be said that the pavement in 1996 was showing more EGE than the record GE of 15 to 21 inches in Norman County and 9 to 15 inches in Mahnoman County. The effective R-values are generally higher than expected for the soils in that area, even for the 1996 deflection data.
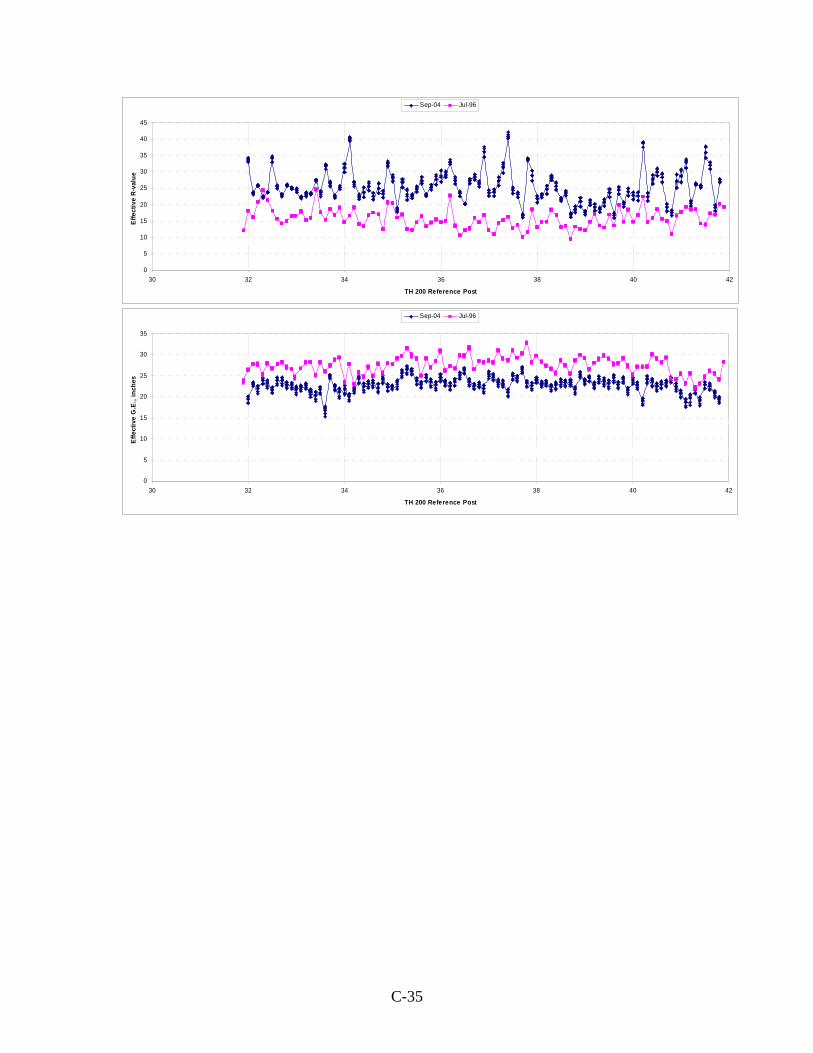
C-35
0
5
10
15
20
25
30
35
40
45
30 32 34 36 38 40 42
TH 200 Reference Post
Effe
ctiv
e R-
valu
e
Sep-04 Jul-96
0
5
10
15
20
25
30
35
30 32 34 36 38 40 42
TH 200 Reference Post
Effe
ctiv
e G
.E.,
inch
es
Sep-04 Jul-96
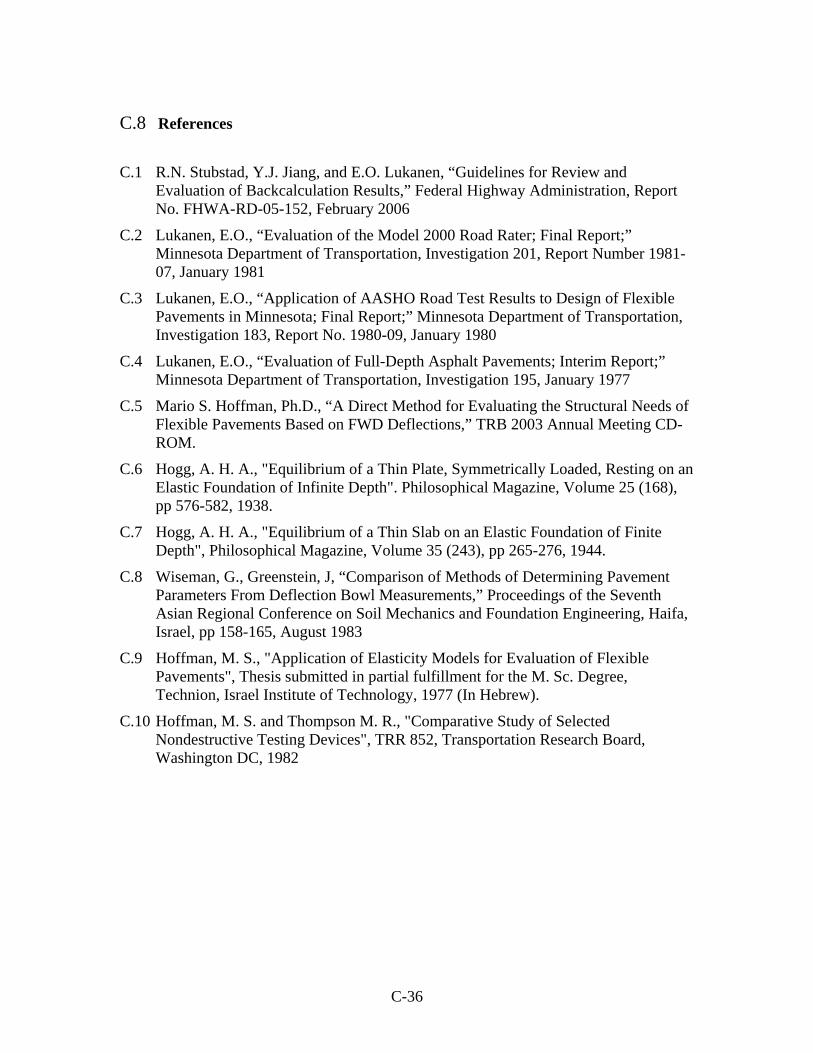
C-36
C.8 References
C.1 R.N. Stubstad, Y.J. Jiang, and E.O. Lukanen, “Guidelines for Review and Evaluation of Backcalculation Results,” Federal Highway Administration, Report No. FHWA-RD-05-152, February 2006
C.2 Lukanen, E.O., “Evaluation of the Model 2000 Road Rater; Final Report;” Minnesota Department of Transportation, Investigation 201, Report Number 1981-07, January 1981
C.3 Lukanen, E.O., “Application of AASHO Road Test Results to Design of Flexible Pavements in Minnesota; Final Report;” Minnesota Department of Transportation, Investigation 183, Report No. 1980-09, January 1980
C.4 Lukanen, E.O., “Evaluation of Full-Depth Asphalt Pavements; Interim Report;” Minnesota Department of Transportation, Investigation 195, January 1977
C.5 Mario S. Hoffman, Ph.D., “A Direct Method for Evaluating the Structural Needs of Flexible Pavements Based on FWD Deflections,” TRB 2003 Annual Meeting CD-ROM.
C.6 Hogg, A. H. A., "Equilibrium of a Thin Plate, Symmetrically Loaded, Resting on an Elastic Foundation of Infinite Depth". Philosophical Magazine, Volume 25 (168), pp 576-582, 1938.
C.7 Hogg, A. H. A., "Equilibrium of a Thin Slab on an Elastic Foundation of Finite Depth", Philosophical Magazine, Volume 35 (243), pp 265-276, 1944.
C.8 Wiseman, G., Greenstein, J, “Comparison of Methods of Determining Pavement Parameters From Deflection Bowl Measurements,” Proceedings of the Seventh Asian Regional Conference on Soil Mechanics and Foundation Engineering, Haifa, Israel, pp 158-165, August 1983
C.9 Hoffman, M. S., "Application of Elasticity Models for Evaluation of Flexible Pavements", Thesis submitted in partial fulfillment for the M. Sc. Degree, Technion, Israel Institute of Technology, 1977 (In Hebrew).
C.10 Hoffman, M. S. and Thompson M. R., "Comparative Study of Selected Nondestructive Testing Devices", TRR 852, Transportation Research Board, Washington DC, 1982

Appendix D Pre-rehabilitation SR Values for Projects to be rehabilitated
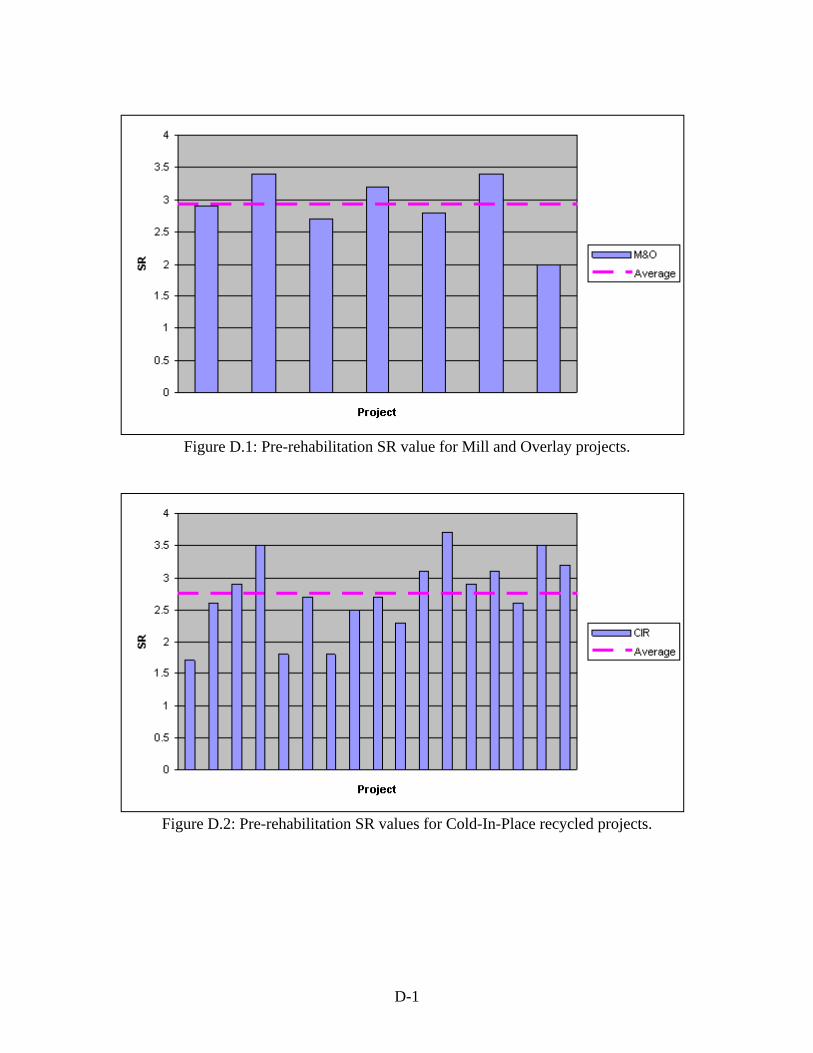
D-1
Figure D.1: Pre-rehabilitation SR value for Mill and Overlay projects.
Figure D.2: Pre-rehabilitation SR values for Cold-In-Place recycled projects.
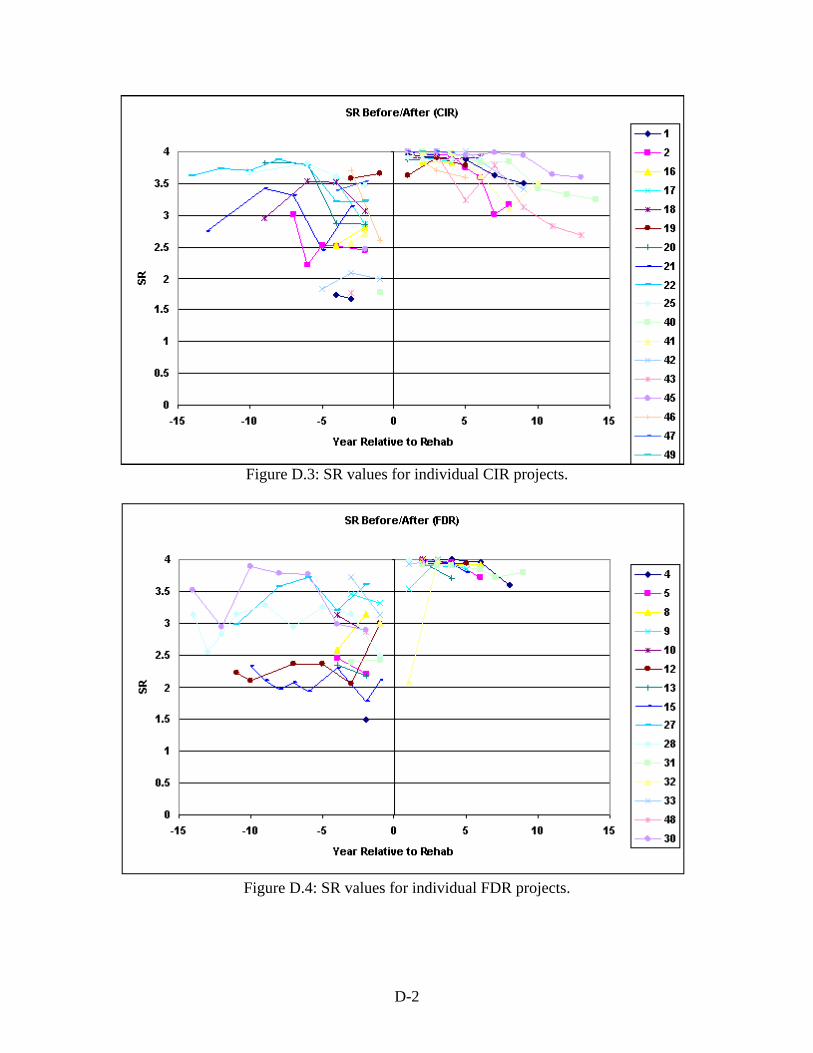
D-2
Figure D.3: SR values for individual CIR projects.
Figure D.4: SR values for individual FDR projects.
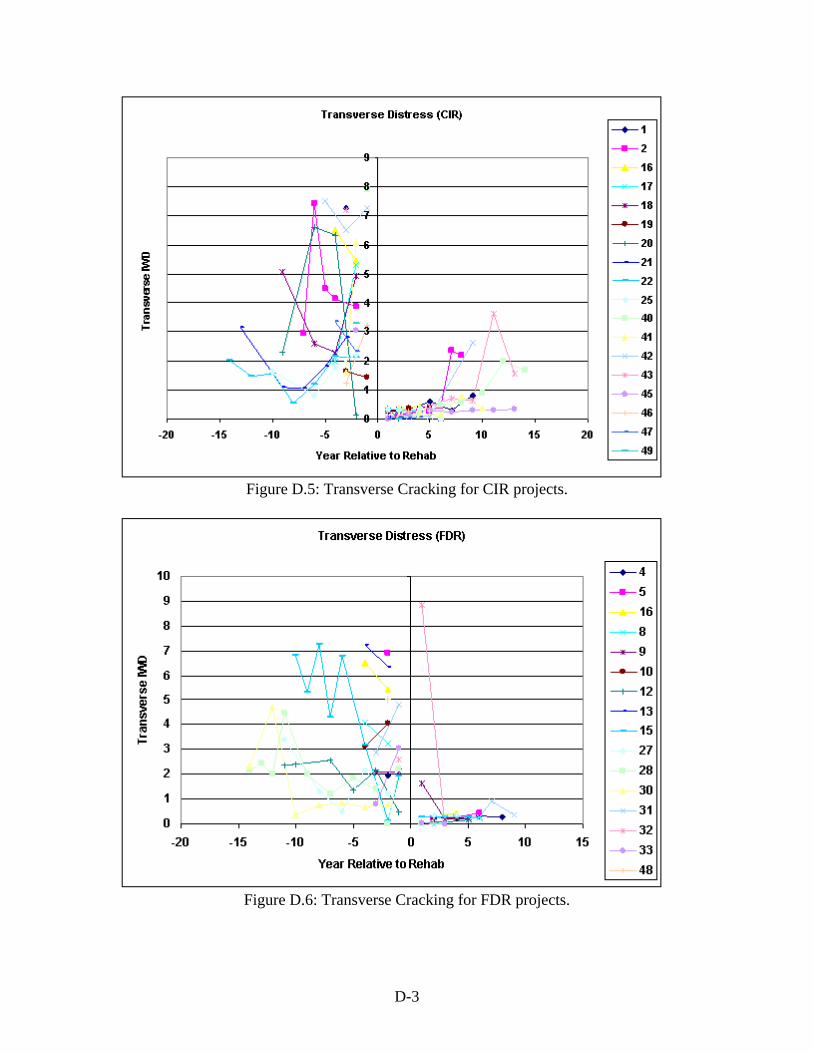
D-3
Figure D.5: Transverse Cracking for CIR projects.
Figure D.6: Transverse Cracking for FDR projects.
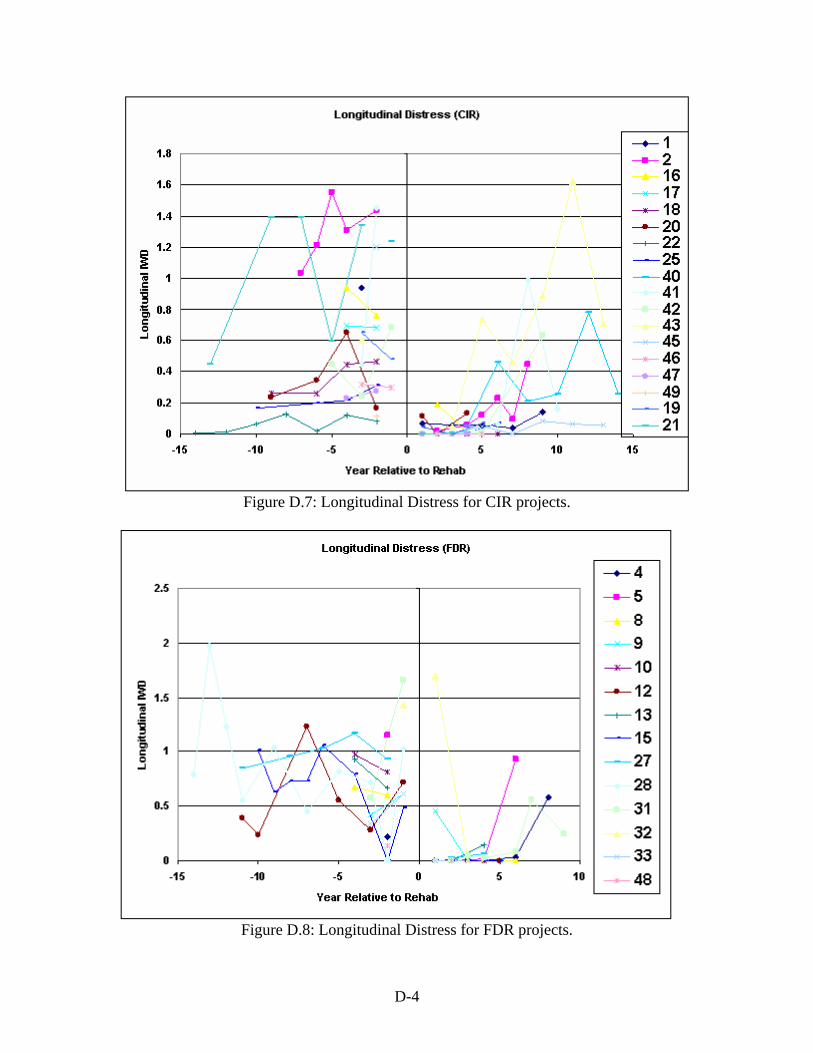
D-4
Figure D.7: Longitudinal Distress for CIR projects.
Figure D.8: Longitudinal Distress for FDR projects.

Appendix E Checklist for Pavement Rehabilitation Decision Procedure

E-1
The project specifically looked at unstabilized full-depth reclamation (FDR), cold in-place recycling (CIR), and mill and overlay (M&O). This appendix is the summary of the decision procedures, which is intended to provide users a simple, step-by-step and useful tool to make decision on rehabilitation methods.
E.1 Geometrics Checklist
The Geometrics Checklist includes information on the cross section, which must be considered when designing the project. The list may also be used to determine which procedure is most appropriate for a project.
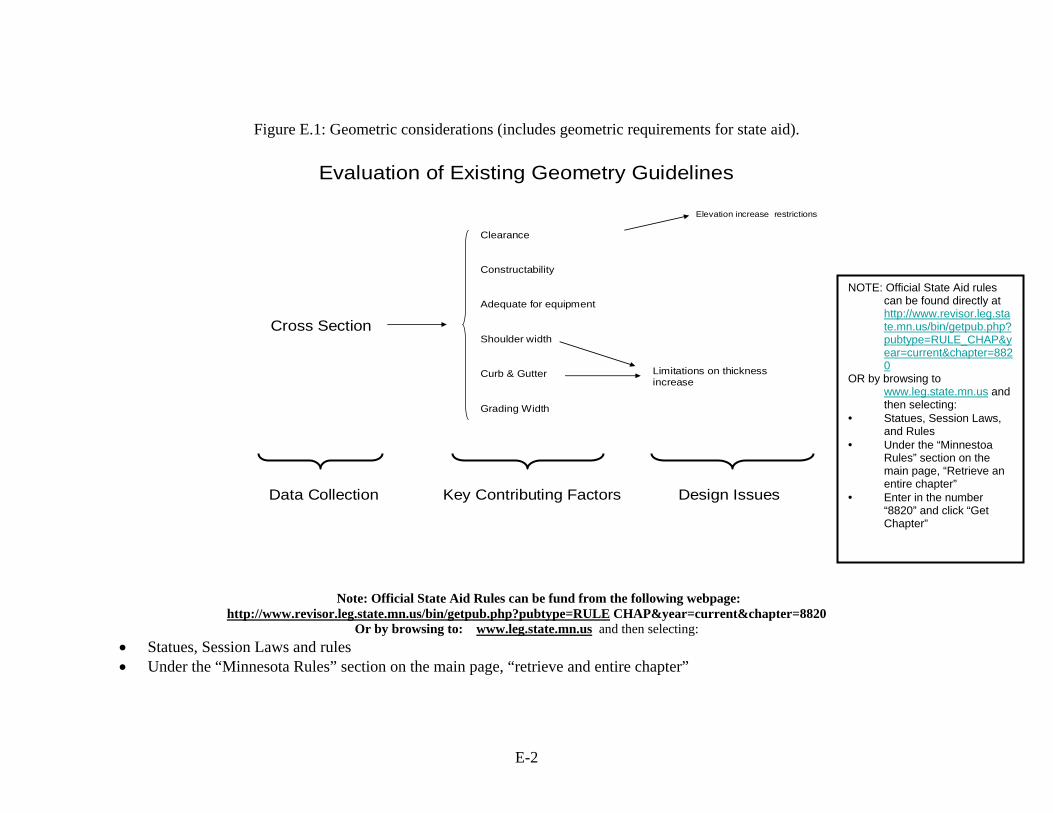
E-2
Figure E.1: Geometric considerations (includes geometric requirements for state aid).
Evaluation of Existing Geometry Guidelines
Cross Section
Clearance
Elevation increase restrictions
Constructability
Adequate for equipment
Shoulder width
Curb & Gutter
Grading Width
Data Collection Key Contributing Factors Design Issues
Limitations on thickness increase
Note: Official State Aid Rules can be fund from the following webpage: http://www.revisor.leg.state.mn.us/bin/getpub.php?pubtype=RULE CHAP&year=current&chapter=8820
Or by browsing to: www.leg.state.mn.us and then selecting: • Statues, Session Laws and rules • Under the “Minnesota Rules” section on the main page, “retrieve and entire chapter”
NOTE: Official State Aid rules can be found directly at http://www.revisor.leg.state.mn.us/bin/getpub.php?pubtype=RULE_CHAP&year=current&chapter=8820
OR by browsing to www.leg.state.mn.us and then selecting:
• Statues, Session Laws, and Rules
• Under the “Minnestoa Rules” section on the main page, “Retrieve an entire chapter”
• Enter in the number “8820” and click “Get Chapter”
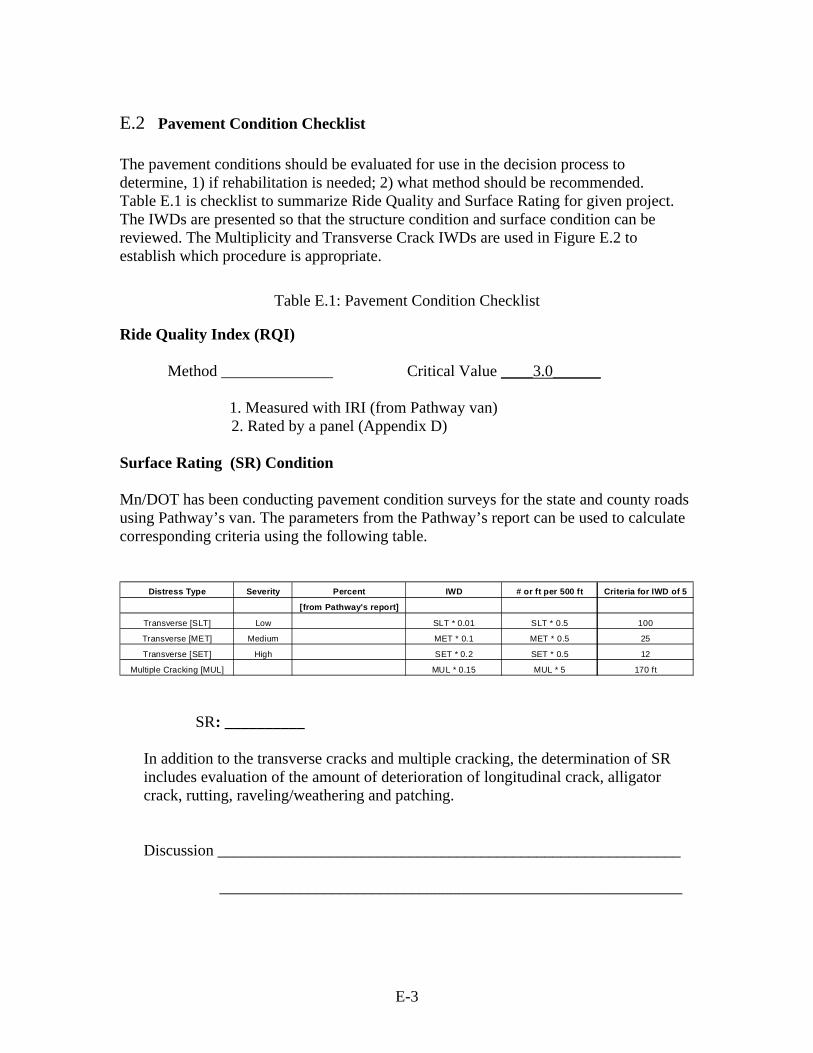
E-3
E.2 Pavement Condition Checklist The pavement conditions should be evaluated for use in the decision process to determine, 1) if rehabilitation is needed; 2) what method should be recommended. Table E.1 is checklist to summarize Ride Quality and Surface Rating for given project. The IWDs are presented so that the structure condition and surface condition can be reviewed. The Multiplicity and Transverse Crack IWDs are used in Figure E.2 to establish which procedure is appropriate.
Table E.1: Pavement Condition Checklist
Ride Quality Index (RQI)
Method ______________ Critical Value ____3.0______
1. Measured with IRI (from Pathway van) 2. Rated by a panel (Appendix D)
Surface Rating (SR) Condition Mn/DOT has been conducting pavement condition surveys for the state and county roads using Pathway’s van. The parameters from the Pathway’s report can be used to calculate corresponding criteria using the following table.
Distress Type Severity Percent IWD # or ft per 500 ft Criteria for IWD of 5
[from Pathway's report]
Transverse [SLT] Low SLT * 0.01 SLT * 0.5 100
Transverse [MET] Medium MET * 0.1 MET * 0.5 25
Transverse [SET] High SET * 0.2 SET * 0.5 12
Multiple Cracking [MUL] MUL * 0.15 MUL * 5 170 ft
SR : __________ In addition to the transverse cracks and multiple cracking, the determination of SR includes evaluation of the amount of deterioration of longitudinal crack, alligator crack, rutting, raveling/weathering and patching. Discussion __________________________________________________________ __________________________________________________________
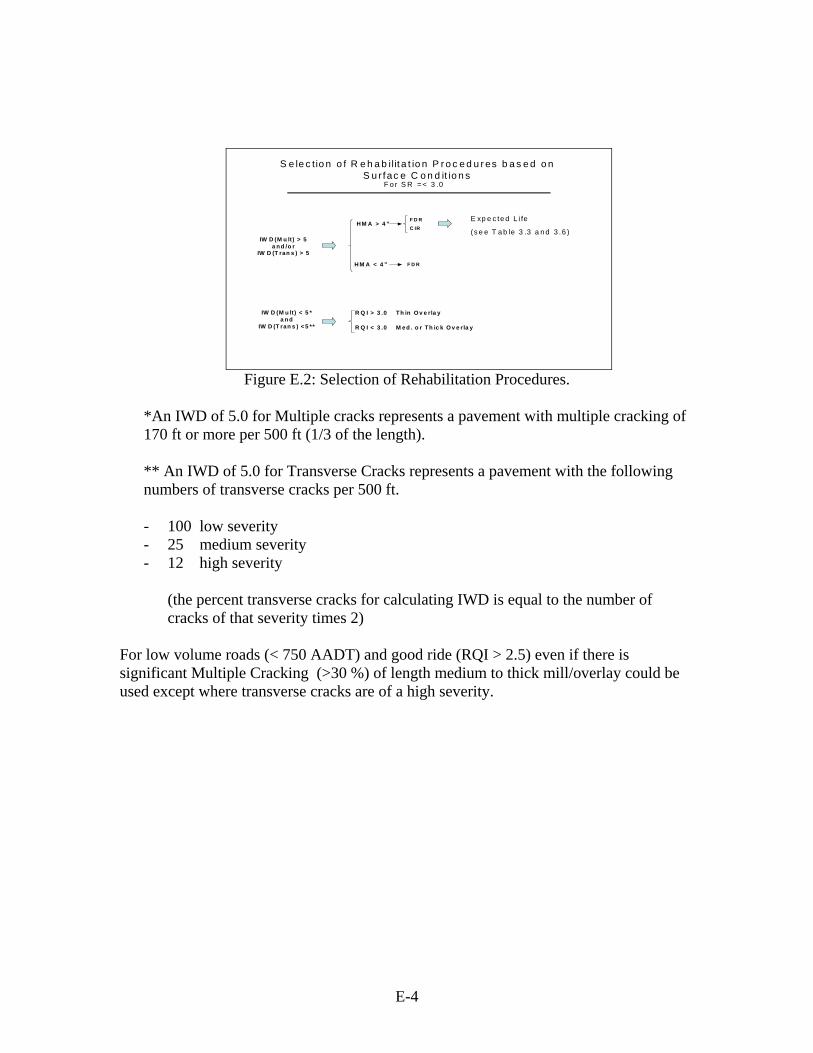
E-4
S e le c tio n o f R e h a b ilit a t io n P r o c e d u r es b a s e d o n S u r fac e C o n d it io n s
IW D (M u lt) > 5a n d /o r
IW D (T ran s ) > 5
H M A > 4 ”F D RC IR
H M A < 4 ” F D R
IW D (M u lt) < 5 *a n d
IW D (T ran s ) < 5 **
R Q I > 3 .0 Th in O v e rla y
R Q I < 3 .0 M e d . o r Th ic k O v e r la y
F o r S R = < 3 .0
E xp e c te d L i fe
(s e e T a b le 3 .3 a n d 3 .6 )
Figure E.2: Selection of Rehabilitation Procedures.
*An IWD of 5.0 for Multiple cracks represents a pavement with multiple cracking of 170 ft or more per 500 ft (1/3 of the length). ** An IWD of 5.0 for Transverse Cracks represents a pavement with the following numbers of transverse cracks per 500 ft. - 100 low severity - 25 medium severity - 12 high severity
(the percent transverse cracks for calculating IWD is equal to the number of cracks of that severity times 2)
For low volume roads (< 750 AADT) and good ride (RQI > 2.5) even if there is significant Multiple Cracking (>30 %) of length medium to thick mill/overlay could be used except where transverse cracks are of a high severity.
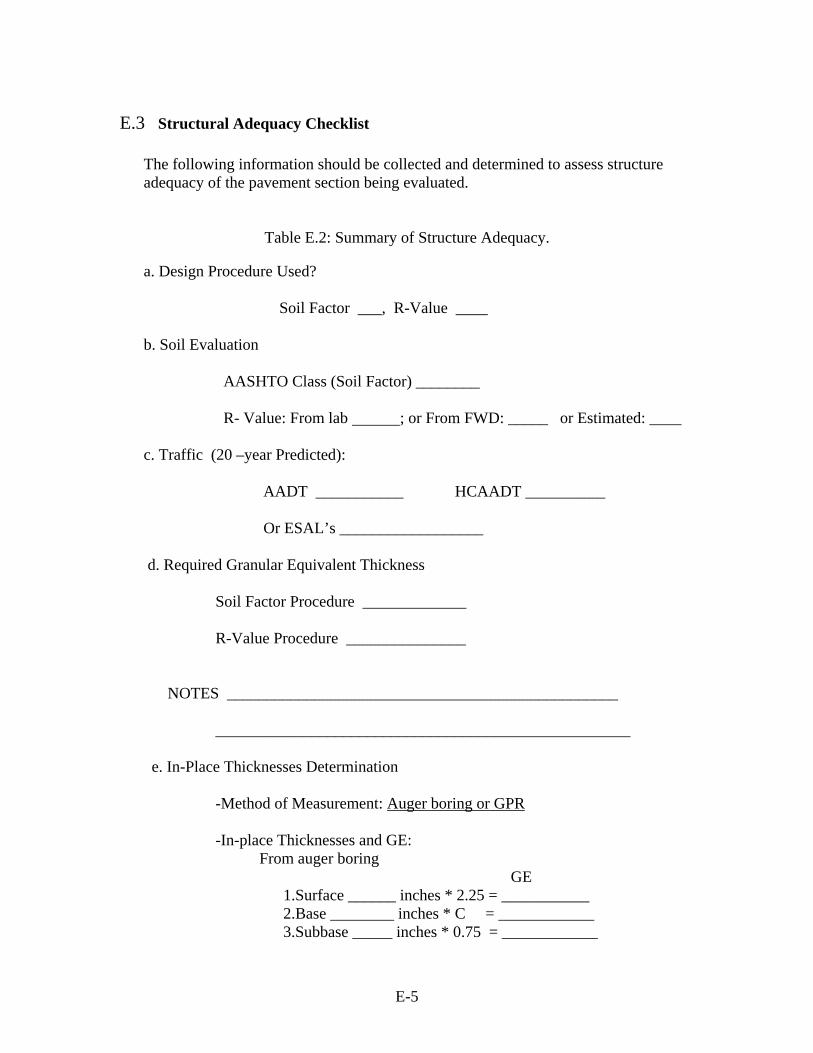
E-5
E.3 Structural Adequacy Checklist The following information should be collected and determined to assess structure adequacy of the pavement section being evaluated.
Table E.2: Summary of Structure Adequacy.
a. Design Procedure Used?
Soil Factor ___, R-Value ____ b. Soil Evaluation
AASHTO Class (Soil Factor) ________ R- Value: From lab ; or From FWD: _____ or Estimated: ____
c. Traffic (20 –year Predicted):
AADT ___________ HCAADT __________ Or ESAL’s __________________
d. Required Granular Equivalent Thickness
Soil Factor Procedure _____________ R-Value Procedure _______________
NOTES _________________________________________________ ____________________________________________________ e. In-Place Thicknesses Determination
-Method of Measurement: Auger boring or GPR
-In-place Thicknesses and GE:
From auger boring GE
1.Surface ______ inches * 2.25 = ___________ 2.Base ________ inches * C = ____________ 3.Subbase _____ inches * 0.75 = ____________

E-6
Total GE = ___________ inches. C: 1 for Cl5 or Cl6 or Cl7 0.75 for Cl3 or Cl4
From FWD: Total Granular Equivalent = ________inches.
-Comparison of Design Thickness with In-Place Thickness:
Difference between in-place GE and design GE:_____________ Comments:_______________________________________________ _______________________________________________
f. Tonnage
-Existing ___________________ -Desired Tonnage ____________
g. Is more structure needed?_____________________
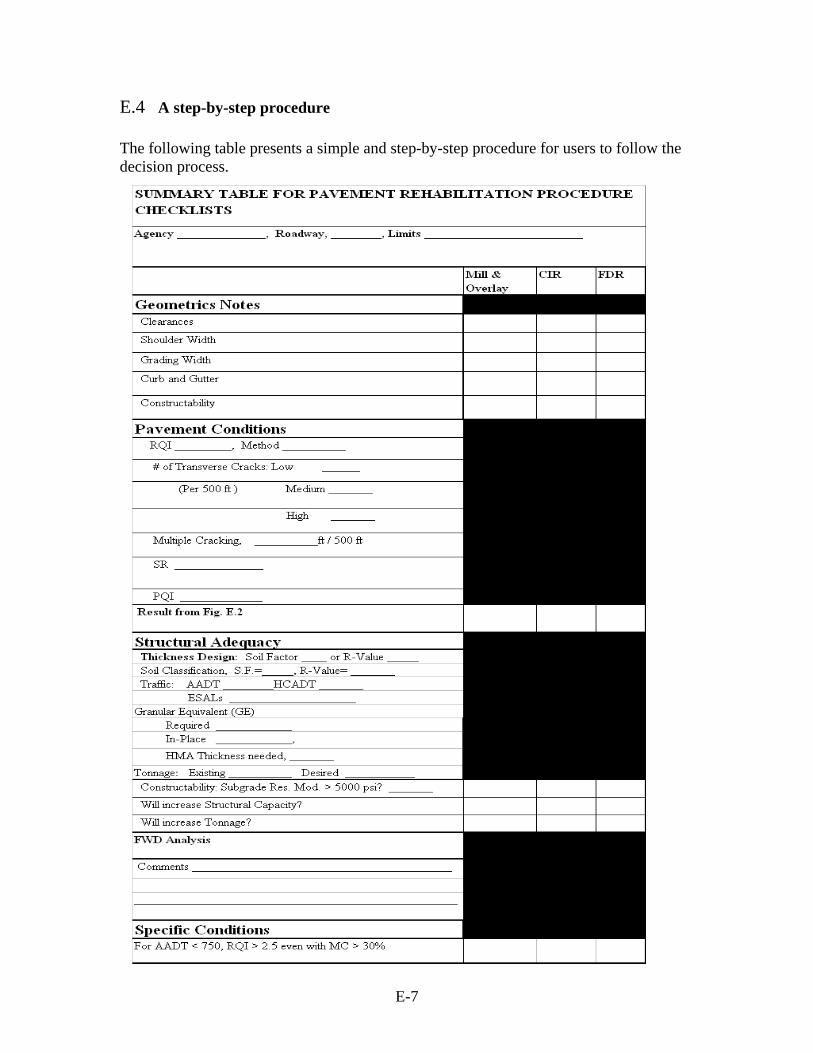
E-7
E.4 A step-by-step procedure
The following table presents a simple and step-by-step procedure for users to follow the decision process.