Embed Size (px)
Citation preview
© 2007 Lenovo
Lenovo Group Limited2007/08 Interim Results
November 1, 2007
© 2007 Lenovo
Wong Wai MingSenior Vice President & Chief Financial Officer
© 2007 Lenovo 3
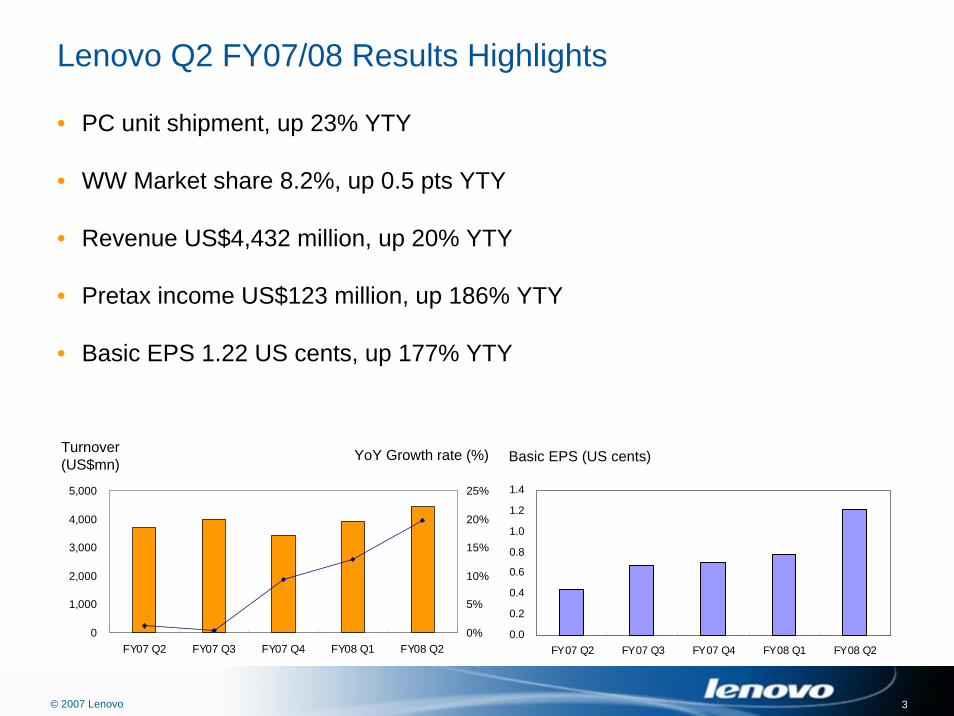
Lenovo Q2 FY07/08 Results Highlights
• PC unit shipment, up 23% YTY
• WW Market share 8.2%, up 0.5 pts YTY
• Revenue US$4,432 million, up 20% YTY
• Pretax income US$123 million, up 186% YTY
• Basic EPS 1.22 US cents, up 177% YTY
0
1,000
2,000
3,000
4,000
5,000
FY07 Q2 FY07 Q3 FY07 Q4 FY08 Q1 FY08 Q20%
5%
10%
15%
20%
25%
Turnover (US$mn) YoY Growth rate (%) Basic EPS (US cents)
0.0
0.2
0.4
0.6
0.8
1.0
1.2
1.4
FY07 Q2 FY07 Q3 FY07 Q4 FY08 Q1 FY08 Q2
© 2007 Lenovo 4
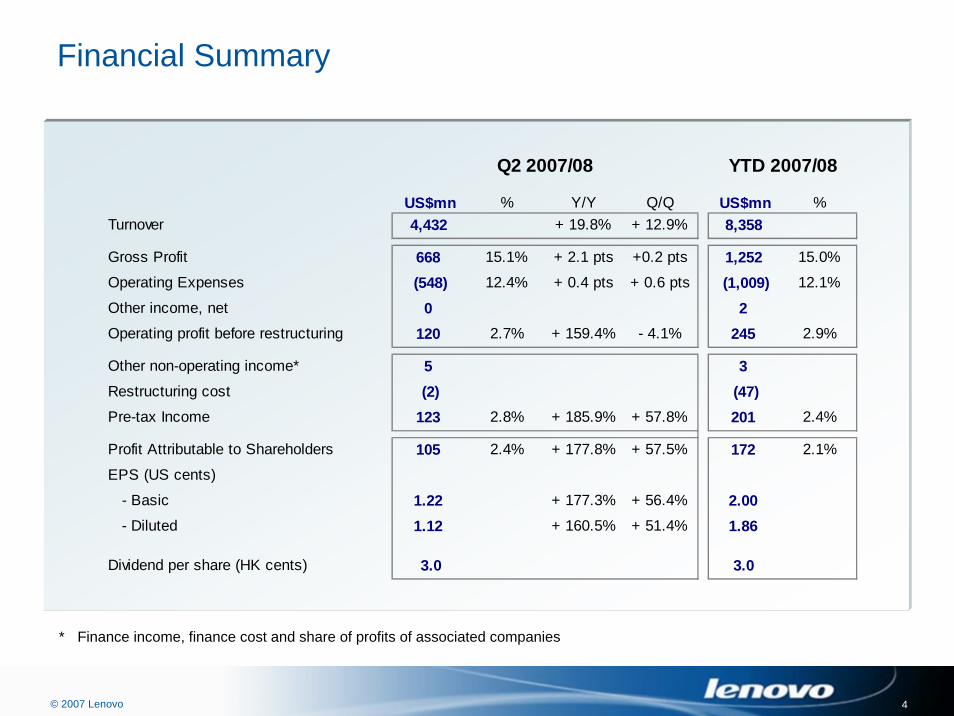
Financial Summary
* Finance income, finance cost and share of profits of associated companies
US$mn % Y/Y Q/Q US$mn %Turnover 4,432 + 19.8% + 12.9% 8,358
Gross Profit 668 15.1% + 2.1 pts +0.2 pts 1,252 15.0%
Operating Expenses (548) 12.4% + 0.4 pts + 0.6 pts (1,009) 12.1%
Other income, net 0 2Operating profit before restructuring 120 2.7% + 159.4% - 4.1% 245 2.9%
Other non-operating income* 5 3Restructuring cost (2) (47)Pre-tax Income 123 2.8% + 185.9% + 57.8% 201 2.4%
Profit Attributable to Shareholders 105 2.4% + 177.8% + 57.5% 172 2.1%
EPS (US cents)
- Basic 1.22 + 177.3% + 56.4% 2.00- Diluted 1.12 + 160.5% + 51.4% 1.86
Dividend per share (HK cents) 3.0 3.0
YTD 2007/08Q2 2007/08

© 2007 Lenovo 5
Condensed Balance Sheet
As at As at US$ mn Sept 30, 2007 Mar 31, 2007
Non-current assets 2,461 2,388 Property, plant and equipment 347 326 Intangible assets 1,851 1,868 Others 263 194
Current assets 4,192 3,061 Cash and cash equivalents 1,882 1,064 Account receivables and others 1,943 1,617 Inventory 353 358 Tax recoverable 14 22
Current liabilities 4,473 3,526 Short-term bank loans 81 18 Account payables and others 4,381 3,499 Marketing rights 11 9
Net current liabilities 281 465
Non-current liabilities 845 789
Total equity 1,335 1,134

© 2007 Lenovo 6
Cash and Working Capital
* Excluding restructuring charges
US$mn Q2 2007/08 Q2 2006/07 Q1 2007/08
EBITDA* 210 89 182
Cash Reserves 1,882 1,101 1,507Total Bank Borrowings 181 111 193Net Cash Reserves 1,701 990 1,314
Days Inventory 9 10 11Days Receivable 24 23 23Days Payable 62 59 60Cash Conversion Cycle -29 days -26 days -26 days
© 2007 Lenovo 7
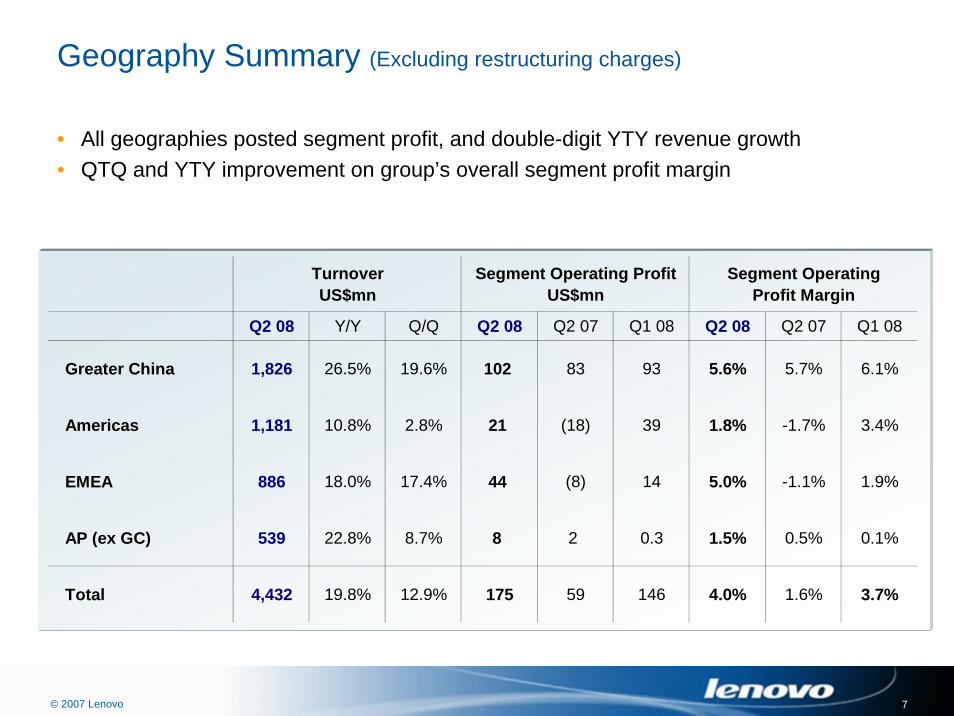
Geography Summary (Excluding restructuring charges)
• All geographies posted segment profit, and double-digit YTY revenue growth • QTQ and YTY improvement on group’s overall segment profit margin
Q2 08 Y/Y Q/Q Q2 08 Q2 07 Q1 08 Q2 08 Q2 07 Q1 08
Greater China 1,826 26.5% 19.6% 102 83 93 5.6% 5.7% 6.1%
Americas 1,181 10.8% 2.8% 21 (18) 39 1.8% -1.7% 3.4%
EMEA 886 18.0% 17.4% 44 (8) 14 5.0% -1.1% 1.9%
AP (ex GC) 539 22.8% 8.7% 8 2 0.3 1.5% 0.5% 0.1%
Total 4,432 19.8% 12.9% 175 59 146 4.0% 1.6% 3.7%
Segment OperatingProfit Margin
TurnoverUS$mn
Segment Operating ProfitUS$mn
© 2007 Lenovo 8
0
500
1,000
1,500
2,000
FY07 Q2 FY07 Q3 FY07 Q4 FY08 Q1 FY08 Q20%
5%
10%
15%
20%
25%
30%
35.9%35.1%
31.6%
36.1%
35.5%
35.1%
31.3%
35.8%34.5%
33.8%
29.6%
32.1%31.7%
31.2%
20%
30%
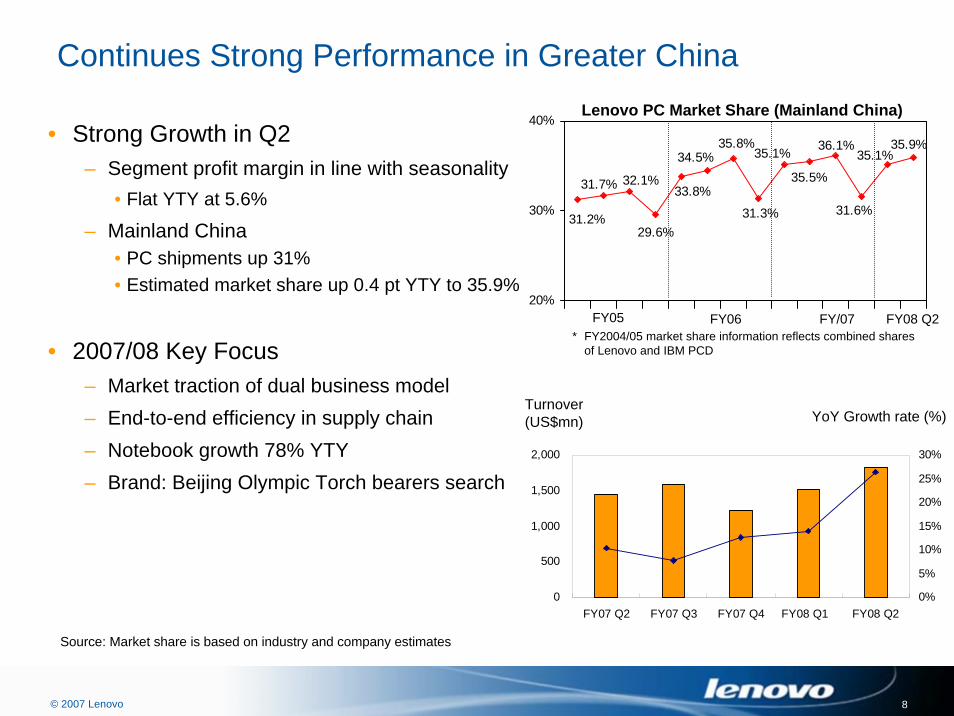
40%• Strong Growth in Q2
– Segment profit margin in line with seasonality• Flat YTY at 5.6%
– Mainland China• PC shipments up 31%• Estimated market share up 0.4 pt YTY to 35.9%
• 2007/08 Key Focus– Market traction of dual business model– End-to-end efficiency in supply chain – Notebook growth 78% YTY– Brand: Beijing Olympic Torch bearers search
Continues Strong Performance in Greater China
FY05 FY06 FY/07
Lenovo PC Market Share (Mainland China)
* FY2004/05 market share information reflects combined shares of Lenovo and IBM PCD
Source: Market share is based on industry and company estimates
FY08 Q2
Turnover (US$mn) YoY Growth rate (%)

© 2007 Lenovo 9
0
200
400
600
800
1,000
1,200
1,400
FY07 Q2 FY07 Q3 FY07 Q4 FY08 Q1 FY08 Q2-15%
-10%
-5%
0%
5%
10%
15%
Americas & EMEA
• Americas– Q2 PC shipments up 12% YTY – Driven by great progress in transaction model roll-out– Gained shares in the U.S. for three consecutive quarters – Segment profit margin lower QTQ with more aggressive pricing
• EMEA– Q2 PC shipments up 16% YTY – Transaction model drove solid growth and profitability improvement – Enhanced focus on profitability in Eastern Europe region
0100200300400500600700800900
1,000
FY07 Q2 FY07 Q3 FY07 Q4 FY08 Q1 FY08 Q20%
5%
10%
15%
20%
Turnover (US$mn)
Turnover (US$mn) YoY Growth rate (%)YoY Growth rate (%)
Americas EMEA
© 2007 Lenovo 10
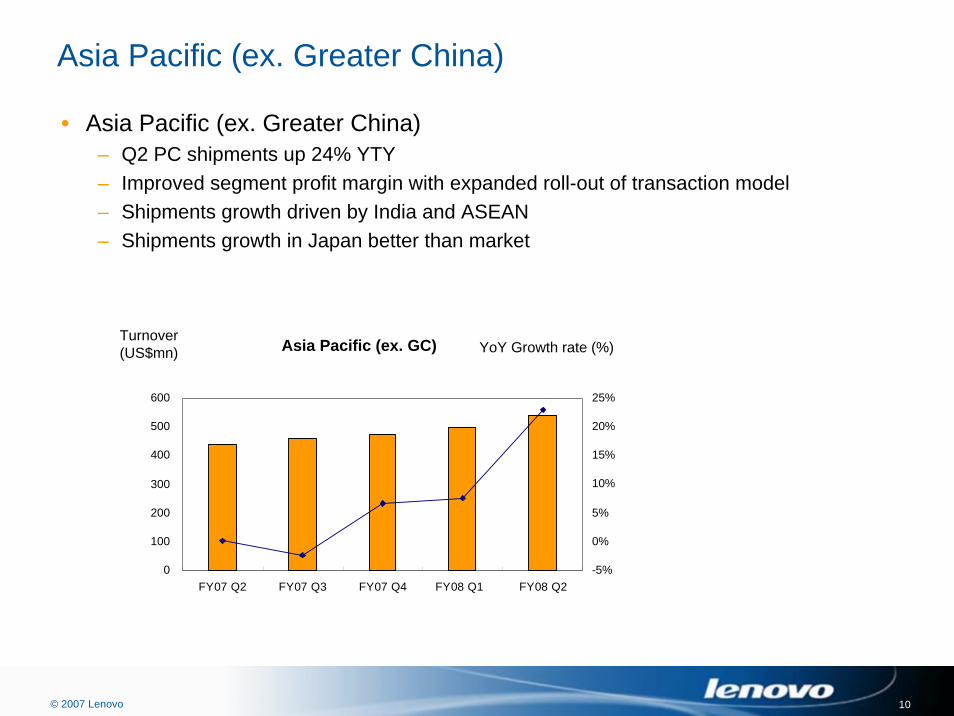
Asia Pacific (ex. Greater China)
• Asia Pacific (ex. Greater China)– Q2 PC shipments up 24% YTY– Improved segment profit margin with expanded roll-out of transaction model– Shipments growth driven by India and ASEAN – Shipments growth in Japan better than market
0
100
200
300
400
500
600
FY07 Q2 FY07 Q3 FY07 Q4 FY08 Q1 FY08 Q2-5%
0%
5%
10%
15%
20%
25%
Turnover (US$mn) YoY Growth rate (%)Asia Pacific (ex. GC)
© 2007 Lenovo 11
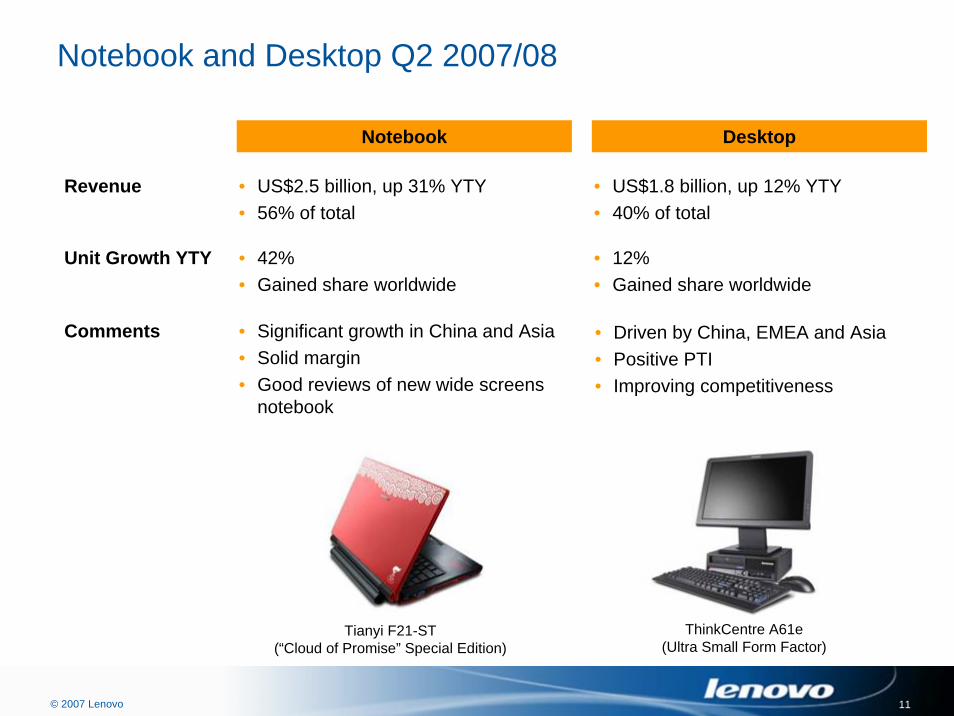
Notebook and Desktop Q2 2007/08
• US$1.8 billion, up 12% YTY• 40% of total
• US$2.5 billion, up 31% YTY• 56% of total
Notebook
Revenue
• 42% • Gained share worldwide
• 12% • Gained share worldwide
• Significant growth in China and Asia • Solid margin • Good reviews of new wide screens
notebook
• Driven by China, EMEA and Asia• Positive PTI • Improving competitiveness
Unit Growth YTY
Comments
Desktop
ThinkCentre A61e (Ultra Small Form Factor)
Tianyi F21-ST (“Cloud of Promise” Special Edition)
© 2007 Lenovo 12
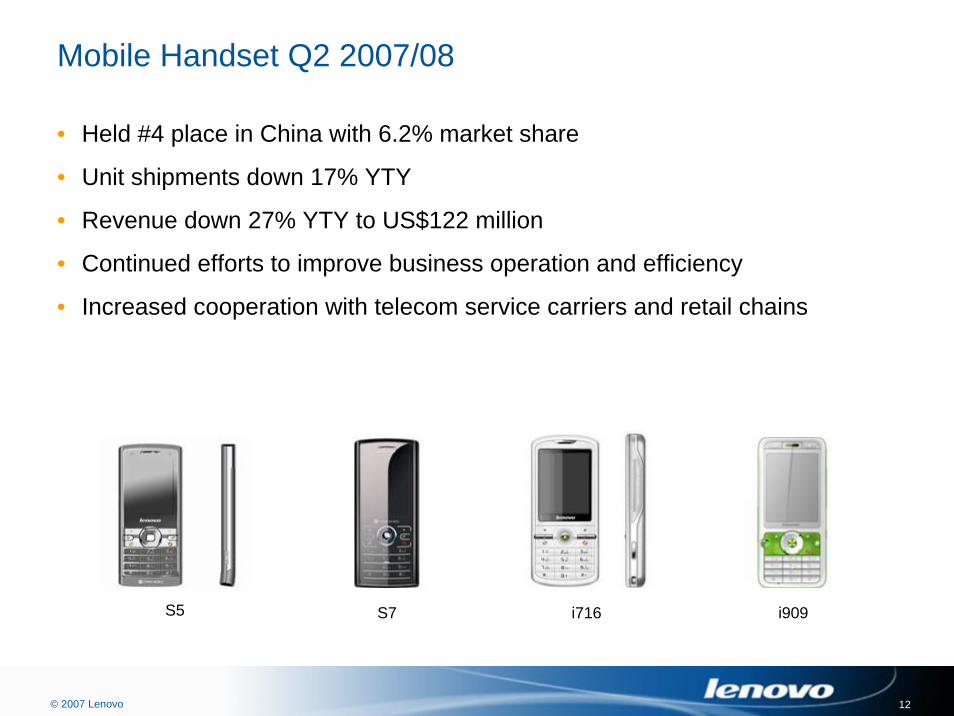
Mobile Handset Q2 2007/08
• Held #4 place in China with 6.2% market share
• Unit shipments down 17% YTY
• Revenue down 27% YTY to US$122 million
• Continued efforts to improve business operation and efficiency
• Increased cooperation with telecom service carriers and retail chains
i909i716S7S5
© 2007 Lenovo 13
Financial Objectives
• To grow faster than the industry
• To improve operational efficiency and profitability
• To enhance shareholder returns
© 2007 Lenovo
William AmelioPresident & Chief Executive Officer
© 2007 Lenovo 15
2. Supply Chain
3. Desktop Competitiveness
1. Transaction Model Roll-out
4. Brands
Strategic Initiatives
© 2007 Lenovo 16
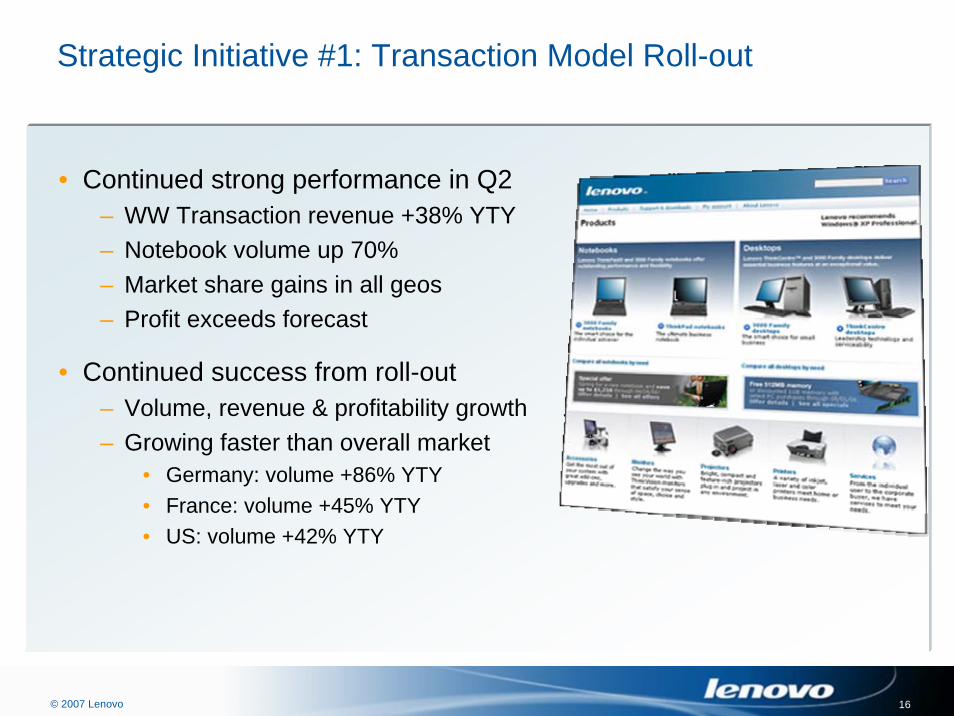
Strategic Initiative #1: Transaction Model Roll-out
• Continued strong performance in Q2– WW Transaction revenue +38% YTY– Notebook volume up 70%– Market share gains in all geos– Profit exceeds forecast
• Continued success from roll-out– Volume, revenue & profitability growth– Growing faster than overall market
• Germany: volume +86% YTY• France: volume +45% YTY• US: volume +42% YTY
© 2007 Lenovo 17
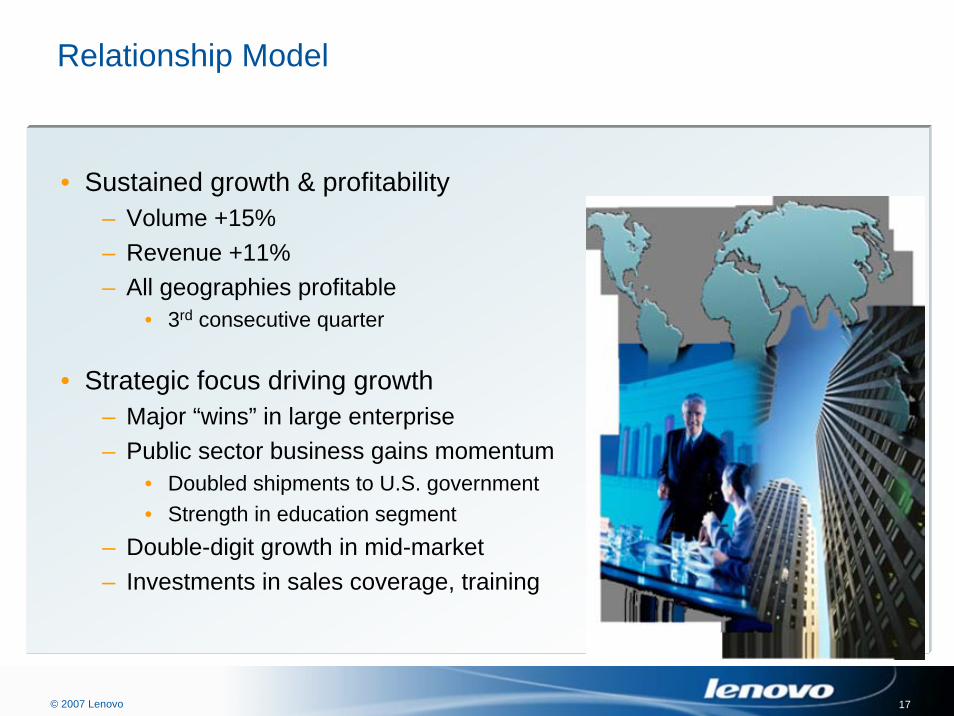
Relationship Model
• Sustained growth & profitability– Volume +15%– Revenue +11%– All geographies profitable
• 3rd consecutive quarter
• Strategic focus driving growth– Major “wins” in large enterprise– Public sector business gains momentum
• Doubled shipments to U.S. government• Strength in education segment
– Double-digit growth in mid-market– Investments in sales coverage, training
© 2007 Lenovo 18
• Overall cost and efficiency improvements– Cost Per Box reductions– Material Cost reductions– Lean Six Sigma-driven efficiencies
• 50% test cycle improvements• 40% cycle time improvements
• Desktop serviceability– 45% YTY improvement
• New Baddi, India plant operational August 30
Strategic Initiative #2: Supply Chain Upgrade
© 2007 Lenovo 19
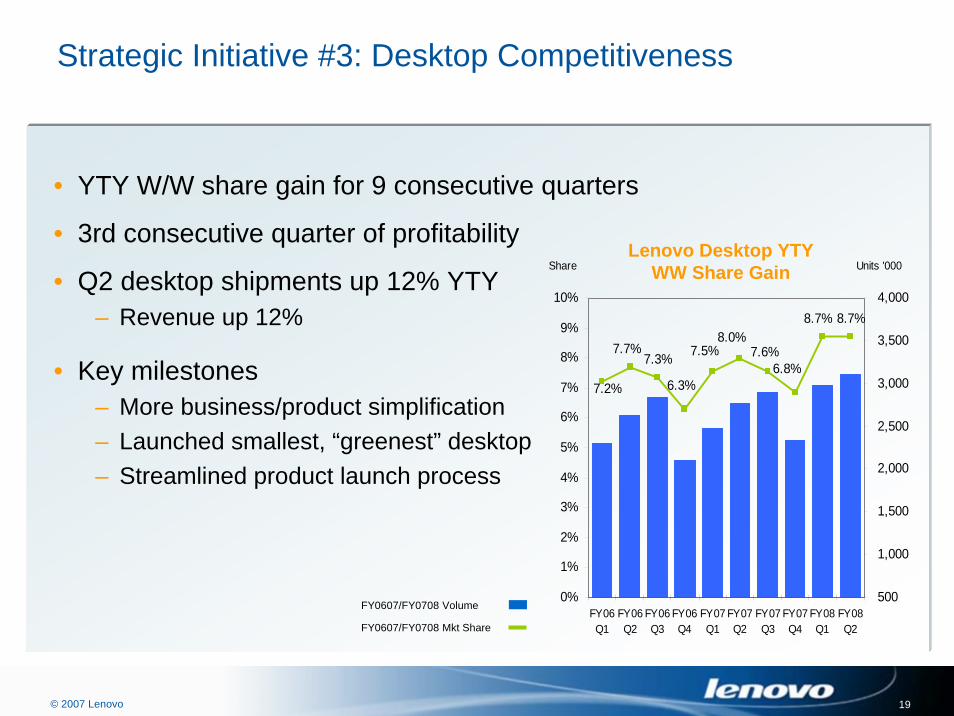
• YTY W/W share gain for 9 consecutive quarters
• 3rd consecutive quarter of profitability
• Q2 desktop shipments up 12% YTY– Revenue up 12%
Strategic Initiative #3: Desktop Competitiveness
7.2%
7.7%7.3%
6.3%
7.5%8.0%
7.6%6.8%
8.7% 8.7%
0%
1%
2%
3%
4%
5%
6%
7%
8%
9%
10%
FY06Q1
FY06Q2
FY06Q3
FY06Q4
FY07Q1
FY07Q2
FY07Q3
FY07Q4
FY08Q1
FY08Q2
500
1,000
1,500
2,000
2,500
3,000
3,500
4,000
Units '000ShareLenovo Desktop YTY
WW Share Gain
• Key milestones – More business/product simplification– Launched smallest, “greenest” desktop– Streamlined product launch process
FY0607/FY0708 Volume
FY0607/FY0708 Mkt Share
© 2007 Lenovo 20
Services, Software & Peripherals
• Contract signings up 65% YTY• Investments in dedicated sales coverage• Expanding portfolio of services
– Executive-Class Service
Lenovo Services
Software & Peripherals• Revenue up 22%
– Strong growth in China market– Continued high overall attach rate
• Leverage alliance partnerships– First to preload MS Office Home, Student Editions in China– New partnerships for thin clients, end-user service management
© 2007 Lenovo 21
Branding
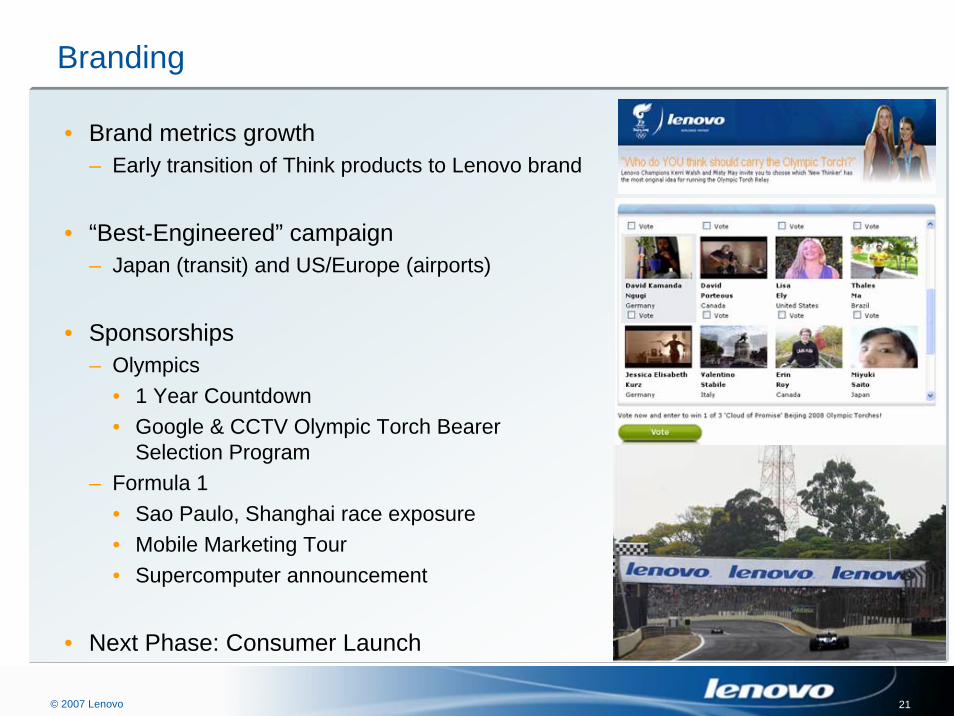
• Brand metrics growth– Early transition of Think products to Lenovo brand
• “Best-Engineered” campaign– Japan (transit) and US/Europe (airports)
• Sponsorships– Olympics
• 1 Year Countdown• Google & CCTV Olympic Torch Bearer
Selection Program– Formula 1
• Sao Paulo, Shanghai race exposure• Mobile Marketing Tour• Supercomputer announcement
• Next Phase: Consumer Launch
© 2007 Lenovo 22
Strategic Focus
• Execute against strategic initiatives
• Deliver the world’s Best-Engineered PCs
• Complete brand transition
• Improve operational efficiency
• Leverage business scale
• Offer unequaled ownership experience
• Ride paths to sustained growth
© 2007 Lenovo
Yang YuanqingChairman of the Board
© 2007 Lenovo 24
© 2007 Lenovo
Appendix
• Revenue Breakdown• Income Statement• Cash Flow Statement

© 2007 Lenovo 26
Others*1.2%
Desktop39.6%
MobileHandset
2.8%
Notebook56.4%
Revenue Breakdown (Q2 2007/08)
Americas26.7%
EMEA19.9%
AsiaPacific Ex
GC12.2%
GreaterChina41.2%
Balanced Geographic Mix Strong Notebook Mix
* Others include servers, printers, digital products, etc.
(39.0%)
(28.8%)
(20.3%)
(11.9%)
(42.4%)
(51.6%)
(1.5%)(4.5%)
Q2 2006/07 figures are in bracket
© 2007 Lenovo 27
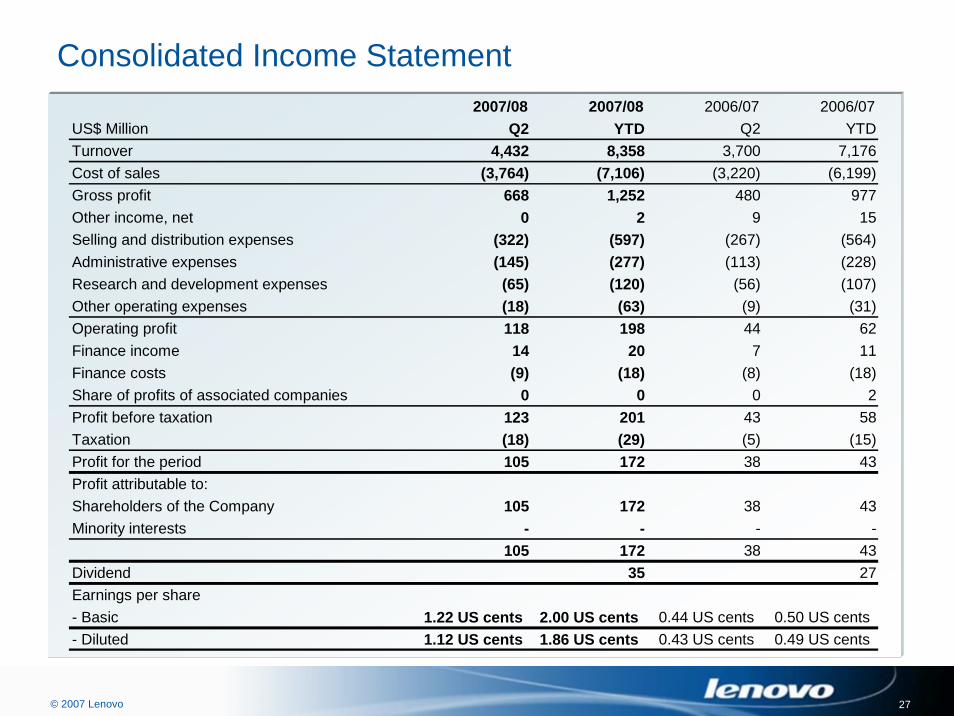
Consolidated Income Statement2007/08 2007/08 2006/07 2006/07
US$ Million Q2 YTD Q2 YTDTurnover 4,432 8,358 3,700 7,176Cost of sales (3,764) (7,106) (3,220) (6,199)Gross profit 668 1,252 480 977Other income, net 0 2 9 15Selling and distribution expenses (322) (597) (267) (564)Administrative expenses (145) (277) (113) (228)Research and development expenses (65) (120) (56) (107)Other operating expenses (18) (63) (9) (31)Operating profit 118 198 44 62Finance income 14 20 7 11Finance costs (9) (18) (8) (18)Share of profits of associated companies 0 0 0 2Profit before taxation 123 201 43 58Taxation (18) (29) (5) (15)Profit for the period 105 172 38 43Profit attributable to:Shareholders of the Company 105 172 38 43Minority interests - - - -
105 172 38 43Dividend 35 27Earnings per share- Basic 1.22 US cents 2.00 US cents 0.44 US cents 0.50 US cents- Diluted 1.12 US cents 1.86 US cents 0.43 US cents 0.49 US cents
© 2007 Lenovo 28
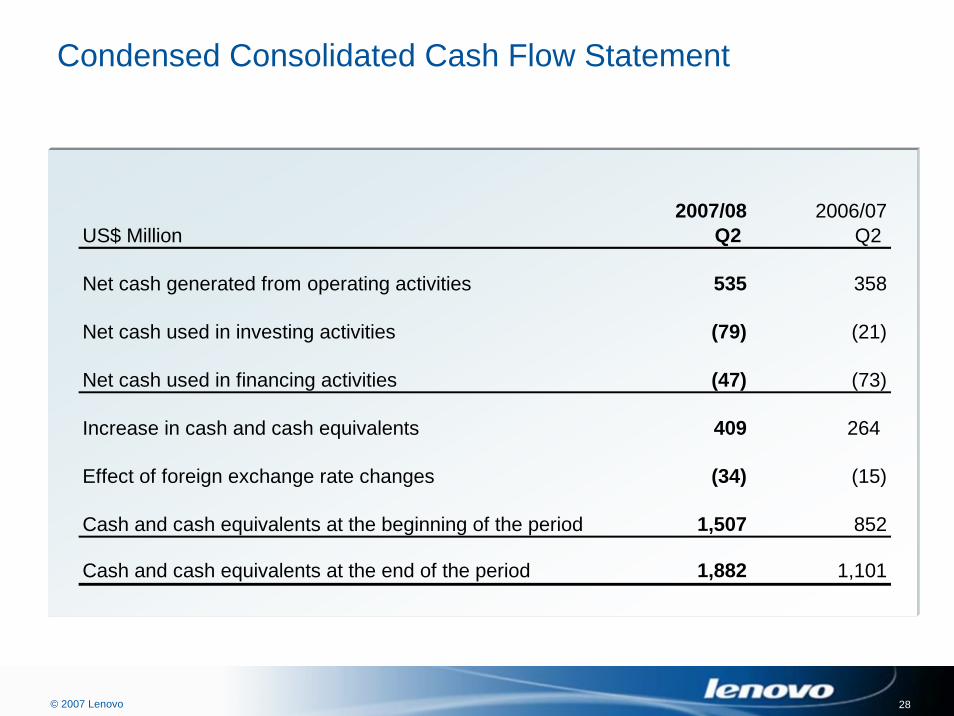
Condensed Consolidated Cash Flow Statement
2007/08 2006/07US$ Million Q2 Q2
Net cash generated from operating activities 535 358
Net cash used in investing activities (79) (21)
Net cash used in financing activities (47) (73)
Increase in cash and cash equivalents 409 264
Effect of foreign exchange rate changes (34) (15)
Cash and cash equivalents at the beginning of the period 1,507 852
Cash and cash equivalents at the end of the period 1,882 1,101