Embed Size (px)
Citation preview
Thickened and Paste Tailings Pipeline Systems: DesignProcedure – Part 2R. Cooke Paterson & Cooke, South Africa
ABSTRACTThis paper is the second in a series examining issues related to the design of paste and thickened tailingspipeline systems. The first paper presented at Paste06 covered design criteria development, characterisationtest work and pipeline flow behaviour modelling. This paper discusses centrifugal pump performancederating for non-Newtonian slurries, and hydraulic and mechanical design of paste and thickened tailingssystems. The paper concludes by exploring specific aspects of designing thickener underflow pump systems,centrifugal pump systems and gravity backfill systems for Bingham plastic mixtures.
1 INTRODUCTIONThe design methodology for pipeline systems conveying thickened and paste tailings systems has been welldeveloped over the last decade. This series of papers outlines the process for designing and implementing atypical surface tailings or underground backfill pipeline system. The papers comprise the following parts:
Part 1 (presented at Paste06) discussed:o development of the design criteria document,o issues to be considered for the test work, ando pipeline flow behaviour modelling, friction loss calculation and pipe diameter selection.
This paper covers the following aspects of thickened and paste tailings design:o centrifugal pump performance,o hydraulic design including hydraulic grade line development, pump suction conditions and
transient flow conditions,o mechanical design including pipeline thickness, wear and material selection, and pump and
motor selection, ando considerations for thickener underflow, centrifugal pump and gravity flow systems.
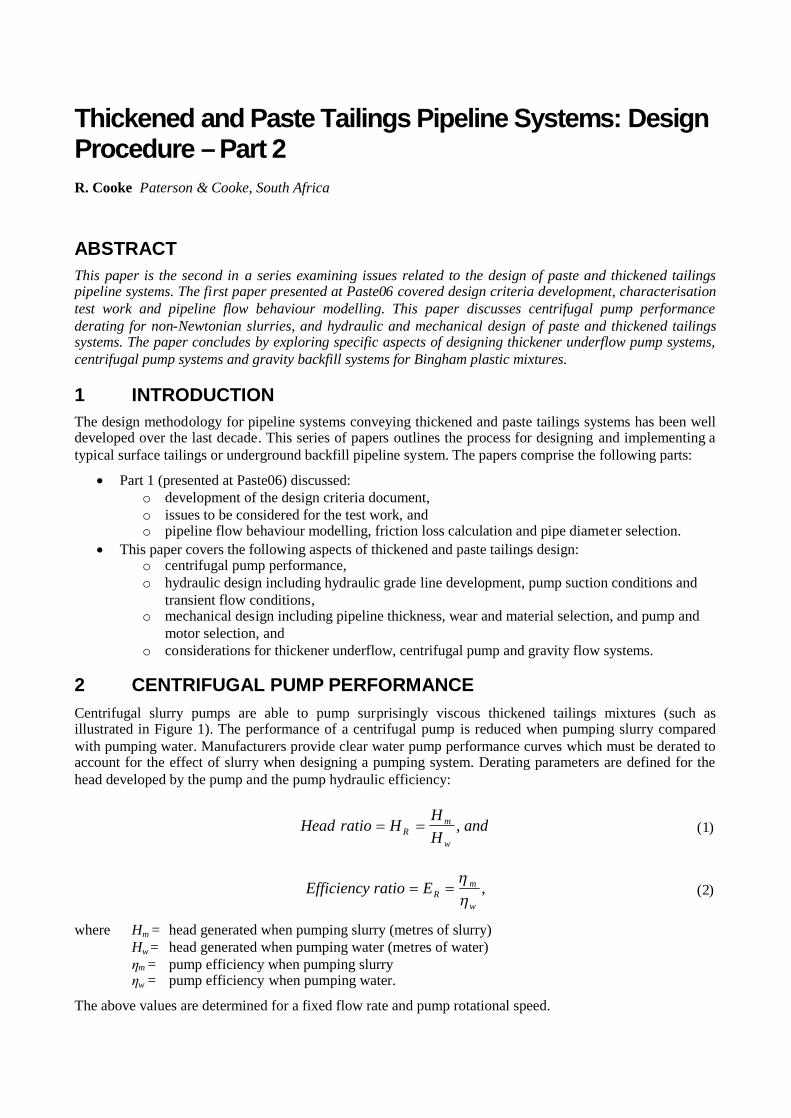
2 CENTRIFUGAL PUMP PERFORMANCECentrifugal slurry pumps are able to pump surprisingly viscous thickened tailings mixtures (such asillustrated in Figure 1). The performance of a centrifugal pump is reduced when pumping slurry comparedwith pumping water. Manufacturers provide clear water pump performance curves which must be derated toaccount for the effect of slurry when designing a pumping system. Derating parameters are defined for thehead developed by the pump and the pump hydraulic efficiency:
andHH
HratioHeadw
mR , (1)
,w
mREratioEfficiency
(2)
where Hm = head generated when pumping slurry (metres of slurry)Hw = head generated when pumping water (metres of water)ηm = pump efficiency when pumping slurryηw = pump efficiency when pumping water.
The above values are determined for a fixed flow rate and pump rotational speed.
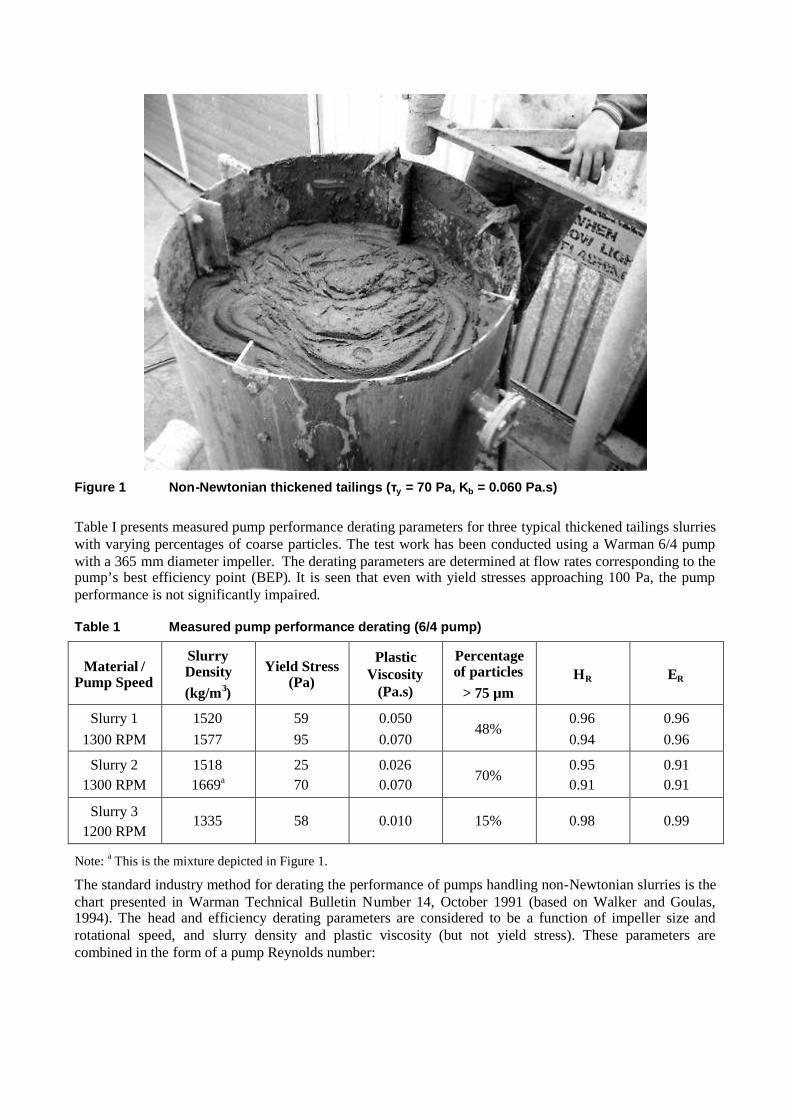
Figure 1 Non-Newtonian thickened tailings (τy = 70 Pa, Kb = 0.060 Pa.s)
Table I presents measured pump performance derating parameters for three typical thickened tailings slurrieswith varying percentages of coarse particles. The test work has been conducted using a Warman 6/4 pumpwith a 365 mm diameter impeller. The derating parameters are determined at flow rates corresponding to thepump’s best efficiency point (BEP). It is seen that even with yield stresses approaching 100 Pa, the pumpperformance is not significantly impaired.
Table 1 Measured pump performance derating (6/4 pump)
Material /Pump Speed
SlurryDensity(kg/m3)
Yield Stress(Pa)
PlasticViscosity
(Pa.s)
Percentageof particles
> 75 µmHR ER
Slurry 11300 RPM
15201577
5995
0.0500.070
48%0.960.94
0.960.96
Slurry 21300 RPM
15181669a
2570
0.0260.070
70%0.950.91
0.910.91
Slurry 31200 RPM
1335 58 0.010 15% 0.98 0.99
Note: a This is the mixture depicted in Figure 1.
The standard industry method for derating the performance of pumps handling non-Newtonian slurries is thechart presented in Warman Technical Bulletin Number 14, October 1991 (based on Walker and Goulas,1994). The head and efficiency derating parameters are considered to be a function of impeller size androtational speed, and slurry density and plastic viscosity (but not yield stress). These parameters arecombined in the form of a pump Reynolds number:
,2
b
mip K
DeR
(3)
where ω = pump rotational speed (radians/s)Di = impeller diameter (m)ρm = mixture density (kg/m3)Kb = Bingham fluid consistency index or plastic viscosity1 (Pa.s).
Figure 2 shows the data presented in Table I plotted as head and efficiency derating versus the Warmanpump Reynolds number. The Warman curves slightly under predict the head derating, but significantly overpredict the efficiency derating.
0.6
0.7
0.8
0.9
1.0
1.E+04 1.E+05 1.E+06 1.E+07
Pump Reynolds Number
Hea
dD
era
ting
Fact
or
Warman Curve
Slurry 1
Slurry 2
Slurry 3
0.6
0.7
0.8
0.9
1.0
1.E+04 1.E+05 1.E+06 1.E+07
Pump Reynolds Number
Eff
icie
ncy
Der
atin
gF
acto
r
Warman Curve
Slurry 1
Slurry 2
Slurry 3
0.6
0.7
0.8
0.9
1.0
1.E+04 1.E+05 1.E+06 1.E+07
Pump Reynolds Number
Hea
dD
era
ting
Fact
or
Warman Curve
Slurry 1
Slurry 2
Slurry 3
0.6
0.7
0.8
0.9
1.0
1.E+04 1.E+05 1.E+06 1.E+07
Pump Reynolds Number
Eff
icie
ncy
Der
atin
gF
acto
r
Warman Curve
Slurry 1
Slurry 2
Slurry 3
Figure 2 Non-Newtonian Pump Performance Derating at BEP (Warman Curves interpolatedfrom published curve)
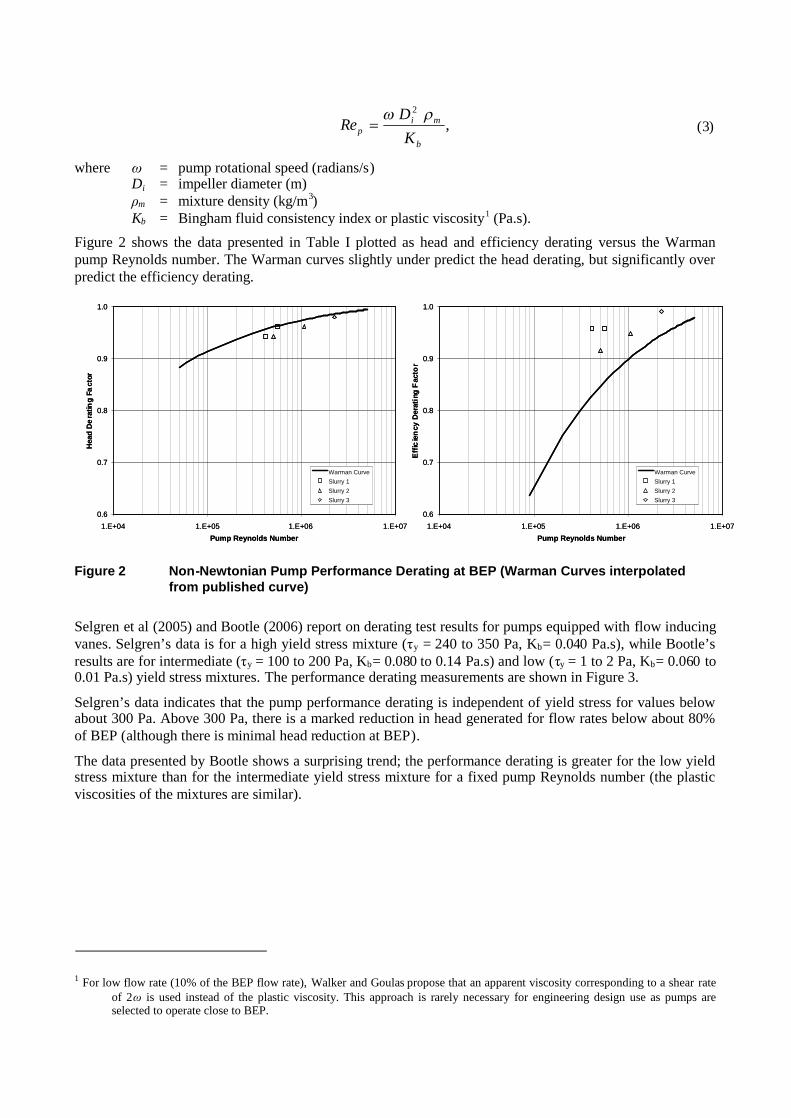
Selgren et al (2005) and Bootle (2006) report on derating test results for pumps equipped with flow inducingvanes. Selgren’s data is for a high yield stress mixture (τy = 240 to 350 Pa, Kb= 0.040 Pa.s), while Bootle’sresults are for intermediate (τy = 100 to 200 Pa, Kb= 0.080 to 0.14 Pa.s) and low (τy = 1 to 2 Pa, Kb= 0.060 to0.01 Pa.s) yield stress mixtures. The performance derating measurements are shown in Figure 3.
Selgren’s data indicates that the pump performance derating is independent of yield stress for values belowabout 300 Pa. Above 300 Pa, there is a marked reduction in head generated for flow rates below about 80%of BEP (although there is minimal head reduction at BEP).
The data presented by Bootle shows a surprising trend; the performance derating is greater for the low yieldstress mixture than for the intermediate yield stress mixture for a fixed pump Reynolds number (the plasticviscosities of the mixtures are similar).
1 For low flow rate (10% of the BEP flow rate), Walker and Goulas propose that an apparent viscosity corresponding to a shear rateof 2ω is used instead of the plastic viscosity. This approach is rarely necessary for engineering design use as pumps areselected to operate close to BEP.
0.6
0.7
0.8
0.9
1.0
1.E+04 1.E+05 1.E+06 1.E+07
Pump Reynolds Number
Hea
dD
erat
ing
Fac
tor
Warman Curve
Bootle Intermediate Yield Stress
Bootle Low Yield Stress
Selgren
0.6
0.7
0.8
0.9
1.0
1.E+04 1.E+05 1.E+06 1.E+07
Pump Reynolds Number
Effi
cien
cyD
erat
ing
Fact
or
Warman Curve
Bootle Intermediate Yield Stress
Bootle Low Yield Stress
Selgren
0.6
0.7
0.8
0.9
1.0
1.E+04 1.E+05 1.E+06 1.E+07
Pump Reynolds Number
Hea
dD
erat
ing
Fac
tor
Warman Curve
Bootle Intermediate Yield Stress
Bootle Low Yield Stress
Selgren
0.6
0.7
0.8
0.9
1.0
1.E+04 1.E+05 1.E+06 1.E+07
Pump Reynolds Number
Effi
cien
cyD
erat
ing
Fact
or
Warman Curve
Bootle Intermediate Yield Stress
Bootle Low Yield Stress
Selgren
Figure 3 Flow Inducer Impeller Pump Performance Derating at BEP
While further work is required before pump performance derating is properly understood for non-Newtonianslurries, the Warman chart is a useful design tool provided the following points are considered:
The chart provides a reasonable estimate for head performance derating for Reynolds numbersgreater than 3 x 10⁵.
The chart over predicts the efficiency derating for standard pump designs in sizes greater than the 4/3pump used to develop the chart. However, it is prudent that the chart derating values are followed fordesign work due to the likely uncertainty in quantifying the mixture properties. It is expected that theefficiency derating will decrease with increasing pump size.
Until the derating criteria are better understood, it is recommended that installations are not designedfor Reynolds number lower than 3 x 10⁵ without conducting test work. Similarly, the recommendedupper limit for yield stress is 200 Pa.
It is important to operate pumps close to BEP (more so than for other slurry types as operation awayfrom BEP can significantly affect the hydraulic stability of the system).
3 HYDRAULIC DESIGNThe sequence followed for the hydraulic design of a paste or thickened tailings pipeline system is:
Select the pipe diameter (and trial pipe wall thickness) considering deposition and laminar settlingcriteria (Cooke, 2006).
Calculate the unit friction losses. Plot the hydraulic grade line for steady state operating conditions. Check that the pipe pressure rating meets the steady state pressure envelope, if necessary change the
pipe specification and repeat the above steps. Determine the hydraulic grade line envelope for transient conditions (pipeline start up, shut down,
flushing, etc). This may require a change to the pipe specification and a repeat of the above steps. From the hydraulic grade line, determine the pump station duty head envelope. Select and specify the pump(s) required for the pump station. Check the operating point stability by plotting the pipeline and pump head versus flow rate curves
(required for centrifugal pump systems). Check that the pump suction pressure is sufficiently high to avoid cavitation.
The discussion below focuses on the development of the hydraulic grade line plot starting with Bernoulli’sequation. Pump suction conditions are also discussed.
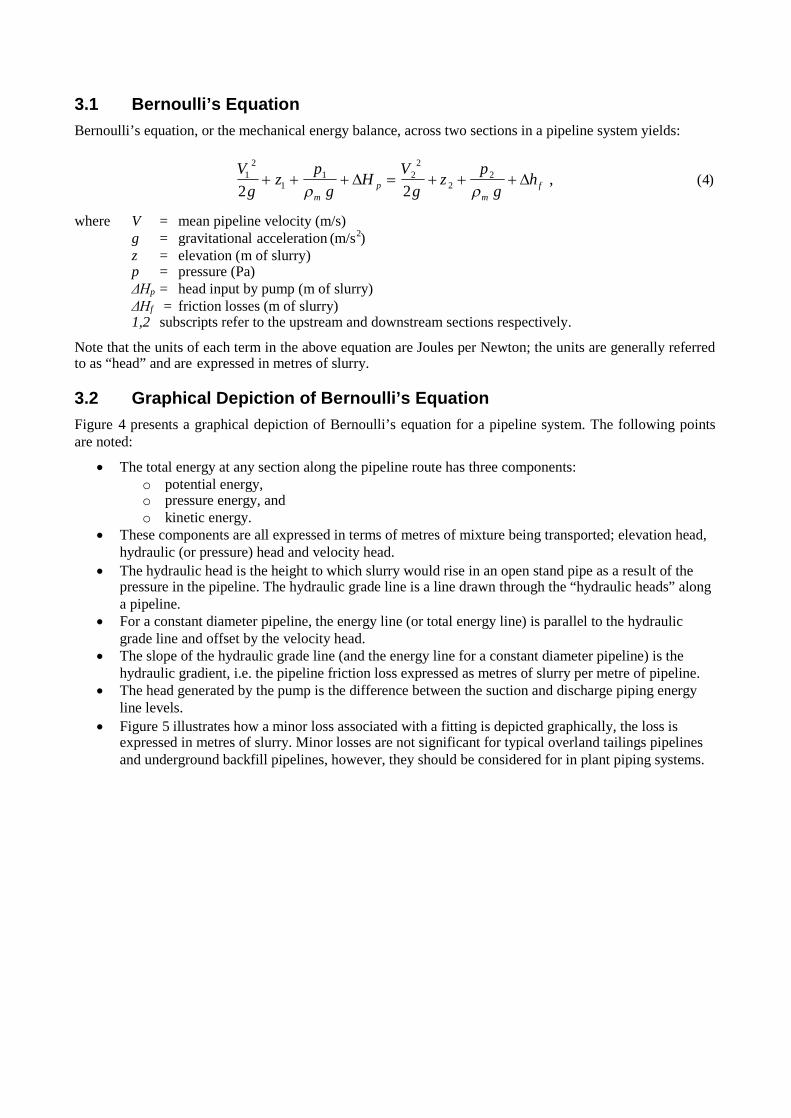
3.1 Bernoulli’s EquationBernoulli’s equation, or the mechanical energy balance, across two sections in a pipeline system yields:
,22
22
221
1
21
fm
pm
hg
pz
gV
Hg
pz
gV
(4)
where V = mean pipeline velocity (m/s)g = gravitational acceleration (m/s2)z = elevation (m of slurry)p = pressure (Pa)ΔHp = head input by pump (m of slurry)ΔHf = friction losses (m of slurry)1,2 subscripts refer to the upstream and downstream sections respectively.
Note that the units of each term in the above equation are Joules per Newton; the units are generally referredto as “head” and are expressed in metres of slurry.
3.2 Graphical Depiction of Bernoulli’s EquationFigure 4 presents a graphical depiction of Bernoulli’s equation for a pipeline system. The following pointsare noted:
The total energy at any section along the pipeline route has three components:o potential energy,o pressure energy, ando kinetic energy.
These components are all expressed in terms of metres of mixture being transported; elevation head,hydraulic (or pressure) head and velocity head.
The hydraulic head is the height to which slurry would rise in an open stand pipe as a result of thepressure in the pipeline. The hydraulic grade line is a line drawn through the “hydraulic heads” alonga pipeline.
For a constant diameter pipeline, the energy line (or total energy line) is parallel to the hydraulicgrade line and offset by the velocity head.
The slope of the hydraulic grade line (and the energy line for a constant diameter pipeline) is thehydraulic gradient, i.e. the pipeline friction loss expressed as metres of slurry per metre of pipeline.
The head generated by the pump is the difference between the suction and discharge piping energyline levels.
Figure 5 illustrates how a minor loss associated with a fitting is depicted graphically, the loss isexpressed in metres of slurry. Minor losses are not significant for typical overland tailings pipelinesand underground backfill pipelines, however, they should be considered for in plant piping systems.

Pu
mp
head
Hydraulic grade line Energy line
Hyd
raul
iche
ad
Horizontal datum
V2/2g
z
p/ρmg
V2/2g
z
p/ρmg
P = ρmgh
Figure 4 Graphical depiction of Bernoulli’s equation for a pipeline system
Min
orlo
ss
Hydraulic grade line Energy line
Valve
Figure 5 Depiction of a minor loss due to a fitting (valve)
3.3 Hydraulic Grade Line Plot
3.3.1 Steady state conditions
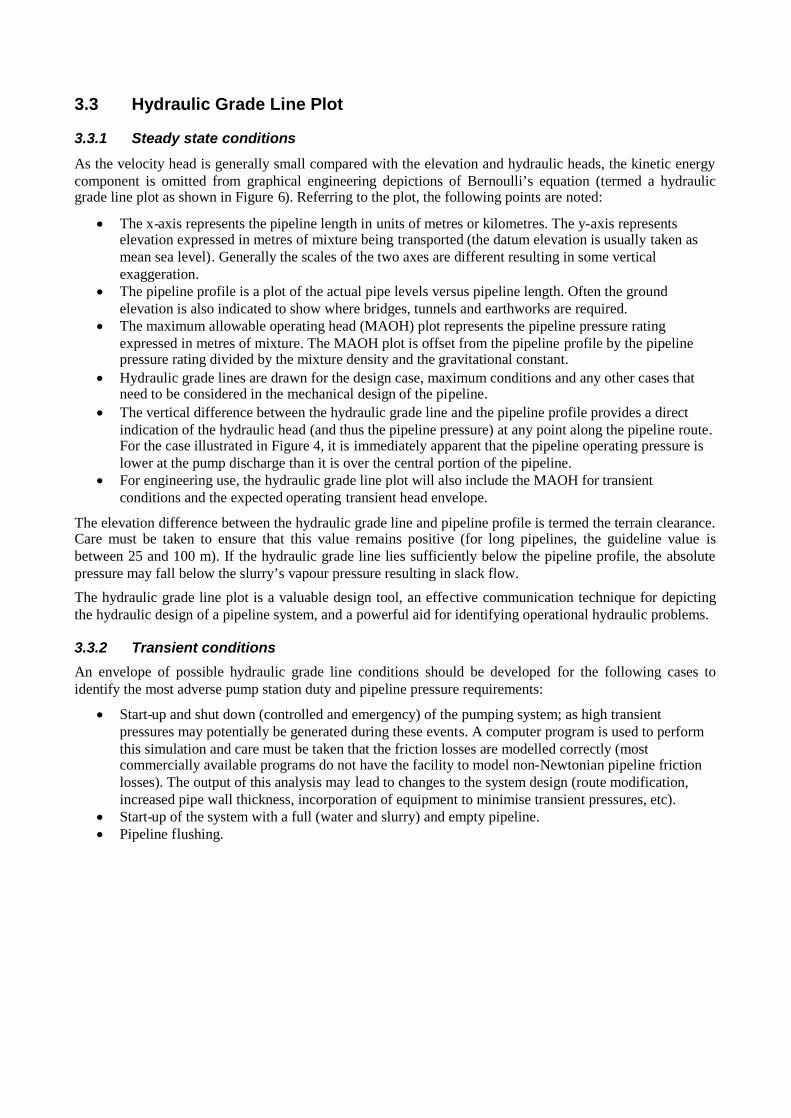
As the velocity head is generally small compared with the elevation and hydraulic heads, the kinetic energycomponent is omitted from graphical engineering depictions of Bernoulli’s equation (termed a hydraulicgrade line plot as shown in Figure 6). Referring to the plot, the following points are noted:
The x-axis represents the pipeline length in units of metres or kilometres. The y-axis representselevation expressed in metres of mixture being transported (the datum elevation is usually taken asmean sea level). Generally the scales of the two axes are different resulting in some verticalexaggeration.
The pipeline profile is a plot of the actual pipe levels versus pipeline length. Often the groundelevation is also indicated to show where bridges, tunnels and earthworks are required.
The maximum allowable operating head (MAOH) plot represents the pipeline pressure ratingexpressed in metres of mixture. The MAOH plot is offset from the pipeline profile by the pipelinepressure rating divided by the mixture density and the gravitational constant.
Hydraulic grade lines are drawn for the design case, maximum conditions and any other cases thatneed to be considered in the mechanical design of the pipeline.
The vertical difference between the hydraulic grade line and the pipeline profile provides a directindication of the hydraulic head (and thus the pipeline pressure) at any point along the pipeline route.For the case illustrated in Figure 4, it is immediately apparent that the pipeline operating pressure islower at the pump discharge than it is over the central portion of the pipeline.
For engineering use, the hydraulic grade line plot will also include the MAOH for transientconditions and the expected operating transient head envelope.
The elevation difference between the hydraulic grade line and pipeline profile is termed the terrain clearance.Care must be taken to ensure that this value remains positive (for long pipelines, the guideline value isbetween 25 and 100 m). If the hydraulic grade line lies sufficiently below the pipeline profile, the absolutepressure may fall below the slurry’s vapour pressure resulting in slack flow.
The hydraulic grade line plot is a valuable design tool, an effective communication technique for depictingthe hydraulic design of a pipeline system, and a powerful aid for identifying operational hydraulic problems.
3.3.2 Transient conditions
An envelope of possible hydraulic grade line conditions should be developed for the following cases toidentify the most adverse pump station duty and pipeline pressure requirements:
Start-up and shut down (controlled and emergency) of the pumping system; as high transientpressures may potentially be generated during these events. A computer program is used to performthis simulation and care must be taken that the friction losses are modelled correctly (mostcommercially available programs do not have the facility to model non-Newtonian pipeline frictionlosses). The output of this analysis may lead to changes to the system design (route modification,increased pipe wall thickness, incorporation of equipment to minimise transient pressures, etc).
Start-up of the system with a full (water and slurry) and empty pipeline. Pipeline flushing.
Pipeline Length (metres), 1:X scale
Ele
vati
on(m
mix
ture
),1
:Ysc
ale
Pipeline profile
Maximum allowable operating head (MAOH)
Hydraulic grade lines(Design and maximum conditions)
Figure 6 Hydraulic grade line plot
3.4 Pump Suction Conditions
3.4.1 Centrifugal pumps
For conventional slurry pumping systems, the net positive suction head (NPSH2) available must be greaterthan the NPSH required to avoid cavitation. Pumps can operate reliably with negative gauge suction pressure(e.g. dredging applications). However, for thickened and paste tailings this issue is more complex:
Due to the typically high viscosities, there is a high likelihood of air being entrained into the pumpsuction (particularly if the discharge into the sump is above the mixture level). The presence of air ina centrifugal pump causes a substantial reduction in the head generated by the pump. Note that thisphenomenon is not cavitation, but rather a head derating effect due to the lower mixture density.
Laboratory tests indicate that the vapour pressure for viscous high concentration water basedmixtures is equal to the value for water alone3.
Bootle (2006) notes that for Bingham Plastic mixtures, due to the modified velocity distribution inthe pump, the NPSH required by the pump can be significantly greater than the NPSH required whenpumping water. This effect is likely to be more marked for smaller pumps.
The following guidelines should be considered:
Minimise the possibility of air entrainment into the mixture through careful sump design. Minimise the suction piping friction losses. Avoid operating with negative gauge pressures, it is suggested that a positive head of at least 2 m at
the pump inlet is provided.
2 NPSH is defined as the total absolute head at the pump centre line less the mixture vapour pressure head expressed in metres ofslurry.
3 L Francis, unpublished research.
Avoid using pumps smaller than 4”/3” for mixtures with yield stresses exceeding 200 Pa. Theefficiency derating may be significantly higher than indicated by the Warman non-Newtonian slurryderating chart. Peristaltic pumps may be a better option for these duties.
3.4.2 Positive displacement pumps
Positive displacement pumps require a positive gauge pressure on the suction side on the pumps. This iseither provided through an elevated feed sump (concrete piston type pumps) or though the use of a chargepump (piston pumps, with and without a diaphragm). This pressure is dependant on the mixture propertiesand the pump configuration and it is recommended that advice is obtained from the pump vendor.
4 MECHANICAL DESIGN
4.1 PipelinesThe mechanical design of the pipeline involves selecting the piping materials, wall thickness, and the supportsystem. Slurry pipelines are typically designed in accordance with ANSI/ASME Code B31.11.
4.1.1 Pipe materials
The primary piping materials used for paste and thickened tailings pipelines are carbon steel and high densitypolyethylene.
Steel piping is suitable for all practical operating pressures and a wide range of diameters, wall thicknesses,steel grades, flanges and fittings are available. A variety of internal lining materials can be used to maximisethe pipeline life, e.g. rubber, polyurethane, polyethylene and even mortar. Often the pipeline is protectedagainst external corrosion through the use of a coating or wrapping.
High density polyethylene piping is ideal for low pressure applications. Care must be taken to derate thepipeline pressure rating due to effects of wear and temperature.
4.1.2 Support system
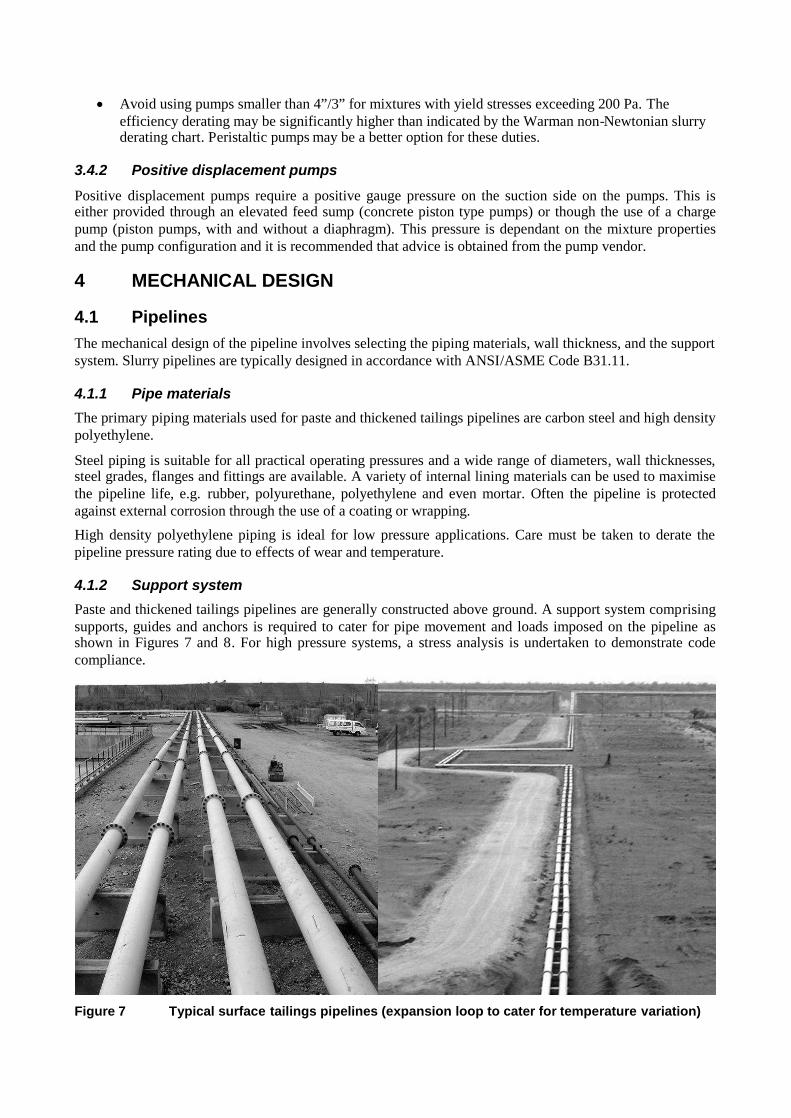
Paste and thickened tailings pipelines are generally constructed above ground. A support system comprisingsupports, guides and anchors is required to cater for pipe movement and loads imposed on the pipeline asshown in Figures 7 and 8. For high pressure systems, a stress analysis is undertaken to demonstrate codecompliance.
Figure 7 Typical surface tailings pipelines (expansion loop to cater for temperature variation)
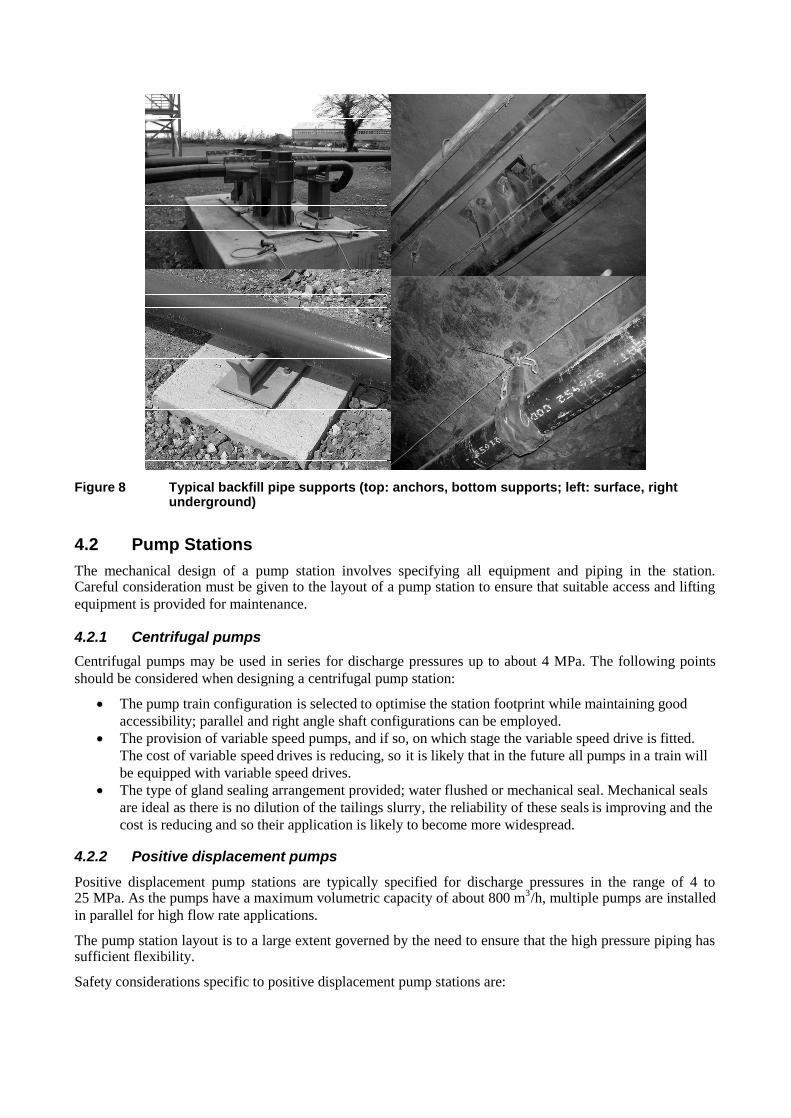
Figure 8 Typical backfill pipe supports (top: anchors, bottom supports; left: surface, rightunderground)
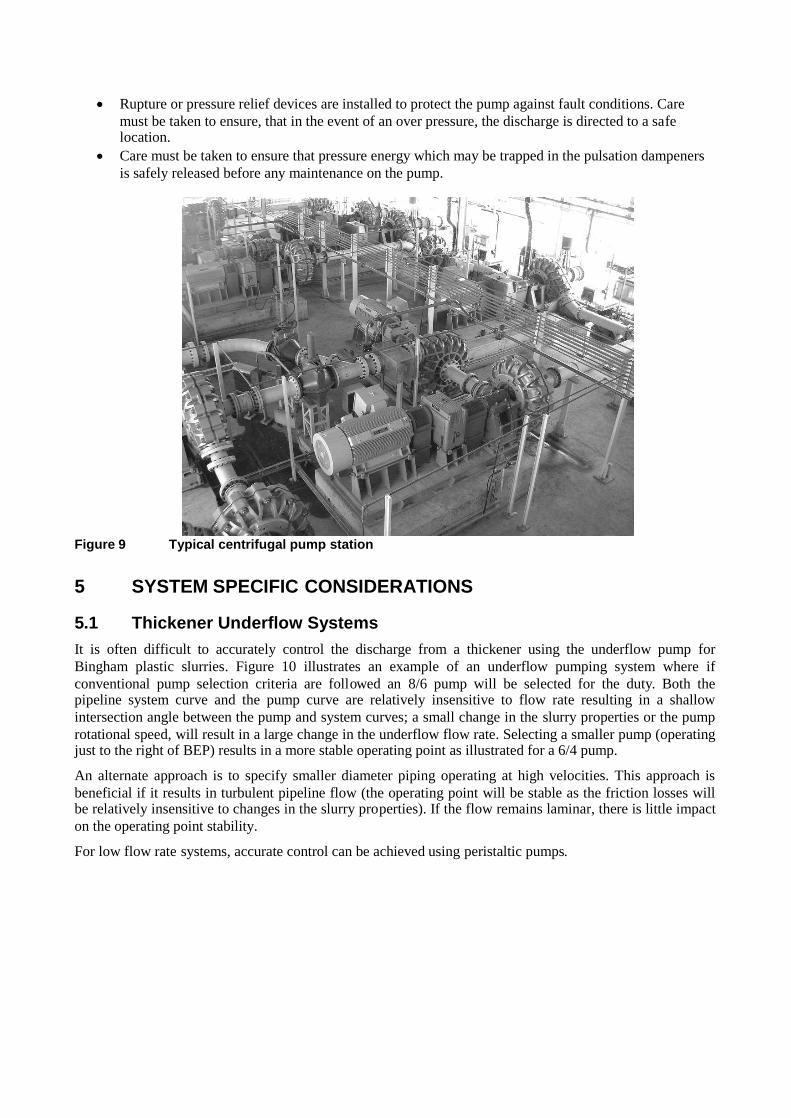
4.2 Pump StationsThe mechanical design of a pump station involves specifying all equipment and piping in the station.Careful consideration must be given to the layout of a pump station to ensure that suitable access and liftingequipment is provided for maintenance.
4.2.1 Centrifugal pumps
Centrifugal pumps may be used in series for discharge pressures up to about 4 MPa. The following pointsshould be considered when designing a centrifugal pump station:
The pump train configuration is selected to optimise the station footprint while maintaining goodaccessibility; parallel and right angle shaft configurations can be employed.
The provision of variable speed pumps, and if so, on which stage the variable speed drive is fitted.The cost of variable speed drives is reducing, so it is likely that in the future all pumps in a train willbe equipped with variable speed drives.
The type of gland sealing arrangement provided; water flushed or mechanical seal. Mechanical sealsare ideal as there is no dilution of the tailings slurry, the reliability of these seals is improving and thecost is reducing and so their application is likely to become more widespread.
4.2.2 Positive displacement pumps
Positive displacement pump stations are typically specified for discharge pressures in the range of 4 to25 MPa. As the pumps have a maximum volumetric capacity of about 800 m3/h, multiple pumps are installedin parallel for high flow rate applications.
The pump station layout is to a large extent governed by the need to ensure that the high pressure piping hassufficient flexibility.
Safety considerations specific to positive displacement pump stations are:
Rupture or pressure relief devices are installed to protect the pump against fault conditions. Caremust be taken to ensure, that in the event of an over pressure, the discharge is directed to a safelocation.
Care must be taken to ensure that pressure energy which may be trapped in the pulsation dampenersis safely released before any maintenance on the pump.
Figure 9 Typical centrifugal pump station
5 SYSTEM SPECIFIC CONSIDERATIONS
5.1 Thickener Underflow SystemsIt is often difficult to accurately control the discharge from a thickener using the underflow pump forBingham plastic slurries. Figure 10 illustrates an example of an underflow pumping system where ifconventional pump selection criteria are followed an 8/6 pump will be selected for the duty. Both thepipeline system curve and the pump curve are relatively insensitive to flow rate resulting in a shallowintersection angle between the pump and system curves; a small change in the slurry properties or the pumprotational speed, will result in a large change in the underflow flow rate. Selecting a smaller pump (operatingjust to the right of BEP) results in a more stable operating point as illustrated for a 6/4 pump.
An alternate approach is to specify smaller diameter piping operating at high velocities. This approach isbeneficial if it results in turbulent pipeline flow (the operating point will be stable as the friction losses willbe relatively insensitive to changes in the slurry properties). If the flow remains laminar, there is little impacton the operating point stability.
For low flow rate systems, accurate control can be achieved using peristaltic pumps.

0
5
10
15
20
25
30
0 50 100 150 200
Flow Rate (litres per second)
He
ad(m
of
mix
ture
)
Pipeline System Curve
6/4 Pump
8/6 Pump
Figure 10 Thickener Underflow System Curves
5.2 Centrifugal Pump SystemsAs centrifugal pumps generate head and not pressure, there can be a substantial reduction in pump stationdischarge pressure when flushing is initiated (related to the change in density less the head derating effect).For high yield stress Bingham plastic slurries operating in laminar flow, it is possible that the pumpingsystem will stall. This can be resolved by increasing the speed of the pumps and/or introducing high pressureflush water on the suction side of the pump train.
5.3 Underground Paste Backfill SystemsThe hydraulic design of underground paste backfill systems is challenging:
Paste backfill systems operate in laminar flow resulting in a flat system curve (i.e. the friction lossesare insensitive to flow rate). The pipeline friction losses are often highly sensitive to small changes inpaste properties. These factors coupled with the flat characteristic of the gravity head driving theflow, results in a potentially unstable operating point.
Many systems use a piston type pump to introduce paste into the pipeline system and provideoperating point stability. Care must be taken when specifying the maximum pump dischargepressure; a small change in the pipeline friction losses may result in a substantial change in therequired pump delivery pressure.
The pipeline routing is largely dictated by the mining requirements. This results in the designerhaving to deal with unfavourable pipeline profiles which may require the hydraulic grade line to bemanipulated through the use of choke or energy dissipation stations.
The start up of deep mine gravity flow systems is potentially problematic due to the high velocitiesthat can arise when starting to fill an empty pipeline. Care must be taken to carefully specify thesystem start up and shut down procedures.
ACKNOWLEDGEMENTSThe author thanks Mr van Sittert for collecting the pump derating data presented in this paper.

REFERENCESBootle, M.J. (2006) Practical aspects of transporting pastes with rotodynamic slurry pumps. International Seminar on
Paste and Thickened Tailings, Limerick, Ireland, April.
Cooke, R. (2006) Thickened and paste tailings pipeline systems: Design procedure – Part 1. International Seminar onPaste and Thickened Tailings, Limerick, Ireland, April.
Walker. C.I. and Goulas A. (1984) Performance characteristics of centrifugal pumps when handling non-Newtonianhomogenous slurries, Proceedings of the Institution of Mechanical Engineers, 198A, pp. 41-49.
Selgren, A., Addie, G.R. and Whitlock, L. (2005) Technical-economical feasibility of using centrifugal pumps in highdensity thickened tailings slurry systems. International Seminar on Paste and Thickened Tailings, Santiago,Chile, April.