Embed Size (px)
Citation preview
THICKENED TAILINGS: RHEOLOGICAL AND GEOTECHNICAL CHARACTERISTICSJAMIE SPIERS
Methods for Treatment of Mine Tailings16 -17 November 2010
Contents
Thickened tailings – Key Drivers and ProcessesRheological characteristics
OverviewMeasurements
Geotechnical CharacteristicsGravimetricGeomechanicalTailings-Water Relationships
Esperanza Tailings Facility – Case Study
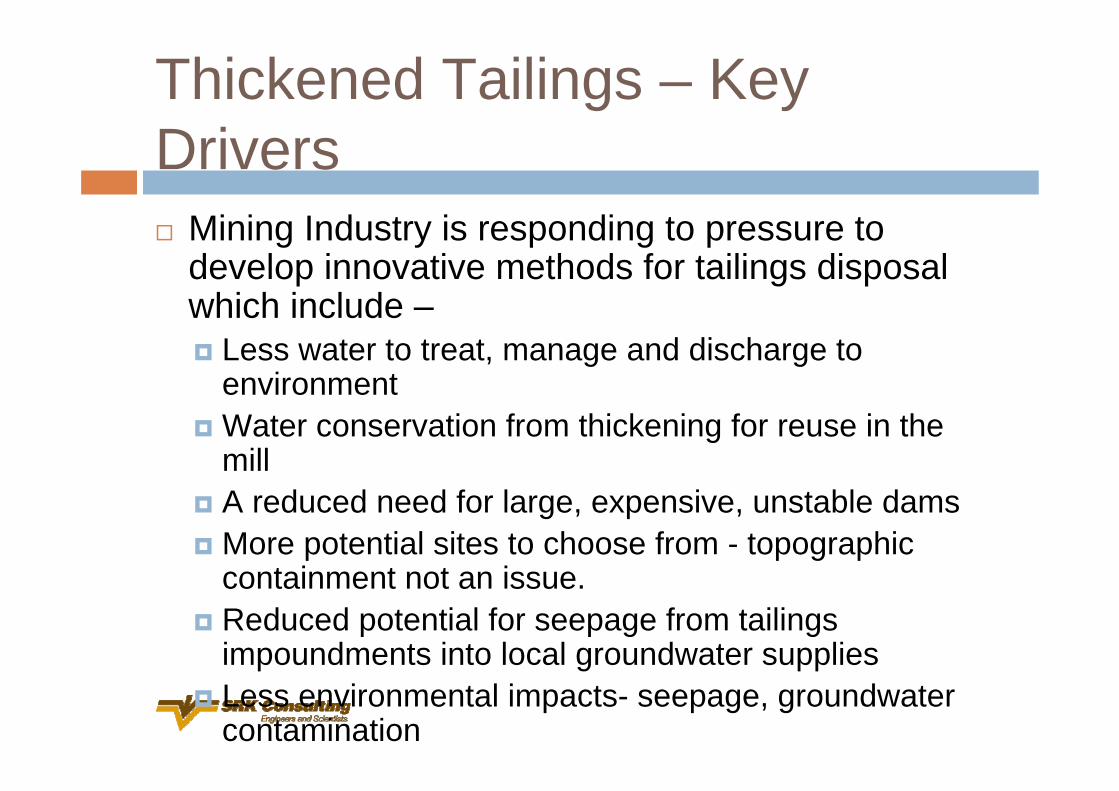
Thickened Tailings – Key Drivers
Mining Industry is responding to pressure to develop innovative methods for tailings disposal which include –
Less water to treat, manage and discharge to environmentWater conservation from thickening for reuse in the millA reduced need for large, expensive, unstable damsMore potential sites to choose from - topographic containment not an issue.Reduced potential for seepage from tailings impoundments into local groundwater suppliesLess environmental impacts- seepage, groundwater contamination
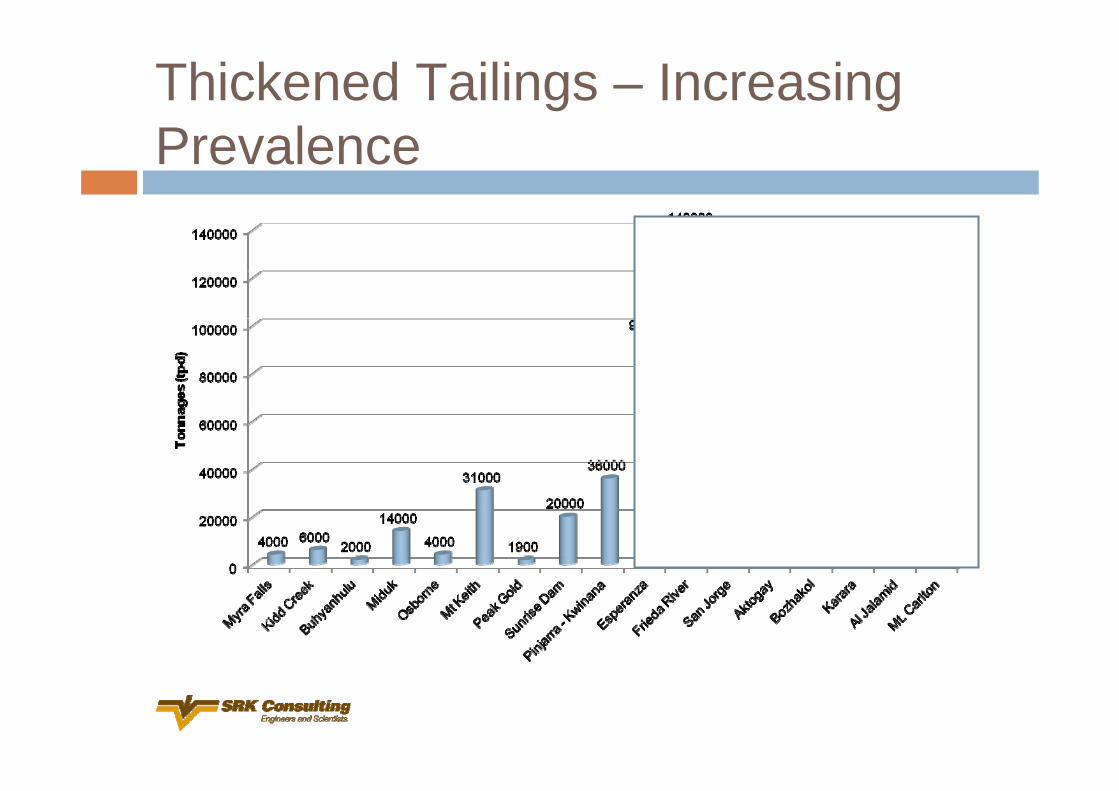
Thickened Tailings – Increasing Prevalence
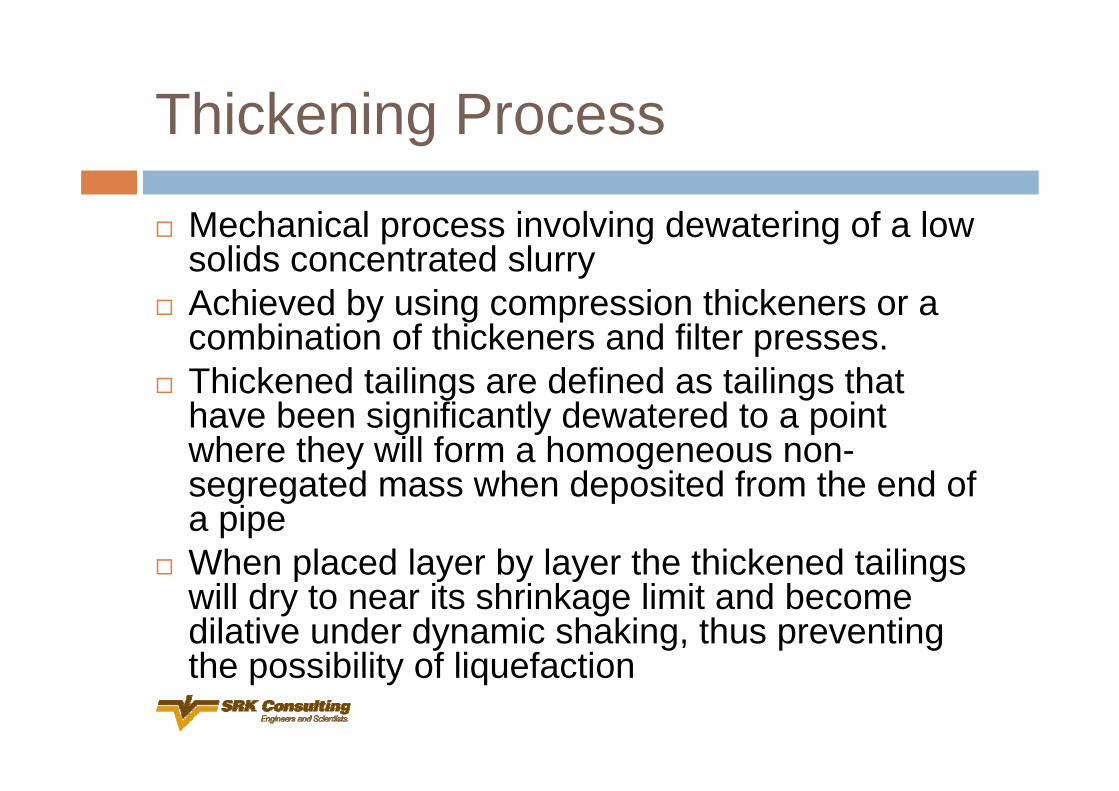
Thickening Process
Mechanical process involving dewatering of a low solids concentrated slurryAchieved by using compression thickeners or a combination of thickeners and filter presses.Thickened tailings are defined as tailings that have been significantly dewatered to a point where they will form a homogeneous non-segregated mass when deposited from the end of a pipe When placed layer by layer the thickened tailings will dry to near its shrinkage limit and become dilative under dynamic shaking, thus preventing the possibility of liquefaction
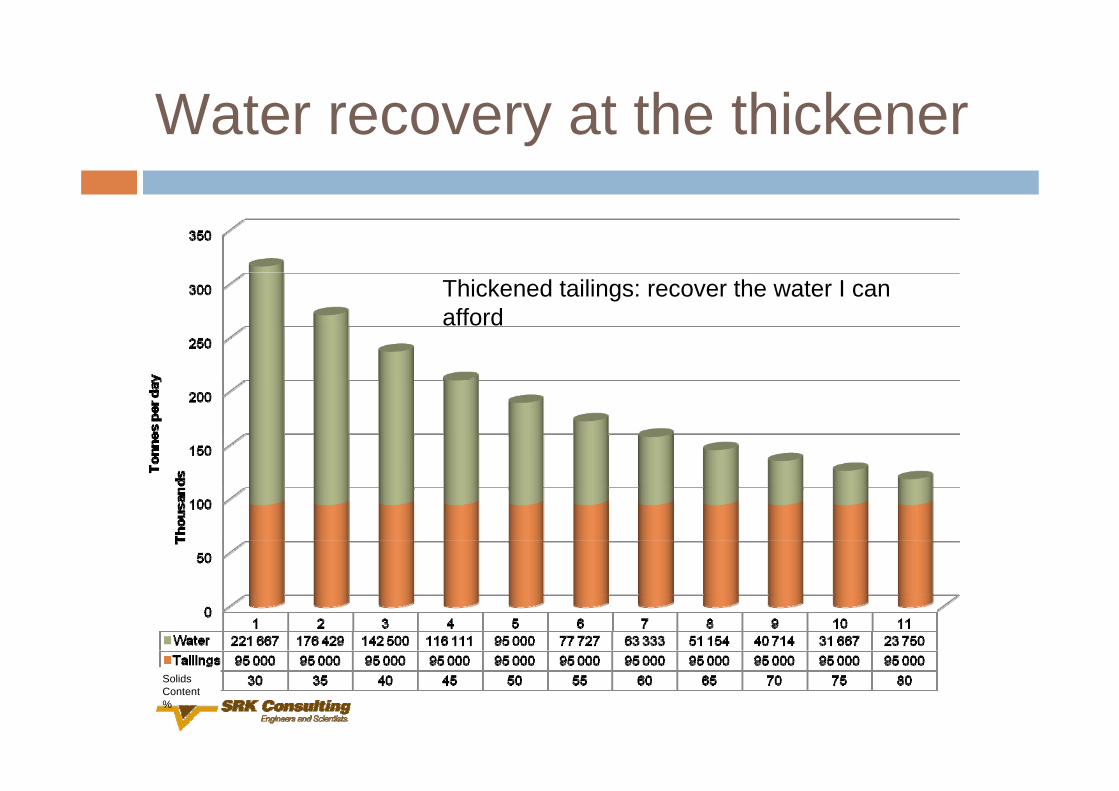
Water recovery at the thickener
Thickened tailings: recover the water I can afford
Solids Content %
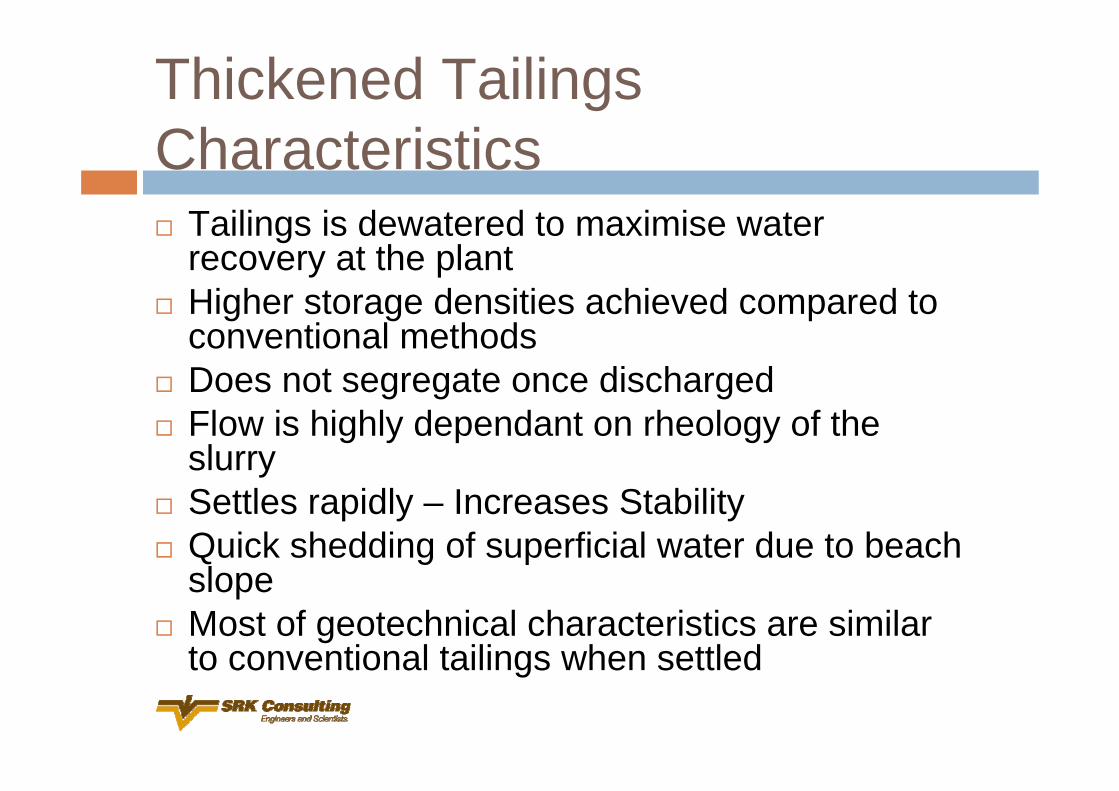
Thickened Tailings Characteristics
Tailings is dewatered to maximise water recovery at the plantHigher storage densities achieved compared to conventional methods Does not segregate once dischargedFlow is highly dependant on rheology of the slurrySettles rapidly – Increases StabilityQuick shedding of superficial water due to beach slopeMost of geotechnical characteristics are similar to conventional tailings when settled
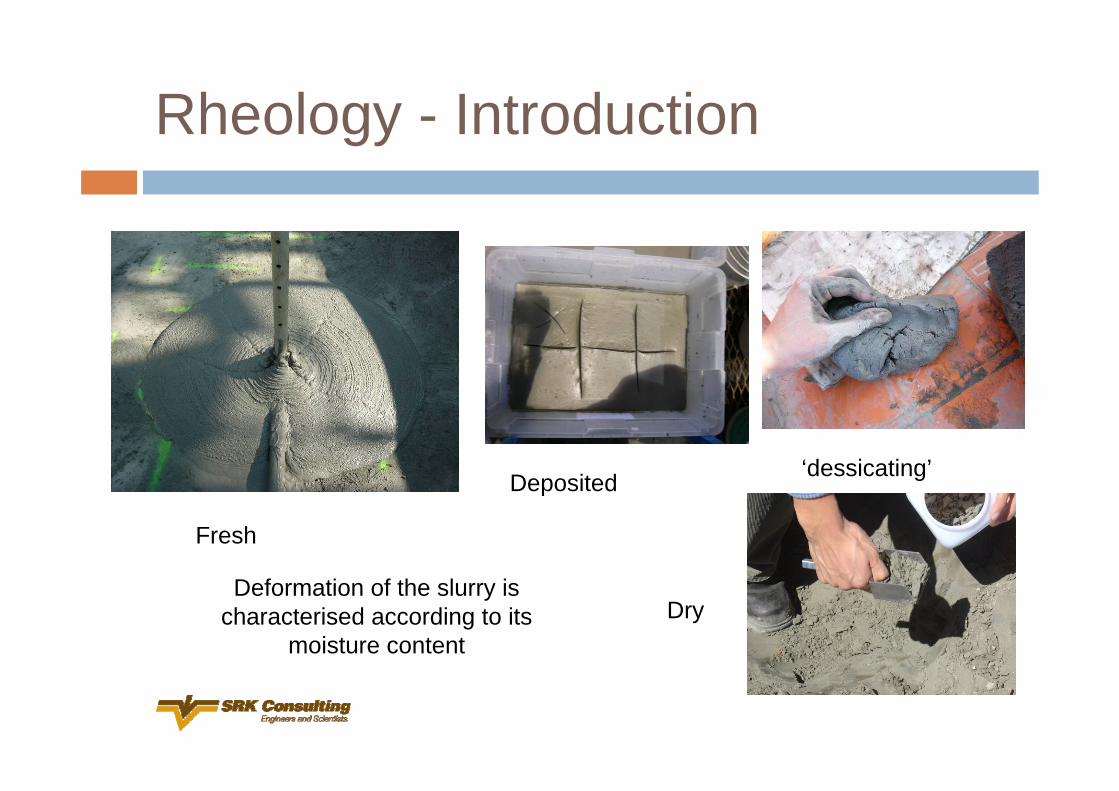
Fresh
Deposited ‘dessicating’
DryDeformation of the slurry is
characterised according to its moisture content
Rheology - Introduction
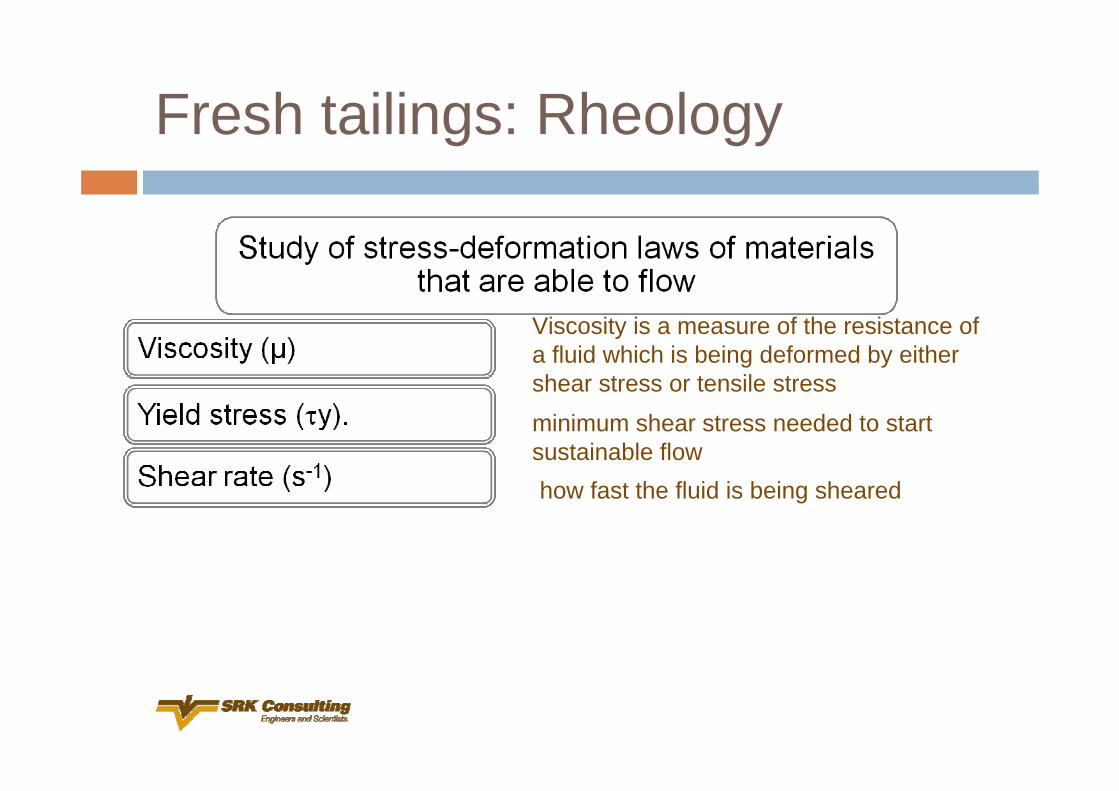
Viscosity is a measure of the resistance of a fluid which is being deformed by either shear stress or tensile stressminimum shear stress needed to start sustainable flow
Fresh tailings: Rheology
how fast the fluid is being sheared
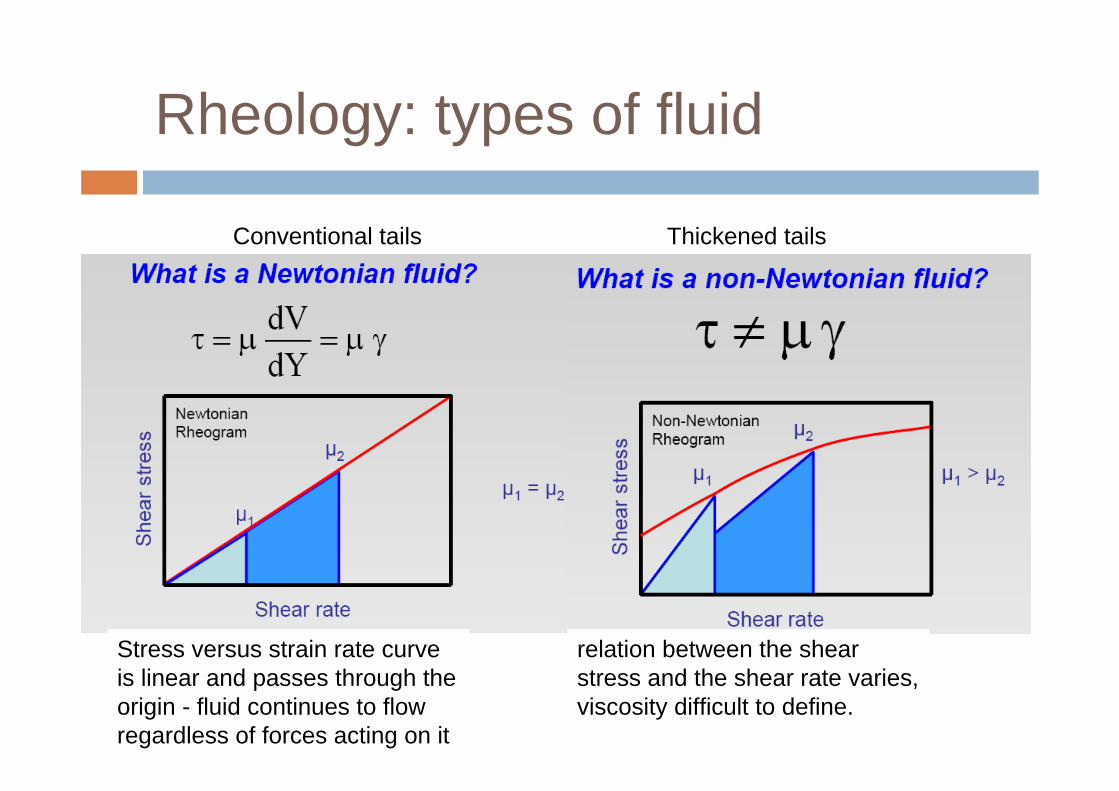
Rheology: types of fluid
Conventional tails Thickened tails
Stress versus strain rate curve is linear and passes through the origin - fluid continues to flow regardless of forces acting on it
relation between the shear stress and the shear rate varies, viscosity difficult to define.
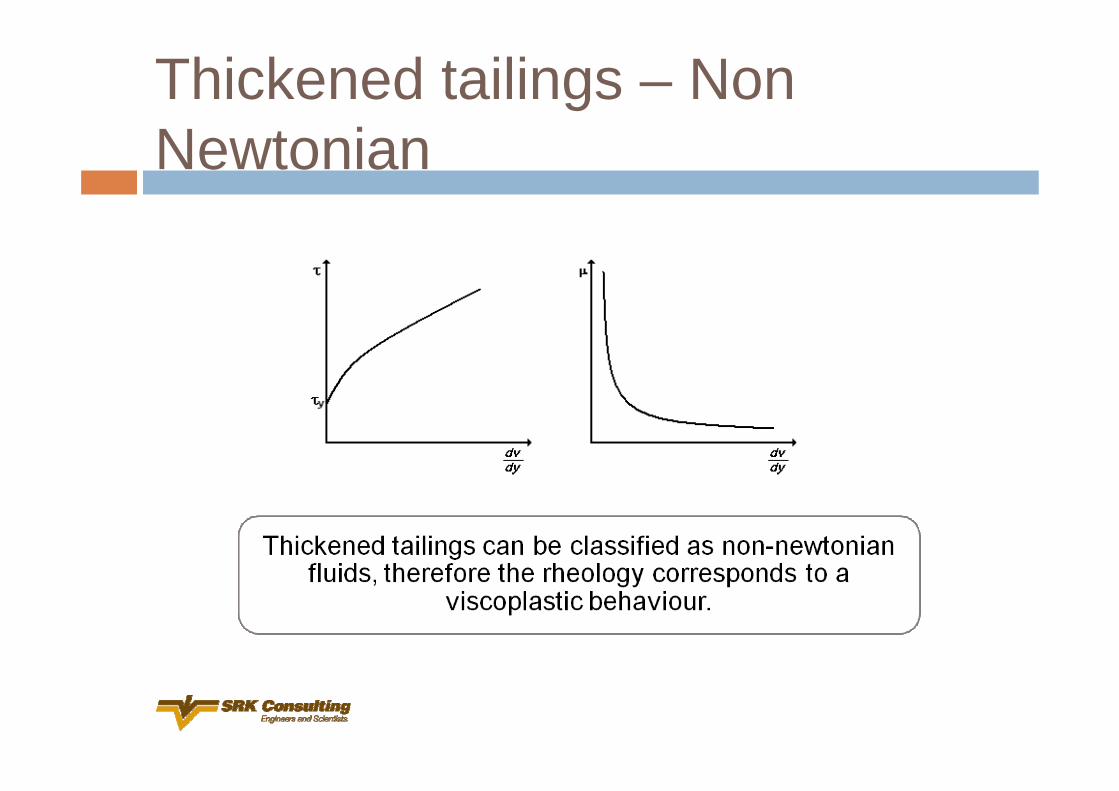
Thickened tailings – Non Newtonian
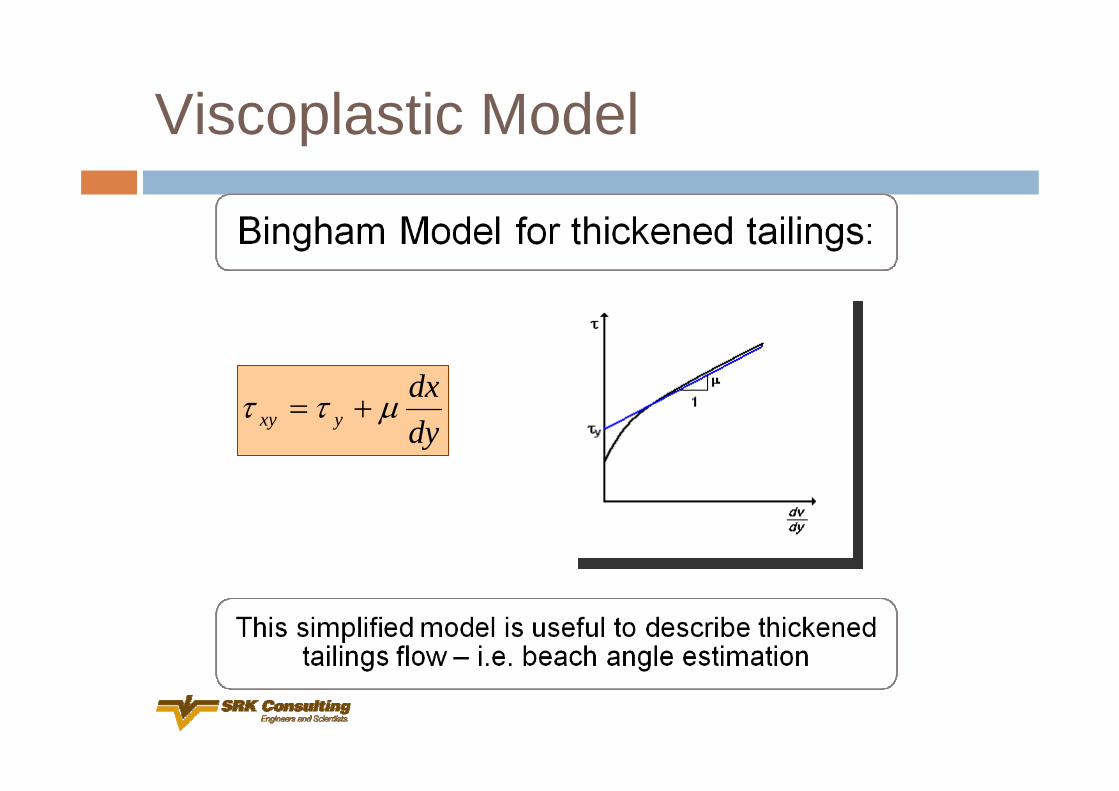
dydx
yxy μττ +=
Viscoplastic Model
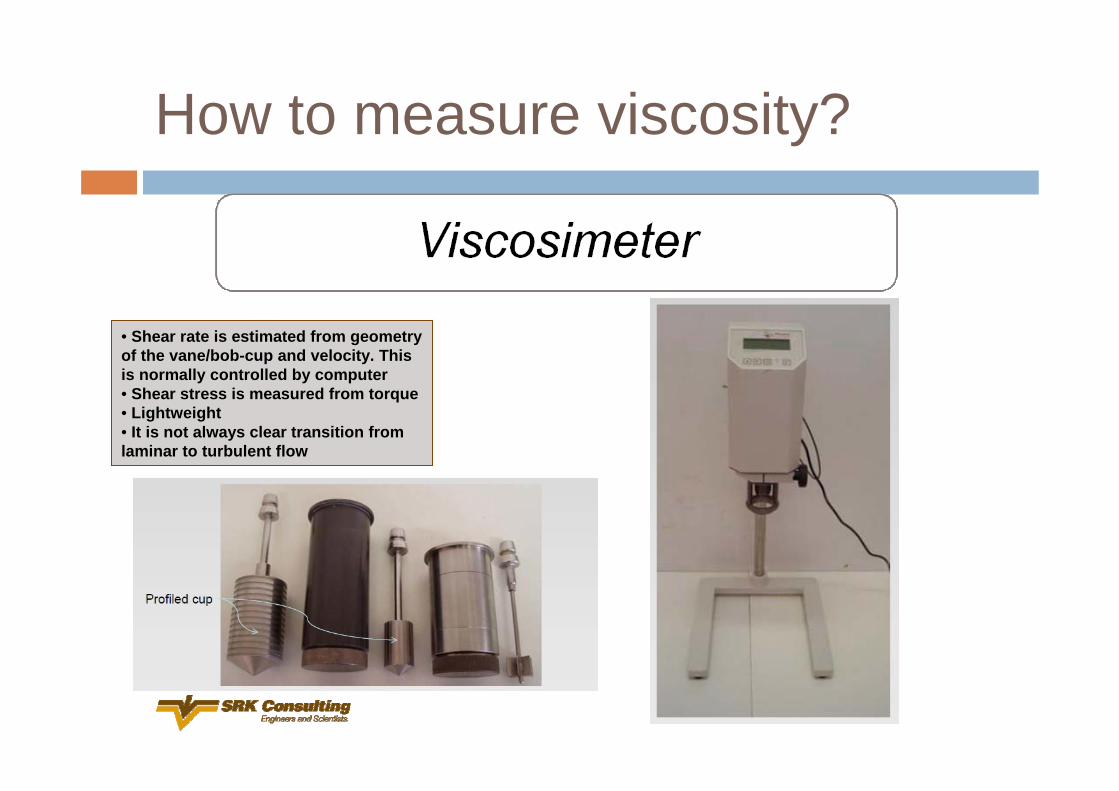
• Shear rate is estimated from geometry of the vane/bob-cup and velocity. This is normally controlled by computer • Shear stress is measured from torque• Lightweight• It is not always clear transition from laminar to turbulent flow
How to measure viscosity?
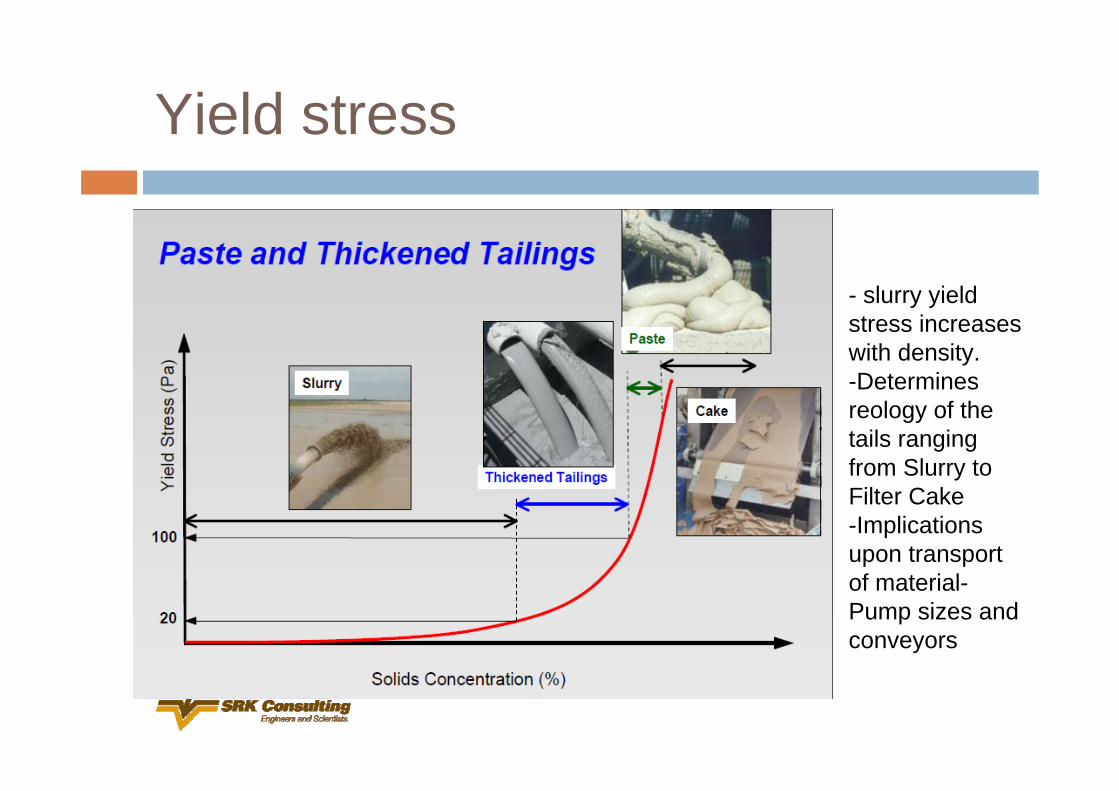
Yield stress
- slurry yield stress increases with density.-Determines reology of the tails ranging from Slurry to Filter Cake-Implications upon transport of material-Pump sizes and conveyors
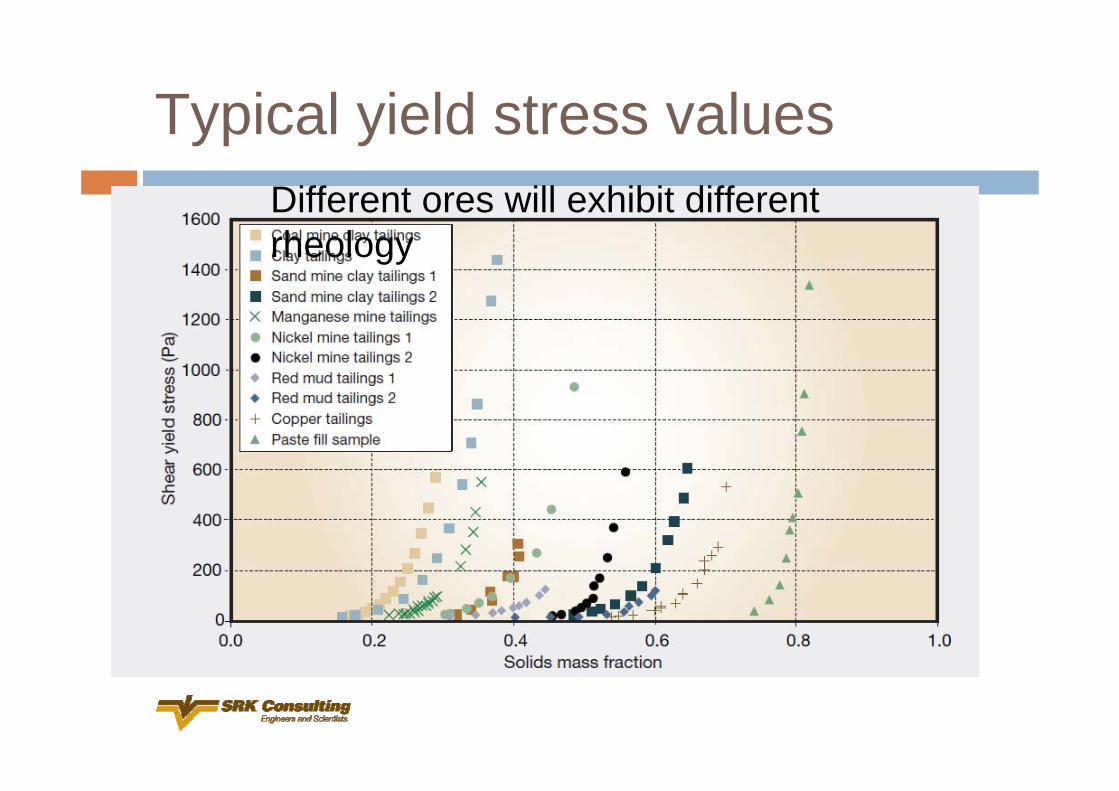
Typical yield stress valuesDifferent ores will exhibit different rheology
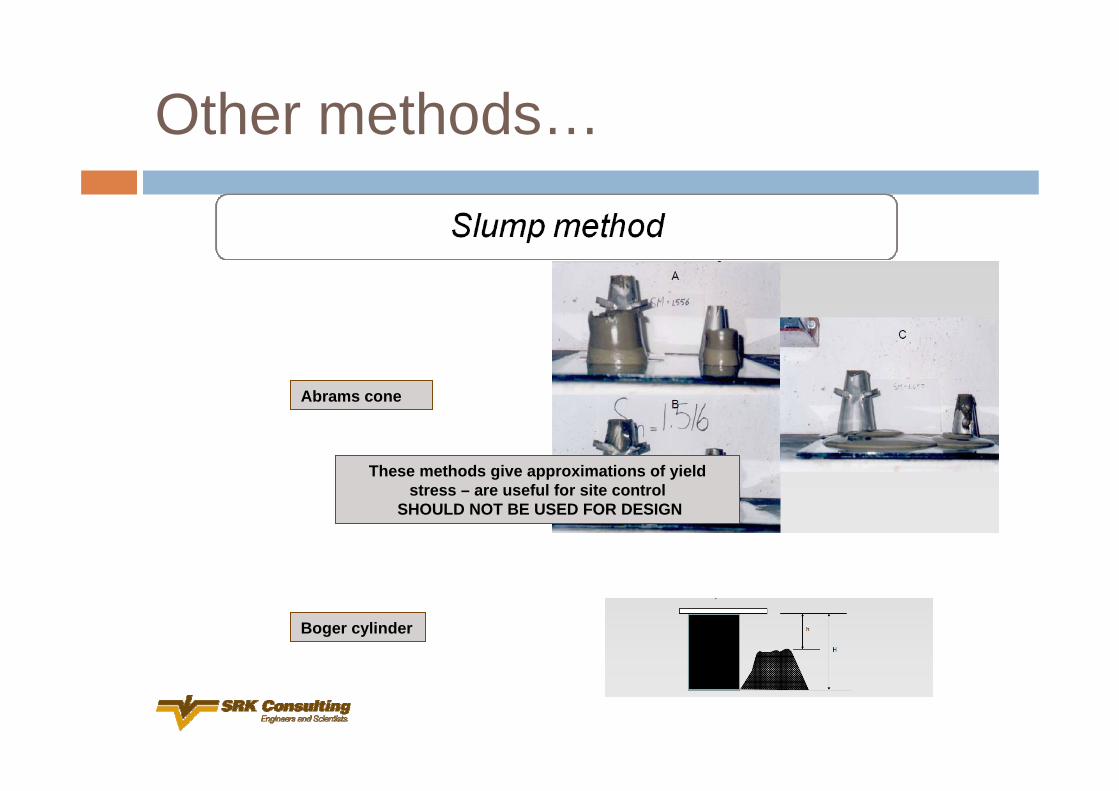
Abrams cone
Boger cylinder
These methods give approximations of yield stress – are useful for site control
SHOULD NOT BE USED FOR DESIGN
Other methods…
Lessons learnt – Tailings rheology
No theoretical models exist to determine rheological parameters WITHOUT test dataThe most widely used model is the two parameter Bingham plastic modelRheometer tests must be carried out at appropriate shear rates. Implications upon:
Thickening processPiping and pumping designBeach flow characterisation
Tests must be done for a range of solids concentrations, size distributions and include all variables that may influence rheologyRheology is sensitive to variations in slurry ‘ingredients’ – a small change in slurry properties could result in a large change in rheology
Geotechnical CharacterisationIt is not very different than conventional characterisationSome of the tailings properties don’t change with water content:
SGPSDAtterbergs
Other properties (transient) change such as:Settling – consolidationDry densityPorosity
Geomechanical characteristics change with tailings fabricMohr – CoulumbCyclic shear strength mobilisationElastoplastic characteristics (E,G )
Specific Gravity
ASTM D854-05This is one of the most important properties: needs to be tested!It is not likely to change with millingIt varies with ore – important when orebody is not homogeoneous
Particle size distribution (PSD)
ASTM D422Change with millingChange with oreFine contents: crucial to establish thickening ratePermeability can be estimated (Hazen or Kozeny-Karman) - don’t use for design!Internal friction angle can be estimated (Dhawan) – don’t use for design!It can be used for drainage design – interface material design.
Tailings settled density
Settling test – 24 h (or more) – drained and undrainedSG is neededAtterbergsShrinkage limitFurther change in density: Consolidation
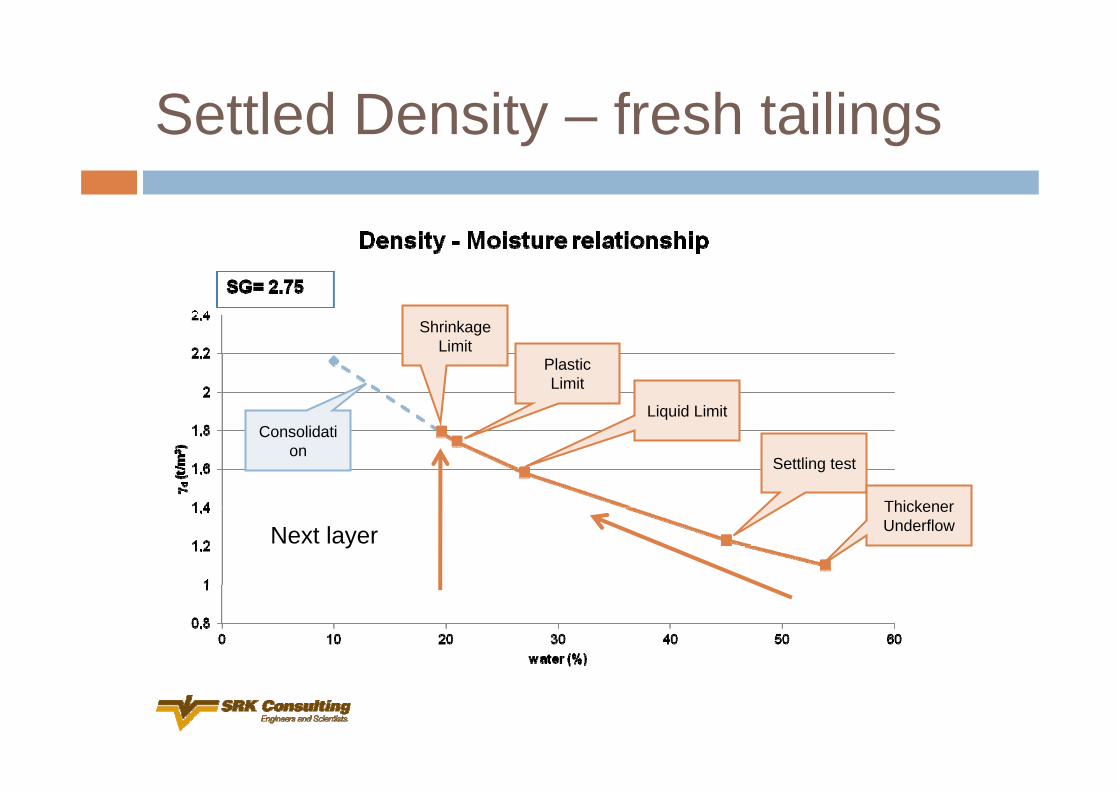
Settled Density – fresh tailings
Shrinkage Limit
Plastic Limit
Liquid Limit
Settling test
Thickener Underflow
Consolidation
Next layer
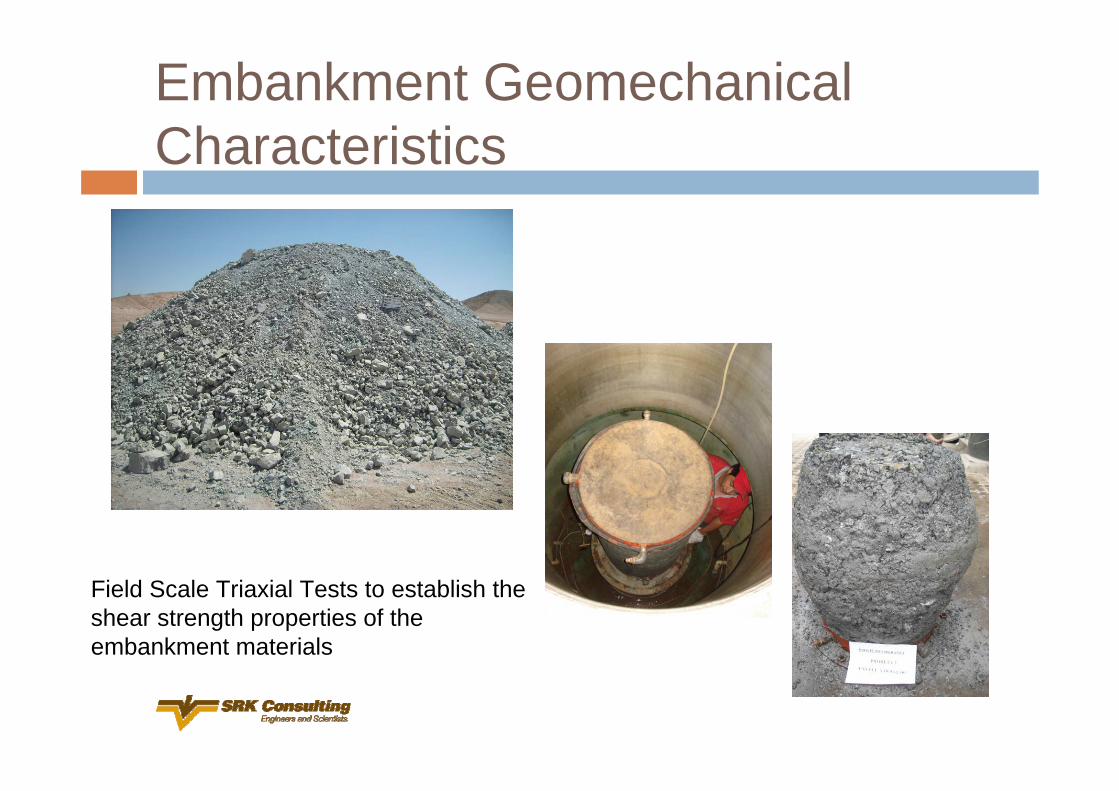
Embankment Geomechanical Characteristics
Field Scale Triaxial Tests to establish the shear strength properties of the embankment materials
Field Tests - The Unconventional
Esperanza Project - Chile95,000 tpd dry product to be stored, total 500 Mt capacity storage.SRK undertook the design of the facilityDesign dependent upon accurate estimation of beach slope (target 4%) to ensure that sufficient capacity was available for storage over the life of mine.
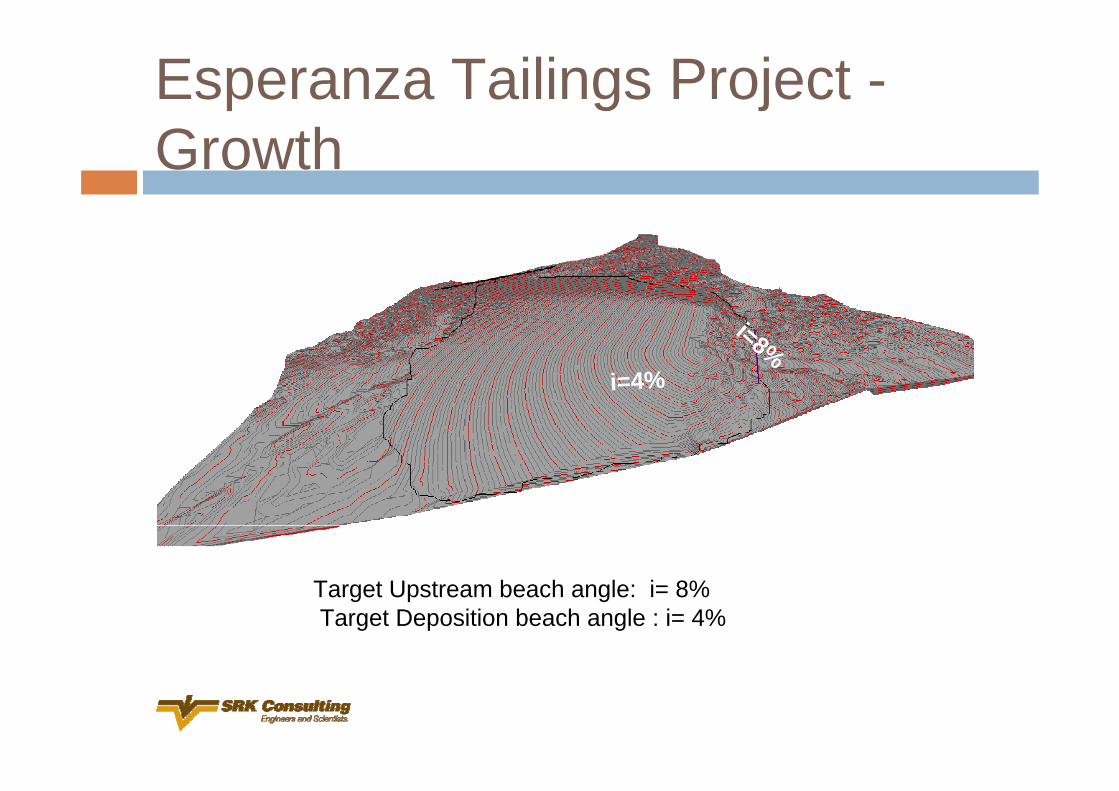
Esperanza Tailings Project -Growth
Target Upstream beach angle: i= 8%Target Deposition beach angle : i= 4%
i=4%
i=8%
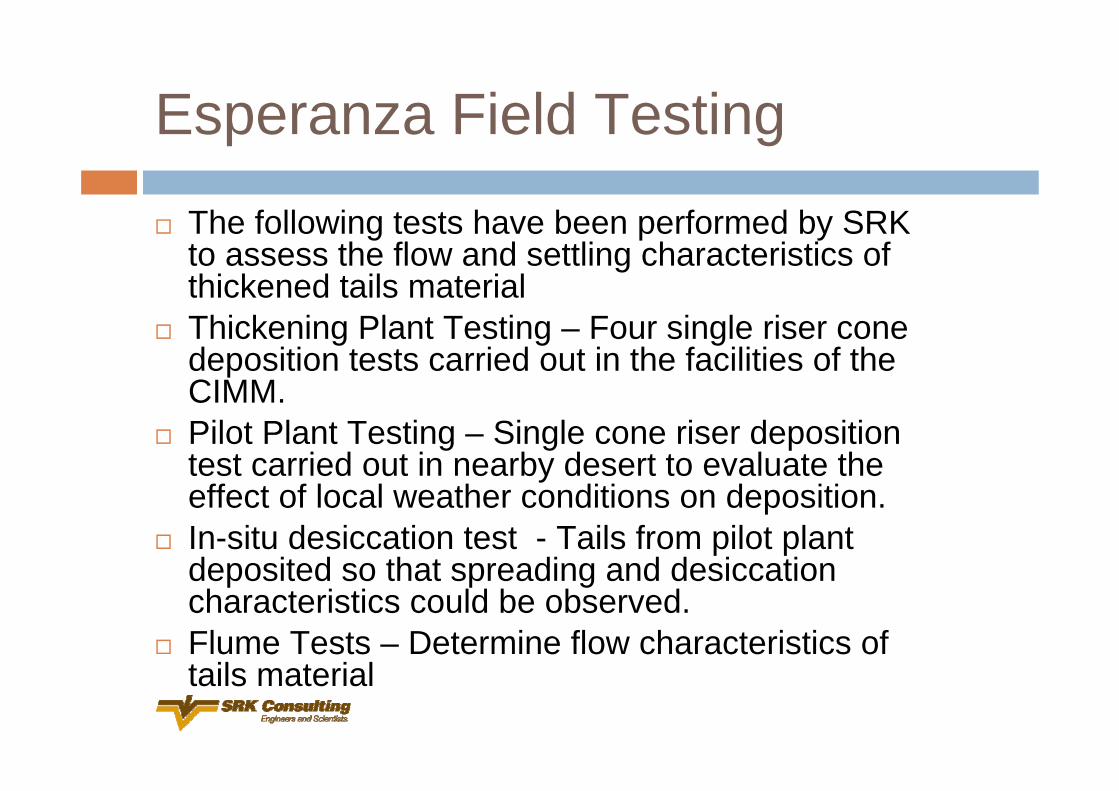
Esperanza Field Testing
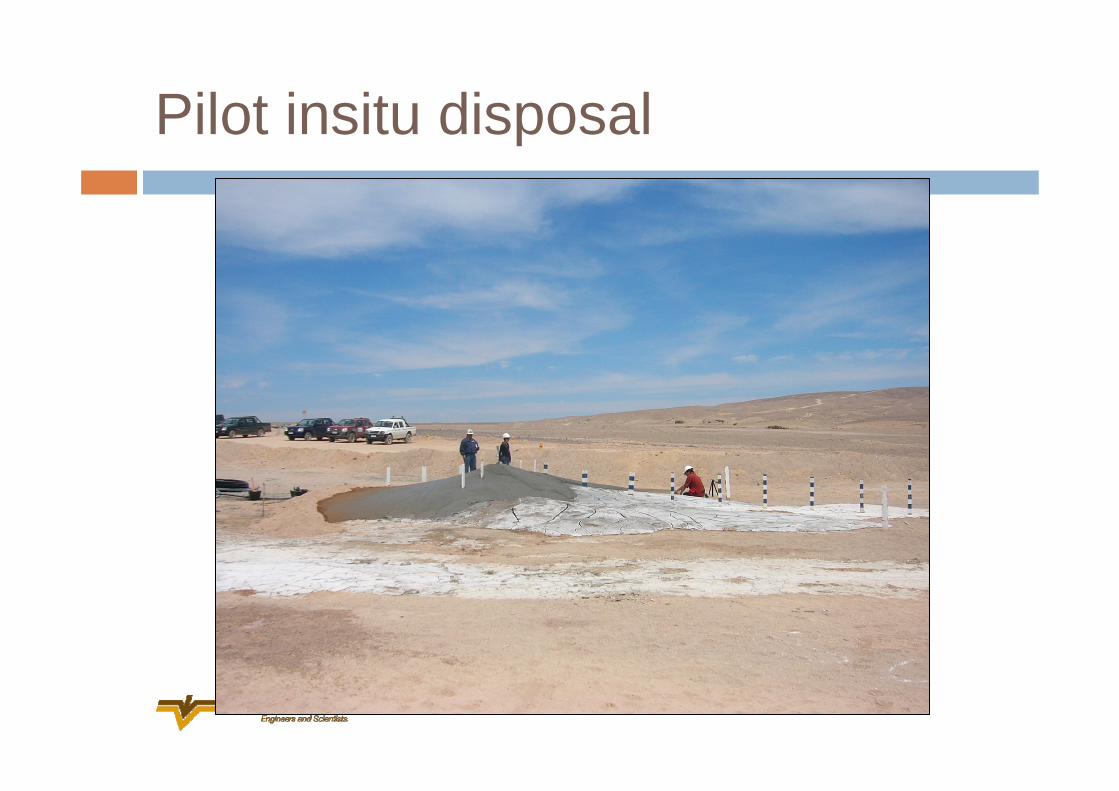
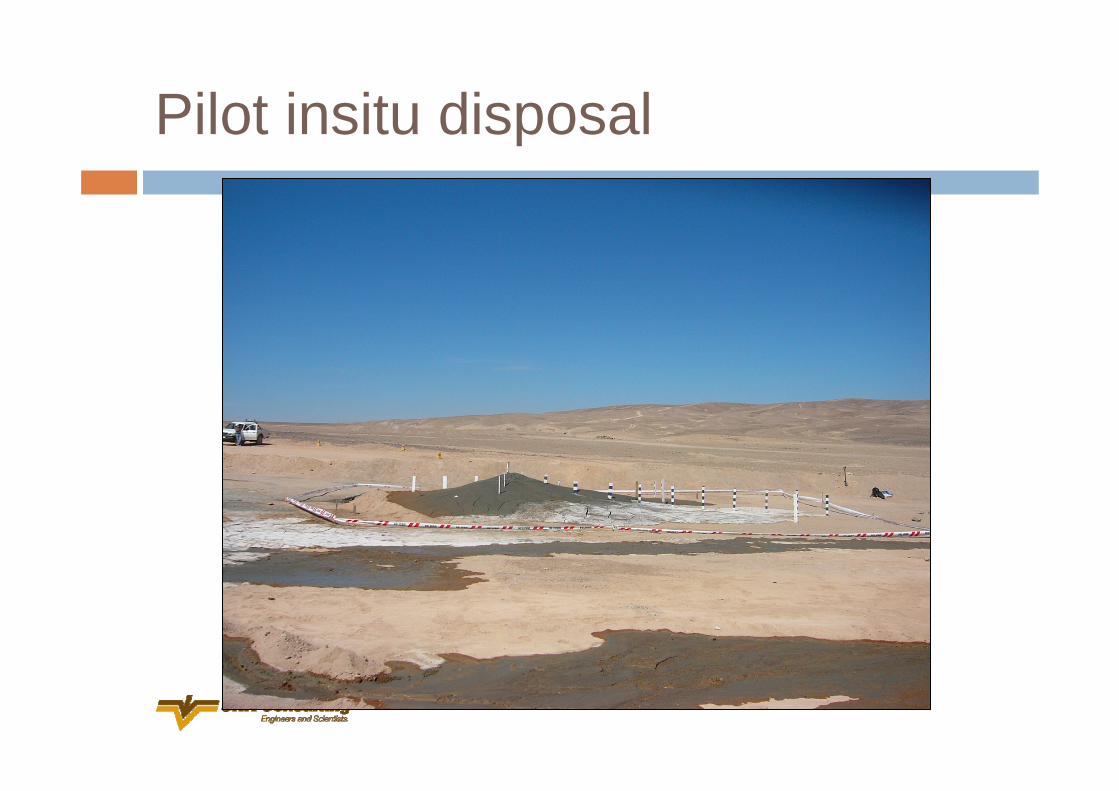
The following tests have been performed by SRK to assess the flow and settling characteristics of thickened tails materialThickening Plant Testing – Four single riser cone deposition tests carried out in the facilities of the CIMM.Pilot Plant Testing – Single cone riser deposition test carried out in nearby desert to evaluate the effect of local weather conditions on deposition.In-situ desiccation test - Tails from pilot plant deposited so that spreading and desiccation characteristics could be observed.Flume Tests – Determine flow characteristics of tails material
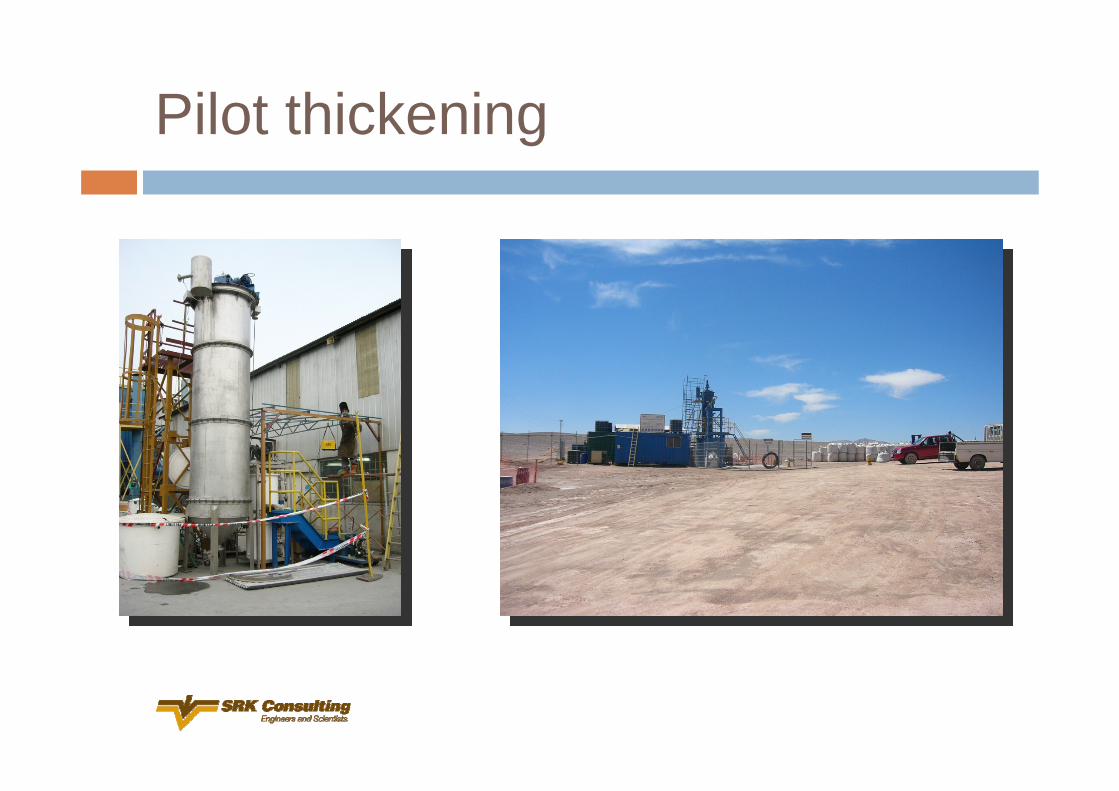
Pilot thickening
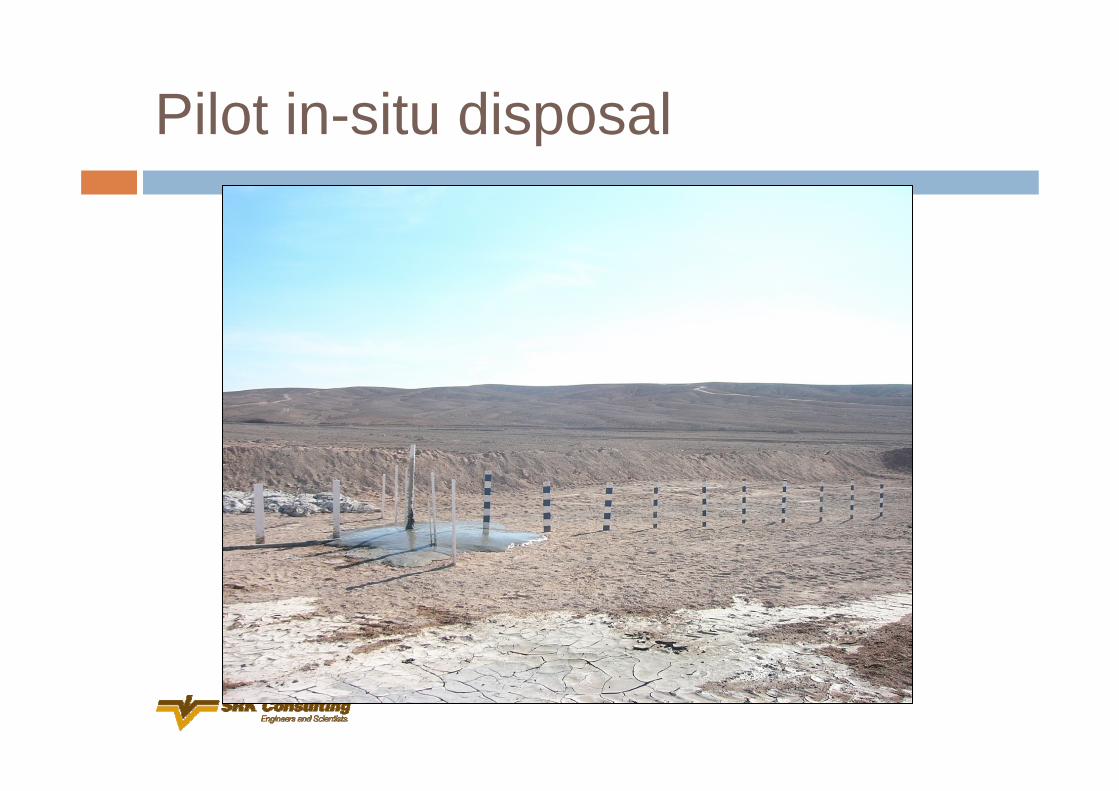
5 Marzo, 2007 – día 0Pilot in-situ disposal
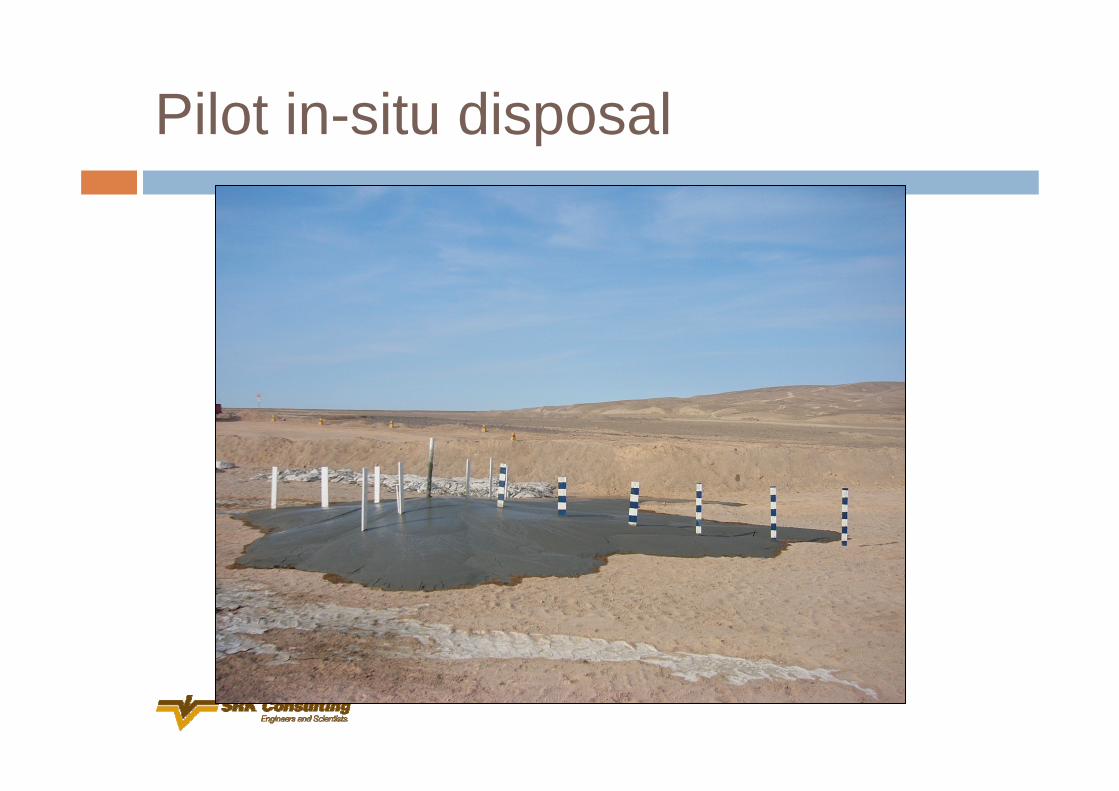
6 Marzo, 2007 – día 1Pilot in-situ disposal
Pilot in-situ disposal
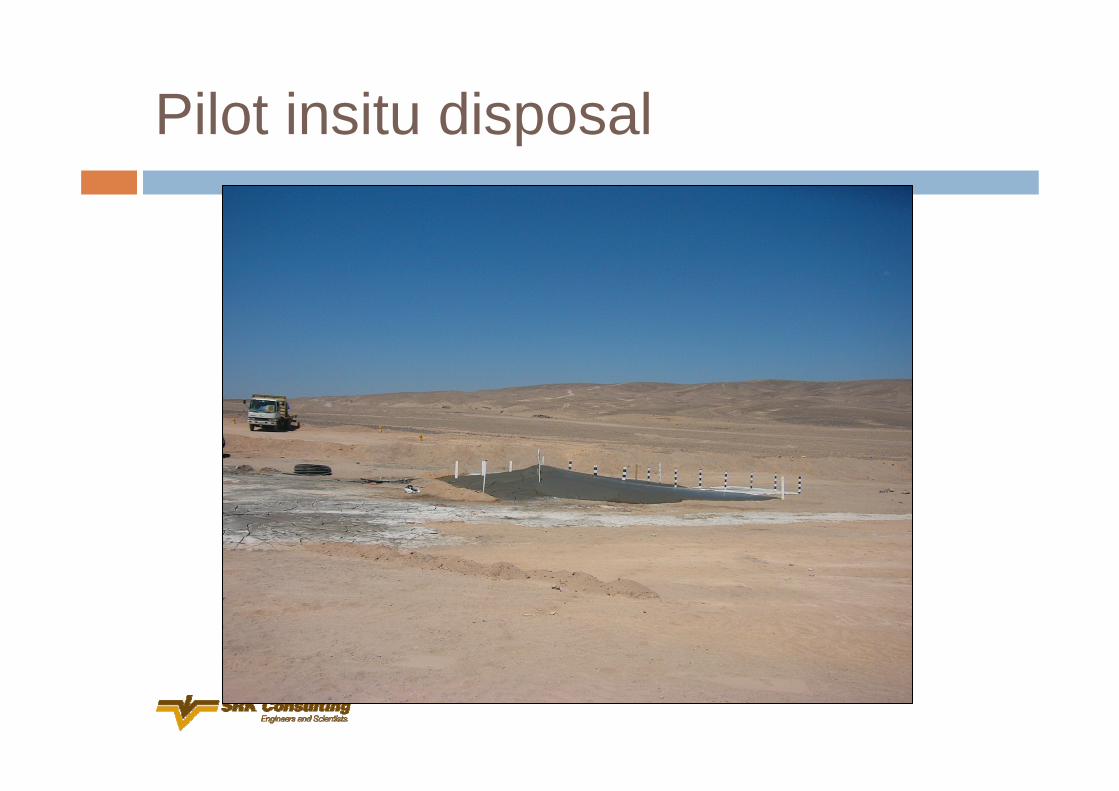
Pilot insitu disposal
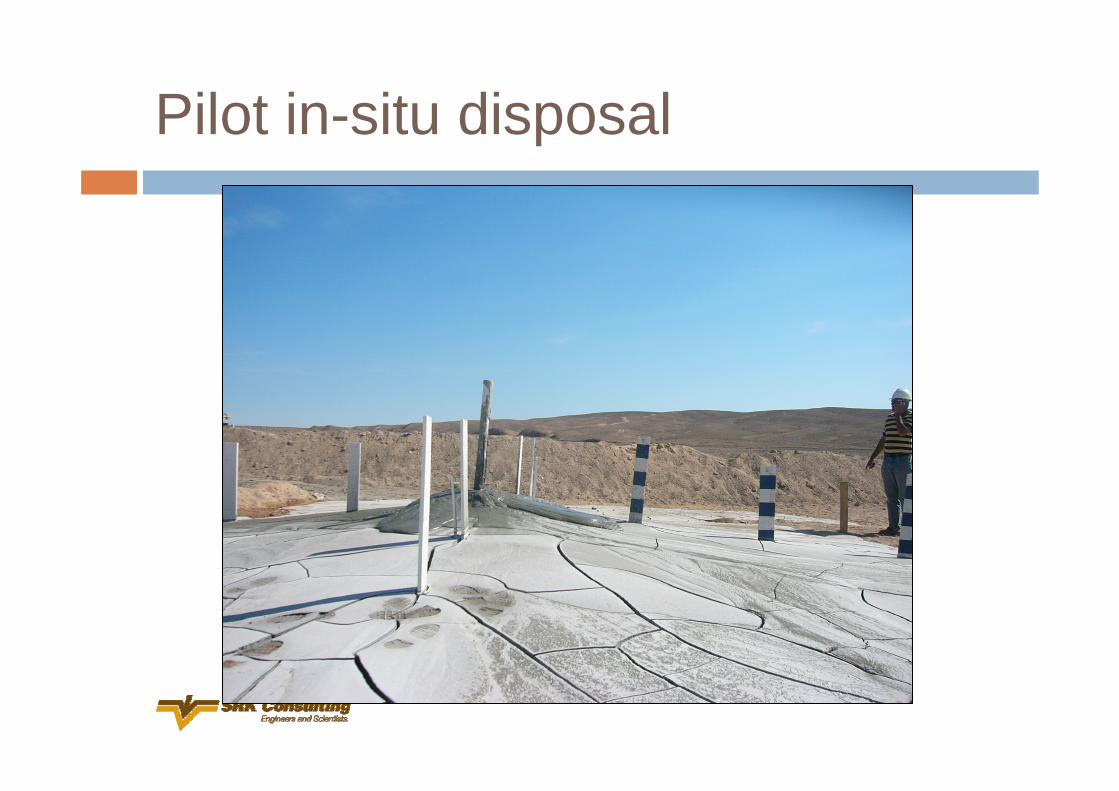
Pilot insitu disposal
Pilot insitu disposal
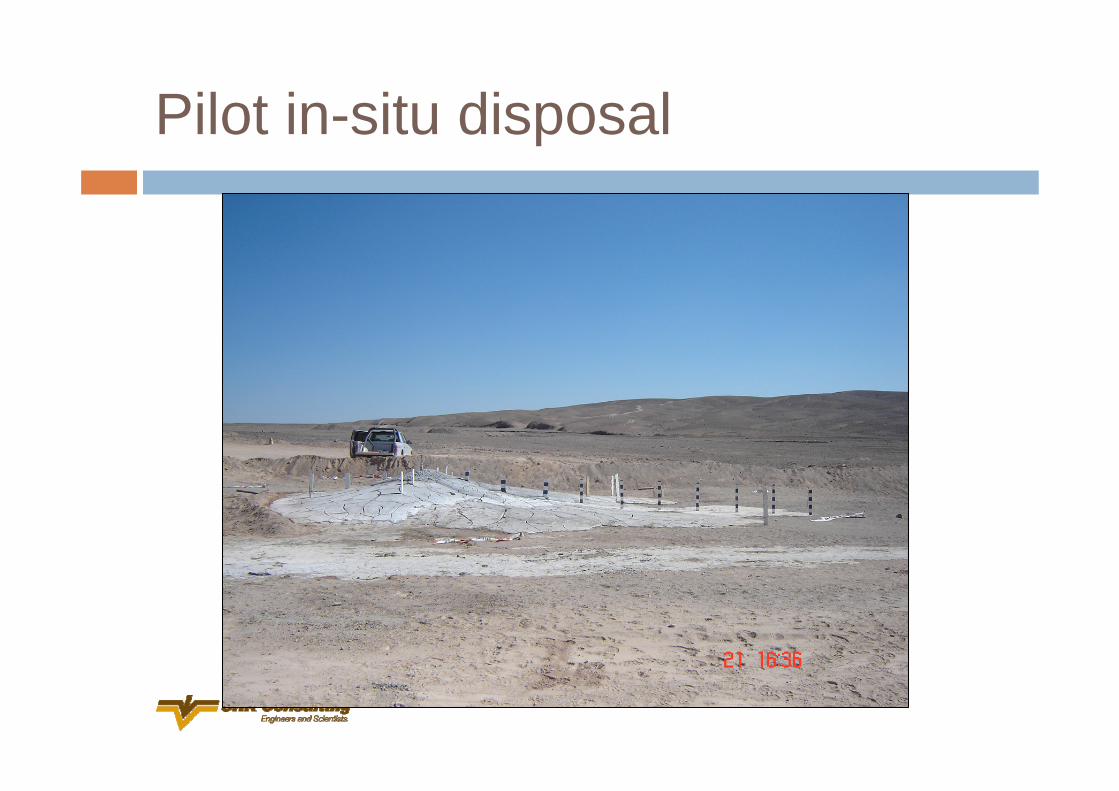
Pilot in-situ disposal
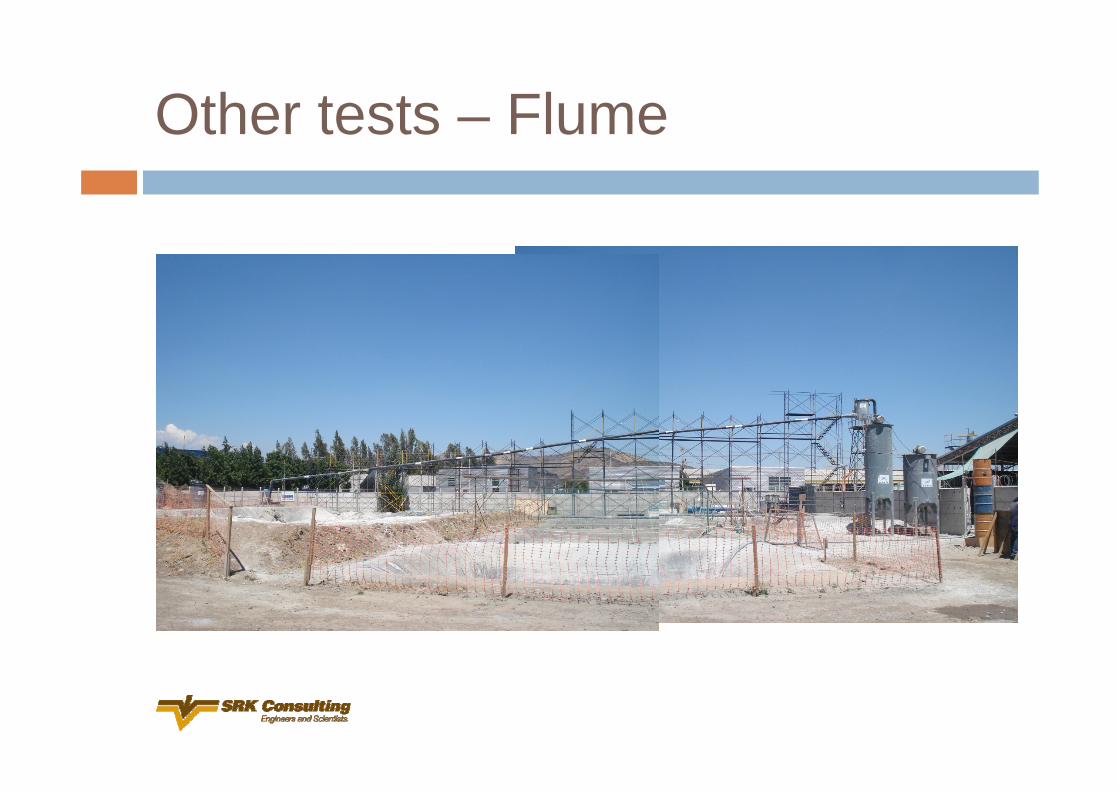
Other tests – Flume
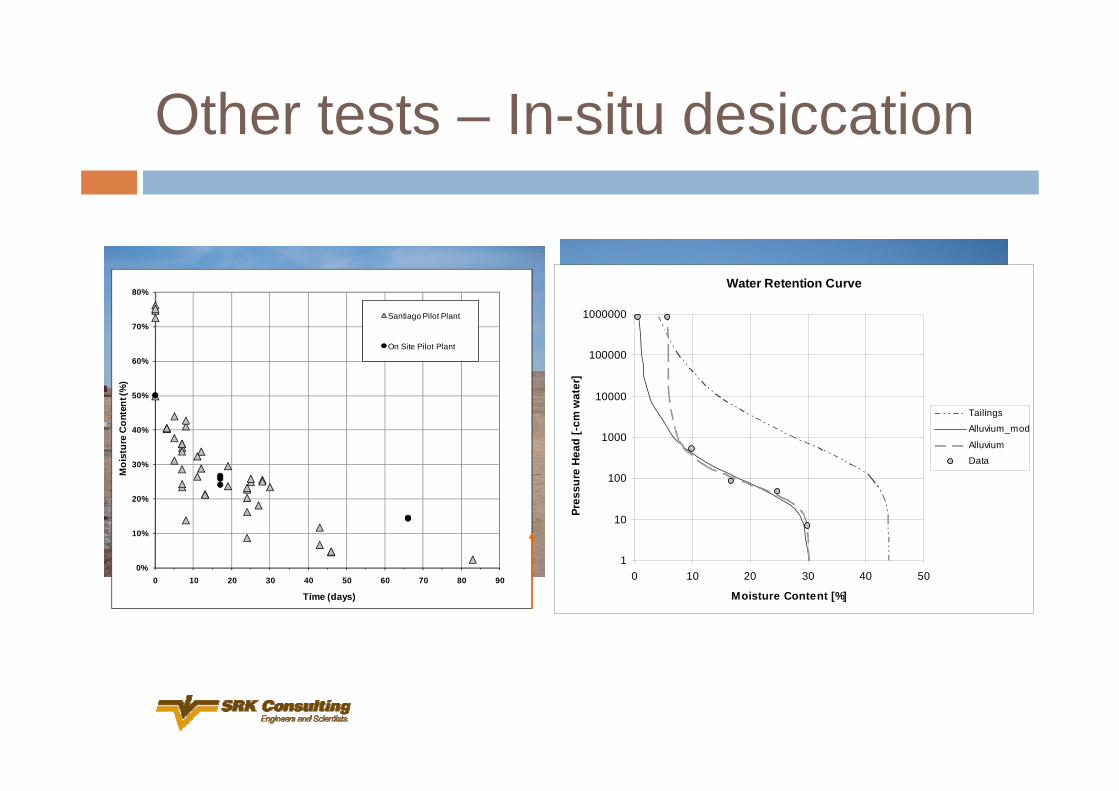
Other tests – In-situ desiccation
0%
10%
20%
30%
40%
50%
60%
70%
80%
0 10 20 30 40 50 60 70 80 90
Moi
stur
e C
onte
nt (%
)
Time (days)
Santiago Pilot Plant
On Site Pilot Plant
Water Retention Curve
1
10
100
1000
10000
100000
1000000
0 10 20 30 40 50
Moisture Content [%]
Pres
sure
Hea
d [-
cm w
ater
]
Tailings
Alluvium_mod
AlluviumData
Applications Thickened Tails
Beach slope estimationInfiltration assessmentStabilityDeformationLiquefaction
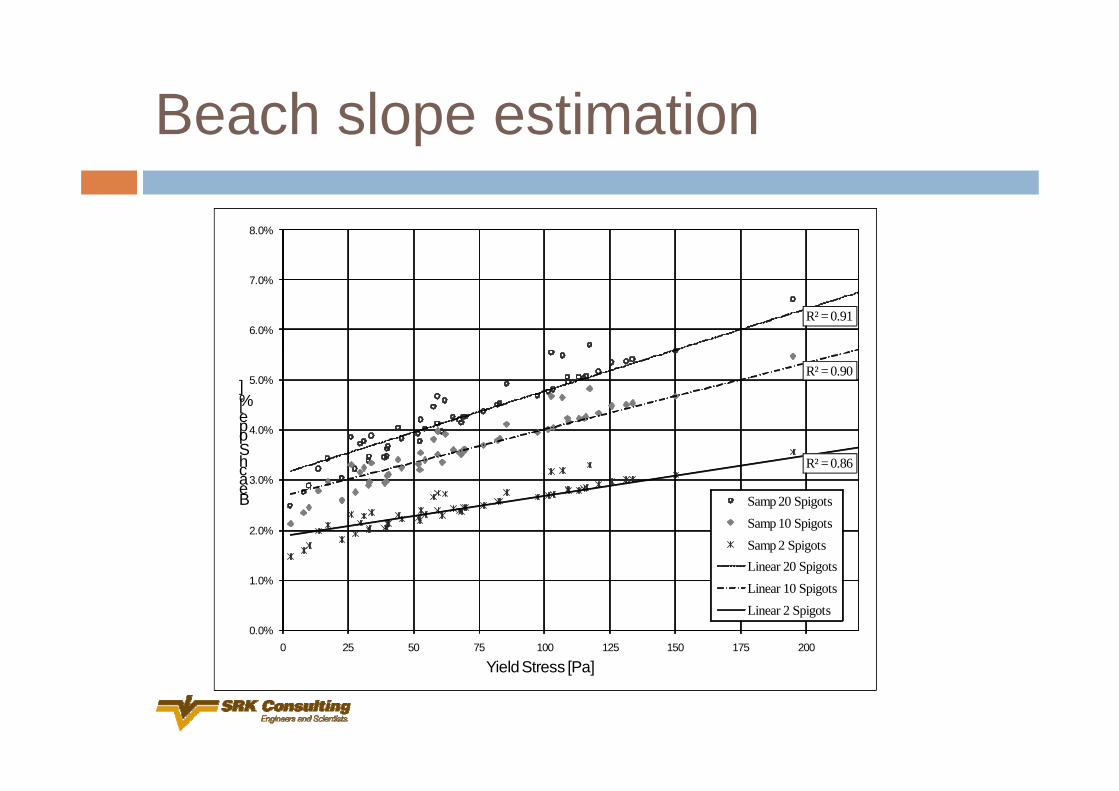
Beach slope estimation
R² = 0.91
R² = 0.90
R² = 0.86
0.0%
1.0%
2.0%
3.0%
4.0%
5.0%
6.0%
7.0%
8.0%
0 25 50 75 100 125 150 175 200
Beach Slope [%]
Yield Stress [Pa]
Samp 20 SpigotsSamp 10 SpigotsSamp 2 SpigotsLinear 20 SpigotsLinear 10 SpigotsLinear 2 Spigots
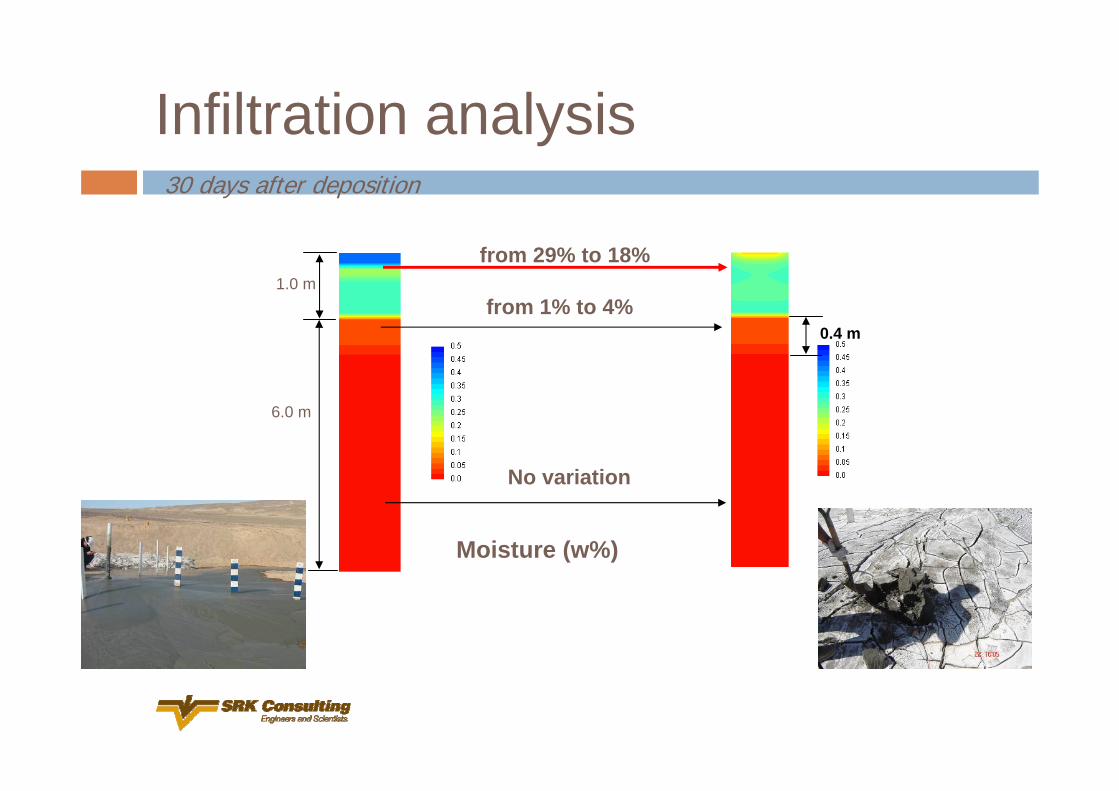
from 29% to 18%
from 1% to 4%
No variation
1.0 m
6.0 m
Moisture (w%)
0.4 m
30 days after deposition
Infiltration analysis
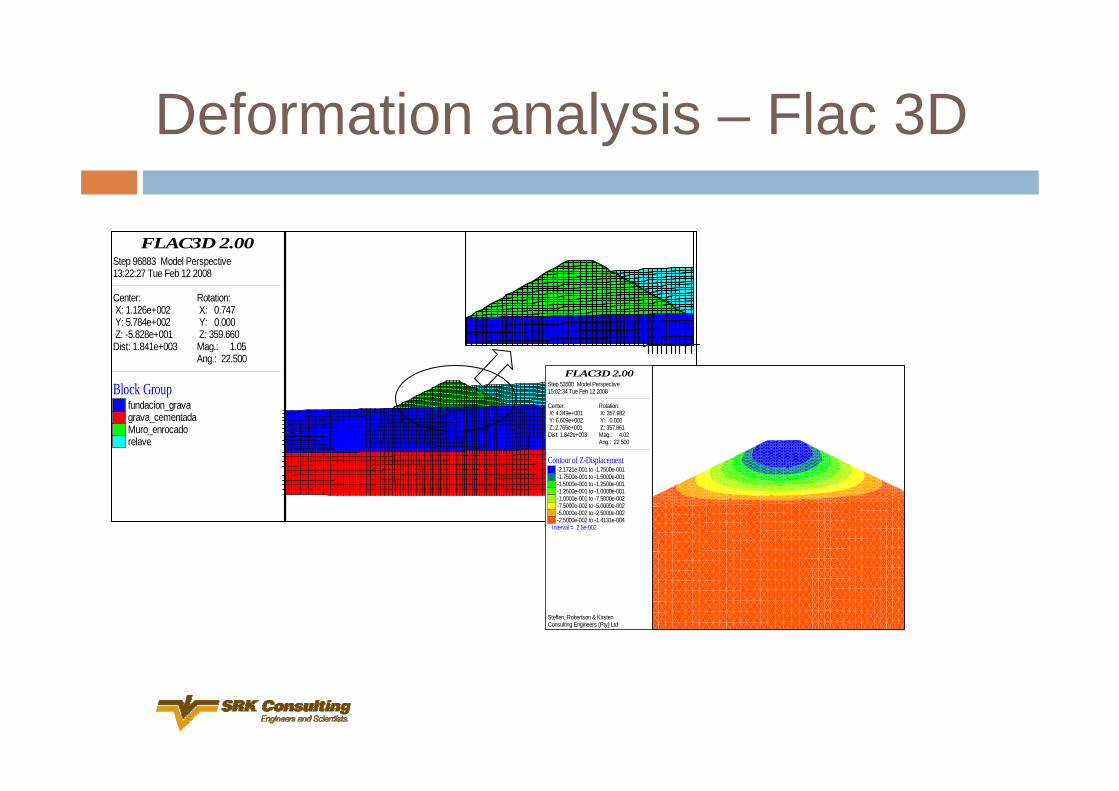
Deformation analysis – Flac 3D
FLAC3D 2.00Step 96883 Model Perspective13:22:27 Tue Feb 12 2008
Center: X: 1.126e+002 Y: 5.784e+002 Z: -5.828e+001
Rotation: X: 0.747 Y: 0.000 Z: 359.660
Dist: 1.841e+003 Mag.: 1.05Ang.: 22.500
Block Groupfundacion_gravagrava_cementadaMuro_enrocadorelave
FLAC3D 2.00
Steffen, Robertson & KirstenConsulting Engineers (Pty) Ltd
Step 53500 Model Perspective15:02:34 Tue Feb 12 2008
Center: X: 4.349e+001 Y: 6.609e+002 Z: 2.765e+001
Rotation: X: 357.982 Y: 0.000 Z: 357.861
Dist: 1.842e+003 Mag.: 4.02Ang.: 22.500
Contour of Z-Displacement-2.1721e-001 to -1.7500e-001-1.7500e-001 to -1.5000e-001-1.5000e-001 to -1.2500e-001-1.2500e-001 to -1.0000e-001-1.0000e-001 to -7.5000e-002-7.5000e-002 to -5.0000e-002-5.0000e-002 to -2.5000e-002-2.5000e-002 to -1.4131e-004
Interval = 2.5e-002
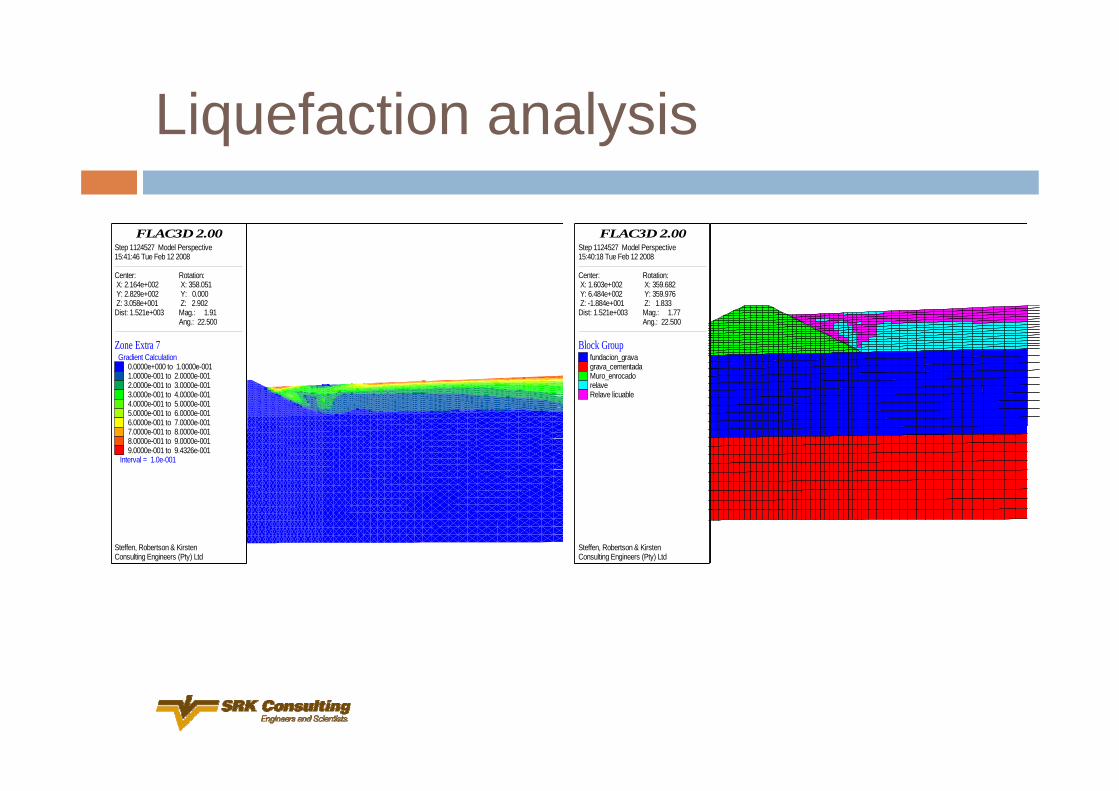
Liquefaction analysis
FLAC3D 2.00
Steffen, Robertson & KirstenConsulting Engineers (Pty) Ltd
Step 1124527 Model Perspective15:41:46 Tue Feb 12 2008
Center: X: 2.164e+002 Y: 2.829e+002 Z: 3.058e+001
Rotation: X: 358.051 Y: 0.000 Z: 2.902
Dist: 1.521e+003 Mag.: 1.91Ang.: 22.500
Zone Extra 7 Gradient Calculation
0.0000e+000 to 1.0000e-001 1.0000e-001 to 2.0000e-001 2.0000e-001 to 3.0000e-001 3.0000e-001 to 4.0000e-001 4.0000e-001 to 5.0000e-001 5.0000e-001 to 6.0000e-001 6.0000e-001 to 7.0000e-001 7.0000e-001 to 8.0000e-001 8.0000e-001 to 9.0000e-001 9.0000e-001 to 9.4326e-001
Interval = 1.0e-001
FLAC3D 2.00
Steffen, Robertson & KirstenConsulting Engineers (Pty) Ltd
Step 1124527 Model Perspective15:40:18 Tue Feb 12 2008
Center: X: 1.603e+002 Y: 6.484e+002 Z: -1.884e+001
Rotation: X: 359.682 Y: 359.976 Z: 1.833
Dist: 1.521e+003 Mag.: 1.77Ang.: 22.500
Block Groupfundacion_gravagrava_cementadaMuro_enrocadorelaveRelave licuable

Discussion - Questions