Embed Size (px)
Citation preview
by
Sylvia LeRoy
Karina Wood
and Jason Clemens
An Analysis of Management, Staff,Volunteers, and Board Effectiveness
in the Non-Profit Sector
2007NON-PROFITPERFORMANCE
REPORT
A program of The Fraser Institute
Report based on the analysis undertaken as part of the

The Fraser Institute
4th Floor, 1770 Burrard Street
Vancouver, British Columbia, Canada
V6J 3G7
Telephone: (604) 714-4531
Fax: (604) 688-8539
E-mail: [email protected]
Contents
Acknowledgements . . . . . . . . . . . . . . . . . . . . . . . . . . . . . . . . . . . . . . 4
About the Authors . . . . . . . . . . . . . . . . . . . . . . . . . . . . . . . . . . . . . . 4
Introduction . . . . . . . . . . . . . . . . . . . . . . . . . . . . . . . . . . . . . . . . . . 5
Performance Criteria . . . . . . . . . . . . . . . . . . . . . . . . . . . . . . . . . . . . . 15
Overall Analysis and Conclusion . . . . . . . . . . . . . . . . . . . . . . . . . . . . . . 37
Appendix: Technical Discussion of the Performance Scores . . . . . . . . . . . . . . . 39
—4—
About the Authors
Jason Clemens is the Director of Research Quality and Resident Scholar in Fiscal Studies at The Fraser In-
stitute. Internally, he also acts as the Director of Strategic Planning and Budgeting. He has an Honours
Bachelors Degree of Commerce and a Masters’ Degree in Business Administration from the University of
Windsor as well as a Post Baccalaureate Degree in Economics from Simon Fraser University. He has pub-
lished studies on a wide range of topics, including taxation, government spending, labour market regula-
tion, banking, welfare reform, and economic prosperity. His articles have appeared in newspapers across
the country and he is a frequent commentator on radio and television.
Sylvia LeRoy is a Senior Policy Analyst in the Fiscal Studies Department at the Fraser Institute, where she
directs the Centre for Social Policy Studies and manages the Donner Canadian Foundation Awards for
Excellence in the Delivery of Social Services. She has an Honours BA in Political Science from the Univer-
sity of Western Ontario and an MA in Political Science from the University of Calgary. She is author or
co-author of more than a dozen studies and book chapters, and has published over 60 articles in The Fra-
ser Institute’s monthly policy magazine Fraser Forum and in newspapers across the country.
Karina Wood is the Donner Awards Outreach Coordinator. She has a Bachelors Degree in Applied Sci-
ence (Agriculture) from the University of Western Sydney and Postgraduate Diplomas in Financial Man-
agement and Business Studies from the University of New England, Australia. She spent two years with
The Fraser Institute as Donner Project Co-ordinator from 2000-2002 and has worked for non-profit orga-
nizations in the United Kingdom.
Acknowledgements
The authors would like to express their sincerest appreciation to the Donner Canadian Foundation, the
Bahen and Chant families, and a group of friends of Peter F. Drucker for their financial support. In partic-
ular, we would like to thank Michael Walker, who originated the idea of developing an objective measure
of performance for non-profit organizations. We would also like to thank Allan Gotlieb, Helen McLean,
Patrick Luciani, Kate Bahen, and Brendan Calder for their personal commitment to this project. A special
thank you should also be extended to Johanna Francis whose work on the project was pivotal to its cur-
rent success, and to Dr. Stephen Easton, Dr. Patrick Basham, Fazil Mihlar, Mark Law, Vanessa Schneider,
Joel Emes, and Margaret Fietz for their comments, suggestions, and criticisms. Finally we are grateful to
Kristin McCahon for her help in preparing this report. Special recognition also goes to Mirja van Herk for
her able assistance in administering the Donner Awards Program from 2003-2006, and to Timothy Mak
for his help compiling data for the 2007 report.
The authors take full responsibility for any errors and omissions. Since they have worked independently,
the views and analysis contained in the report do not necessarily represent the views of The Fraser Insti-
tute or its staff, trustees, or supporters.
Introduction
Canada’s non-profit sector is a vital component of
Canadian civil society, providing many impor-
tant social, cultural, and environmental amenities
independently of both the government, and the
for-profit business sector. Including approxi-
mately 161,000 charities, church groups, commu-
nity associations, and mutual aid societies, this
sector is also an important component of the Ca-
nadian economy.1 Not including hospitals, uni-
versities and colleges, Canada’s non-profit sector
contributes goods and services valued at $34.7 bil-
lion, or 4 percent of the nation’s GDP. The social
services field is the second largest in the sector (af-
ter hospitals, universities, and colleges), contrib-
uting 21 percent of all non-profit economic
activity.2
The organizations in this sector contribute a wide
array of services and amenities that provide sup-
port and aid to the needy, and enhance the quality
of life in our communities. Not including hospitals,
universities and colleges, there are 19,099 Cana-
dian non-profit organizations devoted to deliv-
ering community-based social services; another
12,255 organizations providing social and
economic development and housing supports and
services; and another 8,284 providing education
and research.3 Canada’s 30,679 non-profits with re-
ligious mandates also contribute significantly to
the delivery of social services in Canada.4
The non-profit sector not only provides valued
goods and services to those in need, it also binds
our communities together by providing citizens
with the opportunity to actively participate in find-
ing solutions to some of Canada’s most pressing
social problems. In 2003, Canadian non-profit or-
ganizations benefited from 2 billion volunteer
hours—the equivalent of 1 million full-time jobs—
and $8 billion in individual donations.5 Statistics
Canada estimates that the value of volunteer la-
bour adds about $14.1 billion to the sector’s total
contribution to the Canadian economy; the value
of volunteer work in the area of social services is es-
timated to be about $3 billion, approximately half
the value of total labour in the area of social ser-
vices.6 The voluntary nature of this sector is one of
its most defining characteristics.
—5—
1 There are approximately 80,000 registered charities in Canada. While a charity is, by definition, a non-profit agency,
non-profit agencies are not necessarily charities. Registered with Revenue Canada, charities are subject to its guidelines
and regulations. Charities do not pay income tax, and are able to issue tax-deductible receipts to donors. While other
non-profits are also exempt from paying income tax, they are not able to issue tax-deductible receipts.
2 Hall, Michael et al. (2005), The Canadian Nonprofit and Voluntary Sector in Comparative Perspective (Toronto, ON: Imagine
Canada).
3 Statistics Canada (2004), Cornerstones of Community: Highlights of the National Survey of Nonprofit and Voluntary
Organizations, cat. no. 61-533-XPE (Ottawa, ON: Ministry of Industry).
4 A recent study of social service delivery by religious congregations in Ontario found that the mean percentage of a
congregation’ s operating budget devoted to social services was 20.2 percent. The mean number of social service programs
provided by each congregation was 4.13, with every congregation providing at least one. The net value of these programs
per congregation was over $12,000. See Ram A. Cnaan (2002), The Invisible Caring Hand: American Congregations and the
Provision of Welfare (New York: New York University Press.)
5 Statistics Canada (2004), Cornerstones of Community.
6 Statistics Canada (2004), Satellite Account of Nonprofit Institutions and Volunteering 1997-1999, catalgoue no. 13-015-XIE
(Ottawa, ON: Ministry of Industry).
The Donner Canadian Foundation Awards
Regrettably, the sector’s valuable contribution to
Canadian society often goes unrecognized. The
Donner Canadian Foundation Awards for Excellence in
the Delivery of Social Services were established in
1998 as a means of both providing this well-de-
served recognition and rewarding excellence and
efficiency in the delivery of social services by
non-profit agencies across the country. The national
scope and $70,000 purse makes the Donner Awards
Canada’s largest non-profit recognition program.
Since 1998, $650,000 has been granted to Canadian
non-profits through the Donner Awards.
By providing non-profits with tools to measure
and monitor their performance, the Donner
Awards Program also encourages agencies to
strive to ever-higher levels of excellence. In turn,
the commitment to excellence and accountability
demonstrated by Donner Awards participants
can help encourage public confidence and in-
volvement in this important sector of Canadian
society.
Excellence and Accountability
Demonstrated commitment to excellence and ac-
countability is particularly important at a time when
charities and other non-profit organizations are com-
ing under increased scrutiny for the efficiency and
effectiveness of their program delivery and man-
agement practices. Almost two-thirds of business
leaders polled by COMPAS in September 2003 said
they would be more likely to donate to charity if the
charities were more accountable.7 Similarly, while
79 percent of Canadians report that they have a lot
or some trust in charities, almost all (95 percent)
think more attention should be paid to the way
charities spend their money, and more than half of
Canadians say they’d like more information about
the good work charities do.8
Measurement Challenge
Unlike the for-profit business sector, the non-profit
sector has been hampered in its ability to assess
performance due to the lack of an objective, quanti-
fiable performance measure. The for-profit sector
relies on a number of objective measures to assess
performance, including profitability, market
share, and return on assets. The existence of stan-
dard, objective performance measures in the
for-profit sector allows for comprehensive and
comparative performance analysis.
Unfortunately, there is no such parallel for the
non-profit sector. While more than three quarters
of non-profit organizations surveyed for the Vol-
untary Sector Evaluation Research Project
(VSERP) in 2001 reported that they had engaged in
some type of evaluation in the previous year,9 the
sector has relied almost exclusively on subjective
reviews to assess performance. Subjective assess-
ments normally entail a consultant or performance
evaluator individually reviewing the performance
of agencies and submitting recommendations.
While these types of assessments can be extremely
useful, they are not readily comparable to other
agencies’ performance assessments unless the
same person performs all the analyses. Even in
these circumstances, the scope for comparison is
limited and costly, especially for many small and
medium-sized agencies. This poses a real chal-
lenge for Canadian non-profits, especially as donor
expectations for more rigorous performance evalu-
ation steadily grows. Almost half of the non-profit
—6—
7 Drew Hassleback (2003), “Charities Need to ‘Act Like Business’” National Post, Sept. 12, p. FP2. See also Sylvia LeRoy
(2003), “Growing Accountability and Excellence in the Non-profit Sector,” Fraser Forum, December, pp. 5-7.
8 Ipsos Reid (2004), Talking About Charities 2004—Report. The Muttart Foundation. Available online at
http://www.muttart.org/surveys.htm.
9 Michael Hall, Susan D. Phillips, Claudia Meillat, and Donna Pickering (2003), Assessing Performance: Evaluation Practices &
Perspectives in Canada’s Voluntary Sector (Toronto, ON: Canadian Centre for Philanthropy).
—7—
Table 1: Components of Performance Measurement
Section Area ofMeasurement
Components
One FinancialManagement
• annual surplus—composite measure of the 4 year average and most recent year
• revenue increase—composite measure of the 3 year average and most recent year
• cost containment—composite measure of the 3 year average and most recent year
• program spending versus overall spending—composite measure of the 4 year aver-age and most recent year
• financial reporting
Two IncomeIndependence
• number of sources of income adjusted for the average size of the donation
• percentage of revenue provided by largest revenue source
• percentage of revenue provided by government
• size of accumulated surplus relative to expenses—composite measure of the 4 yearaverage and most recent year
Three StrategicManagement
• use and prevalence of a mission statement
• level of objective and goal setting
• depth of involvement
Four Board Governance • independence
• financial contributions
• level of involvement as measured by frequency of meetings
• level of participation as measured by attendance at meetings
• policy guidelines to avoid conflicts of interest
Five Volunteers • use of volunteers relative to staff—composite measure of agency total and programtotal
• recruiting activities
• management and development of volunteers
• donations other than time by volunteers
• turnover
Six Staff • level of programming provided by employees
• percentage of employees working in programs
• turnover
• management and development of staff
Seven Innovation • uniqueness of agency’s program
• level of restructuring / change
• use of alternative delivery systems / technology in the delivery of services
organizations in the VSERP survey reported that
funder expectations had increased over the previ-
ous three years.10
Anticipating this need, The Fraser Institute began
developing an objective non-profit performance
evaluation system in 1997.11 With the vision and
support of the Donner Canadian Foundation, this
system became the basis of the selection process
for the annual Donner Canadian Foundation
Awards. Between 1998 and 2007, non-profit organi-
zations from all 10 provinces and 2 of the territories
submitted 3,990 unique social service programs for
evaluation in the Donner Awards Program.
This evaluation process represents a major step
forward in the development of an objective,
quantifiable measure of performance for non-
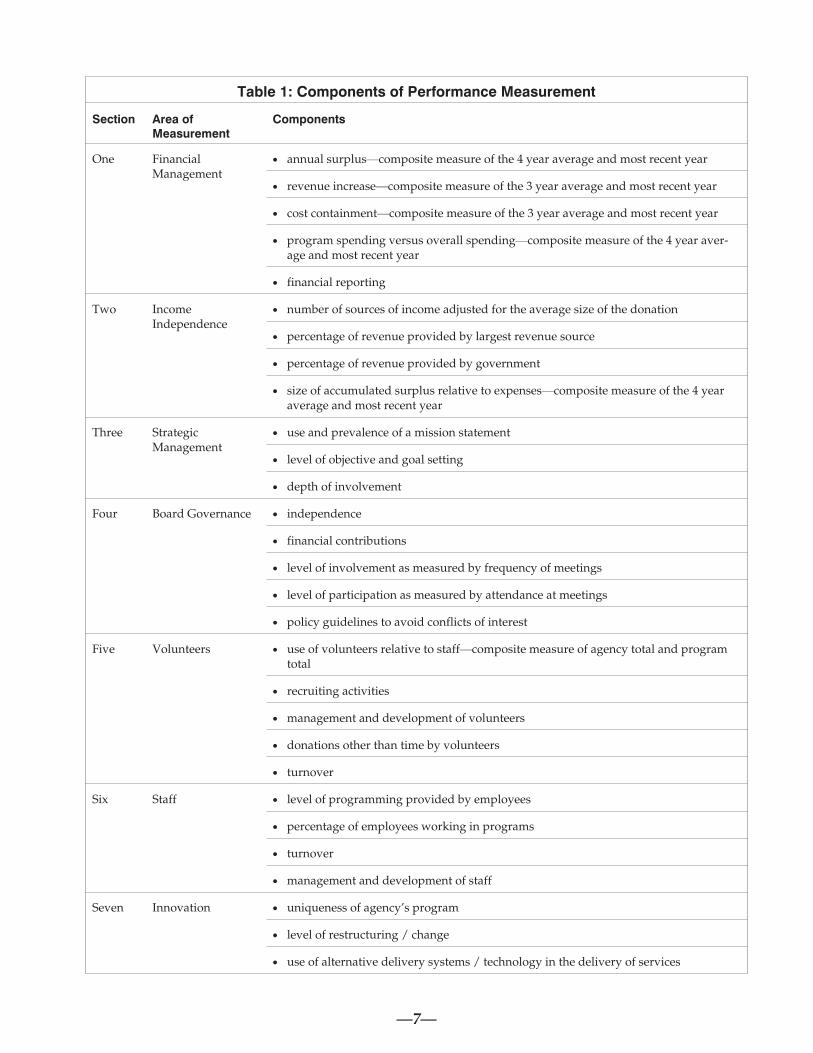
profit organizations. Non-profit performance is
measured in ten areas: Financial Management,
Income Independence, Strategic Management,
Board Governance, Volunteers, Staff, Innova-
tion, Program Cost, Outcome Monitoring, and
Accessibility. In addition to the ten specific crite-
ria, a composite score is also calculated to indi-
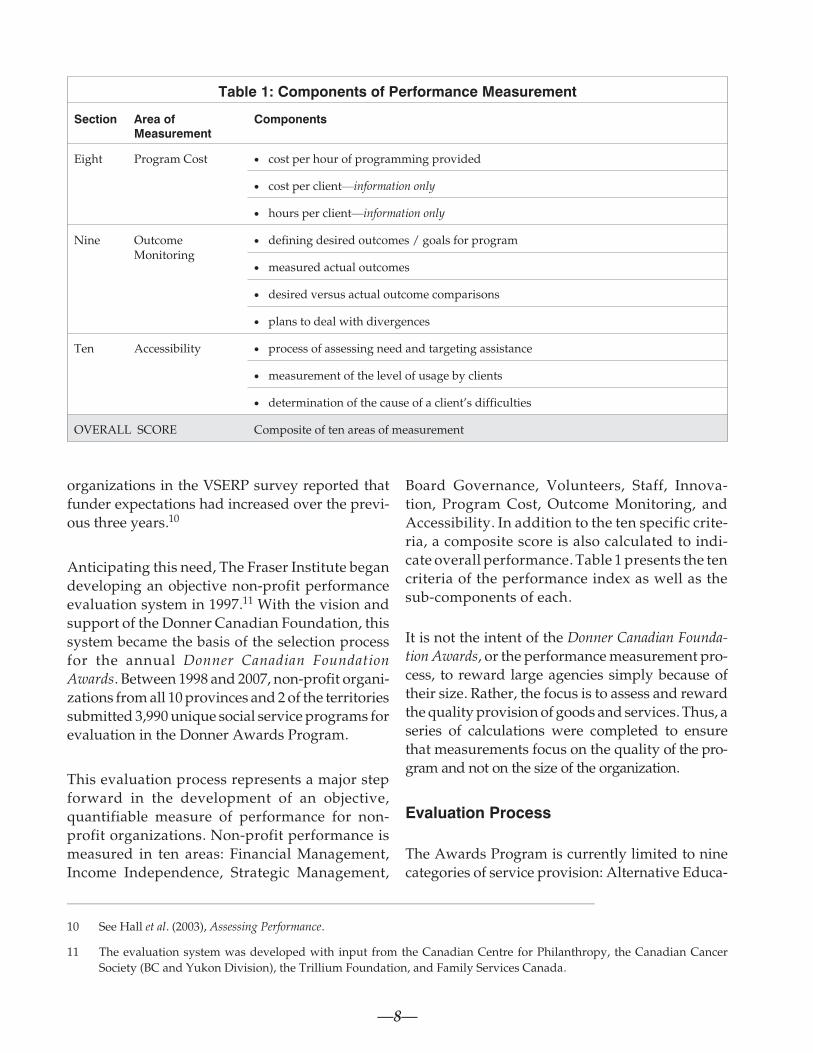
cate overall performance. Table 1 presents the ten
criteria of the performance index as well as the
sub-components of each.
It is not the intent of the Donner Canadian Founda-
tion Awards, or the performance measurement pro-
cess, to reward large agencies simply because of
their size. Rather, the focus is to assess and reward
the quality provision of goods and services. Thus, a
series of calculations were completed to ensure
that measurements focus on the quality of the pro-
gram and not on the size of the organization.
Evaluation Process
The Awards Program is currently limited to nine
categories of service provision: Alternative Educa-
—8—
Table 1: Components of Performance Measurement
Section Area ofMeasurement
Components
Eight Program Cost • cost per hour of programming provided
• cost per client—information only
• hours per client—information only
Nine OutcomeMonitoring
• defining desired outcomes / goals for program
• measured actual outcomes
• desired versus actual outcome comparisons
• plans to deal with divergences
Ten Accessibility • process of assessing need and targeting assistance
• measurement of the level of usage by clients
• determination of the cause of a client’s difficulties
OVERALL SCORE Composite of ten areas of measurement
10 See Hall et al. (2003), Assessing Performance.
11 The evaluation system was developed with input from the Canadian Centre for Philanthropy, the Canadian Cancer
Society (BC and Yukon Division), the Trillium Foundation, and Family Services Canada.
tion, Child Care, Crisis Intervention, Counselling,
the Prevention and Treatment of Substance Abuse,
Provision of Basic Necessities, Services for People
with Disabilities, Services for Seniors, and Tradi-
tional Education.
The selection of categories included in the Donner
Awards Program should in no way be seen as
prioritizing or preferring certain services provided
by the non-profit sector. It is simply a result of lim-
ited resources and the tremendous breadth of ser-
vices the sector provides. One of the long-term
goals of the Awards Program is to expand the num-
ber of service categories.12
Stage One
The Donner Awards Program involves two stages
of evaluation. In the first stage, agencies complete a
detailed application.13 Data from the application is
then used to objectively assess the agency’s perfor-
mance on a comparative basis in key performance
—9—
Table 2: Select Summary Statistics
Category Numberof
Applicants
TotalRevenues
($)
TotalExpenses
($)
TotalAssets
($)
Staff(FTE*)
Volunteers(FTE*)
Numberof
Clients**
Hoursof Pro-
grammingProvided
***
AlternativeEducation
103 144,776,683 139,965,439 95,787,688 1,630 3,942 4,414,147 8,206,342
Child Care 90 93,343,632 94,496,680 68,363,034 1,426 1,703 103,998 6,796,828
Counselling 72 107,667,447 105,069,180 84,430,201 1,870 1,837 122,359 726,234
Crisis Inter-vention
42 70,545,008 67,892,123 70,979,784 822 837 216,380 612,878
Prevention& Treat-ment ofSubstanceAbuse
21 32,177,853 30,502,538 23,924,954 355 600 33,421,509 2,238,456
Provisionof BasicNecessities
72 142,533,532 142,060,891 111,165,179 1,369 1,311 2,378,687 29,578,338
Services forPeople withDisabilities
122 286,025,276 282,337,415 203,343,521 4,308 2,494 1,941,618 9,395,605
Services forSeniors
74 92,409,157 89,788,456 117,799,874 1,930 3,341 205,137 5,435,299
TraditionalEducation
35 57,097,539 55,860,023 75,959,586 475 1,539 2,007,564 4,286,286
TOTAL 631 1,026,576,125 1,007,972,745 851,753,821 14,185 17,604 44,811,399 67,276,265
*FTE refers to Full-Time Equivalent, calculated by assuming 37.5 hours per week, 52 weeks of the year.**Refers to the number of clients participating in programs applying for recognition.***Refers to the number of hours of programming provided by the programs applying for recognition.
12 The Alternative Education and Crisis Intervention categories were established in 2000, increasing the total number of
categories of social service recognized by the Donner Awards from seven to nine.
areas (see table 1). The performance of agencies is
measured in a relative way by ranking the results
from all of the agencies in a particular service cate-
gory. Agencies are, therefore, rated against each
other rather than assessed on the basis of an im-
posed standard.
Stage Two
In the second stage of evaluation, the top three, in
some cases four, agencies in each of the nine cate-
gories complete a number of essay-style questions.
In 2007 the finalists responded to a series of ques-
tions surrounding one key performance criteria:
outcome monitoring. All Donner Award appli-
cants are required to report the extent to which
their organization monitors their program out-
comes on their Stage One application form.
The Stage Two evaluation questions, however,
are designed to elicit a more comprehensive pic-
ture of each applicant’s “best practices.” This in-
volved a discussion of the definition and
measurement of each finalist’s program out-
comes, the actual results achieved (both
short-term and long-term), the internal evalua-
tion of these results, and finally, what changes or-
ganizations actually made in response to the
lessons learned from this outcome monitoring. Fi-
nalists were also asked to discuss a “non- profit
challenge” and provide two independent letters
in support of their application to the 2007 Donner
Awards.
In 2007, the distinguished panel of judges that eval-
uated the Stage Two finalist agencies’ submissions
included: Roch Bernier (Directeur General, Centre
d’expertise en sante de Sherbrooke), Brendan Cal-
der (Professor of Strategic Management, Rotman
School of Management, University of Toronto),
Stephen Easton (Professor of Economics, Simon
Fraser University), Robert English (Director of Re-
gional Operations, Canadian Red Cross), Allan
Gotlieb (Chairman, Donner Canadian Founda-
tion), Michael Hall (Vice President Research, Imag-
ine Canada), Ira Jackson (Dean, Drucker School of
Management, Claremont Graduate University),
Doug Jamieson (Chairman and CEO, Charity Vil-
lage Ltd.), Monica Patten (President and CEO,
Community Foundations of Canada), John
Rietveld (President and Executive Director, Scouts
Canada Foundation), and Brad Zumwalt
(Founding Chairman, Social Venture Part-
ners—Calgary). The awards will be presented at a
special tenth anniversary celebration in Toronto on
October 19, 2007.
The Tenth Annual Donner Awards
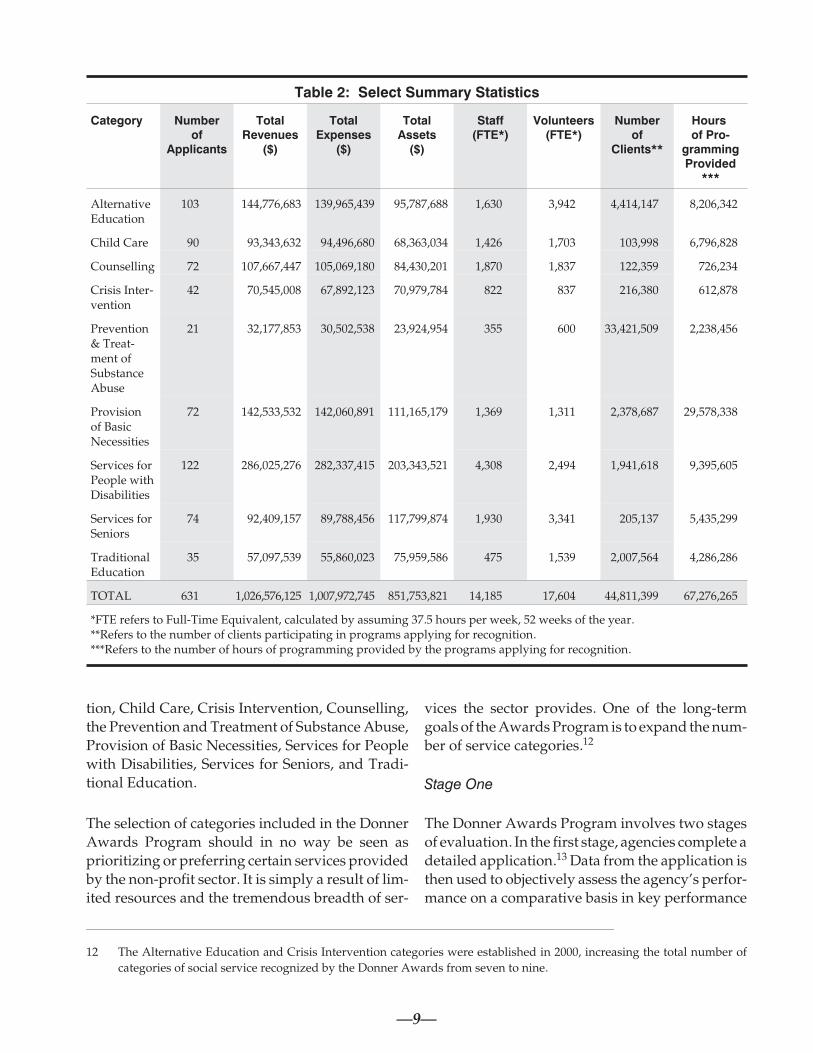
A total of 631 applications were received from
non-profit agencies for the first stage of the awards.
Participating non-profits came from all 10 prov-
inces and one territory. Table 2 summarizes the
number of applications received in each category
and key statistics about the organizations analyzed
in this performance report. These agencies had a
full-time staff equivalent of 14,185 and the equiva-
lent of 17,604 full-time volunteers serving 44.8 mil-
lion clients.14
The following list contains the 28 finalist organiza-
tions that advanced to the second stage of the 2007
Donner Awards. To learn more about these exem-
plary organizations download a copy of the 2007
Donner Awards Profiles in Excellence, available on
our website at www.donnerawards.org. This re-
port also includes a directory of all finalists that
have participated in the Donner Awards Program
between 1998 and 2007.
—10—
13 To receive a copy of the most recent application form, email [email protected] or visit our web site at
www.donnerawards.org.
14 There is much diversity in the definition of “clients” among the various categories of agencies. For example, agencies
providing services such as child care and education have fewer clients receiving a significantly higher numbers of hours of
service than agencies providing basic necessities.
Alternative Education
• Continuing On In Education (Belleville, ON)
• Sarnia Lambton Rebound (Sarnia, ON)
• Teen-Aid Southwest Inc (Swift Current, SK)
Child Care Services
• Big Brothers Big Sisters of Peterborough
(Peterborough, ON)
• Educational Program Innovations Charity So-
ciety (North Sydney, NS)
• The Children’s Garden Nursery School
(Pembroke, ON)
Counselling Services
• Community Living Campbellford/Brighton
(Campbellford, ON)
• Hospice of Waterloo Region (Kitchener, ON)
• Sudbury Action Centre for Youth (Sudbury,
ON)
• Youth Services of Lambton County Inc.—Hu-
ron House Boys’ Home (Bright’s Grove, ON)
Crisis Intervention
• Calgary Pregnancy Care Centre (Calgary, AB)
• Canadian Mental Health Association For The
Kootenays (Cranbrook, BC)
• Crisis Intervention & Suicide Prevention Cen-
tre Of British Columbia (Vancouver, BC)
Services for People with Disabilities
• British Columbia Association of People Who
Stutter (White Rock, BC)
• Multiple Sclerosis Society Of Canada - Cal-
gary Chapter (Calgary, AB)
• Pacific Assistance Dogs Society (Burnaby, BC)
Services for Seniors
• Alzheimer Society of Thunder Bay (Thunder
Bay, ON)
• Calgary Meals on Wheels (Calgary, AB)
• Community & Primary Health Care—Lanark,
Leeds & Grenville (Brockville, ON)
Prevention & Treatment of Substance Abuse
• Fresh Start Recovery Centre (Calgary, AB)
• InnerVisions Recovery Society of BC (Port
Coquitlam, BC)
• Simon House Residence Society (Calgary, AB)
• Sudbury Action Centre For Youth (Sudbury,
ON)
Provision of Basic Necessities
• Alice Housing (Dartmouth, NS)
• Calgary Inter-Faith Food Bank (Calgary, AB)
• Inner City Home of Sudbury (Sudbury, ON)
Traditional Education
• Cornwall Alternative School (Regina, SK)
• John Knox Christian School (Oakville, ON)
• Trenton Christian School Society (Trenton, ON)
Each of the finalists receives a certificate noting
their achievement in reaching the second stage.
The award recipient in each category receives a
$5,000 award in addition to being recognized as the
recipient of the Donner Canadian Foundation Award
for Excellence in the delivery of their particular ser-
vice. The prestigious 2007 William H. Donner Award
for Excellence in the Delivery of Social Services, which
includes a cheque for $20,000, is presented to the
best organization overall. In addition, the $5,000
fourth annual Peter F. Drucker Award for Non-Profit
Management, is presented to a non-profit organiza-
tion whose consistent record of excellence and in-novation in management and service delivery
reflects the philosophy of Peter F. Drucker.
—11—
—12—
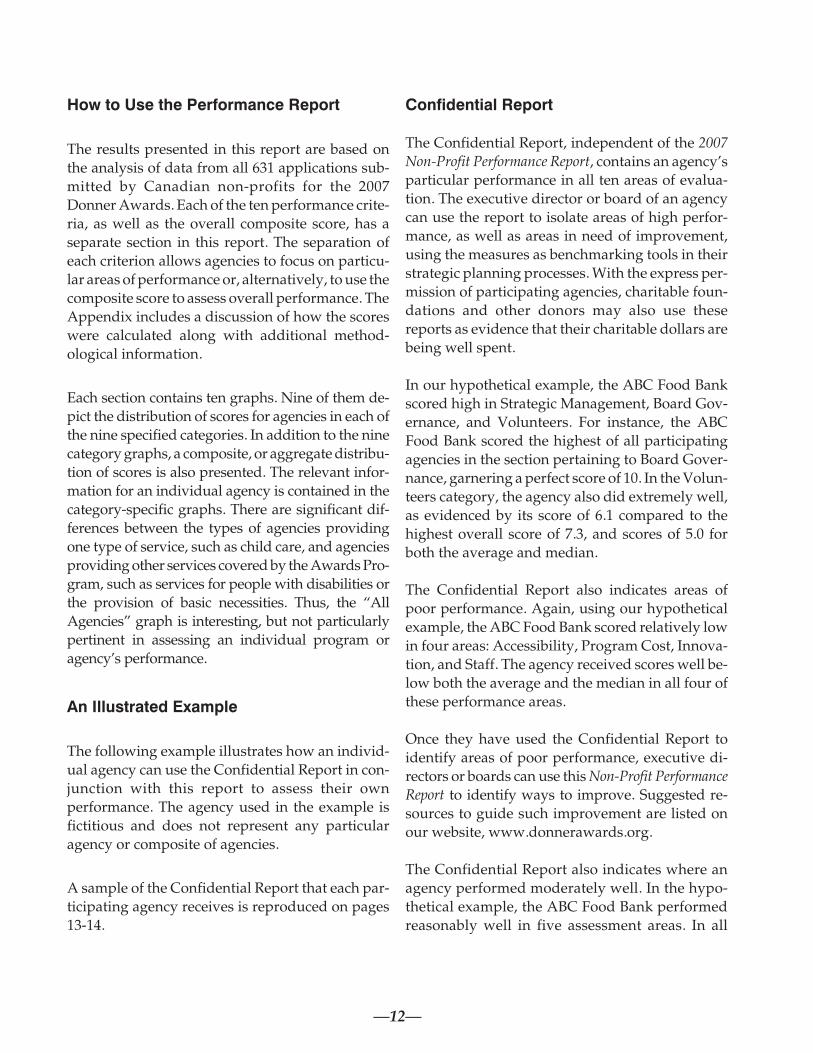
How to Use the Performance Report
The results presented in this report are based on
the analysis of data from all 631 applications sub-
mitted by Canadian non-profits for the 2007
Donner Awards. Each of the ten performance crite-
ria, as well as the overall composite score, has a
separate section in this report. The separation of
each criterion allows agencies to focus on particu-
lar areas of performance or, alternatively, to use the
composite score to assess overall performance. The
Appendix includes a discussion of how the scores
were calculated along with additional method-
ological information.
Each section contains ten graphs. Nine of them de-
pict the distribution of scores for agencies in each of
the nine specified categories. In addition to the nine
category graphs, a composite, or aggregate distribu-
tion of scores is also presented. The relevant infor-
mation for an individual agency is contained in the
category-specific graphs. There are significant dif-
ferences between the types of agencies providing
one type of service, such as child care, and agencies
providing other services covered by the Awards Pro-
gram, such as services for people with disabilities or
the provision of basic necessities. Thus, the “All
Agencies” graph is interesting, but not particularly
pertinent in assessing an individual program or
agency’s performance.
An Illustrated Example
The following example illustrates how an individ-
ual agency can use the Confidential Report in con-
junction with this report to assess their own
performance. The agency used in the example is
fictitious and does not represent any particular
agency or composite of agencies.
A sample of the Confidential Report that each par-
ticipating agency receives is reproduced on pages
13-14.
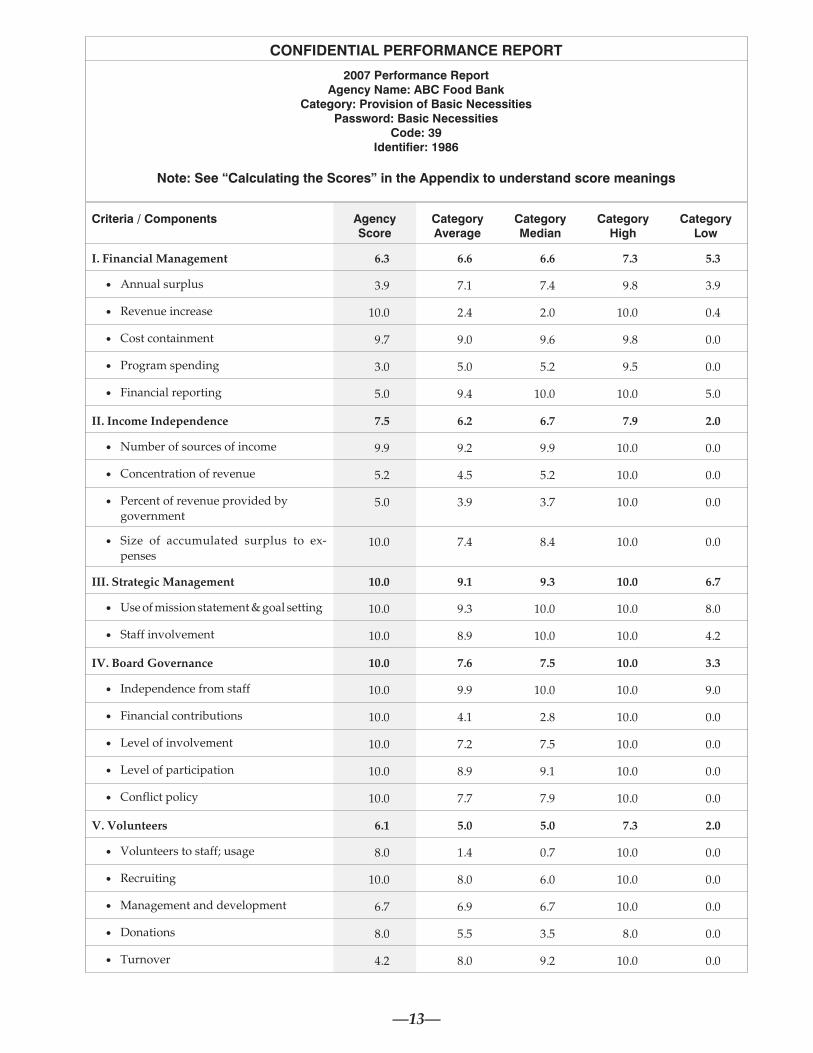
Confidential Report
The Confidential Report, independent of the 2007
Non-Profit Performance Report, contains an agency’s
particular performance in all ten areas of evalua-
tion. The executive director or board of an agency
can use the report to isolate areas of high perfor-
mance, as well as areas in need of improvement,
using the measures as benchmarking tools in their
strategic planning processes. With the express per-
mission of participating agencies, charitable foun-
dations and other donors may also use these
reports as evidence that their charitable dollars are
being well spent.
In our hypothetical example, the ABC Food Bank
scored high in Strategic Management, Board Gov-
ernance, and Volunteers. For instance, the ABC
Food Bank scored the highest of all participating
agencies in the section pertaining to Board Gover-
nance, garnering a perfect score of 10. In the Volun-
teers category, the agency also did extremely well,
as evidenced by its score of 6.1 compared to the
highest overall score of 7.3, and scores of 5.0 for
both the average and median.
The Confidential Report also indicates areas of
poor performance. Again, using our hypothetical
example, the ABC Food Bank scored relatively low
in four areas: Accessibility, Program Cost, Innova-
tion, and Staff. The agency received scores well be-
low both the average and the median in all four of
these performance areas.
Once they have used the Confidential Report to
identify areas of poor performance, executive di-
rectors or boards can use this Non-Profit Performance
Report to identify ways to improve. Suggested re-
sources to guide such improvement are listed on
our website, www.donnerawards.org.
The Confidential Report also indicates where an
agency performed moderately well. In the hypo-
thetical example, the ABC Food Bank performed
reasonably well in five assessment areas. In all
—13—
CONFIDENTIAL PERFORMANCE REPORT
2007 Performance ReportAgency Name: ABC Food Bank
Category: Provision of Basic NecessitiesPassword: Basic Necessities
Code: 39Identifier: 1986
Note: See “Calculating the Scores” in the Appendix to understand score meanings
Criteria / Components AgencyScore
CategoryAverage
CategoryMedian
CategoryHigh
CategoryLow
I. Financial Management 6.3 6.6 6.6 7.3 5.3
• Annual surplus 3.9 7.1 7.4 9.8 3.9
• Revenue increase 10.0 2.4 2.0 10.0 0.4
• Cost containment 9.7 9.0 9.6 9.8 0.0
• Program spending 3.0 5.0 5.2 9.5 0.0
• Financial reporting 5.0 9.4 10.0 10.0 5.0
II. Income Independence 7.5 6.2 6.7 7.9 2.0
• Number of sources of income 9.9 9.2 9.9 10.0 0.0
• Concentration of revenue 5.2 4.5 5.2 10.0 0.0
• Percent of revenue provided by
government5.0 3.9 3.7 10.0 0.0
• Size of accumulated surplus to ex-
penses10.0 7.4 8.4 10.0 0.0
III. Strategic Management 10.0 9.1 9.3 10.0 6.7
• Use of mission statement & goal setting 10.0 9.3 10.0 10.0 8.0
• Staff involvement 10.0 8.9 10.0 10.0 4.2
IV. Board Governance 10.0 7.6 7.5 10.0 3.3
• Independence from staff 10.0 9.9 10.0 10.0 9.0
• Financial contributions 10.0 4.1 2.8 10.0 0.0
• Level of involvement 10.0 7.2 7.5 10.0 0.0
• Level of participation 10.0 8.9 9.1 10.0 0.0
• Conflict policy 10.0 7.7 7.9 10.0 0.0
V. Volunteers 6.1 5.0 5.0 7.3 2.0
• Volunteers to staff; usage 8.0 1.4 0.7 10.0 0.0
• Recruiting 10.0 8.0 6.0 10.0 0.0
• Management and development 6.7 6.9 6.7 10.0 0.0
• Donations 8.0 5.5 3.5 8.0 0.0
• Turnover 4.2 8.0 9.2 10.0 0.0
—14—
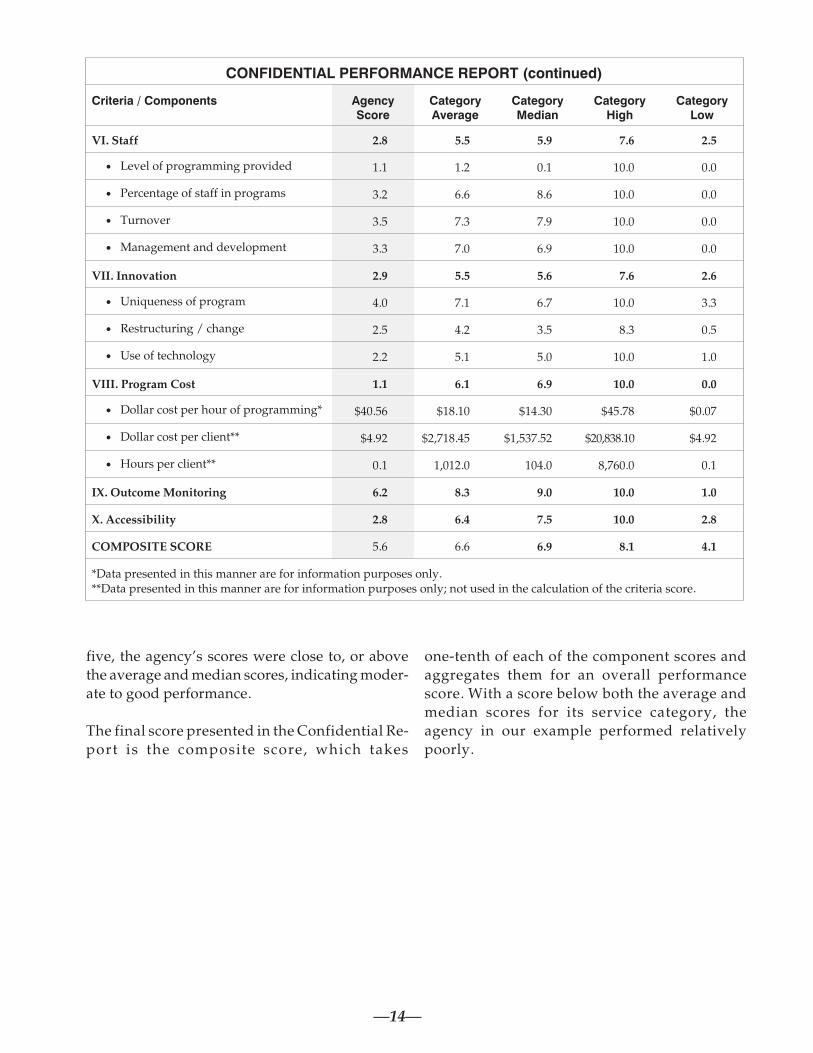
five, the agency’s scores were close to, or above
the average and median scores, indicating moder-
ate to good performance.
The final score presented in the Confidential Re-
port is the composite score, which takes
one-tenth of each of the component scores and
aggregates them for an overall performance
score. With a score below both the average and
median scores for its service category, the
agency in our example performed relatively
poorly.
CONFIDENTIAL PERFORMANCE REPORT (continued)
Criteria / Components AgencyScore
CategoryAverage
CategoryMedian
CategoryHigh
CategoryLow
VI. Staff 2.8 5.5 5.9 7.6 2.5
• Level of programming provided 1.1 1.2 0.1 10.0 0.0
• Percentage of staff in programs 3.2 6.6 8.6 10.0 0.0
• Turnover 3.5 7.3 7.9 10.0 0.0
• Management and development 3.3 7.0 6.9 10.0 0.0
VII. Innovation 2.9 5.5 5.6 7.6 2.6
• Uniqueness of program 4.0 7.1 6.7 10.0 3.3
• Restructuring / change 2.5 4.2 3.5 8.3 0.5
• Use of technology 2.2 5.1 5.0 10.0 1.0
VIII. Program Cost 1.1 6.1 6.9 10.0 0.0
• Dollar cost per hour of programming* $40.56 $18.10 $14.30 $45.78 $0.07
• Dollar cost per client** $4.92 $2,718.45 $1,537.52 $20,838.10 $4.92
• Hours per client** 0.1 1,012.0 104.0 8,760.0 0.1
IX. Outcome Monitoring 6.2 8.3 9.0 10.0 1.0
X. Accessibility 2.8 6.4 7.5 10.0 2.8
COMPOSITE SCORE 5.6 6.6 6.9 8.1 4.1
*Data presented in this manner are for information purposes only.**Data presented in this manner are for information purposes only; not used in the calculation of the criteria score.

PERFORMANCE CRITERIA
Financial Management
Crisis Intervention
0
20
40
60
0 1 2 3 4 5 6 7 8 9 10
SCOREP
erc
en
to
fA
gen
cie
s
Average 6.8
Median 7.0
Provision of Basic Necessities
0
20
40
60
0 1 2 3 4 5 6 7 8 9 10
SCORE
Perc
en
to
fA
gen
cie
s
Average 6.2
Median 6.4
Services for Seniors
0
20
40
60
0 1 2 3 4 5 6 7 8 9 10
SCORE
Perc
en
to
fA
gen
cie
s
Average 6.8
Median 7.2
ALL AGENCIES
0
20
40
60
0 1 2 3 4 5 6 7 8 9 10
SCORE
Perc
en
to
fA
gen
cie
s
Average 6.2
Median 6.4
Child Care
0
20
40
60
0 1 2 3 4 5 6 7 8 9 10
SCORE
Perc
en
to
fA
gen
cie
s
Average 5.1
Median 5.4
Counselling
0
20
40
60
0 1 2 3 4 5 6 7 8 9 10
SCORE
Perc
en
to
fA
gen
cie
s
Average 6.0
Median 6.3
Prevention & Treatment of Substance Abuse
0
20
40
60
0 1 2 3 4 5 6 7 8 9 10
SCORE
Perc
en
to
fA
gen
cie
s
Average 6.4
Median 6.6
Services for People with Disabilities
0
20
40
60
0 1 2 3 4 5 6 7 8 9 10
SCORE
Perc
en
to
fA
gen
cie
s
Average 6.3
Median 6.5
Traditional Education
0
20
40
60
0 1 2 3 4 5 6 7 8 9 10
SCORE
Perc
en
to
fA
gen
cie
s
Average 6.8
Median 7.2
Alternative Education
0
20
40
60
0 1 2 3 4 5 6 7 8 9 10
SCORE
Perc
en
to
fA
gen
cie
s
Average 6.4
Median 6.6
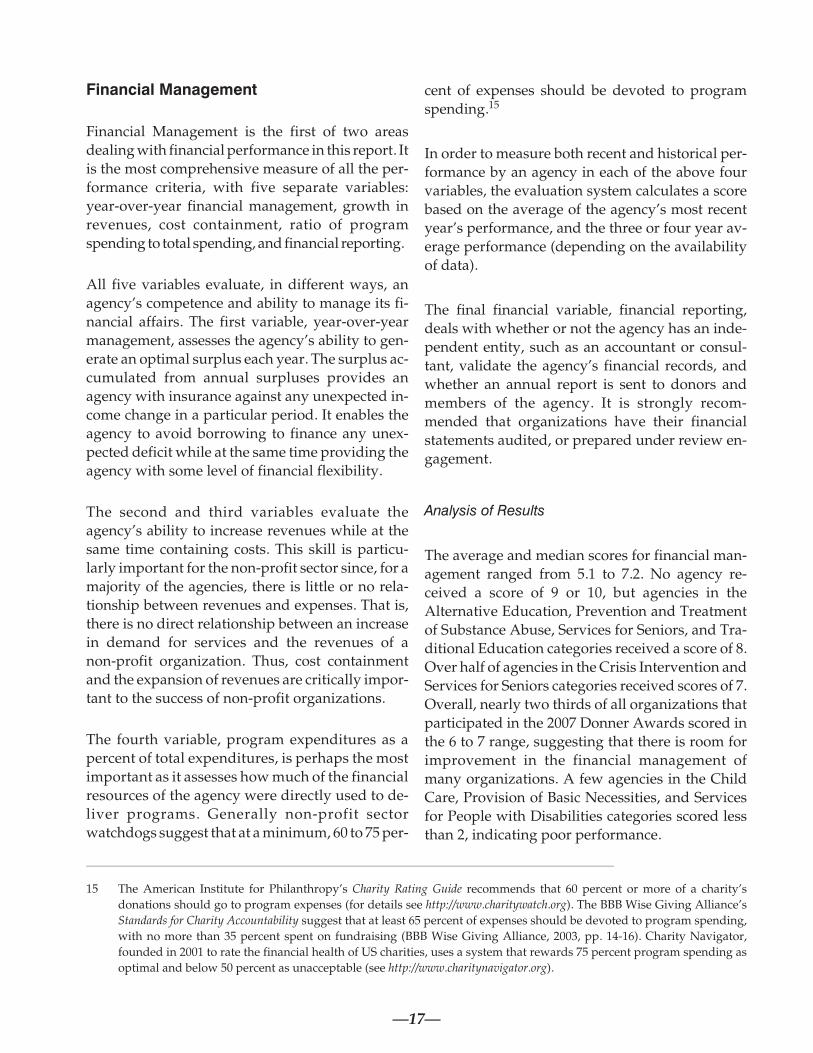
Financial Management
Financial Management is the first of two areas
dealing with financial performance in this report. It
is the most comprehensive measure of all the per-
formance criteria, with five separate variables:
year-over-year financial management, growth in
revenues, cost containment, ratio of program
spending to total spending, and financial reporting.
All five variables evaluate, in different ways, an
agency’s competence and ability to manage its fi-
nancial affairs. The first variable, year-over-year
management, assesses the agency’s ability to gen-
erate an optimal surplus each year. The surplus ac-
cumulated from annual surpluses provides an
agency with insurance against any unexpected in-
come change in a particular period. It enables the
agency to avoid borrowing to finance any unex-
pected deficit while at the same time providing the
agency with some level of financial flexibility.
The second and third variables evaluate the
agency’s ability to increase revenues while at the
same time containing costs. This skill is particu-
larly important for the non-profit sector since, for a
majority of the agencies, there is little or no rela-
tionship between revenues and expenses. That is,
there is no direct relationship between an increase
in demand for services and the revenues of a
non-profit organization. Thus, cost containment
and the expansion of revenues are critically impor-
tant to the success of non-profit organizations.
The fourth variable, program expenditures as a
percent of total expenditures, is perhaps the most
important as it assesses how much of the financial
resources of the agency were directly used to de-
liver programs. Generally non-profit sector
watchdogs suggest that at a minimum, 60 to 75 per-
cent of expenses should be devoted to program
spending.15
In order to measure both recent and historical per-
formance by an agency in each of the above four
variables, the evaluation system calculates a score
based on the average of the agency’s most recent
year’s performance, and the three or four year av-
erage performance (depending on the availability
of data).
The final financial variable, financial reporting,
deals with whether or not the agency has an inde-
pendent entity, such as an accountant or consul-
tant, validate the agency’s financial records, and
whether an annual report is sent to donors and
members of the agency. It is strongly recom-
mended that organizations have their financial
statements audited, or prepared under review en-
gagement.
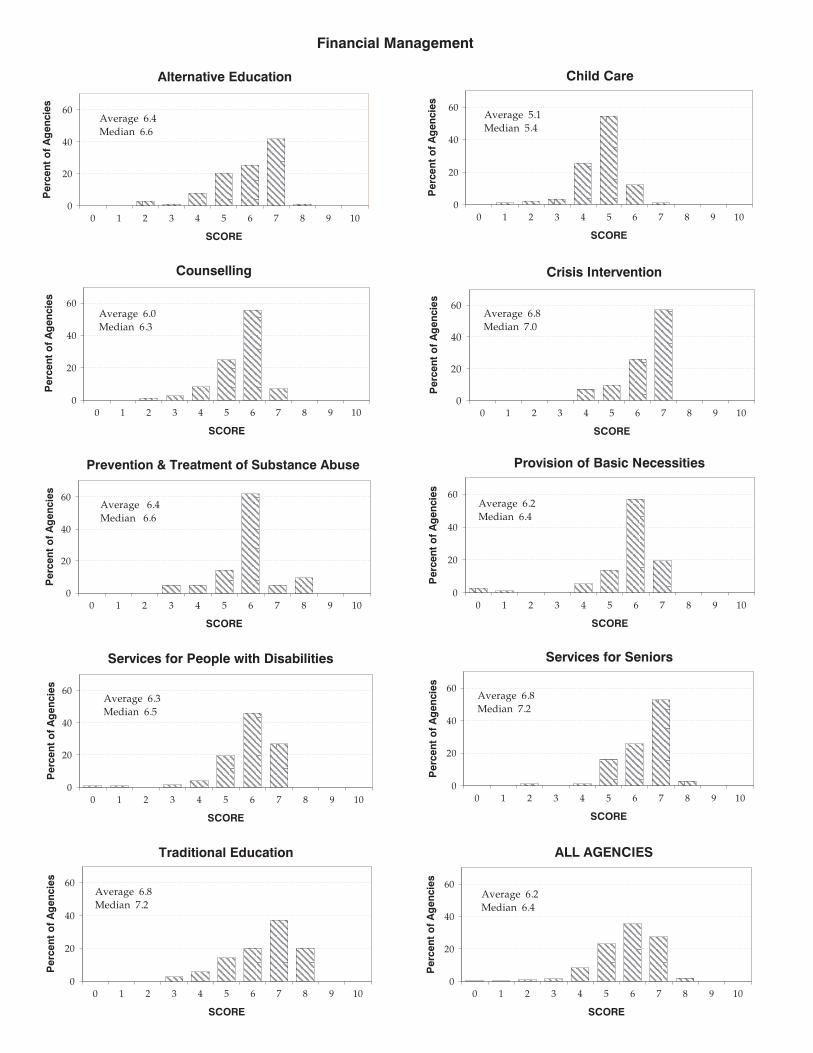
Analysis of Results
The average and median scores for financial man-
agement ranged from 5.1 to 7.2. No agency re-
ceived a score of 9 or 10, but agencies in the
Alternative Education, Prevention and Treatment
of Substance Abuse, Services for Seniors, and Tra-
ditional Education categories received a score of 8.
Over half of agencies in the Crisis Intervention and
Services for Seniors categories received scores of 7.
Overall, nearly two thirds of all organizations that
participated in the 2007 Donner Awards scored in
the 6 to 7 range, suggesting that there is room for
improvement in the financial management of
many organizations. A few agencies in the Child
Care, Provision of Basic Necessities, and Services
for People with Disabilities categories scored less
than 2, indicating poor performance.
—17—
15 The American Institute for Philanthropy’s Charity Rating Guide recommends that 60 percent or more of a charity’s
donations should go to program expenses (for details see http://www.charitywatch.org). The BBB Wise Giving Alliance’s
Standards for Charity Accountability suggest that at least 65 percent of expenses should be devoted to program spending,
with no more than 35 percent spent on fundraising (BBB Wise Giving Alliance, 2003, pp. 14-16). Charity Navigator,
founded in 2001 to rate the financial health of US charities, uses a system that rewards 75 percent program spending as
optimal and below 50 percent as unacceptable (see http://www.charitynavigator.org).
Income Independence
Crisis Intervention
0
10
20
30
40
0 1 2 3 4 5 6 7 8 9 10
SCOREP
erc
en
to
fA
gen
cie
s
Average 6.9
Median 7.4
Provision of Basic Necessities
0
10
20
30
40
0 1 2 3 4 5 6 7 8 9 10
SCORE
Perc
en
to
fA
gen
cie
s
Average 7.2
Median 7.5
Services for Seniors
0
10
20
30
40
0 1 2 3 4 5 6 7 8 9 10
SCORE
Perc
en
to
fA
gen
cie
s
Average 7.4
Median 7.6
ALL AGENCIES
0
10
20
30
40
0 1 2 3 4 5 6 7 8 9 10
SCORE
Perc
en
to
fA
gen
cie
s
Average 7.0
Median 7.3
Child Care
0
10
20
30
40
0 1 2 3 4 5 6 7 8 9 10
SCORE
Perc
en
to
fA
gen
cie
s
Average 7.2
Median 7.4
Counselling
0
10
20
30
40
0 1 2 3 4 5 6 7 8 9 10
SCORE
Perc
en
to
fA
gen
cie
s
Average 6.7
Median 7.0
Prevention & Treatment of Substance Abuse
0
10
20
30
40
0 1 2 3 4 5 6 7 8 9 10
SCORE
Perc
en
to
fA
gen
cie
s
Average 6.7
Median 7.2
Services for People with Disabilities
0
10
20
30
40
0 1 2 3 4 5 6 7 8 9 10
SCORE
Perc
en
to
fA
gen
cie
s
Average 6.5
Median 6.6
Traditional Education
0
10
20
30
40
0 1 2 3 4 5 6 7 8 9 10
SCORE
Perc
en
to
fA
gen
cie
s
Average 7.1
Median 7.1
Alternative Education
0
10
20
30
40
0 1 2 3 4 5 6 7 8 9 10
SCORE
Perc
en
to
fA
gen
cie
s
Average 7.5
Median 7.6
Income Independence
Income Independence is the second of two mea-
surements dealing with finances. Income Inde-
pendence assesses the level of diversification in an
organization’s revenues. Diversification insulates
agencies against unexpected changes in income
sources, and increases the stability of the organiza-
tion’s revenues.
For instance, assume two agencies both have reve-
nues of $1.0 million. The first agency has a well-di-
versified pool of income so that the largest
contributor accounts for less than 5 percent of total
revenue. The second agency’s revenues are much
less diversified; the largest income source accounts
for 25 percent of revenues. If the largest donor for
both agencies decides that it no longer wants to fund
non-profit agencies, the first agency’s revenues will
be affected much less than the second agency’s,
which will decline by one-quarter.
Income Independence also indirectly indicates
how independent an organization is from its fund-
ing sources. For instance, the first agency in the ex-
ample would be more able to resist influence from
its major funding sources than the second, due to
the larger dependence of the second agency on one
particular donor.
Four measures were used to assess performance:
the number of revenue sources adjusted for the size
of the agency, the percentage of total revenue ac-
counted for by the agency’s largest donor, the ex-
tent of government versus private funding, and the
size of the accumulated surplus.
The number of revenue sources is important. This
measure does not weight contributors according to
the amount donated. Agencies with a large pool of
small donors would perform substantially better
than agencies with a small pool of large donors.
The second variable accounts for concentration
within the pool of revenues. It measures, to a greater
degree, an agency’s real diversification level. For in-
stance, an agency might have a large pool of small
donors but still be overly reliant on one particular
donor if that donor accounts for a large percentage
of the agency’s revenues.
The third variable illustrates the level of voluntary
contributions received by the organization. Over the
last two decades, government funding has been one of
the least stable sources of funding for non-profits.
Over-reliance on government funding may, therefore,
affect the long-termstabilityofanagency’s funding. In
addition, a large body of research suggests that gov-
ernment funding may actually “crowd out” private
giving, with private donations decreasing as gov-
ernment involvement increases.16
The final variable, the size of the accumulated sur-
plus compared to expenses, measures an agency’s
ability to weather difficult financial periods. The
optimal size of the accumulated surplus is equal to
one year’s annual expenses, permitting agencies to
provide a year of service without any revenues.
Surpluses below this amount, or deficits, place in-
creased pressure on the agency and create instabil-
ity in the planning process. Alternatively,
surpluses larger than this may introduce an ele-
ment of insulation wherein the agency does not
have to respond to financial signals quickly.
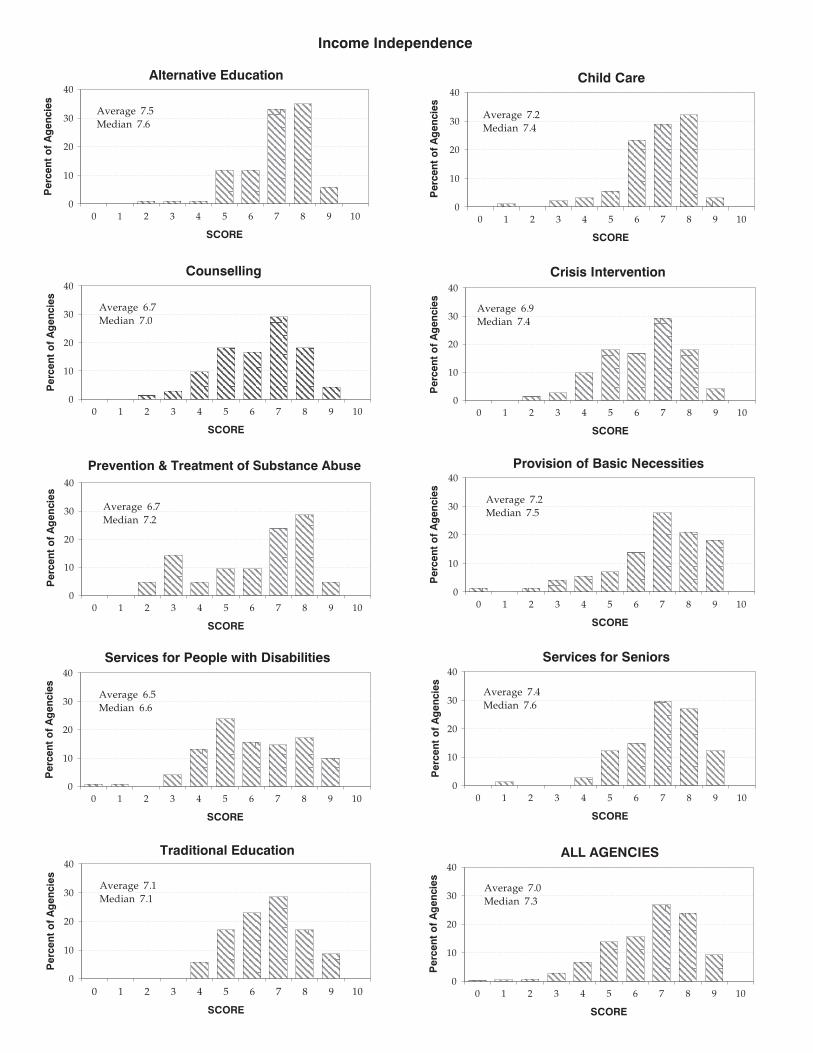
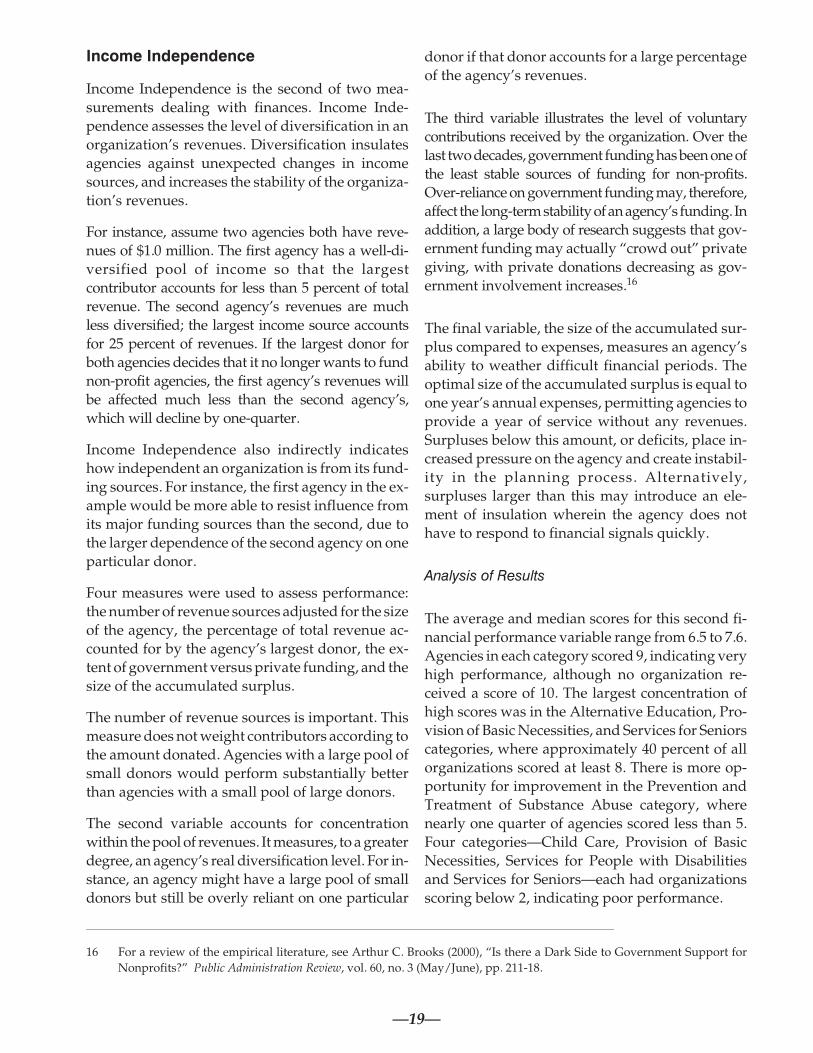
Analysis of Results
The average and median scores for this second fi-
nancial performance variable range from 6.5 to 7.6.
Agencies in each category scored 9, indicating very
high performance, although no organization re-
ceived a score of 10. The largest concentration of
high scores was in the Alternative Education, Pro-
vision of Basic Necessities, and Services for Seniors
categories, where approximately 40 percent of all
organizations scored at least 8. There is more op-
portunity for improvement in the Prevention and
Treatment of Substance Abuse category, where
nearly one quarter of agencies scored less than 5.
Four categories—Child Care, Provision of Basic
Necessities, Services for People with Disabilities
and Services for Seniors—each had organizations
scoring below 2, indicating poor performance.
—19—
16 For a review of the empirical literature, see Arthur C. Brooks (2000), “Is there a Dark Side to Government Support for
Nonprofits?” Public Administration Review, vol. 60, no. 3 (May/June), pp. 211-18.
Strategic Management
Crisis Intervention
0
10
20
30
40
0 1 2 3 4 5 6 7 8 9 10
SCOREP
erc
en
to
fA
gen
cie
s
Average 8.7
Median 9.0
Provision of Basic Necessities
0
10
20
30
40
0 1 2 3 4 5 6 7 8 9 10
SCORE
Perc
en
to
fA
gen
cie
s
Average 8.8
Median 9.5
Services for Seniors
0
10
20
30
40
0 1 2 3 4 5 6 7 8 9 10
SCORE
Perc
en
to
fA
gen
cie
s
Average 8.8
Median 9.6
ALL AGENCIES
0
10
20
30
40
0 1 2 3 4 5 6 7 8 9 10
SCORE
Perc
en
to
fA
gen
cie
s
Average 8.5
Median 9.0
Child Care
0
10
20
30
40
0 1 2 3 4 5 6 7 8 9 10
SCORE
Perc
en
to
fA
gen
cie
s
Average 8.0
Median 8.2
Counselling
0
10
20
30
40
0 1 2 3 4 5 6 7 8 9 10
SCORE
Perc
en
to
fA
gen
cie
s
Average 8.8
Median 9.3
Prevention & Treatment of Substance Abuse
0
10
20
30
40
0 1 2 3 4 5 6 7 8 9 10
SCORE
Perc
en
to
fA
gen
cie
s
Average 8.8
Median 9.1
Services for People with Disabilities
0
10
20
30
40
0 1 2 3 4 5 6 7 8 9 10
SCORE
Perc
en
to
fA
gen
cie
s
Average 8.2
Median 8.6
Traditional Education
0
10
20
30
40
0 1 2 3 4 5 6 7 8 9 10
SCORE
Perc
en
to
fA
gen
cie
s
Average 8.2
Median 8.5
Alternative Education
0
10
20
30
40
0 1 2 3 4 5 6 7 8 9 10
SCORE
Perc
en
to
fA
gen
cie
s
Average 8.5
Median 9.0
Strategic Management
Strategic Management is a multi-staged, multi-fac-
eted process of goal setting and resource alloca-
tion. It is a process by which resources, both
tangible (personnel, monies, physical assets, etc.)
and intangible (motivation, effort, etc.) are directed
towards a common goal or objective.
The first stage in this process is to articulate a mis-
sion, or vision statement. The mission essentially
defines why an organization exists, and the ulti-
mate objective that it wants to achieve. For in-
stance, an adult literacy program may have as its
mission to completely eliminate adult illiteracy in
its city. It is a far-reaching mission but one that
clearly articulates the specific objective toward
which the organization constantly aspires. It is cru-
cial for an organization to have a clear definition
and an understanding of the problem or need that
is being addressed, as well as the client group for
whom services are being provided.
The second step, derived from the mission state-
ment, is to form organizational goals. Organiza-
tions need to establish a link between the intent of
the mission statement and their agency’s specific
goals. This step in the strategic management pro-
cess essentially quantifies the mission statement.
For instance, in our example, the literacy pro-
gram’s ultimate mission is to eliminate adult illiter-
acy in its city, but its immediate goal for this year
may be to successfully introduce a new program,
or increase the literacy rate by ten percent.
The next step is to form program-specific objec-
tives. A particular program’s objectives must be
conducive to, and support, the goals of the organi-
zation and its mission statement. Using our exam-
ple, program-specific objectives might take the
form of increasing the number of participants in a
specific program, or decreasing the dropout rate in
another program.
Finally, the staff and volunteers must agree on spe-
cific goals to support the program goals, the orga-
nizational objectives, and the mission statement.
All the goals and objectives must cohesively exist
within a broad framework of the mission and vi-
sion of the organization. Specifically, the goals for
staff and volunteers must reinforce the objectives
of the program, which in turn must be part of the
agency’s overall objectives, which themselves
must support the organization’s mission. The mul-
tiple goal-setting framework of the strategic man-
agement process enables the efforts of staff and
volunteers as well as the resources of an organiza-
tion to be directed toward a common objective.
The questions in the survey assessing strategic
management focus on the extent of involvement
and active participation by staff and volunteers in
the strategic management process.
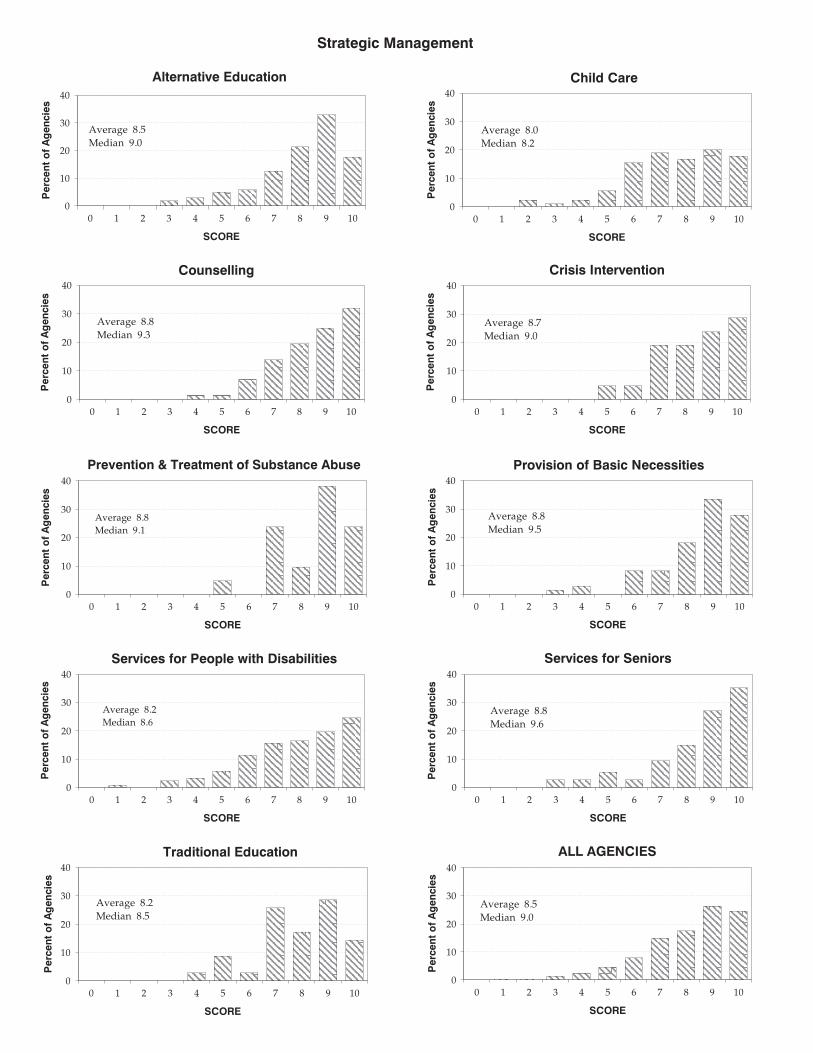
Analysis of Results
In 2007, Strategic Management was an area of rela-
tively high performance. Average and median
scores ranged between 8.0 and 9.6. Every category
had a significant number of agencies scoring a per-
fect 10, with over half of all agencies scoring at least
9. Nevertheless, agencies in every category except
Crisis Intervention and the Prevention and Treat-
ment of Substance Abuse scored less than 5, indi-
cating room for improvement. Agencies in the
Child Care and Services for People with Disabil-
ities scored less then 3, but the overall results across
all categories of service delivery are encouraging.
—21—
Board Governance
Crisis Intervention
0
10
20
30
40
0 1 2 3 4 5 6 7 8 9 10
SCOREP
erc
en
to
fA
gen
cie
s
Average 8.2
Median 8.3
Services for Seniors
0
10
20
30
40
0 1 2 3 4 5 6 7 8 9 10
SCORE
Perc
en
to
fA
gen
cie
s
Average 7.9
Median 7.8
ALL AGENCIES
0
10
20
30
40
0 1 2 3 4 5 6 7 8 9 10
SCORE
Perc
en
to
fA
gen
cie
s
Average 8.1
Median 8.2
Child Care
0
10
20
30
40
0 1 2 3 4 5 6 7 8 9 10
SCORE
Perc
en
to
fA
gen
cie
s
Average 8.1
Median 8.1
Counselling
0
10
20
30
40
0 1 2 3 4 5 6 7 8 9 10
SCORE
Perc
en
to
fA
gen
cie
s
Average 8.2
Median 8.1
Prevention & Treatment of Substance Abuse
0
10
20
30
40
0 1 2 3 4 5 6 7 8 9 10
SCORE
Perc
en
to
fA
gen
cie
s
Average 8.3
Median 8.5
Services for People with Disabilities
0
10
20
30
40
0 1 2 3 4 5 6 7 8 9 10
SCORE
Perc
en
to
fA
gen
cie
s
Average 8.2
Median 8.4
Traditional Education
0
10
20
30
40
0 1 2 3 4 5 6 7 8 9 10
SCORE
Perc
en
to
fA
gen
cie
s
Average 7.5
Median 7.5
Alternative Education
0
10
20
30
40
0 1 2 3 4 5 6 7 8 9 10
SCORE
Perc
en
to
fA
gen
cie
s
Average 8.3
Median 8.7
Provision of Basic Necessities
0
10
20
30
40
0 1 2 3 4 5 6 7 8 9 10
SCORE
Perc
en
to
fA
gen
cie
s
Average 8.1
Median 8.5
Board Governance
The Board of Directors is the critical link between
the donors and members of a non-profit organiza-
tion and its staff and managers. One of the key re-
sponsibilities of the Board of Directors is to ensure
that the management, and ultimately the organiza-
tion’s executive director, is operating the agency
prudently and responsibly and in a manner consis-
tent with the agency’s stated goals and objectives.
Another important role for the Board of Directors
is to have contact with the community. The execu-
tive director, despite being the most visible spokes-
person for the agency, has a limited capacity to
establish community connections. The Board of Di-
rectors, simply by virtue of sheer numbers, has a
much greater capacity to establish such ties.
This report assesses five areas of Board Gover-
nance: independence, contributions, involvement,
participation, and conflict policy. These areas of as-
sessment represent a foundation upon which to as-
sess the independence, accountability, and
effectiveness of board governance.
The first area (the number of paid staff on the
board) and the final area (conflict of interest policy
guidelines) were adapted from standards devel-
oped for charities by the National Charities Infor-
mation Bureau (NCIB) and the Council for Better
Business Bureau Foundation’s Philanthropic Ad-
visory Service in the United States. In 2001, these
two organizations merged to form the BBB Wise
Giving Alliance. While including all of them would
be prohibitive, their Standards for Charity Account-
ability dealing with the independence of the board
have been adopted for the evaluations appearing
in this report.17 The Wise Giving Alliance stan-
dards suggest that a maximum of one paid staff
member (or 10 percent, whichever is greater), nor-
mally the executive director, be a voting member of
the board. This paid staff member should not hold
the duties of the chair or the treasurer in order to
ensure a certain minimum level of accountability
and independence. The NCIB’s conflict policy sug-
gests the board review all business or policy deci-
sions without the presence of those staff or board
members who may benefit, directly or indirectly,
from the decision in question.18
The second question, the percentage of board
members who are financial contributors, deals
with the concept of board members as supporters
of the agency. The Board of Directors should be one
of the greatest sources of revenue development for
an agency, both directly through donations, and in-
directly through the development of new funding
sources, the introduction of new supporters, and in-
creasing the community profile of the agency.
The third and fourth questions attempt to discover
the Board of Directors’ activity level. There is a fine
line between an active and interested Board of Di-
rectors and one that is overly intrusive in the affairs
of the organization. For this report the regularity
and attendance at meetings has been adopted as an
acceptable proxy of a board that is interested and
fulfilling its custodial duties as trustees, yet not
overtly intrusive in the day-to-day management of
the agency.
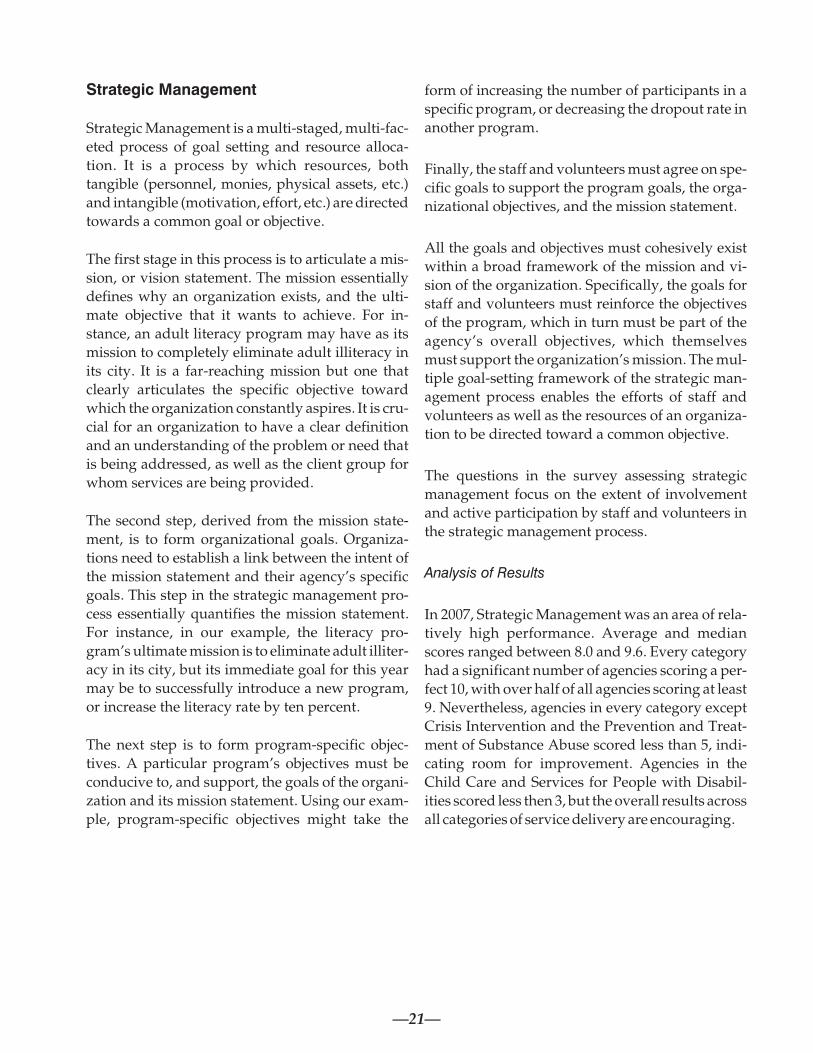
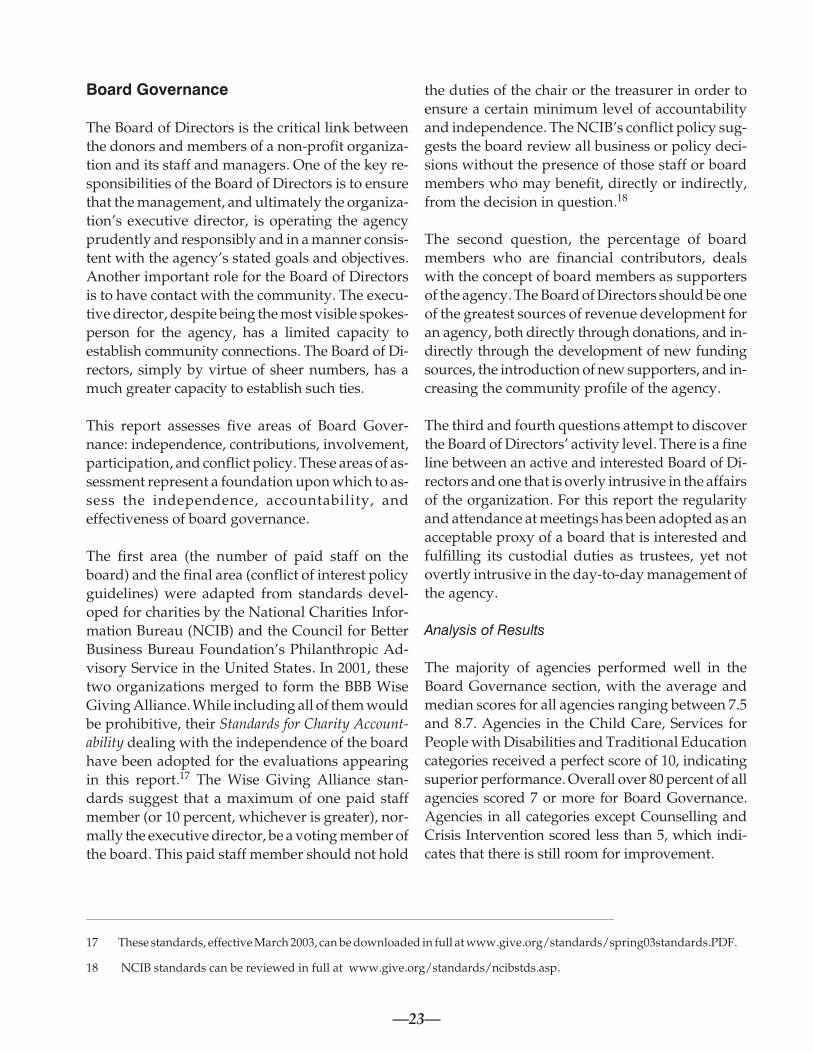
Analysis of Results
The majority of agencies performed well in the
Board Governance section, with the average and
median scores for all agencies ranging between 7.5
and 8.7. Agencies in the Child Care, Services for
People with Disabilities and Traditional Education
categories received a perfect score of 10, indicating
superior performance. Overall over 80 percent of all
agencies scored 7 or more for Board Governance.
Agencies in all categories except Counselling and
Crisis Intervention scored less than 5, which indi-
cates that there is still room for improvement.
—23—
17 These standards, effective March 2003, can be downloaded in full at www.give.org/standards/spring03standards.PDF.
18 NCIB standards can be reviewed in full at www.give.org/standards/ncibstds.asp.
Crisis Intervention
0
10
20
30
40
0 1 2 3 4 5 6 7 8 9 10
SCOREP
erc
en
to
fA
gen
cie
s
Average 5.0
Median 5.5
Provision of Basic Necessities
0
10
20
30
40
0 1 2 3 4 5 6 7 8 9 10
SCORE
Perc
en
to
fA
gen
cie
s
Average 5.4
Median 5.7
Services for Seniors
0
10
20
30
40
0 1 2 3 4 5 6 7 8 9 10
SCORE
Perc
en
to
fA
gen
cie
s
Average 5.5
Median 5.7
ALL AGENCIES
0
10
20
30
40
0 1 2 3 4 5 6 7 8 9 10
SCORE
Perc
en
to
fA
gen
cie
s
Average 5.2
Median 5.4
Child Care
0
10
20
30
40
0 1 2 3 4 5 6 7 8 9 10
SCORE
Perc
en
to
fA
gen
cie
s
Average 4.9
Median 5.0
Counselling
0
10
20
30
40
0 1 2 3 4 5 6 7 8 9 10
SCORE
Perc
en
to
fA
gen
cie
s
Average 5.1
Median 5.5
Prevention & Treatment of Substance Abuse
0
10
20
30
40
0 1 2 3 4 5 6 7 8 9 10
SCORE
Perc
en
to
fA
gen
cie
s
Average 5.1
Median 5.6
Services for People with Disabilities
0
10
20
30
40
0 1 2 3 4 5 6 7 8 9 10
SCORE
Perc
en
to
fA
gen
cie
s
Average 5.1
Median 5.3
Traditional Education
0
10
20
30
40
0 1 2 3 4 5 6 7 8 9 10
SCORE
Perc
en
to
fA
gen
cie
s
Average 4.6
Median 4.5
Alternative Education
0
10
20
30
40
0 1 2 3 4 5 6 7 8 9 10
SCORE
Perc
en
to
fA
gen
cie
s
Average 5.4
Median 5.6
Volunteers
Volunteers
The use of volunteers is the first of two criteriadealing with the effectiveness and use of person-nel, both paid and volunteer. Volunteerism is oneof the critical areas for the long-term success ofnon-profit organizations, and is one of the definingcharacteristics of the non-profit sector. Volunteersprovide unpaid staffing, and in some agencies pro-vide the frontline contact and services to clients; inaddition, studies confirm that there is a greater ten-dency for people who donate time to organizationsto make donations of money and goods.19 There-fore, volunteers are an important source of re-sources, including unpaid services and donationsof both money and in-kind gifts. Along with staff,the volunteers of non-profit organizations form thefoundation of the organization and ultimately de-termine its long-term success.
Five measures were used to assess the use of volun-teers: ratio of volunteer hours to staff hours, re-cruiting activities, management and developmentof volunteer resources, donations (other thantime), and turnover.
The first variable indicates the extent of an organi-zation’s use of volunteers relative to staff. It doesnot differentiate among volunteers on the basis offunction. In other words, volunteers involved inprogram delivery are counted equally with thosewho perform administrative tasks, or serve on theboard, or on a committee. Those agencies that oper-ate solely with volunteers receive their category’shigh score equivalent because agencies operatingwith no paid staff epitomize voluntary action.
The second variable in this section measures the ex-tent to which the agency attempts to recruit indi-viduals, particularly past clients, for volunteeractivities. Past clients who come to the agency asvolunteers are already familiar with the agencyand its mission, as well as first-hand experiencewith the problem or the need the agency is dedi-cated to addressing.
The third variable deals with the management and
development of volunteers. It includes questions
such as whether volunteers are screened, assessed
for job allocation, trained, and evaluated for perfor-
mance. This section determines whether an agency
attempts to place individuals in positions that use
their particular skills, and develops the skills of
their volunteers through a training program.
The fourth variable assesses whether agencies maxi-
mize the charitable contributions of their volunteers
by assessing what percentage of an agency’s volun-
teers donate gifts in addition to their time.
The final variable, volunteer turnover, assesses
what percentage of an agency’s volunteers remain
active. Constantly recruiting and training new vol-
unteers can be costly and time consuming for an
agency. A high rate of volunteer retention ensures
that agency resources can be concentrated on ser-
vice or expansion, rather than simply replacement.
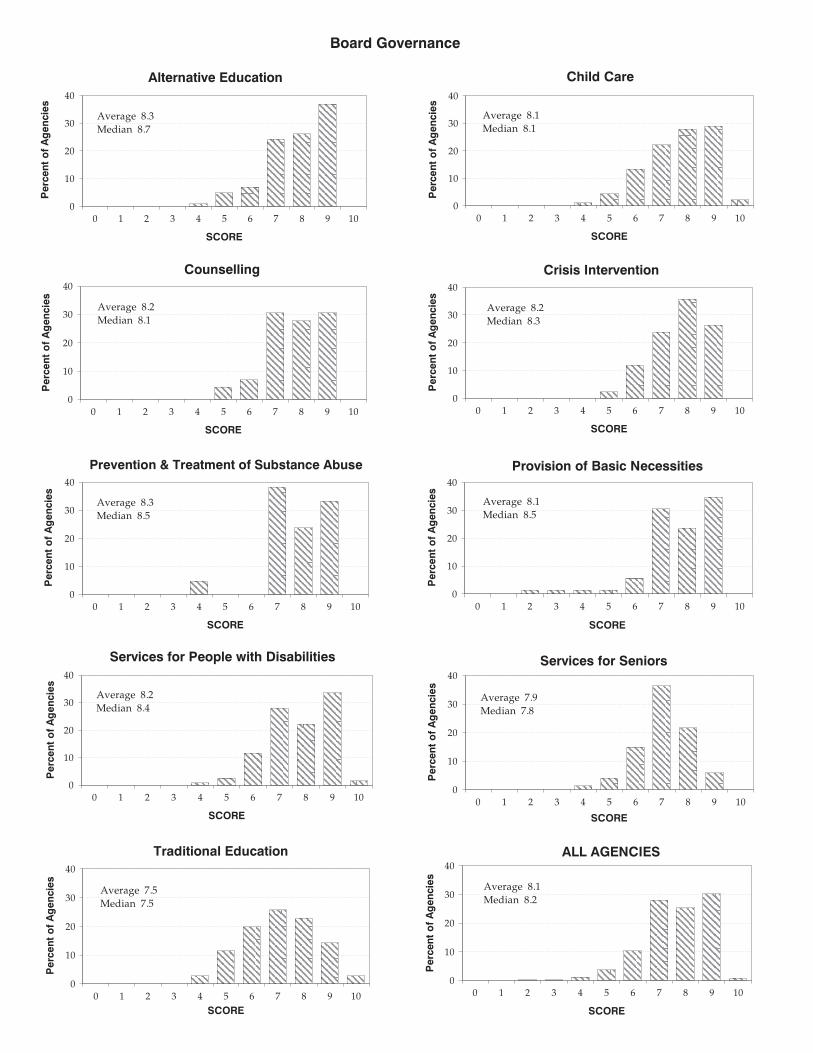
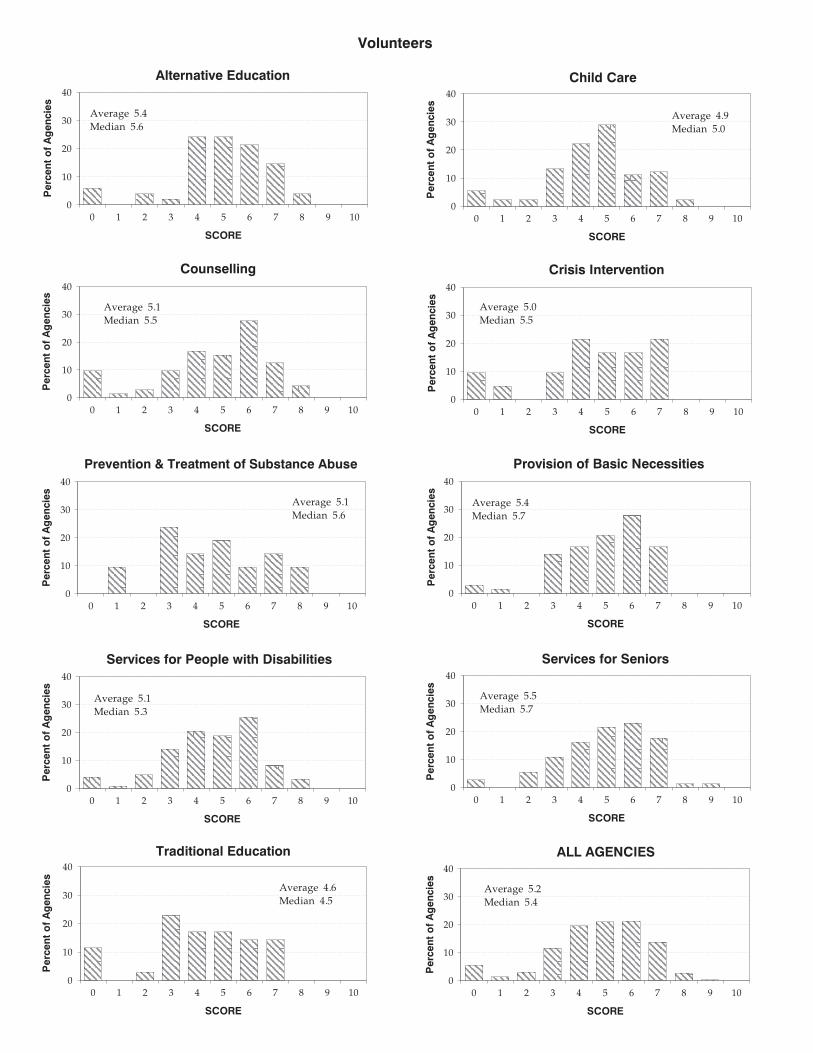
Analysis of Results
Of the ten performance criteria evaluated for the
Donner Awards, scores were lowest for volunteer
usage and management, the first variable assessing
personnel effectiveness and use. The average and
median scores for all service categories ranged
from 4.5 to 5.7. All service categories displayed rel-
atively low scores. While agencies in every cate-
gory except for Crisis Intervention, Provision of
Basic Necessities, and Traditional Education did
receive scores of 8, only one agency in the Services
for Seniors category scored a 9. Over 40 percent of
all organizations scored below 5, which indicates
that there is room for improvement. Every cate-
gory included agencies with scores below 2, indi-
cating poor performance. Since the use of
volunteers is one of the defining aspects of the vol-
untary sector, agencies should strive for improve-
ment in this vital area.
—25—
19 See Statistics Canada (2001), Caring Canadians, Involved Canadians: Highlights From the 2000 National Survey on Giving,
Volunteering and Participating, cat. no. 71-542-XIE (Ottawa, ON: Minister of Industry); The National Commission on
Philanthropy and Civic Renewal (1997), Giving Better, Giving Smarter (available on the Internet at http://pcr.hudson.org/
index.cfm?fuseaction=book_giving); and A. Picard (1997), A Call to Alms: The New Face of Charities in Canada (Toronto: The
Atkinson Charitable Foundation).
Staff
Crisis Intervention
0
20
40
60
0 1 2 3 4 5 6 7 8 9 10
SCOREP
erc
en
to
fA
gen
cie
s Average 6.4
Median 6.7
Provision of Basic Necessities
0
20
40
60
0 1 2 3 4 5 6 7 8 9 10
SCORE
Perc
en
to
fA
gen
cie
s
Average 6.4
Median 6.6
Services for Seniors
0
20
40
60
0 1 2 3 4 5 6 7 8 9 10
SCORE
Perc
en
to
fA
gen
cie
s Average 4.8
Median 5.1
ALL AGENCIES
0
20
40
60
0 1 2 3 4 5 6 7 8 9 10
SCORE
Perc
en
to
fA
gen
cie
s Average 6.1
Median 6.3
Child Care
0
20
40
60
0 1 2 3 4 5 6 7 8 9 10
SCORE
Perc
en
to
fA
gen
cie
s Average 6.4
Median 6.5
Counselling
0
20
40
60
0 1 2 3 4 5 6 7 8 9 10
SCORE
Perc
en
to
fA
gen
cie
s Average 6.4
Median 6.6
Prevention & Treatment of Substance Abuse
0
20
40
60
0 1 2 3 4 5 6 7 8 9 10
SCORE
Perc
en
to
fA
gen
cie
s Average 6.7
Median 7.0
Services for People with Disabilities
0
20
40
60
0 1 2 3 4 5 6 7 8 9 10
SCORE
Perc
en
to
fA
gen
cie
s Average 6.0
Median 6.2
Traditional Education
0
20
40
60
0 1 2 3 4 5 6 7 8 9 10
SCORE
Perc
en
to
fA
gen
cie
s Average 6.1
Median 6.1
Alternative Education
0
20
40
60
0 1 2 3 4 5 6 7 8 9 10
SCORE
Perc
en
to
fA
gen
cie
s Average 6.1
Median 6.3
—27—
Staff
Staff is the second variable assessing personnel ef-
fectiveness. One of the greatest strengths of any or-
ganization is its staff. Staff provide the front line
contact and services to clients, as well as the sup-
port and managerial services that enable the pro-
gram staff and volunteers to achieve their goals.
The Volunteers and Staff variables both deal with
the human resources of agencies—key determi-
nants to their success.
The staff performance measure focuses on four ar-
eas: the number of program hours provided per
full-time equivalent (FTE) staff member, the ratio
of program staff to total staff, turnover, and staff
management and development. Agencies that rely
solely on volunteers (i.e., no staff) are not penal-
ized, but simply receive a “not applicable” (N/A)
rating for the Staff performance area.
The first measure considers the number of pro-
gram hours provided per FTE staff member. It
measures the total amount of service provided by
the agency on a staff basis, focusing on total hours
of programming, so as to effectively eliminate any
differences arising from variation in the nature of
programs provided by different agencies. For in-
stance, a long-term, intensive program with only a
few clients may provide as much or more hours of
programming than one that focuses on
short-term, crisis intervention with a large num-
ber of clients. The measure assesses the amount,
not the nature or quality, of program hours the or-
ganization delivers.
The second measure, the ratio of program staff to
total staff, assesses the intensity of program deliv-
ery on a staff basis. It evaluates the percentage of
staff directly involved in program delivery, as op-
posed to the number of support or administrative
staff.
These first two measurements emphasize the
agency’s success in allocating the maximum
amount of staff resources directly to program pro-
vision. The third variable, staff turnover, was in-
cluded in the report at the suggestion of several
organizations after the 1998 Report was released.
Turnover is an important measure for both staff
and volunteers since it can be used as an early
warning signal for larger managerial problems.
Also, it indicates the level of return being garnered
by the agency on its staff and volunteers. Agencies
invest significant resources in training and devel-
oping staff and volunteers. The longer the duration
of stay for both, the larger the agency’s return on its
investment.
The final variable concerns staff training. An
agency that has a staff training program in place
can ensure that its employees have the skills re-
quired to perform their duties appropriately and
efficiently, and are able to stay current with new
developments in their program area.
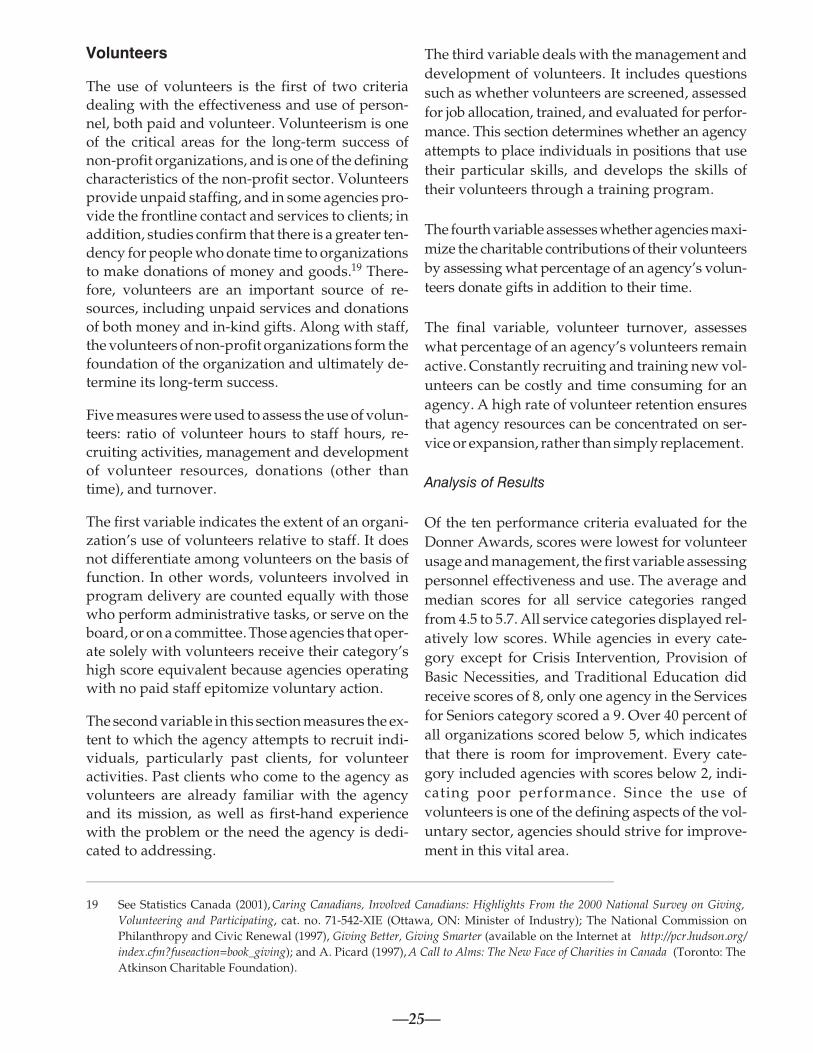
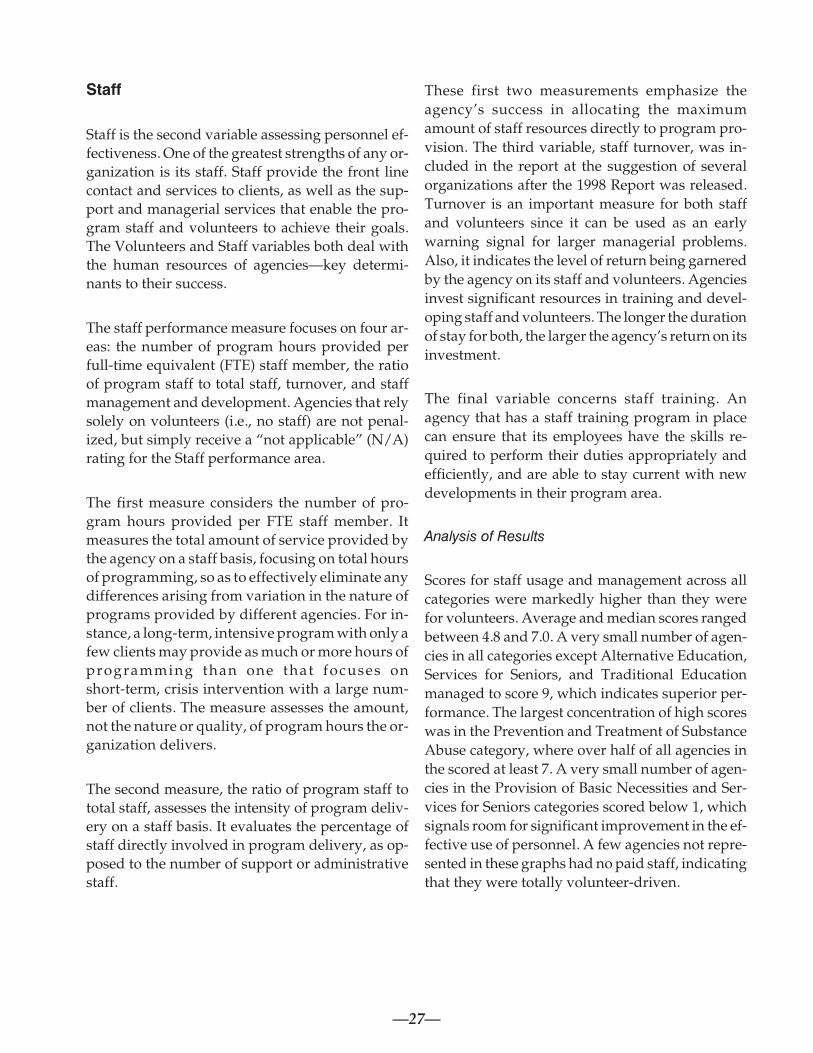
Analysis of Results
Scores for staff usage and management across all
categories were markedly higher than they were
for volunteers. Average and median scores ranged
between 4.8 and 7.0. A very small number of agen-
cies in all categories except Alternative Education,
Services for Seniors, and Traditional Education
managed to score 9, which indicates superior per-
formance. The largest concentration of high scores
was in the Prevention and Treatment of Substance
Abuse category, where over half of all agencies in
the scored at least 7. A very small number of agen-
cies in the Provision of Basic Necessities and Ser-
vices for Seniors categories scored below 1, which
signals room for significant improvement in the ef-
fective use of personnel. A few agencies not repre-
sented in these graphs had no paid staff, indicating
that they were totally volunteer-driven.
Crisis Intervention
0
10
20
30
40
0 1 2 3 4 5 6 7 8 9 10
SCOREP
erc
en
to
fA
gen
cie
s
Average 6.9
Median 7.1
Provision of Basic Necessities
0
10
20
30
40
0 1 2 3 4 5 6 7 8 9 10
SCORE
Perc
en
to
fA
gen
cie
s
Average 6.4
Median 6.4
Services for Seniors
0
10
20
30
40
0 1 2 3 4 5 6 7 8 9 10
SCORE
Perc
en
to
fA
gen
cie
s
Average 6.1
Median 6.3
ALL AGENCIES
0
10
20
30
40
0 1 2 3 4 5 6 7 8 9 10
SCORE
Perc
en
to
fA
gen
cie
s
Average 6.2
Median 6.2
Child Care
0
10
20
30
40
0 1 2 3 4 5 6 7 8 9 10
SCORE
Perc
en
to
fA
gen
cie
s
Average 5.9
Median 5.9
Counselling
0
10
20
30
40
0 1 2 3 4 5 6 7 8 9 10
SCORE
Perc
en
to
fA
gen
cie
s
Average 6.4
Median 6.3
Prevention & Treatment of Substance Abuse
0
10
20
30
40
0 1 2 3 4 5 6 7 8 9 10
SCORE
Perc
en
to
fA
gen
cie
s
Average 7.1
Median 7.3
Services for People with Disabilities
0
10
20
30
40
0 1 2 3 4 5 6 7 8 9 10
SCORE
Perc
en
to
fA
gen
cie
s
Average 6.6
Median 6.7
Traditional Education
0
10
20
30
40
0 1 2 3 4 5 6 7 8 9 10
SCORE
Perc
en
to
fA
gen
cie
s
Average 5.0
Median 5.1
Alternative Education
0
10
20
30
40
0 1 2 3 4 5 6 7 8 9 10
SCORE
Perc
en
to
fA
gen
cie
s
Average 5.6
Median 5.6
Innovation
—29—
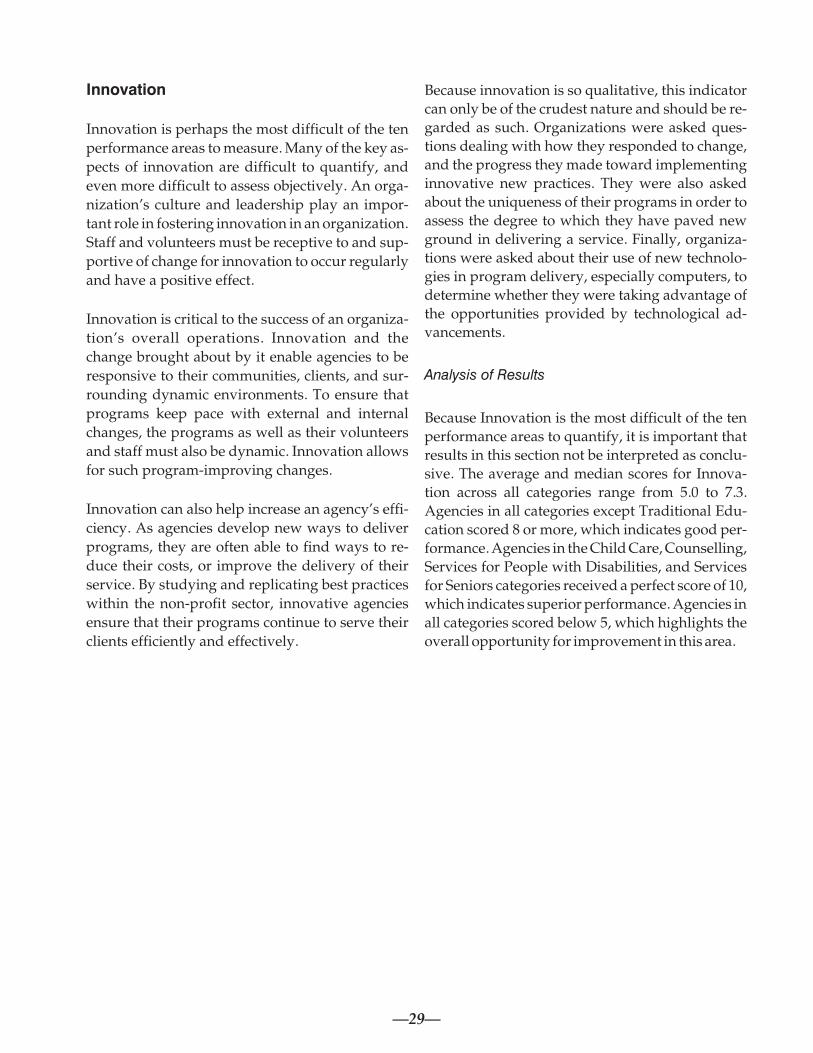
Innovation
Innovation is perhaps the most difficult of the ten
performance areas to measure. Many of the key as-
pects of innovation are difficult to quantify, and
even more difficult to assess objectively. An orga-
nization’s culture and leadership play an impor-
tant role in fostering innovation in an organization.
Staff and volunteers must be receptive to and sup-
portive of change for innovation to occur regularly
and have a positive effect.
Innovation is critical to the success of an organiza-
tion’s overall operations. Innovation and the
change brought about by it enable agencies to be
responsive to their communities, clients, and sur-
rounding dynamic environments. To ensure that
programs keep pace with external and internal
changes, the programs as well as their volunteers
and staff must also be dynamic. Innovation allows
for such program-improving changes.
Innovation can also help increase an agency’s effi-
ciency. As agencies develop new ways to deliver
programs, they are often able to find ways to re-
duce their costs, or improve the delivery of their
service. By studying and replicating best practices
within the non-profit sector, innovative agencies
ensure that their programs continue to serve their
clients efficiently and effectively.
Because innovation is so qualitative, this indicator
can only be of the crudest nature and should be re-
garded as such. Organizations were asked ques-
tions dealing with how they responded to change,
and the progress they made toward implementing
innovative new practices. They were also asked
about the uniqueness of their programs in order to
assess the degree to which they have paved new
ground in delivering a service. Finally, organiza-
tions were asked about their use of new technolo-
gies in program delivery, especially computers, to
determine whether they were taking advantage of
the opportunities provided by technological ad-
vancements.
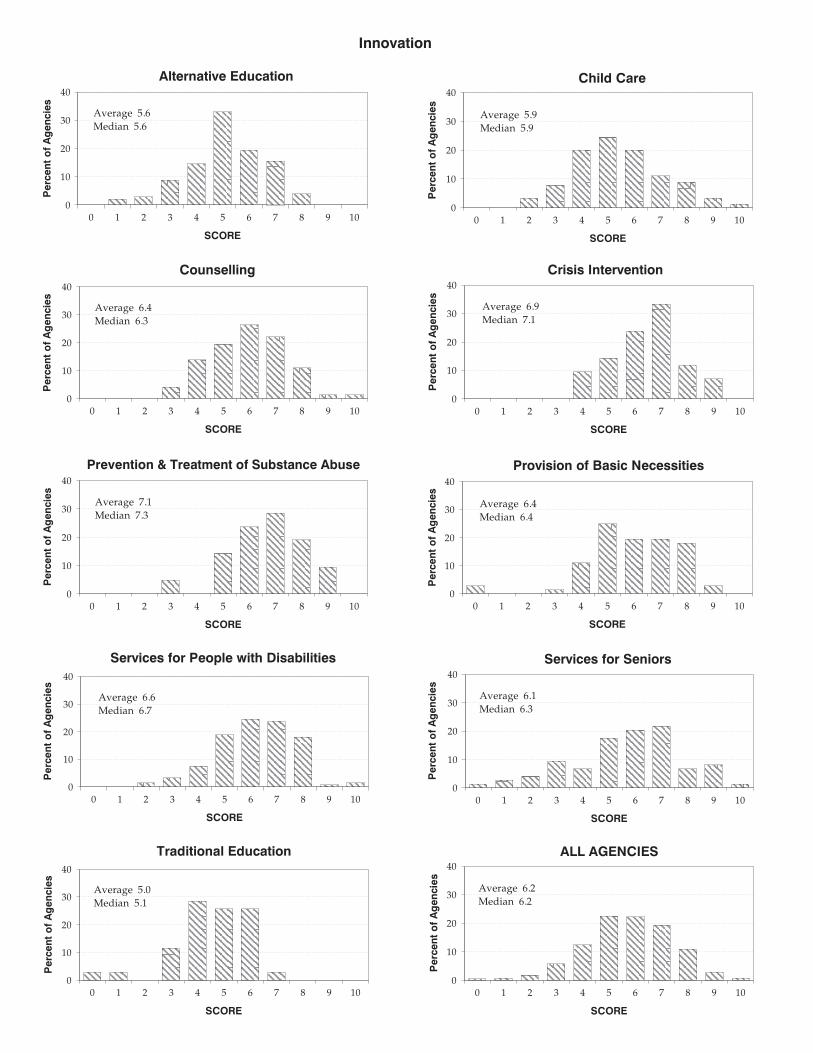
Analysis of Results
Because Innovation is the most difficult of the ten
performance areas to quantify, it is important that
results in this section not be interpreted as conclu-
sive. The average and median scores for Innova-
tion across all categories range from 5.0 to 7.3.
Agencies in all categories except Traditional Edu-
cation scored 8 or more, which indicates good per-
formance. Agencies in the Child Care, Counselling,
Services for People with Disabilities, and Services
for Seniors categories received a perfect score of 10,
which indicates superior performance. Agencies in
all categories scored below 5, which highlights the
overall opportunity for improvement in this area.
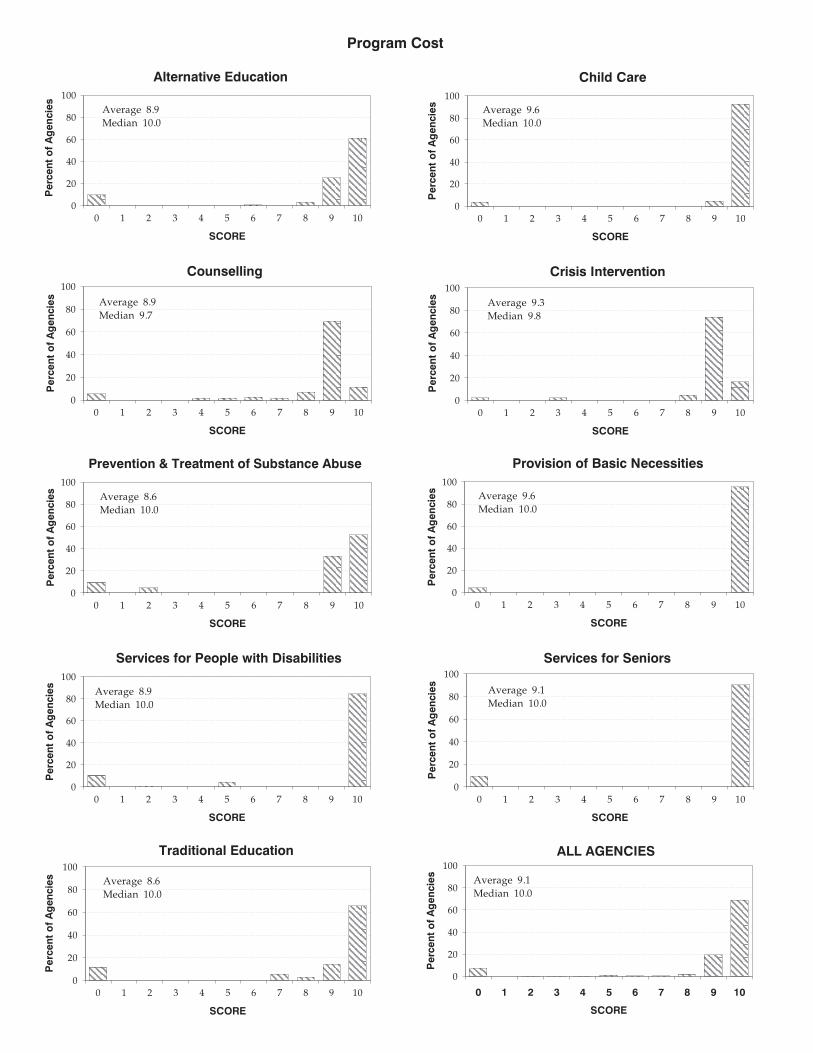
Program Cost
Crisis Intervention
0
20
40
60
80
100
0 1 2 3 4 5 6 7 8 9 10
SCOREP
erc
en
to
fA
gen
cie
s
Average 9.3
Median 9.8
Provision of Basic Necessities
0
20
40
60
80
100
0 1 2 3 4 5 6 7 8 9 10
SCORE
Perc
en
to
fA
gen
cie
s
Average 9.6
Median 10.0
Services for Seniors
0
20
40
60
80
100
0 1 2 3 4 5 6 7 8 9 10
SCORE
Perc
en
to
fA
gen
cie
s
Average 9.1
Median 10.0
ALL AGENCIES
0
20
40
60
80
100
0 1 2 3 4 5 6 7 8 9 10
SCORE
Perc
en
to
fA
gen
cie
s
Average 9.1
Median 10.0
Child Care
0
20
40
60
80
100
0 1 2 3 4 5 6 7 8 9 10
SCORE
Perc
en
to
fA
gen
cie
s
Average 9.6
Median 10.0
Counselling
0
20
40
60
80
100
0 1 2 3 4 5 6 7 8 9 10
SCORE
Perc
en
to
fA
gen
cie
s
Average 8.9
Median 9.7
Prevention & Treatment of Substance Abuse
0
20
40
60
80
100
0 1 2 3 4 5 6 7 8 9 10
SCORE
Perc
en
to
fA
gen
cie
s
Average 8.6
Median 10.0
Services for People with Disabilities
0
20
40
60
80
100
0 1 2 3 4 5 6 7 8 9 10
SCORE
Perc
en
to
fA
gen
cie
s
Average 8.9
Median 10.0
Traditional Education
0
20
40
60
80
100
0 1 2 3 4 5 6 7 8 9 10
SCORE
Perc
en
to
fA
gen
cie
s Average 8.6
Median 10.0
Alternative Education
0
20
40
60
80
100
0 1 2 3 4 5 6 7 8 9 10
SCORE
Perc
en
to
fA
gen
cie
s
Average 8.9
Median 10.0
Program Cost
This performance measure assesses the per-hour
cost of providing a program or service. It is impor-
tant to reiterate how the scores were calculated. As
shown in the adjacent graphs, the scores range
from 0 to 10. The lowest cost per hour received a
score of 10, while the highest cost per hour received
a score of 0. The remaining scores were standard-
ized to fall within the 0 to 10 range.
The costs included in the calculations do not in-
clude indirect administrative expenses, such as a
portion of the senior managers’ or executive direc-
tor’s salaries. They do, however, include adminis-
trative and non-program expenses such as utilities,
rent, and phone charges that are directly related to
the provision of the program. The intent of the cal-
culation is to assess the direct cost of providing a
particular program.
One of the limitations of this particular perfor-
mance measure is that it does not account for pro-
gram quality. The measure only assesses the direct
cost of providing the program. An example illus-
trates the possible limitations of this measure. If
two agencies both provide 1,000 hours of program-
ming in, say, the prevention and treatment of sub-
stance abuse, but one agency’s program costs
$100,000 while the other agency’s program costs
$500,000, then there would obviously be a substan-
tial difference in their score on this measure. The
first agency would receive a performance score ap-
proximately five times better than the second
agency. But what if the two programs were suffi-
ciently different so as to make comparison diffi-
cult? Suppose, for instance, that the latter agency’s
program was an intensive, long-term treatment
program while the former agency’s program was a
short-term, crisis intervention program. The
nature and focus of the programs in this case are
sufficiently different to make cross-comparison
tenuous.
For this reason, in 2000 the number of categories
evaluated through Donner Canadian Foundation
Awards for Excellence in the Delivery of Social Services
was expanded from seven to nine in order to en-
sure, as much as possible, that sufficiently similar
programs are compared to one another. While new
categories could make the cross-comparisons even
more precise, the current evaluations provide an
important resource for assessing the overall cost of
a program relative to other, similar programs
across the country.
In addition to the overall score for program cost,
the Confidential Reports also indicate the dollar
cost per program hour provided, the dollar cost per
client, and the number of hours of programming
provided per client. These data are presented in
this manner for information purposes only. Note
that the cost per client and the hours per client com-
ponents are not used in the calculation of perfor-
mance scores.
Analysis of Results
The area of Program Cost had the highest scores of
all performance areas, with the average and me-
dian scores for all categories ranging from 8.6 to
10.0. Almost ninety percent of all agencies scored 9
or above, which indicates that the 2007 Donner
Award applicants provide low-cost services.
While this is encouraging, every category also had
agencies that scored a 0, indicating relatively high
program costs that may be due to the type of pro-
gram delivered, or to poor performance.
—31—
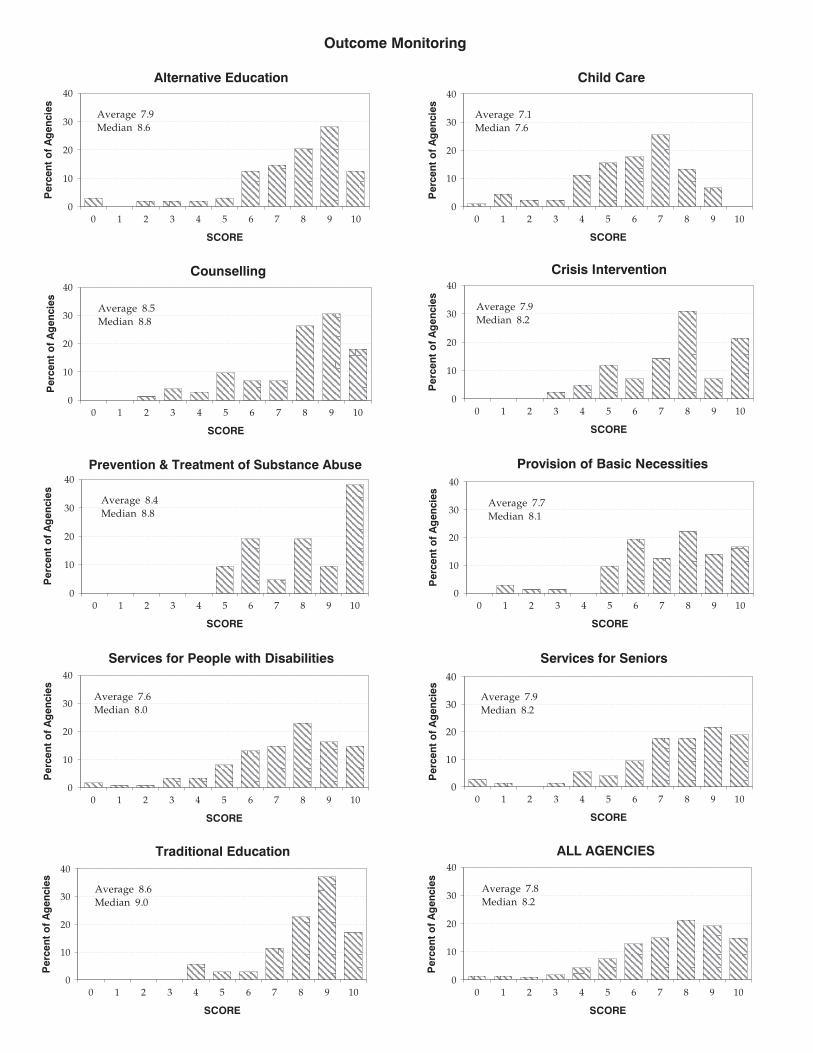
Outcome Monitoring
Crisis Intervention
0
10
20
30
40
0 1 2 3 4 5 6 7 8 9 10
SCOREP
erc
en
to
fA
gen
cie
s
Average 7.9
Median 8.2
Provision of Basic Necessities
0
10
20
30
40
0 1 2 3 4 5 6 7 8 9 10
SCORE
Perc
en
to
fA
gen
cie
s
Average 7.7
Median 8.1
Services for Seniors
0
10
20
30
40
0 1 2 3 4 5 6 7 8 9 10
SCORE
Perc
en
to
fA
gen
cie
s
Average 7.9
Median 8.2
ALL AGENCIES
0
10
20
30
40
0 1 2 3 4 5 6 7 8 9 10
SCORE
Perc
en
to
fA
gen
cie
s
Average 7.8
Median 8.2
Child Care
0
10
20
30
40
0 1 2 3 4 5 6 7 8 9 10
SCORE
Perc
en
to
fA
gen
cie
s
Average 7.1
Median 7.6
Counselling
0
10
20
30
40
0 1 2 3 4 5 6 7 8 9 10
SCORE
Perc
en
to
fA
gen
cie
s
Average 8.5
Median 8.8
Prevention & Treatment of Substance Abuse
0
10
20
30
40
0 1 2 3 4 5 6 7 8 9 10
SCORE
Perc
en
to
fA
gen
cie
s
Average 8.4
Median 8.8
Services for People with Disabilities
0
10
20
30
40
0 1 2 3 4 5 6 7 8 9 10
SCORE
Perc
en
to
fA
gen
cie
s
Average 7.6
Median 8.0
Traditional Education
0
10
20
30
40
0 1 2 3 4 5 6 7 8 9 10
SCORE
Perc
en
to
fA
gen
cie
s
Average 8.6
Median 9.0
Alternative Education
0
10
20
30
40
0 1 2 3 4 5 6 7 8 9 10
SCORE
Perc
en
to
fA
gen
cie
s
Average 7.9
Median 8.6
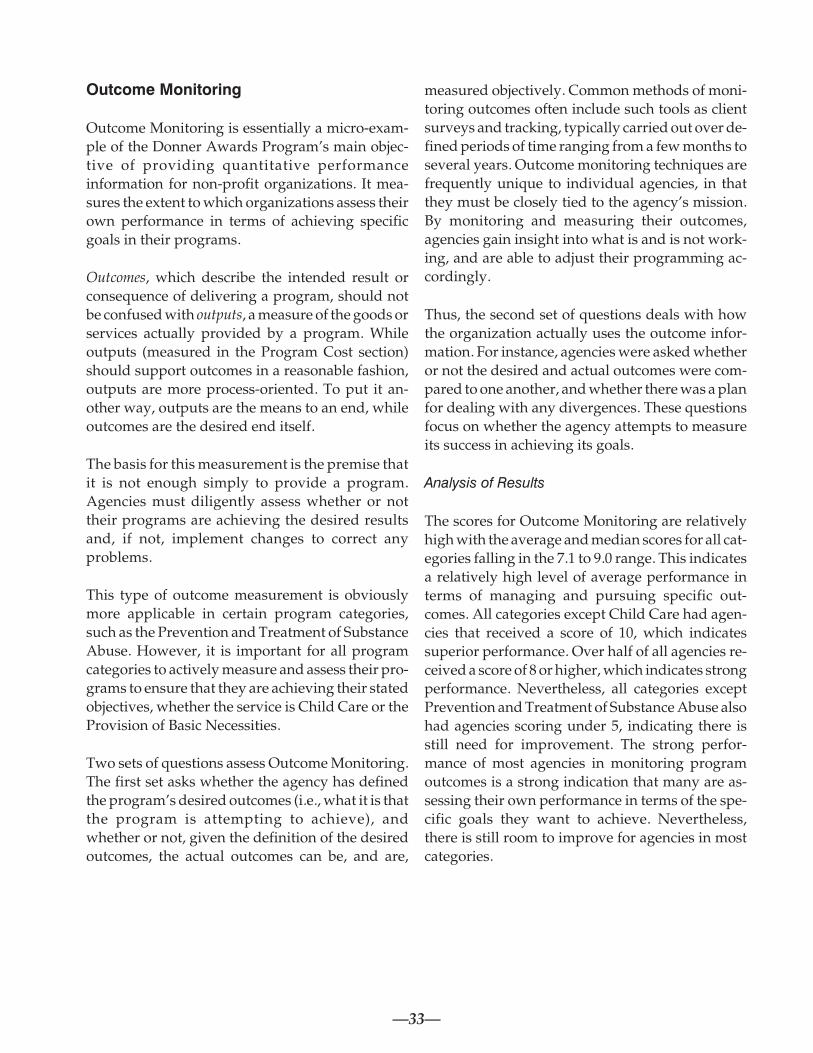
Outcome Monitoring
Outcome Monitoring is essentially a micro-exam-
ple of the Donner Awards Program’s main objec-
tive of providing quantitative performance
information for non-profit organizations. It mea-
sures the extent to which organizations assess their
own performance in terms of achieving specific
goals in their programs.
Outcomes, which describe the intended result or
consequence of delivering a program, should not
be confused with outputs, a measure of the goods or
services actually provided by a program. While
outputs (measured in the Program Cost section)
should support outcomes in a reasonable fashion,
outputs are more process-oriented. To put it an-
other way, outputs are the means to an end, while
outcomes are the desired end itself.
The basis for this measurement is the premise that
it is not enough simply to provide a program.
Agencies must diligently assess whether or not
their programs are achieving the desired results
and, if not, implement changes to correct any
problems.
This type of outcome measurement is obviously
more applicable in certain program categories,
such as the Prevention and Treatment of Substance
Abuse. However, it is important for all program
categories to actively measure and assess their pro-
grams to ensure that they are achieving their stated
objectives, whether the service is Child Care or the
Provision of Basic Necessities.
Two sets of questions assess Outcome Monitoring.
The first set asks whether the agency has defined
the program’s desired outcomes (i.e., what it is that
the program is attempting to achieve), and
whether or not, given the definition of the desired
outcomes, the actual outcomes can be, and are,
measured objectively. Common methods of moni-
toring outcomes often include such tools as client
surveys and tracking, typically carried out over de-
fined periods of time ranging from a few months to
several years. Outcome monitoring techniques are
frequently unique to individual agencies, in that
they must be closely tied to the agency’s mission.
By monitoring and measuring their outcomes,
agencies gain insight into what is and is not work-
ing, and are able to adjust their programming ac-
cordingly.
Thus, the second set of questions deals with how
the organization actually uses the outcome infor-
mation. For instance, agencies were asked whether
or not the desired and actual outcomes were com-
pared to one another, and whether there was a plan
for dealing with any divergences. These questions
focus on whether the agency attempts to measure
its success in achieving its goals.
Analysis of Results
The scores for Outcome Monitoring are relatively
high with the average and median scores for all cat-
egories falling in the 7.1 to 9.0 range. This indicates
a relatively high level of average performance in
terms of managing and pursuing specific out-
comes. All categories except Child Care had agen-
cies that received a score of 10, which indicates
superior performance. Over half of all agencies re-
ceived a score of 8 or higher, which indicates strong
performance. Nevertheless, all categories except
Prevention and Treatment of Substance Abuse also
had agencies scoring under 5, indicating there is
still need for improvement. The strong perfor-
mance of most agencies in monitoring program
outcomes is a strong indication that many are as-
sessing their own performance in terms of the spe-
cific goals they want to achieve. Nevertheless,
there is still room to improve for agencies in most
categories.
—33—
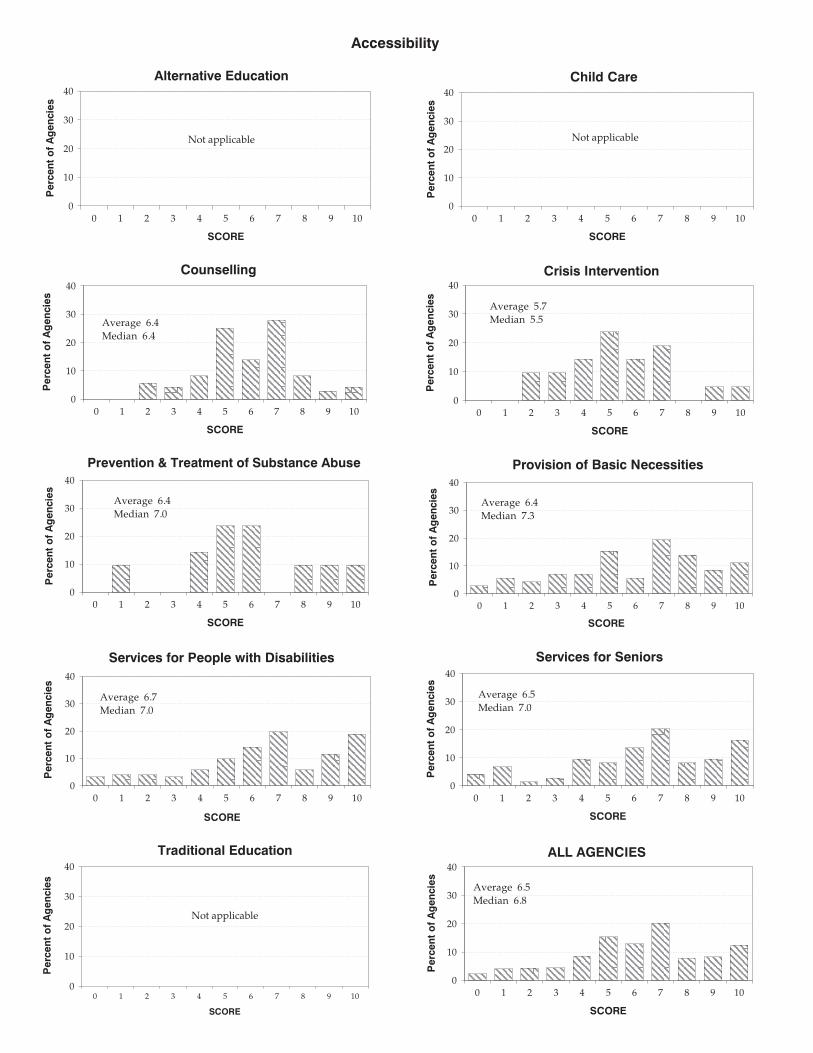
Accessibility
Crisis Intervention
0
10
20
30
40
0 1 2 3 4 5 6 7 8 9 10
SCOREP
erc
en
to
fA
gen
cie
s
Average 5.7
Median 5.5
Provision of Basic Necessities
0
10
20
30
40
0 1 2 3 4 5 6 7 8 9 10
SCORE
Perc
en
to
fA
gen
cie
s
Average 6.4
Median 7.3
Services for Seniors
0
10
20
30
40
0 1 2 3 4 5 6 7 8 9 10
SCORE
Perc
en
to
fA
gen
cie
s
Average 6.5
Median 7.0
ALL AGENCIES
0
10
20
30
40
0 1 2 3 4 5 6 7 8 9 10
SCORE
Perc
en
to
fA
gen
cie
s
Average 6.5
Median 6.8
Counselling
0
10
20
30
40
0 1 2 3 4 5 6 7 8 9 10
SCORE
Perc
en
to
fA
gen
cie
s
Average 6.4
Median 6.4
Child Care
0
10
20
30
40
0 1 2 3 4 5 6 7 8 9 10
SCORE
Perc
en
to
fA
gen
cie
s
Not applicable
Prevention & Treatment of Substance Abuse
0
10
20
30
40
0 1 2 3 4 5 6 7 8 9 10
SCORE
Perc
en
to
fA
gen
cie
s
Average 6.4
Median 7.0
Services for People with Disabilities
0
10
20
30
40
0 1 2 3 4 5 6 7 8 9 10
SCORE
Perc
en
to
fA
gen
cie
s
Average 6.7
Median 7.0
Traditional Education
0
10
20
30
40
0 1 2 3 4 5 6 7 8 9 10
SCORE
Perc
en
to
fA
gen
cie
s
Not applicable
Alternative Education
0
10
20
30
40
0 1 2 3 4 5 6 7 8 9 10
SCORE
Perc
en
to
fA
gen
cie
s
Not applicable
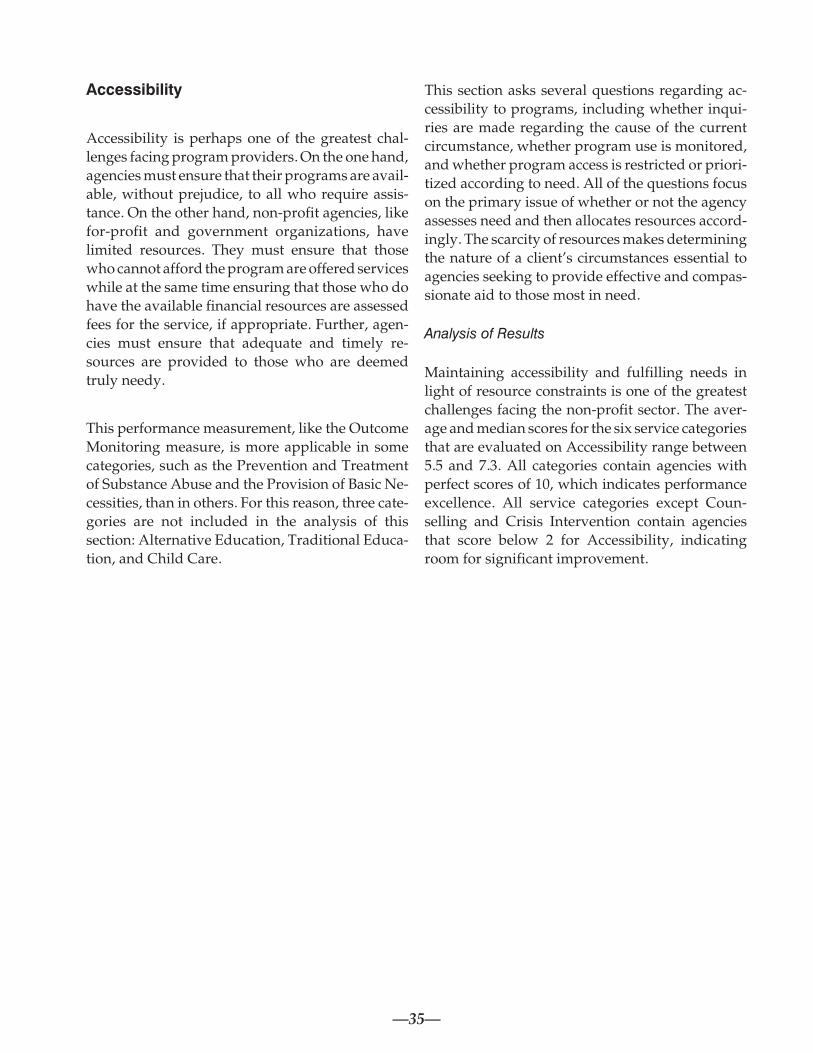
Accessibility
Accessibility is perhaps one of the greatest chal-
lenges facing program providers. On the one hand,
agencies must ensure that their programs are avail-
able, without prejudice, to all who require assis-
tance. On the other hand, non-profit agencies, like
for-profit and government organizations, have
limited resources. They must ensure that those
who cannot afford the program are offered services
while at the same time ensuring that those who do
have the available financial resources are assessed
fees for the service, if appropriate. Further, agen-
cies must ensure that adequate and timely re-
sources are provided to those who are deemed
truly needy.
This performance measurement, like the Outcome
Monitoring measure, is more applicable in some
categories, such as the Prevention and Treatment
of Substance Abuse and the Provision of Basic Ne-
cessities, than in others. For this reason, three cate-
gories are not included in the analysis of this
section: Alternative Education, Traditional Educa-
tion, and Child Care.
This section asks several questions regarding ac-
cessibility to programs, including whether inqui-
ries are made regarding the cause of the current
circumstance, whether program use is monitored,
and whether program access is restricted or priori-
tized according to need. All of the questions focus
on the primary issue of whether or not the agency
assesses need and then allocates resources accord-
ingly. The scarcity of resources makes determining
the nature of a client’s circumstances essential to
agencies seeking to provide effective and compas-
sionate aid to those most in need.
Analysis of Results
Maintaining accessibility and fulfilling needs in
light of resource constraints is one of the greatest
challenges facing the non-profit sector. The aver-
age and median scores for the six service categories
that are evaluated on Accessibility range between
5.5 and 7.3. All categories contain agencies with
perfect scores of 10, which indicates performance
excellence. All service categories except Coun-
selling and Crisis Intervention contain agencies
that score below 2 for Accessibility, indicating
room for significant improvement.
—35—
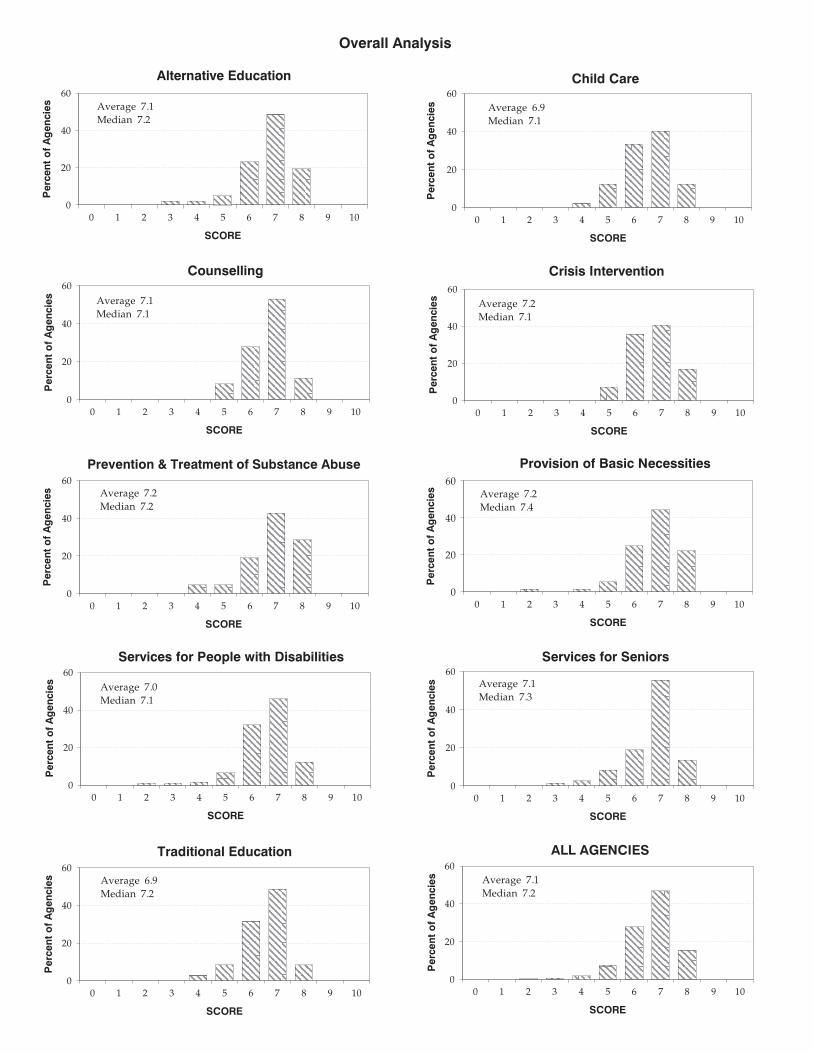
Crisis Intervention
0
20
40
60
0 1 2 3 4 5 6 7 8 9 10
SCOREP
erc
en
to
fA
gen
cie
s
Average 7.2
Median 7.1
Provision of Basic Necessities
0
20
40
60
0 1 2 3 4 5 6 7 8 9 10
SCORE
Perc
en
to
fA
gen
cie
s Average 7.2
Median 7.4
Services for Seniors
0
20
40
60
0 1 2 3 4 5 6 7 8 9 10
SCORE
Perc
en
to
fA
gen
cie
s Average 7.1
Median 7.3
ALL AGENCIES
0
20
40
60
0 1 2 3 4 5 6 7 8 9 10
SCORE
Perc
en
to
fA
gen
cie
s Average 7.1
Median 7.2
Child Care
0
20
40
60
0 1 2 3 4 5 6 7 8 9 10
SCORE
Perc
en
to
fA
gen
cie
s Average 6.9
Median 7.1
Counselling
0
20
40
60
0 1 2 3 4 5 6 7 8 9 10
SCORE
Perc
en
to
fA
gen
cie
s Average 7.1
Median 7.1
Prevention & Treatment of Substance Abuse
0
20
40
60
0 1 2 3 4 5 6 7 8 9 10
SCORE
Perc
en
to
fA
gen
cie
s Average 7.2
Median 7.2
Services for People with Disabilities
0
20
40
60
0 1 2 3 4 5 6 7 8 9 10
SCORE
Perc
en
to
fA
gen
cie
s
Average 7.0
Median 7.1
Traditional Education
0
20
40
60
0 1 2 3 4 5 6 7 8 9 10
SCORE
Perc
en
to
fA
gen
cie
s Average 6.9
Median 7.2
Alternative Education
0
20
40
60
0 1 2 3 4 5 6 7 8 9 10
SCORE
Perc
en
to
fA
gen
cie
s Average 7.1
Median 7.2
Overall Analysis
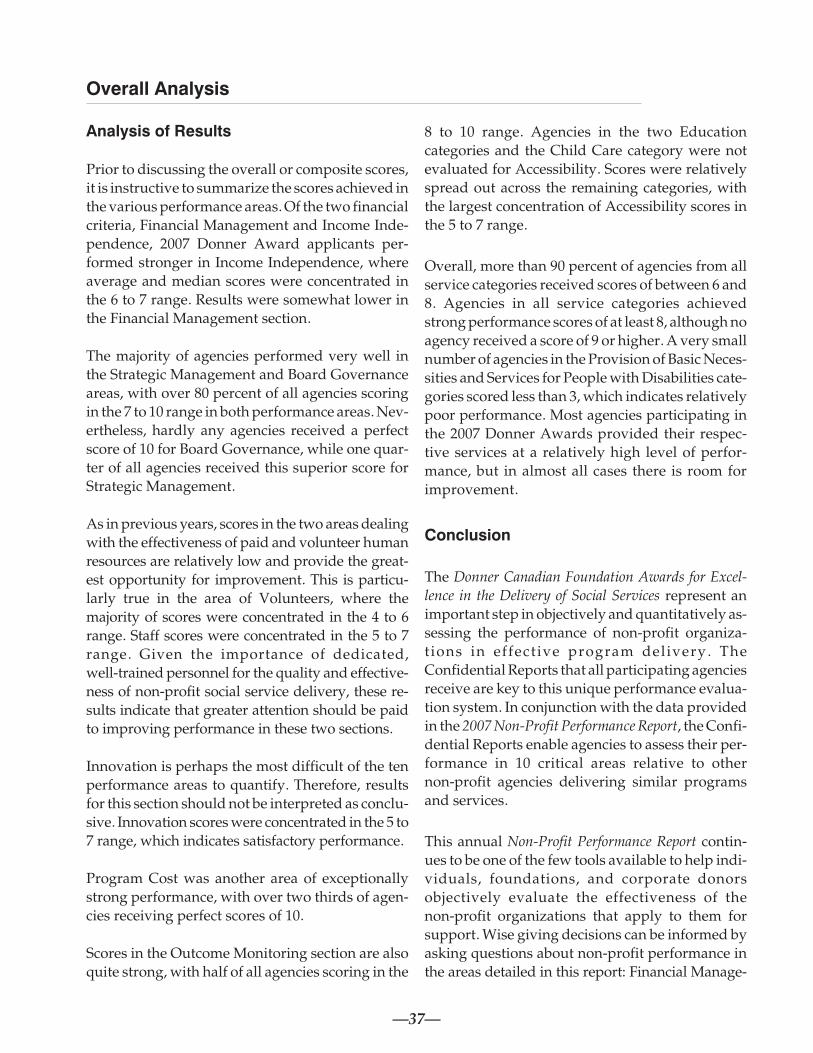
Overall Analysis
Analysis of Results
Prior to discussing the overall or composite scores,
it is instructive to summarize the scores achieved in
the various performance areas. Of the two financial
criteria, Financial Management and Income Inde-
pendence, 2007 Donner Award applicants per-
formed stronger in Income Independence, where
average and median scores were concentrated in
the 6 to 7 range. Results were somewhat lower in
the Financial Management section.
The majority of agencies performed very well in
the Strategic Management and Board Governance
areas, with over 80 percent of all agencies scoring
in the 7 to 10 range in both performance areas. Nev-
ertheless, hardly any agencies received a perfect
score of 10 for Board Governance, while one quar-
ter of all agencies received this superior score for
Strategic Management.
As in previous years, scores in the two areas dealing
with the effectiveness of paid and volunteer human
resources are relatively low and provide the great-
est opportunity for improvement. This is particu-
larly true in the area of Volunteers, where the
majority of scores were concentrated in the 4 to 6
range. Staff scores were concentrated in the 5 to 7
range. Given the importance of dedicated,
well-trained personnel for the quality and effective-
ness of non-profit social service delivery, these re-
sults indicate that greater attention should be paid
to improving performance in these two sections.
Innovation is perhaps the most difficult of the ten
performance areas to quantify. Therefore, results
for this section should not be interpreted as conclu-
sive. Innovation scores were concentrated in the 5 to
7 range, which indicates satisfactory performance.
Program Cost was another area of exceptionally
strong performance, with over two thirds of agen-
cies receiving perfect scores of 10.
Scores in the Outcome Monitoring section are also
quite strong, with half of all agencies scoring in the
8 to 10 range. Agencies in the two Education
categories and the Child Care category were not
evaluated for Accessibility. Scores were relatively
spread out across the remaining categories, with
the largest concentration of Accessibility scores in
the 5 to 7 range.
Overall, more than 90 percent of agencies from all
service categories received scores of between 6 and
8. Agencies in all service categories achieved
strong performance scores of at least 8, although no
agency received a score of 9 or higher. A very small
number of agencies in the Provision of Basic Neces-
sities and Services for People with Disabilities cate-
gories scored less than 3, which indicates relatively
poor performance. Most agencies participating in
the 2007 Donner Awards provided their respec-
tive services at a relatively high level of perfor-
mance, but in almost all cases there is room for
improvement.
Conclusion
The Donner Canadian Foundation Awards for Excel-
lence in the Delivery of Social Services represent an
important step in objectively and quantitatively as-
sessing the performance of non-profit organiza-
tions in effective program delivery. The
Confidential Reports that all participating agencies
receive are key to this unique performance evalua-
tion system. In conjunction with the data provided
in the 2007 Non-Profit Performance Report, the Confi-
dential Reports enable agencies to assess their per-
formance in 10 critical areas relative to other
non-profit agencies delivering similar programs
and services.
This annual Non-Profit Performance Report contin-
ues to be one of the few tools available to help indi-
viduals, foundations, and corporate donors
objectively evaluate the effectiveness of the
non-profit organizations that apply to them for
support. Wise giving decisions can be informed by
asking questions about non-profit performance in
the areas detailed in this report: Financial Manage-
—37—
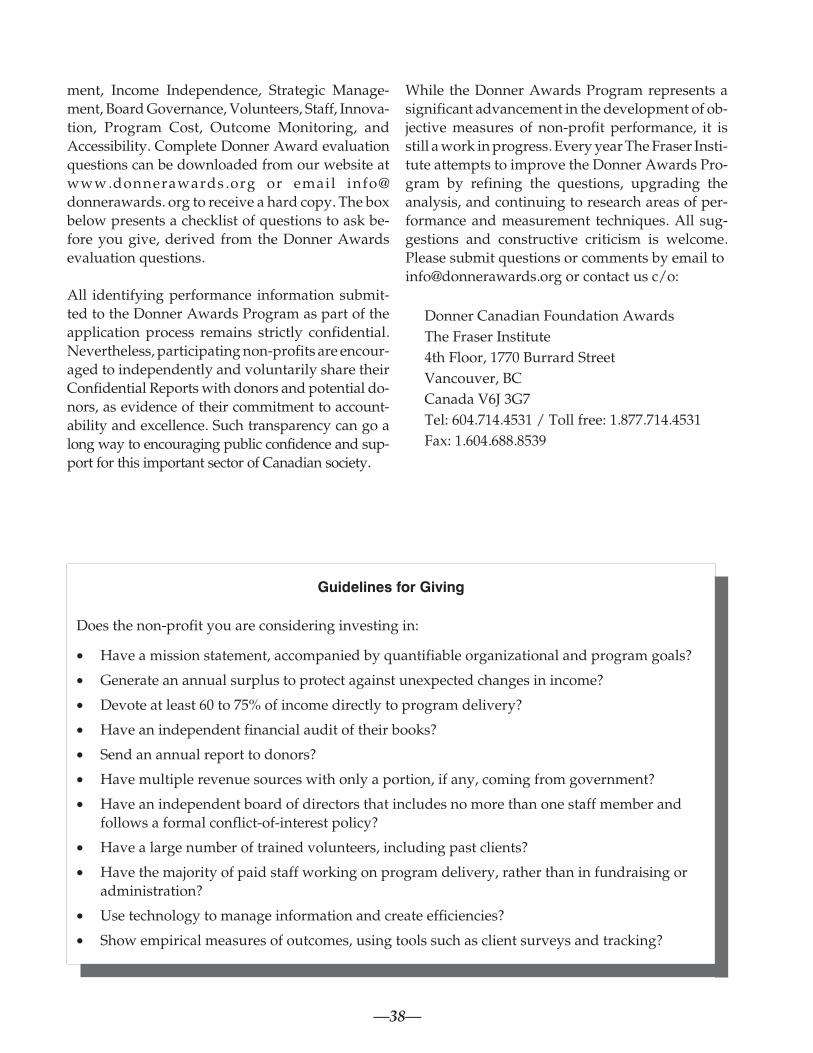
ment, Income Independence, Strategic Manage-
ment, Board Governance, Volunteers, Staff, Innova-
tion, Program Cost, Outcome Monitoring, and
Accessibility. Complete Donner Award evaluation
questions can be downloaded from our website at
www.donnerawards.org or email info@
donnerawards. org to receive a hard copy. The box
below presents a checklist of questions to ask be-
fore you give, derived from the Donner Awards
evaluation questions.
All identifying performance information submit-
ted to the Donner Awards Program as part of the
application process remains strictly confidential.
Nevertheless, participating non-profits are encour-
aged to independently and voluntarily share their
Confidential Reports with donors and potential do-
nors, as evidence of their commitment to account-
ability and excellence. Such transparency can go a
long way to encouraging public confidence and sup-
port for this important sector of Canadian society.
While the Donner Awards Program represents a
significant advancement in the development of ob-
jective measures of non-profit performance, it is
still a work in progress. Every year The Fraser Insti-
tute attempts to improve the Donner Awards Pro-
gram by refining the questions, upgrading the
analysis, and continuing to research areas of per-
formance and measurement techniques. All sug-
gestions and constructive criticism is welcome.
Please submit questions or comments by email to
[email protected] or contact us c/o:
Donner Canadian Foundation Awards
The Fraser Institute
4th Floor, 1770 Burrard Street
Vancouver, BC
Canada V6J 3G7
Tel: 604.714.4531 / Toll free: 1.877.714.4531
Fax: 1.604.688.8539
—38—
Guidelines for Giving
Does the non-profit you are considering investing in:
• Have a mission statement, accompanied by quantifiable organizational and program goals?
• Generate an annual surplus to protect against unexpected changes in income?
• Devote at least 60 to 75% of income directly to program delivery?
• Have an independent financial audit of their books?
• Send an annual report to donors?
• Have multiple revenue sources with only a portion, if any, coming from government?
• Have an independent board of directors that includes no more than one staff member and
follows a formal conflict-of-interest policy?
• Have a large number of trained volunteers, including past clients?
• Have the majority of paid staff working on program delivery, rather than in fundraising or
administration?
• Use technology to manage information and create efficiencies?
• Show empirical measures of outcomes, using tools such as client surveys and tracking?
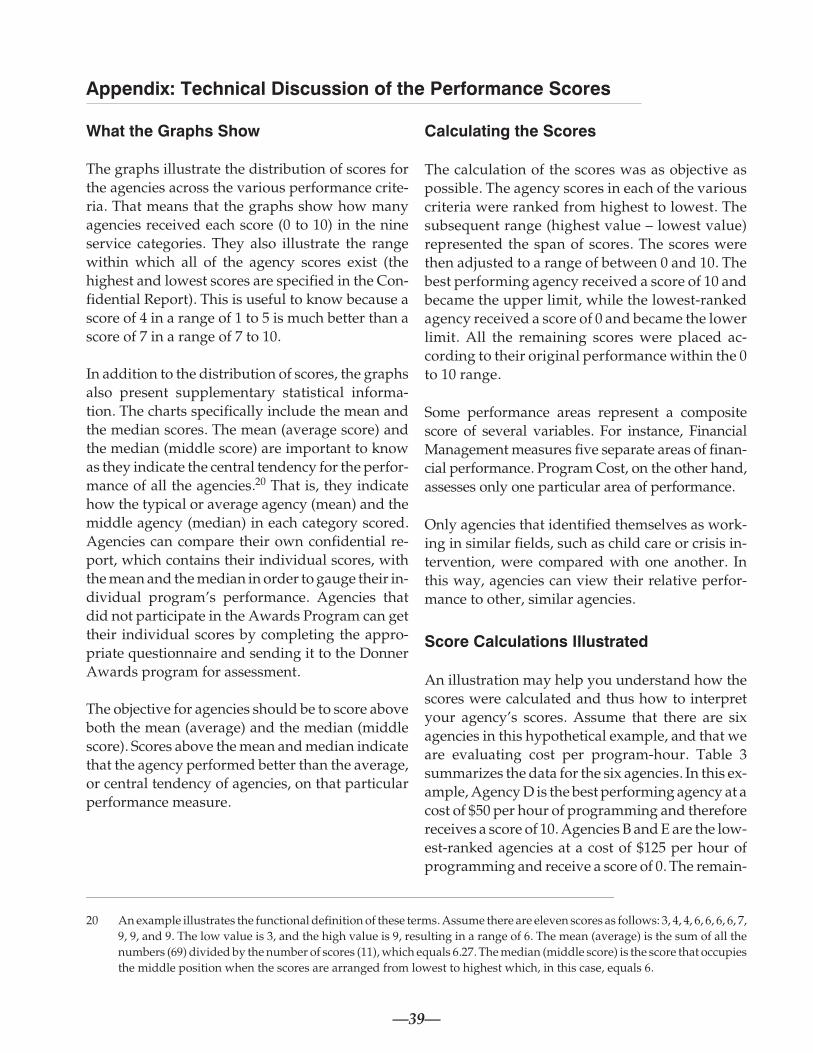
Appendix: Technical Discussion of the Performance Scores
What the Graphs Show
The graphs illustrate the distribution of scores for
the agencies across the various performance crite-
ria. That means that the graphs show how many
agencies received each score (0 to 10) in the nine
service categories. They also illustrate the range
within which all of the agency scores exist (the
highest and lowest scores are specified in the Con-
fidential Report). This is useful to know because a
score of 4 in a range of 1 to 5 is much better than a
score of 7 in a range of 7 to 10.
In addition to the distribution of scores, the graphs
also present supplementary statistical informa-
tion. The charts specifically include the mean and
the median scores. The mean (average score) and
the median (middle score) are important to know
as they indicate the central tendency for the perfor-
mance of all the agencies.20 That is, they indicate
how the typical or average agency (mean) and the
middle agency (median) in each category scored.
Agencies can compare their own confidential re-
port, which contains their individual scores, with
the mean and the median in order to gauge their in-
dividual program’s performance. Agencies that
did not participate in the Awards Program can get
their individual scores by completing the appro-
priate questionnaire and sending it to the Donner
Awards program for assessment.
The objective for agencies should be to score above
both the mean (average) and the median (middle
score). Scores above the mean and median indicate
that the agency performed better than the average,
or central tendency of agencies, on that particular
performance measure.
Calculating the Scores
The calculation of the scores was as objective as
possible. The agency scores in each of the various
criteria were ranked from highest to lowest. The
subsequent range (highest value – lowest value)
represented the span of scores. The scores were
then adjusted to a range of between 0 and 10. The
best performing agency received a score of 10 and
became the upper limit, while the lowest-ranked
agency received a score of 0 and became the lower
limit. All the remaining scores were placed ac-
cording to their original performance within the 0
to 10 range.
Some performance areas represent a composite
score of several variables. For instance, Financial
Management measures five separate areas of finan-
cial performance. Program Cost, on the other hand,
assesses only one particular area of performance.
Only agencies that identified themselves as work-
ing in similar fields, such as child care or crisis in-
tervention, were compared with one another. In
this way, agencies can view their relative perfor-
mance to other, similar agencies.
Score Calculations Illustrated
An illustration may help you understand how the
scores were calculated and thus how to interpret
your agency’s scores. Assume that there are six
agencies in this hypothetical example, and that we
are evaluating cost per program-hour. Table 3
summarizes the data for the six agencies. In this ex-
ample, Agency D is the best performing agency at a
cost of $50 per hour of programming and therefore
receives a score of 10. Agencies B and E are the low-
est-ranked agencies at a cost of $125 per hour of
programming and receive a score of 0. The remain-
—39—
20 An example illustrates the functional definition of these terms. Assume there are eleven scores as follows: 3, 4, 4, 6, 6, 6, 6, 7,
9, 9, and 9. The low value is 3, and the high value is 9, resulting in a range of 6. The mean (average) is the sum of all the
numbers (69) divided by the number of scores (11), which equals 6.27. The median (middle score) is the score that occupies
the middle position when the scores are arranged from lowest to highest which, in this case, equals 6.
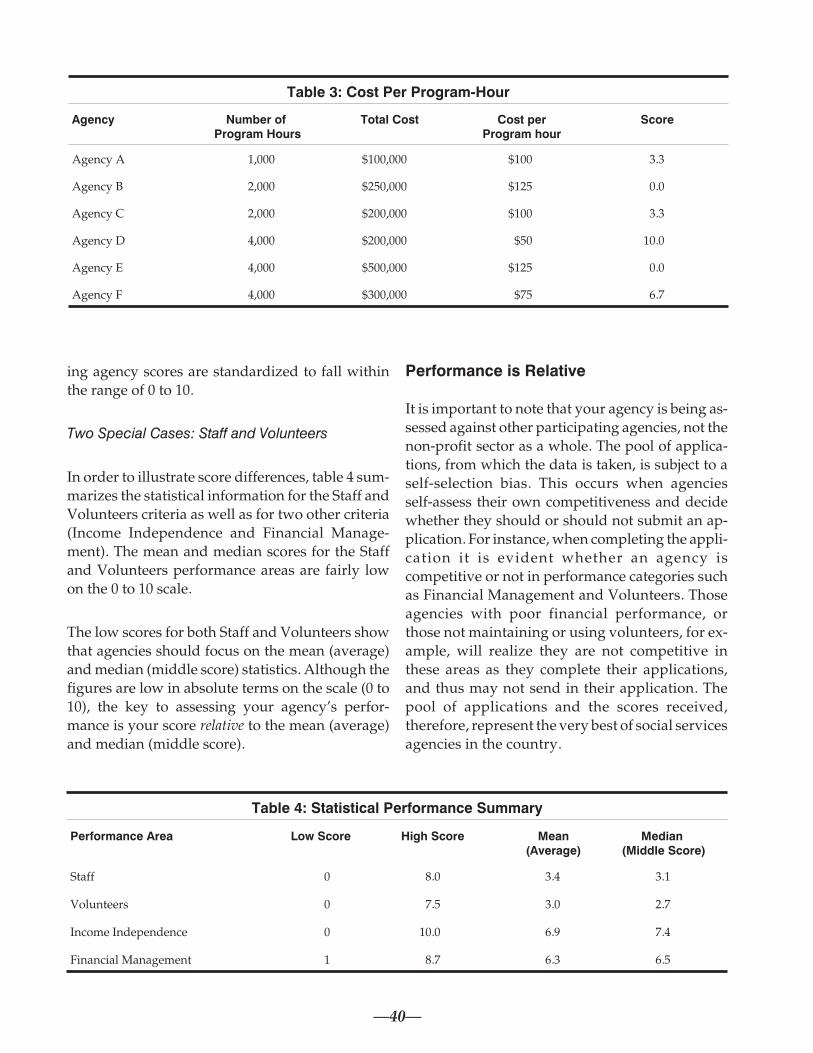
ing agency scores are standardized to fall within
the range of 0 to 10.
Two Special Cases: Staff and Volunteers
In order to illustrate score differences, table 4 sum-
marizes the statistical information for the Staff and
Volunteers criteria as well as for two other criteria
(Income Independence and Financial Manage-
ment). The mean and median scores for the Staff
and Volunteers performance areas are fairly low
on the 0 to 10 scale.
The low scores for both Staff and Volunteers show
that agencies should focus on the mean (average)
and median (middle score) statistics. Although the
figures are low in absolute terms on the scale (0 to
10), the key to assessing your agency’s perfor-
mance is your score relative to the mean (average)
and median (middle score).
Performance is Relative
It is important to note that your agency is being as-
sessed against other participating agencies, not the
non-profit sector as a whole. The pool of applica-
tions, from which the data is taken, is subject to a
self-selection bias. This occurs when agencies
self-assess their own competitiveness and decide
whether they should or should not submit an ap-
plication. For instance, when completing the appli-
cation it is evident whether an agency is
competitive or not in performance categories such
as Financial Management and Volunteers. Those
agencies with poor financial performance, or
those not maintaining or using volunteers, for ex-
ample, will realize they are not competitive in
these areas as they complete their applications,
and thus may not send in their application. The
pool of applications and the scores received,
therefore, represent the very best of social services
agencies in the country.
—40—
Table 4: Statistical Performance Summary
Performance Area Low Score High Score Mean(Average)
Median(Middle Score)
Staff 0 8.0 3.4 3.1
Volunteers 0 7.5 3.0 2.7
Income Independence 0 10.0 6.9 7.4
Financial Management 1 8.7 6.3 6.5
Table 3: Cost Per Program-Hour
Agency Number ofProgram Hours
Total Cost Cost perProgram hour
Score
Agency A 1,000 $100,000 $100 3.3
Agency B 2,000 $250,000 $125 0.0
Agency C 2,000 $200,000 $100 3.3
Agency D 4,000 $200,000 $50 10.0
Agency E 4,000 $500,000 $125 0.0
Agency F 4,000 $300,000 $75 6.7