Embed Size (px)
Citation preview

1
FINAL TECHNICAL REPORT MERCURY POLLUTION IN THE GREENSTONE BELT
Authors: Dr. P. Ouboter
G. Landburg BSc. C. White
Dr. J. Mol Drs. F van der Lugt
Drs. J. Quik
CMO January 2007
NATIONALE ZOOLOGISCHE COLLECTIE VAN SURINAME/CENTRUM VOOR MILIEU-ONDERZOEK

2
Forward
Over the past decades, researches have concluded that human related mercury emissions have increased significantly in the atmosphere approximately 3-5 folds over the pre-industrial times and the rate of deposition is concomitantly higher. These releases are very well documented by UNIDO’s Global Mercury Project, European Environmental Bureau, Mercury Policy Project, Mercury Advocate Groups (BAN HG-WG, Zero Mercury Working Group, Health Care Without Harm) and WWF Guianas among others. The researches on environmental mercury contamination have been largely driven by the health risk of methylmercury exposure which results from the consumption of some fish species, aquatic mammals and shell fish. From a scientific prospective, it is evident that the global mercury problem is driven by emissions into the air, followed by atmospheric transport, deposition and eventually the biological transformation and accumulation in the aquatic ecosystem. These events cause significant risks for the human population and wildlife. Mercury is now considered as a major global pollutant and is even observed in areas that do not release mercury to the environment, for example the Arctic region. The developing fetus, infants and young children are the most vulnerable to damages by mercury and mercury related compounds. Methylated mercury- the widely available form in fishes higher up in the food chain, affects the development of the brain and central nervous system. It can alter nerve cell migration in the fetal brain, and interferes with nerve cell differentiation and division-preventing normal brain structure. Even at low levels of prenatal exposure, symptoms of neurological effects have been observed. Mercury is threatening fish as a local food source in the Guianas. It is the most widely available form of protein for indigenous and maroons groups. Contamination of this important food source can bring about serious economic and health problems to these communities. The recent spike in gold prices has caused an increase in small and medium scale goldmining activities where mercury amalgamation is the preferred method of recovery. Mercury amalgam is heated in most cases in open air releasing mercury vapor. This source is considered by many experts as one of the highest contributors to the anthropogenic levels to the environment (approximately 800-1000t/yr). Several persons from the interior communities and their families are exposed to the toxic forms of mercury. Appropriate mercury regulations and restrictions in the Guianas are lacking and wherever there are laws, the enforcement is often inadequate. In French Guiana for example, the use of mercury for mining was banned from January 2006; however, enforcement of this new law is minimal because of the large insurgent of illegal miners from neighboring countries, and the regulatory agencies lack of financial and personnel resources to take appropriate action.

3
WWF Guianas Forestry Project, through its Goldmining Pollution Abatement Component, is working in collaboration with several regulatory agencies, educational institutions, indigenous and maroons groups, miners’ associations and several other stakeholders to reduce the impact on the environment. Some of these initiatives include: the support for improve mining regulations, education and awareness campaigns on mercury and other environmental issues, supporting regulatory institutions to improve the management of the sector, promoting best practices for miners including mercury free techniques and the use of mercury retorts, and monitoring of mercury in the environment. These activities come under the team of “leaving a living planet for our future generations”. Rickford Vieira Regional Goldmining Pollution Abatement Coordinator WWF Guianas

4
EXECUTIVE SUMMARY The increase gold mining activities in the interior have caused significant destruction to aquatic ecosystems. Surface sheet-wash contributes substantially to an increasing sediment load in streams and rivers. This has a negative impact on aquatic biota and can result in complete changes in biota diversity of aquatic ecosystems. Because of irresponsible use of mercury during gold mining activities, mercury enters the aquatic ecosystem and accumulates in biota, especially in biota on the highest level of the food chain, e.g. predatory fishes. Fish is the most important protein source of villagers in the interior. By eating these fishes, villagers may endanger their health. During this study an overview was made of the mercury pollution in the Greenstone Belt, where most gold mining activities occur. The results were compared with data gathered also in control sites, which are located southeast of the gold mining sites and localities, which are northeast of the gold mining sites. High mercury concentrations have been found for water, bottom sediment and predatory fish in gold mining sites, control sites and sites downstream of the gold mining sites. This means that the control sites and the sites downstream of the gold mining sites are affected by the gold mining activities as well. It is suspected that through atmospheric transportation, mercury is transported to upstream sites and causes pollution in these sites. More research is needed to confirm this. Downstream sites are probably polluted by the transportation of mercury with water and sediment/organic particles from the upstream areas. Measurements for turbidity in the gold mining sites show that the sediment load in the streams and rivers cause high levels for turbidity. These levels exceed international standards for turbidity in aquatic ecosystems and will negatively impact the biodiversity of biota in these systems. A study was also done on the relation between fish consumption and measured mercury concentrations in hair of villagers of the Poesoegroenoe area and the Nieuw Jacobkondre area. It can be concluded that consumption of predatory fish is positively related to increased mercury concentration in the human body. To avoid mercury poisoning, villagers must avoid eating predatory fishes with high mercury concentration. The most important fishes that must be avoided to consume, are: Serrasalmus rhombeus, Hoplias aimara, Hoplias marabaricus and Cichla ocellaris. It is also recommended to avoid big predatory fishes, because accumulation of mercury is positively related to the length of fish (Lindqvist, 1991).

5
CONTENT SUMMARY ............................................................................................................................................ 1 TABLES AND FIGURES....................................................................................................................... 6 1. PREFACE ........................................................................................................................................... 7
1.1 GOAL ............................................................................................................................................. 8 1.2 OBJECTIVE ...................................................................................................................................... 8 1.3 OUTPUTS ........................................................................................................................................ 8 1.4 PROJECT ACTIVITIES ....................................................................................................................... 8
2. STRATEGIES AND METHODOLOGIES ...................................................................................... 11 2.1 FIELD ACTIVITIES .......................................................................................................................... 11 2.2 SAMPLING..................................................................................................................................... 12
2.2.1 Water sampling ..................................................................................................................... 12 2.2.2 Sediment sampling ................................................................................................................ 13 2.2.3 Fish sampling ....................................................................................................................... 13 2.2.4 Laboratory analysis .............................................................................................................. 13
2.3 FISH CONSUMPTION STUDY ............................................................................................................ 13 3. RESULTS ......................................................................................................................................... 16
3.1 WATER QUALITY ........................................................................................................................... 16 3.2 MERCURY ..................................................................................................................................... 17
3.2.1 Suriname River ..................................................................................................................... 17 3.2.2 Saramacca River ................................................................................................................... 19 3.2.3 Tapanahoni River ................................................................................................................. 20 3.2.4 Lawa River ........................................................................................................................... 21
3.3 FISH CONSUMPTION SURVEY .......................................................................................................... 24 3.3.1 Fish consumption patterns .................................................................................................... 24 3.3.2 Alternative Protein Consumption........................................................................................... 25 3.3.3 Mercury measurements in human hair ................................................................................... 26
4. DISCUSSION.................................................................................................................................... 28 4.1 GOLD MINING SITES VERSUS CONTROL SITES VERSUS DOWNSTREAM SITES ....................................... 28 4.2 DRY SEASON VERSUS RAINY SEASON .............................................................................................. 32 4.3 YEAR 1 VERSUS YEAR 2 ................................................................................................................. 32 4.4 FISH CONSUMPTION STUDY ............................................................................................................ 32
5. CONCLUSIONS AND RECOMMENDATIONS ............................................................................ 35 6. REFERENCES ................................................................................................................................. 37 7. APPENDICES ...................................................................... ERROR! BOOKMARK NOT DEFINED.

6
TABLES AND FIGURES Table 1. An overview of the activities planned during the implementation of the
project and the level of achievement for each project activity. Table 2. An overview of the selected sampling sites Table 3 Average mercury concentrations in Hoplias marabaricus, Plagioscion
squamosissimus, Cichla oellaris and Brycon falcatus for all sampling periods
Table 4. Average mercury concentrations in Hoplias marabaricus, Plagioscion squamosissimus, Cichla oellaris and Brycon falcatus for all sampling periods
Table 5. An overview of mercury concentrations in non-predatory fishes Table 6. The total biomass (in g) consumed of each fish species for the two
sampling regions during wet and dry seasons Table 7. Overview of people of the Poesoegroenoe area and the Nieuw
Jacobkondre area who contributed hair Table 8. Average results of mercury in hair from the target groups in the
Poesoegroenoe and the Nieuw Jacobkondre area. Table 9. Results of the Kruskal-Wallis test for a significant differences in [Hg]
between the gold mining sites, the control sites and the downstream gold mining sites for water, bottom sediment, Hoplias aimara and Serrasalmus rhombeus. The highlighted cells indicate that there is a significant difference.
Table 10. Predatory fishes which should be avoided eating Figures 1. The average level for mercury in water, bottom sediment, Hoplias aimara
and Serrasalmus rhombeus of localities in the Suriname River Figures 2. The average level for mercury in water, bottom sediment, Hoplias aimara
and Serrasalmus rhombeus of localities in the Saramacca River Figures 3. The average level for mercury in water, bottom sediment, Hoplias aimara
and Serrasalmus rhombeus of localities in the Tapanahoni River Figure 4. The average level for mercury in water, bottom sediment, Hoplias aimara
and Serrasalmus rhombeus of localities in the Lawa River Figure 5. The average levels of the mercury for water, bottom sediment, Hoplias
aimara and Serrasalmus rhombeus in the gold mining sites, the control sites and the sites downstream of the gold mining sites
Figure 6. Fish consumption pattern in Poesoegroenoe and Nieuw Jacobkondre

7
1. PREFACE From the ’80 on, gold mining activities have increased exponentially in Suriname. The activities are mainly carried out in the northern and southeastern part of the Greenstone Belt, a volcano-sedimentary series of the Armina Formation composed of mafic to intermediate volcanics, associated with meta-gabbros and intercalated with meta-cherts and phyllites, meta-sandstones, meta-conglomerates with local meta-volcanics. Siltstones, sandstones and conglomerates with intermediate volcanics, called Rosebel Formation are found in the Rosebel area, west of the Brokopondo village. The primary gold deposits as well as the gold placers occur in the northern and the southeastern part of the Greenstone Belt (Pollack et al, 1998). During the process of gold extraction, mercury is used for the amalgamation process. The amount of mercury used for the amalgamation process is dependent on the expected amount of gold. It is estimated that for every kilogram of gold, one kilogram of mercury enters the environment (Veiga, 1997) when the amalgam is being heated and the mercury evaporates to the atmosphere. With rainfall mercury is deposited in aquatic and terrestrial ecosystems. Mercury also enters the environment directly, for example when the mats of the sluice box, which can have rest of mercury on it, are being washed in creeks and rivers. Mercury has a very negative impact on aquatic ecosystems. Mercury is easily taken up by organisms, which will result in accumulation of mercury in the food chain. Humans may be affected as they eat fish polluted with mercury, causing a variety of clinical symptoms. Because of the different fate of the chemical forms of mercury in humans and their pattern, the severity of the clinical symptoms are dependent on the form of mercury and the kind of exposure. The most toxic form of mercury, methyl mercury, is a well-established neurotoxicant that can have serious adverse effects on the central nervous system, the area of the brain regulating the sensory, visual, auditory functions and coordination (IPCS, 1990). This report gives an overview of the mercury pollution in the Greenstone Belt of Suriname, in areas without gold mining activities and in areas, downstream the Greenstone Belt, who are also affected by the upstream gold mining activities. Areas mostly affected by the mercury pollution are indicated and changes over time are also documented. This report also presents the results of a study done on the fish consumption pattern of local communities of the Poesoegroenoe area and the Nieuw Jacobkondre area. This study has been carried out by the Center for Environmental Research (CMO), an institute of the Anton de Kom University of Suriname. With this study, CMO, wants to make decision makers and the community aware of the problems related to the use of mercury in the gold mining activities, so measures can be taken to abandon the use of mercury in gold extraction activities and to make use of other present alternatives. Villagers should also be informed about healthy food strategies to avoid mercury poisoning.

8
1.1 Goal The goal of this project is to produce an overview of mercury pollution in the Greenstone Belt in Suriname to help focus decision-makers and project developers to the most affected areas and to increase awareness about the seriousness and extend of mercury pollution.
1.2 Objective Produce an overview of mercury pollution in the Greenstone Belt.
1.3 Outputs The following outputs have been set for this project: 1. Upgrading of CMO laboratory 2. Completion of first series of surveys in 19 selected sites on mercury pollution and fish consumption patterns in two selected sites (2004) 3. Preliminary mapping of areas most seriously affected (2004) 4. Preliminary technical report on mercury pollution and fish consumption patterns of local communities (2004) 5. Completion of second series on survey on mercury pollution of 19 selected sites (2005) 6. Mapping of areas most seriously affected (2005) 7. Second technical report on mercury pollution in the Greenstone Belt (2005) 8. Comparative analysis of 2004 and 2005 results and analysis of trends in mercury pollution
1.4 Project Activities Project activities started November 2003. According to the agreement, the project should be finished by October 2005. Due to unforeseen circumstances, the project activities were extended to May 2006. For each output a set of project activities were planned. Table 1 gives an overview of the activities planned during the implementation of the project and the level of achievement for each project activity.

9
Activity Level of achievement
1. Upgrading of CMO laboratory 1.1 Purchase of equipment and materials Achieved 1.2 Improvement of CMO laboratory infrastructure Achieved 1.3 Training of 3 employees of CMO in ArcView mapping
techniques Achieved
1.4 Development of method for the destruction of hair samples Achieved 1.5 Presentation of monitoring protocol and the selected water
quality parameters Achieved
2. Completion of first series of survey on mercury
pollution and fish consumption patterns of two selected sites
2.1 Sampling of water, bottom sediment, fish and human hair at the selected sites during dry season 2004 and measurement of the selected various water quality parameters
Partly achieved
2.2 Conduct meetings with selected communities to inform them and raise awareness on mercury pollution
Partly achieved
2.3 Interviews to determine fish consumption patterns of selected local communities during the dry season 2004
Achieved
2.4 Analysis of samples for mercury levels dry season 2004 Achieved 2.5 Sampling of water, bottom sediment, fish and human hair
at selected sites during the rainy season and measurement of various water quality parameters
Achieved
2.6 Interviews to determine fish consumption patterns of selected local communities during the rainy season
Achieved
2.7 Analysis of samples of mercury levels Achieved 3. Preliminary technical report on mercury pollution and
fish consumption patterns of local communities (2004)
3.1 Preparation of overview mercury pollution Achieved 3.2 Preparation of overview fish consumption pattern of local
communities Achieved
3.3 Determining risky food fish and possible advice on more healthy fish consumption patterns
Achieved
3.4 Presentation of preliminary results at Regional Workshop in Suriname
Not achieved
4. Preliminary mapping of areas most seriously affected
(2004)
4.1 Identification of areas most seriously affected by mercury pollution
Achieved
4.2 First digital mapping of areas most seriously affected by Achieved

10
mercury pollution 5. Completion of second series on survey on mercury
pollution of 22 selected sites
5.1 Second set of sampling water, bottom sediment, fish and human hair at the selected during dry season and measurement of the selected water quality parameters
Achieved
5.2 Presentation of preliminary results in the different communities
Partly achieved
5.3 Analysis of second set of samples of mercury levels Achieved 5.4 Second set of sampling water of bottom sediment, fish and
human hair at the selected sites during the rainy season and measurement of the selected water quality parameters
Achieved
5.5 Analysis of second set of samples of mercury levels Achieved 6. Second technical report on mercury pollution in the
Greenstone Belt (2005)
6.1 Preparation of overview of mercury pollution Achieved 6.2 Presentation of the second technical report on mercury
pollution in the Greenstone Belt Not achieved
7. Mapping of areas most seriously affected (2005) 7.1 Completion of mapping of areas mostly affected by
mercury pollution Achieved
8 Comparative analysis of 2004 and 2005 results and
analysis of trends in mercury pollution
8.1 Comparison of data with former data on mercury levels Achieved 8.2 Analysis and description of trends in mercury pollution Achieved 8.3 Presentation of results to the scientific community (lecture) Not achieved 8.4 Presentation of comparative results at regional workshop in
Cayenne Not achieved
8.5 Publication of monitoring results Achieved Table 1. An overview of the activities planned during the implementation of the project and the level of achievement for each project activity.

11
2. STRATEGIES AND METHODOLOGIES In cooperation with the Institute for Biodiversity and Environmental Education and Research (IBER), CMO was supplied with all needed equipment for the measurements of the water quality parameters and the analysis of mercury in the water, bottom sediment and fish samples.
2.1 Field activities According to the sampling localities selected in the project proposal, a sampling schedule was set up for each sampling period (short dry season 2004, long rainy season 2004, short dry season 2005 and long rainy season 2005). Sampling localities were reached by plane, car or boat. To work efficiently, sampling localities were grouped to be reached in one period. After the first sampling period, some changes have been made in the sampling localities. Some areas, for example Java, were very difficult to reach. Alternative localities were selected for these areas. The localities have been divided in: gold mining sites, control sites (upstream of the gold mining sites) and sites which are downstream of the gold mining sites. River/Riversystem Gold mining site Control site Downstream gold
mining site Marowijne (with Lawa River and Tapanahoni River)
Benzdorp
Anapaike Albina
Drietabbetje Tepoe Galibi Stoelmanseiland Suriname River Brokopondo Lake
(east and west) Pikin rio Klaaskreek
Piki Pada Pomona Grankreek Saramacca River Nieuw Jacobkondre Poesoegroenoe Kwakoegron Santigron Boskamp Table 2. An overview of the selected sampling sites For each trip a team was selected which consist of one or two field assistants and one researcher. The research team consisted of the following people: - Dr. P. Ouboter Project coordinator - Dr. J. Mol Researcher - Drs. F. van der Lugt Researcher - Drs. J. Quik Researcher

12
- G. Landburg BSc. Coordinator logistics/Field assisstant - R. Jairam Field assistant - U. Satnarain Field assistant - J. Metjo Chemical analyst/field assistant - I. Nanden - Asraf Chemical analyst/field assistant - C. White Consultant fish consumption study During the field trips, the team members tried to inform the local communities on the results and to advice them on healthy fish consumption strategies. The head of the district Brokopondo, advised us not to present data to the local communities, because he was afraid of any confrontation between the local communities and the government on the subject of mercury pollution.
2.2 Sampling At each site, water quality parameters were measured and samples were taken of water, bottom sediment, and fish for the mercury measurements. 2.2.1 Water sampling Water was analyzed for the following parameters:
- temperature - pH - conductivity - dissolved oxygen - turbidity (or secchi depth) - alkalinity - chloride - tannin-lignin (humic acids) - aluminum - iron - mercury
At each locality, temperature, pH, conductivity and dissolved oxygen were measured electro-chemically with portable Hach meters, near the left and the right shore and in the middle of the stream. At the same localities 1 L samples were taken and mixed in a white plastic container. From this mixed 3 L sample, three 300 mL samples are taken in pre-cleaned PET-bottles, containing 0.5 mL concentrated ultra-pure nitric acid. These bottles were pre-cleaned with hydrochloric acid, nitric acid and distillated water. These 300 mL samples were transported to the laboratory on ice and used for the analysis of aluminum and iron. Mercury was taken in the middle of the stream sampled. The remainder of the 3 L sample was used for analysis of the rest of the remaining parameters: Alkalinity and chloride were determined titrimetric, using a digital titrator. Tannin-lignin was measured with a

13
Hach colorimeter, while turbidity was measured colorimetric with a Hach turbidity meter/colorimeter or a secchi disc (depending on availability). 2.2.2 Sediment sampling Bottom sediment is sampled in shallow water or at low tide near the left and right shores of a stream. It is sampled with 100 mL polypropylene containers, covered and transported to the laboratory on ice. Containers were pre-cleaned with hydrochloric acid, nitric acid and distillated water. 2.2.3 Fish sampling At each locality, predatory fish are caught with gill nets overnight or bought from local fishermen. In the field the standard length (exclusive the tail) is measured and the fish are weighed and identified. If possible a piece of muscle tissue is sampled from the lateral side below the dorsal fin and weighted as well. This sample (or the whole fish) is carefully packed in plastic bags and transported to the laboratory on ice. If the fish cannot be identified in the field, they are taken whole for later identification in the laboratory. 2.2.4 Laboratory analysis Mercury measurements were carried out with a Bacharach mercury analyzer, using the “Cold Vapor Atomic Absorption” technology (Clesceri et al. 1998). Sediment samples are dried at room temperature where after they are ground. From the finely ground samples 0.5 g is weighted in 250 ml BOD bottles and 2.5 ml concentrated H2SO4 and 2.5 ml concentrated HNO3 is added and left overnight at room temperature. Samples are digested for 1 hour at 75 ºC, where after they are diluted with 100 ml deionised water. 15 ml KMnO4 5% is added to each sample. After 15 minutes the sample are once again placed in a water bath for 2 hour at 95 ºC. After cool off, 6 ml natriumchloridehydroxylamine hydrochloride and 5 ml SnCl2 is added to the samples and the absorption can be measured. For fish samples, 0.5 g is weighted for sample analysis. The destruction and measurement phase is the same as mentioned above. To check the accuracy of the analysis, standard solutions of mercury are analyzed before the samples are measured. A quality control is developed to check the results of the analyses through regression analysis.
2.3 Fish consumption study At two selected sites, Poesoegroenoe (non-mining site) and Nieuw Jacobkondre (mining site), in the Saramacca River, a fish consumption study was carried out during the project. The goal of the research was to assess the quality and quantity of protein intake among populations at risk of mercury poisoning in Suriname. Of particular interest was the amount of mercury (in g) consumed of different fish species. The local people were asked to contribute human hair for the mercury analysis.

14
This research is aimed at linking fish consumption to mercury levels in the general population not directly associated with small scale gold mining and to identify risky consumption patterns. An understanding of the relation between diet and the symptoms associated with chronic mercury toxicity will allow us to make recommendations to decrease health risks of vulnerable groups, such as pregnant women and prepubescent children. The first sample site was the Nieuw Jacobkondre area (sample site #1). It consisted of four village clusters; Misolibbe, Nieuw Jacobkondre, Balen, and Belowatra. This site is easily accessible, as daily flights are available to this region. There is at least one continually operated store in each village, with a total of eight stores in continuous operation. This cluster also boasts a clinic, primary school, electricity, and two telephone lines. At the time of the study the population count was approximately 150 residents. The second sample site was Poesoegroenoe region (sample site #2), the study area, consisted of six village clusters; Baetel, Poesoegroenoe, Toetima, Tevreden, Soekibakka, Pietie, and Padua. This region was accessible mainly by chartered flights, or a boat trip of 4 days in the dry season. In terms of services, electricity was only available at a clinic in Toetima, while there where no schools within this area. Due to these factors the population in this area is considerably lower, with a total population of approximately 75 individuals. To assess the feasibility of the study, the survey format was tested beforehand at Nieuw Jacobkondre. However, it was not possible to test the survey in the Poesoegroenoe sample region due to cost and time constraints. On the basis of this pretest, a final survey instrument was developed. Questions that posed skeptical results were excluded from the final survey. During this period, two research assistants from the village were selected and later trained to collect hair samples and dietary information. All data were systematically collected and recorded in the local language by the local surveyors and when feasible the primary researcher. The targeted number of households for each sample region was fifteen. In Poesoegroenoe a total of 13 households, spread over 7 villages, were assessed. However, due to increased volunteering because of the perceived health threat caused by local small-scale gold mining, 29 households were assessed from the Nieuw Jacobkondre study area in both seasons. Households were identified and included in the study based on the presence of target individuals: pregnant women and children between the ages of six and twelve who were willing to participate (Clarkson, 2002). The average age of the child sample group from both regions was 7. In the Nieuw Jacobkondre region 11 pregnant women were included in the study while 1 was included from the Poesoegroenoe study area. Each participating household received a small monetary compensation for their time. Socio-demographic variables regarding age, sex, education, work status, health conditions, and length of occupancy in the sample region were collected for each individual who physically resided in the household. This data allowed the researchers to

15
determine the household size and composition, mobility, exposure to education, and non-traditional sources of livelihood. The qualitative data also helped to determine the awareness of participants of the sources and causes of mercury contamination. Health status data was recorded during the wet and dry season rotations. The goal was to assess whether or not individuals reported any symptoms of chronic mercury toxicity such as numbness, dizziness, impaired hearing or vision, and or, slurred speech to their local health care provider within the past year. In addition, to ascertain if they were currently prescribed medication associated with these symptoms. It should be noted that many reports of dizziness and or body pains were often associated with malaria, which has a high incidence in the gold mining region. Dietary data was collected through daily surveys of protein intake during a two-week rotation in both the wet and dry season. Interviews were conducted to identify variations in lifestyle that may influence dietary patterns. Fish dietary data were recorded for each participating household at two mealtimes during the sampling rotation. Moreover, to assess a more realistic volume of household consumption, additional data were recorded whenever the opportunity arose. For accuracy and clarity fish were visually identified with the aid of a color identification chart and or photographed and labeled with the local name. Before the daily meal was to be prepared, all the fishes were counted and the total length and the wet weight of all the fishes were measured. The dietary survey focused on: (1) Sources of fish from the city, self caught, or obtained as a gift (2) Species identification (3) The status of each fish sample before consumption: fresh, dried, or salt preserved (4) Method of preparation: boiled or fried (5) Other types of protein, which can contribute to mercury intake

16
3. RESULTS
3.1 Water quality Tables 1a, 1b, 1c and 1d in appendix 1 gives an overview of the average results for the water quality measurements. The pH of all waters sampled was slightly acidic to neutral. (5.13 – 7.60). Low pH was found at Santigron in both dry (average pH = 5.13) and wet season (average pH = 5.53) and in Poesoegroenoe in the wet season (average pH = 5.23). In general, conductivity is lower in the Interior than in the Coastal Plain. (Ouboter, 1993). The lowest measurement for conductivity was at Tepoe (average: 15.08 S/cm, wet season) in the Tapanahoni River. Low measurements for conductivity were also found in localities in the Saramacca River (Kwakoegron (average: 17.60 S/cm, dry season; average: 18.93 S/cm, wet season) and at Drietabbetje, in the Tapanhoni river, for both wet and dry season (average: 18.05 S/cm/ average: 17.23 S/cm). Because of the turbulence, which favors aeration, the oxygen content in most rivers in the Interior is very high (> 5.5 mg/l). Low oxygen content is found in the Coastal Plain at the localities Pomona (average: 3.22 mg/l, wet season) and Santigron (3.97 mg/l, wet season). For salinity, high measurements for chloride were found in the Coastal Plain (> 5 mg/l Cl), but in the Interior low levels were found (< 3 mg/l Cl). High turbidity levels were found for all rivers in the Coastal Plain. This, because of the influence of the Guyana current, which runs before the coast of Suriname. In the Interior high levels for turbidity were found at the gold mining sites Brokopondo Lake (average: 48.96 NTU, dry season; average: 60.9 NTU, wet season), Grankreek (average: 31.4 NTU, dry season), Stoelmanseiland (average: 32.27 NTU, dry season) and Benzdorp (average: 28.4 NTU, dry season). The highest levels for the metals, aluminium and iron, were found in the Coastal Plain at the localities Galibi (average Al: 2.3 mg/l, dry season; 2.12 mg/l, wet season; average Fe: 8.1 mg/l, dry season; 5.75 mg/l, wet season), Pomona (average Al: 2.89 mg/l, dry season; average Fe: 8 mg/l, dry season) and Boskamp (average Al: 37.5 mg/l, dry season, 20.88 mg/l, wet season; average Fe: 54 mg/l, dry season; 27.75 mg/l, wet season). High levels of iron were found in the gold mining sites of the Interior, Piki Pada (average Fe: 2 mg/l, dry season; 4 mg/l, wet season) and Gran kreek (average Fe: 1.71 mg/l, dry season; 1.59, wet season). The form in which mercury will be present in the aquatic ecosystem is dependent on the water quality, especially the pH and the chloride concentration (vanLoon et al, 2000).

17
With a pH between 5 and 7, mercury can be present as Hg2+ and can form complexes with other complexing agents for example organic matter (as result methyl mercury) and chloride HgCl2 (aq).
3.2 Mercury Table 2 in Appendix 1 gives an overview per river system of the results of the analysis of mercury in water, sediment and predatory fish for both dry and wet season. Predatory fishes caught during the surveys and used for data analysis are:
- Hoplias aimara (124) - Serrasalmus rhombeus (181) - Hoplias marabaricus (28) - Cichla ocellaris (15) - Brycon falcatus (2) - Plagioscion squamosissimus (33)
A total of 383 fishes of the species mentioned above were caught during the survey. From the sampled fishes 62.4% of Serrasalmus rhombeus (113), 25% of Hoplias aimara (31), 53.3 % of Cichla Ocellaris (8), 17.9 % of Hoplias marabaricus (5) and 18.2 % of Plagioscion squamosissimus (6) were above the international standard (0.5 µg/g). The focus is mainly on Hoplias aimara and Serrasalmus rhombeus because they are caught in all river systems assessed and in general they show the highest mercury concentrations. They are also most consumed by the local people. Data of Hoplias aimara and Serrasalmus rhombeus are shown in histograms, while data for all predatory species can be found in table 3. All levels are compared to international standard (WHO) for mercury levels acceptable for aquatic ecosystems: 0.1 g/l for mercury in water, 0.14 g/g for mercury in bottom sediment and 0.5 g/g for mercury in fish. Appendix 2 gives maps with an overview of mercury in water, bottom sediment and fish. International standards are also included. 3.2.1 Suriname River Figure 1 gives the average of the mercury level in the Suriname River for water, bottom sediment, Hoplias aimara and Serrasalmus rhombeus for all sampling periods.

18
0
0.2
0.4
0.6
0.8
1
1.2
1.4
1.6
water water sediment sediment H. aimara H. aimara S. rhombeus S. rhombeus
dry season rainy season dry season rainy season dry season rainy season dry season rainy season
[Hg]
ControlGoldmining siteDownstream Goldmining site
Figure 1. The average level of mercury in water, bottom sediment, Hoplias aimara and Serrasalmus rhombeus for localities in the Suriname River The highest levels of mercury in water were found at the gold mining sites in and around the Brokopondo Lake: in the Lake (average: 0.11 g/l, dry season; 0.28 g/l, wet season), Piki Pada (average: 0.57 g/l, wet season) and Grankreek (average: 0.13 g/l, dry season). In the first year of sampling a mercury concentration of 1.06 g/l, wet season (10 x the international standard) was measured in the Brokopondo Lake (see also Appendix 2, Maps). The control site Pikin rio, showed also a high level for mercury (0.21 g/l, dry season; average: 0.13 g/l, wet season). The downstream site, Klaaskreek showed a high level for mercury in the dry season (0.11 g/l) and a low level in the wet season (average: 0.03
g/l). See also Appendix 2, Maps. High levels for mercury in sediment were found at all gold mining sites (> 0.15 g/g), at the control site, Pikin rio (> 0.24 g/g) and in all downstream sites (> 0.22 g/g). See also Appendix 2, Maps. The highest level for mercury in Hoplias aimara was found at the downstream site Klaaskreek (average: 0.59 g/g, dry season; 1.48 g/g, wet season), while for Serasalmus rhombeus, high levels were found at all gold mining sites (>1.16 g/g): the Brokopondo Lake showed levels of 1.637 g/g in the first year and 1.36 g/g in the second year. The control site also showed high levels for mercury in Serasalmus rhombeus (0.902 g/g,

19
dry season). The downstream site, Klaaskreek, shows low levels of mercury in Serasalmus rhombeus (< 0.218 g/g). See also Appendix 2, Maps. 3.2.2 Saramacca River Figure 2 gives the average of the mercury level in the Saramacca River for water, bottom sediment, Hoplias aimara and Serrasalmus rhombeus for all sampling periods.
0
0.1
0.2
0.3
0.4
0.5
0.6
0.7
0.8
water water sediment sediment H. aimara H. aimara S. rhombeus S. rhombeus
dry season rainy season dry season rainy season dry season rainy season dry season rainy season
[Hg]
ControlGoldmining siteDownstream Goldmining site
Figure 2. The average level of mercury in water, bottom sediment, Hoplias aimara and Serrasalmus rhombeus for localities in the Saramacca River High levels for mercury in water were found at the gold mining site Nieuw Jacobkondre (0.13 g/l, dry season), the control site, Poesoegroenoe (0.11 g/l, dry season) and in the downstream site Santigron (0.13 g/l, dry season). All other localities showed level < 0.08 g/l). See also Appendix 2, Maps. Both the gold mining site and the control site, showed high levels for mercury in sediment for both dry and wet season (> 0.2 g/g). High levels were found at the downstream sites Kwakoegron (average: 0.15 g/g, dry season; 0.14 g/, wet season) and Santigron (average: 0.14 g/g, dry season). See also Appendix 2, Maps. For Hoplias aimara, high levels were found at Nieuw Jacobkondre (average 0.51 g/g, dry season; 0.68 g/g, wet season) and in Poesoegroenoe (average:0.56 g/g, wet season). High levels for mercury in Serrasalmus rhombeus were found at Nieuw

20
Jacobkondre (average: 0.57 g/g, dry season) and at Kwakoegron (average: 0.64 g/g, dry season; 0.61 g/g, wet season). See also Appendix 2, Maps. 3.2.3 Tapanahoni River Figure 3 gives the average of the mercury level in the Tapanahoni River for water, bottom sediment, Hoplias aimara and Serrasalmus rhombeus for all sampling periods.
0
0.1
0.2
0.3
0.4
0.5
0.6
water water sediment sediment H. aimara H. aimara S. rhombeus S. rhombeus
dry season rainy season dry season rainy season dry season rainy season dry season rainy season
[Hg]
ControlGoldmining siteDownstream Goldmining site
Figure 3. The average level of mercury in water, bottom sediment, Hoplias aimara and Serrasalmus rhombeus for localities in the Tapanahoni River Low levels for mercury in water were found at all gold mining sites and the downstream sites (< 0.07 g/l). The control site, Tepu, showed a level of 0.13 g/l in the dry season. See also Appendix 2, Maps. High levels for mercury in bottom sediment were found at all gold mining sites, the control site and the downstream sites for both dry and wet season (> 0.15 g/g). See also Appendix 2, Maps. For Hoplias aimara, low mercury levels were found at the gold mining sites Drietabbetje (average: 0.34 g/g, dry season; 0.12 g/g, wet season) and Stoelmanseiland ( average: 0.44 g/g, dry season; 0.39 g/g, wet season). The downstream site Albina showed a mercury level in the dry season of 0.12 g/g. The control site Tepoe showed a mercury level of average 0.5 g/g in the dry season and average 0.26 g/g in the wet season.

21
Low levels were found for Serrasalmus rhombeus at all localities (<0.41 g/g) for both sampling periods. See also Appendix 2, Maps. 3.2.4 Lawa River Figure 4 gives the average of the mercury level in the Tapanahoni River for water, bottom sediment, Hoplias aimara and Serrasalmus rhombeus for all sampling periods.
0
0.1
0.2
0.3
0.4
0.5
0.6
water water sediment sediment H. aimara H. aimara S. rhombeus S. rhombeus
dry season rainy season dry season rainy season dry season rainy season dry season rainy season
[Hg]
ControlGoldmining siteDownstream Goldmining site
Figure 4. The average level of mercury in water, bottom sediment, Hoplias aimara and Serrasalmus rhombeus for localities in the Lawa River High levels for mercury in water were found at the control site Anapaike (0.19 g/l, dry season) and at the gold mining site Benzdorp (0.39 g/l, wet season). All other localities showed low levels of mercury (< 0.08 g/l) for both sampling periods. See also Appendix 2, Maps. High levels for mercury in bottom sediment were found at all locations for both sampling periods (> 0.17 g/g), except for the downstream locality Albina (average: 0.12 g/g, wet season). See also Appendix 2, Maps. High levels for mercury in Hoplias aimara at the control site Anapaike (average: 0.55
g/g, dry season). For the downstream site and the gold mining site mercury levels were below 0.44 g/g for both sampling periods. For Serrasalmus rhombeus high levels were

22
found at the gold mining site Benzdorp (average: 0.7 g/g, dry season). All other localities showed levels < 0.41 g/g for all sampling periods. See also Appendix 2, Maps. Table 4 gives an overview of all predatory fishes caught. These fishes were not caught in all river systems during the sampling periods.
CONTROL SITES
GOLD MINING SITES
DOWNSTR GOLD
MINING SITES
Dry season Wet season Dry season Wet season Dry season Wet season Serrasalmus 0.47± 0.264 0.3 ± 0.057 0.79 ± 0.519 0.97 ± 0.426 0.34 ± 0.206 0.3 ± 0.179 rhombeus Hoplias aimara 0.47 ± 0.07 0.39 ± 0.125 0.42 ± 0.056 0.3 ± 0.181 0.36 ± 0.192 0. 98 ± 0.500 Hoplias 0.17 ± 0.027 0.26 ± 0.132 0.52 ± 0.106 0.36 ± 0.021 0.36 ± 0.057 marabaricus Plagioscion 0.39 ± 0.255 0.43 ± 0.308 0.29 ± 0.106 squamosissimus Cichla occelaris 0.37 0.33 ± 0.085 0.55 ± 0.198 0.48 ± 0.057 0.33 Brycon falcatus 0.07 0.25
Table 4. Average mercury concentrations in Hoplias marabaricus, Plagioscion squamosissimus, Cichla Ocellaris and Brycon falcatus for all sampling periods. Fish consumption by locals includes both predatory and non-predatory fishes. Although predatory fishes contribute the most to mercury intake, it is important to know the mercury intake with the consumption of non-predatory fishes. During the second sampling period of the second year, non predatory fishes that have been caught in the gill nets were also taken for mercury analysis. Table 5 gives an overview of the mercury concentrations in non-predatory fishes. All results of the measurements were under the international standard.

23
Species Family GOLDMINING SITES CONTROL SITES Leporinus friderici Anostomidae 0.065 ± 0.007 0.08 ± 0.021 Leporinus lebailli Anostomidae 0.105 ± 0.007 Leporinus Maculata Anostomidae 0.07 ± 0.064 Poptella brevispina Characidae 0.18 Geophagus surinamensis Cichlidae 0.14 ± 0.03 0.07 ± 0.033 Geophagus harreri Cichlidae 0.17 ± 0.057 0.085 ± 0.007 Prochilodus reticulatus Curimatidae 0.11 ± 0.042 Curimata cyprinoides Curimatidae 0.19 0.1 ± 0.023 Semaprochilodus varii Curimatidae 0.07 ± 0.016 Platydoras cf dentatus Doraridae 0.12 Doras cf micropoeus Doraridae 0.185 ± 0.005 Hemiodus unimaculatus Hemiodidae 0.11 Pseudancistrus barbatus Loricariidae 0.07± 0.01 Hypostomus gymnorhynchus Loricariidae 0.068 ± 0.039 0.045 ± 0.007 Metaloricaria paucidens Loricariidae 0.18 Hypostomus Ventromaculatus Loricariidae 0.05 ± 0.021 Pachypops fourcroi Scianidae 0.12 Myleus rubripinnis Serrasalmidae 0.015 ± 0.0071 0.04 ± 0.011 Myleus ternetzi Serrasalmidae 0.01 0.01 Myleus rhomboidalis Serrasalmidae 0.00 Acnodon oligacanthus Serrasalmidae 0.005 0.01± 0.007
Table 5. An overview of mercury concentrations in non-predatory fishes
24
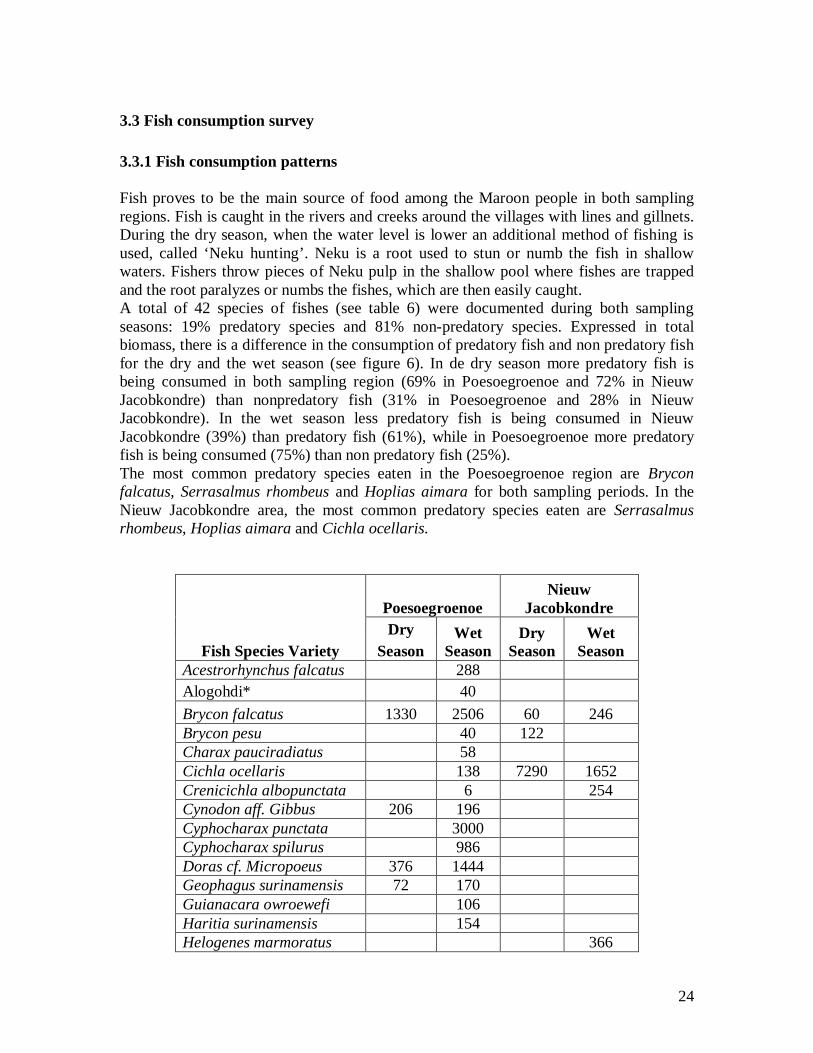
3.3 Fish consumption survey 3.3.1 Fish consumption patterns Fish proves to be the main source of food among the Maroon people in both sampling regions. Fish is caught in the rivers and creeks around the villages with lines and gillnets. During the dry season, when the water level is lower an additional method of fishing is used, called ‘Neku hunting’. Neku is a root used to stun or numb the fish in shallow waters. Fishers throw pieces of Neku pulp in the shallow pool where fishes are trapped and the root paralyzes or numbs the fishes, which are then easily caught. A total of 42 species of fishes (see table 6) were documented during both sampling seasons: 19% predatory species and 81% non-predatory species. Expressed in total biomass, there is a difference in the consumption of predatory fish and non predatory fish for the dry and the wet season (see figure 6). In de dry season more predatory fish is being consumed in both sampling region (69% in Poesoegroenoe and 72% in Nieuw Jacobkondre) than nonpredatory fish (31% in Poesoegroenoe and 28% in Nieuw Jacobkondre). In the wet season less predatory fish is being consumed in Nieuw Jacobkondre (39%) than predatory fish (61%), while in Poesoegroenoe more predatory fish is being consumed (75%) than non predatory fish (25%). The most common predatory species eaten in the Poesoegroenoe region are Brycon falcatus, Serrasalmus rhombeus and Hoplias aimara for both sampling periods. In the Nieuw Jacobkondre area, the most common predatory species eaten are Serrasalmus rhombeus, Hoplias aimara and Cichla ocellaris.
Fish Species Variety
Poesoegroenoe Nieuw
Jacobkondre Dry Wet
Season Dry
Season Wet
Season Season Acestrorhynchus falcatus 288 Alogohdi* 40 Brycon falcatus 1330 2506 60 246 Brycon pesu 40 122 Charax pauciradiatus 58 Cichla ocellaris 138 7290 1652 Crenicichla albopunctata 6 254 Cynodon aff. Gibbus 206 196 Cyphocharax punctata 3000 Cyphocharax spilurus 986 Doras cf. Micropoeus 376 1444 Geophagus surinamensis 72 170 Guianacara owroewefi 106 Haritia surinamensis 154 Helogenes marmoratus 366

25
Hemiodus unimaculatus 156 186 Hoperythrinus unitaeniatus 160 Hoplias aimara 12000 653 714 Hoplias malabaricus 832 Hypostomus gymnorhynchus 120 674 Hypostomus ventromaculatus 4 2750 Kakafissi* 1800 Kamusu* 1862 Kesesi* 4 Krobia itanyi 36 136 Leporinus fasciatus 590 852 826 Leporinus gossei 626 2806 2158 1970 Leporinus maculatus 8 Leporinus nijsseni 12 Moenkhausia georgiae 278 786 2964 976 Moenkhausia oligolepis 55 Myleus rhomboidalis 1586 3104 660 1055 Myleus rubripinnis 2230 580 Pimelodella geryi 186 72 Pimelodus ornatus 36 Prochilodus reticulatus ssp. 234 Pseudoplatystoma fasciatum 50000 Schizodon fasciatum 12 Semaprochilodus varii 787 Serrasalmus rhombeus 3566 1148 9737 2084 Triportheus rotundatus 266 122 Wanakoe 218 Total 24521 73307 24690 13265
Table 6. The total biomass of each fish species consumed for the two sampling regions during dry and wet seasons. 3.3.2 Alternative Protein Consumption During the dry season 100% of all households sampled at Nieuw Jacobkondre reported consuming at least one other protein in the form of bush meat (white-lipped peccary, Tayassu pecari, and collared peccary, Tayassu tajacu), a variety of wild fowl, and domesticated fowl eggs. Only 50% of Poesoegroenoe households reported consuming any variety of these proteins at this time. In the wet season there was a 50% decrease in

26
the consumption of white-lipped peccary, collared peccary, fowl, and or egg consumption in this location (see table 3 in Appendix 1). 3.3.3 Mercury measurements in human hair Table 7 gives an overview of the people of both sampling regions, who contributed hair. Besides the target group (children between 6 and 12, pregnant women and women with new born), two people from the New Jacobkondre area, the captain and his wife, also contributed hair. POESOEGROENOE NIEUW JACOBKONDRE CHILDREN Boys 10 5 Girls 3 12 WOMEN Pregnant 1 5 Women + new born child 5 Others 2 Table 7. Overview of people of the Poesoegroenoe area and the Nieuw Jacobkondre area who contributed hair Table 8 gives the results of the mercury analysis on hair samples collected from people from the Poesoegroenoe area and the Nieuw Jacobkondre area. A detailed overview with mercury level per person can be found in table 3 of Appendix 1. POESOEGROENOE NIEUW JACOBKONDRE CHILDREN Boys 6.92 ± 2.874 (3.56 – 12.11 g/g) 3.454 ± 1.308 (1.70 – 5.25 g/g) Girls 5.53 ± 1.562 (3.4 – 7.10 g/g) 3.432 ± 2.113 (0.95 – 7.75 g/g) WOMEN Pregnant 2.08 3.706 ± 2.045 (1.65 – 6.10 g/g) Women + new born child
2.85 ± 1.989 (0.51 – 6.10 g/g)
Others 3.345 ± 2.485 (0.86, 5.83 g/g) Table 8. Average results of mercury in hair from the target groups in the Poesoegroenoe and the Nieuw Jacobkondre area. An average on mercury in hair samples among all above mentioned categories, gives for the Poesoegroenoe area 6.28 ± 2.85 and for the Nieuw Jacobkondre area 3.44 ± 2.02. Compared with the NOAEL (no observed adverse effect level), set by the WHO of 10 µg/g in hair (UNEP, 2002) shows that 14% of the assessed villagers of the Poesoegroenoe area have a mercury concentration higher than the NOAEL (12.11 µg/g,

27
11.17 µg/g). Remarkable was that these high mercury concentrations were measured in two children of 6 and 12 years old. None of the villagers of the Nieuw Jacobkondre area had a mercury concentration higher than the NOAEL.

28
4. DISCUSSION
4.1 Gold mining sites versus control sites versus downstream sites The purpose of the mercury overview is to describe the pollution by mercury in the gold mining sites. These sites are compared to the mercury pollution in the control sites, which are located upstream of the gold mining sites and which wouldn’t be influenced by the gold mining activities in the downstream located gold mining sites. A comparison is also made between the gold mining sites and the sites which are located downstream the gold mining sites. Except for the high turbidity in the coastal areas, which is caused by the Guyana current, high turbidity levels are found in the gold mining sites (see table 1 in Appendix 1). The gold mining activities result in an increasing sediment load in streams and rivers. Increasing turbidity results in changes in the abundance of present biota in streams and rivers (Mol & Ouboter, 2003). Increasing turbidity also results in polluting of high quality drink water for the local people in the gold mining areas. Comparison of the measured turbidity levels with the water quality guidelines set by the EPA (inducing of 5 NTU when background is less than or equal to 50 NTU) shows that some of the gold mining sites, for example Lake Brokopondo already exceeded these standards. Figure 5 gives the average levels of the mercury levels for water, bottom sediment, Hoplias aimara and Serrasalmus rhombeus in the gold mining sites, the control sites and the sites downstream of the gold mining sites. The figures in Figure 5 show that high levels for mercury are also found in the control sites. This means that the control sites are also affected by the gold mining activities northeast. During the surveys the research team was informed by some people in the Pikin rio area that occasionally gold miners are surveying in the Pikin rio area. It wasn’t clear if the gold mining activities were permanent. High mercury concentrations were also found in some areas in West Suriname (Ouboter, Quik & Mol, 2003), areas without gold mining activities (Lucie River: average of 0.72 µg/g for Hoplias aimara; Amatopo (Corantijn): average of 0.66 µg/g for Hoplias aimara, average of 0.79 µg/g for Serrasalmus rhombeus). Because these areas are free from gold mining activities, the origin of the mercury could only be natural (through erosion of bed rock) or by atmospheric transportation. Areas in Central Suriname (Central Suriname Nature Reserve) with another geological formation as in the areas mentioned above showed also high mercury concentrations in water, bottom sediment and fish. Study on the geological formations in West and Central Suirname resulted in the absence of mercury in these formations. With this information mercury can be excluded as a source of mercury emission in these areas (Landburg, 2005). Atmospheric transportation of mercury seems to be the only source of mercury in these areas. With the north-east wind mercury can be transported to Central and South Suriname, where it possibly can be deposited with rainfall. Through high rainfall at the lee side of the mountain ranges in Central and South Suriname, deposition of mercury can be stimulated in these areas. More research on this subject is needed to confirm this hypothesis.

29
Figure 5 shows also that high concentrations of mercury are found downstream of the ‘gold mining‘sites. Especially sediments show high concentrations of mercury (average 0.15 µg/g in dry season; 0.14 µg/g in wet season). All the rivers with intensive gold mining activities upstream (Suriname River, Marowijne River with the Lawa and the Tapanhoni River and the Saramacca River) show high levels of mercury in sediments downstream. It is possible that mercury is transported from the gold mining sites to the downstream sites and accumulates there in bottom sediment. High mercury concentrations are also found in fish (average Hoplias aimara: 0.98 µg/g). This means that the downstream sites are also affected by the gold mining activities upstream. There is a significant difference between the gold mining sites, the control sites and the downstream sites for water, dry season in the second sampling year and for bottom sediment, dry season in the second sampling year (P < 0.05). Overall there is no noticeable difference between the mercury concentrations found in water, bottom sediment, Hoplias aimara and Serrasalmus rhombeus from the gold mining sites, the control sites and the downstream sites.
Kruskal-Wallis Test Result Water Dry season 2004 - Rainy season 2004 P > 0.5 Dry season 2005 P < 0.05 Rainy season 2005 P > 0.9 Bottom sediment Dry season 2004 P > 0.5 Rainy season 2004 P > 0.1 Dry season 2005 P < 0.05 Rainy season 2005 P > 0.995 Hoplias aimara Dry season 2004 P > 0.1 Rainy season 2004 P > 0.9 Dry season 2005 P > 0.995 Rainy season 2005 P > 0.1 Serrasalmus rhombeus Dry season 2004 P > 0.1 Rainy season 2004 P > 0.5 Dry season 2005 P > 0.5 Rainy season 2005 P > 0.1
Table 9. Results of the Kruskal-Wallis test for a significant differences in [Hg] between the gold mining sites, the control sites and the downstream gold mining sites for water, bottom sediment, Hoplias aimara and Serrasalmus rhombeus. The highlighted cells indicate that there is a significant difference.

30
Other areas outside of the gold mining areas are also affected by the use of mercury in the gold mining activities (see Appendix 2, Maps). Through atmospheric transportation, areas southwest of the gold mining area may be affected by mercury pollution, while mercury is transported by water and fish to areas downstream of the gold mining areas.

31
Mercury overview in different sites
0
0.2
0.4
0.6
0.8
1
1.2
Dry season Rainy season Dry season Rainy season Dry season Rainy season Dry season Rainy season
[Hg] water [Hg] sediment [Hg] aimara [Hg] piranha
[Hg]
Gold mining sites
Control sites
Downstream gold miningsites
Figure 5. The average levels of the mercury for water, bottom sediment, Hoplias aimara and Serrasalmus rhombeus in the gold mining sites, the control sites and the sites downstream of the gold mining site

32
4.2 Dry season versus rainy season In the rainy season lower levels of mercury are expected in the aquatic ecosystem. Due to rainfall, more water enters the aquatic ecosystem, which favors the dilution effects of the concentration of chemical compounds. From Figure 5 it is clear that in the gold mining sites the highest levels for mercury in the aquatic ecosystem are found in the rainy season. Because of the need for water for the gold mining activities, the rainy season is favorable for gold mining activities. At the control sites and the downstream sites, lower levels are found in the rainy season. No noticeable difference was found for water, bottom sediment, Hoplias aimara 2004 and Serrasalmus rhombeus 2004/2005 (P > 0.1). For Hoplias aimara 2005 a significant difference (P < 0.025) was found between the wet season and the dry season.
4.3 Year 1 versus year 2 Samples have been taken over a period of two years (2004 and 2005). By personal observations, it seems that the gold mining activities have increased in the second year. But the levels of mercury in some of the areas were much lower than the first year. There is a noticeable difference (P > 0.1) between the mercury levels of year 1 and year 2. Data on rainfall of the second year show that during the long rainy season there was a high rainfall average in the gold mining sites (324.05 mm). These data were compared to the average rainfall during 1978 – 1987 (230.29 mm) (Meteorological Service Suriname). Rainfall data of 2004 was not available to make any comparison between 2004 and 2005. High rainfall can result in dilution in the aquatic ecosystem and also lower measured levels for mercury.
4.4 Fish consumption study Although there are no gold mining activities in the Poesoegroenoe area, the villagers show a higher average level of mercury in hair (6.28 ± 2.85) than the villagers of the Nieuw Jacobkondre area (3.44 ± 2.02). From the villagers of the Poesoegroenoe area 14% show mercury concentrations higher than NOAEL. The mercury levels measured are lower than the average measured in four Wayana populations in French Guiana :11.4 ± 4.2 µg/g (Fréry, N. et al, 2001). In the USA (McDowell M.A. et al, 2004) mercury

33
concentrations in women and children are lower (women: 0.2 ± 0.02 µg/g, children: 0.12 ± 0.01 µg/g) than in the Poesoegroenoe and Nieuw Jacobkondre area. Correlated with fish consumption, it can be stated that the villagers of the Poesoegroenoe area eat more predatory fish than non-predatory fish (see figure 6). The high mercury levels measured can be a result from the high consumption of predatory fish. Due to incomplete data gathering it is not possible to estimate the daily mercury intake for the villagers (Fréry, N. et al, 2001). Another explanation can be the position of Poesoegroenoe near the mountain ranges in Central and South Suriname. If the hypothesis of high deposition of mercury, near the mountain ranges in Central and South Suriname is correct, villagers of the Poesoegroenoe area are also exposed to this deposition. This can favor accumulation of mercury in human body. More research is needed to confirm this.

34
0
10000
20000
30000
40000
50000
60000
Predatory fish Non-predatory Predatory fish Non-predatory
September (dry season) November (wet season)
Bio
m
(g)
Nieuw JacobkondrePoesoegroenoe
Figure 6. Fish consumption pattern in Poesoegroenoe and Nieuw Jacobkondre

35
5. CONCLUSIONS AND RECOMMENDATIONS Due to gold mining activities mercury levels are increasing in the aquatic ecosystem of the gold mining sites. The quality of the aquatic ecosystems in these areas is also decreasing because of draining of waste water of gold mining activities in the rivers and creeks. This has resulted in increased turbidity in these rivers and creeks and inducing of mercury in the aquatic ecosystem. Villagers, who are very dependable on these aquatic ecosystems for their drink water and fish, endanger their health by drinking polluted water and consuming fish with high mercury concentrations.
An alternative method for gold extraction needs to be implemented and the use of mercury prohibited so that further destruction of the aquatic ecosystem can be prevented. A monitoring program should also be set up to guarantee rehabilitation of these areas. Control sites are also affected by the northeast located gold mining sites. Possible explanations are that through atmospheric transportation, mercury is transported to upstream localities. This can result in high mercury levels in the aquatic ecosystem of the control sites. According to the high levels of mercury in hair samples, it can be concluded that also the villagers upstream are affected by the gold mining activities northeast. This could be related to atmospheric transported mercury. Further study on atmospheric transportation in the upstream sites is needed to assess this problem.
Consumption of predatory fishes contributes to the intake of mercury in the human body. This can result in chronic mercury poisoning, which can be seen in changes in the function of e.g. the nervous system. To prevent mercury poisoning, villagers must avoid predatory fish, especially the big ones, that shows high levels of mercury, but eat more non-predatory fish. The following table gives a list of predatory fishes which should be avoided eating.
Scientific name Local name Cichla ocellaris Tukunari Hoplias aimara Anjoemara Hoplias marabaricus Pataka Serrasalmus rhombeus Piranha
Table 14. Predatory fishes which should be avoided eating

36

37
6. REFERENCES 1. Clarkson T. 2002, The Three Modern Faces of Mercury, Environmental Health Perspectives, , 110, 11-53 2. Clesceri, L.S., A.E. Greenberg & A.D. Eaton (eds.), 1998, Methods for the Examination of Water and Wastewater, 20th edition, American Public Health Association, 800 pag 3. Fréry, N., Maury-Brachet R., Mailot, E., Deheeger, M., de Mérona, B. and Boundou A, 2001, Gold Mining Activities and Mercury Contaminaton of Native Amerindian Communities in French Guiana: Key Role of Fish in Dietary Uptake, Environmental Health Perspectives, Volume 109, No 5 4. International Program on Chemical Safety, 1991, Environmental Health Criteria 101 WHO Geneva 5. Landburg, G, 2005, Kwikvervuiling in midden en west Suriname; Natuurlijk of antropogeen?, 6. Lindqvist O. 1991, Mercury in the Swedish Environment, Recent Research on Causes, Consequences and Corrective Methods, Kluwer Academic Publishers, the Netherlands 7. McDowell M.A., Dillon C.F.,Osterloh J., Bolger P.M., Pellizzari E., Fernando R., Montes de Oca R., Schober S.E., Sinks T., Jones R.L., Mahaffey K.R., Hair Mercury Levels in U.S. children and women of childbearing age: reference range data from NHANES 1999-2000, August 2004 8. Meteorologische Dienst Suriname, Monthly Precipitation Totals (mm), January 2007 9. Mol, J.and Ouboter, P, 2004, Downstream Effects of Erosion from Small-Scale Gold Mining on the Instream Habitat and Fish Community of a Small Neotropical Rainforest Stream, Conservation biology Volume 18, No 1 10. Ouboter P., Mol J.& Quik J., 2003, De invloed van atmosferisch transport van kwik op het kwikgehalte in water en biota in rivieren van Suriname, Schure-Beyerinck-Popping Fonds, Nederland

38
11. Ouboter P.E. 1993, The Freshwater Ecosystems of Suriname, Kluwer academic Publishers, pag 54 12. Pollack H., de Kom J., Quik J., Zuilen L., 1998, Introducing Retorts for Abatement of Mercury Pollution in Suirname 13. Suriname Plan Atlas, Stichting Planburean Suriname, Afdeling Regionale Planning en Ruimtelijke Ordening, Washington, D.C., 1988 14. United Nations Environment Programme-Chemicals, 2002, Global Mercury Assessment, Geneve, Switzerland 15. Veiga M. 1997, Introducing New Tachnologies for Abatement of Global Mercury Pollution in Latin America, United Nations Industrial Development Organization (UNIDO), University of British Columbia (UBC), Center for Mineral Technology (CETEM/CNPq, Rio de Janeiro.

39
APPENDIX 1 Table 1a. Average results of water quality analyses – dry season 2004/2005 Table 1b. Average results of water quality analyses – dry season 2004/2005 (con’t) Table 1c. Average results of water quality analyses – wet season 2004/2005 Table 1d. Average results of water quality analyses – wet season 2004/2005 (con’t) Table 2. Results of mercury analysis on water, bottom sediment and fish per river system Table 3a. Fish consumption survey, Nieuw Jacobkondre Area, dry season Table 3b. Fish consumption survey, Nieuw Jacobkondre Area, wet season Table 3c. Fish consumption survey, Nieuw Jacobkondre Area, dry season Table 3d. Fish consumption survey, Nieuw Jacobkondre Area, wet season

40
TABLE 1A. AVERAGE RESULTS OF WATER QUALITY ANALYSES - DRY SEASON 2004/2005
Locality Secci Temp pH Con DO (cm) (ºC) (µS/cm) (mg/l)
GOLD MINING SITES Lake Brokopondo 30.38 ± 1.324 7.18 ± 0.002 31.87 ± 2.186 6.84 ± 1.029 Nw Jacob Kondre 29.3 ± 1.881 6.58 ± 0.368 22.69 ± 1.86 7.71 ± 1.138 Piki pada 71.67 30.49 ± 1.011 6.97 ± 0.184 20.14 ± 6.456 7.23 Grankreek 67.5 26.34 7.17 32.05 6.89 Benzdorp 28.33 26.51 ± 0.092 6.36 20.82 ± 2.666 5.51 ± 1.032 Drietabbetje 33.34 27.87 ± 0.898 5.8 ± 1.46 18.05 ± 2.786 7.39 ± 0.445 Stoelmanseiland 68.33 26.49 ± 0.014 6.3 ± 0.66 19.5 ± 3.415 7.56 ± 0.389 CONTROL SITES Poesoegroenoe 27 ± 0.8 5.47 ± 0.332 21.55 ± 1.344 6.1 ± 0.21 Pikin Rio 27.62 ± 0.453 6.1 ± 0.88 20.12 ± 4.787 6.7 ± 0.29 Tepoe 25.71 ± 1.096 6.38 ± 0.247 16.74 ± 3.91 6.82 ± 0.785 Anapaike 73.33 26.41 ± 0.057 6.11 17.19 ± 3.231 6.47 DOWNSTR GOLDM SITE Montresor 28.65± 0.354 6.8 ± 0.28 39.22 ± 22.22 6.4 ± 1.188 Pomona 21 28.29 ± 1.676 7.61 ± 0.269 16.46 ± 7.71 7.21 ± 0.806 Galibi 17 29.125 ± 0.035 7.2 ± 1.0 23.52 ± 14.96 7.29 ± 0.12 Santigron 48 29.73 5.13 34.27 4.59 Klaaskreek 27.39 ± 1.252 6.96 ± 0.368 20.6 ± 7.92 7.24 ± 0.53 Kwakoegron 28.85 ± 2.192 6.13 ± 1.174 17.6 ± 5.23 5.64± 1.973 Albina 27.2 7.1 20.51 4.54 Boskamp 9 28.5 6.6 673.67 5.37 Temp - Temperatuur, Con - Conductivity, DO - Dissolved oxygen

41
TABLE 1B. AVERAGE RESULTS OF WATER QUALITY ANALYSES - DRY SEASON 2004/2005
Locality Alk Cl Turb Al Fe Tan-Lig (mg/l) (mg/l) (NTU) (mg/l) (mg/l) (mg/l)
GOLD MINING SITES Lake Brokopondo 7.07 ± 0.702 3.78 ± 1.564 124 0.12 ± 0.025 0.2 ± 0.09 0.55 ± 0.173 Nw Jacob Kondre 3.2 ± 1.10 4.25 ± 1.626 13.24 ± 0.757 0.38 ± 0.099 0.86 ± 0.247 1.4 ± 0.16 Piki pada 6.6 ± 2.76 4.2 ± 1.84 12.17 0.27 ± .014 0.63 ± 0.078 1.4 ± 0.28 Grankreek 10.9 10 0.32 1.71 1.4 Benzdorp 3.75 ± 0.837 3.8 ± 0.57 28.4 0.58 ± 0.219 1.27 ± 0.085 1.5 ± 0.14 Drietabbetje 2.84 ± 1.464 5.65 ± 4.738 9.1 0.36 ± .148 0.62 1.67 ± 0.94 Stoelmanseiland 3.25 ± 1.768 3.1 32.27 0.37 ± 0.021 0.98 ± 0.283 1.3 ± 0.42 CONTROL SITES Poesoegroenoe 1.7 ± 0.28 3.8 ± 2.12 14.02 ± 3.748 0.33 0.5 0.95 ± 0.636 Pikin Rio 2.75 ± 0.919 4.8 ± 3.82 7.04 ± 0.191 0.33 ± 0.148 0.66 ± 0.057 1.9 ± 0.42 Tepoe 2.4 3.75 ± 2.051 8.97 ± 3.344 0.22 0.65 ± 0.2 2.05 ± 0.212 Anapaike 3.75 ± 0.837 3.6 ± 0.14 16.27 0.46 0.93 ± 0.134 1.0 ± 0.3 DOWNSTR GOLDM SITE Montresor 33.5 ± 14.85 > 1000 202 1.87 2.39 lim/10.0 Pomona 48.65 ± 9.546 >1000 107 5.4 14.4 lim/10.0 Galibi 51.5 ± 26.16 >1000 253.5 ± 9.19 2.3 ± 0.28 8.1 ± 3.96 lim/10.0 Santigron 2.8 15 55 0.67 2.12 3.4 Klaaskreek 14.5 ± 10.67 6.15 ± 5.445 20 0.4 ± 0.14 1.01 0.85 ± 0.354 Kwakoegron 10 ± 4.2 9 ± 4.2 30 0.72 1.08 1.7 ± 0.99 Albina 2 12 33 0.72 1.22 2 Boskamp 9 150 37.5 54 4.5 Alk - Alkalinity, Cl - Chloride, Turb - Trubidity, Al - Aluminium, Fe - Ijzer,Tan Lig - Tannin Lignin

42
TABLE 1C. AVERAGE RESULTS OF WATER QUALITY ANALYSES - WET SEASON 2004/2005
Locality Secci Temp pH Con DO (cm) (ºC) (µS/cm) (mg/l)
GOLD MINING SITES Lake Brokopondo 21 30.388 ± 0.796 6.97 ± 0.450 33.5 6.77 ± 0.351 Nw Jacob Kondre 130 27.85 ± 1.344 6.5 23.83 ± 5.996 7.43 ± 0.035 Piki pada 80 29.49 ± 0.969 6.42 ± 1.054 20.29 ± 4.363 5.56 Benzdorp 39 26.8 6.36 26.33 6.64 Grankreek 75 25.16 ± 0.863 6.38 ± 0.396 32.47 ± 2.878 7.79 ± 0.445 CONTROL SITES Poesoegroenoe 150 26.47 ± 0.332 5.23 18.93 ± 3.076 6.88 ± 0.064 Pikin Rio 143.33 27.45 ± 1.344 6.09 ± 0.87 19.64 ± 2.348 6.74 Tepoe 48 25.37 ± 1.131 6.1 ± 1.03 15.08 ± 1.867 7.59 Anapaike DOWNSTR GOLDM SITE Montresor 153 26.8 7.8 349.6 0.55 Pomona 49 28.07 6.83 16.12 3.22 Galibi 32.1 ± 0.141 7.3 104 6.66 ± 0.332 Santigron 28 5.53 144.13 3.97 Klaaskreek 95 28.62 ± 0.021 5.77 ± 0.368 25.54 ± 1.506 5.45 ± 0.085 Kwakoegron 48.33 28.5 ± 2.26 5.97 ± 0.198 141.7 5.73 ± 1.867 Albina 9 29.6 ± 0.95 6.1 142.97 7.17 ± 0.247 Drietabbetje 95 27.97 ± 2.213 6.3 ± 0.21 17.23 ± 0.10 7.09 ± 1.141 Stoelmanseiland 48.33 28.45 ± 0.537 6.82 ± 0.728 23.22 ± 3.231 7.17 Boskamp 9 27.73 7.1 373 5.28 Temp - Temperatuur, Con - Conductivity, DO - Dissolved oxygen

43
TABLE 1D. AVERAGE RESULTS OF WATER QUALITY ANALYSES - WET SEASON 2004/2005 Locality Alk Cl Turb Al Fe Tan-Lig
(mg/l) (mg/l) (NTU) (mg/l) (mg/l) (mg/l) GOLD MINING SITES Lake Brokopondo 7.7 ± 0.50 3.85 ± 0.778 165 0.11 ± 0.044 0.22 ± 0.095 0.4 Nw Jacob Kondre 3.85 ± 1.485 3.7 ± 1.84 28.8 0.31 ± 0.007 0.91± 0.438 1.2 ± 0.28 Piki pada 4.45 ± .636 4.65 ± 1.344 10.57 0.44 ± 0.41 2 ± 1.3 1.8 ± 0.57 Benzdorp 8.1 1.7 19 0.35 1.12 1 Grankreek 9.15 ± 2.616 7.8 31.4 0.2 ± 0.05 1.59 ± 0.057 0.9 ± 0.14 CONTROL SITES Poesoegroenoe 2.9 ± 0.14 3.3 ± 1.70 9.33 0.23 ± 0.049 0.54 ± 0.049 0.9 ± 0.14 Pikin Rio 3.5 ± 0.42 3.65 ± 1.768 10.77 0.28 ± 0.099 0.79 ± 0.085 1.3 ± 0.14 Tepoe 2.6 ± 1.27 4.5 6.73 0.29 ± 0.134 0.59 ± 0.071 1.0 ± 0.3 Anapaike DOWNSTR GOLDM SITE Montresor 10.3 92 202 6.15 11 5.2 Pomona 57.6 107 6 4 8.1 Galibi 43 ± 4.2 6600 208 ± 55.2 4.05 11 9.6 ± 0.57 Santigron 5.1 3.7 26 0.26 1.74 2.8 Klaaskreek 8.45 ± 2.475 16 23 0.27 ± 0.12 0.87 ± 0.453 0.9 ± 0.14 Kwakoegron 6.45 ± 0.845 3.75 ± 1.344 28 ± 19.8 0.41 ± 0.092 1.27 ± 0.226 1.9 ± 0.71 Albina 7.5 3.5 25 ± 0.7 0.53 ± 0.148 1.51 ± 0.156 1.55 ± 0.212 Drietabbetje 2.7 ± 1.27 3.55 ± 1.202 13.63 0.57 ± 0.148 0.73 ± 0.085 1.1 ± 0.14 Stoelmanseiland 5.7 ± 1.70 3.45 ± 0.919 18.43 0.48 ± 0.134 0.99 ± 0.332 1.1 ± 0.424 Boskamp 36 13 154 4.25 11.5 7.5 Alk - Alkalinity, Cl - Chloride, Turb - Trubidity, Al - Aluminium, Fe - Ijzer,Tan Lig - Tannin Lignin

44
TABLE 2 Results of mercury analysis on water, bottom sediment and fish per river system
Riviersysteem WATER SEDIMENT HOPLIAS AIMARA SERRASALMUS RHOMBEUS
dry season rainy
season dry season rainy season dry season rainy season dry season rainy season SARAMACCA RIVER Control 0.11 0.07 0.23 0.2 0.46 0.56 0.47 0.38 Goldmining site 0.09 ± 0.029 0.02 ± 0.008 0.2 ± 0.04 0.22 ± 0.037 0.51 0.68 0.57 ± 0.27 0.308 ± 0.215 Downstream Goldmining site 0.09 0.02 0.117 0.097 0.38 0.48 0.37 0.395 SURINAME RIVER Control 0.21 0.13 0.31 0.24 0.36 0.36 0.902 0.27
Goldmining site 0.113 ± 0.012 0.297± 0.217 0.21±0.049 0.207± 0.019 0.403 ± 0.011 0.47± 0.016
Downstream Goldmining site 0.11 0.03 0.22 0.23 0.59 1.48 0.218 0.21 TAPANAHONI RIVER Control 0.13 0.04 0.19 0.15 0.5 0.26 0.29 0.25
Goldmining site 0.065 ± 0.005 0.035 ± 0.005 0.235 ± 0.15 0.315 ± 0.2 0.39 ± 0.05 0.255 ± 0.135 0.255 ± 0.125
Downstream Goldmining site 0.06 0.06 0.23 ± 0.04 0.18 ± 0.01 0.12 0.41 0.2 LAWA RIVER Control 0.13 0.24 0.55 0.225 Goldmining site 0.075 ± 0.005 0.21 ± 0.18 0.3 0.315 ± 0.085 0.44 0.39 0.54 ± 0.16 Downstream Goldmining site 0.06 0.06 0.18 ± 0.01 0.12 0.12 0.305 ± 0.105

45
TABLE 3D. FISH CONSUMPTION SURVEY, POESOEGROENOE AREA WET SEASON
Village H/H Person ID#
Sex
Work
Pregnant
Age
Time in Region
Health status
Predatory fish consumed
(g)
Non-predatory fish consumed
(g)
Other Protein
[Hg] (µg/g)
Baetel Gertrude 2 01 01 F farm yes 16 2 years
Henki 2 01 02 F na 1 1 year
NOT AVAILABLE / NO DATA COLLECTED
Baetel Nolda 2 02 01 F other 39 2 years
Henki 2 02 02 M other 46 2 years
2 02 03 F na 11 2 years
NOT AVAILABLE / NO DATA COLLECTED
2 02 04 F na 9 2 years
2 02 05 M na 6 2 years
2 02 06 F na 5 2 years
Baetel Sonja 2 03 01 F farm 36 2 years na Brycon falcatus (992) Leporinus gossei (172)
Henki 2 03 02 M other 43 2 years na Myleus rhomboidalis (164)
2 03 03 F na 14 2 years malaria kamusu (1392)
2 03 04 M na 6 2 years na 5.3
2 03 05 F na 1 2 years na
Baetel Sila 2 04 01 F
shop keeper 29 2 years na
Serrasalmus rhombeus(12) Myleus rhomboidalis(2780)
Elmont 2 04 02 M other 33 2 years na Cichla ocellaris (138) Leporinus gossei (1960)
2 04 F na 13 2 years na Hoplias malabaricus Geophagus surinamensis (66)

46
03 (428)
2 04 04 M na 10 2 years na Cyphocharax punctata (3000) 2.92
2 04 05 F na 6 2 years na Charax pauciradiatus (58) 7.1
2 04 06 F na 4 2years na Leporinus nijsseni (12)
2 04 07 F na 1 1 year na Moenkhausia georgiae(48)
kakafissi (1800)
Baetel Ethel 2 05 01 F 51 2 years malaria Brycon falcatus (238) Leporinus fasciatus (232)
2 05 02 M 12 2 years malaria
Serrasalmus rhombeus(1088) Leporinus gossei (148) 12.11
kamusu (470)
Pietei Fanfillia 2 08 01 F farm 36 1 year
Karden 2 08 02 M farm 12 1 year
NOT AVAILABLE / NO DATA COLLECTED
2 08 03 M farm 9 1 year
Pietei Kerda 2 09 01 F farm 46 2 years na Brycon falcatus (364) Doras cf. micropoeus (840)
Bailey 2 09 02 M farm 14 2 years na Cynodon aff.gibbus (196)
2 09 03 M farm 12 2 years na Pseudoplatystoma fasciatum (50000) 7.67
2 09 04 M farm 10 2 years body pains Myleus rubripinnis (580) 6.2
2 09 05 F farm 8 2 years na Myleus rhomboidalis (160) 3.4
2 09 06 F farm 5 2 years na Leporinus gossei (206)
2 09 07 M farm 59 2 years na Haritia surinamensis (106)

47
Soekibakka Silva 2 10 01 F hossel 45 1 year body pains Hoplias malabaricus (90) Haritia surinamensis (48) eggs
King 2 10 02 M electrician 48 1 year na
Crenicichla albopunctata (6) Hypostomus ventromaculatus (4)
Serrasalmus rhombeus (48) Guianacara owroewefi (38)
2 10 03 F na 4 1 year cavaties Brycon pesu (28) Leporinus nijsseni (12)
2 10 04 M na 6 1 year diarheaa Cyphocharax spilurus (986) 6.75
2 10 05 M na 6 1 year diarheaa Moenkhausia georgiae (516) 3.56
Leporinus maculatus (8)
Moenkhausia oligolepis (55)
akindonia (346)
Doras cf. micropoeus (604)
Acestrorhynchus falcatus (288)
Triportheus rotundatus (122)
Hemiodus unimaculatus (72)
Pietei Ado 2 11 01 M Bashia 44 2 years na Brycon pesu (12) Moenkhausia georgiae (150) egg
Adoma 2 11 02 F school 11 2 years na Hemiodus unimaculatus (44)
2 11 03 M na 6 2 years malaria Guianacara owroewefi (68) 11.17
2 11 04 F na 19 2 years na Leporinus fasciatus (24)
2 11 05 F school 13 2 years na Geophagus surinamensis (22)
2 11 06 F na 6 2 years na 6.09
Pietei Pauline 2 12 01 F farm 73 2 years body pains
Hoplias malabaricus (314) Geophagus surinamensis (62) fowl, egg
Adams 2 12 02 F na 4 2 years na Brycon falcatus (296) Leporinus fasciatus (548)
2 12 03 M school 7 2 years na 8.57

48
Pietei Brigita 2 13 01 F farm yes 30 2 years na Brycon falcatus (616) Krobia itanyi (36) egg 2.08
Eva 2 13 02 M farm 9 2 years malaria Leporinus fasciatus (48)
2 13 03 M farm 7 2 years na alogohdi (40) 4.95
2 13 04 F farm 4 2 years na Hemiodus unimaculatus (40)
2 13 05 M farm 3 2 years na Moenkhausia georgiae (72)
2 13 06 M farm 1 1 year na Geophagus surinamensis (20)
Leporinus gossei (320)
Table 3d gives on overview of the fish concumption survey. Household members are identified by person, sex, age, residence time, health status, pregnant or having a newborn, fish and other protein consumed. An overview of the measured [Hg] is also given.

49
APPENDIX 2 MAP

50

51