Embed Size (px)
Citation preview

1
2006 Workforce Report
Debra F. Minott, Director

2
Table Of Contents Table Of Contents……………………………………………………. 2-3 Letter from State Personnel Director………………………………. 4 Notable Statistics in 2006……………………………………………. 5 Information Methodology…………………………………………… 6
Employment: Managing Positions Introduction………………………………………………………….. 8 Chart: Applicants by Job Function………………………………… 9 Chart: Applicants by Education …………………………………... 10 Chart: Applicants by Ethnic Group …..……………………….….. 11 Chart: Applicants by Gender ……….…………………………….. 12 Chart: Applicants by Age Range...………………………………… 13
Table: Applicants by County of Residence & Ethnicity…………. 14-15
Demographics: Indiana State Government Chart: Full-Time Employee Count (2002-2006) …………………. 17 Table: State Employees by Agency ……………………………….. 18-19 Table: State Employees by County of Work Location ….………. 20-22 Chart: State Employees by Job Function ……..………………….. 23 Diversity in the Workforce …………………………………..……. 24 Chart: Ethnic/Gender Distribution ………….……………………. 25 Table: Ethnicity/Gender by State Agency ………....….………….. 26 Chart: Ethnicity/Gender by Job Function ………..…………….… 29 Table: Average Age/Years of Service by Agency…………….…… 30-31 Chart: Gender by Age Groups …...………………………….….… 32 Table: Average Age Groups by Job Function …..………..…….… 33 Table: Average Age/Years of Service by Job Function ….….……. 34-35 Chart: Average Length of Service by Job Function ..………….… 37 Table: Years of Service Percentages by Job Function …………… 38 Table: Years of Service Groups by Job Function ………………… 39 Table: Average Years of Service by Job Function ……………….. 40 Chart: Distribution of Employees by Age ………………………… 41 Chart: Distribution of Employees by Years of Service ……..……. 42
2006 Workforce Report

3
Table Of Contents (Continued)
Compensation Chart: Average Annual Salary Trends...…………………………... 42 Chart: Average Salaries by Age Group……………..……………... 43 Chart: Average Salary by Years of Service Groups ……………… 44
Workforce Mobility Table: Separations from State Government by Job Function …. .. 46 Table: Turnover by State Agency ……...………………………….. 47-48 Table: Employees Currently Eligible to Retire ……….………….. 49 Table: Employees Eligible to Retire in 5 Yrs w/F-Benefits…….…. 50-51 Table: Employees Eligible to Retire in 5 Yrs w/R-Benefits…….…. 52-53 Chart: Historical Data on Retirement ……………………………… 54 Table: Average Age of Retirees by Job Function ………...……….. 55 Chart: Retirement Averages by Gender ……………..……………. 55 Leave Chart: Leave Balance Summaries ………………………...………… 57 Chart: Leave Used Summaries …...………………………..……….. 57 State Agencies Agencies Included in Data……………...……………...…………….. 58
2006 Workforce Report

4
Letter from State Personnel Director
Dear State Human Resource Professional: We are pleased to provide you with the State of Indiana 2006 Workforce Report. This report contains statistical demographic information on the workforce em-ployed by the State of Indiana as well as summary information on applicants seek-ing to be hired by the State. Indiana has experienced a growing economy in 2006. While that is positive news for Hoosiers, that growth in job opportunities has resulted in the State experiencing some challenges in recruiting and retaining a government workforce capable of de-livering efficient and high quality services to our citizens. To address these chal-lenges before they become problems, agencies should be planning, analyzing and developing strategies to ensure that necessary staff levels and competencies are in place to fulfill the mission of each agency. This report will serve as a helpful tool to you in conducting workforce planning for your agency. The staff of State Personnel will work with you to develop your strategies to achieve the right number of people with the right competencies in the right jobs at the right time. Sincerely, Debra F. Minott July 2007
Debra F. Minott State Personnel Director
Mitchell E. Daniels, Jr. Governor

5
Notable Statistics in 2006
The Selection Process • 25 percent of the applicant
pool reported a bachelor’s level degree in 2006 (See pg 11 for more details).
• Applicants between the ages of 25-29 represented the highest number of applicants at 38,668, or 16.6 percent.
Demographics • Marion County accounts for
over 36 percent of the State’s workforce.
• Department Of Correction is the State’s largest agency with over 21 percent of the workforce comprising more than 7,000 employees. De-partment of Transportation is second with 14.2 percent(See pg 19-20 for more de-tails).
• The average age for state employees is 45, and 31 per-cent are between the ages of 50-59 (See pg 34).
• Minorities comprise 15 per-cent of the State’s workforce.
Retirement • 36 percent of the current
workforce will be eligible for retirement in 5 years(See pg 51-54 for more details).
• Actual retirement numbers have remained at 2 per-cent or less since 2004.
• The average retirement age/years of service for males: 64/28 yrs of ser-vice; females: 63/22 yrs of service (See pg 56 for more details).
Compensation • The average annual salary
for all state employees is $36,053.
• The average annual clas-sified salary is $33,158, an increase of 14.3 percent since 2001.
• The average annual un-classified salary is $40,243, an increase of 17.7 percent since 2001. This group includes QUASI agencies as well as the legislative and judi-cial branches and agen-cies of separately elected officials.

6
Information Methodology
Report Structure The report highlights workforce trends, processes and programs which agencies can utilize to meet the challenges of a changing workforce and maintain a high performance organization.
Data Reliability Extra care has been taken to ensure the information reported is accurate and reflects the workforce. When applicable, tables and charts are noted with the criteria used to obtain the data.
1999 PeopleSoft was implemented as the State’s human resource management system (HRMS).
2005 PeopleSoft e-recruit was implemented, which created an electronic online version of the State’s employment application.
Information and Data PeopleSoft is an integrated database, which provides information to state agencies and policy-makers to enable them to make sound personnel–related decisions. The majority of the information contained in this report is readily available in PeopleSoft. The State Personnel Department encourages agencies to utilize the report and data contained in PeopleSoft to strategically recruit, hire, develop and retain their diversified work-force.
2002-2003 PeopleSoft Benefits was implemented in late 2002/early 2003, with the first self-service open enrollment occurring in mid-2003 for life insurance.

7
Employment
Managing Positions
8
The State of Indiana implemented the online single access portal to view and apply for jobs on Sept. 30, 2005. All applicants and data were previously tracked in PeopleSoft but this data was first captured on paper and then entered manu-ally into the system. Now applicants can apply 24/7 and enter the data directly, giving the State an efficient and streamlined, paperless process. Since the implementation of e-recruit, the number of applications processed by the State has surpassed ex-pectations. During the 2006 calendar year, the State processed 248,121 applications from 36,959 distinct applicants. Applicants are required to apply to each vacancy for which they are interested in being considered. The State was also able to capture profile data from 10,469 candidates. These are profiles entered in by potential applicants, but they have not yet applied to a specific position. Recruiters can search this database for skills and match the candidates and other applicants to job vacancies.
Introduction
Employment
9
Chart Employment
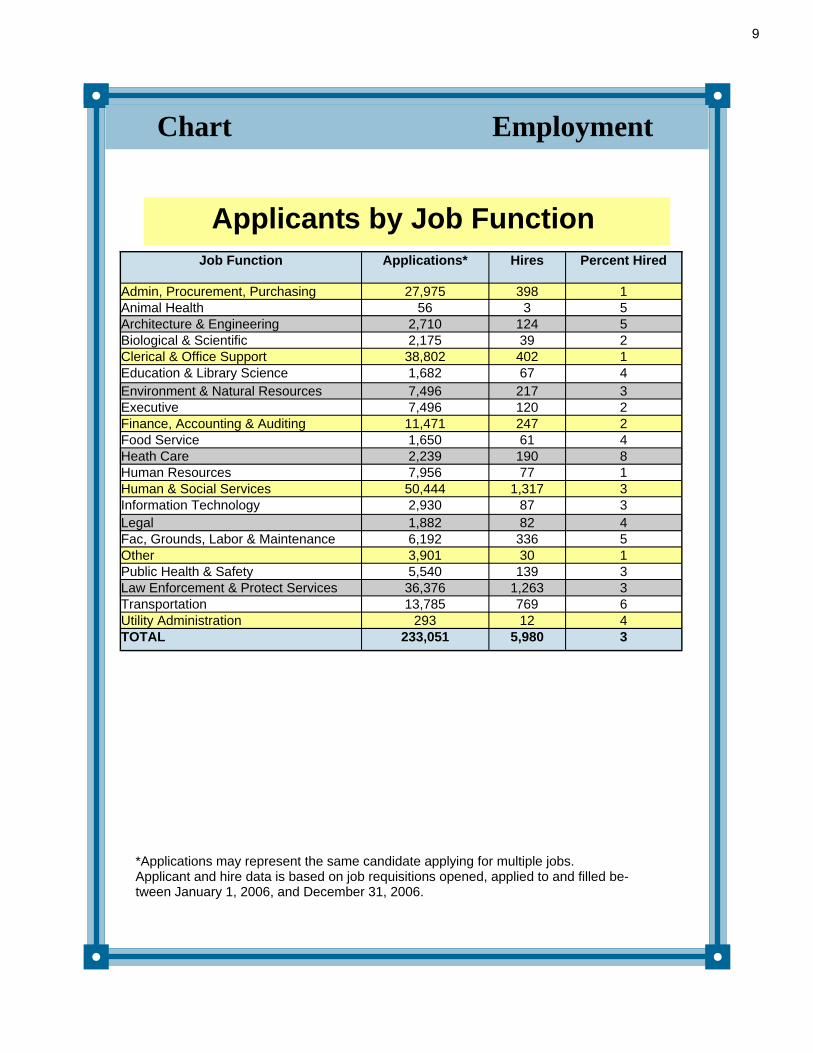
Job Function Applications* Hires Percent Hired
Admin, Procurement, Purchasing 27,975 398 1 Animal Health 56 3 5 Architecture & Engineering 2,710 124 5 Biological & Scientific 2,175 39 2 Clerical & Office Support 38,802 402 1 Education & Library Science 1,682 67 4 Environment & Natural Resources 7,496 217 3 Executive 7,496 120 2 Finance, Accounting & Auditing 11,471 247 2 Food Service 1,650 61 4 Heath Care 2,239 190 8 Human Resources 7,956 77 1 Human & Social Services 50,444 1,317 3 Information Technology 2,930 87 3 Legal 1,882 82 4 Fac, Grounds, Labor & Maintenance 6,192 336 5 Other 3,901 30 1 Public Health & Safety 5,540 139 3 Law Enforcement & Protect Services 36,376 1,263 3 Transportation 13,785 769 6 Utility Administration 293 12 4 TOTAL 233,051 5,980 3
Applicants by Job Function
*Applications may represent the same candidate applying for multiple jobs. Applicant and hire data is based on job requisitions opened, applied to and filled be-tween January 1, 2006, and December 31, 2006.

10
Chart Employment
Applicants by Education
5,1651,094
52,881
7,950
18,139
59,646
12,366
19,676
1,201 2,287 167
52,479
0
10,000
20,000
30,000
40,000
50,000
60,000
70,000
Unr epor ted Less than HSGr ad
HS Gr aduate orEquivalent
Some Col lege TechnicalSchool
2-Year Col legeDegr ee
Bachelor 'sLevel Degr ee
Some Gr aduateSchool
Master 's LevelDegr ee
Doctor ate(Academic)
Doctor ate(Pr of essional )
Post Doctor ate
Data represents applicants who applied for job requisitions opened during the calendar year 2006, which includes applicants who applied for multiple requisitions. Disclosure of applicants highest level of education is based on self reporting.

11
Applicants by Ethnic Group
Asian2.28%
Hispanic / Latino1.69%
Not self identified10.06%
American Indian / Alaska Native
0.50%
Native Hawaiian / Other Pacific
Islander0.07%
Black / African American
21.98%
White63.42%
Data represents applicants who applied for job requisitions opened during the calendar year 2006, which includes applicants who applied for multiple requisitions. Disclosure of ethnicity is based on self reporting and was strictly voluntary.
Chart Employment

12
Applicants by Gender
Unreported 16,821 7%
Male 82,684
35%
Female133,546
58%
Data represents applicants who applied for job requisitions opened during the calendar year 2006, which includes applicants who applied for multiple requisitions. Disclosure of gender is based on self reporting and was strictly voluntary.
Chart Employment

13
Applicants by Age* Range
33,236
38,668
28,87626,895
22,897 23,920
19,284
12,650
4,330
787 111
21,397
0
5000
10000
15000
20000
25000
30000
35000
40000
16 - 24 25 - 29 30 - 34 35 - 39 40 - 44 45 - 49 50 - 54 55 - 59 60 - 64 65 - 69 70 + Unreport ed
Chart Employment
Data represents applicants who applied for job requisitions opened during the calendar year 2006, which includes applicants who applied for multiple requisitions. Disclosure of age is based on self reporting and was strictly voluntary. *Applicant’s age as of December 31, 2006.

14
Table Employment
White Black Hispanic Asian American Indian
Native Hawaiian/Other Pac
Island
Not Specified Total
Adams 113 4 0 0 0 0 51 168 Allen 1,517 905 37 36 8 18 393 2,914 Bartholomew 1,504 200 3 0 0 3 82 1,792 Benton 94 0 5 0 0 0 40 139 Blackford 177 0 0 0 0 0 5 182 Boone 902 140 1 159 6 0 94 1,302 Brown 222 0 0 0 0 0 27 249 Carroll 513 13 0 1 6 0 64 597 Cass 5,321 51 43 7 46 9 447 5,924 Clark 381 75 3 4 20 5 35 523 Clay 1,033 0 0 9 2 0 220 1,264 Clinton 432 0 1 0 0 0 96 529 Crawford 109 0 0 0 0 0 14 123 Daviess 250 0 0 0 0 0 37 287 Dearborn 161 0 7 0 0 0 55 223 Decatur 465 2 0 0 0 0 31 498 DeKalb 231 4 0 0 0 0 28 263 Delaware 2,471 313 11 9 9 0 399 3,212 Dubois 276 0 2 0 0 0 39 317 Elkhart 565 75 6 1 0 0 96 743 Fayette 338 3 3 2 3 0 39 388 Floyd 337 20 1 0 0 0 35 393 Fountain 249 0 1 0 0 0 37 287 Franklin 218 0 42 0 0 0 22 282 Fulton 833 0 7 0 20 0 33 893 Gibson 304 1 0 0 0 0 39 344 Grant 1,398 40 22 0 26 0 88 1,574 Greene 1,180 16 0 4 1 0 145 1,346 Hamilton 3,896 630 48 358 50 0 595 5,577 Hancock 3,210 200 27 32 11 0 493 3,973 Harrison 223 1 0 0 0 0 31 255 Hendricks 6,322 675 159 240 9 0 670 8,075 Henry 2,663 73 16 4 23 0 257 3,036 Howard 2,262 199 58 37 12 0 73 2,641 Huntington 396 0 0 2 0 0 54 452 Jackson 926 29 0 1 0 1 148 1,105 Jasper 344 0 14 0 0 0 26 384 Jay 163 0 0 1 1 0 14 179 Jefferson 1,225 5 24 8 1 0 123 1,386 Jennings 1,386 2 4 0 3 0 159 1,554 Johnson 4,280 83 37 73 13 0 362 4,848 Knox 1,021 13 2 1 1 0 111 1,149 Kosciusko 162 6 14 0 0 0 47 229 LaGrange 147 0 2 0 0 0 10 159 Lake 2,097 5,181 477 27 12 2 766 8,562 La Porte 2,834 571 78 27 16 12 373 3,911 Lawrence 360 12 8 10 0 0 82 472
Applicants by County of Residence & Ethnicity

15
Table Employment
White Black Hispanic Asian American Indian
Native Hawaiian/Other Pac
Island
Not Specified Total
Madison 3,235 811 33 9 20 3 536 4,647 Marion 33,322 31,470 1,298 2,891 310 18 6,901 76,210 Marshall 245 0 2 0 0 0 18 265 Martin 51 0 0 1 0 0 2 54 Miami 2,032 22 59 7 26 0 206 2,352 Monroe 1,788 92 13 58 2 19 489 2,461 Montgomery 1,147 0 0 0 1 0 94 1,242 Morgan 3,431 0 21 2 49 24 175 3,702 Newton 5 0 0 0 0 0 32 37 Noble 14 4 0 0 0 0 32 50 Ohio 10 0 0 0 0 0 4 14 Orange 37 0 2 0 0 0 18 57 Owen 89 0 0 0 0 0 30 119 Parke 151 0 0 0 0 0 83 234 Perry 97 1 0 0 0 0 64 162 Pike 5 0 0 0 0 0 14 19 Porter 652 104 59 0 0 0 225 1,040 Posey 34 0 2 0 0 0 40 76 Pulaski 255 6 9 0 0 0 49 319 Putnam 2,255 9 5 0 20 0 346 2,635 Randolph 241 0 0 0 10 0 37 288 Ripley 311 0 0 3 7 0 61 382 Rush 423 3 0 0 4 0 102 532 Scott 461 0 0 0 6 0 30 497 Shelby 1,266 53 77 0 1 0 88 1,485 Spencer 199 0 0 0 3 0 24 226 Starke 618 1 1 0 0 0 71 691 St. Joseph 1,030 485 17 0 10 3 118 1,663 Steuben 497 0 6 0 3 0 103 609 Sullivan 1,114 0 1 0 6 9 149 1,279 Switzerland 87 0 1 3 0 0 16 107 Tippecanoe 2,556 249 97 211 22 22 632 3,789 Tipton 307 0 1 0 4 0 31 343 Union 88 0 0 0 0 0 6 94 Vanderburgh 2,105 386 14 2 9 1 274 2,791 Vermillion 226 1 0 0 2 0 41 270 Vigo 3,017 432 49 8 2 0 299 3,807 Wabash 353 0 4 0 2 0 30 389 Warren 96 11 0 0 0 0 24 131 Warrick 502 9 7 0 0 0 86 604 Washington 379 0 0 2 0 0 20 401 Wayne 1,747 173 9 13 11 0 313 2,266 Wells 99 0 0 0 7 0 27 133 White 393 2 4 0 0 0 120 519 Whitley 349 0 0 0 0 0 30 379 Not Self Reported 11,628 5,368 543 551 154 3 11,836 30,083 Out of State 5,239 1,678 185 270 115 1 1,410 8,898 139,697 50,912 3,682 5,084 1,105 153 32,421 233,054
Applicants by County of Residence & Ethnicity

16
Demographics
Indiana State Government Workforce
17
Chart Demographics
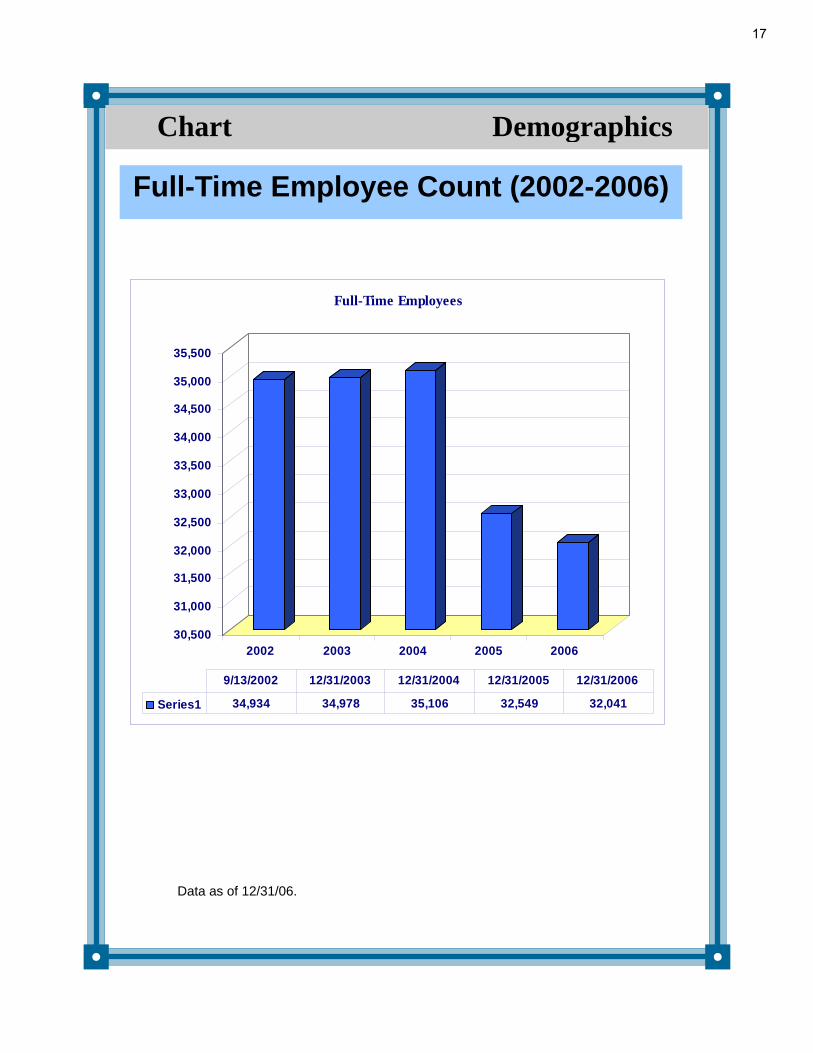
Full-Time Employee Count (2002-2006)
Data as of 12/31/06.
30,500
31,000
31,500
32,000
32,500
33,000
33,500
34,000
34,500
35,000
35,500
2002 2003 2004 2005 2006
Full-Time Employees
Series1 34,934 34,978 35,106 32,549 32,041
9/13/2002 12/31/2003 12/31/2004 12/31/2005 12/31/2006

18
Table Demographics State Employees by Agency
Agency % to Workforce
FT PT Adjutant General's Office 380 3 1.20 Alcohol & Tobacco Commission 111 0 0.35 Appellate Court 87 6 0.29 Attorney General 292 0 0.91 Auditor of State 62 0 0.19 Board of Animal Health 114 0 0.36 Board of Tax Review 20 0 0.06 Budget Agency 30 0 0.09 Bureau of Motor Vehicles 401 1 1.25 Civil Rights Commission 34 0 0.11 Clerk Supreme & Appellate Court 13 0 0.04 Commission on Proprietary Education 10 0 0.03 Commission on Public Records 27 1 0.09 Criminal Justice Institute 34 1 0.11 Dept of Administration 290 1 0.91 Dept of Agriculture 67 0 0.21 Dept of Child Services 2,124 6 6.65 Dept of Correction 7,008 7 21.89 Dept of Education 294 1 0.92 Dept of Financial Institutions 73 0 0.23 Dept of Insurance 82 0 0.26 Dept of Labor 86 1 0.27 Dept of Local Government Finance 61 0 0.19 Dept of Natural Resources 1,380 5 4.32 Dept of Revenue 798 1 2.49 Dept of Veterans Affairs 13 0 0.04 Dept of Workforce Development 869 0 2.71 Division of Family Resource 2,041 6 6.39 Education Employee Relations Board 7 2 0.03 Environmental Adjudication 3 0 0.01 Environmental Management 878 11 2.77 Family & Social Services Administration 3,986 58 12.62 Gov Plan Council for People w/Disabilities 5 0 0.02 Governor's Office 30 2 0.10 Historical Bureau 5 0 0.02 IN Arts Commission 11 0 0.03 IN Dept of Gaming Research 1 0 0.00 IN Dept of Homeland Security 228 0 0.71 IN Dept of Transportation 4,561 0 14.23
# of Employees
Data as of 12/31/06. FT is all full-time employees. PT is all part-time employees.

19
Table Demographics
Agency % to Workforce
FT PT IN Economic Development Corp 80 2 0.26 IN Gaming Commission 149 0 0.47 IN Judicial Center 23 0 0.07 IN Professional Licensing Agency 88 0 0.27 IN School for the Blind & Visually Impaired 170 0 0.53 IN School for the Deaf 284 0 0.89 IN State Department of Health 1,382 10 4.34 IN State Library 54 0 0.17 IN State Police 1,773 0 5.53 IN Tax Court 5 0 0.02 IN Tobacco Prevention & Cessation 12 0 0.04 IN Utility Regulatory Commission 70 0 0.22 Integrated Public Safety Commission 10 0 0.03 Law Enforcement Training Board 64 0 0.20 Lieutenant Governor's Office 73 1 0.23 NW IN Regional Dev Authority 2 0 0.01 Off of Faith-Based & Commission Init 9 0 0.03 Office of Federal Grants & Pro 1 0 0.00 Office of Inspector General 16 0 0.05 Office of Management & Budget 9 0 0.03 Office of Technology 262 0 0.82 Prosecuting Attorney Council 8 0 0.02 Protection Advocacy Services Comm 30 0 0.09 Public Access Counselor 1 0 0.00 Public Defender Council 9 0 0.03 Public Defenders Office 64 0 0.20 Public Employee Retirement Fund 124 0 0.39 Secretary of State 74 2 0.24 State Board of Accounts 277 2 0.87 State Employees Appeals Commission 2 0 0.01 State Personnel Department 104 0 0.32 State Racing Commission 16 0 0.05 State Student Assistance 17 0 0.05 Supreme Court 110 6 0.36 Teachers Retirement Fund 43 0 0.13 Treasurer of State 12 0 0.04 Utility Consumer Counsel 43 0 0.13 War Memorials Commission 20 0 0.06 Workers' Compensation Board 35 1 0.11
# of Employees
State Employees by Agency (Cont.)

20
Table Demographics
State Employees by County of Work Location
COUNTY # OF EMPLOYEES % TOTAL Adams 29 0.09 Allen 857 2.67 Bartholomew 120 0.37 Benton 32 0.10 Blackford 15 0.05 Boone 29 0.09 Brown 59 0.18 Carroll 23 0.07 Cass 940 2.93 Clark 334 1.04 Clay 30 0.09 Clinton 49 0.15 Crawford 26 0.08 Daviess 54 0.17 Dearborn 55 0.17 Decatur 29 0.09 DeKalb 49 0.15 Delaware 202 0.63 Dubois 138 0.43 Elkhart 204 0.64 Fayette 81 0.25 Floyd 102 0.32 Fountain 27 0.08 Franklin 71 0.22 Fulton 25 0.08 Gibson 34 0.11 Grant 104 0.32 Greene 138 0.43 Hamilton 42 0.13 Hancock 346 1.08 Harrison 66 0.21
Northern Indiana
Central Indiana
Southern Indiana
Data as of 12/31/06, based on full-time employees
Hendricks 844 2.63

21
Table Demographics
State Employees by County of Work Location (Cont.)
COUNTY # OF EMPLOYEES % TOTAL Henry 96 0.30 Howard 97 0.30 Huntington 68 0.21 Jackson 394 1.23 Jasper 54 0.17 Jay 72 0.22 Jefferson 630 1.97 Jennings 92 0.29 Johnson 218 0.68 Knox 369 1.15 Kosciusko 79 0.25 Lagrange 44 0.14 Lake 908 2.83 Laporte 1,995 6.23 Lawrence 82 0.26 Madison 1,389 4.34 Marion 11,731 36.61 Marshall 121 0.38 Martin 21 0.07 Miami 654 2.04 Monroe 206 0.64 Montgomery 311 0.97 Morgan 70 0.22 Newton 36 0.11 Noble 77 0.24 Ohio 23 0.07 Orange 47 0.15 Owen 47 0.15 Parke 332 1.04 Perry 323 1.01
Northern Indiana
Central Indiana
Southern Indiana

22
Table Demographics
State Employees By County of Work Location (Cont.)
COUNTY # OF EMPLOYEES % TOTAL Pike 50 0.16 Porter 179 0.56 Posey 37 0.12 Pulaski 98 0.31 Putnam 661 2.06 Randolph 29 0.09 Ripley 89 0.28 Rush 192 0.60 Scott 61 0.19 Shelby 55 0.17 Spencer 44 0.14 St Joseph 634 1.98 Starke 18 0.06 Steuben 135 0.42 Sullivan 674 2.10 Switzerland 17 0.05 Tippecanoe 636 1.98 Tipton 39 0.12 Union 26 0.08 Vanderburgh 820 2.56 Vermillion 22 0.07 Vigo 277 0.86 Wabash 60 0.19 Warren 17 0.05 Warrick 35 0.11 Washington 31 0.10 Wayne 666 2.08 Wells 46 0.14 White 48 0.15 Whitley 35 0.11 Telecommuters 549 1.71 Out of State 20 0.06
Northern Indiana
Central Indiana
Southern Indiana

23
Chart Demographics
State Employees by Job Function
Data as of 12/31/06, based on full-time employees.
Percent to Workforce
Education & Library Science1.62%
Environment & Nat Resources
4.35%
Clerical & Office Support9.51%
Biological & Scientific0.83%
Architecture & Engineering
2.70%
Animal Health0.24%
Admin, Procurement, Purchasing
6.95%
Utility Administration0.31%
Transportation7.67%
Law Enforcement & Protect Srvs
19.85%
Other1.53%
Public Health & Safety2.52%
Information Technology
2.52%
Fac, Grounds, Labor & Maint5.77%
Legal0.91%
Executive4.26%
Finance, Accounting & Auditing5.94%
Food Service0.84%
Health Care2.16%
Human & Socal Services18.71%
Human Resources0.81%

24
Table Demographics
Ethnic
Percentage of Full-Time
State Employees 2006
Estimated Percentage of Indiana's 2005 General
Population
White 84.5 88.6
Black 12.4 8.8
Hispanic 1.0 4.5
Asian 1.2 1.2
American Indian 0.2 0.3
Native Hawaiian/Other Pacific Island
0.0 0.0
Ethnic Distribution Compared To Indiana's General Population
Source: Indiana’s 2005 general population statistics are esti-mates of the U.S. Census, derived from the STATS Indiana IN Depth Profile, www.state.indiana.edu/profiles/pr18000.html
Diversity in the Workforce

25
Chart Demographics
● Indiana’s 2006 esti-mated population shows 14.8 percent for minorities.*
● Data source: IN STATS.
● Indiana’s 2005 General Demograph-ics shows 51 percent for females.
● Data source: U.S. Census Bureau 2000
Data as of 12/31/06, based on full-time employees. * Minorities include Black, Hispanic, Asian, American Indian, and Native Hawaiian/Other Pacific Island. Ethnic figures are based on self-reporting by the employee.
Ethnic/Gender Distribution
Indiana State Government Work force
Female49.61%
Male50.39%
Indiana State Government Work force
Minority15%
Not identified
1%
White84%

26
Table Demographics Ethnicity/Gender by State Agency
AGENCY % Female
% Male
American Indian Asian Black Hispanic
Native Hawai-
ian / Pacific
Islander
White Not Identified
% Minority
Total Employees
Adjutant General's Office 25.00 75.00 1 3 7 0 0 368 1 2.89 380 Alcohol & Tobacco Comm 34.23 65.77 0 3 9 2 0 97 0 12.61 111
Appellate Court 63.22 36.78 0 0 7 0 0 75 5 8.05 87 Attorney General 58.90 41.10 2 5 27 3 0 249 6 12.67 292 Auditor of State 67.74 32.26 0 2 2 0 0 57 1 6.45 62 Board of Animal Health 33.33 66.67 0 3 1 1 0 109 0 4.39 114 Board of Tax Review 60.00 40.00 0 0 2 0 0 18 0 10.00 20 Budget Agency 43.33 56.67 0 3 2 2 0 23 0 23.33 30 Bureau of Motor Vehicles 76.81 23.19 2 7 81 2 0 309 0 22.94 401 Civil Rights Commission 61.76 38.24 0 0 18 2 0 14 0 58.82 34
Clerk Supreme & Appell Ct 69.23 30.77 0 0 4 0 0 9 0 30.77 13
Comm on Proprietary Ed 70.00 30.00 0 0 1 0 0 9 0 10.00 10
Comm on Public Records 59.26 40.74 0 2 2 0 0 23 0 14.81 27 Criminal Justice Inst 61.76 38.24 0 0 7 0 0 26 1 20.59 34 Dept of Administration 44.48 55.52 1 5 63 6 0 215 0 25.86 290 Dept of Agriculture 40.30 59.70 1 0 0 0 0 64 2 1.49 67 Dept of Child Services 83.19 16.81 4 13 409 30 0 1,619 49 21.47 2,124 Dept of Correction 35.69 64.31 20 32 1,105 84 1 5,761 5 17.72 7,008 Dept of Education 76.19 23.81 0 4 32 3 0 253 2 13.27 294 Dept of Financial Institutions 30.14 69.86 0 1 5 0 0 66 1 8.22 73
Dept of Insurance 67.07 32.93 0 2 8 1 0 71 0 13.41 82 Dept of Labor 36.05 63.95 0 3 7 2 0 74 0 13.95 86 Dept of Local Gov Finance 50.82 49.18 0 2 1 0 0 58 0 4.92 61 Dept of Natural Resources 26.38 73.62 4 6 23 2 0 1,341 4 2.54 1,380 Dept of Revenue 67.67 32.33 4 18 109 4 0 661 2 16.92 798 Dept of Veterans Affairs 30.77 69.23 0 0 0 0 0 12 1 0.00 13 Dept of Workforce Develop 64.10 35.90 1 7 133 12 0 716 0 17.61 869
Division of Family Resources 89.61 10.39 1 8 520 48 0 1,462 2 28.27 2,041
Education Employ Relations Board 71.43 28.57 0 0 0 0 0 7 0 0.00 7
Environmental Adjudica-tion 100.00 0.00 0 0 1 0 0 2 0 33.33 3
Environmental Mgmt 43.62 56.38 6 51 60 7 2 751 1 14.35 878
Family & Social Svcs Admin 68.84 31.16 4 36 523 17 1 3404 1 14.58 3,986 Gov Plan Cncl for People w/Disabilities 80.00 20.00 0 1 0 0 0 4 0 20.00 5
Governor's Office 50.00 50.00 0 1 2 0 0 24 3 10.00 30 Historical Bureau 80.00 20.00 0 0 0 0 0 5 0 0.00 5

27
Table Demographics Ethnicity/Gender by State Agency (Cont.)
AGENCY % Female
% Male
American Indian Asian Black Hispanic
Native Hawai-
ian / Pacific
Islander
White Not Identified
% Minority
Total Employees
IN Arts Commission 63.64 36.36 0 2 2 0 0 7 0 36.36 11 IN Dept of Gaming Research 0.00 100.00 0 0 0 0 0 1 0 0.00 1
IN Dept of Homeland Security 33.77 66.23 1 2 17 2 0 205 1 9.65 228
IN Dept of Transportation 21.97 78.03 10 71 191 42 1 4,171 75 6.91 4,561
IN Economic Development Corp 53.75 46.25 0 2 8 3 0 67 0 16.25 80
IN Gaming Commission 26.85 73.15 0 3 20 7 0 119 0 20.13 149 IN Judicial Center 82.61 17.39 0 1 2 0 0 20 0 13.04 23
IN Professional Licensing Agcy 79.55 20.45 0 5 23 0 0 60 0 31.82 88
IN School for the Blind & VI 69.41 30.59 0 1 44 0 0 125 0 26.47 170
IN School for the Deaf 61.62 38.38 0 3 41 3 0 233 4 16.55 284
IN State Department of Health 69.68 30.32 3 41 149 14 1 1,173 1 15.05 1,382
IN State Library 72.22 27.78 1 1 9 0 0 43 0 20.37 54 IN State Police 24.93 75.07 6 6 141 14 0 1,599 7 9.42 1,773 IN Tax Court 80.00 20.00 0 0 3 0 0 2 0 60.00 5 IN Tobacco Prevention & Cessation 75.00 25.00 0 0 3 0 0 9 0 25.00 12
IN Utility Regulatory Comm 48.57 51.43 0 1 8 1 0 60 0 14.29 70 Integrated Public Safety Com-mission 40.00 60.00 0 0 1 0 0 8 1 10.00 10
Law Enforcement Training Board 37.50 62.50 0 0 2 0 0 62 0 3.13 64
Lieutenant Governor's Office 64.38 35.62 0 0 5 0 0 67 1 6.85 73 NW IN Regional Dev Author-ity 50.00 50.00 0 0 0 0 0 1 1 0.00 2
Off of Faith-Based & Commis-sion Init 55.56 44.44 0 0 2 0 0 7 0 22.22 9
Office of Federal Grants & Pro 0.00 100.00 0 0 0 0 0 1 0 0.00 1
Office of Inspector General 56.25 43.75 0 0 0 0 0 16 0 0.00 16 Office of Management & Budget 11.11 88.89 0 0 0 0 0 9 0 0.00 9
Office of Technology 31.30 68.70 0 16 16 0 0 230 0 12.21 262 Prosecuting Attorney Cncl 75.00 25.00 0 0 0 0 0 8 0 0.00 8 Protection Advocacy Svcs Commission 70.00 30.00 0 0 3 0 0 27 0 10.00 30
Public Access Counselor 100.00 0.00 0 0 0 0 0 1 0 0.00 1 Public Defender Council 55.56 44.44 0 0 2 0 0 7 0 22.22 9 Public Defenders Office 59.38 40.63 0 2 8 0 0 54 0 15.63 64 Public Employee Retirement Fund 66.94 33.06 0 1 26 1 0 96 0 22.58 124
Secretary of State 62.16 37.84 0 0 1 0 0 36 37 1.35 74 State Board of Accounts 56.32 43.68 0 2 15 2 0 258 0 6.86 277 State Employees Appeals Com-mission 0.00 100.00 0 0 0 0 0 2 0 0.00 2

28
Table Demographics
Ethnicity/Gender by State Agency (Cont.)
AGENCY % Female
% Male
American Indian Asian Black Hispanic
Native Hawai-
ian / Pacific
Islander
White Not Identified
%Minority
Total Em-ployees
State Personnel Department 68.27 31.73 0 1 17 1 0 85 0 18.27 104
State Racing Commission 68.75 31.25 0 0 1 0 0 15 0 6.25 16
State Student Assistance 70.59 29.41 0 1 6 0 0 10 0 41.18 17 Supreme Court 63.64 36.36 0 2 13 0 1 91 3 14.55 110 Teachers Retirement Fund 48.84 0.51 0 3 11 1 0 28 0 34.88 43
Treasurer of State 66.67 33.33 0 0 1 0 0 11 0 8.33 12 Utility Consumer Counsel 27.91 60.47 0 1 2 0 0 40 0 6.98 43
War Memorials Commission 15.00 85.00 0 0 4 0 0 16 0 20.00 20
Workers' Comp Board 77.14 22.86 0 2 8 0 0 25 0 28.57 35 Total 49.61 50.39 72 388 3,976 319 7 27,061 218 14.86 32,041
Data as of 12/31/06, based on full-time employees. Ethnicity figures are based on self-reporting by employees.

29
Chart Demographics
Ethnicity / Gender by Job Function
Data is as of 12/31/06, based on full-time employees with an employee status of active or suspended. Gender and ethnic figures are based on self-reporting by employees.
1480
18
151
113
2732
287
352
588
1340
209
578
217
4441
295
170
303
321
360
1584
320
38
748
59
715
153
316
232
1041
778
562
60
113
41
1555
511
122
1546
168
449
4776
2138
61
0 % 2 0 % 4 0 % 6 0 % 8 0 % 10 0 %
Female Male
Utility Administration
Transportation
Public Health & Safety
Other
Legal
Law Enforcement & Protect Svcs
Information Technology Human Resources Human & Social Services
Health Care
Food Service
Finance, Accounting & Auditing
Fac, Grounds, Labor & Maint
Executive
Environment & Nat Resources
Education & Library Science
Clerical & Office Support
Biological & Scientific
Architecture & Engineering
Animal Health
Admin, Procurement, Purchasing 358
45
687
247
46
44
1239
133
59
64
8
1853
74
812
221
2330
489
1307
1245
1646
223
628
213
4706
665
254
1685
418
737
5213
2251
91
3
50
28
78
120
62
169
29
153
1140
0% 20% 40% 60% 80% 100%
Minor it y Whit e

30
Table Demographics Average Age/Years of Service by Agency
Agency Age 50
or Older
Percentage of Workforce
Age 50 or Older
Average Age
Average Years
of Service
Adjutant General's Office 188 49.47 48 12
Alcohol & Tobacco Commission 28 25.23 39 10
Appellate Court 33 37.93 44 9
Attorney General 77 26.37 41 5
Auditor of State 24 38.71 47 10
Board of Animal Health 62 54.39 50 15
Bureau of Motor Vehicles 179 44.64 46 10
Dept of Administration 127 43.79 47 12
Dept of Child Services 724 34.09 43 10
Dept of Correction 2610 37.24 44 9
Dept of Education 148 50.34 47 12
Dept of Financial Institutions 31 42.47 45 16
Dept of Insurance 30 36.59 44 9
Dept of Labor 42 48.84 48 11
Dept of Local Gov Finance 25 40.98 46 13
Dept of Natural Resources 589 42.68 46 14
Dept of Revenue 388 48.62 48 14
Dept of Workforce Development 529 60.87 50 16
Division of Family Resources 934 45.76 46 13
Environmental Adjudication 0 0.00 47 7
Environmental Management 350 39.86 46 13

31
Table Demographics Average Age/Years of Service by Agency (Cont.)
Agency Age 50 or Older
Percentage of Workforce
Age 50 or Older
Average Age
Average Years
of Service
Family & Social Services Admin 1,945 48.80 56 18
Gov Plan Council for People w/Disab 4 80.00 54 20
IN Dept of Homeland Security 143 62.72 52 11
IN Dept of Transportation 2,022 44.33 47 13
IN Economic Development Corp 19 23.75 42 4
IN Gaming Commission 37 24.83 39 7
IN Professional Licensing Agcy 30 34.09 43 10
IN School for the Blind & VI 92 54.12 49 13
IN School for the Deaf 109 59.24 45 12
IN State Department of Health 719 52.03 57 14
IN State Library 27 50.00 48 15
IN State Police 445 25.10 42 14
IN Utility Regulatory Commission 20 28.57 44 10
Law Enforcement Training Board 38 59.38 51 12
Lieutenant Governor's Office 16 21.92 37 4
Office of Technology 80 30.53 44 10
Public Defenders Office 24 37.50 45 13
Public Employee Retirement Fund 39 31.45 44 6
Secretary of State 16 21.62 37 5
State Board of Accounts 108 38.99 45 17
State Personnel Department 39 37.50 44 10
Supreme Court 45 40.91 46 11
Data is based on agencies with an employee count of 50 or more.

32
Chart Demographics
Gender by Age Groups
71.74%
52.87%
48.35%
51.43%
50.69%
48.74%
49.62%
49.41%
52.38%
50.76%
51.75%
53.11%
64.44%
28.26%
47.13%
51.65%
48.57%
49.31%
51.26%
50.38%
50.59%
47.62%
49.24%
48.25%
46.89%
35.56%
30.00%70.00%
0% 10% 20% 30% 40% 50% 60% 70% 80% 90% 100%
Less than 20
20-24
25-29
30-34
35-39
40-44
45-49
50-54
55-59
60-64
65-69
70-74
75-79
80 plus
Male Female

33
Table Demographics
Average Age Groups by Job Function
Job Function Less than 20
20-29 30-39 40-49 50-59 60-69 70-79 Over 80
Average Age
Admin, Procurement, Purch - 233 361 596 783 239 14 2 47
Animal Health - 2 7 25 34 8 1 - 50
Architecture & Engineering 2 68 112 246 330 99 9 - 48
Biological & Scientific - 55 75 52 65 18 - 1 42
Clerical & Office Support 9 268 420 770 1,011 513 52 5 48
Education & Library Science - 31 76 137 214 57 4 - 49
Environ & Nat Resources - 165 321 369 451 82 3 2 44
Executive - 91 266 346 509 142 10 2 47
Finance, Accounting & Audit 1 170 284 555 664 206 20 2 47
Food Service - 12 36 82 103 33 3 - 48
Health Care 4 56 94 157 267 100 11 2 49
Human Resources - 24 45 67 101 20 1 - 46
Human & Social Services 7 784 1,262 1,532 1,919 471 21 - 45
Information Technology - 51 185 267 227 72 4 - 46
Legal - 49 89 67 69 15 3 - 42
Fac, Grounds, Labor & Maint 2 97 187 609 709 224 20 1 49
Other - 86 110 118 134 39 2 - 43
Public Health & Safety 1 71 108 230 271 113 13 2 48
Law Enforce & Protect Svcs 6 1,048 1,835 1,680 1,430 349 11 1 42
Transportation 14 259 400 776 757 232 20 - 46
Utility Administration - 7 16 42 27 7 - - 46
Total 46 3,627 6,289 8,723 10,075 3,039 222 20 46
Percent Total 0.14 11.32 19.63 27.22 31.44 9.48 0.69 0.06

34
Table Demographics
Average Age/Years of Service by Job Function Agency Number 50
or Older Percent of Workforce
Age 50 or Older Average
Age Average Years
of Service Adjutant General's Office 188 49.47 48 12
Alcohol & Tobacco Commission 28 25.23 39 10
Appellate Court 33 37.93 44 9
Attorney General 77 26.37 41 5
Auditor of State 24 38.71 47 10
Board of Animal Health 62 54.39 50 15
Bureau of Motor Vehicles 179 44.64 46 10
Dept of Administration 127 43.79 47 12
Dept of Child Services 724 34.09 43 10
Dept of Correction 2,610 37.24 44 9
Dept of Education 148 50.34 47 12
Dept of Financial Institutions 31 42.47 45 16
Dept of Insurance 30 36.59 44 9
Dept of Labor 42 48.84 48 11
Dept of Local Gov Finance 25 40.98 46 13
Dept of Natural Resources 589 42.68 46 14
Dept of Revenue 388 48.62 48 14
Dept of Workforce Development 529 60.87 50 16
Division of Family Resources 934 45.76 46 13
Environmental Adjudication 0 0.00 47 7
Environmental Management 350 39.86 46 13
Data based on employee count of 32,041 as of 12/31/06, for full-time employees and agencies with 50 or more employees.

35
Table Demographics
Average Age/Years of Service by Job Function (Cont.)
Agency Number 50 or Older
Percent of Workforce age 50 or Older
Average Age
Average Years of Service
Family & Social Services Admin 1,945 48.80 56 18 Gov Plan Council for People w/Disab 4 80.00 54 20 IN Dept of Homeland Security 143 62.72 52 11 IN Dept of Transportation 2,022 44.33 47 13
IN Economic Development Corp 19 23.75 42 4 IN Gaming Commission 37 24.83 39 7
IN Professional Licensing Agcy 30 34.09 43 10 IN School for the Blind & VI 92 54.12 49 13 IN School for the Deaf 109 59.24 45 12 IN State Department of Health 719 52.03 57 14 IN State Library 27 50.00 48 15 IN State Police 445 25.10 42 14 IN Utility Regulatory Commission 20 28.57 44 10
Law Enforcement Training Board 38 59.38 51 12 Lieutenant Governor's Office 16 21.92 37 4 Office of Technology 80 30.53 44 10 Public Defenders Office 24 37.50 45 13 Public Employee Retirement Fund 39 31.45 44 6 Secretary of State 16 21.62 37 5 State Board of Accounts 108 38.99 45 17
State Personnel Department 39 37.50 44 10
Supreme Court 45 40.91 46 11
Data based on employee count of 32,041 as of 12/31/06, for full-time employees and agencies with 50 or more employees.
36
Table Demographics
1315
1812
12
1314
12
14
11
10
13
12
128
13
8
11
9
119
0 2 4 6 8 10 12 14 16 18 20
Years of Service
Admin, Procure, Purch
Architecture & Engrg
Clerical & Office Suppt
Env & Natural Resources
Finance, Acctng & Audit
Health Care
Health & Social Svcs
Legal
Other
Law Enforce & Pro Svcs
Utility Administration
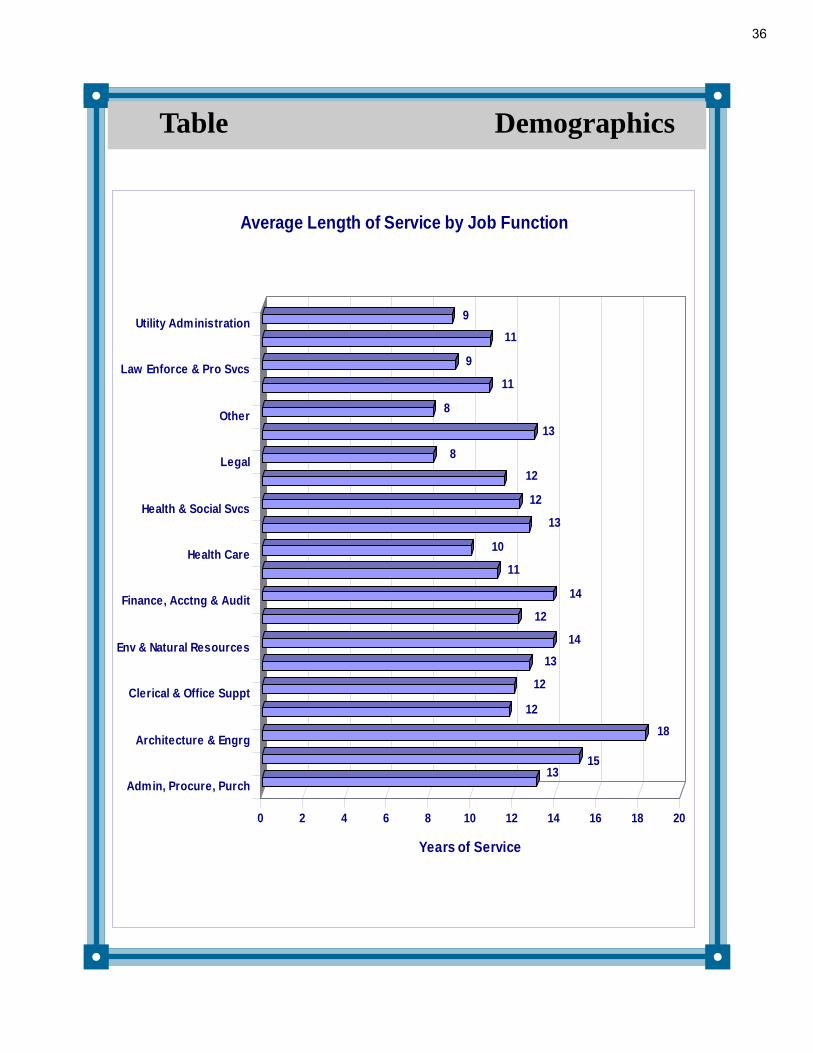
Average Length of Service by Job Function

37
Table Demographics
Job Function Less than 3 3 to 5 6 to 8 9 to 10 11
to 15 16
to 20 21
to 25 26
to 30
More than 30
Admin, Procurement, Purch 1.43 0.87 0.62 0.34 1.02 0.87 0.61 0.65 0.53
Animal Health 0.03 0.02 0.02 0.02 0.02 0.05 0.03 0.02 0.02
Architecture & Engineering 0.23 0.28 0.19 0.12 0.39 0.32 0.31 0.32 0.54
Biological & Scientific 0.23 0.13 0.07 0.03 0.07 0.08 0.08 0.07 0.06
Clerical & Office Support 1.80 1.23 1.18 0.67 1.53 1.19 0.71 0.72 0.49
Education & Library Science 0.21 0.27 0.21 0.11 0.22 0.20 0.18 0.14 0.07
Environ & Nat Resources 0.73 0.41 0.40 0.17 0.79 0.60 0.52 0.41 0.32
Executive 1.29 0.46 0.32 0.17 0.50 0.41 0.34 0.35 0.43
Finance, Acctng & Audit 0.90 0.66 0.59 0.33 0.96 0.91 0.65 0.57 0.39
Food Service 0.17 0.12 0.07 0.08 0.14 0.11 0.08 0.05 0.02
Health Care 0.73 0.23 0.20 0.09 0.29 0.27 0.18 0.10 0.07
Human Resources 0.17 0.08 0.07 0.04 0.14 0.12 0.07 0.07 0.04
Human & Social Services 4.14 2.38 1.78 0.99 2.79 2.30 1.69 1.37 1.28
Information Technology 0.58 0.39 0.27 0.16 0.30 0.26 0.26 0.16 0.15
Legal 0.36 0.09 0.10 0.04 0.13 0.07 0.05 0.04 0.02
Fac, Grounds, Labor & Mant 1.07 0.70 0.56 0.33 0.84 0.75 0.69 0.55 0.28
Other 0.57 0.30 0.15 0.07 0.12 0.10 0.07 0.10 0.04
Public Health & Safety 0.54 0.38 0.27 0.16 0.41 0.37 0.20 0.11 0.09
Law Enforce & Protect Svcs 5.11 3.37 2.61 1.37 2.99 2.09 1.02 0.88 0.42
Transportation 2.29 0.99 0.84 0.42 0.74 0.67 0.64 0.64 0.43
Utility Administration 0.07 0.05 0.06 0.01 0.05 0.04 0.02 0.01 0.01
Percent Total 22.67 13.40 10.60 5.73 14.43 11.76 8.39 7.31 5.71
Years of Service Percentages by Job Function

38
Table Demographics
Job Function Less than 3 3 to 5 6 to 8 9 to 10 11 to 15 16 to 20 21 to 25 26 to 30 More
than 30
Admin, Procurement, Purch 459 279 200 110 326 280 194 209 171
Animal Health 10 7 8 6 7 15 11 7 6
Architecture & Engineering 74 90 61 40 126 104 98 101 172
Biological & Scientific 73 43 24 11 22 26 25 22 20
Clerical & Office Support 577 393 377 215 490 380 228 231 157
Education & Library Science 68 87 67 36 71 64 59 44 23
Environ & Nat Resources 235 130 129 53 253 192 167 130 102
Executive 412 148 103 55 159 131 108 111 139
Finance, Acctng & Audit 287 210 188 105 307 291 207 181 125
Food Service 55 37 22 25 44 36 27 16 7
Health Care 234 73 65 28 93 86 57 31 24 Human Resources 53 26 23 14 46 37 22 24 13
Human & Social Services 1326 763 570 317 894 735 540 439 410
Information Technology 187 124 85 52 96 82 82 51 47
Legal 116 30 33 13 43 21 16 13 7
Fac, Grounds, Labor & Mant 342 223 178 107 268 241 222 177 90
Other 184 96 48 21 39 32 23 32 13
Public Health & Safety 174 121 88 50 130 118 64 34 28
Law Enforce & Protect Svcs 1636 1078 835 439 956 668 328 282 133
Transportation 733 318 270 136 237 213 204 205 139
Utility Administration 24 15 20 2 15 13 6 2 2
Total 7259 4291 3394 1835 4622 3765 2688 2342 1828
Percent Totals 22.67 13.40 10.60 5.73 14.43 11.76 8.39 7.31 5.71
Years of Service Groups by Job Function
39
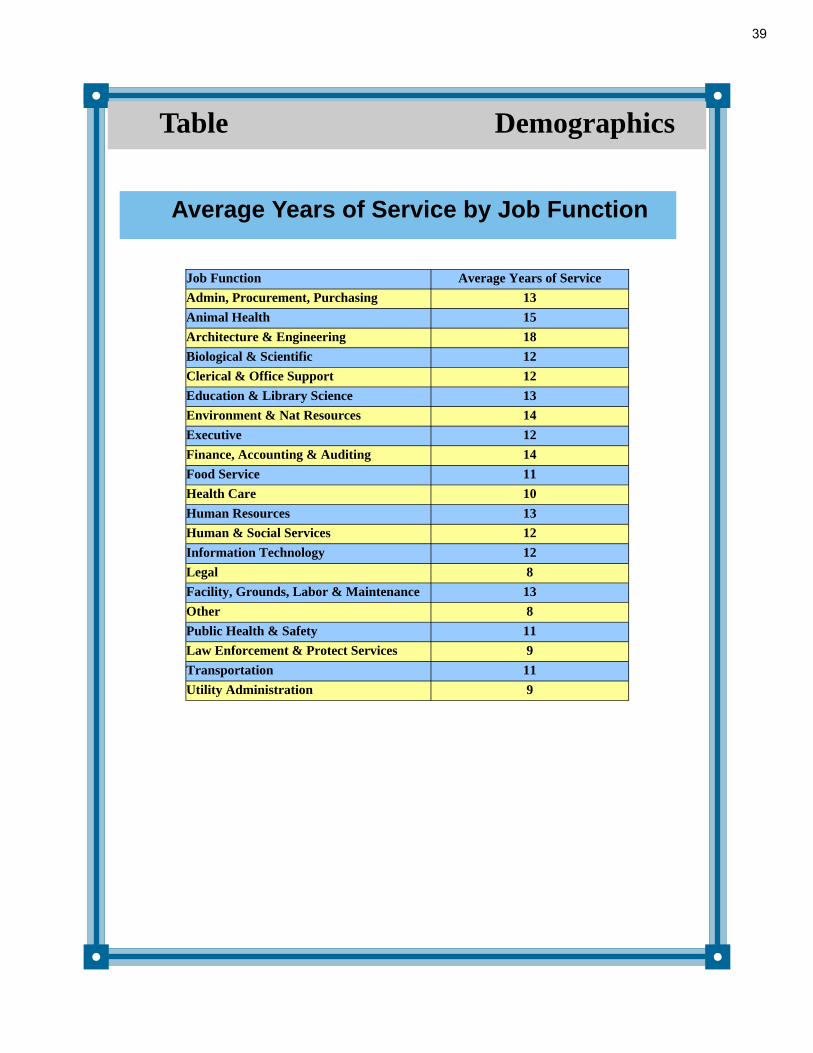
Table Demographics
Average Years of Service by Job Function
Job Function Average Years of Service Admin, Procurement, Purchasing 13 Animal Health 15 Architecture & Engineering 18 Biological & Scientific 12 Clerical & Office Support 12 Education & Library Science 13 Environment & Nat Resources 14 Executive 12 Finance, Accounting & Auditing 14 Food Service 11 Health Care 10 Human Resources 13 Human & Social Services 12 Information Technology 12 Legal 8 Facility, Grounds, Labor & Maintenance 13 Other 8 Public Health & Safety 11 Law Enforcement & Protect Services 9 Transportation 11 Utility Administration 9

40
Chart Demographics
11,550
5,2294,622
3,765
2,688 2,342
1,379
355 75 16 30
2000
4000
6000
8000
10000
12000
0-5 6 to 10 11 to 15 16 to 20 21 to 25 26 to 30 31 to 35 36 to 40 41 to 45 46 to 50 51 plus
Distribution of Employees by Years of Service
1,573
2,6153,052
3,427
4,120
4,8985,292
4,515
1,886
468195
0
1000
2000
3000
4000
5000
6000
18-25 26-30 31-35 36-40 41-45 46-50 51-55 56-60 61-65 66-70 71 plus
Distribution of Employees by Age

41
Salary
Compensation

42
Average Annual Salary Trends
Chart Salary
$27,295.78
$28,417.26
$29,417.46
$30,522.54
$31,784.00 $31,860.45$31,911.96
$33,101.93
$34,265.07
$35,551.39
$37,232.18$38,144.62
$40,243.09
$30,132.12
$31,194.45
$32,370.35
$33,810.65$34,300.57
$36,053.23
$33,158.17
$28,991.84
$ 2 0 , 0 0 0 . 0 0
$ 2 2 , 0 0 0 . 0 0
$ 2 4 , 0 0 0 . 0 0
$ 2 6 , 0 0 0 . 0 0
$ 2 8 , 0 0 0 . 0 0
$ 3 0 , 0 0 0 . 0 0
$ 3 2 , 0 0 0 . 0 0
$ 3 4 , 0 0 0 . 0 0
$ 3 6 , 0 0 0 . 0 0
$ 3 8 , 0 0 0 . 0 0
$ 4 0 , 0 0 0 . 0 0
$ 4 2 , 0 0 0 . 0 0
2000 2001 2002 2003 2004 2005 2006
Classified
Unclassified
Total
Data as of December 31, 2006, based on full-time employees.
● State government employees median annual wage for 2006 was $32,285.76.

43
Chart Salary
Average Salaries by Age Group
Data as of 12/31/06, based on full-time employees.
$20,
981.
32
$26,
730.
28
$31,
449.
47
$34,
325.
99
$35,
447.
17
$35,
465.
33
$36,
858.
34
$37,
646.
17
$38,
954.
02
$37,
808.
29
$37,
136.
73
$37,
370.
35
$41,
260.
90
$0$2,000$4,000$6,000$8,000
$10,000$12,000$14,000$16,000$18,000$20,000$22,000$24,000$26,000$28,000$30,000$32,000$34,000$36,000$38,000$40,000$42,000
18-19 20-24 25-29 30-34 35-39 40-44 45-49 50-54 55-59 60-64 65-69 70-74 75 +
Age Groups

44
Chart Salary
$40,
956
$50,
113
$44,
731
$45,
345
$46,
088
$42,
337
$40,
903
$38,
311
$37,
386
$33,
522
$31,
491
$33,
236
$30,
658
$0
$5,000
$10,000
$15,000
$20,000
$25,000
$30,000
$35,000
$40,000
$45,000
$50,000
$55,000
Lessthan ayear
1 to 2 3 to 4 5 to 9 10 to15
16 to20
21 to25
26 to30
31 to35
36 to40
41 to45
46 to49
52 to59
Years of Service Groups
Data as of 12/31/06, based on full-time employees.
Average Salary by Years of Service Group
45
Workforce Mobility
Workforce Mobility

46
Table Workforce Mobility
Separations from State Government by Job Function
Data based on separations involving full-time employees for the calendar year 2006.
Voluntary Involuntary
Job Function Retired Resigned Discharged Death Lay-off % Turnover Workforce
Admin, Procurement, Purch 46 184 46 8 10 13 2,228
Architecture & Engineering 22 41 6 2 3 9 866
Animal Health 0 4 0 1 0 6 77
Biological & Scientific 2 11 1 1 1 6 266
Clerical & Office Support 69 270 110 20 50 17 3,048
Education & Library Science 20 46 6 1 13 17 519
Environment & Nat Resources 13 89 9 2 0 8 1,393
Executive 29 102 26 2 1 12 1,366
Finance, Accounting & Audit 47 128 33 10 13 12 1,902
Food Service 7 27 25 3 62 46 269
Health Care 15 160 45 5 29 37 691
Human Resources 6 17 10 1 4 15 258
Human & Social Services 129 528 148 19 567 23 5,996
Information Technology 14 53 12 2 24 13 806
Legal 1 52 0 2 0 19 292
Fac, Grounds, Labor & Mant 46 167 65 13 96 21 1,849
Other 4 22 5 0 2 7 489
Public Health & Safety 16 89 11 1 2 15 809 Law Enforcement & Protect Svcs 101 728 349 20 12 19 6,360
Transportation 44 347 75 11 16 20 2,458
Utility Administration 0 9 1 0 0 10 99
Total of Workforce 631 3,074 983 124 905 18 32,041

47
Turnover by State Agency
Agency Retired Resigned Discharged Death Lay-off Total % Turnover
Adjutant General's Office 1 41 16 2 0 60 16
Alcohol & Tobacco Commission 6 6 2 0 0 14 13
Appellate Court 0 13 0 2 0 15 17
Attorney General 0 37 9 0 0 46 16
Auditor of State 3 4 2 0 0 9 15
Board of Animal Health 0 8 0 1 0 9 8
Board of Tax Review 0 2 0 0 0 2 10
Budget Agency 0 2 0 0 0 2 7
Bureau of Motor Vehicles 7 47 37 0 0 91 23
Civil Rights Commission 1 3 0 0 1 5 15
Clerk Supreme & Appellate Ct 0 3 0 0 0 3 23
Commission on Public Records 0 3 3 0 0 6 22
Criminal Justice Inst 0 5 5 0 0 10 29
Dept of Administration 8 26 14 3 0 51 18
Dept of Agriculture 2 1 4 0 0 7 10
Dept of Child Services 23 114 34 3 0 174 8
Dept of Correction 133 909 385 30 14 1,471 21
Dept of Education 4 32 1 0 0 37 13
Dept of Financial Institutions 2 1 0 0 0 3 4
Dept of Insurance 0 8 4 0 1 13 16
Dept of Labor 4 7 0 0 0 11 13
Dept of Local Gov Finance 0 2 0 1 0 3 5
Dept of Natural Resources 20 85 12 4 0 121 9
Dept of Revenue 30 62 22 3 5 122 15
Dept of Veterans Affairs 1 3 0 0 0 4 31
Dept of Workforce Development 35 76 24 4 6 145 17
Environmental Management 7 65 7 2 0 81 9
Family & Social Services Admin* 149 578 156 35 739 1,657 27
Governor's Office 0 9 0 0 0 9 30
Historical Bureau 0 2 0 0 1 3 60
IN Arts Commission 1 0 0 0 0 1 9
IN Dept of Homeland Security 5 17 6 0 0 28 12
IN Dept of Transportation 101 493 92 17 20 723 16
Table Workforce Mobility
*Data for Family & Social Services Administration includes the Division of Family Resources.

48
Table Workforce Mobility
Agency Retired Resigned Discharged Death Lay-off Total *%Turnover
IN Economic Development Corp 0 12 2 0 0 14 18 IN Gaming Commission 1 6 7 0 0 14 9 IN Professional Licensing Agcy 1 8 5 0 0 14 16 IN School for the Blind & VI 4 9 6 0 0 19 11 IN School for the Deaf 4 14 10 0 0 28 10 IN State Department of Health 18 169 58 6 118 369 30 IN State Library 1 4 2 0 1 8 15 IN State Police 45 62 17 4 0 128 7 IN Tobacco Prevention & Cessation 0 1 0 0 0 1 8 IN Utility Regulatory Commission 0 5 2 0 0 7 10 Law Enforcement Training Board 0 2 1 1 0 4 6 Lieutenant Governor's Office 0 3 13 0 2 18 25 Office of Faith-Based & Comm Initiative 0 1 0 0 0 1 11 Office of Inspector General 0 2 0 0 0 2 13 Office of Technology 3 12 2 1 0 18 7 Prosecuting Attorney Council 0 1 0 0 0 1 13 Protection Advocacy Services Comm 0 1 1 0 0 2 7 Public Access Counselor 0 1 1 0 0 2 200 Public Defender Council 0 1 0 0 0 1 11 Public Defenders Office 0 2 0 0 0 2 3 Public Employee Retirement Fund 1 15 12 1 0 29 23 Secretary of State 0 10 4 0 0 14 19 Soldiers & Sailors Children's Home 3 10 4 2 0 19 11 State Board of Accounts 1 14 0 0 0 15 5 State Personnel Department 0 6 1 0 0 7 7 State Racing Commission 0 1 3 0 0 4 25 State Student Assistance 0 0 2 0 0 2 12 Supreme Court 0 11 0 0 0 11 10 Teachers Retirement Fund 0 5 5 0 0 10 23 Treasurer of State 1 2 0 0 0 3 25 Utility Consumer Counsel 0 5 1 0 0 6 14 War Memorials Commission 1 3 0 0 0 4 20 Workers' Comp Board 0 4 0 0 0 4 11
Turnover by State Agency (Cont.)
*Turnover equals separations divided by agency workforce totals. Separations include retired, resigned, discharged, death and/or lay-off. Data based on separations involving full-time employees for the calendar year 2006.

49
Chart Workforce Mobility Employees Currently Eligible to Retire
**Full Pension Benefits eligibility: At age 65 with 10 or more years of creditable service. At age 60 with 15 or more years of creditable service. At least age 55 plus the employee’s years of service is at least 85 (known as the “Rule of 85”). Data based on full-time employees as of 12/31/2006.
*Early retirement formula with reduced benefits: At age 50 through 59 with 15 or more years of creditable service.
Eligible to Retire w/Reduced Benefits Age* # Employees Eligible % of Workforce
50 514 1.60 51 604 1.89 52 579 1.81 53 568 1.77 54 640 2.00 55 384 1.20 56 373 1.16 57 318 0.99 58 302 0.94 59 242 0.76
Total 4,524 14.12
Eligible to Retire w/Full Benefits** Age # Employees Eligible % of Workforce 55 189 0.59 56 215 0.67 57 253 0.79 58 234 0.73 59 256 0.80
60+ 392 1.22 61+ 287 0.90 62+ 202 0.63 63+ 200 0.62 64+ 209 0.65 65+ 899 2.81
Total 3,336 10.41
50
Table Workforce Mobility
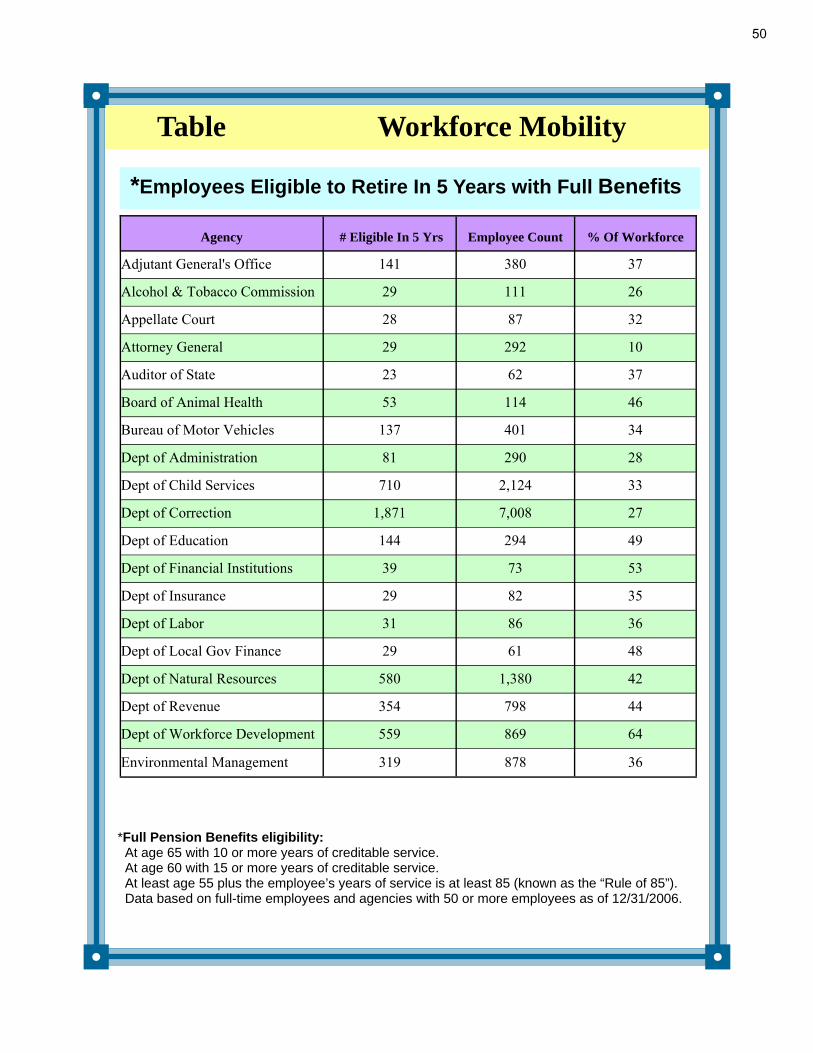
*Employees Eligible to Retire In 5 Years with Full Benefits
*Full Pension Benefits eligibility: At age 65 with 10 or more years of creditable service. At age 60 with 15 or more years of creditable service. At least age 55 plus the employee’s years of service is at least 85 (known as the “Rule of 85”). Data based on full-time employees and agencies with 50 or more employees as of 12/31/2006.
Agency # Eligible In 5 Yrs Employee Count % Of Workforce
Adjutant General's Office 141 380 37
Alcohol & Tobacco Commission 29 111 26
Appellate Court 28 87 32
Attorney General 29 292 10
Auditor of State 23 62 37
Board of Animal Health 53 114 46
Bureau of Motor Vehicles 137 401 34
Dept of Administration 81 290 28
Dept of Child Services 710 2,124 33
Dept of Correction 1,871 7,008 27
Dept of Education 144 294 49
Dept of Financial Institutions 39 73 53
Dept of Insurance 29 82 35
Dept of Labor 31 86 36
Dept of Local Gov Finance 29 61 48
Dept of Natural Resources 580 1,380 42
Dept of Revenue 354 798 44
Dept of Workforce Development 559 869 64
Environmental Management 319 878 36

51
Table Workforce Mobility
*Employees Eligible To Retire In 5 Years w/ Full Benefits (Cont.)
* Full Pension Benefits eligibility: At age 65 with 10 or more years of creditable service. At age 60 with 15 or more years of creditable service. At least age 55 plus the employee’s years of service is at least 85 (known as the “Rule of 85”). Data based on full-time employees and agencies with 50 or more employees as of 12/31/2006. ** FSSA consists of all DFC county offices and state hospitals.
Agency # Eligible In 5 Yrs Employee Count % of Workforce
Family & Social Services Admin** 2,798 6,027 46
IN Dept of Homeland Security 108 228 47
IN Dept of Transportation 1,683 4,561 37
IN Economic Development Corp 7 80 9
IN Gaming Commission 34 149 23
IN Professional Licensing Agcy 25 88 28
IN School for the Blind & VI 85 170 50
IN School for the Deaf 86 284 30
IN State Department of Health 510 1,372 37
IN State Library 35 54 65
IN State Police 454 1,773 26
IN Utility Regulatory Comm. 13 70 19
Law Enforcement Training Board 32 64 50
Lieutenant Governor's Office 16 73 22
Office of Technology 54 262 21
Public Defenders Office 28 64 44
Public Employee Retirement Fund 16 124 13
Secretary of State 7 74 9
State Board of Accounts 128 277 46
State Personnel Department 24 104 23
Supreme Court 43 110 39
52
Table Workforce Mobility
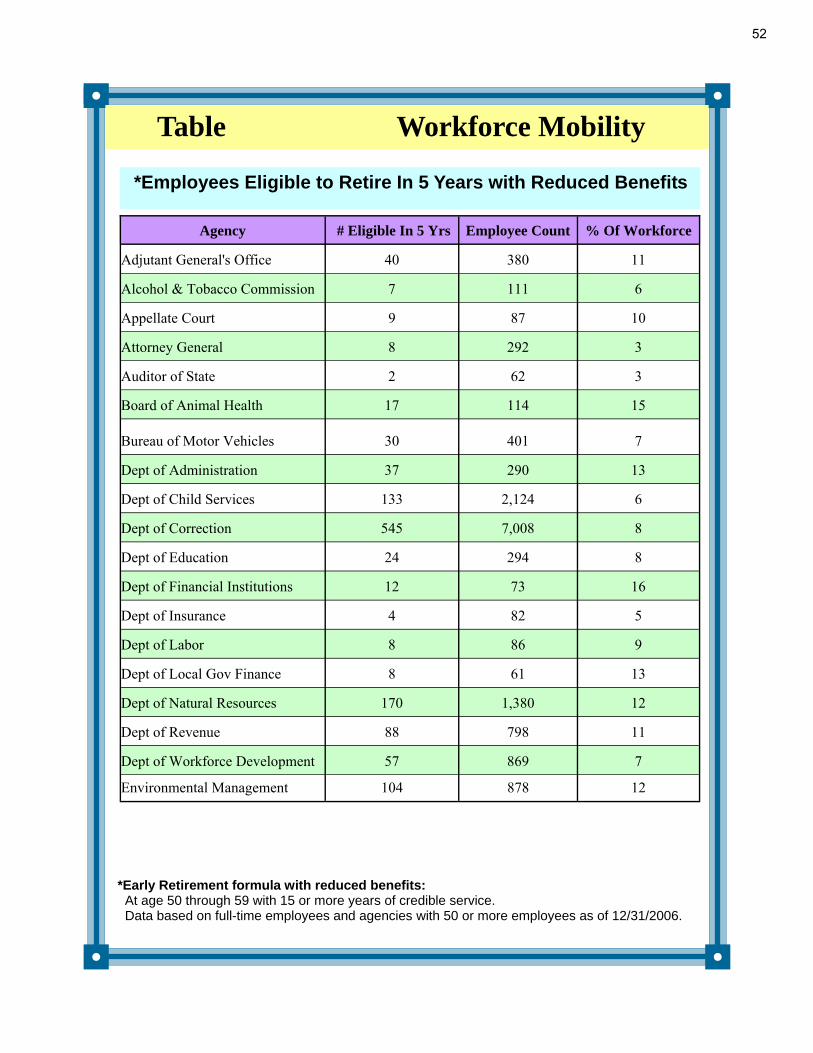
*Employees Eligible to Retire In 5 Years with Reduced Benefits
*Early Retirement formula with reduced benefits: At age 50 through 59 with 15 or more years of credible service. Data based on full-time employees and agencies with 50 or more employees as of 12/31/2006.
Agency # Eligible In 5 Yrs Employee Count % Of Workforce
Adjutant General's Office 40 380 11
Alcohol & Tobacco Commission 7 111 6
Appellate Court 9 87 10
Attorney General 8 292 3
Auditor of State 2 62 3
Board of Animal Health 17 114 15
Bureau of Motor Vehicles 30 401 7
Dept of Administration 37 290 13
Dept of Child Services 133 2,124 6
Dept of Correction 545 7,008 8
Dept of Education 24 294 8
Dept of Financial Institutions 12 73 16
Dept of Insurance 4 82 5
Dept of Labor 8 86 9
Dept of Local Gov Finance 8 61 13
Dept of Natural Resources 170 1,380 12
Dept of Revenue 88 798 11
Dept of Workforce Development 57 869 7
Environmental Management 104 878 12

53
Table Workforce Mobility
*Employees Eligible to Retire In 5 Yrs w/ Reduced Benefits (Cont.)
*Early Retirement formula with reduced benefits: At age 50 through 59 with 15 or more years of credible service. Data based on full-time employees and agencies with 50 or more employees as of 12/31/2006.
Agency # Eligible In 5 Yrs Employee Count % Of Workforce
Family & Social Svcs Admin 586 6,027 10
IN Dept of Homeland Security 18 228 8
IN Dept of Transportation 533 4,561 12
IN Economic Development Corp 2 80 3
IN Gaming Commission 7 149 5
IN Professional Licensing Agcy 4 88 5
IN School for the Blind & VI 19 170 11
IN School for the Deaf 35 284 12
IN State Department of Health 94 1,372 7
IN State Library 4 54 7
IN State Police 231 1,773 13
IN Utility Regulatory Comm 10 70 14 Law Enforcement Training Board 4 64 6
Lieutenant Governor's Office 0 73 0
Office of Technology 27 262 10
Public Defenders Office 9 64 14
Public Empl Retirement Fund 8 124 6
Secretary of State 5 74 7
State Board of Accounts 45 277 16
State Personnel Department 10 104 10
Supreme Court 12 110 11

54
Chart Workforce Mobility Historical Data on Retirement
*Retirement Incentive Program implemented November 1, 2002 - June 14, 2003.
29000
30000
31000
32000
33000
34000
35000
36000
37000
2001 2002* 2003* 2004 2005 2006
Comparison of Workforce to Retirements
Total employees Percent of workforce that actually retired
1.291.44
4.07
0.98
2.011.98
Eligibility vs Actual Retirement
18.521.0 20.0 21.0 21.0
24.5
7.010.0
8.0 8.0 9.0 8.0
05
1015202530
Jan-Oct Jan-Aug Jan-Dec Jan-Dec Jan-Dec Jan-Dec
2001 2002* 2003* 2004 2005 2006
Timeframe
Perc
ent E
ligib
lePe
rcen
t Elig
ible
Who
R
etire
d

55
Chart Workforce Mobility
Retirement Averages
0
20
40
60
80
Retired Yrs Of Svcs
Ind iana St at e Go vernment Emp loyees
M alesFemales
● The average retirement age for males is 60 years of age, with 25 years of service.
● The average retirement age for females is 67 years of age, with 22 years of service.
Average Age of Retirees from State Government Retirement Age Years of Services Job Function Male Female Male Female Admin, Procure, Purchasing 64 63 28 22 Architecture & Engineering 62 N/A 30 N/A Animal Health N/A N/A N/A N/A Biological & Scientific 71 N/A 32 N/A Clerical & Office Support 79 64 19 22 Education & Library Science 61 63 23 25 Environ & Nat Resources 59 57 25 26 Executive 62 58 26 23 Finance, Accounting & Auditing 62 64 28 21 Food Service N/A 64 N/A 26 Health Care 65 63 26 21 Human Resources N/A 61 N/A 25 Human & Social Services 64 62 26 25 Information Technology 61 65 26 19 Legal N/A 65 N/A 30 Facility, Grounds, Labor & Maintenance 63 65 22 19 Other 65 67 24 15 Public Health & Safety 67 64 28 18 Law Enforce & Protect Services 58 63 25 18 Transportation 64 66 23 13 Utility Administration N/A N/A N/A N/A

56
Leave
Vacation, Sick & Personal

57
751,674620,516
44,291
745,455574,552
42,602
721,255539,759
41,331
712,653534,460
42,048
0 100000 200000 300000 400000 500000 600000 700000 800000
Number of days available
2003
2004
2005
2006
Personal
Sick
Vacation
Charts represent total state employees' leave balances for the year ending December 31, 2006. The number of days are based on a 7.5 hour day and is rounded to the nearest day.
Chart Leave Leave Balance Summaries
593,006554,275
290,074 280,023246,800
163,962
90,107 88,257 76,135
322,828
476,846
50,739
0
90000
180000
270000
360000
450000
540000
630000
2003 2004 2005 2006
Num
ber o
f 7.5
hou
r day
s us
ed
Vacation Sick Personal
Leave Used Summaries

58
State Agencies Included in Data Alcohol & Tobacco Commission Indiana Gaming Commission Appellate Court Indiana Judicial Center Attorney General Indiana Professional Licensing Agcy
Auditor of State Indiana Protection and Advocacy Services Commission Board of Animal Health Indiana School for the Blind & VI Board of Tax Review Indiana School for the Deaf Budget Agency Indiana State Department of Health Bureau of Motor Vehicles Indiana State Library Civil Rights Commission Indiana State Police Clerk Supreme & Appellate Court Indiana Tax Court Commission on Proprietary Education Indiana Tobacco Prevention & Cessation Commission on Public Records Indiana Utility Regulatory Commission Criminal Justice Institute Integrated Public Safety Commission Department of Administration Law Enforcement Training Board Department of Agriculture Lieutenant Governor's Office Department of Child Services NW Indiana Regional Development Authority Department of Correction Office of Faith-Based & Community Initiative Department of Education Office of Federal Grants & Pro Department of Financial Institutions Office of Inspector General Department of Insurance Office of Management & Budget Department of Labor Office of Technology Department of Local Government Finance Prosecuting Attorneys Council Department of Natural Resources Public Access Counselor Department of Revenue Public Defender Council Department of Veterans Affairs Public Defenders Office Department of Workforce Development Public Employees Retirement Fund Division of Family Resources Secretary of State Education Employ Relations Board State Board of Accounts Environmental Adjudication State Employees Appeals Commission Environmental Management State Personnel Department Family & Social Services Administration State Racing Commission Governor's Office State Student Assistance Governor's Planning Council for People with Dis-abilities Supreme Court Historical Bureau Teachers Retirement Fund Indiana Arts Commission The Military Department (Adjutant General's Office) Indiana Department of Gaming Research Treasurer of State Indiana Department of Homeland Security Utility Consumer Counsel Indiana Department of Transportation War Memorials Commission Indiana Economic Development Corp Workers' Compensation Board


![Bwauthconcepts JUDI 1204[1]](https://img.pdfslide.us/doc/110x75/55cf97bf550346d033935d9d/bwauthconcepts-judi-12041.jpg)
