Embed Size (px)
Citation preview
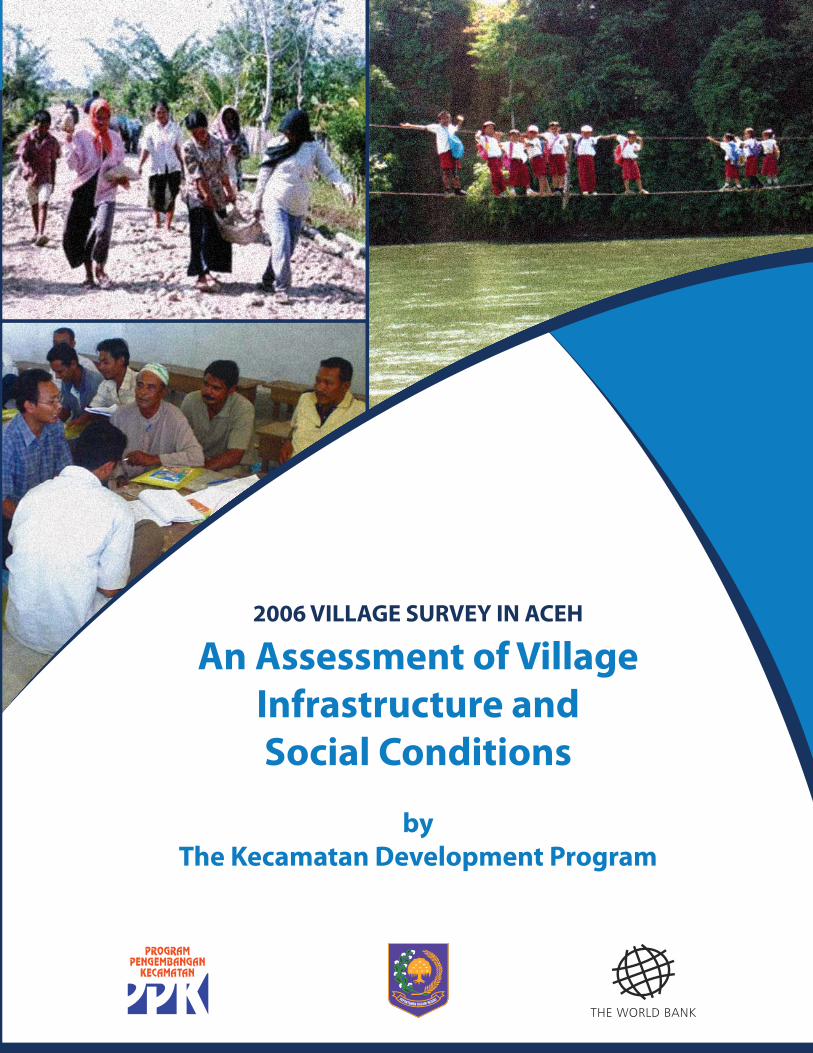
2006 VILLAGE SURVEY IN ACEH
An Assessment of Village Infrastructure and Social Conditions
byThe Kecamatan Development Program
MINISTRY of HOME AFFAIRSCommunity Development Offi ce (PMD)Jl. Raya Pasar Minggu Km. 9Jakarta 12510Tel: (6221) 791-91684Fax: (6221) 791-96118E-mail: [email protected]
KDP REGIONAL MANAGEMENT UNIT in ACEHJl. T. Iskandar No. 46Desa Lamteh Ulee KarengBanda Aceh 23118Ph.: 0651- 27997Fax: 0651- 32283E-mail: [email protected]
THE WORLD BANK OFFICE JAKARTAJakarta Stock Exchange Building Tower II/12th Fl.Jl. Jend. Sudirman Kav. 52-53Jakarta 12910Tel: (6221) 5299-3000Fax: (6221) 5299-3111Website: http://www.worldbank.org/id
Printed in March, 2007. The fi ndings, interpretations, and conclusions expressed in here do not necessarily refl ect the views of the Board of Executive Directors of the World Bank or the governments they represent.The World Bank does not guarantee the accuracy of the data included in this work. The boundaries, colors, denominations, and other information shown on any map in this work do not imply any judgment on the part of the World Bank concerning the legal status of any territory or the endorsement of acceptance of such boundaries.

2006 Village Survey in Aceh
An Assessment of Village Infrastructure and Social Conditionsby
The Kecamatan Development Program

FOREWORDThe year 2007 marks two years after the tsunami and earthquake that devastated Aceh and one year after the signing of Helsinki Memorandum of Understanding (MoU) that signaled the beginning of the peace process in Aceh. Signifi cant progress has been achieved by the Government of Indonesia in addressing the needs of the Acehnese in the post-tsunami and post-confl ict reconstruction and reintegration processes. However, there are still many challenges faced by the people in regaining normal and productive lives after the twin disasters of confl ict and tsunami.
In order to better understand the infrastructure condition and social situation in Aceh two years after the tsunami and one year after the signing of Helsinki MoU, the Government of Indonesia through the Kecamatan Development Program (KDP) in Aceh, and with the support of the World Bank, the Multi-Donor Fund for Aceh and Nias, and the Decentralization Support Facility, conducted the Aceh Village Survey in 2006. The report from the survey gives information concerning infrastructure and social conditions of villages in Aceh, including the situation of internally displaced people (IDPs), village information and development needs, social dynamics, and education conditions. The government hopes that this information can be utilized as inputs for reconstruction and reintegration program planning, as well as for the village visioning of the KDP.
This report is only one of many steps that the goverment and the people of Aceh need to take in order to rebuild Aceh in the context of a lasting peace. With the results of this survey and the wealth of information it contains, the government and the people of Aceh, with support from international agencies and donors, have an opportunity to use these fi ndings to ensure that development programs are designed in such a way as to address the real needs of the Acehnese. Making use of such a wealth of information will be an important step on the road towards sustainable peace in the province, and help to improve the lives, opportunities and prosperity of the people of Aceh.
March 2007
Irwandi YusufGovernor
Nanggroe Aceh Darussalam
Ayip Mufl ichDirector General of Village and
Community Empowerment Ministry of Home Aff airs
Scott E. GuggenheimCountry Sector Coordinator,
IndonesiaThe World Bank

ACKNOWLEDGMENTSThis Aceh Village Survey 2006 is the joint product of the Ministry of Home Aff airs, Community Development Offi ce (PMD), the KDP Facilitator Team in Aceh, the Tunas Aceh Research Institute (TARI) and the World Bank Social Development Unit.
The team was led by Susan Wong and Lily Hoo (World Bank). The core team included: Richard Gnagey (PMD consultant), Taufi q Dawood and Jeliteng Pribadi (TARI), and Steven Shewfelt, Patrick Barron, Ambar Mawardi, Wawan Setiono, Ellen Tan, and Sandra Usmany Tjan (World Bank).
The core team would like to express its thanks and gratitude to the following parties for their invaluable inputs into the survey and this report:
PMD : Ayip Mufl ich, Arwan Surbakti, Eko Sri Haryanto, Bito Wikantosa, Prabawa Eka Sutanta, Tommy Aryanto and Titik Mulyani
KDP team in Aceh : M. Rusli, Ramli, Alfi an, Fachri, Hamir, Rizky and Satria (RMU Aceh), KM Kabs, FKs, FDs, and TPKs
Training team : Chamiatus (NMC Jakarta), Azhari, Alfi an, Mirdas (RMU Aceh), Yanis Rinaldi, Nasrillah Anis, Miftachuddin (TARI), Fauzi Mohammad, Sadwanto Purnomo, Suyatno, M. Yusuf (World Bank)
World Bank staff : Andy Yogatama, Surya Windu, Samuel Clark, Matthew Zurstrassen, Arya B. GaduhGARANSI : H. Syafruddin Budiman, Mohamad Ali, M. Rizal, Fadhil, and Iqbal
Special thanks to Ari Siregar and Camilla Holmemo for their valuable contributions to the preparation of the survey.
John Victor Bottini, Joel Hellman, Scott Guggenheim, and Wolfgang Fengler from the World Bank provided critical advice to the team.
The editor of this report was Peter Milne who also provided important suggestions to the report’s substance.
Photographs were provided by KDP consultants, TARI, and the World Bank. Maps were prepared by Zejd Mohammad and Doddy Prima Kusumadhynata (World Bank).
Financial support for this survey was provided by the Government of Indonesia, the World Bank, the Multi-Donor Fund for Aceh and Nias, and the Decentralization Support Facility.
To all of these contributors, the team would like to express their deepest thanks and appreciation.
Any follow-up questions, or requests for additional information should be directed to Susan Wong ([email protected]) or Lily Hoo ([email protected]).

2006 Village Survey In Aceh An Assesssment of Village Infrastructure and Social Conditions March 2007 i
MAP of ACEH
ii 2006 Village Survey In Aceh An Assesssment of Village Infrastructure and Social Conditions March 2007
TABLE OF CONTENTSList of Boxes ii
List of Figures iii
List of Tables iv
List of Maps v
List of Annexes v
Glossary 1
EXECUTIVE SUMMARY 3
CHAPTER 1: INTRODUCTION 11
1.1 Background 12
1.2 Aims of the Aceh Village Survey 13
1.3 Main Components of the Survey 13
CHAPTER 2: SURVEY METHODOLOGY 16
CHAPTER 3: GENERAL VILLAGE INFORMATION 21
CHAPTER 4: INFRASTRUCTURE STATUS 27
CHAPTER 5: SOCIAL SECTION 41
5.1 Internally Displaced People 42
5.2 Information Needs 58
5.3 Village Needs 66
5.4 Social Capital 72
5.5 Education Situation 80
CHAPTER 6: CONCLUSIONS and RECOMMENDATIONS 85
ANNEXES 91
REFERENCES 125
List of Boxes
Box 1.1 What is the Kecamatan Development Program? 13
Box 2.1 Who are the FDs? 19
Box 4.1 Explanation of reporting damage 31
Box 4.2 District level index of damage 32
Box 5.1 Notes on the data 42
Box 5.2 Methodology to calculate exclusion score and exclusion level 73
2006 Village Survey In Aceh An Assesssment of Village Infrastructure and Social Conditions March 2007 iii
List of Figures
Figure 3.1 District population by gender 22
Figure 3.2 Breakdown of occupations by working population 25
Figure 4.1 Average degree of infrastructure damage by cause of damage 33
Figure 4.2 Share of costs needed for infrastructure reconstruction/replacement by district 40
Figure 5.1 Number of tsunami and confl ict IDPs who have not yet returned by district 43
Figure 5.2 Current dwellings of tsunami IDPs (returned and from other villages) 50
Figure 5.3 Current dwellings of confl ict IDPs (returned and from other villages) 51
Figure 5.4 Current economic condition of tsunami IDPs compared with before the tsunami by tsunami impact (kecamatan level)
53
Figure 5.5 Economic condition of tsunami IDPs from other villages compared with people from within the community by tsunami impact (kecamatan level)
54
Figure 5.6 Economic condition of confl ict IDPs from other villages compared with people from within the community by confl ict intensity (kecamatan level)
54
Figure 5.7 Economic condition of tsunami IDPs from outside the village compared with other villagers by respondent
55
Figure 5.8 Information needs of communities 59
Figure 5.9 Types of information that local leaders share with community 61
Figure 5.10 Percentage of village heads, youth leaders and women’s leaders receiving suffi cient information on post-confl ict issues
68
Figure 5.11 Percentage of respondents who have received suffi cient information by confl ict intensity area
64
Figure 5.12 Sources of information about the MoU 65
Figure 5.13 Village priority needs 67
Figure 5.14 Percentage of responses on proportion of villagers who have diffi culty to access diff erent public services
69
Figure 5.15 Percentage of respondents who chose roads and livelihoods as fi rst priority needs when proportion of villagers who have diffi culty to access diff erent public services increased
71
Figure 5.16 Percentage of exclusion level in Aceh 73
Figure 5.17 Percentage of responses on villagers who have diffi culty to attend village meetings and social activities
74
Figure 5.18 Percentage of responses on the proportion of villagers who have diffi culty to attend village meetings and social activities
74
Figure 5.19 Percentage of responses for main reasons for diffi culties to access public services and to participate in village functions
75
Figure 5.20 Main problem solving mechanisms 76
Figure 5.21 Percentage of responses on participants at village meetings based on gender 76
Figure 5.22 Levels of trust towards GAM returnees 77
Figure 5.23 Solidarity levels between villagers 78
Figure 5.24 Solidarity levels post Helsinki MoU 78
Figure 5.25 Opinions on diff erent statements of trust 79
Figure 5.26 School category 81

iv 2006 Village Survey In Aceh An Assesssment of Village Infrastructure and Social Conditions March 2007
Figure 5.27 Average number of teacher per school and student-teacher ratio 81
Figure 5.28 Composition of drop-out students by gender 83
Figure 5.29 Schools’ priority needs 84
List of Tables
Table 1.1 Overview of research questions and respondents 15
Table 2.1 Timetable of the Aceh Village Survey 18
Table 3.1 Household information by district 24
Table 4.1 Damage index for all causes of damage by infrastructure categories and by district 29
Table 4.2 Types of infrastructure with high percentage of damage 32
Table 4.3 Types of infrastructure with the highest share of damage caused by confl ict 34
Table 4.4 Types of infrastructure with the lowest share of damage caused by confl ict 34
Table 4.5 Types of infrastructure with the highest percentage of damage caused by natural disaster
34
Table 4.6 Share of infrastructure damage from disasters by category of infrastructure 35
Table 4.7 Types of infrastructure with the highest percentage of damage due to lack of maintenance
35
Table 4.8 Types of infrastructure with the lowest percentage of damage by lack of maintenance 35
Table 4.9 Confl ict and natural disaster related damage indexes by district 36
Table 4.10 Percentage of damaged infrastructure caused by confl ict and natural disaster by category of infrastructure and by district
37
Table 4.11 Percentage of damaged infrastructure replaced or under repair by district 38
Table 4.12 Average repair rate of confl ict and natural disaster related infrastructure damage by categories
38
Table 4.13 Types of infrastructure with the highest rate of replacement or repair 39
Table 5.1 Number of households that left their villages by cause 43
Table 5.2 IDP families displaced from their village by tsunami 44
Table 5.3 IDP families displaced from their village by the confl ict 46
Table 5.4 Number of IDPs from other villages currently being hosted by district 48
Table 5.5 IDPs’ economic condition 52
Table 5.6 Tsunami and confl ict IDPs’ economic condition in communities with both tsunami and confl ict IDPs
52
Table 5.7 Tsunami and confl ict IDPs’ economic condition by district 56
Table 5.8 Percentage of respondents prioritizing information on tsunami programming by tsunami impact (kecamatan level)
60
Table 5.9 Percentage of respondents prioritizing information on reintegration programming by confl ict intensity (kecamatan level)
60
Table 5.10 Extent to which respondents provide information on tsunami issues by tsunami impact (kecamatan level)
62
Table 5.11 Extent to which respondents provide information on the MoU by confl ict intensity (kecamatan level)
62

2006 Village Survey In Aceh An Assesssment of Village Infrastructure and Social Conditions March 2007 v
Table 5.12 Extent to which respondents provide information on reintegration programming by confl ict intensity (kecamatan level)
63
Table 5.13 Percentage of local leaders receiving suffi cient information on post-confl ict issues 63
Table 5.14 Availability of public services 68
Table 5.15 Proportion of villagers who have diffi culties to access public services when public transportation is not available
68
Table 5.16 Relation between access to health, education, water and sanitation and the availability of public services
70
Table 5.17 First priority needs by poverty level index 71
Table 5.18 Students per school ratio 82
List of Maps
Map 1 Map of Aceh i
Map 5.1 Map showing total number of HHs displaced by tsunami that have not yet returned (distribution at the kecamatan level)
45
Map 5.2 Map showing total number of HHs displaced by confl ict that have not yet returned (distribution at the kecamatan level)
47
Map 5.3 Map showing the areas with total number of confl ict and tsunami IDPs from other villages currently being hosted (distribution at the kecamatan level)
49
List of Annexes
Annex 1 Survey Instrument
Annex 1.1 Social Questionnaires 93
Annex 1.2 Infrastructure Survey Form 110
Annex 2 Infrastructure Data
Annex 2.1 Infrastructure damage by type of infrastructure, level of damage, cause of damage, and repair status
114
Annex 2.2 Percentage of infrastructure by level of damage, cause of damage, and repair rate 116Annex 2.3 Sectoral damage index by district and source of damage 118Annex 2.4 Degree of damage and current status of repair of confl ict and natural disaster related
infrastructure damage119
Annex 2.5 Costs to repair or replace damaged infrastructure caused by confl ict and natural disaster 123

vi 2006 Village Survey In Aceh An Assesssment of Village Infrastructure and Social Conditions March 2007
GLOSSARY
12006 Village Survey In Aceh An Assesssment of Village Infrastructure and Social Conditions March 2007
GLOSSARYAMM Aceh Monitoring MissionAPEA Aceh Public Expenditure AnalysisBRA Aceh Reintegration Agency (Badan Reintegrasi-Damai Aceh) BRR Aceh Reconstruction and Rehabilitation Agency (Badan Rekonstruksi dan
Rehabilitasi Aceh)BPS National Statistics Offi ce, Indonesia (Badan Pusat Statistik)CDD Community-Driven DevelopmentDikdasmen Directorate of Basic and Secondary Education (Direktorat Pendidikan Dasar dan
Menengah)Desa VillageDusun HamletEMIS Education Management Information SystemFD KDP Village Facilitator (Fasilitator Desa)FK KDP Kecamatan Facilitator (Fasilitator Kecamatan)FT KDP Kecamatan Technical Facilitator (Fasilitator Teknik)Garansi Gerakan Aman Adil Sejahtera untuk IndonesiaGAM Free Aceh Movement (Gerakan Aceh Merdeka)GDS Governance and Decentralization SurveyGoI Government of IndonesiaHH HouseholdsICG International Crisis GroupIDP Internally Displaced PeopleKabupaten DistrictKDP Kecamatan Development ProgramKecamatan Sub-districtKM Kab District Management Consultant (Konsultan Manajemen Kabupaten)Komnas- Perempuan National Commission against Violence towards Women (Komisi Nasional Anti
Kekerasan terhadap Perempuan) KPA Monitoring Commission Aceh (Komisi Pemantauan Aceh)LoGA Law on Governing AcehMI Islamic elementary school (Madrasah Ibtidayah)MoNE Ministry of National EducationMoU Memorandum of UnderstandingNGO Non-Governmental OrganizationPMD Ministry of Home Aff airs, Community Development Offi ce (Pemberdayaan
Masyarakat dan Desa)PNS Government Civil Servant (Pegawai Negeri Sipil)Podes Village Potential Survey, (Survei Potensi Desa)PREM Poverty Reduction and Economic Management Puskesmas Pembantu Community health unit (at village level)RMU Regional Management UnitSD Primary SchoolSusenas National Social and Economic Survey (Survei Sosial dan Ekonomi Nasional)TNI Indonesian Armed Forces (Tentara Nasional Indonesia)TPK Project Implementation Team (Tim Pelaksana Kegiatan)UNDP United Nations Development ProgramUNICEF United Nations Children’s FundUNIMS United Nations Information and Management SystemUSAID United States Agency for International DevelopmentWB The World Bank

2 2006 Village Survey In Aceh An Assesssment of Village Infrastructure and Social Conditions March 2007
EXECUTIVE SUMMARY
32006 Village Survey In Aceh An Assesssment of Village Infrastructure and Social Conditions March 2007
EXECUTIVE SUMMARY
The 26 December 2004 earthquake and tsunami, coming on top of three decades of violent confl ict, have had a devastating impact on infrastructure and social dynamics in Aceh. The confl ict between the Government of Indonesia (GoI) and the Free Aceh Movement (GAM) lasted almost thirty years and resulted in nearly 15,000 deaths, and more than 35,000 households displaced. Throughout the province, and particularly in rural areas, infrastructure sustained serious damage and further deteriorated because the security situation made maintenance diffi cult or impossible. In addition to the physical damage, years of confl ict have also had an impact on the social fabric of the province, with families separated or displaced, psycho-social repercussions on individuals and society, and tensions between communities, the state, and GAM. The 2004 earthquake and tsunami thus occurred in a province that was already experiencing large-scale disaster and damage.
The earthquake and tsunami disasters resulted in an estimated 130,000 deaths, with 37,000 still missing. Among the worst aff ected areas were Banda Aceh, the northwest coast, and the islands off the coast, where hundreds of villages were cut off from transport and communication. Beyond this, damage extended around the northern tip of Aceh, with districts along the east coast also experiencing heavy losses. Many buildings and infrastructure collapsed due to the earthquake, and there is evidence of land subsidence in coastal areas. The ensuing tsunami swept debris and sea water into homes and buildings up to fi ve kilometers inland, crushing them and further damaging roads, bridges, telecommunications, water and electricity systems, crops, irrigation systems, and other economic infrastructure.
To provide an accurate overview of the current condition of Acehnese villages, the Kecamatan Development Program (KDP)—the government’s largest community development program in Aceh—undertook an assessment of the infrastructure status and the social situation throughout the province. KDP is a nationwide government program, implemented by the Ministry of Home Aff airs. Using KDP facilitators at the village, sub-district (kecamatan) and district levels, the assessment was conducted in almost all rural villages in Aceh, covering 5,698 villages, 221 sub-districts (kecamatan) and 18 districts (17 kabupaten and 1 kota). It is expected that the information gathered from this survey will be incorporated directly into KDP-sponsored village visioning and planning in order to guide villagers in their own planning and resource allocation. The data collected through the assessment will serve as a resource for development practitioners, academics, government offi cials and the people in Aceh. The information will be shared widely with the aim of guiding the planning and resource allocation of future initiatives throughout the province.
The report consists of six sections. The introductory sections provide background information on the aims of the survey, the survey design, and the methodology. The third section reports general village information. The fourth section provides results of the infrastructure assessment. The fi fth section discusses the results from the social section of the survey, including sub-sections on internally displaced people (IDPs), village information and development needs, social capital, and education. The sixth and concluding section reviews the study’s fi ndings and discusses recommendations suggested by these fi ndings.
SURVEY and DESIGN METHODOLOGY
Main Components of the Survey
The Aceh Village Survey consists of two components: an infrastructure assessment and a social assessment. Both components are implemented in all KDP villages in Aceh. The infrastructure assessment of the survey maps infrastructure in almost all villages, together with the levels of, and reasons behind, the damage (natural disaster, confl ict, or lack of maintenance). It also looks at the need for reconstruction or replacement of damaged and destroyed infrastructure and, if applicable, the level of reconstruction to date. The Social Assessment consists of four key informant questionnaires aimed at: the village head, a youth leader, a woman
EXECUTIVE SUMMARY
4 2006 Village Survey In Aceh An Assesssment of Village Infrastructure and Social Conditions March 2007
representative, and the elementary school principal. A total of some 22,300 village respondents were interviewed for this survey. Data were collected on general village characteristics, IDPs, village information and development needs, social capital, and education.
Survey Methodology
The fi eld work for the Aceh Village Survey was conducted in August and September 2006 by KDP village teams, following an intensive preparation period to establish the systems for implementation, and develop and fi eld-test the questionnaires. The KDP fi eld teams consisted of: the KDP Regional Management Unit, the KDP district facilitators, kecamatan facilitators, village facilitators, and Village Technical Implementation Teams. The World Bank Indonesia team provided overall guidance, oversight, and research analysis for this survey. The survey design was prepared jointly by the Ministry of Home Aff airs and the World Bank.
GENERAL VILLAGE INFORMATION in ACEH
A variety of measures suggest that poverty is widespread throughout the province. Several measures were taken to assess the extent of poverty, and the nature and extent of economic activity in the province. Out of a total of some 5,200 rural villages reporting population fi gures, covering 3.41 million people, about 26 percent or 207,594 households were registered by the village head as “poor households”. Some 18,818 households (2.4 percent of the total) are reported to be able to aff ord to eat only one meal per day. About 190,000 households, or 23.8 percent, are reported to be receiving zakat (religious alms) donations. In addition, the survey recorded 107,635 orphans. Both in terms of overall poverty headcount and poverty indicators, the districts of Pidie, Aceh Utara and Bireuen stand out as requiring special attention.
INFRASTRUCTURE CONDITIONS in ACEH
The survey found that infrastructure damage is extensive; over 50 percent of the main infrastructure types were damaged. The survey examined 57 types of village-level infrastructure that were grouped into nine main categories: roads; bridges; water and sanitation; electricity; irrigation; village facilities; economic facilities; residential structures; and productive land. For many of these categories, more than 50 percent of the infrastructure was reported damaged. For individual types of infrastructure, many were reported to be damaged by more than 80 percent. Particularly hard hit were bridges, drainage systems, latrines and village roads, especially those at the hamlet (dusun) level.
On average, confl ict caused 19.5 percent of damage, natural disasters 38.6 percent, and lack of maintenance 41.9 percent of the total damage reported (a ratio of about 1:2:2). The categories used for the cause of damaged infrastructure were: the confl ict; natural disaster; and lack of maintenance. Damage due to confl ict seems to be focused on economically productive assets, with fi sh or shrimp ponds, generators, and other farm land or orchards being the types of infrastructure where damage is most likely. In contrast, retaining walls, small dams, and wooden beam bridges are the three types of infrastructure most likely to be reported damaged due to natural disasters. Lack of maintenance has also taken a high toll on infrastructure in the province, with generators, latrines, and pre-schools most often reported damaged.
Infrastructure repair eff orts have focused largely on tsunami-aff ected areas. Among the types of infrastructure most often reported to be repaired or under repair are health facilities, district roads, and the more elaborate bridges. In addition, some kinds of infrastructure given priority by the communities are more likely to be reported repaired or under repair, including places of worship, schools, and fi elds.
Several districts reported high levels of infrastructure damage. The areas that reported the highest levels of infrastructure damage due to confl ict are Aceh Timur, Bener Meriah, and Nagan Raya. The areas reporting the
EXECUTIVE SUMMARY
52006 Village Survey In Aceh An Assesssment of Village Infrastructure and Social Conditions March 2007
highest levels of damage due to natural disasters are Aceh Jaya, Simeulue and Bireuen. With some exceptions, natural disasters are reported to have caused more damage than the confl ict.
Based on typical costs for building KDP infrastructure in recent years, the total cost estimate for repairing or replacing damaged infrastructure is nearly Rp 12 trillion, or US$1.3 billion. Nearly half of this sum is needed to repair or replace housing. The next largest sum is needed to return land to productive use, followed by repairs to, or replacement of, roads. Aceh Utara, Pidie, Bireuen, Aceh Timur, and Aceh Besar have the highest shares of total costs needed for reconstruction/replacement of infrastructure.
SOCIAL CONDITIONS in ACEH
Social conditions in Aceh are in many respects good, with relatively few access issues and most measures of social relations favorable. However, responses to questions about social relations also reveal important issues that need to be addressed, including the need to broaden the focus of the recovery eff ort beyond tsunami-aff ected areas and the importance of ensuring full community participation in development projects.
Internally Displaced People
The report focuses on IDPs from both the tsunami and the confl ict, in the following three categories:IDPs who were displaced but have returned to the respondent’s community;IDPs who remain displaced from the respondent’s community;IDPs from other places who are currently living in the respondent’s community
More households are reported to have been displaced from their villages by confl ict (103,453 households) than by the tsunami (66,893 households). The districts of Pidie, Bireuen, and Aceh Besar report the largest numbers of IDP families displaced by the tsunami, among the largest numbers displaced by the confl ict, and among the largest numbers of households from other communities currently living in the respondents’ communities. This higher IDP level in eastern districts may be related to the fact that west coast areas received a more immediate aid response and as a result fewer people in western districts had to leave their villages in the aftermath of the disaster.
Confl ict IDPs are reported to be returning at a lower rate (64.6 percent) than tsunami IDPs (85.2 percent). These return rates are consistent across districts. There are no districts where the percentage of returned confl ict IDPs is higher than the average percentage of returned tsunami IDPs. Likewise, there are no districts where the percentage of returned tsunami IDPs is lower than the average percentage of returned confl ict IDPs.
Returned tsunami IDPs are more likely to be living in their own homes than returned confl ict IDPs. Consistent with the enormous eff ort that has gone into rebuilding homes for tsunami IDPs, by far the largest share of returned tsunami IDPs are reported to be living in their own homes (59.9 percent). The number of returned confl ict IDPs reported to be living in their own homes (26.7 percent) is slightly less than the number reported to be living in rented homes (29.5 percent) and other dwellings (28.1 percent). This could be because few homes are being built for confl ict IDPs, but it is also consistent with the possibility that confl ict IDPs have more diffi culty reintegrating fully into their communities of origin.
Confl ict IDPs from other communities are more likely to be living in their own homes than tsunami IDPs from other communities. Tsunami IDPs who are reported to have come from other locations mainly live in barracks (19.7 percent), tents (8.0 percent), with family (14.0 percent), with relatives (10.8 percent), in rented homes (10.3 percent), in their own homes (13.1 percent), or in other accommodation (24.1 percent). In contrast, just over half of all confl ict IDPs who have come from other locations are currently reported to be living in their own homes (50.5 percent), suggesting that this group has taken more steps towards integrating fully into the communities to which they were displaced.
•••
EXECUTIVE SUMMARY
6 2006 Village Survey In Aceh An Assesssment of Village Infrastructure and Social Conditions March 2007
In villages that are hosting both confl ict and tsunami IDPs, confl ict IDPs are perceived to be considerably worse off economically than are tsunami IDPs. Confl ict IDPs who are from outside the respondents’ communities are reported to be somewhat worse off economically than others in the community. This fi nding is consistent across districts and varies little with the intensity of the confl ict in the kecamatan where respondents are located. This diff erence between the IDPs and others in the community is smaller for tsunami IDPs than for confl ict IDPs. Furthermore, respondents located in kecamatan that were heavily aff ected by the tsunami are more likely to believe that tsunami IDPs from outside are currently enjoying a better economic condition than others in the community. The same pattern exists when respondents are asked to compare returned tsunami IDPs’ economic condition with their pre-tsunami condition. These fi ndings are consistent with a general belief that confl ict IDPs lag behind tsunami IDPs as measured by the extent to which they have been able to restart normal, productive lives. It also suggests that people who are not receiving the same benefi ts as tsunami IDPs are feeling somewhat left behind.
Information Needs
Respondents report that villagers’ top information needs relate to the Helsinki Memorandum of Understanding (MoU), signed by the government and GAM in August 2005 (22.9 percent), and the use of village budgets (21.7 percent). However, broadening the focus to include the top three information needs reveals that information on development programs (52.5 percent) and employment opportunities (49.8 percent) are also important. Lower on the priority list is information on specifi c tsunami and post-confl ict reintegration programming, and there is little demand for information on access to land, fi nancial services, and psychological trauma and counseling. There is little variation in the responses of the three types of respondent (village heads, women’s leaders, and youth leaders) or between areas impacted to diff erent extents by the tsunami and confl ict. The data show the extent to which investing in information strategies for regular government development activities is at least as important as publicizing benefi ts and programs stemming from Aceh’s two disasters.
Not surprisingly, based on these identifi ed information needs, local leaders are most likely to regularly share information about village development and village budget information. They less commonly share information on tsunami and reintegration programming, or information relating to the Helsinki MoU. These patterns are also consistent across types of respondents and across areas impacted to diff erent extents by the tsunami and confl ict.
Many local leaders feel they have insuffi cient information about post-confl ict issues, including the reintegration fund. In terms of where villagers receive information, television is by far the most important source of information about the MoU, with 92.8 percent of respondents reporting this as one of their top three sources. Newspapers (81.2 percent) and radio (57.2 percent) were the next most important sources of information. Of the three groups of respondents, village heads are least likely to feel they have suffi cient information on post-confl ict topics, but the history of confl ict has little impact on whether local leaders feel they receive suffi cient information on post-confl ict issues.
Village Needs
Consistent with the fi ndings regarding infrastructure conditions and the fi ndings from other studies, the main village need identifi ed by respondents in Aceh is roads, with 59.8 percent of respondents identifying this as one of their top three priorities. Livelihoods (50 percent), job opportunities (39.6 percent), and education (37.7 percent) are the next highest priorities identifi ed. There are few diff erences among the three respondents in each village regarding priority village needs at the province and district levels, although there are signifi cant diff erences at the village level. There is little correlation between village needs and the level of confl ict intensity or the level of damage due to the tsunami.
Village needs are not always consistent with access to public services. The survey also included questions regarding the number of villagers who had diffi culty accessing four types of public service: public transportation, water and sanitation, and education and health services. The data show that diffi culties in obtaining access to
EXECUTIVE SUMMARY
72006 Village Survey In Aceh An Assesssment of Village Infrastructure and Social Conditions March 2007
these services do not necessarily prompt the respondents to choose the services as their priority needs. For example, although there are relatively few villagers who have diffi culties accessing primary education, almost 40 percent of them chose education as a priority need. There was a fairly high correlation in responses to these questions, suggesting that these access issues are concentrated; if in a particular village a large number of villagers have diffi culty accessing one kind of public service, an even larger number of villagers are likely to have diffi culty accessing all kinds of public services in this location.
Social Capital
The survey includes questions on social cohesion and inclusion, decision-making mechanisms, and trust and solidarity.
Social capital is relatively strong in Aceh. The exclusion level is low and few villagers experienced diffi culties attending village meetings and social activities, such as receptions, funerals, and religious festivals. More villagers have diffi culties attending village meetings than social activities, suggesting that villagers are more able to attend informal social activities that involve interaction with family, friends and/or neighbors.
Around 77 percent of respondents chose poverty as the main reason their fellow villagers had diffi culties accessing public services or participating in village meetings and social activities. Lack of education and occupation were also identifi ed as reasons for non-participation, but less than 10 percent of respondents chose identity-related factors such as religion and ethnicity/race as reasons for the exclusion. However, around 20 percent of respondents chose “confl ict victims” as one of the top three reasons for the exclusion, suggesting that confl ict victims still face some diffi culties reintegrating in their communities.
Overall, villages meetings are seen as the main problem-solving mechanism. While turning to family, friends and neighbors is the preferred mechanism (32 percent) for solving common problems, looking at the top three mechanisms cumulatively this is only third (45.8 percent), after village meetings (80.3 percent) and community organizations (69.4 percent). Given their importance, it is particularly noteworthy that 52 percent of respondents claim that village meetings are usually attended by men accompanied by only a few women, highlighting the importance of ensuring mechanisms are in place to address women’s issues.
When asked to rate the level of trust between “those who just returned from the mountains” and others in the community, the majority chose to remain neutral, with 61 percent responding that trust was neither low nor high, and about 25 percent saying it was high or very high. In contrast, about 50 percent of respondents chose neither low nor high when asked to rate the general level of solidarity in the village, with around 40 percent saying it was high or very high. Trust levels appear to be higher when respondents are asked general questions about trust in the village, with 49 percent agreeing or strongly agreeing with the statement that most of villagers can be trusted. Even more agree or strongly agree with statements that villagers usually help each other and are willing to help others (58 percent and 76 percent, respectively). This combination of fi ndings suggests that although trust levels are generally good, the residue from the confl ict has not disappeared and peace-building work with GAM returnees must continue. Interestingly, there appears to be no correlation between the responses to questions concerning trust and solidarity, and the intensity of confl ict.
Education Situation
Student-teacher ratios in the schools surveyed are low. Among the schools surveyed, there is an average of 12.6 teachers per school, of whom 52 percent are government civil servants (PNS), 20 percent are honorary teacher (guru honor), 18 percent are voluntary teachers (guru bakti), and 10 percent are contract teachers (guru kontrak). The student-teacher ratio is 14.6, a ratio that is considerably lower than the national average. Furthermore, teacher distribution is uneven, with more teachers concentrated in urban areas than remote areas.
EXECUTIVE SUMMARY
8 2006 Village Survey In Aceh An Assesssment of Village Infrastructure and Social Conditions March 2007
According to school principals—the key respondents for the education section—the highest priority education needs include more qualifi ed and experienced teachers, better classrooms, and additional teachers, at 35.8 percent, 17.9 percent, and 16.7 percent of respondents, respectively. Looking at the top three needs selected by respondents, more textbooks (62.1 percent), more experienced and qualifi ed teachers (53.6 percent), and better classrooms (47.2 percent) are identifi ed as the most important.
CONCLUSIONS and RECOMMENDATIONS
Major Investment is Still Required
A major theme that emerges in this report is that, notwithstanding the progress that has been made in helping Aceh recover from the tsunami and confl ict, enormous challenges remain that require major additional investment at the village level. The cost of repairing infrastructure is estimated to be Rp 12 trillion, or US$1.3 billion. Furthermore, this accounts for only about 60 percent of the total damaged infrastructure in the province; a further 40 percent of reported damage was identifi ed as being the result of lack of maintenance. Thus, total infrastructure repair costs could be as high as Rp 20 trillion, or US$2.2 billion. Recovery on this scale will only move forward if all interested parties participate in the eff ort.
While a return to confl ict appears remote, the lingering residue of the confl ict and the potential for renewed confl ict remain real. Although in many respects social conditions in Aceh are surprisingly good, it is important that these positive trends should not obscure the fact that the residue of the confl ict holds the potential to disrupt the peace process and recovery eff ort. A variety of indicators suggest that problems may lie not far beneath the surface. Communities realize that the successful implementation of the Helsinki MoU is crucial to their lives and prosperity in the next few years. Existing eff orts to support the post-confl ict peace-building process should therefore continue. Such eff orts should include ongoing socialization regarding developments in the peace process, improving the availability of public services and explaining how these can benefi t communities, equipping local leaders with accurate and up-to-date information on reintegration programs, and boosting ongoing eff orts to improve security.
The recovery eff ort in Aceh should build on the province’s strengths and the considerable progress that has already been made. This report shows that conditions in some areas have improved considerably. A majority of both confl ict-induced and tsunami-induced IDPs have already returned to their homes of origin, and many of these IDPs are now living in their own houses. Most measures of social capital indicate that conditions are good: exclusion from public services is rare, respondents report reasonably high levels of trust in their communities, and a variety of mechanisms are used for resolving local issues. Continuing recovery eff orts should build on these strengths. For education, with teachers available at schools, education investment should focus upon addressing the top priorities identifi ed: improving the quality and experience level of teachers; providing more textbooks; and improving school facilities.
Recovery in Aceh is a Province-Wide Process
Relief and recovery eff orts for tsunami-aff ected populations should not crowd out the need for assistance in other parts of the province. Tsunami-aff ected areas and populations are leading the way in the recovery and rehabilitation process. However, the infrastructure and social damage that Aceh has suff ered goes well beyond tsunami-aff ected areas, and the recovery eff ort needs to be a province-wide process. Poverty remains widespread and confl ict-aff ected areas and populations continue to lag behind tsunami-aff ected areas and populations in many respects. Given the lingering eff ects of the confl ict and the potential for future problems, renewed emphasis should be placed on the recovery eff ort in confl ict-aff ected and other non-tsunami-aff ected areas.

EXECUTIVE SUMMARY
92006 Village Survey In Aceh An Assesssment of Village Infrastructure and Social Conditions March 2007
Community-Driven Processes are Most Eff ective in Targeting Investment
While the patterns that emerge at the provincial and district levels can help guide overall policy direction, the diff erence in opinions that exist at the village level make community-driven development processes the most eff ective means in addressing village needs. The value of these approaches is most evident in light of the signifi cant local-level variation between respondents on many of the issues in this report. Furthermore, since women are still largely under-represented in the decision-making process in Aceh—more than half of respondents say that village meetings are attended mostly by men, with only a few women—special attention should be paid to ensuring that all members of the community have the opportunity to participate in, and contribute to, local development processes.

10 2006 Village Survey In Aceh An Assesssment of Village Infrastructure and Social Conditions March 2007

01CHAPTER 1
Introduction
CHAPTER 1: INTRODUCTION
12 2006 Village Survey In Aceh An Assesssment of Village Infrastructure and Social Conditions March 2007
1.1 BACKGROUND
The 26 December 2004 earthquake and tsunami, coming on top of three decades of violent confl ict, have had a devastating impact on infrastructure and social dynamics in Aceh. The confl ict between the Government of Indonesia (GoI) and the Free Aceh Movement (GAM) lasted almost thirty years and resulted in nearly 15,000 deaths, and an estimated 35,000 households displaced. Throughout the province, and particularly in rural areas, infrastructure sustained serious damage and further deteriorated because the security situation made maintenance diffi cult or impossible. In addition to the physical damage, years of confl ict have also had an impact on the social fabric of the province, with families separated or displaced, psycho-social repercussions on individuals and society, and tensions between communities, the state, and GAM. The 2004 earthquake and tsunami thus occurred in a province that was already experiencing widespread disaster and damage.
The earthquake and tsunami resulted in an estimated 130,000 deaths, with 37,000 still missing. The worst aff ected areas were Banda Aceh, the northwest coast, and the islands off the coast, where hundreds of villages were cut off from transport and communication. Many buildings and infrastructure collapsed due to the earthquake, and there is some evidence of land subsidence in coastal areas. The ensuing tsunami swept debris and sea water into homes and buildings up to fi ve kilometers inland, crushing them and further damaging roads, bridges, telecommunications, water and electricity systems, crops, irrigation systems, fi shery infrastructure, and food and fuel outlets.
Following the tsunami, on 15 August 2005 the GoI and GAM signed the Helsinki Memorandum of Understanding (MoU) to end the long-running confl ict. The unprecedented national and international response to the tsunami created a unique window of opportunity for an alternative pathway out of confl ict in Aceh. One year after the signing of the MoU, there is still tremendous scope for actors involved in the rebuilding of Aceh to have a positive impact on the peace process. Villages in confl ict-aff ected areas received very little development assistance during the confl ict, and the peace agreement has created an opportunity to bring much needed development to rural Achenese villages that were previously off -limits to the development community.
While there has been much progress, the challenges of reconstruction and rebuilding in Aceh after the tsunami and confl ict remain daunting. There is also a growing conviction that one of the best ways of addressing local infrastructure and household needs is to empower and give resources to citizens, allowing them to prioritize needs and manage their own activities through community-development approaches. Community-driven development (CDD) is an approach that allows communities to take control over the planning, decision-making, management and use of development funds.
To provide an accurate overview of the current condition of Acehnese villages, the Kecamatan Development Program (KDP)—the largest government community development program in Aceh—undertook an assessment of the infrastructure status and the social situation throughout the province. KDP is a national GoI program, implemented by the Ministry of Home Aff airs. KDP has been active in Aceh since 1998, and the program scaled up its assistance to every rural village in Aceh following the 2004 tsunami. Using KDP facilitators at the village, kecamatan, and district levels, the assessment was implemented in all KDP rural villages in Aceh, covering 5,698 villages, 221 sub-districts (kecamatan) and 18 districts (17 kabupaten and 1 kota).1
The information gathered from this survey will be incorporated directly into the village visioning and planning of KDP, and help to guide villages in their own planning and resource allocation. Also, the data collected through the assessment will be made available to government agencies, donors, NGOs, researchers, communities and others, and will serve as a resource to guide the planning and resource allocation of initiatives throughout the province.
1 The number of KDP villages in Aceh is based on the Regional Management Unit (RMU) estimation in September 2006.
CHAPTER 1: INTRODUCTION
132006 Village Survey In Aceh An Assesssment of Village Infrastructure and Social Conditions March 2007
1.2 AIMS of THE ACEH VILLAGE SURVEY
The main objective of the Aceh Village Survey is to improve the understanding of development needs in Acehnese communities. This will feed directly into KDP village visioning and implementation, and help to guide communities in their own planning and resource allocation. The survey:
Provides comprehensive data on village infrastructure damage and needs, which will guide development of reconstruction programs in 2007 and beyond; and Provides an understanding of social dynamics in each village, which will enable better tailoring of future programs.
Box 1.1 What is the Kecamatan Development Program?
The Kecamatan Development Program (KDP) is a national Government of Indonesia program aimed at alleviating poverty, strengthening local government and community institutions, and improving local governance. KDP is implemented by the Ministry of Home Aff airs, Community Development offi ce (PMD). The program is funded through government budget allocations, donor grants and loans from the World Bank.
The ultimate aim of the Aceh Village Survey is to support community development in Aceh and provide relevant information to donors and government agencies for their medium-term programs to promote the peace and reconstruction process in the province.
Many NGOs, agencies, and donors are undertaking assessments and surveys in Aceh, collecting information on the confl ict, the tsunami, and the general conditions
throughout the province. The Aceh Village Survey will complement many of these past and ongoing eff orts. However, the Aceh Village Survey is diff erent in three important respects:
The Aceh Village Survey was implemented in nearly all villages in Aceh. KDP operates in 221 of the 226 kecamatan in Aceh or 5,698 villages. The Aceh Village Survey is the only survey or assessment implemented to date that will collect information on both infrastructure and social indicators with such a broad coverage in Aceh province. This will enable accurate comparisons across villages, kecamatan, and district.The data will be owned by the villages. In addition to being entered into a central database, the information collected will complement existing information at the village level. As these data will be owned by the villages, they will serve as an important tool in village planning and resource allocation.The assessment uses local experts to collect the information. The assessment was implemented using KDP mechanisms. The KDP village facilitators, who are local volunteers residing in the villages, were the enumerators for the survey, supported by consultants at the kecamatan level. These village facilitators have far better knowledge of existing conditions than external enumerators, and know the personalities and resource people in their villages. It is hoped that this has enabled the survey to collect more accurate and locally derived data.
1.3 MAIN COMPONENTS of THE SURVEY
The Aceh Village Survey consists of two components: a social assessment and an infrastructure assessment. Both components are implemented in all KDP villages in Aceh.
Social Assessment
Reintegration and reconstruction programs should address both material and social needs. Understanding social relations at the local level and how these are impacted by the return of former combatants, prisoners, and other population groups is critical for working through the multiple issues involved in delivering aid in a post-confl ict environment. The social assessment consists of four key informant questionnaires for completion by: the village head; a youth leader; a women’s representative; and a primary school principal.
•
•
•
•
•

CHAPTER 1: INTRODUCTION
14 2006 Village Survey In Aceh An Assesssment of Village Infrastructure and Social Conditions March 2007
A total of some 22,300 village respondents were interviewed for this survey. The main information collected is:
General village information: This component includes data on population, poverty, and employment.Internally Displaced People (IDPs): This component provides an overview of tsunami and confl ict IDPs, their numbers, living conditions, and economic status.Information: This component identifi es information needs and gaps in demand and supply of information. Village needs: This component provides a snapshot of the communities’ development needs. Social Capital: This component includes inclusion/exclusion, collective action, participation, and trust. Education: The education module is based upon interviews with school principals and provides basic school information, such as numbers of teachers and students and main needs in the education sector.
Selection of Respondents
To strike a balance between the need for detailed data from a cross-selection of villages and the capacity and time availability of the enumerators, the social component was implemented using key respondent surveys rather than a broader sampling at the household level. The respondents were chosen to ensure representation from the village leadership, youth, and women. Again, to ensure easier implementation in the fi eld a choice was made to use the same questionnaires for each of these three respondent groups, with the exception of an additional module on village characteristics asked only to the village head. While this means some loss in terms of data richness, it was deemed necessary to ensure manageability and good quality of the data collected. In addition to the three main key informant surveys, a brief separate module was used to interview school principals and assess the current status of primary schools.
Village headsLocal community leaders are the key dispute-resolution actors. Even for GAM-GoI related confl icts, the village heads often played a key role, for example in negotiating in kidnapping cases and settling disputes related to extortion. Their participation in socializing and monitoring the peace process, as well as facilitating the trust required for development projects, is crucial.
Youth leadersThe youth leader provides the perspective of the young population in Aceh. The participation of youth in the community development process is particularly important, as this population group is largely aff ected by the reintegration process and will also form the future leadership in the province.
Women’s representativesWomen are often marginalized in the development process in Aceh. They are also the ones who spend most time at home in the village, so they know the social dynamics well. The views of women provide important insights into village development planning and community needs.
A total of some 22,300 respondents (village heads, women’s leaders, youth leaders, and school heads) in 5,587 rural villages of Aceh were interviewed for this survey.2
Research instrumentsThe table below provides an overview of the questions asked for the various respondents. The key informant questionnaires are included in Annex 1.
2 This calculation is based on the total number of questionnaires returned by the village facilitators.
•
•
•
•••
CHAPTER 1: INTRODUCTION
152006 Village Survey In Aceh An Assesssment of Village Infrastructure and Social Conditions March 2007
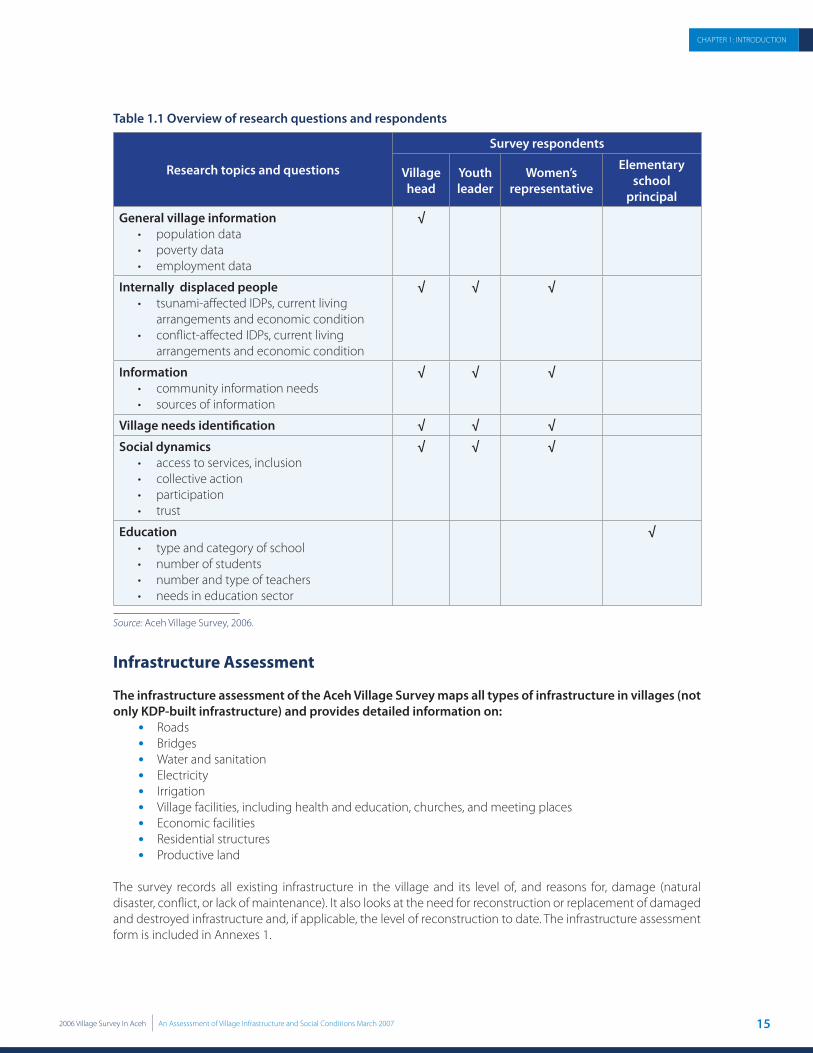
Table 1.1 Overview of research questions and respondents
Research topics and questions
Survey respondents
Village head
Youth leader
Women’s representative
Elementary school
principal
General village information• population data• poverty data• employment data
√
Internally displaced people• tsunami-aff ected IDPs, current living
arrangements and economic condition• confl ict-aff ected IDPs, current living
arrangements and economic condition
√ √ √
Information• community information needs• sources of information
√ √ √
Village needs identifi cation √ √ √
Social dynamics• access to services, inclusion• collective action• participation• trust
√ √ √
Education• type and category of school• number of students• number and type of teachers• needs in education sector
√
Source: Aceh Village Survey, 2006.
Infrastructure Assessment The infrastructure assessment of the Aceh Village Survey maps all types of infrastructure in villages (not only KDP-built infrastructure) and provides detailed information on:
RoadsBridgesWater and sanitationElectricityIrrigationVillage facilities, including health and education, churches, and meeting placesEconomic facilitiesResidential structuresProductive land
The survey records all existing infrastructure in the village and its level of, and reasons for, damage (natural disaster, confl ict, or lack of maintenance). It also looks at the need for reconstruction or replacement of damaged and destroyed infrastructure and, if applicable, the level of reconstruction to date. The infrastructure assessment form is included in Annexes 1.
•••••••••

16 2006 Village Survey In Aceh An Assesssment of Village Infrastructure and Social Conditions March 2007
02CHAPTER 2
Survey Methodology
CHAPTER 2: SURVEY METHODOLOGY
18 2006 Village Survey In Aceh An Assesssment of Village Infrastructure and Social Conditions March 2007
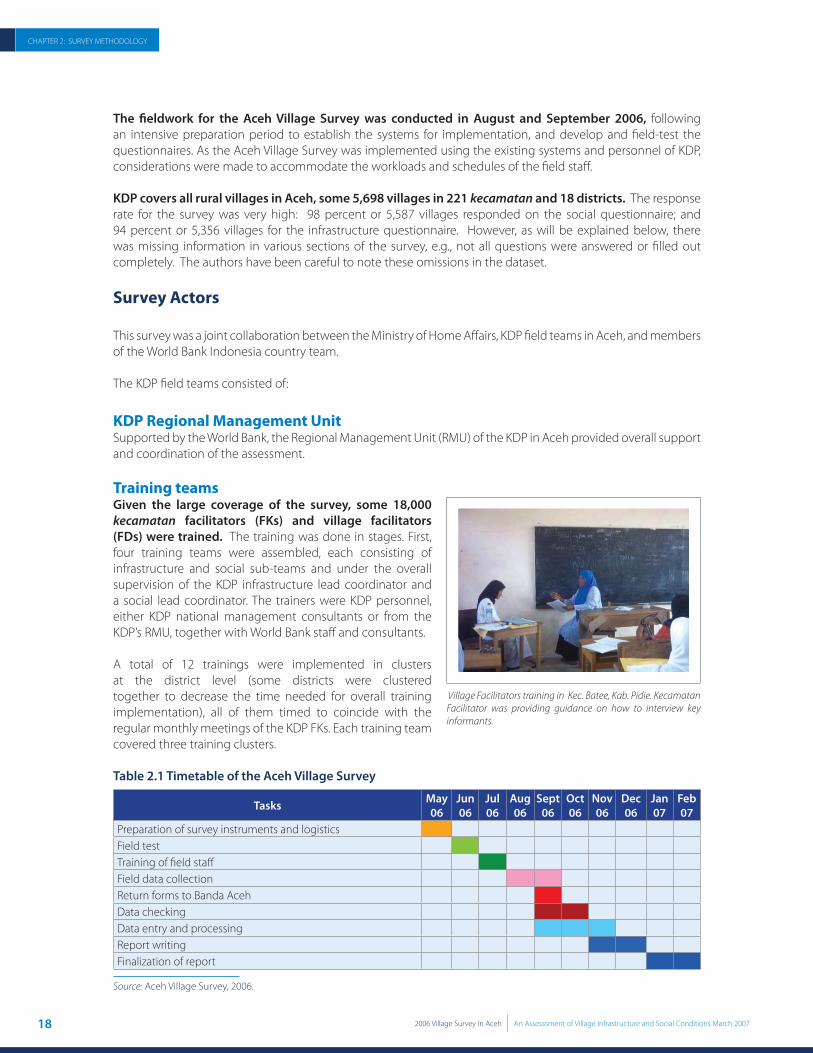
The fi eldwork for the Aceh Village Survey was conducted in August and September 2006, following an intensive preparation period to establish the systems for implementation, and develop and fi eld-test the questionnaires. As the Aceh Village Survey was implemented using the existing systems and personnel of KDP, considerations were made to accommodate the workloads and schedules of the fi eld staff .
KDP covers all rural villages in Aceh, some 5,698 villages in 221 kecamatan and 18 districts. The response rate for the survey was very high: 98 percent or 5,587 villages responded on the social questionnaire; and 94 percent or 5,356 villages for the infrastructure questionnaire. However, as will be explained below, there was missing information in various sections of the survey, e.g., not all questions were answered or fi lled out completely. The authors have been careful to note these omissions in the dataset.
Survey Actors
This survey was a joint collaboration between the Ministry of Home Aff airs, KDP fi eld teams in Aceh, and members of the World Bank Indonesia country team.
The KDP fi eld teams consisted of:
KDP Regional Management UnitSupported by the World Bank, the Regional Management Unit (RMU) of the KDP in Aceh provided overall support and coordination of the assessment.
Training teamsGiven the large coverage of the survey, some 18,000 kecamatan facilitators (FKs) and village facilitators (FDs) were trained. The training was done in stages. First, four training teams were assembled, each consisting of infrastructure and social sub-teams and under the overall supervision of the KDP infrastructure lead coordinator and a social lead coordinator. The trainers were KDP personnel, either KDP national management consultants or from the KDP’s RMU, together with World Bank staff and consultants.
A total of 12 trainings were implemented in clusters at the district level (some districts were clustered together to decrease the time needed for overall training implementation), all of them timed to coincide with the regular monthly meetings of the KDP FKs. Each training team covered three training clusters.
Table 2.1 Timetable of the Aceh Village Survey
Tasks May 06
Jun 06
Jul 06
Aug 06
Sept 06
Oct 06
Nov 06
Dec 06
Jan 07
Feb 07
Preparation of survey instruments and logisticsField testTraining of fi eld staff Field data collectionReturn forms to Banda AcehData checkingData entry and processingReport writingFinalization of report
Source: Aceh Village Survey, 2006.
Village Facilitators training in Kec. Batee, Kab. Pidie. Kecamatan Facilitator was providing guidance on how to interview key informants.
Village Facilitators training in Kec. Batee, Kab. Pidie. Kecamatan Facilitator was providing guidance on how to interview key informants.

192006 Village Survey In Aceh An Assesssment of Village Infrastructure and Social Conditions March 2007
CHAPTER 2: SURVEY METHODOLOGY
KDP district facilitators (KMKabs)The KMKabs are the kabupaten (district) level managers of the KDP. They provided the overall coordination and supervision of the Aceh Village Survey at the district level. They had the primary responsibility for organizing and supporting the FK trainings and for coordinating with the KDP training teams and the RMU on the overall implementation of the assessment. The KMKabs also had the responsibility for collecting all questionnaires from the FKs and conducting spot-checks before submitting them to the RMU at the September 2006 KMKab meeting in Banda Aceh.
KDP kecamatan facilitators (FKs)The FKs are the kecamatan facilitators of the KDP and each kecamatan has one social facilitator (FDs) and one or two technical facilitators (FTs), depending on size and access. The FTs and FKs were the main trainers for the assessment. The FTs were responsible for training one FD and one project technical implementation team (TPK) from each village on the procedures for implementing the infrastructure assessment. The FKs were responsible for training one FD from each village in implementing the social assessment.
The FKs/FTs were given a “Training of Trainers” by the training teams. Following this, they were responsible for organizing the village-level training, providing overall support and coordination throughout the implementation of the survey, conducting spot-checks in the villages, and collecting the questionnaires from the village level actors, and submitting these to the KMKabs at their monthly meeting at the district level.
KDP village facilitators (FDs) and Village Implementation Teams (TPKs)Methodologies and data collection methods were purposefully kept simple in order to allow for local village representatives to serve as the enumerators. One KDP village facilitator (FD), together with one Village Implementation Team (TPK), had the responsibility for implementing the infrastructure component. Another FD had the responsibility for implementing the social component and interviewing the key informants.
The KDP kecamatan facilitators trained the FDs and TPKs in the survey procedures. Training was given at the kecamatan level and scheduled to coincide with the monthly FD meetings.
Following the training, the FDs were given a window of time to practice and implement the survey. They were also responsible for bringing all the completed questionnaires to their FKs/FTs within a given deadline.
Data entering and cleaningOnce the KDP village facilitators completed the survey, the survey forms were sent up through the kecamatan facilitators to the KMKabs and the RMU in Banda Aceh. A data team then counted up the survey forms and conducted a randomized paper review of about 30 percent of the survey forms to check on the completeness of the forms.
Forms were then handed over to the Acehnese data management organization, Garansi, to enter the data, clean the data, and prepare requested tabulations. The full datasets and tabulations were handed over to the World Bank survey report team for analysis and reporting.
The World Bank IndonesiaThe World Bank Indonesia team provided overall guidance, oversight, and research analysis for this survey. The World Bank team for this survey was composed of staff members and consultants from the Social Development and Poverty Reduction and Economics Management (PREM) units of the World Bank Indonesia country team.
The survey design was done jointly by the Ministry of Home Aff airs and the World Bank.
Box 2.1 Who are the FDs?
Villagers elect FDs, or village facilitators (one man, one woman), who assist with the KDP socialization and planning process. The facilitators hold group meetings, including separate women’s meetings, to discuss the needs of the village and its development priorities.
CHAPTER 2: SURVEY METHODOLOGY
20 2006 Village Survey In Aceh An Assesssment of Village Infrastructure and Social Conditions March 2007
Data Cleaning issues
The survey team experienced several data cleaning issues prior to analysis. Among the most common were:
Careful attention had to be given to ensuring that “0” and “missing values” were not mixed up. In cases where answers were not completed, the survey analysis team was very careful to document the number of respondents for each variable.For several of the categories with numerical “facts”, e.g, percentage of poor population, careful checking was done to ensure that there were no discrepancies in the information. For records with serious discrepancies, e.g, number of poor households was listed as much greater than the village household population, these data were considered “missing data” and set aside in the calculations.Some duplicate and empty records were found and subsequently eliminated. For infrastructure data, the analysis team checked the reasonableness of the data related to measurement units. Although the units of measure should have been entered automatically, sometimes the fi eld worker had a diff erent unit of measure in mind. For example, the unit used to record health clinics was in the number of clinics. However, there were cases where the clinic was recorded in square meters instead. These kinds of data errors in many cases could be converted because the analysis team understood common conditions in the fi eld.The measurement of the infrastructure status was broken down into undamaged and four degrees or magnitudes of damage, as well as three causes of damage. The total amount of damaged infrastructure based on the four degrees of damage should be equal to the total amount based on causes of damage. If not the same, these had to be corrected, even though the original fi eld forms were not available. This required a background in the likely degrees of damage from each potential cause of damage. Each damaged infrastructure from the dataset should have data about its current status. Damaged infrastructure had two possibilities: it had not been repaired or replaced, or it was undergoing repair or replacement. If it was already repaired, it would not be counted as damaged infrastructure, but rather would have been characterized as having fi nished repairs. This was sometimes not fi lled in correctly, so that the fi gure for damage had to be reduced by the fi nished amount by the analysis team, and the total of undamaged infrastructure had to be increased by an equal amount.
In all cases, the survey analysis team made every eff ort to check and validate all data fi elds for this survey.
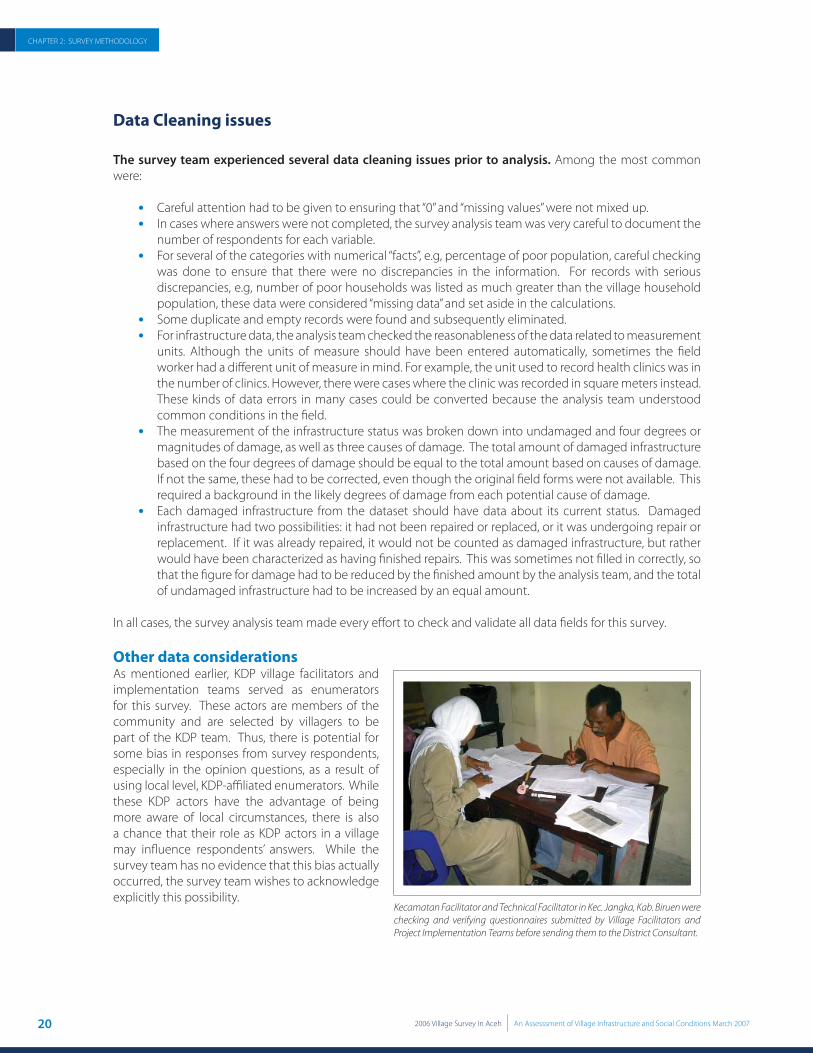
Other data considerationsAs mentioned earlier, KDP village facilitators and implementation teams served as enumerators for this survey. These actors are members of the community and are selected by villagers to be part of the KDP team. Thus, there is potential for some bias in responses from survey respondents, especially in the opinion questions, as a result of using local level, KDP-affi liated enumerators. While these KDP actors have the advantage of being more aware of local circumstances, there is also a chance that their role as KDP actors in a village may infl uence respondents’ answers. While the survey team has no evidence that this bias actually occurred, the survey team wishes to acknowledge explicitly this possibility.
••
•
••
•
•
Kecamatan Facilitator and Technical Facilitator in Kec. Jangka, Kab. Biruen were checking and verifying questionnaires submitted by Village Facilitators and Project Implementation Teams before sending them to the District Consultant.
Kecamatan Facilitator and Technical Facilitator in Kec. Jangka, Kab. Biruen were checking and verifying questionnaires submitted by Village Facilitators and Project Implementation Teams before sending them to the District Consultant.
03CHAPTER 3
General Village Information
22 2006 Village Survey In Aceh An Assesssment of Village Infrastructure and Social Conditions March 2007
CHAPTER 3: GENERAL VILLAGE INFORMATION
The fi rst module in the survey asked 11 questions to village heads regarding general socio-economic characteristics of their villages. It also explored the level of dependency at the village level (e.g.: dependent households, orphans, out-of-school children), and issues of employment and work. The variables were:
Village population (male, female)Number of households (HHs) in the villageHHs that share residence with their parents/family HHs that can aff ord only one meal per dayHHs that receive zakat donationsPoor HHsOrphansSchool-aged chidren who have not enrolled at school or who are not attending schoolOccupationsPersons age 15 and above who are not currently employedPersons at productive age (between 15 and 55 years old)3
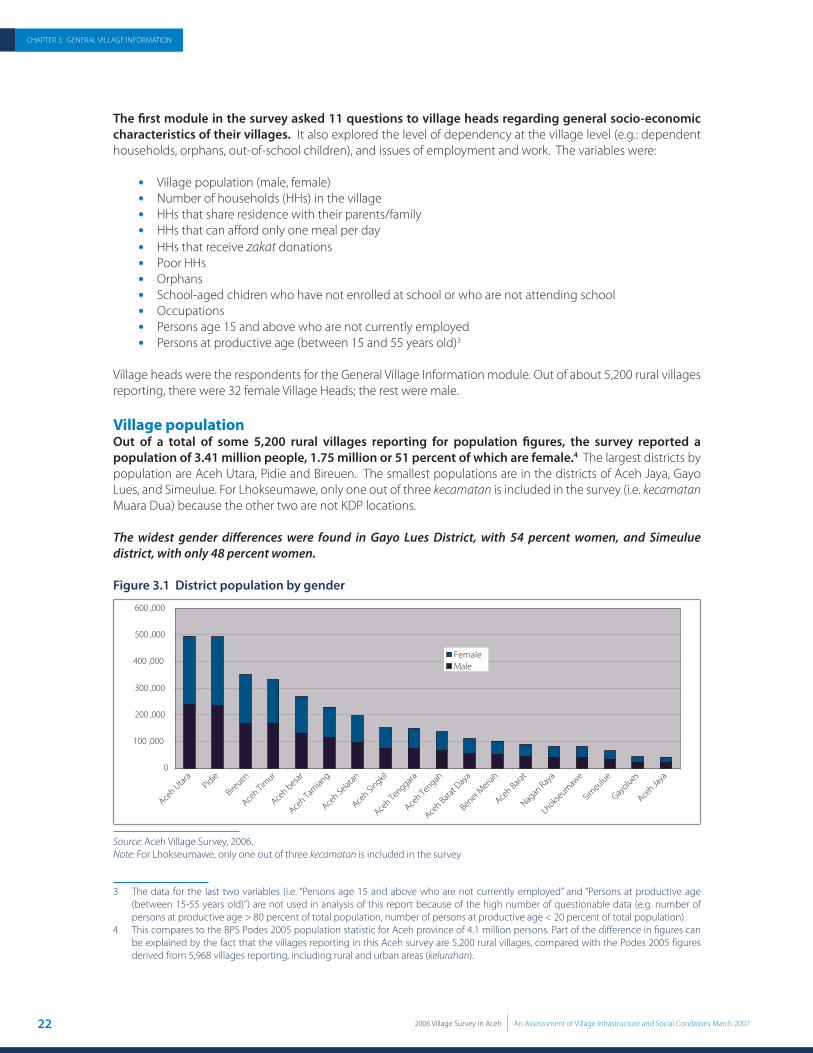
Village heads were the respondents for the General Village Information module. Out of about 5,200 rural villages reporting, there were 32 female Village Heads; the rest were male.
Village populationOut of a total of some 5,200 rural villages reporting for population fi gures, the survey reported a population of 3.41 million people, 1.75 million or 51 percent of which are female.4 The largest districts by population are Aceh Utara, Pidie and Bireuen. The smallest populations are in the districts of Aceh Jaya, Gayo Lues, and Simeulue. For Lhokseumawe, only one out of three kecamatan is included in the survey (i.e. kecamatan Muara Dua) because the other two are not KDP locations.
The widest gender diff erences were found in Gayo Lues District, with 54 percent women, and Simeulue district, with only 48 percent women.
Figure 3.1 District population by gender
0
100 ,000
200 ,000
300 ,000
400 ,000
500 ,000
600 ,000
Aceh U
tara
Bireuen
Pidie
Aceh Tim
ur
Aceh besar
Aceh Tam
iang
Aceh Selat
an
Aceh Singkil
Aceh Tenggara
Aceh Tengah
Aceh Bara
t Day
a
Bener Meria
h
Aceh Bara
t
Nagan
Raya
Lhokse
umawe
Simeulue
Gayolues
Aceh Ja
ya
FemaleMale
Source: Aceh Village Survey, 2006.Note: For Lhokseumawe, only one out of three kecamatan is included in the survey
3 The data for the last two variables (i.e. “Persons age 15 and above who are not currently employed” and “Persons at productive age (between 15-55 years old)”) are not used in analysis of this report because of the high number of questionable data (e.g. number of persons at productive age > 80 percent of total population, number of persons at productive age < 20 percent of total population).
4 This compares to the BPS Podes 2005 population statistic for Aceh province of 4.1 million persons. Part of the diff erence in fi gures can be explained by the fact that the villages reporting in this Aceh survey are 5,200 rural villages, compared with the Podes 2005 fi gures derived from 5,968 villages reporting, including rural and urban areas (kelurahan).
•••••••••••

232006 Village Survey In Aceh An Assesssment of Village Infrastructure and Social Conditions March 2007
CHAPTER 3: GENERAL VILLAGE INFORMATION
Number of households that stay with parents/familiesThe number of HHs staying with parents/families is 111,145, or about 14 percent of the total. The highest numbers of dependent households are found in Pidie (25,007 families); Aceh Utara (15,534 families); and Bireuen (11,082 families). The highest percentages of dependent families are found in Pidie (21.7 percent), Aceh Barat Daya (17.6 percent), and Aceh Selatan (16.6 percent)
Households that eat only once a dayThe number of households that can only aff ord to eat one meal per day is 18,818, or about 2.4 percent of the total. Out of 4,530 villages reporting, 1,055 villages or 23 percent reported some cases of HHs that could only aff ord to eat one meal per day. The greatest concentrations were in Pidie (3,250 HHs), followed by Aceh Utara (2,259 HHs), Bireuen (2,221 HHs) and Aceh Timur (1,926 HHs). As a percentage of district population, Gayo Lues had the highest rate with 5.1 percent of the district population, followed by Aceh Barat (3.1 percent) and Bener Meriah (3.0 percent).
Households receiving zakat The survey asked how many households received mosque donations (zakat). These donations are usually given out to the poor. On average, about 190,000 households, or 23.8 percent5 of the province, receive donations. The highest numbers of households receiving donations are found in Pidie (30,489), Aceh Utara (25,359), and Aceh Besar (17,561). The highest percentages of households receiving donations are in Aceh Barat (63.2 percent), Aceh Tengah (28.3 percent), Nagan Raya (26.9 percent) and Pidie (26.4 percent).
Number of poor householdsTwenty-six percent or 207,594 HHs6 were registered by village heads as “poor HHs”. The top three districts by poverty headcount were Pidie (34,759 families); Aceh Utara (29,555 families) and Bireuen (19,777 families).7 In terms of percentage of district populations, almost all districts report that a range of 25 to 30 percent of their district populations are poor, with Nagan Raya and Gayo Lues (30.5 percent) and Pidie (30.1 percent) in the top three districts by percentage. Pidie, Aceh Utara and Bireuen are among the top fi ve districts with highest intensity of confl ict.8 of these districts, however, only Bireuen was signifi cantly impacted by the tsunami.9
On a number of relevant poverty indicators, Pidie, Aceh Utara and Bireuen districts stand out as having the highest numbers of poor.10
Number of orphansThe survey recorded 107,635 orphans11 in the province, with the most number of orphans in Pidie (17,338), Aceh Utara (15,804) and Bireuen (11,783).
School-aged children currently not enrolled or not attending schoolOut-of-school children totaled 60,313. The highest numbers of out-of-school youth are in Pidie (10,371), Aceh Utara (8,935), and Bireuen (6,384).
5 Out of 3,966 villages reporting. 6 3,610 villages reporting7 BPS Susenas 2004 data showed that poverty rate in Aceh is 28.5 percent with Aceh Utara, Pidie and Bireuen as the top three districts by
poverty headcount. 8 The confl ict intensity index categorized kecamatan in Aceh into three categories of confl ict intensity: low, medium and high. The index
for kabupaten is calculated by using weighted-average of index score of all kecamatan in the kabupaten (low = 1, medium = 2, high = 3).
9 The tsunami impact index put kecamatan in Aceh into four categories of tsunami incidence: normal, light, medium, and heavy. The kabupaten indices are calculated using the weighted-average of index score of all kecamatan in the kabupaten (normal = 0, light = 1, medium = 2, heavy = 3).
10 PODES 2005 data also showed that Aceh Utara, Pidie and Bireuen have the highest number of poor households in Aceh.11 5,079 villages reporting on orphans.

24 2006 Village Survey In Aceh An Assesssment of Village Infrastructure and Social Conditions March 2007
CHAPTER 3: GENERAL VILLAGE INFORMATION
Tabl
e 3.
1 H
ouse
hold
info
rmat
ion
by d
istr
ict
Dis
tric
tTo
tal H
Hs
Num
ber o
f de
pend
ent
HH
s
%
Dep
ende
nt
HH
s
Num
ber
of H
Hs
eat o
nce
a da
y
%
H
Hs
eat
once
a
day
Num
ber
of H
Hs
rece
ivin
g za
kat
(mos
que
dona
tion)
% H
Hs
rece
ivin
g za
kat
(mos
que
dona
tion)
Num
ber
of p
oor
HH
s
% o
f Po
or
HH
s
Num
ber
of
orph
ans
Num
ber o
f sc
hool
-age
d
chid
ren
curr
ently
no
t enr
olle
d or
no
t att
endi
ng
scho
ol
Aceh
Bar
at23
,636
3,20
513
.672
93.
114
,944
63.2
6,76
828
.64,
578
2,21
3
Aceh
Bar
at D
aya
26,3
094,
628
17.6
403
1.5
4,61
617
.56,
307
24.0
2,28
41,
648
Aceh
Bes
ar70
,526
9,75
613
.81,
864
2.6
17,5
6124
.918
,368
26.0
11,1
295,
320
Aceh
Jaya
13,4
681,
540
11.4
375
2.8
2,81
120
.93,
097
23.0
1,97
090
8
Aceh
Sel
atan
44,2
537,
333
16.6
1,03
72.
38,
846
20.0
9,85
022
.35,
738
3,44
8
Aceh
Sin
gkil
33,2
663,
567
10.7
677
2.0
7,04
321
.28,
519
25.6
4,06
62,
282
Aceh
Tam
iang
49,4
773,
637
7.4
822
1.7
9,53
619
.310
,925
22.1
4,36
02,
125
Aceh
Teng
ah32
,654
2,61
78.
083
52.
69,
245
28.3
9,18
828
.14,
441
2,79
2
Aceh
Teng
gara
35,5
163,
629
10.2
676
1.9
8,44
323
.810
,545
29.7
4,78
52,
478
Aceh
Tim
ur70
,806
9,51
713
.41,
926
2.7
16,1
4322
.818
,208
25.7
9,08
15,
321
Aceh
Uta
ra11
4,14
415
,534
13.6
2,25
92.
025
,359
22.2
29,5
5525
.915
,804
8,93
5
Bene
r Mer
iah
23,7
572,
233
9.4
711
3.0
4,99
921
.06,
531
27.5
3,71
22,
303
Bire
uen
77,6
7811
,082
14.3
2,22
12.
916
,811
21.6
19,7
7725
.511
,783
6,38
4
Gay
o Lu
es9,
465
1,49
315
.847
85.
12,
189
23.1
2,88
630
.51,
248
756
Lhok
seum
awe
20,1
391,
612
8.0
670.
31,
729
8.6
2,20
410
.960
846
2
Nag
an R
aya
20,7
293,
211
15.5
211
1.0
5,56
826
.96,
324
30.5
2,79
91,
556
Pidi
e11
5,47
625
,007
21.7
3,25
02.
830
,489
26.4
34,7
5930
.117
,338
10,3
71
Sim
eulu
e13
,708
1,54
411
.327
72.
03,
150
23.0
3,78
327
.61,
911
1,01
1
TOTA
L79
5,00
711
1,14
514
.018
,818
2.4
189,
482
23.8
207,
594
26.1
107,
635
60,3
13
Sour
ce: A
ceh
Villa
ge S
urve
y, 20
06.
Not
e: F
or L
hoks
eum
awe,
onl
y on
e ou
t of t
hree
kec
amat
an is
incl
uded
in th
e su
rvey
.
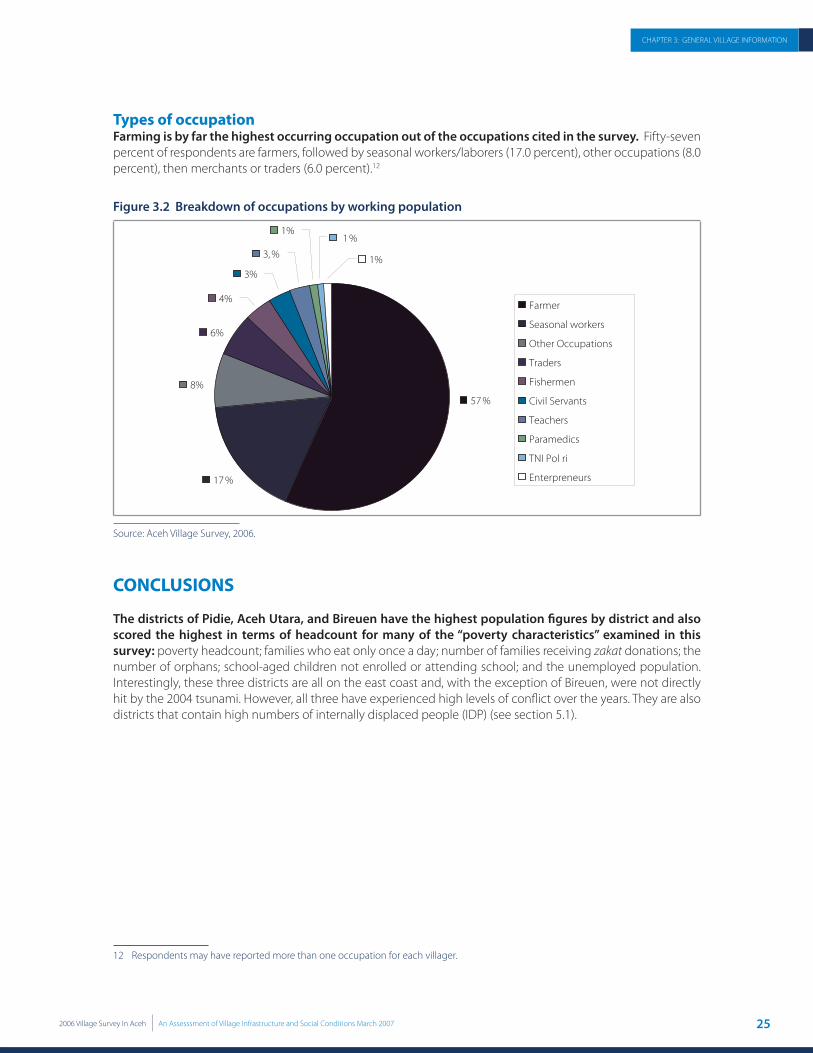
252006 Village Survey In Aceh An Assesssment of Village Infrastructure and Social Conditions March 2007
CHAPTER 3: GENERAL VILLAGE INFORMATION
Types of occupationFarming is by far the highest occurring occupation out of the occupations cited in the survey. Fifty-seven percent of respondents are farmers, followed by seasonal workers/laborers (17.0 percent), other occupations (8.0 percent), then merchants or traders (6.0 percent).12
Figure 3.2 Breakdown of occupations by working population
1%
3, %
3%
4%
6%
8%
17 %
57 %
1 %
1%
Farmer
Seasonal workers
Other Occupations
Traders
Fishermen
Civil Servants
Teachers
Paramedics
TNI Pol ri
Enterpreneurs
Source: Aceh Village Survey, 2006.
CONCLUSIONS
The districts of Pidie, Aceh Utara, and Bireuen have the highest population fi gures by district and also scored the highest in terms of headcount for many of the “poverty characteristics” examined in this survey: poverty headcount; families who eat only once a day; number of families receiving zakat donations; the number of orphans; school-aged children not enrolled or attending school; and the unemployed population. Interestingly, these three districts are all on the east coast and, with the exception of Bireuen, were not directly hit by the 2004 tsunami. However, all three have experienced high levels of confl ict over the years. They are also districts that contain high numbers of internally displaced people (IDP) (see section 5.1).
12 Respondents may have reported more than one occupation for each villager.

26 2006 Village Survey In Aceh An Assesssment of Village Infrastructure and Social Conditions March 2007

04CHAPTER 4
Infrastructure Status

28 2006 Village Survey In Aceh An Assesssment of Village Infrastructure and Social Conditions March 2007
CHAPTER 4. INFRASTRUCTURE STATUS
The infrastructure assessment evaluated the village level infrastructure situation in Aceh to document the current status of damage, causes of damage, and repair/reconstruction status. The survey examined 57 types of infrastructure that were grouped into nine main categories: roads/transportation; bridges; water and sanitation; electricity; irrigation; village facilities; economic facilities; residential structures; and productive land. This survey was based upon a previous far more modest survey carried out by KDP in March 2005 on infrastructure damaged by the earthquakes and tsunami in Aceh and Nias. While the results from this earlier survey three months after the tsunami struck were suffi cient and informative, the survey could not cover all the damaged areas at the time due to limitations in KDP coverage and personnel constraints.
For this 2006 Aceh Village Survey, the instruments and methodology were improved. The old survey instruments were reviewed and the methodology was improved to make it more accurate and complete. One instrument reviewed was the basic data collection report and another was the summary forms. It was agreed to add some new additional types of infrastructure to the survey, bringing the total to 57. The summary form was also changed to reveal three potential causes of damage—not just the tsunami as previously. These three possible causes were confl ict, natural disaster (including tsunami and earthquake), and lack of maintenance. The form was also altered to include information on the fate of damaged infrastructure, in particular whether it had been repaired or replaced at the time of the survey. The guidelines were also altered to refl ect the new instruments and forms. Explanation of the instruments and forms can be found in Box 4.1.
What is damaged and where?
The survey found that village infrastructure damage is extensive; over 50 percent of main infrastructure categories were damaged. In order to determine the cause of damage for each district, a district-level index of damage was created. The methodology used to calculate this index is shown in Box 4.2. From Table 4.1, it can be seen that the general state of infrastructure throughout is distressed. There is no district with less than 50 percent damage overall. For example, Aceh Tamiang’s index is 5.52, which means that more than 55 percent of infrastructure was in damaged condition either from confl ict, natural disaster, or lack of maintenance. The average index from all districts was 6.82. Aceh Jaya tops the list with an index of 8.88, or more than 80 percent of its infrastructure damaged. Detailed data on infrastructure damage by type of infrastructure, by extent of damage, by cause of damage, and by state of repair can be found in Annexes 3.1 and 3.2.13
On average, more than 50 percent on infrastructure was damaged in all categories. Examination of Table 4.1 for the nine main infrastructure categories shows that only three categories (i.e. productive land, housing, and electricity) sustained less than 40 percent damage in any district (i.e. have indices below 4), and these occur in only fi ve of the 18 districts. Conversely, more than 50 percent of water supply systems, irrigation systems, transportation and bridges sustained damage in all districts.
13 This survey was conducted six months before the fl ash fl oods that occurred in seven districts in Aceh in December 2006 (Aceh Tamiang, Aceh Utara, Aceh Timur, Bireuen, Bener Meriah, Gayo Lues and Aceh Tengah). Hence, the status of damaged infrastructure in those kabupaten is likely to be even worse than reported here.
Project Implementation Team measured village wooden bridge at Ds. Uning Pune, Kec. Putri Betung, Kab. Gayo LuesProject Implementation Team measured village wooden bridge at Ds. Uning Pune, Kec. Putri Betung, Kab. Gayo Lues

292006 Village Survey In Aceh An Assesssment of Village Infrastructure and Social Conditions March 2007
CHAPTER 4. INFRASTRUCTURE STATUS
The province-wide indices for six of the nine infrastructure categories (namely transport, bridges, water and sanitation systems, electricity, irrigation systems, and village facilities) are 7, meaning more than 70 percent of the infrastructure in these categories is damaged. Only housing, productive land, and economic activities are slightly lower (below 70 percent).
Table 4.1 Damage index for all causes of damage by infrastructure categories and by district
Districts
Tran
spor
t
Brid
ges
Wat
er a
nd
sani
tatio
n
Elec
tric
ity
Irri
gatio
n
Villa
ge
faci
litie
s
Econ
omic
fa
cilit
ies
Hou
sing
Prod
uctiv
e la
nd
Aver
age
Aceh Barat 7 7 8 9 7 6 7 5 6 7.40
Aceh Barat Daya 6 6 7 6 7 6 4 4 4 5.97
Aceh Besar 7 6 6 7 7 6 5 4 3 6.04
Aceh Jaya 9 8 8 9 9 9 9 8 8 8.88
Pidie 7 6 6 4 7 7 4 5 5 6.24
Nagan Raya 8 7 6 8 8 8 4 6 8 7.50
Lhokseumawe 6 5 6 10 9 7 4 5 7 6.96
Aceh Utara 7 6 7 8 7 7 6 6 4 6.74
Aceh Selatan 8 7 7 9 8 7 6 4 8 7.55
Aceh Tenggara 8 9 8 7 8 7 6 4 3 7.09
Aceh Timur 7 7 7 6 8 8 6 5 5 7.31
Gayo Lues 8 8 6 6 8 9 6 7 7 7.73
Aceh Tamiang 5 6 6 4 7 6 4 3 2 5.52
Aceh Tengah 6 7 7 3 7 7 5 3 5 6.12
Bener Meriah 7 8 7 9 6 8 9 5 6 7.73
Bireuen 7 7 7 8 8 8 6 6 6 7.32
Aceh Singkil 6 7 8 3 8 7 6 5 7 6.77
Simeulue 7 7 7 6 8 8 7 8 7 7.66
Province-wide 7 7 7 7 7 7 6 5 5 6.82
Source: Aceh Village Survey, 2006. Note: For Lhokseumawe, only one out of three kecamatan is included in the survey.
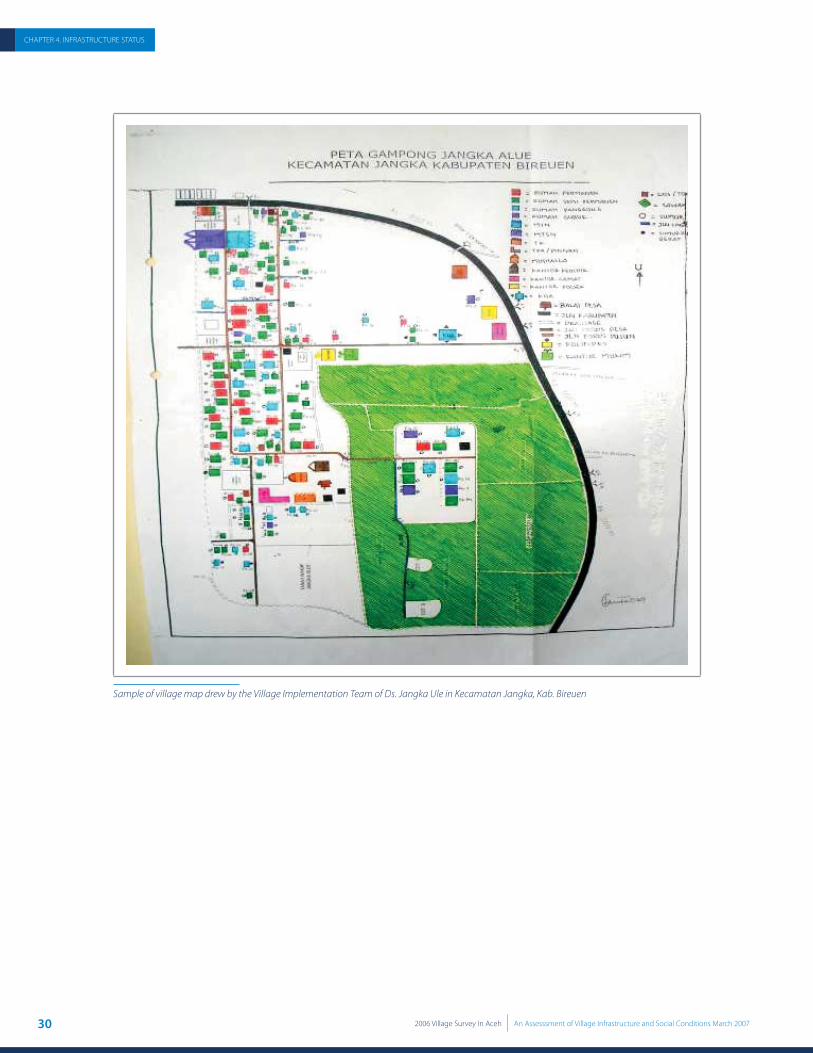
30 2006 Village Survey In Aceh An Assesssment of Village Infrastructure and Social Conditions March 2007
CHAPTER 4. INFRASTRUCTURE STATUS
Sample of village map drew by the Village Implementation Team of Ds. Jangka Ule in Kecamatan Jangka, Kab. Bireuen
312006 Village Survey In Aceh An Assesssment of Village Infrastructure and Social Conditions March 2007
CHAPTER 4. INFRASTRUCTURE STATUS
Box 4.1 Explanation of reporting damage
Explanation about the degree of damageEach piece of infrastructure was recorded along with its degree of damage, with the understanding that some infrastructure could be subdivided into a number of portions or segments of diff erent degree. For example, a 500-meter road could consist of 100 meters of undamaged road, 100 meters with minor damage, and 300 meters of heavy damage. When a volume was recorded as a single unit, then it could only appear in a single category.
Not damaged Still fully functional or already repairedLightly damaged Damaged, but still usable while awaiting repairsHeavily damaged Damaged enough to make it fully or nearly unusable, but repairableRequires replacement Damaged beyond the point of repairable, thereby requiring reconstructionAbandoned Unusable, perhaps because abandoned prior to completion. Abandonment could have
been for genuine security reasons or due to fear.
Explanation of causes of damageThis survey considered three causes of damage, and the village facilitator and technical implementation teams were asked to select a single cause for each piece or portion of infrastructure observed. There were many cases where a piece of infrastructure had been aff ected by multiple causes, but nonetheless the facilitator picked the dominant cause. For example, a piece of infrastructure had been slightly damaged due to lack of maintenance, and then was closed due to confl ict. Later the tsunami hit it. In this case confl ict should have been selected as the primary cause. The three causes of damage were as follows:
Confl ict Fighting between the GAM and TNI often paralyzed an area and pressure was applied on the local communities from both sides. Much infrastructure was damaged to prevent access to remote areas that were the base of the movement. Other facilities were damaged to hinder the enemy.
Natural disaster The 2004 tsunami aff ected 13 of the 17 kabupaten in Aceh, as well as all 4 cities (Banda Aceh, Sabang, Lhokseumawe, and Langsa). Besides the tsunami and preceding earthquake, follow-up earthquakes and other natural disasters had also occurred in Aceh, including fl oods in Aceh Tamiang and Aceh Tenggara.
Lack of maintenance Infrastructure requires maintenance, but maintenance activities would be diffi cult to guarantee given the human and fi nancial constraints. Some infrastructure therefore was in poor condition due to heavy usage and insuffi cient of maintenance.
Explanation of current statusFor purposes of this survey, damaged infrastructure could be in one of three categories at the time of the survey:
Not yet repaired Up to the time of the survey, there had been no observable eff orts to repair the damaged infrastructure. Or perhaps a small portion was fi xed but the reported amount was not yet fi xed.
Under repair At the time of the survey, the recorded amount was undergoing repairs but had not yet been fi nished.
Already repaired At the time of the survey, the damage had been repaired or the infrastructure replaced. This infrastructure should not have been counted as damaged, because at the time of the survey it was no longer damaged.
Many types of infrastructure sustained levels of more than 80 percent damage. Table 4.2 shows some types of infrastructure that suff ered more than 75 percent damage. This table distinguishes between types of infrastructure that can be found in many of the reporting villages (more than 20 percent of reporting villages have these types of infrastructure) and those that can be found in only less than 20 percent of the reporting villages.14 Infrastructure with high levels of damage include wooden bridges, drainage ditches, latrines and many types of village roads, especially those at the hamlet (dusun) level, local roads, and farm roads. District roads and village access roads were more resistant to damage, although these were still signifi cantly damaged (60-70 percent damaged). Table 4.2 includes damage from confl ict, natural disasters, as well as lack of maintenance.
14 This distinction is important to give a better measure of relative magnitude of damage. Some infrastructure types might suff er high percentage of damage but since they are only present in a small number of villages, the absolute numbers are relatively small.
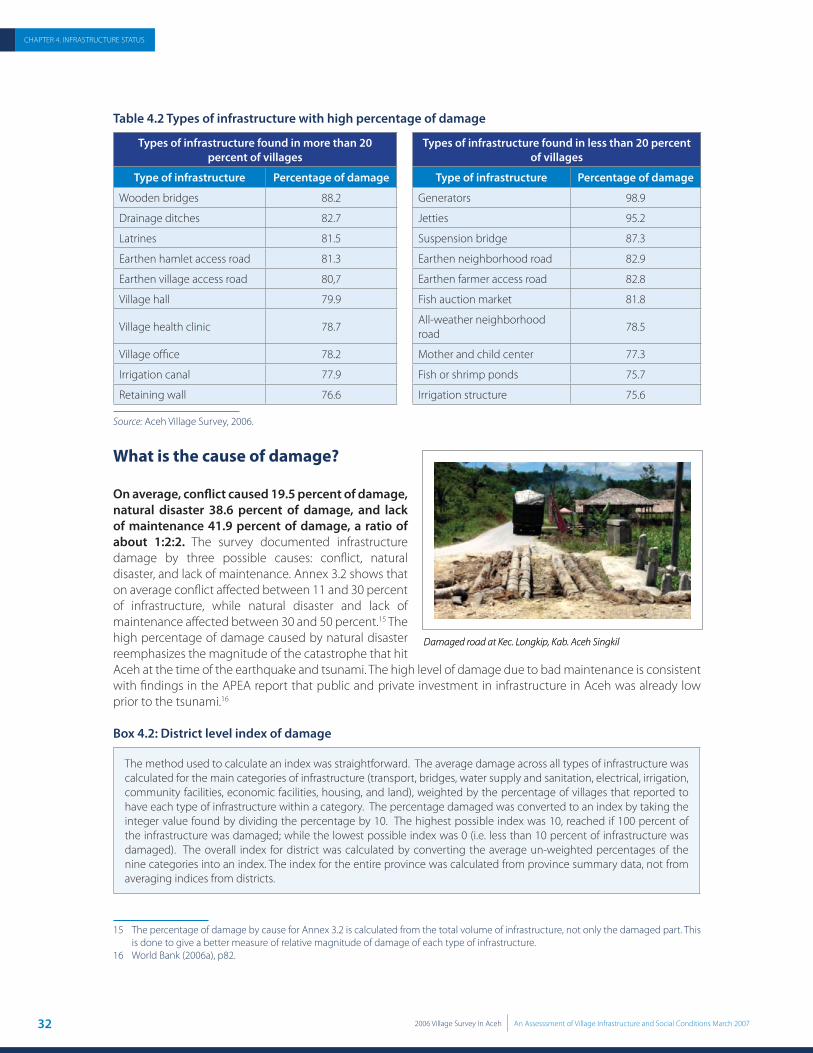
32 2006 Village Survey In Aceh An Assesssment of Village Infrastructure and Social Conditions March 2007
CHAPTER 4. INFRASTRUCTURE STATUS
Table 4.2 Types of infrastructure with high percentage of damage
Types of infrastructure found in more than 20 percent of villages
Types of infrastructure found in less than 20 percent of villages
Type of infrastructure Percentage of damage Type of infrastructure Percentage of damage
Wooden bridges 88.2 Generators 98.9
Drainage ditches 82.7 Jetties 95.2
Latrines 81.5 Suspension bridge 87.3
Earthen hamlet access road 81.3 Earthen neighborhood road 82.9
Earthen village access road 80,7 Earthen farmer access road 82.8
Village hall 79.9 Fish auction market 81.8
Village health clinic 78.7All-weather neighborhood road
78.5
Village offi ce 78.2 Mother and child center 77.3
Irrigation canal 77.9 Fish or shrimp ponds 75.7
Retaining wall 76.6 Irrigation structure 75.6
Source: Aceh Village Survey, 2006.
What is the cause of damage?
On average, confl ict caused 19.5 percent of damage, natural disaster 38.6 percent of damage, and lack of maintenance 41.9 percent of damage, a ratio of about 1:2:2. The survey documented infrastructure damage by three possible causes: confl ict, natural disaster, and lack of maintenance. Annex 3.2 shows that on average confl ict aff ected between 11 and 30 percent of infrastructure, while natural disaster and lack of maintenance aff ected between 30 and 50 percent.15 The high percentage of damage caused by natural disaster reemphasizes the magnitude of the catastrophe that hit Aceh at the time of the earthquake and tsunami. The high level of damage due to bad maintenance is consistent with fi ndings in the APEA report that public and private investment in infrastructure in Aceh was already low prior to the tsunami.16
Box 4.2: District level index of damage
The method used to calculate an index was straightforward. The average damage across all types of infrastructure was calculated for the main categories of infrastructure (transport, bridges, water supply and sanitation, electrical, irrigation, community facilities, economic facilities, housing, and land), weighted by the percentage of villages that reported to have each type of infrastructure within a category. The percentage damaged was converted to an index by taking the integer value found by dividing the percentage by 10. The highest possible index was 10, reached if 100 percent of the infrastructure was damaged; while the lowest possible index was 0 (i.e. less than 10 percent of infrastructure was damaged). The overall index for district was calculated by converting the average un-weighted percentages of the nine categories into an index. The index for the entire province was calculated from province summary data, not from averaging indices from districts.
15 The percentage of damage by cause for Annex 3.2 is calculated from the total volume of infrastructure, not only the damaged part. This is done to give a better measure of relative magnitude of damage of each type of infrastructure.
16 World Bank (2006a), p82.
Damaged road at Kec. Longkip, Kab. Aceh SingkilDamaged road at Kec. Longkip, Kab. Aceh Singkil

332006 Village Survey In Aceh An Assesssment of Village Infrastructure and Social Conditions March 2007
CHAPTER 4. INFRASTRUCTURE STATUS
The percentage of confl ict and natural-disaster related damage is strongly related with the confl ict intensity and tsunami impact indices. When correlating the percentage of damage caused by confl ict with the confl ict-intensity index, the result shows that the percentage of damage is positively related to confl ict intensity: the higher the intensity of confl ict in an area, the higher the percentage of confl ict-related infrastructure damage. The same tendency is revealed when correlating the percentage of damage caused by natural disaster with the tsunami impact index. The correlation is stronger for natural-disaster related damage.17 This is not surprising, as more infrastructures are reported damaged due to natural disaster than due to confl ict.
The degree of damage caused by lack of maintenance is less severe than the degree of damage caused by either confl ict or natural disaster. A comparison of average degree of damage for each of the three main causes shows that confl ict and natural disaster exhibit the same level of damage on average (Figure 4.1). Damage caused by lack of maintenance, however, tends to be about 15 percent less severe on average. These fi gures were calculated by averaging damage from 20,000 cases in fi ve districts where damage was caused by only one of these three causes.18
What types of infrastructure have the highest share of damage caused by confl ict, natural disaster or lack of maintenance?
Economic-related infrastructure has the highest share of damage as a result of confl ict. Table 4.3 below indicates fi ve types of infrastructure with the highest shares of damage caused by confl ict. Economic assets such as fi sh/shrimp ponds and fi elds are among infrastructure with the highest shares of damage caused by confl ict (26.6 and 23 percent, respectively). Table 4.4 shows types of infrastructure with lowest shares of damage caused by confl ict. These are mainly from the water and sanitation category. The damage could have been caused by GAM or TNI, as a result of fi ghting or abandonment. Although school damage in Aceh is generally associated with confl ict, more schools are reported damaged due to natural disaster and lack of maintenance than due to confl ict. of about 2,000 villages responding, only 12-18 percent reported schools damaged due to confl ict.19 Around 20-24 percent of schools were damaged due to natural disaster, while 25-30 percent reported damage caused by lack of maintenance.
17 Correlation for confl ict related damage with confl ict intensity index is 0.47 while correlation for natural disaster damage with tsunami impact index is 0.56. Both correlation analyses are done at kecamatan level and are signifi cant at 0.01 level. Again, the percentage of damage by cause is calculated as share of total volume of infrastructure.
18 Cause of damage by confl ict only = 9,687 cases; by natural disaster only = 21,270 cases; by lack of maintenance only = 25,531 cases.19 There were four type of schools asked in this survey: primary, middle, high, and pre-school. Of these, primary schools were reported to
have the highest percentage of damage due to confl ict (18.1 percent) while middle schools reported the lowest percentage of 12.7 percent.
Figure 4.1 Average degree of infrastructure damage by cause of damage
0%
20%
40%
60%
80%
100%
LightD amage 24.1% 24.9% 36.3%Heavy damage 37.1% 38.6% 29.2%Need replacement 21.1% 20.5% 12.4%
NaturalDisaster
Lack ofMaintenance
Source: Aceh Village Survey, 2006.
Figure 4.1 Average degree of infrastructure damage by cause of damage
0%
20%
40%
60%
80%
100%
LightD amage 24.1% 24.9% 36.3%Heavy damage 37.1% 38.6% 29.2%Need replacement 21.1% 20.5% 12.4%
NaturalDisaster
Lack ofMaintenance
Source: Aceh Village Survey, 2006.
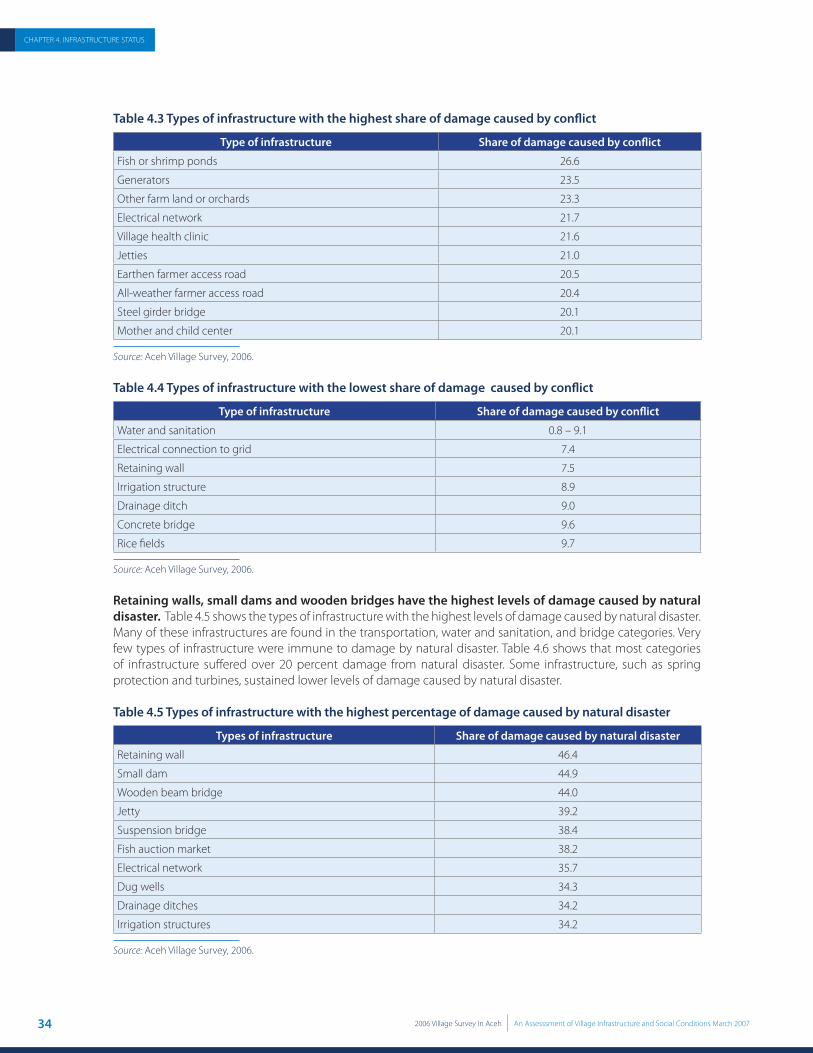
34 2006 Village Survey In Aceh An Assesssment of Village Infrastructure and Social Conditions March 2007
CHAPTER 4. INFRASTRUCTURE STATUS
Table 4.3 Types of infrastructure with the highest share of damage caused by confl ict
Type of infrastructure Share of damage caused by confl ict
Fish or shrimp ponds 26.6
Generators 23.5
Other farm land or orchards 23.3
Electrical network 21.7
Village health clinic 21.6
Jetties 21.0
Earthen farmer access road 20.5
All-weather farmer access road 20.4
Steel girder bridge 20.1
Mother and child center 20.1
Source: Aceh Village Survey, 2006.
Table 4.4 Types of infrastructure with the lowest share of damage caused by confl ict
Type of infrastructure Share of damage caused by confl ict
Water and sanitation 0.8 – 9.1
Electrical connection to grid 7.4
Retaining wall 7.5
Irrigation structure 8.9
Drainage ditch 9.0
Concrete bridge 9.6
Rice fi elds 9.7
Source: Aceh Village Survey, 2006.
Retaining walls, small dams and wooden bridges have the highest levels of damage caused by natural disaster. Table 4.5 shows the types of infrastructure with the highest levels of damage caused by natural disaster. Many of these infrastructures are found in the transportation, water and sanitation, and bridge categories. Very few types of infrastructure were immune to damage by natural disaster. Table 4.6 shows that most categories of infrastructure suff ered over 20 percent damage from natural disaster. Some infrastructure, such as spring protection and turbines, sustained lower levels of damage caused by natural disaster.
Table 4.5 Types of infrastructure with the highest percentage of damage caused by natural disaster
Types of infrastructure Share of damage caused by natural disaster
Retaining wall 46.4
Small dam 44.9
Wooden beam bridge 44.0
Jetty 39.2
Suspension bridge 38.4
Fish auction market 38.2
Electrical network 35.7
Dug wells 34.3
Drainage ditches 34.2
Irrigation structures 34.2
Source: Aceh Village Survey, 2006.

352006 Village Survey In Aceh An Assesssment of Village Infrastructure and Social Conditions March 2007
CHAPTER 4. INFRASTRUCTURE STATUS
Table 4.6 Share of infrastructure damage from disasters by category of infrastructure
Category Percent of damage Types of infrastructure with lower percentage of damage for each category
Transportation > 25
Bridges > 30
Water and sanitation > 25 Spring protection (4.5 percent)
Irrigation > 30
Electrical > 24 Turbines (14.3 percent)
Village facilities > 18
Economic facilities > 15
Housing >18
Productive land > 18
Source: Aceh Village Survey, 2006.
Generators, latrines and pre-schools are types of infrastructure with the highest percentage of damage caused by lack of maintenance. Table 4.7 shows infrastructure with high shares of damage from lack of maintenance. Lack of maintenance might be caused by overuse, and poor quality or lack of communities’ familiarity with correct usage. Conversely, Table 4.8 shows types of infrastructure with the lowest shares of damage caused by lack of maintenance. of these, turbines, connections to the electricity grid, and concrete bridges have the lowest shares of lack of maintenance-related damage.
Table 4.7 Types of infrastructure with the highest percentage of damage due to lack of maintenance
Type of infrastructure Share of damage due to lack of maintenance
Generators 48.6
Latrines 45.1
Pre-schools 40.7
Dug wells with hand pumps 39.6
Drainage ditches 39.6
Village halls 38.9
Village health clinic 38.7
Earthen neighborhood road 38.6
Public hydrant 37.9
Irrigation canal 37.5
Source: Aceh Village Survey, 2006.
Table 4.8 Types of infrastructure with the lowest percentage of damage by lack of maintenance
Type of infrastructure Share of damage due to lack of maintenance
Turbine 14.3
Connection to electrical grid 16.2
Concrete bridge 16.2
Fish or shrimp pond 16.5
Semi-permanent housing 16.6
Spring protection 16.7
Electrical network 18.0
Permanent housing 18.5
Stores or shops 19.5
Source: Aceh Village Survey, 2006.
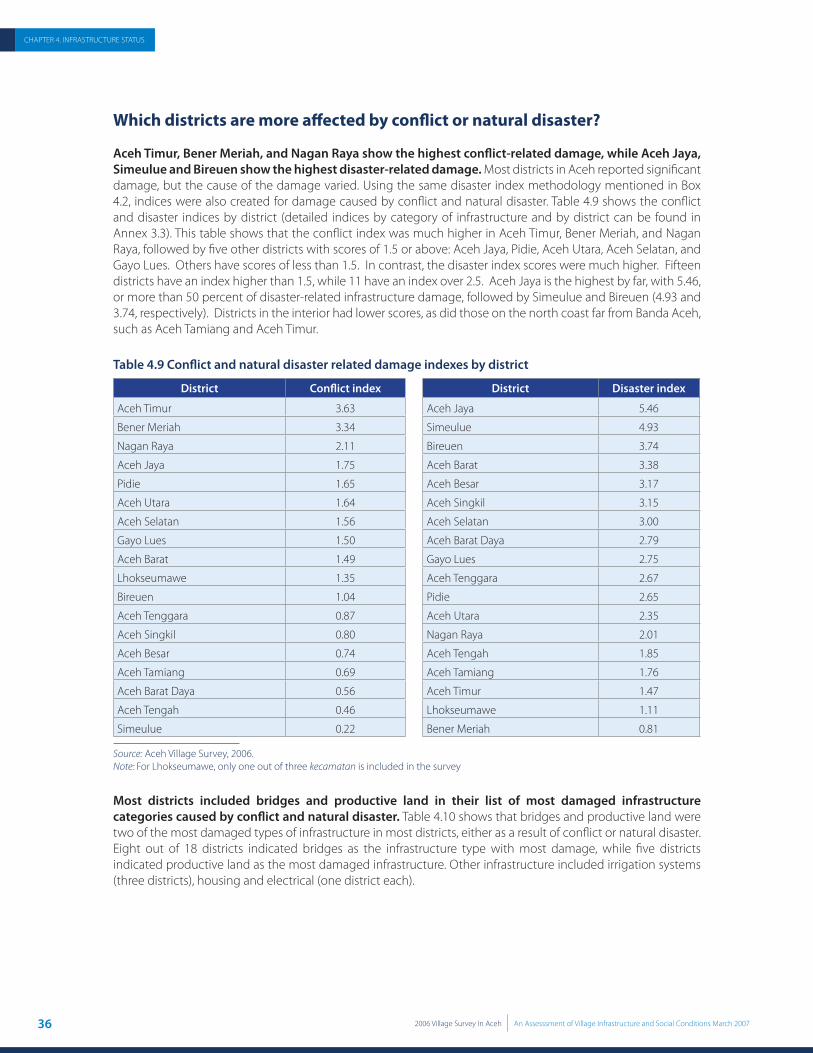
36 2006 Village Survey In Aceh An Assesssment of Village Infrastructure and Social Conditions March 2007
CHAPTER 4. INFRASTRUCTURE STATUS
Which districts are more aff ected by confl ict or natural disaster?
Aceh Timur, Bener Meriah, and Nagan Raya show the highest confl ict-related damage, while Aceh Jaya, Simeulue and Bireuen show the highest disaster-related damage. Most districts in Aceh reported signifi cant damage, but the cause of the damage varied. Using the same disaster index methodology mentioned in Box 4.2, indices were also created for damage caused by confl ict and natural disaster. Table 4.9 shows the confl ict and disaster indices by district (detailed indices by category of infrastructure and by district can be found in Annex 3.3). This table shows that the confl ict index was much higher in Aceh Timur, Bener Meriah, and Nagan Raya, followed by fi ve other districts with scores of 1.5 or above: Aceh Jaya, Pidie, Aceh Utara, Aceh Selatan, and Gayo Lues. Others have scores of less than 1.5. In contrast, the disaster index scores were much higher. Fifteen districts have an index higher than 1.5, while 11 have an index over 2.5. Aceh Jaya is the highest by far, with 5.46, or more than 50 percent of disaster-related infrastructure damage, followed by Simeulue and Bireuen (4.93 and 3.74, respectively). Districts in the interior had lower scores, as did those on the north coast far from Banda Aceh, such as Aceh Tamiang and Aceh Timur.
Table 4.9 Confl ict and natural disaster related damage indexes by district
District Confl ict index District Disaster index
Aceh Timur 3.63 Aceh Jaya 5.46
Bener Meriah 3.34 Simeulue 4.93
Nagan Raya 2.11 Bireuen 3.74
Aceh Jaya 1.75 Aceh Barat 3.38
Pidie 1.65 Aceh Besar 3.17
Aceh Utara 1.64 Aceh Singkil 3.15
Aceh Selatan 1.56 Aceh Selatan 3.00
Gayo Lues 1.50 Aceh Barat Daya 2.79
Aceh Barat 1.49 Gayo Lues 2.75
Lhokseumawe 1.35 Aceh Tenggara 2.67
Bireuen 1.04 Pidie 2.65
Aceh Tenggara 0.87 Aceh Utara 2.35
Aceh Singkil 0.80 Nagan Raya 2.01
Aceh Besar 0.74 Aceh Tengah 1.85
Aceh Tamiang 0.69 Aceh Tamiang 1.76
Aceh Barat Daya 0.56 Aceh Timur 1.47
Aceh Tengah 0.46 Lhokseumawe 1.11
Simeulue 0.22 Bener Meriah 0.81
Source: Aceh Village Survey, 2006.Note: For Lhokseumawe, only one out of three kecamatan is included in the survey
Most districts included bridges and productive land in their list of most damaged infrastructure categories caused by confl ict and natural disaster. Table 4.10 shows that bridges and productive land were two of the most damaged types of infrastructure in most districts, either as a result of confl ict or natural disaster. Eight out of 18 districts indicated bridges as the infrastructure type with most damage, while fi ve districts indicated productive land as the most damaged infrastructure. Other infrastructure included irrigation systems (three districts), housing and electrical (one district each).

372006 Village Survey In Aceh An Assesssment of Village Infrastructure and Social Conditions March 2007
CHAPTER 4. INFRASTRUCTURE STATUS
Table 4.10 Percentage of damaged infrastructure caused by confl ict and natural disaster by category of infrastructure and by district
District
Category of infrastructure
Mos
t dam
aged
Seco
nd m
ost
dam
aged
Tran
spor
ta-
tion
Brid
ges
Wat
er a
nd
sani
tatio
n
Elec
tric
al
Irri
gatio
n
Villa
ge
faci
litie
s
Econ
omic
fa
cilit
ies
Hou
sing
Prod
uctiv
e la
nd
Aceh Barat 51.95 64.58 35.81 32.69 41.67 50.62 63.81 54.24 43.16 Bridges Economic
Aceh Barat Daya 30.05 47.19 22.33 15.67 43.42 34.19 24.24 32.39 52.56 Land Bridges
Aceh Besar 43.41 56.49 28.84 56.37 42.11 32.60 26.09 30.40 35.58 Bridges Electrical
Aceh Jaya 65.26 74.41 68.94 91.89 65.58 65.34 67.40 75.64 74.14 Electrical Housing
Aceh Selatan 50.79 53.48 41.71 39.02 49.04 42.84 36.71 32.53 64.04 Land Bridges
Aceh Singkil 36.17 44.74 41.30 21.05 57.23 44.58 38.99 45.95 25.15 Irrigation Housing
Aceh Tamiang 25.65 35.82 31.08 15.86 38.21 20.28 13.02 14.55 25.38 Irrigation Bridges
Aceh Tengah 26.79 47.04 22.35 15.17 20.66 16.72 12.95 12.42 33.74 Bridges Land
Aceh Tenggara 44.11 52.92 38.69 24.27 62.03 29.18 19.44 24.58 23.12 Irrigation Bridges
Aceh Timur 58.70 65.10 31.09 53.28 57.17 51.23 53.94 43.78 44.15 Bridges Roads
Aceh Utara 41.52 49.19 38.11 18.29 40.52 38.96 44.44 40.56 47.89 Bridges Land
Bener Meriah 36.05 50.64 29.58 47.46 44.53 42.53 41.97 25.38 54.80 Land Bridges
Bireuen 51.17 66.88 56.15 34.90 52.83 50.53 40.98 45.67 31.61 Bridges Water
Gayo Lues 21.48 51.48 1.91 46.44 59.38 35.58 45.18 60.22 61.00 Land Housing
Lhokseumawe 22.90 27.20 10.00 9.38 28.88 30.57 15.46 26.86 50.64 Land V.Facilities
Nagan Raya 42.77 62.00 31.43 40.55 43.61 41.04 22.62 41.83 44.33 Bridges Land
Pidie 40.75 51.88 36.62 18.03 47.80 30.92 27.61 28.17 50.74 Bridges Land
Simeulue 55.89 63.11 37.99 28.17 22.22 73.86 57.77 80.99 43.50 Housing V.Facilities
Note: More than half of infrastructure damaged
25% - 50% of infrastructure damaged
Less than 25% of infrastructure damaged
Source: Aceh Village Survey, 2006. Note: For Lhokseumawe, only one out of three kecamatan is included in the survey.
What is the repair rate of the damaged infrastructure?
Overall, around 11 percent of damaged infrastructure has either been repaired or is currently under repair. The relative speed in undertaking repairs is strongly correlated with the cause of damage. Districts with relatively high natural-disaster damage, such as Simeulue (19.6 percent of damage under repair or already repaired), Aceh Besar, Bireuen and Aceh Jaya (more than 10 percent) were faster in carrying out repairs, while districts with relatively low natural disaster damage were much slower. The slowest was Bener Meriah, with only 4.3 percent repaired (Table 4.11). This might be due to the more comprehensive and organized reconstruction programs for tsunami-related damage undertaken by the government and development agents in these areas. Comparison was also made between the level of repair between confl ict-aff ected and natural disaster-aff ected areas. As the full data set could not be used to make this comparison, a special subset of data was prepared containing those sites aff ected only by confl ict or only by natural disaster. About 30,000 of the 80,000 records met these criteria; of these, about 70 percent are from natural disaster areas. The results can be seen in the “Percentage degree of damage and current status of repair of confl ict and natural disaster related infrastructure damage” table in Annex 3.4.

38 2006 Village Survey In Aceh An Assesssment of Village Infrastructure and Social Conditions March 2007
CHAPTER 4. INFRASTRUCTURE STATUS
Table 4.11 Percentage of damaged infrastructure replaced or under repair by district
District Percentage of infrastructure repaired or replaced
Simeulue 19.6
Aceh Besar 13.2
Bireuen 12.7
Nagan Raya 12.2
Aceh Jaya 10.9
Aceh Tengah 10.9
Aceh Selatan 10.6
Aceh Barat 10.2
Aceh Timur 10.1
Pidie 9.8
Aceh Utara 9.5
Aceh Tenggara 7.8
Aceh Barat Daya 7.5
Gayo Lues 7.5
Aceh Tamiang 7.2
Aceh Singkil 6.4
Lhokseumawe 5.6
Bener Meriah 4.3
Source: Aceh Village Survey, 2006. Note: For Lhokseumawe, only one out of three kecamatan is included in the survey.
Natural disaster-damaged infrastructure on average is being repaired about 50 percent faster than confl ict-damaged infrastructure. On average, only 6.5 percent of infrastructure damaged by confl ict is already repaired or under repair, compared with 10.2 percent for infrastructure damaged by natural disaster (Table 4.12). Annex 3.4 also shows that confl ict-damaged infrastructure is three times more likely to have been abandoned than disaster-damaged infrastructure (7.4 percent vs 2.4 percent). This might be due to the fact that more eff ort and funding have been directed to the reconstruction of post-tsunami damage. There are also diff erences in types of infrastructure that were most likely to be repaired between confl ict and natural-disaster aff ected areas. Productive land and irrigation systems were slightly more quickly tackled when confl ict-damaged, while housing and electricity were much more likely to be tackled when disaster-damaged (7.6 percent vs 19.0 percent and 4.2 percent vs 13.1 percent, respectively).
Table 4.12 Average repair rate of confl ict and natural disaster related infrastructure damage by categories
CategoriesPercentage being repaired
Confl ict Disaster
Transportation 4.1 7.2
Bridges 6.4 9.5
Water and Sanitation 7.0 10.1
Electrical 4.2 13.1
Irrigation 2.6 2.2
Village Facilities 9.6 12.2
Economic Facilities 5.0 10.3
Housing 7.6 19.0
Productive Land 14.9 12.6
Average 6.8 10.7
Source: Aceh Village Survey, 2006.

392006 Village Survey In Aceh An Assesssment of Village Infrastructure and Social Conditions March 2007
CHAPTER 4. INFRASTRUCTURE STATUS
By type of infrastructure, Puskesmas Pembantu (community health units at the village level) top the list of infrastructure that is most quickly replaced or under repair. It is important to establish which types of infrastructure have been repaired or rebuilt most quickly by communities, organizations, and the government. Table 4.13 shows the percentage of infrastructure that has been repaired or was under repair at the time of the survey, with around 25 percent of Puskesmas Pembantu already replaced or under repair. Those already repaired are no longer considered damaged infrastructure. From Table 4.13, it can also be seen that repairs to several types of infrastructure are more advanced than for others. The most advanced include those that are addressed by other development actors or by special eff orts, such as health facilities, district roads, and more elaborate bridges. These also include types of infrastructure given priority by communities and that communities are capable of repairing, such as for places of worship, schools, and fi elds.
Table 4.13 Types of infrastructure with the highest rate of replacement or repair
Types of infrastructure Percentage of infrastructure replaced or under repair
Puskesmas pembantu 25.0
Generator 23.8
Place of worship 22.0
Schools 16.1-20.6
Other fi elds/orchards 18.8
Public hydrants 18.3
Rice fi elds 180
Fish or shrimp ponds 17.0
Village hall 16.6
District road 16.6
Housing 10.8 - 18.6
Concrete bridge 14.6
Steel girder bridge 12.4
Source: Aceh Village Survey, 2006. Note: Ranges indicate different types of schools and housing
What is the estimated cost of repairing/replacing infrastructure?
The total cost estimate for repairing or replacing damaged infrastructure is estimated to be nearly Rp 12 trillion, or US$1.3 billion. This does not include infrastructure damage caused by lack of maintenance. Nearly half of this sum is for the repair or replacement of housing. The next largest amount is to restore productive land, followed by repairs or replacement of roads. Cost data were not collected during the survey, as it would have made data collection unnecessarily complicated and time consuming. However, costs were estimated based upon typical costs for building recent KDP infrastructure.20 The total costs calculated for each type of infrastructure were reduced by an amount equivalent to the percentage of infrastructure damaged due to lack of maintenance. The results of these estimates are admittedly only rough approximations, but can be used to estimate needs per type of infrastructure and overall needs (detailed calculations can be seen in Annex 3.5).
Aceh Utara, Pidie, Bireuen, Aceh Timur, and Aceh Besar have the highest shares of total costs needed for reconstruction/replacement of infrastructure. Using the same unit costs and calculation method as above, the estimated total cost needed for reconstruction was calculated for each district to provide a description of the level of infrastructure damage by district. The result in Figure 4.2 shows that Aceh Utara, Pidie, Bireuen, Aceh Timur, and Aceh Besar have the highest shares of costs, suggesting that these districts have the highest levels of damaged infrastructure requiring reconstruction/replacement.
20 Several consultation and technical meetings have been conducted with KDP District Technical Facilitators (KM Teknik) to determine the most reasonable unit costs for typical infrastructure building costs in Aceh. For some type of infrastructure such as housing, the unit cost follows recommendation from assessment done by the BRR. Same unit costs are also used in a recent Aceh Flood Damage Assessment conducted by the World Bank after the fl ooding in December 2006.

40 2006 Village Survey In Aceh An Assesssment of Village Infrastructure and Social Conditions March 2007
CHAPTER 4. INFRASTRUCTURE STATUS
Figure 4.2 Share of costs needed for infrastructure reconstruction/replacement by district
Aceh Utara 15%
Pidie 13%
Bireuen 12%
Aceh Timur 11%
Aceh Besar10%
Aceh Selatan5%
Aceh Jaya 5%
Aceh Singkil 4%
Aceh Barat 4%
Simeulue 4%
Aceh Tamiang 3%
Aceh Tengah3%
Bener Meriah3%Nagan Raya 2%Aceh Tenggara 2%Aceh Barat Daya 1%
Gayo Lues1%
Lhokseumawe1%
Source: Aceh Village Survey, 2006. Note: For Lhokseumawe, only one out of three kecamatan is included in the survey.
CONCLUSIONS and RECOMMENDATIONS
Several conclusions can be made based on the results of the infrastructure assessment.
Comprehensive eff orts are still needed to address infrastructure problems in Aceh. Few places escaped both the confl ict and natural disasters. Some areas not aff ected by the tsunami were later hit by severe fl ash fl oods. Some areas not aff ected by confl ict, such as Simeulue, were severely hit by the tsunami. Some high confl ict areas, such as Aceh Timur, were relatively lightly aff ected by the natural disaster. A few areas fared badly on both counts, such as Aceh Jaya, which was worst in terms of natural disaster and fourth-worst in terms of confl ict.Damage aff ected nearly all types of infrastructure, with more than 50 percent of infrastructure aff ected in the main categories. While much attention should be paid to bridges, irrigation, and roads, in fact all categories were seriously aff ected. Again, a comprehensive reconstruction plan is needed to repair or rebuild infrastructure in both confl ict and tsunami-aff ected areas.While some repairs have been made, at the time of the survey in August to September 2006, only 11 percent of damaged infrastructure had been repaired. These repairs were often the responsibility of sectoral agencies or the villagers themselves, but in general did not include many categories of infrastructure normally handled by block grants, such as local roads, bridges, and irrigation systems. Private-sector repairs to markets, shops, warehouses, rice mills, etc. are similarly lagging.Repair and reconstruction plans need to be focused on both tsunami- and confl ict-aff ected areas. Overall, about 40 percent of damage was caused by natural disaster, 40 percent by lack of maintenance, and 20 percent by confl ict. Natural disaster-damaged infrastructure on average is being repaired about 50 percent faster than confl ict-damaged infrastructure. Since infrastructure has been severely damaged by both natural disaster and confl ict, more eff ort is needed to ensure that damage caused by confl ict is also handled adequately.
In general, these data and results should be used to guide planners in the design of programs to help communities re-establish themselves after the twin disasters of confl ict and the tsunami.
•
•
•
•

05CHAPTER 5
Social Section
42 2006 Village Survey In Aceh An Assesssment of Village Infrastructure and Social Conditions March 2007
CHAPTER 5. SOCIAL SECTION
5.1 INTERNALY DISPLACED PEOPLE
The combination of confl ict and natural disasters in Aceh in recent years has generated large numbers of internally displaced people (IDPs). These IDPs often experience both a physical and emotional dislocation when they lose or are evicted from their homes and communities, and they are widely believed to be among the neediest and most vulnerable populations in Aceh. However, their physical dislocation also makes them an extremely diffi cult population to track and to target for assistance. In this section we explore the current IDP situation in Aceh as revealed by this survey and uncover some surprising results.
Box 5.1 Notes on the data
One of the most diffi cult challenges associated with collecting accurate data on IDPs is that the defi nition of an IDP is not self-evident. The most typical image of an IDP is someone who is displaced from his/her home and community and now lives in a temporary shelter in another location. However, people may be displaced and later return to their communities of origin to live in temporary shelters or even permanent homes there. Or they may be displaced so long they acquire homes, jobs, and seemingly normal lives in a new location. It is not easy, especially for an outsider, to determine when one ceases to be an IDP. and even when it is clear someone is an IDP, the distinction between tsunami and confl ict IDPs can be diffi cult to make. Many people from the highlands of central Aceh were displaced once by the confl ict to the coastal areas and then a second time by the tsunami.
To address partially these diffi culties, the Aceh Village Survey included questions about the IDPs from both the tsunami and from the confl ict in each of the following three categories of IDPs:
DPs who were displaced but have returned to the respondent’s community;IDPs who remain displaced from the respondent’s community; andIDPs from other places who are currently living in the respondent’s community
This survey did not provide a single rule for identifying IDPs or distinguishing between sources of displacement. Instead, because IDPs typically report to the village head when they arrive in a village, it is assumed that village heads are best equipped to report the count and breakdown of diff erent kinds of IDPs in a village. Therefore, while these questions were asked of all three respondents (the village head, a women’s leader, and a youth leader), the IDP counts in this section rely on responses by the village head alone unless otherwise reported.
•••
Overall numbers of IDPs
More households in the areas covered by this survey were displaced from their villages by confl ict than by the tsunami. Aid to IDPs in Aceh has focused primarily on victims of the tsunami, based in part on the conventional wisdom that tsunami IDPs outnumber confl ict IDPs. However, the data in Table 5.1 show that a signifi cantly larger number of households were displaced from their villages by confl ict (103,453) than by the tsunami (66,893). Furthermore, confl ict IDPs return at a lower rate (64.6 percent) than tsunami IDPs (85.2 percent). One possible explanation for these numbers is that many families displaced by the tsunami were able to stay within their villages, either because new accommodation was built, because they could stay with friends or family, or because their whole village physically moved together to a new location. Thus, those displaced face relatively few social obstacles to return. Furthermore, the focus of aid programs on tsunami-aff ected households likely contributes to tsunami IDPs’ higher rate of return. In contrast, families displaced by the confl ict are more likely to have left their villages and their social support structures alone or in smaller groups. Tensions may persist between those who fl ed and others in the villages, leading to signifi cant social obstacles to return. Taken together, these numbers highlight the importance of designing return programs for confl ict IDPs that are accompanied by measures to help build social cohesion.21
21 As explained in Chapters 1 and 2, the fi eld work for this survey was conducted in August-September 2006. Since then, the number of IDPs may have changed due to relocation or resettlement to their host communities. Also, the December 2006 fl ash fl ood has caused some people to be displaced in seven districts, causing changes to the number of IDPs in those areas.
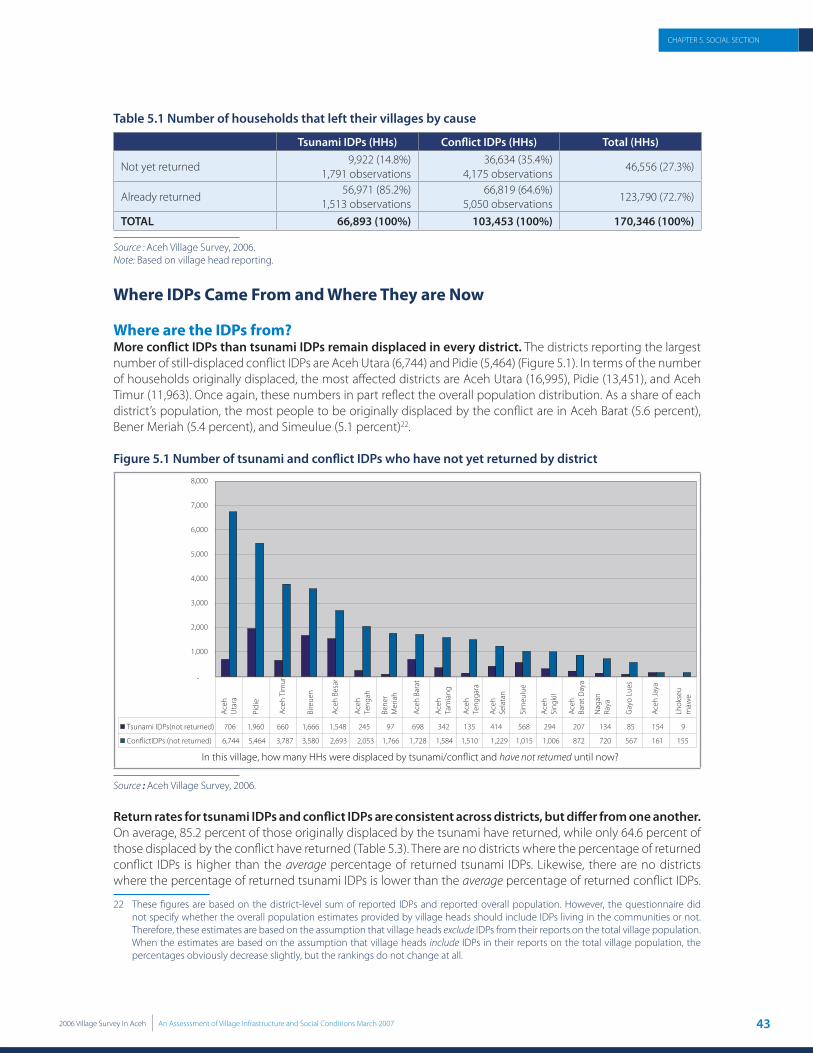
432006 Village Survey In Aceh An Assesssment of Village Infrastructure and Social Conditions March 2007
CHAPTER 5. SOCIAL SECTION
Table 5.1 Number of households that left their villages by cause
Tsunami IDPs (HHs) Confl ict IDPs (HHs) Total (HHs)
Not yet returned9,922 (14.8%)
1,791 observations36,634 (35.4%)
4,175 observations46,556 (27.3%)
Already returned56,971 (85.2%)
1,513 observations66,819 (64.6%)
5,050 observations123,790 (72.7%)
TOTAL 66,893 (100%) 103,453 (100%) 170,346 (100%)
Source : Aceh Village Survey, 2006. Note: Based on village head reporting.
Where IDPs Came From and Where They are Now
Where are the IDPs from?More confl ict IDPs than tsunami IDPs remain displaced in every district. The districts reporting the largest number of still-displaced confl ict IDPs are Aceh Utara (6,744) and Pidie (5,464) (Figure 5.1). In terms of the number of households originally displaced, the most aff ected districts are Aceh Utara (16,995), Pidie (13,451), and Aceh Timur (11,963). Once again, these numbers in part refl ect the overall population distribution. As a share of each district’s population, the most people to be originally displaced by the confl ict are in Aceh Barat (5.6 percent), Bener Meriah (5.4 percent), and Simeulue (5.1 percent)22.
Figure 5.1 Number of tsunami and confl ict IDPs who have not yet returned by district
-
1,000
2,000
3,000
4,000
5,000
6,000
7,000
8,000
Tsunami IDPs(not returned) 706 1,960 660 1,666 1,548 245 97 698 342 135 414 568 294 207 134 85 154 9
6,744 5,464 3,787 3,580 2,693 2,053 1,766 1,728 1,584 1,510 1,229 1,015 1,006 872 720 567 161 155
Aceh
Uta
ra
Pidi
e
Aceh
Tim
ur
Bire
uen
Aceh
Bes
ar
Aceh
Teng
ah
Bene
rM
eria
h
Aceh
Bar
at
Aceh
Tam
iang
Aceh
Teng
gara
Aceh
Sela
tan
Sim
eulu
e
Aceh
Sing
kil
Aceh
Bara
t Day
a
Nag
anRa
ya
Gay
o Lu
es
Aceh
Jaya
Lhok
seu
maw
e
Source : Aceh Village Survey, 2006.
Return rates for tsunami IDPs and confl ict IDPs are consistent across districts, but diff er from one another. On average, 85.2 percent of those originally displaced by the tsunami have returned, while only 64.6 percent of those displaced by the confl ict have returned (Table 5.3). There are no districts where the percentage of returned confl ict IDPs is higher than the average percentage of returned tsunami IDPs. Likewise, there are no districts where the percentage of returned tsunami IDPs is lower than the average percentage of returned confl ict IDPs.
22 These fi gures are based on the district-level sum of reported IDPs and reported overall population. However, the questionnaire did not specify whether the overall population estimates provided by village heads should include IDPs living in the communities or not. Therefore, these estimates are based on the assumption that village heads exclude IDPs from their reports on the total village population. When the estimates are based on the assumption that village heads include IDPs in their reports on the total village population, the percentages obviously decrease slightly, but the rankings do not change at all.
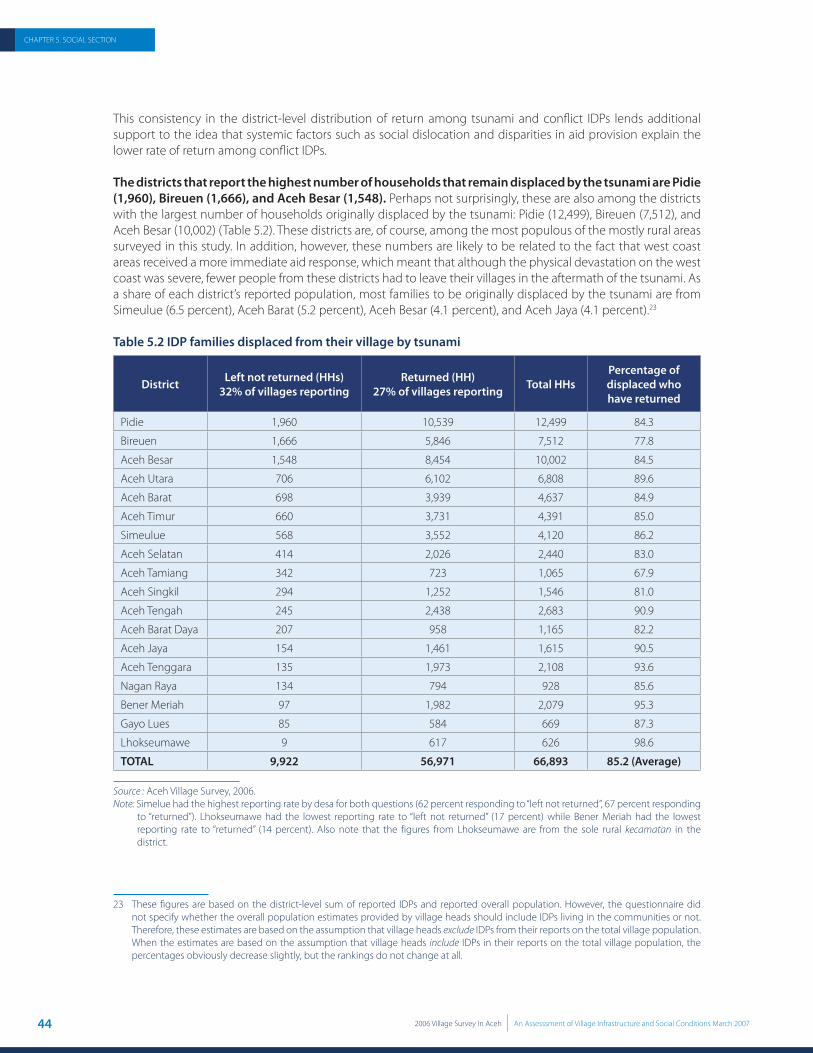
44 2006 Village Survey In Aceh An Assesssment of Village Infrastructure and Social Conditions March 2007
CHAPTER 5. SOCIAL SECTION
This consistency in the district-level distribution of return among tsunami and confl ict IDPs lends additional support to the idea that systemic factors such as social dislocation and disparities in aid provision explain the lower rate of return among confl ict IDPs.
The districts that report the highest number of households that remain displaced by the tsunami are Pidie (1,960), Bireuen (1,666), and Aceh Besar (1,548). Perhaps not surprisingly, these are also among the districts with the largest number of households originally displaced by the tsunami: Pidie (12,499), Bireuen (7,512), and Aceh Besar (10,002) (Table 5.2). These districts are, of course, among the most populous of the mostly rural areas surveyed in this study. In addition, however, these numbers are likely to be related to the fact that west coast areas received a more immediate aid response, which meant that although the physical devastation on the west coast was severe, fewer people from these districts had to leave their villages in the aftermath of the tsunami. As a share of each district’s reported population, most families to be originally displaced by the tsunami are from Simeulue (6.5 percent), Aceh Barat (5.2 percent), Aceh Besar (4.1 percent), and Aceh Jaya (4.1 percent).23
Table 5.2 IDP families displaced from their village by tsunami
District Left not returned (HHs)32% of villages reporting
Returned (HH)27% of villages reporting Total HHs
Percentage of displaced who have returned
Pidie 1,960 10,539 12,499 84.3
Bireuen 1,666 5,846 7,512 77.8
Aceh Besar 1,548 8,454 10,002 84.5
Aceh Utara 706 6,102 6,808 89.6
Aceh Barat 698 3,939 4,637 84.9
Aceh Timur 660 3,731 4,391 85.0
Simeulue 568 3,552 4,120 86.2
Aceh Selatan 414 2,026 2,440 83.0
Aceh Tamiang 342 723 1,065 67.9
Aceh Singkil 294 1,252 1,546 81.0
Aceh Tengah 245 2,438 2,683 90.9
Aceh Barat Daya 207 958 1,165 82.2
Aceh Jaya 154 1,461 1,615 90.5
Aceh Tenggara 135 1,973 2,108 93.6
Nagan Raya 134 794 928 85.6
Bener Meriah 97 1,982 2,079 95.3
Gayo Lues 85 584 669 87.3
Lhokseumawe 9 617 626 98.6
TOTAL 9,922 56,971 66,893 85.2 (Average)
Source : Aceh Village Survey, 2006. Note: Simelue had the highest reporting rate by desa for both questions (62 percent responding to “left not returned”, 67 percent responding
to “returned”). Lhokseumawe had the lowest reporting rate to “left not returned” (17 percent) while Bener Meriah had the lowest reporting rate to “returned” (14 percent). Also note that the figures from Lhokseumawe are from the sole rural kecamatan in the district.
23 These fi gures are based on the district-level sum of reported IDPs and reported overall population. However, the questionnaire did not specify whether the overall population estimates provided by village heads should include IDPs living in the communities or not. Therefore, these estimates are based on the assumption that village heads exclude IDPs from their reports on the total village population. When the estimates are based on the assumption that village heads include IDPs in their reports on the total village population, the percentages obviously decrease slightly, but the rankings do not change at all.
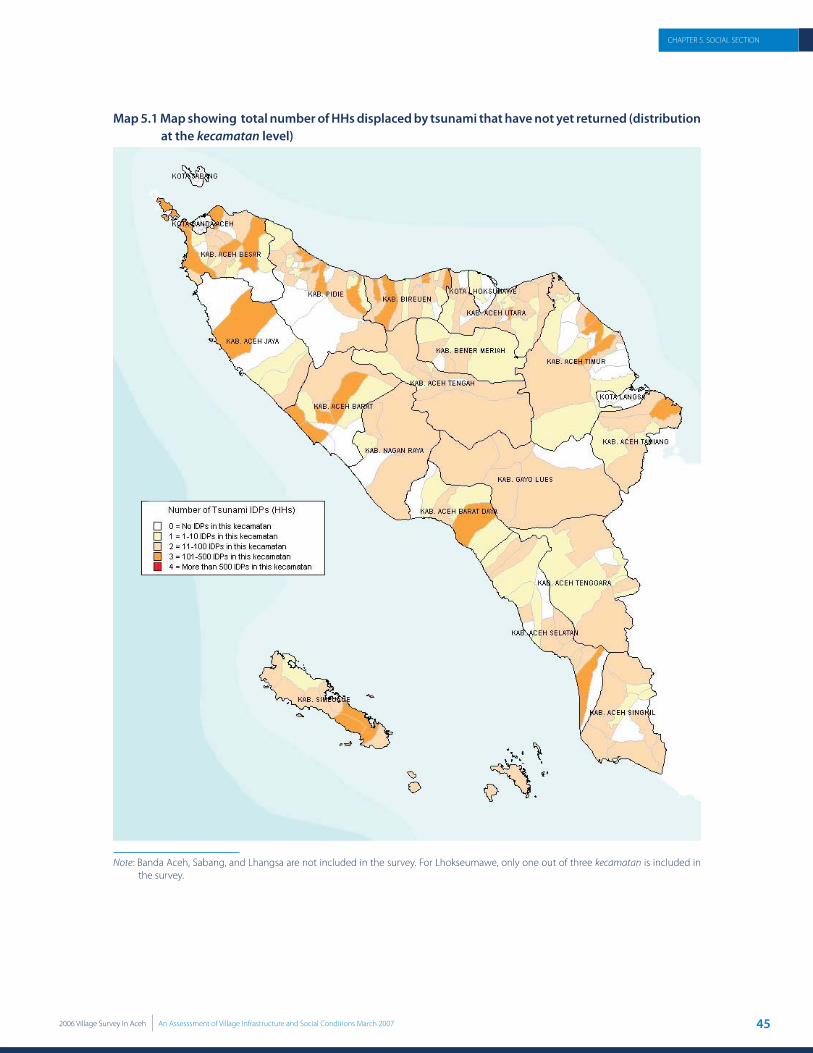
452006 Village Survey In Aceh An Assesssment of Village Infrastructure and Social Conditions March 2007
CHAPTER 5. SOCIAL SECTION
Map 5.1 Map showing total number of HHs displaced by tsunami that have not yet returned (distribution at the kecamatan level)
Note: Banda Aceh, Sabang, and Lhangsa are not included in the survey. For Lhokseumawe, only one out of three kecamatan is included in the survey.

46 2006 Village Survey In Aceh An Assesssment of Village Infrastructure and Social Conditions March 2007
CHAPTER 5. SOCIAL SECTION
Table 5.3 IDP families displaced from their village by the confl ict
District Left not returned (HH)75% of villages reporting
Returned (HH)91% of villages reporting Total HHs Percentage of
HH returned
Aceh Utara 6,744 10,251 16,995 60.3
Pidie 5,464 7,987 13,451 59.4
Aceh Timur 3,787 8,176 11,963 68.3
Bireuen 3,583 5,994 9,577 62.6
Aceh Besar 2,693 4,687 7,380 63.5
Bener Meriah 1,766 3,737 5,503 67.9
Aceh Tenggara 1,510 3,882 5,392 72.0
Aceh Barat 1,728 3,213 4,941 65.0
Aceh Tengah 2,053 2,884 4,937 58.4
Aceh Selatan 1,229 3,488 4,717 73.9
Aceh Singkil 1,006 3,401 4,407 77.2
Aceh Tamiang 1,584 2,508 4,092 61.3
Simeuleu 1,015 2,237 3,252 68.8
Nagan Raya 720 1,834 2,554 71.8
Aceh Barat Daya 872 933 1,805 51.7
Gayo Lues 567 490 1,057 46.4
Aceh Jaya 161 881 1,042 84.5
Lhokseumawe 155 236 391 60.4
TOTAL 36,637 66,819 103,456 64.6 (Average)
Source : Aceh Village Survey, 2006. Note: Lhokseumawe had the highest reporting rate by desa for both questions (97 percent responding to “left not returned”, 100 percent
responding to “returned”). Aceh Barat and Aceh Besar both had low reporting rates to “left not returned” (63 percent) while Aceh Barat had the low reporting rate to “returned” (76 percent). Also note that the figures from Lhokseumawe are from the sole rural kecamatan in the district.

472006 Village Survey In Aceh An Assesssment of Village Infrastructure and Social Conditions March 2007
CHAPTER 5. SOCIAL SECTION
Map 5.2 Map showing total number of HHs displaced by confl ict that have not yet returned (distribution at the kecamatan level)
Note: Banda Aceh, Sabang, and Lhangsa are not included in the survey. For Lhokseumawe, only one out of three kecamatan is included in the survey.
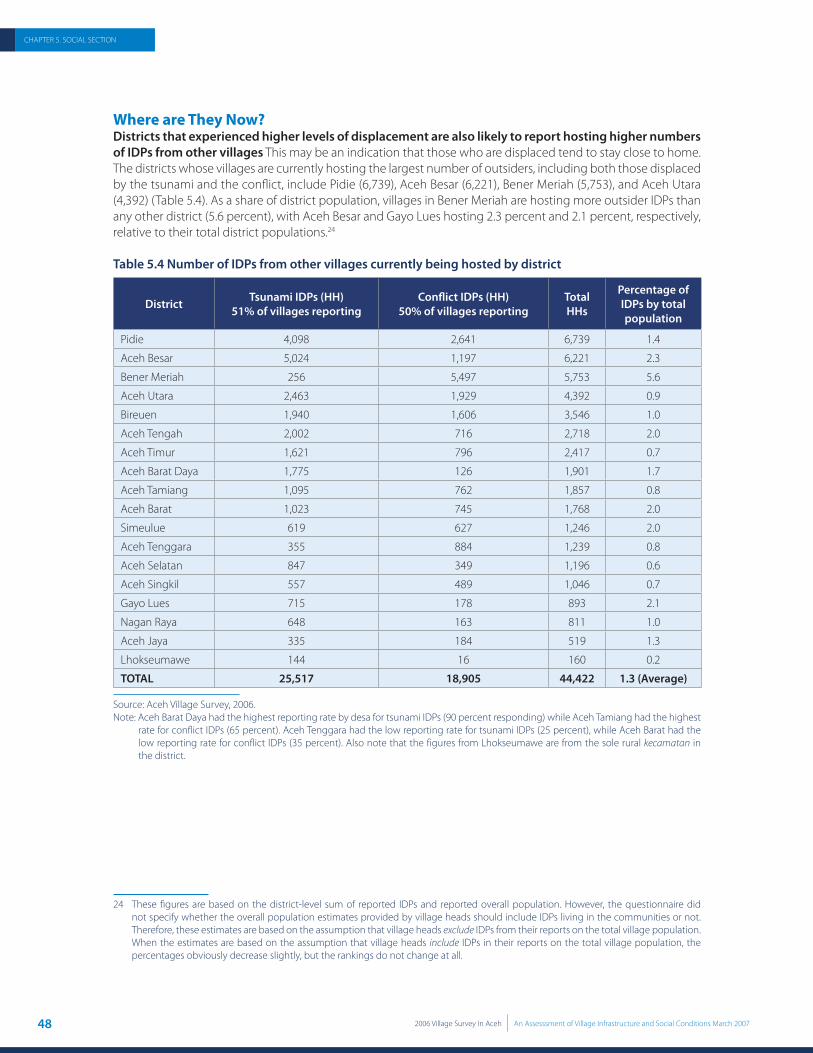
48 2006 Village Survey In Aceh An Assesssment of Village Infrastructure and Social Conditions March 2007
CHAPTER 5. SOCIAL SECTION
Where are They Now?Districts that experienced higher levels of displacement are also likely to report hosting higher numbers of IDPs from other villages This may be an indication that those who are displaced tend to stay close to home. The districts whose villages are currently hosting the largest number of outsiders, including both those displaced by the tsunami and the confl ict, include Pidie (6,739), Aceh Besar (6,221), Bener Meriah (5,753), and Aceh Utara (4,392) (Table 5.4). As a share of district population, villages in Bener Meriah are hosting more outsider IDPs than any other district (5.6 percent), with Aceh Besar and Gayo Lues hosting 2.3 percent and 2.1 percent, respectively, relative to their total district populations.24
Table 5.4 Number of IDPs from other villages currently being hosted by district
District Tsunami IDPs (HH)51% of villages reporting
Confl ict IDPs (HH)50% of villages reporting
Total HHs
Percentage of IDPs by total population
Pidie 4,098 2,641 6,739 1.4
Aceh Besar 5,024 1,197 6,221 2.3
Bener Meriah 256 5,497 5,753 5.6
Aceh Utara 2,463 1,929 4,392 0.9
Bireuen 1,940 1,606 3,546 1.0
Aceh Tengah 2,002 716 2,718 2.0
Aceh Timur 1,621 796 2,417 0.7
Aceh Barat Daya 1,775 126 1,901 1.7
Aceh Tamiang 1,095 762 1,857 0.8
Aceh Barat 1,023 745 1,768 2.0
Simeulue 619 627 1,246 2.0
Aceh Tenggara 355 884 1,239 0.8
Aceh Selatan 847 349 1,196 0.6
Aceh Singkil 557 489 1,046 0.7
Gayo Lues 715 178 893 2.1
Nagan Raya 648 163 811 1.0
Aceh Jaya 335 184 519 1.3
Lhokseumawe 144 16 160 0.2
TOTAL 25,517 18,905 44,422 1.3 (Average)
Source: Aceh Village Survey, 2006. Note: Aceh Barat Daya had the highest reporting rate by desa for tsunami IDPs (90 percent responding) while Aceh Tamiang had the highest
rate for conflict IDPs (65 percent). Aceh Tenggara had the low reporting rate for tsunami IDPs (25 percent), while Aceh Barat had the low reporting rate for conflict IDPs (35 percent). Also note that the figures from Lhokseumawe are from the sole rural kecamatan in the district.
24 These fi gures are based on the district-level sum of reported IDPs and reported overall population. However, the questionnaire did not specify whether the overall population estimates provided by village heads should include IDPs living in the communities or not. Therefore, these estimates are based on the assumption that village heads exclude IDPs from their reports on the total village population. When the estimates are based on the assumption that village heads include IDPs in their reports on the total village population, the percentages obviously decrease slightly, but the rankings do not change at all.

492006 Village Survey In Aceh An Assesssment of Village Infrastructure and Social Conditions March 2007
CHAPTER 5. SOCIAL SECTION
Map 5.3 Map showing the areas with total number of confl ict and tsunami IDPs from other villages currently being hosted (distribution at the kecamatan level)
Note: Banda Aceh, Sabang, and Lhangsa are not included in the survey. For Lhokseumawe, only one out of three kecamatan is included in the survey.
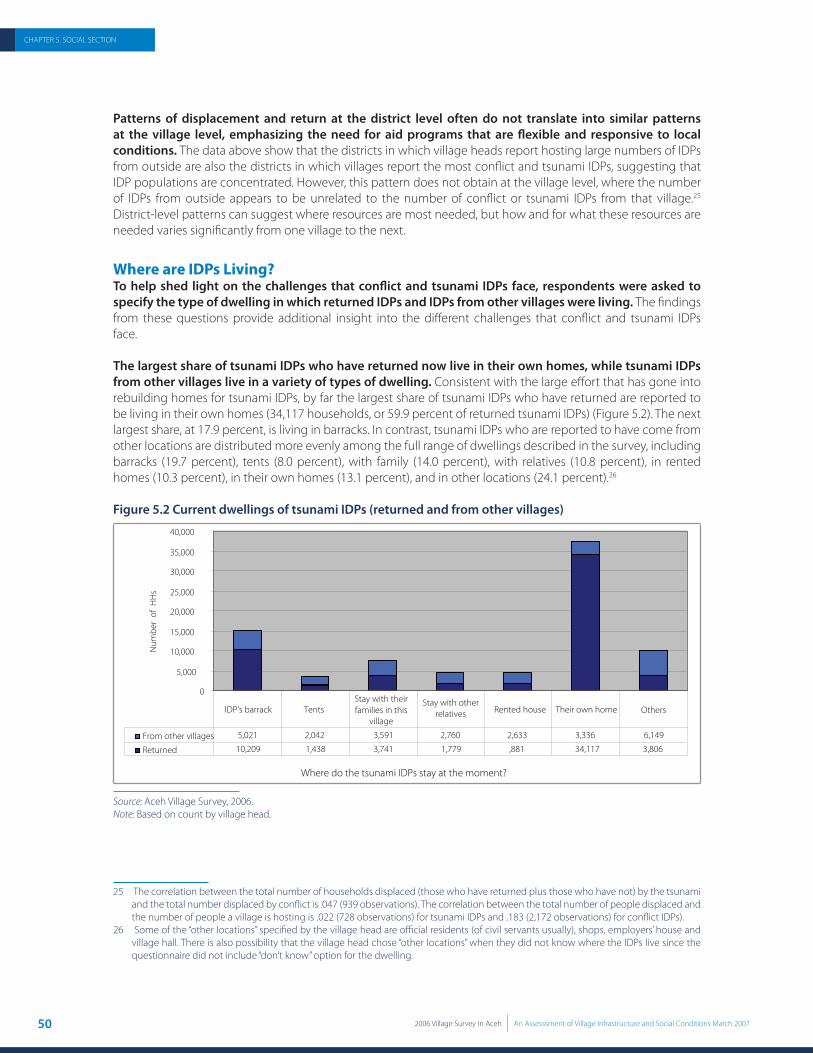
50 2006 Village Survey In Aceh An Assesssment of Village Infrastructure and Social Conditions March 2007
CHAPTER 5. SOCIAL SECTION
Patterns of displacement and return at the district level often do not translate into similar patterns at the village level, emphasizing the need for aid programs that are fl exible and responsive to local conditions. The data above show that the districts in which village heads report hosting large numbers of IDPs from outside are also the districts in which villages report the most confl ict and tsunami IDPs, suggesting that IDP populations are concentrated. However, this pattern does not obtain at the village level, where the number of IDPs from outside appears to be unrelated to the number of confl ict or tsunami IDPs from that village.25 District-level patterns can suggest where resources are most needed, but how and for what these resources are needed varies signifi cantly from one village to the next.
Where are IDPs Living?To help shed light on the challenges that confl ict and tsunami IDPs face, respondents were asked to specify the type of dwelling in which returned IDPs and IDPs from other villages were living. The fi ndings from these questions provide additional insight into the diff erent challenges that confl ict and tsunami IDPs face.
The largest share of tsunami IDPs who have returned now live in their own homes, while tsunami IDPs from other villages live in a variety of types of dwelling. Consistent with the large eff ort that has gone into rebuilding homes for tsunami IDPs, by far the largest share of tsunami IDPs who have returned are reported to be living in their own homes (34,117 households, or 59.9 percent of returned tsunami IDPs) (Figure 5.2). The next largest share, at 17.9 percent, is living in barracks. In contrast, tsunami IDPs who are reported to have come from other locations are distributed more evenly among the full range of dwellings described in the survey, including barracks (19.7 percent), tents (8.0 percent), with family (14.0 percent), with relatives (10.8 percent), in rented homes (10.3 percent), in their own homes (13.1 percent), and in other locations (24.1 percent).26
Figure 5.2 Current dwellings of tsunami IDPs (returned and from other villages)
0
5,000
10,000
15,000
20,000
25,000
30,000
35,000
40,000
Num
ber
of H
Hs
From other villages 5,021 2,042 3,591 2,760 2,633 3,336 6,149
10,209 1,438 3,741 1,779 ,881 34,117Returned 3,806
IDP's barrack TentsStay with theirfamilies in this
village
Stay with otherrelatives Rented house Their own home Others
Where do the tsunami IDPs stay at the moment?
Source: Aceh Village Survey, 2006.Note: Based on count by village head.
25 The correlation between the total number of households displaced (those who have returned plus those who have not) by the tsunami and the total number displaced by confl ict is .047 (939 observations). The correlation between the total number of people displaced and the number of people a village is hosting is .022 (728 observations) for tsunami IDPs and .183 (2,172 observations) for confl ict IDPs).
26 Some of the “other locations” specifi ed by the village head are offi cial residents (of civil servants usually), shops, employers’ house and village hall. There is also possibility that the village head chose “other locations” when they did not know where the IDPs live since the questionnaire did not include “don’t know” option for the dwelling.

512006 Village Survey In Aceh An Assesssment of Village Infrastructure and Social Conditions March 2007
CHAPTER 5. SOCIAL SECTION
Returned confl ict IDPs are equally likely to be living in rented homes, their own homes, or in other types of dwelling. The number of returned confl ict IDPs reported to be living in their own homes (17,843 households, or 26.7 percent) is slightly less than the number reported to be living in rented homes (19,720 households, or 29.5 percent) and other dwellings (18,746 households, or 28.1 percent) (Figure 5.3). This wider distribution of living circumstances for confl ict IDPs as compared with tsunami IDPs may simply be a result of more homes being built for tsunami IDPs than confl ict IDPs, or it may refl ect diffi culties that confl ict IDPs have reintegrating fully into their communities of origin. In either case, return programs for confl ict IDPs should include measures geared towards promoting social cohesion.
Confl ict IDPs from other villages are most likely to be living in their own homes. That the majority (9,556 households, or 50.5 percent) of this group live in their own homes may be an indication that confl ict IDPs, who have generally been displaced for longer than tsunami IDPs, have taken more steps toward integrating fully into the communities to which they were displaced, at least with respect to their housing situation. To the extent that this is true, it has important implications for how programs for confl ict IDPs can provide these IDPs with the ability to choose between return, resettlement, or empowerment in current host communities.
Figure 5.3 Current dwellings of confl ict IDPs (returned and from other villages)
0
5,000
10,000
15,000
20,000
25,000
30,000
652 609 2,666 1,668 2,862 9,556 8971,485 1,952 3,871 3,202 19,720 17,843 18,746
sH
H fo rebmu
N
From other villages
Returned
IDP's barrack TentsStay with theirfamilies in this
village
Stay with otherrelatives Rented house Their own home Others
Source: Aceh Village Survey, 2006. Note: Based on count by village head.
IDPs’ Economic Situation
Most respondents believe that returned tsunami IDPs are somewhat worse off economically than they were pre-tsunami. In each village, the village head, a women’s group leader, and a youth group leader were asked to compare the current economic conditions of returned tsunami IDPs with their economic condition pre-tsunami. The average score for all respondents (2.5) is midway between a score of “somewhat worse” (2) and “the same” (3), suggesting that notwithstanding the progress that has been made, the economic eff ects of the tsunami continue to be felt at the village level, even among those tsunami IDPs who have returned
Most respondents believe that IDPs from other villages are somewhat worse off economically than others in the community, especially among confl ict IDPs. In each village, the village head, a women’s group leader, and a youth group leader were asked to compare the current economic condition of IDPs (both confl ict and tsunami) from outside who were being hosted in their communities with the economic condition of others in their communities. Table 5.5 shows that the mean response to this question for tsunami IDPs was the same as the mean response to the previous question (2.5), suggesting a recognition that those who remain displaced by the
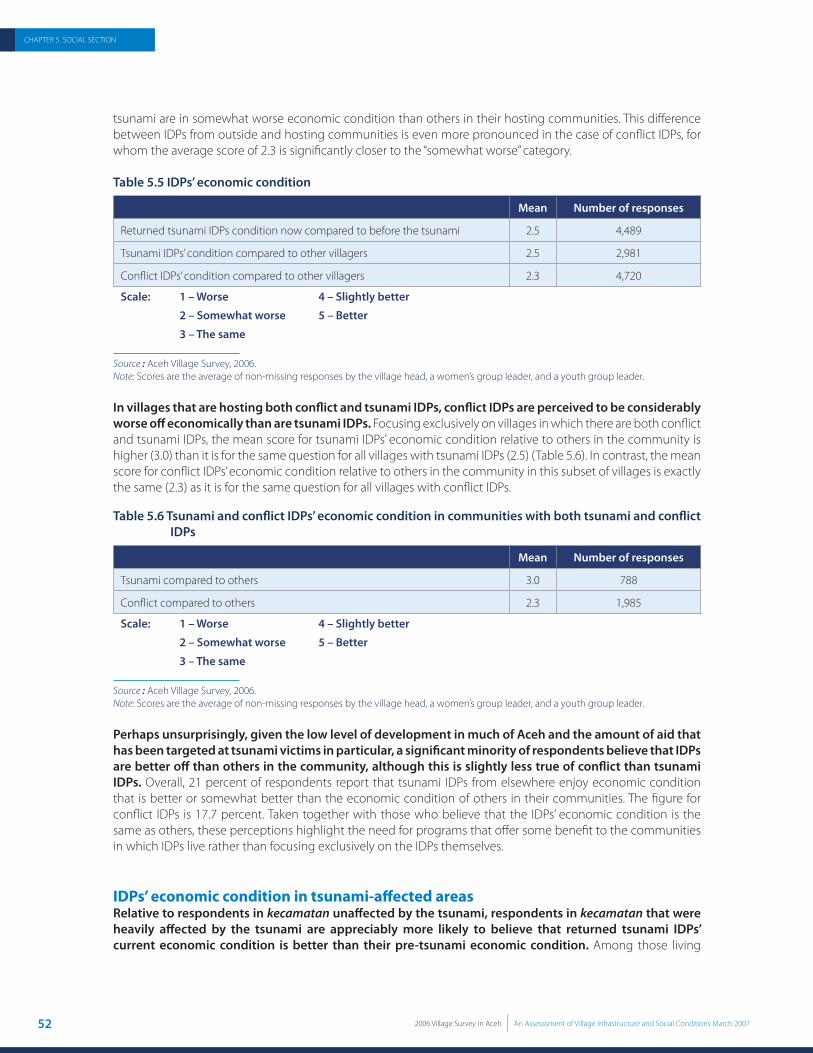
52 2006 Village Survey In Aceh An Assesssment of Village Infrastructure and Social Conditions March 2007
CHAPTER 5. SOCIAL SECTION
tsunami are in somewhat worse economic condition than others in their hosting communities. This diff erence between IDPs from outside and hosting communities is even more pronounced in the case of confl ict IDPs, for whom the average score of 2.3 is signifi cantly closer to the “somewhat worse” category.
Table 5.5 IDPs’ economic condition
Mean Number of responses
Returned tsunami IDPs condition now compared to before the tsunami 2.5 4,489
Tsunami IDPs’ condition compared to other villagers 2.5 2,981
Confl ict IDPs’ condition compared to other villagers 2.3 4,720
Scale: 1 – Worse 4 – Slightly better
2 – Somewhat worse 5 – Better
3 – The same
Source : Aceh Village Survey, 2006.Note: Scores are the average of non-missing responses by the village head, a women’s group leader, and a youth group leader.
In villages that are hosting both confl ict and tsunami IDPs, confl ict IDPs are perceived to be considerably worse off economically than are tsunami IDPs. Focusing exclusively on villages in which there are both confl ict and tsunami IDPs, the mean score for tsunami IDPs’ economic condition relative to others in the community is higher (3.0) than it is for the same question for all villages with tsunami IDPs (2.5) (Table 5.6). In contrast, the mean score for confl ict IDPs’ economic condition relative to others in the community in this subset of villages is exactly the same (2.3) as it is for the same question for all villages with confl ict IDPs.
Table 5.6 Tsunami and confl ict IDPs’ economic condition in communities with both tsunami and confl ict IDPs
Mean Number of responses
Tsunami compared to others 3.0 788
Confl ict compared to others 2.3 1,985
Scale: 1 – Worse 4 – Slightly better
2 – Somewhat worse 5 – Better
3 – The same
Source : Aceh Village Survey, 2006. Note: Scores are the average of non-missing responses by the village head, a women’s group leader, and a youth group leader.
Perhaps unsurprisingly, given the low level of development in much of Aceh and the amount of aid that has been targeted at tsunami victims in particular, a signifi cant minority of respondents believe that IDPs are better off than others in the community, although this is slightly less true of confl ict than tsunami IDPs. Overall, 21 percent of respondents report that tsunami IDPs from elsewhere enjoy economic condition that is better or somewhat better than the economic condition of others in their communities. The fi gure for confl ict IDPs is 17.7 percent. Taken together with those who believe that the IDPs’ economic condition is the same as others, these perceptions highlight the need for programs that off er some benefi t to the communities in which IDPs live rather than focusing exclusively on the IDPs themselves.
IDPs’ economic condition in tsunami-aff ected areasRelative to respondents in kecamatan unaff ected by the tsunami, respondents in kecamatan that were heavily aff ected by the tsunami are appreciably more likely to believe that returned tsunami IDPs’ current economic condition is better than their pre-tsunami economic condition. Among those living
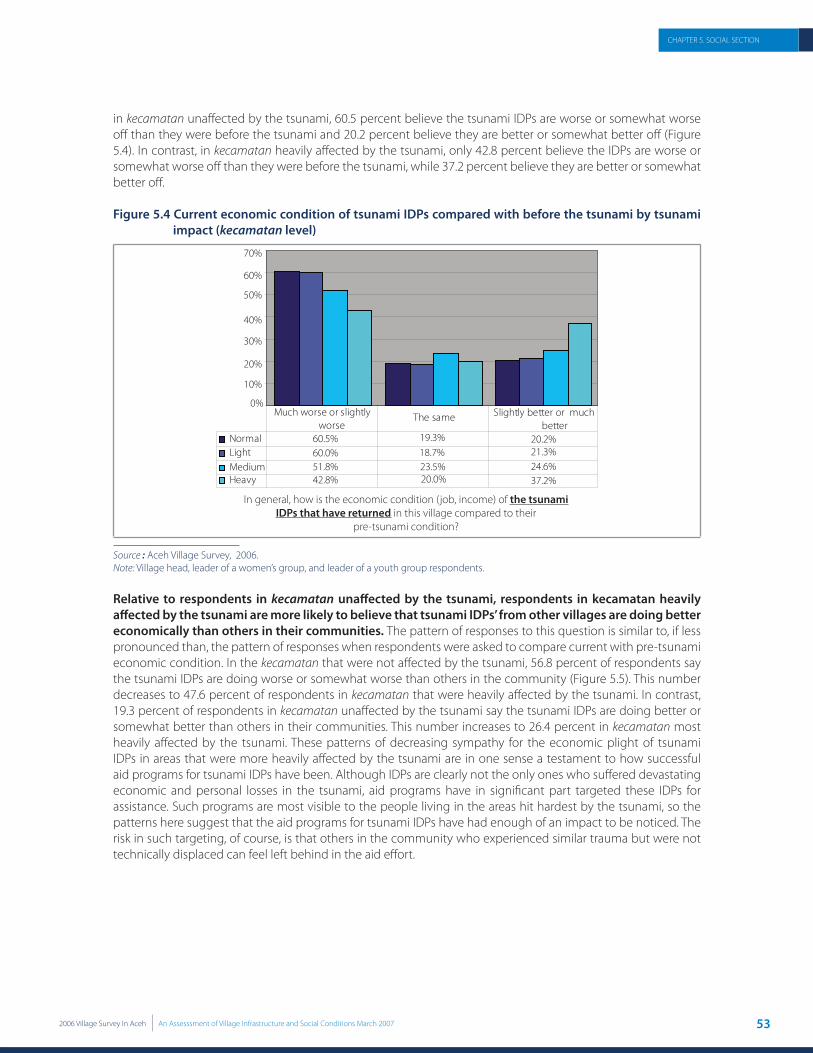
532006 Village Survey In Aceh An Assesssment of Village Infrastructure and Social Conditions March 2007
CHAPTER 5. SOCIAL SECTION
in kecamatan unaff ected by the tsunami, 60.5 percent believe the tsunami IDPs are worse or somewhat worse off than they were before the tsunami and 20.2 percent believe they are better or somewhat better off (Figure 5.4). In contrast, in kecamatan heavily aff ected by the tsunami, only 42.8 percent believe the IDPs are worse or somewhat worse off than they were before the tsunami, while 37.2 percent believe they are better or somewhat better off .
Figure 5.4 Current economic condition of tsunami IDPs compared with before the tsunami by tsunami impact (kecamatan level)
0%
10%
20%
30%
40%
50%
60%
70%
Normal 60.5% 19.3% 20.2%Light 60.0% 18.7% 21.3%Medium 51.8% 23.5% 24.6%Heavy 42.8% 20.0% 37.2%
Much worse or slightlyworse
The same Slightly better or muchbetter
In general, how is the economic condition (job, income) of the tsunamiIDPs that have returned in this village compared to their
pre-tsunami condition?
Source : Aceh Village Survey, 2006. Note: Village head, leader of a women’s group, and leader of a youth group respondents.
Relative to respondents in kecamatan unaff ected by the tsunami, respondents in kecamatan heavily aff ected by the tsunami are more likely to believe that tsunami IDPs’ from other villages are doing better economically than others in their communities. The pattern of responses to this question is similar to, if less pronounced than, the pattern of responses when respondents were asked to compare current with pre-tsunami economic condition. In the kecamatan that were not aff ected by the tsunami, 56.8 percent of respondents say the tsunami IDPs are doing worse or somewhat worse than others in the community (Figure 5.5). This number decreases to 47.6 percent of respondents in kecamatan that were heavily aff ected by the tsunami. In contrast, 19.3 percent of respondents in kecamatan unaff ected by the tsunami say the tsunami IDPs are doing better or somewhat better than others in their communities. This number increases to 26.4 percent in kecamatan most heavily aff ected by the tsunami. These patterns of decreasing sympathy for the economic plight of tsunami IDPs in areas that were more heavily aff ected by the tsunami are in one sense a testament to how successful aid programs for tsunami IDPs have been. Although IDPs are clearly not the only ones who suff ered devastating economic and personal losses in the tsunami, aid programs have in signifi cant part targeted these IDPs for assistance. Such programs are most visible to the people living in the areas hit hardest by the tsunami, so the patterns here suggest that the aid programs for tsunami IDPs have had enough of an impact to be noticed. The risk in such targeting, of course, is that others in the community who experienced similar trauma but were not technically displaced can feel left behind in the aid eff ort.

54 2006 Village Survey In Aceh An Assesssment of Village Infrastructure and Social Conditions March 2007
CHAPTER 5. SOCIAL SECTION
Figure 5.5 Economic condition of tsunami IDPs from other villages compared with people from within the community by tsunami impact (kecamatan level)
In general, how is the economic condition (job, income) of the tsunami-IDPs who came from other village and stay in this village compared
to the local people?
0%
10%
20%
30%
40%
50%
60%
Normal 56.8% 23.9% 19.3%Light 54.7% 24.4% 20.9%Medium 52.9% 23.4% 23.7%Heavy 47.6% 25.9% 26.4%
Much worse or slightlyworse The same
Slightly better or muchbetter
Source: Aceh Village Survey, 2006Note: Village head, leader of a women’s group, and leader of a youth group respondents
IDPs’ economic condition in confl ict-aff ected areasRespondents’ perceptions regarding the economic condition of confl ict IDPs from elsewhere relative to others in their communities do not vary based on the intensity of the confl ict in the kecamatan in which the respondents are located. This fi nding contrasts with the responses to questions about tsunami IDPs’, where there was a clear pattern of improved economic conditions in more heavily aff ected kecamatan. The share of respondents who perceive that confl ict IDPs are worse or somewhat worse off than others in their communities is about 60 percent regardless of the level of confl ict (Figure 5.6). Likewise, the share of respondents who perceive that confl ict IDPs are better or somewhat better off than others in the community is about 18 percent, regardless of the confl ict intensity in the respondents’ kecamatan. The discussion above suggested that the pattern of responses to questions about tsunami IDPs’ economic condition was likely a result of the eff ectiveness of IDP-targeted aid programs in areas heavily aff ected by the tsunami. Along these same lines, the fi nding here that there is no pattern in responses to questions about confl ict IDPs’ economic condition is likely a refl ection of the dearth of programs targeted at confl ict IDPs.
Figure 5.6 Economic condition of confl ict IDPs from other villages compared with people from within the community by confl ict intensity (kecamatan level)
0%
10%
20%
30%
40%
50%
60%
70%
Low 60.6% 21.1% 18.3%Medium 61.1% 22.5% 16.4%High 59.6% 22.5% 17.9%
Much worse or slightlyworse
The sameSlightly better or
much better
In general, how is the economic condition (job, income) of the confl ictIDPs who came from other village and stay in this village compared
to the local people?
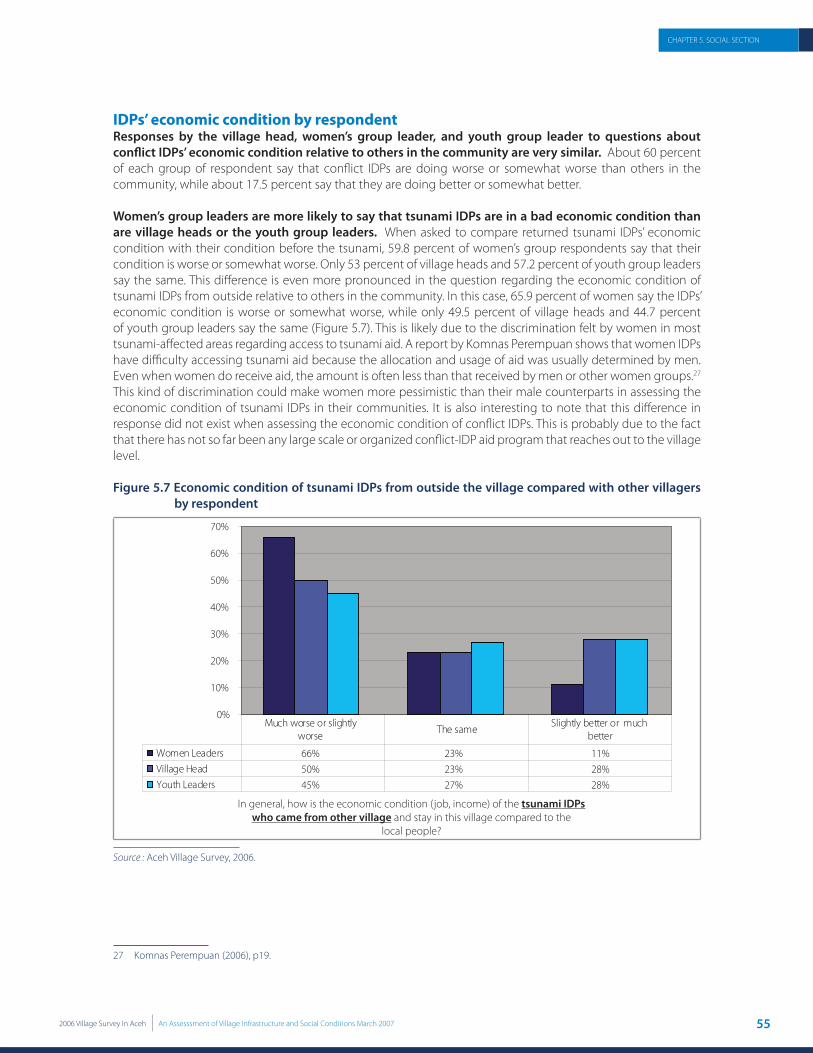
552006 Village Survey In Aceh An Assesssment of Village Infrastructure and Social Conditions March 2007
CHAPTER 5. SOCIAL SECTION
IDPs’ economic condition by respondent Responses by the village head, women’s group leader, and youth group leader to questions about confl ict IDPs’ economic condition relative to others in the community are very similar. About 60 percent of each group of respondent say that confl ict IDPs are doing worse or somewhat worse than others in the community, while about 17.5 percent say that they are doing better or somewhat better.
Women’s group leaders are more likely to say that tsunami IDPs are in a bad economic condition than are village heads or the youth group leaders. When asked to compare returned tsunami IDPs’ economic condition with their condition before the tsunami, 59.8 percent of women’s group respondents say that their condition is worse or somewhat worse. Only 53 percent of village heads and 57.2 percent of youth group leaders say the same. This diff erence is even more pronounced in the question regarding the economic condition of tsunami IDPs from outside relative to others in the community. In this case, 65.9 percent of women say the IDPs’ economic condition is worse or somewhat worse, while only 49.5 percent of village heads and 44.7 percent of youth group leaders say the same (Figure 5.7). This is likely due to the discrimination felt by women in most tsunami-aff ected areas regarding access to tsunami aid. A report by Komnas Perempuan shows that women IDPs have diffi culty accessing tsunami aid because the allocation and usage of aid was usually determined by men. Even when women do receive aid, the amount is often less than that received by men or other women groups.27 This kind of discrimination could make women more pessimistic than their male counterparts in assessing the economic condition of tsunami IDPs in their communities. It is also interesting to note that this diff erence in response did not exist when assessing the economic condition of confl ict IDPs. This is probably due to the fact that there has not so far been any large scale or organized confl ict-IDP aid program that reaches out to the village level.
Figure 5.7 Economic condition of tsunami IDPs from outside the village compared with other villagers by respondent
Women Leaders
0%
10%
20%
30%
40%
50%
60%
70%
66% 23% 11%Village Head 50% 23% 28%Youth Leaders 45% 27% 28%
Much worse or slightlyworse
The sameSlightly better or much
better
In general, how is the economic condition (job, income) of the tsunami IDPswho came from other village and stay in this village compared to the
local people?
Source : Aceh Village Survey, 2006.
27 Komnas Perempuan (2006), p19.

56 2006 Village Survey In Aceh An Assesssment of Village Infrastructure and Social Conditions March 2007
CHAPTER 5. SOCIAL SECTION
At the village level, there is little agreement between respondents on IDPs’ relative economic condition. Responses by village heads, women’s group leaders, and youth group leaders are not closely related at the village level.28 This lack of consistency between respondents at the village level once again highlights the importance of programs that are fl exible, inclusive, and responsive to local needs.
IDPs’ economic condition by district Most district-level scores for the economic questions are close to the province-level average. Interestingly, the scores that are most at odds with the overall average score, with one exception, do not include the districts with the largest numbers of IDPs (Aceh Besar, Aceh Utara, Bireuen, and Pidie) (Table 5.7).
Table 5.7 Tsunami and confl ict IDPs’ economic condition by district
Tsunami compared with before
Tsunami compared with others
Confl ict compared with others
Aceh Barat 2.4 2.6 2.3
Aceh Barat Daya 2.4 2.7 2.3
Aceh Besar 2.8 2.5 2.4
Aceh Jaya 2.8 2.3 2.2
Aceh Selatan 2.4 2.6 2.3
Aceh Singkil 2.4 2.4 2.5
Aceh Tamiang 2.3 2.2 2.3
Aceh Tengah 2.7 2.5 2.3
Aceh Tenggara 2.5 2.5 2.3
Aceh Timur 2.1 2.3 2.4
Aceh Utara 2.4 2.4 2.3
Bener Meriah 2.2 2.3 2.4
Bireuen 2.4 2.4 2.4
Gayo Lues 2.3 2.5 2.2
Lhokseumawe 2.5 2.1 2.1
Nagan Raya 2.4 2.5 2.3
Pidie 2.5 2.6 2.3
Simeulue 3.3 3.0 2.5
Scale: 1 – Worse 4 – Slightly better2 – Somewhat worse 5 – Better3 – The same
Source : Aceh Village Survey, 2006. Note: Scores are the average of non-missing responses by the village head, a women’s group leader, and a youth group leader.
28 Across all the comparisons between respondents to the three diff erent economic questions asked, only one shows a correlation with an absolute value greater than 0.1 (0.15): the village head and women’s group leader’s responses to the question about returned tsunami IDPs’ economic condition compared with before the tsunami.
572006 Village Survey In Aceh An Assesssment of Village Infrastructure and Social Conditions March 2007
CHAPTER 5. SOCIAL SECTION
Conclusions and Recommendations: Internally Displaced People
The IDP situation in Aceh remains serious and complex. As this report shows, a conservative estimate puts the number of IDP households reported as not yet having returned to their communities of origin at nearly 50,000. Several key points stand out in looking at these data:
Far more households were displaced from their villages by confl ict than by the tsunami (103,456 compared with 66,893). This fi nding has important implications for decisions in post-MoU Aceh regarding how best to target assistance to these needy populations. Confl ict IDPs seem to be experiencing more severe lingering eff ects of their displacement than tsunami IDPs. This can be seen in the fi nding that confl ict IDPs have returned to their villages of origin at lower rates than tsunami IDPs (64.6 percent compared with 85.2 percent). It is also evident from the fi ndings that, relative to others in the community, confl ict IDPs are perceived to be doing worse economically than tsunami IDPs. Refl ecting the success of house-building eff orts after the tsunami, the largest share of returned tsunami IDPs live in their own homes (59.9 percent). The second most common dwelling for returned tsunami IDPs is barracks (17.9 percent). In contrast, tsunami IDPs living in other villages are most likely to be in barracks (19.7 percent) or other accommodation types (24.1 percent), but are also likely to live with relatives or in rented accommodation. Returned confl ict IDPs are almost equally likely to be in rented accommodation (29.5 percent), their own homes (26.7 percent), or other accommodation (28.1 percent). They are much less likely to be in barracks (2.2 percent). Those who are reported to be from other villages are by far most likely to be in their own homes in their new villages (50.5 percent). This latter observation may refl ect the long-term nature of many confl ict IDPs.Respondents generally report that tsunami IDPs’ economic condition has deteriorated, but the extent of this reported deterioration decreases if respondents are located in kecamatan that were heavily aff ected by the tsunami. Tsunami IDPs from outside are more likely to be perceived as better off economically than others in the community if the respondent is reporting from a kecamatan that was heavily aff ected by the tsunami. The same pattern exists when respondents are asked about returned tsunami IDPs’ economic condition relative to their pre-tsunami economic condition. These fi ndings suggest that tsunami IDP assistance programs are working, but at the same time serve as a reminder of the importance of ensuring that aid is not limited to IDPs. Respondents report that confl ict IDPs’ economic condition is not good. Regardless of the confl ict intensity in the kecamatan in which a respondent is located, confl ict IDPs from outside are most commonly perceived as doing worse or somewhat worse economically than others in the community. Perceptions of confl ict IDPs’ economic condition are consistent across the three groups of respondents interviewed, with a majority reporting that IDPs from outside the community are worse or somewhat worse off than others in the community.Women’s group leaders are most likely to report that tsunami IDPs’ economic condition is bad. This is true when comparing the economic condition of returned IDPs with their pre-tsunami condition. It is also true when respondents are asked to compare the economic condition of IDPs from outside the community with others in the community. Here, 66 percent of women’s group leaders say that IDPs are worse off , but only 50 percent of village heads and 45 percent of youth group leaders say the same. Few of the patterns observed at the district or kecamatan level hold when looking at the village level. There is no relationship at the village level between the presence of confl ict and tsunami IDPs; there remain signifi cant diff erences of opinion between respondents within each village about IDPs’ economic condition; and there is little relationship between return rates for confl ict and tsunami IDPs. This local variation highlights the importance of programming that is fl exible and responsive enough to adapt to the specifi c circumstances of each location.
•
•
•
•
•
•
•
•

58 2006 Village Survey In Aceh An Assesssment of Village Infrastructure and Social Conditions March 2007
CHAPTER 5. SOCIAL SECTION
5.2. INFORMATION NEEDS
Village heads, women’s leaders and youth leaders were asked a number of questions related to information issues. The aim was to obtain a better understanding of what the main information needs are in Acehnese villages and to understand better how people access that information. The questions also allow for analysis of whether there are any signifi cant geographic diff erences in answers, in particular in relation to confl ict- and tsunami-aff ected populations.
What Kinds of Information Do Communities Need?
Priority information needsVillagers seek information on a wide range of issues related to the peace process, development projects and expenditures, employment, and education and training opportunities. Figure 5.8 shows the prioritized information needs of communities, as perceived by village heads, women’s leaders and youth leaders.29 It shows that information on development programs (52.5 percent), employment opportunities (49.8 percent), and village budget use (46.5 percent) are the top three information priorities for villagers.
The most frequently selected response for fi rst priority (22.9 percent) is for information relating to the Helsinki Memorandum of Understanding (MoU), signed by the government and GAM in August 2005. Almost 40 percent of respondents cited information on the Helsinki MoU as one of their top three priority information needs. This is striking given that more than a year had passed between the signing of the MoU and the survey implementation. It shows the continuing extent to which communities feel that the agreement is important. Even after the withdrawal of the military and GAM’s disarming, and while the security situation is still extremely good, communities realize that the implementation of the MoU remains crucial to a sustainable peace in the longer term, and want to be informed of developments.
There is a need to support ongoing socialization of peace-process developments to communities. Similarly, information on post-confl ict programs is deemed to be more of a priority more than information on tsunami programs. To date, there has been an imbalance in information in this area, with more eff orts being made to communicate tsunami activities.30
29 Responses from the three respondent types are aggregated. N = 16,758 (5,586 village heads, 5,586 women’s group leaders, and 5,586 youth leaders).
30 In large part, this is because of the vast resources that are being devoted to tsunami aid compared with post-confl ict activities. As a result, BRR and the other large players have public information units, produce newsletters on progress, and sponsor radio and television slots. In contrast, BRA has one person responsible for public information.
Village Facilitator interviewed women’s leader in Ds. Cinta Maju, Kec. Blang Pegayon, Kab. Gayo Lues.
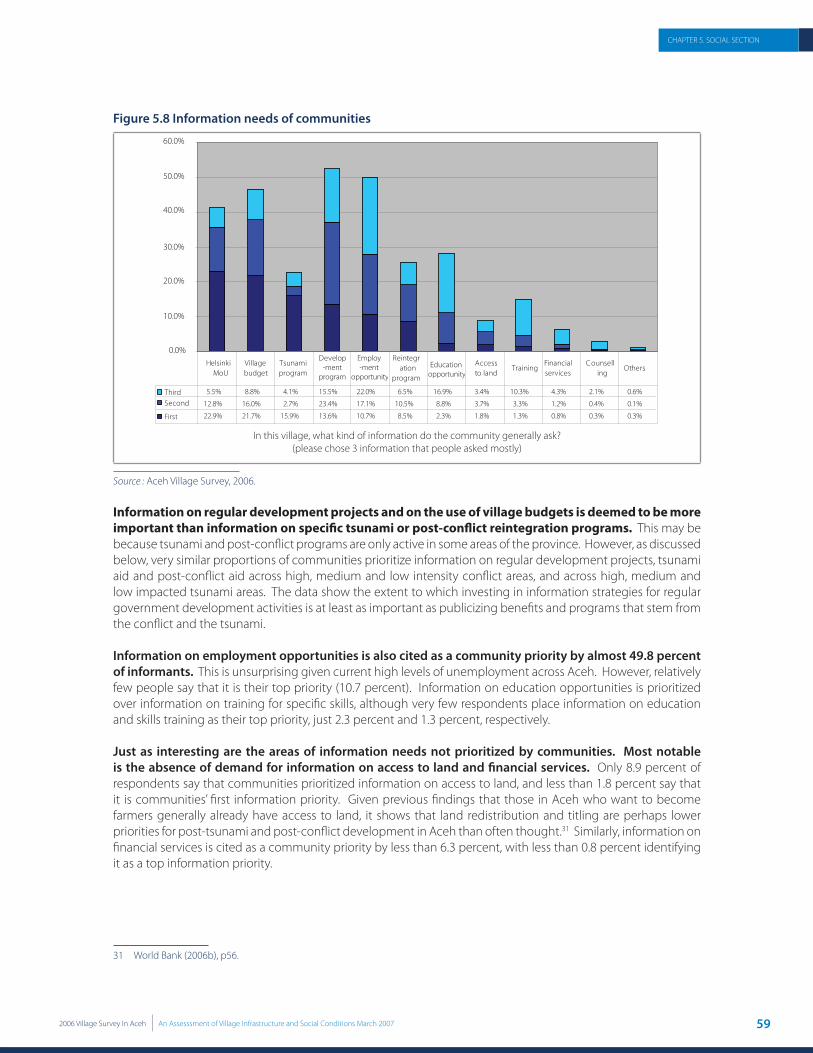
592006 Village Survey In Aceh An Assesssment of Village Infrastructure and Social Conditions March 2007
CHAPTER 5. SOCIAL SECTION
Figure 5.8 Information needs of communities
In this village, what kind of information do the community generally ask?(please chose 3 information that people asked mostly)
0.0%
10.0%
20.0%
30.0%
40.0%
50.0%
60.0%
Third 5.5% 8.8% 4.1% 15.5% 22.0% 6.5% 16.9% 3.4% 10.3% 4.3% 2.1% 0.6%Second 12.8% 16.0% 2.7% 23.4% 17.1% 10.5% 8.8% 3.7% 3.3% 1.2% 0.4% 0.1%
First 22.9% 21.7% 15.9% 13.6% 10.7% 8.5% 2.3% 1.8% 1.3% 0.8% 0.3% 0.3%
HelsinkiMoU
Villagebudget
Tsunamiprogram
Develop-ment
program
Employ-ment
opportunity
Reintegration
program
Educationopportunity
Accessto land
TrainingFinancialservices
C ounselling
Others
Source : Aceh Village Survey, 2006.
Information on regular development projects and on the use of village budgets is deemed to be more important than information on specifi c tsunami or post-confl ict reintegration programs. This may be because tsunami and post-confl ict programs are only active in some areas of the province. However, as discussed below, very similar proportions of communities prioritize information on regular development projects, tsunami aid and post-confl ict aid across high, medium and low intensity confl ict areas, and across high, medium and low impacted tsunami areas. The data show the extent to which investing in information strategies for regular government development activities is at least as important as publicizing benefi ts and programs that stem from the confl ict and the tsunami.
Information on employment opportunities is also cited as a community priority by almost 49.8 percent of informants. This is unsurprising given current high levels of unemployment across Aceh. However, relatively few people say that it is their top priority (10.7 percent). Information on education opportunities is prioritized over information on training for specifi c skills, although very few respondents place information on education and skills training as their top priority, just 2.3 percent and 1.3 percent, respectively.
Just as interesting are the areas of information needs not prioritized by communities. Most notable is the absence of demand for information on access to land and fi nancial services. Only 8.9 percent of respondents say that communities prioritized information on access to land, and less than 1.8 percent say that it is communities’ fi rst information priority. Given previous fi ndings that those in Aceh who want to become farmers generally already have access to land, it shows that land redistribution and titling are perhaps lower priorities for post-tsunami and post-confl ict development in Aceh than often thought.31 Similarly, information on fi nancial services is cited as a community priority by less than 6.3 percent, with less than 0.8 percent identifying it as a top information priority.
31 World Bank (2006b), p56.
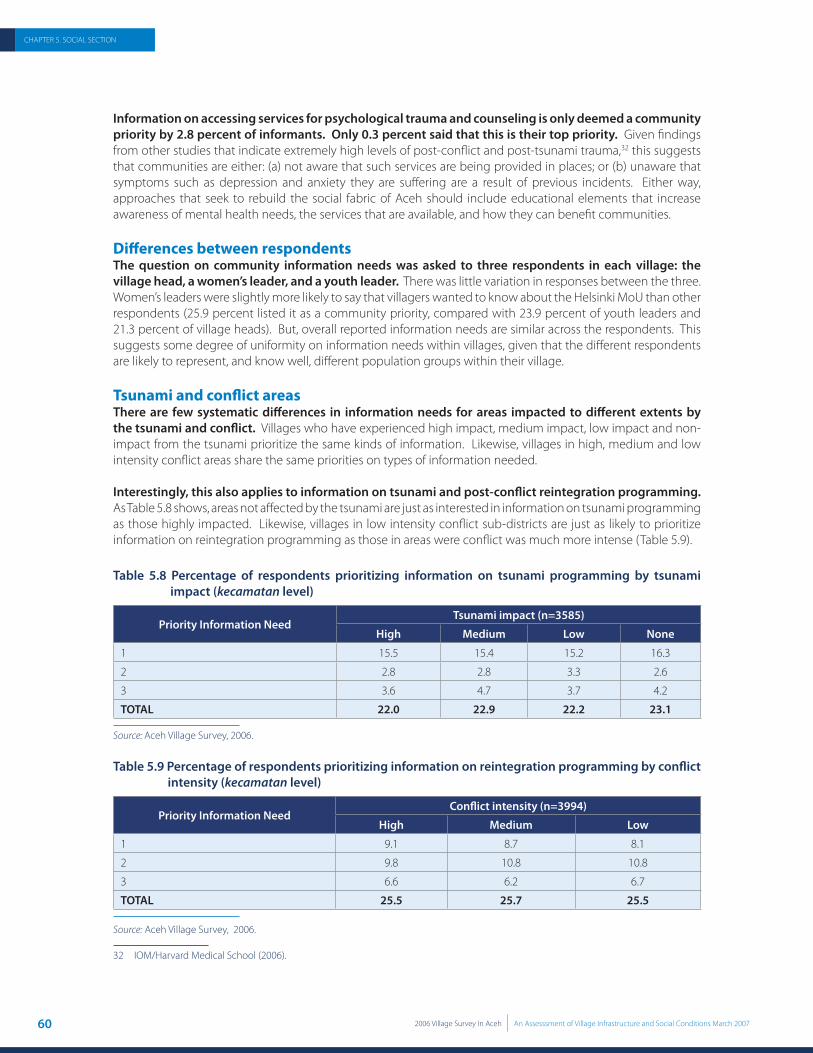
60 2006 Village Survey In Aceh An Assesssment of Village Infrastructure and Social Conditions March 2007
CHAPTER 5. SOCIAL SECTION
Information on accessing services for psychological trauma and counseling is only deemed a community priority by 2.8 percent of informants. Only 0.3 percent said that this is their top priority. Given fi ndings from other studies that indicate extremely high levels of post-confl ict and post-tsunami trauma,32 this suggests that communities are either: (a) not aware that such services are being provided in places; or (b) unaware that symptoms such as depression and anxiety they are suff ering are a result of previous incidents. Either way, approaches that seek to rebuild the social fabric of Aceh should include educational elements that increase awareness of mental health needs, the services that are available, and how they can benefi t communities.
Diff erences between respondents The question on community information needs was asked to three respondents in each village: the village head, a women’s leader, and a youth leader. There was little variation in responses between the three. Women’s leaders were slightly more likely to say that villagers wanted to know about the Helsinki MoU than other respondents (25.9 percent listed it as a community priority, compared with 23.9 percent of youth leaders and 21.3 percent of village heads). But, overall reported information needs are similar across the respondents. This suggests some degree of uniformity on information needs within villages, given that the diff erent respondents are likely to represent, and know well, diff erent population groups within their village.
Tsunami and confl ict areasThere are few systematic diff erences in information needs for areas impacted to diff erent extents by the tsunami and confl ict. Villages who have experienced high impact, medium impact, low impact and non-impact from the tsunami prioritize the same kinds of information. Likewise, villages in high, medium and low intensity confl ict areas share the same priorities on types of information needed.
Interestingly, this also applies to information on tsunami and post-confl ict reintegration programming. As Table 5.8 shows, areas not aff ected by the tsunami are just as interested in information on tsunami programming as those highly impacted. Likewise, villages in low intensity confl ict sub-districts are just as likely to prioritize information on reintegration programming as those in areas were confl ict was much more intense (Table 5.9).
Table 5.8 Percentage of respondents prioritizing information on tsunami programming by tsunami impact (kecamatan level)
Priority Information NeedTsunami impact (n=3585)
High Medium Low None
1 15.5 15.4 15.2 16.3
2 2.8 2.8 3.3 2.6
3 3.6 4.7 3.7 4.2
TOTAL 22.0 22.9 22.2 23.1
Source: Aceh Village Survey, 2006.
Table 5.9 Percentage of respondents prioritizing information on reintegration programming by confl ict intensity (kecamatan level)
Priority Information NeedConfl ict intensity (n=3994)
High Medium Low
1 9.1 8.7 8.1
2 9.8 10.8 10.8
3 6.6 6.2 6.7
TOTAL 25.5 25.7 25.5
Source: Aceh Village Survey, 2006.
32 IOM/Harvard Medical School (2006).

612006 Village Survey In Aceh An Assesssment of Village Infrastructure and Social Conditions March 2007
CHAPTER 5. SOCIAL SECTION
These fi ndings show the extent to which tsunami reconstruction and post-confl ict reintegration are province-wide processes. The scale of the tsunami and the impacts of confl ict were such that everyone in Aceh was aff ected, directly or indirectly. Even areas that were not directly impacted by the tsunami experienced indirect eff ects: in terms of population movements; in terms of changes in the structure of the economy; and so on. areas that did not suff er directly from confl ict also experienced indirect impacts, in particular in the martial law period. There were restrictions on travel, specifi cally on ID cards and use of cellular phones, and freedom of expression and assembly were limited. People understand that the twin processes of post-tsunami and post-confl ict recovery will fundamentally reshape Aceh and, as such, are interested in receiving information on them. The implications are major: province-wide information strategies are needed.
What Information Do Village Heads, Women’s Leaders and Youth Leaders Share with Communities?
Local leaders are most likely to regularly share information about village development and village budget information with communities. As Figure 5.9 shows, 17.9 percent of local leaders say they always share information on village development, and 46.3 percent say they often do. Meanwhile, 11.1 percent say they always share information on the village budget, and 46.7 percent say they often do. This is not surprising given the extent of community interest in these topics (see above).
Figure 5.9 Types of information that local leaders share with community
0%
20%
40%
60%
80%
100%
120%
Always 3.1% 4.0% 4.4% 11.1% 17.9% 12.5%Often 22.9% 29.6% 24.7% 46.7% 46.3% 50.5%Sometimes 24.1% 28.6% 28.2% 22.4% 19.5% 10.8%Seldom 22.3% 21.6% 20.3% 11.5% 8.9% 7.7%Never 27.5% 16.2% 22.4% 8.3% 7.4% 18.5%
Tsunami programs Helsinki MoU re integrationprograms
Village budgetusage
Developmentprograms
Others
As the head of village/youth leader/women leader, how often do you share thefollowing information with your community?
Source : Aceh Village Survey, 2006.
Local leaders less commonly share information on tsunami and reintegration programming or information relating to the Helsinki MoU. This may be because the tsunami only impacted some areas of Aceh, and because the impacts of confl ict and hence reintegration needs are uneven across areas. However, as the analysis above shows, communities across all of Aceh want more information on these areas. It may be that communities receive information from other sources on these topics. The analysis below shows, for example, that television, radio and newspapers are more common sources of information on MoU-related topics than local leaders. However, given the added advantages of information that is communicated directly, face to face, it does suggest that greater eff orts should be made in providing information on these areas to local leaders, and to building their capacity to share this information with the communities they represent.
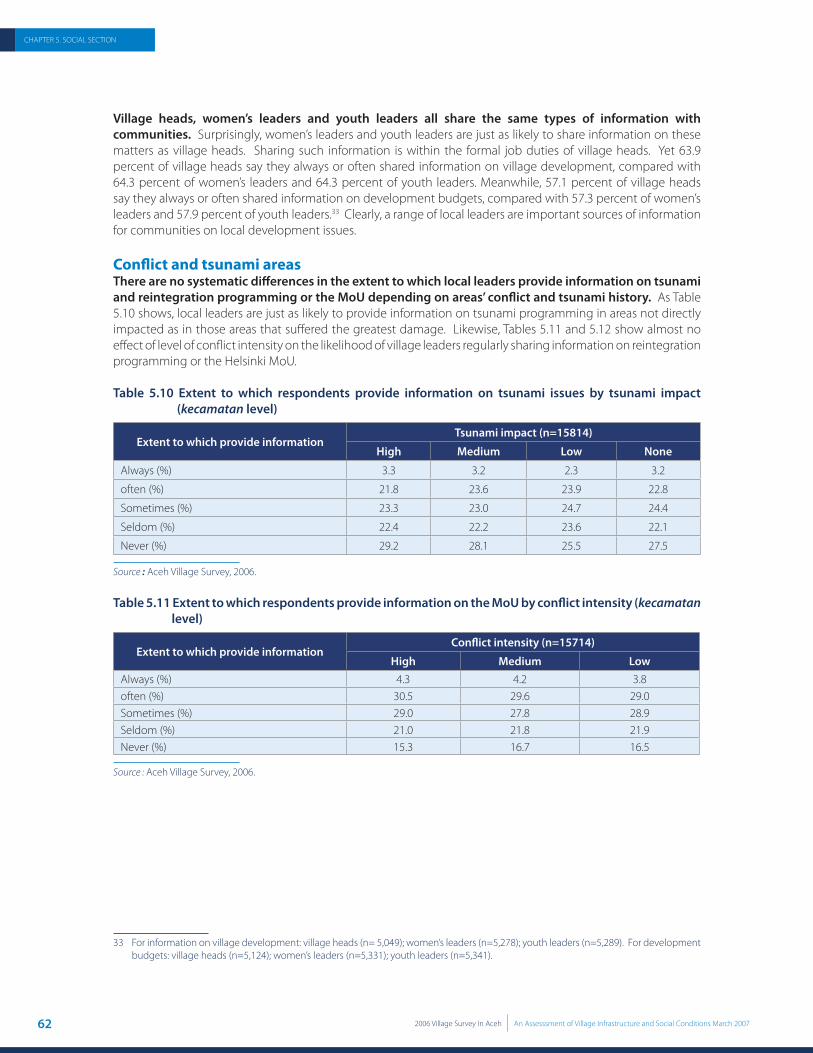
62 2006 Village Survey In Aceh An Assesssment of Village Infrastructure and Social Conditions March 2007
CHAPTER 5. SOCIAL SECTION
Village heads, women’s leaders and youth leaders all share the same types of information with communities. Surprisingly, women’s leaders and youth leaders are just as likely to share information on these matters as village heads. Sharing such information is within the formal job duties of village heads. Yet 63.9 percent of village heads say they always or often shared information on village development, compared with 64.3 percent of women’s leaders and 64.3 percent of youth leaders. Meanwhile, 57.1 percent of village heads say they always or often shared information on development budgets, compared with 57.3 percent of women’s leaders and 57.9 percent of youth leaders.33 Clearly, a range of local leaders are important sources of information for communities on local development issues.
Confl ict and tsunami areasThere are no systematic diff erences in the extent to which local leaders provide information on tsunami and reintegration programming or the MoU depending on areas’ confl ict and tsunami history. As Table 5.10 shows, local leaders are just as likely to provide information on tsunami programming in areas not directly impacted as in those areas that suff ered the greatest damage. Likewise, Tables 5.11 and 5.12 show almost no eff ect of level of confl ict intensity on the likelihood of village leaders regularly sharing information on reintegration programming or the Helsinki MoU.
Table 5.10 Extent to which respondents provide information on tsunami issues by tsunami impact (kecamatan level)
Extent to which provide informationTsunami impact (n=15814)
High Medium Low None
Always (%) 3.3 3.2 2.3 3.2
often (%) 21.8 23.6 23.9 22.8
Sometimes (%) 23.3 23.0 24.7 24.4
Seldom (%) 22.4 22.2 23.6 22.1
Never (%) 29.2 28.1 25.5 27.5
Source : Aceh Village Survey, 2006.
Table 5.11 Extent to which respondents provide information on the MoU by confl ict intensity (kecamatan level)
Extent to which provide informationConfl ict intensity (n=15714)
High Medium LowAlways (%) 4.3 4.2 3.8often (%) 30.5 29.6 29.0Sometimes (%) 29.0 27.8 28.9Seldom (%) 21.0 21.8 21.9Never (%) 15.3 16.7 16.5
Source : Aceh Village Survey, 2006.
33 For information on village development: village heads (n= 5,049); women’s leaders (n=5,278); youth leaders (n=5,289). For development budgets: village heads (n=5,124); women’s leaders (n=5,331); youth leaders (n=5,341).
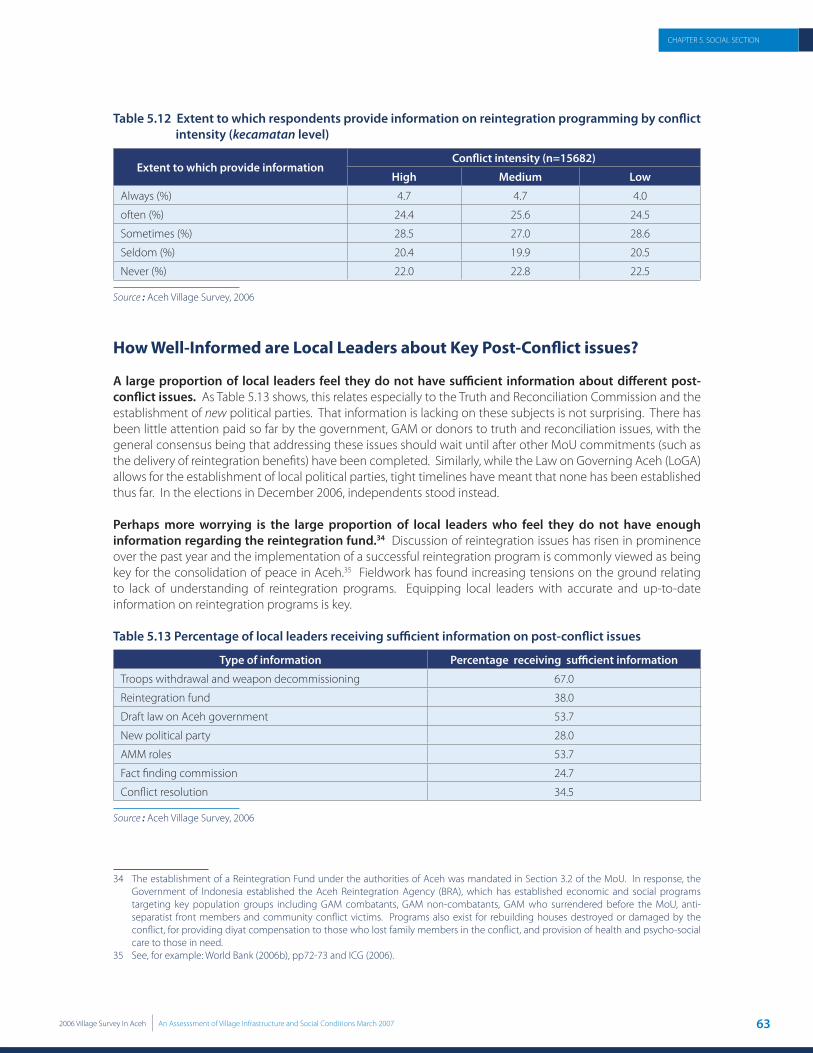
632006 Village Survey In Aceh An Assesssment of Village Infrastructure and Social Conditions March 2007
CHAPTER 5. SOCIAL SECTION
Table 5.12 Extent to which respondents provide information on reintegration programming by confl ict intensity (kecamatan level)
Extent to which provide informationConfl ict intensity (n=15682)
High Medium Low
Always (%) 4.7 4.7 4.0
often (%) 24.4 25.6 24.5
Sometimes (%) 28.5 27.0 28.6
Seldom (%) 20.4 19.9 20.5
Never (%) 22.0 22.8 22.5
Source : Aceh Village Survey, 2006
How Well-Informed are Local Leaders about Key Post-Confl ict issues?
A large proportion of local leaders feel they do not have suffi cient information about diff erent post-confl ict issues. As Table 5.13 shows, this relates especially to the Truth and Reconciliation Commission and the establishment of new political parties. That information is lacking on these subjects is not surprising. There has been little attention paid so far by the government, GAM or donors to truth and reconciliation issues, with the general consensus being that addressing these issues should wait until after other MoU commitments (such as the delivery of reintegration benefi ts) have been completed. Similarly, while the Law on Governing Aceh (LoGA) allows for the establishment of local political parties, tight timelines have meant that none has been established thus far. In the elections in December 2006, independents stood instead.
Perhaps more worrying is the large proportion of local leaders who feel they do not have enough information regarding the reintegration fund.34 Discussion of reintegration issues has risen in prominence over the past year and the implementation of a successful reintegration program is commonly viewed as being key for the consolidation of peace in Aceh.35 Fieldwork has found increasing tensions on the ground relating to lack of understanding of reintegration programs. Equipping local leaders with accurate and up-to-date information on reintegration programs is key.
Table 5.13 Percentage of local leaders receiving suffi cient information on post-confl ict issues
Type of information Percentage receiving suffi cient information
Troops withdrawal and weapon decommissioning 67.0
Reintegration fund 38.0
Draft law on Aceh government 53.7
New political party 28.0
AMM roles 53.7
Fact fi nding commission 24.7
Confl ict resolution 34.5
Source : Aceh Village Survey, 2006
34 The establishment of a Reintegration Fund under the authorities of Aceh was mandated in Section 3.2 of the MoU. In response, the Government of Indonesia established the Aceh Reintegration Agency (BRA), which has established economic and social programs targeting key population groups including GAM combatants, GAM non-combatants, GAM who surrendered before the MoU, anti-separatist front members and community confl ict victims. Programs also exist for rebuilding houses destroyed or damaged by the confl ict, for providing diyat compensation to those who lost family members in the confl ict, and provision of health and psycho-social care to those in need.
35 See, for example: World Bank (2006b), pp72-73 and ICG (2006).

64 2006 Village Survey In Aceh An Assesssment of Village Infrastructure and Social Conditions March 2007
CHAPTER 5. SOCIAL SECTION
Village heads are least likely to feel they have suffi cient information on post-confl ict topics. As Figure 5.10 shows, for all issues, youth leaders are more likely to feel they have enough information, while women’s leaders are even more likely to feel this. This is probably not an indicator of diff erent levels of knowledge that village heads, women’s leaders and youth leaders possess. Rather, it suggests that expectations are higher among village heads, who may see themselves as being the primary source of information on such issues, even if communities disagree.
Figure 5.10 Percentage of village heads, youth leaders and women’s leaders receiving suffi cient information on post-confl ict issues
0%
10%20%30%40%
50%60%70%80%
%fR
so
ednop
n tp
eo
no
si
in
Village Head 64.2% 36.4% 52.1% 27.1% 50.8% 23.6% 33.0%Youth Leader 67.0% 38.1% 52.8% 27.5% 54.2% 25.4% 35.2%Women's Leader 69.7% 39.4% 56.2% 29.2% 55.9% 25.1% 35.2%
Troops withdrawaland weapon
decommisioning
Draft of lawon thegoverning of Aceh
(RUU-PA)
Establishment of newpolitical partyGAM
Roles of AMM (AcehMonitoring Mission)
Establishment of facts finding and
reconciliation committee
information on the following issues?
Source: Village Survey, 2006.
Impact by intensity of confl ictThe history of confl ict has little impact on whether local leaders feel they have received suffi cient information on post-confl ict issues (Figure 5.11).
Figure 5.11 Percentage of respondents who have received suffi cient information by confl ict intensity area
Establishment offacts finding and
reconciliation committee
0%
10%
20%
30%
40%
50%
60%
70%
80%
%fo
r pse
dnone
tsnoinipo
High 68.0% 36.7% 53.5% 28.2% 54.0% 24.7% 33.9%Medium 67.4% 39.2% 53.8% 28.7% 53.5% 25.1% 35.0%Low 66.1% 38.0% 53.7% 27.4% 53.6% 24.6% 34.5%
Troops Withdrawaland weapon
decommisioning
Reintegration fu nd forex-GAM returnees and
Draft of Law on the Governing of Aceh
(RUU-PA)
Establishment of newpolitical party
Roles of AMM (AcehMonitoring Mission)
As the head of village/youth leader/women's leader, do you feel that you have
Source : Aceh Village Survey, 2006.
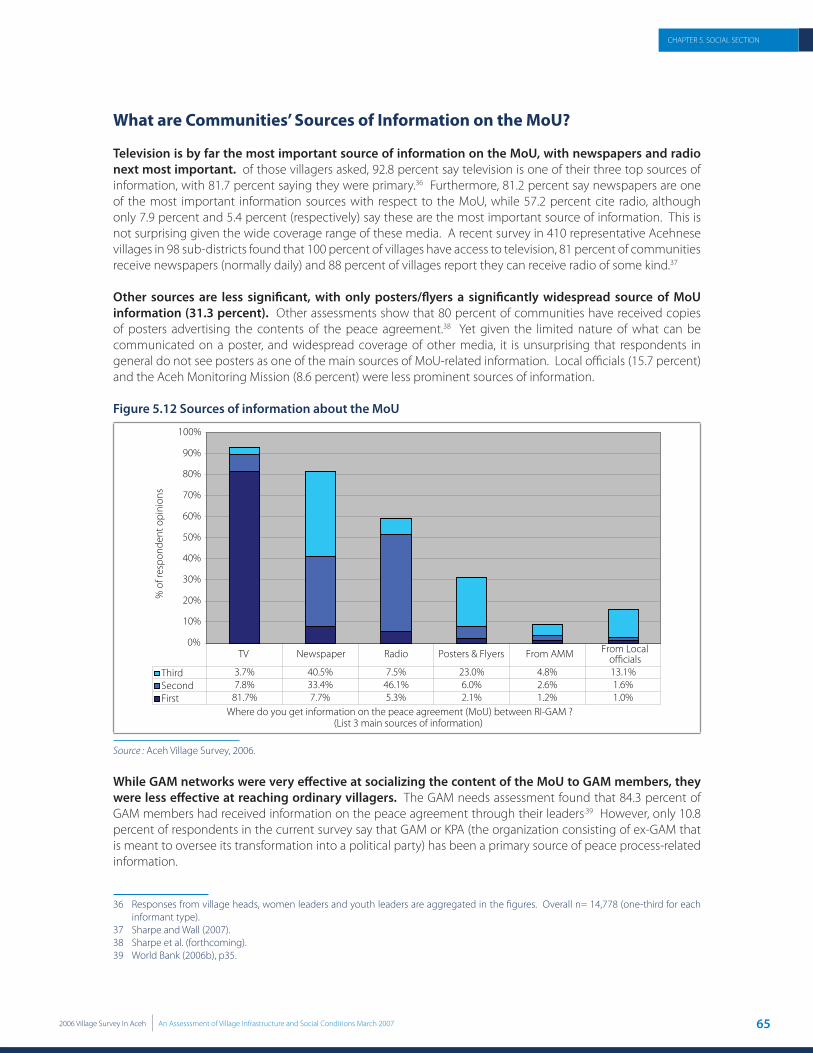
652006 Village Survey In Aceh An Assesssment of Village Infrastructure and Social Conditions March 2007
CHAPTER 5. SOCIAL SECTION
What are Communities’ Sources of Information on the MoU?
Television is by far the most important source of information on the MoU, with newspapers and radio next most important. of those villagers asked, 92.8 percent say television is one of their three top sources of information, with 81.7 percent saying they were primary.36 Furthermore, 81.2 percent say newspapers are one of the most important information sources with respect to the MoU, while 57.2 percent cite radio, although only 7.9 percent and 5.4 percent (respectively) say these are the most important source of information. This is not surprising given the wide coverage range of these media. A recent survey in 410 representative Acehnese villages in 98 sub-districts found that 100 percent of villages have access to television, 81 percent of communities receive newspapers (normally daily) and 88 percent of villages report they can receive radio of some kind.37
Other sources are less signifi cant, with only posters/fl yers a signifi cantly widespread source of MoU information (31.3 percent). Other assessments show that 80 percent of communities have received copies of posters advertising the contents of the peace agreement.38 Yet given the limited nature of what can be communicated on a poster, and widespread coverage of other media, it is unsurprising that respondents in general do not see posters as one of the main sources of MoU-related information. Local offi cials (15.7 percent) and the Aceh Monitoring Mission (8.6 percent) were less prominent sources of information.
Figure 5.12 Sources of information about the MoU
0%
10%
20%
30%
40%
50%
60%
70%
80%
90%
100%
snoinipo tn ednop ser fo %
Third 3.7% 40.5% 7.5% 23.0% 4.8% 13.1%Second 7.8% 33.4% 46.1% 6.0% 2.6% 1.6%First 81.7% 7.7% 5.3% 2.1% 1.2% 1.0%
TV Newspaper Radio Posters & Flyers From AMM From Local
Where do you get information on the peace agreement (MoU) between RI-GAM ?(List 3 main sources of information)
Source : Aceh Village Survey, 2006.
While GAM networks were very eff ective at socializing the content of the MoU to GAM members, they were less eff ective at reaching ordinary villagers. The GAM needs assessment found that 84.3 percent of GAM members had received information on the peace agreement through their leaders.39 However, only 10.8 percent of respondents in the current survey say that GAM or KPA (the organization consisting of ex-GAM that is meant to oversee its transformation into a political party) has been a primary source of peace process-related information.
36 Responses from village heads, women leaders and youth leaders are aggregated in the fi gures. Overall n= 14,778 (one-third for each informant type).
37 Sharpe and Wall (2007).38 Sharpe et al. (forthcoming).39 World Bank (2006b), p35.

66 2006 Village Survey In Aceh An Assesssment of Village Infrastructure and Social Conditions March 2007
CHAPTER 5. SOCIAL SECTION
Again, there is no substantive diff erence in the responses of village heads, women’s leaders and youth leaders.
Confl ict areasThe history of confl ict in an area does not correlate with diff erences in the relative importance of diff erent sources of information about the MoU. This fi ts broadly with the fi ndings of another study that mapped access to diff erent media across 410 villages.40 The distribution and reach of most mass media does not diff er greatly between villages in high and low confl ict sub-districts, with newspaper, radio and television coverage being similar. Interestingly, respondents were no more likely to say that they received information from GAM in high confl ict areas than in areas with medium or low intensity confl ict.
Conclusions and Recommendations: Information Needs
The survey results point to a number of conclusions and recommendations on how information eff orts should be focused.
Communities require information on a wide range of issues that aff ect ther day-to-day lives. Unsurprisingly, people prioritize receiving information that they fi nd useful. This includes information on development programs and economic opportunities.
There is a mismatch between the interest of communities in the Aceh peace process and the extent to which local leaders feel equipped to provide it. More than a year after the Helsinki agreement, communities still prioritize receiving information on the MoU, acknowledging that its successful implementation will have a major impact of their lives in the coming years. However, village heads felt they did not have adequate information on both the MoU and the reintegration programming to share with their constituents. Despite early post-MoU socialization programs, there has been under-investment by the government and donors to ensure that information on the peace process reaches communities.
There is a need to utilize multiple people within villages to share information. Women’s leaders and youth leaders were as likely to share information on issues such as village development as were village heads. and yet, within villages there appear to be diff erences on who provides what kind of information. Thus, systematically providing a range of local leaders with information on key issues would improve information fl ows to communities.
5.3. VILLAGE NEEDS
This section of the Aceh Village Survey assesses the main village needs in Aceh. The survey team also analyzed whether the reported needs were consistent with other sections of the survey including access to several public services (namely primary education, health services, water and sanitation, and public transportation) and with the infrastructure status report.
The Needs of Villagers in Aceh
The main village need is roads. of all respondents interviewed in the survey, nearly half (48.4 percent, or 7,701 out of 15,911 respondents) chose roads as the fi rst priority need of their village.41 Observing the cumulative proportion across fi rst, second and third priority needs, Figure 5.13 shows that roads rank top as being the
40 Sharpe and Wall (2007). 41 Total responses for the fi rst priority is 15,911, second priority 15,901 and third priority 15,615. The no response rate for all three priority
needs is around 5 percent of the total respondents.
•
•
•
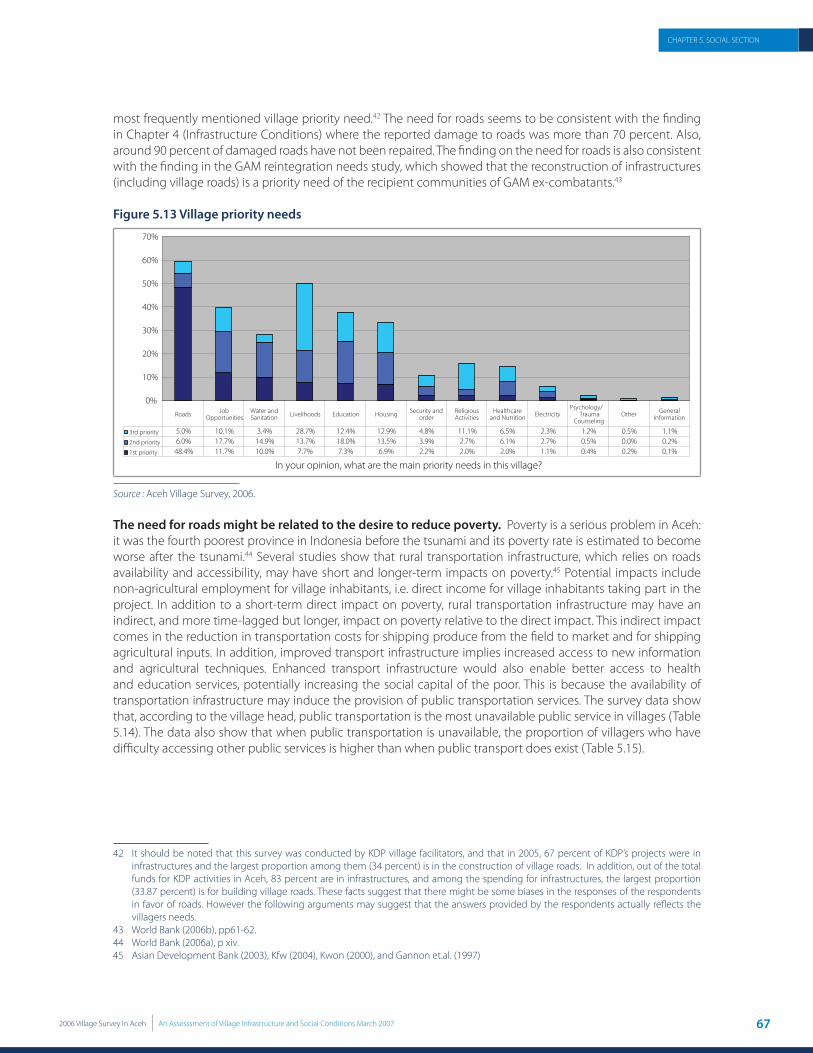
672006 Village Survey In Aceh An Assesssment of Village Infrastructure and Social Conditions March 2007
CHAPTER 5. SOCIAL SECTION
most frequently mentioned village priority need.42 The need for roads seems to be consistent with the fi nding in Chapter 4 (Infrastructure Conditions) where the reported damage to roads was more than 70 percent. Also, around 90 percent of damaged roads have not been repaired. The fi nding on the need for roads is also consistent with the fi nding in the GAM reintegration needs study, which showed that the reconstruction of infrastructures (including village roads) is a priority need of the recipient communities of GAM ex-combatants.43
Figure 5.13 Village priority needs
0%
10%
20%
30%
40%
50%
60%
70%
3rd priority 5.0% 10.1% 3.4% 28.7% 12.4% 12.9% 4.8% 11.1% 6.5% 2.3% 1.2% 0.5% 1.1%2nd priority 6.0% 17.7% 14.9% 13.7% 18.0% 13.5% 3.9% 2.7% 6.1% 2.7% 0.5% 0.0% 0.2%1st priority 48.4% 11.7% 10.0% 7.7% 7.3% 6.9% 2.2% 2.0% 2.0% 1.1% 0.4% 0.2% 0.1%
Roads Job Opportunities
Water and Sanitation Livelihoods Education Housing Security and
orderReligious Activities
Healthcare and Nutrition Electricity
Psychology/Trauma
CounselingOther General
Information
In your opinion, what are the main priority needs in this village?
Source : Aceh Village Survey, 2006.
The need for roads might be related to the desire to reduce poverty. Poverty is a serious problem in Aceh: it was the fourth poorest province in Indonesia before the tsunami and its poverty rate is estimated to become worse after the tsunami.44 Several studies show that rural transportation infrastructure, which relies on roads availability and accessibility, may have short and longer-term impacts on poverty.45 Potential impacts include non-agricultural employment for village inhabitants, i.e. direct income for village inhabitants taking part in the project. In addition to a short-term direct impact on poverty, rural transportation infrastructure may have an indirect, and more time-lagged but longer, impact on poverty relative to the direct impact. This indirect impact comes in the reduction in transportation costs for shipping produce from the fi eld to market and for shipping agricultural inputs. In addition, improved transport infrastructure implies increased access to new information and agricultural techniques. Enhanced transport infrastructure would also enable better access to health and education services, potentially increasing the social capital of the poor. This is because the availability of transportation infrastructure may induce the provision of public transportation services. The survey data show that, according to the village head, public transportation is the most unavailable public service in villages (Table 5.14). The data also show that when public transportation is unavailable, the proportion of villagers who have diffi culty accessing other public services is higher than when public transport does exist (Table 5.15).
42 It should be noted that this survey was conducted by KDP village facilitators, and that in 2005, 67 percent of KDP’s projects were in infrastructures and the largest proportion among them (34 percent) is in the construction of village roads. In addition, out of the total funds for KDP activities in Aceh, 83 percent are in infrastructures, and among the spending for infrastructures, the largest proportion (33.87 percent) is for building village roads. These facts suggest that there might be some biases in the responses of the respondents in favor of roads. However the following arguments may suggest that the answers provided by the respondents actually refl ects the villagers needs.
43 World Bank (2006b), pp61-62. 44 World Bank (2006a), p xiv. 45 Asian Development Bank (2003), Kfw (2004), Kwon (2000), and Gannon et.al. (1997)
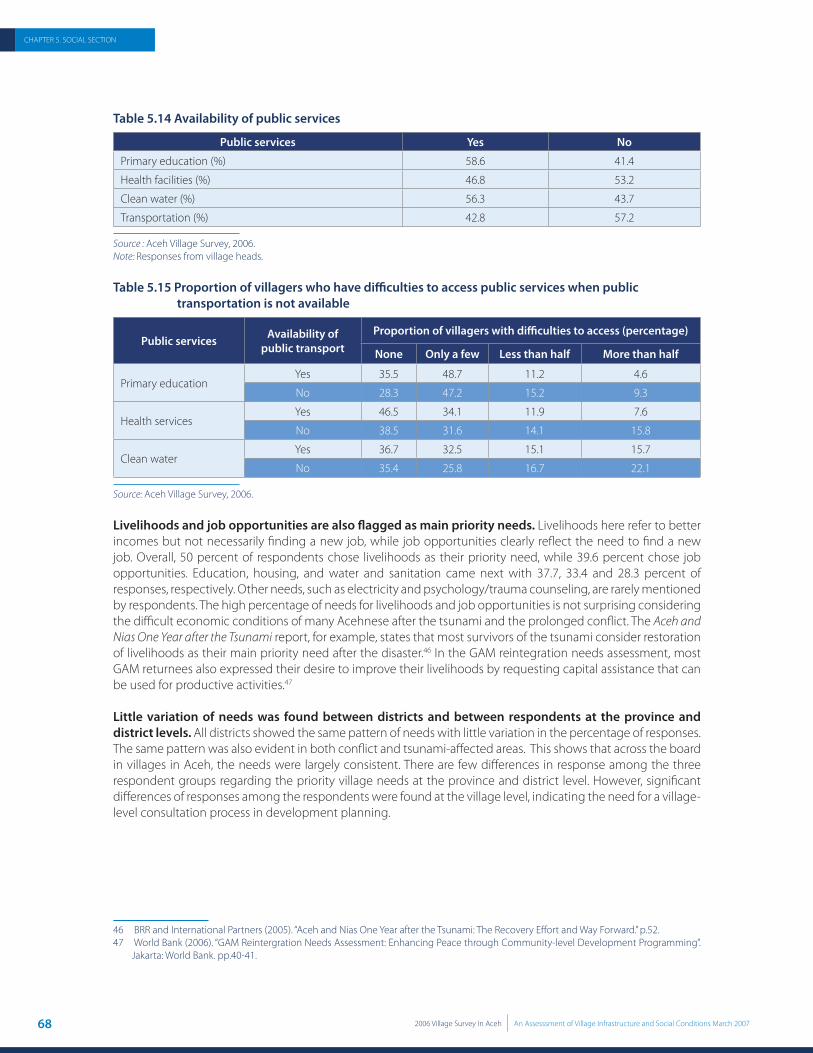
68 2006 Village Survey In Aceh An Assesssment of Village Infrastructure and Social Conditions March 2007
CHAPTER 5. SOCIAL SECTION
Table 5.14 Availability of public services
Public services Yes No
Primary education (%) 58.6 41.4
Health facilities (%) 46.8 53.2
Clean water (%) 56.3 43.7
Transportation (%) 42.8 57.2
Source : Aceh Village Survey, 2006. Note: Responses from village heads.
Table 5.15 Proportion of villagers who have diffi culties to access public services when public transportation is not available
Public services Availability of public transport
Proportion of villagers with diffi culties to access (percentage)
None Only a few Less than half More than half
Primary educationYes 35.5 48.7 11.2 4.6
No 28.3 47.2 15.2 9.3
Health servicesYes 46.5 34.1 11.9 7.6
No 38.5 31.6 14.1 15.8
Clean waterYes 36.7 32.5 15.1 15.7
No 35.4 25.8 16.7 22.1
Source: Aceh Village Survey, 2006.
Livelihoods and job opportunities are also fl agged as main priority needs. Livelihoods here refer to better incomes but not necessarily fi nding a new job, while job opportunities clearly refl ect the need to fi nd a new job. Overall, 50 percent of respondents chose livelihoods as their priority need, while 39.6 percent chose job opportunities. Education, housing, and water and sanitation came next with 37.7, 33.4 and 28.3 percent of responses, respectively. Other needs, such as electricity and psychology/trauma counseling, are rarely mentioned by respondents. The high percentage of needs for livelihoods and job opportunities is not surprising considering the diffi cult economic conditions of many Acehnese after the tsunami and the prolonged confl ict. The Aceh and Nias One Year after the Tsunami report, for example, states that most survivors of the tsunami consider restoration of livelihoods as their main priority need after the disaster.46 In the GAM reintegration needs assessment, most GAM returnees also expressed their desire to improve their livelihoods by requesting capital assistance that can be used for productive activities.47
Little variation of needs was found between districts and between respondents at the province and district levels. All districts showed the same pattern of needs with little variation in the percentage of responses. The same pattern was also evident in both confl ict and tsunami-aff ected areas. This shows that across the board in villages in Aceh, the needs were largely consistent. There are few diff erences in response among the three respondent groups regarding the priority village needs at the province and district level. However, signifi cant diff erences of responses among the respondents were found at the village level, indicating the need for a village-level consultation process in development planning.
46 BRR and International Partners (2005). “Aceh and Nias One Year after the Tsunami: The Recovery Eff ort and Way Forward.” p.52.47 World Bank (2006). “GAM Reintergration Needs Assessment: Enhancing Peace through Community-level Development Programming”.
Jakarta: World Bank. pp.40-41.
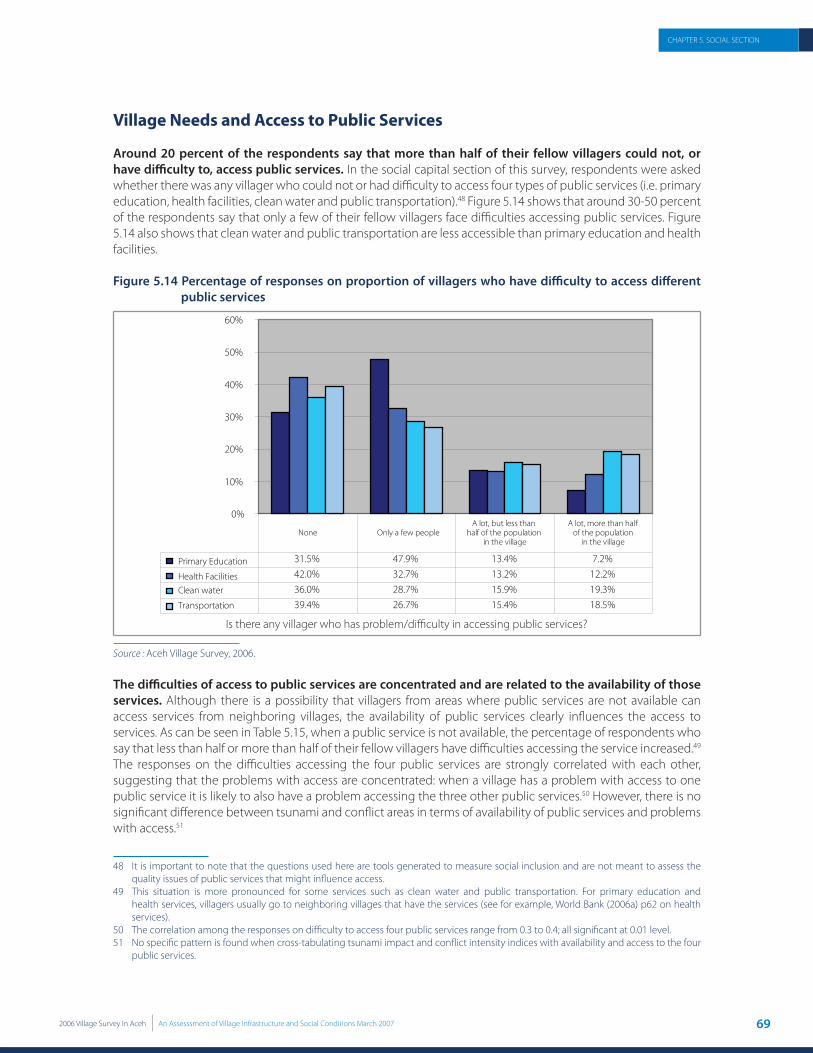
692006 Village Survey In Aceh An Assesssment of Village Infrastructure and Social Conditions March 2007
CHAPTER 5. SOCIAL SECTION
Village Needs and Access to Public Services
Around 20 percent of the respondents say that more than half of their fellow villagers could not, or have diffi culty to, access public services. In the social capital section of this survey, respondents were asked whether there was any villager who could not or had diffi culty to access four types of public services (i.e. primary education, health facilities, clean water and public transportation).48 Figure 5.14 shows that around 30-50 percent of the respondents say that only a few of their fellow villagers face diffi culties accessing public services. Figure 5.14 also shows that clean water and public transportation are less accessible than primary education and health facilities.
Figure 5.14 Percentage of responses on proportion of villagers who have diffi culty to access diff erent public services
0%
10%
20%
30%
40%
50%
60%
Primary Education 31.5% 47.9% 13.4% 7.2%
Health Facilities 42.0% 32.7% 13.2% 12.2%
Clean water 36.0% 28.7% 15.9% 19.3%Transportation 39.4% 26.7% 15.4% 18.5%
None Only a few peopleA lot, but less than
half of the populationin the village
A lot, more than halfof the population
in the village
Source : Aceh Village Survey, 2006.
The diffi culties of access to public services are concentrated and are related to the availability of those services. Although there is a possibility that villagers from areas where public services are not available can access services from neighboring villages, the availability of public services clearly infl uences the access to services. As can be seen in Table 5.15, when a public service is not available, the percentage of respondents who say that less than half or more than half of their fellow villagers have diffi culties accessing the service increased.49 The responses on the diffi culties accessing the four public services are strongly correlated with each other, suggesting that the problems with access are concentrated: when a village has a problem with access to one public service it is likely to also have a problem accessing the three other public services.50 However, there is no signifi cant diff erence between tsunami and confl ict areas in terms of availability of public services and problems with access.51
48 It is important to note that the questions used here are tools generated to measure social inclusion and are not meant to assess the quality issues of public services that might infl uence access.
49 This situation is more pronounced for some services such as clean water and public transportation. For primary education and health services, villagers usually go to neighboring villages that have the services (see for example, World Bank (2006a) p62 on health services).
50 The correlation among the responses on diffi culty to access four public services range from 0.3 to 0.4; all signifi cant at 0.01 level.51 No specifi c pattern is found when cross-tabulating tsunami impact and confl ict intensity indices with availability and access to the four
public services.

70 2006 Village Survey In Aceh An Assesssment of Village Infrastructure and Social Conditions March 2007
CHAPTER 5. SOCIAL SECTION
Table 5.16 Relation between access to health, education, water and sanitation and the availability of public services
Public services AvailabilityProportion of villagers with diffi culties in access
None Only a few Less than half More than halfTotal Percent Total Percent Total Percent Total Percent
Primary Education
Yes 3,099 33.8 4,489 49.0 1,097 12.0 472 5.2
No 1,709 27.8 2,839 46.2 958 15.6 635 10.3
Health ServicesYes 3,769 51.8 2,419 33.3 662 9.1 420 5.8
No 2,589 32.8 2,532 32.1 1,332 16.9 1,429 18.1
Clean WaterYes 3,893 43.9 3,118 35.2 1,122 12.7 729 8.2
No 1,588 25.0 1,249 19.7 1,296 20.4 2,219 34.9
TransportationYes 3,616 54.2 2,144 32.1 619 9.3 295 4.4
No 2,297 27.6 1,856 22.3 1,696 20.4 2,476 29.7
Source : Aceh Village Survey, 2006.
Village priority needs are not always consistent with access to public services. Around 20 percent of respondents say that more than half of their fellow villagers have problems accessing clean water (Figure 5.14).52 However, less than 30 percent of all respondents choose water as their priority need. of those who say that more than half of the villagers have problems accessing clean water, only 11 percent fl ag water as their priority need. On the contrary, while less than 10 percent of respondents say that more than half of the villagers have diffi culty accessing primary schools, education is chosen by almost 40 percent of respondents as their priority need. For electricity, while about 27 percent of households in Aceh do not have access to electricity according to the APEA report,53 only 6 percent of respondents choose electricity as their priority need. This indicates that access is not the only consideration behind villagers’ views of their needs. Thus, for the purpose of development planning, besides looking at access issues, planners also need to assess the needs as these are perceived by the community. Communities may have more compelling reasons to choose certain needs despite apparent access problems to some services.
Village Needs and Poverty
Poverty is the main reason behind the diffi culties in accessing public services but has no direct relation with respondents’ choice of priority village need. When asked about the main reason that their fellow villagers had diffi culties accessing public services and social activities, 77 percent of respondents say that poverty is the main reason behind the diffi culties (Figure 5.19). A cross tabulation between fi rst priority village needs with access to the four public services shows an interesting pattern: as the proportion of villagers who have diffi culty to access increases, so respondents are less likely to choose roads as their fi rst priority need and more likely to choose livelihoods (Figure 5.15). This seems to suggest that as diffi culty in access increases—the main reason for which is poverty—the more likely respondents will choose livelihoods as their fi rst priority need. However, when repeating the same exercise using a poverty level index, no correlation is found between the level of poverty in an area with respondents’ choice of fi rst priority village
52 For primary education, 79 percent of respondents chose none or only a few (12,155 out of 15,324); for health services 75 percent (11,348 out of 15,201); clean water 65 percent (9,886 out of 15,274); and transportation 66 percent (9,937 out of 15,037). The no response rate for this section is around 9 percent. All respondents are included in this analysis.
53 World Bank (2006a), p83.
Village Facilitator interviewed village head in Ds. Lancang, Kec. Bandar Baru Kab. Pidie

712006 Village Survey In Aceh An Assesssment of Village Infrastructure and Social Conditions March 2007
CHAPTER 5. SOCIAL SECTION
needs (Table 5.17).54 Also, when correlating between the poverty index and the responses for diffi culty to obtain access to each of the four public services, no relation was found between the diffi culties in obtaining access with the poverty level in an area. This seems to indicate that although many of the village local leaders (i.e. the respondents) associate access problems with poverty and are quite aware of the poverty situation in their communities, the magnitude of poverty itself has no direct infl uence over their opinions on priority village needs. It seems that regardless of the number of poor households in their communities, local leaders tend to think of poverty as a serious problem for their villages.
Figure 5.15 Percentage of respondents who chose roads and livelihoods as fi rst priority needs when proportion of villagers who have diffi culty to access diff erent public services increased
0%
5%
10%
15%
20%
25
Primary education 6.1% 7.2% 11.0% 13.8%Health facilities 6.2% 6.8% 9.4% 14.6%Clean water 5.4% 6.3% 9.3% 13.2%Tranportation 5.3% 4.1% 4.0% 22.0%
None Only a few people
Source : Aceh Village Survey, 2006.
Table 5.17 First priority needs by poverty level index
1st priority needsPercentage of responses by the poverty level index
Not poor Somewhat poor Poor Very poorSum Percent Sum Percent Sum Percent Sum Percent
Road 917 47.5 1,781 48.4 1,247 47.5 957 47.5
Water and sanitation 173 9.0 379 10.3 252 9.6 220 10.9
Job opportunities 237 12.3 428 11.6 321 12.2 235 11.7
Education 142 7.3 272 7.4 216 8.2 136 6.7
Electricity 27 1.4 32 0.9 21 0.8 26 1.3
Healthcare and Nutrition 41 2.1 78 2.1 49 1.9 46 2.3
Security and Order 41 2.1 69 1.9 63 2.4 50 2.5
Housing 147 7.6 248 6.7 180 6.9 144 7.1
Livelihoods 144 7.5 305 8.3 198 7.5 148 7.3
Counseling 9 0.5 11 0.3 9 0.3 10 0.5
Religious Activities 46 2.4 66 1.8 65 2.5 37 1.8
Information 4 0.2 5 0.1 3 0.1 3 0.1
Others 4 0.2 8 0.2 3 0.1 4 0.2
TOTAL 1,932 100 3,682 100 2,627 100 2,016 100
Source : Aceh Village Survey, 2006.
54 A poverty level index with four categories of poverty—not poor, somewhat poor, poor and very poor—has been created to help with this analysis. The poverty index level is created using the data on the percentage of poor households in each village (number of poor households divided by the number of total households). The index is divided into four categories:
• Not poor : % poor > 1 standard deviation below the mean • Somewhat poor : 1 standard deviation below the mean > % poor < mean • Poor : mean < % poor < 1 standard deviation above the mean • Very poor : % poor > 1 standard deviation above the mean

72 2006 Village Survey In Aceh An Assesssment of Village Infrastructure and Social Conditions March 2007
CHAPTER 5. SOCIAL SECTION
Conclusions and Recommendations: Village Needs
Roads, livelihoods, and job opportunities were reported as the priority needs of villagers. Planners should pay attention to these areas in discussing development at the village level. These needs are consistent across districts and are unrelated to either tsunami or confl ict incidence. Hence, development planning should target both tsunami and confl ict areas to ensure that all communities share the same benefi ts from development interventions.
It is important to conduct village/community-level consultations during the development planning process. As village priority needs do not always correspond with access to public services, planners need to consult with the community on their needs and not rely solely on reports regarding the availability and access to public services. Moreover, since there are diff ering opinions of needs among respondents at the village level, planners also need to ensure that the consultation process involves as many elements of the community as possible.
5.4. SOCIAL CAPITAL
In this section, the Aceh Village Survey examines social capital in Aceh almost two years after the tsunami and one year after the Helsinki MoU.55 The aspects included in this survey are social cohesion and inclusion, decision-making mechanisms, and trust and solidarity. Previous World Bank assessments on post-tsunami recovery and GAM reintegration show that social capital at the community level in Aceh is strong.56 Social capital is widely accepted as one of the key pillars for empowerment at the local level and as one of the key ingredients for successful community development programs. Understanding current social capital in Aceh is thus important in helping determine how development programs—including post-tsunami reconstruction and post-confl ict reconciliation—can best be carried out to serve the needs of the Acehnese.
Social capital is strong in Aceh, especially among groups that share similar backgrounds and characteristics, such as families, close friends, neighbors and colleagues. The exclusion level is low and is mainly caused by economic factors such as poverty. The level of trust and solidarity among villagers remains strong and solidarity levels have generally improved since the signing of the Helsinki MoU.
There are, however, some issues that might become potential problems for both the tsunami reconstruction and the confl ict reconciliation. First, the Acehnese still feel somewhat uncertain about the future of the peace process. Second, confl ict victims still experience some degree of exclusion from access to public services and participation in community functions. Third, in the decision-making processes, women are still largely under-represented. Since there is a high degree of diff erence of opinion between village heads, youth leaders and women’s leaders at the village level, it becomes important to ensure that women’s voices are heard in planning and implementing development programs. This is required in order to capture their special needs and to make sure that development outcomes are enjoyed by women and men alike.
55 Social capital usually refers to the organizations and networks and the underlying norms and values that govern the interactions among people in society (Grootaert and van Bastelaer, 2002, p2).
56 BRR and International Partners (2005), p45 and World Bank (2006b), p23.
•
•
Village Facilitator interviewed youth leader in Ds. Rantau Panjang, Kec. Longkip, Kab. Aceh Singkil
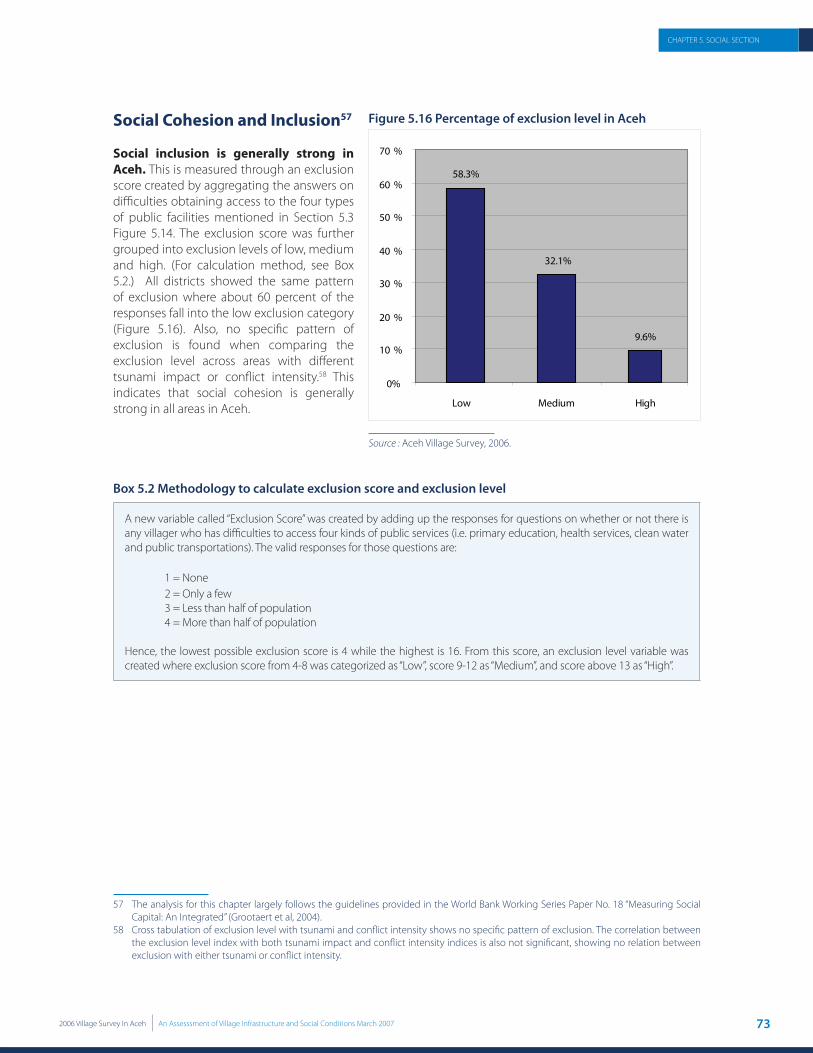
732006 Village Survey In Aceh An Assesssment of Village Infrastructure and Social Conditions March 2007
CHAPTER 5. SOCIAL SECTION
Social Cohesion and Inclusion57
Social inclusion is generally strong in Aceh. This is measured through an exclusion score created by aggregating the answers on diffi culties obtaining access to the four types of public facilities mentioned in Section 5.3 Figure 5.14. The exclusion score was further grouped into exclusion levels of low, medium and high. (For calculation method, see Box 5.2.) All districts showed the same pattern of exclusion where about 60 percent of the responses fall into the low exclusion category (Figure 5.16). Also, no specifi c pattern of exclusion is found when comparing the exclusion level across areas with diff erent tsunami impact or confl ict intensity.58 This indicates that social cohesion is generally strong in all areas in Aceh.
Box 5.2 Methodology to calculate exclusion score and exclusion level
A new variable called “Exclusion Score” was created by adding up the responses for questions on whether or not there is any villager who has diffi culties to access four kinds of public services (i.e. primary education, health services, clean water and public transportations). The valid responses for those questions are:
1 = None 2 = Only a few 3 = Less than half of population4 = More than half of population
Hence, the lowest possible exclusion score is 4 while the highest is 16. From this score, an exclusion level variable was created where exclusion score from 4-8 was categorized as “Low”, score 9-12 as “Medium”, and score above 13 as “High”.
57 The analysis for this chapter largely follows the guidelines provided in the World Bank Working Series Paper No. 18 “Measuring Social Capital: An Integrated” (Grootaert et al, 2004).
58 Cross tabulation of exclusion level with tsunami and confl ict intensity shows no specifi c pattern of exclusion. The correlation between the exclusion level index with both tsunami impact and confl ict intensity indices is also not signifi cant, showing no relation between exclusion with either tsunami or confl ict intensity.
Figure 5.16 Percentage of exclusion level in Aceh
58.3%
32.1%
9.6%
0%
10 %
20 %
30 %
40 %
50 %
60 %
70 %
Low Medium High
Source : Aceh Village Survey, 2006.

74 2006 Village Survey In Aceh An Assesssment of Village Infrastructure and Social Conditions March 2007
CHAPTER 5. SOCIAL SECTION
Some villagers experienced diffi culties participating in village meetings and social activities. While only 38 percent of respondents say that there are villagers who cannot, or who experience diffi culties, to attend social activities such as receptions, funerals, and religious festivals, up to 48 percent say that attending village meetings is diffi cult or impossible (Figure 5.17).59 Of those, around 70 percent say that less than half of the village population experience these diffi culties, indicating high social cohesion among villagers (Figure 5.18).60 The observation that the participation rate is higher for social activities than for village meetings seems to indicate that villagers are better able to attend social activities that are less formal and involved more interaction with family, friends and/or neighbors compared with more formal village meetings. This suggests that “bonding” social capital (i.e. ties to people with similar demographic characteristics, such as family members, neighbors and close friends) are strong in the villages.
Respondents’ views of the exclusion level are consistent at the province and district levels, but not at the village level. There is a high correlation of responses among the three groups of respondents at the province and district level (correlation = 0.99). However, correlation is very low (close to 0) at the village level.61 This indicates that although at the aggregate level the responses from the three groups of respondents are consistent with each other, this is not the case at the village level. Similar to the fi ndings in the other sections of the social status chapter, this observation re-emphasizes the need for development planning that takes into account opinions or inputs from as many segments of the population as possible.
Economic factors have more impact on villagers’ diffi culties gaining access to public services and attending meetings/social activities. When asked about the main reason behind the diffi culties of villagers obtaining access to public services or attending meetings/social activities, 89 percent of respondents give poverty as the reason, followed by lack of knowledge/education (58.7 percent) and occupation (52.7 percent) (Figure 5.19). This is understandable given the high level of poverty that still prevails in Aceh. Less than 10 percent of respondents choose identity-related factors such as religion and ethnicity/race as reasons for the exclusion. This is consistent with the fact that the confl ict in Aceh is in general not based on identity-related issues.62
59 For social activities, 6,053 out of 15,814 respondents said there were villagers who have diffi culties or cannot participate in social activities (no response rate: 5.6percent). For village meetings, 7,578 out of 15,809 respondents claimed that diffi culties existed (no response rate is the same with social activities).
60 5,345 out of 7,578 respondents for village meetings and 4,126 out of 6,053 for social activities.61 The same observation prevailed for all questions in this section.62 See World Bank (2006b), p23.
Figure 5.17 Percentage of responses on villagers who have diffi culty to attend village meetings and social activities
0%
10%
20%
30%
40%
50%
60%
70%
Village meetings 47.9% 52.1%Social activities 38.3% 61.7%
meetings/social activities?
Source : Aceh Village Survey, 2006.
Figure 5.18 Percentage of responses on the proportion of villagers who have diffi culty to attend village meetings and social activities
0%
10%
20%
30%
40%
50%
60%
70%
80%
Village meetings 13.2% 72.5% 14.3%
Social activities 12.2% 71.1% 16.7%
Only a few people A lot, but less than half of the population in the village
A lot, more than half of the population in the village
meetings/social activities ?
Source : Aceh Village Survey, 2006.
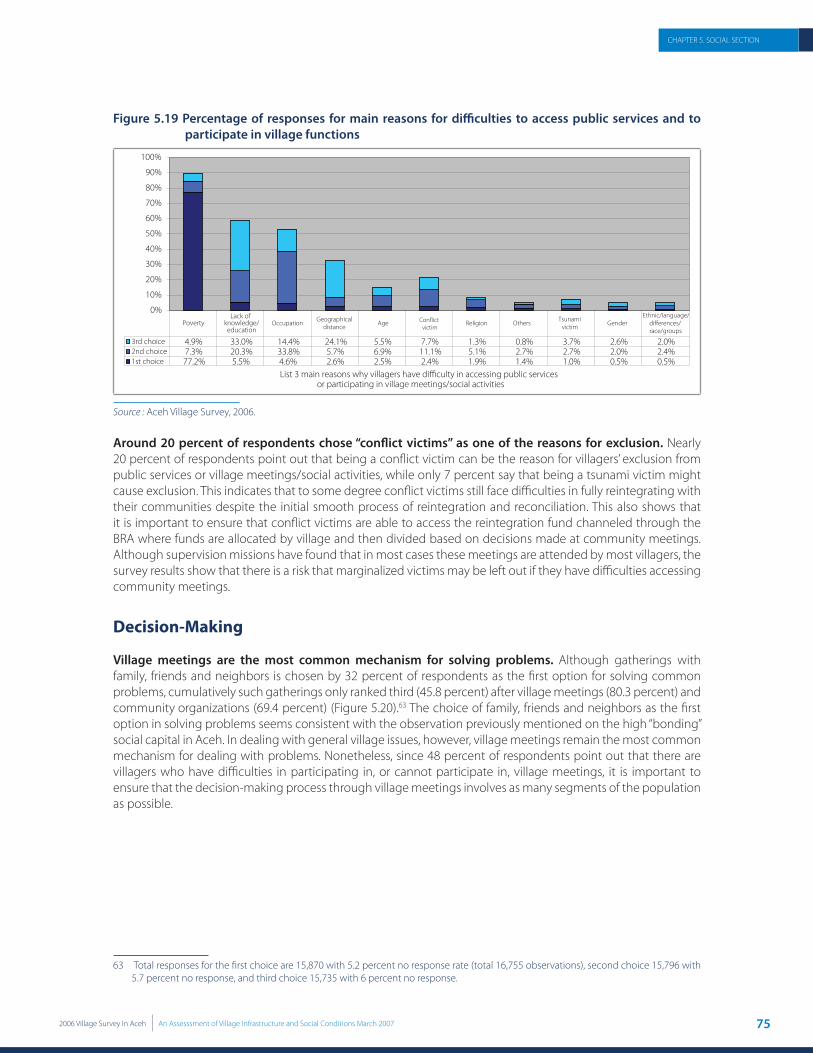
752006 Village Survey In Aceh An Assesssment of Village Infrastructure and Social Conditions March 2007
CHAPTER 5. SOCIAL SECTION
Figure 5.19 Percentage of responses for main reasons for diffi culties to access public services and to participate in village functions
0%
10%
20%
30%
40%
50%
60%
70%
80%
90%
100%
3rd choice 4.9% 33.0% 14.4% 24.1% 5.5% 7.7% 1.3% 0.8% 3.7% 2.6% 2.0%2nd choice 7.3% 20.3% 33.8% 5.7% 6.9% 11.1% 5.1% 2.7% 2.7% 2.0% 2.4%1st choice 77.2% 5.5% 4.6% 2.6% 2.5% 2.4% 1.9% 1.4% 1.0% 0.5% 0.5%
PovertyLack of
knowledge/ education
Occupation Geographicaldistance Age Religion Others Tsunami
victim GenderEthnic/language/
race/groups
or participating in village meetings/social activities
Source : Aceh Village Survey, 2006.
Around 20 percent of respondents chose “confl ict victims” as one of the reasons for exclusion. Nearly 20 percent of respondents point out that being a confl ict victim can be the reason for villagers’ exclusion from public services or village meetings/social activities, while only 7 percent say that being a tsunami victim might cause exclusion. This indicates that to some degree confl ict victims still face diffi culties in fully reintegrating with their communities despite the initial smooth process of reintegration and reconciliation. This also shows that it is important to ensure that confl ict victims are able to access the reintegration fund channeled through the BRA where funds are allocated by village and then divided based on decisions made at community meetings. Although supervision missions have found that in most cases these meetings are attended by most villagers, the survey results show that there is a risk that marginalized victims may be left out if they have diffi culties accessing community meetings.
Decision-Making
Village meetings are the most common mechanism for solving problems. Although gatherings with family, friends and neighbors is chosen by 32 percent of respondents as the fi rst option for solving common problems, cumulatively such gatherings only ranked third (45.8 percent) after village meetings (80.3 percent) and community organizations (69.4 percent) (Figure 5.20).63 The choice of family, friends and neighbors as the fi rst option in solving problems seems consistent with the observation previously mentioned on the high “bonding” social capital in Aceh. In dealing with general village issues, however, village meetings remain the most common mechanism for dealing with problems. Nonetheless, since 48 percent of respondents point out that there are villagers who have diffi culties in participating in, or cannot participate in, village meetings, it is important to ensure that the decision-making process through village meetings involves as many segments of the population as possible.
63 Total responses for the fi rst choice are 15,870 with 5.2 percent no response rate (total 16,755 observations), second choice 15,796 with 5.7 percent no response, and third choice 15,735 with 6 percent no response.

76 2006 Village Survey In Aceh An Assesssment of Village Infrastructure and Social Conditions March 2007
CHAPTER 5. SOCIAL SECTION
Figure 5.20 Main problem solving mechanisms
0%
10%
20%
30%
40%
50%
60%
70%
80%
90%
3rd choice 7.6% 10.1% 25.2% 13.1% 22.8% 11.2% 1.4% 2.1% 4.5% 0.0% 2.0%2nd choice 5.7% 30.2% 30.5% 18.5% 4.8% 6.0% 0.6% 0.9% 2.3% 0.3% 0.0%1st choice 32.5% 29.1% 24.6% 8.9% 2.0% 1.3% 0.5% 0.4% 0.4% 0.3% 0.0%
usually solved (please list 3 main actions that people generally do)?
Fam
ily, n
eigh
bors
, an
d fri
ends
gat
her
to d
iscus
s ho
w to
so
lve
the
prob
lem
Villa
ge m
eetin
g is
held
to s
olve
the
prob
lem
Sub-
dist
rict
deve
lopm
ent p
lan
mee
ting
is he
ld to
di
scus
s pro
blem
so
lvin
g
KDP
mec
hani
sm
help
in p
robl
em
solv
ing
Prob
lem
left
unso
lved
Oth
ers
Don
't kn
ow
Source : Aceh Village Survey, 2006.
More men participate in village meetings than women. Based on feedback from village heads, on average 10 village meetings are held annually. Furthermore, 52 percent of respondents claim that these meetings are usually attended by men, accompanied by only a few women (Figure 5.21).64 Since these meetings are the most common mechanism for solving general village problems as demonstrated above, it is important for the government and development practitioners to consider special mechanisms, such as special women’s meetings, to ensure that issues specifi c to women are properly addressed. Acknowledging and addressing women’s special needs are important considering that many women are victims of both the tsunami and the confl ict. This issue becomes even more critical given that the opinions expressed by the three groups of respondents in the villages are quite diff erent, suggesting possible diff erent needs of women at the village level.65
Adat institutions remain important in Aceh for decision-making. Community organization was chosen by 63 percent of respondents (cumulatively) as one of the common problem-solving mechanisms. In Aceh, community organizations are usually related to adat (i.e. traditional) institutions such as tuha lapan/tuha peut (for adat/customary laws), keujruen blang (farmers’ groups), and panglima laot (fi shermen’s groups). These institutions are traditional organizations established to deal with problems that are related to customary laws and other local customs. The importance of these institutions has been acknowledged by the provincial government
64 8,273 out of 15,829 respondents (no response rate: 5.5 percent).65 Correlation between responses of women leaders with either youth leaders or head of villages at the village level is close to 0.
Figure 5.21 Percentage of responses on participants at village meetings based on gender
52.3%
29.0%
12.3%
4.5%2.0%
0%
10%
20%
30%
40%
50%
60%
Mostly men,and a fewwomen
Women andmen, in almostequal numbers
Onlymen
Mostly women,and a few men
Onlywomen
In general, who usually came/participate in the village meetings?
Source : Aceh Village Survey, 2006.
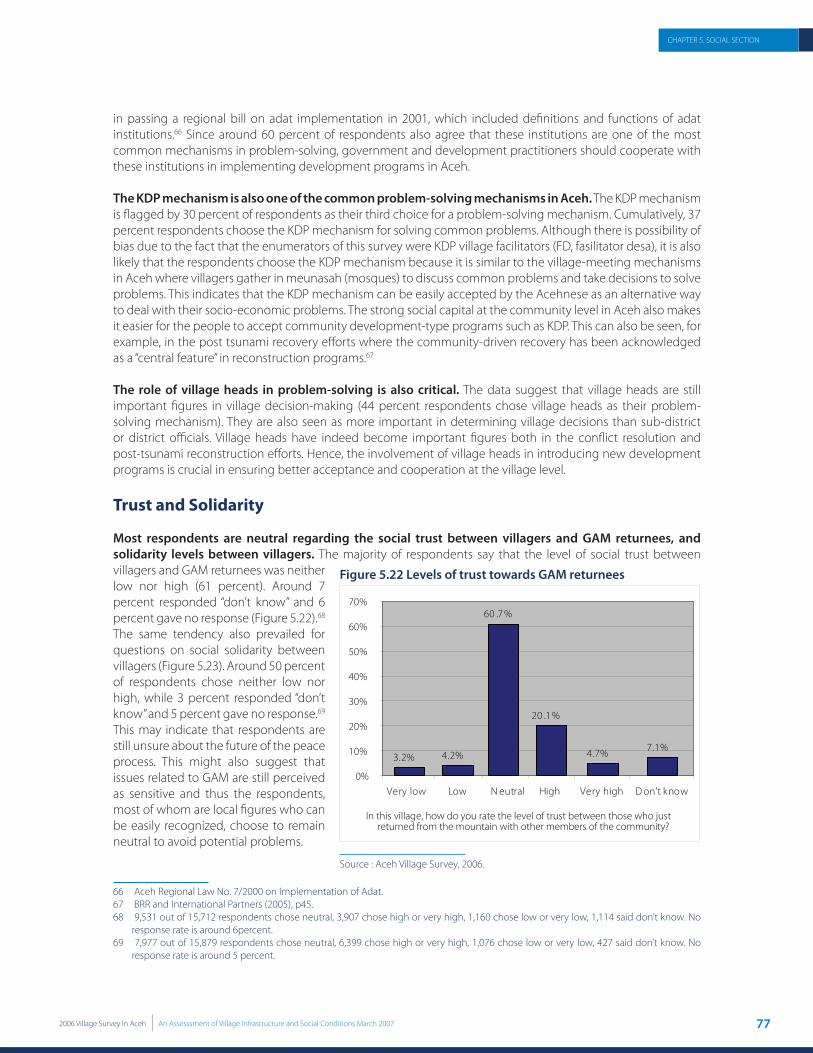
772006 Village Survey In Aceh An Assesssment of Village Infrastructure and Social Conditions March 2007
CHAPTER 5. SOCIAL SECTION
in passing a regional bill on adat implementation in 2001, which included defi nitions and functions of adat institutions.66 Since around 60 percent of respondents also agree that these institutions are one of the most common mechanisms in problem-solving, government and development practitioners should cooperate with these institutions in implementing development programs in Aceh.
The KDP mechanism is also one of the common problem-solving mechanisms in Aceh. The KDP mechanism is fl agged by 30 percent of respondents as their third choice for a problem-solving mechanism. Cumulatively, 37 percent respondents choose the KDP mechanism for solving common problems. Although there is possibility of bias due to the fact that the enumerators of this survey were KDP village facilitators (FD, fasilitator desa), it is also likely that the respondents choose the KDP mechanism because it is similar to the village-meeting mechanisms in Aceh where villagers gather in meunasah (mosques) to discuss common problems and take decisions to solve problems. This indicates that the KDP mechanism can be easily accepted by the Acehnese as an alternative way to deal with their socio-economic problems. The strong social capital at the community level in Aceh also makes it easier for the people to accept community development-type programs such as KDP. This can also be seen, for example, in the post tsunami recovery eff orts where the community-driven recovery has been acknowledged as a “central feature” in reconstruction programs.67
The role of village heads in problem-solving is also critical. The data suggest that village heads are still important fi gures in village decision-making (44 percent respondents chose village heads as their problem-solving mechanism). They are also seen as more important in determining village decisions than sub-district or district offi cials. Village heads have indeed become important fi gures both in the confl ict resolution and post-tsunami reconstruction eff orts. Hence, the involvement of village heads in introducing new development programs is crucial in ensuring better acceptance and cooperation at the village level.
Trust and Solidarity
Most respondents are neutral regarding the social trust between villagers and GAM returnees, and solidarity levels between villagers. The majority of respondents say that the level of social trust between villagers and GAM returnees was neither low nor high (61 percent). Around 7 percent responded “don’t know” and 6 percent gave no response (Figure 5.22).68 The same tendency also prevailed for questions on social solidarity between villagers (Figure 5.23). Around 50 percent of respondents chose neither low nor high, while 3 percent responded “don’t know” and 5 percent gave no response.69 This may indicate that respondents are still unsure about the future of the peace process. This might also suggest that issues related to GAM are still perceived as sensitive and thus the respondents, most of whom are local fi gures who can be easily recognized, choose to remain neutral to avoid potential problems.
66 Aceh Regional Law No. 7/2000 on Implementation of Adat. 67 BRR and International Partners (2005), p45.68 9,531 out of 15,712 respondents chose neutral, 3,907 chose high or very high, 1,160 chose low or very low, 1,114 said don’t know. No
response rate is around 6percent.69 7,977 out of 15,879 respondents chose neutral, 6,399 chose high or very high, 1,076 chose low or very low, 427 said don’t know. No
response rate is around 5 percent.
Figure 5.22 Levels of trust towards GAM returnees
3.2% 4.2%
60 .7 %
20 .1 %
4.7% 7.1%
0%
10%
20%
30%
40%
50%
60%
70%
Very low Low N eutral High Very high D on't know
In this village, how do you rate the level of trust between those who just returned from the mountain with other members of the community?
Source : Aceh Village Survey, 2006.

78 2006 Village Survey In Aceh An Assesssment of Village Infrastructure and Social Conditions March 2007
CHAPTER 5. SOCIAL SECTION
Figure 5.23 Solidarity levels between villagers
2.3%4.5%
50.2%
27.8%
12.5%
2.7%
0%
10%
20%
30%
40%
50%
60%
Very low Low Neutral High Very high Don't Know
In general, how do you rate the level of social solidarity in this village?
Source : Aceh Village Survey, 2006.
Respondents gave more positive responses on trust and solidarity than negative ones. The data also show that more respondents said that the levels of trust and solidarity were either high or very high (25 percent for level of trust and 40 percent for solidarity) compared with low or very low (7 percent for both trust and solidarity). Although there is a possibility of bias due to tendency to give positive responses to avoid tension, this might indicate that the level of trust between villagers and ex-GAM combatants and the solidarity between villagers are actually improving. This observation is consistent with the responses on solidarity levels following the Helsinki MoU where the majority of respondents (61 percent) say that the solidarity level is either better or much better (Figure 5.24).70
In general, feelings of trust among villagers are still relatively strong. When asked to give an opinion on diff erent statements of trust, most respondents agree that their fellow villagers can be trusted, usually help each other and are willing to help others (Figure 5.25). The percentages are higher for statements that the villagers usually help each other and are willing to help others (58 percent and 76 percent, respectively). In fact, this strong sense of community and solidarity has been one of the main drivers helping the recovery process in post-tsunami Aceh. Although suff ering a huge loss of social capital in the tsunami, communities in Aceh were quick to reorganize and to become the leaders for their own recovery.71 Nonetheless, it is very important for both GAM and the government to show strong commitment towards the peace process in order to reassure the Acehnese that the peace process will be carried through to a successful conclusion.
70 9,679 out of 15,792 respondents chose better or much better; 4,584 chose the same, 1,529 chose lower or much lower. The no-response rate is around 6 percent.
71 BRR and International Partners (2005), pp45-47.
Figure 5.24 Solidarity levels post Helsinki MoU
3.4%6.3%
29.0%
13.7%
47.6%
0%
5%
10%
15%
20%
25%
30%
35%
40%
45%
50%
Much lower Lower Same Better Much better
In your opinion, compare to before the signing of the Helsinki MoU,how is the current level of social solidarity in this village?
Source : Aceh Village Survey, 2006.
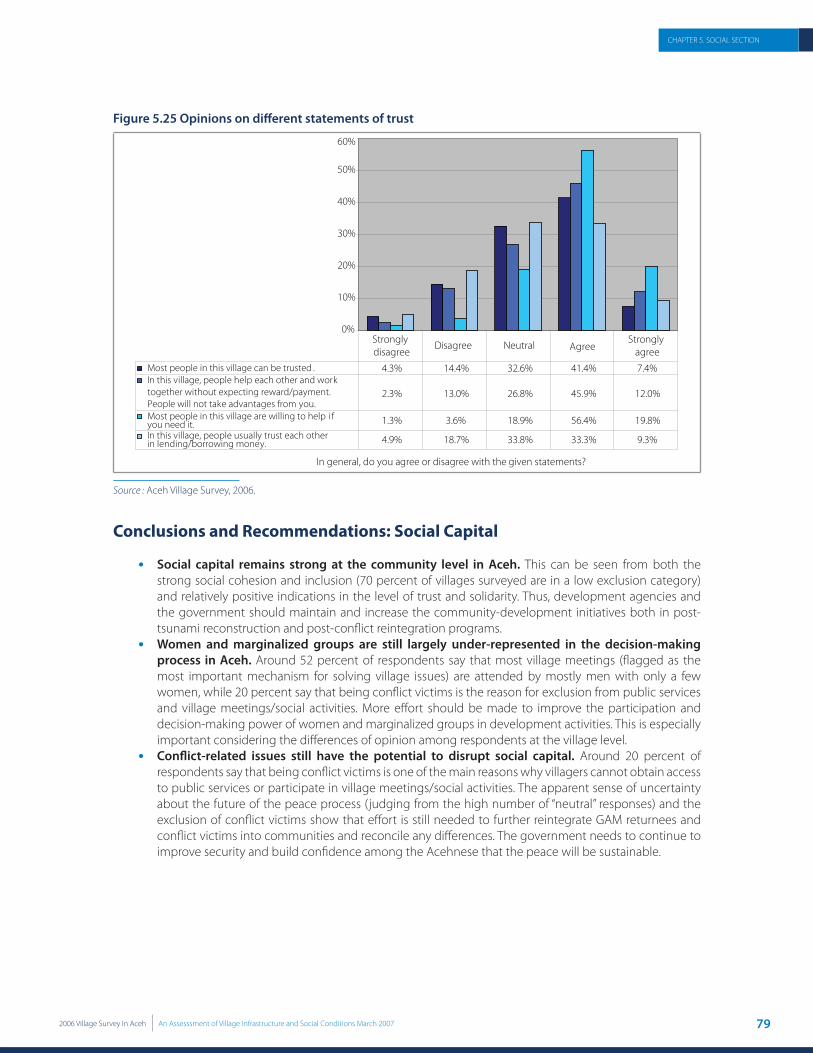
792006 Village Survey In Aceh An Assesssment of Village Infrastructure and Social Conditions March 2007
CHAPTER 5. SOCIAL SECTION
Figure 5.25 Opinions on diff erent statements of trust
0%
10%
20%
30%
40%
50%
60%
Most people in this village can be trusted . 4.3% 14.4% 32.6% 41.4% 7.4%In this village, people help each other and worktogether without expecting reward/payment.People will not take advantages from you.
2.3% 13.0% 26.8% 45.9% 12.0%
Most people in this village are willing to help i fyou need it. 1.3% 3.6% 18.9% 56.4% 19.8%In this village, people usually trust each otherin lending/borrowing money. 4.9% 18.7% 33.8% 33.3% 9.3%
Stronglydisagree
Disagree Neutral AgreeStrongly
agree
In general, do you agree or disagree with the given statements?
Source : Aceh Village Survey, 2006.
Conclusions and Recommendations: Social Capital
Social capital remains strong at the community level in Aceh. This can be seen from both the strong social cohesion and inclusion (70 percent of villages surveyed are in a low exclusion category) and relatively positive indications in the level of trust and solidarity. Thus, development agencies and the government should maintain and increase the community-development initiatives both in post-tsunami reconstruction and post-confl ict reintegration programs. Women and marginalized groups are still largely under-represented in the decision-making process in Aceh. Around 52 percent of respondents say that most village meetings (fl agged as the most important mechanism for solving village issues) are attended by mostly men with only a few women, while 20 percent say that being confl ict victims is the reason for exclusion from public services and village meetings/social activities. More eff ort should be made to improve the participation and decision-making power of women and marginalized groups in development activities. This is especially important considering the diff erences of opinion among respondents at the village level.Confl ict-related issues still have the potential to disrupt social capital. Around 20 percent of respondents say that being confl ict victims is one of the main reasons why villagers cannot obtain access to public services or participate in village meetings/social activities. The apparent sense of uncertainty about the future of the peace process (judging from the high number of “neutral” responses) and the exclusion of confl ict victims show that eff ort is still needed to further reintegrate GAM returnees and confl ict victims into communities and reconcile any diff erences. The government needs to continue to improve security and build confi dence among the Acehnese that the peace will be sustainable.
•
•
•
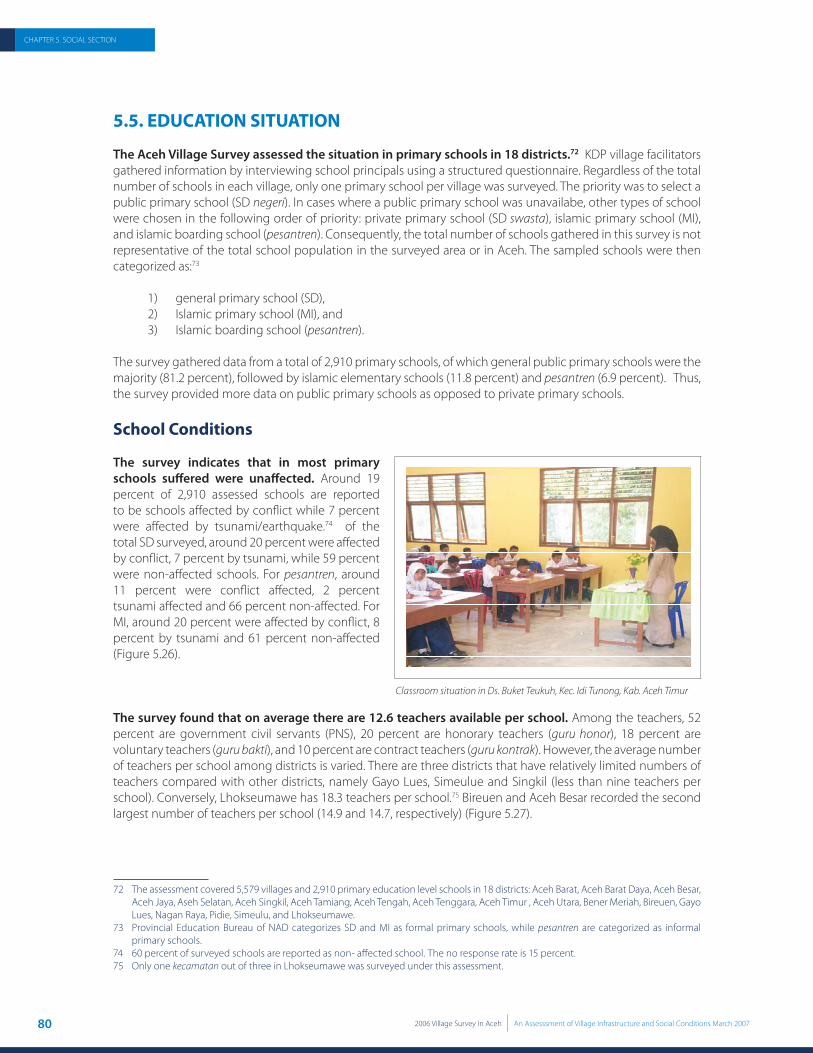
80 2006 Village Survey In Aceh An Assesssment of Village Infrastructure and Social Conditions March 2007
CHAPTER 5. SOCIAL SECTION
5.5. EDUCATION SITUATION
The Aceh Village Survey assessed the situation in primary schools in 18 districts.72 KDP village facilitators gathered information by interviewing school principals using a structured questionnaire. Regardless of the total number of schools in each village, only one primary school per village was surveyed. The priority was to select a public primary school (SD negeri). In cases where a public primary school was unavailabe, other types of school were chosen in the following order of priority: private primary school (SD swasta), islamic primary school (MI), and islamic boarding school (pesantren). Consequently, the total number of schools gathered in this survey is not representative of the total school population in the surveyed area or in Aceh. The sampled schools were then categorized as:73
1) general primary school (SD), 2) Islamic primary school (MI), and 3) Islamic boarding school (pesantren).
The survey gathered data from a total of 2,910 primary schools, of which general public primary schools were the majority (81.2 percent), followed by islamic elementary schools (11.8 percent) and pesantren (6.9 percent). Thus, the survey provided more data on public primary schools as opposed to private primary schools.
School Conditions
The survey indicates that in most primary schools suff ered were unaff ected. Around 19 percent of 2,910 assessed schools are reported to be schools aff ected by confl ict while 7 percent were aff ected by tsunami/earthquake.74 of the total SD surveyed, around 20 percent were aff ected by confl ict, 7 percent by tsunami, while 59 percent were non-aff ected schools. For pesantren, around 11 percent were confl ict aff ected, 2 percent tsunami aff ected and 66 percent non-aff ected. For MI, around 20 percent were aff ected by confl ict, 8 percent by tsunami and 61 percent non-aff ected (Figure 5.26).
The survey found that on average there are 12.6 teachers available per school. Among the teachers, 52 percent are government civil servants (PNS), 20 percent are honorary teachers (guru honor), 18 percent are voluntary teachers (guru bakti), and 10 percent are contract teachers (guru kontrak). However, the average number of teachers per school among districts is varied. There are three districts that have relatively limited numbers of teachers compared with other districts, namely Gayo Lues, Simeulue and Singkil (less than nine teachers per school). Conversely, Lhokseumawe has 18.3 teachers per school.75 Bireuen and Aceh Besar recorded the second largest number of teachers per school (14.9 and 14.7, respectively) (Figure 5.27).
72 The assessment covered 5,579 villages and 2,910 primary education level schools in 18 districts: Aceh Barat, Aceh Barat Daya, Aceh Besar, Aceh Jaya, Aseh Selatan, Aceh Singkil, Aceh Tamiang, Aceh Tengah, Aceh Tenggara, Aceh Timur , Aceh Utara, Bener Meriah, Bireuen, Gayo Lues, Nagan Raya, Pidie, Simeulu, and Lhokseumawe.
73 Provincial Education Bureau of NAD categorizes SD and MI as formal primary schools, while pesantren are categorized as informal primary schools.
74 60 percent of surveyed schools are reported as non- aff ected school. The no response rate is 15 percent.75 Only one kecamatan out of three in Lhokseumawe was surveyed under this assessment.
Classroom situation in Ds. Buket Teukuh, Kec. Idi Tunong, Kab. Aceh Timur

812006 Village Survey In Aceh An Assesssment of Village Infrastructure and Social Conditions March 2007
CHAPTER 5. SOCIAL SECTION
Figure 5.26 School category
0%
10%
20%
30%
40%
50%
60%
70%
80%
90%
100%
Non A cted 61.1% 66.0% 58.9%
Tsunami A cted 7.6% 2.0% 7.2%
Co t A cted 19.6% 10.5% 19.5%
MI Pesantren SD
Source : Aceh Village Survey, 2006.
Figure 5.27 Average number of teacher per school and student-teacher ratio
0.0
5.0
10.0
15.0
20.0
25.0
R a
t i o
Average Teacherper School 8.9 18.3 11.7 11.6 12.3 13.6 11.9 12.5 8.7 16.6 12.8 8.9 13.5 14.9 7.8 14.7 9.7 12.8Student TeacherRatio
21.4 17.8 16.9 16.9 16.7 16.6 15.7 14.7 14.6 14.3 13.8 13.5 13.1 13.0 12.5 12.4 11.5 11.3
Aceh
Sin
gkil
Lhok
seum
awe
Aceh
Tim
ur
Aceh
Tam
iang
Nag
an R
aya
Aceh
Uta
ra
Bene
r Mer
iah
Aceh
Bar
at D
aya
Gay
o Lu
es
Aceh
Ten
ggar
a
Aceh
Sel
atan
Sim
eulu
e
Pidi
e
Bire
uen
Aceh
Bar
at
Aceh
Bes
ar
Aceh
Jaya
Aceh
Ten
gah
Source : Aceh Village Survey, 2006. Note: For Lhokseumawe, only one out of three kecamatan is included in the survey.
Within the schools surveyed, student density per class is low. The survey found a total of 482,704 students or, on average, 166 students per school. Using an estimate from the Ministry of Education that there are six classes per school in Aceh, the total students per class would be 27.6.76 The highest student density per school is in Lhokseumawe, which on average has 293 students per school or 49 students per class. Aceh Utara and Aceh Tamiang have the second and the third highest student density per class (Table 5.18).
76 An Aceh Education Data Pack (UNIMS, 2005) published by Education Management Information System EMIS/ School Mapping), Ministry of National Education (MoNE), Republic of Indonesia, in cooperation with UNICEF shows that number of classes in primary schools varies between 1 and 8 classes per school. However, an interview with the staff of the Provincial Education Bureau found that in general, most schools have six classes and one shift per day.
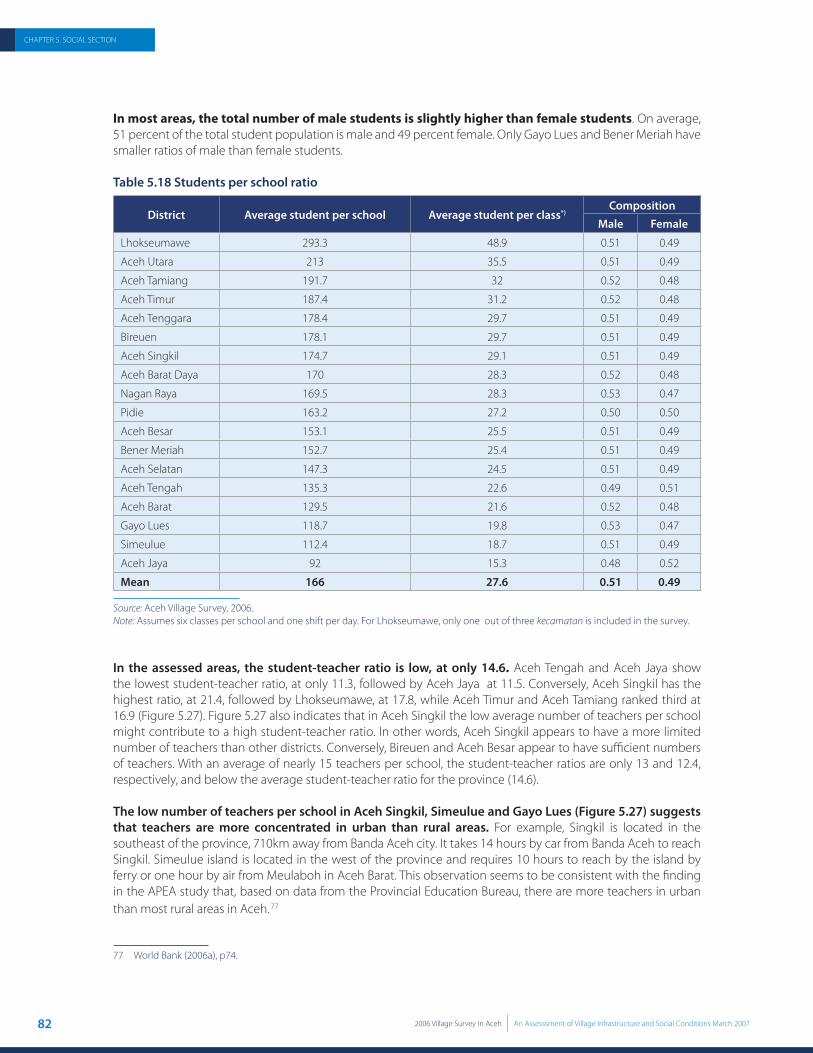
82 2006 Village Survey In Aceh An Assesssment of Village Infrastructure and Social Conditions March 2007
CHAPTER 5. SOCIAL SECTION
In most areas, the total number of male students is slightly higher than female students. On average, 51 percent of the total student population is male and 49 percent female. Only Gayo Lues and Bener Meriah have smaller ratios of male than female students.
Table 5.18 Students per school ratio
District Average student per school Average student per class*)Composition
Male Female
Lhokseumawe 293.3 48.9 0.51 0.49
Aceh Utara 213 35.5 0.51 0.49
Aceh Tamiang 191.7 32 0.52 0.48
Aceh Timur 187.4 31.2 0.52 0.48
Aceh Tenggara 178.4 29.7 0.51 0.49
Bireuen 178.1 29.7 0.51 0.49
Aceh Singkil 174.7 29.1 0.51 0.49
Aceh Barat Daya 170 28.3 0.52 0.48
Nagan Raya 169.5 28.3 0.53 0.47
Pidie 163.2 27.2 0.50 0.50
Aceh Besar 153.1 25.5 0.51 0.49
Bener Meriah 152.7 25.4 0.51 0.49
Aceh Selatan 147.3 24.5 0.51 0.49
Aceh Tengah 135.3 22.6 0.49 0.51
Aceh Barat 129.5 21.6 0.52 0.48
Gayo Lues 118.7 19.8 0.53 0.47
Simeulue 112.4 18.7 0.51 0.49
Aceh Jaya 92 15.3 0.48 0.52
Mean 166 27.6 0.51 0.49
Source: Aceh Village Survey, 2006. Note: Assumes six classes per school and one shift per day. For Lhokseumawe, only one out of three kecamatan is included in the survey.
In the assessed areas, the student-teacher ratio is low, at only 14.6. Aceh Tengah and Aceh Jaya show the lowest student-teacher ratio, at only 11.3, followed by Aceh Jaya at 11.5. Conversely, Aceh Singkil has the highest ratio, at 21.4, followed by Lhokseumawe, at 17.8, while Aceh Timur and Aceh Tamiang ranked third at 16.9 (Figure 5.27). Figure 5.27 also indicates that in Aceh Singkil the low average number of teachers per school might contribute to a high student-teacher ratio. In other words, Aceh Singkil appears to have a more limited number of teachers than other districts. Conversely, Bireuen and Aceh Besar appear to have suffi cient numbers of teachers. With an average of nearly 15 teachers per school, the student-teacher ratios are only 13 and 12.4, respectively, and below the average student-teacher ratio for the province (14.6).
The low number of teachers per school in Aceh Singkil, Simeulue and Gayo Lues (Figure 5.27) suggests that teachers are more concentrated in urban than rural areas. For example, Singkil is located in the southeast of the province, 710km away from Banda Aceh city. It takes 14 hours by car from Banda Aceh to reach Singkil. Simeulue island is located in the west of the province and requires 10 hours to reach by the island by ferry or one hour by air from Meulaboh in Aceh Barat. This observation seems to be consistent with the fi nding in the APEA study that, based on data from the Provincial Education Bureau, there are more teachers in urban than most rural areas in Aceh. 77
77 World Bank (2006a), p74.

832006 Village Survey In Aceh An Assesssment of Village Infrastructure and Social Conditions March 2007
CHAPTER 5. SOCIAL SECTION
The number of male students dropping out is slightly higher than female students. On average, 53 percent of drop-outs were male and only 47 percent female (Figure 5.28). Pidie, which has the highest number of drop-outs, has the same proportion of male and female drop-outs. For Aceh Utara, Aceh Timur, Aceh Besar, Aceh Tamiang, and Aceh Barat, the average number of male drop-outs is slightly higher than female drop-outs.78
Figure 5.28 Composition of drop-out students by gender
0
10,000
20,000
30,000
40,000
50,000
60,000
70,000
80,000
Num
ber o
f Stu
dent
s
Female Student 34,263 33,403 21,475 20,852 15,389 15,092 13,093 11,731 11,279 9,948 9,877 8,757 8,115 6,848 5,549 3,053 3,208 3,004
Male Student 35,729 35,183 22,760 22,256 16,863 15,995 13,747 12,373 11,515 10,751 10,422 9,771 7,765 7,391 5,807 3,400 3,230 2,810
Aceh
Sel
atan
Aceh
Sin
gkil
Bire
uen
Aceh
Tim
ur
Aceh
Bar
at
Aceh
Bes
ar
Lhok
seum
awe
Bene
r Mer
iah
Aceh
Uta
ra
Aceh
Bar
at D
aya
Sim
eulu
e
Nag
an R
aya
Aceh
Ten
gah
Aceh
Tam
iang
Aceh
Ten
ggar
a
Gay
o Lu
es
Pidi
e
Aceh
Jaya
Number of drop-out students during academic year 2004-2005
Source: Aceh Village Survey, 2006. Note: For Lhokseumawe, only one out of three kecamatan is included in the survey.
Primary School Needs
According to primary school principals, the top education needs for their schools are more experienced and qualifi ed teachers, more textbooks, and better classrooms and school furniture (Figure 5.29). There is no major diff erence in the needs between high, medium and low intensity confl ict areas. There is also no signifi cant diff erence in the education needs among the schools in low, medium and high tsunami-impacted areas. In fact, data indicate that education needs of primary schools are very similar across both confl ict and tsunami-aff ected areas.
Over 35 percent of primary school principal respondents state that “more experienced and qualifi ed teachers” is the fi rst priority need for improving services. To some extent, this indicates that the quality of teachers is low in village primary schools. The APEA study also found that the quality of teachers in primary schools in rural areas is relatively low. The study states that this problem is due to several reasons. First, teachers’ qualifi cations in Aceh (while not a perfect measure of quality) are low relative to the national average. The study shows that average qualifi cations are lowest for primary schools compared with higher level schools. Second, based on the Governance and Decentralization Survey 2 (GDS2) also conducted in 2006, 30 percent of teachers were absent during school time. Third, a persistent problem in recent years is that teachers prefer to teach in schools in urban areas. This implies that qualifi ed teachers are more inclined to seek jobs in urban areas, leaving rural primary schools with lower qualifi ed teachers.
78 Student drop-out numbers for academic year 2004/2005. The calculation of the drop-out rate is not possible because the survey did not contain data on the student population in academic year 2004/2005.
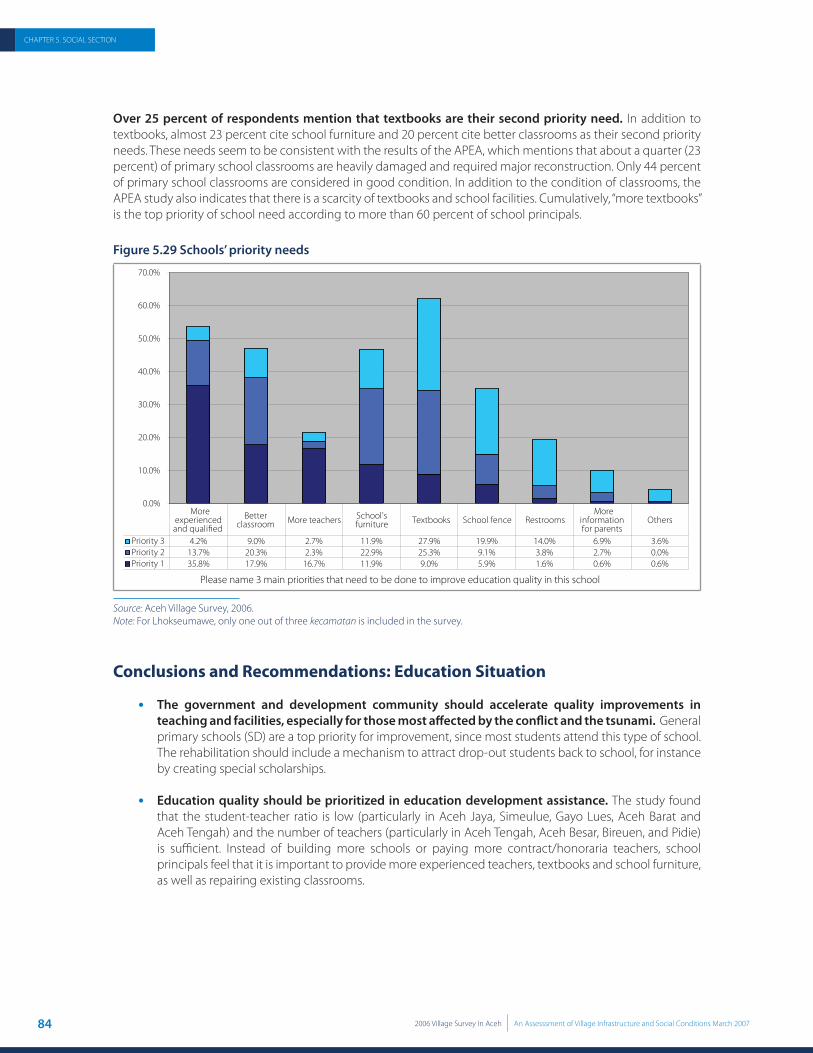
84 2006 Village Survey In Aceh An Assesssment of Village Infrastructure and Social Conditions March 2007
CHAPTER 5. SOCIAL SECTION
Over 25 percent of respondents mention that textbooks are their second priority need. In addition to textbooks, almost 23 percent cite school furniture and 20 percent cite better classrooms as their second priority needs. These needs seem to be consistent with the results of the APEA, which mentions that about a quarter (23 percent) of primary school classrooms are heavily damaged and required major reconstruction. Only 44 percent of primary school classrooms are considered in good condition. In addition to the condition of classrooms, the APEA study also indicates that there is a scarcity of textbooks and school facilities. Cumulatively, “more textbooks” is the top priority of school need according to more than 60 percent of school principals.
Figure 5.29 Schools’ priority needs
0.0%
10.0%
20.0%
30.0%
40.0%
50.0%
60.0%
70.0%
Priority 3 4.2% 9.0% 2.7% 11.9% 27.9% 19.9% 14.0% 6.9% 3.6%Priority 2 13.7% 20.3% 2.3% 22.9% 25.3% 9.1% 3.8% 2.7% 0.0%Priority 1 35.8% 17.9% 16.7% 11.9% 9.0% 5.9% 1.6% 0.6% 0.6%
More experienced Better
classroom More teachers School's furniture Textbooks School fence Restrooms
More information for parents
Others
Please name 3 main priorities that need to be done to improve education quality in this school
Source: Aceh Village Survey, 2006. Note: For Lhokseumawe, only one out of three kecamatan is included in the survey.
Conclusions and Recommendations: Education Situation
The government and development community should accelerate quality improvements in teaching and facilities, especially for those most aff ected by the confl ict and the tsunami. General primary schools (SD) are a top priority for improvement, since most students attend this type of school. The rehabilitation should include a mechanism to attract drop-out students back to school, for instance by creating special scholarships.
Education quality should be prioritized in education development assistance. The study found that the student-teacher ratio is low (particularly in Aceh Jaya, Simeulue, Gayo Lues, Aceh Barat and Aceh Tengah) and the number of teachers (particularly in Aceh Tengah, Aceh Besar, Bireuen, and Pidie) is suffi cient. Instead of building more schools or paying more contract/honoraria teachers, school principals feel that it is important to provide more experienced teachers, textbooks and school furniture, as well as repairing existing classrooms.
•
•

06CHAPTER 6:
Conclusions and Recommendations

86 2006 Village Survey In Aceh An Assesssment of Village Infrastructure and Social Conditions March 2007
CHAPTER 6. CONCLUSIONS and RECOMMENDATIONS
This study assesses the physical infrastructure and social conditions in Aceh in the latter half of 2006 as the province recovers from nearly 30 years of confl ict and the catastrophic tsunami. Based on surveys distributed through the government’s Kecamatan Development Program to nearly all rural villages in Aceh, the report includes questions on the current condition of the province’s infrastructure, IDPs, village information and development needs and priorities, social capital, and expenditures.
This concluding section discusses the priorities suggested by these fi ndings and ways in which development programs and mechanisms can best address identifi ed needs. The recommendations are grouped into three main categories, as follows: 1. Major investments are still required before the physical and social recovery in Aceh can be said to be
complete. 2. Special attention needs to be paid to ensuring that these recovery eff orts address the needs of victims of
the confl ict and are not focused exclusively on recovery from the tsunami or other natural disasters. 3. The fi ndings here emphasize the need for local input into the recovery and development process,
underscoring the value of community-driven development processes.
Major Investment is Still Required
A major theme that emerges in this report is that, notwithstanding the progress that has been made in helping Aceh recover from the tsunami and confl ict, enormous challenges remain that require major additional investment.
Many of the fi ndings in this report point to the extensive damage Aceh has experienced and the major work that remains to be done before the recovery can be called complete. Either the tsunami or the confl ict, or in some cases both, damaged more than 50 percent of all major infrastructure types in the province, together with more than 25 percent of responding schools. Very few locations escaped completely unscathed. Over and above the estimated 130,000 people killed by the tsunami and 15,000 killed by the confl ict, more than 170,000 households were displaced by one or the other. The damage to the social infrastructure of the province was enormous and no one could reasonably expect recovery to be rapid or straightforward.
Many problems still exist. The number of poor households in the areas covered by the report remains high, with nearly 24 percent of the population reported to be poor enough to receive donations from local mosques and 26 percent identifi ed by village heads as “poor households”. The infrastructure repair process is also far from complete. Only about 11 percent of damaged infrastructure has already been repaired or is under repair, with the low rate of repair applying both to infrastructure that is typically the responsibility of village or government organizations, and to private-sector repairs, such as markets, shops, warehouses, and rice mills. The number of student drop-outs is high in both confl ict- and tsunami-aff ected areas and there is a high level of demand for improvements in the quality of teachers. Social inclusion remains incomplete, together with limited female participation in public decision-making.
The data in this report suggest that the total cost of repairing infrastructure damaged by the confl ict or tsunami is Rp 12 trillion, or US$1.3 billion. Furthermore, this accounts for only about 60 percent of the total damaged infrastructure in the province; the other 40 percent of reported damage was identifi ed as being the result of lack of maintenance. Regardless of whether maintenance was left undone simply because of neglect or because of the exigencies of the confl ict or tsunami, these numbers suggest that the total infrastructure repair costs could be as high as Rp 20 trillion or US$2.2 billion.
Recovery on this scale will only progress if all interested parties participate in the eff ort. The international community must continue to play a positive role by providing the kind of fi nancial, logistical, and technical assistance needed to speed the recovery. The central government and local governments in Aceh must build on the progress that has been made in repairing infrastructure and in negotiating the minefi eld of post-confl ict

872006 Village Survey In Aceh An Assesssment of Village Infrastructure and Social Conditions March 2007
CHAPTER 6. CONCLUSIONS and RECOMMENDATIONS
politics. But, most important, the people of Aceh must continue to support the physical, economic, and socio-political recovery by actively committing themselves to the process.
While a return to confl ict appears remote, the lingering eff ects of the past confl ict and the potential for future confl ict remain real
In many respects, social conditions in Aceh are surprisingly good. Social capital is generally strong, especially among groups, such as families, close friends, neighbors and colleagues. The measures of exclusion reported in the survey are low and appear mainly to be related to economic factors such as poverty. Furthermore, the level of trust and solidarity among villagers is strong and solidarity levels appear to have improved since the signing of the Helsinki MoU.
However, it is important that these positive trends are not allowed to obscure the residue of the confl ict, which still holds the potential to disrupt the peace process and recovery eff ort. For example, a large proportion of local leaders feel that they have insuffi cient information about post-confl ict issues or about reintegration funds, while fi eldwork has found increasing tensions on the ground related to lack of understanding of reintegration programs. As many as 20 percent of respondents indicated that being a confl ict victim is a reason why people are unable to access public services or to participate in village meetings and social activities. Respondents to questions on social trust and social solidarity towards GAM returnees seemed reluctant to give an opinion compared with their more positive responses to similar questions about villagers who are not linked with GAM or the Helsinki MoU.
As indicated by the fi nding that the top information priority is for information relating to the Helsinki MoU, communities realize that successful implementation of the political agreement will be absolutely crucial in shaping their lives and prosperity in the next few years. Obviously, existing eff orts to support the post-confl ict peace-building process should continue. However, such eff orts should also include more emphasis on socialization with regard to developments in the peace process; equipping local leaders with accurate and up-to-date information on reintegration programs; and ongoing eff orts to improve security.
The recovery eff ort in Aceh should build on the province’s strengths and the considerable progress that has already been made in the recovery eff ort.
The need for continued investment is not surprising, and should build on the tremendous progres that have already been made by the people of Aceh, the national and sub-national governments, and the international community. The report shows that conditions in some areas have improved considerably. A majority of both confl ict-induced and tsunami-induced IDPs have already returned to their villages of origin, and many are now living in their own homes. Most measures of social capital indicate that conditions are good. Exclusion from public services is rare, respondents report reasonably high levels of trust in their communities, and a variety of mechanisms are used for resolving local issues.
Continuing recovery eff orts should build on these strengths. The indicators of good social capital and inclusion suggest that participatory processes hold most promise for creating development plans that respond most closely to local needs. Development agencies and the government should therefore maintain and increase the community-driven development initiatives both in post-tsunami reconstruction and post-confl ict reintegration programs. Local leaders remain an important source of information for many people in Aceh. Given the added advantage of information that is communicated face to face, greater eff orts should be made to provide information to these local leaders regarding tsunami reintegration programming and programming relating to the MoU, building their capacity to share this information with the communities they represent. In primary schools, student-teacher ratios appear to be adequate. However, education investment should now focus on addressing the top priorities identifi ed here: improving the overall quality and experience level of teachers; supplying more textbooks; and improving classrooms and facilities.

88 2006 Village Survey In Aceh An Assesssment of Village Infrastructure and Social Conditions March 2007
CHAPTER 6. CONCLUSIONS and RECOMMENDATIONS
Recovery in Aceh is a Province-Wide Process
Relief and recovery eff orts for tsunami-aff ected populations should not crowd out the need for assistance in other parts of the province.
Tsunami-aff ected areas and populations are leading the way in the recovery and rehabilitation process. The report suggests, for example, that natural disaster-damaged infrastructure on average was being repaired about 50 percent faster than confl ict-damaged infrastructure. Similarly, confl ict IDPs who have returned are less likely to be living in their own homes than are tsunami IDPs, suggesting that the extent to which the physical reconstruction eff ort among confl ict-aff ected households lags behind the eff ort among tsunami-aff ected households is not simply limited to public works.
The infrastructure and social damage that Aceh has suff ered goes well beyond tsunami-aff ected areas, and the recovery eff ort needs to be a province-wide process. Nearly every district in Aceh reports an average of more than 22 percent of families classifi ed as poor, regardless of whether that district was aff ected directly by the tsunami. The report also shows that in many ways confl ict-aff ected areas have experienced more extensive damage than the tsunami-aff ected areas. More families were displaced from their villages by confl ict than by the tsunami (103,456 compared with 69,389, respectively), and confl ict IDPs have returned at a lower rate than tsunami IDPs (64.6 percent compared with 82.1 percent, respectively). While the latter statistic is not surprising, given the more pressing need for community reconciliation in confl ict- than in tsunami-aff ected areas, the data also suggest that this disparity has not gone unnoticed at the local level. Respondents in areas that were more heavily aff ected by the tsunami are more likely to believe tsunami IDPs are better off than others in the community and better off than they were before the tsunami. When asked a similar question about the condition of confl ict IDPs today relative to the condition of others in the community, the fi ndings are signifi cantly diff erent. Confl ict IDPs are perceived to be worse off relative to others in the community than are tsunami IDPs, an opinion that is shared across areas that were both heavily and lightly aff ected by the confl ict. Finally, the emphasis that respondents place on the need for better information about the Helsinki MoU and on post-confl ict programming, especially relative to the lower priority they place on information on tsunami programming, suggests that more attention needs to be paid to the former. Most Acehnese seem to see the success of the MoU as the most fundamental factor in their future prosperity and security.
Given the lingering eff ects of the confl ict and the potential for future problems, renewed emphasis should be placed on the recovery eff ort in confl ict-aff ected areas. This emphasis includes: improved eff orts to communicate information related to the MoU and post-confl ict programming; continued eff orts to provide confl ict IDPs with the support they need to return to their villages of origin, or resettle permanently in other locations; and a focus on infrastructure repair eff orts in confl ict-aff ected areas.
Community-Driven Processes are Most Eff ective in Targeting Investment
While the patterns that emerge at the provincial and district levels can help to guide overall policy direction, the diff erences that exist at the village level make community-driven development processes the most eff ective means for addressing village needs.
In order to capture the needs of diff erent groups that exist at the local level, it is important to give communities the opportunity to be more involved in development activities and planning processes. Although there are very little diff erences of opinion among respondents at the province and district levels, the diff erences are signifi cant at the local level, indicating the need for mechanisms to capture diff erent communities’ needs in the development process. The village head’s opinion does not necessarily agree with that of the youth leader or women’s leader in the same village. Since the survey shows that almost 50 percent of villagers have diffi culties attending village meetings – which are the main problem-solving mechanism in villages – it becomes very important to increase community participation in village decision-making processes to ensure that these

892006 Village Survey In Aceh An Assesssment of Village Infrastructure and Social Conditions March 2007
CHAPTER 6. CONCLUSIONS and RECOMMENDATIONS
diff erences of opinion are addressed. Moreover, the survey results also shows that women and other marginalized groups such as confl ict victims are more likely to be excluded from village meetings. Since these groups might have specifi c needs that diff er from others in the community, it is important to have mechanisms that allow their voices to be heard. Finally, the desire of the community to obtain more information on village development programs and village budget use seems to refl ect their interest to be more involved in development activities and decision-making process that have a direct impact on their personal lives.
Special attention must be paid to ensuring that all members of the community have the opportunity to participate in and contribute to local development processes
Women are still largely under-represented in the decision-making process in Aceh. More than half of respondents said that most village meetings—fl agged as the most popular mechanism for solving village issues—were attended by mostly men with only a few women. This is troubling in its own right. However, it is a special concern in view of the fi nding in this report that on many issues there are important diff erences of opinion at the village level among the three types of respondents interviewed in this survey. When the village head’s opinion on a local village or information need diff ers from the opinion of the women’s group leader, it is especially important that both voices be heard at the village meeting in which development and investment decisions are made.
Also troubling is the 48 percent of respondents who say that some villagers have diffi culty attending village meetings. As much promise as consultative processes at the community level hold for responding eff ectively to local needs, this is less likely to be achieved when there are signifi cant segments of the population that are unable to participate.

90 2006 Village Survey In Aceh An Assesssment of Village Infrastructure and Social Conditions March 2007

ANNEXES
92 2006 Village Survey In Aceh An Assesssment of Village Infrastructure and Social Conditions March 2007
ANNEXES
ANNEX 1Survey Instrument
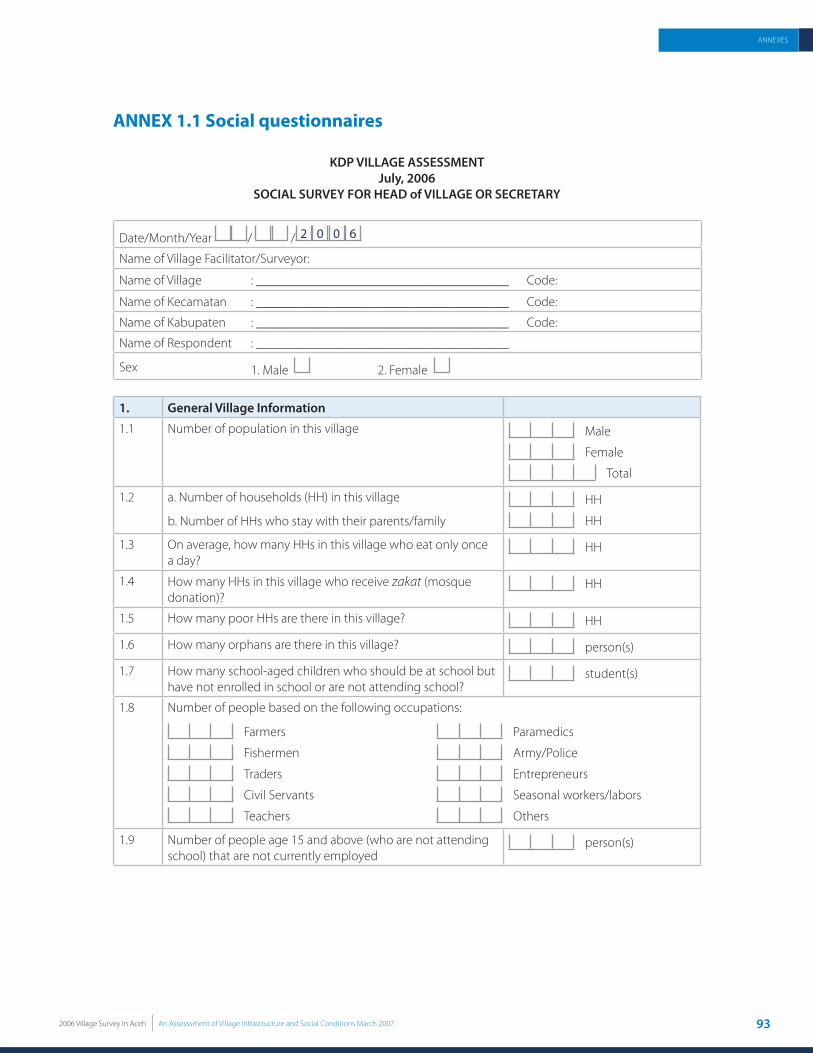
932006 Village Survey In Aceh An Assesssment of Village Infrastructure and Social Conditions March 2007
ANNEXES
ANNEX 1.1 Social questionnaires
KDP VILLAGE ASSESSMENTJuly, 2006
SOCIAL SURVEY FOR HEAD of VILLAGE OR SECRETARY
Date/Month/Year / / 2 0 0 6
Name of Village Facilitator/Surveyor:
Name of Village : ______________________________________ Code:
Name of Kecamatan : ______________________________________ Code:
Name of Kabupaten : ______________________________________ Code:
Name of Respondent : ______________________________________
Sex 1. Male 2. Female
1. General Village Information
1.1 Number of population in this village Male
Female
Total
1.2 a. Number of households (HH) in this village
b. Number of HHs who stay with their parents/family
HH
HH
1.3 On average, how many HHs in this village who eat only once a day?
HH
1.4 How many HHs in this village who receive zakat (mosque donation)?
HH
1.5 How many poor HHs are there in this village? HH
1.6 How many orphans are there in this village? person(s)
1.7 How many school-aged children who should be at school but have not enrolled in school or are not attending school?
student(s)
1.8 Number of people based on the following occupations:
Farmers
Fishermen
Traders
Civil Servants
Teachers
Paramedics
Army/Police
Entrepreneurs
Seasonal workers/labors
Others
1.9 Number of people age 15 and above (who are not attending school) that are not currently employed
person(s)
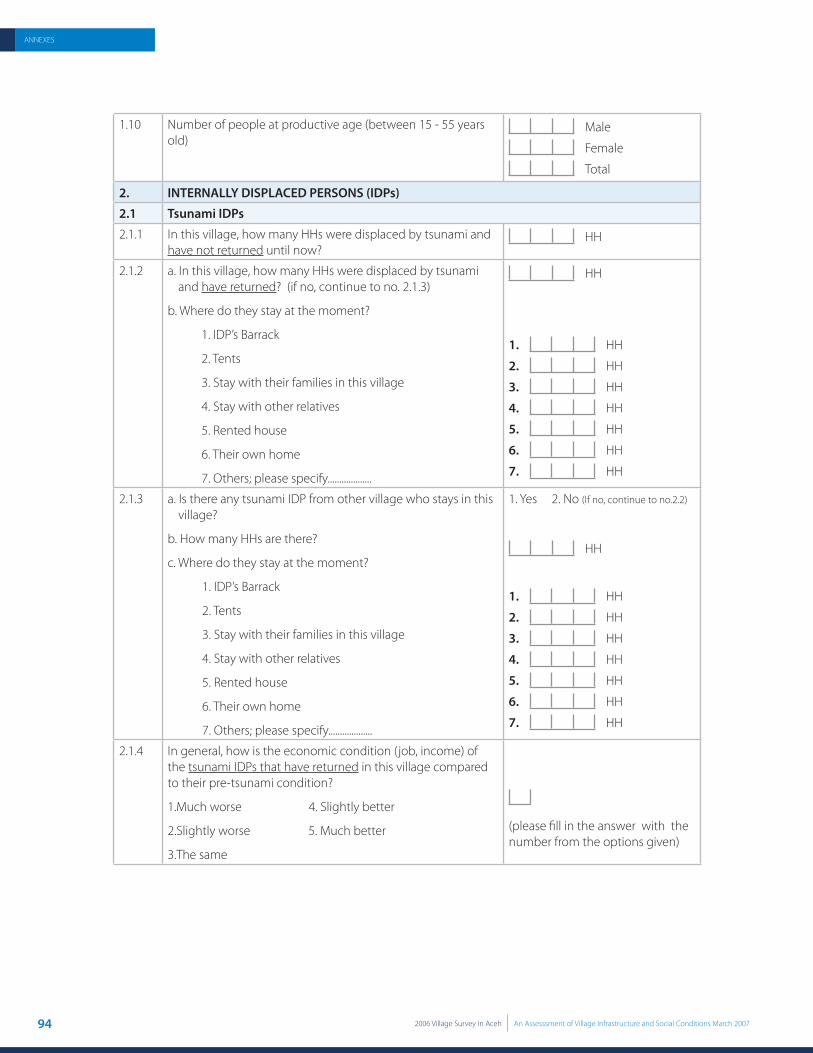
94 2006 Village Survey In Aceh An Assesssment of Village Infrastructure and Social Conditions March 2007
ANNEXES
1.10 Number of people at productive age (between 15 - 55 years old)
Male
Female
Total
2. INTERNALLY DISPLACED PERSONS (IDPs)
2.1 Tsunami IDPs
2.1.1 In this village, how many HHs were displaced by tsunami and have not returned until now?
HH
2.1.2 a. In this village, how many HHs were displaced by tsunami and have returned? (if no, continue to no. 2.1.3)
b. Where do they stay at the moment?
1. IDP’s Barrack
2. Tents
3. Stay with their families in this village
4. Stay with other relatives
5. Rented house
6. Their own home
7. Others; please specify...................
HH
1. HH
2. HH
3. HH
4. HH
5. HH
6. HH
7. HH
2.1.3 a. Is there any tsunami IDP from other village who stays in this village?
b. How many HHs are there?
c. Where do they stay at the moment?
1. IDP’s Barrack
2. Tents
3. Stay with their families in this village
4. Stay with other relatives
5. Rented house
6. Their own home
7. Others; please specify...................
1. Yes 2. No (If no, continue to no.2.2)
HH
1. HH
2. HH
3. HH
4. HH
5. HH
6. HH
7. HH
2.1.4 In general, how is the economic condition (job, income) of the tsunami IDPs that have returned in this village compared to their pre-tsunami condition?
1.Much worse 4. Slightly better
2.Slightly worse 5. Much better
3.The same
(please fi ll in the answer with the number from the options given)

952006 Village Survey In Aceh An Assesssment of Village Infrastructure and Social Conditions March 2007
ANNEXES
2.1.5 In general, how is the economic condition of the tsunami IDPs who came from other village and stay in this village compared to the local people?
1.Much worse 4. Slightly better
2.Slightly worse 5. Much better
3.The same
(please fi ll in the answer with the number from the options given)
2.2 Confl ict IDPs
2.2.1 In your village, how many HHs were displaced by confl ict and have not returned until now?
HH
2.2.2 a. In your village, how many HHs were displaced by confl ict and have returned?
b. Where do they stay at the moment?
1. IDP’s barrack
2. Tents
3. Stay with their families in this village
4. Stay with other relatives
5. Rented house
6. Their own home
7. Others, please specify...................
HH
1. HH
2. HH
3. HH
4. HH
5. HH
6. HH
7. HH
2.2.3 a. Is there any confl ict IDP from other village who stays in this village?
b. How many HHs are there?
c. Where do they stay at the moment?
1. IDP’s barrack
2. Tents
3. Staying with their families in this village
4. Staying with other relatives
5. Rented house
6. Their own home
7. Others, please specify...................
1. Yes 2. No (If no, continue to no.3)
HH
1. HH
2. HH
3. HH
4. HH
5. HH
6. HH
7. HH
2.2.4 In general, how is the economic condition of the confl ict IDPs who came from other village and stay in this village compared to local people?
1. Much worse 4. Slightly better
2. Slightly worse 5. Much better
3. The same
(please fi ll in the answer with the number from the options given)

96 2006 Village Survey In Aceh An Assesssment of Village Infrastructure and Social Conditions March 2007
ANNEXES
3. Information
3.1 In this village, what kind of information do the community generally ask?
(please choose 3 information that were most often asked)
1. Tsunami program
2. Helsinki MoU 3. Post-confl ict reintegration program 9. Training for specifi c skills
4. Village budget use
5. Development program (based on program plan at the village)
6. Access to land (land certifi cate, land boundaries, land ownership, etc.)
7. Employment opportunities
8. Education opportunities
10. Financial services
11. Psychology/trauma counselling
12. Others, please specify__________
1.
2.
3.
(Answer No.1 refl ects the information that the community asked most frequently.)
3.2 As the head of village/youth leader/women leader, how often do you share the following information with your community?
1. Tsunami program...............
2. Helsinki MoU .......................
3. Post-confl ict reintegration program........................
4. Village budget use ...................
5. Development program .......................
6. Others, please specify........................
...............................................................
Never seldom Some-times often Always
1 2 3 4 5
.............................................................................................
3.3 As the head of village/youth leader/women leader, do you feel that you have received suffi cient information on the following issues? (yes or no)
1. Troops withdrawal and weapon decommissioning
2. Reintegration fund for ex-GAM returnees and confl ict victims?
3. Draft of Law on the Governing of Aceh (RUU-PA)
4. Establishment of new political party
5. Roles of AMM (Aceh Monitoring Mission)
6. Establishment of facts fi nding and reconciliation committee
7. Confl ict resolutions
1. Yes No
2. Yes No
3. Yes No
4. Yes No
5. Yes No
6. Yes No
7. Yes No
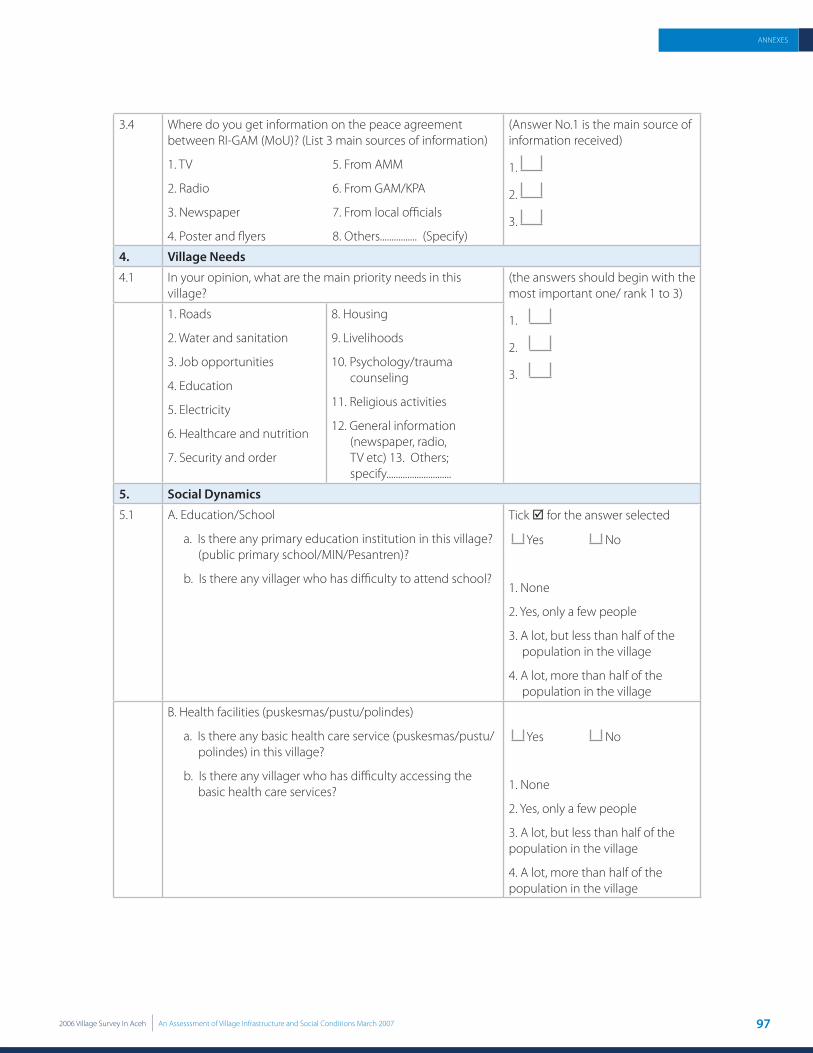
972006 Village Survey In Aceh An Assesssment of Village Infrastructure and Social Conditions March 2007
ANNEXES
3.4 Where do you get information on the peace agreement between RI-GAM (MoU)? (List 3 main sources of information)
1. TV 5. From AMM
2. Radio 6. From GAM/KPA
3. Newspaper 7. From local offi cials
4. Poster and fl yers 8. Others................ (Specify)
(Answer No.1 is the main source of information received)
1.
2.
3.
4. Village Needs
4.1 In your opinion, what are the main priority needs in this village?
(the answers should begin with the most important one/ rank 1 to 3)
1.
2.
3.
1. Roads
2. Water and sanitation
3. Job opportunities
4. Education
5. Electricity
6. Healthcare and nutrition
7. Security and order
8. Housing
9. Livelihoods
10. Psychology/trauma counseling
11. Religious activities
12. General information (newspaper, radio, TV etc) 13. Others; specify............................
5. Social Dynamics
5.1 A. Education/School
a. Is there any primary education institution in this village? (public primary school/MIN/Pesantren)?
b. Is there any villager who has diffi culty to attend school?
Tick for the answer selected
Yes No
1. None
2. Yes, only a few people
3. A lot, but less than half of the population in the village
4. A lot, more than half of the population in the village
B. Health facilities (puskesmas/pustu/polindes)
a. Is there any basic health care service (puskesmas/pustu/polindes) in this village?
b. Is there any villager who has diffi culty accessing the basic health care services?
Yes No
1. None
2. Yes, only a few people
3. A lot, but less than half of the population in the village
4. A lot, more than half of the population in the village
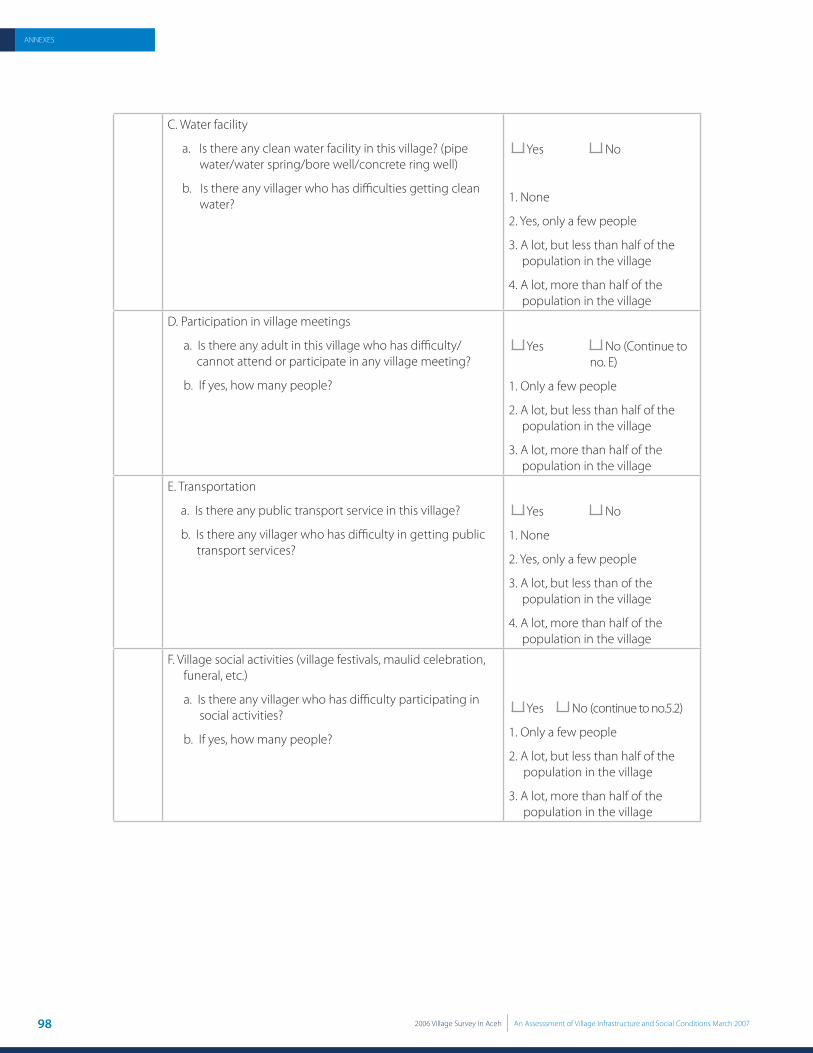
98 2006 Village Survey In Aceh An Assesssment of Village Infrastructure and Social Conditions March 2007
ANNEXES
C. Water facility
a. Is there any clean water facility in this village? (pipe water/water spring/bore well/concrete ring well)
b. Is there any villager who has diffi culties getting clean water?
Yes No
1. None
2. Yes, only a few people
3. A lot, but less than half of the population in the village
4. A lot, more than half of the population in the village
D. Participation in village meetings
a. Is there any adult in this village who has diffi culty/cannot attend or participate in any village meeting?
b. If yes, how many people?
Yes No (Continue to no. E)
1. Only a few people
2. A lot, but less than half of the population in the village
3. A lot, more than half of the population in the village
E. Transportation
a. Is there any public transport service in this village?
b. Is there any villager who has diffi culty in getting public transport services?
Yes No
1. None
2. Yes, only a few people
3. A lot, but less than of the population in the village
4. A lot, more than half of the population in the village
F. Village social activities (village festivals, maulid celebration, funeral, etc.)
a. Is there any villager who has diffi culty participating in social activities?
b. If yes, how many people?
Yes No (continue to no.5.2)
1. Only a few people
2. A lot, but less than half of the population in the village
3. A lot, more than half of the population in the village

992006 Village Survey In Aceh An Assesssment of Village Infrastructure and Social Conditions March 2007
ANNEXES
5.2 List 3 main reasons why villagers have diffi culty in accessing public services or participating in village meetings/social activities as mentioned in No. 5.1 point A – F above
(Answer no. 1 is the main reason and so on)
1.
2.
3.
1. Poverty
2. Religion
3. Ethnic/Language diff erences/Race/group
4. Occupation
5. Gender
6. Age
7. Confl ict victim
8. Tsunami victim
9. Lack of knowledge/education
10. Geographical distance
11. Others; specify .............
Common Social Activities/Actions
5.3 If there is a problem that aff ecting the whole village, for example, lack of clean water or clean water channel is not functioning, how is this problem usually solved (please list 3 main actions that people generally do)?
1. Family, neighbors, and friends gather to discuss how to solve the problem
2. Community organizations in the village fi nd the solution
3. The head of village fi nds the solution
4. Village meeting is held to solve the problem
5. Sub-district Development Plan Meeting is held to discuss problem solving
6. Handled by the district government/offi cials
7. Handled by the sub district government/offi cials
8. KDP mechanism help in problem solving
9. Problem left unsolved
10. Others; please specify...........
11. Don’t know
1.
2.
3.
Participation
5.4 a. In the past year, how many times were village meetings conducted in this village?
b. In general, who usually come/participate in the meetings?
1. Women and men, in almost equal numbers
2. Only men
3. Mostly men, and a few women
4. Mostly women, and a few men
5. Only women
Time(s)
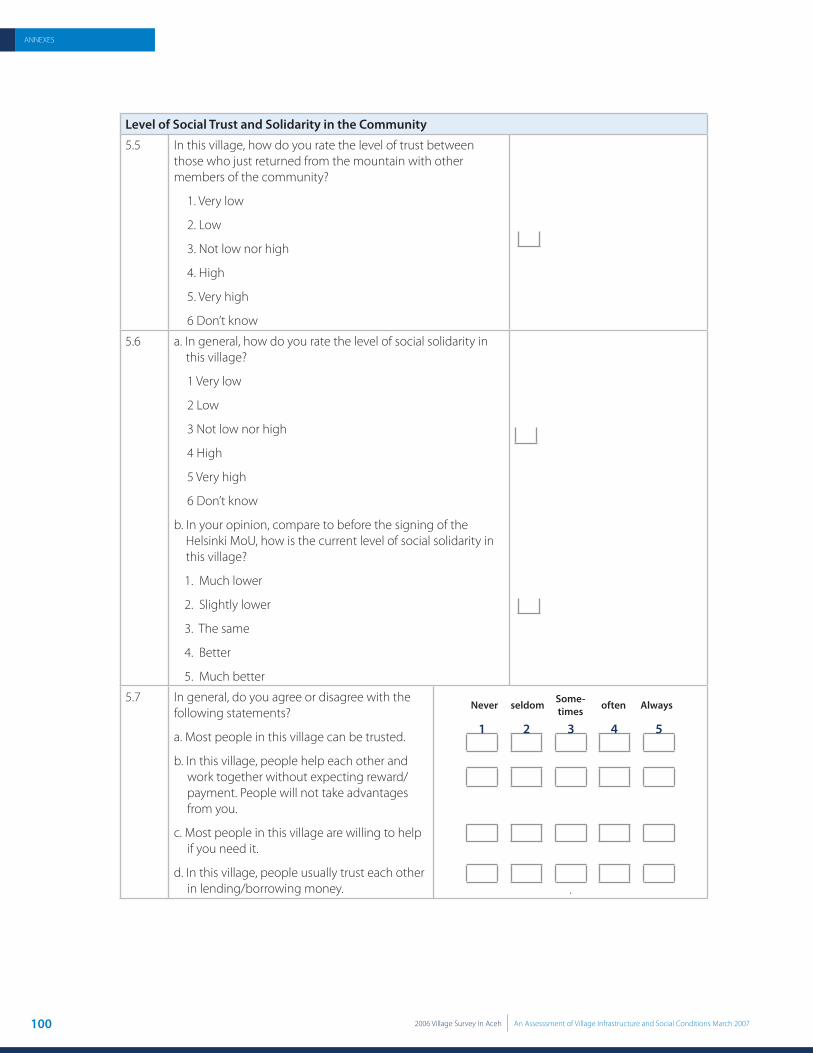
100 2006 Village Survey In Aceh An Assesssment of Village Infrastructure and Social Conditions March 2007
ANNEXES
Level of Social Trust and Solidarity in the Community
5.5 In this village, how do you rate the level of trust between those who just returned from the mountain with other members of the community?
1. Very low
2. Low
3. Not low nor high
4. High
5. Very high
6 Don’t know
5.6 a. In general, how do you rate the level of social solidarity in this village?
1 Very low
2 Low
3 Not low nor high
4 High
5 Very high
6 Don’t know
b. In your opinion, compare to before the signing of the Helsinki MoU, how is the current level of social solidarity in this village?
1. Much lower
2. Slightly lower
3. The same
4. Better
5. Much better
5.7 In general, do you agree or disagree with the following statements?
a. Most people in this village can be trusted.
b. In this village, people help each other and work together without expecting reward/payment. People will not take advantages from you.
c. Most people in this village are willing to help if you need it.
d. In this village, people usually trust each other in lending/borrowing money.
Never seldom Some-times often Always
1 2 3 4 5
.
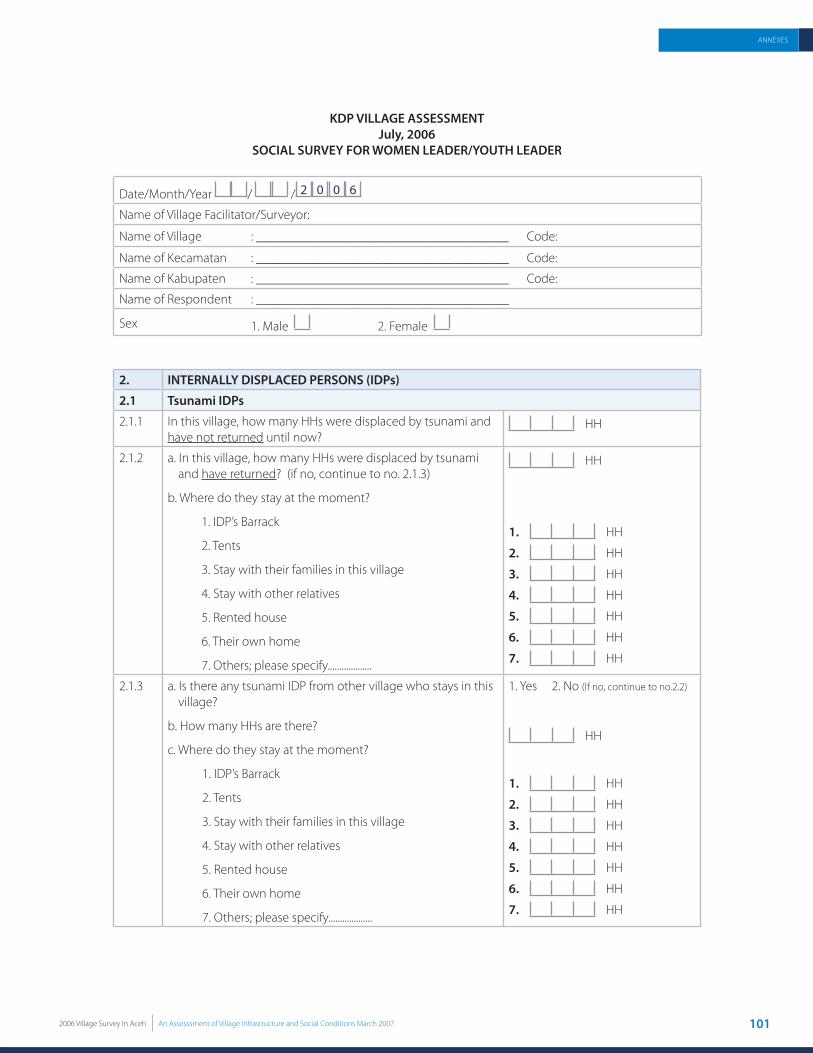
1012006 Village Survey In Aceh An Assesssment of Village Infrastructure and Social Conditions March 2007
ANNEXES
KDP VILLAGE ASSESSMENTJuly, 2006
SOCIAL SURVEY FOR WOMEN LEADER/YOUTH LEADER
Date/Month/Year / / 2 0 0 6
Name of Village Facilitator/Surveyor:
Name of Village : ______________________________________ Code:
Name of Kecamatan : ______________________________________ Code:
Name of Kabupaten : ______________________________________ Code:
Name of Respondent : ______________________________________
Sex 1. Male 2. Female
2. INTERNALLY DISPLACED PERSONS (IDPs)
2.1 Tsunami IDPs
2.1.1 In this village, how many HHs were displaced by tsunami and have not returned until now?
HH
2.1.2 a. In this village, how many HHs were displaced by tsunami and have returned? (if no, continue to no. 2.1.3)
b. Where do they stay at the moment?
1. IDP’s Barrack
2. Tents
3. Stay with their families in this village
4. Stay with other relatives
5. Rented house
6. Their own home
7. Others; please specify...................
HH
1. HH
2. HH
3. HH
4. HH
5. HH
6. HH
7. HH
2.1.3 a. Is there any tsunami IDP from other village who stays in this village?
b. How many HHs are there?
c. Where do they stay at the moment?
1. IDP’s Barrack
2. Tents
3. Stay with their families in this village
4. Stay with other relatives
5. Rented house
6. Their own home
7. Others; please specify...................
1. Yes 2. No (If no, continue to no.2.2)
HH
1. HH
2. HH
3. HH
4. HH
5. HH
6. HH
7. HH

102 2006 Village Survey In Aceh An Assesssment of Village Infrastructure and Social Conditions March 2007
ANNEXES
2.1.4 In general, how is the economic condition (job, income) of the tsunami IDPs that have returned in this village compared to their pre-tsunami condition?
1.Much worse 4. Slightly better
2.Slightly worse 5. Much better
3.The same
(please fi ll in the answer with the number from the options given)
2.1.5 In general, how is the economic condition of the tsunami IDPs who came from other village and stay in this village compared to the local people?
1.Much worse 4. Slightly better
2.Slightly worse 5. Much better
3.The same
(please fi ll in the answer with the number from the options given)
2.2 Confl ict IDPs
2.2.1 In your village, how many HHs were displaced by confl ict and have not returned until now?
HH
2.2.2 a. In your village, how many HHs were displaced by confl ict and have returned?
b. Where do they stay at the moment?
1. IDP’s barrack
2. Tents
3. Stay with their families in this village
4. Stay with other relatives
5. Rented house
6. Their own home
7. Others, please specify...................
HH
1. HH
2. HH
3. HH
4. HH
5. HH
6. HH
7. HH
2.2.3 a. Is there any confl ict IDP from other village who stays in this village?
b. How many HHs are there?
c. Where do they stay at the moment?
1. IDP’s barrack
2. Tents
3. Staying with their families in this village
4. Staying with other relatives
5. Rented house
6. Their own home
7. Others, please specify...................
1. Yes 2. No (If no, continue to no.3)
HH
1. HH
2. HH
3. HH
4. HH
5. HH
6. HH
7. HH

1032006 Village Survey In Aceh An Assesssment of Village Infrastructure and Social Conditions March 2007
ANNEXES
2.2.4 In general, how is the economic condition of the confl ict IDPs who came from other village and stay in this village compared to local people?
1. Much worse 4. Slightly better
2. Slightly worse 5. Much better
3. The same
(please fi ll in the answer with the number from the options given)
3. Information
3.1 In this village, what kind of information do the community generally ask?
(please choose 3 information that were most often asked)
1. Tsunami program
2. Helsinki MoU 3. Post-confl ict reintegration program 9. Training for specifi c skills
4. Village budget use
5. Development program (based on program plan at the village)
6. Access to land (land certifi cate, land boundaries, land ownership, etc.)
7. Employment opportunities
8. Education opportunities
10. Financial services
11. Psychology/trauma counselling
12. Others, please specify__________
1.
2.
3.
(Answer No.1 refl ects the information that the community asked most frequently.)
3.2 As the head of village/youth leader/women leader, how often do you share the following information with your community?
1. Tsunami program...............
2. Helsinki MoU .......................
3. Post-confl ict reintegration program........................
4. Village budget use ...................
5. Development program .......................
6. Others, please specify........................
...............................................................
Never seldom Some-times often Always
1 2 3 4 5
.............................................................................................

104 2006 Village Survey In Aceh An Assesssment of Village Infrastructure and Social Conditions March 2007
ANNEXES
3.3 As the head of village/youth leader/women leader, do you feel that you have received suffi cient information on the following issues? (yes or no)
1. Troops withdrawal and weapon decommissioning
2. Reintegration fund for ex-GAM returnees and confl ict victims?
3. Draft of Law on the Governing of Aceh (RUU-PA)
4. Establishment of new political party
5. Roles of AMM (Aceh Monitoring Mission)
6. Establishment of facts fi nding and reconciliation committee
7. Confl ict resolutions
1. Yes No
2. Yes No
3. Yes No
4. Yes No
5. Yes No
6. Yes No
7. Yes No
3.4 Where do you get information on the peace agreement between RI-GAM (MoU)? (List 3 main sources of information)
1. TV 5. From AMM
2. Radio 6. From GAM/KPA
3. Newspaper 7. From local offi cials
4. Poster and fl yers 8. Others................ (Specify)
(Answer No.1 is the main source of information received)
1.
2.
3.
4. Village Needs
4.1 In your opinion, what are the main priority needs in this village?
(the answers should begin with the most important one/ rank 1 to 3)
1.
2.
3.
1. Roads
2. Water and sanitation
3. Job opportunities
4. Education
5. Electricity
6. Healthcare and nutrition
7. Security and order
8. Housing
9. Livelihoods
10. Psychology/trauma counseling
11. Religious activities
12. General information (newspaper, radio, TV etc) 13. Others; specify............................
5. Social Dynamics
5.1 A. Education/School
a. Is there any primary education institution in this village? (public primary school/MIN/Pesantren)?
b. Is there any villager who has diffi culty to attend school?
Tick for the answer selected
Yes No
1. None
2. Yes, only a few people
3. A lot, but less than half of the population in the village
4. A lot, more than half of the population in the village
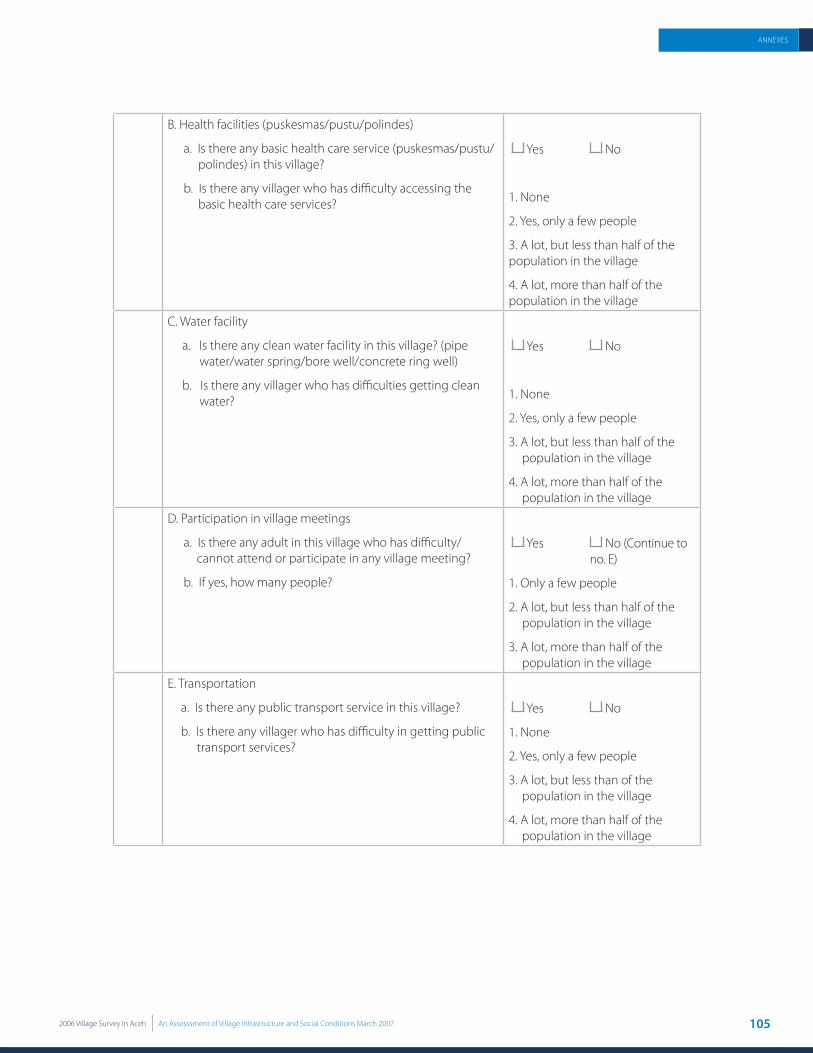
1052006 Village Survey In Aceh An Assesssment of Village Infrastructure and Social Conditions March 2007
ANNEXES
B. Health facilities (puskesmas/pustu/polindes)
a. Is there any basic health care service (puskesmas/pustu/polindes) in this village?
b. Is there any villager who has diffi culty accessing the basic health care services?
Yes No
1. None
2. Yes, only a few people
3. A lot, but less than half of the population in the village
4. A lot, more than half of the population in the village
C. Water facility
a. Is there any clean water facility in this village? (pipe water/water spring/bore well/concrete ring well)
b. Is there any villager who has diffi culties getting clean water?
Yes No
1. None
2. Yes, only a few people
3. A lot, but less than half of the population in the village
4. A lot, more than half of the population in the village
D. Participation in village meetings
a. Is there any adult in this village who has diffi culty/cannot attend or participate in any village meeting?
b. If yes, how many people?
Yes No (Continue to no. E)
1. Only a few people
2. A lot, but less than half of the population in the village
3. A lot, more than half of the population in the village
E. Transportation
a. Is there any public transport service in this village?
b. Is there any villager who has diffi culty in getting public transport services?
Yes No
1. None
2. Yes, only a few people
3. A lot, but less than of the population in the village
4. A lot, more than half of the population in the village
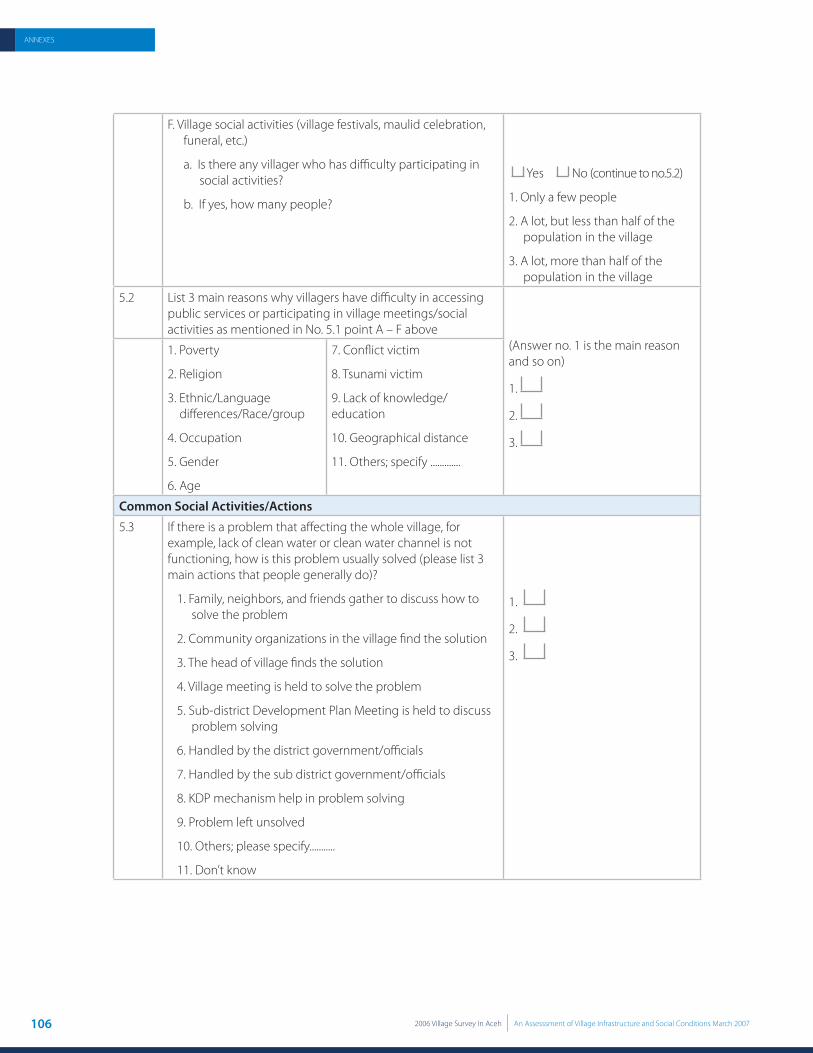
106 2006 Village Survey In Aceh An Assesssment of Village Infrastructure and Social Conditions March 2007
ANNEXES
F. Village social activities (village festivals, maulid celebration, funeral, etc.)
a. Is there any villager who has diffi culty participating in social activities?
b. If yes, how many people?
Yes No (continue to no.5.2)
1. Only a few people
2. A lot, but less than half of the population in the village
3. A lot, more than half of the population in the village
5.2 List 3 main reasons why villagers have diffi culty in accessing public services or participating in village meetings/social activities as mentioned in No. 5.1 point A – F above
(Answer no. 1 is the main reason and so on)
1.
2.
3.
1. Poverty
2. Religion
3. Ethnic/Language diff erences/Race/group
4. Occupation
5. Gender
6. Age
7. Confl ict victim
8. Tsunami victim
9. Lack of knowledge/education
10. Geographical distance
11. Others; specify .............
Common Social Activities/Actions
5.3 If there is a problem that aff ecting the whole village, for example, lack of clean water or clean water channel is not functioning, how is this problem usually solved (please list 3 main actions that people generally do)?
1. Family, neighbors, and friends gather to discuss how to solve the problem
2. Community organizations in the village fi nd the solution
3. The head of village fi nds the solution
4. Village meeting is held to solve the problem
5. Sub-district Development Plan Meeting is held to discuss problem solving
6. Handled by the district government/offi cials
7. Handled by the sub district government/offi cials
8. KDP mechanism help in problem solving
9. Problem left unsolved
10. Others; please specify...........
11. Don’t know
1.
2.
3.

1072006 Village Survey In Aceh An Assesssment of Village Infrastructure and Social Conditions March 2007
ANNEXES
Participation
5.4 a. In the past year, how many times were village meetings conducted in this village?
b. In general, who usually come/participate in the meetings?
1. Women and men, in almost equal numbers
2. Only men
3. Mostly men, and a few women
4. Mostly women, and a few men
5. Only women
Time(s)
Level of Social Trust and Solidarity in the Community
5.5 In this village, how do you rate the level of trust between those who just returned from the mountain with other members of the community?
1. Very low
2. Low
3. Not low nor high
4. High
5. Very high
6 Don’t know
5.6 a. In general, how do you rate the level of social solidarity in this village?
1 Very low
2 Low
3 Not low nor high
4 High
5 Very high
6 Don’t know
b. In your opinion, compare to before the signing of the Helsinki MoU, how is the current level of social solidarity in this village?
1. Much lower
2. Slightly lower
3. The same
4. Better
5. Much better
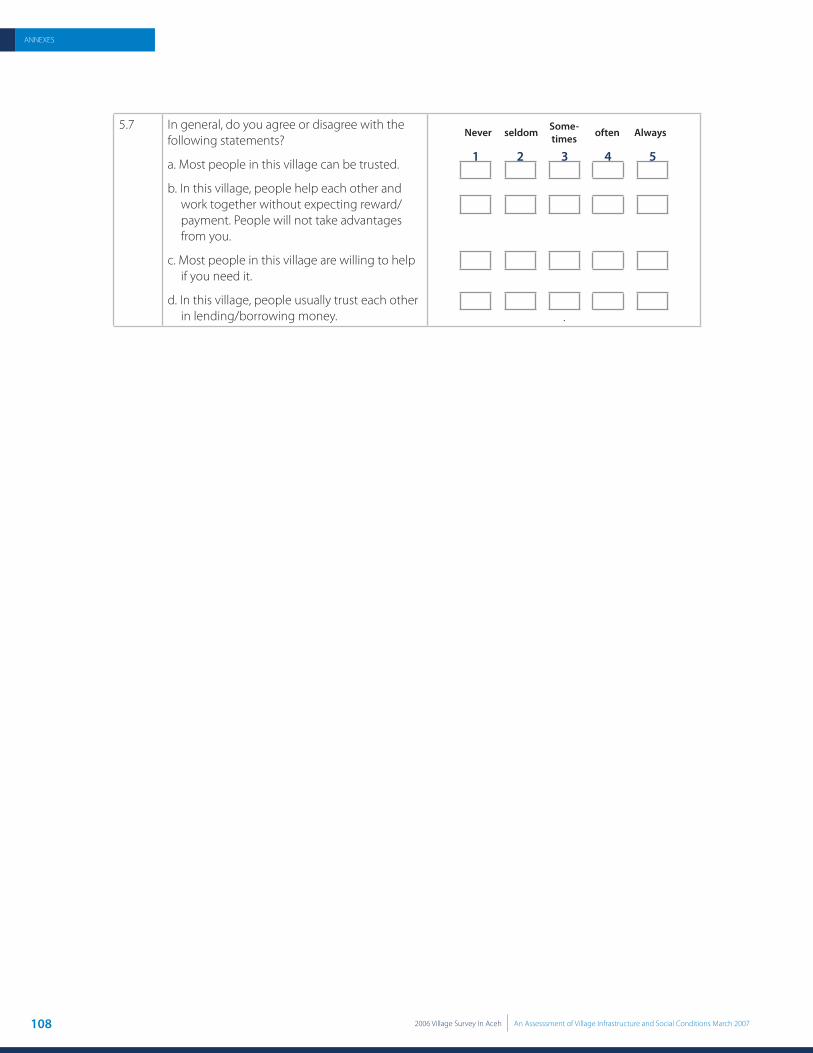
108 2006 Village Survey In Aceh An Assesssment of Village Infrastructure and Social Conditions March 2007
ANNEXES
5.7 In general, do you agree or disagree with the following statements?
a. Most people in this village can be trusted.
b. In this village, people help each other and work together without expecting reward/payment. People will not take advantages from you.
c. Most people in this village are willing to help if you need it.
d. In this village, people usually trust each other in lending/borrowing money.
Never seldom Some-times often Always
1 2 3 4 5
.
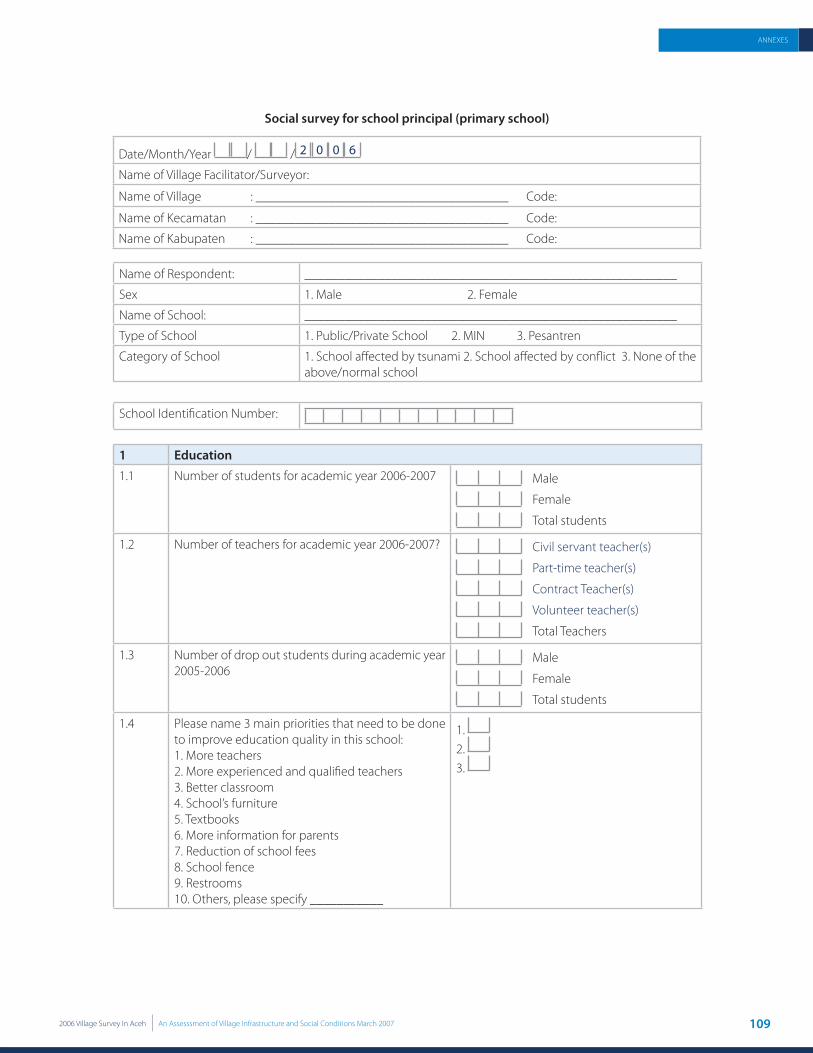
1092006 Village Survey In Aceh An Assesssment of Village Infrastructure and Social Conditions March 2007
ANNEXES
Social survey for school principal (primary school)
Date/Month/Year / / 2 0 0 6
Name of Village Facilitator/Surveyor:
Name of Village : ______________________________________ Code:
Name of Kecamatan : ______________________________________ Code:
Name of Kabupaten : ______________________________________ Code:
Name of Respondent: ________________________________________________________
Sex 1. Male 2. Female
Name of School: ________________________________________________________
Type of School 1. Public/Private School 2. MIN 3. Pesantren
Category of School 1. School aff ected by tsunami 2. School aff ected by confl ict 3. None of the above/normal school
School Identifi cation Number:
1 Education
1.1 Number of students for academic year 2006-2007 Male
Female
Total students
1.2 Number of teachers for academic year 2006-2007? Civil servant teacher(s)
Part-time teacher(s)
Contract Teacher(s)
Volunteer teacher(s)
Total Teachers
1.3 Number of drop out students during academic year 2005-2006
Male
Female
Total students
1.4 Please name 3 main priorities that need to be done to improve education quality in this school: 1. More teachers2. More experienced and qualifi ed teachers3. Better classroom4. School’s furniture 5. Textbooks 6. More information for parents7. Reduction of school fees8. School fence9. Restrooms 10. Others, please specify ___________
1. 2. 3.

110 2006 Village Survey In Aceh An Assesssment of Village Infrastructure and Social Conditions March 2007
ANNEXES
AN
NEX
1.2
Infr
astr
uctu
re s
urve
y fo
rm
RECA
PITU
LATI
ON
of V
ILLA
GE
INFR
AST
RUCT
URE
DA
MA
GED
STA
TUS
Dist
rict
Team
: ……
……
……
.
Subd
istric
tD
ate
: ……
……
……
.
Villa
gePa
ge: …
…of
……
No.
Type
of I
nfra
stru
ctur
eSa
tuan
Volu
me
Num
ber a
ccor
ding
to le
vel o
f dam
aged
Num
ber a
ccor
ding
to re
ason
for d
amag
eN
umbe
r acc
ordi
ng to
reco
nstr
uctio
n st
atus
III
IIIIV
VI
IIIII
III
III
Not
da
mag
edN
eed
light
re
cons
truc
tion
Nee
d he
avy
reco
nstr
uctio
nM
ust b
e re
plac
ed
Aba
ndon
ed/
Neg
lect
edCo
nfl ic
tD
isas
ter
Lack
of
mai
nten
ance
Hav
e no
t re
cons
truc
ted
Und
er
reco
nstr
uctio
nH
ave
fi nis
hed
reco
nstr
uctio
n
II.1.
1Tr
ansp
orta
tion
Kabu
pate
n ro
adm
eter
s
All-w
eath
er v
illag
e ac
cess
road
met
ers
Eart
hen
villa
ge a
cces
s roa
dm
eter
s
All-w
eath
er h
amle
t acc
ess r
oad
met
ers
Eart
hen
ham
let a
cces
s roa
dm
eter
s
All-w
eath
er n
eigh
borh
ood
road
met
ers
Eart
hen
neig
hbor
hood
road
met
ers
All-w
eath
er fa
rmer
acc
ess r
oad
met
ers
Eart
hen
farm
er a
cces
s roa
dm
eter
s
Culv
ert
units
Reta
inin
g w
all
met
ers
Road
dra
inag
em
eter
s
Jett
yun
its
II.1.
2Br
idge
s
Conc
rete
brid
ges
units
Stee
l gird
er b
ridge
units
Woo
den
brid
geun
its
Susp
ensio
n br
idge
units
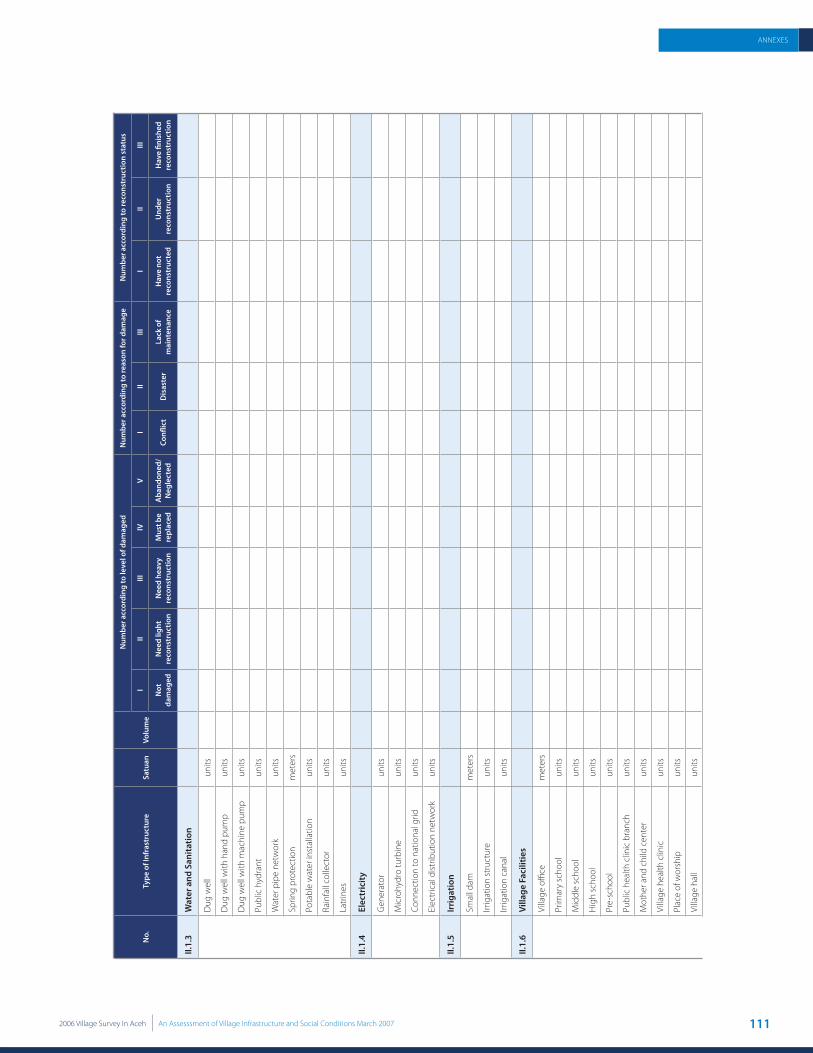
1112006 Village Survey In Aceh An Assesssment of Village Infrastructure and Social Conditions March 2007
ANNEXES
No.
Type
of I
nfra
stru
ctur
eSa
tuan
Volu
me
Num
ber a
ccor
ding
to le
vel o
f dam
aged
Num
ber a
ccor
ding
to re
ason
for d
amag
eN
umbe
r acc
ordi
ng to
reco
nstr
uctio
n st
atus
III
IIIIV
VI
IIIII
III
III
Not
da
mag
edN
eed
light
re
cons
truc
tion
Nee
d he
avy
reco
nstr
uctio
nM
ust b
e re
plac
ed
Aba
ndon
ed/
Neg
lect
edCo
nfl ic
tD
isas
ter
Lack
of
mai
nten
ance
Hav
e no
t re
cons
truc
ted
Und
er
reco
nstr
uctio
nH
ave
fi nis
hed
reco
nstr
uctio
n
II.1.
3W
ater
and
San
itatio
n
Dug
wel
lun
its
Dug
wel
l with
han
d pu
mp
units
Dug
wel
l with
mac
hine
pum
pun
its
Publ
ic h
ydra
ntun
its
Wat
er p
ipe
netw
ork
units
Sprin
g pr
otec
tion
met
ers
Pota
ble
wat
er in
stal
latio
nun
its
Rain
fall
colle
ctor
units
Latr
ines
units
II.1.
4El
ectr
icit
y
Gen
erat
orun
its
Mic
rohy
dro
turb
ine
units
Conn
ectio
n to
nat
iona
l grid
units
Elec
tric
al d
istrib
utio
n ne
twor
kun
its
II.1.
5Ir
riga
tion
Smal
l dam
met
ers
Irrig
atio
n st
ruct
ure
units
Irrig
atio
n ca
nal
units
II.1.
6Vi
llage
Fac
ilitie
s
Vi
llage
offi
cem
eter
s
Pr
imar
y sc
hool
units
M
iddl
e sc
hool
units
H
igh
scho
olun
its
Pr
e-sc
hool
units
Pu
blic
hea
lth c
linic
bra
nch
units
M
othe
r and
chi
ld c
ente
run
its
Vi
llage
hea
lth c
linic
units
Pl
ace
of w
orsh
ipun
its
Vi
llage
hal
lun
its
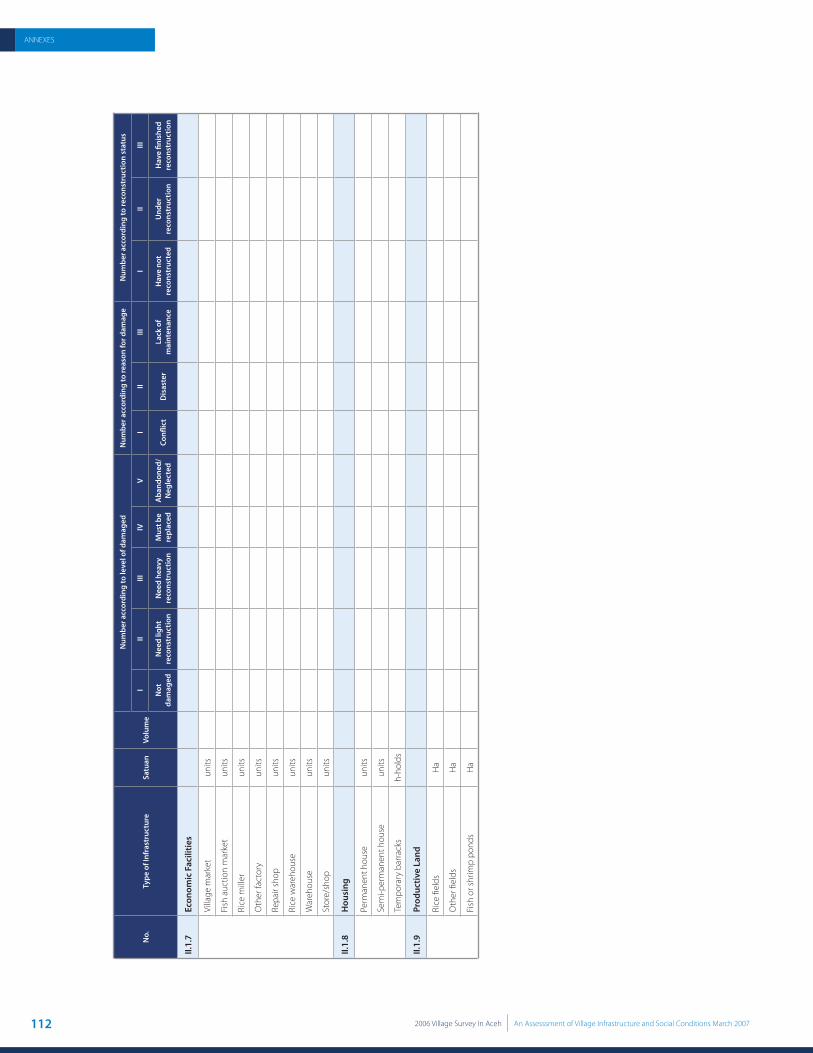
112 2006 Village Survey In Aceh An Assesssment of Village Infrastructure and Social Conditions March 2007
ANNEXES
No.
Type
of I
nfra
stru
ctur
eSa
tuan
Volu
me
Num
ber a
ccor
ding
to le
vel o
f dam
aged
Num
ber a
ccor
ding
to re
ason
for d
amag
eN
umbe
r acc
ordi
ng to
reco
nstr
uctio
n st
atus
III
IIIIV
VI
IIIII
III
III
Not
da
mag
edN
eed
light
re
cons
truc
tion
Nee
d he
avy
reco
nstr
uctio
nM
ust b
e re
plac
ed
Aba
ndon
ed/
Neg
lect
edCo
nfl ic
tD
isas
ter
Lack
of
mai
nten
ance
Hav
e no
t re
cons
truc
ted
Und
er
reco
nstr
uctio
nH
ave
fi nis
hed
reco
nstr
uctio
n
II.1.
7Ec
onom
ic F
acili
ties
Villa
ge m
arke
tun
its
Fish
auc
tion
mar
ket
units
Rice
mill
erun
its
Oth
er fa
ctor
yun
its
Repa
ir sh
opun
its
Rice
war
ehou
seun
its
War
ehou
seun
its
Stor
e/sh
opun
its
II.1.
8H
ousi
ng
Perm
anen
t hou
seun
its
Sem
i-per
man
ent h
ouse
units
Tem
pora
ry b
arra
cks
h-ho
lds
II.1.
9Pr
oduc
tive
Land
Rice
fi el
dsH
a
Oth
er fi
elds
Ha
Fish
or s
hrim
p po
nds
Ha

1132006 Village Survey In Aceh An Assesssment of Village Infrastructure and Social Conditions March 2007
ANNEXES
ANNEX 2Infrastructure data

114 2006 Village Survey In Aceh An Assesssment of Village Infrastructure and Social Conditions March 2007
ANNEXES
AN
NEX
2.1
Infr
astr
uctu
re d
amag
e by
typ
e of
infr
astr
uctu
re, l
evel
of
dam
age,
cau
se o
f da
mag
e, a
nd
repa
ir s
tatu
s Ty
pe o
f Inf
rast
ruct
ure
Uni
tsN
umbe
r of
Vill
ages
Volu
me
Not
D
amag
edLi
ght
Dam
age
Hea
vy
Dam
age
Nee
ds
Repl
ace-
men
t
Aba
n-
done
dCo
nfl ic
tD
isas
ter
Lack
of
Mai
nten
- an
ce
Not
Yet
Re
paire
dU
nder
Re
pair
Alre
ady
Repa
ired
Tran
spor
tatio
n
Kabu
pate
n ro
adm
eter
s2,
232
3,86
2,08
81,
560,
386
780,
893
1,28
1,86
813
5,27
110
3,67
042
9,93
498
1,75
389
0,01
52,
097,
367
204,
335
214,
541
All-w
eath
er v
illag
e ac
cess
road
met
ers
3,41
56,
107,
918
1,78
2,41
41,
635,
148
2,27
9,60
623
1,37
117
9,37
993
4,37
21,
643,
920
1,74
7,21
24,
122,
631
202,
873
264,
907
Eart
hen
villa
ge a
cces
s roa
dm
eter
s1,
830
2,98
0,27
457
6,56
072
6,36
51,
371,
231
128,
731
177,
387
569,
219
757,
472
1,07
7,02
32,
343,
888
59,8
2659
,820
All-w
eath
er h
amle
t acc
ess r
oad
met
ers
2,27
73,
296,
009
913,
658
858,
616
1,25
7,62
314
7,17
811
8,93
449
1,30
788
8,17
61,
002,
868
2,30
1,04
781
,304
160,
749
Eart
hen
ham
let a
cces
s roa
dm
eter
s1,
966
2,88
4,58
653
8,20
168
9,88
81,
310,
886
154,
655
190,
956
539,
872
737,
528
1,06
8,98
52,
295,
848
50,5
3755
,442
All-w
eath
er n
eigh
borh
ood
road
met
ers
575
648,
601
139,
129
162,
391
285,
502
36,3
5225
,227
98,3
8518
4,38
922
6,69
849
6,63
912
,833
21,9
35
Eart
hen
neig
hbor
hood
road
met
ers
734
883,
182
154,
546
243,
374
360,
464
43,5
5081
,248
165,
120
222,
250
341,
266
720,
546
8,09
010
,912
All-w
eath
er fa
rmer
acc
ess r
oad
met
ers
404
717,
233
141,
240
141,
310
346,
771
42,2
1145
,701
146,
430
217,
026
212,
537
550,
006
25,9
8714
,396
Eart
hen
farm
er a
cces
s roa
dm
eter
s1,
004
1,73
6,99
229
5,37
641
7,63
884
1,41
688
,564
93,9
9835
5,77
544
0,66
964
5,17
21,
396,
096
45,5
2021
,398
Culv
ert
units
2,92
026
,638
8,06
23,
870
6,63
47,
541
531
3,33
28,
623
6,62
118
,156
420
1,52
4
Reta
inin
g w
all
met
ers
1,27
71,
097,
972
257,
266
130,
282
426,
854
241,
183
42,3
8782
,513
508,
953
249,
240
814,
238
26,4
6827
,758
Road
dra
inag
em
eter
s1,
839
3,98
5,42
268
7,42
867
6,69
71,
864,
103
517,
938
238,
634
357,
449
1,36
3,64
01,
576,
283
3,21
1,99
485
,378
141,
219
Jett
yun
its17
480
639
135
268
291
7316
931
628
272
344
7
Brid
ges
Conc
rete
brid
ges
units
2,58
48,
562
3,58
01,
708
1,91
11,
185
178
823
2,77
31,
386
4,71
926
354
3
Stee
l gird
er b
ridge
units
728
1,73
444
237
954
733
928
349
578
365
1,18
810
464
Woo
den
brid
geun
its1,
224
4,36
951
670
31,
448
1,58
511
781
71,
924
1,11
23,
755
9866
Susp
ensio
n br
idge
units
375
544
6912
519
814
111
100
209
166
458
1712
Wat
er a
nd S
anita
tion
Dug
wel
lun
its2,
043
155,
355
57,8
9034
,473
37,6
3123
,536
1,82
56,
520
53,3
0537
,640
93,0
094,
456
7,54
9
Dug
wel
l with
han
d pu
mp
units
231
2,20
671
526
885
435
019
5256
687
31,
365
126
75
Dug
wel
l with
mac
hine
pum
pun
its61
28,
483
3,33
01,
348
2,10
91,
627
6941
22,
451
2,29
04,
849
304
326
Publ
ic h
ydra
ntun
its23
096
526
818
432
516
424
3529
636
662
176
63
Wat
er p
ipe
netw
ork
met
ers
531
1,01
3,79
631
8,12
114
2,88
126
9,99
922
4,54
658
,249
83,2
6826
5,54
434
6,86
362
4,66
171
,014
38,0
05
Sprin
g pr
otec
tion
units
209
4,35
73,
402
587
241
8245
3419
472
793
817
58
Pota
ble
wat
er in
stal
latio
nun
its69
363
4051
9515
522
719
012
631
67
3
Rain
fall
colle
ctor
units
164
2,05
527
856
545
962
512
818
876
682
31,
527
250
19
Latr
ines
units
3,08
224
,159
4,47
53,
957
6,14
35,
480
4,10
41,
455
7,33
010
,899
18,4
501,
234
301
Elec
tric
ity
Gen
erat
orun
its37
51,
606
1731
442
781
038
377
431
781
1,21
737
29
Mic
rohy
dro
turb
ine
units
101
126
767
2121
114
1818
464
3
Conn
ectio
n to
nat
iona
l grid
units
361
512
267
5677
100
1238
124
8323
69
9
Elec
tric
al d
istrib
utio
n ne
twor
km
eter
s1,
216
608,
868
149,
827
100,
305
146,
058
199,
012
13,6
6613
1,90
621
7,64
610
9,48
943
3,99
125
,050
16,1
22
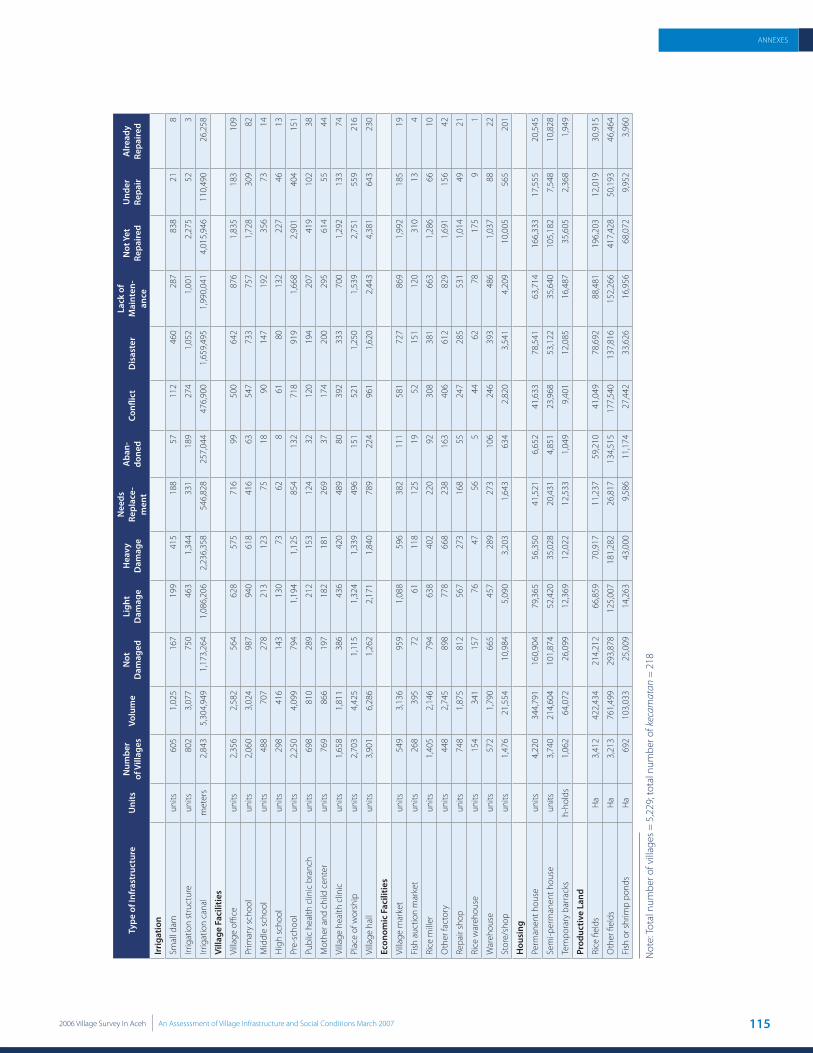
1152006 Village Survey In Aceh An Assesssment of Village Infrastructure and Social Conditions March 2007
ANNEXES
Type
of I
nfra
stru
ctur
eU
nits
Num
ber
of V
illag
esVo
lum
eN
ot
Dam
aged
Ligh
t D
amag
eH
eavy
D
amag
e
Nee
ds
Repl
ace-
men
t
Aba
n-
done
dCo
nfl ic
tD
isas
ter
Lack
of
Mai
nten
- an
ce
Not
Yet
Re
paire
dU
nder
Re
pair
Alre
ady
Repa
ired
Irri
gatio
n
Smal
l dam
units
605
1,02
516
719
941
518
857
112
460
287
838
218
Irrig
atio
n st
ruct
ure
units
802
3,07
775
046
31,
344
331
189
274
1,05
21,
001
2,27
552
3
Irrig
atio
n ca
nal
met
ers
2,84
35,
304,
949
1,17
3,26
41,
086,
206
2,23
6,35
854
6,82
825
7,04
447
6,90
01,
659,
495
1,99
0,04
14,
015,
946
110,
490
26,2
58
Villa
ge F
acili
ties
Villa
ge o
ffi ce
units
2,35
62,
582
564
628
575
716
9950
064
287
61,
835
183
109
Prim
ary
scho
olun
its2,
060
3,02
498
794
061
841
663
547
733
757
1,72
830
982
Mid
dle
scho
olun
its48
870
727
821
312
375
1890
147
192
356
7314
Hig
h sc
hool
units
298
416
143
130
7362
861
8013
222
746
13
Pre-
scho
olun
its2,
250
4,09
979
41,
194
1,12
585
413
271
891
91,
668
2,90
140
415
1
Publ
ic h
ealth
clin
ic b
ranc
hun
its69
881
028
921
215
312
432
120
194
207
419
102
38
Mot
her a
nd c
hild
cen
ter
units
769
866
197
182
181
269
3717
420
029
561
455
44
Villa
ge h
ealth
clin
icun
its1,
658
1,81
138
643
642
048
980
392
333
700
1,29
213
374
Plac
e of
wor
ship
units
2,70
34,
425
1,11
51,
324
1,33
949
615
152
11,
250
1,53
92,
751
559
216
Villa
ge h
all
units
3,90
16,
286
1,26
22,
171
1,84
078
922
496
11,
620
2,44
34,
381
643
230
Econ
omic
Fac
ilitie
s
Villa
ge m
arke
tun
its54
93,
136
959
1,08
859
638
211
158
172
786
91,
992
185
19
Fish
auc
tion
mar
ket
units
268
395
7261
118
125
1952
151
120
310
134
Rice
mill
erun
its1,
405
2,14
679
463
840
222
092
308
381
663
1,28
666
10
Oth
er fa
ctor
yun
its44
82,
745
898
778
668
238
163
406
612
829
1,69
115
642
Repa
ir sh
opun
its74
81,
875
812
567
273
168
5524
728
553
11,
014
4921
Rice
war
ehou
seun
its15
434
115
776
4756
544
6278
175
91
War
ehou
seun
its57
21,
790
665
457
289
273
106
246
393
486
1,03
788
22
Stor
e/sh
opun
its1,
476
21,5
5410
,984
5,09
03,
203
1,64
363
42,
820
3,54
14,
209
10,0
0556
520
1
Hou
sing
Perm
anen
t hou
seun
its4,
220
344,
791
160,
904
79,3
6556
,350
41,5
216,
652
41,6
3378
,541
63,7
1416
6,33
317
,555
20,5
45
Sem
i-per
man
ent h
ouse
units
3,74
021
4,60
410
1,87
452
,420
35,0
2820
,431
4,85
123
,968
53,1
2235
,640
105,
182
7,54
810
,828
Tem
pora
ry b
arra
cks
h-ho
lds
1,06
264
,072
26,0
9912
,369
12,0
2212
,533
1,04
99,
401
12,0
8516
,487
35,6
052,
368
1,94
9
Prod
uctiv
e La
nd
Rice
fi el
dsH
a3,
412
422,
434
214,
212
66,8
5970
,917
11,2
3759
,210
41,0
4978
,692
88,4
8119
6,20
312
,019
30,9
15
Oth
er fi
elds
Ha
3,21
376
1,49
929
3,87
812
5,00
718
1,28
226
,817
134,
515
177,
540
137,
816
152,
266
417,
428
50,1
9346
,464
Fish
or s
hrim
p po
nds
Ha
692
103,
033
25,0
0914
,263
43,0
009,
586
11,1
7427
,442
33,6
2616
,956
68,0
729,
952
3,96
0
Not
e: To
tal n
umbe
r of v
illag
es =
5,2
29; t
otal
num
ber o
f kec
amat
an =
218

116 2006 Village Survey In Aceh An Assesssment of Village Infrastructure and Social Conditions March 2007
ANNEXES
AN
NEX
2.2
Per
cent
age
of in
fras
truc
ture
by
leve
l of d
amag
e, c
ause
of d
amag
e, a
nd re
pair
rate
Type
of I
nfra
stru
ctur
e%
of A
ll Vi
llage
s
Perc
ent o
f Vol
ume
Perc
ent o
f Vol
ume
Perc
ent o
f Dam
aged
and
Rep
aire
d
No
Dam
age
With
D
amag
eLi
ght
Dam
age
Hea
vy
Dam
age
Nee
ds
Repl
ace-
men
t
Aba
n-
done
dCo
nfl ic
tD
isas
ter
Lack
of
Mai
nten
-an
ce
Repa
irs
Not
Ye
t Sta
rted
Und
er
Repa
irFi
nish
ed
Repa
irs
Und
er
Repa
ir +
Fi
nish
ed
Tran
spor
t
Kabu
pate
n ro
ad42
.7%
40.4
%59
.6%
20.2
%33
.2%
3.5%
2.7%
11.1
%25
.4%
23.0
%83
.4%
8.1%
8.5%
16.6
%
All-w
eath
er v
illag
e ac
cess
road
65.3
%29
.2%
70.8
%26
.8%
37.3
%3.
8%2.
9%15
.3%
26.9
%28
.6%
89.8
%4.
4%5.
8%10
.2%
Eart
hen
villa
ge a
cces
s roa
d35
.0%
19.3
%80
.7%
24.4
%46
.0%
4.3%
6.0%
19.1
%25
.4%
36.1
%95
.1%
2.4%
2.4%
4.9%
All-w
eath
er h
amle
t acc
ess r
oad
43.5
%27
.7%
72.3
%26
.1%
38.2
%4.
5%3.
6%14
.9%
26.9
%30
.4%
90.5
%3.
2%6.
3%9.
5%
Eart
hen
ham
let a
cces
s roa
d37
.6%
18.7
%81
.3%
23.9
%45
.4%
5.4%
6.6%
18.7
%25
.6%
37.1
%95
.6%
2.1%
2.3%
4.4%
All-w
eath
er n
eigh
borh
ood
road
11.0
%21
.5%
78.5
%25
.0%
44.0
%5.
6%3.
9%15
.2%
28.4
%35
.0%
93.5
%2.
4%4.
1%6.
5%
Eart
hen
neig
hbor
hood
road
14.0
%17
.5%
82.5
%27
.6%
40.8
%4.
9%9.
2%18
.7%
25.2
%38
.6%
97.4
%1.
1%1.
5%2.
6%
All-w
eath
er fa
rmer
acc
ess r
oad
7.7%
19.7
%80
.3%
19.7
%48
.3%
5.9%
6.4%
20.4
%30
.3%
29.6
%93
.2%
4.4%
2.4%
6.8%
Eart
hen
farm
er a
cces
s roa
d19
.2%
17.0
%83
.0%
24.0
%48
.4%
5.1%
5.4%
20.5
%25
.4%
37.1
%95
.4%
3.1%
1.5%
4.6%
Culv
ert
55.8
%30
.3%
69.7
%14
.5%
24.9
%28
.3%
2.0%
12.5
%32
.4%
24.9
%90
.3%
2.1%
7.6%
9.7%
Reta
inin
g w
all
24.4
%23
.4%
76.6
%11
.9%
38.9
%22
.0%
3.9%
7.5%
46.4
%22
.7%
93.8
%3.
0%3.
2%6.
2%
Road
dra
inag
e35
.2%
17.2
%82
.7%
17.0
%46
.8%
13.0
%6.
0%9.
0%34
.2%
39.6
%93
.4%
2.5%
4.1%
6.6%
Jett
y3.
3%4.
8%95
.2%
16.7
%33
.3%
36.1
%9.
1%21
.0%
39.2
%35
.0%
93.4
%5.
7%0.
9%6.
6%
Brid
ges
Conc
rete
brid
ges
49.4
%41
.8%
58.2
%19
.9%
22.3
%13
.8%
2.1%
9.6%
32.4
%16
.2%
85.4
%4.
8%9.
8%14
.6%
Stee
l gird
er b
ridge
13.9
%25
.5%
74.5
%21
.9%
31.5
%19
.5%
1.6%
20.1
%33
.3%
21.0
%87
.6%
7.7%
4.7%
12.4
%
Woo
den
brid
ge23
.4%
11.8
%88
.2%
16.1
%33
.1%
36.3
%2.
7%18
.7%
44.0
%25
.5%
95.8
%2.
5%1.
7%4.
2%
Susp
ensio
n br
idge
7.2%
12.7
%87
.3%
23.0
%36
.4%
25.9
%2.
0%18
.4%
38.4
%30
.5%
94.0
%3.
5%2.
5%6.
0%
Wat
er a
nd S
anita
tion
Dug
wel
l39
.1%
37.3
%62
.7%
22.2
%24
.2%
15.1
%1.
2%4.
2%34
.3%
24.2
%88
.6%
4.2%
7.2%
11.4
%
Dug
wel
l with
han
d pu
mp
4.4%
32.4
%67
.6%
12.1
%38
.7%
15.9
%0.
9%2.
4%25
.7%
39.6
%87
.2%
8.0%
4.8%
12.8
%
Dug
wel
l with
mac
hine
pum
p11
.7%
39.3
%60
.7%
15.9
%24
.9%
19.2
%0.
8%4.
9%28
.9%
27.0
%88
.5%
5.5%
5.9%
11.5
%
Publ
ic h
ydra
nt4.
4%27
.8%
72.2
%19
.1%
33.7
%17
.0%
2.5%
3.6%
30.7
%37
.9%
81.7
%10
.0%
8.3%
18.3
%
Wat
er p
ipe
netw
ork
10.2
%31
.4%
68.6
%14
.1%
26.6
%22
.1%
5.7%
8.2%
26.2
%34
.2%
85.1
%9.
7%5.
2%14
.9%
Sprin
g pr
otec
tion
4.0%
78.1
%21
.9%
13.5
%5.
5%1.
9%1.
0%0.
8%4.
5%16
.7%
92.6
%1.
7%5.
7%7.
4%
Pota
ble
wat
er in
stal
latio
n1.
3%11
.0%
89.0
%14
.0%
26.2
%42
.7%
6.1%
1.9%
52.3
%34
.7%
96.9
%2.
1%0.
9%3.
1%
Rain
fall
colle
ctor
3.1%
13.5
%86
.5%
27.5
%22
.3%
30.4
%6.
2%9.
1%37
.3%
40.0
%85
.0%
13.9
%1.
1%15
.0%
Latr
ines
58.9
%18
.5%
81.5
%16
.4%
25.4
%22
.7%
17.0
%6.
0%30
.3%
45.1
%92
.3%
6.2%
1.5%
7.7%
Elec
tric
ity
Gen
erat
or7.
2%1.
1%98
.9%
19.6
%26
.6%
50.4
%2.
4%23
.5%
26.8
%48
.6%
76.2
%23
.3%
0.6%
23.8
%
Mic
rohy
dro
turb
ine
1.9%
60.3
%39
.7%
5.6%
16.7
%16
.7%
0.8%
11.1
%14
.3%
14.3
%86
.8%
7.5%
5.7%
13.2
%
Conn
ectio
n to
nat
iona
l grid
6.9%
52.1
%47
.9%
10.9
%15
.0%
19.5
%2.
3%7.
4%24
.2%
16.2
%92
.9%
3.5%
3.5%
7.1%
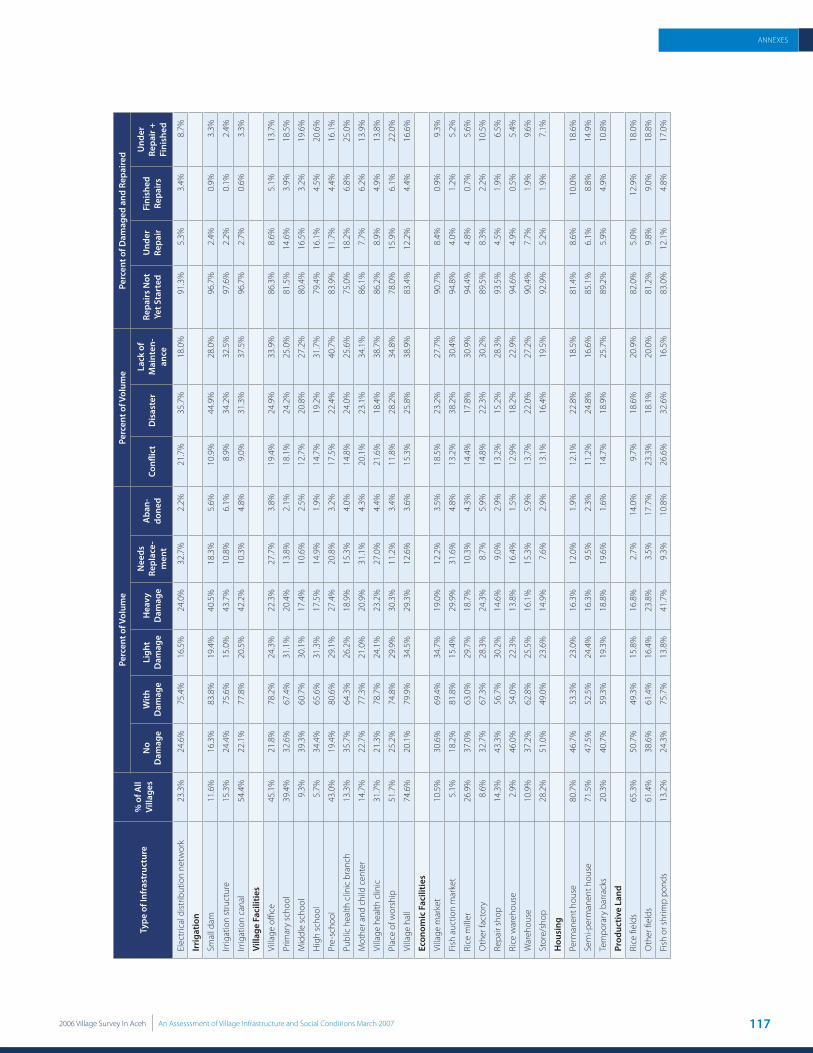
1172006 Village Survey In Aceh An Assesssment of Village Infrastructure and Social Conditions March 2007
ANNEXES
Type
of I
nfra
stru
ctur
e%
of A
ll Vi
llage
s
Perc
ent o
f Vol
ume
Perc
ent o
f Vol
ume
Perc
ent o
f Dam
aged
and
Rep
aire
d
No
Dam
age
With
D
amag
eLi
ght
Dam
age
Hea
vy
Dam
age
Nee
ds
Repl
ace-
men
t
Aba
n-
done
dCo
nfl ic
tD
isas
ter
Lack
of
Mai
nten
-an
ce
Repa
irs
Not
Ye
t Sta
rted
Und
er
Repa
irFi
nish
ed
Repa
irs
Und
er
Repa
ir +
Fi
nish
ed
Elec
tric
al d
istrib
utio
n ne
twor
k23
.3%
24.6
%75
.4%
16.5
%24
.0%
32.7
%2.
2%21
.7%
35.7
%18
.0%
91.3
%5.
3%3.
4%8.
7%
Irri
gatio
n
Smal
l dam
11.6
%16
.3%
83.8
%19
.4%
40.5
%18
.3%
5.6%
10.9
%44
.9%
28.0
%96
.7%
2.4%
0.9%
3.3%
Irrig
atio
n st
ruct
ure
15.3
%24
.4%
75.6
%15
.0%
43.7
%10
.8%
6.1%
8.9%
34.2
%32
.5%
97.6
%2.
2%0.
1%2.
4%
Irrig
atio
n ca
nal
54.4
%22
.1%
77.8
%20
.5%
42.2
%10
.3%
4.8%
9.0%
31.3
%37
.5%
96.7
%2.
7%0.
6%3.
3%
Villa
ge F
acili
ties
Villa
ge o
ffi ce
45.1
%21
.8%
78.2
%24
.3%
22.3
%27
.7%
3.8%
19.4
%24
.9%
33.9
%86
.3%
8.6%
5.1%
13.7
%
Prim
ary
scho
ol39
.4%
32.6
%67
.4%
31.1
%20
.4%
13.8
%2.
1%18
.1%
24.2
%25
.0%
81.5
%14
.6%
3.9%
18.5
%
Mid
dle
scho
ol9.
3%39
.3%
60.7
%30
.1%
17.4
%10
.6%
2.5%
12.7
%20
.8%
27.2
%80
.4%
16.5
%3.
2%19
.6%
Hig
h sc
hool
5.7%
34.4
%65
.6%
31.3
%17
.5%
14.9
%1.
9%14
.7%
19.2
%31
.7%
79.4
%16
.1%
4.5%
20.6
%
Pre-
scho
ol43
.0%
19.4
%80
.6%
29.1
%27
.4%
20.8
%3.
2%17
.5%
22.4
%40
.7%
83.9
%11
.7%
4.4%
16.1
%
Publ
ic h
ealth
clin
ic b
ranc
h13
.3%
35.7
%64
.3%
26.2
%18
.9%
15.3
%4.
0%14
.8%
24.0
%25
.6%
75.0
%18
.2%
6.8%
25.0
%
Mot
her a
nd c
hild
cen
ter
14.7
%22
.7%
77.3
%21
.0%
20.9
%31
.1%
4.3%
20.1
%23
.1%
34.1
%86
.1%
7.7%
6.2%
13.9
%
Villa
ge h
ealth
clin
ic31
.7%
21.3
%78
.7%
24.1
%23
.2%
27.0
%4.
4%21
.6%
18.4
%38
.7%
86.2
%8.
9%4.
9%13
.8%
Plac
e of
wor
ship
51.7
%25
.2%
74.8
%29
.9%
30.3
%11
.2%
3.4%
11.8
%28
.2%
34.8
%78
.0%
15.9
%6.
1%22
.0%
Villa
ge h
all
74.6
%20
.1%
79.9
%34
.5%
29.3
%12
.6%
3.6%
15.3
%25
.8%
38.9
%83
.4%
12.2
%4.
4%16
.6%
Econ
omic
Fac
ilitie
s
Villa
ge m
arke
t10
.5%
30.6
%69
.4%
34.7
%19
.0%
12.2
%3.
5%18
.5%
23.2
%27
.7%
90.7
%8.
4%0.
9%9.
3%
Fish
auc
tion
mar
ket
5.1%
18.2
%81
.8%
15.4
%29
.9%
31.6
%4.
8%13
.2%
38.2
%30
.4%
94.8
%4.
0%1.
2%5.
2%
Rice
mill
er26
.9%
37.0
%63
.0%
29.7
%18
.7%
10.3
%4.
3%14
.4%
17.8
%30
.9%
94.4
%4.
8%0.
7%5.
6%
Oth
er fa
ctor
y8.
6%32
.7%
67.3
%28
.3%
24.3
%8.
7%5.
9%14
.8%
22.3
%30
.2%
89.5
%8.
3%2.
2%10
.5%
Repa
ir sh
op14
.3%
43.3
%56
.7%
30.2
%14
.6%
9.0%
2.9%
13.2
%15
.2%
28.3
%93
.5%
4.5%
1.9%
6.5%
Rice
war
ehou
se2.
9%46
.0%
54.0
%22
.3%
13.8
%16
.4%
1.5%
12.9
%18
.2%
22.9
%94
.6%
4.9%
0.5%
5.4%
War
ehou
se10
.9%
37.2
%62
.8%
25.5
%16
.1%
15.3
%5.
9%13
.7%
22.0
%27
.2%
90.4
%7.
7%1.
9%9.
6%
Stor
e/sh
op28
.2%
51.0
%49
.0%
23.6
%14
.9%
7.6%
2.9%
13.1
%16
.4%
19.5
%92
.9%
5.2%
1.9%
7.1%
Hou
sing
Perm
anen
t hou
se80
.7%
46.7
%53
.3%
23.0
%16
.3%
12.0
%1.
9%12
.1%
22.8
%18
.5%
81.4
%8.
6%10
.0%
18.6
%
Sem
i-per
man
ent h
ouse
71.5
%47
.5%
52.5
%24
.4%
16.3
%9.
5%2.
3%11
.2%
24.8
%16
.6%
85.1
%6.
1%8.
8%14
.9%
Tem
pora
ry b
arra
cks
20.3
%40
.7%
59.3
%19
.3%
18.8
%19
.6%
1.6%
14.7
%18
.9%
25.7
%89
.2%
5.9%
4.9%
10.8
%
Prod
uctiv
e La
nd
Rice
fi el
ds65
.3%
50.7
%49
.3%
15.8
%16
.8%
2.7%
14.0
%9.
7%18
.6%
20.9
%82
.0%
5.0%
12.9
%18
.0%
Oth
er fi
elds
61.4
%38
.6%
61.4
%16
.4%
23.8
%3.
5%17
.7%
23.3
%18
.1%
20.0
%81
.2%
9.8%
9.0%
18.8
%
Fish
or s
hrim
p po
nds
13.2
%24
.3%
75.7
%13
.8%
41.7
%9.
3%10
.8%
26.6
%32
.6%
16.5
%83
.0%
12.1
%4.
8%17
.0%
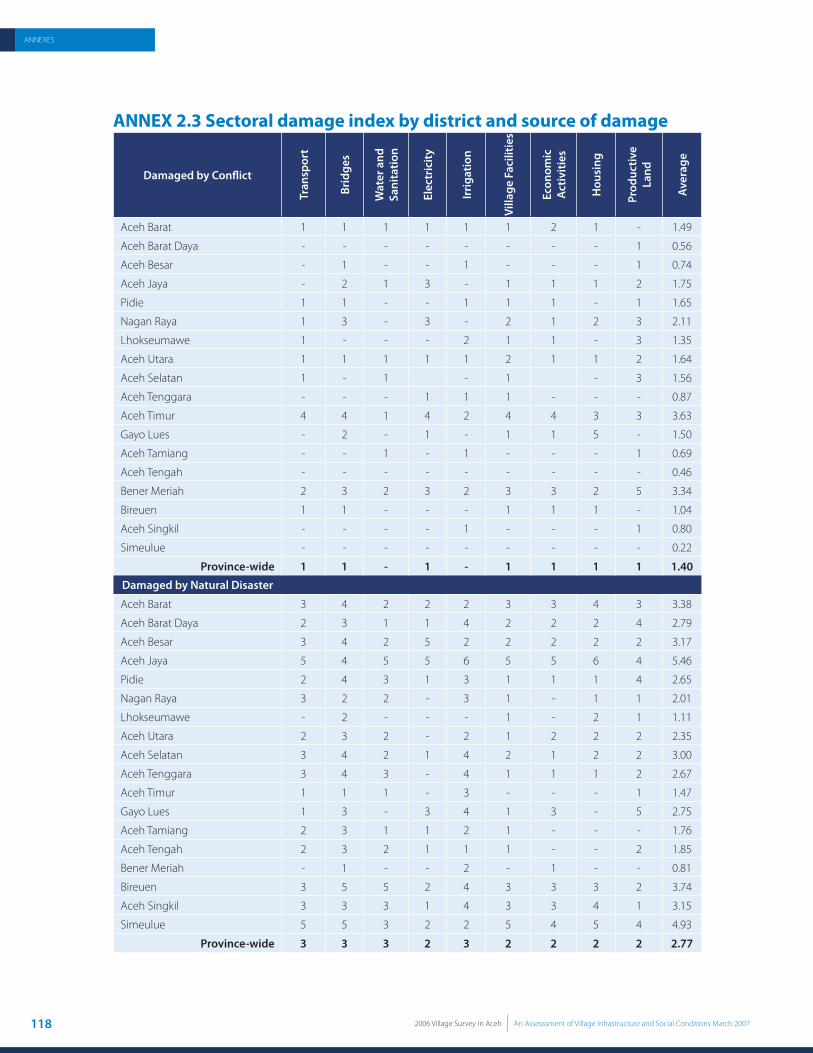
118 2006 Village Survey In Aceh An Assesssment of Village Infrastructure and Social Conditions March 2007
ANNEXES
ANNEX 2.3 Sectoral damage index by district and source of damage
Damaged by Confl ict
Tran
spor
t
Brid
ges
Wat
er a
nd
Sani
tatio
n
Elec
tric
ity
Irri
gatio
n
Villa
ge F
acili
ties
Econ
omic
A
ctiv
ities
Hou
sing
Prod
uctiv
e La
nd
Aver
age
Aceh Barat 1 1 1 1 1 1 2 1 - 1.49
Aceh Barat Daya - - - - - - - - 1 0.56
Aceh Besar - 1 - - 1 - - - 1 0.74
Aceh Jaya - 2 1 3 - 1 1 1 2 1.75
Pidie 1 1 - - 1 1 1 - 1 1.65
Nagan Raya 1 3 - 3 - 2 1 2 3 2.11
Lhokseumawe 1 - - - 2 1 1 - 3 1.35
Aceh Utara 1 1 1 1 1 2 1 1 2 1.64
Aceh Selatan 1 - 1 - 1 - 3 1.56
Aceh Tenggara - - - 1 1 1 - - - 0.87
Aceh Timur 4 4 1 4 2 4 4 3 3 3.63
Gayo Lues - 2 - 1 - 1 1 5 - 1.50
Aceh Tamiang - - 1 - 1 - - - 1 0.69
Aceh Tengah - - - - - - - - - 0.46
Bener Meriah 2 3 2 3 2 3 3 2 5 3.34
Bireuen 1 1 - - - 1 1 1 - 1.04
Aceh Singkil - - - - 1 - - - 1 0.80
Simeulue - - - - - - - - - 0.22
Province-wide 1 1 - 1 - 1 1 1 1 1.40
Damaged by Natural Disaster
Aceh Barat 3 4 2 2 2 3 3 4 3 3.38
Aceh Barat Daya 2 3 1 1 4 2 2 2 4 2.79
Aceh Besar 3 4 2 5 2 2 2 2 2 3.17
Aceh Jaya 5 4 5 5 6 5 5 6 4 5.46
Pidie 2 4 3 1 3 1 1 1 4 2.65
Nagan Raya 3 2 2 - 3 1 - 1 1 2.01
Lhokseumawe - 2 - - - 1 - 2 1 1.11
Aceh Utara 2 3 2 - 2 1 2 2 2 2.35
Aceh Selatan 3 4 2 1 4 2 1 2 2 3.00
Aceh Tenggara 3 4 3 - 4 1 1 1 2 2.67
Aceh Timur 1 1 1 - 3 - - - 1 1.47
Gayo Lues 1 3 - 3 4 1 3 - 5 2.75
Aceh Tamiang 2 3 1 1 2 1 - - - 1.76
Aceh Tengah 2 3 2 1 1 1 - - 2 1.85
Bener Meriah - 1 - - 2 - 1 - - 0.81
Bireuen 3 5 5 2 4 3 3 3 2 3.74
Aceh Singkil 3 3 3 1 4 3 3 4 1 3.15
Simeulue 5 5 3 2 2 5 4 5 4 4.93
Province-wide 3 3 3 2 3 2 2 2 2 2.77

1192006 Village Survey In Aceh An Assesssment of Village Infrastructure and Social Conditions March 2007
ANNEXES
ANNEX 2.4 Degree of damage and current status of repair of confl ict and natural disaster related infrastructure damage
Type of Infrastructure Units
Caused by Confl ict Only
Amount Damaged
Degree of Damage Current Status of Repair
Lightly HeavilyNeeds to be
ReplacedAbandoned Not yet
RepairedUnder Repair
Finished Repairs
Percent in Repair
Transport
Kabupaten road meters 261,034 24.5% 62.5% 5.8% 7.2% 247,984 13,050 13,620 9.7%
All-weather village access road meters 622,493 26.3% 64.5% 6.3% 2.9% 606,550 15,943 24,155 6.2%
Earthen village access road meters 406,775 25.8% 61.7% 5.2% 7.3% 394,675 12,100 12,090 5.8%
All-weather hamlet access road meters 366,239 26.5% 66.4% 5.0% 2.1% 355,419 10,820 8,180 5.1%
Earthen hamlet access road meters 360,336 15.8% 71.3% 4.1% 8.8% 355,906 4,430 6,730 3.0%
All-weather neighborhood road meters 99,650 17.8% 68.2% 3.4% 10.5% 97,337 2,313 5,475 7.4%
Earthen neighborhood road meters 126,710 8.5% 72.9% 9.0% 9.5% 126,710 0 2,500 1.9%
All-weather farmer access road meters 88,875 8.8% 64.7% 2.5% 24.1% 88,475 400 2,600 3.3%
Earthen farmer access road meters 251,048 17.4% 71.5% 5.5% 5.6% 246,148 4,900 2,200 2.8%
Culvert units 39,293 7.6% 86.1% 4.6% 1.7% 39,234 59 199 0.7%
Retaining wall meters 49,324 16.9% 60.0% 16.2% 6.9% 48,902 422 350 1.6%
Road drainage meters 213,056 11.0% 56.6% 22.8% 9.6% 210,226 2,830 8,211 5.0%
Jetty units 6,037 3.4% 57.9% 22.1% 16.6% 6,009 28 0 0.5%
Bridges
Concrete bridges units 549 39.3% 33.7% 23.1% 3.8% 535 14 61 12.3%
Steel girder bridge units 355 24.2% 47.2% 26.6% 2.0% 333 22 12 9.3%
Wooden bridge units 538 7.4% 39.6% 50.9% 2.0% 535 3 4 1.3%
Suspension bridge units 171 24.6% 42.7% 31.0% 1.8% 166 5 0 2.9%
Water and Sanitation
Dug well units 3,474 20.6% 39.6% 39.1% 0.6% 3,402 72 6 2.2%
Dug well with hand pump units 306 22.5% 45.4% 32.0% 0.0% 298 8 0 2.6%
Dug well with machine pump units 309 12.6% 15.5% 70.6% 1.3% 307 2 0 0.6%
Public hydrant units 87 9.2% 51.7% 37.9% 1.1% 86 1 0 1.1%
Water pipe network meters 59,022 15.6% 36.5% 42.3% 5.7% 58,982 40 3,248 5.3%
Spring protection units 2,032 0.2% 1.1% 98.6% 0.0% 2,032 0 2 0.1%
Potable water installation units 4 0.0% 0.0% 100.0% 0.0% 4 0 0 0.0%
Rainfall collector units 160 54.4% 7.5% 36.3% 1.9% 80 80 0 50.0%
Latrines units 638 12.9% 44.5% 31.7% 11.0% 633 5 0 0.8%
Electricity
Generator units 309 9.1% 33.3% 53.4% 4.2% 293 16 0 5.2%
Microhydro turbine units 27 11.1% 33.3% 48.1% 7.4% 27 0 3 10.0%
Connection to national grid units 34 23.5% 14.7% 47.1% 14.7% 34 0 0 0.0%
Electrical distribution network meters 95,374 15.0% 38.6% 42.5% 3.9% 95,171 203 1,462 1.7%
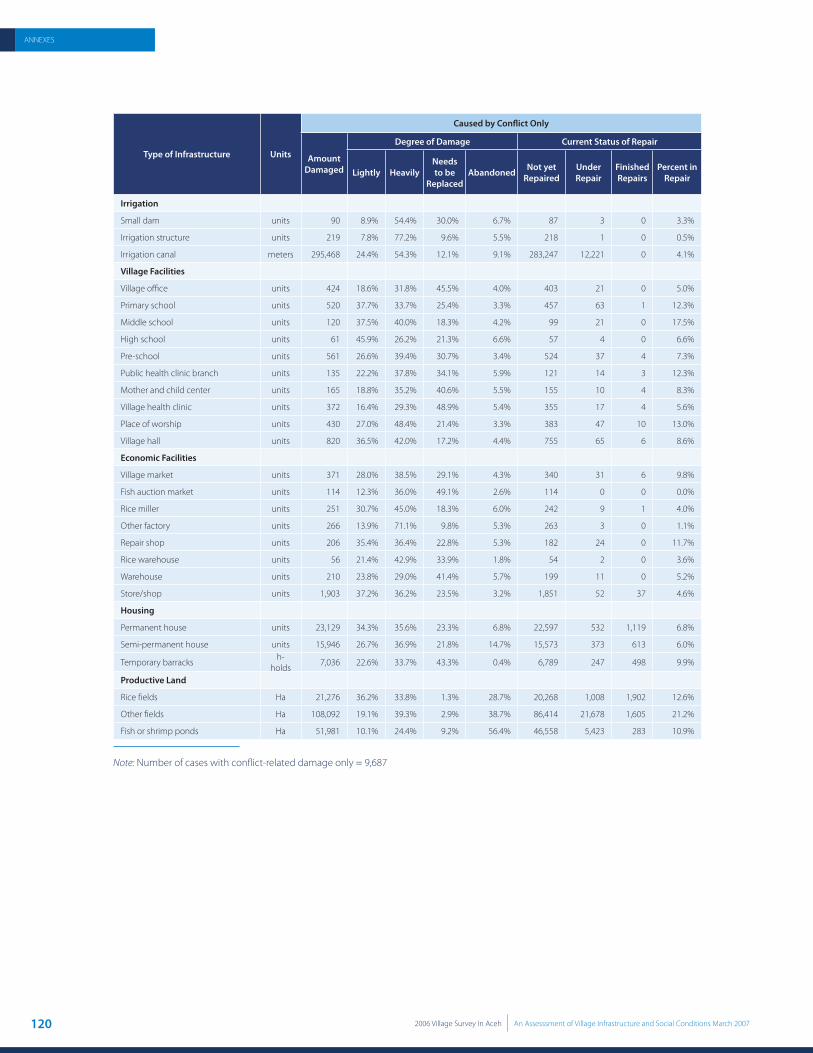
120 2006 Village Survey In Aceh An Assesssment of Village Infrastructure and Social Conditions March 2007
ANNEXES
Type of Infrastructure Units
Caused by Confl ict Only
Amount Damaged
Degree of Damage Current Status of Repair
Lightly HeavilyNeeds to be
ReplacedAbandoned Not yet
RepairedUnder Repair
Finished Repairs
Percent in Repair
Irrigation
Small dam units 90 8.9% 54.4% 30.0% 6.7% 87 3 0 3.3%
Irrigation structure units 219 7.8% 77.2% 9.6% 5.5% 218 1 0 0.5%
Irrigation canal meters 295,468 24.4% 54.3% 12.1% 9.1% 283,247 12,221 0 4.1%
Village Facilities
Village offi ce units 424 18.6% 31.8% 45.5% 4.0% 403 21 0 5.0%
Primary school units 520 37.7% 33.7% 25.4% 3.3% 457 63 1 12.3%
Middle school units 120 37.5% 40.0% 18.3% 4.2% 99 21 0 17.5%
High school units 61 45.9% 26.2% 21.3% 6.6% 57 4 0 6.6%
Pre-school units 561 26.6% 39.4% 30.7% 3.4% 524 37 4 7.3%
Public health clinic branch units 135 22.2% 37.8% 34.1% 5.9% 121 14 3 12.3%
Mother and child center units 165 18.8% 35.2% 40.6% 5.5% 155 10 4 8.3%
Village health clinic units 372 16.4% 29.3% 48.9% 5.4% 355 17 4 5.6%
Place of worship units 430 27.0% 48.4% 21.4% 3.3% 383 47 10 13.0%
Village hall units 820 36.5% 42.0% 17.2% 4.4% 755 65 6 8.6%
Economic Facilities
Village market units 371 28.0% 38.5% 29.1% 4.3% 340 31 6 9.8%
Fish auction market units 114 12.3% 36.0% 49.1% 2.6% 114 0 0 0.0%
Rice miller units 251 30.7% 45.0% 18.3% 6.0% 242 9 1 4.0%
Other factory units 266 13.9% 71.1% 9.8% 5.3% 263 3 0 1.1%
Repair shop units 206 35.4% 36.4% 22.8% 5.3% 182 24 0 11.7%
Rice warehouse units 56 21.4% 42.9% 33.9% 1.8% 54 2 0 3.6%
Warehouse units 210 23.8% 29.0% 41.4% 5.7% 199 11 0 5.2%
Store/shop units 1,903 37.2% 36.2% 23.5% 3.2% 1,851 52 37 4.6%
Housing
Permanent house units 23,129 34.3% 35.6% 23.3% 6.8% 22,597 532 1,119 6.8%
Semi-permanent house units 15,946 26.7% 36.9% 21.8% 14.7% 15,573 373 613 6.0%
Temporary barracksh-
holds7,036 22.6% 33.7% 43.3% 0.4% 6,789 247 498 9.9%
Productive Land
Rice fi elds Ha 21,276 36.2% 33.8% 1.3% 28.7% 20,268 1,008 1,902 12.6%
Other fi elds Ha 108,092 19.1% 39.3% 2.9% 38.7% 86,414 21,678 1,605 21.2%
Fish or shrimp ponds Ha 51,981 10.1% 24.4% 9.2% 56.4% 46,558 5,423 283 10.9%
Note: Number of cases with conflict-related damage only = 9,687
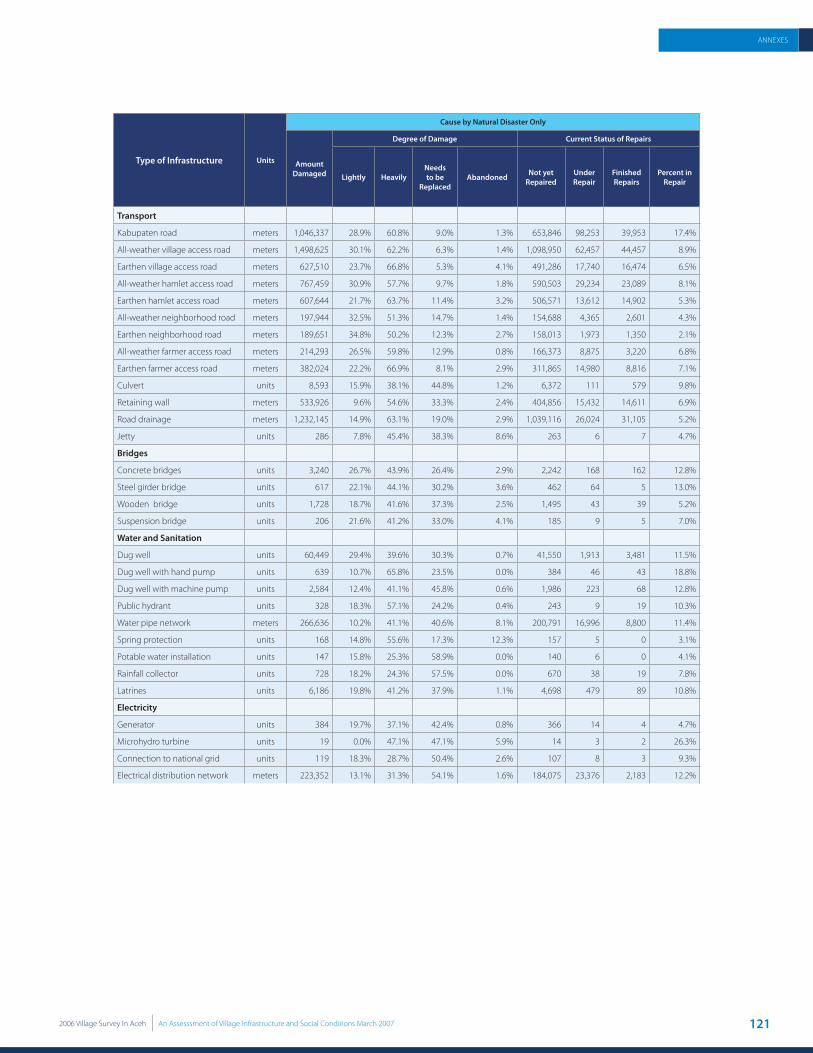
1212006 Village Survey In Aceh An Assesssment of Village Infrastructure and Social Conditions March 2007
ANNEXES
Type of Infrastructure Units
Cause by Natural Disaster Only
Amount Damaged
Degree of Damage Current Status of Repairs
Lightly HeavilyNeeds to be
ReplacedAbandoned Not yet
RepairedUnder Repair
Finished Repairs
Percent in Repair
Transport
Kabupaten road meters 1,046,337 28.9% 60.8% 9.0% 1.3% 653,846 98,253 39,953 17.4%
All-weather village access road meters 1,498,625 30.1% 62.2% 6.3% 1.4% 1,098,950 62,457 44,457 8.9%
Earthen village access road meters 627,510 23.7% 66.8% 5.3% 4.1% 491,286 17,740 16,474 6.5%
All-weather hamlet access road meters 767,459 30.9% 57.7% 9.7% 1.8% 590,503 29,234 23,089 8.1%
Earthen hamlet access road meters 607,644 21.7% 63.7% 11.4% 3.2% 506,571 13,612 14,902 5.3%
All-weather neighborhood road meters 197,944 32.5% 51.3% 14.7% 1.4% 154,688 4,365 2,601 4.3%
Earthen neighborhood road meters 189,651 34.8% 50.2% 12.3% 2.7% 158,013 1,973 1,350 2.1%
All-weather farmer access road meters 214,293 26.5% 59.8% 12.9% 0.8% 166,373 8,875 3,220 6.8%
Earthen farmer access road meters 382,024 22.2% 66.9% 8.1% 2.9% 311,865 14,980 8,816 7.1%
Culvert units 8,593 15.9% 38.1% 44.8% 1.2% 6,372 111 579 9.8%
Retaining wall meters 533,926 9.6% 54.6% 33.3% 2.4% 404,856 15,432 14,611 6.9%
Road drainage meters 1,232,145 14.9% 63.1% 19.0% 2.9% 1,039,116 26,024 31,105 5.2%
Jetty units 286 7.8% 45.4% 38.3% 8.6% 263 6 7 4.7%
Bridges
Concrete bridges units 3,240 26.7% 43.9% 26.4% 2.9% 2,242 168 162 12.8%
Steel girder bridge units 617 22.1% 44.1% 30.2% 3.6% 462 64 5 13.0%
Wooden bridge units 1,728 18.7% 41.6% 37.3% 2.5% 1,495 43 39 5.2%
Suspension bridge units 206 21.6% 41.2% 33.0% 4.1% 185 9 5 7.0%
Water and Sanitation
Dug well units 60,449 29.4% 39.6% 30.3% 0.7% 41,550 1,913 3,481 11.5%
Dug well with hand pump units 639 10.7% 65.8% 23.5% 0.0% 384 46 43 18.8%
Dug well with machine pump units 2,584 12.4% 41.1% 45.8% 0.6% 1,986 223 68 12.8%
Public hydrant units 328 18.3% 57.1% 24.2% 0.4% 243 9 19 10.3%
Water pipe network meters 266,636 10.2% 41.1% 40.6% 8.1% 200,791 16,996 8,800 11.4%
Spring protection units 168 14.8% 55.6% 17.3% 12.3% 157 5 0 3.1%
Potable water installation units 147 15.8% 25.3% 58.9% 0.0% 140 6 0 4.1%
Rainfall collector units 728 18.2% 24.3% 57.5% 0.0% 670 38 19 7.8%
Latrines units 6,186 19.8% 41.2% 37.9% 1.1% 4,698 479 89 10.8%
Electricity
Generator units 384 19.7% 37.1% 42.4% 0.8% 366 14 4 4.7%
Microhydro turbine units 19 0.0% 47.1% 47.1% 5.9% 14 3 2 26.3%
Connection to national grid units 119 18.3% 28.7% 50.4% 2.6% 107 8 3 9.3%
Electrical distribution network meters 223,352 13.1% 31.3% 54.1% 1.6% 184,075 23,376 2,183 12.2%
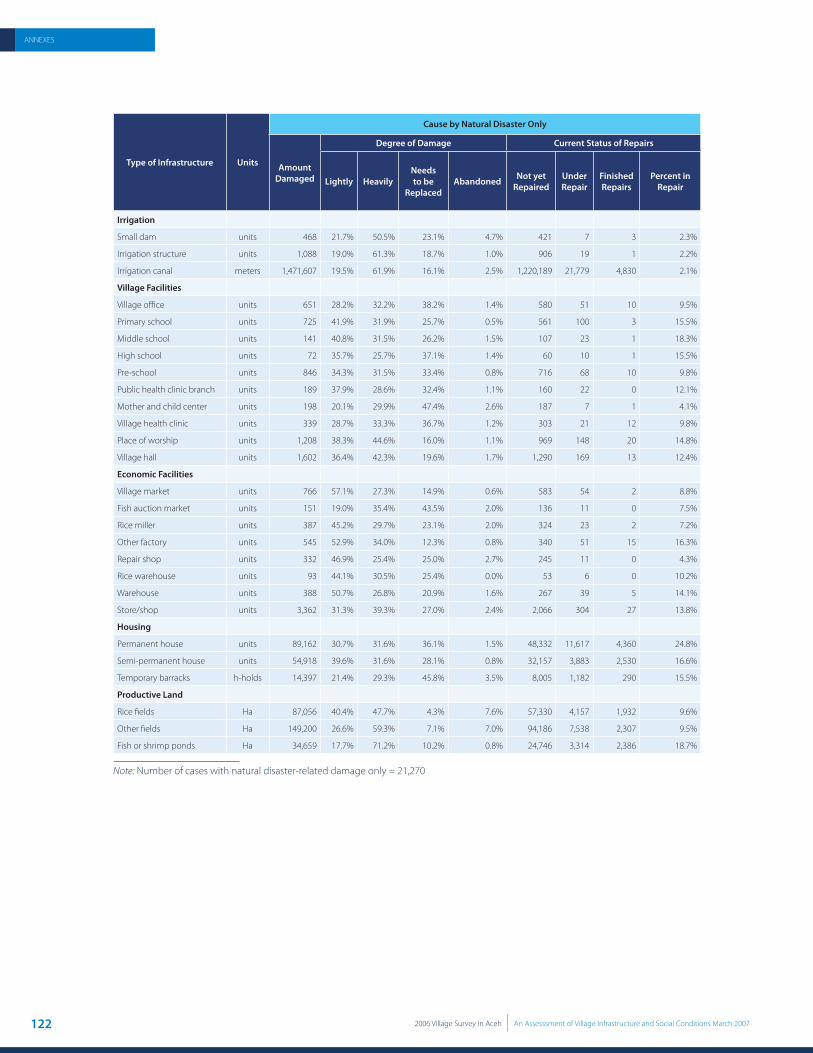
122 2006 Village Survey In Aceh An Assesssment of Village Infrastructure and Social Conditions March 2007
ANNEXES
Type of Infrastructure Units
Cause by Natural Disaster Only
Amount Damaged
Degree of Damage Current Status of Repairs
Lightly HeavilyNeeds to be
ReplacedAbandoned Not yet
RepairedUnder Repair
Finished Repairs
Percent in Repair
Irrigation
Small dam units 468 21.7% 50.5% 23.1% 4.7% 421 7 3 2.3%
Irrigation structure units 1,088 19.0% 61.3% 18.7% 1.0% 906 19 1 2.2%
Irrigation canal meters 1,471,607 19.5% 61.9% 16.1% 2.5% 1,220,189 21,779 4,830 2.1%
Village Facilities
Village offi ce units 651 28.2% 32.2% 38.2% 1.4% 580 51 10 9.5%
Primary school units 725 41.9% 31.9% 25.7% 0.5% 561 100 3 15.5%
Middle school units 141 40.8% 31.5% 26.2% 1.5% 107 23 1 18.3%
High school units 72 35.7% 25.7% 37.1% 1.4% 60 10 1 15.5%
Pre-school units 846 34.3% 31.5% 33.4% 0.8% 716 68 10 9.8%
Public health clinic branch units 189 37.9% 28.6% 32.4% 1.1% 160 22 0 12.1%
Mother and child center units 198 20.1% 29.9% 47.4% 2.6% 187 7 1 4.1%
Village health clinic units 339 28.7% 33.3% 36.7% 1.2% 303 21 12 9.8%
Place of worship units 1,208 38.3% 44.6% 16.0% 1.1% 969 148 20 14.8%
Village hall units 1,602 36.4% 42.3% 19.6% 1.7% 1,290 169 13 12.4%
Economic Facilities
Village market units 766 57.1% 27.3% 14.9% 0.6% 583 54 2 8.8%
Fish auction market units 151 19.0% 35.4% 43.5% 2.0% 136 11 0 7.5%
Rice miller units 387 45.2% 29.7% 23.1% 2.0% 324 23 2 7.2%
Other factory units 545 52.9% 34.0% 12.3% 0.8% 340 51 15 16.3%
Repair shop units 332 46.9% 25.4% 25.0% 2.7% 245 11 0 4.3%
Rice warehouse units 93 44.1% 30.5% 25.4% 0.0% 53 6 0 10.2%
Warehouse units 388 50.7% 26.8% 20.9% 1.6% 267 39 5 14.1%
Store/shop units 3,362 31.3% 39.3% 27.0% 2.4% 2,066 304 27 13.8%
Housing
Permanent house units 89,162 30.7% 31.6% 36.1% 1.5% 48,332 11,617 4,360 24.8%
Semi-permanent house units 54,918 39.6% 31.6% 28.1% 0.8% 32,157 3,883 2,530 16.6%
Temporary barracks h-holds 14,397 21.4% 29.3% 45.8% 3.5% 8,005 1,182 290 15.5%
Productive Land
Rice fi elds Ha 87,056 40.4% 47.7% 4.3% 7.6% 57,330 4,157 1,932 9.6%
Other fi elds Ha 149,200 26.6% 59.3% 7.1% 7.0% 94,186 7,538 2,307 9.5%
Fish or shrimp ponds Ha 34,659 17.7% 71.2% 10.2% 0.8% 24,746 3,314 2,386 18.7%
Note: Number of cases with natural disaster-related damage only = 21,270

1232006 Village Survey In Aceh An Assesssment of Village Infrastructure and Social Conditions March 2007
ANNEXES
AN
NEX
2.5
Cos
ts to
repa
ir o
r rep
lace
dam
aged
infr
astr
uctu
re c
ause
d by
con
fl ict
and
nat
ural
dis
aste
r
Type
of I
nfra
stru
ctur
eU
nits
Am
ount
of D
amag
eU
nit C
ost
Tota
l Cos
ts
(Rp
'000
.000
)
Lack
of
Mai
nten
-an
ceLi
ght
Dam
age
Hea
vy
Dam
age
Nee
ds
Repl
ace-
men
t
Aba
n-do
ned
Ligh
t D
amag
eH
eavy
D
amag
eRe
plac
eA
band
oned
Tran
spor
t
Kabu
pate
n ro
adm
eter
s78
0,89
31,
281,
868
135,
271
103,
670
100,
000
250,
000
500,
000
375,
000
388,
676
23.0
%
All-w
eath
er v
illag
e ac
cess
road
met
ers
1,63
5,14
82,
279,
606
231,
371
179,
379
75,0
0012
0,00
013
5,00
010
1,25
031
8,12
328
.6%
Eart
hen
villa
ge a
cces
s roa
dm
eter
s72
6,36
51,
371,
231
128,
731
177,
387
32,5
0050
,000
65,0
0048
,750
69,7
2636
.1%
All-w
eath
er h
amle
t acc
ess r
oad
met
ers
858,
616
1,25
7,62
314
7,17
811
8,93
462
,500
100,
000
112,
500
84,3
7514
3,33
430
.4%
Eart
hen
ham
let a
cces
s roa
dm
eter
s68
9,88
81,
310,
886
154,
655
190,
956
27,0
0042
,000
54,0
0040
,500
56,5
0237
.1%
All-w
eath
er n
eigh
borh
ood
road
met
ers
162,
391
285,
502
36,3
5225
,227
50,0
0080
,000
90,0
0067
,500
23,3
7535
.0%
Eart
hen
neig
hbor
hood
road
met
ers
243,
374
360,
464
43,5
5081
,248
22,0
0034
,000
43,0
0032
,250
13,5
6238
.6%
All-w
eath
er fa
rmer
acc
ess r
oad
met
ers
141,
310
346,
771
42,2
1145
,701
62,5
0010
0,00
011
2,50
084
,375
36,6
7129
.6%
Eart
hen
farm
er a
cces
s roa
dm
eter
s41
7,63
884
1,41
688
,564
93,9
9827
,000
42,0
0054
,000
40,5
0034
,700
37.1
%
Culv
ert
units
3,87
06,
634
7,54
153
12,
400,
000
4,80
0,00
06,
000,
000
4,50
0,00
066
,703
24.9
%
Reta
inin
g w
all
met
ers
130,
282
426,
854
241,
183
42,3
8760
,000
120,
000
150,
000
112,
500
77,2
8922
.7%
Road
dra
inag
em
eter
s67
6,69
71,
864,
103
517,
938
238,
634
2,50
06,
000
10,0
007,
500
11,9
9639
.6%
Jett
yun
its13
526
829
173
15,0
00,0
0030
,000
,000
75,0
00,0
0056
,250
,000
23,4
0235
.0%
Brid
ges
Conc
rete
brid
ges
units
1,70
81,
911
1,18
517
816
,000
,000
96,0
00,0
0012
0,00
0,00
090
,000
,000
309,
270
16.2
%
Stee
l gird
er b
ridge
units
379
547
339
2815
,000
,000
65,0
00,0
0078
,000
,000
58,5
00,0
0054
,672
21.0
%
Woo
den
brid
geun
its70
31,
448
1,58
511
79,
000,
000
41,6
00,0
0052
,000
,000
39,0
00,0
0011
4,46
625
.5%
Susp
ensio
n br
idge
units
125
198
141
1112
0,00
0,00
024
0,00
0,00
030
0,00
0,00
022
5,00
0,00
074
,554
30.5
%
Wat
er a
nd S
anita
tion
Dug
wel
lun
its34
,473
37,6
3123
,536
1,82
51,
000,
000
3,00
0,00
06,
000,
000
4,50
0,00
022
4,88
624
.2%
Dug
wel
l with
han
d pu
mp
units
268
854
350
191,
800,
000
3,80
0,00
06,
800,
000
5,10
0,00
03,
749
39.6
%
Dug
wel
l with
mac
hine
pum
pun
its1,
348
2,10
91,
627
692,
000,
000
4,00
0,00
07,
000,
000
5,25
0,00
016
,706
27.0
%
Publ
ic h
ydra
ntun
its18
432
516
424
1,00
0,00
04,
000,
000
5,00
0,00
03,
750,
000
1,48
637
.9%
Wat
er p
ipe
netw
ork
met
ers
142,
881
269,
999
224,
546
58,2
4920
,000
40,0
0050
,000
37,5
0017
,808
34.2
%
Sprin
g pr
otec
tion
units
587
241
8245
8,00
0,00
020
,000
,000
25,0
00,0
0018
,750
,000
10,3
3916
.7%
Pota
ble
wat
er in
stal
latio
nun
its51
9515
522
5,00
0,00
015
,000
,000
30,0
00,0
0022
,500
,000
4,45
634
.7%
Rain
fall
colle
ctor
units
565
459
625
128
3,00
0,00
07,
500,
000
15,0
00,0
0011
,250
,000
9,56
440
.0%
Latr
ines
units
3,95
76,
143
5,48
04,
104
4,20
0,00
033
,600
,000
42,0
00,0
0031
,500
,000
319,
691
45.1
%
Elec
tric
ity
Gen
erat
orun
its31
442
781
038
2,00
0,00
04,
800,
000
8,00
0,00
06,
000,
000
4,82
148
.6%
Mic
rohy
dro
turb
ine
units
721
211
25,0
00,0
0060
,000
,000
100,
000,
000
75,0
00,0
003,
094
14.3
%
Conn
ectio
n to
nat
iona
l grid
units
5677
100
1240
,000
,000
100,
000,
000
200,
000,
000
150,
000,
000
26,5
9516
.2%
Elec
tric
al d
istrib
utio
n ne
twor
km
eter
s10
0,30
514
6,05
819
9,01
213
,666
8,10
020
,250
40,5
0030
,375
10,0
4318
.0%

124 2006 Village Survey In Aceh An Assesssment of Village Infrastructure and Social Conditions March 2007
ANNEXES
Type
of I
nfra
stru
ctur
eU
nits
Am
ount
of D
amag
eU
nit C
ost
Tota
l Cos
ts (R
p '0
00.0
00)
Lack
of
Mai
nten
-anc
eLi
ght
Dam
age
Hea
vy
Dam
age
Nee
ds
Repl
ace-
men
tA
band
oned
Ligh
t D
amag
eH
eavy
D
amag
eRe
plac
eA
band
oned
Irri
gatio
n
Smal
l dam
units
199
415
188
575,
000,
000
10,0
00,0
0025
,000
,000
18,7
50,0
007,
858
28.0
%
Irrig
atio
n st
ruct
ure
units
463
1,34
433
118
93,
000,
000
7,00
0,00
015
,000
,000
11,2
50,0
0012
,069
32.5
%
Irrig
atio
n ca
nal
met
ers
1,08
6,20
62,
236,
358
546,
828
257,
044
45,0
0010
0,00
012
5,00
093
,750
228,
057
37.5
%
Villa
ge F
acili
ties
Villa
ge o
ffi ce
units
628
575
716
9912
,500
,000
30,0
00,0
0050
,000
,000
37,5
00,0
0042
,691
33.9
%
Prim
ary
scho
olun
its94
061
841
663
45,0
00,0
0018
0,00
0,00
022
5,00
0,00
016
8,75
0,00
019
3,24
325
.0%
Mid
dle
scho
olun
its21
312
375
1845
,000
,000
180,
000,
000
225,
000,
000
168,
750,
000
37,6
1427
.2%
Hig
h sc
hool
units
130
7362
845
,000
,000
180,
000,
000
225,
000,
000
168,
750,
000
23,4
1031
.7%
Pre-
scho
olun
its1,
194
1,12
585
413
215
,000
,000
60,0
00,0
0075
,000
,000
56,2
50,0
0093
,044
40.7
%
Publ
ic h
ealth
clin
ic b
ranc
hun
its21
215
312
432
7,00
0,00
070
,000
,000
140,
000,
000
105,
000,
000
24,5
0325
.6%
Mot
her a
nd c
hild
cen
ter
units
182
181
269
375,
760,
000
28,8
00,0
0057
,600
,000
43,2
00,0
0015
,398
34.1
%
Villa
ge h
ealth
clin
icun
its43
642
048
980
12,5
00,0
0030
,000
,000
50,0
00,0
0037
,500
,000
27,9
1338
.7%
Plac
e of
wor
ship
units
1,32
41,
339
496
151
60,0
00,0
0024
0,00
0,00
030
0,00
0,00
022
5,00
0,00
038
0,61
034
.8%
Villa
ge h
all
units
2,17
11,
840
789
224
15,0
00,0
0060
,000
,000
75,0
00,0
0056
,250
,000
131,
283
38.9
%
Econ
omic
Fac
ilitie
s
Villa
ge m
arke
tun
its1,
088
596
382
111
45,0
00,0
0018
0,00
0,00
022
5,00
0,00
016
8,75
0,00
018
8,61
927
.7%
Fish
auc
tion
mar
ket
units
6111
812
519
45,0
00,0
0018
0,00
0,00
022
5,00
0,00
016
8,75
0,00
038
,511
30.4
%
Rice
mill
erun
its63
840
222
092
20,0
00,0
0075
,000
,000
150,
000,
000
112,
500,
000
59,6
1030
.9%
Oth
er fa
ctor
yun
its77
866
823
816
310
,000
,000
24,0
00,0
0040
,000
,000
30,0
00,0
0026
,679
30.2
%
Repa
ir sh
opun
its56
727
316
855
20,0
00,0
0075
,000
,000
150,
000,
000
112,
500,
000
45,3
0428
.3%
Rice
war
ehou
seun
its76
4756
515
,000
,000
50,0
00,0
0075
,000
,000
56,2
50,0
006,
148
22.9
%
War
ehou
seun
its45
728
927
310
615
,000
,000
36,0
00,0
0060
,000
,000
45,0
00,0
0027
,981
27.2
%
Stor
e/sh
opun
its5,
090
3,20
31,
643
634
20,0
00,0
0075
,000
,000
150,
000,
000
112,
500,
000
530,
956
19.5
%
Hou
sing
Perm
anen
t hou
seun
its79
,365
56,3
5041
,521
6,65
25,
760,
000
28,8
00,0
0057
,600
,000
43,2
00,0
003,
879,
570
18.5
%
Sem
i-per
man
ent h
ouse
units
52,4
2035
,028
20,4
314,
851
3,00
0,00
015
,000
,000
30,0
00,0
0022
,500
,000
1,17
1,46
516
.6%
Tem
pora
ry b
arra
cks
h-ho
lds
12,3
6912
,022
12,5
331,
049
480,
000
2,40
0,00
04,
800,
000
3,60
0,00
073
,321
25.7
%
Prod
uctiv
e La
nd
Rice
fi el
dsH
a66
,859
70,9
1711
,237
59,2
104,
376,
415
8,75
2,83
08,
752,
830
6,56
4,62
31,
107,
052
20.9
%
Oth
er fi
elds
Ha
125,
007
181,
282
26,8
1713
4,51
583
7,93
11,
396,
552
2,79
3,10
32,
094,
827
571,
716
20.0
%
Fish
or s
hrim
p po
nds
Ha
14,2
6343
,000
9,58
611
,174
3,00
0,00
07,
200,
000
12,0
00,0
009,
000,
000
474,
516
16.5
%
TOTA
LRp
11
,889
,401
mill
ion
$
1,32
1,04
4,57
0(1
$ =
Rp 9
,000
)
Not
e: U
nit c
ost f
or a
band
oned
= 7
5% o
f uni
t cos
t for
repl
ace.
US
REFERENCES
ADB. 2003. Infrastructure and Poverty Reduction: What is the connection? ERD Policy Briefs series No.13. Manila, Philippines.
BRR and International Partners. 2005. Aceh and Nias One Year after the Tsunami: The Recovery Eff ort and Way Forward. Banda Aceh.
Gannon, Collin and Zhi Liu. 1997. Poverty and Transport. World Bank.
Grootaert, C.D. and T. van Bastelaer (ed). 2002. Understanding and Measuring Social Capital: A Multidisciplinary Tool for Practitioners. World Bank.
Grootaert, C, D. Narayan, V.N. Jones, and M. Woolcock. 2004. Measuring Social Capital: An Integrated Questionnaire. World Bank.
ICG. 2006. Aceh: Now For the Hard Part, 29 March 2006; No. 44.
IOM/Harvard Medical School. 2006. Psychosocial Needs Assessment of Communities Aff ected by the Confl ict in the Districts of Pidie, Bireuen Aceh Utara; WHO Recommendations for Mental Health in Aceh, available at http://www.who.or.id/eng/contents/aceh/WHO_Recommendations_Mental_Health_Aceh.pdf
Kfw. 2004. Transport and Poverty: The direct contribution of transport infrastructures to poverty reduction.
Komnas Perempuan. 2006. As Victims, Also Survivors: A Collection of Women IDPs’ Experiences and Voices of Violence and Discrimination in Aceh.
Kwon, Eunkyung. 2000. Infrastructures Growth, and Poverty in Indonesia, A cross sectional Analysis. Asian Development Bank, Manila, Philippines.
Ministry of Home Aff airs. 2006. Kecamatan Development Program (KDP) Annual Report 2005. Jakarta.
Posko Aceh Dikdasmen. 2005. “Data Kondisi Guru Pra dan Pasca Gempa Provinsi Nangroe Aceh Darussalam dan Sumatera Utara (Nias dan Nias Selatan)”. 27 April 27 2005.
Sharpe, J. and I. Wall. 2007. “Mapping Media: Understanding Communication Environments in Aceh”. Indonesian Social Development Paper No. 9. Banda Aceh/Jakarta: World Bank/DSF.
Sharpe, J. , P. Barron and A. Sim. (forthcoming). “Promoting Peace: Public Outreach and ‘Socialization’ of the Peace Process in Post-Confl ict Aceh.” Banda Aceh: World Bank/DSF.
Subhan, Muhammad. 2005. “Proses Pendidikan Dasar Menengah di Provinsi Nanggroe Aceh Darussalam (NAD) Pasca Tsunami”. Implementation Coordination Unit (Satkorlak) NAD Province, Banda Aceh.
United Nation Information Management Services for Sumaterat (UNIMS). 2005. “An Aceh Education Data Pack”. Education Management Information System (EMis/ School Mapping), Ministry of National Education (MoNE), Republic of Indonesia, in cooperation with UNICEF. Jakarta.
World Bank. 2003. “Aceh Regional Public Expenditure Review: Human Development”. Education section. Unpublished joint paper: The World Bank, UNDP and USAID. Banda Aceh.

World Bank. 2005. Confl ict and Recovery in Aceh. World Bank Jakarta.
World Bank. 2006a. Aceh Public Expenditures Analysis: Spending for Reconstruction and Poverty Reduction. World Bank, Banda Aceh/Jakarta.
World Bank. 2006b. GAM Reintegration Needs Assessment: Enhancing Peace through Community-Level Development Programming. Banda Aceh: World Bank/DSF.