Embed Size (px)
Citation preview
Sveriges RiksbankEconomic ReviewPUBLISHED BY SVERIGES RIKSBANK
2005:2
S V E R I G E S R I K S B A N K

EconomicReview
2005:2

341 123Trycksak
SVERIGES RIKSBANK ECONOMIC REVIEW
is issued by Sveriges Riksbank four times a year.
PUBLISHER: LARS HEIKENSTEN
GOVERNOR OF SVERIGES RIKSBANK
EDITORS: STAFFAN VIOTTI, KERSTIN MITLID
AND THE COMMUNICATIONS SECRETARIAT
Sveriges Riksbank, SE-103 37 Stockholm, Sweden.
Telephone +46 8 787 00 00
The views expressed in signed articles are the
responsibility of the authors and are not to be
regarded as representing the view of the Riksbank
in the matters concerned.
Subscription to the journal and single copies
can be ordered from:
the website of the Riksbank
www.riksbank.se/Published/Publications/Economic Review,
E-mail [email protected],
Fax +46 8 787 0526, and
Communications secretariat
Sveriges Riksbank
SE-103 37 Stockholm.
Contents
■ Thoughts on how to develop the Riksbank’s monetary policy work 5
Lars HeikenstenThe article provides a fundamental discussion of the Riksbank’s monetary policy frame-
work, its monetary policy analysis and the possibilities to improve the material underpin-
ning the Bank’s decisions. The newly undertaken changes to the Riksbank’s methods are
described. It should, however, be stressed that this is not a question of changing the
Bank’s monetary policy strategy.
■ Basel II – the new framework for bank capital 22
Göran LindBasel II is the commonly used term for the new framework for capital requirements on
banks. It will supersede the present Capital Accord. In Sweden and other EU countries
the new framework will be implemented on 1 January 2007. The introduction of Basel II
will have noticeable effects, which is why there is a need to provide short guidance on
the main issues. The text focuses on overarching issues.
■ Monetary policy expectations and forward premia 39
Jan Alsterlind and Hans DillènMonetary policy expectations can be measured in various ways. One way is to measure
repo rate expectations. Another approach is to use the rates for treasury papers with
different maturities to calculate the forward interest rate curve. Due to the existence of
term premia, however, the short forward rates are not a direct reflection of expectations
about the short-term market rate; one needs to gauge the size of these premia. The dif-
ferent measures have their particular advantages and drawbacks, thus there is some-
thing to be said for combining the alternative measures.
■ The Riksbank’s management of interest rates – monetary policy
in practice 54
Annika OtzThe Riksbank’s interest rate management is the operational component of its monetary
policy process. Through its interest rate management, the Riksbank implements the
Executive Board’s monetary policy decisions by influencing the market’s shortest interest
rate, the overnight rate. The aim of this article, besides elucidating how monetary policy
is implemented in practice, is to further clarify the connection between the steering of
interest rates and the Riksbank’s payment system.
E C O N O M I C R E V I E W 2 / 2 0 0 5 3

■ Notices 65
■ Monetary policy calendar 67
■ Statistical appendix 69
■ Articles in earlier issues 78
E C O N O M I C R E V I E W 2 / 2 0 0 54
E C O N O M I C R E V I E W 2 / 2 0 0 5 5
■ Thoughts on how todevelop the Riksbank’smonetary policy work
BY LARS HEIKENSTENLars Heikensten is Governor of Sveriges Riksbank. This article is based on a speech he madeto the Economics Association on 22 February 2005.
I believe that most people would agree that inflation-targeting has
worked well. Since inflation-targeting was introduced, Sweden has gone
from being a high-inflation economy to an economy with low inflation
and stable wage increases, higher GDP growth and improved stability of
the economy. Nevertheless, there is always good reason to consider how
monetary policy can be developed and improved. To this end, I will dis-
cuss how the Riksbank’s monetary policy work has been developed. I
would like start with the Riksbanks’s monetary policy framework and its
monetary policy analysis. It will be followed by a description of the
methodological changes that we are now introducing. However, let me
already in the introduction stress that we are not contemplating changes
in the Bank’s monetary policy strategy.
The Riksbank’s inflation targeting policy today
AN EXPLICIT TARGET AND A CLEAR INTELLECTUAL FRAMEWORK
The Riksbank’s decision in 1993 to let its policy be guided by an inflation
target was a fairly new approach at the time.1 The idea had only really
been tried in three other countries before (New Zealand, Canada and the
United Kingdom). An inflation target has considerable advantages over
the methods of conducting monetary policy under a floating exchange
rate that have been tried before, e.g. a target for the growth rate of
money. Communication becomes simpler when the operational target
agrees with the final one. In addition, an explicit target facilitates a stabili-
sation of inflation expectations and enables policy to be evaluated. The
inflation target also has the advantage of capturing all important variables
1 See Heikensten, L., “Behind the Riksbank’s massive walls – establishing the inflation targeting policy1995–2003”, Sveriges Riksbank Economic Review 3, 2003, 45–80, for a more in-depth account of theanalytical framework for monetary policy and how it was developed up to 2003.
An inflation target hasconsiderableadvantages overmonetary policy undera floating exchangerate.
in one single variable. The inflation forecast is influenced not only by
interest rates but also by an assessment of credit developments, the
exchange rate and other factors of significance to demand.
The monetary policy objective laid down by Parliament is to maintain
price stability. The Riksbank has operationalised this objective in the shape
of a quantitative target for the inflation rate: the annual increase in the
consumer price index, CPI, should be 2 per cent. Around this target is a
tolerance band of ±1 percentage point, the purpose of which is both to
make clear that inflation from time to time will deviate from 2 per cent
and that the Riksbank’s ambition is to limit such deviations.
Since the effects of monetary policy are exerted with a certain lag the
Riksbank must adopt a forward-looking approach and base its interest
rate decisions on a forecast of future developments. Before each decision,
therefore, we prepare forecasts of factors such as inflation developments
and the business cycle over the next two years. Since December 2000 we
have often found reason to supplement the forecasts two years ahead
with a qualitative assessment of the longer term.
We have also worked with a simple policy rule: If inflation is forecast
to be above target one to two years ahead we normally raise the repo
rate, and vice versa if the forecast is below target. We have not followed
this rule mechanically, of course. That is exactly why the word “normally”
is always included in the formulation of the policy rule. It is a rule that on
average provides a good description of the Bank’s policy.
The policy rule was introduced in 1997, primarily due to a desire to
make policy even more transparent. The studies available at the time, all
of which are uncertain, indicated that interest rate adjustments tended to
have their largest impact on inflation in this time perspective. For my part
I also considered it important to focus the difficult forecasting work on the
time perspective that was deemed to be the most essential for monetary
policy and not become too involved in discussions about a more uncertain
future. This argument was strengthened in my opinion when the
Riksbank’s decision-making process became a collective undertaking.
With a less explicit rule and an entirely flexible time horizon our discus-
sions would have risked focusing – more than would have been desirable
– on the choice of time perspective, at the cost of a discussion about what
we actually know about the present and what we believe about develop-
ments over the coming two years.
E C O N O M I C R E V I E W 2 / 2 0 0 56
The Riksbank’s targetfor the inflation rate isan annual increase inthe CPI of 2 per cent±1 percentage point.
The Riksbank workswith a simple policy
rule: If inflation isforecast to be above
target one to two yearsahead we normally
raise the repo rate, andvice versa.
CONSIDERATION OF REAL DEVELOPMENTS
Allow me also to say a few words about the background to the clarifica-
tion of the principles for monetary policy that the Riksbank decided on at
the start of 1999. When the inflation target was established in 1993 we
understood even then that it could not be applied mechanically. That was
intimated, among other things, in a statement that the target was not to
begin to apply fully until 1995, in order thereby to cushion the effects of
the inflationary impulses that were predicted during 1993 and 1994 fol-
lowing the krona’s fall and the change in indirect taxes. There were also
several occasions during the latter half of the 1990s when policy was not
conducted slavishly on the basis of CPI forecasts. That was because it was
obvious that it could result in absurd consequences. For example, the rate
cuts in 1996 and 1997 had caused a decrease in the CPI via housing
costs. This could have resulted in the claim that interest rates should have
been lowered further, as a direct consequence of the fact that they had
only just been cut sharply. However, it was not until the turn of the year
1998/1999 that the Riksbank developed a coherent, explicit approach to
these issues. It had been preceded by a long discussion, where the main
idea had been to change from the CPI to a different index, in which the
components that fluctuated most due to temporary reasons would be
excluded. However, the more we discussed this the clearer it became that
there was no index that always provided the best picture of inflationary
pressures in the economy. For this reason we opted instead for an
approach whereby we, in connection with each decision, would make it
as clear as possible what considerations were guiding policy at the time.
This would enable our actions to be evaluated in a better way than
before.
The clarification states that monetary policy should normally be cen-
tred on bringing inflation to target one to two years ahead. It also identi-
fies two cases when the Riksbank may depart from this rule: transitory
effects on inflation and large deviations from the target. By transitory
effects is meant that some particular factors affect the forecast of inflation
one to two years ahead, but that the effects are expected to dissipate
without the need for any monetary policy action. By large deviations from
the target is meant that inflation has deviated so much from the target
that there may be reason to bring it back to target over a longer period
than the normal two-year horizon. A faster return to target could give rise
to undesired fluctuations in output and employment, for example.
E C O N O M I C R E V I E W 2 / 2 0 0 5 7
At the start of 1999 theRiksbank decided on aclarification of theprinciples for monetarypolicy.
The clarification statesthat monetary policyshould normally becentred on bringinginflation to target oneto two years ahead butmay in certain casesdepart from that rule.
In practice this approach has often led us to focus our monetary poli-
cy analysis and discussion on the inflation measure UND1X, as there is
generally always reason to disregard the effects on inflation of indirect
taxes and subsidies as well as of changes in interest rates. In some situa-
tions we have also decided to study inflation measures from which other
price changes have been excluded, e.g. in spring 2001, when the prices of
a number of goods such as electricity, heating oil, petrol, telecommunica-
tions and different kinds of food rose; and 2003, when it was primarily
fluctuations in electricity prices that had a very sharp impact on inflation
for a period.
INFLATION AND INFLATION EXPECTATIONS IN LINE WITH
THE TARGET
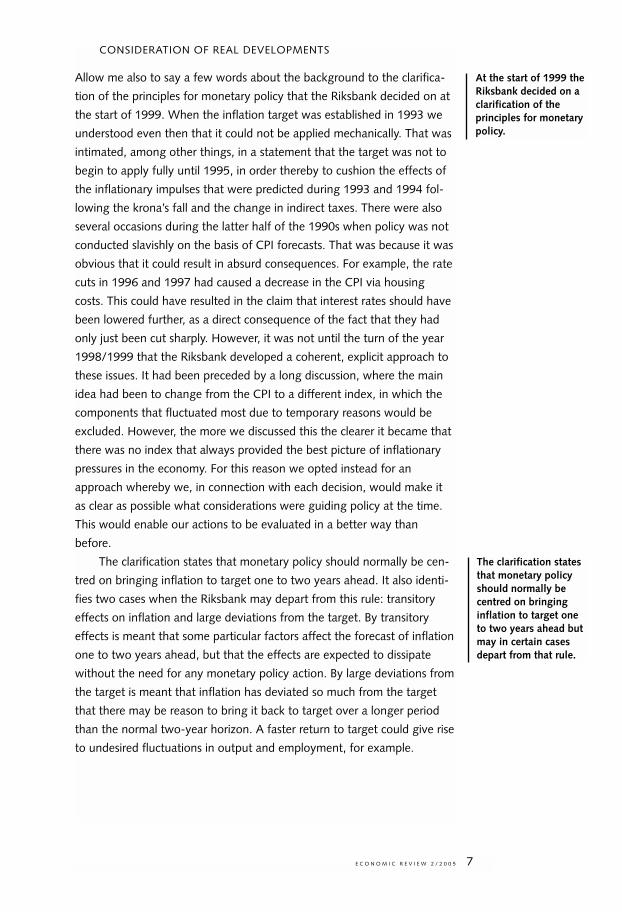
The result of the Bank’s policy can be illustrated in different ways. Let me
begin with the most obvious gauge, the inflation outcome. If we start
with the date that was set in the original decision – the beginning of 1995
– CPI inflation up to today has averaged 1.4 per cent. If we instead go
back to January 1993, when the new policy was announced, the same
figure is 1.7 per cent. If we focus on UND1X, the underlying measure that
guided policy especially in recent years but also during a large part of the
period 1996–1999, the corresponding figures are 1.8 and 2.0 per cent,
respectively (see Figure 1).
E C O N O M I C R E V I E W 2 / 2 0 0 58
This approach has oftenled us to focus our
monetary policyanalysis on the
inflation measureUND1X.
From the beginning of1995 up to today
the CPI inflation hasaveraged 1.4 per centand UND1X inflation
1.8 per cent.
Sources: Statistics Sweden and the Riksbank.
–1
0
1
2
3
4
5
6
1993 1995 1997 1999 2001 20031994 1996 1998 2000 2002 2004
Figure 1. Different measures of inflationAnnual percentage change
CPI UND1X
Whether this constitutes a good result or not is open to discussion,
of course. Allow me here to simply say that when the target was adopted,
and as an observer outside the Bank, I thought like many others that it
would be very difficult to bring inflation down sustainably to a level
around 2 per cent. What is particularly interesting in this context is that it
has proved possible to establish a regime with a low inflation rate, close
to the target, and to combine it with firm economic growth, which over
these years has averaged almost 3 per cent a year, compared with about
2 per cent during the two previous decades. If anything, economic
growth also appears to have become more stable since the inflation target
was introduced.2
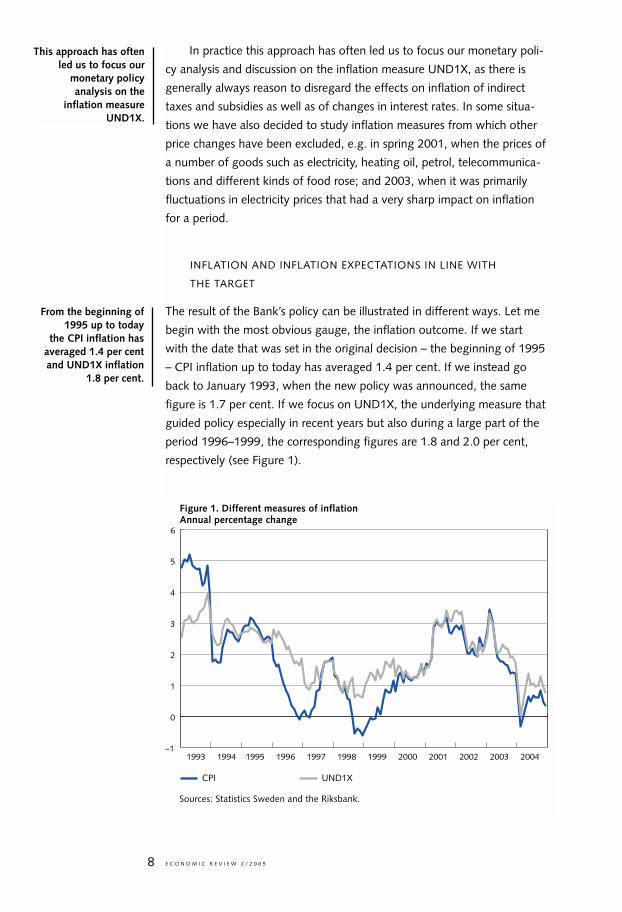
Another way to assess policy is to study whether we have acted in
the way that we say we will, i.e. followed our policy rule. Figure 2 shows
our interest rate adjustments on the vertical axis and our inflation fore-
casts’ deviation from the target two years ahead on the horizontal axis. As
we can see there is a clear relationship between forecast deviations from
target and our decisions, but there are also points in Figure 2 that deviate
from the average behaviour. These points chiefly relate to the forecasts
we produced when we chose not to counter the effects of energy prices
on inflation. So it seems that we have essentially acted in line with how
we have said we will normally act.
E C O N O M I C R E V I E W 2 / 2 0 0 5 9
2 The volatility, measured as the standard deviation of GDP growth, was 1.9 percentage points during theperiod 1970–1992. Since 1995 the corresponding standard deviation has been 1.3 percentage points.
It has proved possibleto establish a regimewith a low inflationrate and to combine itwith firm economicgrowth.
There is a clearrelationship betweenforecast deviationsfrom target and ourdecisions.
Source: The Riksbank.
Figure 2. Repo rate decisions and inflation forecasts, 1999-2004Per cent
– 0.50
–0.25
0.00
0.25
0.50
–0.6 – 0.4 – 0.2 0.0 0.2 0.4 0.6
IR03:2
IR00:4IR02:1
IR99:3IR00:1IR00:3IR01:2IR02:2
IR99:2IR00:2IR01:3IR04:3IR04:4IR01:4 IR99:4
IR01:1IR02:3IR03:4IR04:2IR03:3
IR99:1IR02:4IR03:1
IR04:1
Rep
o ra
te c
hang
e
Forecast deviation from inflation target
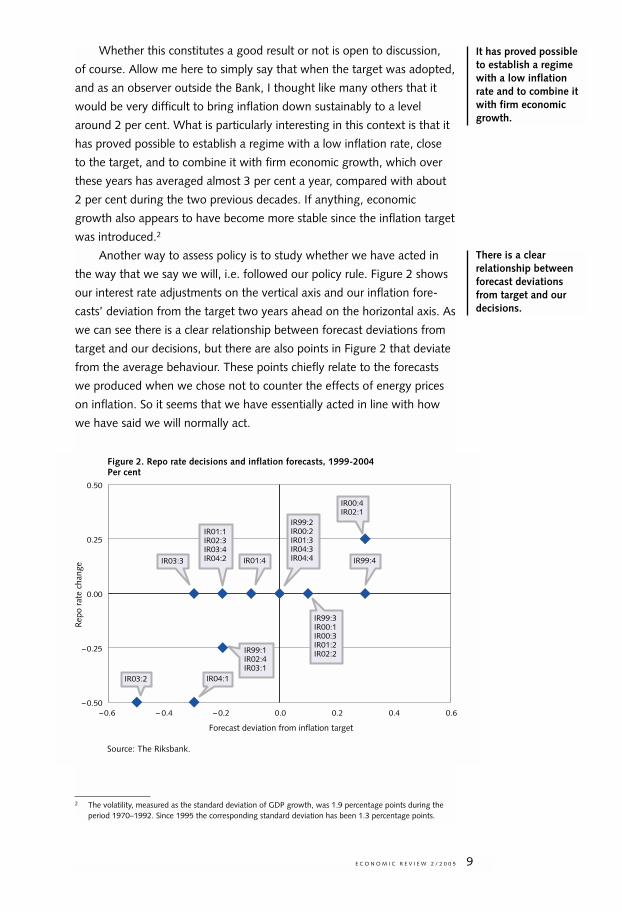
Yet another way to evaluate the result of our policy is to investigate
whether it is credible. The most important factor here is that inflation
expectations two years ahead and beyond have been firmly anchored to
our target since the regime was stabilised in 1997–1998. That conclusion
holds up fairly well regardless of the method used (see Figure 3).
Our ambition to be transparent derives, among other things, from a
desire to avoid unnecessary movements or unease in the financial mar-
kets. To illustrate our performance in this regard the Riksbank has con-
ducted a number of studies over the years, of which some have been
published.3 The picture we have received is that our policy has essentially
been intelligible and that it has not resulted in any sharp fluctuations in
financial prices that could have been avoided. International comparisons
as well as surveys and similar studies that have been carried out by exter-
nal analysts in the media, for example, confirm that the Bank’s monetary
policy communication has worked fairly well. However, this does not
mean – and I want to stress this – that there are no examples of episodes
when our communication in my opinion could have been better.
E C O N O M I C R E V I E W 2 / 2 0 0 510
3 See Andersson, M., Dillén, H. & Sellin, P., “The yield curve and the Riksbank’s signalling”, SverigesRiksbank Economic Review 3, 2002, 5–19.
Figure 3. Different agents’ expectations of inflation two years aheadPer cent
–1
0
1
2
3
4
1996 1997 1998 1999 2000 2001 2002 2003 2004
Source: Prospera.
Labour market organisations Purchasing managers Money market agents
Our ambition to betransparent derives,among other things,
from a desire to avoidunnecessary
movements or uneasein the financial
markets.
My conclusion is that the Bank’s policy in the past ten years has
worked well. Nonetheless there is of course every reason to reflect on
whether the analysis that we carry out and the framework that we follow
in our monetary policy work could be improved. That is the aim of the
rest of the article.
Some thoughts on how to develop the Riksbank’smonetary policy work
METHODOLOGICAL ASPECTS
Let me begin by addressing an issue that is of a rather technical or
methodological nature, but that, as we also shall see, has a number of
further consequences: the choice of repo rate on which the inflation fore-
cast is based.
Since 1996 the Riksbank’s Inflation Reports have presented overall
assessments of the economy and inflation that have served as a guide for
policy. From the fourth Report in 1997 these have included numerical, rel-
atively detailed forecasts. The published forecasts have consistently been
based on the assumption of an unchanged repo rate, above all because
forecasts arrived at in that way make it easy to motivate changes in poli-
cy. Before a monetary policy decision the Bank makes clear whether it
expects inflation to deviate from the target or not, given the current inter-
est rate level. If the forecast is above or below target it shows clearly that
there is reason to consider whether the repo rate needs to be changed.
The framework applied by the Riksbank has been the established
practice in inflation-targeting countries. But as early as the mid-1990s the
Reserve Bank of New Zealand, for example, opted for a different method,
publishing forecasts based on the interest rate path that they thought
gave the best target fulfilment. Our academic advisers have also repeat-
edly said that we should prepare forecasts based either on how the mar-
ket expects interest rates to evolve or that we, as in New Zealand, should
work out what interest rate path is consistent with reaching the inflation
target.4
Against this background we at the Riksbank have of course discussed
over the years the question of what importance we should attach to dif-
ferent interest rate assumptions in our internal work and when we publish
forecasts. When making decisions we have also had many other kinds of
model-based estimates and scenarios to go on than those published.
E C O N O M I C R E V I E W 2 / 2 0 0 5 11
4 See, for example, Svensson, L., “Monetary Policy and Real Stabilization” in Rethinking Stabilization Policy,A Symposium Sponsored by the Federal Reserve Bank of Kansas City, Jackson Hole, Wyoming, August29–31, 2002, 261–312.
My conclusion is thatthe Bank’s policy in thepast ten years hasworked well.
Since late 1997 theRiksbank has presentednumerical detailedforecasts of theeconomy and inflationbased on theassumption of anunchanged repo rate.
Moreover, from October 1999 until March 2003, our Inflation Report
contained boxes in which we published estimates based on a survey of
market expectations of the repo rate.5 The estimates were seldom given
any great significance in the monetary policy debate, however.
So what are the points of attaching greater importance to, and also
publishing forecasts based on, other interest rate assumptions than a con-
stant repo rate? There are chiefly two:
The first point has to do with comparability and the possibilities to
assess our forecasts. As things currently stand the Riksbank’s forecasts can
be difficult to compare with others, since other forecasters do not normal-
ly base their forecasts on an unchanged policy rate. This risks confusing
those that monitor the Riksbank and compare our forecasts with others
in, for example, the media. So it is possible that an interest rate assump-
tion that is more consistent with the market's view of how the interest
rate will develop could make our communication easier in certain situa-
tions. That is especially true of course if there is a large deviation between
the assumption of an unchanged repo rate and a more realistic assump-
tion of the rate's path. What is clear in any case is that ex post assess-
ments of forecasts of economic and inflation developments become gen-
erally easier if they are based on an assumption that better reflects the
interest rate expectations of market players.
The other point has to do with the fact that it becomes easier to pro-
duce consistent forecasts and scenarios. This is particularly important
when preparing estimates and developing scenarios in a somewhat
longer-term perspective than the usual two years, which can sometimes
be valuable in order, for example, to show the effect on inflation of
shocks that are judged to be temporary. The assumption of a constant
repo rate becomes generally more unrealistic the longer the forecast hori-
zon is extended. When the difference between the market’s view of the
future repo rate and the assumption of an unchanged repo rate has been
large, it has also been complicated to link assumptions about short-term
interest rates to a reasonable picture of, for instance, future long-term
rates, since long-term rates depend on expectations of how short-term
rates will evolve.
Up to the end of 2004 the Riksbank has chosen to highlight forecasts
based on an unchanged repo rate; this has basically worked well, not least
in terms of communication. Little by little, however, the Bank's monetary
policy work has evolved to the extent that there are now sufficient analyt-
ical resources with which to deepen the discussion in this area. The
E C O N O M I C R E V I E W 2 / 2 0 0 512
5 The only exceptions were Inflation Report 2001:1 and 2001:2 when no such estimates were published,since market expectations largely coincided with the assumption of an unchanged repo rate.
Publishing forecastsbased on other interest
rate assumptions hastwo advantages; the
first has to do withcomparability and thepossibilities to assess
our forecasts.
The second has to dowith the fact that it
becomes easier toproduce consistent
forecasts and scenarios.
Up till the end of 2004the Riksbank has
chosen to highlightforecasts based on anunchanged repo rate.
approach used so far has also, as the Bank’s analysis has developed, felt
like a bigger restriction in the internal work than before. The perceptions
of how the Riksbank acts seem also to have become so well established
that the communication risks of presenting forecasts with different inter-
est rate scenarios appear smaller today than before. I should also mention
here that a couple of other inflation-targeting countries with which we
have an extensive professional exchange – the UK and Norway – have
recently begun to attach much greater importance to forecasts based on
other assumptions than a constant policy rate and that this appears to
have worked well.
We are now able to make use of our development work. In the first
Report of this year we published forecasts based on implied forward rates,
a measure that may not be exactly the same as market expectations of
the future repo rate, due, among other things, to maturity premiums, but
that nevertheless are a reasonable approximation. It does not really mat-
ter that much whether one chooses to condition the forecast on implied
forward rates, surveys that attempt to give a more direct reading of mar-
ket expectations, or some other fairly reasonable assumption about future
monetary policy. We have chosen, however, to use implied forward rates,
since this is a relatively simple way to get a fairly reasonable idea of future
monetary policy. What is important to underline, though, is that the paths
we publish on the basis of implied forward rates should not be taken as a
sign of our own judgement of the future path of the repo rate. Experience
also shows that the situation often changes so that the actual repo rate
path turns out to be a different one than that implied by forward rates.
Allow me also to stress that we as usual presented a forecast on the
assumption of an unchanged repo rate for the sake of maintaining conti-
nuity and transparency in our analysis.
COMMUNICATION
One advantage of using implied forward rates is, as I just mentioned, that
it becomes more meaningful to produce forecasts over a longer time
frame. It also makes it easier to estimate and present scenarios that can
illustrate some of the problems that we face. Allow me to considerer two
different issues, both of which have come to the fore in recent years, and
thereby show how our developed methods can be used to improve pri-
marily our communication but also our own understanding of the prob-
lems we have to address.
E C O N O M I C R E V I E W 2 / 2 0 0 5 13
In the first Report ofthis year we publishedforecasts based onimplied forward rates.
Using implied forwardrates makes it moremeaningful to produceforecasts over a longertime frame and easierto present some of theproblems we face.
The first relates to situations when there have been particular shocks
to the inflation outlook that we have judged to be of a temporary nature.
Perhaps the best example of this is 2002 to 2003, when electricity prices
suddenly began to rise to record-highs as a result of lower water levels in
Sweden and Norway as well as colder weather than usual. There was rea-
son to believe that the electricity prices would fall back and that this
would then also have a marked impact on inflation. We thus followed the
strategy that we had established in our clarification from 1999, and
explained that policy should disregard the temporary effects of the fluctu-
ations in electricity prices. On this particular occasion it was appropriate to
calculate an alternative measure of inflation, UND1X excluding energy,
and this measure was therefore used as a basis for policy.
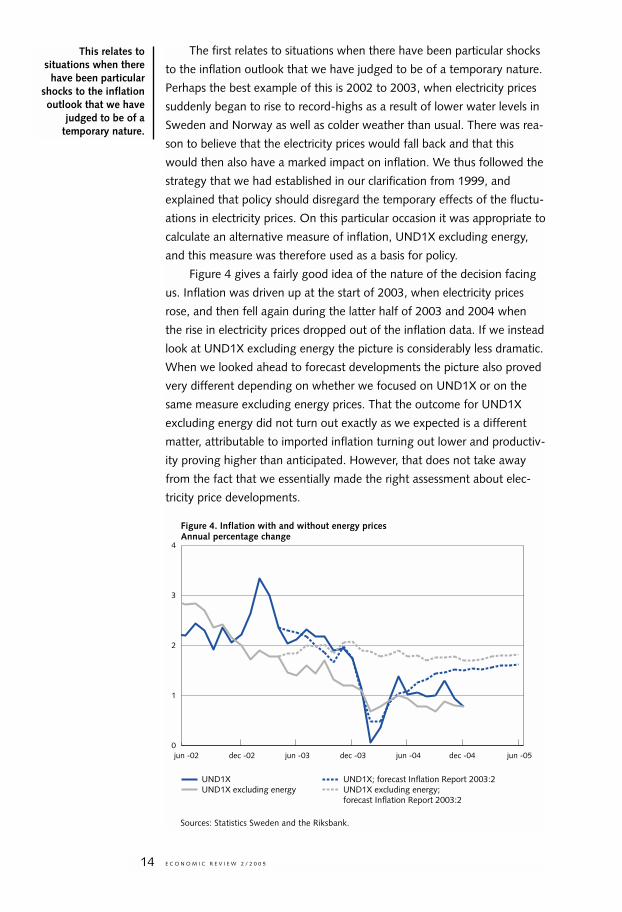
Figure 4 gives a fairly good idea of the nature of the decision facing
us. Inflation was driven up at the start of 2003, when electricity prices
rose, and then fell again during the latter half of 2003 and 2004 when
the rise in electricity prices dropped out of the inflation data. If we instead
look at UND1X excluding energy the picture is considerably less dramatic.
When we looked ahead to forecast developments the picture also proved
very different depending on whether we focused on UND1X or on the
same measure excluding energy prices. That the outcome for UND1X
excluding energy did not turn out exactly as we expected is a different
matter, attributable to imported inflation turning out lower and productiv-
ity proving higher than anticipated. However, that does not take away
from the fact that we essentially made the right assessment about elec-
tricity price developments.
E C O N O M I C R E V I E W 2 / 2 0 0 514
This relates tosituations when there
have been particularshocks to the inflationoutlook that we have
judged to be of atemporary nature.
Sources: Statistics Sweden and the Riksbank.
Figure 4. Inflation with and without energy pricesAnnual percentage change
0
1
2
3
4
jun -02 dec -02 jun -03 dec -03 jun -04 dec -04 jun -05
UND1X UND1X; forecast Inflation Report 2003:2UND1X excluding energy UND1X excluding energy; forecast Inflation Report 2003:2
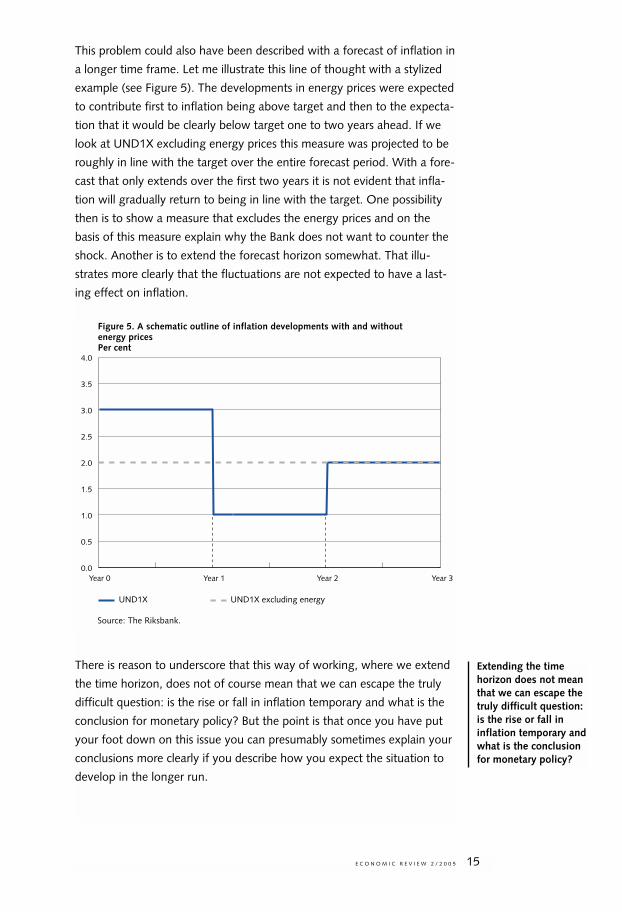
This problem could also have been described with a forecast of inflation in
a longer time frame. Let me illustrate this line of thought with a stylized
example (see Figure 5). The developments in energy prices were expected
to contribute first to inflation being above target and then to the expecta-
tion that it would be clearly below target one to two years ahead. If we
look at UND1X excluding energy prices this measure was projected to be
roughly in line with the target over the entire forecast period. With a fore-
cast that only extends over the first two years it is not evident that infla-
tion will gradually return to being in line with the target. One possibility
then is to show a measure that excludes the energy prices and on the
basis of this measure explain why the Bank does not want to counter the
shock. Another is to extend the forecast horizon somewhat. That illu-
strates more clearly that the fluctuations are not expected to have a last-
ing effect on inflation.
There is reason to underscore that this way of working, where we extend
the time horizon, does not of course mean that we can escape the truly
difficult question: is the rise or fall in inflation temporary and what is the
conclusion for monetary policy? But the point is that once you have put
your foot down on this issue you can presumably sometimes explain your
conclusions more clearly if you describe how you expect the situation to
develop in the longer run.
E C O N O M I C R E V I E W 2 / 2 0 0 5 15
Source: The Riksbank.
Figure 5. A schematic outline of inflation developments with and without energy pricesPer cent
0.0
0.5
1.0
1.5
2.0
2.5
3.0
3.5
4.0
UND1X UND1X excluding energy
Year 0 Year 1 Year 2 Year 3
Extending the timehorizon does not meanthat we can escape thetruly difficult question:is the rise or fall ininflation temporary andwhat is the conclusionfor monetary policy?
The other issue has to do with how alternative interest rate paths can
be used to illustrate the choices facing monetary policy. Let me use the
Riksbank’s interest rate decision in December 2004 as an example. On
that occasion we left the rate unchanged despite the fact that inflation
was forecast to be below our target of 2 per cent during the greater part
of the next two years. With inflation forecast to be so low during such a
large part of the forecast period it would have been possible to justify a
further rate cut. But there were also arguments in the opposite direction.
The most important was that demand was already growing markedly
faster than the economy was deemed capable of sustaining in the long
run. The vigorous growth was anticipated to continue and so it was not
weak demand that was causing the low inflation. Instead, the low infla-
tion was being caused by unexpectedly high productivity and unexpect-
edly low price increases for imported goods, something that in itself could
be expected to further stimulate growth in the period ahead. An addition-
al factor was that the repo rate was already at an unusually low level,
which could partly explain the increase in households’ debt burden and
the continued rise in housing prices. Even though debt levels were not
deemed to be a threat to financial stability, another rate cut could have
further fuelled house price inflation and indebtedness. That in turn could
have given rise to future problems when monetary policy eventually
would most likely have to be tightened. None of these arguments in
themselves were the key factor in deciding to leave the repo rate
unchanged, but taken together they indicated nevertheless the need for a
certain measure of caution.
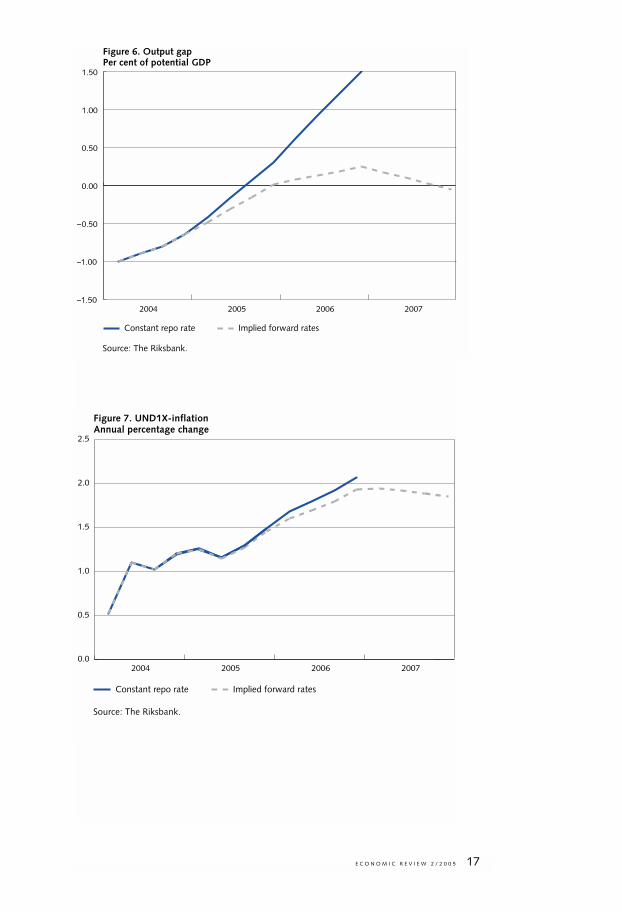
In this kind of situation it can be interesting to consider how different
future paths for the interest rate can be expected to affect both the real
economy and inflation. Figure 6 shows resource utilisation in two different
cases: one based on an unchanged repo rate and another on the implied
forward rates that applied during the autumn of 2004. At that time the
implied forward rates were indicating that the repo rate would be raised
very shortly and that it would then rise to levels around 4.5 per cent in
the longer term. Resource utilisation picks up in both cases, turning posi-
tive after about a year. But if the repo rate is raised according to the
implied forward rate at the time, resource utilisation drops, turning nega-
tive again during 2007, whereas it remains positive throughout the whole
period covered by the example if the rate is held constant. The situation
also differs somewhat between the two alternatives when it comes to
inflation (see Figure 7). With last autumn’s implied forward rate, inflation
never reaches the inflation target, while, with an unchanged repo rate, it
can be expected to overshoot the target just beyond the traditional two-
year horizon.
E C O N O M I C R E V I E W 2 / 2 0 0 516
Another issue has to dowith how alternative
interest rate paths canbe used to illustrate the
choices facingmonetary policy.
E C O N O M I C R E V I E W 2 / 2 0 0 5 17
Source: The Riksbank.
Figure 6. Output gapPer cent of potential GDP
–1.50
–1.00
–0.50
0.00
0.50
1.00
1.50
2004 2005 2006 2007
Constant repo rate Implied forward rates
Source: The Riksbank.
0.0
0.5
1.0
1.5
2.0
2.5
2004 2005 2006 2007
Figure 7. UND1X-inflationAnnual percentage change
Constant repo rate Implied forward rates
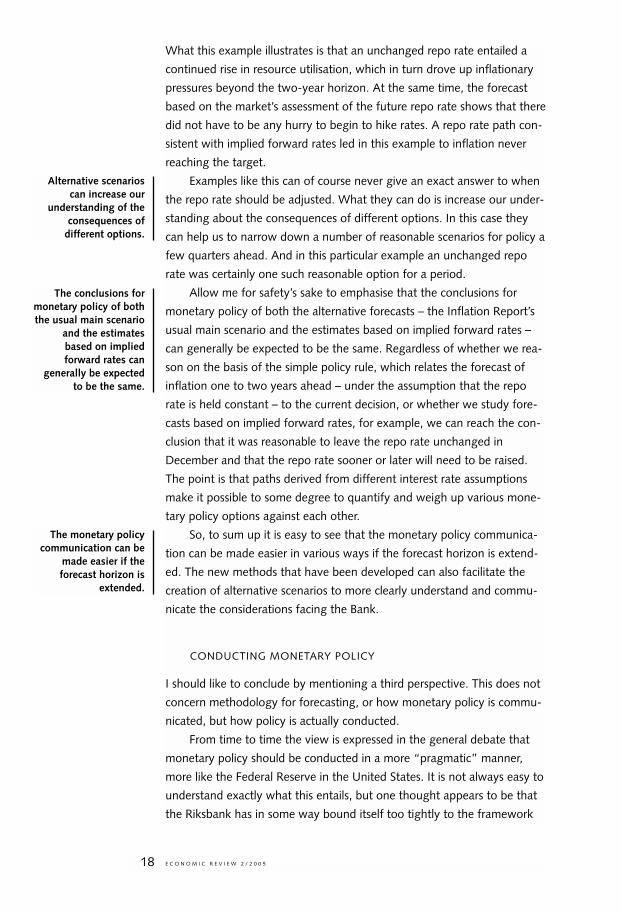
What this example illustrates is that an unchanged repo rate entailed a
continued rise in resource utilisation, which in turn drove up inflationary
pressures beyond the two-year horizon. At the same time, the forecast
based on the market’s assessment of the future repo rate shows that there
did not have to be any hurry to begin to hike rates. A repo rate path con-
sistent with implied forward rates led in this example to inflation never
reaching the target.
Examples like this can of course never give an exact answer to when
the repo rate should be adjusted. What they can do is increase our under-
standing about the consequences of different options. In this case they
can help us to narrow down a number of reasonable scenarios for policy a
few quarters ahead. And in this particular example an unchanged repo
rate was certainly one such reasonable option for a period.
Allow me for safety’s sake to emphasise that the conclusions for
monetary policy of both the alternative forecasts – the Inflation Report’s
usual main scenario and the estimates based on implied forward rates –
can generally be expected to be the same. Regardless of whether we rea-
son on the basis of the simple policy rule, which relates the forecast of
inflation one to two years ahead – under the assumption that the repo
rate is held constant – to the current decision, or whether we study fore-
casts based on implied forward rates, for example, we can reach the con-
clusion that it was reasonable to leave the repo rate unchanged in
December and that the repo rate sooner or later will need to be raised.
The point is that paths derived from different interest rate assumptions
make it possible to some degree to quantify and weigh up various mone-
tary policy options against each other.
So, to sum up it is easy to see that the monetary policy communica-
tion can be made easier in various ways if the forecast horizon is extend-
ed. The new methods that have been developed can also facilitate the
creation of alternative scenarios to more clearly understand and commu-
nicate the considerations facing the Bank.
CONDUCTING MONETARY POLICY
I should like to conclude by mentioning a third perspective. This does not
concern methodology for forecasting, or how monetary policy is commu-
nicated, but how policy is actually conducted.
From time to time the view is expressed in the general debate that
monetary policy should be conducted in a more “pragmatic” manner,
more like the Federal Reserve in the United States. It is not always easy to
understand exactly what this entails, but one thought appears to be that
the Riksbank has in some way bound itself too tightly to the framework
E C O N O M I C R E V I E W 2 / 2 0 0 518
The monetary policycommunication can be
made easier if theforecast horizon is
extended.
Alternative scenarioscan increase our
understanding of theconsequences of
different options.
The conclusions formonetary policy of boththe usual main scenario
and the estimatesbased on impliedforward rates can
generally be expectedto be the same.
that we and many other inflation-targeting countries abide by. Even
though, when looking back over the past ten years of monetary policy, I
cannot see any situation where we have been curbed by our analytical
framework and thereby made some tangible error in our policy, I believe
this issue is worth discussing.
Let me just take this opportunity to note that my impression is that
there has been a convergence process within the central bank world.
Countries that have conducted a more “pragmatic” policy like that in the
United States, which is less governed by clearly-described principles have
been working on making more information publicly available and estab-
lishing a clearer framework for their policy. At the same time, inflation-
targeting countries have been discussing in greater depth the various
problems that sometimes prevent policy from following the simplest prin-
ciples.
The Riksbank’s approach to new monetary policy issues or problems
is, as has been pointed out earlier, that we keep to a relatively well-speci-
fied framework. This is our starting point when considering the monetary
policy stance to be taken. If, for instance, we wish to deviate from the
usual policy rule, we can do so, but we then make the requirement of
ourselves that we can motivate this on the basis of the framework we use
and the flexibility we apply. It is difficult to see any reason to change this
system. In my opinion, it has served us well and forced us to improve our
thinking with regard to tackling the various problems that arise.
The new analysis and forecasting methods do not change the frame-
work for our monetary policy. We still have the same target, the same
ambition to achieve this target in two years and the same arguments for
taking real developments into account when deciding the details of the
policy. However, we now have new data on which to base our decisions
and new opportunities for communicating them.
Conclusion
Let me try to summarise my message here. I believe that most people
agree that inflation-targeting has worked well on the whole. We know
that since inflation-targeting was introduced, Sweden has gone from
being a high-inflation economy to an economy with low inflation and sta-
ble wage increases. The lower inflation rate has not led to weaker output
growth; GDP growth has on average been higher under the new regime.
It also appears that, if anything, the real stability of the economy has
improved.
E C O N O M I C R E V I E W 2 / 2 0 0 5 19
The Riksbank’sapproach to newmonetary policy issuesis to keep to a relativelywell-specified frame-work and motivatepossible deviations.
The new analysis andforecasting methods donot change theframework for ourmonetary policy.
Nevertheless, there is always good reason to consider how monetary
policy can be developed and improved. To this end, I have discussed how
the Riksbank’s monetary policy work can be developed.
This has included what could be termed technical improvements; for
instance, greater use of other assumptions than an unchanged repo rate
and an extended forecast horizon when producing and presenting data.
The advantage of using, for example, implied forward rates as a basis is
that they can often be a more realistic assumption than an unchanged
interest rate. This can in turn allow more and better alternative scenarios,
which can illustrate different aspects of monetary policy including the
consequences for inflation and resource utilisation over a longer time
horizon.
It has also included the Riksbank’s communication. Working with a
longer time horizon provides a better overview of the effects of tempo-
rary influences on inflation. Scenarios containing different assumptions
regarding the repo rate and using a longer time horizon can also con-
tribute to a clearer illustration of the considerations monetary policy has
to take into account with regard to balancing inflation against real eco-
nomic aspects. I have also discussed this.
The primary advantage of supplementing the assumption of an
unchanged repo rate with alternative interest rate paths and making
longer-term forecasts is that it makes it easier to explain the monetary
policy message. The simple policy rule – which involves interest rate deci-
sions being based on inflation normally being returned to the target one
to two years ahead – will continue to provide a good guide to our actions.
The guidelines in the clarification from 1999 will thus continue to form
the basis of our monetary policy. When the decisions need to take
account of other information than that significant for inflation one to two
years ahead, the new working method should make it easier to under-
stand how this is done.
Discussing an entire interest rate path can also create the conditions
for a more balanced discussion of monetary policy. This can involve when
we intend to change our monetary policy stance and how quickly we
should proceed. What will happen if we wait a while before changing the
interest rate? This type of consideration is probably more important than
detailed discussions about tenths of a percentage point in a forecast.
In conclusion, I have also mentioned the fundamental framework
that governs monetary policy. This is mainly because it is sometimes
claimed in the general debate that the Riksbank and other inflation-tar-
geting countries have bound themselves too tightly to a particular model
and that a more “pragmatic” policy system would give better results. My
conclusion is that our method of working is sufficiently flexible to manage
E C O N O M I C R E V I E W 2 / 2 0 0 520
Supplementing theassumption of an
unchanged repo ratewith alternative interest
rate paths and makinglonger-term forecasts
makes it easier toexplain the monetary
policy message.
Discussing an entireinterest rate path can
also create theconditions for a more
balanced discussion ofmonetary policy.
the necessary balance. As I see it, there are major advantages to a system
like ours, with a clear target, publication of the background data, a policy
rule, etc. It provides our activities with stability, both at the staff level and
in the Executive Board’s discussions and communications. We are also
forced to systematically examine all new ideas and issues that arise
against the framework we apply, which has proved an intellectually fruit-
ful exercise.
However, what I have tried to show here is that the methods we now
use can sometimes enable us to produce more interesting data for mone-
tary policy and to describe our considerations in a more pedagogical man-
ner. They can make it easier to demonstrate the flexibility of the inflation-
targeting regime we work with. Whether this will then have an impact on
the monetary policy debate in Sweden, and ultimately on the policy con-
ducted, is a very difficult question that only the future can answer. One
consolation for those who wish for an answer is that they can form an
opinion of how the Executive Board develops its view of monetary policy
through the Inflation Reports, speeches and the minutes of the monetary
policy meetings published.
E C O N O M I C R E V I E W 2 / 2 0 0 5 21
■ Basel II – the newframework for bank capital
BY GÖRAN LINDGöran Lind is adviser to the Governing Board of the Riksbank
Basel II is the commonly used term for the new framework for capital
requirements on banks.1 It will supersede the present Capital Accord,
agreed by the Basel Committee in 1988 and sometimes called Basel I. In
Sweden and other EU countries the new framework will be implemented
on 1 January 2007. The corresponding EU directive reflects Basel II, but
includes a number of amendments, some small, others larger.2
A lot of descriptive and analytical material has already been written
on the technical aspects of Basel II, such as on risk measurement meth-
ods. But since the introduction of Basel II will have noticeable effects
even for those of us who are not risk experts, there is a need to provide
short and non-technical guidance on the main issues. That is the aim of
this article. Hence, the text focuses on overarching issues rather than
technicalities.
Why change from Basel I to Basel II?
In most countries, the law requires banks to hold a certain amount of cap-
ital, primarily in the forms of share capital and some quasi-capital debt
instruments. The history of capital requirements shows a step-wise devel-
opment towards increasingly sophisticated approaches.
The traditional requirement is that banks must hold a minimum
amount of capital,3 both to provide a cushion against losses and to disci-
pline the bank’s owners. Some countries also apply a leverage capital
ratio of, for instance, 4 per cent of a bank’s total assets as a backstop to
ensure that the amount of capital stays in line with the size of the balance
E C O N O M I C R E V I E W 2 / 2 0 0 522
1 The full name is “International Convergence of Capital Measurement and Capital Standards – a RevisedFramework”; June 2004, the Basel Committee on Banking Supervision, BIS.
2 The EU Directive is called “Re-casting Directive 2000/12/EC of the European Parliament and of the Councilof 20 March 2000 relating to the taking up and pursuit of the business of credit institutions and Councildirective 93/6/EEC of 15 March 1993 on the capital adequacy of investment firms and credit institutions”.It is sometimes called the Capital Requirements Directive (CRD), or alternatively, CAD III. While Basel II ismainly intended to apply only to internationally active banks, CAD III will cover all banks as well as othercredit institutions and securities firms in EU member states.
3 For instance, a bank established in the EU must have a minimum capital of 5 million euro.
sheet and thus with the risks. Risk-based capital ratios of at least 8 per
cent for credit risk were formalised in the 1988 Capital Accord, and capital
requirements for market risks were added in 1996. This is sometimes
called the Basel Capital Accord or Basel I, for short.
With a risk-based ratio, different categories of borrower (in the case
of credit risk) are assigned different risk weights, set in relation to the like-
lihood of the borrower not fulfilling his loan obligation. The capital
requirement is then calculated as the amount of the loan multiplied by the
risk weight times 8 per cent.4 The Capital Accord is based on a relatively
small selection of weights. The same risk weight is applied to all loans to
companies and to individuals, with one exception – for loans to individu-
als collateralised by their own house or apartment there is a lower require-
ment. Obviously, such a crude categorisation does not reflect the risk that
a particular borrower actually poses for the bank. A highly creditworthy
company, say Volvo, would in practice represent a much smaller risk than,
say, a recently started restaurant.
Since the Capital Accord was adopted, there have been significant
developments in the theory and practice of measuring and managing
risks. Moreover, new financial instruments, such as credit derivatives, have
improved banks’ ability to handle and mitigate risks. In recent years there
has also been a rapid development towards larger and more complex
banking groups with broader operations, both across the financial sector
and across countries. The difference between internationally active large
banks and local banks has grown.
Thus, a thoroughly revised framework for capital requirements was
called for. In order to keep pace with developments, such a framework
should contain:
• A closer relationship between the risk and the capital required in each
case. Referring to the example mentioned above, a loan to Volvo
should have a much lower capital requirement than a loan to the
restaurant. Since the costs to the bank for acquiring the capital5
should, in principle, be covered by the interest paid on the loan, the
lower capital requirement would translate into a lower borrowing
rate for Volvo.
• Different rules for banks that are more as opposed to less advanced
in the management of risk and capital. Banks with less complex risks
E C O N O M I C R E V I E W 2 / 2 0 0 5 23
4 One example: an unsecured 500 million krona loan to a company would carry a risk weight of 100 per centunder the Capital Accord. The capital requirement would thus be: 500 million x 100 % x 8 % = 40 million.Assuming that the annual cost of share capital is 15 per cent, the capital requirement would then cost 6million krona a year.
5 The annual cost for this is generally estimated to be around 15 per cent. Investors in share capital demanda high yield to cover the presumed high volatility in share values plus the risk of total loss.
There have beensignificantdevelopments in themeasurement andmanagement of risksand new financialinstruments haveimproved banks’ abilityto mitigate risks.
Thus a revisedframework for capitalrequirements wascalled for.
may use simpler rules. More advanced banks will be allowed to use
more advanced alternatives, which put heavier burdens on them but
lead to a closer relationship between the risk and the capital require-
ment and are thus more in line with the bank’s own estimates of risk.
• Explicit capital requirements also for operational risk, in addition to
credit and market risks. Operational risk factors are important for
banks and should be taken into account in a revised capital frame-
work.
• A broader framework that includes both quantitative and qualitative
requirements on banks as well as requirements for public disclosure
of some bank information. Such a broader approach to supervision
would act as a basis for the monitoring of banks’ risk management
by banks, supervisory agencies and the general public.
Thus, there are several reasons for replacing the current capital rules by
Basel II. The following is overarching and therefore perhaps the most
important.
To be effective, banking regulation cannot conflict unduly with the
way banks actually conduct their business. Regulations that are too stand-
ardised or do not reflect realities will be an expensive hindrance because
banks then need to operate double systems – one to provide the supervis-
ors with the requisite information and the other for the bank’s own man-
agement, for which the supervisory requirements have become inade-
quate. Banking instruments and operations have changed significantly
since the inception of the present capital requirements, so an updated
regulation is needed. Besides, the supervisors need a more flexible system
to improve their capability to supervise banks with markedly different
structures. In the new world of sophisticated banks and complex banking
operations, supervisors have encountered growing difficulties with tradi-
tional, often insufficiently penetrating, methods of supervision.
Basel II reflects developments already underway
As a matter of fact, many banks have already implemented important
parts of Basel II on their own initiative, in particular by improving systems
for the management, measurement and mitigation of risks. Some banks
have actually developed their risk measurement and management sys-
tems further than hitherto required by the supervisors because they see
the new systems as useful instruments for better decision-making and
hence lower losses. Under Basel II, internal bank systems that are found
adequate by the supervisors may also be used to calculate a bank’s statu-
tory capital requirements. The possibility of reducing capital requirements
E C O N O M I C R E V I E W 2 / 2 0 0 524
As banking instrumentsand operations have
changed significantly,the regulations need to
be updated.
will be an additional incentive for the banks to optimise methods, portfo-
lios and risk-taking.
Many features of Basel II have already been incorporated in super-
visory methods. For instance, the concept of “risk-based supervision”,
whereby supervisors focus on the main risks in the banking system (often
the larger banks and problem banks) and on the main risk-drivers within
each bank, is being increasingly adopted by supervisors.
Hence, Basel II could be seen as a framework that formalises some
practices which the most advanced banks and supervisors are already
using. But Basel II also incorporates a number of areas in which further
development is warranted, for instance the measurement and manage-
ment of operational risk. In such cases, Basel II could be seen as an instru-
ment for furthering development.
Why do banks need to be regulated?
Before discussing the Basel II framework in more detail, let us consider
the basic question of the rationale for regulating and supervising banks in
the first place. Would not banks develop more quickly and provide better
and cheaper services if they did not have to carry the burden of resource-
consuming, restrictive and costly regulations? Are there legitimate reasons
for regulating and supervising banks more than other financial and non-
financial institutions?
The answer lies in the banks’ multiple roles, which are highly impor-
tant and beneficial for the economy as a whole:
• They provide payment services.
• They intermediate capital by providing a range of savings instru-
ments and extending various forms of credit to borrowers.
• They handle and transform risks.
Some of these functions are by their very nature particularly vulnerable to
disturbances. For instance, loans usually have a longer duration than
deposits. Hence, in certain situations a bank may lose a large proportion
of its deposits rather quickly while its loans remain outstanding. Such a
situation may impose a severe liquidity shortage on the bank, which may
ultimately collapse. Another example: The daily turnover of payments
between the Swedish banks comprises very large amounts. A disturbance
in the payment system – whether of a technical nature or due to one
bank’s failure to honour its obligations to the system on time – can quickly
spread to other banks and even destabilise the overall financial system.
E C O N O M I C R E V I E W 2 / 2 0 0 5 25
Supervisors areincreasingly adoptingthe concept of “risk-based supervision”.
Hence, Basel II could beseen as a frameworkthat formalises someexisting practices.
Banks have multipleroles.
Some bankingfunctions areparticularly vulnerable.
In some of the functions, banks have a monopoly or dominant role,
with few alternatives. Only banks may receive deposits that are protected
by the Deposit Guarantee Scheme. Banks have a dominant role in lending
to small and medium-sized companies. Banks and their affiliates have a
dominant role in the payments system. Thus, in many cases a bank cus-
tomer has just a limited possibility of obtaining similar services from non-
banks.
These three factors – that certain banking activities are intrinsically
vulnerable, that even minor disturbances can threaten overall financial
stability through contagion, and that the banks are the dominant pro-
viders of some key services – form the rationale for regulating banks and
for doing so partly differently from other companies. That being said, all
regulations should ideally pass a cost/benefit test. The total benefit to
society of any regulation must exceed its total cost to society. This in-
cludes direct financial as well as other costs and benefits. A substantial
potential cost to society is the expense of having to deal with a crisis in
the financial system. Since an individual bank has no commercial reason
to take this systemic cost into account, society has to ensure, e.g. through
regulation and monitoring, that banks do not behave in ways that unduly
increases the systemic risk.
Reasons for using capital requirements as aregulatory tool
There are many good reasons why banks, as well as non-banks and non-
financial companies, should maintain an adequate risk-related amount of
capital. However, the “special nature” of banks makes it more important
to have regulatory requirements for the capital in banks than in other com-
panies. Capital is needed:
• To reduce the risk that volatility in bank earnings, e.g., stemming
from macroeconomic developments, leads to bankruptcy.
• Because in the event of a bank failure, equity capital is hit first, there-
by reducing the residual cost to other parties, including tax-payers.
• To encourage prudence among bank owners because more of their
own capital is at stake.
• Because, although capital requirements should not prevent banks
from taking risks, the cost of capital for covering risks will lead to a
more risk-aligned pricing of risks and to a considered strategy for
taking risks.
E C O N O M I C R E V I E W 2 / 2 0 0 526
Banks have a dominantrole in some financial
functions.
The importance of theregulatory requirements
lies in the “specialnature” of banks.
• Because capital requirements will promote the development of com-
mon, “integrated”, management processes and policies within a
bank group – across entities, countries, risks, and operations.
Normally, large and internationally active banks do more than comply
with the minimum 8 per cent level for capital adequacy. The banks them-
selves, their market counterparties and rating agencies have found it pru-
dent for such banks to maintain capital ratios at 10 per cent or more. This
will certainly continue to be the case under Basel II.
The structure of Basel II
Given the discussion above, we can draw some conclusions about the
desired structure and content of a revised framework for capital require-
ments:
• It should link capital requirements closely to actual risks.
• It should encompass all material risks to banks.
• It should reflect the different operations, organisations and degrees
of “sophistication” of different banks.
• It should provide incentives for in-bank developments that lead to
“better management” and thus reduce the risk of bank failures. But
it should also provide enhanced powers for supervisors to act against
identified weaknesses in the management of banks.
To satisfy these demands, Basel II has become multifaceted.
It is built on three pillars:
• Pillar 1 encompasses the capital requirements for credit risk, market
risk and operational risk.
• Pillar 2 contains the “supervisory review process”, which outlines the
demands on banks’ management of risks and capital and defines the
roles and powers of the supervisors.
• Pillar 3 sets out demands on banks for public disclosures. These shall
include quantitative as well as qualitative information, in particular
about a bank’s management of risks and capital.
Under pillar 1, banks may choose from different alternatives, depending
on their “level of advancement”. For credit risk, Standardised Approach is
the simplest level,6 rather like the present Basel I but containing more risk
weights, all fixed by the authorities. Banks may increase the range of risk
E C O N O M I C R E V I E W 2 / 2 0 0 5 27
6 In fact, there is even a simplified version of the Standardised Approach, intended for little advancedbanking systems. In this version there are fewer alternatives, e.g. for risk weights, than in the StandardisedApproach.
Banks may choose fromdifferent alternativesdepending on their“level ofadvancement”.
weights set by the supervisors by using credit risk assessments from
acknowledged rating agencies, such as Moody’s, Standard & Poor’s, Fitch
and so on.7 The next level in pillar 1 is called “Internal Ratings Based”
(Approach). In the IRB, the risk weights and thus the capital requirements
are partly based on the individual bank’s internal estimates. There is also
an advanced form of IRB, in which an even larger part of the capital re-
quirements is influenced by the banks’ own calculations.
For market risks, there is also a simple and an advanced alternative to
choose from. The treatment of market risk has not changed from the pres-
ent Capital Accord to Basel II.
For operational risk, there are three alternatives, called Basic Indicator
Approach, Standardised Approach and Advanced Measurement Appro-
aches, AMA.
In every case banks have an incentive to move to a more advanced
level since the required capital will then be more closely aligned with the
bank’s actual risk. In most situations this implies a lower capital require-
ment. However, when a bank opts for a more advanced alternative it has
to prove that it has accurate and well-tested systems for its management,
in particular for the management of risks and capital. Thus, a lower capital
requirement for such banks would be matched by a lower risk of bank
failure; in other words, this is fully in line with the objective of Basel II –
that capital requirements reflect actual risks.
Basel II is more than capital requirements –pillars 2 and 3
One of the major achievements in relation to Basel I, which was purely
quantitative, is that Basel II also includes comprehensive rules for (i)
banks’ management of risks and capital, encompassing all material risks,
not just those covered by the capital requirements under pillar 1, (ii)
supervisors, who may demand additional capital or restrict operations in
individual banks, and (iii) public disclosures of bank information. Basel II is
intended to exert pressure so that the whole bank is managed in an
integrated fashion, with good corporate governance. It also forces
supervisors to develop processes to understand and monitor in depth how
each bank actually operates. Some of these important “non-quantitative”
components of Basel II are discussed below.
E C O N O M I C R E V I E W 2 / 2 0 0 528
7 For instance, in the absence of rating a non-financial company is assigned a risk weight of 100 per cent;if a rating exists, however, the risk weight for the same company could be 20, 50, 100, or 150 per cent,depending on the rating class.
Basel II includes rulesfor banks’ management
of risks and capital,supervisors, and public
disclosuresof information.

STRONGER CORPORATE GOVERNANCE
Basel II calls for stronger corporate governance of banks. Banks’ Boards of
Directors must set the overall strategies for risks and capital, besides
deciding which systems for risk management and controls are to be used
in the bank. In addition, they must regularly monitor the bank’s compli-
ance with these systems and strategies. The CEO and other members of
the management team are to apply the systems in the daily operations of
the whole banking group and must report regularly to the Board – in par-
ticular when the rules have been violated. The bank’s governance is sup-
ported by a strong internal audit function, which monitors not only com-
pliance but also the validity of systems and controls. The audit function
should report directly to the Board to reduce the risk of it being influenced
by the management it monitors.
Is stronger governance in banks a good thing? Yes, indeed. Many
bank failures stem from lax or unwitting bank directors who gave the
managers and operational experts too much leeway without taking an
overall view on strategies and risks. Nick Leeson claims to have convinced
Board members in Barings Bank that he had found a low-risk source of
revenue in the derivatives market, which would provide high and sus-
tained profits to the bank each year. Any member of a bank Board ought
to know that risk and yield are closely linked.
BROADER ROLE FOR SUPERVISORS
Under Basel II the role of supervisors will be broader than at present.
Among other things, they will:
• Endorse and validate individual banks’ systems for risk, capital and
internal audit.
• Check the actual application of these systems throughout the bank.
• Assess all material risks including concentration, and interest rate risk
in the banking book.
• Assess risk in relation to available capital, and take corrective action
when needed, including requiring additional capital for individual
banks.
The revised and augmented role for supervisors under Basel II is a neces-
sary development for several reasons. The increasing complexity of bank-
ing operations, instruments and organisations means that traditional
supervision, such as focussing on individual transactions, is no longer
effective, or indeed, feasible. Also, developments in financial instruments
E C O N O M I C R E V I E W 2 / 2 0 0 5 29
Boards of Directorsmust set overallstrategies, decidesystems for riskmanagement andcontrol and regularlycheck the bank’scompliance with thesesystems and strategies.
The increasingcomplexity of bankingoperations makes theaugmented role ofsupervisors necessary.
and markets have made it possible for banks to shift their risks as well as
their assets and liabilities more rapidly than before. Even if they were to
receive somewhat enlarged resources, supervisors would not be able to
monitor the banks with a commensurate frequency.
The Basel II approach to this is three-pronged: (i) giving more re-
sponsibility to banks themselves to strengthen internal corporate gover-
nance; (ii) giving more powers to supervisors to ensure that banks estab-
lish robust management systems and operate in accordance with the
rules, not only as they are written but also in line with their spirit; and
(iii) giving external stakeholders increased means to analyse banks.
Through this approach, it is hoped, supervisory work will be facilitated and
supported by the bank’s internal monitoring as well as by the monitoring
conducted by external stakeholders. Taken together, this should mean that
each bank’s behaviour is scrutinised on a broad and frequent basis.
MARKET DISCIPLINE THROUGH PUBLIC DISCLOSURES
Academicians have been advocating for a long time that more of the
supervision of banks should be left to market participants. Their reasoning
is that market participants have an interest in identifying, analysing and
publicising findings of positive or negative developments in a bank. That
should elicit a reaction from various parties, for instance so that depositors
start withdrawing their money. The mere risk of such repercussions would
– the argument goes – lead bank managers to act with more forethought.
A repeated proposal from academe is that banks should be obliged to
issue debt instruments that are priced and traded on a liquid public mar-
ket. Shifts in the market perception of a bank would immediately result in
movements in the price of the debt instrument and thus signal the condi-
tion of the bank.
Basel II does not include this idea of issuing debt, but seeks to
increase market discipline by requiring banks to publish more substantive
and more frequent information than today about their risks, capital and
other aspects. Banks must not only publish the actual numbers but also
explain their strategies, management methods and governance structures.
The only secrets a bank may keep in this regard are those which are close
to the bank’s internal business strategy.
Supporting market discipline by information disclosures is an impor-
tant part of Basel II. At present, rules and practices on bank disclosures
vary greatly between banks and also between countries. Many countries’
supervisors demand far fewer and less detailed disclosures from banks
than is presently the case in Sweden and even here requirements fall short
of the desired degree of transparency. Whether or not more disclosures
E C O N O M I C R E V I E W 2 / 2 0 0 530
Basel II seeks toincrease market
discipline by requiringbanks to publish more
substantive andfrequent information.
will in fact lead to better market discipline depends to a very high degree
on the recipients of the information. Investors, analysts and others must
be prepared to scrutinise it carefully and publish their unbiased views.
Banks’ counterparties should be ready to react to it. The disclosure instru-
ment will then influence the banks’ behaviour as intended. Successfully
implemented, this would provide a highly useful complement to the regu-
lar supervision, since, unlike investors and analysts, the authorities neither
can nor should be involved in the operations of banks on an ongoing
basis.
Challenges when drafting the new rules
In drafting the Basel II framework, the Basel Committee faced the dilem-
ma that while similar rules should apply to all countries and all banks to
ensure fair competition, countries and banks also need some differentia-
tion for local circumstances. A solution was found by making the Basel II
framework apply the same basic rules to all but with a large number of
“options” whereby individual countries can adapt their own rules if they
can show they have good reasons for doing so. For instance, if a country
can demonstrate that the losses its banks have suffered from real estate
loans are much smaller than those of other countries’ banks, then it will
be allowed to use an “option” of reduced risk weights for real estate
loans.
Another dilemma when constructing Basel II was that banks differ.
Imagine a small local savings bank with simple deposit and lending opera-
tions on the one hand and an international mega bank with a global pres-
ence and some extremely sophisticated financial services on the other.
How can you construct regulations that cope with the complexity of the
latter without placing an unreasonable burden on the former? That is why
Basel II provides different layers of complexity from which banks can
choose. Advanced and large banks are expected, by the market and by
supervisors, to apply the advanced risk management methods. A bank
with non-complex operations may use a simple and less expensive sys-
tem.
A general challenge in rule-making is to produce something that
does not rapidly become obsolete on account of rapid developments in
the financial field. Basel II is drafted flexibly so that future changes, such
as new financial instruments, new activities and so on, can be incorporat-
ed without having to change the basic structure. Basel II aims to give
banks a high degree of freedom in the way they operate or may operate
in the future, but has some built-in restraints to ensure at least a basic lev-
el of capital, such as minimum “floors” on the capital requirements even
E C O N O M I C R E V I E W 2 / 2 0 0 5 31
The Basel II frameworkapplies the same basicrules to all, but with alarge number of“options”.
Banks can choose fromdifferent layers ofcomplexity.
Basel II is draftedflexibly to allow forfuture changes.
when a bank’s temporary situation could be seen to justify an even lower
level of capital.
In all three examples above, the solution included providing more
flexibility in the rules and for the banks. Note, however, that this ap-
proach does have side-effects. For instance, a flexible application of rules
may distort preconditions for fair competition on a level playing field. Rule
flexibility may also lead to “supervisory arbitrage”, whereby banks seek
to identify instruments, operations or jurisdictions where the rules are less
strict. Such arbitrage towards less regulated areas may increase banks’
vulnerability to destabilising incidents.
Controversial issues
In the public debate, various parties have criticised aspects of Basel II.
These criticisms differ in kinds. Some focus on the macroeconomic side
effects, others on the structural effects, and others again on issues of
competition and fairness. A number of the most hotly debated issues are
summarised below.
• Procyclicality: Larger risk weights and higher capital requirements
may restrict bank lending when it is most needed in cyclical down-
turns and lead to excessive lending at cyclical peaks. That could exa-
cerbate cyclical swings. When constructing Basel II there was a need
to balance this cyclical effect with the need to create rules that are
truly risk-sensitive. A mix of partial solutions was adopted, such as
requiring banks to assess the creditworthiness of borrowers over a
period that includes good times as well as cyclical downturns. Banks
would then hold a cushion of extra capital in good times. It may also
be that the fears of large swings in lending are exaggerated since it is
in the interest of banks to extend loans to creditworthy borrowers
even in macroeconomic downturns. That being said, the structure of
Basel II itself – which aims for a closer link between capital require-
ments and actual risks in lending – will indeed tend to lead to more
procyclicality in lending than the present Basel Capital Accord. That is
one of the issues on which a balance must be struck between finan-
cial system stability and other macroeconomic aims.
• Loans to small and medium-sized companies (SMEs): Such loans
may in many cases look more risky, for instance due to the limited
size of such enterprises’ capital. However, in many countries, the
development of SMEs is important for overall economic growth.
SMEs and politicians have expressed concern that high capital
E C O N O M I C R E V I E W 2 / 2 0 0 532
requirements in Basel II might reduce lending to SMEs and also make
it more expensive. The Basel Committee considered the issue further
and noted that the risk from lending to SMEs was lower in practice
than indicated by share capital and tangible assets. For instance, the
owners, who in many cases are also the managers, of SMEs usually
assume an added financial responsibility for their firms and are often
prepared to supply other funds when needed to prevent a payment
failure. Another aspect is that lending to a large number of fairly
small SMEs implies a high degree of diversification in a bank’s portfo-
lio and this reduces the risk of major total losses to the bank. These
and other considerations induced the Basel Committee to reduce the
risk weights and thus the capital requirements on loans to SMEs
under certain conditions. As in the case of procyclicality, in its treat-
ment of the SMEs, Basel II had to strike a balance between a more
technically-oriented risk weight assessment and the overarching
macroeconomic aspects.
• Large banks: Some have argued that Basel II will favour large banks8
because they are more likely to adopt the advanced risk management
methods and thus benefit from lower capital requirements. It is prob-
ably correct that more large than smaller banks will adopt the ad-
vanced methods. Huge fixed costs are involved in setting up ad-
vanced risk management systems, while the operational costs are
limited. Hence, once a bank has invested in a sophisticated system, it
can make substantial savings in costs for capital requirements and
these savings might be used to buy small banks. But that need not
necessarily happen. Small banks compete with much more than the
price for their services, for instance with their local presence and
knowledge about customers. It is also evident in practice that owners
of many small banks, such as savings banks and cooperative banks,
require a lower yield on their capital than the owners of listed banks.
• Non-banks: “Basel II favours non-banks”. The notion here is that
institutions which avoid capital requirements will be in a favourable
position to compete with the banks. My view is that Basel II will
rather improve the competitive situation of banks in certain opera-
tions since capital requirements will be more closely related to risk.
For instance, banks may be able to regain some lending to highly
creditworthy companies, which earlier went to the securities markets
because the capital requirements were too high in relation to the
E C O N O M I C R E V I E W 2 / 2 0 0 5 33
8 To be more precise, this discussion is about complex versus non-complex banks, rather than large versussmall banks. A large bank conducting few and uncomplicated operations may introduce an advanced riskmeasurement and management approach fairly easily and at limited cost.
actual risk. In fact, Basel II will alter the current incentives for lending
– for instance, some borrowers will become more welcome and oth-
ers less so in certain banks, depending on their risk profiles. Basel II
will also strengthen the incentives for more risk-aligned pricing.
Competition among banks and between them and other financial
institutions will be altered – e.g. for operations that are favoured or
disfavoured by introducing Basel II. All this is generally welcome
because a better allocation of risks and capital will promote financial
stability and economic efficiency. However, some negative side-
effects are unavoidable, for instance during the transitional phase.
• Emerging market: “Too expensive for emerging markets”. The argu-
ment is that less rich countries cannot adopt Basel II because of the
high costs for introducing risk management systems in banks and
more efficient but resource-consuming supervision. But this argument
ignores some important aspects. Firstly, the simpler measurement
methods of Basel II are far less expensive and better adapted to
countries with less complex banking activities. Secondly, good risk
management in banks and effective supervision will pay for them-
selves by reducing the incidence of bank failures. Dealing with a
major banking crisis is many times more expensive than the cost of
almost any risk management system. Hence, before implementing
Basel II, countries should focus on introducing a framework of sound
practices for the “basics” of regulation, supervision and bank man-
agement. Having done that, a country should adopt the Basel II alter-
native that suits the situation of its banking system (small or large;
simple or sophisticated; national or cross-border) and risk structures.
• Advantages for large banks: “Large banks from developed countries
will have competitive advantages in emerging markets and develop-
ing countries”. For instance, external ratings from major international
rating agencies are much more frequent in developed countries.
Hence, goes the argument, a bank from a developed country will get
lower capital requirements. However, there is a fallacy in this line of
reasoning. The fact that there are more ratings in a bank’s home
country will not benefit it in the host country. If a borrower has no
rating, the standardised risk weight will be the same for the interna-
tional bank as for the local bank.
A conceivable situation is that the national authorities only allow
their banks to apply the simpler measurement methods of Basel II,
while an international bank from another country might be allowed
in its home country to apply the advanced methods on a consolidat-
ed basis for all its entities. The host authorities in the less developed
E C O N O M I C R E V I E W 2 / 2 0 0 534
country then have a choice – accept that the bank may use the
advanced methods also in the host country or demand that it applies
the simpler methods to its local subsidiary. This is a matter for negoti-
ation between the two countries. Requiring all banks, local or inter-
national, to apply the same simple Basel II approach in a country
would create a level playing field in a regulatory sense. However, it
would also stifle the beneficial influence on the local banks from the
introduction of better risk management methods.
• Risk of herding behaviour: This risk relates to Basel II’s implementa-
tion rather than to its structure. The concern is that too much super-
visory harmonisation in the implementation of Basel II, or “voluntary
harmonisation” by the banks themselves, might lead to excessively
similar risk management systems, which will reinforce cyclical swings
and increase the risk of systemic disturbances. However, studies on
banks9 which are already operating similar systems indicate that
banks in fact assume different risk attitudes to the same companies,
for sound economic reasons. Hence the impact in the event of any
herding might not be as large as feared. Nonetheless, it would be
unfortunate if there was a far-reaching standardisation of, for
instance, risk measurement systems. It might happen under certain
circumstances that all these systems would produce misleading risk
estimates and thereby threaten the banks.
• Supervisory capture: Under Basel II, supervisors will have the task of
endorsing a bank’s methods and processes, e.g. for managing risk
and capital. The supervisors will also monitor the planned functioning
of these methods and systems. Some have expressed worries that
once a supervisory authority has endorsed a specific process or
method, the authority will be less inclined to express criticism of the
process or method since this would implicitly criticise its earlier
approval.
Of course, this worry can be neither confirmed nor rejected until
Basel II has been up and running for some time. Still, the implemen-
tation of Basel II clearly will (and is intended to) increase the demands
on supervisors’ skills and integrity and it is crucial that the supervisory
agencies are provided with the resources and other means to meet
these demands. “Supervisory capture” is not a new issue and present
rules for supervisors deal with it. For instance, some countries apply
E C O N O M I C R E V I E W 2 / 2 0 0 5 35
9 Jacobson, T,. Roszbach, K. & Lindé, J., (2003), Internal Rating Systems, Implied Credit Risk and theConsistency of Banks’ Risk Classification Policies, Sveriges Riksbank, Working Paper No. 155, December,(www.riksbank.com/research/roszbach).
rules that make the supervisory authority legally liable for taking ade-
quate and timely action to deal with weaknesses in banks.
Hence, there seem, at least in my view, to be reassuring answers and par-
tial solutions to the controversial issues mentioned above. Nonetheless,
the whole process of shaping and implementing Basel II has benefited and
will continue to benefit from such critical and legitimate scrutiny. If Basel II
is to receive broad acceptance and also to function better, all potential
weaknesses and side-effects of the framework, be they on the banks or on
other parts of the economy, must be identified, analysed and discussed.
Partial solutions may be found for some of these weaknesses and side-
effects, e.g. by adapting Basel II. In other cases, however, the contradic-
tions between Basel II and other objectives, such as macroeconomic devel-
opments, may not be fully solvable but at least a discussion will clarify the
nature of the conflict.
Operational risk issues10
The present capital requirements are calculated solely for credit and mar-
ket risks, although the credit risk component implicitly includes opera-
tional risk. Basel II also has explicit capital requirements for operational
risk. Many, including the managers of most large international banks, see
these risks as significant and thus important to manage. However, many
kinds of operational risk are very difficult to measure with a view to pro-
viding a basis for capital requirements. Operational risks include frequent
events that have little impact on a bank, such as the daily miscounting –
intentional or otherwise – by the bank’s numerous cashiers. But they also
include highly infrequent events that can have a major impact, such as an
earthquake or an act of terrorism. How are such disparate risk categories
to be reconciled in a measurement system? Basel II has three levels for the
measurement of operational risks, designed to match the sophistication of
a bank’s operations:
• Basic Indicator Approach: The magnitude of a bank’s operational risk
and thus its capital requirement is calculated as a fixed proportion of
the bank’s net interest income and non-interest income, measured as
the average over the last three years.
• Standardised Approach: All of a bank’s operations are categorised
and given fixed risk weights in proportion to the amount allocated to
E C O N O M I C R E V I E W 2 / 2 0 0 536
10 In Basel II, operational risk encompasses events caused by individuals, systems and “nature”. This covers awide range of events, from miscalculations to fraud or IT-system breakdowns. It also includes fires, naturaldisasters and terrorist actions. Also legal risks are included.
Basel II has three levelsfor measurement of
operational risks,designed to match the
sophistication of abank’s operations.
each category. The overall capital requirement is the sum of the
requirements for all the categories.
• Advanced Measurement Approaches, AMA: In keeping with the
advanced methods for the calculation of credit and market risks, the
capital requirement is based on the bank’s internal system for the
measurement and management of operational risk.
Depending on the choice of measurement method, the above will provide
a crude, or a more advanced, estimate of a bank’s operational risks. What
matters much more than the actual amount prescribed by the capital
requirement, however, is that the bank management will be forced to
develop a system to identify, measure, manage and, not least, mitigate
the operational risks of the bank. In fact, now that bank managements
are focusing more on operational risk issues as a result of Basel II, they
increasingly acknowledge that these risks need to be dealt with in a struc-
tured manner.
Conclusion – the role of Basel II in the regulatoryframework
• Some degree of regulation and supervision of banks is beneficial to
society as a whole because banks on their own may not take external
considerations fully into account. On the other hand, excessive regu-
lation is not desirable because it stifles development and diversity in
the banks. Moreover, all regulation should ideally be constructed so
that it steers banks towards a behaviour that is beneficial for society,
while not restricting development.
• Basel II tries to achieve these goals by closely linking capital and risks;
by strengthening corporate governance in banks; by giving supervi-
sors more instruments to address weaknesses in banks; and by
increasing market discipline. To a much greater extent than hitherto,
Basel II will enable banks to be flexible in using their own methods
and systems, when adequate, to fulfil the regulatory requirements.
• The implementation of Basel II will increase the financial stability of
banks as well as of financial systems. This is beneficial for macroeco-
nomic growth in general.
The implementation of Basel II
As already noted, Basel II will come into effect on 1 January 2007. It must
be implemented by the internationally active banks in all G10 countries
and by all banks, credit institutions and also securities firms in every EU
member state. For all other countries it is a voluntary undertaking but
E C O N O M I C R E V I E W 2 / 2 0 0 5 37
Basel II will come intoeffect on 1 January 2007 in allG10 countries and inall EU member states.
many countries around the world have already declared an intention to
apply the new rules. A country may decide to limit the choice of alterna-
tives in Basel II for its own jurisdiction. For instance, the USA have stated
that only the most advanced approaches for risk measurement and capital
requirements will be accepted for their banks, and thus only the country’s
ten to twenty largest international banks11 will be allowed to use Basel II.
Some countries will allow their banks only to use the simple approaches
of Basel II, since they acknowledge that their banks and other circum-
stances will not (yet) be ready for the advanced alternatives.
Implementing Basel II in all countries which have decided to adopt it
is a huge process. It involves, among other things, new legislation, new
working processes and additional staff skills in the supervisory authorities
and central banks, bilateral negotiations between countries which have
common cross-border banking groups and, not least, setting up and run-
ning complex systems and procedures in banks.
As in many other countries, an intensive process has now been set in
motion in Sweden to prepare for implementation on the planned date.
Banks are compiling the information they need to estimate different risk
factors, and are building and testing the systems needed to run the risk
management. They are also preparing applications to the supervisors for
using various measurement and management systems for risk and capital.
The supervisors are bracing themselves to process these applications, for
instance by formulating manuals and check-lists. An added layer of com-
plexity in the process comes from banks that have a cross-border pres-
ence. A bank’s home country supervisors must coordinate the application
process with the supervisors of the bank’s host country/countries. Ideally,
a bank should only have to apply to one country’s authority and get a
coordinated response from it. However, particularly if the bank’s subsi-
diary or branch is large in the host country, the supervisors of that country
may wish to make their own scrutiny of the bank’s applications and this
may complicate the coordination.
At the time of writing, the legislative process is still underway in
Brussels. Even if an EU Directive is agreed on as planned in the near
future, a rapid process in the individual member states will be needed in
order to transform the new EU directive into national legislation so that
implementation may start on 1 January 2007.
E C O N O M I C R E V I E W 2 / 2 0 0 538
11 Between them, these banks cover close to 100 per cent of all US banks’ operations abroad. All other USbanks will be subject to other forms of regulation and supervision.
As in many othercountries, an intensiveprocess has now been
set in motion inSweden to prepare for
implementation on theplanned date.
E C O N O M I C R E V I E W 2 / 2 0 0 5 39
■ Monetary policyexpectations and forwardpremia
BY JAN ALSTERLIND AND HANS DILLÉNThe authors work in the Monetary Policy Department.
Monetary policy expectations can be measured in various ways. Survey
data can be used to measure repo rate expectations but this has the
drawback that the data are rather infrequent. Another approach is to use
the rates for treasury paper with different maturities to calculate the for-
ward interest rate curve. Such implied forward rates have the advantage
that they can be computed on a daily basis. Due to the existence of term
premia, however, the short forward rates are not a direct reflection of
expectations about the short-term market rate. In order to judge the
extent to which the implicitly calculated short forward curve does mirror
expectations of the shortest market rate, one needs to gauge the size of
these premia. As the different measures have their particular advantages
and drawbacks, there is something to be said for combining alternative
measures of monetary policy expectations.
Monetary policy expectations
Monitoring and analysing monetary policy expectations – market expec-
tations of the future level of the repo rate – is of interest for the Riksbank
for a number of reasons. For one thing, in its Inflation Report the Riks-
bank now includes an alternative forecast of inflation, given that the repo
rate will follow the path of the forward curve, which is assumed in turn to
reflect the market’s repo rate expectations.1 It is also of interest to analyse
the extent to which the market’s monetary policy expectations and there-
by the yield curve are affected by events in Sweden and the rest of the
world, including monetary policy decisions and statements by members of
the Riksbank’s Executive Board.2 The impact of monetary policy decisions
1 In order to make this assumption less sensitive to temporary market movements, a 15-day average of theforward curve is used. For a fuller discussion of this assumption, see the box on pages 52–54 in InflationReport 2005:1, Sveriges Riksbank.
2 For a more comprehensive analysis of how various events, including monetary policy decisions andstatements, affect the Swedish yield curve, see Andersson, Dillén & Sellin (2001).
The impact of monetarypolicy decisions isdependent on theextent to which thedecisions affectmonetary policyexpectations.
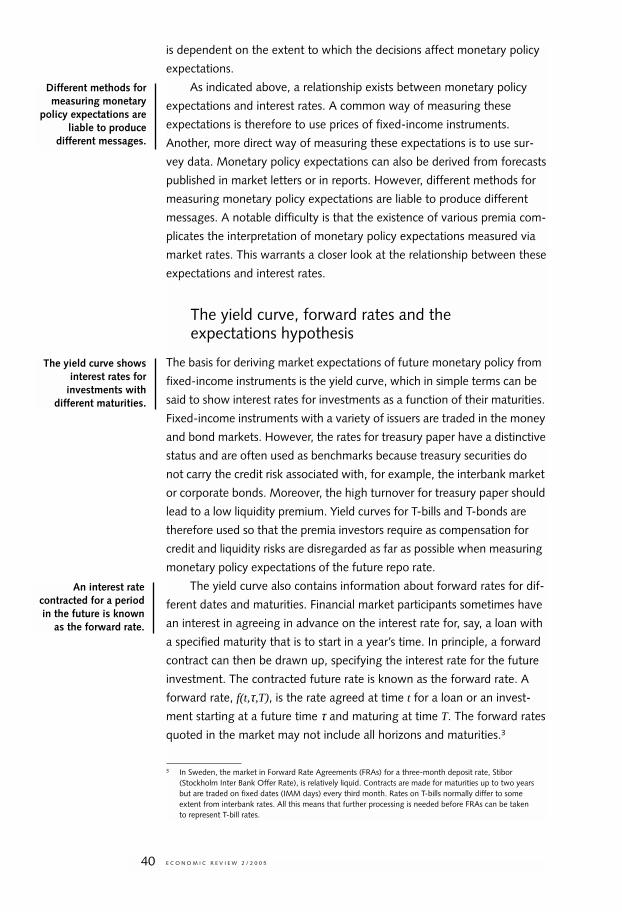
is dependent on the extent to which the decisions affect monetary policy
expectations.
As indicated above, a relationship exists between monetary policy
expectations and interest rates. A common way of measuring these
expectations is therefore to use prices of fixed-income instruments.
Another, more direct way of measuring these expectations is to use sur-
vey data. Monetary policy expectations can also be derived from forecasts
published in market letters or in reports. However, different methods for
measuring monetary policy expectations are liable to produce different
messages. A notable difficulty is that the existence of various premia com-
plicates the interpretation of monetary policy expectations measured via
market rates. This warrants a closer look at the relationship between these
expectations and interest rates.
The yield curve, forward rates and theexpectations hypothesis
The basis for deriving market expectations of future monetary policy from
fixed-income instruments is the yield curve, which in simple terms can be
said to show interest rates for investments as a function of their maturities.
Fixed-income instruments with a variety of issuers are traded in the money
and bond markets. However, the rates for treasury paper have a distinctive
status and are often used as benchmarks because treasury securities do
not carry the credit risk associated with, for example, the interbank market
or corporate bonds. Moreover, the high turnover for treasury paper should
lead to a low liquidity premium. Yield curves for T-bills and T-bonds are
therefore used so that the premia investors require as compensation for
credit and liquidity risks are disregarded as far as possible when measuring
monetary policy expectations of the future repo rate.
The yield curve also contains information about forward rates for dif-
ferent dates and maturities. Financial market participants sometimes have
an interest in agreeing in advance on the interest rate for, say, a loan with
a specified maturity that is to start in a year’s time. In principle, a forward
contract can then be drawn up, specifying the interest rate for the future
investment. The contracted future rate is known as the forward rate. A
forward rate, f(t,τ,T), is the rate agreed at time t for a loan or an invest-
ment starting at a future time τ and maturing at time T. The forward rates
quoted in the market may not include all horizons and maturities.3
E C O N O M I C R E V I E W 2 / 2 0 0 540
3 In Sweden, the market in Forward Rate Agreements (FRAs) for a three-month deposit rate, Stibor(Stockholm Inter Bank Offer Rate), is relatively liquid. Contracts are made for maturities up to two yearsbut are traded on fixed dates (IMM days) every third month. Rates on T-bills normally differ to someextent from interbank rates. All this means that further processing is needed before FRAs can be takento represent T-bill rates.
Different methods formeasuring monetary
policy expectations areliable to produce
different messages.
The yield curve showsinterest rates for
investments withdifferent maturities.
An interest ratecontracted for a periodin the future is known
as the forward rate.
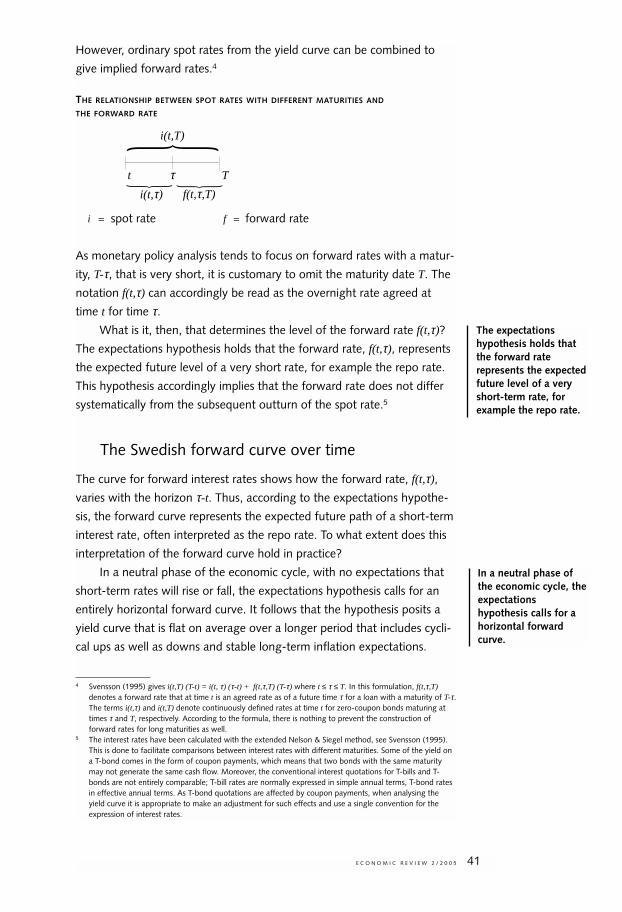
However, ordinary spot rates from the yield curve can be combined to
give implied forward rates.4
THE RELATIONSHIP BETWEEN SPOT RATES WITH DIFFERENT MATURITIES AND
THE FORWARD RATE
i = spot rate f = forward rate
As monetary policy analysis tends to focus on forward rates with a matur-
ity, T-τ, that is very short, it is customary to omit the maturity date T. The
notation f(t,τ) can accordingly be read as the overnight rate agreed at
time t for time τ.
What is it, then, that determines the level of the forward rate f(t,τ)?
The expectations hypothesis holds that the forward rate, f(t,τ), represents
the expected future level of a very short rate, for example the repo rate.
This hypothesis accordingly implies that the forward rate does not differ
systematically from the subsequent outturn of the spot rate.5
The Swedish forward curve over time
The curve for forward interest rates shows how the forward rate, f(t,τ),
varies with the horizon τ-t. Thus, according to the expectations hypothe-
sis, the forward curve represents the expected future path of a short-term
interest rate, often interpreted as the repo rate. To what extent does this
interpretation of the forward curve hold in practice?
In a neutral phase of the economic cycle, with no expectations that
short-term rates will rise or fall, the expectations hypothesis calls for an
entirely horizontal forward curve. It follows that the hypothesis posits a
yield curve that is flat on average over a longer period that includes cycli-
cal ups as well as downs and stable long-term inflation expectations.
E C O N O M I C R E V I E W 2 / 2 0 0 5 41
4 Svensson (1995) gives i(t,T) (T-t) = i(t, τ) (τ-t) + f(t,τ,T) (T-τ) where t ≤ τ ≤ T. In this formulation, f(t,τ,T)denotes a forward rate that at time t is an agreed rate as of a future time τ for a loan with a maturity of T-τ.The terms i(t,τ) and i(t,T) denote continuously defined rates at time t for zero-coupon bonds maturing attimes τ and T, respectively. According to the formula, there is nothing to prevent the construction offorward rates for long maturities as well.
5 The interest rates have been calculated with the extended Nelson & Siegel method, see Svensson (1995).This is done to facilitate comparisons between interest rates with different maturities. Some of the yield ona T-bond comes in the form of coupon payments, which means that two bonds with the same maturitymay not generate the same cash flow. Moreover, the conventional interest quotations for T-bills and T-bonds are not entirely comparable; T-bill rates are normally expressed in simple annual terms, T-bond ratesin effective annual terms. As T-bond quotations are affected by coupon payments, when analysing theyield curve it is appropriate to make an adjustment for such effects and use a single convention for theexpression of interest rates.
{ i(t,T)
{{t τ T
i(t,τ) f(t,τ,T)
The expectationshypothesis holds thatthe forward raterepresents the expectedfuture level of a veryshort-term rate, forexample the repo rate.
In a neutral phase ofthe economic cycle, theexpectationshypothesis calls for ahorizontal forwardcurve.
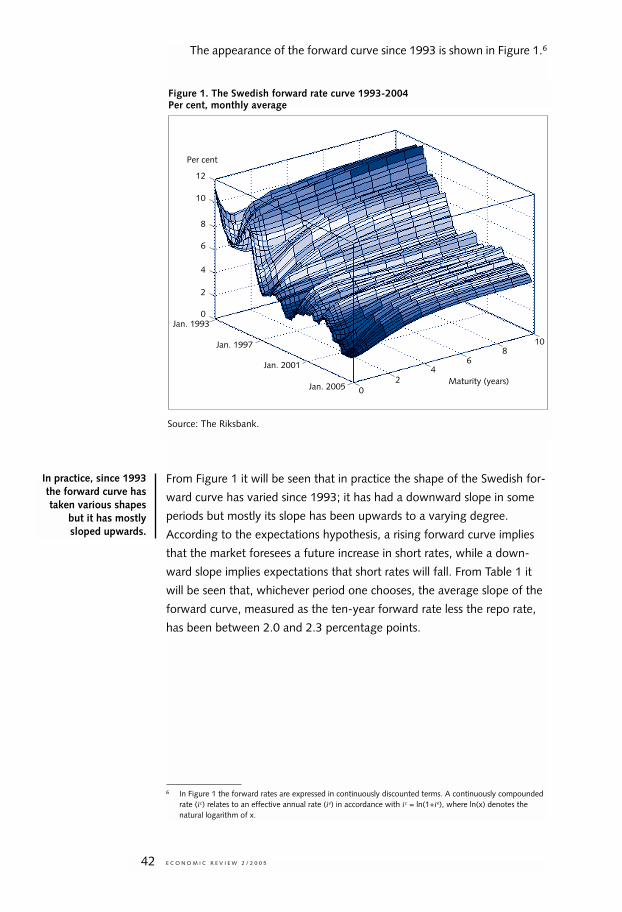
The appearance of the forward curve since 1993 is shown in Figure 1.6
From Figure 1 it will be seen that in practice the shape of the Swedish for-
ward curve has varied since 1993; it has had a downward slope in some
periods but mostly its slope has been upwards to a varying degree.
According to the expectations hypothesis, a rising forward curve implies
that the market foresees a future increase in short rates, while a down-
ward slope implies expectations that short rates will fall. From Table 1 it
will be seen that, whichever period one chooses, the average slope of the
forward curve, measured as the ten-year forward rate less the repo rate,
has been between 2.0 and 2.3 percentage points.
E C O N O M I C R E V I E W 2 / 2 0 0 542
6 In Figure 1 the forward rates are expressed in continuously discounted terms. A continuously compoundedrate (ic) relates to an effective annual rate (ie) in accordance with ic = ln(1+ie), where ln(x) denotes thenatural logarithm of x.
02
46
810
12
10
8
6
4
2
0
Maturity (years)
Per cent
Jan. 2005
Jan. 2001
Jan. 1997
Jan. 1993
Source: The Riksbank.
Figure 1. The Swedish forward rate curve 1993-2004Per cent, monthly average
In practice, since 1993the forward curve hastaken various shapes
but it has mostlysloped upwards.
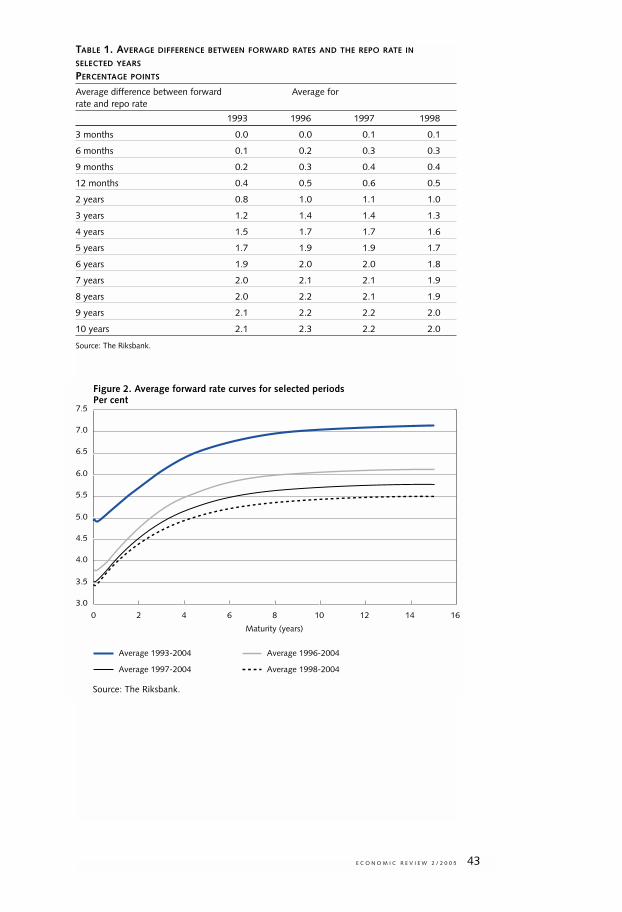
TABLE 1. AVERAGE DIFFERENCE BETWEEN FORWARD RATES AND THE REPO RATE IN
SELECTED YEARS
PERCENTAGE POINTS
Average difference between forward Average forrate and repo rate
1993 1996 1997 1998
3 months 0.0 0.0 0.1 0.1
6 months 0.1 0.2 0.3 0.3
9 months 0.2 0.3 0.4 0.4
12 months 0.4 0.5 0.6 0.5
2 years 0.8 1.0 1.1 1.0
3 years 1.2 1.4 1.4 1.3
4 years 1.5 1.7 1.7 1.6
5 years 1.7 1.9 1.9 1.7
6 years 1.9 2.0 2.0 1.8
7 years 2.0 2.1 2.1 1.9
8 years 2.0 2.2 2.1 1.9
9 years 2.1 2.2 2.2 2.0
10 years 2.1 2.3 2.2 2.0
Source: The Riksbank.
E C O N O M I C R E V I E W 2 / 2 0 0 5 43
3.0
3.5
4.0
4.5
5.0
5.5
6.0
6.5
7.0
7.5
0 2 4 6 8 10 12 14 16
Maturity (years)
Average 1993-2004 Average 1996-2004
Average 1997-2004 Average 1998-2004
Source: The Riksbank.
Figure 2. Average forward rate curves for selected periodsPer cent
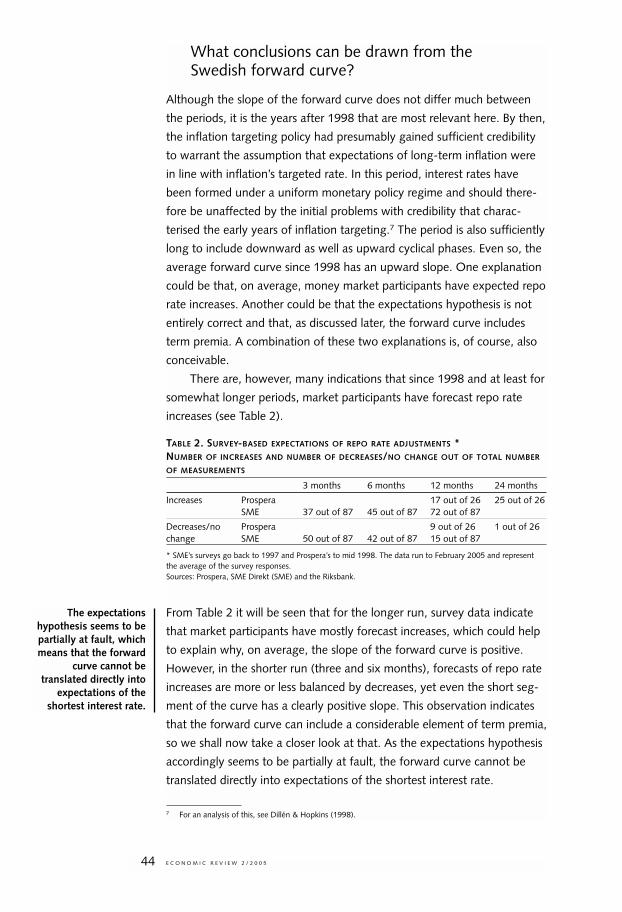
What conclusions can be drawn from theSwedish forward curve?
Although the slope of the forward curve does not differ much between
the periods, it is the years after 1998 that are most relevant here. By then,
the inflation targeting policy had presumably gained sufficient credibility
to warrant the assumption that expectations of long-term inflation were
in line with inflation’s targeted rate. In this period, interest rates have
been formed under a uniform monetary policy regime and should there-
fore be unaffected by the initial problems with credibility that charac-
terised the early years of inflation targeting.7 The period is also sufficiently
long to include downward as well as upward cyclical phases. Even so, the
average forward curve since 1998 has an upward slope. One explanation
could be that, on average, money market participants have expected repo
rate increases. Another could be that the expectations hypothesis is not
entirely correct and that, as discussed later, the forward curve includes
term premia. A combination of these two explanations is, of course, also
conceivable.
There are, however, many indications that since 1998 and at least for
somewhat longer periods, market participants have forecast repo rate
increases (see Table 2).
TABLE 2. SURVEY-BASED EXPECTATIONS OF REPO RATE ADJUSTMENTS *NUMBER OF INCREASES AND NUMBER OF DECREASES/NO CHANGE OUT OF TOTAL NUMBER
OF MEASUREMENTS
3 months 6 months 12 months 24 months
Increases Prospera 17 out of 26 25 out of 26SME 37 out of 87 45 out of 87 72 out of 87
Decreases/no Prospera 9 out of 26 1 out of 26change SME 50 out of 87 42 out of 87 15 out of 87
* SME’s surveys go back to 1997 and Prospera’s to mid 1998. The data run to February 2005 and representthe average of the survey responses.Sources: Prospera, SME Direkt (SME) and the Riksbank.
From Table 2 it will be seen that for the longer run, survey data indicate
that market participants have mostly forecast increases, which could help
to explain why, on average, the slope of the forward curve is positive.
However, in the shorter run (three and six months), forecasts of repo rate
increases are more or less balanced by decreases, yet even the short seg-
ment of the curve has a clearly positive slope. This observation indicates
that the forward curve can include a considerable element of term premia,
so we shall now take a closer look at that. As the expectations hypothesis
accordingly seems to be partially at fault, the forward curve cannot be
translated directly into expectations of the shortest interest rate.
E C O N O M I C R E V I E W 2 / 2 0 0 544
7 For an analysis of this, see Dillén & Hopkins (1998).
The expectationshypothesis seems to bepartially at fault, whichmeans that the forward
curve cannot betranslated directly into
expectations of theshortest interest rate.
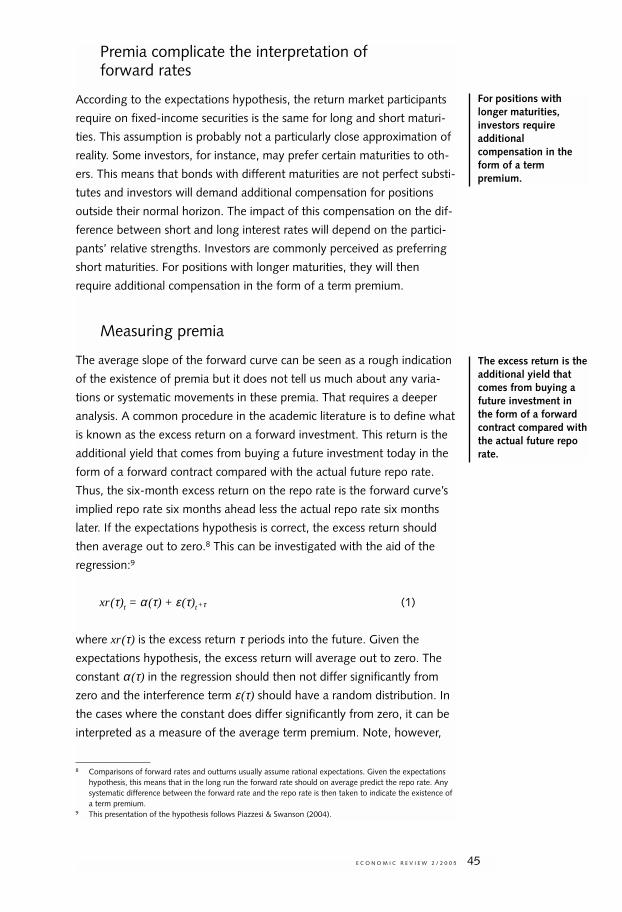
Premia complicate the interpretation offorward rates
According to the expectations hypothesis, the return market participants
require on fixed-income securities is the same for long and short maturi-
ties. This assumption is probably not a particularly close approximation of
reality. Some investors, for instance, may prefer certain maturities to oth-
ers. This means that bonds with different maturities are not perfect substi-
tutes and investors will demand additional compensation for positions
outside their normal horizon. The impact of this compensation on the dif-
ference between short and long interest rates will depend on the partici-
pants’ relative strengths. Investors are commonly perceived as preferring
short maturities. For positions with longer maturities, they will then
require additional compensation in the form of a term premium.
Measuring premia
The average slope of the forward curve can be seen as a rough indication
of the existence of premia but it does not tell us much about any varia-
tions or systematic movements in these premia. That requires a deeper
analysis. A common procedure in the academic literature is to define what
is known as the excess return on a forward investment. This return is the
additional yield that comes from buying a future investment today in the
form of a forward contract compared with the actual future repo rate.
Thus, the six-month excess return on the repo rate is the forward curve’s
implied repo rate six months ahead less the actual repo rate six months
later. If the expectations hypothesis is correct, the excess return should
then average out to zero.8 This can be investigated with the aid of the
regression:9
xr(τ)t = α (τ) + ε(τ)t+τ (1)
where xr(τ) is the excess return τ periods into the future. Given the
expectations hypothesis, the excess return will average out to zero. The
constant α (τ) in the regression should then not differ significantly from
zero and the interference term ε(τ) should have a random distribution. In
the cases where the constant does differ significantly from zero, it can be
interpreted as a measure of the average term premium. Note, however,
E C O N O M I C R E V I E W 2 / 2 0 0 5 45
8 Comparisons of forward rates and outturns usually assume rational expectations. Given the expectationshypothesis, this means that in the long run the forward rate should on average predict the repo rate. Anysystematic difference between the forward rate and the repo rate is then taken to indicate the existence ofa term premium.
9 This presentation of the hypothesis follows Piazzesi & Swanson (2004).
For positions withlonger maturities,investors requireadditionalcompensation in theform of a termpremium.
The excess return is theadditional yield thatcomes from buying afuture investment inthe form of a forwardcontract compared withthe actual future reporate.
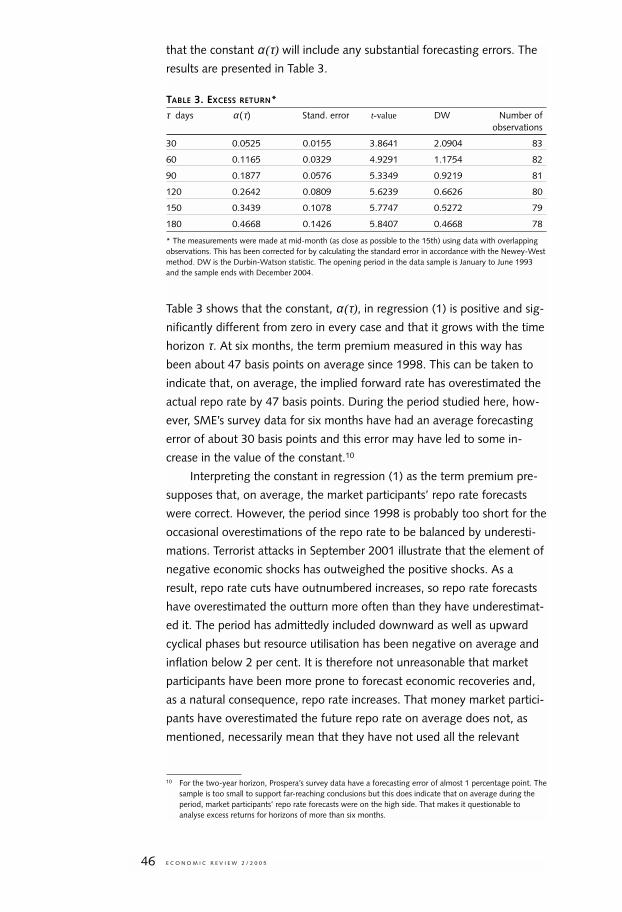
that the constant α (τ) will include any substantial forecasting errors. The
results are presented in Table 3.
TABLE 3. EXCESS RETURN* τ days α(τ) Stand. error t-value DW Number of
observations
30 0.0525 0.0155 3.8641 2.0904 83
60 0.1165 0.0329 4.9291 1.1754 82
90 0.1877 0.0576 5.3349 0.9219 81
120 0.2642 0.0809 5.6239 0.6626 80
150 0.3439 0.1078 5.7747 0.5272 79
180 0.4668 0.1426 5.8407 0.4668 78
* The measurements were made at mid-month (as close as possible to the 15th) using data with overlappingobservations. This has been corrected for by calculating the standard error in accordance with the Newey-Westmethod. DW is the Durbin-Watson statistic. The opening period in the data sample is January to June 1993and the sample ends with December 2004.
Table 3 shows that the constant, α (τ), in regression (1) is positive and sig-
nificantly different from zero in every case and that it grows with the time
horizon τ. At six months, the term premium measured in this way has
been about 47 basis points on average since 1998. This can be taken to
indicate that, on average, the implied forward rate has overestimated the
actual repo rate by 47 basis points. During the period studied here, how-
ever, SME’s survey data for six months have had an average forecasting
error of about 30 basis points and this error may have led to some in-
crease in the value of the constant.10
Interpreting the constant in regression (1) as the term premium pre-
supposes that, on average, the market participants’ repo rate forecasts
were correct. However, the period since 1998 is probably too short for the
occasional overestimations of the repo rate to be balanced by underesti-
mations. Terrorist attacks in September 2001 illustrate that the element of
negative economic shocks has outweighed the positive shocks. As a
result, repo rate cuts have outnumbered increases, so repo rate forecasts
have overestimated the outturn more often than they have underestimat-
ed it. The period has admittedly included downward as well as upward
cyclical phases but resource utilisation has been negative on average and
inflation below 2 per cent. It is therefore not unreasonable that market
participants have been more prone to forecast economic recoveries and,
as a natural consequence, repo rate increases. That money market partici-
pants have overestimated the future repo rate on average does not, as
mentioned, necessarily mean that they have not used all the relevant
E C O N O M I C R E V I E W 2 / 2 0 0 546
10 For the two-year horizon, Prospera’s survey data have a forecasting error of almost 1 percentage point. Thesample is too small to support far-reaching conclusions but this does indicate that on average during theperiod, market participants’ repo rate forecasts were on the high side. That makes it questionable toanalyse excess returns for horizons of more than six months.
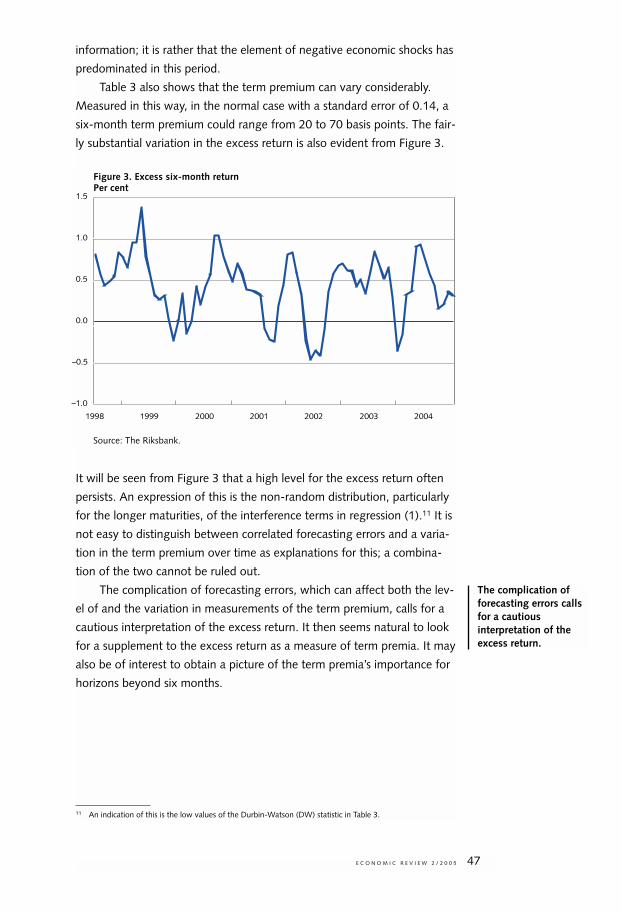
information; it is rather that the element of negative economic shocks has
predominated in this period.
Table 3 also shows that the term premium can vary considerably.
Measured in this way, in the normal case with a standard error of 0.14, a
six-month term premium could range from 20 to 70 basis points. The fair-
ly substantial variation in the excess return is also evident from Figure 3.
It will be seen from Figure 3 that a high level for the excess return often
persists. An expression of this is the non-random distribution, particularly
for the longer maturities, of the interference terms in regression (1).11 It is
not easy to distinguish between correlated forecasting errors and a varia-
tion in the term premium over time as explanations for this; a combina-
tion of the two cannot be ruled out.
The complication of forecasting errors, which can affect both the lev-
el of and the variation in measurements of the term premium, calls for a
cautious interpretation of the excess return. It then seems natural to look
for a supplement to the excess return as a measure of term premia. It may
also be of interest to obtain a picture of the term premia’s importance for
horizons beyond six months.
E C O N O M I C R E V I E W 2 / 2 0 0 5 47
11 An indication of this is the low values of the Durbin-Watson (DW) statistic in Table 3.
–1.0
–0.5
0.0
0.5
1.0
1.5
1998 1999 2000 2001 2002 2003 2004
Source: The Riksbank.
Figure 3. Excess six-month returnPer cent
The complication offorecasting errors callsfor a cautiousinterpretation of theexcess return.
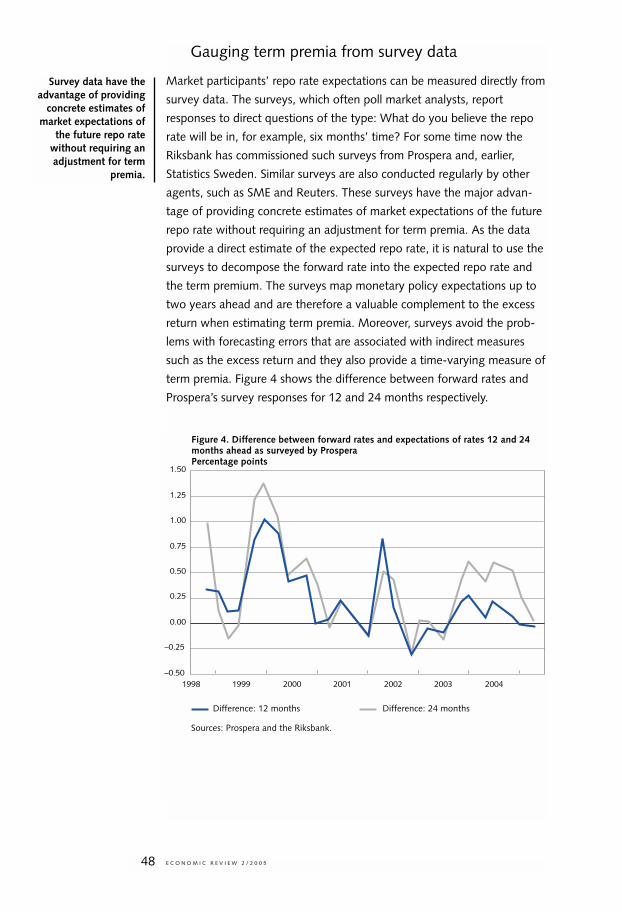
Gauging term premia from survey data
Market participants’ repo rate expectations can be measured directly from
survey data. The surveys, which often poll market analysts, report
responses to direct questions of the type: What do you believe the repo
rate will be in, for example, six months’ time? For some time now the
Riksbank has commissioned such surveys from Prospera and, earlier,
Statistics Sweden. Similar surveys are also conducted regularly by other
agents, such as SME and Reuters. These surveys have the major advan-
tage of providing concrete estimates of market expectations of the future
repo rate without requiring an adjustment for term premia. As the data
provide a direct estimate of the expected repo rate, it is natural to use the
surveys to decompose the forward rate into the expected repo rate and
the term premium. The surveys map monetary policy expectations up to
two years ahead and are therefore a valuable complement to the excess
return when estimating term premia. Moreover, surveys avoid the prob-
lems with forecasting errors that are associated with indirect measures
such as the excess return and they also provide a time-varying measure of
term premia. Figure 4 shows the difference between forward rates and
Prospera’s survey responses for 12 and 24 months respectively.
E C O N O M I C R E V I E W 2 / 2 0 0 548
Survey data have theadvantage of providing
concrete estimates ofmarket expectations of
the future repo ratewithout requiring anadjustment for term
premia.
–0.50
–0.25
0.00
0.25
0.50
0.75
1.00
1.25
1.50
1998 1999 2000 2001 2002 2003 2004
Sources: Prospera and the Riksbank.
Figure 4. Difference between forward rates and expectations of rates 12 and 24 months ahead as surveyed by ProsperaPercentage points
Difference: 12 months Difference: 24 months
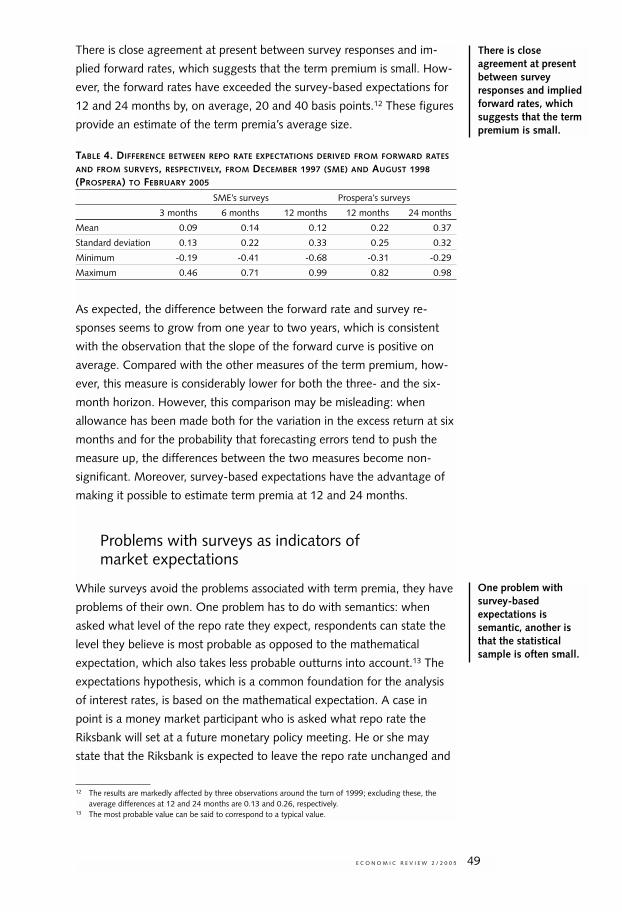
There is close agreement at present between survey responses and im-
plied forward rates, which suggests that the term premium is small. How-
ever, the forward rates have exceeded the survey-based expectations for
12 and 24 months by, on average, 20 and 40 basis points.12 These figures
provide an estimate of the term premia’s average size.
TABLE 4. DIFFERENCE BETWEEN REPO RATE EXPECTATIONS DERIVED FROM FORWARD RATES
AND FROM SURVEYS, RESPECTIVELY, FROM DECEMBER 1997 (SME) AND AUGUST 1998
(PROSPERA) TO FEBRUARY 2005
SME’s surveys Prospera’s surveys
3 months 6 months 12 months 12 months 24 months
Mean 0.09 0.14 0.12 0.22 0.37
Standard deviation 0.13 0.22 0.33 0.25 0.32
Minimum -0.19 -0.41 -0.68 -0.31 -0.29
Maximum 0.46 0.71 0.99 0.82 0.98
As expected, the difference between the forward rate and survey re-
sponses seems to grow from one year to two years, which is consistent
with the observation that the slope of the forward curve is positive on
average. Compared with the other measures of the term premium, how-
ever, this measure is considerably lower for both the three- and the six-
month horizon. However, this comparison may be misleading: when
allowance has been made both for the variation in the excess return at six
months and for the probability that forecasting errors tend to push the
measure up, the differences between the two measures become non-
significant. Moreover, survey-based expectations have the advantage of
making it possible to estimate term premia at 12 and 24 months.
Problems with surveys as indicators ofmarket expectations
While surveys avoid the problems associated with term premia, they have
problems of their own. One problem has to do with semantics: when
asked what level of the repo rate they expect, respondents can state the
level they believe is most probable as opposed to the mathematical
expectation, which also takes less probable outturns into account.13 The
expectations hypothesis, which is a common foundation for the analysis
of interest rates, is based on the mathematical expectation. A case in
point is a money market participant who is asked what repo rate the
Riksbank will set at a future monetary policy meeting. He or she may
state that the Riksbank is expected to leave the repo rate unchanged and
E C O N O M I C R E V I E W 2 / 2 0 0 5 49
12 The results are markedly affected by three observations around the turn of 1999; excluding these, theaverage differences at 12 and 24 months are 0.13 and 0.26, respectively.
13 The most probable value can be said to correspond to a typical value.
There is closeagreement at presentbetween surveyresponses and impliedforward rates, whichsuggests that the termpremium is small.
One problem withsurvey-basedexpectations issemantic, another isthat the statisticalsample is often small.
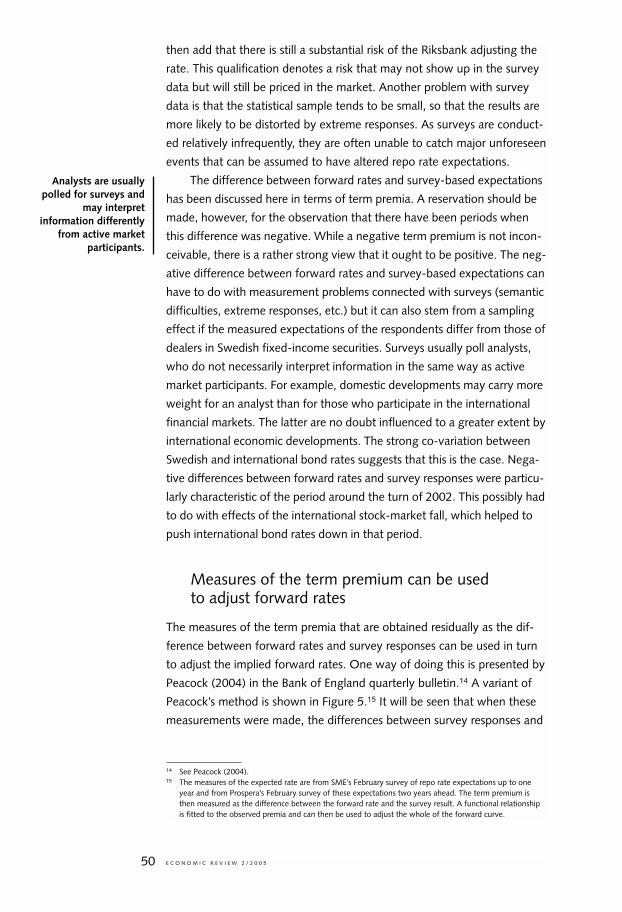
then add that there is still a substantial risk of the Riksbank adjusting the
rate. This qualification denotes a risk that may not show up in the survey
data but will still be priced in the market. Another problem with survey
data is that the statistical sample tends to be small, so that the results are
more likely to be distorted by extreme responses. As surveys are conduct-
ed relatively infrequently, they are often unable to catch major unforeseen
events that can be assumed to have altered repo rate expectations.
The difference between forward rates and survey-based expectations
has been discussed here in terms of term premia. A reservation should be
made, however, for the observation that there have been periods when
this difference was negative. While a negative term premium is not incon-
ceivable, there is a rather strong view that it ought to be positive. The neg-
ative difference between forward rates and survey-based expectations can
have to do with measurement problems connected with surveys (semantic
difficulties, extreme responses, etc.) but it can also stem from a sampling
effect if the measured expectations of the respondents differ from those of
dealers in Swedish fixed-income securities. Surveys usually poll analysts,
who do not necessarily interpret information in the same way as active
market participants. For example, domestic developments may carry more
weight for an analyst than for those who participate in the international
financial markets. The latter are no doubt influenced to a greater extent by
international economic developments. The strong co-variation between
Swedish and international bond rates suggests that this is the case. Nega-
tive differences between forward rates and survey responses were particu-
larly characteristic of the period around the turn of 2002. This possibly had
to do with effects of the international stock-market fall, which helped to
push international bond rates down in that period.
Measures of the term premium can be usedto adjust forward rates
The measures of the term premia that are obtained residually as the dif-
ference between forward rates and survey responses can be used in turn
to adjust the implied forward rates. One way of doing this is presented by
Peacock (2004) in the Bank of England quarterly bulletin.14 A variant of
Peacock’s method is shown in Figure 5.15 It will be seen that when these
measurements were made, the differences between survey responses and
E C O N O M I C R E V I E W 2 / 2 0 0 550
14 See Peacock (2004).15 The measures of the expected rate are from SME’s February survey of repo rate expectations up to one
year and from Prospera’s February survey of these expectations two years ahead. The term premium isthen measured as the difference between the forward rate and the survey result. A functional relationshipis fitted to the observed premia and can then be used to adjust the whole of the forward curve.
Analysts are usuallypolled for surveys and
may interpretinformation differently
from active marketparticipants.
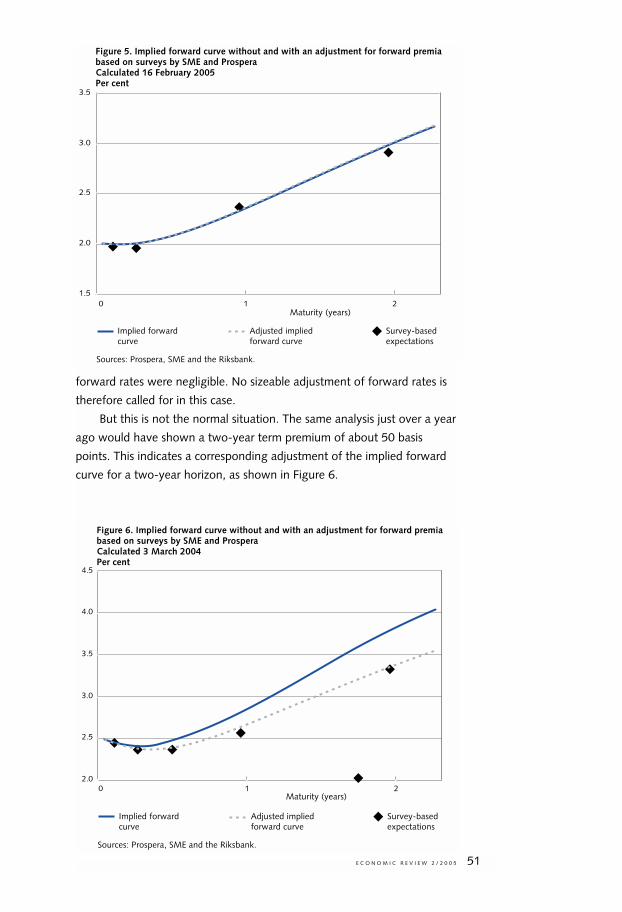
forward rates were negligible. No sizeable adjustment of forward rates is
therefore called for in this case.
But this is not the normal situation. The same analysis just over a year
ago would have shown a two-year term premium of about 50 basis
points. This indicates a corresponding adjustment of the implied forward
curve for a two-year horizon, as shown in Figure 6.
E C O N O M I C R E V I E W 2 / 2 0 0 5 51
1.5
2.0
2.5
3.0
3.5
0 1 2
Sources: Prospera, SME and the Riksbank.
Maturity (years)
Figure 5. Implied forward curve without and with an adjustment for forward premia based on surveys by SME and ProsperaCalculated 16 February 2005Per cent
Implied forward Adjusted implied Survey-based curve forward curve expectations
2.0
2.5
3.0
3.5
4.0
4.5
0 1 2
Figure 6. Implied forward curve without and with an adjustment for forward premia based on surveys by SME and ProsperaCalculated 3 March 2004Per cent
Maturity (years)
Sources: Prospera, SME and the Riksbank.
Implied forward Adjusted implied Survey-based curve forward curve expectations
Both survey data and forward rates should be used
Under all circumstances, the periodically large difference between forward
rates and survey responses underscores the difficulty in measuring interest
rate expectations. Whether monetary policy expectations are based on
surveys or on forward rates, the results should be interpreted with cau-
tion. Another question is the extent to which measures of monetary poli-
cy expectations are able to predict the future path of the repo rate. In
practice, one often has to rely on forward rates because relevant survey
data showing how monetary policy expectations are affected by various
events are normally not available. One should bear in mind, however, that
forward rates are also affected by term premia, which can be large and
volatile in periods of financial unrest. Survey-based expectations are
therefore a more robust measure of monetary policy expectations and
useful for checking against.
E C O N O M I C R E V I E W 2 / 2 0 0 552
The periodically largedifference between
forward rates andsurvey responsesunderscores the
difficulty in measuringinterest rate
expectations.
References
Andersson, M., Dillén, H. & Sellin, P., (2002), “Monetary policy signallingand movements in the Swedish term structure of interest rates”,Working Paper 132, Sveriges Riksbank.
Campbell, J. Y., Lo, A. W. & MacKinlay, A. C., (1997), The Econometricsof Financial Markets, Princeton University Press.
Dillén, H. & Hopkins, E., (1998), “Forward interest rates and inflationexpectations: The role of regime shift premia and monetary policy”,Working Paper 51, Sveriges Riksbank.
Peacock, C., (2004), “Deriving a market-based measure of interest rateexpectations”, Bank of England quarterly bulletin, Summer.
Piazzesi, M. & Cochrane, J., (2002), “Bond risk premia”, NBER WorkingPaper 9178, September.
Piazzesi, M. & Swansson, E., (2004), “Futures prices as risk-adjusted fore-casts of monetary policy”, NBER Working Paper 10547, June.
Svensson, L. E. O., (1993), “Term, inflation and foreign exchange riskpremia: A unified treatment”, NBER Working Paper 4544,November.
Svensson, L. E. O., (1995), “Estimating forward interest rates with theextended Nelson & Siegel method”, Economic Review, 3, SverigesRiksbank.
E C O N O M I C R E V I E W 2 / 2 0 0 5 53
■ The Riksbank’smanagement of interestrates – monetary policy inpractice
BY ANNIKA OTZAnnika Otz works at the Market Operations Department.
The Riksbank’s interest rate management is the operational component
of its monetary policy process. Through its interest rate management, the
Riksbank implements the Executive Board’s monetary policy decisions by
influencing the market’s shortest interest rate, the overnight rate.
Knowledge of how the Riksbank steers interest rates is thus important for
those wishing to gain a more in-depth understanding of the Bank’s mon-
etary policy.
A previous article1 in this journal explained the Riksbank’s interest
rate management in the light of the traditional approach for inflation tar-
geting given in textbooks, coupled with a comparison with the system
used by the US Federal Reserve. The aim of this article, besides elucidat-
ing how monetary policy is implemented in practice, is to further clarify
the connection between the steering of interest rates and the Riksbank’s
payment system.
Fundamental conditions for the Riksbank’smanagement of interest rates
When banks need to borrow or deposit funds in kronor, they can do so
with each other at different maturities. The most interesting maturity,
which constitutes the essence of the Riksbank's ability to influence inter-
est rates, is the banks' borrowing or deposit requirement overnight.
Banks’ need to borrow funds from, or deposit funds with, each other
overnight stems from the payments that occur between them during the
day. But in order for banks to be able to carry out these payment transac-
tions at all, a common payment system is required.
E C O N O M I C R E V I E W 2 / 2 0 0 554
The banks’ borrowingor deposit requirement
overnight constitutesthe essence of the
Riksbank’s managementof interest rates.
Interbank paymenttransactions require a
common paymentsystem.
1 Mitlid & Vesterlund (2001).
THE RIKSBANK’S PAYMENT SYSTEM – A PREREQUISITE
FOR STEERING INTEREST RATES
When households and companies pay their bills they do so through the
bank in which they hold their accounts. The bank then forwards the pay-
ment to the recipient’s account. If this account is held in a different bank
the process requires a payment system, that is to say, an infrastructure
that makes it possible to forward a payment from one bank to another. In
Sweden the Riksbank provides such a payment system, called RIX.2
Payments in RIX are made in Swedish kronor only and go via the
participant banks’ accounts at the Riksbank. Those banks that do not par-
ticipate in RIX have to go through the participant banks.
To ensure that payments can be made smoothly in RIX the Riksbank
gives participants the opportunity to borrow interest-free funds from the
Bank during the day, known as intraday credit. The banks can do so on
condition that they have provided sufficient eligible assets to the Riksbank.
The payments in RIX are processed one by one, known as real-time
gross settlement, when payers have sufficient funds in their accounts or
adequate collateral to obtain intraday credit.
DEPOSITS AND LOANS AT THE RIKSBANK SET THE BOUNDARIES
FOR THE OVERNIGHT RATE
Before the payment system closes, the banks’ accounts in RIX must be
balanced. That means that banks with intraday credit at the end of the
day have to finance this in some way. Likewise, banks with a surplus in
their Riksbank accounts have to make sure that they deposit these funds.
Banks can resolve this by turning to the overnight market or by bor-
rowing or depositing funds at the Riksbank overnight, that is to say, by
making use of the Riksbank’s marginal lending and deposit facilities (the
Riksbank’s standing facilities). In other words banks can extend their loans
overnight (through the marginal lending facility) or deposit funds over-
night (through the deposit facility) at the Riksbank at interest rates
announced in advance.
The lending rate is 150 basis points higher than the deposit rate (see
Figure 1). This interest rate differential creates an incentive for banks to
borrow from, and deposit with, each other at a rate of interest between
the Riksbank’s deposit and lending rates, thereby setting the boundaries
for the overnight rate.3
E C O N O M I C R E V I E W 2 / 2 0 0 5 55
2 The Riksbank’s payment system RIX is a hub of the Swedish payment infrastructure. For more information,see Sveriges Riksbank (2004a).
3 Banks usually have a liquidity plan that extends over a longer period than overnight. Nevertheless, theovernight market is important for banks to be able to manage the deficits and surpluses that arise in theirpayment flows on particular days.
The Riksbank providesa payment system,called RIX.
The Riksbank givesparticipants theopportunity to borrowinterest-free funds ifrequired, known asintraday credit.
Banks can turn to theovernight market ormake use of theRiksbank’s marginallending and depositfacilities.
The lending rate is 150basis points higherthan the deposit rate,creating an incentivefor banks to borrowfrom and deposit witheach other.
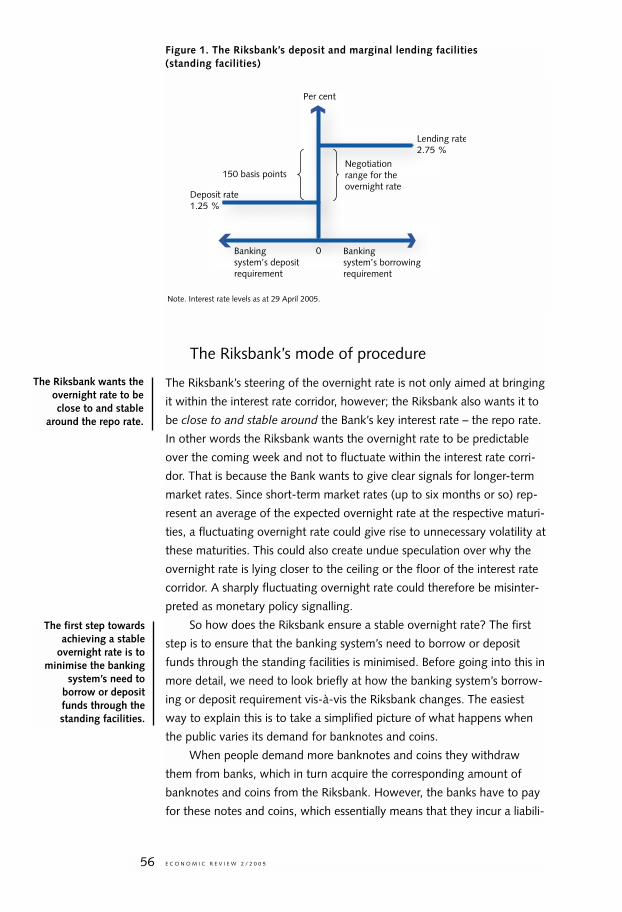
Figure 1. The Riksbank’s deposit and marginal lending facilities(standing facilities)
The Riksbank’s mode of procedure
The Riksbank’s steering of the overnight rate is not only aimed at bringing
it within the interest rate corridor, however; the Riksbank also wants it to
be close to and stable around the Bank’s key interest rate – the repo rate.
In other words the Riksbank wants the overnight rate to be predictable
over the coming week and not to fluctuate within the interest rate corri-
dor. That is because the Bank wants to give clear signals for longer-term
market rates. Since short-term market rates (up to six months or so) rep-
resent an average of the expected overnight rate at the respective maturi-
ties, a fluctuating overnight rate could give rise to unnecessary volatility at
these maturities. This could also create undue speculation over why the
overnight rate is lying closer to the ceiling or the floor of the interest rate
corridor. A sharply fluctuating overnight rate could therefore be misinter-
preted as monetary policy signalling.
So how does the Riksbank ensure a stable overnight rate? The first
step is to ensure that the banking system’s need to borrow or deposit
funds through the standing facilities is minimised. Before going into this in
more detail, we need to look briefly at how the banking system’s borrow-
ing or deposit requirement vis-à-vis the Riksbank changes. The easiest
way to explain this is to take a simplified picture of what happens when
the public varies its demand for banknotes and coins.
When people demand more banknotes and coins they withdraw
them from banks, which in turn acquire the corresponding amount of
banknotes and coins from the Riksbank. However, the banks have to pay
for these notes and coins, which essentially means that they incur a liabili-
E C O N O M I C R E V I E W 2 / 2 0 0 556
Per cent
Negotiation range for the overnight rate
150 basis points
Lending rate2.75 %
Deposit rate1.25 %
Banking system’s deposit requirement
Banking system’s borrowing requirement
0
Note. Interest rate levels as at 29 April 2005.
The Riksbank wants theovernight rate to beclose to and stable
around the repo rate.
The first step towardsachieving a stable
overnight rate is tominimise the banking
system’s need toborrow or depositfunds through thestanding facilities.
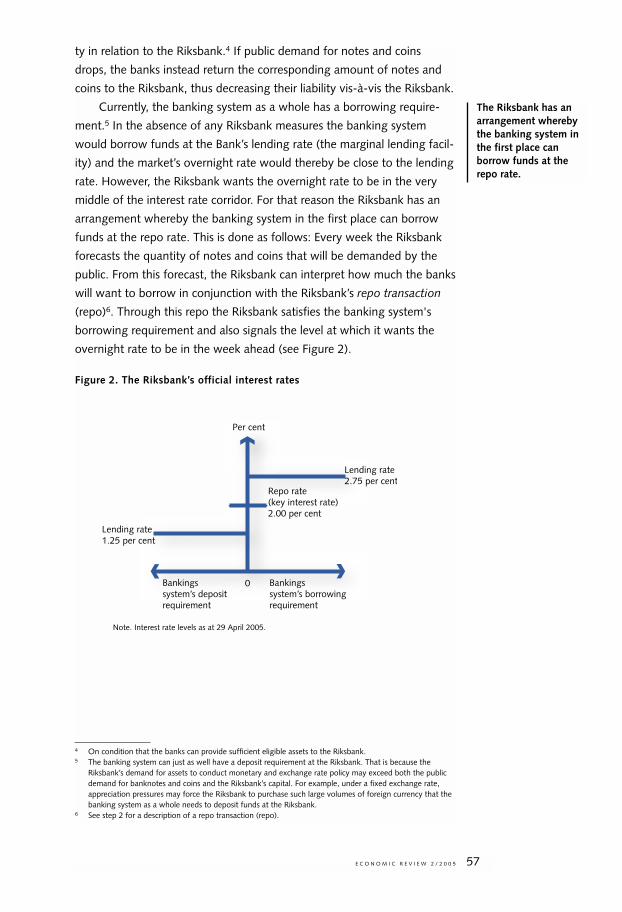
ty in relation to the Riksbank.4 If public demand for notes and coins
drops, the banks instead return the corresponding amount of notes and
coins to the Riksbank, thus decreasing their liability vis-à-vis the Riksbank.
Currently, the banking system as a whole has a borrowing require-
ment.5 In the absence of any Riksbank measures the banking system
would borrow funds at the Bank’s lending rate (the marginal lending facil-
ity) and the market’s overnight rate would thereby be close to the lending
rate. However, the Riksbank wants the overnight rate to be in the very
middle of the interest rate corridor. For that reason the Riksbank has an
arrangement whereby the banking system in the first place can borrow
funds at the repo rate. This is done as follows: Every week the Riksbank
forecasts the quantity of notes and coins that will be demanded by the
public. From this forecast, the Riksbank can interpret how much the banks
will want to borrow in conjunction with the Riksbank’s repo transaction
(repo)6. Through this repo the Riksbank satisfies the banking system's
borrowing requirement and also signals the level at which it wants the
overnight rate to be in the week ahead (see Figure 2).
Figure 2. The Riksbank’s official interest rates
E C O N O M I C R E V I E W 2 / 2 0 0 5 57
4 On condition that the banks can provide sufficient eligible assets to the Riksbank.5 The banking system can just as well have a deposit requirement at the Riksbank. That is because the
Riksbank’s demand for assets to conduct monetary and exchange rate policy may exceed both the publicdemand for banknotes and coins and the Riksbank’s capital. For example, under a fixed exchange rate,appreciation pressures may force the Riksbank to purchase such large volumes of foreign currency that thebanking system as a whole needs to deposit funds at the Riksbank.
6 See step 2 for a description of a repo transaction (repo).
The Riksbank has anarrangement wherebythe banking system inthe first place canborrow funds at therepo rate.
Per cent
Repo rate (key interest rate) 2.00 per cent
Lending rate 2.75 per cent
Lending rate1.25 per cent
Bankings system’s deposit requirement
Bankings system’s borrowing requirement
0
Note. Interest rate levels as at 29 April 2005.
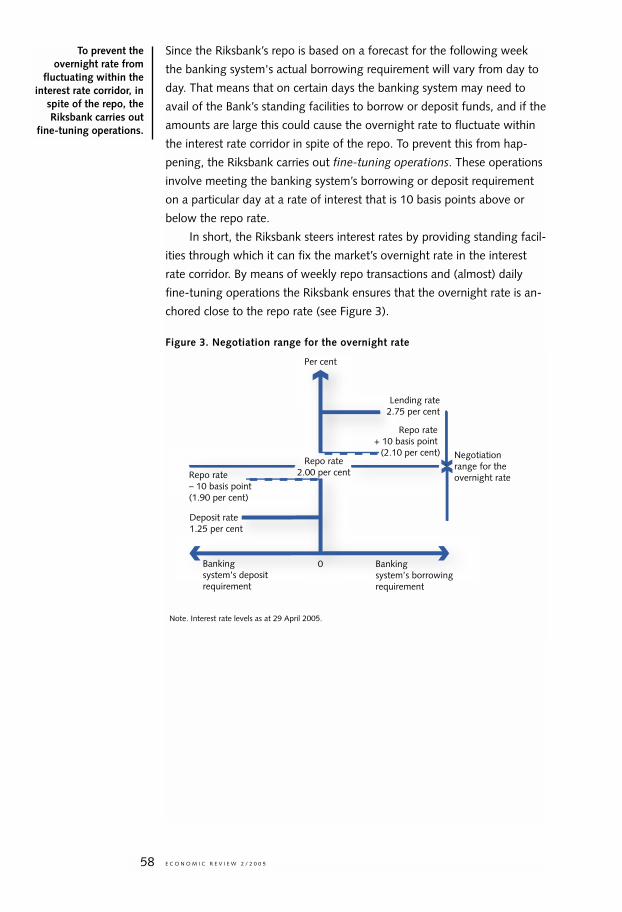
Since the Riksbank’s repo is based on a forecast for the following week
the banking system's actual borrowing requirement will vary from day to
day. That means that on certain days the banking system may need to
avail of the Bank’s standing facilities to borrow or deposit funds, and if the
amounts are large this could cause the overnight rate to fluctuate within
the interest rate corridor in spite of the repo. To prevent this from hap-
pening, the Riksbank carries out fine-tuning operations. These operations
involve meeting the banking system’s borrowing or deposit requirement
on a particular day at a rate of interest that is 10 basis points above or
below the repo rate.
In short, the Riksbank steers interest rates by providing standing facil-
ities through which it can fix the market’s overnight rate in the interest
rate corridor. By means of weekly repo transactions and (almost) daily
fine-tuning operations the Riksbank ensures that the overnight rate is an-
chored close to the repo rate (see Figure 3).
Figure 3. Negotiation range for the overnight rate
E C O N O M I C R E V I E W 2 / 2 0 0 558
To prevent theovernight rate from
fluctuating within theinterest rate corridor, in
spite of the repo, theRiksbank carries out
fine-tuning operations.
Repo rate + 10 basis point
(2.10 per cent)
Per cent
Repo rate2.00 per cent
Lending rate2.75 per cent
Deposit rate1.25 per cent
Repo rate – 10 basis point (1.90 per cent)
Negotiation range for theovernight rate
Banking system’s depositrequirement
Banking system’s borrowingrequirement
0
Note. Interest rate levels as at 29 April 2005.
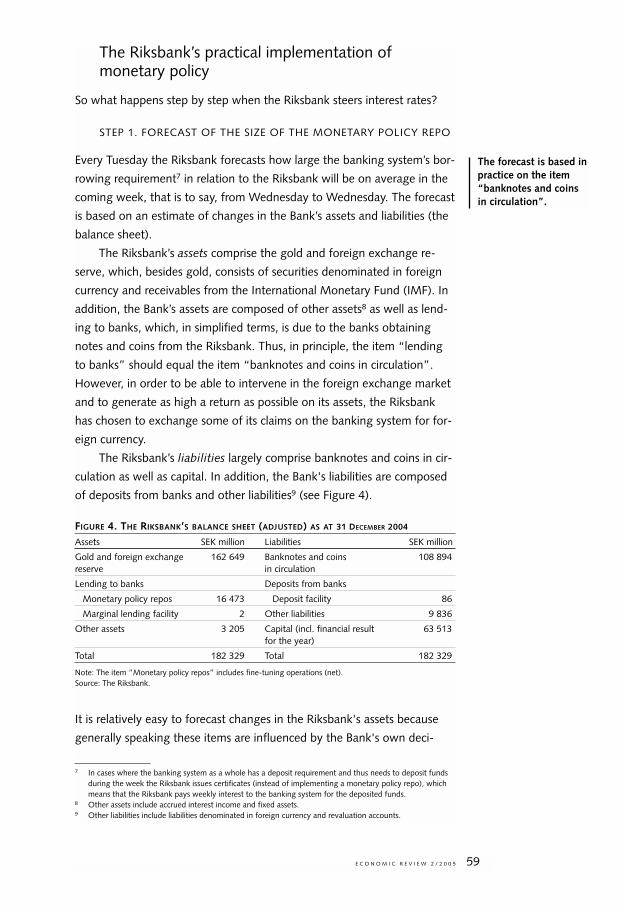
The Riksbank’s practical implementation ofmonetary policy
So what happens step by step when the Riksbank steers interest rates?
STEP 1. FORECAST OF THE SIZE OF THE MONETARY POLICY REPO
Every Tuesday the Riksbank forecasts how large the banking system’s bor-
rowing requirement7 in relation to the Riksbank will be on average in the
coming week, that is to say, from Wednesday to Wednesday. The forecast
is based on an estimate of changes in the Bank’s assets and liabilities (the
balance sheet).
The Riksbank’s assets comprise the gold and foreign exchange re-
serve, which, besides gold, consists of securities denominated in foreign
currency and receivables from the International Monetary Fund (IMF). In
addition, the Bank’s assets are composed of other assets8 as well as lend-
ing to banks, which, in simplified terms, is due to the banks obtaining
notes and coins from the Riksbank. Thus, in principle, the item “lending
to banks” should equal the item “banknotes and coins in circulation”.
However, in order to be able to intervene in the foreign exchange market
and to generate as high a return as possible on its assets, the Riksbank
has chosen to exchange some of its claims on the banking system for for-
eign currency.
The Riksbank’s liabilities largely comprise banknotes and coins in cir-
culation as well as capital. In addition, the Bank's liabilities are composed
of deposits from banks and other liabilities9 (see Figure 4).
FIGURE 4. THE RIKSBANK’S BALANCE SHEET (ADJUSTED) AS AT 31 DECEMBER 2004
Assets SEK million Liabilities SEK million
Gold and foreign exchange 162 649 Banknotes and coins 108 894reserve in circulation
Lending to banks Deposits from banks
Monetary policy repos 16 473 Deposit facility 86
Marginal lending facility 2 Other liabilities 9 836
Other assets 3 205 Capital (incl. financial result 63 513for the year)
Total 182 329 Total 182 329
Note: The item ”Monetary policy repos” includes fine-tuning operations (net).Source: The Riksbank.
It is relatively easy to forecast changes in the Riksbank's assets because
generally speaking these items are influenced by the Bank's own deci-
E C O N O M I C R E V I E W 2 / 2 0 0 5 59
7 In cases where the banking system as a whole has a deposit requirement and thus needs to deposit fundsduring the week the Riksbank issues certificates (instead of implementing a monetary policy repo), whichmeans that the Riksbank pays weekly interest to the banking system for the deposited funds.
8 Other assets include accrued interest income and fixed assets.9 Other liabilities include liabilities denominated in foreign currency and revaluation accounts.
The forecast is based inpractice on the item“banknotes and coinsin circulation”.
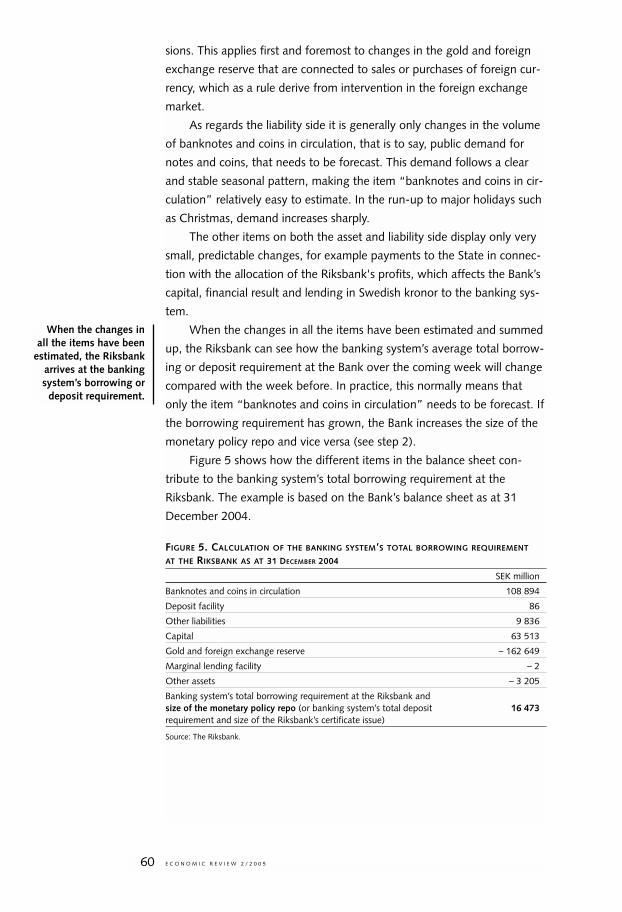
sions. This applies first and foremost to changes in the gold and foreign
exchange reserve that are connected to sales or purchases of foreign cur-
rency, which as a rule derive from intervention in the foreign exchange
market.
As regards the liability side it is generally only changes in the volume
of banknotes and coins in circulation, that is to say, public demand for
notes and coins, that needs to be forecast. This demand follows a clear
and stable seasonal pattern, making the item “banknotes and coins in cir-
culation” relatively easy to estimate. In the run-up to major holidays such
as Christmas, demand increases sharply.
The other items on both the asset and liability side display only very
small, predictable changes, for example payments to the State in connec-
tion with the allocation of the Riksbank's profits, which affects the Bank’s
capital, financial result and lending in Swedish kronor to the banking sys-
tem.
When the changes in all the items have been estimated and summed
up, the Riksbank can see how the banking system’s average total borrow-
ing or deposit requirement at the Bank over the coming week will change
compared with the week before. In practice, this normally means that
only the item “banknotes and coins in circulation” needs to be forecast. If
the borrowing requirement has grown, the Bank increases the size of the
monetary policy repo and vice versa (see step 2).
Figure 5 shows how the different items in the balance sheet con-
tribute to the banking system’s total borrowing requirement at the
Riksbank. The example is based on the Bank’s balance sheet as at 31
December 2004.
FIGURE 5. CALCULATION OF THE BANKING SYSTEM’S TOTAL BORROWING REQUIREMENT
AT THE RIKSBANK AS AT 31 DECEMBER 2004
SEK million
Banknotes and coins in circulation 108 894
Deposit facility 86
Other liabilities 9 836
Capital 63 513
Gold and foreign exchange reserve – 162 649
Marginal lending facility – 2
Other assets – 3 205
Banking system’s total borrowing requirement at the Riksbank andsize of the monetary policy repo (or banking system’s total deposit 16 473requirement and size of the Riksbank’s certificate issue)
Source: The Riksbank.
E C O N O M I C R E V I E W 2 / 2 0 0 560
When the changes inall the items have been
estimated, the Riksbankarrives at the bankingsystem’s borrowing or
deposit requirement.
STEP 2. IMPLEMENTATION OF THE MONETARY POLICY REPO
Having arrived at the liquidity forecast and calculated the banking sys-
tem’s average total borrowing or deposit requirement10 the Riksbank
implements a monetary policy repo (or issues certificates).
The Riksbank’s repo11 is designed in the same way as an ordinary
repo instrument in the financial markets.12 Repos in the financial markets
are sale and purchase agreements whereby one party agrees to sell a
security to another party and to repurchase the security at a predeter-
mined price on a specific future date. The price of a repo is represented by
the repo rate, that is to say, the lending rate over the maturity of the
repo.13
As a rule, the monetary policy repo has a maturity of one week, from
Wednesday to Wednesday. Thus, once a week the Riksbank buys securi-
ties from the banks and simultaneously agrees to resell them to the banks
a week later.
When the repo matures, the banks pay interest (the repo rate) on the
past week’s “loans”. At the same time, the Riksbank implements a new
repo, giving the banks the opportunity to renew their “loans” and there-
by “borrow” from the Riksbank for another week. The size of the “loans”
from the Riksbank may vary from week to week, however, depending on
the Riksbank’s forecast (see Step 1).
Because the repo in most cases has a maturity of only one week the
Riksbank can change the repo rate each week.14 In other words, one could
say that over time the banking system borrows funds at a variable rate of
interest from the Riksbank but that the rate is fixed for one week at a time.
So the starting point for the monetary policy repo is the banks' bor-
rowing requirement in relation to the Riksbank. The fact that the repo is
basically constructed as a purchase of securities in exchange for capital is a
purely technical issue. The Riksbank could just as easily grant ordinary
loans with a maturity of one week in return for interest, with securities as
collateral for the loans.
E C O N O M I C R E V I E W 2 / 2 0 0 5 61
10 It is usual to say that the banking system has a structural liquidity deficit or liquidity surplus, thereforeindicating how much liquidity the Riksbank needs to provide or absorb in the market. This terminologycreates some confusion, however, since the Riksbank neither provides nor absorbs liquidity in the market.For that reason it is more correct to say that the banking system has a borrowing or deposit requirement atthe Riksbank.
11 The term “repo” is short for repurchase agreement.12 Strictly speaking, the Riksbank’s repo in this case is a “reverse repo” since the Riksbank first buys securities
and subsequently sells them back. A repo is when a party first sells and then repurchase securities.13 The repo rate for a repo instrument in the financial markets should not be confused with the Riksbank’s
repo rate, which is in this case the Bank’s key interest rate.14 In practice, the repo rate is adjusted in connection with the Bank’s pre-announced monetary policy
meetings, which as a rule are held eight times a year. Extra meetings may be called, as was the case whenthe repo rate was cut after the terrorist attack in New York on 11 September 2001.
As a rule, the monetarypolicy repo has amaturity of one week.
The starting point forthe monetary policyrepo is the banks’borrowing requirementin relation to theRiksbank.
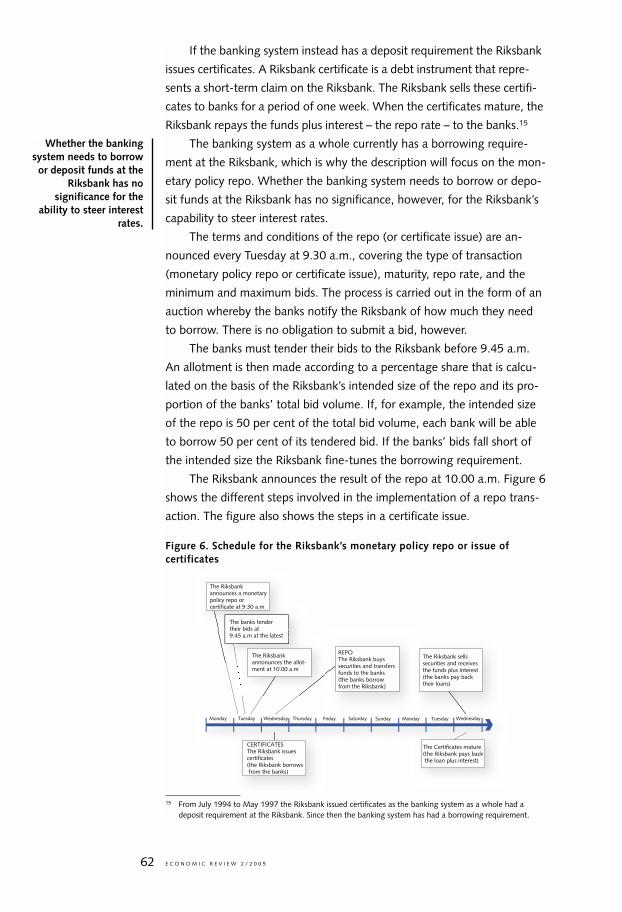
If the banking system instead has a deposit requirement the Riksbank
issues certificates. A Riksbank certificate is a debt instrument that repre-
sents a short-term claim on the Riksbank. The Riksbank sells these certifi-
cates to banks for a period of one week. When the certificates mature, the
Riksbank repays the funds plus interest – the repo rate – to the banks.15
The banking system as a whole currently has a borrowing require-
ment at the Riksbank, which is why the description will focus on the mon-
etary policy repo. Whether the banking system needs to borrow or depo-
sit funds at the Riksbank has no significance, however, for the Riksbank’s
capability to steer interest rates.
The terms and conditions of the repo (or certificate issue) are an-
nounced every Tuesday at 9.30 a.m., covering the type of transaction
(monetary policy repo or certificate issue), maturity, repo rate, and the
minimum and maximum bids. The process is carried out in the form of an
auction whereby the banks notify the Riksbank of how much they need
to borrow. There is no obligation to submit a bid, however.
The banks must tender their bids to the Riksbank before 9.45 a.m.
An allotment is then made according to a percentage share that is calcu-
lated on the basis of the Riksbank’s intended size of the repo and its pro-
portion of the banks’ total bid volume. If, for example, the intended size
of the repo is 50 per cent of the total bid volume, each bank will be able
to borrow 50 per cent of its tendered bid. If the banks’ bids fall short of
the intended size the Riksbank fine-tunes the borrowing requirement.
The Riksbank announces the result of the repo at 10.00 a.m. Figure 6
shows the different steps involved in the implementation of a repo trans-
action. The figure also shows the steps in a certificate issue.
Figure 6. Schedule for the Riksbank’s monetary policy repo or issue ofcertificates
E C O N O M I C R E V I E W 2 / 2 0 0 562
15 From July 1994 to May 1997 the Riksbank issued certificates as the banking system as a whole had adeposit requirement at the Riksbank. Since then the banking system has had a borrowing requirement.
Whether the bankingsystem needs to borrowor deposit funds at the
Riksbank has nosignificance for the
ability to steer interestrates.
Tuesday Wednesday Thursday Friday Saturday Sunday Monday Tuesday Wednesday
The Riksbank announces a monetary policy repo or certificate at 9.30 a.m
REPOThe Riksbank buys securities and transfersfunds to the banks (the banks borrow from the Riksbank)
The Riksbank sells securities and receivesthe funds plus interest(the banks pay back their loans)
The Certificates mature (the Riksbank pays back the loan plus interest)
The banks tender their bids at 9.45 a.m at the latest
The Riksbank annonunces the allot-ment at 10.00 a.m
Monday
CERTIFICATESThe Riksbank issues certificates (the Riksbank borrows from the banks)
STEP 3. IMPLEMENTATION OF THE FINE-TUNING OPERATIONS
The banking system’s actual daily borrowing or deposit requirement at the
Riksbank may differ from the Bank's forecast for the average requirement
over the week. That means that the banking system may need to borrow
or deposit funds through the standing facilities.
Since the Riksbank wants a stable overnight rate, the Bank therefore
carries out fine-tuning operations.
Those banks that have a borrowing or deposit requirement at the
end of the day, and that have not managed to resolve this in the over-
night market, will call the Riksbank after 4.20 p.m. to ask whether the
Bank is offering fine-tuning. The Riksbank has details of both individual
banks’ account balances in RIX and of the banking system’s total position
in relation to the Riksbank. If the requested amount can be matched by
another bank the Riksbank asks the enquiring bank to contact other
banks. If there are no matching positions at the other banks the Riksbank
performs a fine-tuning operation equal to the requested amount or parts
thereof with the enquiring bank.
If, for example, the banking system as a whole has a borrowing re-
quirement of 100 and the Riksbank is contacted by a bank with a borrow-
ing requirement of 150, the Riksbank will only perform fine-tuning opera-
tions for 100. That is because a different bank (or several banks between
them) needs to deposit 50, and the banks are thereby expected to bal-
ance this out in the overnight market.
The Riksbank performs fine-tuning operations between 4.20 p.m.
and 4.40 p.m. as it is not until 4.20 p.m. that the Riksbank has full details
of the banking system's borrowing or deposit requirement.16
Simple, market-oriented operational framework
The Riksbank’s operational framework has a relatively simple design and is
very similar to that employed by other central banks.
It is reasonable to ask, of course, whether it is possible to simplify the
framework further. It is likely, for example, that an even narrower interest
rate corridor would be able to achieve a stable overnight rate. The ques-
tion, though, is how narrow the corridor can become before the shortest-
term market, that is the overnight market, ceases to function as the incen-
tives for the banks to borrow and deposit funds with each other disappear.
In such a situation, the banks will decide to borrow and deposit funds at
the Riksbank only. Since the Riksbank strives for a market-oriented opera-
tional framework, alternative solutions have been rejected in favour of the
current framework, which evidently works well.
E C O N O M I C R E V I E W 2 / 2 0 0 5 63
16 The banks can return banknotes up to this time.
If there are no matchingpositions between thebanks the Riksbankperforms a fine-tuningoperation.
Since the Riksbankstrives for a market-oriented operationalframework, the currentsolution whichevidently works wellwas the evident choice.
References
Daltung, S. & Ericson, M., (2004), ”Cash-supply efficiency”, SverigesRiksbank Economic Review, no. 3.
Ernhagen, T., Vesterlund, M. & Viotti, S., (2002), “Central banks’ equityneeds”, Sveriges Riksbank Economic Review, no. 2.
Mitlid, K. & Vesterlund, M., (2001), “Steering interest rates in monetarypolicy – how does it work?”, Sveriges Riksbank Economic Review,no. 1.
Sveriges Riksbank, (2004a), The Swedish Financial Market 2004, chapterentitled “The financial infrastructure”.
Sveriges Riksbank, (2004b), Annual Report 2003, section entitled “Cashmanagement” under “The Riksbank’s methods of working”.
Viotti, S., (2004), “Swedish Monetary Policy”, Sveriges RiksbankEconomic Review, no. 2.
E C O N O M I C R E V I E W 2 / 2 0 0 564

■ Notices
Preview of Tumba Bruk museum
On 22 March 2005 the Riksbank offered a preview of Tumba Bruk muse-um’s newly renovated premises. Tumba Bruk paper mill was founded in1755 and celebrates its 250th anniversary this year. The mill premises willnow become a museum. Paper for banknotes was manufactured here onbehalf of the Riksbank until a few years ago, when these operations weretaken over by the American company Crane AB.
Three buildings will house exhibitions showing the history of bank-notes, paper manufacturing and life at the paper mill. Tumba Bruk muse-um was founded in connection with the Riksbank donating the buildingsto the National Property Board and commissioning the Royal CoinCabinet to build up and run a new museum.
Executive Board visits Jämtland
The Executive Board of the Riksbank visited Jämtland county on 7–8April. They held a meeting in Östersund and made a number of study vi-sits in the region, including a visit to Trångsviken outside Östersund.
The Riksbank has located some of its meetings outside of Stockholm inrecent years with the purpose of providing greater opportunity to discusseconomic developments with representatives of various sectors andregions in the country, and to obtain views on the Riksbank’s activities.
Commemorative banknote – 250th anniversary of theTumba Bruk paper mill
To celebrate the 250th anniversary of the Tumba Bruk banknote paper millSveriges Riksbank is issuing a commemorative banknote with the denomi-nation 100 kronor. The note has been furnished with modern security fea-tures but has an old design. The motif on the face of the note is ‘MotherSweden’, according to the pattern used on notes at the end of the 19th
century. The main motif on the reverse of the note is an old blueprint ofTumba Bruk and a picture of paper manufacture from the 18th century.
The note will be issued in a limited edition of 100,000 and will be deli-vered in a folder. The sales price is SEK 150. The price of the banknote hasbeen set with a view to covering marketing and other sales costs. Theofficial issuance date is 26 May, when the Post Office will also be markingthe 250th anniversary of Tumba Bruk by issuing a commemorative stamp.
E C O N O M I C R E V I E W 2 / 2 0 0 5 65

The commemorative banknote can be ordered as of 2 May on the Bank’swebsite, www.riksbank.se, or by telephone at +46 8 787 02 50.The note will also be on sale at the Royal Coin Cabinet in Stockholm.Other wholesale dealers will also be able to buy the note for further sale.
E C O N O M I C R E V I E W 2 / 2 0 0 566
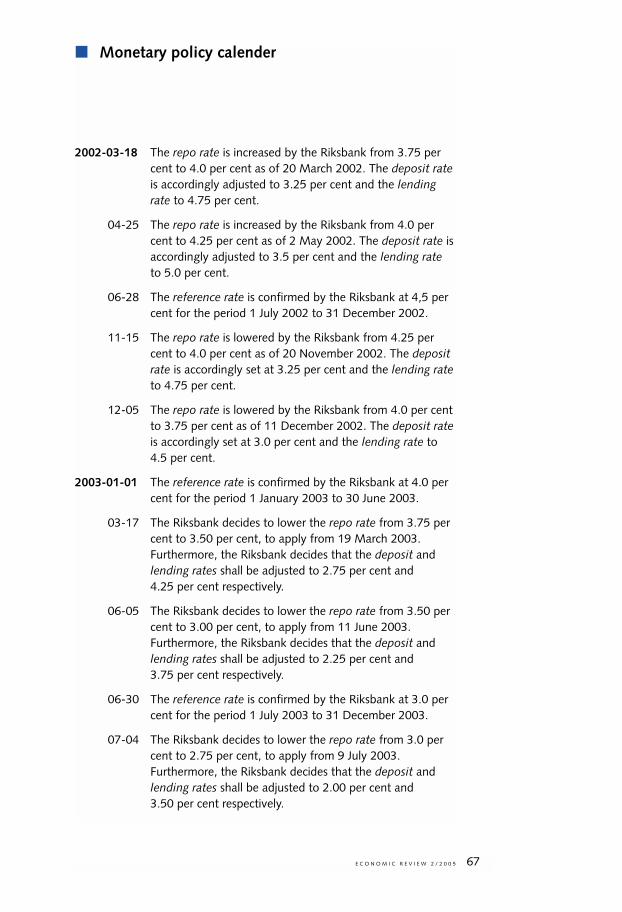
■ Monetary policy calender
2002-03-18 The repo rate is increased by the Riksbank from 3.75 percent to 4.0 per cent as of 20 March 2002. The deposit rateis accordingly adjusted to 3.25 per cent and the lendingrate to 4.75 per cent.
04-25 The repo rate is increased by the Riksbank from 4.0 percent to 4.25 per cent as of 2 May 2002. The deposit rate isaccordingly adjusted to 3.5 per cent and the lending rateto 5.0 per cent.
06-28 The reference rate is confirmed by the Riksbank at 4,5 percent for the period 1 July 2002 to 31 December 2002.
11-15 The repo rate is lowered by the Riksbank from 4.25 percent to 4.0 per cent as of 20 November 2002. The depositrate is accordingly set at 3.25 per cent and the lending rateto 4.75 per cent.
12-05 The repo rate is lowered by the Riksbank from 4.0 per centto 3.75 per cent as of 11 December 2002. The deposit rateis accordingly set at 3.0 per cent and the lending rate to4.5 per cent.
2003-01-01 The reference rate is confirmed by the Riksbank at 4.0 percent for the period 1 January 2003 to 30 June 2003.
03-17 The Riksbank decides to lower the repo rate from 3.75 percent to 3.50 per cent, to apply from 19 March 2003.Furthermore, the Riksbank decides that the deposit andlending rates shall be adjusted to 2.75 per cent and4.25 per cent respectively.
06-05 The Riksbank decides to lower the repo rate from 3.50 percent to 3.00 per cent, to apply from 11 June 2003.Furthermore, the Riksbank decides that the deposit andlending rates shall be adjusted to 2.25 per cent and3.75 per cent respectively.
06-30 The reference rate is confirmed by the Riksbank at 3.0 percent for the period 1 July 2003 to 31 December 2003.
07-04 The Riksbank decides to lower the repo rate from 3.0 percent to 2.75 per cent, to apply from 9 July 2003.Furthermore, the Riksbank decides that the deposit andlending rates shall be adjusted to 2.00 per cent and3.50 per cent respectively.
E C O N O M I C R E V I E W 2 / 2 0 0 5 67

2004-01-01 The reference rate is confirmed by the Riksbank at 3.0 percent for the period 1 January 2004 to 30 June 2004.
02-06 The Riksbank decides to lower the repo rate from 2.75 percent to 2.50 per cent, to apply from 11 February 2004.Furthermore, the Riksbank decides that the deposit andlending rates shall be adjusted to 1.75 per cent and 3.25per cent respectively.
03-31 The Riksbank decides to lower the repo rate from 2.50 percent to 2.00 per cent, to apply from 7 April 2004.Furthermore, the Riksbank decides that the deposit andlending rates shall be adjusted to 1.25 per cent and 2.75per cent respectively.
06-30 The reference rate is confirmed by the Riksbank at 2.0 percent for the period 1 July 2004 to 31 December 2004.
2005-01-01 The reference rate is confirmed by the Riksbank at 2.00 percent for the period 1 January 2005 to 30 June 2005.
E C O N O M I C R E V I E W 2 / 2 0 0 568
■ Statistical appendix
1 Riksbank’s assets and liabilities 71
2 Money supply 72
3 Interest rates set by the Riksbank 73
4 Capital market interest rates 73
5 Overnight and money market interest rates 74
6 Treasury bill and selected international rates 75
7 Krona exchage rate: TCW index and selected exchange rates 76
8 Nominal effective TCW exchange rate 77
E C O N O M I C R E V I E W 2 / 2 0 0 5 69
Statistics from Sveriges Riksbank are to be found on the Internet (www.riksbank.se). Dates of publication ofstatistics regarding the Riksbank’s assets and liabilities including foreign exchange reserves plus financial marketand the balance of payments statistics are available on the website of the International Monetary Fund (IMF)(dsbb.imf.org). Dates of publication are also available on www.riksbank.se.

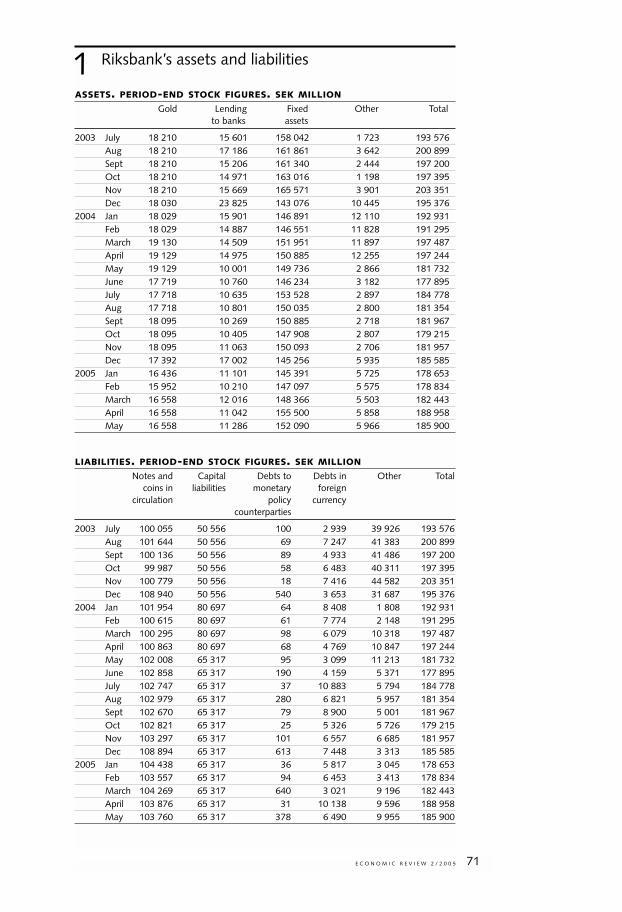
Riksbank’s assets and liabilities
ASSETS. PERIOD-END STOCK FIGURES. SEK MILLION
Gold Lending Fixed Other Totalto banks assets
2003 July 18 210 15 601 158 042 1 723 193 576Aug 18 210 17 186 161 861 3 642 200 899Sept 18 210 15 206 161 340 2 444 197 200Oct 18 210 14 971 163 016 1 198 197 395Nov 18 210 15 669 165 571 3 901 203 351Dec 18 030 23 825 143 076 10 445 195 376
2004 Jan 18 029 15 901 146 891 12 110 192 931Feb 18 029 14 887 146 551 11 828 191 295March 19 130 14 509 151 951 11 897 197 487April 19 129 14 975 150 885 12 255 197 244May 19 129 10 001 149 736 2 866 181 732June 17 719 10 760 146 234 3 182 177 895July 17 718 10 635 153 528 2 897 184 778Aug 17 718 10 801 150 035 2 800 181 354Sept 18 095 10 269 150 885 2 718 181 967Oct 18 095 10 405 147 908 2 807 179 215Nov 18 095 11 063 150 093 2 706 181 957Dec 17 392 17 002 145 256 5 935 185 585
2005 Jan 16 436 11 101 145 391 5 725 178 653Feb 15 952 10 210 147 097 5 575 178 834March 16 558 12 016 148 366 5 503 182 443April 16 558 11 042 155 500 5 858 188 958May 16 558 11 286 152 090 5 966 185 900
LIABILITIES. PERIOD-END STOCK FIGURES. SEK MILLION
Notes and Capital Debts to Debts in Other Totalcoins in liabilities monetary foreign
circulation policy currencycounterparties
2003 July 100 055 50 556 100 2 939 39 926 193 576Aug 101 644 50 556 69 7 247 41 383 200 899Sept 100 136 50 556 89 4 933 41 486 197 200Oct 99 987 50 556 58 6 483 40 311 197 395Nov 100 779 50 556 18 7 416 44 582 203 351Dec 108 940 50 556 540 3 653 31 687 195 376
2004 Jan 101 954 80 697 64 8 408 1 808 192 931Feb 100 615 80 697 61 7 774 2 148 191 295March 100 295 80 697 98 6 079 10 318 197 487April 100 863 80 697 68 4 769 10 847 197 244May 102 008 65 317 95 3 099 11 213 181 732June 102 858 65 317 190 4 159 5 371 177 895July 102 747 65 317 37 10 883 5 794 184 778Aug 102 979 65 317 280 6 821 5 957 181 354Sept 102 670 65 317 79 8 900 5 001 181 967Oct 102 821 65 317 25 5 326 5 726 179 215Nov 103 297 65 317 101 6 557 6 685 181 957Dec 108 894 65 317 613 7 448 3 313 185 585
2005 Jan 104 438 65 317 36 5 817 3 045 178 653Feb 103 557 65 317 94 6 453 3 413 178 834March 104 269 65 317 640 3 021 9 196 182 443April 103 876 65 317 31 10 138 9 596 188 958May 103 760 65 317 378 6 490 9 955 185 900
E C O N O M I C R E V I E W 2 / 2 0 0 5 71
1
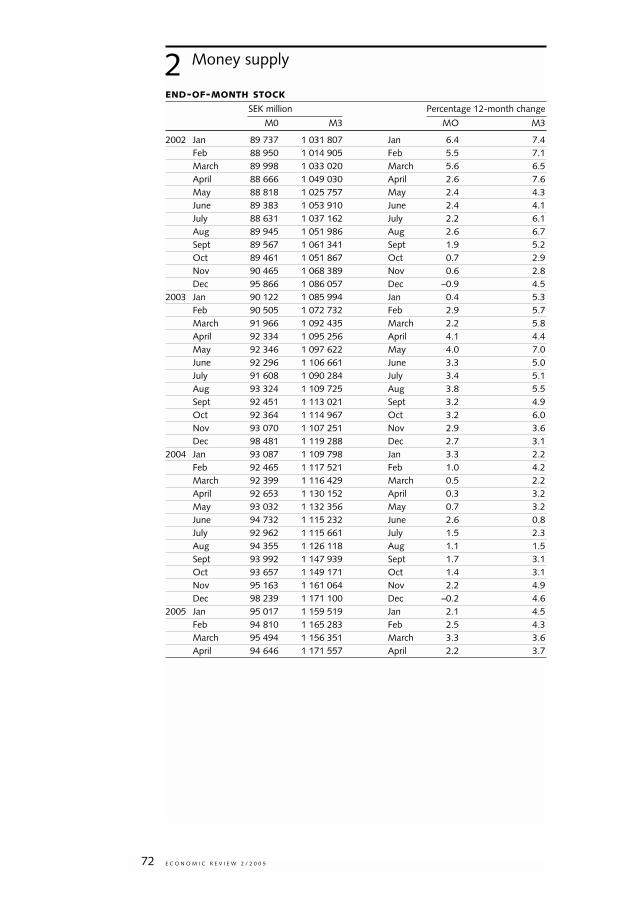
Money supply
END-OF-MONTH STOCK
SEK million Percentage 12-month change
M0 M3 MO M3
2002 Jan 89 737 1 031 807 Jan 6.4 7.4Feb 88 950 1 014 905 Feb 5.5 7.1March 89 998 1 033 020 March 5.6 6.5April 88 666 1 049 030 April 2.6 7.6May 88 818 1 025 757 May 2.4 4.3June 89 383 1 053 910 June 2.4 4.1July 88 631 1 037 162 July 2.2 6.1Aug 89 945 1 051 986 Aug 2.6 6.7Sept 89 567 1 061 341 Sept 1.9 5.2Oct 89 461 1 051 867 Oct 0.7 2.9Nov 90 465 1 068 389 Nov 0.6 2.8Dec 95 866 1 086 057 Dec –0.9 4.5
2003 Jan 90 122 1 085 994 Jan 0.4 5.3Feb 90 505 1 072 732 Feb 2.9 5.7March 91 966 1 092 435 March 2.2 5.8April 92 334 1 095 256 April 4.1 4.4May 92 346 1 097 622 May 4.0 7.0June 92 296 1 106 661 June 3.3 5.0July 91 608 1 090 284 July 3.4 5.1Aug 93 324 1 109 725 Aug 3.8 5.5Sept 92 451 1 113 021 Sept 3.2 4.9Oct 92 364 1 114 967 Oct 3.2 6.0Nov 93 070 1 107 251 Nov 2.9 3.6Dec 98 481 1 119 288 Dec 2.7 3.1
2004 Jan 93 087 1 109 798 Jan 3.3 2.2Feb 92 465 1 117 521 Feb 1.0 4.2March 92 399 1 116 429 March 0.5 2.2April 92 653 1 130 152 April 0.3 3.2May 93 032 1 132 356 May 0.7 3.2June 94 732 1 115 232 June 2.6 0.8July 92 962 1 115 661 July 1.5 2.3Aug 94 355 1 126 118 Aug 1.1 1.5Sept 93 992 1 147 939 Sept 1.7 3.1Oct 93 657 1 149 171 Oct 1.4 3.1Nov 95 163 1 161 064 Nov 2.2 4.9Dec 98 239 1 171 100 Dec –0.2 4.6
2005 Jan 95 017 1 159 519 Jan 2.1 4.5Feb 94 810 1 165 283 Feb 2.5 4.3March 95 494 1 156 351 March 3.3 3.6April 94 646 1 171 557 April 2.2 3.7
E C O N O M I C R E V I E W 2 / 2 0 0 572
2
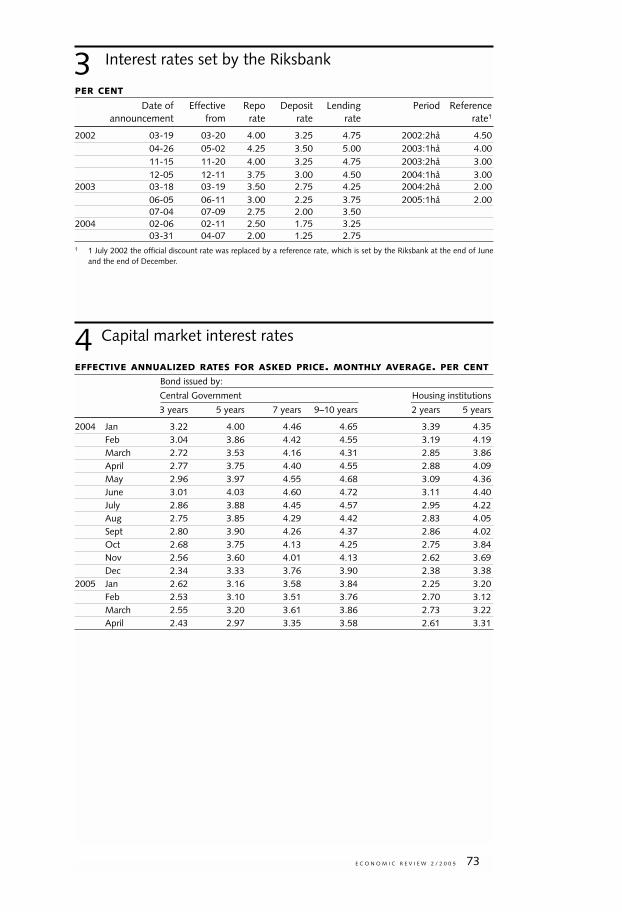
Interest rates set by the Riksbank
PER CENT
Date of Effective Repo Deposit Lending Period Referenceannouncement from rate rate rate rate1
2002 03-19 03-20 4.00 3.25 4.75 2002:2hå 4.5004-26 05-02 4.25 3.50 5.00 2003:1hå 4.0011-15 11-20 4.00 3.25 4.75 2003:2hå 3.0012-05 12-11 3.75 3.00 4.50 2004:1hå 3.00
2003 03-18 03-19 3.50 2.75 4.25 2004:2hå 2.0006-05 06-11 3.00 2.25 3.75 2005:1hå 2.0007-04 07-09 2.75 2.00 3.50
2004 02-06 02-11 2.50 1.75 3.2503-31 04-07 2.00 1.25 2.75
1 1 July 2002 the official discount rate was replaced by a reference rate, which is set by the Riksbank at the end of Juneand the end of December.
Capital market interest rates
EFFECTIVE ANNUALIZED RATES FOR ASKED PRICE. MONTHLY AVERAGE. PER CENT
Bond issued by:
Central Government Housing institutions
3 years 5 years 7 years 9–10 years 2 years 5 years
2004 Jan 3.22 4.00 4.46 4.65 3.39 4.35Feb 3.04 3.86 4.42 4.55 3.19 4.19March 2.72 3.53 4.16 4.31 2.85 3.86April 2.77 3.75 4.40 4.55 2.88 4.09May 2.96 3.97 4.55 4.68 3.09 4.36June 3.01 4.03 4.60 4.72 3.11 4.40July 2.86 3.88 4.45 4.57 2.95 4.22Aug 2.75 3.85 4.29 4.42 2.83 4.05Sept 2.80 3.90 4.26 4.37 2.86 4.02Oct 2.68 3.75 4.13 4.25 2.75 3.84Nov 2.56 3.60 4.01 4.13 2.62 3.69Dec 2.34 3.33 3.76 3.90 2.38 3.38
2005 Jan 2.62 3.16 3.58 3.84 2.25 3.20Feb 2.53 3.10 3.51 3.76 2.70 3.12March 2.55 3.20 3.61 3.86 2.73 3.22April 2.43 2.97 3.35 3.58 2.61 3.31
E C O N O M I C R E V I E W 2 / 2 0 0 5 73
3
4
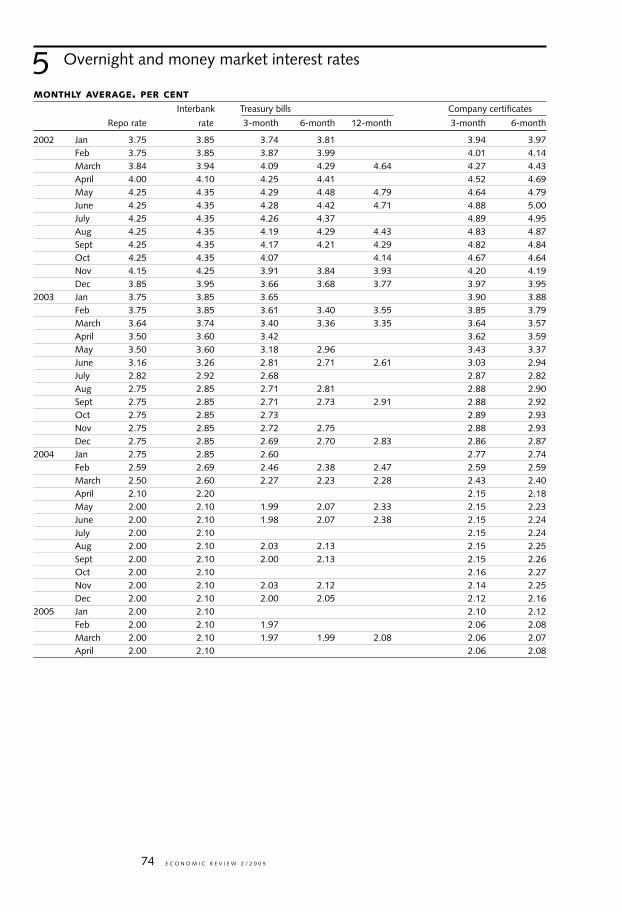
Overnight and money market interest rates
MONTHLY AVERAGE. PER CENT
Interbank Treasury bills Company certificates
Repo rate rate 3-month 6-month 12-month 3-month 6-month
2002 Jan 3.75 3.85 3.74 3.81 3.94 3.97Feb 3.75 3.85 3.87 3.99 4.01 4.14March 3.84 3.94 4.09 4.29 4.64 4.27 4.43April 4.00 4.10 4.25 4.41 4.52 4.69May 4.25 4.35 4.29 4.48 4.79 4.64 4.79June 4.25 4.35 4.28 4.42 4.71 4.88 5.00July 4.25 4.35 4.26 4.37 4.89 4.95Aug 4.25 4.35 4.19 4.29 4.43 4.83 4.87Sept 4.25 4.35 4.17 4.21 4.29 4.82 4.84Oct 4.25 4.35 4.07 4.14 4.67 4.64Nov 4.15 4.25 3.91 3.84 3.93 4.20 4.19Dec 3.85 3.95 3.66 3.68 3.77 3.97 3.95
2003 Jan 3.75 3.85 3.65 3.90 3.88Feb 3.75 3.85 3.61 3.40 3.55 3.85 3.79March 3.64 3.74 3.40 3.36 3.35 3.64 3.57April 3.50 3.60 3.42 3.62 3.59May 3.50 3.60 3.18 2.96 3.43 3.37June 3.16 3.26 2.81 2.71 2.61 3.03 2.94July 2.82 2.92 2.68 2.87 2.82Aug 2.75 2.85 2.71 2.81 2.88 2.90Sept 2.75 2.85 2.71 2.73 2.91 2.88 2.92Oct 2.75 2.85 2.73 2.89 2.93Nov 2.75 2.85 2.72 2.75 2.88 2.93Dec 2.75 2.85 2.69 2.70 2.83 2.86 2.87
2004 Jan 2.75 2.85 2.60 2.77 2.74Feb 2.59 2.69 2.46 2.38 2.47 2.59 2.59March 2.50 2.60 2.27 2.23 2.28 2.43 2.40April 2.10 2.20 2.15 2.18May 2.00 2.10 1.99 2.07 2.33 2.15 2.23June 2.00 2.10 1.98 2.07 2.38 2.15 2.24July 2.00 2.10 2.15 2.24Aug 2.00 2.10 2.03 2.13 2.15 2.25Sept 2.00 2.10 2.00 2.13 2.15 2.26Oct 2.00 2.10 2.16 2.27Nov 2.00 2.10 2.03 2.12 2.14 2.25Dec 2.00 2.10 2.00 2.05 2.12 2.16
2005 Jan 2.00 2.10 2.10 2.12Feb 2.00 2.10 1.97 2.06 2.08March 2.00 2.10 1.97 1.99 2.08 2.06 2.07April 2.00 2.10 2.06 2.08
E C O N O M I C R E V I E W 2 / 2 0 0 574
5
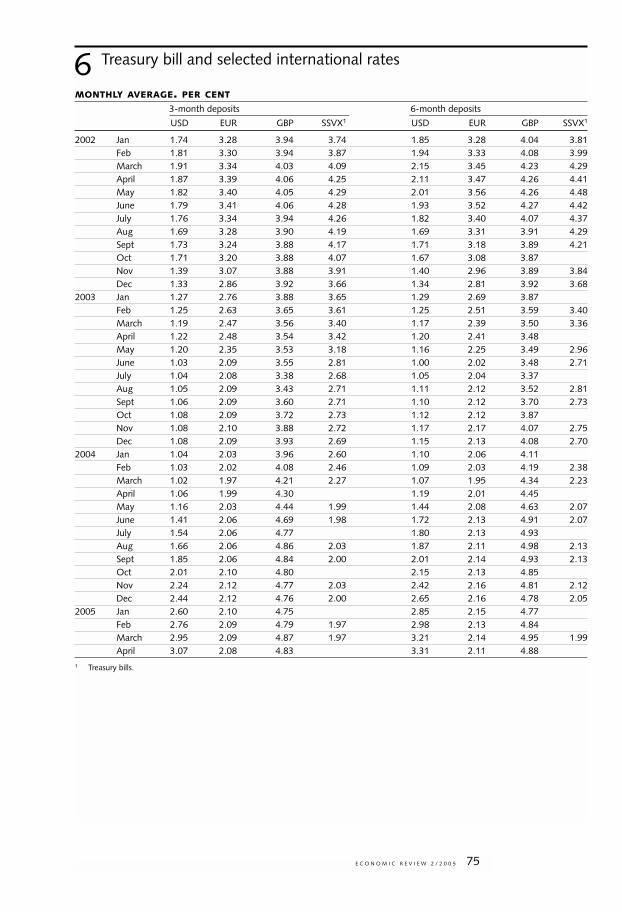
Treasury bill and selected international rates
MONTHLY AVERAGE. PER CENT
3-month deposits 6-month deposits
USD EUR GBP SSVX1 USD EUR GBP SSVX1
2002 Jan 1.74 3.28 3.94 3.74 1.85 3.28 4.04 3.81Feb 1.81 3.30 3.94 3.87 1.94 3.33 4.08 3.99March 1.91 3.34 4.03 4.09 2.15 3.45 4.23 4.29April 1.87 3.39 4.06 4.25 2.11 3.47 4.26 4.41May 1.82 3.40 4.05 4.29 2.01 3.56 4.26 4.48June 1.79 3.41 4.06 4.28 1.93 3.52 4.27 4.42July 1.76 3.34 3.94 4.26 1.82 3.40 4.07 4.37Aug 1.69 3.28 3.90 4.19 1.69 3.31 3.91 4.29Sept 1.73 3.24 3.88 4.17 1.71 3.18 3.89 4.21Oct 1.71 3.20 3.88 4.07 1.67 3.08 3.87Nov 1.39 3.07 3.88 3.91 1.40 2.96 3.89 3.84Dec 1.33 2.86 3.92 3.66 1.34 2.81 3.92 3.68
2003 Jan 1.27 2.76 3.88 3.65 1.29 2.69 3.87Feb 1.25 2.63 3.65 3.61 1.25 2.51 3.59 3.40March 1.19 2.47 3.56 3.40 1.17 2.39 3.50 3.36April 1.22 2.48 3.54 3.42 1.20 2.41 3.48May 1.20 2.35 3.53 3.18 1.16 2.25 3.49 2.96June 1.03 2.09 3.55 2.81 1.00 2.02 3.48 2.71July 1.04 2.08 3.38 2.68 1.05 2.04 3.37Aug 1.05 2.09 3.43 2.71 1.11 2.12 3.52 2.81Sept 1.06 2.09 3.60 2.71 1.10 2.12 3.70 2.73Oct 1.08 2.09 3.72 2.73 1.12 2.12 3.87Nov 1.08 2.10 3.88 2.72 1.17 2.17 4.07 2.75Dec 1.08 2.09 3.93 2.69 1.15 2.13 4.08 2.70
2004 Jan 1.04 2.03 3.96 2.60 1.10 2.06 4.11Feb 1.03 2.02 4.08 2.46 1.09 2.03 4.19 2.38March 1.02 1.97 4.21 2.27 1.07 1.95 4.34 2.23April 1.06 1.99 4.30 1.19 2.01 4.45May 1.16 2.03 4.44 1.99 1.44 2.08 4.63 2.07June 1.41 2.06 4.69 1.98 1.72 2.13 4.91 2.07July 1.54 2.06 4.77 1.80 2.13 4.93Aug 1.66 2.06 4.86 2.03 1.87 2.11 4.98 2.13Sept 1.85 2.06 4.84 2.00 2.01 2.14 4.93 2.13Oct 2.01 2.10 4.80 2.15 2.13 4.85Nov 2.24 2.12 4.77 2.03 2.42 2.16 4.81 2.12Dec 2.44 2.12 4.76 2.00 2.65 2.16 4.78 2.05
2005 Jan 2.60 2.10 4.75 2.85 2.15 4.77Feb 2.76 2.09 4.79 1.97 2.98 2.13 4.84March 2.95 2.09 4.87 1.97 3.21 2.14 4.95 1.99April 3.07 2.08 4.83 3.31 2.11 4.88
1 Treasury bills.
E C O N O M I C R E V I E W 2 / 2 0 0 5 75
6
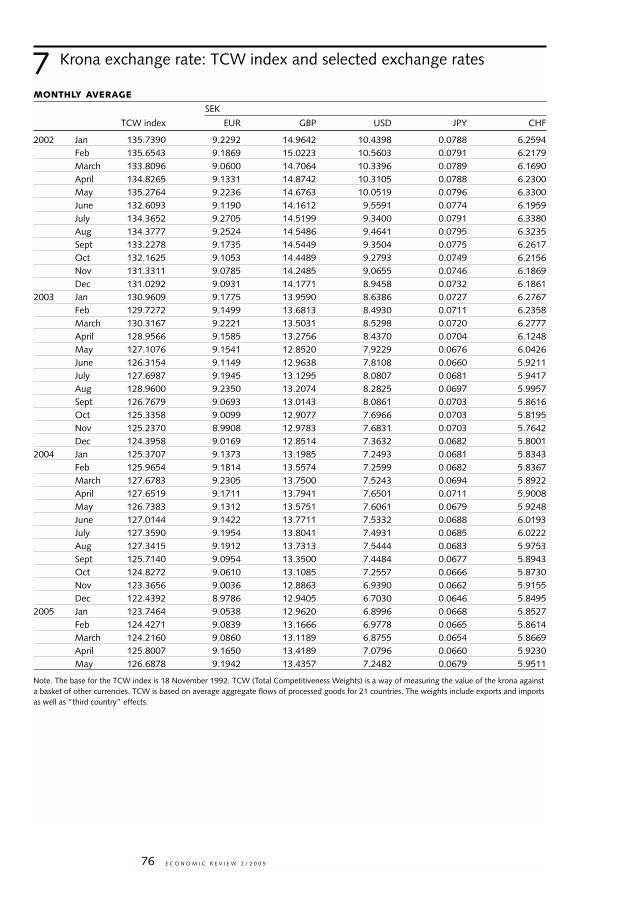
Krona exchange rate: TCW index and selected exchange rates
MONTHLY AVERAGE
SEK
TCW index EUR GBP USD JPY CHF
2002 Jan 135.7390 9.2292 14.9642 10.4398 0.0788 6.2594Feb 135.6543 9.1869 15.0223 10.5603 0.0791 6.2179March 133.8096 9.0600 14.7064 10.3396 0.0789 6.1690April 134.8265 9.1331 14.8742 10.3105 0.0788 6.2300May 135.2764 9.2236 14.6763 10.0519 0.0796 6.3300June 132.6093 9.1190 14.1612 9.5591 0.0774 6.1959July 134.3652 9.2705 14.5199 9.3400 0.0791 6.3380Aug 134.3777 9.2524 14.5486 9.4641 0.0795 6.3235Sept 133.2278 9.1735 14.5449 9.3504 0.0775 6.2617Oct 132.1625 9.1053 14.4489 9.2793 0.0749 6.2156Nov 131.3311 9.0785 14.2485 9.0655 0.0746 6.1869Dec 131.0292 9.0931 14.1771 8.9458 0.0732 6.1861
2003 Jan 130.9609 9.1775 13.9590 8.6386 0.0727 6.2767Feb 129.7272 9.1499 13.6813 8.4930 0.0711 6.2358March 130.3167 9.2221 13.5031 8.5298 0.0720 6.2777April 128.9566 9.1585 13.2756 8.4370 0.0704 6.1248May 127.1076 9.1541 12.8520 7.9229 0.0676 6.0426June 126.3154 9.1149 12.9638 7.8108 0.0660 5.9211July 127.6987 9.1945 13.1295 8.0807 0.0681 5.9417Aug 128.9600 9.2350 13.2074 8.2825 0.0697 5.9957Sept 126.7679 9.0693 13.0143 8.0861 0.0703 5.8616Oct 125.3358 9.0099 12.9077 7.6966 0.0703 5.8195Nov 125.2370 8.9908 12.9783 7.6831 0.0703 5.7642Dec 124.3958 9.0169 12.8514 7.3632 0.0682 5.8001
2004 Jan 125.3707 9.1373 13.1985 7.2493 0.0681 5.8343Feb 125.9654 9.1814 13.5574 7.2599 0.0682 5.8367March 127.6783 9.2305 13.7500 7.5243 0.0694 5.8922April 127.6519 9.1711 13.7941 7.6501 0.0711 5.9008May 126.7383 9.1312 13.5751 7.6061 0.0679 5.9248June 127.0144 9.1422 13.7711 7.5332 0.0688 6.0193July 127.3590 9.1954 13.8041 7.4931 0.0685 6.0222Aug 127.3415 9.1912 13.7313 7.5444 0.0683 5.9753Sept 125.7140 9.0954 13.3500 7.4484 0.0677 5.8943Oct 124.8272 9.0610 13.1085 7.2557 0.0666 5.8730Nov 123.3656 9.0036 12.8863 6.9390 0.0662 5.9155Dec 122.4392 8.9786 12.9405 6.7030 0.0646 5.8495
2005 Jan 123.7464 9.0538 12.9620 6.8996 0.0668 5.8527Feb 124.4271 9.0839 13.1666 6.9778 0.0665 5.8614March 124.2160 9.0860 13.1189 6.8755 0.0654 5.8669April 125.8007 9.1650 13.4189 7.0796 0.0660 5.9230May 126.6878 9.1942 13.4357 7.2482 0.0679 5.9511
Note. The base for the TCW index is 18 November 1992. TCW (Total Competitiveness Weights) is a way of measuring the value of the krona againsta basket of other currencies. TCW is based on average aggregate flows of processed goods for 21 countries. The weights include exports and importsas well as ”third country” effects.
E C O N O M I C R E V I E W 2 / 2 0 0 576
7
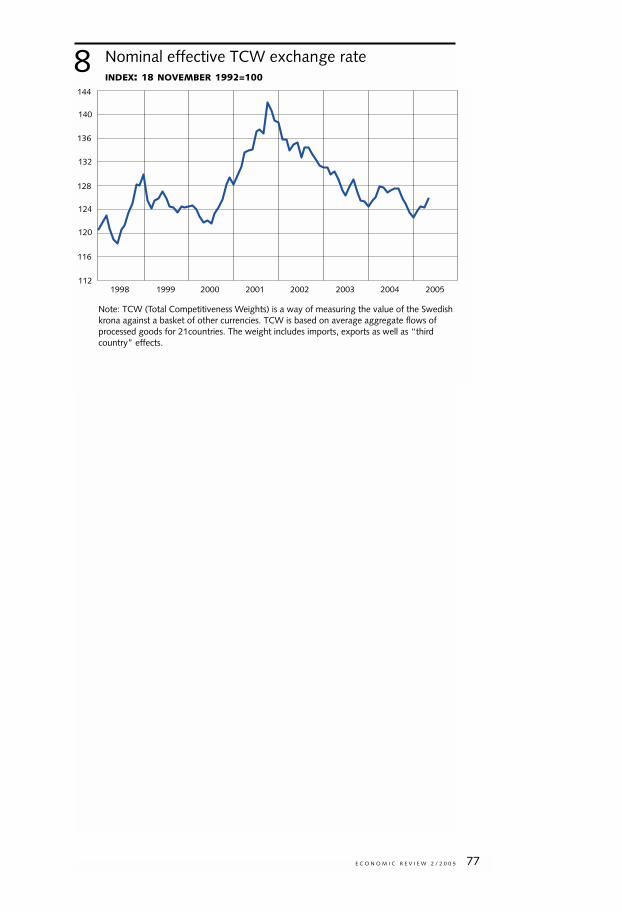
Nominal effective TCW exchange rateINDEX: 18 NOVEMBER 1992=100
E C O N O M I C R E V I E W 2 / 2 0 0 5 77
112
116
124
120
132
140
1998 1999 2000 2001 2002 2003 2004 2005
Note: TCW (Total Competitiveness Weights) is a way of measuring the value of the Swedish krona against a basket of other currencies. TCW is based on average aggregate flows of processed goods for 21countries. The weight includes imports, exports as well as “third country” effects.
136
128
144
8
■ Articles in earlier issues
Swedish krona loans on international markets Loulou Wallman 1990:1
Foreign exchange markets in April 1989 – a global study Robert Bergqvist 1990:1
The balance of payments Gunnar Blomberg 1990:2
Reinvested earnings and direct investment assets Fredrika Röckert 1990:2
Foreign ownership – the law and current proposals Per Arne Ström 1990:2
The international foreign exchange market in 1989 and 1990 Robert Bergqvist 1990:3
Exchange deregulation – short and long-run effects Christina Lindenius 1990:3
The Swedish credit market, January through September 1990
Marianne Biljer and Per Arne Ström 1990:4
Fewer loans and larger mortgage payments – the Riksbank’s household survey,
January–June 1990 Anna Thoursie 1990:4
New data on outflow of travel allowance Fredrika Röckert 1990:4
Competition and regulation: trends in financial systems David T. Llewellyn 1990:4
Foreign bank branches and Riksbank loan facilities Loulou Wallman 1991:1
The EMU process in 1990 – a résumé Gustaf Adlercreutz 1991:1
The Norwegian krone to Ecu Christina Lindenius 1991:1
The 1990 balance of payments Fredrika Röckert 1991:2
Swedish holdings of foreign portfolio shares Martin Falk 1991:2
Profits in commercial banking Bo Dalheim, Peter Lagerlöf and Per Arne Ström 1991:2
International capital adequacy rules – the work continues
Göran Lind and Åke Törnqvist 1991:2
Safeguard the monetary role of the IMF Margareta Kylberg 1991:2
Finance companies – structural changes Marianne Biljer 1991:3
The Swedish krona pegged to the Ecu Hans Lindberg and Christina Lindenius 1991:3
The private Ecu – characteristics and tendencies Jonny Nilsson 1991:3
The international foreign exchange market in 1990 and 1991 – expanding EMS
block Robert Bergqvist and Leif Johansson 1991:4
The EEA agreement and the Riksbank Jan Nipstad 1991:4
Household borrowing in 1991:1 Siw Stjernborg 1991:4
The Riksbank and primary dealers
Robert Bergqvist and Ann Westman Mårtensson 1992:1
Economic and monetary union – Maastricht points the way Gustaf Adlercreutz 1992:1
European monetary union – convergence criteria and adjustment
Christian Nilsson 1992:1
Bank results in Sweden and other Nordic countries
Bo Dalheim, Göran Lind and Anna-Karin Nedersjö 1992:2
Market deregulation for krona certificates and bonds Loulou Wallman 1992:2
Foreign acquisitions of shares in Swedish companies Rolf Skog 1992:2
The EEA agreement and financial markets Jan Nipstad 1992:2
The budget deficit and fiscal policy Krister Andersson 1992:3
Foreign investment in Swedish interest-bearing securities
Martin Falk and Tomas Niemelä 1992:3
E C O N O M I C R E V I E W 2 / 2 0 0 578
The performance of banks in the UK and Scandinavia: a case study in competition
and deregulation David T. Llewellyn 1992:3
The foreign exchange market in April 1992 Robert Bergqvist 1992:4
The interest rate scale Ann Westman Mårtensson 1992:4
The local government economy Maude Svensson 1992:4
Monetary policy indicators Yngve Lindh 1993:1
Payment systems in transition Hans Bäckström 1993:1
Annus horribilis for EMU Gustaf Adlercreutz 1993:1
The 1992 balance of payments Martin Falk and Anders Lindström 1993:2
The Swedish credit market in 1992 Marianne Biljer and Johanna Jonsson 1993:2
The banking sector in 1992 Bo Dalheim, Göran Lind and Anna-Karin Nedersjö 1993:2
Structural saving deficiency – a long-standing problem
Annika Alexius and Gunnar Blomberg 1993:2
Capital cover for market risk Robert Berqvist and Mats Ericsson 1993:3
Securitisation on the Swedish credit market Willem van der Hoeven 1993:3
Government indexed bonds Kerstin Hallsten 1993:3
Estimating forward interest rates Lars E.O. Svensson 1993:3
Debt consolidation in progress Daniel Barr and Kurt Gustavsson 1993:4
Will Sweden follow Finland’s path? Maria Landell 1993:4
Monetary policy instruments in EMU Kari Lotsberg and Ann Westman 1993:4
Monetary policy effects on interest rate formation Annika Alexius 1994:1
The economic role of asset prices Claes Berg and Mats Galvenius 1994:1
Stage two in the EMU process Louise Lundberg 1994:1
The 1993 balance of payments with a flexible exchange rate
Anders Lindström and Tomas Lundberg 1994:2
Nonresident holdings of Swedish securities
Mattias Croneborg and Johan Östberg 1994:2
The Swedish credit market in 1993 Johanna Jonsson 1994:2
The banking sector in 1993 Göran Lind and Anna-Karin Nedersjö 1994:2
The Riksbank sets reserve requirements to zero Kari Lotsberg 1994:2
The Riksbank’s new interest rate management system Lars Hörngren 1994:2
The 1993 household survey Eeva Seppälä 1994:2
Central government debt, interest rates and the behaviour of foreign investors
Thomas Franzén 1994:3
Monetary conditions index – a monetary policy indicator
Bengt Hansson and Hans Lindberg 1994:3
Sweden’s net external debt Robert Bergqvist and Anders Lindström 1994:3
The Riksbank, the RIX system and systemic risks Daniel Barr 1994:3
RIX – the Riksbank’s system for clearing and settlement Bertil Persson 1994:3
The international foreign exchange market in 1994
Martin Edlund and Kerstin Mitlid 1994:4
The yield curve and investment behaviour Lars Hörngren and Fredrika Lindsjö 1994:4
Direct investment – interpretations and implications Johan Östberg 1994:4
Price stability and monetary policy Urban Bäckström 1995:1
The coordination of economic policy in the European Union
Christina Lindenius 1995:1
The bank’s deposit monopoly and competition for savings
Daniel Barr and Lars Hörngren 1995:1
E C O N O M I C R E V I E W 2 / 2 0 0 5 79
The Riksbank and primary dealers in the currency market
Robert Bergqvist and Ann Westman 1995:1
The 1994 balance of payments – capital flows and exchange rate
Robert Bergquist and Mattias Croneborg 1995:2
Output gap and inflation in a historical perspective Mikael Apel 1995:2
The Swedish credit market in 1994 – continued consolidation Felice Marlor 1995:2
Banks and housing institutions in 1994
Björn Hasselgren and Anna-Karin Nedersjö 1995:2
The 1994 household survey – increased financial saving Hans Dillén 1995:2
Monetary policy in theory and practice Lars Hörngren 1995:3
Estimating forward interest rates with the extended Nelson and Siegel method
Lars E.O. Svensson 1995:3
Household saving in private bonds Lotte Schou and Marianne Wolfbrandt 1995:3
Tourism dominates the travel item Fredrika Röckert 1995:3
The Riksbank and european monetary cooperation Urban Bäckström 1995:4
Strategy and instruments in EMU’s third stage Claes Berg 1995:4
EMU and employment Krister Andersson and Anatoli Annenkov 1995:4
EMU’s final objective – a single currency Stefan Ingves and Agneta Brandimarti 1995:4
EU, EMU and the payment system Hans Bäckström 1995:4
The management of the bank crisis – in retrospect
Stefan Ingves and Göran Lind 1996:1
The krona’s equilibrium real exchange rate Annika Alexius and Hans Lindberg 1996:1
Sharp swings in international capital flows Fredrika Röckert and Karin Stillerud 1996:1
Swedish derivatives market dominated by a few agents
Antti Koivisto and Marianne Wolfbrandt 1996:1
“Herstatt risk” and the international banking system Hans Bäckström 1996:1
Monetary policy strategies for the European Central Bank Claes Berg 1996:2
Producer and import prices and the CPI – weak aggregated relationship
Hans Dellmo 1996:2
The 1995 household survey Peter Lundkvist 1996:2
Monetary policy, inflation and unemployment
Mikael Apel and Lars Heikensten 1996:3
Potential output and output gap Mikael Apel, Jan Hansen and Hans Lindberg 1996:3
Government’s altered role in financial markets
Martin Blåvarg and Stefan Ingves 1996:3
Aspects of Sweden’s external debt Robert Bergqvist and Tomas Lundberg 1996:4
The Riksbank’s management of short-term interest rates Karolina Holmberg 1996:4
Government’s finance in a structural perspective Johan Fall 1996:4
Monetary policy and unemployment Urban Bäckström 1997:1
Macroeconomic indicators of system risk Felice Marlor 1997:1
Structural change and price formation Tor Borg and Mattias Croneborg 1997:1
Electronic money – risk, questions, potential
Hans Bäckström and Peter Stenkula 1997:1
Has the inflation process changed? Claes Berg and Peter Lundqvist 1997:2
EMU expectations and interest rates Hans Dillén and Martin Edlund 1997:2
EMU 1999 – the current situation Jonas Eriksson and Loulou Wallman 1997:2
The 1996 household survey – renewed upswing in new borrowing
Peter Lundqvist 1997:2
The Swedish repo market Christian Ragnartz and Johan Östberg 1997:3/4
E C O N O M I C R E V I E W 2 / 2 0 0 580
Payment system float Johanna Lybeck 1997:3/4
Lessons of the Dutch model Jonas A. Eriksson and Eva Uddén-Jondal 1997:3/4
The krona’s role outside the EMU Kerstin Mitlid 1998:1
EMU soon a reality – how is monetary policy affected?
Lars Heikensten and Fredrika Lindsjö 1998:1
Five years with the price stability target Urban Bäckström 1998:1
Co-ordination for financial stability Göran Lind 1998:1
Why is an independent central bank a good idea?
Mikael Apel and Staffan Viotti 1998:2
Should Sveriges Riksbank concern itself with share prices?
Ossian Ekdahl, Jonas A. Eriksson and Felice Marlor 1998:2
Exchange rates and currency options as EMU indicators
Javiera Aguilar and Peter Hördahl 1998:2
Value at Risk Lina El Jahel, William Perraudin and Peter Sellin 1998:2
Efficiency in the payment system – a network perspective Gabriela Guibourg 1998:3
Securitisation – a future form of financing? Martin Blåvarg and Per Lilja 1998:3
Links between competition and inflation Marcus Asplund and Richard Friberg 1998:3
Inflation targeting and Swedish monetary policy – experience and problems
Lars Heikensten and Anders Vredin 1998:4
Can we create a global payments network? Hans Bäckström and Stefan Ingves 1998:4
Why use bond indexes? Christian Ragnartz 1998:4
Development and financial structure of the International Monetary Fund
Maria Götherström 1998:4
The Riksbank’s inflation target – clarifications and evaluation Lars Heikensten 1999:1
Hedge funds – trouble-makers? Per Walter and Pär Krause 1999:1
Option prices and market expectations Javiera Aguilar and Peter Hördahl 1999:1
Managing and preventing financial crises Martin Andersson and Staffan Viotti 1999:1
The current situation for monetary policy Urban Bäckström 1999:2
Inflation forecasts with uncertainty intervals Mårten Blix and Peter Sellin 1999:2
Market valuation of external position Gunnar Blomberg and Johan Östberg 1999:2
Why Sweden has changed its stabilisation policy regime Villy Bergström 1999:2
Towards new national and international banking regulations
Göran Lind and Johan Molin 1999:3
Interest rate risk in the foreign exchange reserve Christian Ragnartz 1999:3
Inflation forecast targeting Claes Berg 1999:3
The current situation for monetary policy Urban Bäckström 1999:4
Different ways of conducting inflation targeting – theory and practice
Mikael Apel, Marianne Nessén, Ulf Söderström and Anders Vredin 1999:4
Structural changes in the banking sector – driving forces and consequences
Per Lilja 1999:4
Economic policy coordination in the EU/euro area
Lars Heikensten and Tomas Ernhagen 2000:1
Is there a “new economy” and is it coming to Europe?
Jonas A. Eriksson and Martin Ådahl 2000:1
Macroeconomic indicators of credit risk in business lending Lena Lindhe 2000:1
International portfolio investments Roger Josefsson 2000:1
Current monetary policy Urban Bäckström 2000:2
Macroeconomic dependence on demographics: a key to better forecasting
Thomas Lindh 2000:2
E C O N O M I C R E V I E W 2 / 2 0 0 5 81
Swedish housing finance and the euro Margareta Kettis and Lars Nyberg 2000:2
Conducting monetary policy with a collegial board: the new Swedish legislation
one year on Claes Berg and Hans Lindberg 2000:2
The conquest of inflation – An introduction to Sargent’s analysis
Ulf Söderström and Anders Vredin 2000:3
The conquest of American inflation: A summary
Thomas J. Sargent and Ulf Söderström 2000:3
Dealing with banking crisis – the proposed new regulatory framework
Staffan Viotti 2000:3
The banking Law Committee’s main and final reports 2000:3
The current situation for monetary policy Urban Bäckström 2000:4
Credit rating and the business cycle: can bankruptcies be forecast?
Tor Jacobson and Jesper Lindé 2000:4
Accession countries’ choice of exchange rate system in preparation for EMU
Martin Ådahl 2000:4
The wage spread between different sectors in Sweden Sara Tägtström 2000:4
Trends in Swedish Public Finances – Past and Future
Yngve Lindh and Henry Ohlsson 2000:4
Independent central banks in democracies? Villy Bergström 2001:1
Steering interest rates in monetary policy – how does it work?
Kerstin Mitlid and Magnus Vesterlund 2001:1
Changed wage formation in a changing world?
Kent Friberg and Eva Uddén Sonnegård 2001:1
The Riksbank’s opinion on the report “Public administration of banks in distress”
SOU 2000:66 2001:1
How can central banks promote financial stability?
Tor Jacobson, Johan Molin and Anders Vredin 2001:2
Regulation and banks’ incentives to control risk Arnoud W.A. Boot 2001:2
Maintaining financial stability: Possible policy options Philip Lowe 2001:2
Dealing with financial instability: The central bank’s tool kit Arturo Estrella 2001:2
Challenges for tax policy in Sweden Robert Boije 2001:2
The role of the property tax in the tax system Peter Englund 2001:2
The Riksbank’s oversight of the financial infrastructure
Martin Andersson, Gabriela Guibourg and Björn Segendorff 2001:3
The International Monetary Fund’s quotas – their function and influence
Anna-Karin Nedersjö 2001:3
How good is the forecasting performance of major institutions?
Mårten Blix, Joachim Wadefjord, Ulrika Wienecke and Martin Ådahl 2001:3
Share-index options as forward-looking indicators Magnus Lomakka 2001:3
A financial measure of inflation expectations
Malin Andersson and Henrik Degrér 2001:3
Price stability and financial stability Sonja Daltung 2001:4
The use of cash in the Swedish economy
Martin Andersson and Gabriela Guibourg 2001:4
Explaining wage trends Lars Calmfors and Eva Uddén Sonnegård 2001:4
Households, stock markets and the financial system Urban Bäckström 2002:1
The Riksbank’s foreign exchange interventions – preparations, decision
and communication Lars Heikensten and Anders Borg 2002:1
The real interest rate and monetary policy Magnus Jonsson 2002:1
E C O N O M I C R E V I E W 2 / 2 0 0 582
The role of the gold reserves and the rate of return on gold
Annette Henriksson 2002:1
Central banks’ equity needs
Tomas Ernhagen, Magnus Vesterlund and Staffan Viotti 2002:2
Inter-bank exposures and systemic risk Martin Blåvarg 2002:2
Rixmod – the Riksbank’s macroeconomic model for monetary policy analysis
Christian Nilsson 2002:2
Should tax deviations be integrated into the budget process? Robert Boije 2002:2
The yield curve and the Riksbank’s signalling
Malin Andersson, Hans Dillén and Peter Sellin 2002:3
Consolidation in the Swedish banking sector: a central bank perspective
Lars Frisell and Martin Noréus 2002:3
An evaluation of forecasts for the Swedish economy
Mårten Blix, Kent Friberg and Fredrik Åkerlind 2002:3
The art of targeting inflation Lars Heikensten och Anders Vredin 2002:4
The IRB approach in the Basel Committee’s proposal for new capital adequacy
rules: some simulation-based illustrations
Tor Jacobson, Jesper Lindé and Kasper Roszbach 2002:4
Reformed management of international financial crises Ola Melander 2002:4
The Riksbank’s statement regarding the report ”Stabilisation policy in the
monetary union” SOU 2002:16 2002:4
Should we welcome globalisation? Villy Bergström 2003:1
National stabilisation policy in the event of Swedish Eurosystem membership
Robert Boije and Hovick Shahnazarian 2003:1
How is the economy affected by the inflation target?
Malin Adolfson and Ulf Söderström 2003:1
The use of market indicators in financial stability analyses
Mattias Persson and Martin Blåvarg 2003:2
Card payments in Sweden Lars Nyberg and Gabriela Guibourg 2003:2
Errors and omissions in the balance of payments statistics – symptoms and
causes Gunnar Blomberg, Lars Forss and Ingvar Karlsson 2003:2
Special Drawing Rights – a lubricant Anna-Karin Nedersjö 2003:2
The Riksbank’s submission on the final report Future financial supervision
SOU 2003:22 2003:2
The road to price stability in the 1990s Urban Bäckström 2003:3
Behind the Riksbank’s massive walls – establishing the inflation targeting
policy 1995–2003 Lars Heikensten 2003:3
On central bank efficiency Mårten Blix, Sonja Daltung and Lars Heikensten 2003:3
An Inflation Reports report Eric M. Leeper 2003:3
Financial bubbles and monetary policy Hans Dillén and Peter Sellin 2003:3
IMF – development, criticisms and future tasks David Farelius 2003:3
Crisis exercises make for crisis readiness Göran Lind 2003:4
Payment system efficiency and pro-competitive regulation Mats A. Bergman 2003:4
Is “wage drift” a problem? Eva Uddén Sonnegård 2003:4
The general government structural budget balance Robert Boije 2004:1
The peaks and troughs of the Stability and Growth Pact Jonas Fischer 2004:1
Lessons from the past: What can we learn from the history of centralized
wage bargaining? Michelle Alexopoulos and Jon Cohen 2004:1
E C O N O M I C R E V I E W 2 / 2 0 0 5 83
Can we be best again? The role of capital formation in long-term growth
Villy Bergström 2004:2
The financial accelerator and corporate investment
Claes Berg, Jan Hansen and Peter Sellin 2004:2
Swedish monetary policy Staffan Viotti 2004:2
Assessment of the Riksbank’s work on financial stability issues
Franklin Allen, Lennart Francke and Mark W. Swinburne 2004:3
Cash-supply efficiency Sonja Daltung and Mithra Ericson 2004:3
Inflation and relative-price changes in the Swedish economy
Bengt Assarsson 2004:3
A decade of inflation targeting Lars Heikensten 2004:4
Households’ inflation opinions – a tale of two surveys
Stefan Palmqvist and Lena Strömberg 2004:4
Price-setting behaviour in Swedish firms
Mikael Apel, Richard Friberg and Kerstin Hallsten 2004:4
Employment and the Riksbank
Villy Bergström, Annika Svensson and Martin Ådahl 2005:1
Experience of inflation-targeting in 20 countries Claes Berg 2005:1
The “new economy” and productivity in Sweden in the 2000s
Björn Andersson and Martin Ådahl 2005:1
On the need to focus more on the asymmetry problem within the
EU Fiscal Policy Framework Robert Boije 2005:1
E C O N O M I C R E V I E W 2 / 2 0 0 584


