Embed Size (px)
Citation preview

8/13/2019 2005 Financial Survey
http://slidepdf.com/reader/full/2005-financial-survey 1/284
© 2005 by theConstruction FinancialManagement Association29 Emmons Drive, Suite F-50Princeton, NJ 08540Phone: 609.452.8000 FAX: 609.452.0474www.cfma.org
William M. SchwabPresident & CEO
Brian K. SummersChief Operations Officer
Joe GrossoDirector, Graphic Design Services
All rights reserved. No part of thisbook may be reproduced in any way,or by any means, without permissionin writing from the publisher.
Printed in the United States of America
8/13/2019 2005 Financial Survey
http://slidepdf.com/reader/full/2005-financial-survey 2/284
C F M A ’s 2 0 0 5
Construction
Industry Annual
Financial Survey
GENERAL INFORMATION

8/13/2019 2005 Financial Survey
http://slidepdf.com/reader/full/2005-financial-survey 3/284
Please note that some numbers may not sum due to rounding. General Information
About CFMA — The Source & Resource for
Construction Financial Professionals
The Construction Financial Management Association (CFMA) is the source and resource for construction
industry professionals and the only nonprofit organization dedicated to serving the construction financial professional. Established in 1981, CFMA now boasts 7,000 members and 89 chapters in major cities across
the country. CFMA is the communications leader and premier source of education and information
about those aspects of financial management unique to the construction industry.
CFMA meets the needs of a broad spectrum of financial managers: CFOs, treasurers, controllers, and
accountants. CFMA’s General Membership represents all types of contractors, including generals and subs, as
well as developers, construction managers, architects, engineers, principals, and material and equipment
suppliers.
CFMA’s Associate Membership is open to those serving the construction industry, such as lawyers, public
accountants, bankers, sureties, insurance agents and carriers, and other service providers.
As the primary forum for education and networking among today’s construction financial managers, CFMA is
proud of its highly rated educational products. In addition to the 2005 Construction Industry Annual
Financial Survey, these specialized communications include:
CFMA Building Profits – CFMA’s bimonthly magazine featuring an outstanding selection of
feature articles, technical pieces, and industry news.
Financial Management and Accounting for the Construction Industry – The definitive reference book, written and updated annually by CFMA members.
CFMA’s Construction Industry Information Technology Survey – A comprehensive report on
the industry’s use of technology, including hardware, software applications, operating systems, and
emerging technology trends. THE SOURCE Online – CFMA’s Online Membership Directory is easy to use, always up-to-
date, and just a mouse click away.
www.cfma.org – CFMA’s 24-hour virtual association.
CFMA’s extensive education services include an Annual Conference and Exhibition each May, mini-
conferences, co-sponsored seminars, and specialized training workshops for chapter leaders. Dedicated to
excellence, CFMA’s conferences and seminars provide unique opportunities for the exchange of information
and technical support, networking referrals, and employment opportunities.
CFMA began as an informal gathering of construction financial executives 25 years ago and has since growninto a vital industry participant. CFMA has testified, submitted comments, and worked with industry coalitions
on: the definition of an independent contractor and the Section 530 Safe Harbor, the definition of temporaryassignment, the ADA and the EEOC, Look-Back Rules, tax reporting requirements, and more. Two keyCFMA committees (Tax & Legislative Affairs and Accounting & Reporting) continue to provide memberswith timely and critical information and analyses on tax, accounting, and legal issues affecting the industry.
8/13/2019 2005 Financial Survey
http://slidepdf.com/reader/full/2005-financial-survey 4/284
General Information
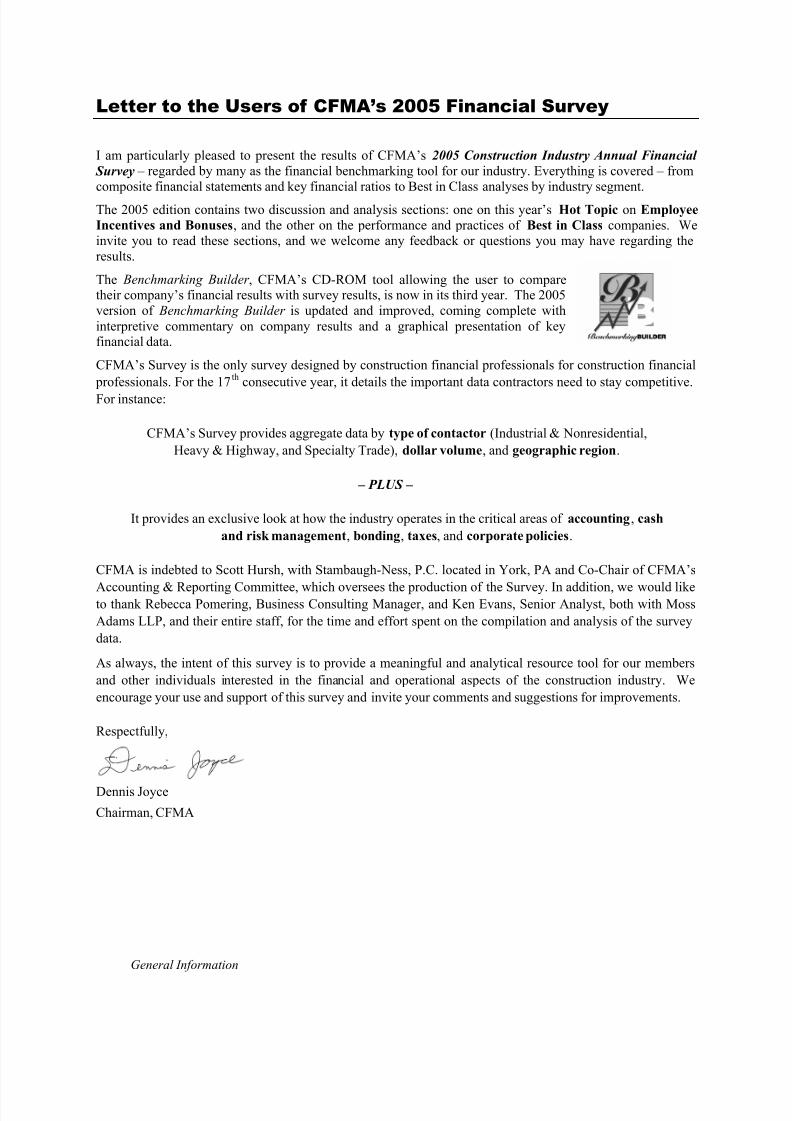
Letter to the Users of CFMA’s 2005 Financial Survey
I am particularly pleased to present the results of CFMA’s 2005 Construction Industry Annual Financial
Survey – regarded by many as the financial benchmarking tool for our industry. Everything is covered – fromcomposite financial statements and key financial ratios to Best in Class analyses by industry segment.
The 2005 edition contains two discussion and analysis sections: one on this year’s Hot Topic on Employee
Incentives and Bonuses, and the other on the performance and practices of Best in Class companies. Weinvite you to read these sections, and we welcome any feedback or questions you may have regarding theresults.
The Benchmarking Builder , CFMA’s CD-ROM tool allowing the user to comparetheir company’s financial results with survey results, is now in its third year. The 2005version of Benchmarking Builder is updated and improved, coming complete withinterpretive commentary on company results and a graphical presentation of keyfinancial data.
CFMA’s Survey is the only survey designed by construction financial professionals for construction financial
professionals. For the 17th consecutive year, it details the important data contractors need to stay competitive.
For instance:
CFMA’s Survey provides aggregate data by type of contactor (Industrial & Nonresidential,
Heavy & Highway, and Specialty Trade), dollar volume, and geographic region.
– PLUS –
It provides an exclusive look at how the industry operates in the critical areas of accounting, cash
and risk management, bonding, taxes, and corporate policies.
CFMA is indebted to Scott Hursh, with Stambaugh-Ness, P.C. located in York, PA and Co-Chair of CFMA’s
Accounting & Reporting Committee, which oversees the production of the Survey. In addition, we would liketo thank Rebecca Pomering, Business Consulting Manager, and Ken Evans, Senior Analyst, both with Moss
Adams LLP, and their entire staff, for the time and effort spent on the compilation and analysis of the survey
data.
As always, the intent of this survey is to provide a meaningful and analytical resource tool for our members
and other individuals interested in the financial and operational aspects of the construction industry. We
encourage your use and support of this survey and invite your comments and suggestions for improvements.
Respectfully,
Dennis Joyce
Chairman, CFMA
8/13/2019 2005 Financial Survey
http://slidepdf.com/reader/full/2005-financial-survey 5/284
Please note that some numbers may not sum due to rounding. General Information
Description of CFMA’s 2005 Financial Survey
CFMA’s 2005 Construction Industry Annual Financial Survey was designed to provide critical benchmarking andfinancial information on the construction industry. The results are presented in the form of financial statementinformation, financial ratios, charts, graphs, and narrative analysis.
The information for this study was compiled and analyzed by Moss Adams LLP. Moss Adams LLP was not engagedto and did not audit this information, and accordingly, does not express an opinion or any other form of assurance onit.
It is important to note the new areas included in the 2005 report:
1. Return on Assets (ROA) and Return on Equity (ROE) are calculated using net earnings (loss) before incometaxes. Studies conducted in prior years used net earnings (loss) after taxes to calculate ROA and ROE. Allreferences to ROAs and ROEs from prior studies have been updated to reflect this change.
2. Specific state data has been collected. For more information on how to obtain this data, contact a MossAdams representative at 206-442-2646. (Note: Some industry segment breakouts are unavailable due to aminimal response rate.)
3. In prior years, direct cost information was gathered, but not presented in the overall report due to a significantnumber of participants omitting detailed expense information. This year, 515 companies submitted direct
cost information and a detailed report on Direct Costs appears in Appendix D on page 280.
The report is presented in the following sections:
The Executive Summary condenses the overall survey results and provides a summary of important issues and trends,as well as financial information and comparative financial data. In addition, various topics are compared over a five-year period (2001-2005) when significant industry trends have been observed.
Once again, the 2005 edition contains two additional discussion and analysis sections: one on this year’s Hot Topic, Employee Incentives and Bonuses, and the other on the performance and practices of Best in Class companies. Weinvite you to read these sections, and we welcome any feedback or questions you may have regarding the results.
The Overall Survey Results section presents data in two formats. First, information is provided graphically in theform of charts and tables. This first section is enhanced by a discussion that compares data from each chart/table to prior year results and then points out trends or differences between classifications. This first section is divided into
eight parts and includes: General Profile, Economy and Competition, Cash Management and Finance, Bondingand Sureties, Insurance, Professional Consultants, Taxation, Accounting Policies and Methods.
The second section provides detailed financial data on the survey respondents as a whole. Detailed composite balancesheets, earning statements, and financial ratios are presented for the 2005 and 2004 survey participants. Compositefinancial statements and ratios are also presented on a regional basis.
The survey data is then presented for each of the three major classifications of contractors: Industrial &Nonresidential, Heavy & Highway, and Specialty Trade. For each classification, the survey data is compared to thecomposite results or prior period results. Financial data is then presented by geographic size and contractor size (basedon annual revenue).
The survey data is intended to provide a source of information on the entire group of respondents first, then on specificsegments of the entire group. Therefore, the needs of the individual reader will determine which sections will be mostuseful. There are limited comparisons of data among the three major classifications of contractors to allow for a more
focused analysis.
CFMA’s 2005 Construction Industry Annual Financial Survey is not intended to, nor does it, provide a statisticallyvalid representation of the construction industry as a whole; rather, it is representative of approximately 4,100 CFMAgeneral members employed by U.S. construction companies, plus a small number of other U.S. contractors. Thenumber and mix of respondents in each year’s survey affect trends in the financial statement information.
8/13/2019 2005 Financial Survey
http://slidepdf.com/reader/full/2005-financial-survey 6/284
M oss Adams LLP is pleased to have compiled
and analyzed the 17th edition of the CFMA Construction
Industry Annual Financial Survey.
Moss Adams LLP provides accounting, tax, and consulting
services to public and private middle-market enterprises in construction
and many other industries.
Moss Adams is the 12th largest accounting and consulting firm in the U.S.
and the largest headquartered on the West Coast.
For further information about Moss Adams, contact:
AC C O U N T I N G SE R V I C E S: EL A I N E ERVIN , CPA
1 0 0 1 F o u r t h A v e n u e , S u i t e 2 9 0 0 / S e a t t l e , W A 9 8 1 5 4
2 0 6 - 4 4 2 - 2 3 5 8 / F a x : 2 0 6 - 6 2 2 - 9 9 7 5 / E l a i n e . E r v i n @ m o s s a d a m s . c o m
CONSULT ING SE R V I C E S: RE B E C C A PO M E R I N G
1 0 0 1 F o u r t h A v e n u e , S u i t e 2 7 0 0 / S e a t t l e , W A 9 8 1 5 4
2 0 6 - 4 4 2 - 2 6 2 2 / F a x : 2 0 6 - 2 3 3 - 9 2 1 4 / R e b e c c a . P o m e r i n g @ m o s s a d a m s . c o m
Certified Public Accountants and Business Consultants
w w w . m o s s a d a m s . c o m

8/13/2019 2005 Financial Survey
http://slidepdf.com/reader/full/2005-financial-survey 7/284
C F M A ’s 2 0 0 5
Construction
Industry Annual
Financial Survey
EXECUTIVE SUMMARY

8/13/2019 2005 Financial Survey
http://slidepdf.com/reader/full/2005-financial-survey 8/284
Executive Summary
EXECUTIVE SUMMARY
We are pleased to present the results of CFMA’s 2005 Construction Industry Annual Financial Survey. Distinctive features this year include a Hot Topic section on Employee Bonuses and Incentives,
discussion of Best in Class company profiles and practices, and an updated version of CFMA’s Benchmarking Builder CD-ROM, which can be purchased separately.
The survey is conducted by CFMA’s Accounting & Reporting Committee, and survey results arecompiled and analyzed by Moss Adams LLP. The Committee wishes to thank all participants andencourages all CFMA General Members to participate in future studies.
Introduction
CFMA’s Financial Survey is a benchmarking tool that allows construction companies to comparetheir financial information, as well as their business practices and strategies, with their peers inthe industry. CFMA’s Financial Surveys are confidential and unique to the industry.
The 2005 Construction Industry Annual Financial Survey questionnaire was distributed in April2005 to approximately 4,100 general members employed within U.S. construction companies anda small number of other U.S. contractors. Survey responses were received between May and July2005.
A total of 660 companies participated in the 2005 Financial Survey. A total of 538 submitteddetailed financial data, with 532 included in the study. Of those, 72% participated in the 2004survey and 97% are CFMA members.
The Financial Survey presents data in composite form, and according to the type of constructionwork performed, the region, revenues, and financial performance. Details are provided for thefollowing sectors: Industrial & Nonresidential, Heavy & Highway, and Specialty Trade.
The Benchmarking Builder , CFMA’s CD-ROM tool that allows users to compare their
company’s financial results with survey results, is now in its fourth year. The 2005 version of Benchmarking Builder is updated and improved, complete with interpretive commentary oncompany results and a graphical presentation of key financial data, along with greater flexibilityin selecting benchmarks and easier data entry.
Hot Topic Focus: Employee Incentives and Bonuses
When employees leave a company, it is not inherently a bad thing — some level of turnover is healthy asit can allow someone with different skills, experiences, and/or point of view to address challenges.Similarly, losing poorly performing employees who would do better elsewhere is usually good for both parties involved. However, losing competent employees to competitors means that another company iscapitalizing on your investment in those employees. While compensation might not keep employees fromlooking for work elsewhere, it can be a very important factor in their decision to stay. In the following
chart, participants were asked to rank nine factors (from 1 to 9, with 9 being the most important factor)they believed contribute to the overall satisfaction and attitude of their employees. Participantsoverwhelmingly selected compensation as the most important factor.
8/13/2019 2005 Financial Survey
http://slidepdf.com/reader/full/2005-financial-survey 9/284
Executive Summary
Average
Ranking 1 2 3
Compensation 2.8 35% 18% 17%
Overall employee morale 3.5 24% 18% 13%
Comfortable balance between work and life 4.6 12% 13% 14%
Level of effective communication 4.7 8% 14% 11%
Collaborative teamwork 5.0 5% 7% 15%
Intellectual challenge 5.7 4% 8% 9%
General caring for one another 6.0 5% 8% 7%
Clarity of future vision 6.0 5% 7% 8%
Adequacy of facilities and equipment 6.7 2% 5% 8%
Percent Selecting As
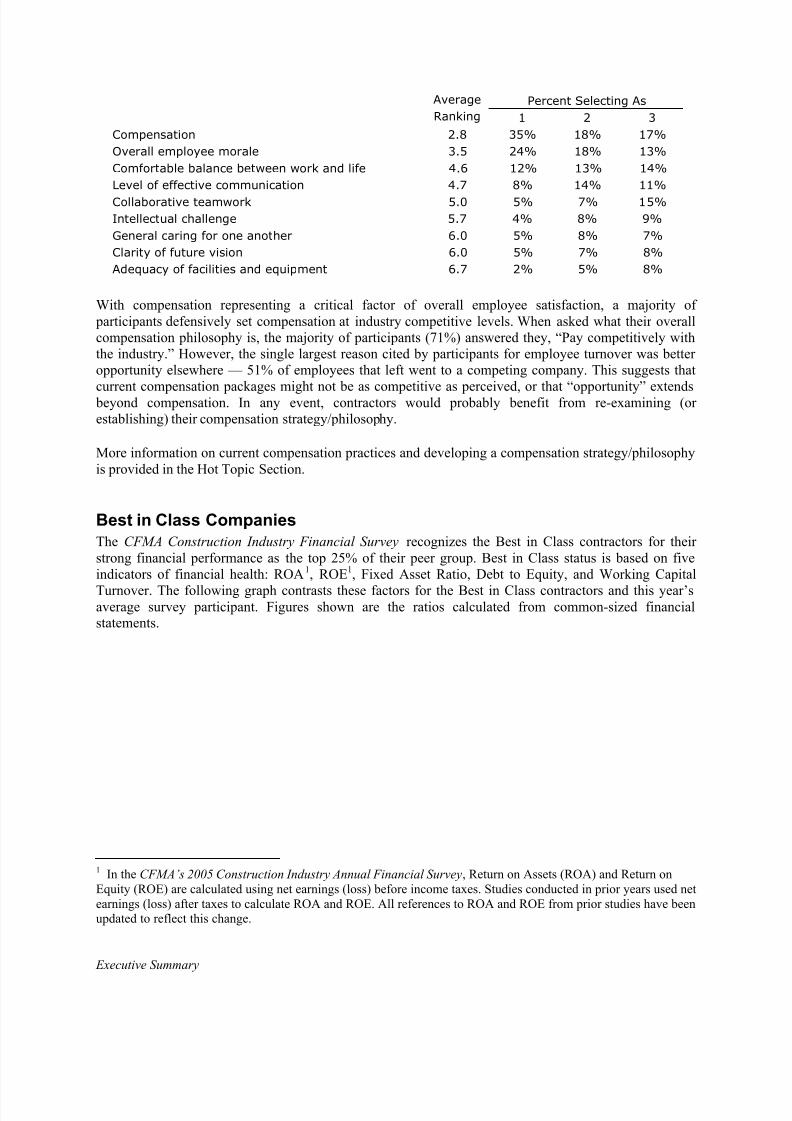
With compensation representing a critical factor of overall employee satisfaction, a majority of participants defensively set compensation at industry competitive levels. When asked what their overallcompensation philosophy is, the majority of participants (71%) answered they, “Pay competitively withthe industry.” However, the single largest reason cited by participants for employee turnover was betteropportunity elsewhere — 51% of employees that left went to a competing company. This suggests that
current compensation packages might not be as competitive as perceived, or that “opportunity” extends beyond compensation. In any event, contractors would probably benefit from re-examining (orestablishing) their compensation strategy/philosophy.
More information on current compensation practices and developing a compensation strategy/philosophyis provided in the Hot Topic Section.
Best in Class Companies
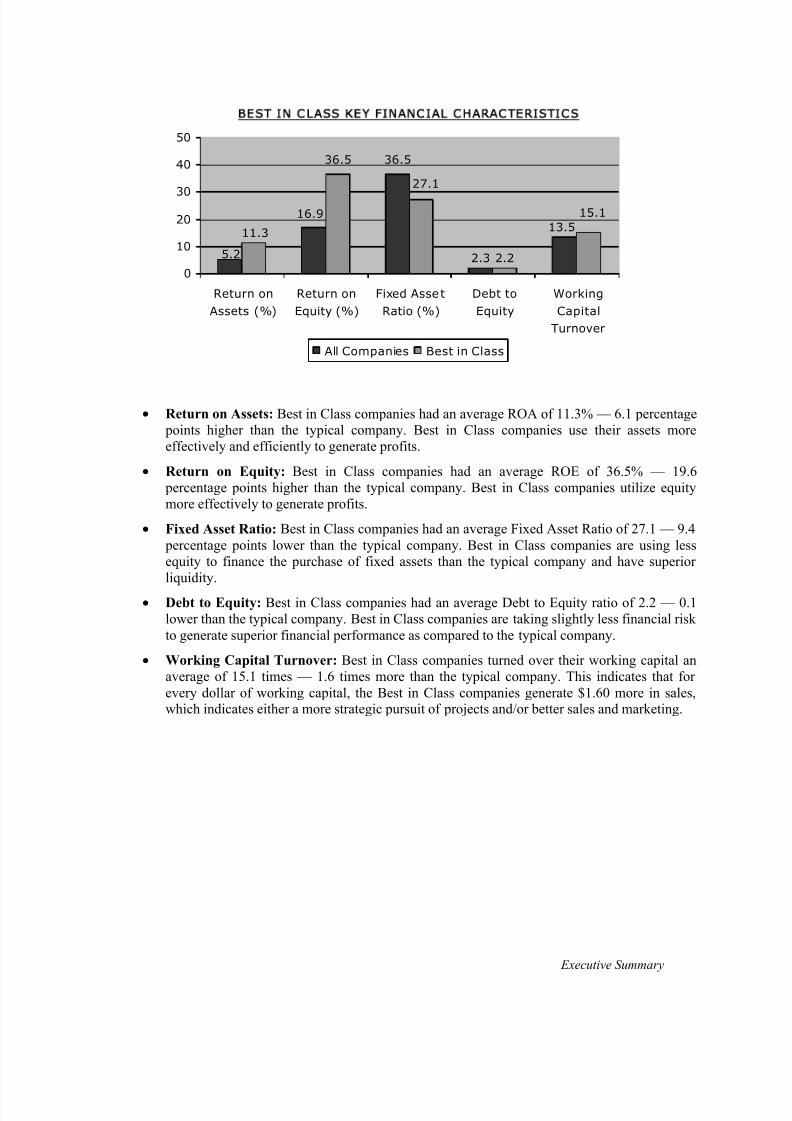
The CFMA Construction Industry Financial Survey recognizes the Best in Class contractors for theirstrong financial performance as the top 25% of their peer group. Best in Class status is based on fiveindicators of financial health: ROA1, ROE1, Fixed Asset Ratio, Debt to Equity, and Working Capital
Turnover. The following graph contrasts these factors for the Best in Class contractors and this year’saverage survey participant. Figures shown are the ratios calculated from common-sized financialstatements.
1 In the CFMA’s 2005 Construction Industry Annual Financial Survey, Return on Assets (ROA) and Return onEquity (ROE) are calculated using net earnings (loss) before income taxes. Studies conducted in prior years used netearnings (loss) after taxes to calculate ROA and ROE. All references to ROA and ROE from prior studies have beenupdated to reflect this change.
8/13/2019 2005 Financial Survey
http://slidepdf.com/reader/full/2005-financial-survey 10/284
Executive Summary
B E S T I N C L A S S K E Y F I N A N C I A L C H A R A C T E R I S T IC S
36.536.5
2.35.2
13.516.9
2.2
11.3
15.1
27.1
0
10
20
30
40
50
Return on
Assets (%)
Return on
Equity (%)
Fixed Asset
Ratio (%)
Debt to
Equity
Working
Capital
Turnover
All Companies Best in Class
• Return on Assets: Best in Class companies had an average ROA of 11.3% — 6.1 percentage points higher than the typical company. Best in Class companies use their assets moreeffectively and efficiently to generate profits.
• Return on Equity: Best in Class companies had an average ROE of 36.5% — 19.6 percentage points higher than the typical company. Best in Class companies utilize equitymore effectively to generate profits.
• Fixed Asset Ratio: Best in Class companies had an average Fixed Asset Ratio of 27.1 — 9.4 percentage points lower than the typical company. Best in Class companies are using lessequity to finance the purchase of fixed assets than the typical company and have superiorliquidity.
• Debt to Equity: Best in Class companies had an average Debt to Equity ratio of 2.2 — 0.1lower than the typical company. Best in Class companies are taking slightly less financial riskto generate superior financial performance as compared to the typical company.
• Working Capital Turnover: Best in Class companies turned over their working capital anaverage of 15.1 times — 1.6 times more than the typical company. This indicates that forevery dollar of working capital, the Best in Class companies generate $1.60 more in sales,which indicates either a more strategic pursuit of projects and/or better sales and marketing.
8/13/2019 2005 Financial Survey
http://slidepdf.com/reader/full/2005-financial-survey 11/284
Executive Summary
General Profile
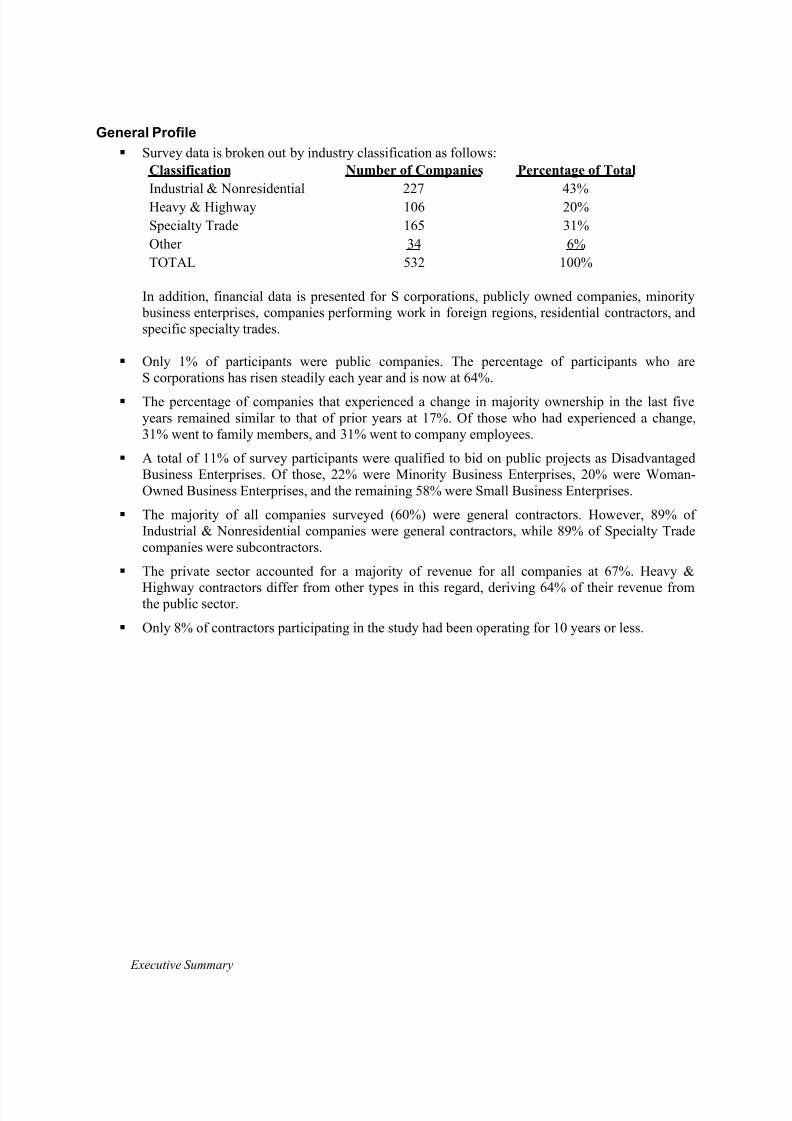
Survey data is broken out by industry classification as follows:
Classification Number of Companies Percentage of Total
Industrial & Nonresidential 227 43%
Heavy & Highway 106 20%
Specialty Trade 165 31%
Other 34 6%
TOTAL 532 100%
In addition, financial data is presented for S corporations, publicly owned companies, minority business enterprises, companies performing work in foreign regions, residential contractors, andspecific specialty trades.
Only 1% of participants were public companies. The percentage of participants who areS corporations has risen steadily each year and is now at 64%.
The percentage of companies that experienced a change in majority ownership in the last fiveyears remained similar to that of prior years at 17%. Of those who had experienced a change,31% went to family members, and 31% went to company employees.
A total of 11% of survey participants were qualified to bid on public projects as DisadvantagedBusiness Enterprises. Of those, 22% were Minority Business Enterprises, 20% were Woman-Owned Business Enterprises, and the remaining 58% were Small Business Enterprises.
The majority of all companies surveyed (60%) were general contractors. However, 89% ofIndustrial & Nonresidential companies were general contractors, while 89% of Specialty Tradecompanies were subcontractors.
The private sector accounted for a majority of revenue for all companies at 67%. Heavy &
Highway contractors differ from other types in this regard, deriving 64% of their revenue fromthe public sector.
Only 8% of contractors participating in the study had been operating for 10 years or less.
8/13/2019 2005 Financial Survey
http://slidepdf.com/reader/full/2005-financial-survey 12/284
Executive Summary
Economy and Competition
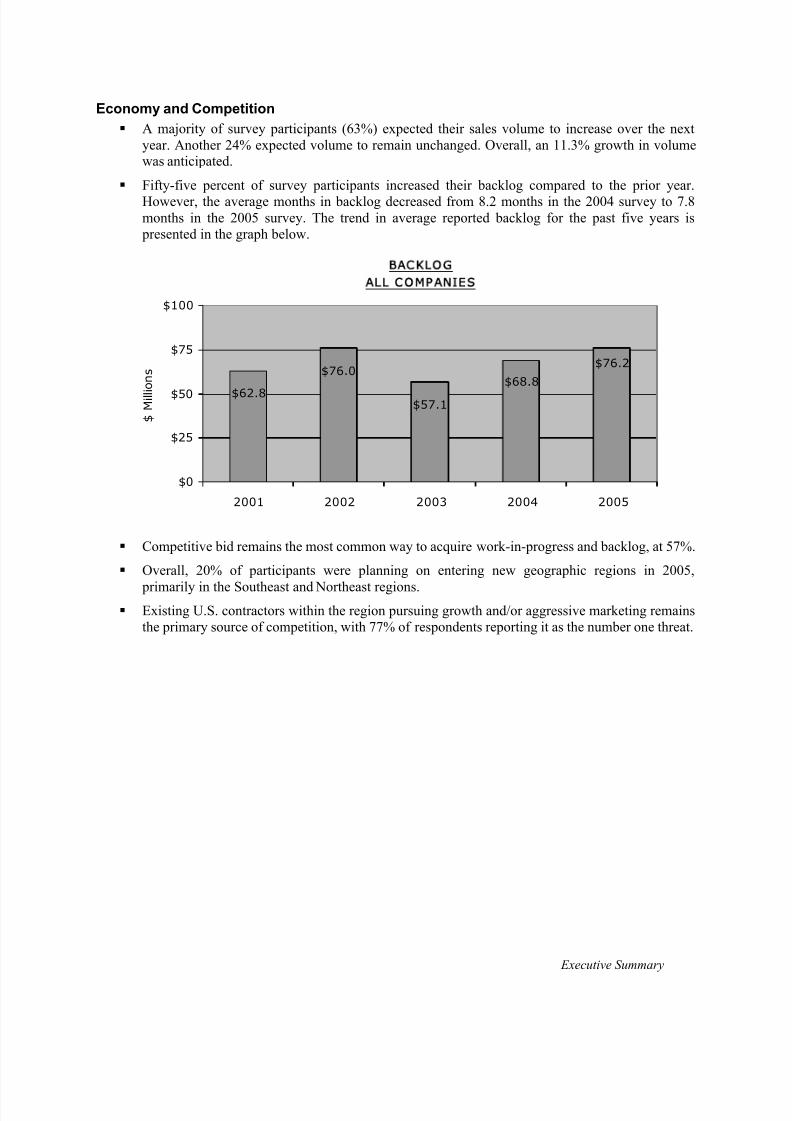
A majority of survey participants (63%) expected their sales volume to increase over the nextyear. Another 24% expected volume to remain unchanged. Overall, an 11.3% growth in volumewas anticipated.
Fifty-five percent of survey participants increased their backlog compared to the prior year.
However, the average months in backlog decreased from 8.2 months in the 2004 survey to 7.8months in the 2005 survey. The trend in average reported backlog for the past five years is presented in the graph below.
B A C K L O G
A L L C O M P A N IE S
$76.2
$62.8
$76.0
$57.1
$68.8
$0
$25
$50
$75
$100
2001 2002 2003 2004 2005
$ M i l l i o n s
Competitive bid remains the most common way to acquire work-in-progress and backlog, at 57%.
Overall, 20% of participants were planning on entering new geographic regions in 2005,
primarily in the Southeast and Northeast regions. Existing U.S. contractors within the region pursuing growth and/or aggressive marketing remains
the primary source of competition, with 77% of respondents reporting it as the number one threat.
8/13/2019 2005 Financial Survey
http://slidepdf.com/reader/full/2005-financial-survey 13/284

8/13/2019 2005 Financial Survey
http://slidepdf.com/reader/full/2005-financial-survey 14/284
Executive Summary
Cash Management and Finance
Zero-balance arrangements remain the industry’s most popular cash management technique,employed by 80% of respondents.
The availability of bank credit has improved slightly, with 35% of respondents indicating that it
was better than the previous year. Similarly, 29% of respondents indicated they experienced anincrease in their working capital line of credit.
Over half of the respondents finance equipment purchases through current cash flows.
Bonding and Sureties
Not surprisingly, the vast majority of participants (94%) bond some portion of their project work.Among those who do, 39% bond less than 20%.
Among those who bond subcontractor dollars, most bond less than 20%.
Professional Consultants
About two-thirds (70%) of participants had their financial statements audited.
The most common type of accounting firm with which participants have a relationship is aregional firm with construction focus (47%).
Taxation
Over 90% of participants use the percentage-of-completion method for recognition of contractrevenue and gross profit for tax reporting purposes.
Eight percent of respondents reported having an AMT liability for the last tax year.
Fifty-six percent of all respondents filed IRS Form 8697 (Look-Back Interest Computation) withtheir last tax return.
One-third of all participants have never had an IRS examination, 26% have had an examination
within the last six years, and the remainder have not had an examination in the last six years.
Almost exclusively, tax examinations resulted in either an immaterial change or no change in taxliability.
Accounting Policies and Methods
Sixty-five percent of survey participants report their earnings on a calendar year basis.
The vast majority (97%) of respondents recognize revenue for financial statement purposes usingthe percentage-of-completion method.
Most companies (72%) recognize profits as soon as costs are charged to the job.
Fixed-price contracts are the most common type of contract.
Approximately half of those participants who need to account for joint ventures use the equitymethod.
8/13/2019 2005 Financial Survey
http://slidepdf.com/reader/full/2005-financial-survey 15/284
Executive Summary
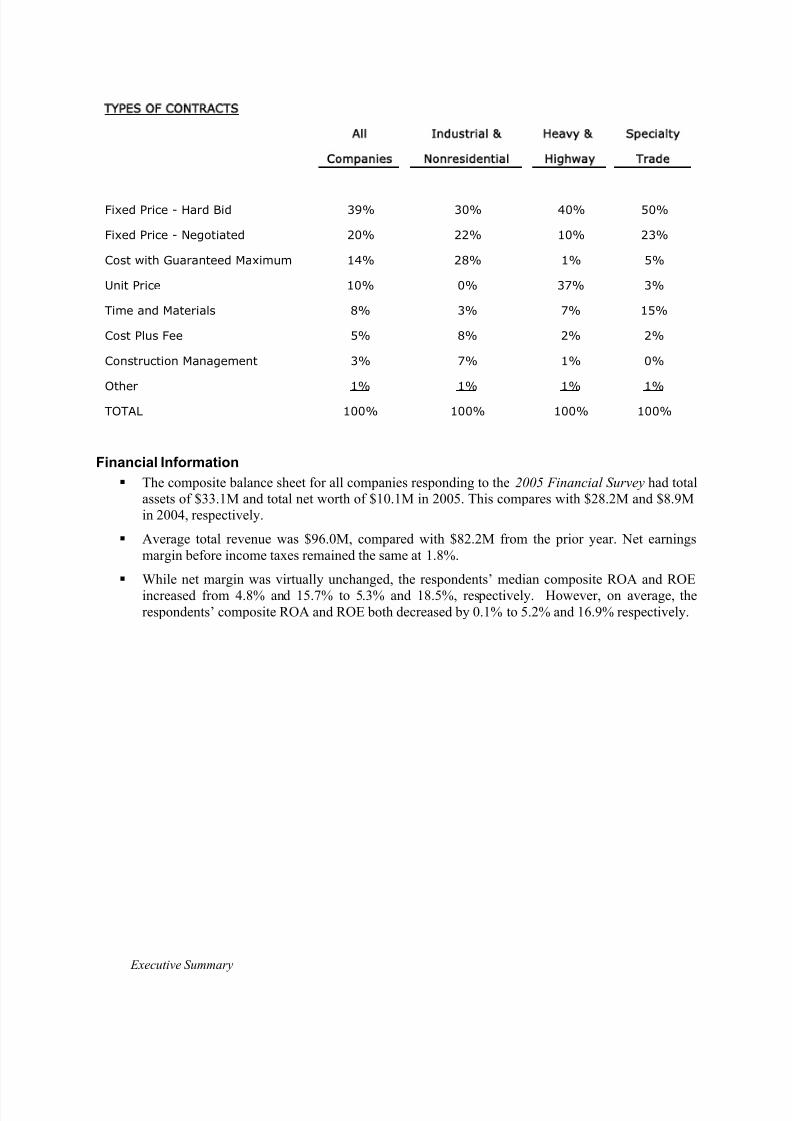
TYPES OF CONTRACTS
All Industrial & Heavy & Specialty
Companies Nonresidential Highway Trade
Fixed Price - Hard Bid 39% 30% 40% 50%
Fixed Price - Negotiated 20% 22% 10% 23%
Cost with Guaranteed Maximum 14% 28% 1% 5%
Unit Price 10% 0% 37% 3%
Time and Materials 8% 3% 7% 15%
Cost Plus Fee 5% 8% 2% 2%
Construction Management 3% 7% 1% 0%
Other 1% 1% 1% 1%
TOTAL 100% 100% 100% 100%
Financial Information
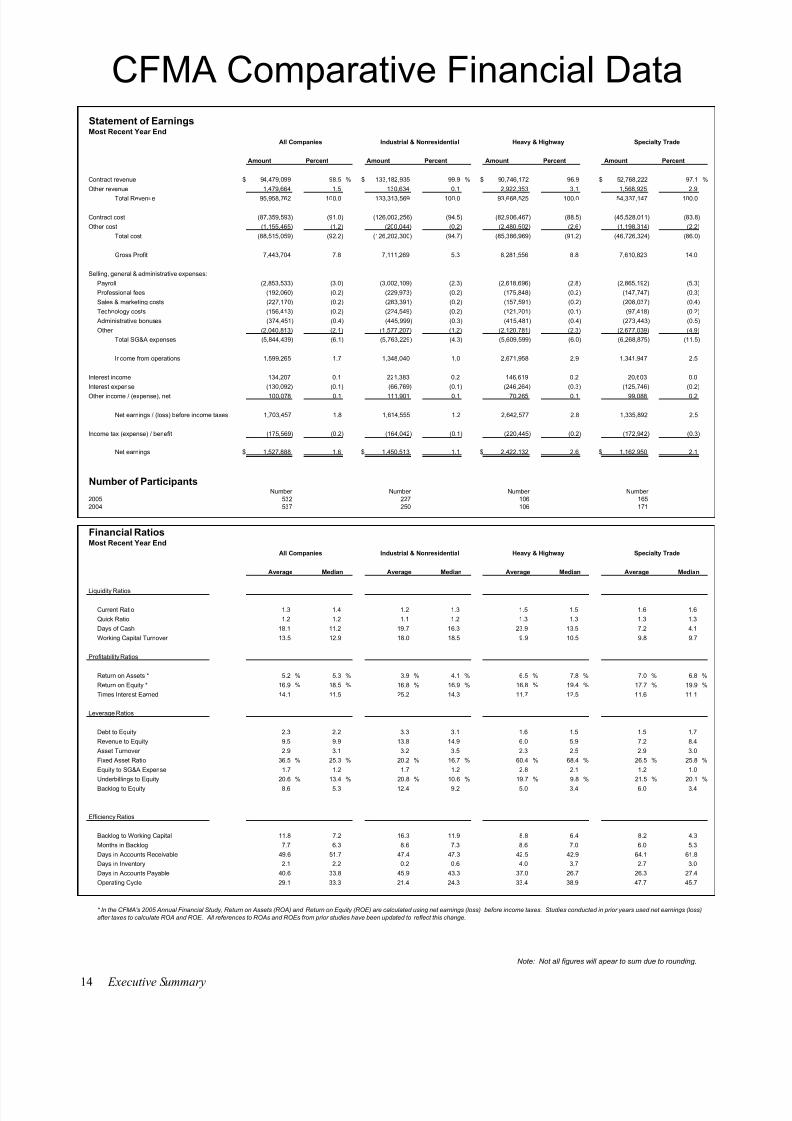
The composite balance sheet for all companies responding to the 2005 Financial Survey had totalassets of $33.1M and total net worth of $10.1M in 2005. This compares with $28.2M and $8.9Min 2004, respectively.
Average total revenue was $96.0M, compared with $82.2M from the prior year. Net earningsmargin before income taxes remained the same at 1.8%.
While net margin was virtually unchanged, the respondents’ median composite ROA and ROEincreased from 4.8% and 15.7% to 5.3% and 18.5%, respectively. However, on average, therespondents’ composite ROA and ROE both decreased by 0.1% to 5.2% and 16.9% respectively.
8/13/2019 2005 Financial Survey
http://slidepdf.com/reader/full/2005-financial-survey 16/284
Executive Summary
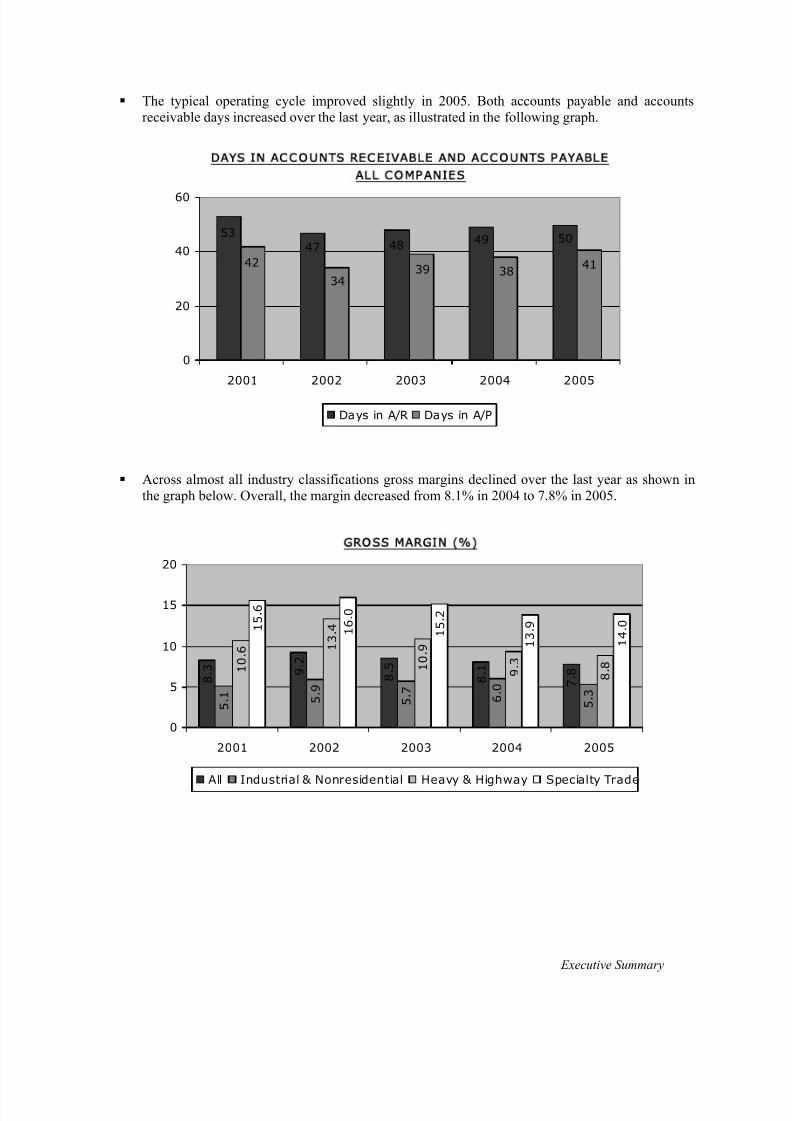
The typical operating cycle improved slightly in 2005. Both accounts payable and accountsreceivable days increased over the last year, as illustrated in the following graph.
50494847
53
413839
34
42
0
20
40
60
2001 2002 2003 2004 2005
Days in A/R Days in A/P
DAYS IN ACCOUNTS RECEIVABLE AND ACCOUNTS PAYABLE
ALL COMP ANIES
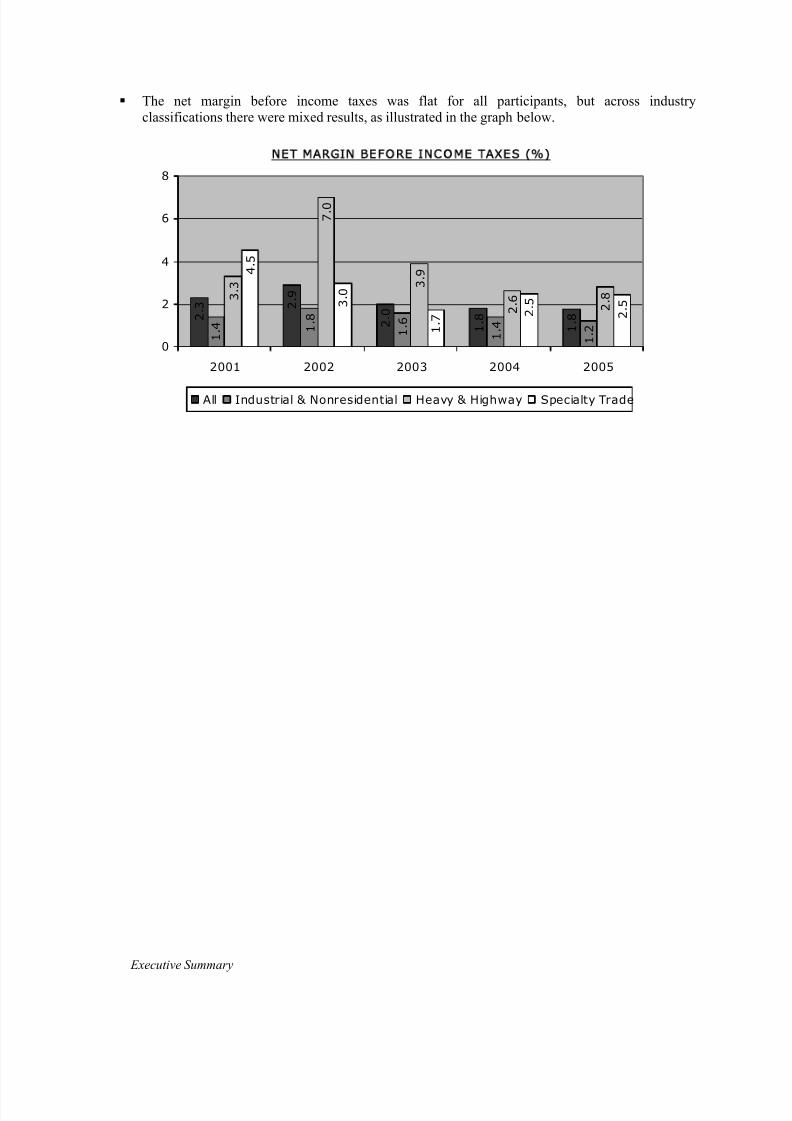
Across almost all industry classifications gross margins declined over the last year as shown inthe graph below. Overall, the margin decreased from 8.1% in 2004 to 7.8% in 2005.
GR OSS MAR GI N (% )
7 . 8 9
. 2
8 . 1
8 . 5
8 . 3
5 . 3 6
. 0 5 . 7
5 . 9
5 . 1
8 . 8
9 . 3 1
0 . 9 1
3 . 4
1 0 . 6
1 4 . 0
1 3 . 9
1 5 . 2
1 6 . 0
1 5 . 6
0
5
10
15
20
2001 2002 2003 2004 2005
All Industrial & Nonresidential Heavy & Highway Specialty Trade
8/13/2019 2005 Financial Survey
http://slidepdf.com/reader/full/2005-financial-survey 17/284
Executive Summary
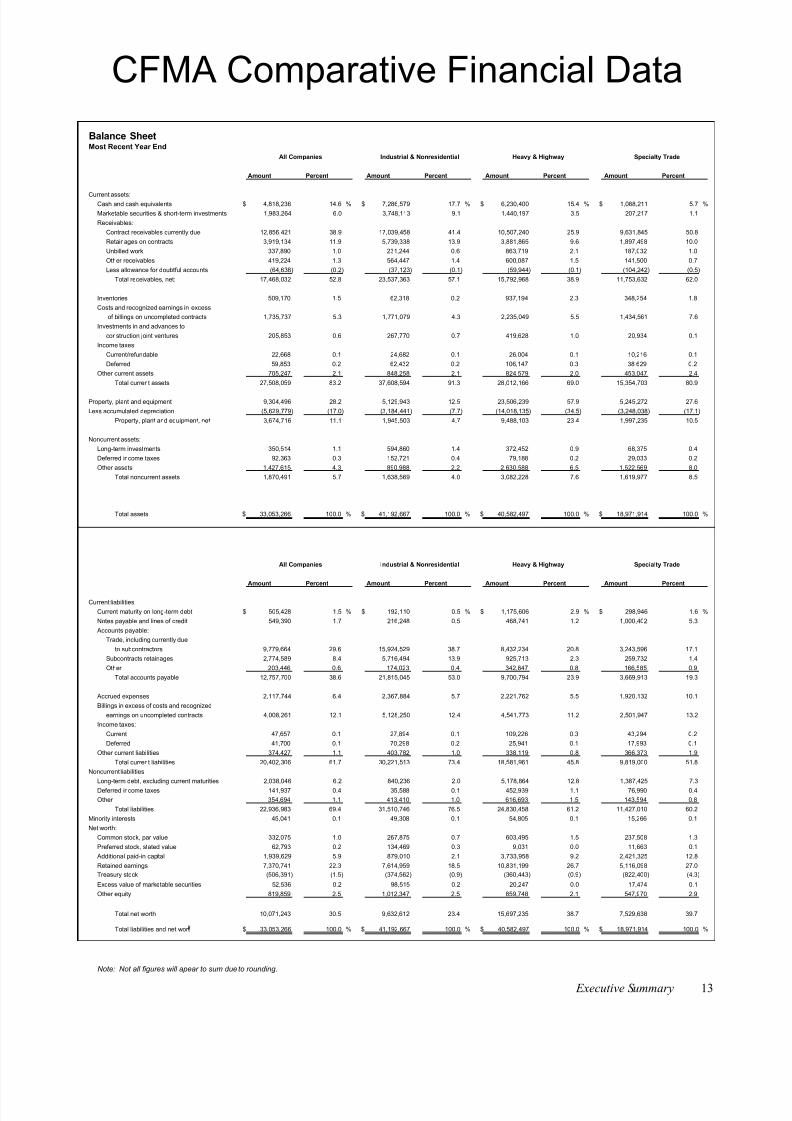
The net margin before income taxes was flat for all participants, but across industryclassifications there were mixed results, as illustrated in the graph below.
N E T M A R G I N BE F O R E I N C O M E T A X E S ( % )
1 . 8
2 . 9
1 . 8
2 . 0 2
. 3
1 . 2
1 . 4
1 . 6
1 . 8
1 . 4
2 . 8
2 . 6
3 . 9
7 . 0
3 . 3
2 . 5
2 . 5
1 . 7
3 . 0
4 . 5
0
2
4
6
8
2001 2002 2003 2004 2005
All Industrial & Nonresidential Heavy & Highway Specialty Trade
8/13/2019 2005 Financial Survey
http://slidepdf.com/reader/full/2005-financial-survey 18/284
Balance SheetMost Recent Year End
Amount Percent Amount Percent Amount Percent Amount Percent
Current assets:Cash and cash equivalents $ 4,818,236 14.6 % $ 7,286,579 17.7 % $ 6,230,400 15.4 % $ 1,088,211 5.7 %
Marketable securities & short-term investments 1,983,264 6.0 3,748,113 9.1 1,440,197 3.5 207,217 1.1
Receivables:
Contract receivables currently due 12,856,421 38.9 17,039,458 41.4 10,507,240 25.9 9,631,845 50.8
Retainages on contracts 3,919,134 11.9 5,739,338 13.9 3,881,865 9.6 1,897,498 10.0
Unbilled work 337,890 1.0 231,244 0.6 863,719 2.1 187,032 1.0
Other receivables 419,224 1.3 564,447 1.4 600,087 1.5 141,500 0.7
Less allowance for doubtful accounts (64,638) (0.2) (37,123) (0.1) (59,944) (0.1) (104,242) (0.5)
Total receivables, net: 17,468,032 52.8 23,537,363 57.1 15,792,968 38.9 11,753,632 62.0
Inventories 509,170 1.5 62,318 0.2 937,194 2.3 348,254 1.8
Costs and recognized earnings in excess
of billings on uncompleted contracts 1,735,737 5.3 1,771,079 4.3 2,235,049 5.5 1,434,561 7.6
Investments in and advances to
construction joint ventures 205,853 0.6 267,770 0.7 419,628 1.0 20,934 0.1
Income taxes:
Current/refundable 22,668 0.1 24,682 0.1 26,004 0.1 10,216 0.1
Deferred 59,853 0.2 62,432 0.2 106,147 0.3 38,629 0.2
Other current assets 705,247 2.1 848,258 2.1 824,579 2.0 453,047 2.4
Total current assets 27,508,059 83.2 37,608,594 91.3 28,012,166 69.0 15,354,703 80.9
Property, plant and equipment 9,304,496 28.2 5,129,943 12.5 23,506,239 57.9 5,245,272 27.6
Less accumulated depreciation (5,629,779) (17.0) (3,184,441) (7.7) (14,018,135) (34.5) (3,248,038) (17.1)
Property, plant and equipment, net 3,674,716 11.1 1,945,503 4.7 9,488,103 23.4 1,997,235 10.5
Noncurrent assets:
Long-term investments 350,514 1.1 594,860 1.4 372,452 0.9 68,375 0.4
Deferred income taxes 92,363 0.3 152,721 0.4 79,188 0.2 29,033 0.2
Other assets 1,427,615 4.3 890,988 2.2 2,630,588 6.5 1,522,569 8.0
Total noncurrent assets 1,870,491 5.7 1,638,569 4.0 3,082,228 7.6 1,619,977 8.5
Total assets $ 33,053,266 100.0 % $ 41,192,667 100.0 % $ 40,582,497 100.0 % $ 18,971,914 100.0 %
Amount Percent Amount Percent Amount Percent Amount Percent
Current liabilities:
Current maturity on long-term debt $ 505,428 1.5 % $ 192,110 0.5 % $ 1,175,606 2.9 % $ 298,946 1.6 %
Notes payable and lines of credit 549,390 1.7 216,248 0.5 468,741 1.2 1,000,402 5.3
Accounts payable:
Trade, including currently due
to subcontractors 9,779,664 29.6 15,924,529 38.7 8,432,234 20.8 3,243,596 17.1
Subcontracts retainages 2,774,589 8.4 5,716,494 13.9 925,713 2.3 259,732 1.4
Other 203,446 0.6 174,023 0.4 342,847 0.8 166,585 0.9
Total accounts payable 12,757,700 38.6 21,815,045 53.0 9,700,794 23.9 3,669,913 19.3
Accrued expenses 2,117,744 6.4 2,367,884 5.7 2,221,762 5.5 1,920,132 10.1
Billings in excess of costs and recognized
earnings on uncompleted contracts 4,008,261 12.1 5,128,250 12.4 4,541,773 11.2 2,501,947 13.2
Income taxes:
Current 47,657 0.1 27,894 0.1 109,226 0.3 43,294 0.2
Deferred 41,700 0.1 70,298 0.2 25,941 0.1 17,993 0.1
Other current liabilities 374,427 1.1 403,782 1.0 338,119 0.8 366,373 1.9
Total current liabilities 20,402,306 61.7 30,221,513 73.4 18,581,961 45.8 9,819,000 51.8
Noncurrent liabilities
Long-term debt, excluding current maturities 2,038,046 6.2 840,236 2.0 5,178,864 12.8 1,387,425 7.3
Deferred income taxes 141,937 0.4 35,588 0.1 452,939 1.1 76,990 0.4
Other 354,694 1.1 413,410 1.0 616,693 1.5 143,594 0.8
Total liabilities 22,936,983 69.4 31,510,746 76.5 24,830,458 61.2 11,427,010 60.2
Minority interests 45,041 0.1 49,308 0.1 54,805 0.1 15,266 0.1
Net worth:
Common stock, par value 332,075 1.0 267,875 0.7 603,495 1.5 237,508 1.3
Preferred stock, stated value 62,793 0.2 134,469 0.3 9,031 0.0 11,663 0.1
Additional paid-in capital 1,939,629 5.9 879,010 2.1 3,733,958 9.2 2,421,325 12.8
Retained earnings 7,370,741 22.3 7,614,959 18.5 10,831,199 26.7 5,116,098 27.0
Treasury stock (506,391) (1.5) (374,562) (0.9) (360,443) (0.9) (822,400) (4.3)
Excess value of marketable securities 52,536 0.2 98,515 0.2 20,247 0.0 17,474 0.1
Other equity 819,859 2.5 1,012,347 2.5 859,748 2.1 547,970 2.9
Total net worth 10,071,243 30.5 9,632,612 23.4 15,697,235 38.7 7,529,638 39.7
Total liabilities and net wort $ 33,053,266 100.0 % $ 41,192,667 100.0 % $ 40,582,497 100.0 % $ 18,971,914 100.0 %
Note: Not all figures will apear to sum due to rounding.
CFMA Comparative Financial Data
All Companies Industrial & Nonresidential Heavy & Highway Specialty Trade
All Companies Industrial & Nonresidential Heavy & Highway Specialty Trade
Executive Summary 13
8/13/2019 2005 Financial Survey
http://slidepdf.com/reader/full/2005-financial-survey 19/284
Statement of EarningsMost Recent Year End
Amount Percent Amount Percent Amount Percent Amount Percent
Contract revenue $ 94,479,099 98.5 % $ 133,182,935 99.9 % $ 90,746,172 96.9 $ 52,768,222 97.1 %
Other revenue 1,479,664 1.5 130,634 0.1 2,922,353 3.1 1,568,925 2.9
Total Revenue 95,958,762 100.0 133,313,569 100.0 93,668,525 100.0 54,337,147 100.0
Contract cost (87,359,593) (91.0) (126,002,256) (94.5) (82,906,467) (88.5) (45,528,011) (83.8)
Other cost (1,155,465) (1.2) (200,044) (0.2) (2,480,502) (2.6) (1,198,314) (2.2)
Total cost (88,515,059) (92.2) (126,202,300) (94.7) (85,386,969) (91.2) (46,726,324) (86.0)
Gross Profit 7,443,704 7.8 7,111,269 5.3 8,281,556 8.8 7,610,823 14.0
Selling, general & administrative expenses:
Payroll (2,853,533) (3.0) (3,002,109) (2.3) (2,618,696) (2.8) (2,865,192) (5.3)
Professional fees (192,060) (0.2) (229,973) (0.2) (175,848) (0.2) (147,747) (0.3)
Sales & marketing costs (227,170) (0.2) (283,391) (0.2) (157,591) (0.2) (208,037) (0.4)
Technology costs (156,413) (0.2) (224,549) (0.2) (121,201) (0.1) (97,418) (0.2)
Administrative bonuses (374,451) (0.4) (445,999) (0.3) (415,481) (0.4) (273,443) (0.5)
Other (2,040,813) (2.1) (1,577,207) (1.2) (2,120,781) (2.3) (2,677,039) (4.9)
Total SG&A expenses (5,844,439) (6.1) (5,763,229) (4.3) (5,609,599) (6.0) (6,268,875) (11.5)
Income from operations 1,599,265 1.7 1,348,040 1.0 2,671,958 2.9 1,341,947 2.5
Interest income 134,207 0.1 221,383 0.2 146,619 0.2 20,603 0.0
Interest expense (130,092) (0.1) (66,769) (0.1) (246,264) (0.3) (125,746) (0.2)
Other income / (expense), net 100,078 0.1 111,901 0.1 70,265 0.1 99,088 0.2
Net earnings / (loss) before income taxes 1,703,457 1.8 1,614,555 1.2 2,642,577 2.8 1,335,892 2.5
Income tax (expense) / benefit (175,569) (0.2) (164,042) (0.1) (220,445) (0.2) (172,942) (0.3)
Net earnings $ 1,527,888 1.6 $ 1,450,513 1.1 $ 2,422,132 2.6 $ 1,162,950 2.1
Number of ParticipantsNumber Number Number Number
2005 532 227 106 1652004 537 250 106 171
Financial RatiosMost Recent Year End
Average Median Average Median Average Median Average Median
Liquidity Ratios
Current Ratio 1.3 1.4 1.2 1.3 1.5 1.5 1.6 1.6
Quick Ratio 1.2 1.2 1.1 1.2 1.3 1.3 1.3 1.3
Days of Cash 18.1 11.2 19.7 16.3 23.9 13.5 7.2 4.1
Working Capital Turnover 13.5 12.9 18.0 18.5 9.9 10.5 9.8 9.7
Profitability Ratios
Return on Assets * 5.2 % 5.3 % 3.9 % 4.1 % 6.5 % 7.8 % 7.0 % 6.8 %
Return on Equity * 16.9 % 18.5 % 16.8 % 16.9 % 16.8 % 19.4 % 17.7 % 19.9 %
Times Interest Earned 14.1 11.5 25.2 14.3 11.7 12.5 11.6 11.1
Leverage Ratios
Debt to Equity 2.3 2.2 3.3 3.1 1.6 1.5 1.5 1.7
Revenue to Equity 9.5 9.9 13.8 14.9 6.0 5.9 7.2 8.4
Asset Turnover 2.9 3.1 3.2 3.5 2.3 2.5 2.9 3.0
Fixed Asset Ratio 36.5 % 25.3 % 20.2 % 16.7 % 60.4 % 68.4 % 26.5 % 25.8 %
Equity to SG&A Expense 1.7 1.2 1.7 1.2 2.8 2.1 1.2 1.0
Underbillings to Equity 20.6 % 13.4 % 20.8 % 10.6 % 19.7 % 9.8 % 21.5 % 20.1 %
Backlog to Equity 8.6 5.3 12.4 9.2 5.0 3.4 6.0 3.4
Efficiency Ratios
Backlog to Working Capital 11.8 7.2 16.3 11.9 8.8 6.4 8.2 4.3
Months in Backlog 7.7 6.3 8.6 7.3 8.6 7.0 6.0 5.3
Days in Accounts Receivable 49.6 51.7 47.4 47.3 42.5 42.9 64.1 61.8
Days in Inventory 2.1 2.2 0.2 0.6 4.0 3.7 2.7 3.0
Days in Accounts Payable 40.6 33.8 45.9 43.3 37.0 26.7 26.3 27.4
Operating Cycle 29.1 33.3 21.4 24.3 33.4 38.9 47.7 45.7
14 Executive Summary
Note: Not all figures will apear to sum due to rounding.
CFMA Comparative Financial Data
All Companies Industrial & Nonresidential Heavy & Highway Specialty Trade
* In the CFMA's 2005 Annual Financial Study, Return on Assets (ROA) and Return on Equity (ROE) are calculated using net earnings (loss) before income taxes. Studies conducted in prior years used net earnings (loss)
after taxes to calculate ROA and ROE. All references to ROAs and ROEs from prior studies have been updated to reflect this change.
All Companies Industrial & Nonresidential Heavy & Highway Specialty Trade

8/13/2019 2005 Financial Survey
http://slidepdf.com/reader/full/2005-financial-survey 20/284
C F M A ’s 2 0 0 5
Construction
Industry Annual
Financial Survey
HOT TOPIC: EMPLOYEE
INCENTIVES & BONUSES
8/13/2019 2005 Financial Survey
http://slidepdf.com/reader/full/2005-financial-survey 21/284
Hot Topic: Employee Incentives and Bonuses
HOT TOPIC EMPLOYEE INCENTIVES AND BONUSES
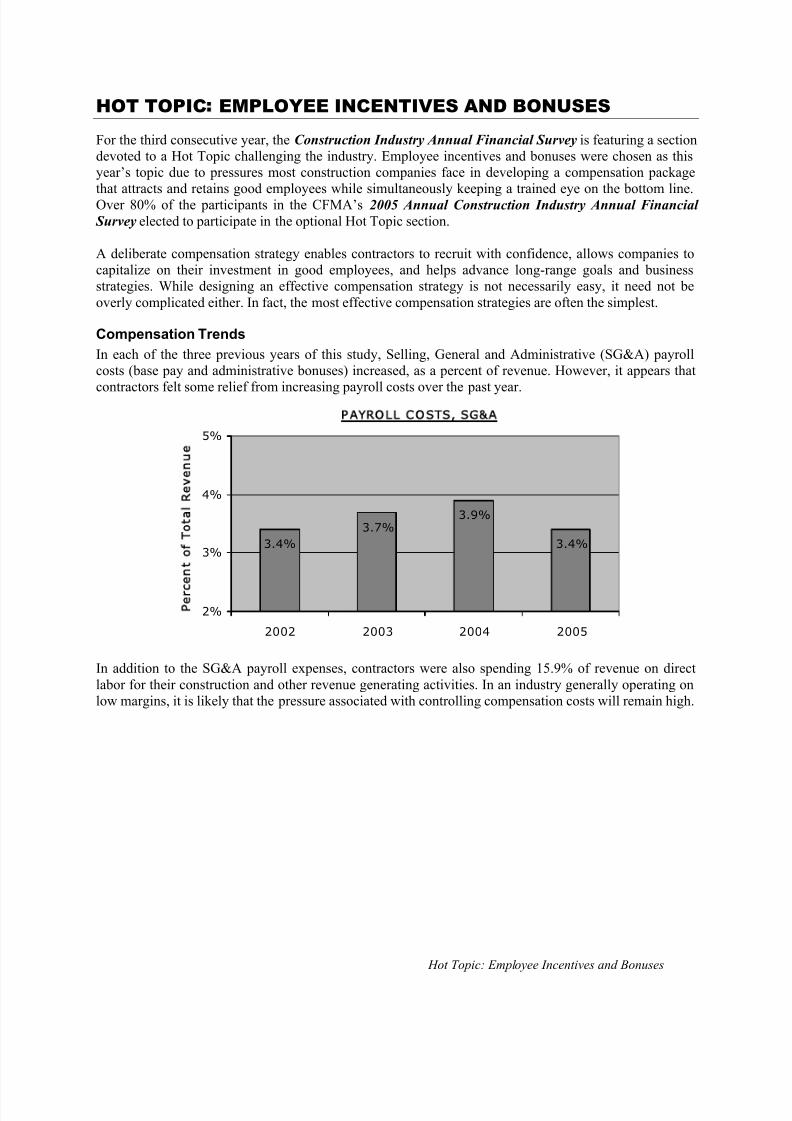
For the third consecutive year, the Construction Industry Annual Financial Survey is featuring a sectiondevoted to a Hot Topic challenging the industry. Employee incentives and bonuses were chosen as thisyear’s topic due to pressures most construction companies face in developing a compensation packagethat attracts and retains good employees while simultaneously keeping a trained eye on the bottom line.Over 80% of the participants in the CFMA’s 2005 Annual Construction Industry Annual Financial
Survey elected to participate in the optional Hot Topic section.
A deliberate compensation strategy enables contractors to recruit with confidence, allows companies tocapitalize on their investment in good employees, and helps advance long-range goals and businessstrategies. While designing an effective compensation strategy is not necessarily easy, it need not beoverly complicated either. In fact, the most effective compensation strategies are often the simplest.
Compensation Trends
In each of the three previous years of this study, Selling, General and Administrative (SG&A) payrollcosts (base pay and administrative bonuses) increased, as a percent of revenue. However, it appears that
contractors felt some relief from increasing payroll costs over the past year.
P A Y R O L L C O S T S , S G & A
3.4%
3.7%3.9%
3.4%
2%
3%
4%
5%
2002 2003 2004 2005
Pc
toTa Re
ue
In addition to the SG&A payroll expenses, contractors were also spending 15.9% of revenue on directlabor for their construction and other revenue generating activities. In an industry generally operating onlow margins, it is likely that the pressure associated with controlling compensation costs will remain high.
8/13/2019 2005 Financial Survey
http://slidepdf.com/reader/full/2005-financial-survey 22/284
Hot Topic: Employee Incentives and Bonuses
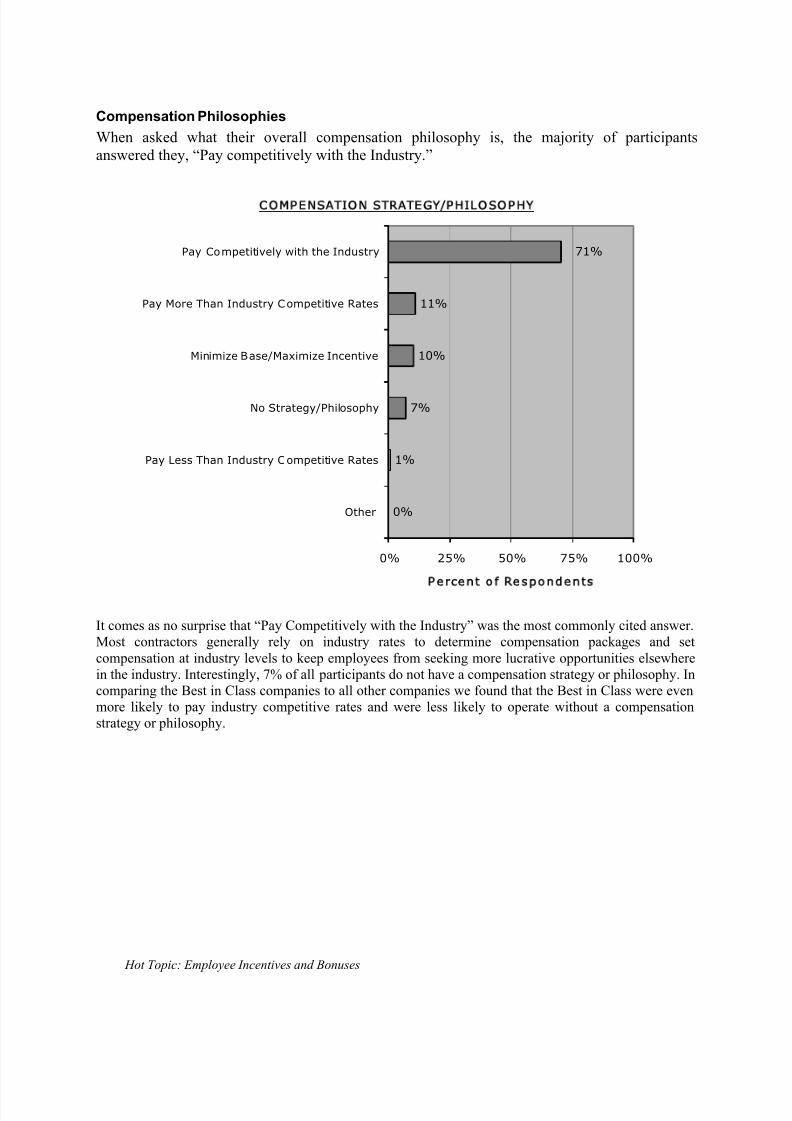
Compensation Philosophies
When asked what their overall compensation philosophy is, the majority of participantsanswered they, “Pay competitively with the Industry.”
C O M P E N S A T I O N S T R A T E G Y / P H I L O S O P H Y
0%
1%
7%
10%
11%
71%
0% 25% 50% 75% 100%
Other
Pay Less Than Industry Competitive Rates
No Strategy/Philosophy
Minimize Base/Maximize Incentive
Pay More Than Industry Competitive Rates
Pay Competitively with the Industry
P e r c e n t o f R e s p o n d e n t s
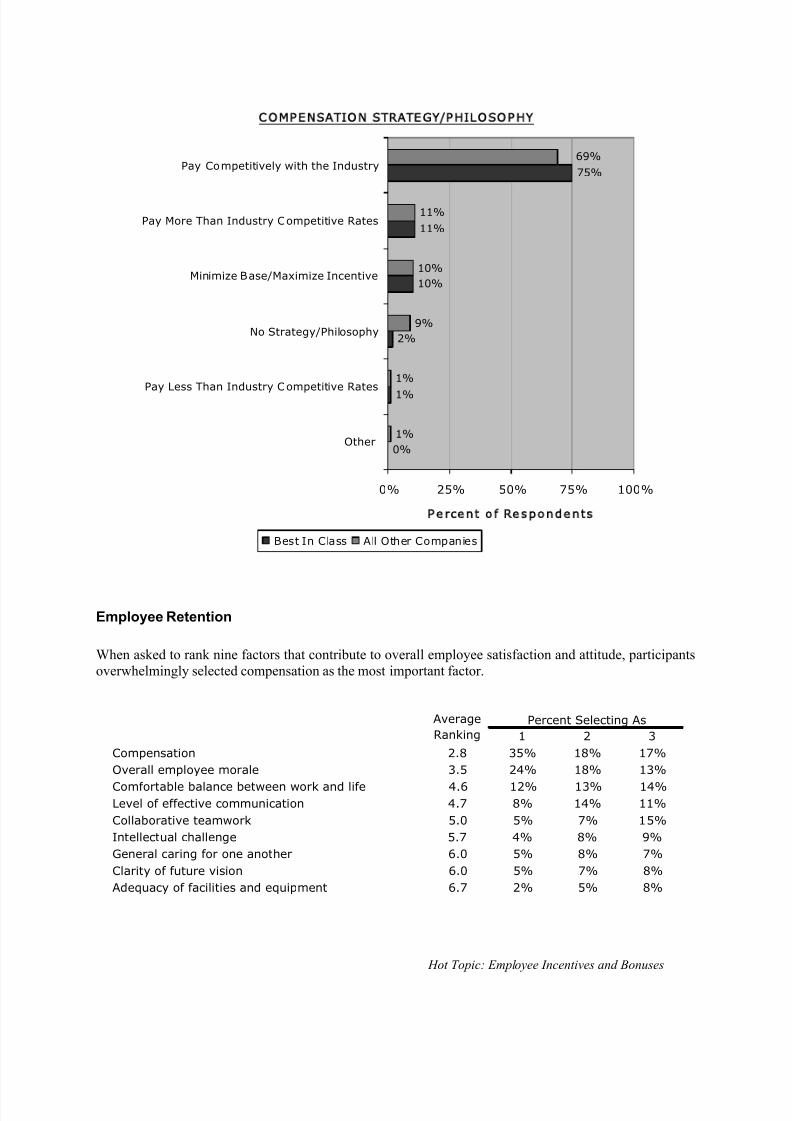
It comes as no surprise that “Pay Competitively with the Industry” was the most commonly cited answer.Most contractors generally rely on industry rates to determine compensation packages and setcompensation at industry levels to keep employees from seeking more lucrative opportunities elsewherein the industry. Interestingly, 7% of all participants do not have a compensation strategy or philosophy. Incomparing the Best in Class companies to all other companies we found that the Best in Class were evenmore likely to pay industry competitive rates and were less likely to operate without a compensationstrategy or philosophy.
8/13/2019 2005 Financial Survey
http://slidepdf.com/reader/full/2005-financial-survey 23/284
Hot Topic: Employee Incentives and Bonuses
COMP ENSATION STRATEGY/PHILOSOPHY
0%
1%
2%
10%
11%
75%
1%
1%
9%
10%
11%
69%
0% 25% 50% 75% 100%
Other
Pay Less Than Industry Competitive Rates
No Strategy/Philosophy
Minimize Base/Maximize Incentive
Pay More Than Industry Competitive Rates
Pay Competitively with the Industry
Percent of Respondents
Best In Class All Other Companies
Employee Retention
When asked to rank nine factors that contribute to overall employee satisfaction and attitude, participantsoverwhelmingly selected compensation as the most important factor.
Average
Ranking 1 2 3
Compensation 2.8 35% 18% 17%
Overall employee morale 3.5 24% 18% 13%
Comfortable balance between work and life 4.6 12% 13% 14%Level of effective communication 4.7 8% 14% 11%
Collaborative teamwork 5.0 5% 7% 15%
Intellectual challenge 5.7 4% 8% 9%
General caring for one another 6.0 5% 8% 7%
Clarity of future vision 6.0 5% 7% 8%
Adequacy of facilities and equipment 6.7 2% 5% 8%
Percent Selecting As
8/13/2019 2005 Financial Survey
http://slidepdf.com/reader/full/2005-financial-survey 24/284
Hot Topic: Employee Incentives and Bonuses
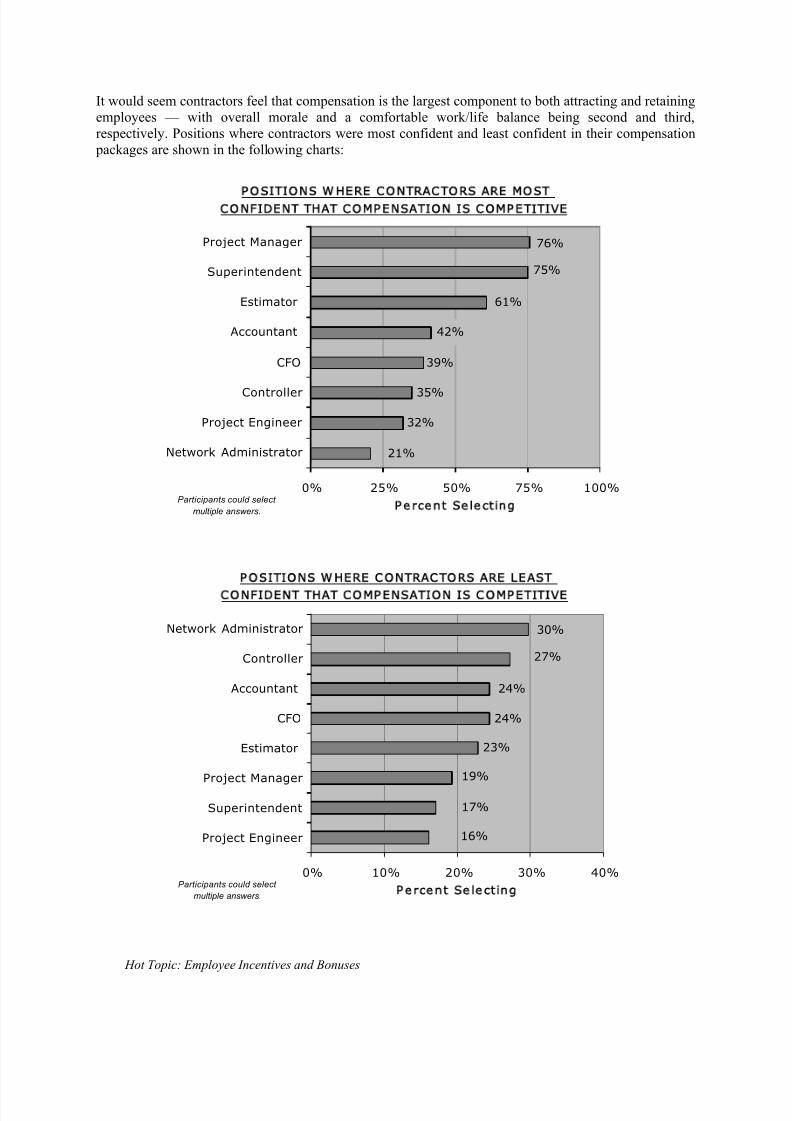
It would seem contractors feel that compensation is the largest component to both attracting and retainingemployees — with overall morale and a comfortable work/life balance being second and third,respectively. Positions where contractors were most confident and least confident in their compensation packages are shown in the following charts:
PO SITIONS W HERE CO NTRACTORS ARE MOST
35%
21%
42%
39%
75%
61%
32%
0% 25% 50% 75% 100%
Network Administrator
Project Engineer
Controller
CFO
Accountant
Estimator
Superintendent
Project Manager
P e r c e n t S e l e c t in gParticipants could select
multiple answers.
P O S I TI O N S W H E R E C O N T R A C T O R S AR E L E A S T
C O N F ID E N T TH A T C O M P E N S A TI O N I S C O M P E T T IV E
23%
24%
30%
27%
24%
17%
19%
16%
0% 10% 20% 30% 40%
Project Engineer
Superintendent
Project Manager
Estimator
CFO
Accountant
Controller
Network Administrator
Percent SelectingParticipants could select
multiple answers.
76%
CONFIDENT THAT COMPENSATION IS COMPET TIVE

8/13/2019 2005 Financial Survey
http://slidepdf.com/reader/full/2005-financial-survey 25/284
Hot Topic: Employee Incentives and Bonuses
The positions with the highest turnover were as follows:
3%
2%
1%
7%1
0%1
5%
25%
36%
0%
10%
20%
30%
40%
Project
Manager
Superintendent
E
stimator
Project
Engineer
Accountant
Controller
CFO
N
etwork
Adm
inistrator
P O S I TI O N S W I TH T H E H I G H E S T T U R N O V E R D U R I N G L A S T 3 Y E A R S
Interestingly, the position in which contractors were most confident in their compensation packages(project manager) was also the position with the highest turnover. This suggests there is some level ofdisconnect between the perceived importance of compensation as part of employee satisfaction andconfidence in current compensation packages. The following chart shows how contractors perceive whyemployees left their company:
R E A S O N S W H Y E M P L O Y E E S L E F T
24%27%28%
49%
55%
0%
20%
40%
60%
80%
Better
Opportunity
Elsewhere
Terminated for
Poor
Performance
Layoff/Reduction
in Staff
Incompatible
with Company
Culture
Terminated for
CauseParticipants
co uld select
multiple
answers.
8/13/2019 2005 Financial Survey
http://slidepdf.com/reader/full/2005-financial-survey 26/284
Hot Topic: Employee Incentives and Bonuses
The single largest reason cited by participants for employee turnover was better opportunity elsewhere at55%. Fifty-one percent of the employees that left went to a competing company. This could suggest thatcurrent compensation packages might not be as competitive as perceived or that “opportunity” extends beyond compensation. In any event, contractors would probably benefit from re-examining (orestablishing) their compensation strategy/philosophy.
Developing a Compensation PhilosophySome general philosophies or belief systems exist regarding compensation, each addressing this question:“In respect to paying my employees, what is important?”
1. General economic climate/cost of living
2. What an individual contractor can afford
3. Employee tenure
4. Employee competency
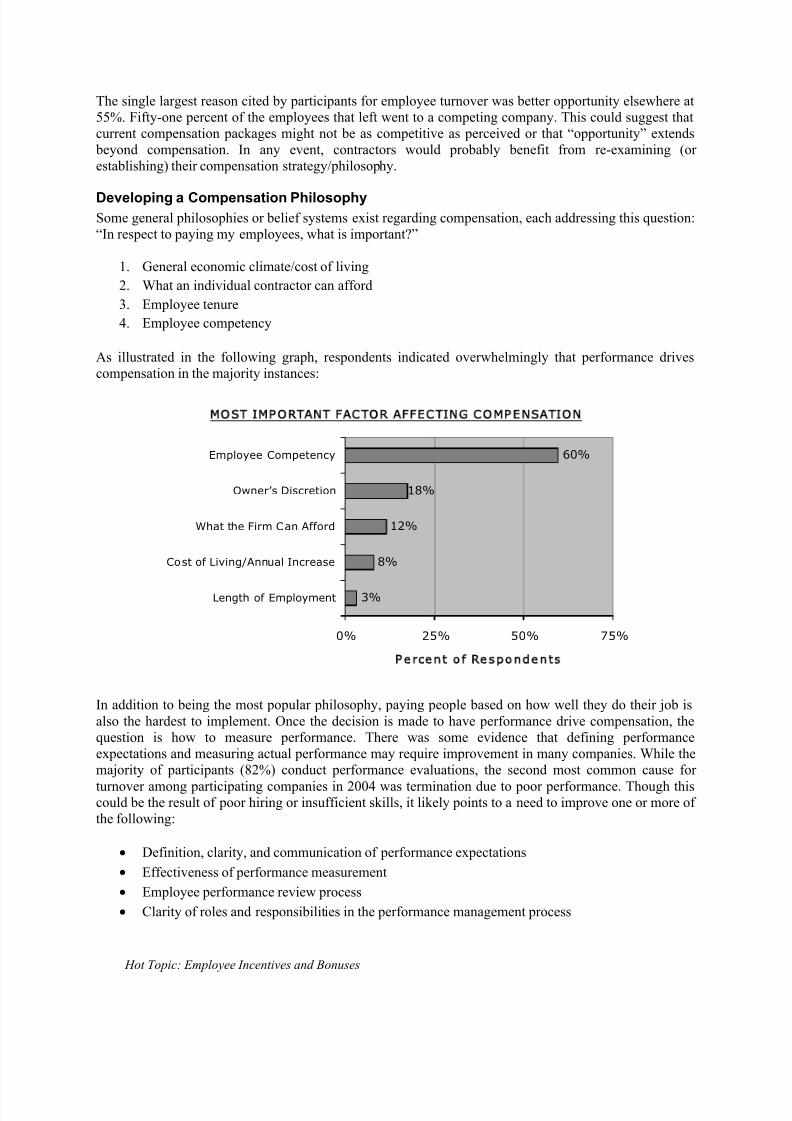
As illustrated in the following graph, respondents indicated overwhelmingly that performance drivescompensation in the majority instances:
3%
60%
8%
12%
18%
0% 25% 50% 75%
Length of Employment
Cost of Living/Annual Increase
What the Firm Can Afford
Owner’s Discretion
Employee Competency
P e r c e n t o f R e s p o n d e n t s
M O S T I M P O R T A N T F AC T O R A F F E C T IN G C O M P E N S A T IO N
In addition to being the most popular philosophy, paying people based on how well they do their job isalso the hardest to implement. Once the decision is made to have performance drive compensation, thequestion is how to measure performance. There was some evidence that defining performanceexpectations and measuring actual performance may require improvement in many companies. While themajority of participants (82%) conduct performance evaluations, the second most common cause for
turnover among participating companies in 2004 was termination due to poor performance. Though thiscould be the result of poor hiring or insufficient skills, it likely points to a need to improve one or more ofthe following:
• Definition, clarity, and communication of performance expectations
• Effectiveness of performance measurement
• Employee performance review process
• Clarity of roles and responsibilities in the performance management process
8/13/2019 2005 Financial Survey
http://slidepdf.com/reader/full/2005-financial-survey 27/284
Hot Topic: Employee Incentives and Bonuses
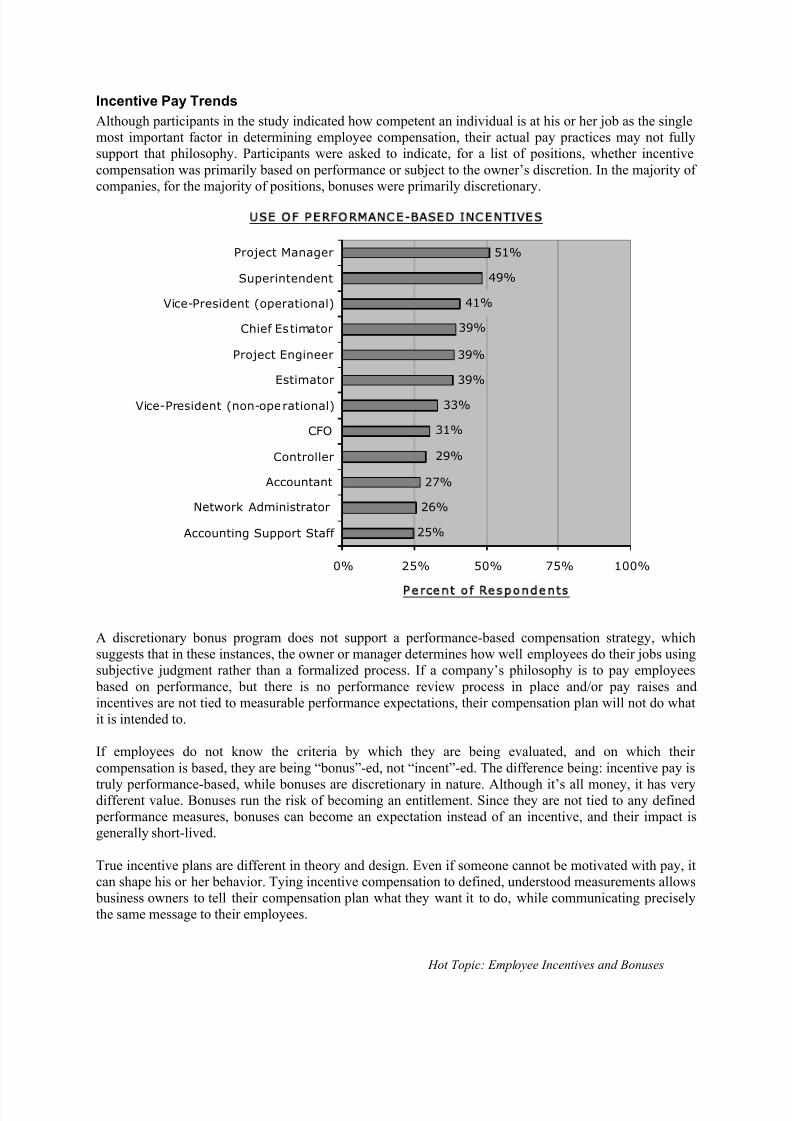
Incentive Pay Trends
Although participants in the study indicated how competent an individual is at his or her job as the singlemost important factor in determining employee compensation, their actual pay practices may not fullysupport that philosophy. Participants were asked to indicate, for a list of positions, whether incentivecompensation was primarily based on performance or subject to the owner’s discretion. In the majority ofcompanies, for the majority of positions, bonuses were primarily discretionary.
U S E O F P E R F O R M A N C E - BA S E D IN C E N T I V E S
26%
27%
51%
29%
25%
39%
33%
31%
39%
41%
49%
39%
0% 25% 50% 75% 100%
Accounting Support Staff
Network Administrator
Accountant
Controller
CFO
Vice-President (non-operational)
Estimator
Project Engineer
Chief Estimator
Vice-President (operational)
Superintendent
Project Manager
P e r ce n t o f R e s p o n d e n t s
A discretionary bonus program does not support a performance-based compensation strategy, whichsuggests that in these instances, the owner or manager determines how well employees do their jobs usingsubjective judgment rather than a formalized process. If a company’s philosophy is to pay employees based on performance, but there is no performance review process in place and/or pay raises andincentives are not tied to measurable performance expectations, their compensation plan will not do whatit is intended to.
If employees do not know the criteria by which they are being evaluated, and on which theircompensation is based, they are being “bonus”-ed, not “incent”-ed. The difference being: incentive pay is
truly performance-based, while bonuses are discretionary in nature. Although it’s all money, it has verydifferent value. Bonuses run the risk of becoming an entitlement. Since they are not tied to any defined performance measures, bonuses can become an expectation instead of an incentive, and their impact isgenerally short-lived.
True incentive plans are different in theory and design. Even if someone cannot be motivated with pay, itcan shape his or her behavior. Tying incentive compensation to defined, understood measurements allows business owners to tell their compensation plan what they want it to do, while communicating preciselythe same message to their employees.
8/13/2019 2005 Financial Survey
http://slidepdf.com/reader/full/2005-financial-survey 28/284
Hot Topic: Employee Incentives and Bonuses
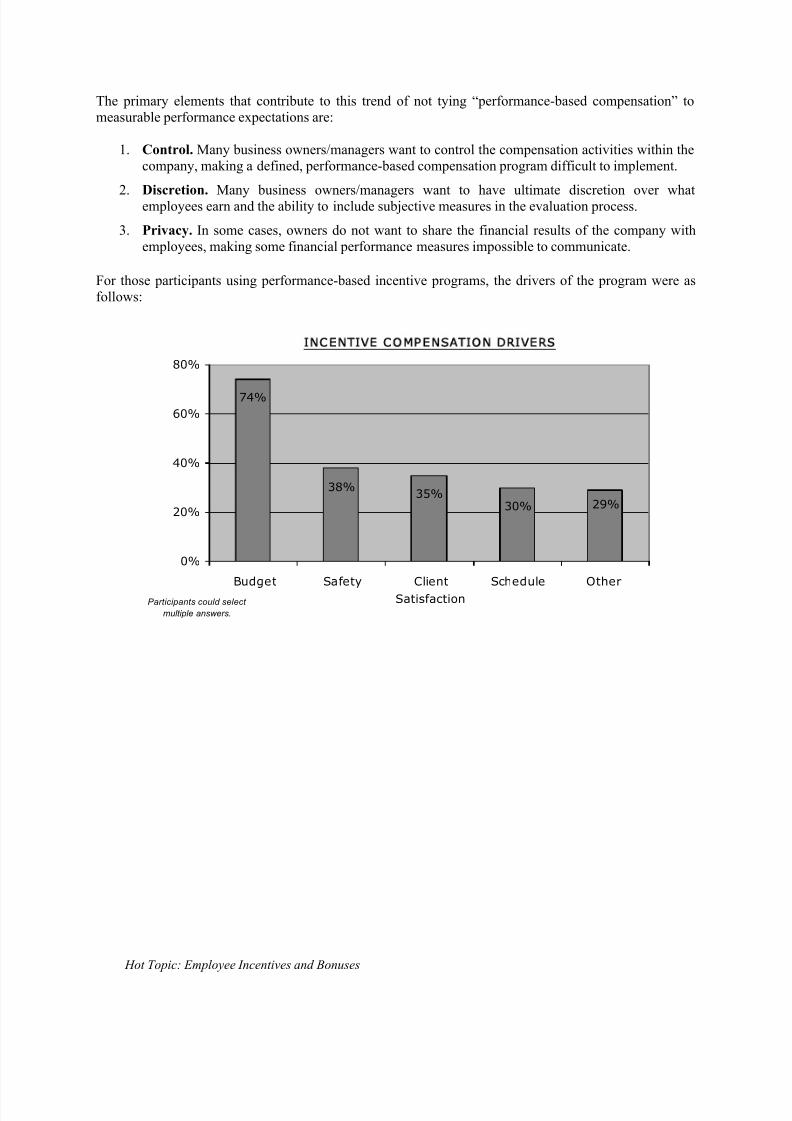
The primary elements that contribute to this trend of not tying “performance-based compensation” tomeasurable performance expectations are:
1. Control. Many business owners/managers want to control the compensation activities within thecompany, making a defined, performance-based compensation program difficult to implement.
2. Discretion. Many business owners/managers want to have ultimate discretion over whatemployees earn and the ability to include subjective measures in the evaluation process.
3. Privacy. In some cases, owners do not want to share the financial results of the company withemployees, making some financial performance measures impossible to communicate.
For those participants using performance-based incentive programs, the drivers of the program were asfollows:
INCENTIVE CO MPENSATION DRIVERS
29%30%35%
38%
74%
0%
20%
40%
60%
80%
Budget Safety Client
Satisfaction
Schedule Other
Participants could select
multiple answers.

8/13/2019 2005 Financial Survey
http://slidepdf.com/reader/full/2005-financial-survey 29/284
Hot Topic: Employee Incentives and Bonuses
Conclusion
There are several things to consider when revisiting/establishing a compensation philosophy/strategy,including:
1. What do you want to pay and can you afford to pay it ? Although you may want to pay more
than the competition, it may not be economical to do so. Define both your philosophy and internaleconomics to ensure they are aligned.
2. How will you determine industry compensation rates? Reliable data from relevantcompensation benchmarking studies is a major component of “good” compensation programs.The most sophisticated programs carefully compare the skills, qualifications, job duties, andfunctions of a given position against industry data to establish a competitive compensation range.A significant number of owners/managers feel that they have a good sense of what is considered“competitive,” but using a formalized process of benchmarking adds transparency andobjectivity.
3. How will you structure your compensation package? Will compensation be primarily salary based or will incentive compensation comprise a significant component of total compensation? If
incentive compensation will be used, what drives the incentive program — individual performance? Team performance? Company-wide performance? How do perquisites factor intototal compensation?
4. Does your compensation strategy/philosophy promote and/or reinforce the achievement of
company-wide goals? A compensation plan will always do what you tell it to do. If yourcompensation plan is tied to an underlying business strategy, the plan will reinforce that strategy.And, if your compensation strategy is arbitrary or undefined, the plan’s effectiveness will belimited.
8/13/2019 2005 Financial Survey
http://slidepdf.com/reader/full/2005-financial-survey 30/284
Hot Topic: Employee Incentives and Bonuses
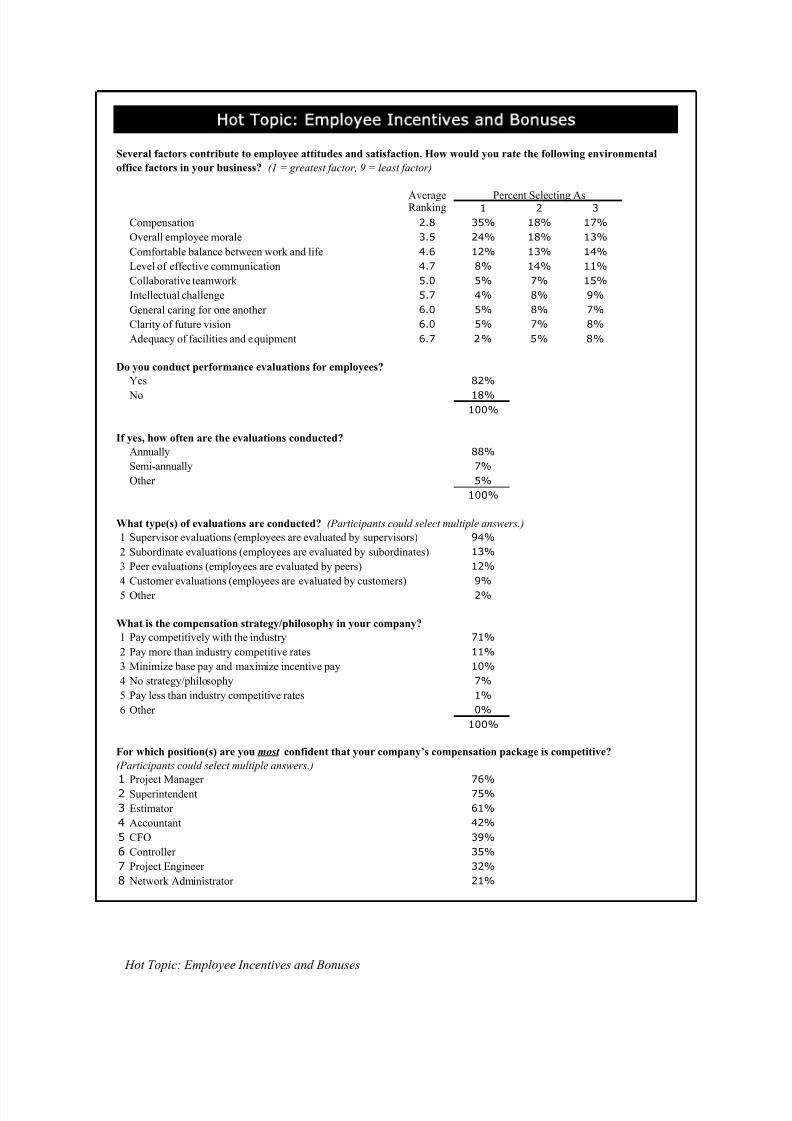
AverageRanking 1 2 3
Compensation 2.8 35% 18% 17%
Overall employee morale 3.5 24% 18% 13%
Comfortable balance between work and life 4.6 12% 13% 14%
Level of effective communication 4.7 8% 14% 11%
Collaborative teamwork 5.0 5% 7% 15%
Intellectual challenge 5.7 4% 8% 9%
General caring for one another 6.0 5% 8% 7%
Clarity of future vision 6.0 5% 7% 8%
Adequacy of facilities and equipment 6.7 2% 5% 8%
Do you conduct performance evaluations for employees?
Yes 82%
No 18%
100%
If yes, how often are the evaluations conducted?
Annually 88%
Semi-annually 7%
Other 5%
100%
What type(s) of evaluations are conducted? (Participants could select multiple answers.)
1 Supervisor evaluations (employees are evaluated by supervisors) 94%
2 Subordinate evaluations (employees are evaluated by subordinates) 13%
3 Peer evaluations (employees are evaluated by peers) 12%
4 Customer evaluations (employees are evaluated by customers) 9%
5 Other 2%
What is the compensation strategy/philosophy in your company?
1 Pay competitively with the industry 71%
2 Pay more than industry competitive rates 11%
3 Minimize base pay and maximize incentive pay 10%
4 No strategy/philosophy 7%
5 Pay less than industry competitive rates 1%
6 Other 0%
100%
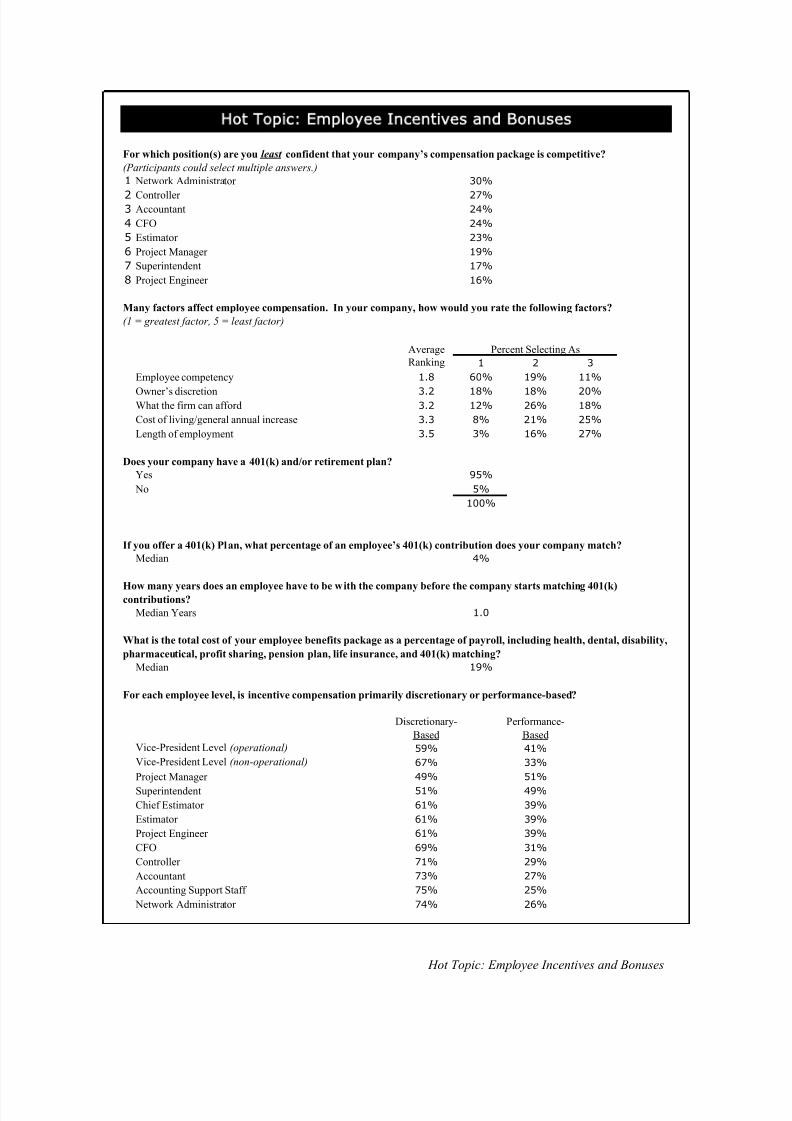
1 Project Manager 76%
2 Superintendent 75%
3 Estimator 61%
4 Accountant 42%
5 CFO 39%
6 Controller 35%
7 Project Engineer 32%
8 Network Administrator 21%
For which position(s) are you most confident that your company’s compensation package is competitive?
(Participants could select multiple answers.)
Several factors contribute to employee attitudes and satisfaction. How would you rate the following environmental
office factors in your business? (1 = greatest factor, 9 = least factor)
Percent Selecting As
Hot Topic: Employee Incentives and Bonuses
8/13/2019 2005 Financial Survey
http://slidepdf.com/reader/full/2005-financial-survey 31/284
Hot Topic: Employee Incentives and Bonuses
1 Network Administrator 30%
2 Controller 27%3 Accountant 24%
4 CFO 24%
5 Estimator 23%
6 Project Manager 19%
7 Superintendent 17%
8 Project Engineer 16%
Average
Ranking 1 2 3
Employee competency 1.8 60% 19% 11%
Owner’s discretion 3.2 18% 18% 20%What the firm can afford 3.2 12% 26% 18%
Cost of living/general annual increase 3.3 8% 21% 25%
Length of employment 3.5 3% 16% 27%
Does your company have a 401(k) and/or retirement plan?
Yes 95%
No 5%
100%
Median 4%
Median Years 1.0
Median 19%
For each employee level, is incentive compensation primarily discretionary or performance-based?
Discretionary- Performance-
Based BasedVice-President Level (operational) 59% 41%
Vice-President Level (non-operational) 67% 33%
Project Manager 49% 51%
Superintendent 51% 49%
Chief Estimator 61% 39%
Estimator 61% 39%
Project Engineer 61% 39%
CFO 69% 31%
Controller 71% 29%
Accountant 73% 27%
Accounting Support Staff 75% 25%
Network Administrator 74% 26%
How many years does an employee have to be with the company before the company starts matching 401(k)contributions?
What is the total cost of your employee benefits package as a percentage of payroll, including health, dental, disability,
pharmaceutical, profit sharing, pension plan, life insurance, and 401(k) matching?
Hot Topic: Employee Incentives and Bonuses
For which position(s) are you least confident that your company’s compensation package is competitive?
(Participants could select multiple answers.)
Many factors affect employee compensation. In your company, how would you rate the following factors?
(1 = greatest factor, 5 = least factor)
If you offer a 401(k) Plan, what percentage of an employee’s 401(k) contribution does your company match?
Percent Selecting As
8/13/2019 2005 Financial Survey
http://slidepdf.com/reader/full/2005-financial-survey 32/284
Hot Topic: Employee Incentives and Bonuses
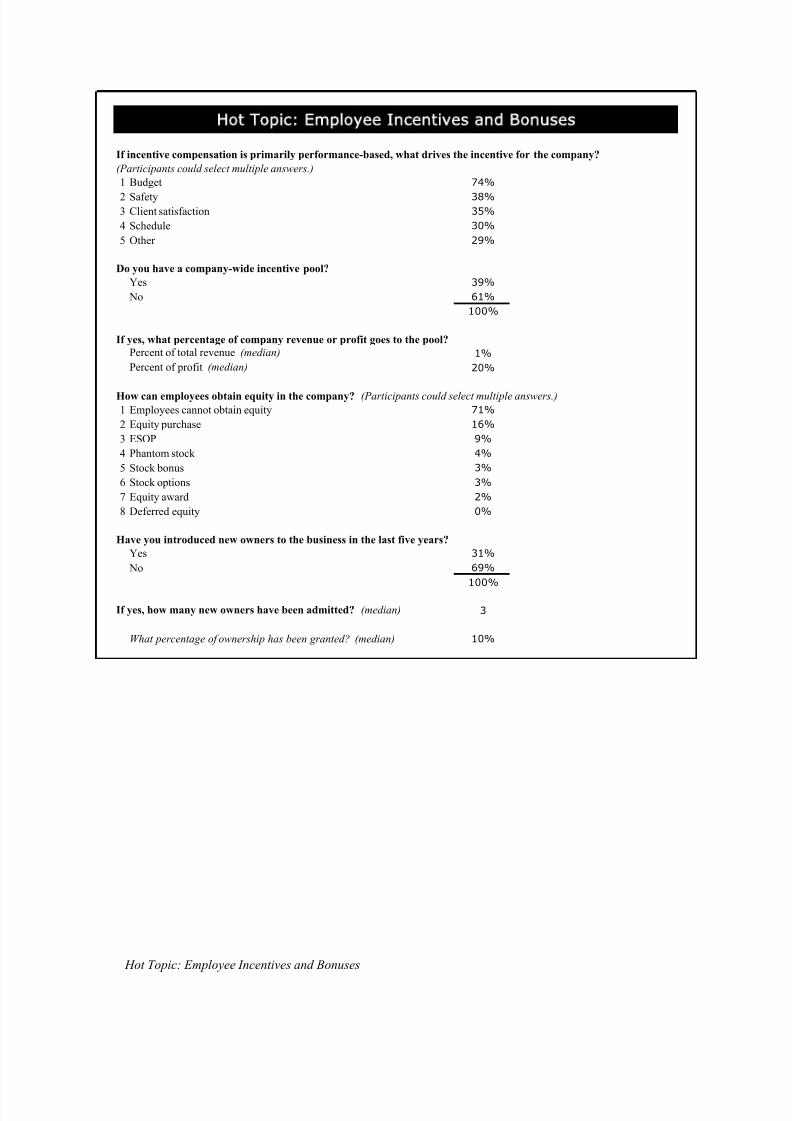
1 Budget 74%
2 Safety 38%3 Client satisfaction 35%
4 Schedule 30%
5 Other 29%
Do you have a company-wide incentive pool?
Yes 39%
No 61%
100%
If yes, what percentage of company revenue or profit goes to the pool?
Percent of total revenue (median) 1%
Percent of profit (median) 20%
How can employees obtain equity in the company? (Participants could select multiple answers.)
1 Employees cannot obtain equity 71%
2 Equity purchase 16%
3 ESOP 9%
4 Phantom stock 4%
5 Stock bonus 3%
6 Stock options 3%
7 Equity award 2%
8 Deferred equity 0%
Have you introduced new owners to the business in the last five years?
Yes 31%
No 69%
100%
If yes, how many new owners have been admitted? (median) 3
What percentage of ownership has been granted? (median) 10%
Hot Topic: Employee Incentives and Bonuses
If incentive compensation is primarily performance-based, what drives the incentive for the company?
(Participants could select multiple answers.)
8/13/2019 2005 Financial Survey
http://slidepdf.com/reader/full/2005-financial-survey 33/284
Hot Topic: Employee Incentives and Bonuses
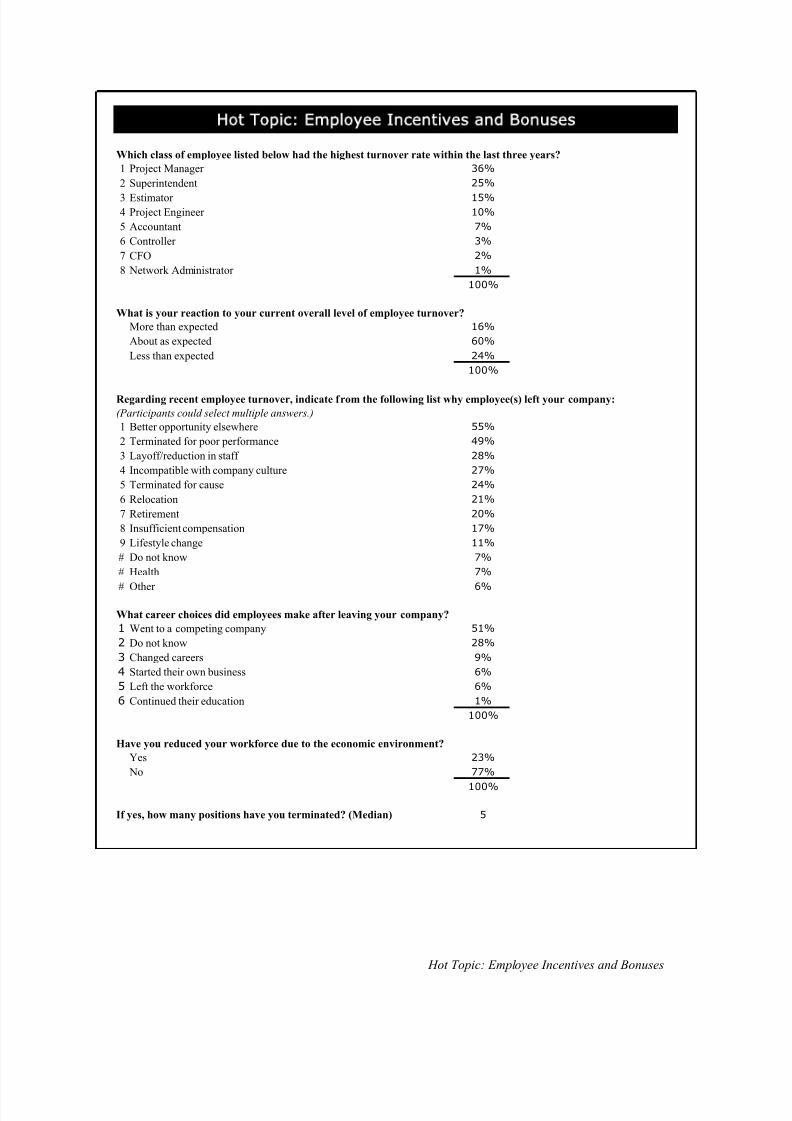
Which class of employee listed below had the highest turnover rate within the last three years?
1 Project Manager 36%
2 Superintendent 25%
3 Estimator 15%4 Project Engineer 10%
5 Accountant 7%
6 Controller 3%
7 CFO 2%
8 Network Administrator 1%
100%
What is your reaction to your current overall level of employee turnover?
More than expected 16%
About as expected 60%
Less than expected 24%
100%
1 Better opportunity elsewhere 55%
2 Terminated for poor performance 49%
3 Layoff/reduction in staff 28%
4 Incompatible with company culture 27%
5 Terminated for cause 24%
6 Relocation 21%
7 Retirement 20%
8 Insufficient compensation 17%
9 Lifestyle change 11%
# Do not know 7%
# Health 7%
# Other 6%
What career choices did employees make after leaving your company?
1 Went to a competing company 51%
2 Do not know 28%
3 Changed careers 9%
4 Started their own business 6%
5 Left the workforce 6%
6 Continued their education 1%
100%
Have you reduced your workforce due to the economic environment?
Yes 23%
No 77%
100%
If yes, how many positions have you terminated? (Median) 5
Hot Topic: Employee Incentives and Bonuses
Regarding recent employee turnover, indicate from the following list why employee(s) left your company:
(Participants could select multiple answers.)

8/13/2019 2005 Financial Survey
http://slidepdf.com/reader/full/2005-financial-survey 34/284
C F M A ’s 2 0 0 5
Construction
Industry Annual
Financial Survey
BEST IN CLASS
COMPANIES

8/13/2019 2005 Financial Survey
http://slidepdf.com/reader/full/2005-financial-survey 35/284
Best In Class Companies
BEST IN CLASS COMPANIES
The Best in Class contractors presented in the CFMA Financial Survey are the top 25% of their peergroup. Best in Class status is calculated using the following five factors that are key indicators of financialhealth:
Factor Formula InterpretationReturn on Assets Net Earnings Before Income
Taxes/Total Assets
Indicates the profit generated by the total assetsemployed. A higher ratio reflects a more effective use ofcompany assets.
Return on Equity Net Earnings Before IncomeTaxes/
Total Net Worth
Indicates the profit generated by net assets (assets toliabilities) employed. This ratio reflects the stockholders’return on investment. A high ratio may indicate anundercapitalized company (low equity) or, conversely, avery profitable company (high net earnings).
Fixed Asset Ratio Net Fixed Assets/
Total Net Worth
Indicates the level of stockholders’ equity invested in net
fixed assets. A higher ratio may indicate a lack of fundsfor current operations. Usually, a low ratio indicates afavorable liquidity position.
Debt to Equity Total Liabilities/
Total Net Worth
Indicates the relationship between creditors and owners.Generally, a ratio of three or lower is consideredacceptable.
Working Capital
Turnover
Revenue/
Working Capital
(Current Assets/CurrentLiabilities)
Indicates the amount of revenue being supported by each$1 of net working capital employed. A ratio exceeding 30may indicate a need for increased working capital tosupport future revenue growth.
Participants in the survey are ranked on each factor to arrive at an overall ranking, of which the top 25%make up the Best in Class group reported in the study. Examining the practices, views, and financialstructure of these companies can provide guidance on how to improve a contracting business. This sectionof the report reviews the characteristics of the Best in Class companies in order to provide insight intowhat makes a contracting company successful.

8/13/2019 2005 Financial Survey
http://slidepdf.com/reader/full/2005-financial-survey 36/284
Best In Class Companies
Best in Class Selection
The following graph illustrates how the Best in Class companies are differentiated from the participant body as a whole, according to the five factors used for determining Best in Class status.
B E S T I N C L A S S K E Y F I N A N C I A L C H A R A C T E R I S T IC S
36.536.5
2.35.2
13.516.9
2.2
11.3
15.1
27.1
0
10
20
30
40
50
Return on
Assets (%) *
Return on
Equity (%) *
Fixed Asset
Ratio (%)
Debt to
Equity
Working
Capital
Turnover
All Companies Best in Class
• Return on Assets: Best in Class companies had an average ROA of 11.3% — 6.1 percentage points higher than the typical company. Best in Class companies use their assets moreeffectively and efficiently to generate profits.
• Return on Equity: Best in Class companies had an average ROE of 36.5% — 19.6 percentage points higher than the typical company. Best in Class companies utilize equitymore effectively to generate profits.
• Fixed Asset Ratio: Best in Class companies had an average Fixed Asset Ratio of 27.1 — 9.4 percentage points lower than the typical company. Best in Class companies are using lessequity to finance the purchase of fixed assets than the typical company and have superiorliquidity.
• Debt to Equity: Best in Class companies had an average Debt to Equity ratio of 2.2 — 0.1lower than the typical company. Best in Class companies are taking slightly less financial riskto generate superior financial performance as compared to the typical company.
• Working Capital Turnover: Best in Class companies turned over their working capital anaverage of 15.1 times — 1.6 times more than the typical company. This indicates that forevery dollar of working capital, the Best in Class companies generate $1.60 more in sales,
which indicates either a more strategic pursuit of projects and/or better sales and marketing.
* In the CFMA's 2005 Annual Financial Study, Return on Assets (ROA) and Return on Equity (ROE) are calculated
using net earnings (loss) before income taxes. Studies conducted in prior years used net earnings (loss) after taxes
to calculate ROA and ROE. All references to ROAs and ROEs from prior studies have been updated to reflect this
change.
8/13/2019 2005 Financial Survey
http://slidepdf.com/reader/full/2005-financial-survey 37/284
Best In Class Companies
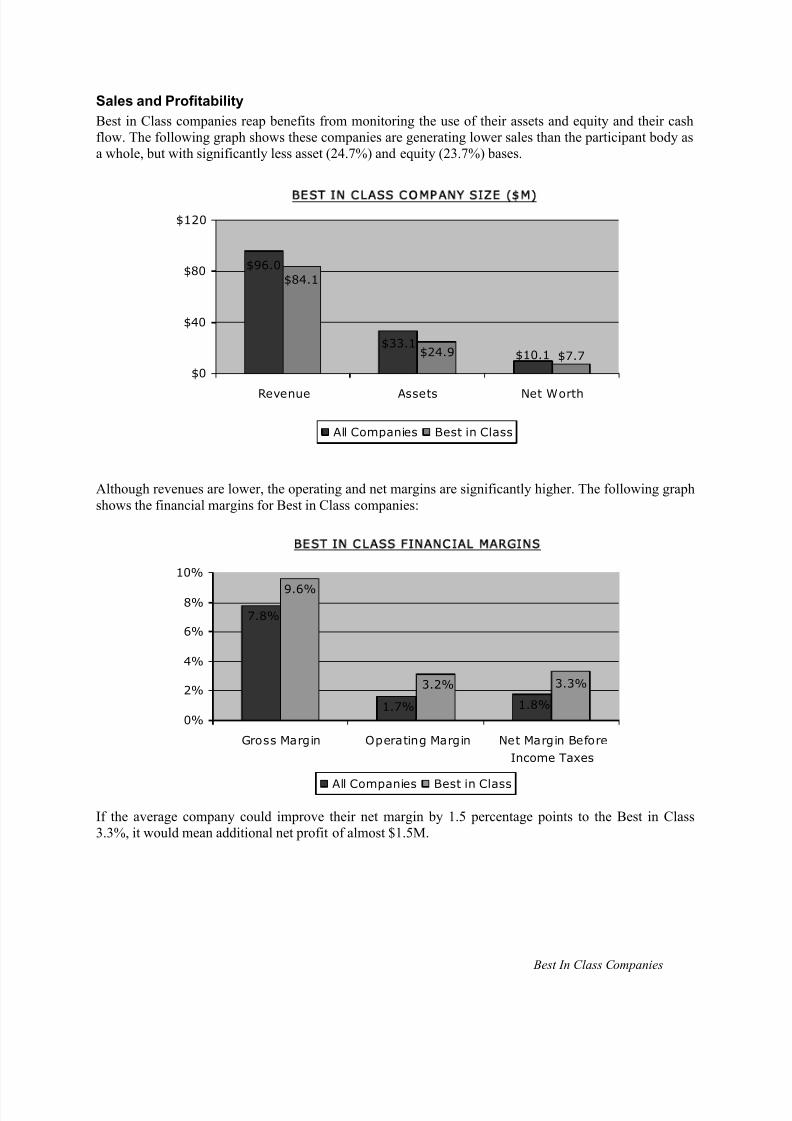
Sales and Profitability
Best in Class companies reap benefits from monitoring the use of their assets and equity and their cashflow. The following graph shows these companies are generating lower sales than the participant body asa whole, but with significantly less asset (24.7%) and equity (23.7%) bases.
B E S T I N C L A S S C O M P A N Y S I ZE ( M )
$10.1$33.1
$96.0
$7.7$24.9
$84.1
$0
$40
$80
$120
Revenue Assets Net Worth
All Companies Best in Class
Although revenues are lower, the operating and net margins are significantly higher. The following graphshows the financial margins for Best in Class companies:
BEST I N C LASS F I N AN C I AL MAR GI N S
1.8%1.7%
7.8%
3.3%3.2%
9.6%
0%
2%
4%
6%
8%
10%
Gross Margin Operating Margin Net Margin Before
Income Taxes
All Companies Best in Class
If the average company could improve their net margin by 1.5 percentage points to the Best in Class3.3%, it would mean additional net profit of almost $1.5M.
8/13/2019 2005 Financial Survey
http://slidepdf.com/reader/full/2005-financial-survey 38/284
Best In Class Companies
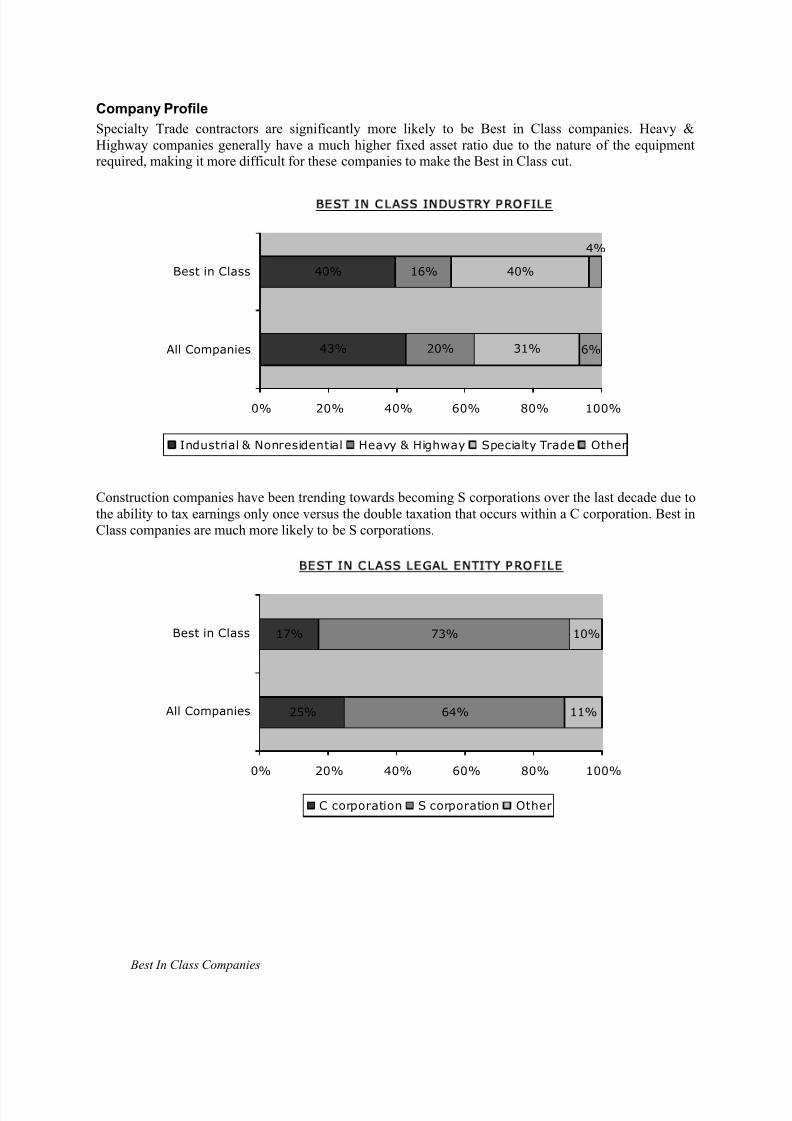
Company Profile
Specialty Trade contractors are significantly more likely to be Best in Class companies. Heavy &Highway companies generally have a much higher fixed asset ratio due to the nature of the equipmentrequired, making it more difficult for these companies to make the Best in Class cut.
B E S T I N C L A S S I N D U S T R Y P R O F I L E
43%
40%
20%
16%
31%
40%
4%
6%
0% 20% 40% 60% 80% 100%
All Companies
Best in Class
Industrial & Nonresidential Heavy & Highway Specialty Trade Other
Construction companies have been trending towards becoming S corporations over the last decade due tothe ability to tax earnings only once versus the double taxation that occurs within a C corporation. Best inClass companies are much more likely to be S corporations.
B E S T I N C L A S S L E G A L E N T I T Y P R O F I L E
25%
17%
64%
73%
11%
10%
0% 20% 40% 60% 80% 100%
All Companies
Best in Class
C corporation S corporation Other

8/13/2019 2005 Financial Survey
http://slidepdf.com/reader/full/2005-financial-survey 39/284
Best In Class Companies
More Best in Class companies operated in the Midwest, West, and Far West regions in 2005.
BEST IN CLASS REGIONAL PROFILE
15%
9%
18%
16%
30%
34% 5% 12%
16%
24%
11% 11%
0% 20% 40% 60% 80% 100%
All Companies
Best in Class
Northeast Southeast Midwest Southwest West Far West
Best in Class companies generate slightly more revenue from private clients than other companies. Thiscould be attributed partially to the fact that Heavy & Highway companies are less likely to be part of theBest of Class classification due to their higher fixed asset ratio, and Heavy & Highway companies perform a higher percentage of public work.
B E S T IN C L A S S C L I E N T P R O F I L E
33%
30%
67%
70%
0% 20% 40% 60% 80% 100%
All Companies
Best in Class
Public Private
8/13/2019 2005 Financial Survey
http://slidepdf.com/reader/full/2005-financial-survey 40/284
Best In Class Companies
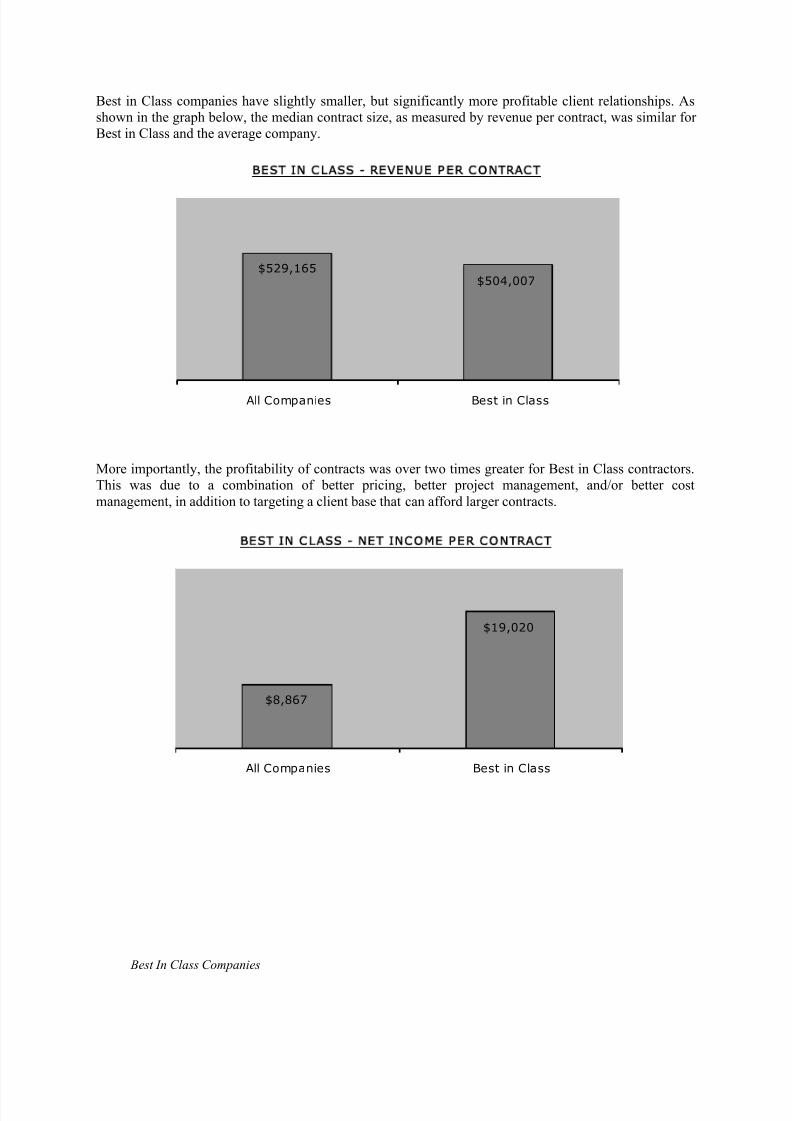
Best in Class companies have slightly smaller, but significantly more profitable client relationships. Asshown in the graph below, the median contract size, as measured by revenue per contract, was similar forBest in Class and the average company.
B E S T IN C L A S S - R E V E N U E P E R C O N T R AC T
$504,007$529,165
All Companies Best in Class
More importantly, the profitability of contracts was over two times greater for Best in Class contractors.This was due to a combination of better pricing, better project management, and/or better costmanagement, in addition to targeting a client base that can afford larger contracts.
$19,020
$8,867
All Companies Best in Class
B E S T IN C L A S S - N E T IN C O M E P E R C O N T R A C T
8/13/2019 2005 Financial Survey
http://slidepdf.com/reader/full/2005-financial-survey 41/284
Best In Class Companies
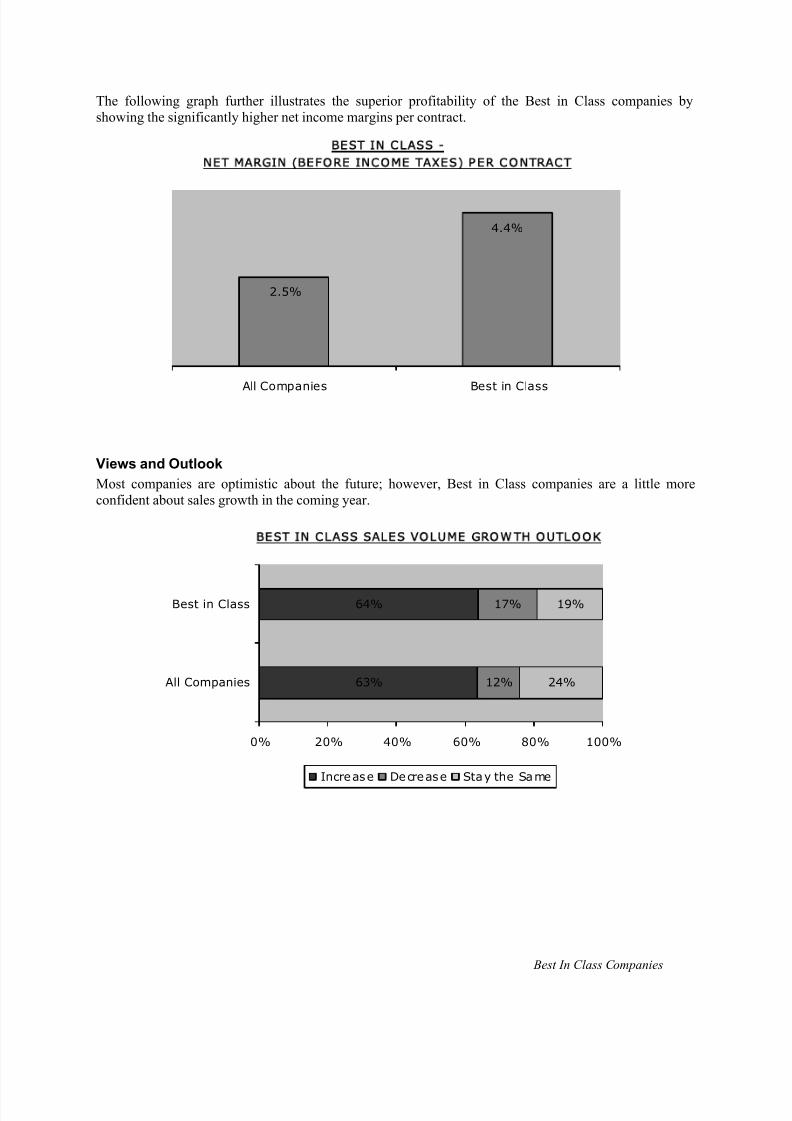
The following graph further illustrates the superior profitability of the Best in Class companies byshowing the significantly higher net income margins per contract.
2.5%
4.4%
All Companies Best in Class
BEST IN CLASS -
NET MARGIN (BEFORE INCO ME TAXES) PER CO NTRACT
Views and Outlook
Most companies are optimistic about the future; however, Best in Class companies are a little moreconfident about sales growth in the coming year.
BEST IN CLASS SALES VOLUME GROW TH OUTLOOK
63%
64%
12%
17%
24%
19%
0% 20% 40% 60% 80% 100%
All Companies
Best in Class
Increase Decrease Stay the Same

8/13/2019 2005 Financial Survey
http://slidepdf.com/reader/full/2005-financial-survey 42/284
Best In Class Companies
Likewise, Best in Class companies have a similar outlook with respect to future prospects for backloggrowth as compared to the participant body as a whole.
B E S T IN C L A S S B A C K L O G G R O W T H O U T L O O K
55%
56%
23%
24%
22%
20%
0% 20% 40% 60% 80% 100%
All Companies
Best in Class
Increase Decrease Stay the Same
8/13/2019 2005 Financial Survey
http://slidepdf.com/reader/full/2005-financial-survey 43/284
Balance Sheet
All Participants Best in Class All Participants Best in Class
Amount Percent Amount Percent Amount Percent Amount Percent
Current assets: Current liabilities:
Cash and cash equivalents $ 4,818,236 14.6 % $ 4,404,370 17.7 % Current maturity on long-term debt $ 505,428 1.5 % $ 132,576 0.5 %Marketable securities & short-term investments 1,983,264 6.0 1,379,088 5.5 Notes payable and lines of credit 549,390 1.7 288,054 1.2
Receivables: Accounts payable:
Contr act r ecei va ble s c urr ent ly du e 12, 856, 421 3 8.9 10, 677, 379 4 2.8 Tr ade, inc lu din g c urr ent ly due
Retainages on contracts 3,919,134 11.9 3,292,397 13.2 to subcontractors 9,779,664 29.6 7,341,608 29.4
Unbilled work 337,890 1.0 206,036 0.8 Subcontracts retainages 2,774,589 8.4 2,429,390 9.7
Other receivables 419,224 1.3 346,767 1.4 Other 203,446 0.6 210,421 0.8
Less allowance for doubtful accounts (64,638) (0.2) (44,348) (0.2) Total accounts payable 12,757,700 38.6 9,981,419 40.0
Total receivables, net: 17,468,032 52.8 14,478,231 58.1
Accrued expenses 2,117,744 6.4 1,863,032 7.5
Inventories 509,170 1.5 160,129 0.6 Billings in excess of costs and recognized
Costs and recognized earnings in excess earnings on uncompleted contracts 4,008,261 12.1 3,936,763 15.8
of billings on uncompleted contracts 1,735,737 5.3 1,099,513 4.4 Income taxes:
Investments in and advances to Current 47,657 0.1 41,123 0.2
construction joint ventures 205,853 0.6 162,530 0.7 Deferred 41,700 0.1 13,662 0.1
Income taxes: Other current liabilities 374,427 1.1 389,705 1.6
Current/refundable 22,668 0.1 7,548 0.0 Total current liabilities 20,402,306 61.7 16,646,332 66.8
Deferred 59,853 0.2 8,756 0.0 Noncurrent liabilities
Other current assets 705,247 2.1 502,153 2.0 Long-term debt, excluding current maturities 2,038,046 6.2 344,990 1.4
Total current assets 27,508,059 83.2 22,202,317 89.0 Deferred income taxes 141,937 0.4 16,828 0.1
Other 354,694 1.1 196,171 0.8
Property, plant and equipment 9,304,496 28.2 5,433,893 21.8 Total liabilities 22,936,983 69.4 17,204,321 69.0
Less accumulated depreciation (5,629,779) (17.0) (3,340,333) (13.4) Minority interests 45,041 0.1 19,498 0.1
Property, plant and equipment, net 3,674,716 11.1 2,093,561 8.4 Net worth:
Common stock, par value 332,075 1.0 262,246 1.1
Noncurrent assets: Preferred stock, stated value 62,793 0.2 30,215 0.1
Long-term investments 350,514 1.1 132,685 0.5 Additional paid-in capital 1,939,629 5.9 863,720 3.5
Deferred income taxes 92,363 0.3 5,826 0.0 Retained earnings 7,370,741 22.3 5,763,191 23.1
Other assets 1,427,615 4.3 500,529 2.0 Treasury stock (506,391) (1.5) (441,184) (1.8)
Total noncurrent assets 1,870,491 5.7 639,040 2.6 Excess value of marketable securities 52,536 0.2 84,968 0.3
Other equity 819,859 2.5 1,147,941 4.6
Total net worth 10,071,243 30.5 7,711,098 30.9
Total assets $ 33,053,266 100.0 % $ 24,934,917 100.0 % Total liabilities and net worth $ 33,053,266 100.0 % $ 24,934,917 100.0 %
Statement of Earnings Financial Ratios
All Participants Best in Class All Participants Best in Class
Amount Percent Amount Percent Average Median Average Median
Contract revenue $ 94,479,099 98.5 % $ 83,799,198 99.6 % Liquidity Ratios
Other revenue 1,479,664 1.5 326,794 0.4
Total Revenue 95,958,762 100.0 84,125,992 100.0 Current Ratio 1.3 1.4 1.3 1.4
Quick Ratio 1.2 1.2 1.2 1.3
Contract cost (87,359,593) (91.0) (75,814,902) (90.1) Days of Cash 18.1 11.2 18.8 14.8
Other cost (1,155,465) (1.2) (238,967) (0.3) Working Capital Turnover 13.5 12.9 15.1 14.2
Total cost (88,515,059) (92.2) (76,053,869) (90.4)
Profitability Ratios
Gross Profit 7,443,704 7.8 8,072,123 9.6
Return on Assets * 5.2 % 5.3 % 11.3 % 13.5 %
Selling, general & administrative expenses: Return on Equity * 16.9 % 18.5 % 36.5 % 38.0 %
Payroll (2,853,533) (3.0) (2,571,550) (3.1) Times Interest Earned 14.1 11.5 76.1 28.4
Professional fees (192,060) (0.2) (156,591) (0.2)
Sales & marketing costs (227,170) (0.2) (194,101) (0.2) Leverage Ratios
Technology costs (156,413) (0.2) (118,055) (0.1)
Administrative bonuses (374,451) (0.4) (388,854) (0.5) Debt to Equity 2.3 2.2 2.2 1.9
Other (2,040,813) (2.1) (1,985,550) (2.4) Revenue to Equity 9.5 9.9 10.9 10.4
Total SG&A expenses (5,844,439) (6.1) (5,414,701) (6.4) Asset Turnover 2.9 3.1 3.4 3.5
Fixed Asset Ratio 36.5 % 25.3 % 27.1 % 19.7 %
Income from operations 1,599,265 1.7 2,657,423 3.2 Equity to SG&A Expense 1.7 1.2 1.4 1.1
Underbillings to Equity 20.6 % 13.4 % 16.9 % 10.7 %
Interest income 134,207 0.1 89,757 0.1 Backlog to Equity 8.6 5.3 6.5 4.0
Interest expense (130,092) (0.1) (37,468) (0.0)
Other income / (expense), net 100,078 0.1 105,254 0.1
Efficiency Ratios
Net ear ni ngs / ( los s) bef or e i nco me t axes 1 ,703 ,45 7 1. 8 2 ,81 4,96 6 3. 3
Backlog to Working Capital 11.8 7.2 8.3 5.8
Income tax (expense) / benefit (175,569) (0.2) (214,182) (0.3) Months in Backlog 7.7 6.3 6.7 5.7
Days in Accounts Receivable 49.6 51.7 47.0 47.6
Net earnings $ 1,527,888 1.6 % $ 2,600,785 3.1 % Days in Inventory 2.1 2.2 0.8 1.7
Days in Accounts Payable 40.6 33.8 35.7 29.2
Operating Cycle 29.1 33.3 30.8 33.2
Number of ParticipantsNumber Number
532 134
Note: Not all figures will apear to sum due to rounding.
Best In Class Companies 4
All CompaniesComposite: Best in Class
* In theCFMA's 2005 Annual Financial Study, Returnon Assets(ROA)and Return on Equity (ROE) are calculated using
net earnings (loss) before income taxes. Studies conducted in prior years used net earnings (loss) after taxes to
calculate ROA and ROE. All references to ROAs and ROEs from prior studies have been updated to reflect this change.
8/13/2019 2005 Financial Survey
http://slidepdf.com/reader/full/2005-financial-survey 44/284
Best In Class Companies
Best in Class Industry Sector Comparisons
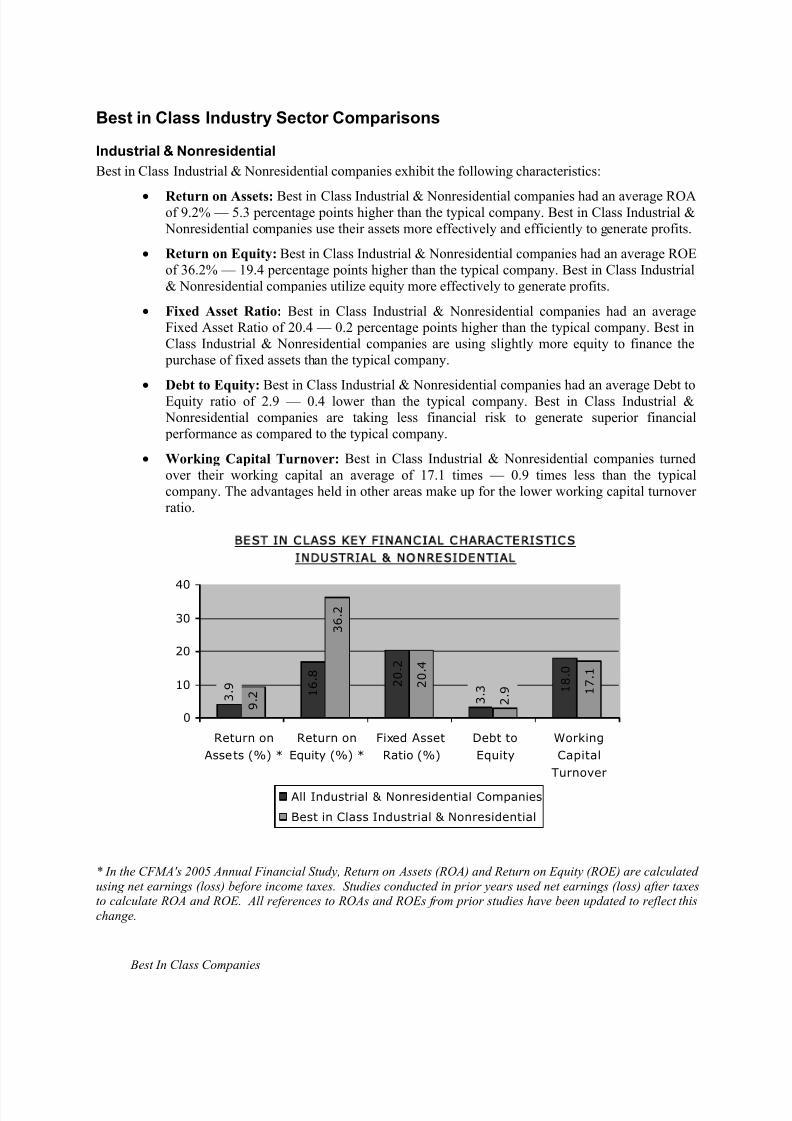
Industrial & Nonresidential
Best in Class Industrial & Nonresidential companies exhibit the following characteristics:
• Return on Assets: Best in Class Industrial & Nonresidential companies had an average ROAof 9.2% — 5.3 percentage points higher than the typical company. Best in Class Industrial & Nonresidential companies use their assets more effectively and efficiently to generate profits.
• Return on Equity: Best in Class Industrial & Nonresidential companies had an average ROEof 36.2% — 19.4 percentage points higher than the typical company. Best in Class Industrial& Nonresidential companies utilize equity more effectively to generate profits.
• Fixed Asset Ratio: Best in Class Industrial & Nonresidential companies had an averageFixed Asset Ratio of 20.4 — 0.2 percentage points higher than the typical company. Best inClass Industrial & Nonresidential companies are using slightly more equity to finance the purchase of fixed assets than the typical company.
• Debt to Equity: Best in Class Industrial & Nonresidential companies had an average Debt toEquity ratio of 2.9 — 0.4 lower than the typical company. Best in Class Industrial & Nonresidential companies are taking less financial risk to generate superior financial performance as compared to the typical company.
• Working Capital Turnover: Best in Class Industrial & Nonresidential companies turnedover their working capital an average of 17.1 times — 0.9 times less than the typicalcompany. The advantages held in other areas make up for the lower working capital turnoverratio.
BEST IN CLASS KEY FINANCIAL CHARACTERISTICS
INDUSTRIAL & NONRESIDENTIAL
3 . 9
3 . 3 1
8 . 0
2 0
. 2
1 6
. 8
2 . 9 1
7 . 1
2 0
. 4
3 6
. 2
9 . 2
0
10
20
30
40
Return on
Assets (%) *
Return on
Equity (%) *
Fixed Asset
Ratio (%)
Debt to
Equity
Working
Capital
Turnover
All Industrial & Nonresidential Companies
Best in Class Industrial & Nonresidential
* In the CFMA's 2005 Annual Financial Study, Return on Assets (ROA) and Return on Equity (ROE) are calculated
using net earnings (loss) before income taxes. Studies conducted in prior years used net earnings (loss) after taxesto calculate ROA and ROE. All references to ROAs and ROEs from prior studies have been updated to reflect this
change.
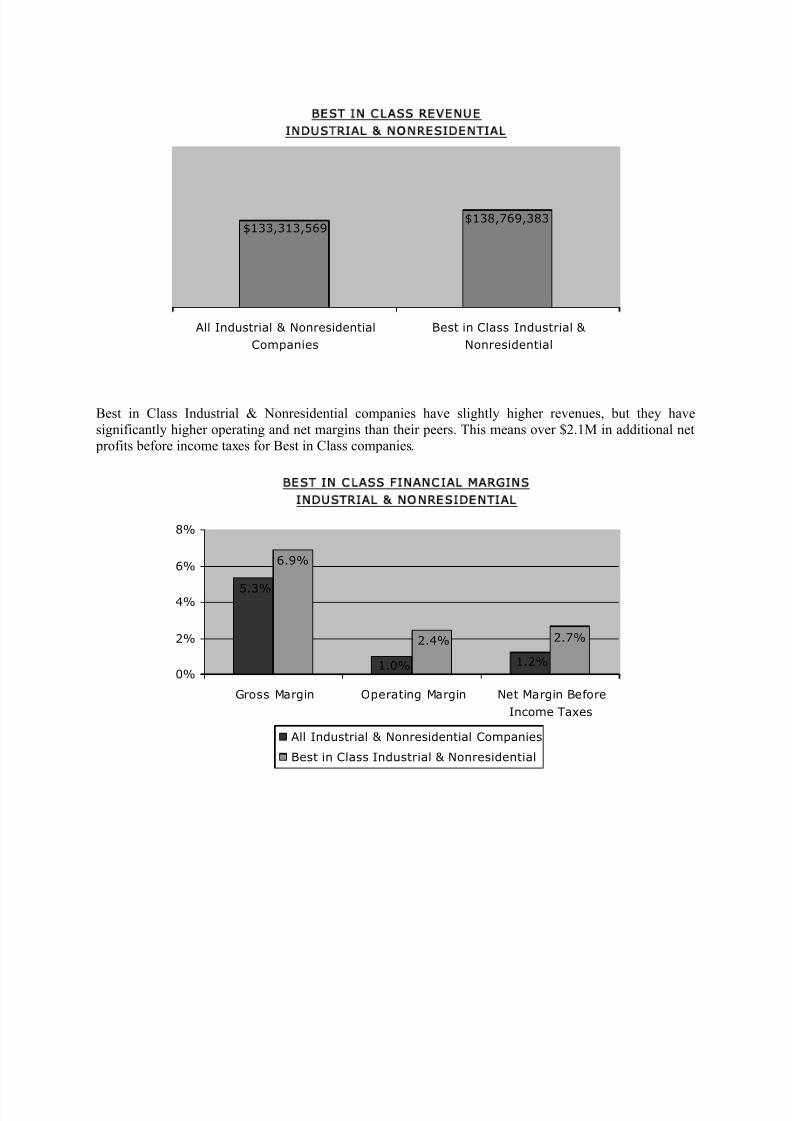
8/13/2019 2005 Financial Survey
http://slidepdf.com/reader/full/2005-financial-survey 45/284
B E S T I N C L A S S R E V E N U E
I N DU STR I AL & N ON R ES I DEN T I A L
$133,313,569$138,769,383
All Industrial & Nonresidential
Companies
Best in Class Industrial &
Nonresidential
Best in Class Industrial & Nonresidential companies have slightly higher revenues, but they havesignificantly higher operating and net margins than their peers. This means over $2.1M in additional net profits before income taxes for Best in Class companies.
BEST IN CLASS FINANCIAL MARGINS
INDUSTRIAL & NONRESIDENTIAL
1.2%1.0%
5.3%
2.7%2.4%
6.9%
0%
2%
4%
6%
8%
Gross Margin Operating Margin Net Margin Before
Income Taxes
All Industrial & Nonresidential Companies
Best in Class Industrial & Nonresidential
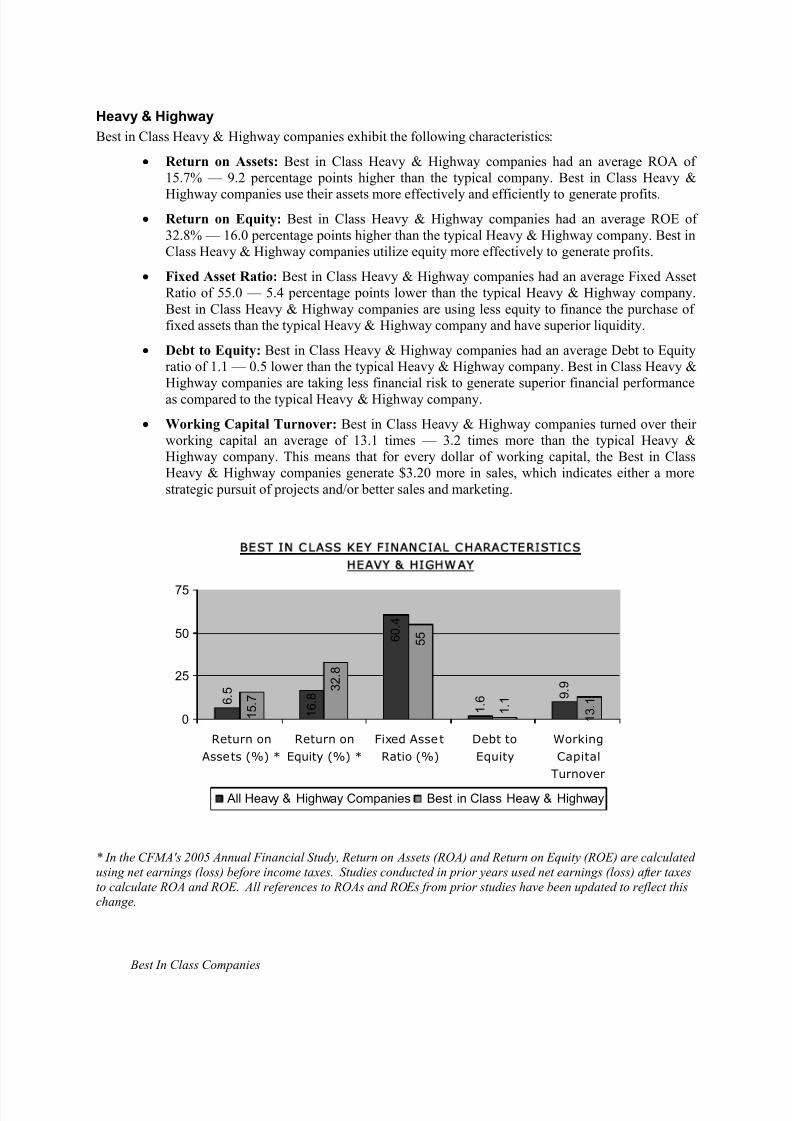
8/13/2019 2005 Financial Survey
http://slidepdf.com/reader/full/2005-financial-survey 46/284
Best In Class Companies
Heavy & Highway
Best in Class Heavy & Highway companies exhibit the following characteristics:
• Return on Assets: Best in Class Heavy & Highway companies had an average ROA of15.7% — 9.2 percentage points higher than the typical company. Best in Class Heavy &
Highway companies use their assets more effectively and efficiently to generate profits.
• Return on Equity: Best in Class Heavy & Highway companies had an average ROE of32.8% — 16.0 percentage points higher than the typical Heavy & Highway company. Best inClass Heavy & Highway companies utilize equity more effectively to generate profits.
• Fixed Asset Ratio: Best in Class Heavy & Highway companies had an average Fixed AssetRatio of 55.0 — 5.4 percentage points lower than the typical Heavy & Highway company.Best in Class Heavy & Highway companies are using less equity to finance the purchase offixed assets than the typical Heavy & Highway company and have superior liquidity.
• Debt to Equity: Best in Class Heavy & Highway companies had an average Debt to Equityratio of 1.1 — 0.5 lower than the typical Heavy & Highway company. Best in Class Heavy &Highway companies are taking less financial risk to generate superior financial performanceas compared to the typical Heavy & Highway company.
• Working Capital Turnover: Best in Class Heavy & Highway companies turned over theirworking capital an average of 13.1 times — 3.2 times more than the typical Heavy &Highway company. This means that for every dollar of working capital, the Best in ClassHeavy & Highway companies generate $3.20 more in sales, which indicates either a morestrategic pursuit of projects and/or better sales and marketing.
BEST IN CLASS KEY FINANCIAL CHARACTERISTICS
HEAVY & HIGHWAY
6 . 5
1 . 6
1 . 1 9
. 9
6 0 . 4
1 6 . 8
1 5 . 7
1 3 . 1
5 5
3 2 . 8
0
25
50
75
Return on
Assets (%) *
Return on
Equity (%) *
Fixed Asset
Ratio (%)
Debt to
Equity
Working
Capital
Turnover
All Heavy & Highway Companies Best in Class Heavy & Highway
* In the CFMA's 2005 Annual Financial Study, Return on Assets (ROA) and Return on Equity (ROE) are calculated
using net earnings (loss) before income taxes. Studies conducted in prior years used net earnings (loss) after taxes
to calculate ROA and ROE. All references to ROAs and ROEs from prior studies have been updated to reflect thischange.
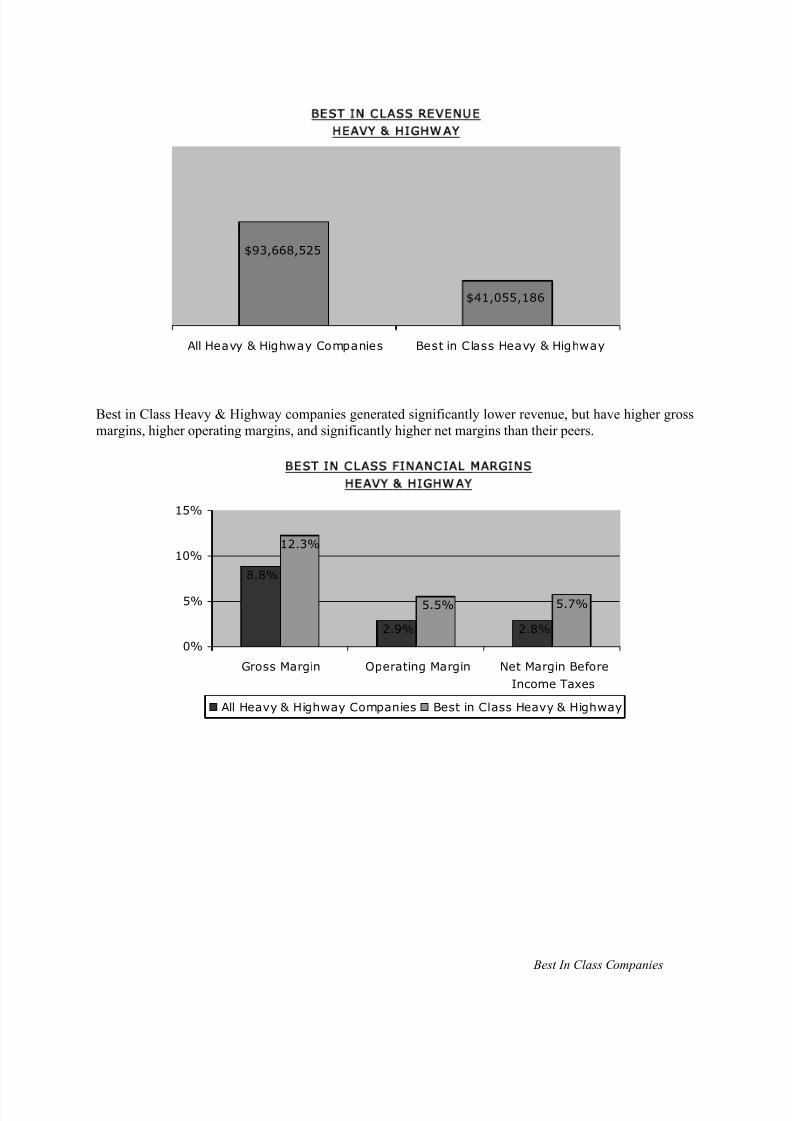
8/13/2019 2005 Financial Survey
http://slidepdf.com/reader/full/2005-financial-survey 47/284
Best In Class Companies
BEST IN CLASS REVENUE
HEAVY & HIGHWAY
$93,668,525
$41,055,186
All Heavy & Highway Companies Best in Class Heavy & Highway
Best in Class Heavy & Highway companies generated significantly lower revenue, but have higher grossmargins, higher operating margins, and significantly higher net margins than their peers.
BEST IN CLASS FINANCIAL MARGINS
HEAVY & HIGHWAY
2.8%2.9%
8.8%
5.7%5.5%
12.3%
0%
5%
10%
15%
Gross Margin Operating Margin Net Margin Before
Income Taxes
All Heavy & Highway Companies Best in Class Heavy & Highway
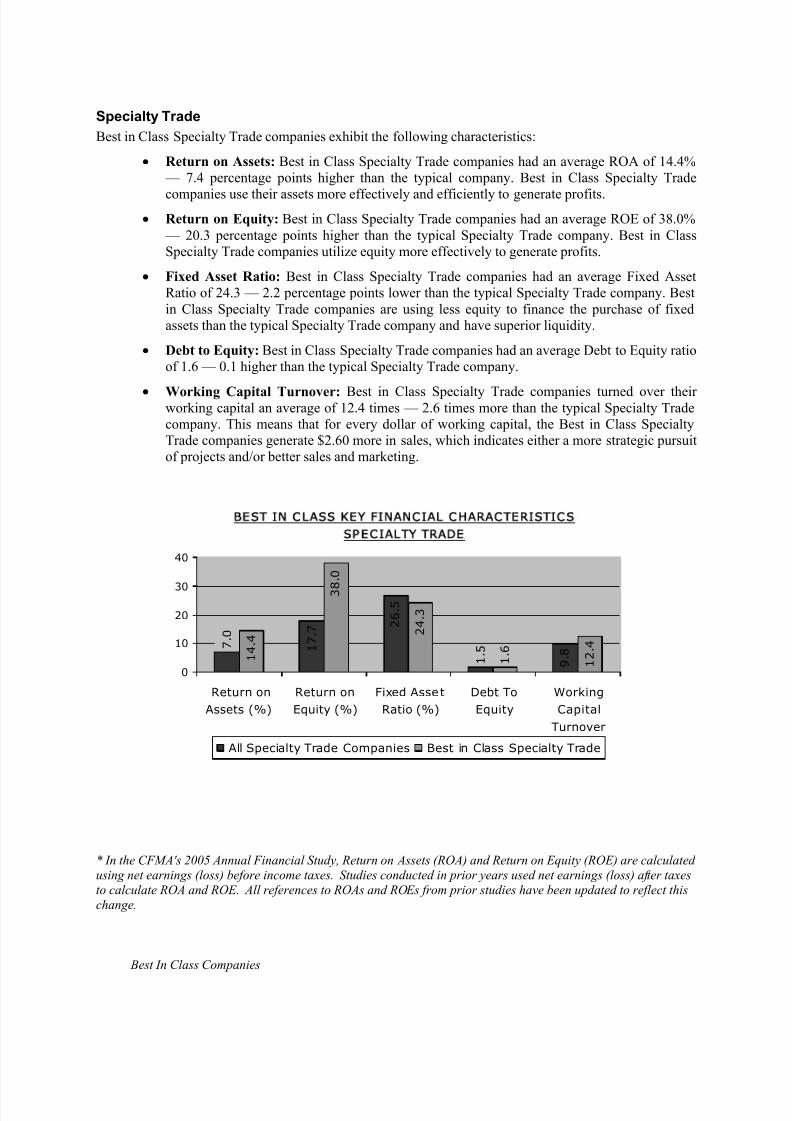
8/13/2019 2005 Financial Survey
http://slidepdf.com/reader/full/2005-financial-survey 48/284
Best In Class Companies
Specialty Trade
Best in Class Specialty Trade companies exhibit the following characteristics:
• Return on Assets: Best in Class Specialty Trade companies had an average ROA of 14.4% — 7.4 percentage points higher than the typical company. Best in Class Specialty Trade
companies use their assets more effectively and efficiently to generate profits.
• Return on Equity: Best in Class Specialty Trade companies had an average ROE of 38.0% — 20.3 percentage points higher than the typical Specialty Trade company. Best in ClassSpecialty Trade companies utilize equity more effectively to generate profits.
• Fixed Asset Ratio: Best in Class Specialty Trade companies had an average Fixed AssetRatio of 24.3 — 2.2 percentage points lower than the typical Specialty Trade company. Bestin Class Specialty Trade companies are using less equity to finance the purchase of fixedassets than the typical Specialty Trade company and have superior liquidity.
• Debt to Equity: Best in Class Specialty Trade companies had an average Debt to Equity ratioof 1.6 — 0.1 higher than the typical Specialty Trade company.
• Working Capital Turnover: Best in Class Specialty Trade companies turned over theirworking capital an average of 12.4 times — 2.6 times more than the typical Specialty Tradecompany. This means that for every dollar of working capital, the Best in Class SpecialtyTrade companies generate $2.60 more in sales, which indicates either a more strategic pursuitof projects and/or better sales and marketing.
B E S T I N C L A S S K E Y F I N A N C I A L C H A R A C T E R I S T IC S
SPEC I ALTY TR ADE
1 . 6 1
7 . 7 2
6 . 5
9 . 8
7 . 0
1 . 5
1 2 . 4
2 4 . 3
3 8 . 0
1 4 . 4
0
10
20
30
40
Return on
Assets (%)
Return on
Equity (%)
Fixed Asset
Ratio (%)
Debt To
Equity
Working
Capital
Turnover
All Specialty Trade Companies Best in Class Specialty Trade
* In the CFMA's 2005 Annual Financial Study, Return on Assets (ROA) and Return on Equity (ROE) are calculated
using net earnings (loss) before income taxes. Studies conducted in prior years used net earnings (loss) after taxes
to calculate ROA and ROE. All references to ROAs and ROEs from prior studies have been updated to reflect this
change.
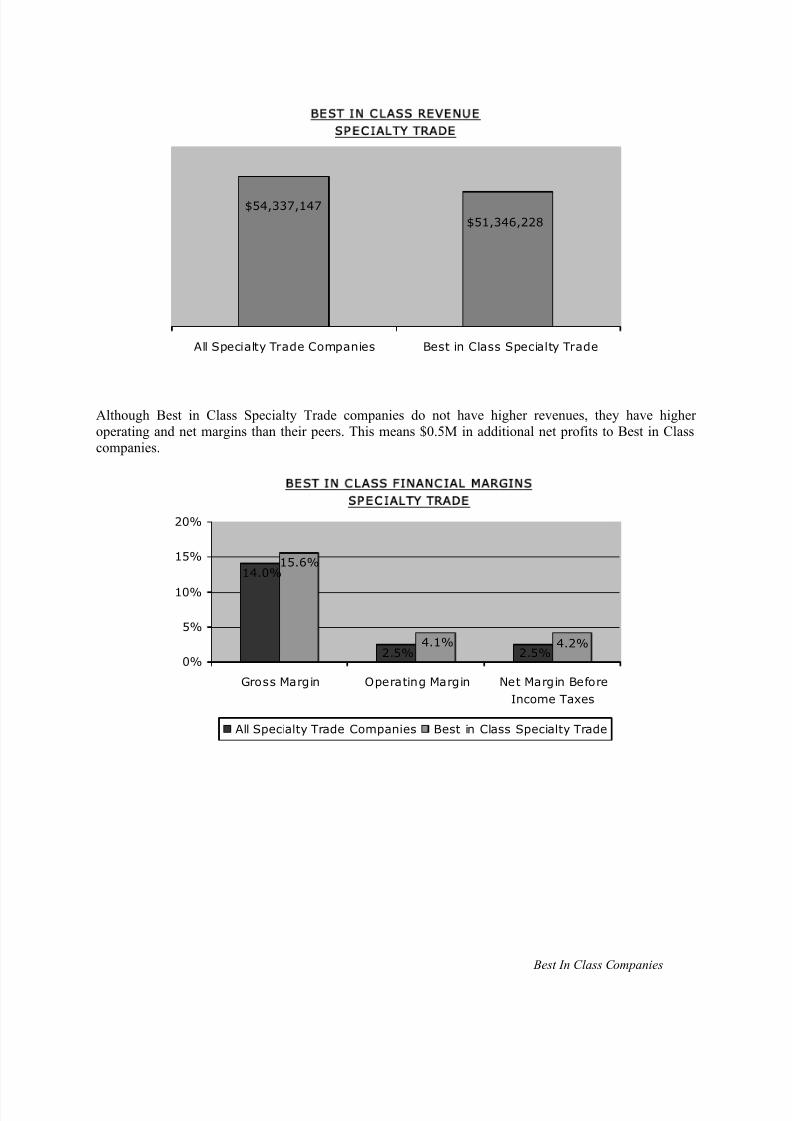
8/13/2019 2005 Financial Survey
http://slidepdf.com/reader/full/2005-financial-survey 49/284
Best In Class Companies
B E S T I N C L A S S R E V E N U E
SPEC I ALTY TR ADE
$51,346,228
$54,337,147
All Specialty Trade Companies Best in Class Specialty Trade
Although Best in Class Specialty Trade companies do not have higher revenues, they have higheroperating and net margins than their peers. This means $0.5M in additional net profits to Best in Classcompanies.
BEST I N C LASS F I N AN C I AL MAR GI N S
SPEC I ALTY TR ADE
14.0%
2.5% 2.5%
15.6%
4.1% 4.2%
0%
5%
10%
15%
20%
Gross Margin Operating Margin Net Margin Before
Income Taxes
All Specialty Trade Companies Best in Class Specialty Trade

8/13/2019 2005 Financial Survey
http://slidepdf.com/reader/full/2005-financial-survey 50/284
C F M A ’s 2 0 0 5
Construction
Industry Annual
Financial Survey
OVERALL SURVEY
RESULTS
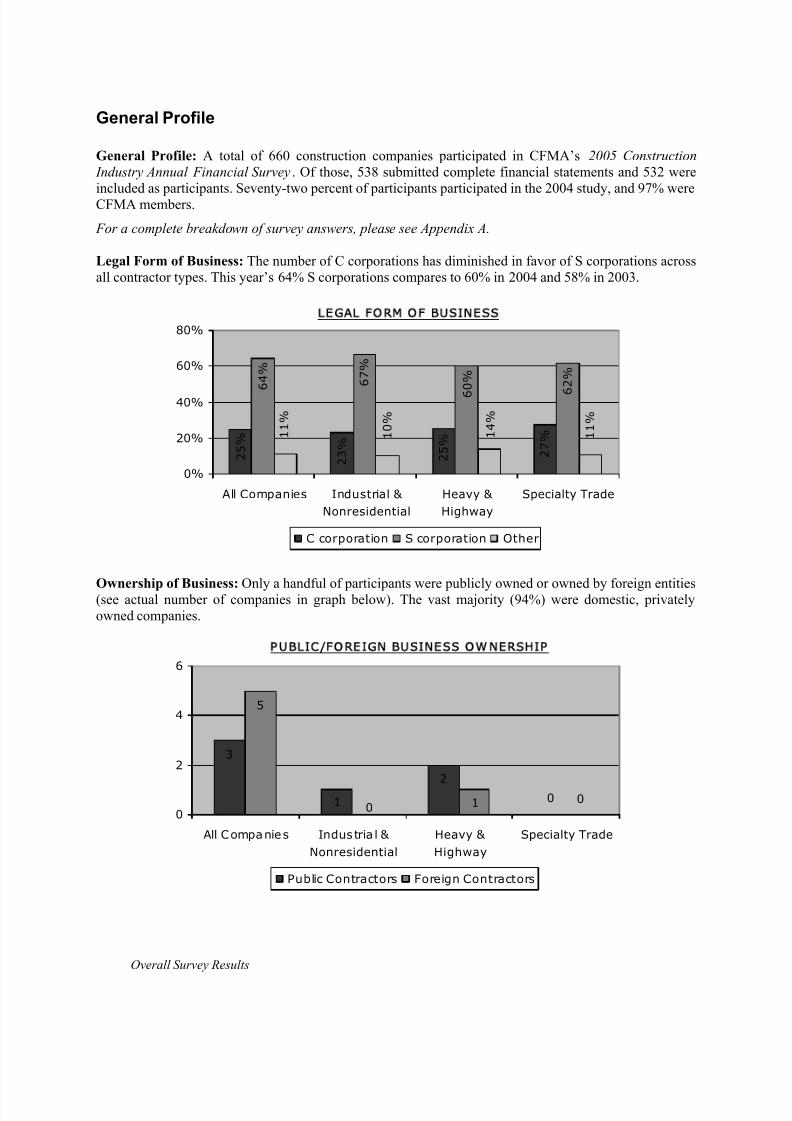
8/13/2019 2005 Financial Survey
http://slidepdf.com/reader/full/2005-financial-survey 51/284
Overall Survey Results
General Profile
General Profile: A total of 660 construction companies participated in CFMA’s 2005 Construction
Industry Annual Financial Survey. Of those, 538 submitted complete financial statements and 532 wereincluded as participants. Seventy-two percent of participants participated in the 2004 study, and 97% wereCFMA members.
For a complete breakdown of survey answers, please see Appendix A.
Legal Form of Business: The number of C corporations has diminished in favor of S corporations acrossall contractor types. This year’s 64% S corporations compares to 60% in 2004 and 58% in 2003.
L E G A L F O R M O F B U S I N E S S
25%
23%
25%
27%
64%
67%
60%
6
2%
11%
14%
11%
10%
0%
20%
40%
60%
80%
All Companies Industrial &
Nonresidential
Heavy &
Highway
Specialty Trade
C corporation S corporation Other
Ownership of Business: Only a handful of participants were publicly owned or owned by foreign entities(see actual number of companies in graph below). The vast majority (94%) were domestic, privatelyowned companies.
PUBLIC/FOREIGN BUSINESS OW NERSHIP
3
1
2
0
5
0 1 0
0
2
4
6
All Companies Industria l &
Nonresidential
Heavy &
Highway
Specialty Trade
Public Contractors Foreign Contractors
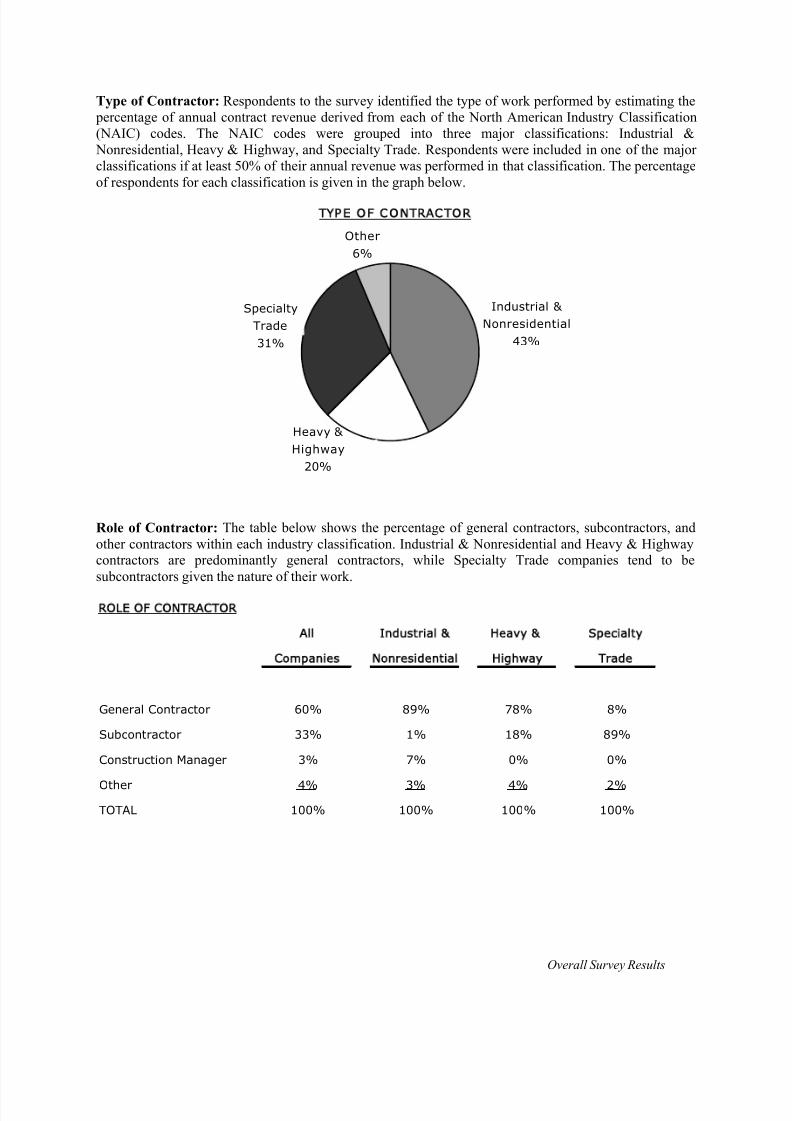
8/13/2019 2005 Financial Survey
http://slidepdf.com/reader/full/2005-financial-survey 52/284
Overall Survey Results
Type of Contractor: Respondents to the survey identified the type of work performed by estimating the percentage of annual contract revenue derived from each of the North American Industry Classification(NAIC) codes. The NAIC codes were grouped into three major classifications: Industrial & Nonresidential, Heavy & Highway, and Specialty Trade. Respondents were included in one of the majorclassifications if at least 50% of their annual revenue was performed in that classification. The percentageof respondents for each classification is given in the graph below.
T YP E O F C O N T R AC T O R
Other
6%
Specialty
Trade
31%
Industrial &
Nonresidential
43%
Heavy &
Highway
20%
Role of Contractor: The table below shows the percentage of general contractors, subcontractors, andother contractors within each industry classification. Industrial & Nonresidential and Heavy & Highwaycontractors are predominantly general contractors, while Specialty Trade companies tend to besubcontractors given the nature of their work.
ROLE OF CONTRACTOR
All Industrial & Heavy & Specialty
Companies Nonresidential Highway Trade
General Contractor 60% 89% 78% 8%
Subcontractor 33% 1% 18% 89%
Construction Manager 3% 7% 0% 0%
Other 4% 3% 4% 2%
TOTAL 100% 100% 100% 100%
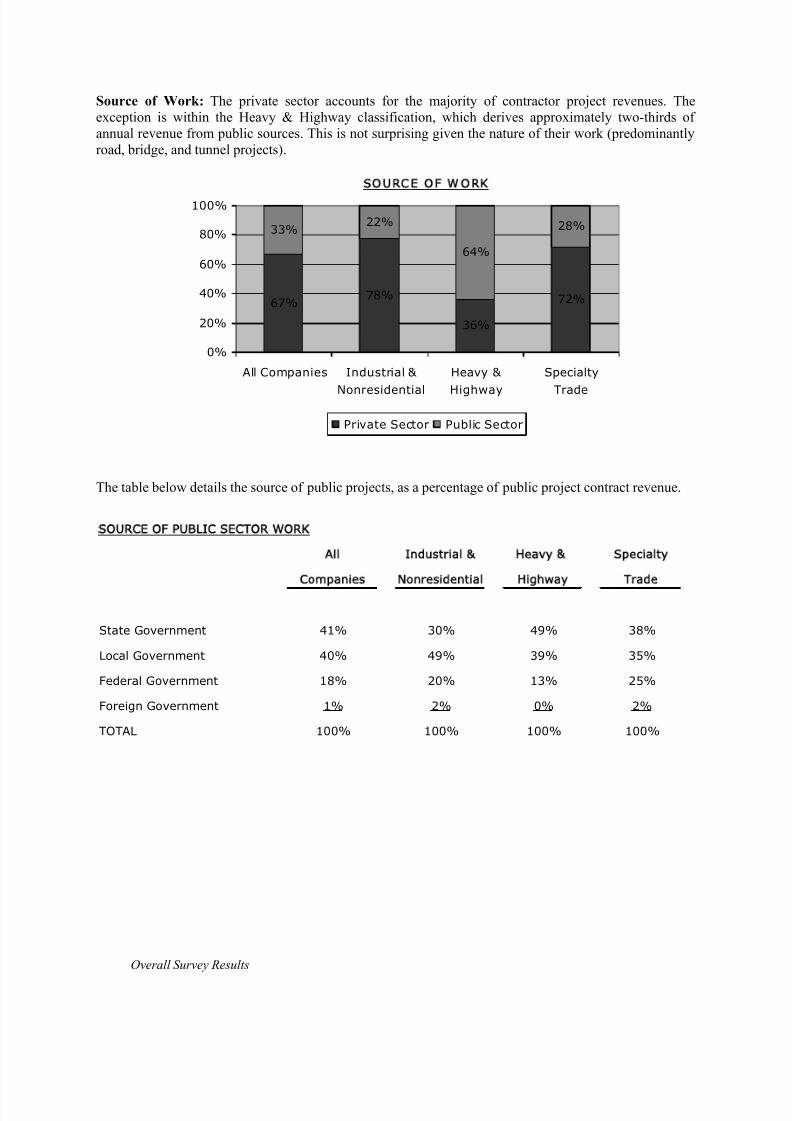
8/13/2019 2005 Financial Survey
http://slidepdf.com/reader/full/2005-financial-survey 53/284
Overall Survey Results
Source of Work: The private sector accounts for the majority of contractor project revenues. Theexception is within the Heavy & Highway classification, which derives approximately two-thirds ofannual revenue from public sources. This is not surprising given the nature of their work (predominantlyroad, bridge, and tunnel projects).
S O U RC E O F W O R K
67% 78%
36%
72%
33% 22%
64%
28%
0%
20%
40%
60%
80%
100%
All Companies Industrial &
Nonresidential
Heavy &
Highway
Specialty
Trade
Private Sector Public Sector
The table below details the source of public projects, as a percentage of public project contract revenue.
SOURCE OF PUBLIC SECTOR WORK
All Industrial & Heavy & Specialty
Companies Nonresidential Highway Trade
State Government 41% 30% 49% 38%
Local Government 40% 49% 39% 35%
Federal Government 18% 20% 13% 25%
Foreign Government 1% 2% 0% 2%
TOTAL 100% 100% 100% 100%
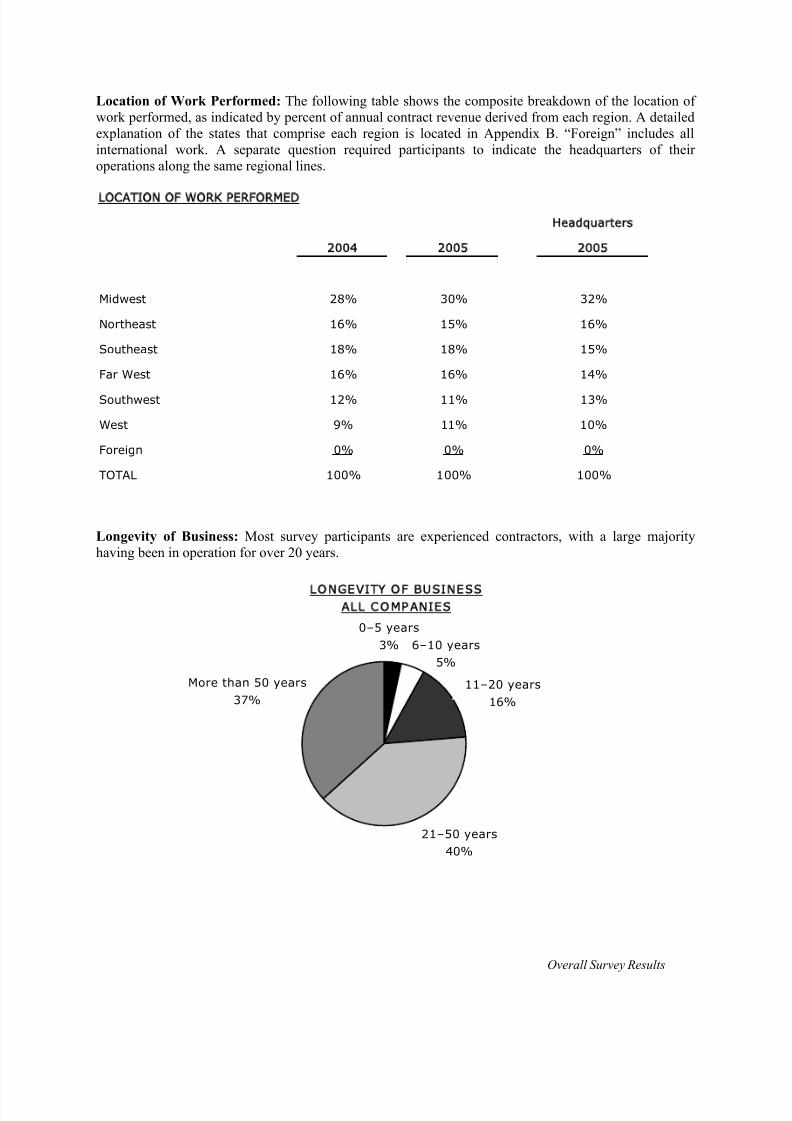
8/13/2019 2005 Financial Survey
http://slidepdf.com/reader/full/2005-financial-survey 54/284
Overall Survey Results
Location of Work Performed: The following table shows the composite breakdown of the location ofwork performed, as indicated by percent of annual contract revenue derived from each region. A detailedexplanation of the states that comprise each region is located in Appendix B. “Foreign” includes allinternational work. A separate question required participants to indicate the headquarters of theiroperations along the same regional lines.
LOCATION OF WORK PERFORMED
Headquarters
2004 2005 2005
Midwest 28% 30% 32%
Northeast 16% 15% 16%
Southeast 18% 18% 15%
Far West 16% 16% 14%
Southwest 12% 11% 13%
West 9% 11% 10%
Foreign 0% 0% 0%
TOTAL 100% 100% 100%
Longevity of Business: Most survey participants are experienced contractors, with a large majorityhaving been in operation for over 20 years.
L O N G E V I TY O F B U S I N E S SA L L C O M P A N IE S
21–50 years
40%
11–20 years
16%
6–10 years
5%
0–5 years
3%
More than 50 years
37%
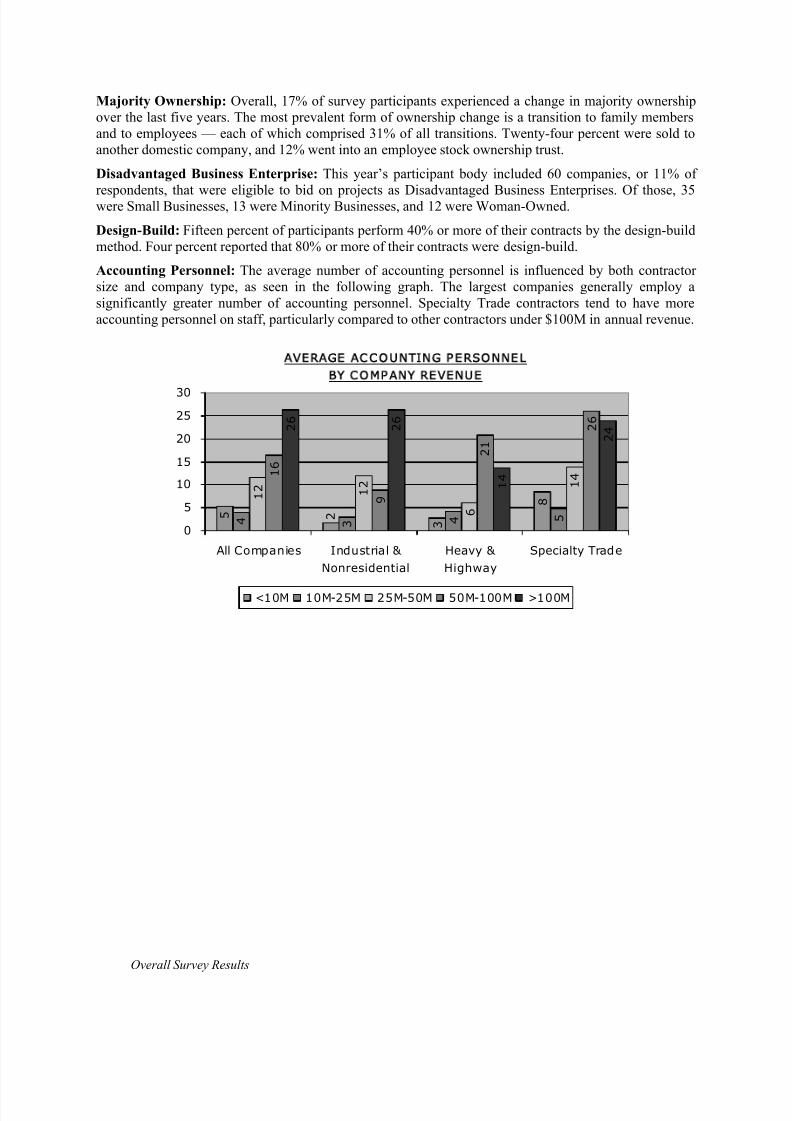
8/13/2019 2005 Financial Survey
http://slidepdf.com/reader/full/2005-financial-survey 55/284
Overall Survey Results
Majority Ownership: Overall, 17% of survey participants experienced a change in majority ownershipover the last five years. The most prevalent form of ownership change is a transition to family membersand to employees — each of which comprised 31% of all transitions. Twenty-four percent were sold toanother domestic company, and 12% went into an employee stock ownership trust.
Disadvantaged Business Enterprise: This year’s participant body included 60 companies, or 11% of
respondents, that were eligible to bid on projects as Disadvantaged Business Enterprises. Of those, 35were Small Businesses, 13 were Minority Businesses, and 12 were Woman-Owned.
Design-Build: Fifteen percent of participants perform 40% or more of their contracts by the design-buildmethod. Four percent reported that 80% or more of their contracts were design-build.
Accounting Personnel: The average number of accounting personnel is influenced by both contractorsize and company type, as seen in the following graph. The largest companies generally employ asignificantly greater number of accounting personnel. Specialty Trade contractors tend to have moreaccounting personnel on staff, particularly compared to other contractors under $100M in annual revenue.
A V E R A G E A C C O U N T I N G P E R S O N N E L
B Y C O M P A N Y R E V E N U E
2 8
3 5 5 4 3 4
1 4
6
1 2
1 2
2 6
2 1
9
1 6
2 4
1 4
2 6
2 6
0
5
10
15
20
25
30
All Companies Industrial &
Nonresidential
Heavy &
Highway
Specialty Trade
<10M 10M-25M 25M-50M 50M-100M >100M

8/13/2019 2005 Financial Survey
http://slidepdf.com/reader/full/2005-financial-survey 56/284
Overall Survey Results
Project Managers: The average number of project managers was influenced primarily by revenue size.The largest companies employ a significantly greater number of project management personnel.
A V E R A G E N U M B E R P R O J E C T M A N A GE R S
B Y C O M P A N Y R E V E N U E
3 4 3 6 5 4 6 5 7 7 5 9 1 3 1
4 1 1 1
5
4 7
5 5
3 7 4
0
0
10
20
30
40
5060
All Companies Industrial &
Nonresidential
Heavy &
Highway
Specialty Trade
<10M 10M-25M 25M-50M 50M-100M >100M
Estimators: The average number of estimators is influenced by both contractor size and company type.Specialty Trade contractors tend to have more estimators on staff.
AVERAGE NUMBER OF ESTIMATORS
BY COMPANY REVENUE
2 2 2 2 3 3
2 3
6
3 3 4
6 5 4
5
1
9
1 3
1 6
1 6
0
5
10
15
20
All Companies Industria l &
Nonresidential
Heavy &
Highway
Specialty Trade
<10M 10M-25M 25M-50M 50M-100M >100M

8/13/2019 2005 Financial Survey
http://slidepdf.com/reader/full/2005-financial-survey 57/284
Overall Survey Results
Open-Shop/Union Contractor: Open-shop contractors dominate the industry. The exception is withinthe Specialty Trade classification, in which more than half are union contractors, as illustrated in thegraph below.
P E R C E N T A G E O F O P E N -S H O P
A N D U N I O N C O N T R A C T O R S
4 6 %
4 8 %
3 5 %
5 1 %
3 6 %
2 3 %
4 0 %
5 3 %
9 %
9 %
1 0 %
9 %
9 %
1 7 %
2 %
3 %
0%
30%
60%
All Companies Industrial &
Nonresidential
Heavy &
Highway
Specialty Trade
Open-shop contractor Union contractor
Double-breasted contractor Merit
Length of Contracts: Nearly two-thirds of this year’s participants indicated that their average contractlength is less than one year. Very few perform projects that extend beyond two years.
AVERAGE CONTRACT DURATION
5 7 %
7 2 %
5 8 % 6
2 %
2 8 %
3 3 % 4
2 %
3 5 %
0 %
9 %
1 % 2
%
0%
20%
40%
60%
80%
All Companies Industria l &
Nonresidential
Heavy &
Highway
Specialty Trade
<12 Months 12-24 Months >24 Months

8/13/2019 2005 Financial Survey
http://slidepdf.com/reader/full/2005-financial-survey 58/284
Overall Survey Results
Economy and Competition
Anticipated Growth in Next Year’s Volume: All contractor types had similar optimism about revenuegrowth as compared to the 2004 study. Overall, 63% of participants expected revenues to go up,compared to 58% last year. The overall expected change in revenues over the year is 11.3%. Among those participants anticipating an increase, their average expected change is a very substantial 21.5%.
A N T IC I P A T E D G R O W T H I N N E X T Y E A R' S V O L U M E
63% 63% 62% 65%
12% 13% 11% 12%
24% 24% 27% 23%
0%
20%
40%
60%
80%
100%
All Companies Industrial &
Nonresidential
Heavy &
Highway
Specialty Trade
Increase Decrease No Change
Markets with Highest Anticipated Growth: Overall market rankings did not change significantly fromlast year, but Real Estate Development moved up one spot to overtake Heavy & Highway. However, in aninteresting disparity of opinion, Heavy & Highway contractors continue to expect their own fortunes torise faster than anticipated by other sectors.
MARKETS WITH THE HIGHEST ANTICIPATED GROWTH
(Highest growth market = 1, lowest growth market = 5)
All Industrial & Heavy & Specialty
Companies Nonresidential Highway Trade
Residential 1 1 1 1
Industrial & Nonresidential 2 2 3 2
Real Estate Development 3 3 4 3
Heavy & Highway 4 4 2 4
Specialty Trade 5 5 5 5
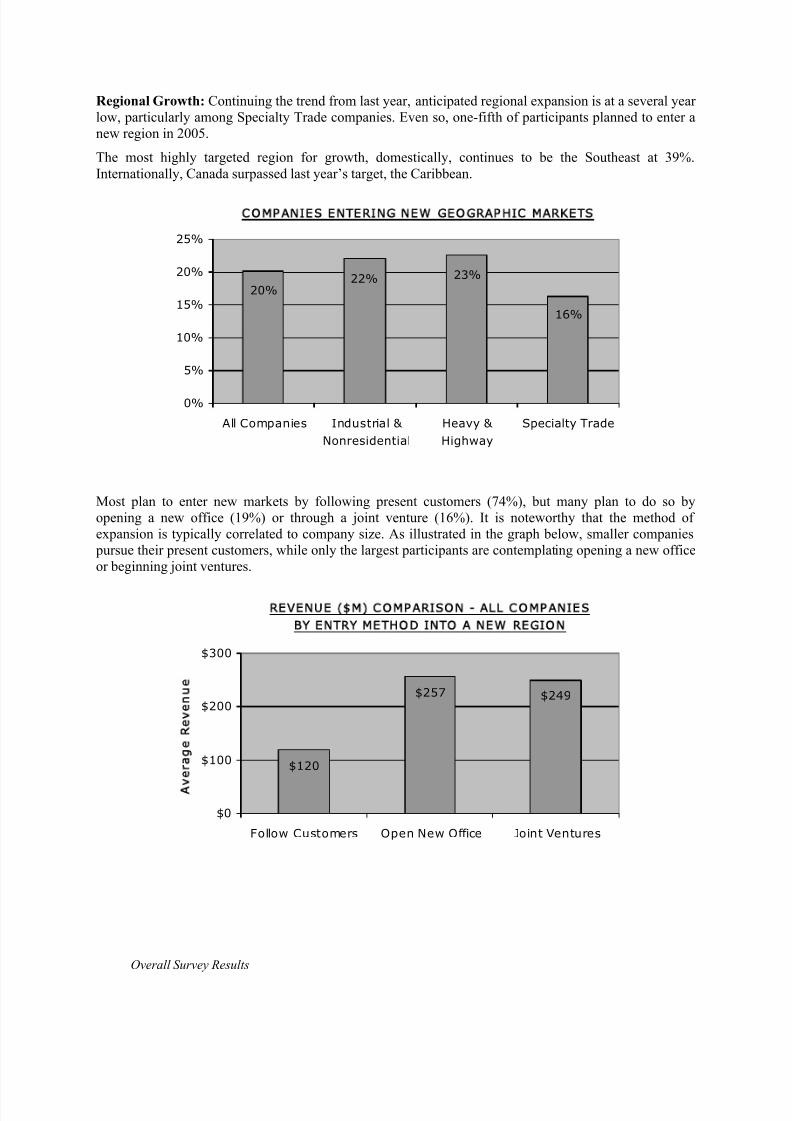
8/13/2019 2005 Financial Survey
http://slidepdf.com/reader/full/2005-financial-survey 59/284
Overall Survey Results
Regional Growth: Continuing the trend from last year, anticipated regional expansion is at a several yearlow, particularly among Specialty Trade companies. Even so, one-fifth of participants planned to enter anew region in 2005.
The most highly targeted region for growth, domestically, continues to be the Southeast at 39%.Internationally, Canada surpassed last year’s target, the Caribbean.
C O M P A N IE S E N T E R IN G N E W G E O G R A P H IC M A R KE T S
16%
23%22%20%
0%
5%
10%
15%
20%
25%
All Companies Industrial &
Nonresidential
Heavy &
Highway
Specialty Trade
Most plan to enter new markets by following present customers (74%), but many plan to do so byopening a new office (19%) or through a joint venture (16%). It is noteworthy that the method ofexpansion is typically correlated to company size. As illustrated in the graph below, smaller companies pursue their present customers, while only the largest participants are contemplating opening a new officeor beginning joint ventures.
$120
$249$257
$0
$100
$200
$300
Follow Customers Open New Office Joint Ventures
v
aeRe
ue
R E V E N U E ( M ) C O M P A R I S O N - A L L C O M P A N I E S
B Y E N TR Y M E T H O D I N TO A N E W R E G I O N
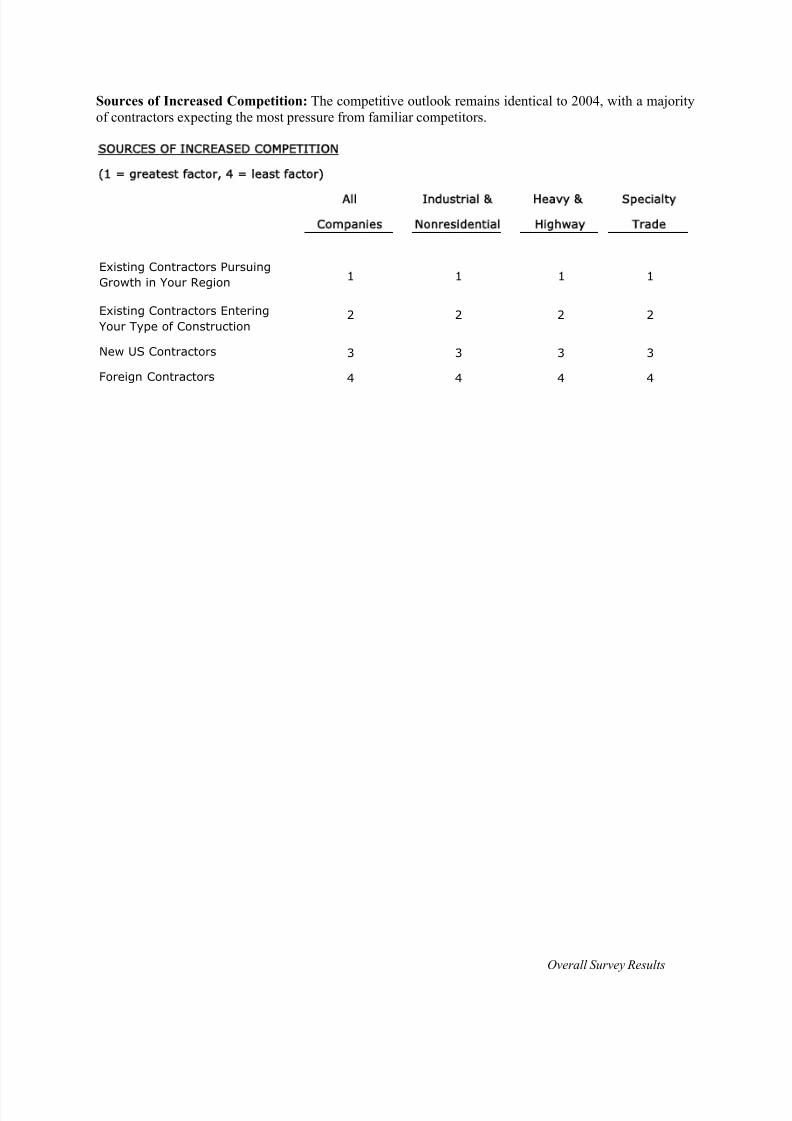
8/13/2019 2005 Financial Survey
http://slidepdf.com/reader/full/2005-financial-survey 60/284
Overall Survey Results
Sources of Increased Competition: The competitive outlook remains identical to 2004, with a majorityof contractors expecting the most pressure from familiar competitors.
SOURCES OF INCREASED CO MPETITION
(1 = greatest factor, 4 = least factor)
All Industrial & Heavy & Specialty
Companies Nonresidential Highway Trade
Existing Contractors Pursuing
Growth in Your Region 1 1 1 1
Existing Contractors Entering
Your Type of Construction2 2 2 2
New US Contractors 3 3 3 3
Foreign Contractors 4 4 4 4
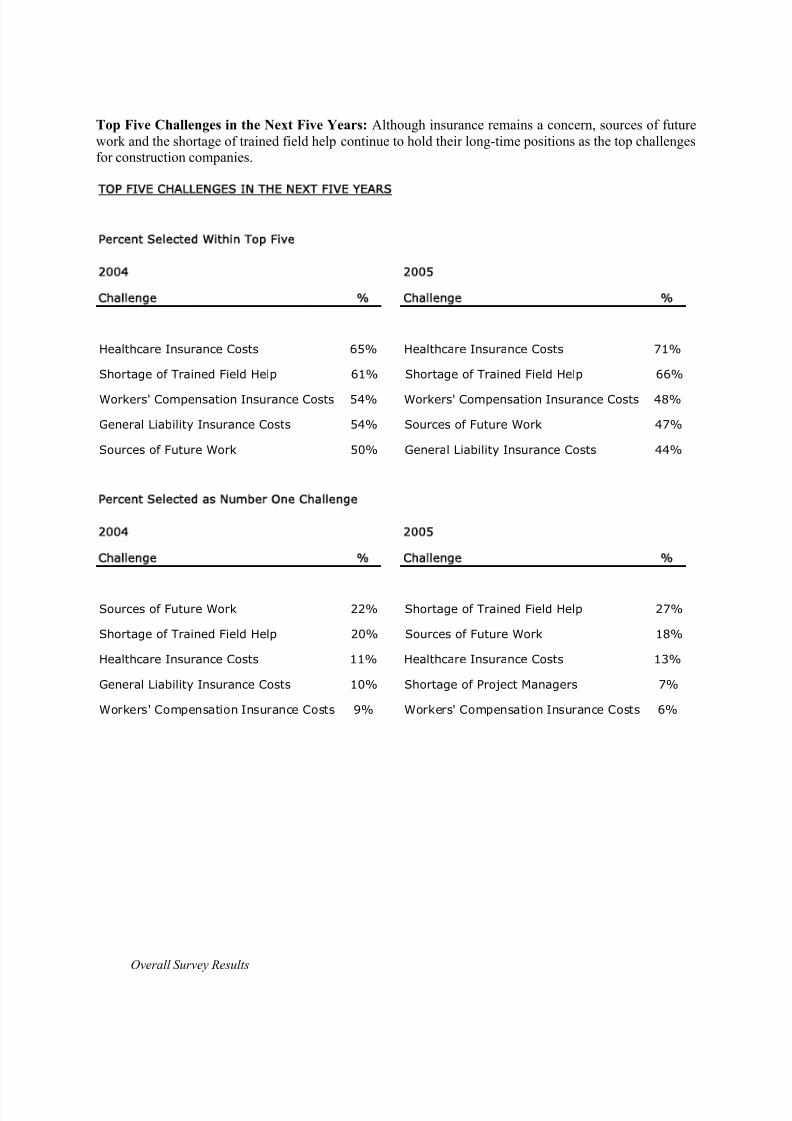
8/13/2019 2005 Financial Survey
http://slidepdf.com/reader/full/2005-financial-survey 61/284
Overall Survey Results
Top Five Challenges in the Next Five Years: Although insurance remains a concern, sources of futurework and the shortage of trained field help continue to hold their long-time positions as the top challengesfor construction companies.
TOP FIVE CHALLENGES IN THE NEXT FIVE YEARS
Percent Selected Within Top Five
2004 2005
Challenge % Challenge %
Healthcare Insurance Costs 65% Healthcare Insurance Costs 71%
Shortage of Trained Field Help 61% Shortage of Trained Field Help 66%
54% 48%
General Liability Insurance Costs 54% Sources of Future Work 47%
Sources of Future Work 50% General Liability Insurance Costs 44%
Percent Selected as Number One Challenge
2004 2005
Challenge % Challenge %
Sources of Future Work 22% Shortage of Trained Field Help 27%
Shortage of Trained Field Help 20% Sources of Future Work 18%
Healthcare Insurance Costs 11% Healthcare Insurance Costs 13%
General Liability Insurance Costs 10% Shortage of Project Managers 7%
9% 6%
Workers' Compensation Insurance CostsWorkers' Compensation Insurance Costs
Workers' Compensation Insurance Costs Workers' Compensation Insurance Costs

8/13/2019 2005 Financial Survey
http://slidepdf.com/reader/full/2005-financial-survey 62/284
Overall Survey Results
Backlog: The number of contractors experiencing an increase in backlog improved significantlycompared to the 2004 study. Over half of all participants experienced backlog increase. The relative sizeof backlog at year-end was also significantly improved as compared to the prior year.
S I Z E O F B A C K L O G C O M P A R E D T O L A S T YE A R
55% 50%64%
54%
23% 29%16%
21%
22% 21% 20% 25%
0%
20%
40%
60%
80%
100%
All Companies Industrial &
Nonresidential
Heavy &
Highway
Specialty Trade
Increase Decrease No Change
BAC KL OG AT YEAR -EN D ( M )
$27.6
$113.7
$87.9
$76.2
$0
$50
$100
$150
All Companies Industrial &
Nonresidential
Heavy &
Highway
Specialty Trade
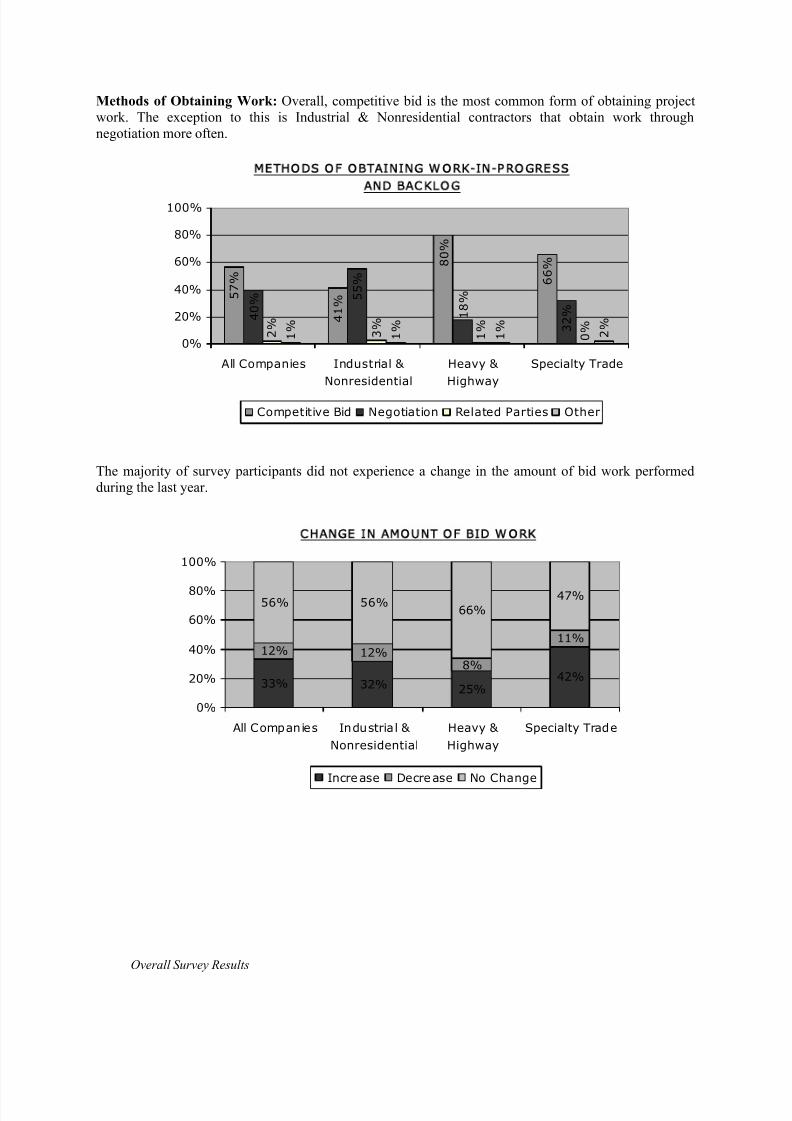
8/13/2019 2005 Financial Survey
http://slidepdf.com/reader/full/2005-financial-survey 63/284
Overall Survey Results
Methods of Obtaining Work: Overall, competitive bid is the most common form of obtaining projectwork. The exception to this is Industrial & Nonresidential contractors that obtain work throughnegotiation more often.
M E T H O D S O F O B T AI N I N G W O R K - IN - P R O G R E S S
A N D B AC K L O G
2%
1%
0%
1%
1%
1% 2
%
66%8
0%
41%
57%
55%
18%
32%4
0%
3%
0%
20%
40%
60%
80%
100%
All Companies Industrial &
Nonresidential
Heavy &
Highway
Specialty Trade
Competitive Bid Negotiation Related Parties Other
The majority of survey participants did not experience a change in the amount of bid work performedduring the last year.
CHANGE IN AMOUNT OF BID WORK
33% 32% 25%42%
12% 12%
11%
56% 56%66%
47%
8%
0%
20%
40%
60%
80%
100%
All Companies Industrial &
Nonresidential
Heavy &
Highway
Specialty Trade
Increase Decrease No Change
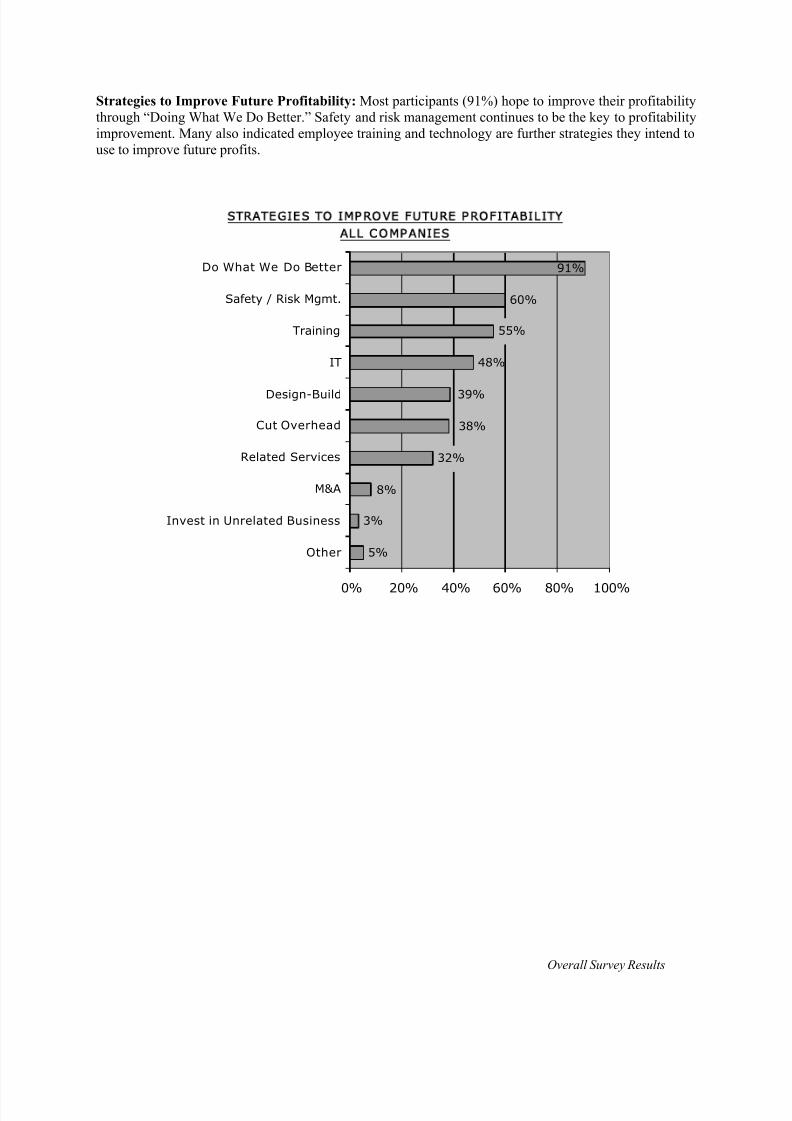
8/13/2019 2005 Financial Survey
http://slidepdf.com/reader/full/2005-financial-survey 64/284
Overall Survey Results
Strategies to Improve Future Profitability: Most participants (91%) hope to improve their profitabilitythrough “Doing What We Do Better.” Safety and risk management continues to be the key to profitabilityimprovement. Many also indicated employee training and technology are further strategies they intend touse to improve future profits.
STRATEGIES TO IMPROVE FUTURE PROFITABILITY
ALL CO MPANIES
5%
3%
48%
60%
39%
38%
55%
91%
8%
32%
0% 20% 40% 60% 80% 100%
Other
Invest in Unrelated Business
M&A
Related Services
Cut Overhead
Design-Build
IT
Training
Safety / Risk Mgmt.
Do What We Do Better
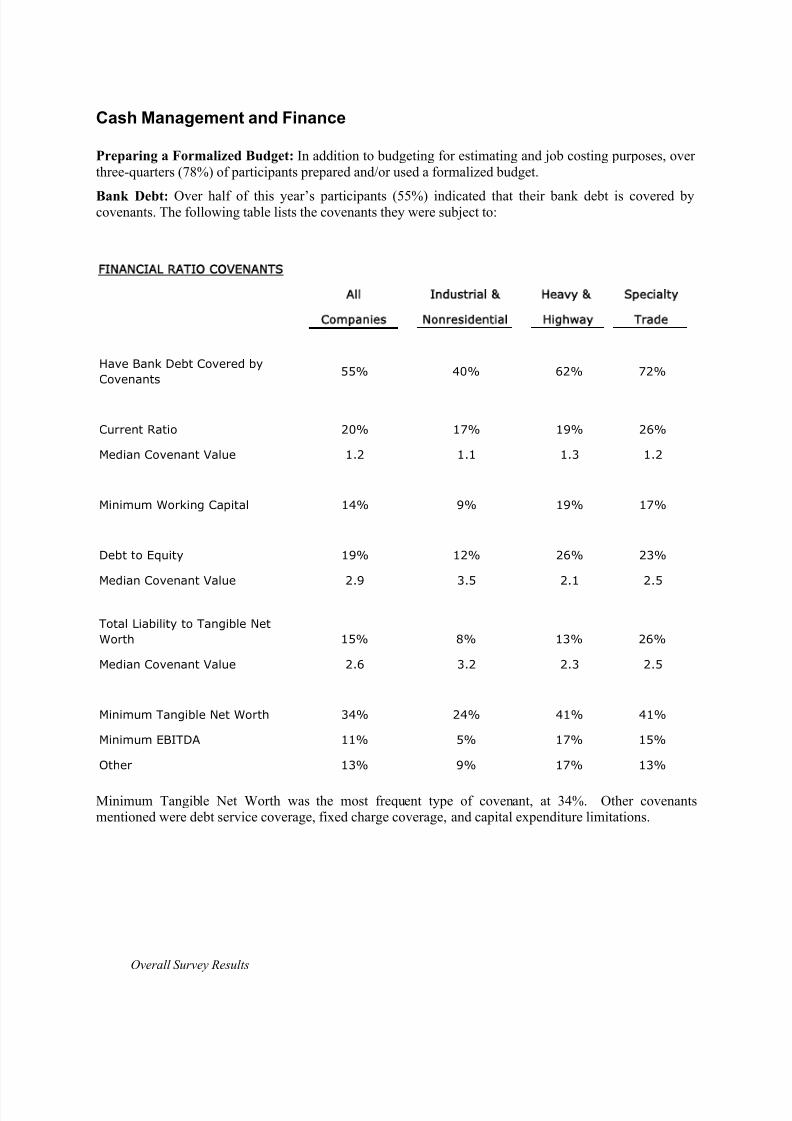
8/13/2019 2005 Financial Survey
http://slidepdf.com/reader/full/2005-financial-survey 65/284
Overall Survey Results
Cash Management and Finance
Preparing a Formalized Budget: In addition to budgeting for estimating and job costing purposes, overthree-quarters (78%) of participants prepared and/or used a formalized budget.
Bank Debt: Over half of this year’s participants (55%) indicated that their bank debt is covered bycovenants. The following table lists the covenants they were subject to:
FINANCIAL RATIO COVENA NTS
All Industrial & Heavy & Specialty
Companies Nonresidential Highway Trade
Have Bank Debt Covered by
Covenants 55% 40% 62% 72%
Current Ratio 20% 17% 19% 26%
Median Covenant Value 1.2 1.1 1.3 1.2
Minimum Working Capital 14% 9% 19% 17%
Debt to Equity 19% 12% 26% 23%
Median Covenant Value 2.9 3.5 2.1 2.5
Total Liability to Tangible Net
Worth 15% 8% 13% 26%
Median Covenant Value 2.6 3.2 2.3 2.5
Minimum Tangible Net Worth 34% 24% 41% 41%
Minimum EBITDA 11% 5% 17% 15%
Other 13% 9% 17% 13%
Minimum Tangible Net Worth was the most frequent type of covenant, at 34%. Other covenantsmentioned were debt service coverage, fixed charge coverage, and capital expenditure limitations.
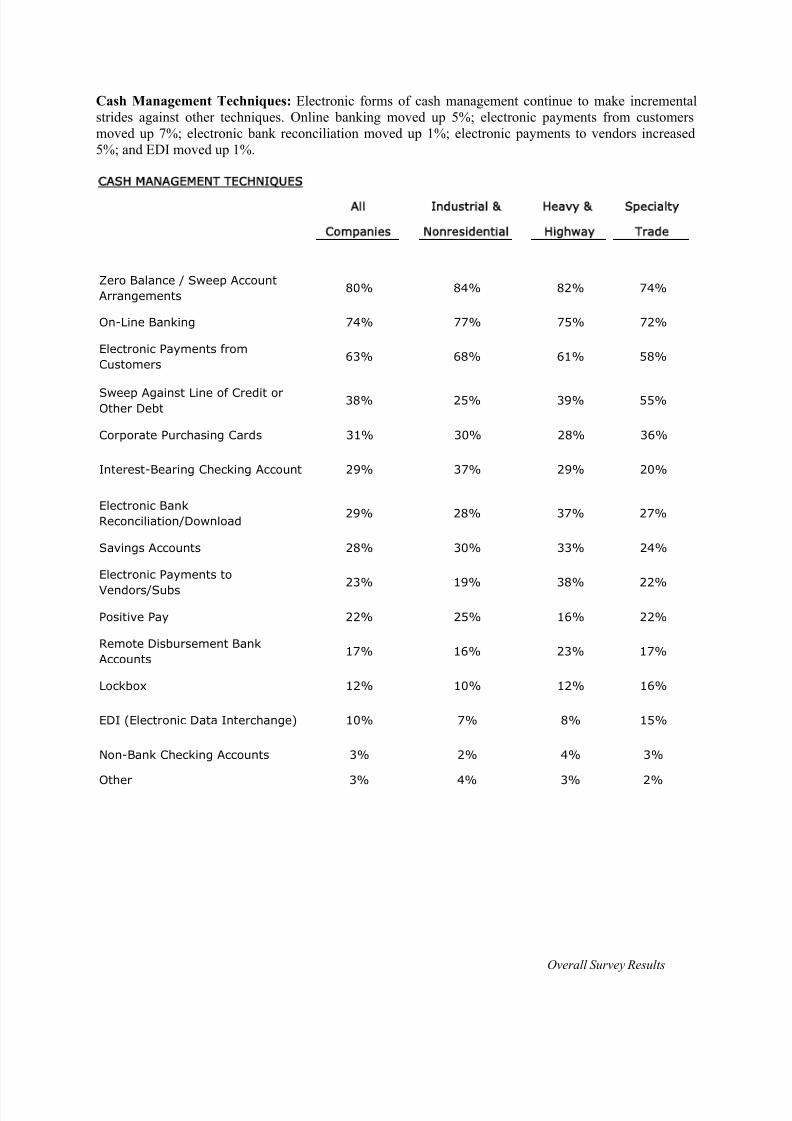
8/13/2019 2005 Financial Survey
http://slidepdf.com/reader/full/2005-financial-survey 66/284
Overall Survey Results
Cash Management Techniques: Electronic forms of cash management continue to make incrementalstrides against other techniques. Online banking moved up 5%; electronic payments from customersmoved up 7%; electronic bank reconciliation moved up 1%; electronic payments to vendors increased5%; and EDI moved up 1%.
CASH MANAGEMENT TECHNIQUES
All Industrial & Heavy & Specialty
Companies Nonresidential Highway Trade
Zero Balance / Sweep Account
Arrangements 80% 84% 82% 74%
On-Line Banking 74% 77% 75% 72%
Electronic Payments from
Customers 63% 68% 61% 58%
Sweep Against Line of Credit orOther Debt
38% 25% 39% 55%
Corporate Purchasing Cards 31% 30% 28% 36%
Interest-Bearing Checking Account 29% 37% 29% 20%
Electronic Bank
Reconciliation/Download 29% 28% 37% 27%
Savings Accounts 28% 30% 33% 24%
Electronic Payments to
Vendors/Subs 23% 19% 38% 22%
Positive Pay 22% 25% 16% 22%
Remote Disbursement Bank
Accounts 17% 16% 23% 17%
Lockbox 12% 10% 12% 16%
EDI (Electronic Data Interchange) 10% 7% 8% 15%
Non-Bank Checking Accounts 3% 2% 4% 3%
Other 3% 4% 3% 2%
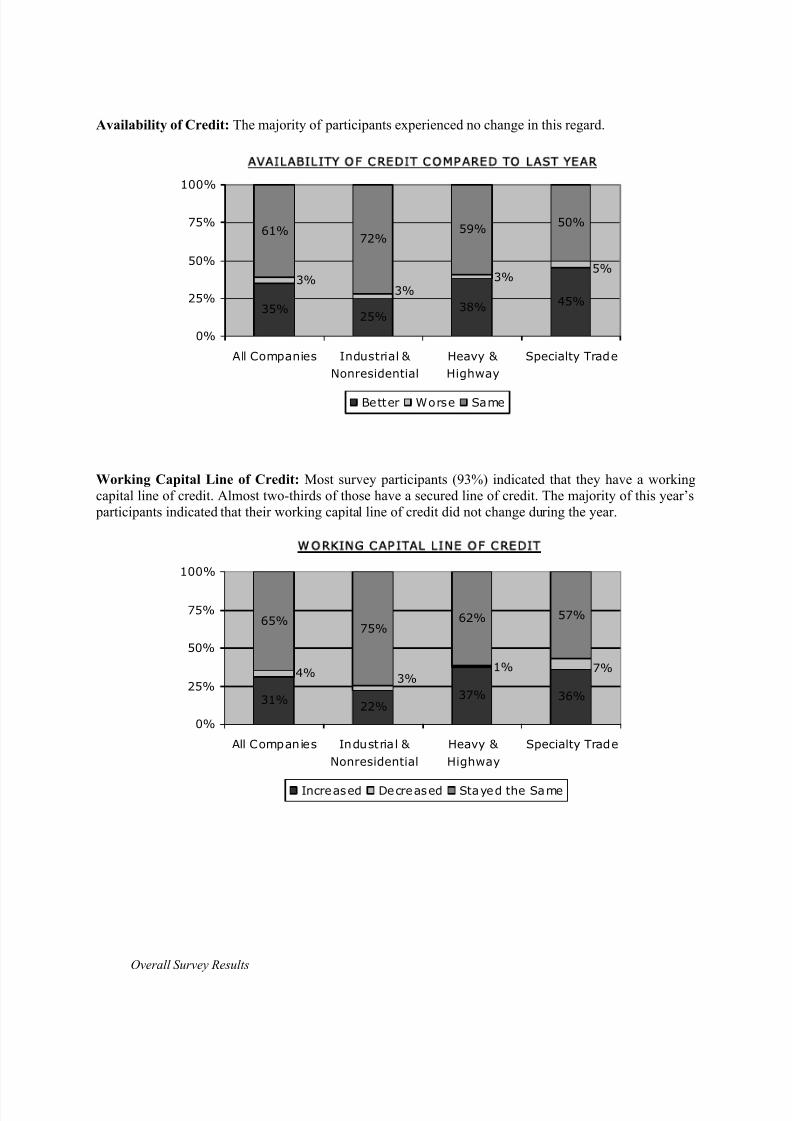
8/13/2019 2005 Financial Survey
http://slidepdf.com/reader/full/2005-financial-survey 67/284
Overall Survey Results
Availability of Credit: The majority of participants experienced no change in this regard.
A V A IL A B I L IT Y O F C R E D I T C O M P A R E D T O L A S T Y E A R
35%25%
38% 45%
61%72%
59% 50%
5%3%
3%3%
0%
25%
50%
75%
100%
All Companies Industrial &
Nonresidential
Heavy &
Highway
Specialty Trade
Better Worse Same
Working Capital Line of Credit: Most survey participants (93%) indicated that they have a workingcapital line of credit. Almost two-thirds of those have a secured line of credit. The majority of this year’s participants indicated that their working capital line of credit did not change during the year.
WO RKING CAPITAL LINE OF CREDIT
31%22%
37% 36%
65%75%
62% 57%
4%3%
1% 7%
0%
25%
50%
75%
100%
All Companies Industrial &
Nonresidential
Heavy &
Highway
Specialty Trade
Increased Decreased Stayed the Same
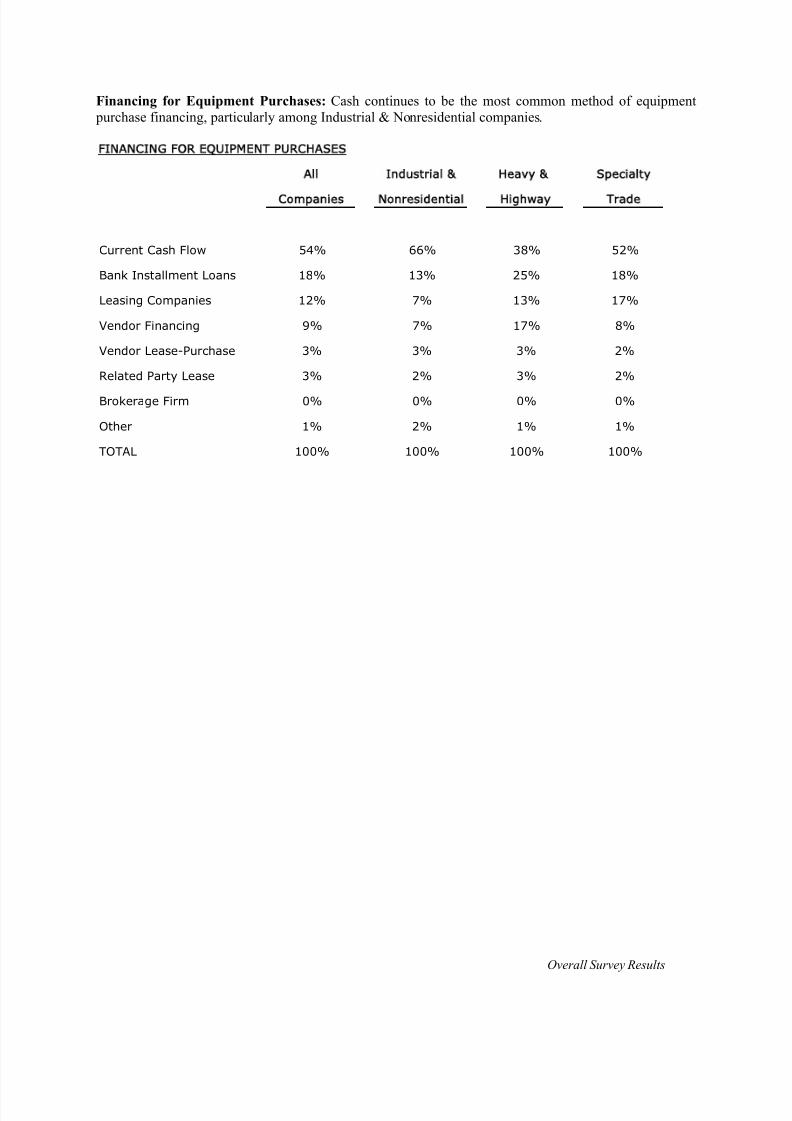
8/13/2019 2005 Financial Survey
http://slidepdf.com/reader/full/2005-financial-survey 68/284
Overall Survey Results
Financing for Equipment Purchases: Cash continues to be the most common method of equipment purchase financing, particularly among Industrial & Nonresidential companies.
FINANCING FOR EQUIPMENT PURCH ASES
All Industrial & Heavy & Specialty
Companies Nonresidential Highway Trade
Current Cash Flow 54% 66% 38% 52%
Bank Installment Loans 18% 13% 25% 18%
Leasing Companies 12% 7% 13% 17%
Vendor Financing 9% 7% 17% 8%
Vendor Lease-Purchase 3% 3% 3% 2%
Related Party Lease 3% 2% 3% 2%
Brokerage Firm 0% 0% 0% 0%
Other 1% 2% 1% 1%
TOTAL 100% 100% 100% 100%

8/13/2019 2005 Financial Survey
http://slidepdf.com/reader/full/2005-financial-survey 69/284
Overall Survey Results
As can be seen in the first graph below, those financing equipment purchases are choosing cash more thanloans on financing. Debt to equity is still high; however, the debt is now more balanced between short andlong term, as can be seen in the second graph below. This is an improvement compared to 2004, when themajority of debt was long-term.
R A TI O S B Y E Q U I P M E N T F I N A N C I N G M E T H O D
A L L C O M P A N IE S
2.1
14.9
2.25.3 2.57.7
2.3
11.8
0
10
20
Days of Cash Debt to Equity
Cash Bank Loan Leasing Co. Loan Vendor Financing
1 7
%
3 % 4
% 8 % 1
0 %
1 1 %
9 % 9
%
8 %
1 5 %
9 %
6 %
0%
5%
10%
15%
20%
Cash Current Debt Long Term Debt
Cash Bank Loan Leasing Co. Loan Vendor Financing
P E R C E N T A G E O F A S S E TS
B Y E Q U I P M E N T F IN A N C I N G M E T H O D
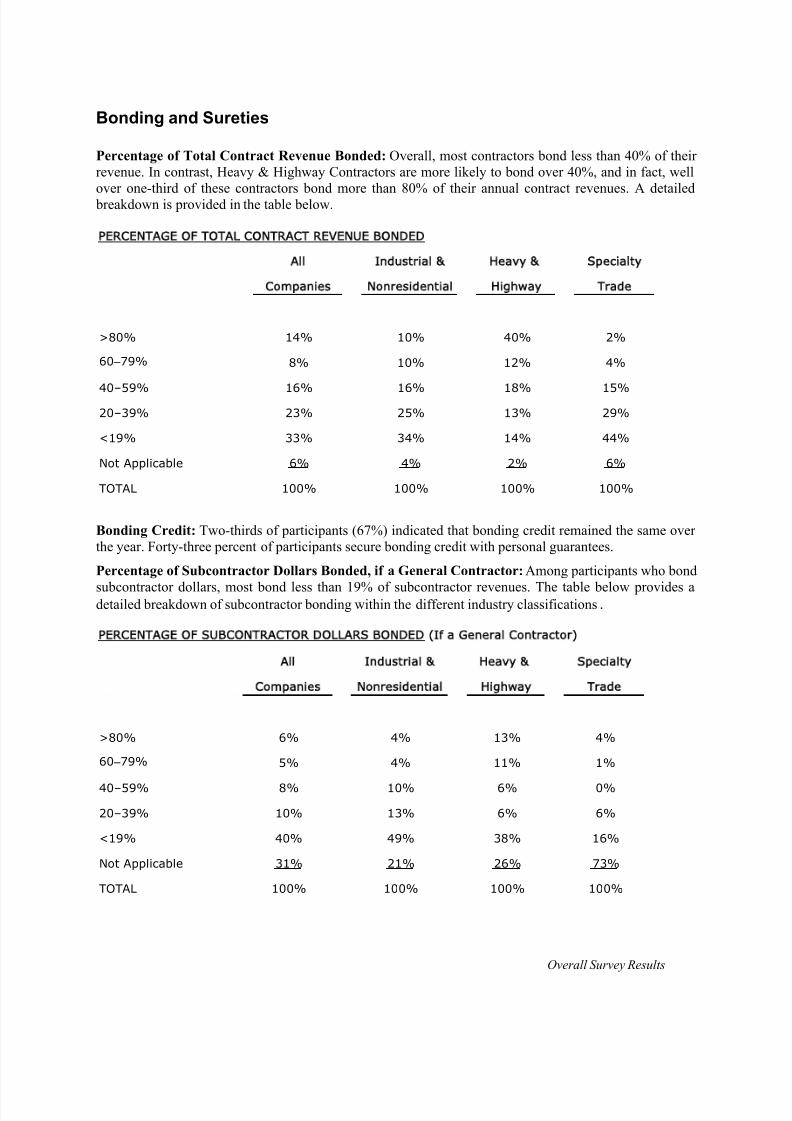
8/13/2019 2005 Financial Survey
http://slidepdf.com/reader/full/2005-financial-survey 70/284
Overall Survey Results
Bonding and Sureties
Percentage of Total Contract Revenue Bonded: Overall, most contractors bond less than 40% of theirrevenue. In contrast, Heavy & Highway Contractors are more likely to bond over 40%, and in fact, wellover one-third of these contractors bond more than 80% of their annual contract revenues. A detailed breakdown is provided in the table below.
PERCENTAGE OF TOTAL CONTRACT REVENUE BONDED
All Industrial & Heavy & Specialty
Companies Nonresidential Highway Trade
>80% 14% 10% 40% 2%
60 –79% 8% 10% 12% 4%
40–59% 16% 16% 18% 15%
20–39% 23% 25% 13% 29%
<19% 33% 34% 14% 44%
Not Applicable 6% 4% 2% 6%
TOTAL 100% 100% 100% 100%
Bonding Credit: Two-thirds of participants (67%) indicated that bonding credit remained the same overthe year. Forty-three percent of participants secure bonding credit with personal guarantees.
Percentage of Subcontractor Dollars Bonded, if a General Contractor: Among participants who bond
subcontractor dollars, most bond less than 19% of subcontractor revenues. The table below provides adetailed breakdown of subcontractor bonding within the different industry classifications.
PERCENTAGE OF SUBCON TRACTOR DOLLARS BONDED (If a General Contractor)
All Industrial & Heavy & Specialty
Companies Nonresidential Highway Trade
>80% 6% 4% 13% 4%
60 –79% 5% 4% 11% 1%
40–59% 8% 10% 6% 0%
20–39% 10% 13% 6% 6%
<19% 40% 49% 38% 16%
Not Applicable 31% 21% 26% 73%
TOTAL 100% 100% 100% 100%

8/13/2019 2005 Financial Survey
http://slidepdf.com/reader/full/2005-financial-survey 71/284
Overall Survey Results
Current Bonding Program: Most participants within each industry classification bond with only onesurety. About one-quarter have a standby surety, and a small percentage actively use more than onesurety.
B O N D I N G P R O G R A M
3%7
%7%
6%
17%
32%
26%
24%
79%
61%
67%
71%
0%
20%
40%
60%
80%
100%
All Companies Industrial &
Nonresidential
Heavy &
Highway
Specialty Trade
More Than One Surety One Surety + One Standby One Surety
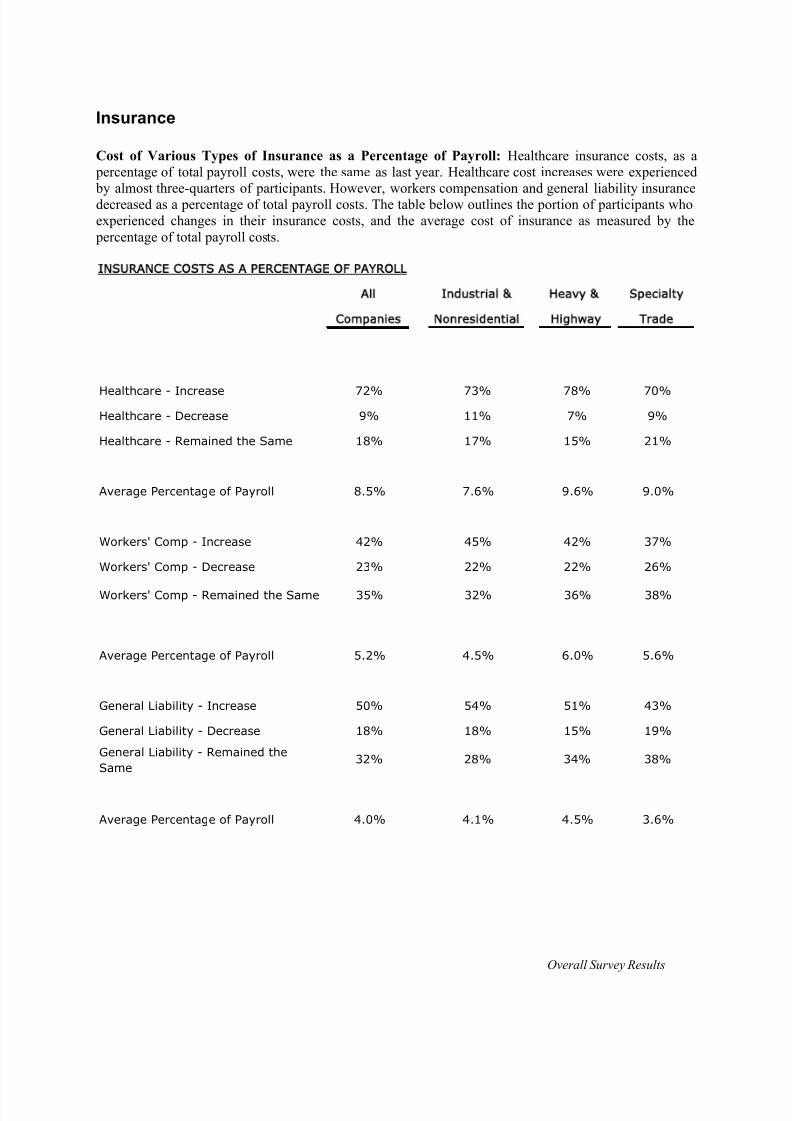
8/13/2019 2005 Financial Survey
http://slidepdf.com/reader/full/2005-financial-survey 72/284
Overall Survey Results
Insurance
Cost of Various Types of Insurance as a Percentage of Payroll: Healthcare insurance costs, as a percentage of total payroll costs, were the same as last year. Healthcare cost increases were experienced by almost three-quarters of participants. However, workers compensation and general liability insurancedecreased as a percentage of total payroll costs. The table below outlines the portion of participants whoexperienced changes in their insurance costs, and the average cost of insurance as measured by the percentage of total payroll costs.
INSURANCE COSTS AS A PERCENTAGE OF PAYROLL
All Industrial & Heavy & Specialty
Companies Nonresidential Highway Trade
Healthcare - Increase 72% 73% 78% 70%
Healthcare - Decrease 9% 11% 7% 9%
Healthcare - Remained the Same 18% 17% 15% 21%
Average Percentage of Payroll 8.5% 7.6% 9.6% 9.0%
Workers' Comp - Increase 42% 45% 42% 37%
Workers' Comp - Decrease 23% 22% 22% 26%
Workers' Comp - Remained the Same 35% 32% 36% 38%
Average Percentage of Payroll 5.2% 4.5% 6.0% 5.6%
General Liability - Increase 50% 54% 51% 43%
General Liability - Decrease 18% 18% 15% 19%
General Liability - Remained the
Same 32% 28% 34% 38%
Average Percentage of Payroll 4.0% 4.1% 4.5% 3.6%

8/13/2019 2005 Financial Survey
http://slidepdf.com/reader/full/2005-financial-survey 73/284
Overall Survey Results
Actions Taken to Control Insurance Costs: Similar to last year, construction companies have becomemore proactive about controlling insurance costs. The following table summarizes actions they are taking:
ACTIONS TAKEN TO CONTROL INSURANCE COSTS
All Industrial & Heavy & Specialty
Companies Nonresidential Highway Trade
Aggressive Loss Control 57% 53% 65% 56%
Competitive Bids 49% 46% 47% 55%
Raised Deductible 39% 35% 44% 39%
Changed Carriers 28% 26% 27% 30%
Reduced Coverage 11% 11% 8% 10%
Changed Brokers 11% 9% 11% 12%
Other 6% 5% 8% 7%
Workers’ Compensation: Most companies (80%) have a workers’ compensation experience modifierwithin the range of 0.5 and 0.99, as seen in prior years.
W O R K E R S ' C O M P E N S A TI O N E X P E R IE N C E M O D I F IE R
2 %
2 %
1 % 3
% 4 %
4 % 6
% 4 %
4 5 % 5 1
%
4 2 %
3 7 %
3 8 %
3 6 %
3 3 %
3 5 %
1 5 % 1
0 %
1 8 %
1 4 %
0%
20%
40%
60%
All Companies Industrial &
Nonresidential
Heavy &
Highway
Specialty Trade
<0.30 0.30-0.49 0.50-0.79 0.80-0.99 >1.0

8/13/2019 2005 Financial Survey
http://slidepdf.com/reader/full/2005-financial-survey 74/284
Overall Survey Results
Consistent with prior years, the typical number of claims per year falls between the 1 to 10 range.
NUMBER OF WO RKERS' COMPE NSATION CLAIMS
7 %
3 %
1 % 8
% 6 % 7
% 4 % 7
% 4 %
2 % 8
% 4 %
1 3 %
4 5 %
4 3 %
6 4 %
5 3 %
3 4 %
3 3 %
1 2 %
2 4 %
1 0 %
5 % 6
%
0%
25%
50%
75%
All Companies Industria l &
Nonresidential
Heavy &
Highway
Specialty Trade
None 1-10 11-25 26-50 51-100 >100
On average, most companies pay $5,000 per claim or less.
7 %
1 0 % 1
5 % 2
2 %
3 6 %
3 4 %
3 5 % 4 0
%
2 1 %
1 8 % 2
6 %
2 2 %
1 3 %
1 5 %
1 7 %
1 4 %
1 2 %
1 0 %
1 1 %
9 %
4 %
1 % 4
% 3 %
0%
20%
40%
60%
All Companies Industria l &
Nonresidential
Heavy &
Highway
Specialty Trade
<$500 $500-$2,500 $2,500-$5,000
$5,000-$10,000 $10,000-$25,000 >$25,000
AVERAGE COST OF E ACH WO RKERS' COMPE NSATION CLAIM

8/13/2019 2005 Financial Survey
http://slidepdf.com/reader/full/2005-financial-survey 75/284
Overall Survey Results
Professional Consultants
Attestation of Year-End Financial Statements: The majority of companies (70%) have their financialstatements audited. Only 1% have no form of attestation.
ATTESTATION OF YEAR-END FINANCIAL STATEMENTS
1
%
1
%
0 %
1
%
1
%
0 %
0 % 4
%
5 5 %
8 2 %
7 6 %
7 0 %
2
4 %
1 8
%
4 1 %
2 8 %
0%
20%
40%
60%
80%
100%
All Companies Industria l &
Nonresidential
Heavy &
Highway
Specialty Trade
Audited Reviewed Compiled No Attesta tion
Assurance Services: As in prior years, most participants use a local or regional accounting firm with aconstruction focus. Only a handful use a sole practitioner to perform their assurance services.
47%
25%
14%
10% 3%
0%
20%
40%
60%
Local/Regional Firm With
Construction Focus
Local/Regional Firm With
General Focus
Next Tier National Firm
"Big Four" Firm
Sole Practitioner
ACCOUNTING FIRMS PROVIDING ASSURANCESERVICES - ALL COMPANIES
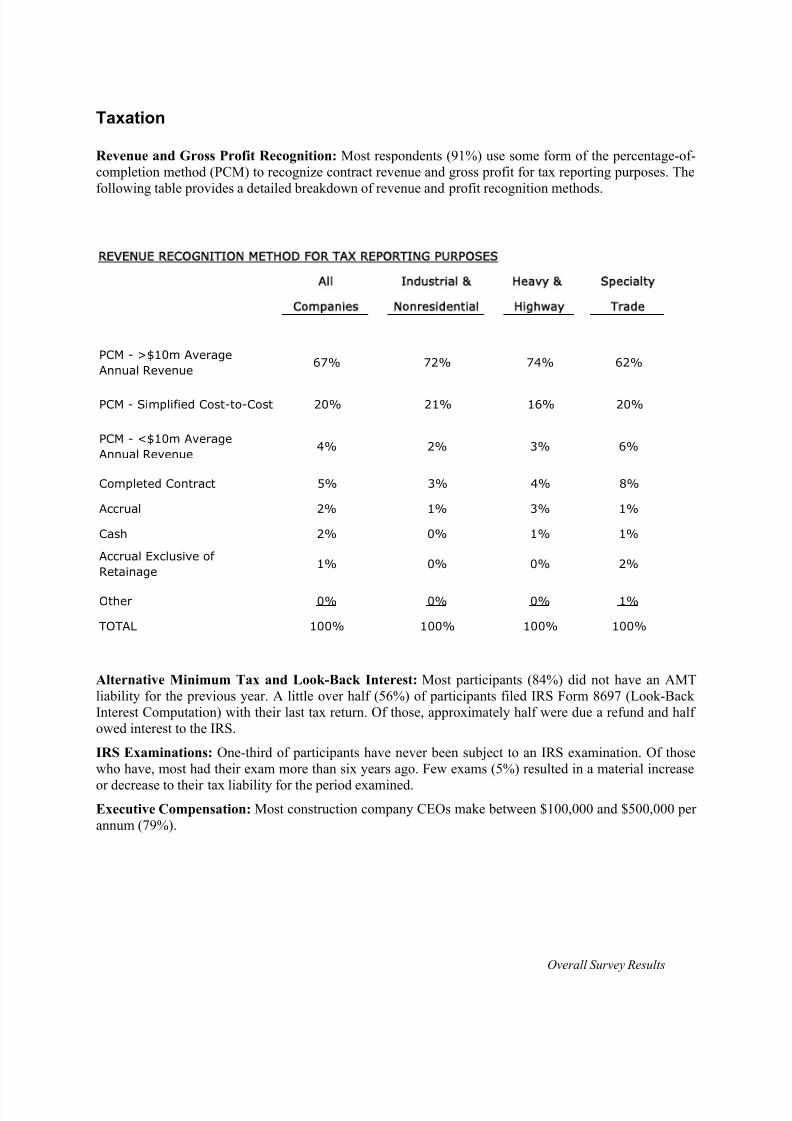
8/13/2019 2005 Financial Survey
http://slidepdf.com/reader/full/2005-financial-survey 76/284
Overall Survey Results
Taxation
Revenue and Gross Profit Recognition: Most respondents (91%) use some form of the percentage-of-completion method (PCM) to recognize contract revenue and gross profit for tax reporting purposes. Thefollowing table provides a detailed breakdown of revenue and profit recognition methods.
REVENUE RECOGNITION METHOD FOR TAX REPORTING PURPOSES
All Industrial & Heavy & Specialty
Companies Nonresidential Highway Trade
PCM - >$10m Average
Annual Revenue 67% 72% 74% 62%
PCM - Simplified Cost-to-Cost 20% 21% 16% 20%
PCM - <$10m Average
Annual Revenue 4% 2% 3% 6%
Completed Contract 5% 3% 4% 8%
Accrual 2% 1% 3% 1%
Cash 2% 0% 1% 1%
Accrual Exclusive of
Retainage 1% 0% 0% 2%
Other 0% 0% 0% 1%
TOTAL 100% 100% 100% 100%
Alternative Minimum Tax and Look-Back Interest: Most participants (84%) did not have an AMTliability for the previous year. A little over half (56%) of participants filed IRS Form 8697 (Look-BackInterest Computation) with their last tax return. Of those, approximately half were due a refund and halfowed interest to the IRS.
IRS Examinations: One-third of participants have never been subject to an IRS examination. Of thosewho have, most had their exam more than six years ago. Few exams (5%) resulted in a material increase
or decrease to their tax liability for the period examined.
Executive Compensation: Most construction company CEOs make between $100,000 and $500,000 perannum (79%).

8/13/2019 2005 Financial Survey
http://slidepdf.com/reader/full/2005-financial-survey 77/284
Overall Survey Results
TOTAL CEO COMPENSATION
All Industrial & Heavy & Specialty
Companies Nonresidential Highway Trade
Less than $100,000 4% 4% 4% 4%
$100,001 –$250,000 49% 47% 46% 53%
$250,001–$500,000 30% 30% 32% 27%
$500,001–$1 Million 12% 14% 13% 10%
Over $1 Million 5% 5% 5% 5%
TOTAL 100% 100% 100% 100%
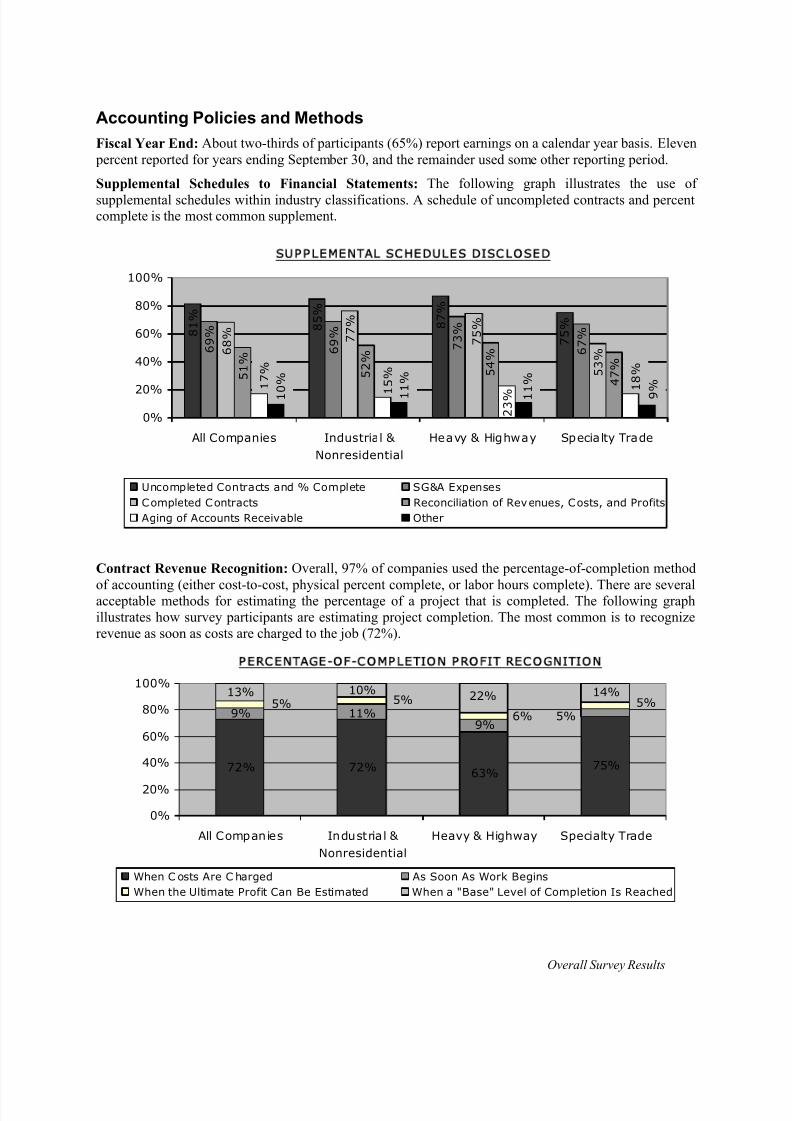
8/13/2019 2005 Financial Survey
http://slidepdf.com/reader/full/2005-financial-survey 78/284
Overall Survey Results
Accounting Policies and Methods
Fiscal Year End: About two-thirds of participants (65%) report earnings on a calendar year basis. Eleven percent reported for years ending September 30, and the remainder used some other reporting period.
Supplemental Schedules to Financial Statements: The following graph illustrates the use of
supplemental schedules within industry classifications. A schedule of uncompleted contracts and percentcomplete is the most common supplement.
SUPPLEMENTAL SCHEDULES DISCLOSED
8 1 %
8 5 %
8 7 %
7 5 %
6 9 %
6 9 %
7 3 %
6 7 %
6 8 % 7
7 %
7 5 %
5 3 %
4 7 % 5
4 %
5 1 %
5 2 %
1
5 %
1 8 %
1 7 %
2 3 % 1
1 %
9 %
1 1 %
1 0 %
0%
20%
40%
60%
80%
100%
All Companies Industrial &
Nonresidential
Heavy & Highway Specialty Trade
Uncompleted Contracts and % Complete SG&A Expenses
Completed Contracts Reconciliation of Revenues, Costs, and Profits
Aging of Accounts Receivable Other
Contract Revenue Recognition: Overall, 97% of companies used the percentage-of-completion method
of accounting (either cost-to-cost, physical percent complete, or labor hours complete). There are severalacceptable methods for estimating the percentage of a project that is completed. The following graphillustrates how survey participants are estimating project completion. The most common is to recognizerevenue as soon as costs are charged to the job (72%).
P E R C E N T A G E - O F - C O M P L E T I O N P R O F I T R E C O G N I T I O N
72% 72%63%
75%
9%9%
13% 10% 14%
5%11%5% 5%
6%
5% 22%
0%
20%
40%
60%
80%
100%
All Companies Industrial &
Nonresidential
Heavy & Highway Specialty Trade
When C osts Are C harged As Soon As Work Begins
When the Ultimate Profit Can Be Estimated When a "Base" Level of Completion Is Reached
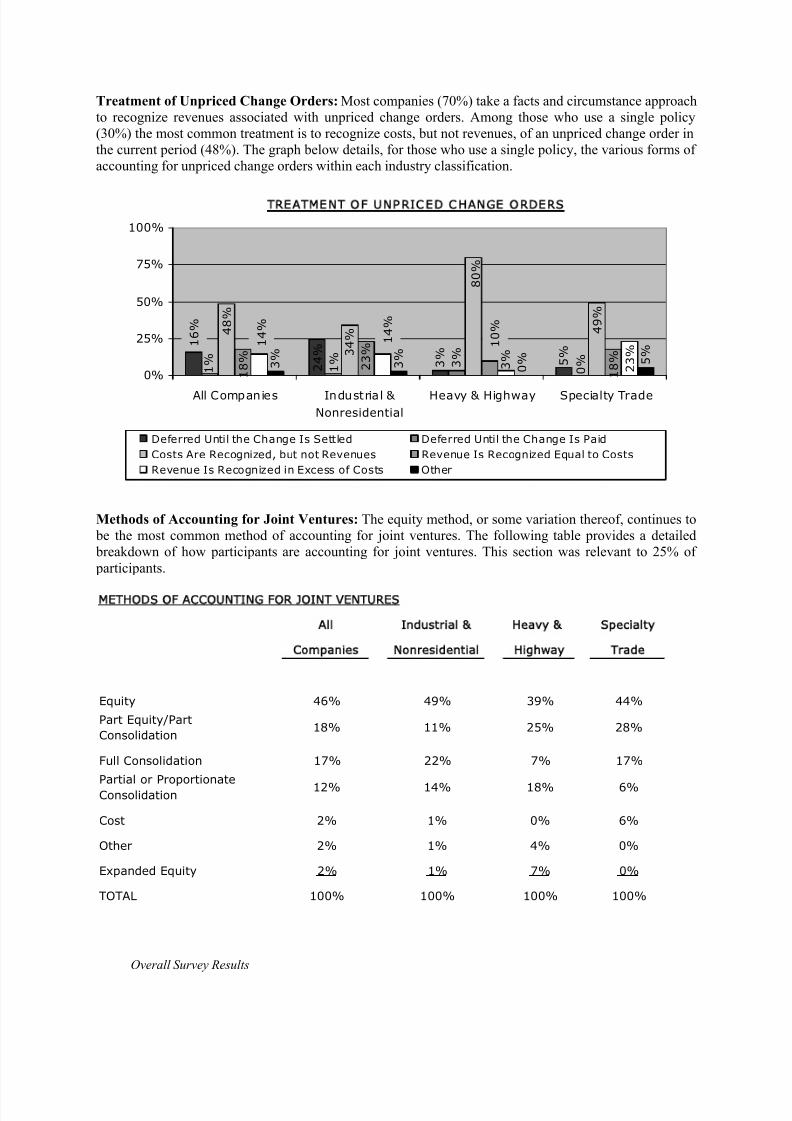
8/13/2019 2005 Financial Survey
http://slidepdf.com/reader/full/2005-financial-survey 79/284
Overall Survey Results
Treatment of Unpriced Change Orders: Most companies (70%) take a facts and circumstance approachto recognize revenues associated with unpriced change orders. Among those who use a single policy(30%) the most common treatment is to recognize costs, but not revenues, of an unpriced change order inthe current period (48%). The graph below details, for those who use a single policy, the various forms ofaccounting for unpriced change orders within each industry classification.
T R E A TM E N T O F U N P R I C E D C H A N G E O R D E R S
3 %
3 %
0 % 5
% 1 6 %
2 4 %
3 %
5 %
1 %
1 % 3
% 0 %
4 8 %
3 4 %
8 0 %
4 9 %
1 8 %
1 0 %
1 8 %
2 3 %
1 4 %
2 3 %
1 4 %
3 %
0%
25%
50%
75%
100%
All Companies Industrial &
Nonresidential
Heavy & Highway Specialty Trade
Deferred Until the Change Is Settled Deferred Until the Change Is Paid
Costs Are Recognized, but not Revenues Revenue Is Recognized Equal to Costs
Revenue Is Recognized in Excess of Costs Other
Methods of Accounting for Joint Ventures: The equity method, or some variation thereof, continues to be the most common method of accounting for joint ventures. The following table provides a detailed breakdown of how participants are accounting for joint ventures. This section was relevant to 25% of participants.
METHODS OF ACCOUNTING FOR JOINT VENTURES
All Industrial & Heavy & Specialty
Companies Nonresidential Highway Trade
Equity 46% 49% 39% 44%
Part Equity/Part
Consolidation 18% 11% 25% 28%
Full Consolidation 17% 22% 7% 17%
Partial or ProportionateConsolidation 12% 14% 18% 6%
Cost 2% 1% 0% 6%
Other 2% 1% 4% 0%
Expanded Equity 2% 1% 7% 0%
TOTAL 100% 100% 100% 100%
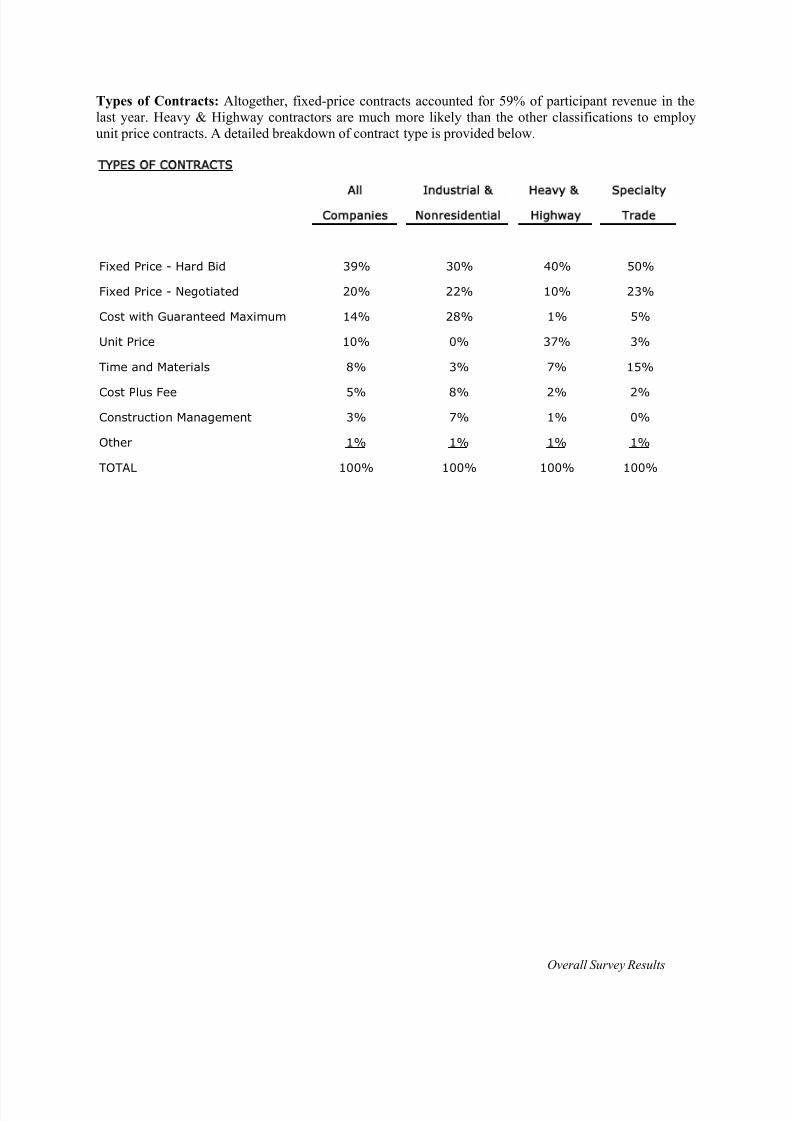
8/13/2019 2005 Financial Survey
http://slidepdf.com/reader/full/2005-financial-survey 80/284
Overall Survey Results
Types of Contracts: Altogether, fixed-price contracts accounted for 59% of participant revenue in thelast year. Heavy & Highway contractors are much more likely than the other classifications to employunit price contracts. A detailed breakdown of contract type is provided below.
TYPES OF CONTRACTS
All Industrial & Heavy & Specialty
Companies Nonresidential Highway Trade
Fixed Price - Hard Bid 39% 30% 40% 50%
Fixed Price - Negotiated 20% 22% 10% 23%
Cost with Guaranteed Maximum 14% 28% 1% 5%
Unit Price 10% 0% 37% 3%
Time and Materials 8% 3% 7% 15%
Cost Plus Fee 5% 8% 2% 2%
Construction Management 3% 7% 1% 0%
Other 1% 1% 1% 1%
TOTAL 100% 100% 100% 100%
8/13/2019 2005 Financial Survey
http://slidepdf.com/reader/full/2005-financial-survey 81/284
Overall Survey Results
Selected Financial Data
This section of the survey analyzes the composite financial statement data and financial ratios for the 532companies that provided complete financial information and were included as participants for the most
recent year-end. Separate sections of the survey are devoted to analysis of the composite financialstatements and ratios for each classification of contractor. This section provides insight on the industry asa whole. Conclusions on individual industry classifications may differ, so it is advisable to also examinethe results from the section relevant to your business. It should also be noted that the number and mix ofrespondents for each year’s survey affect trends in financial statement information.
Composite Balance Sheets
Liquidity remained constant in 2005. The Current and Quick Ratios were essentially unchanged for2003 and 2004 at 1.3 and 1.2, respectively.
Leverage essentially remained constant in 2005. Debt to equity was at 2.3.
Efficiency increased in 2005. Overall, the operating cycle was shortened by almost a day in 2005 to 29.1days.
The average asset size for participants in the 2005 survey was $33.1M. This is an increase from the$28.2M reported in 2004.
Net Receivables are the largest single asset, accounting for 52.8% of total assets. This is a slight increasefrom 2004 (51.6%).
Current liabilities increased as compared to 2004 (61.7% versus 58.3%). Noncurrent liabilities decreasedand total liabilities increased to 69.4%, from 68.4% in 2004.
Retained earnings continue to be the most prevalent form of Net Worth. Given that private companiesdominate within the participant body, this result is not surprising.
Composite Statement of Earnings
Profitability was similar to 2004. The net margin before income taxes remained constant at 1.8%.
ROA and ROE both remained consistent. ROA went from 5.3% in 2004 to 5.2% in 2005. ROE went from17.0% in 2004 to 16.9% in 2005.
Total revenue was higher by about $13.8M in 2005. SG&A expenses decreased slightly to 6.1%, butdirect costs increased slightly to 92.2%.
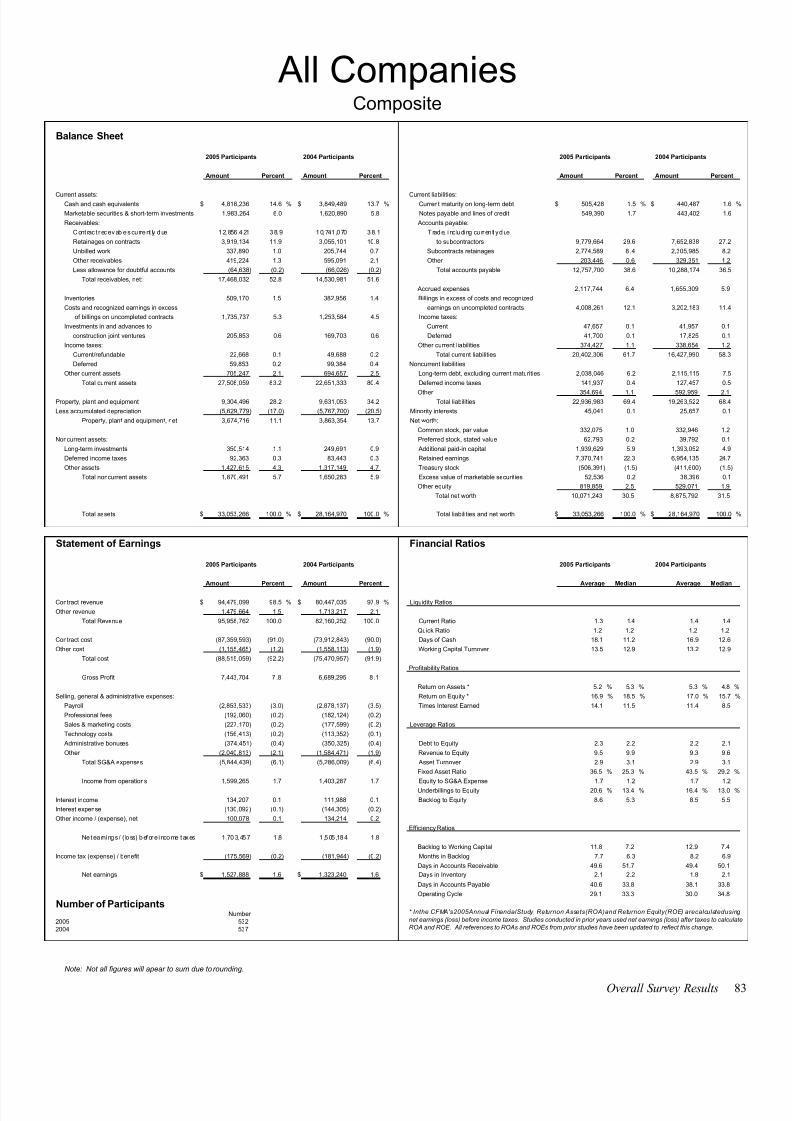
8/13/2019 2005 Financial Survey
http://slidepdf.com/reader/full/2005-financial-survey 82/284
Balance Sheet
2005 Participants 2004 Participants 2005 Participants 2004 Participants
Amount Percent Amount Percent Amount Percent Amount Percent
Current assets: Current liabilities:Cash and cash equivalents $ 4,818,236 14.6 % $ 3,849,489 13.7 % Current maturity on long-term debt $ 505,428 1.5 % $ 440,487 1.6 %
Marketable securities & short-term investments 1,983,264 6.0 1,620,890 5.8 Notes payable and lines of credit 549,390 1.7 443,402 1.6
Receivables: Accounts payable:
Cont rac t r eceivab les cu rrent ly due 12,856 ,421 38.9 10,741 ,070 38.1 T rade, i nc luding cu rren tl y due
Retainages on contracts 3,919,134 11.9 3,055,101 10.8 to subcontractors 9,779,664 29.6 7,652,838 27.2
Unbilled work 337,890 1.0 205,744 0.7 Subcontracts retainages 2,774,589 8 .4 2,305,985 8.2
Other receivables 419,224 1.3 595,091 2.1 Other 203,446 0.6 329,351 1.2
Less allowance for doubtful accounts (64,638) (0.2) (66,026) (0.2) Total accounts payable 12,757,700 38.6 10,288,174 36.5
Total receivables, net: 17,468,032 52.8 14,530,981 51.6
Accrued expenses 2,117,744 6.4 1,655,309 5.9
Inventories 509,170 1.5 382,956 1.4 Billings in excess of costs and recognized
Costs and recognized earnings in excess earnings on uncompleted contracts 4,008,261 12.1 3,202,183 11.4
of billings on uncompleted contracts 1,735,737 5.3 1,253,584 4.5 Income taxes:
Investments in and advances to Current 47,657 0.1 41,957 0.1
construction joint ventures 205,853 0.6 169,703 0.6 Deferred 41,700 0.1 17,825 0.1
Income taxes: Other current liabilities 374,427 1.1 338,654 1.2
Current/refundable 22,668 0.1 49,688 0.2 Total current liabilities 20,402,306 61.7 16,427,990 58.3
Deferred 59,853 0.2 99,384 0.4 Noncurrent liabilities
Other current assets 705,247 2.1 694,657 2.5 Long-term debt, excluding current maturities 2,038,046 6.2 2,115,115 7.5
Total current assets 27,508,059 83.2 22,651,333 80.4 Deferred income taxes 141,937 0.4 127,457 0.5
Other 354,694 1.1 592,959 2.1Property, plant and equipment 9,304,496 28.2 9,631,053 34.2 Total liabilities 22,936,983 69.4 19,263,522 68.4
Less accumulated depreciation (5,629,779) (17.0) (5,767,700) (20.5) Minority interests 45,041 0.1 25,657 0.1
Property, plant and equipment, net 3,674,716 11.1 3,863,354 13.7 Net worth:
Common stock, par value 332,075 1.0 332,946 1.2
Noncurrent assets: Preferred stock, stated value 62,793 0.2 39,792 0.1
Long-term investments 350,514 1.1 249,691 0.9 Additional paid-in capital 1,939,629 5.9 1,393,052 4.9
Deferred income taxes 92,363 0.3 83,443 0.3 Retained earnings 7,370,741 22.3 6,954,135 24.7
Other assets 1,427,615 4.3 1,317,149 4.7 Treasury stock (506,391) (1.5) (411,600) (1.5)
Total noncurrent assets 1,870,491 5.7 1,650,283 5.9 Excess value of marketable securities 52,536 0.2 38,396 0.1
Other equity 819,859 2.5 529,071 1.9
Total net worth 10,071,243 30.5 8,875,792 31.5
Total assets $ 33,053,266 100.0 % $ 28,164,970 100.0 % Total liabilities and net worth $ 33,053,266 100.0 % $ 28,164,970 100.0 %
Statement of Earnings Financial Ratios
2005 Participants 2004 Participants 2005 Participants 2004 Participants
Amount Percent Amount Percent Average Median Average Median
Contract revenue $ 94,479,099 98.5 % $ 80,447,035 97.9 % Liquidity Ratios
Other revenue 1,479,664 1.5 1,713,217 2.1
Total Revenue 95,958,762 100.0 82,160,252 100.0 Current Ratio 1.3 1.4 1.4 1.4
Quick Ratio 1.2 1.2 1.2 1.2
Contract cost (87,359,593) (91.0) (73,912,843) (90.0) Days of Cash 18.1 11.2 16.9 12.6
Other cost (1,155,465) (1.2) (1,558,113) (1.9) Working Capital Turnover 13.5 12.9 13.2 12.9
Total cost (88,515,059) (92.2) (75,470,957) (91.9)
Profitability Ratios
Gross Profit 7,443,704 7.8 6,689,295 8.1
Return on Assets * 5.2 % 5.3 % 5.3 % 4.8 %
Selling, general & administrative expenses: Return on Equity * 16.9 % 18.5 % 17.0 % 15.7 %
Payroll (2,853,533) (3.0) (2,878,137) (3.5) Times Interest Earned 14.1 11.5 11.4 8.5
Professional fees (192,060) (0.2) (182,124) (0.2)
Sales & marketing costs (227,170) (0.2) (177,599) (0.2) Leverage Ratios
Technology costs (156,413) (0.2) (113,352) (0.1)
Administrative bonuses (374,451) (0.4) (350,325) (0.4) Debt to Equity 2.3 2.2 2.2 2.1
Other (2,040,813) (2.1) (1,584,471) (1.9) Revenue to Equity 9.5 9.9 9.3 9.6
Total SG&A expenses (5,844,439) (6.1) (5,286,009) (6.4) Asset Turnover 2.9 3.1 2.9 3.1
Fixed Asset Ratio 36.5 % 25.3 % 43.5 % 29.2 %
Income from operations 1,599,265 1.7 1,403,287 1.7 Equity to SG&A Expense 1.7 1.2 1.7 1.2
Underbillings to Equity 20.6 % 13.4 % 16.4 % 13.0 %
Interest income 134,207 0.1 111,988 0.1 Backlog to Equity 8.6 5.3 8.5 5.5
Interest expense (130,092) (0.1) (144,305) (0.2)
Other income / (expense), net 100,078 0.1 134,214 0.2
Efficiency Ratios
Ne t ea rnings / ( loss) before i ncome taxes 1 ,703,457 1 .8 1 ,505 ,184 1 .8
Backlog to Working Capital 11.8 7.2 12.9 7.4
Income tax (expense) / benefit (175,569) (0.2) (181,944) (0.2) Months in Backlog 7.7 6.3 8.2 6.9
Days in Accounts Receivable 49.6 51.7 49.4 50.1
Net earnings $ 1,527,888 1.6 $ 1,323,240 1.6 Days in Inventory 2.1 2.2 1.8 2.1
Days in Accounts Payable 40.6 33.8 38.1 33.8
Operating Cycle 29.1 33.3 30.0 34.8
Number of ParticipantsNumber
2005 5322004 537
Note: Not all figures will apear to sum due to rounding.
Composite
All Companies
* Inthe CFMA's2005Annual FinancialStudy, Returnon Assets(ROA)and Returnon Equity(ROE) arecalculatedusing
net earnings (loss) before income taxes. Studies conducted in prior years used net earnings (loss) after taxes to calculate
ROA and ROE. All references to ROAs and ROEs from prior studies have been updated to reflect this change.
Overall Survey Results 8
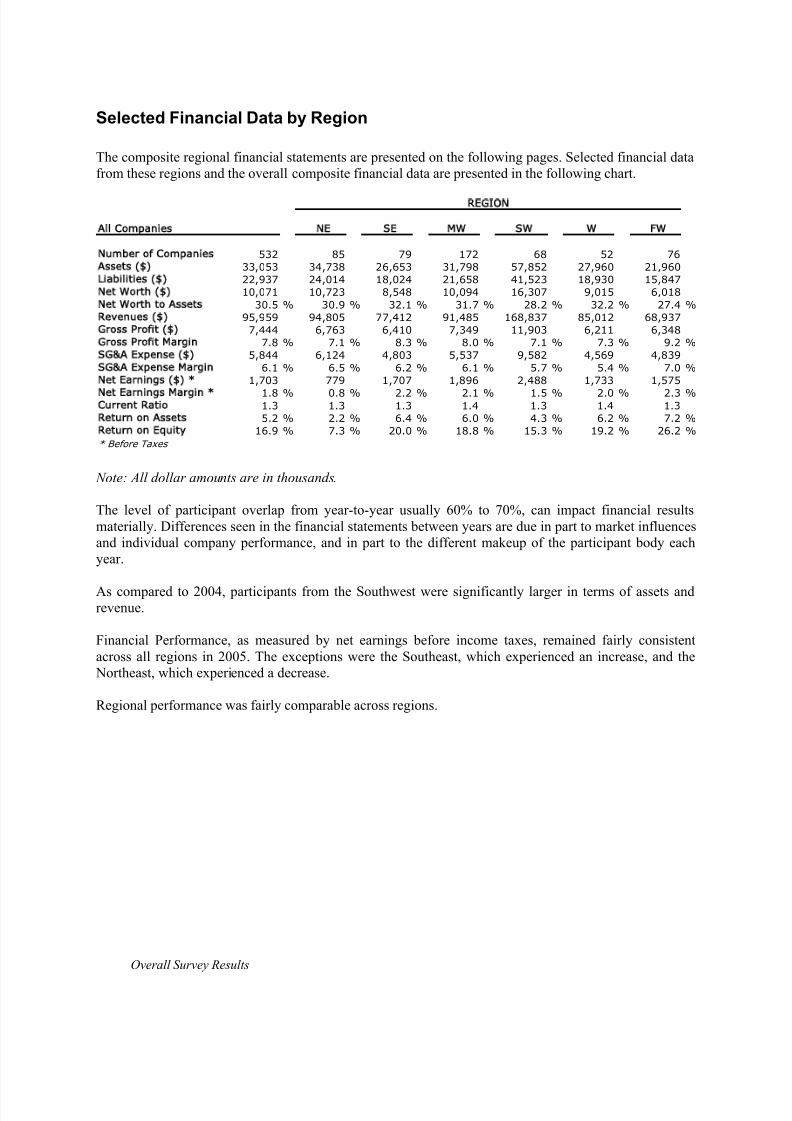
8/13/2019 2005 Financial Survey
http://slidepdf.com/reader/full/2005-financial-survey 83/284
Overall Survey Results
Selected Financial Data by Region
The composite regional financial statements are presented on the following pages. Selected financial datafrom these regions and the overall composite financial data are presented in the following chart.
All Companies NE SE MW SW W FW
Number of Companies 532 85 79 172 68 52 76
Assets ( ) 33,053 34,738 26,653 31,798 57,852 27,960 21,960
Liabilities ( ) 22,937 24,014 18,024 21,658 41,523 18,930 15,847
Net Worth ( ) 10,071 10,723 8,548 10,094 16,307 9,015 6,018
Net Worth to A ssets 30.5 % 30.9 % 32.1 % 31.7 % 28.2 % 32.2 % 27.4 %
Revenues ( ) 95,959 94,805 77,412 91,485 168,837 85,012 68,937
Gross Profit ( ) 7,444 6,763 6,410 7,349 11,903 6,211 6,348
Gross Profit Margin 7.8 % 7.1 % 8.3 % 8.0 % 7.1 % 7.3 % 9.2 %
SG&A Expense ( ) 5,844 6,124 4,803 5,537 9,582 4,569 4,839
SG&A Expense Margin 6.1 % 6.5 % 6.2 % 6.1 % 5.7 % 5.4 % 7.0 %
Net Earnings ( ) * 1,703 779 1,707 1,896 2,488 1,733 1,575
Net Earnings Margin * 1.8 % 0.8 % 2.2 % 2.1 % 1.5 % 2.0 % 2.3 %Current Ratio 1.3 1.3 1.3 1.4 1.3 1.4 1.3
Return on Assets 5.2 % 2.2 % 6.4 % 6.0 % 4.3 % 6.2 % 7.2 %
Return on Equity 16.9 % 7.3 % 20.0 % 18.8 % 15.3 % 19.2 % 26.2 %
* Before Taxes
REGION
Note: All dollar amounts are in thousands.
The level of participant overlap from year-to-year usually 60% to 70%, can impact financial resultsmaterially. Differences seen in the financial statements between years are due in part to market influencesand individual company performance, and in part to the different makeup of the participant body eachyear.
As compared to 2004, participants from the Southwest were significantly larger in terms of assets andrevenue.
Financial Performance, as measured by net earnings before income taxes, remained fairly consistentacross all regions in 2005. The exceptions were the Southeast, which experienced an increase, and the Northeast, which experienced a decrease.
Regional performance was fairly comparable across regions.

8/13/2019 2005 Financial Survey
http://slidepdf.com/reader/full/2005-financial-survey 84/284
Balance Sheet
2005 Participants 2004 Participants 2005 Participants 2004 Participants
Amount Percent Amount Percent Amount Percent Amount Percent
Current assets: Current liabilities:
Cash and cash equivalents $ 5,189,627 14.9 % $ 3,138,080 12.0 % Current maturity on long-term debt $ 1,044,210 3.0 % $ 595,474 2.3 %Marketable securities & short-term investments 934,113 2.7 959,836 3.7 Notes payable and lines of credit 600,137 1.7 614,588 2.3
Receivables: Accounts payable:
Contr act r ecei va ble s c urr ent ly du e 13, 141, 613 3 7.8 9 ,628 ,84 5 3 6.7 Tr ade, inc lu din g c urr ent ly due
Retainages on contracts 3,712,487 10.7 2,466,209 9.4 to subcontractors 9,931,767 28.6 6,861,630 26.1
Unbilled work 308,327 0.9 127,767 0.5 Subcontracts retainages 2,905,496 8.4 1,019,644 3.9
Other receivables 224,640 0.6 918,743 3.5 Other 303,833 0.9 99,636 0.4
Less allowance for doubtful accounts (107,594) (0.3) (117,487) (0.4) Total accounts payable 13,141,096 37.8 7,980,910 30.4
Total receivables, net: 17,279,472 49.7 13,024,078 49.6
Accrued expenses 2,079,610 6.0 1,328,551 5.1
Inventories 992,363 2.9 459,377 1.8 Billings in excess of costs and recognized
Costs and recognized earnings in excess earnings on uncompleted contracts 3,555,846 10.2 2,941,134 11.2
of billings on uncompleted contracts 1,791,944 5.2 1,396,509 5.3 Income taxes:
Investments in and advances to Current 46,441 0.1 94,187 0.4
construction joint ventures 209,730 0.6 232,815 0.9 Deferred 54,265 0.2 38,799 0.1
Income taxes: Other current liabilities 115,813 0.3 338,293 1.3
Current/refundable 27,254 0.1 26,131 0.1 Total current liabilities 20,637,417 59.4 13,931,935 53.1
Deferred 197,639 0.6 99,140 0.4 Noncurrent liabilities
Other current assets 743,985 2.1 588,365 2.2 Long-term debt, excluding current maturities 2,710,541 7.8 1,972,088 7.5
Total current assets 27,366,126 78.8 19,924,332 75.9 Deferred income taxes 287,902 0.8 249,132 0.9
Other 377,883 1.1 632,931 2.4
Property, plant and equipment 9,167,489 26.4 11,527,528 43.9 Total liabilities 24,013,743 69.1 16,786,086 64.0
Less accumulated depreciation (5,471,325) (15.8) (7,480,334) (28.5) Minority interests 721 0.0 2,149 0.0
Property, plant and equipment, net 3,696,163 10.6 4,047,194 15.4 Net worth:
Common stock, par value 133,795 0.4 222,024 0.8
Noncurrent assets: Preferred stock, stated value 20,285 0.1 66,738 0.3
Long-term investments 881,144 2.5 351,820 1.3 Additional paid-in capital 4,573,251 13.2 3,362,871 12.8
Deferred income taxes 90,943 0.3 32,291 0.1 Retained earnings 6,145,931 17.7 6,188,544 23.6
Other assets 2,703,250 7.8 1,892,271 7.2 Treasury stock (405,859) (1.2) (412,200) (1.6)
Total noncurrent assets 3,675,337 10.6 2,276,382 8.7 Excess value of marketable securities 9,643 0.0 11,917 0.0
Other equity 246,116 0.7 19,780 0.1
Total net worth 10,723,162 30.9 9,459,673 36.0
Total assets $ 34,737,627 100.0 % $ 26,247,908 100.0 % Total liabilities and net worth $ 34,737,627 100.0 % $ 26,247,908 100.0 %
Statement of Earnings Financial Ratios
2005 Participants 2004 Participants 2005 Participants 2004 Participants
Amount Percent Amount Percent Average Median Average Median
Contract revenue $ 93,394,134 98.5 % $ 66,609,515 98.6 % Liquidity Ratios
Other revenue 1,410,896 1.5 974,354 1.4
Total Revenue 94,805,029 100.0 67,583,869 100.0 Current Ratio 1.3 1.4 1.4 1.4
Quick Ratio 1.1 1.2 1.2 1.2
Contract cost (86,884,191) (91.6) (60,418,682) (89.4) Days of Cash 19.7 11.1 16.7 11.8
Other cost (1,158,086) (1.2) (750,397) (1.1) Working Capital Turnover 14.1 12.0 11.3 11.0
Total cost (88,042,277) (92.9) (61,169,079) (90.5)
Profitability Ratios
Gross Profit 6,762,753 7.1 6,414,791 9.5
Return on Assets * 2.2 % 4.4 % 4.8 % 3.7 %
Selling, general & administrative expenses: Return on Equity * 7.3 % 15.3 % 13.3 % 12.0 %
Payroll (3,126,625) (3.3) (2,736,367) (4.0) Times Interest Earned 6.0 9.5 10.3 8.1
Professional fees (193,256) (0.2) (171,325) (0.3)
Sales & marketing costs (355,981) (0.4) (159,492) (0.2) Leverage Ratios
Technology costs (212,300) (0.2) (86,722) (0.1)
Administrative bonuses (384,973) (0.4) (301,378) (0.4) Debt to Equity 2.2 2.5 1.8 2.1
Other (1,850,456) (2.0) (1,786,797) (2.6) Revenue to Equity 8.8 9.6 7.1 8.4
Total SG&A expenses (6,123,591) (6.5) (5,242,080) (7.8) Asset Turnover 2.7 2.9 2.6 2.8
Fixed Asset Ratio 34.5 % 19.6 % 42.8 % 22.7 %
Income from operations 639,161 0.7 1,172,711 1.7 Equity to SG&A Expense 1.8 1.4 1.8 1.3
Underbillings to Equity 19.6 % 13.1 % 16.1 % 13.6 %
Interest income 113,373 0.1 55,348 0.1 Backlog to Equity 11.2 6.4 8.9 4.9
Interest expense (156,519) (0.2) (135,534) (0.2)
Other income / (expense), net 183,241 0.2 166,096 0.2
Efficiency Ratios
Net ear ni ngs / ( los s) bef or e i nco me t axes 779, 257 0. 8 1 ,25 8,62 1 1. 9
Backlog to Working Capital 15.3 9.1 12.6 7.2
Income tax (expense) / benefit (316,641) (0.3) (180,165) (0.3) Months in Backlog 8.6 8.0 9.4 6.9
Days in Accounts Receivable 50.3 55.6 55.6 57.8
Net earnings $ 462,615 0.5 % $ 1,078,456 1.6 % Days in Inventory 4.1 2.8 2.7 2.2
Days in Accounts Payable 41.9 38.3 41.0 37.2
Operating Cycle 32.3 37.3 34.0 39.1
Number of Participants
2005 852004 89
Note: Not all figures will apear to sum due to rounding.
All CompaniesNortheast Region
* In theCFMA's 2005 Annual Financial Study, Returnon Assets(ROA)and Returnon Equity (ROE) are calculated using
net earnings (loss) before income taxes. Studies conducted in prior years used net earnings (loss) after taxes to
calculate ROA and ROE. All references to ROAs and ROEs from prior studies have been updated to reflect this change.
Overall Survey Results

8/13/2019 2005 Financial Survey
http://slidepdf.com/reader/full/2005-financial-survey 85/284
Balance Sheet
2005 Participants 2004 Participants 2005 Participants 2004 Participants
Amount Percent Amount Percent Amount Percent Amount Percent
Current assets: Current liabilities:
Cash and cash equivalents $ 3,386,402 12.7 % $ 3,629,709 11.5 % Current maturity on long-term debt $ 334,667 1.3 % $ 604,058 1.9 %
Marketable securities & short-term investments 1,962,574 7.4 1,594,893 5.1 Notes payable and lines of credit 219,896 0.8 215,126 0.7
Receivables: Accounts payable:
Contr act r ecei va ble s c urr ent ly du e 11, 001, 051 4 1.3 11, 861, 113 3 7.6 Tr ade, inc lu din g c urr ent ly due
Retainages on contracts 3,065,484 11.5 3,490,908 11.1 to subcontractors 7,299,332 27.4 7,397,143 23.5
Unbilled work 238,613 0.9 304,621 1.0 Subcontracts retainages 2,155,337 8.1 2,348,515 7.4
Other receivables 254,197 1.0 670,377 2.1 Other 84,222 0.3 467,930 1.5
Less allowance for doubtful accounts (53,901) (0.2) (64,289) (0.2) Total accounts payable 9,538,891 35.8 10,213,588 32.4
Total receivables, net: 14,505,444 54.4 16,262,731 51.6
Accrued expenses 1,404,809 5.3 1,817,960 5.8
Inventories 372,762 1.4 414,145 1.3 Billings in excess of costs and recognized
Costs and recognized earnings in excess earnings on uncompleted contracts 4,571,795 17.2 4,401,052 14.0
of billings on uncompleted contracts 1,232,820 4.6 1,426,189 4.5 Income taxes:
Investments in and advances to Current 77,397 0.3 6,400 0.0
construction joint ventures 39,536 0.1 88,752 0.3 Deferred 21,485 0.1 23,608 0.1
Income taxes: Other current liabilities 192,689 0.7 395,188 1.3
Current/refundable 22,938 0.1 147,438 0.5 Total current liabilities 16,361,628 61.4 17,676,980 56.0
Deferred 9,600 0.0 165,863 0.5 Noncurrent liabilities
Other current assets 436,499 1.6 718,322 2.3 Long-term debt, excluding current maturities 1,188,341 4.5 3,762,398 11.9
Total current assets 21,968,574 82.4 24,448,042 77.5 Deferred income taxes 182,576 0.7 196,436 0.6
Other 291,415 1.1 601,496 1.9
Property, plant and equipment 8,582,996 32.2 10,860,095 34.4 Total liabilities 18,023,961 67.6 22,237,310 70.5
Less accumulated depreciation (4,940,431) (18.5) (6,091,544) (19.3) Minority interests 81,310 0.3 112,786 0.4
Property, plant and equipment, net 3,642,565 13.7 4,768,551 15.1 Net worth:
Common stock, par value 221,664 0.8 562,702 1.8
Noncurrent assets: Preferred stock, stated value 3,147 0.0 120,199 0.4
Long-term investments 94,600 0.4 516,128 1.6 Additional paid-in capital 581,625 2.2 972,197 3.1
Deferred income taxes 10,266 0.0 181,485 0.6 Retained earnings 5,827,312 21.9 6,224,170 19.7
Other assets 937,244 3.5 1,629,324 5.2 Treasury stock (358,725) (1.3) (268,482) (0.9)
Total noncurrent assets 1,042,111 3.9 2,326,937 7.4 Excess value of marketable securities 196,485 0.7 118,761 0.4
Other equity 2,076,469 7.8 1,463,888 4.6
Total net worth 8,547,979 32.1 9,193,434 29.1
Total assets $ 26,653,249 100.0 % $ 31,543,530 100.0 % Total liabilities and net worth $ 26,653,249 100.0 % $ 31,543,530 100.0 %
Statement of Earnings Financial Ratios
2005 Participants 2004 Participants 2005 Participants 2004 Participants
Amount Percent Amount Percent Average Median Average Median
Contract revenue $ 75,512,574 97.5 % $ 90,120,843 95.8 % Liquidity Ratios
Other revenue 1,899,321 2.5 3,936,325 4.2
Total Revenue 77,411,895 100.0 94,057,167 100.0 Current Ratio 1.3 1.4 1.4 1.5
Quick Ratio 1.2 1.3 1.2 1.2
Contract cost (69,760,321) (90.1) (83,096,583) (88.3) Days of Cash 15.7 12.2 13.9 14.6
Other cost (1,241,455) (1.6) (3,105,870) (3.3) Working Capital Turnover 13.8 12.2 13.9 12.6
Total cost (71,001,775) (91.7) (86,202,453) (91.6)
Profitability Ratios
Gross Profit 6,410,120 8.3 7,854,714 8.4
Return on Assets * 6.4 % 5.0 % 4.4 % 3.9 %
Selling, general & administrative expenses: Return on Equity * 20.0 % 13.8 % 15.2 % 11.9 %
Payroll (2,192,808) (2.8) (3,637,785) (3.9) Times Interest Earned 17.6 14.3 7.9 13.6
Professional fees (145,509) (0.2) (218,773) (0.2)
Sales & marketing costs (136,225) (0.2) (220,150) (0.2) Leverage Ratios
Technology costs (114,394) (0.1) (170,225) (0.2)
Administrative bonuses (279,600) (0.4) (349,968) (0.4) Debt to Equity 2.1 2.1 2.4 1.9
Other (1,934,543) (2.5) (1,928,881) (2.1) Revenue to Equity 9.1 9.5 10.2 9.8
Total SG&A expenses (4,803,080) (6.2) (6,525,783) (6.9) Asset Turnover 2.9 3.0 3.0 3.2
Fixed Asset Ratio 42.6 % 24.4 % 51.9 % 29.8 %
Income from operations 1,607,040 2.1 1,328,931 1.4 Equity to SG&A Expense 1.8 1.2 1.4 1.2
Underbillings to Equity 17.2 % 10.5 % 18.8 % 10.8 %
Interest income 101,107 0.1 85,287 0.1 Backlog to Equity 6.9 4.8 7.9 6.6
Interest expense (102,749) (0.1) (201,993) (0.2)Other income / (expense), net 101,376 0.1 185,119 0.2
Efficiency Ratios
Net ear ni ngs / ( los s) bef or e i nco me t axes 1, 706 ,77 4 2. 2 1 ,39 7,34 4 1. 5
Backlog to Working Capital 11.0 6.0 12.7 7.7
Income tax (expense) / benefit (173,383) (0.2) (149,322) (0.2) Months in Backlog 7.4 6.2 8.0 7.3
Days in Accounts Receivable 52.1 49.4 47.7 45.8
Net earnings $ 1,533,391 2.0 % $ 1,248,022 1.3 % Days in Inventory 1.9 2.1 1.7 2.1
Days in Accounts Payable 37.4 34.6 32.8 31.6
Operating Cycle 32.3 32.4 30.5 38.0
Number of ParticipantsNumber
2005 792004 94
Overall Survey Results
Note: Not all figures will apear to sum due to rounding.
* In theCFMA's 2005 Annual Financial Study, Returnon Assets(ROA)and Returnon Equity (ROE) are calculated using
net earnings (loss) before income taxes. Studies conducted in prior years used net earnings (loss) after taxes to
calculate ROA and ROE. All references to ROAs and ROEs from prior studies have been updated to reflect this change.
All CompaniesSoutheast Region

8/13/2019 2005 Financial Survey
http://slidepdf.com/reader/full/2005-financial-survey 86/284
Balance Sheet
2005 Participants 2004 Participants 2005 Participants 2004 Participants
Amount Percent Amount Percent Amount Percent Amount Percent
Current assets: Current liabilities:
Cash and cash equivalents $ 4,540,702 14.3 % $ 3,316,183 14.5 % Current maturity on long-term debt $ 502,694 1.6 % $ 323,641 1.4 %
Marketable securities & short-term investments 885,294 2.8 616,357 2.7 Notes payable and lines of credit 381,144 1.2 477,744 2.1
Receivables: Accounts payable:
Contr act r ecei va ble s c urr ent ly du e 11, 924, 113 3 7.5 8 ,682 ,59 4 3 8.0 Tr ade, inc lu din g c urr ent ly due
Retainages on contracts 3,648,757 11.5 2,230,856 9.8 to subcontractors 9,475,438 29.8 5,868,544 25.7
Unbilled work 509,445 1.6 107,601 0.5 Subcontracts retainages 2,048,420 6.4 1,757,965 7.7
Other receivables 488,651 1.5 408,272 1.8 Other 184,122 0.6 147,056 0.6
Less allowance for doubtful accounts (54,421) (0.2) (30,988) (0.1) Total accounts payable 11,707,980 36.8 7,773,565 34.0
Total receivables, net: 16,516,545 51.9 11,398,335 49.9
Accrued expenses 2,005,042 6.3 1,528,537 6.7
Inventories 655,000 2.1 504,065 2.2 Billings in excess of costs and recognized
Costs and recognized earnings in excess earnings on uncompleted contracts 3,475,233 10.9 2,211,256 9.7
of billings on uncompleted contracts 1,754,277 5.5 1,127,361 4.9 Income taxes:
Investments in and advances to Current 40,392 0.1 35,680 0.2
construction joint ventures 198,850 0.6 160,697 0.7 Deferred 6,722 0.0 2,645 0.0
Income taxes: Other current liabilities 265,035 0.8 198,899 0.9
Current/refundable 17,178 0.1 20,459 0.1 Total current liabilities 18,384,242 57.8 12,551,968 54.9
Deferred 23,829 0.1 22,199 0.1 Noncurrent liabilities
Other current assets 648,946 2.0 625,321 2.7 Long-term debt, excluding current maturities 2,820,143 8.9 2,133,241 9.3
Total current assets 25,240,618 79.4 17,790,977 77.8 Deferred income taxes 60,143 0.2 57,905 0.3
Other 393,200 1.2 232,114 1.0
Property, plant and equipment 11,294,780 35.5 9,959,851 43.6 Total liabilities 21,657,729 68.1 14,975,228 65.5
Less accumulated depreciation (6,876,027) (21.6) (6,115,930) (26.8) Minority interests 46,116 0.1 4,352 0.0
Property, plant and equipment, net 4,418,753 13.9 3,843,921 16.8 Net worth:
Common stock, par value 264,611 0.8 288,881 1.3
Noncurrent assets: Preferred stock, stated value 156,595 0.5 0 0.0
Long-term investments 434,564 1.4 109,005 0.5 Additional paid-in capital 1,221,636 3.8 867,738 3.8
Deferred income taxes 15,266 0.0 21,795 0.1 Retained earnings 8,389,924 26.4 6,994,485 30.6
Other assets 1,688,390 5.3 1,091,401 4.8 Treasury stock (284,170) (0.9) (499,364) (2.2)
Total noncurrent assets 2,138,220 6.7 1,222,201 5.3 Excess value of marketable securities 39,471 0.1 22,671 0.1
Other equity 305,679 1.0 203,110 0.9
Total net worth 10,093,747 31.7 7,877,520 34.5
Total assets $ 31,797,592 100.0 % $ 22,857,099 100.0 % Total liabilities and net worth $ 31,797,592 100.0 % $ 22,857,099 100.0 %
Statement of Earnings Financial Ratios
2005 Participants 2004 Participants 2005 Participants 2004 Participants
Amount Percent Amount Percent Average Median Average Median
Contract revenue $ 90,349,443 98.8 % $ 65,565,281 98.7 % Liquidity Ratios
Other revenue 1,135,399 1.2 857,702 1.3
Total Revenue 91,484,842 100.0 66,422,983 100.0 Current Ratio 1.4 1.4 1.4 1.4
Quick Ratio 1.2 1.2 1.2 1.2
Contract cost (83,227,572) (91.0) (59,339,780) (89.3) Days of Cash 17.9 8.8 18.0 10.0
Other cost (908,739) (1.0) (1,312,572) (2.0) Working Capital Turnover 13.3 12.6 12.7 13.5
Total cost (84,136,311) (92.0) (60,652,352) (91.3)
Profitability Ratios
Gross Profit 7,348,531 8.0 5,770,632 8.7
Return on Assets * 6.0 % 5.7 % 5.8 % 5.6 %
Selling, general & administrative expenses: Return on Equity * 18.8 % 20.3 % 17.0 % 17.0 %
Payroll (2,624,364) (2.9) (2,448,570) (3.7) Times Interest Earned 14.7 11.1 12.2 7.9
Professional fees (158,875) (0.2) (139,927) (0.2)
Sales & marketing costs (225,329) (0.2) (171,400) (0.3) Leverage Ratios
Technology costs (131,998) (0.1) (83,847) (0.1)
Administrative bonuses (427,224) (0.5) (313,918) (0.5) Debt to Equity 2.1 2.1 1.9 2.1
Other (1,969,257) (2.2) (1,314,479) (2.0) Revenue to Equity 9.1 9.9 8.4 10.0
Total SG&A expenses (5,537,046) (6.1) (4,472,141) (6.7) Asset Turnover 2.9 3.2 2.9 3.2
Fixed Asset Ratio 43.8 % 28.9 % 48.8 % 37.5 %
Income from operations 1,811,485 2.0 1,298,491 2.0 Equity to SG&A Expense 1.8 1.2 1.8 1.2
Underbillings to Equity 22.4 % 13.7 % 15.7 % 14.0 %
Interest income 74,513 0.1 104,356 0.2 Backlog to Equity 8.1 4.0 8.0 5.1
Interest expense (138,721) (0.2) (119,615) (0.2)Other income / (expense), net 148,963 0.2 52,252 0.1
Efficiency Ratios
Net ear ni ngs / ( los s) bef or e i nco me t axes 1, 896 ,24 0 2. 1 1 ,33 5,48 4 2. 0
Backlog to Working Capital 9.1 5.1 11.0 8.1
Income tax (expense) / benefit (143,515) (0.2) (92,582) (0.1) Months in Backlog 6.5 5.4 7.8 6.5
Days in Accounts Receivable 48.6 50.9 49.1 50.4
Net earnings $ 1,752,724 1.9 % $ 1,242,902 1.9 % Days in Inventory 2.8 2.2 3.0 2.4
Days in Accounts Payable 41.3 31.4 35.7 33.7
Operating Cycle 28.0 32.5 34.4 31.3
Number of ParticipantsNumber
2005 1722004 154
Note: Not all figures will apear to sum due to rounding.
Overall Survey Results
All Companies
* In theCFMA's 2005 Annual Financial Study, Returnon Assets(ROA)and Returnon Equity (ROE) are calculated using
net earnings (loss) before income taxes. Studies conducted in prior years used net earnings (loss) after taxes to
calculate ROA and ROE. All references to ROAs and ROEs from prior studies have been updated to reflect this change.
Midwest Region

8/13/2019 2005 Financial Survey
http://slidepdf.com/reader/full/2005-financial-survey 87/284
Balance Sheet
2005 Participants 2004 Participants 2005 Participants 2004 Participants
Amount Percent Amount Percent Amount Percent Amount Percent
Current assets: Current liabilities:
Cash and cash equivalents $ 8,409,302 14.5 % $ 4,601,829 11.1 % Current maturity on long-term debt $ 494,117 0.9 % $ 483,201 1.2 %
Marketable securities & short-term investments 6,980,664 12.1 6,578,589 15.8 Notes payable and lines of credit 1,307,978 2.3 662,183 1.6
Receivables: Accounts payable:
Contr act r ecei va ble s c urr ent ly du e 22, 122, 622 3 8.2 14, 221, 156 3 4.2 Tr ade, inc lu din g c urr ent ly due
Retainages on contracts 7,304,396 12.6 4,688,535 11.3 to subcontractors 17,603,064 30.4 12,454,008 30.0
Unbilled work 242,625 0.4 29,915 0.1 Subcontracts retainages 5,770,879 10.0 3,565,107 8.6
Other receivables 949,805 1.6 515,746 1.2 Other 202,556 0.4 174,983 0.4
Less allowance for doubtful accounts (89,499) (0.2) (108,835) (0.3) Total accounts payable 23,576,500 40.8 16,194,097 39.0
Total receivables, net: 30,529,948 52.8 19,346,518 46.6
Accrued expenses 4,011,558 6.9 1,719,414 4.1
Inventories 286,824 0.5 440,094 1.1 Billings in excess of costs and recognized
Costs and recognized earnings in excess earnings on uncompleted contracts 7,430,938 12.8 4,615,653 11.1
of billings on uncompleted contracts 3,187,803 5.5 1,859,038 4.5 Income taxes:
Investments in and advances to Current 53,224 0.1 28,678 0.1
construction joint ventures 632,409 1.1 80,436 0.2 Deferred 206,567 0.4 7,368 0.0
Income taxes: Other current liabilities 1,249,404 2.2 791,721 1.9
Current/refundable 41,588 0.1 61,891 0.1 Total current liabilities 38,330,286 66.3 24,502,315 59.0
Deferred 43,681 0.1 79,111 0.2 Noncurrent liabilities
Other current assets 1,488,160 2.6 1,048,191 2.5 Long-term debt, excluding current maturities 2,396,653 4.1 1,872,056 4.5
Total current assets 51,600,378 89.2 34,095,697 82.1 Deferred income taxes 172,545 0.3 106,034 0.3
Other 623,478 1.1 1,422,923 3.4
Property, plant and equipment 11,025,984 19.1 12,791,326 30.8 Total liabilities 41,522,961 71.8 27,903,328 67.2
Less accumulated depreciation (6,875,812) (11.9) (7,833,017) (18.9) Minority interests 21,949 0.0 8,370 0.0
Property, plant and equipment, net 4,150,171 7.2 4,958,310 11.9 Net worth:
Common stock, par value 770,461 1.3 358,162 0.9
Noncurrent assets: Preferred stock, stated value 16,324 0.0 5,147 0.0
Long-term investments 147,130 0.3 291,159 0.7 Additional paid-in capital 2,384,210 4.1 1,118,856 2.7
Deferred income taxes 434,272 0.8 283,344 0.7 Retained earnings 13,062,165 22.6 11,956,271 28.8
Other assets 1,520,176 2.6 1,903,955 4.6 Treasury stock (2,071,467) (3.6) (1,055,905) (2.5)
Total noncurrent assets 2,101,578 3.6 2,478,457 6.0 Excess value of marketable securities 46,019 0.1 63,378 0.2
Other equity 2,099,506 3.6 1,174,857 2.8
Total net worth 16,307,217 28.2 13,620,765 32.8
Total assets $ 57,852,127 100.0 % $ 41,532,464 100.0 % Total liabilities and net worth $ 57,852,127 100.0 % $ 41,532,464 100.0 %
Statement of Earnings Financial Ratios
2005 Participants 2004 Participants 2005 Participants 2004 Participants
Amount Percent Amount Percent Average Median Average Median
Contract revenue $ 167,671,363 99.3 % $ 110,909,508 97.0 % Liquidity Ratios
Other revenue 1,165,410 0.7 3,372,222 3.0
Total Revenue 168,836,773 100.0 114,281,730 100.0 Current Ratio 1.3 1.3 1.4 1.4
Quick Ratio 1.2 1.2 1.2 1.3
Contract cost (155,984,964) (92.4) (103,300,171) (90.4) Days of Cash 17.9 12.2 14.5 14.9
Other cost (948,536) (0.6) (2,890,753) (2.5) Working Capital Turnover 12.7 15.1 11.9 13.2
Total cost (156,933,500) (92.9) (106,190,925) (92.9)
Profitability Ratios
Gross Profit 11,903,273 7.1 8,090,805 7.1
Return on Assets * 4.3 % 4.2 % 5.3 % 5.3 %
Selling, general & administrative expenses: Return on Equity * 15.3 % 14.2 % 16.3 % 14.5 %
Payroll (4,940,984) (2.9) (3,568,208) (3.1) Times Interest Earned 11.6 10.2 13.9 7.1
Professional fees (424,722) (0.3) (280,551) (0.2)
Sales & marketing costs (221,432) (0.1) (243,681) (0.2) Leverage Ratios
Technology costs (235,145) (0.1) (167,950) (0.1)
Administrative bonuses (383,441) (0.2) (435,622) (0.4) Debt to Equity 2.5 2.5 2.0 1.9
Other (3,375,959) (2.0) (1,622,132) (1.4) Revenue to Equity 10.4 11.3 8.4 8.7
Total SG&A expenses (9,581,682) (5.7) (6,318,144) (5.5) Asset Turnover 2.9 3.0 2.8 3.0
Fixed Asset Ratio 25.4 % 23.0 % 36.4 % 25.2 %
Income from operations 2,321,591 1.4 1,772,661 1.6 Equity to SG&A Expense 1.7 1.3 2.2 1.4
Underbillings to Equity 21.0 % 13.8 % 13.9 % 10.7 %
Interest income 403,415 0.2 285,659 0.2 Backlog to Equity 8.6 5.6 6.8 4.0
Interest expense (235,576) (0.1) (172,210) (0.2)Other income / (expense), net (1,320) (0.0) 333,925 0.3
Efficiency Ratios
Net ear ni ngs / ( los s) bef or e i nco me t axes 2, 488 ,11 0 1. 5 2 ,22 0,03 6 1. 9
Backlog to Working Capital 10.3 8.4 12.8 6.3
Income tax (expense) / benefit (208,050) (0.1) (96,439) (0.1) Months in Backlog 7.7 6.6 6.6 6.2
Days in Accounts Receivable 49.0 50.4 46.1 44.9
Net earnings $ 2,280,060 1.4 % $ 2,123,597 1.9 % Days in Inventory 0.7 2.1 1.5 1.3
Days in Accounts Payable 40.8 35.8 42.8 33.7
Operating Cycle 26.7 32.8 19.3 33.3
Number of ParticipantsNumber
2005 682004 68
Overall Survey Results
Note: Not all figures will apear to sum due to rounding.
Southwest Region
All Companies
* In theCFMA's 2005 Annual Financial Study, Returnon Assets(ROA)and Returnon Equity (ROE) are calculated using
net earnings (loss) before income taxes. Studies conducted in prior years used net earnings (loss) after taxes to
calculate ROA and ROE. All references to ROAs and ROEs from prior studies have been updated to reflect this change.

8/13/2019 2005 Financial Survey
http://slidepdf.com/reader/full/2005-financial-survey 88/284
Balance Sheet
2005 Participants 2004 Participants 2005 Participants 2004 Participants
Amount Percent Amount Percent Amount Percent Amount Percent
Current assets: Current liabilities:
Cash and cash equivalents $ 3,796,021 13.6 % $ 6,584,511 19.1 % Current maturity on long-term debt $ 282,141 1.0 % $ 418,345 1.2 %
Marketable securities & short-term investments 2,681,087 9.6 580,030 1.7 Notes payable and lines of credit 337,975 1.2 333,251 1.0
Receivables: Accounts payable:
Contr act r ecei va ble s c urr ent ly du e 11, 449, 254 4 0.9 13, 730, 078 3 9.8 Tr ade, inc lu din g c urr ent ly due
Retainages on contracts 2,816,181 10.1 4,405,123 12.8 to subcontractors 8,036,225 28.7 12,259,740 3 5.5
Unbilled work 120,232 0.4 550,054 1.6 Subcontracts retainages 2,630,652 9.4 1,896,351 5.5
Other receivables 234,980 0.8 1,158,421 3.4 Other 421,304 1.5 239,070 0.7
Less allowance for doubtful accounts (32,817) (0.1) (32,902) (0.1) Total accounts payable 11,088,181 39.7 14,395,162 41.7
Total receivables, net: 14,587,830 52.2 19,810,774 57.4
Accrued expenses 1,887,045 6.7 2,516,061 7.3
Inventories 285,600 1.0 120,596 0.3 Billings in excess of costs and recognized
Costs and recognized earnings in excess earnings on uncompleted contracts 3,105,489 11.1 4,822,301 14.0
of billings on uncompleted contracts 1,383,777 4.9 873,364 2.5 Income taxes:
Investments in and advances to Current 68,679 0.2 64,433 0.2
construction joint ventures 158,208 0.6 661,243 1.9 Deferred 2,488 0.0 27,166 0.1
Income taxes: Other current liabilities 428,109 1.5 145,657 0.4
Current/refundable 9,753 0.0 24,504 0.1 Total current liabilities 17,200,106 61.5 22,722,377 65.8
Deferred 126,779 0.5 323,714 0.9 Noncurrent liabilities
Other current assets 557,782 2.0 1,044,928 3.0 Long-term debt, excluding current maturities 1,288,767 4.6 1,228,118 3.6
Total current assets 23,586,839 84.4 30,023,663 86.9 Deferred income taxes 222,825 0.8 157,363 0.5
Other 217,908 0.8 1,076,601 3.1
Property, plant and equipment 8,238,622 29.5 7,673,474 22.2 Total liabilities 18,929,607 67.7 25,184,459 72.9
Less accumulated depreciation (4,921,633) (17.6) (4,405,478) (12.8) Minority interests 14,841 0.1 4,114 0.0
Property, plant and equipment, net 3,316,988 11.9 3,267,996 9.5 Net worth:
Common stock, par value 528,985 1.9 152,280 0.4
Noncurrent assets: Preferred stock, stated value 0 0.0 1,634 0.0
Long-term investments 276,840 1.0 136,563 0.4 Additional paid-in capital 2,847,260 10.2 1,514,382 4.4
Deferred income taxes 155,220 0.6 19,490 0.1 Retained earnings 5,718,151 20.5 7,737,378 22.4
Other assets 623,871 2.2 1,088,303 3.2 Treasury stock (240,294) (0.9) (113,092) (0.3)
Total noncurrent assets 1,055,932 3.8 1,244,355 3.6 Excess value of marketable securities 28,857 0.1 5,206 0.0
Other equity 132,351 0.5 49,653 0.1
Total net worth 9,015,311 32.2 9,347,441 27.1
Total assets $ 27,959,758 100.0 % $ 34,536,014 100.0 % Total liabilities and net worth $ 27,959,758 100.0 % $ 34,536,014 100.0 %
Statement of Earnings Financial Ratios
2005 Participants 2004 Participants 2005 Participants 2004 Participants
Amount Percent Amount Percent Average Median Average Median
Contract revenue $ 83,844,806 98.6 % $ 118,224,018 99.1 % Liquidity Ratios
Other revenue 1,167,218 1.4 1,089,905 0.9
Total Revenue 85,012,024 100.0 119,313,923 100.0 Current Ratio 1.4 1.3 1.3 1.3
Quick Ratio 1.2 1.2 1.2 1.2
Contract cost (78,064,965) (91.8) (110,720,536) (92.8) Days of Cash 16.1 9 .5 19.9 11.5
Other cost (736,140) (0.9) (810,453) (0.7) Working Capital Turnover 13.3 15.4 16.3 14.9
Total cost (78,801,105) (92.7) (111,530,989) (93.5)
Profitability Ratios
Gross Profit 6,210,918 7.3 7,782,934 6.5
Return on Assets * 6.2 % 4.1 % 6.5 % 5.8 %
Selling, general & administrative expenses: Return on Equity * 19.2 % 19.2 % 23.9 % 17.1 %
Payroll (2,323,037) (2.7) (2,953,751) (2.5) Times Interest Earned 35.2 14.5 11.7 7.9
Professional fees (162,914) (0.2) (210,895) (0.2)
Sales & marketing costs (144,581) (0.2) (184,729) (0.2) Leverage Ratios
Technology costs (142,917) (0.2) (137,241) (0.1)
Administrative bonuses (368,965) (0.4) (462,963) (0.4) Debt to Equity 2.1 2.3 2.7 2.6
Other (1,427,057) (1.7) (1,636,925) (1.4) Revenue to Equity 9.4 11.9 12.8 11.9
Total SG&A expenses (4,569,471) (5.4) (5,586,505) (4.7) Asset Turnover 3.0 3.4 3.5 3.6
Fixed Asset Ratio 36.8 % 31.2 % 35.0 % 36.1 %
Income from operations 1,641,447 1.9 2,196,429 1.8 Equity to SG&A Expense 2.0 1.2 1.7 1.3
Underbillings to Equity 16.7 % 16.0 % 15.2 % 10.7 %
Interest income 113,316 0.1 127,538 0.1 Backlog to Equity 9.3 6.9 13.3 8.1
Interest expense (50,710) (0.1) (209,407) (0.2)Other income / (expense), net 29,205 0.0 121,435 0.1
Efficiency Ratios
Net ear ni ngs / ( los s) bef or e i nco me t axes 1, 733 ,25 8 2. 0 2 ,23 5,99 4 1. 9
Backlog to Working Capital 12.7 7.7 19.1 11.0
Income tax (expense) / benefit (130,006) (0.2) (756,194) (0.6) Months in Backlog 8.1 7.3 9.3 7.0
Days in Accounts Receivable 49.3 50.9 44.8 47.3
Net earnings $ 1,603,253 1.9 % $ 1,479,800 1.2 % Days in Inventory 1.3 1.4 0.4 1.1
Days in Accounts Payable 38.6 37.0 40.3 35.5
Operating Cycle 28.1 30.6 24.7 25.5
Number of ParticipantsNumber
2005 522004 45
Note: Not all figures will apear to sum due to rounding.
Overall Survey Results
All Companies
* In theCFMA's 2005 Annual Financial Study, Returnon Assets(ROA)and Returnon Equity (ROE) are calculated using
net earnings (loss) before income taxes. Studies conducted in prior years used net earnings (loss) after taxes to
calculate ROA and ROE. All references to ROAs and ROEs from prior studies have been updated to reflect this change.
West Region

8/13/2019 2005 Financial Survey
http://slidepdf.com/reader/full/2005-financial-survey 89/284
Balance Sheet
2005 Participants 2004 Participants 2005 Participants 2004 Participants
Amount Percent Amount Percent Amount Percent Amount Percent
Current assets: Current liabilities:
Cash and cash equivalents $ 4,005,673 18.2 % $ 3,756,027 17.0 % Current maturity on long-term debt $ 249,431 1.1 % $ 290,104 1.3 %
Marketable securities & short-term investments 714,225 3.3 766,763 3.5 Notes payable and lines of credit 681,815 3.1 340,105 1.5
Receivables: Accounts payable:
Contr act r ecei va ble s c urr ent ly du e 9 ,248 ,01 6 4 2.1 10, 046, 334 45.4 Tr ade, in clu din g c urr ent ly du e
Retainages on contracts 3,375,240 15.4 2,670,671 12.1 to subcontractors 7,069,297 32.2 5,761,390 26.0
Unbilled work 320,059 1.5 311,745 1.4 Subcontracts retainages 2,332,906 10.6 3,773,741 17.1
Other receivables 302,601 1.4 283,987 1.3 Other 110,572 0.5 904,655 4.1
Less allowance for doubtful accounts (50,409) (0.2) (60,951) (0.3) Total accounts payable 9,512,775 43.3 10,439,786 47.2
Total receivables, net: 13,195,507 60.1 13,251,786 59.9
Accrued expenses 1,619,915 7.4 1,542,922 7.0
Inventories 132,423 0.6 147,748 0.7 Billings in excess of costs and recognized
Costs and recognized earnings in excess earnings on uncompleted contracts 2,690,087 12.2 1,985,185 9.0
of billings on uncompleted contracts 1,095,281 5.0 867,748 3.9 Income taxes:
Investments in and advances to Current 15,183 0.1 36,808 0.2
construction joint ventures 41,190 0.2 24,074 0.1 Deferred 7,137 0.0 20,330 0.1
Income taxes: Other current liabilities 280,543 1.3 271,026 1.2
Current/refundable 21,593 0.1 23,401 0.1 Total current liabilities 15,056,885 68.6 14,926,267 67.5
Deferred 8,192 0.0 64,244 0.3 Noncurrent liabilities
Other current assets 469,095 2.1 443,058 2.0 Long-term debt, excluding current maturities 590,957 2.7 1,098,287 5.0
Total current assets 19,683,180 89.6 19,344,850 87.4 Deferred income taxes 38,823 0.2 52,848 0.2
Other 160,490 0.7 282,717 1.3
Property, plant and equipment 4,892,382 22.3 4,323,484 19.5 Total liabilities 15,847,155 72.2 16,360,119 73.9
Less accumulated depreciation (3,072,750) (14.0) (2,139,712) (9.7) Minority interests 95,798 0.4 17,932 0.1
Property, plant and equipment, net 1,819,633 8.3 2,183,772 9.9 Net worth:
Common stock, par value 294,318 1.3 349,915 1.6
Noncurrent assets: Preferred stock, stated value 44,589 0.2 42,602 0.2
Long-term investments 65,223 0.3 132,474 0.6 Additional paid-in capital 1,011,879 4.6 914,092 4.1
Deferred income taxes 4,843 0.0 15,798 0.1 Retained earnings 4,076,768 18.6 4,139,761 18.7
Other assets 387,582 1.8 450,831 2.0 Treasury stock (56,983) (0.3) (61,074) (0.3)
Total noncurrent assets 457,648 2.1 599,103 2.7 Excess value of marketable securities 2,478 0.0 4,130 0.0
Other equity 644,458 2.9 360,250 1.6
Total net worth 6,017,507 27.4 5,749,674 26.0
Total assets $ 21,960,460 100.0 % $ 22,127,725 100.0 % Total liabilities and net worth $ 21,960,460 100.0 % $ 22,127,725 100.0 %
Statement of Earnings Financial Ratios
2005 Participants 2004 Participants 2005 Participants 2004 Participants
Amount Percent Amount Percent Average Median Average Median
Contract revenue $ 66,542,091 96.5 % $ 67,143,348 99.1 % Liquidity Ratios
Other revenue 2,394,432 3.5 607,153 0.9
Total Revenue 68,936,523 100.0 67,750,501 100.0 Current Ratio 1.3 1.4 1.3 1.4
Quick Ratio 1.2 1.2 1.2 1.2
Contract cost (60,494,526) (87.8) (61,582,683) (90.9) Days of Cash 20.9 13.0 20.0 16.4
Other cost (2,093,586) (3.0) (491,863) (0.7) Working Capital Turnover 14.9 11.5 15.3 12.4
Total cost (62,588,112) (90.8) (62,074,546) (91.6)
Profitability Ratios
Gross Profit 6,348,411 9.2 5,675,955 8.4
Return on Assets * 7.2 % 8.4 % 5.6 % 6.1 %
Selling, general & administrative expenses: Return on Equity * 26.2 % 26.7 % 21.5 % 19.4 %
Payroll (2,248,802) (3.3) (2,384,305) (3.5) Times Interest Earned 23.7 11.7 16.6 11.3
Professional fees (125,985) (0.2) (136,453) (0.2)
Sales & marketing costs (243,448) (0.4) (105,783) (0.2) Leverage Ratios
Technology costs (131,627) (0.2) (76,346) (0.1)
Administrative bonuses (337,550) (0.5) (340,297) (0.5) Debt to Equity 2.6 1.9 2.8 1.9
Other (1,751,456) (2.5) (1,426,722) (2.1) Revenue to Equity 11.5 9.3 11.8 9.0
Total SG&A expenses (4,838,868) (7.0) (4,469,906) (6.6) Asset Turnover 3.1 3.0 3.1 3.0
Fixed Asset Ratio 30.2 % 25.1 % 38.0 % 25.2 %
Income from operations 1,509,543 2.2 1,206,049 1.8 Equity to SG&A Expense 1.2 1.2 1.3 1.2
Underbillings to Equity 23.5 % 13.3 % 20.5 % 12.3 %
Interest income 100,434 0.1 68,503 0.1 Backlog to Equity 8.2 5.3 8.7 5.8
Interest expense (69,363) (0.1) (79,166) (0.1)Other income / (expense), net 34,297 0.0 42,193 0.1
Efficiency Ratios
Net ear ni ngs / ( los s) bef or e i nco me t axes 1, 574 ,91 0 2. 3 1 ,23 7,57 9 1. 8
Backlog to Working Capital 15.4 6.4 14.5 6.8
Income tax (expense) / benefit (94,721) (0.1) (146,996) (0.2) Months in Backlog 9.1 6.6 8.9 7.0
Days in Accounts Receivable 49.6 52.9 54.6 50.6
Net earnings $ 1,480,189 2.1 % $ 1,090,584 1.6 % Days in Inventory 0.8 2.1 0.9 1.9
Days in Accounts Payable 41.3 29.0 38.7 33.9
Operating Cycle 30.0 41.1 36.7 40.8
Number of ParticipantsNumber
2005 762004 87
Overall Survey Results
Note: Not all figures will apear to sum due to rounding.
* In theCFMA's 2005 Annual Financial Study, Returnon Assets(ROA)and Returnon Equity (ROE) are calculated using
net earnings (loss) before income taxes. Studies conducted in prior years used net earnings (loss) after taxes to
calculate ROA and ROE. All references to ROAs and ROEs from prior studies have been updated to reflect this change.
Far West Region
All Companies

8/13/2019 2005 Financial Survey
http://slidepdf.com/reader/full/2005-financial-survey 90/284
C F M A ’s 2 0 0 5
Construction
Industry Annual
Financial Survey
INDUSTRIAL &
NONRESIDENTIAL CONTRACTORS
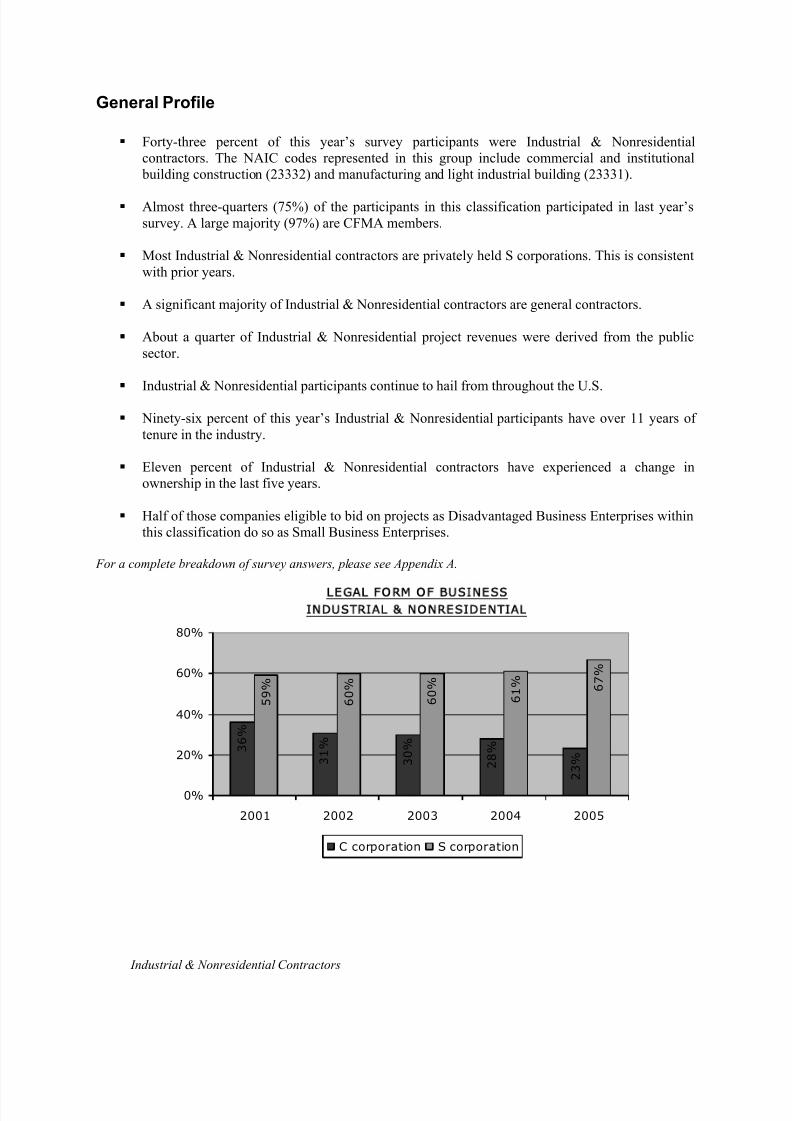
8/13/2019 2005 Financial Survey
http://slidepdf.com/reader/full/2005-financial-survey 91/284
Industrial & Nonresidential Contractors
General Profile
Forty-three percent of this year’s survey participants were Industrial & Nonresidentialcontractors. The NAIC codes represented in this group include commercial and institutional building construction (23332) and manufacturing and light industrial building (23331).
Almost three-quarters (75%) of the participants in this classification participated in last year’ssurvey. A large majority (97%) are CFMA members.
Most Industrial & Nonresidential contractors are privately held S corporations. This is consistentwith prior years.
A significant majority of Industrial & Nonresidential contractors are general contractors.
About a quarter of Industrial & Nonresidential project revenues were derived from the publicsector.
Industrial & Nonresidential participants continue to hail from throughout the U.S.
Ninety-six percent of this year’s Industrial & Nonresidential participants have over 11 years oftenure in the industry.
Eleven percent of Industrial & Nonresidential contractors have experienced a change inownership in the last five years.
Half of those companies eligible to bid on projects as Disadvantaged Business Enterprises withinthis classification do so as Small Business Enterprises.
For a complete breakdown of survey answers, please see Appendix A.
L E G A L F O R M O F B U S I N E S S
I N DU STR I AL & N ON R ES I DEN T I A L
3 6 %
3 1 %
3 0 %
2 8 %
2 3 %
5 9 %
6 0 %
6 0 %
6 1 % 6
7 %
0%
20%
40%
60%
80%
2001 2002 2003 2004 2005
C corporation S corporation
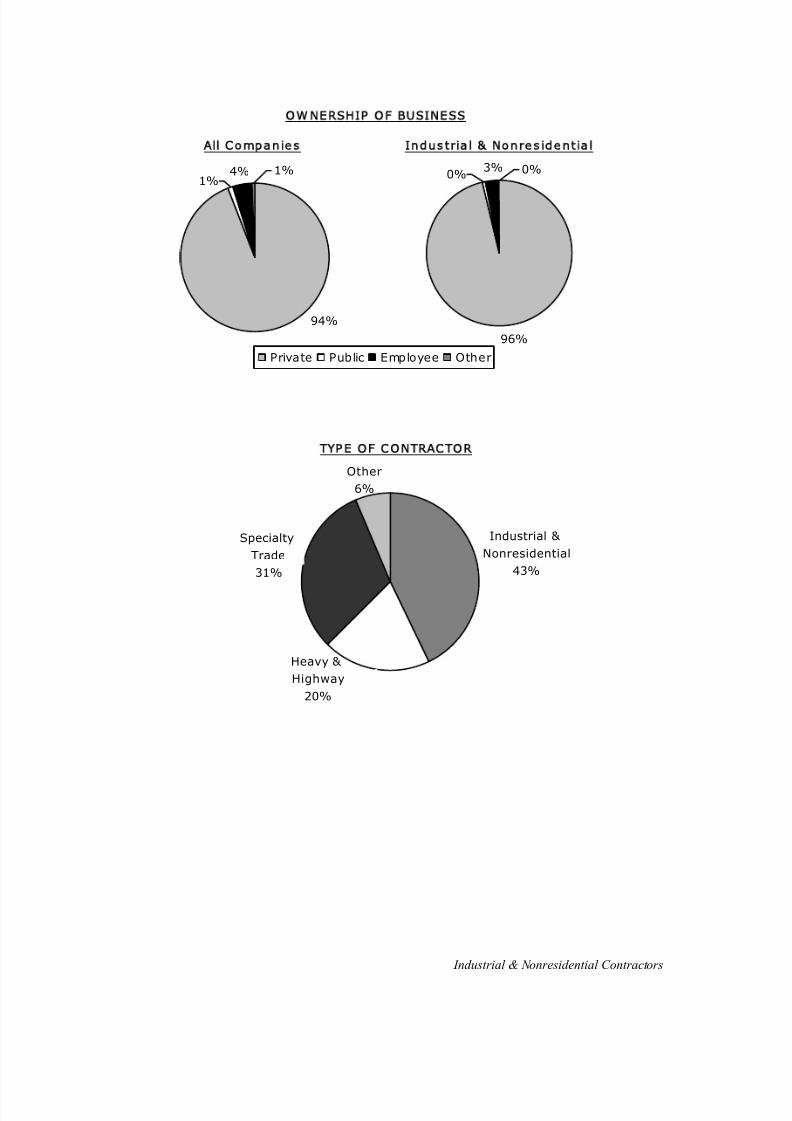
8/13/2019 2005 Financial Survey
http://slidepdf.com/reader/full/2005-financial-survey 92/284
Industrial & Nonresidential Contractors
O W N E R S HI P O F B U S IN E S S
96%
0% 3% 0%
Private Public Employee Other
I n d u s t r i a l & N o n r e s i d e n t i a l
4% 1%1%
94%
A ll C o m p a n i e s
T YP E O F C O N T R AC T O R
Other
6%
Specialty
Trade
31%
Industrial &
Nonresidential
43%
Heavy &
Highway
20%
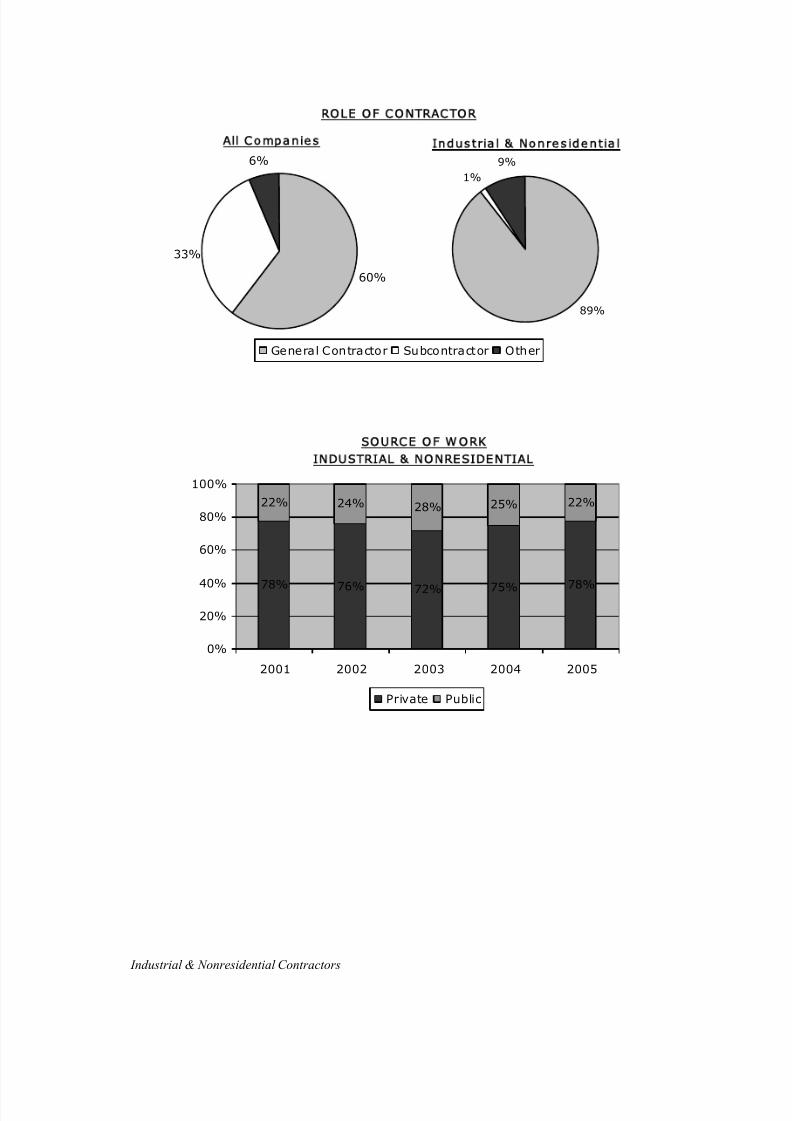
8/13/2019 2005 Financial Survey
http://slidepdf.com/reader/full/2005-financial-survey 93/284
Industrial & Nonresidential Contractors
ROLE OF CONTRACTOR
1%
9%
89%
General Contractor Subcontractor Other
Industrial & Nonres idential
6%
33%
60%
All Companies
S O U RC E O F W O R K
I N D U S TR I A L & N O N R E S I D E N T I A L
78% 76% 72% 75% 78%
22% 24% 28% 25% 22%
0%
20%
40%
60%
80%
100%
2001 2002 2003 2004 2005
Private Public
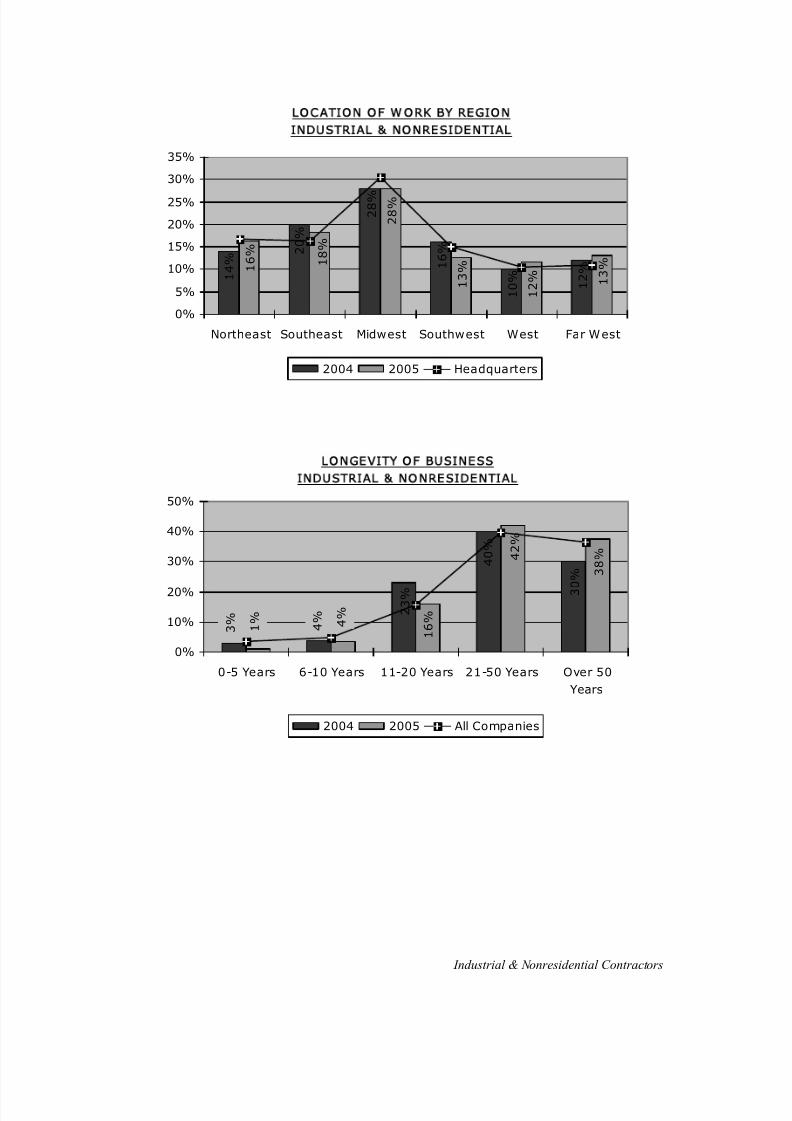
8/13/2019 2005 Financial Survey
http://slidepdf.com/reader/full/2005-financial-survey 94/284
Industrial & Nonresidential Contractors
LOC ATION OF W ORK BY REGION
INDUSTRIAL & NONRESIDENTIAL
1 4 %
2 0 %
2 8 %
1 6 %
1 0 %
1 2 % 1
6 %
1 8 %
2 8 %
1 3 %
1 2 % 1
3 %
0%
5%
10%
15%
20%
25%
30%
35%
Northeast Southeast Midwest Southwest West Far West
2004 2005 Headquarters
L O N G E V I TY O F B U S I N E S S
I N DU STR I AL & N ON R ES I DEN T I A L
30
%40%
23%
4%
3%
38%4
2%
16%4
%1%
0%
10%
20%
30%
40%
50%
0-5 Years 6-10 Years 11-20 Years 21-50 Years Over 50
Years
2004 2005 All Companies

8/13/2019 2005 Financial Survey
http://slidepdf.com/reader/full/2005-financial-survey 95/284
Industrial & Nonresidential Contractors
M A J O R I TY O W N E R S H I P C H A N G E S
89%
11%
Majority Ownership Changed Within the Last Five Years
No Change in Majority Ownership Within the Last Five Years
I n d u s t r i a l & N o n r e s i d e n t i a l
17%
83%
A ll C o m p a n i e s
M E T H O D S O F C H A N G I N G M A JO R I T Y O W N E R S H I P
1 %
1 %
0 %
0 %
0 %
0 %
0 %
0 %
3 1 %
3 1 %
2 4
%
1 2 % 5 %
1 0 %
4 8 %
3 8 %
0%
10%
20%
30%
40%
50%
E m p l o y e e
S a l e
T r a n s f e r t o
F a m i l y
D o m e s t i c
S a l e
E S O P
F o r e i g n
S a l e
B a n k r u p t c y
I P O
O t h e r
All Companies Industrial & Nonresidential
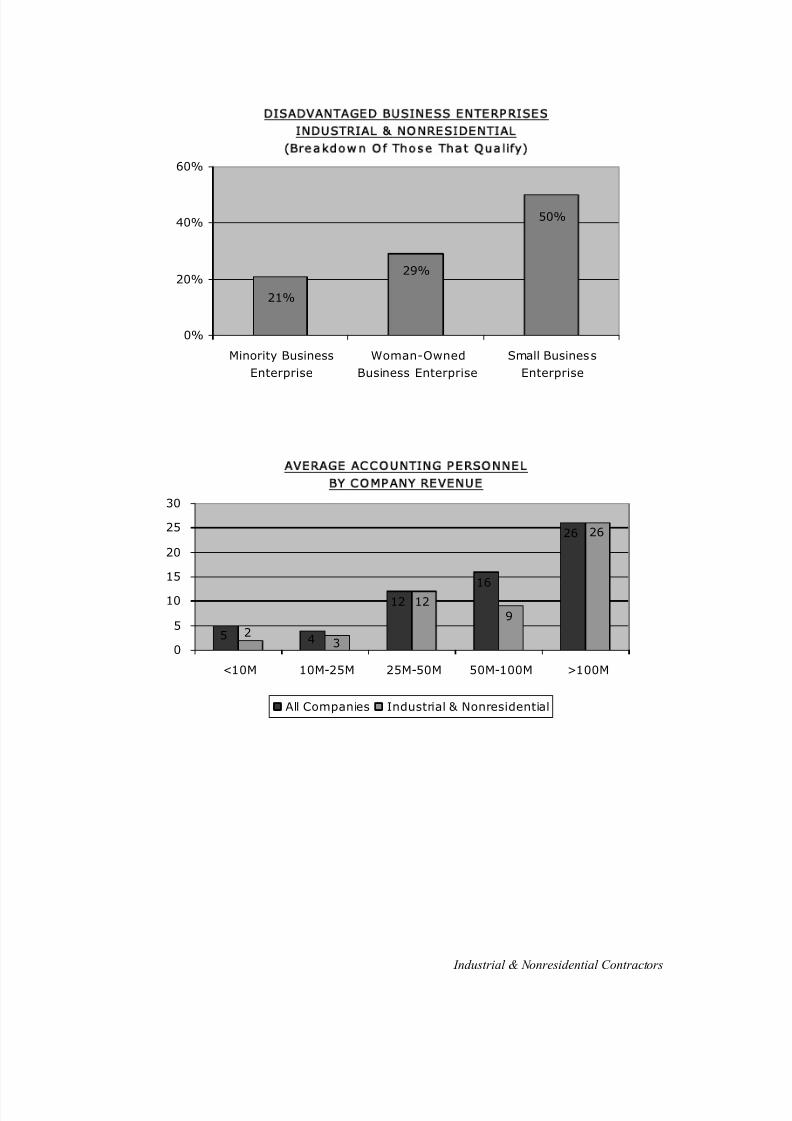
8/13/2019 2005 Financial Survey
http://slidepdf.com/reader/full/2005-financial-survey 96/284
Industrial & Nonresidential Contractors
DI SADVAN TAGED BU S I N ESS EN TER PR I SES
I N DU STR I AL & N ON R ES I DEN T I A L
( Br e a k d o w n O f T h o s e T h a t Q u a lif y)
50%
29%
21%
0%
20%
40%
60%
Minority Business
Enterprise
Woman-Owned
Business Enterprise
Small Business
Enterprise
A V E R A G E A C C O U N T I N G P E R S O N N E L
B Y C O M P A N Y R E V E N U E
26
5 4
12
16
26
9
12
23
0
5
10
15
20
25
30
<10M 10M-25M 25M-50M 50M-100M >100M
All Companies Industrial & Nonresidential
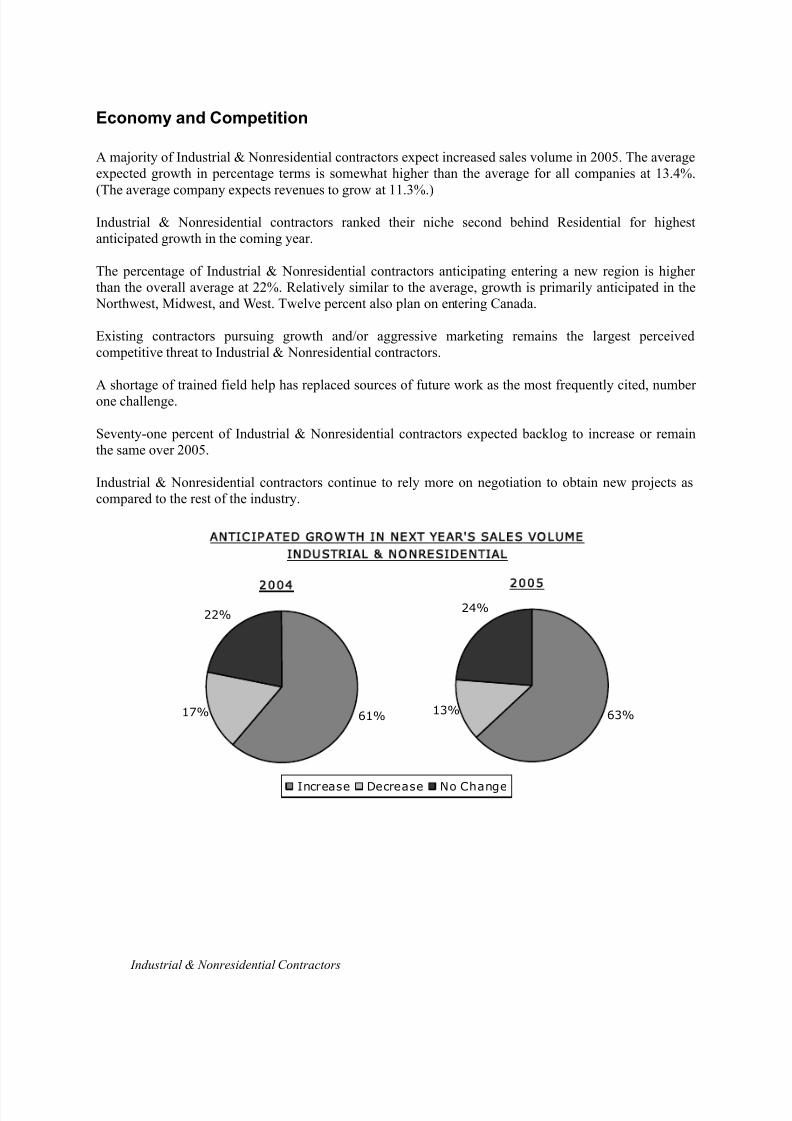
8/13/2019 2005 Financial Survey
http://slidepdf.com/reader/full/2005-financial-survey 97/284
Industrial & Nonresidential Contractors
Economy and Competition
A majority of Industrial & Nonresidential contractors expect increased sales volume in 2005. The averageexpected growth in percentage terms is somewhat higher than the average for all companies at 13.4%.
(The average company expects revenues to grow at 11.3%.)
Industrial & Nonresidential contractors ranked their niche second behind Residential for highestanticipated growth in the coming year.
The percentage of Industrial & Nonresidential contractors anticipating entering a new region is higherthan the overall average at 22%. Relatively similar to the average, growth is primarily anticipated in the Northwest, Midwest, and West. Twelve percent also plan on entering Canada.
Existing contractors pursuing growth and/or aggressive marketing remains the largest perceivedcompetitive threat to Industrial & Nonresidential contractors.
A shortage of trained field help has replaced sources of future work as the most frequently cited, numberone challenge.
Seventy-one percent of Industrial & Nonresidential contractors expected backlog to increase or remainthe same over 2005.
Industrial & Nonresidential contractors continue to rely more on negotiation to obtain new projects ascompared to the rest of the industry.
24%
63%13%
Increase Decrease No Change
2 0 0 5
A N T IC I P A T E D G R O W T H I N N E X T Y E A R' S S AL E S V O L U M E
I N D U S TR I A L & N O N R E S I D E N T I A L
61%17%
22%
2 0 0 4
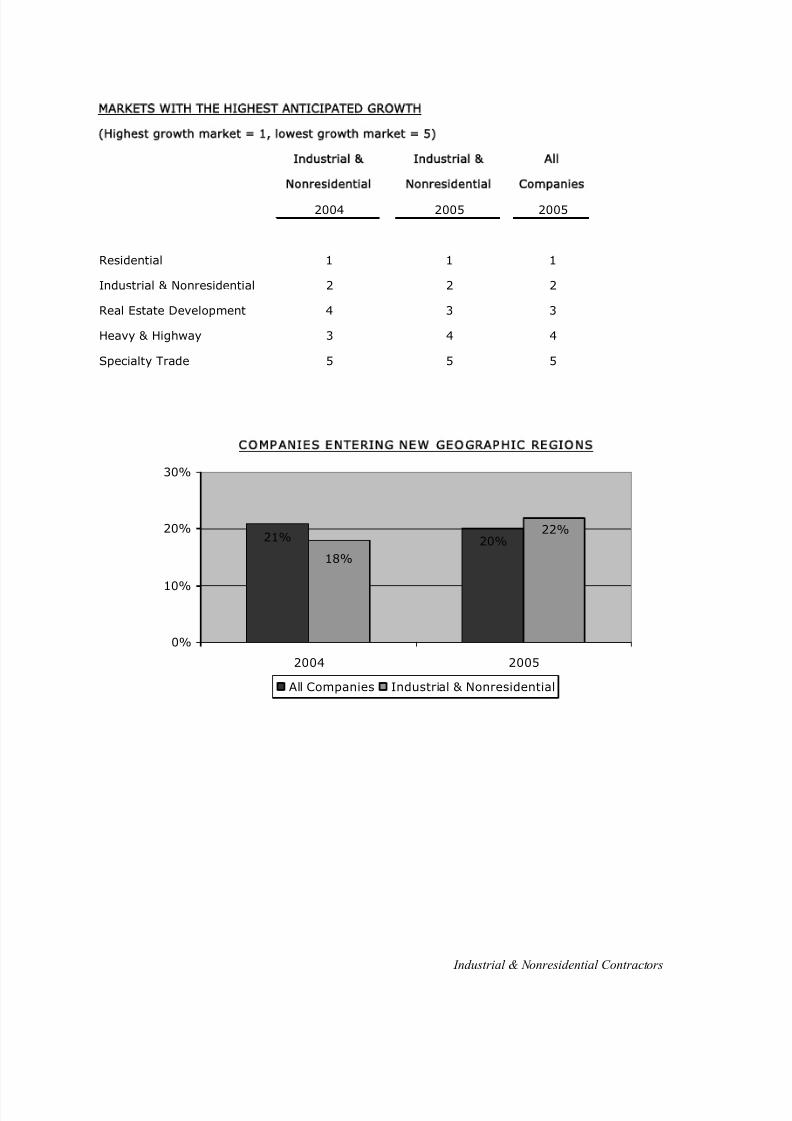
8/13/2019 2005 Financial Survey
http://slidepdf.com/reader/full/2005-financial-survey 98/284
Industrial & Nonresidential Contractors
MARKETS WITH THE HIGHEST ANTICIPATED GROWTH
(Highest growth market = 1, lowest growth market = 5)
Industrial & Industrial & All
Nonresidential Nonresidential Companies
2004 2005 2005
Residential 1 1 1
Industrial & Nonresidential 2 2 2
Real Estate Development 4 3 3
Heavy & Highway 3 4 4
Specialty Trade 5 5 5
C O M P A N IE S E N T E R I N G N E W G E O G R AP H I C R E G I O N S
20%21% 22%
18%
0%
10%
20%
30%
2004 2005
All Companies Industrial & Nonresidential
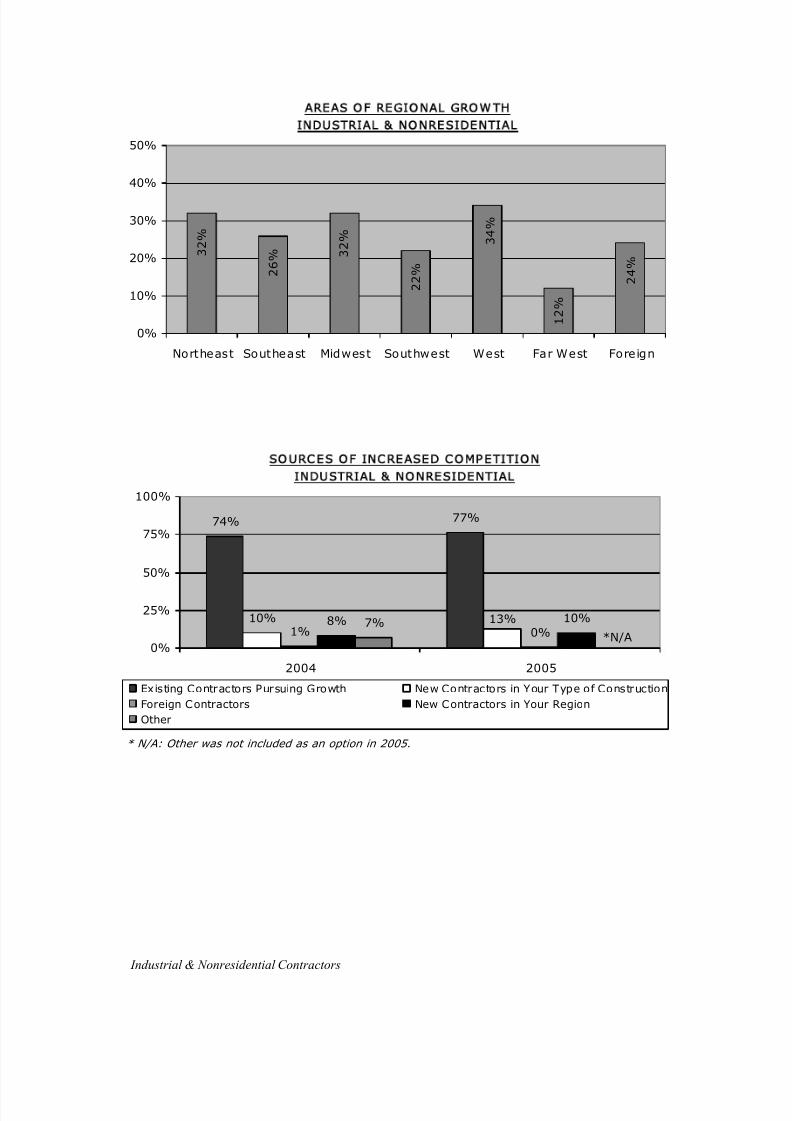
8/13/2019 2005 Financial Survey
http://slidepdf.com/reader/full/2005-financial-survey 99/284
Industrial & Nonresidential Contractors
A R E A S O F R E G I O N A L G R O W T H
I N DU STR I AL & N ON R ES I DEN T I A L
3 2 %
2 6 % 3
2 %
2 2 %
3 4 %
2 4 %
1 2 %
0%
10%
20%
30%
40%
50%
Northeast Southeast Midwest Southwest West Far West Foreign
S O U R C E S O F I N C R E A S E D C O M P E T IT IO N
I N DU STR I AL & N ON R ES I DEN T I A L
74% 77%
10%1% 0%
8% 10%7% 13%
*N/A0%
25%
50%
75%
100%
2004 2005
Existing Contractors Pursuing Growth New Contractors in Your Type of Construction
Foreign Contractors New Contractors in Your Region
Other
* N/A: Other was not included as an option in 2005.
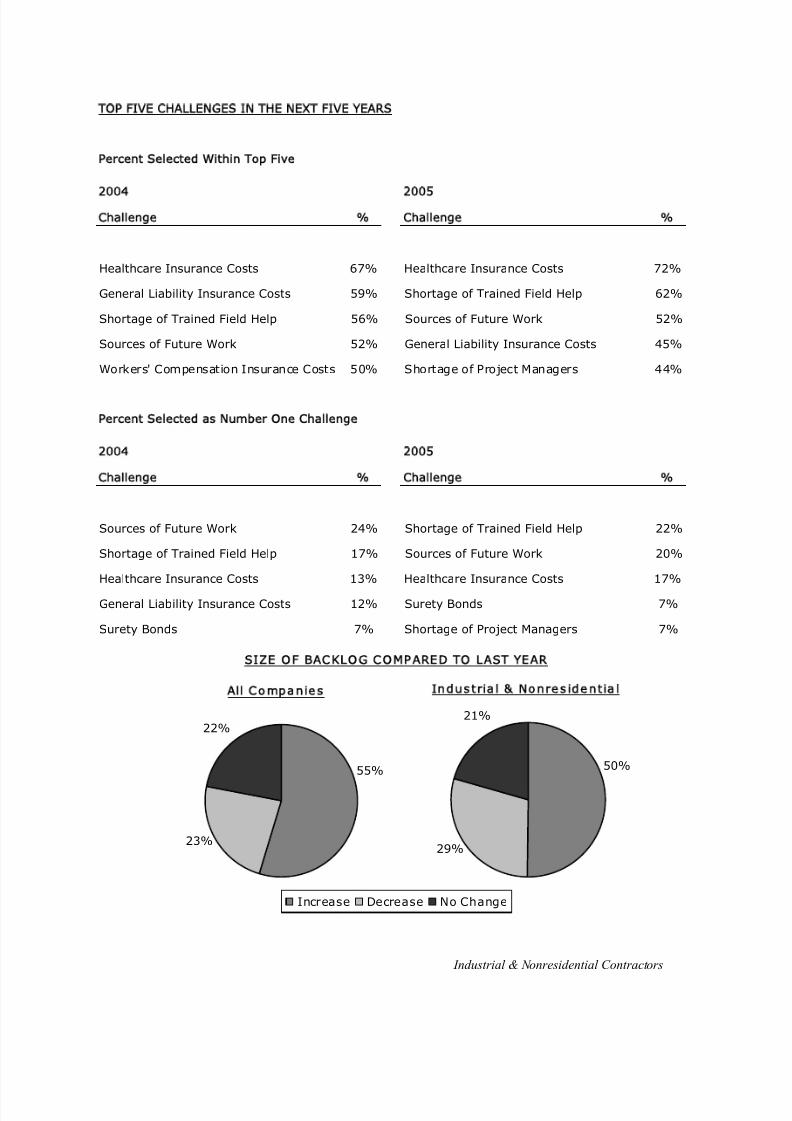
8/13/2019 2005 Financial Survey
http://slidepdf.com/reader/full/2005-financial-survey 100/284
Industrial & Nonresidential Contractors
TOP FIVE CHALLENGES IN THE NEXT FIVE YEARS
Percent Selected Within Top Five
2004 2005
Challenge % Challenge %
Healthcare Insurance Costs 67% Healthcare Insurance Costs 72%
General Liability Insurance Costs 59% Shortage of Trained Field Help 62%
Shortage of Trained Field Help 56% Sources of Future Work 52%
Sources of Future Work 52% General Liability Insurance Costs 45%
Workers' Compensation Insurance Costs 50% Shortage of Project Managers 44%
Percent Selected as Number One Challenge
2004 2005
Challenge % Challenge %
Sources of Future Work 24% Shortage of Trained Field Help 22%
Shortage of Trained Field Help 17% Sources of Future Work 20%
Healthcare Insurance Costs 13% Healthcare Insurance Costs 17%
General Liability Insurance Costs 12% Surety Bonds 7%
Surety Bonds 7% Shortage of Project Managers 7%
S I ZE O F B A C K L O G C O M P A R E D T O L A S T YE A R
21%
50%
29%
Increase Decrease No Change
I n d u s t r i a l & N o n r e s i d e n t i a l
22%
23%
55%
A ll C o m p a n i e s
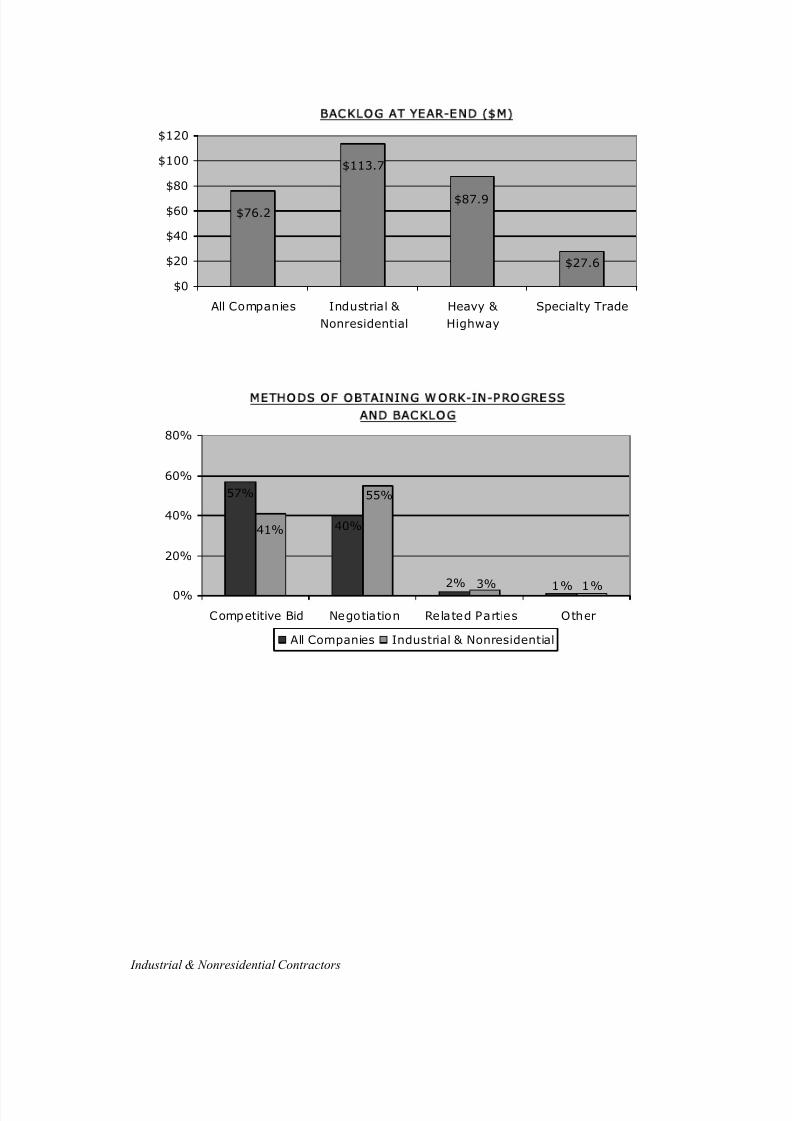
8/13/2019 2005 Financial Survey
http://slidepdf.com/reader/full/2005-financial-survey 101/284
Industrial & Nonresidential Contractors
BAC KL OG AT YEAR -EN D ( M )
$27.6
$76.2
$113.7
$87.9
$0
$20
$40
$60
$80
$100
$120
All Companies Industrial &
Nonresidential
Heavy &
Highway
Specialty Trade
M E T H O D S O F O B T A I N IN G W O R K - I N -P R O G R E S S
A N D BA C K L O G
57%
40%
2% 1% 1%3%
41%
55%
0%
20%
40%
60%
80%
Competitive Bid Negotiation Related Parties Other
All Companies Industrial & Nonresidential

8/13/2019 2005 Financial Survey
http://slidepdf.com/reader/full/2005-financial-survey 102/284
Industrial & Nonresidential Contractors
S T R AT E G I E S T O I M P R O V E F U T U R E P R O F I T AB I L I TY
5%
3%
8%
32%
60%
4%
4%
6%
56%
93%
91%
55%
48%
38%
39%
49%
44%
52%
37%
30%
0% 25% 50% 75% 100%
Other
Invest in Unrelated Business
M&A
Related Services
Cut Overhead
Design-Build
IT
Training
Risk Mgmt
Do What We Do Better
All Companies Industrial & Nonresidential
C H A N G E I N A M O U N T O F B I D W O R K
33% 32%
12% 12%
56% 56%
0%
20%
40%
60%
80%
100%
All Companies Industrial & Nonresidential
Increase Decrease No Change
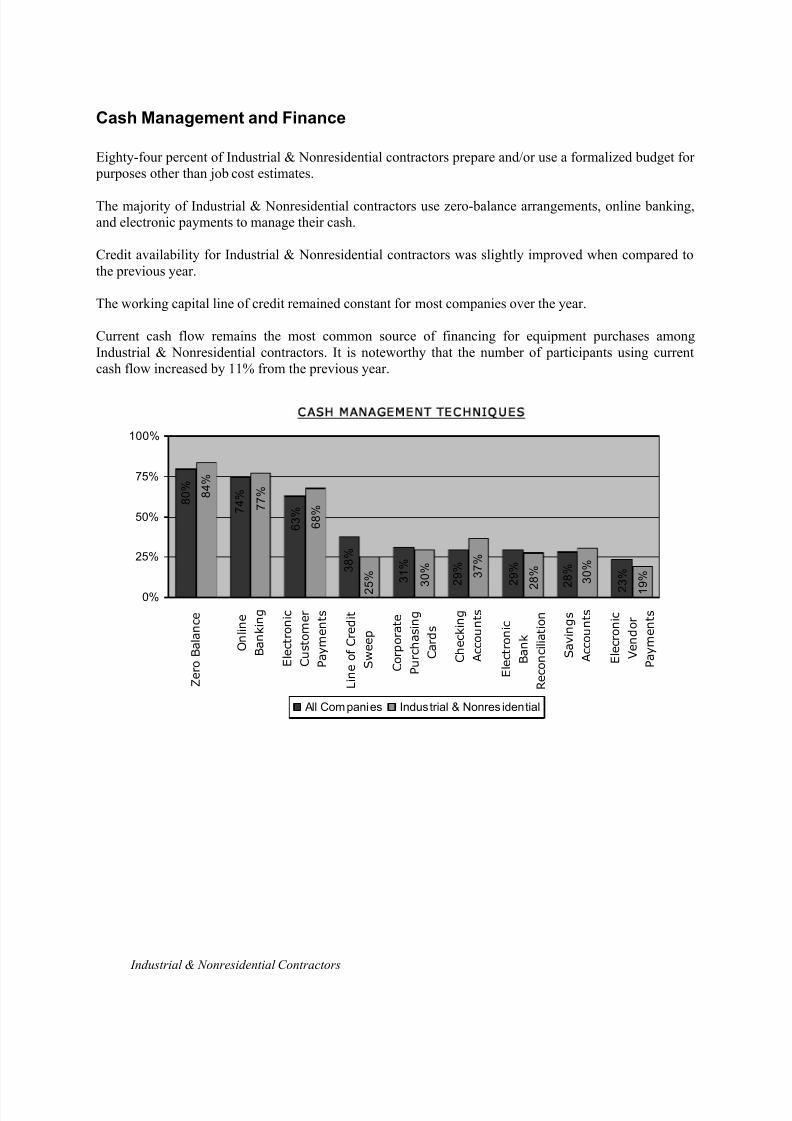
8/13/2019 2005 Financial Survey
http://slidepdf.com/reader/full/2005-financial-survey 103/284
Industrial & Nonresidential Contractors
Cash Management and Finance
Eighty-four percent of Industrial & Nonresidential contractors prepare and/or use a formalized budget for purposes other than job cost estimates.
The majority of Industrial & Nonresidential contractors use zero-balance arrangements, online banking,and electronic payments to manage their cash.
Credit availability for Industrial & Nonresidential contractors was slightly improved when compared tothe previous year.
The working capital line of credit remained constant for most companies over the year.
Current cash flow remains the most common source of financing for equipment purchases amongIndustrial & Nonresidential contractors. It is noteworthy that the number of participants using currentcash flow increased by 11% from the previous year.
CASH MANAGEMENT TEC HNIQUES
2
3 %
2 8 %
2 9 %
2 9 %
3 1 % 3
8 %
6 3 % 7
4 %
8 0 %
1 9 % 3
0 %
2
8 % 3
7 %
3 0 %
2 5 %
6 8 %
7 7 % 8
4 %
0%
25%
50%
75%
100%
Z e r o
B a
l a n c e
O n
l i n e
B a n
k i n g
E l e c t r o n
i c
C u s t o m e r
P a y m e n t s
L i n e o
f C r e
d i t
S w e e p
C o r p o r a t e
P u r c h a s i n g
C a r d s
C h e c
k i n g
A c c o u n t s
E l e c t r o n
i c
B a n
k
R e c o n c i l i a t i o n
S a v
i n g s
A c c o u n t s
E l e c r o n
i c
V e n
d o r
P a y m e n t s
All Companies Industrial & Nonres idential
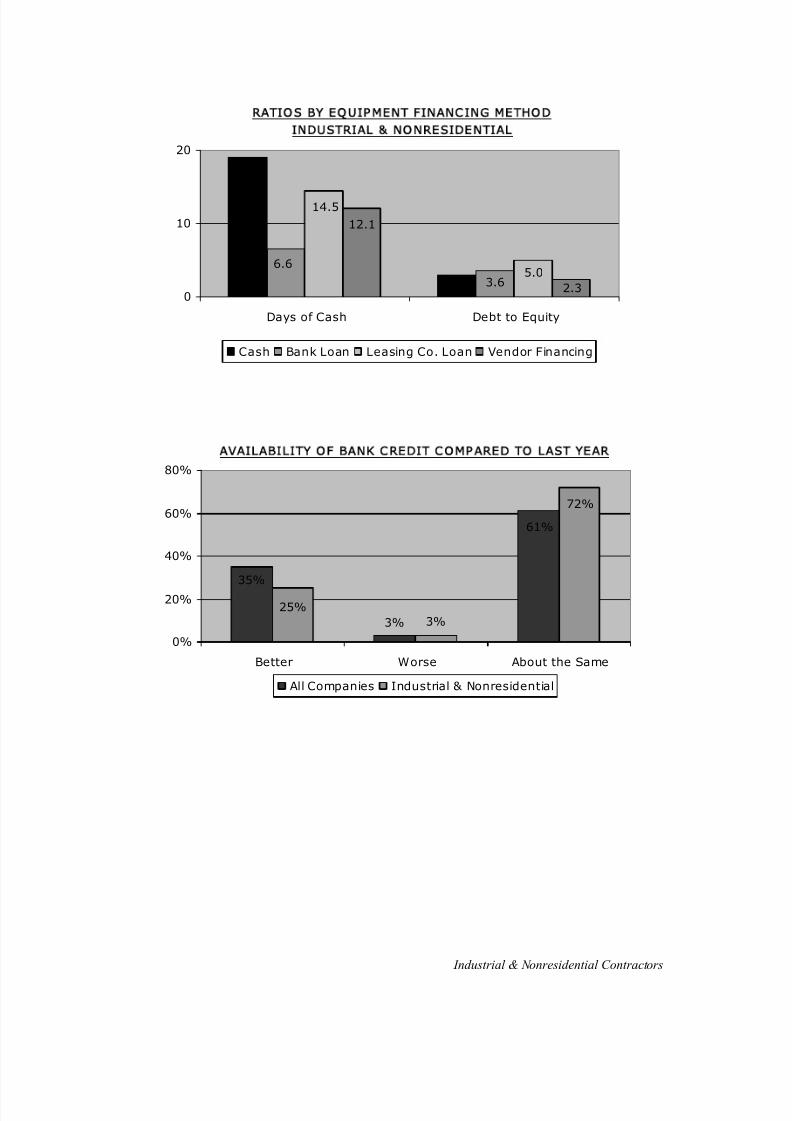
8/13/2019 2005 Financial Survey
http://slidepdf.com/reader/full/2005-financial-survey 104/284
Industrial & Nonresidential Contractors
R A TI O S B Y E Q U I P M E N T F I N A N C I N G M E T H O D
I N DU STR I AL & N ON R ES I DEN T I A L
3.0
19.0
3.6
6.65.0
14.5
2.3
12.1
0
10
20
Days of Cash Debt to Equity
Cash Bank Loan Leasing Co. Loan Vendor Financing
35%
3%
61%
72%
25%
3%
0%
20%
40%
60%
80%
Better Worse About the Same
All Companies Industrial & Nonresidential
AVAILABILITY OF BANK CREDIT COMPARED TO LAST YEAR
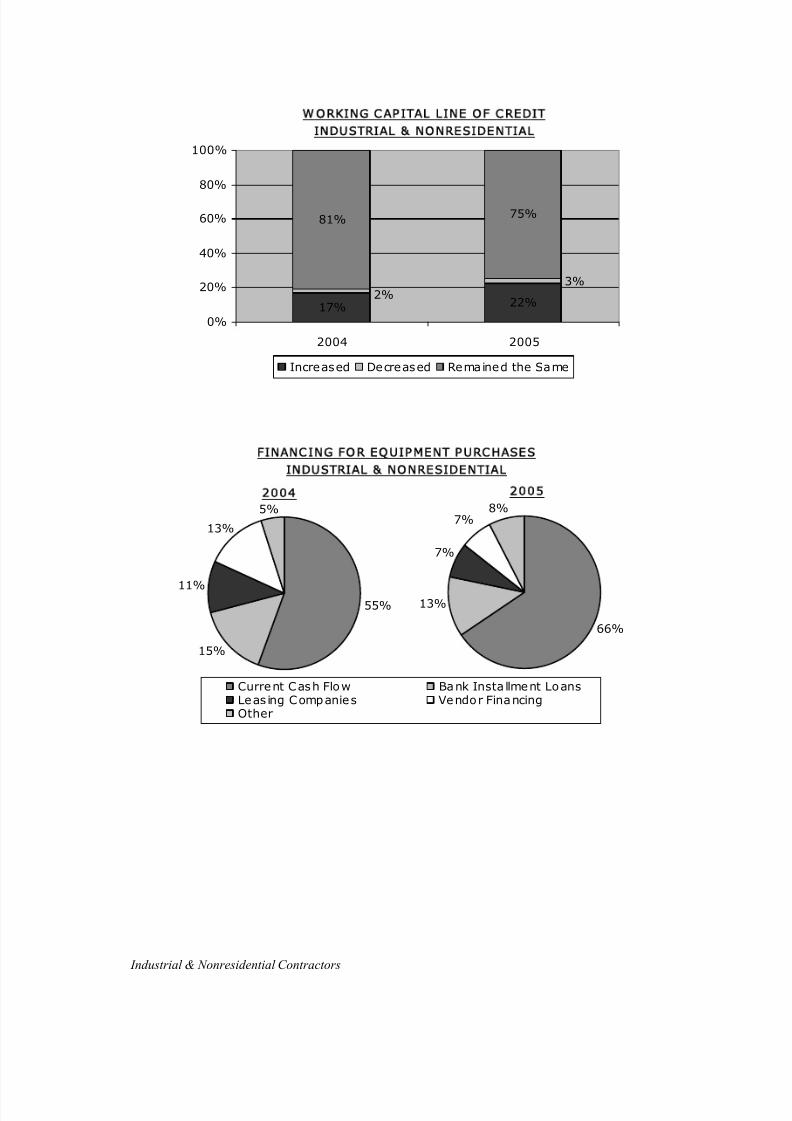
8/13/2019 2005 Financial Survey
http://slidepdf.com/reader/full/2005-financial-survey 105/284
Industrial & Nonresidential Contractors
W ORKING CAPITAL LINE OF CREDIT
INDUSTRIAL & NONRESIDENTIAL
17% 22%
81%75%
3%2%
0%
20%
40%
60%
80%
100%
2004 2005
Increased Decreased Remained the Same
F I N A N C I N G F O R E Q U I P M E N T P U R C H A S E S
I N D U S T RI A L & N O N R E S I D E N T I A L
7%
7%
66%
13%
8%
Current Cash Flow Bank Insta llment LoansLeas ing Companies Vendor FinancingOther
2 0 0 5
5%
11%
13%
15%
55%
2 0 0 4
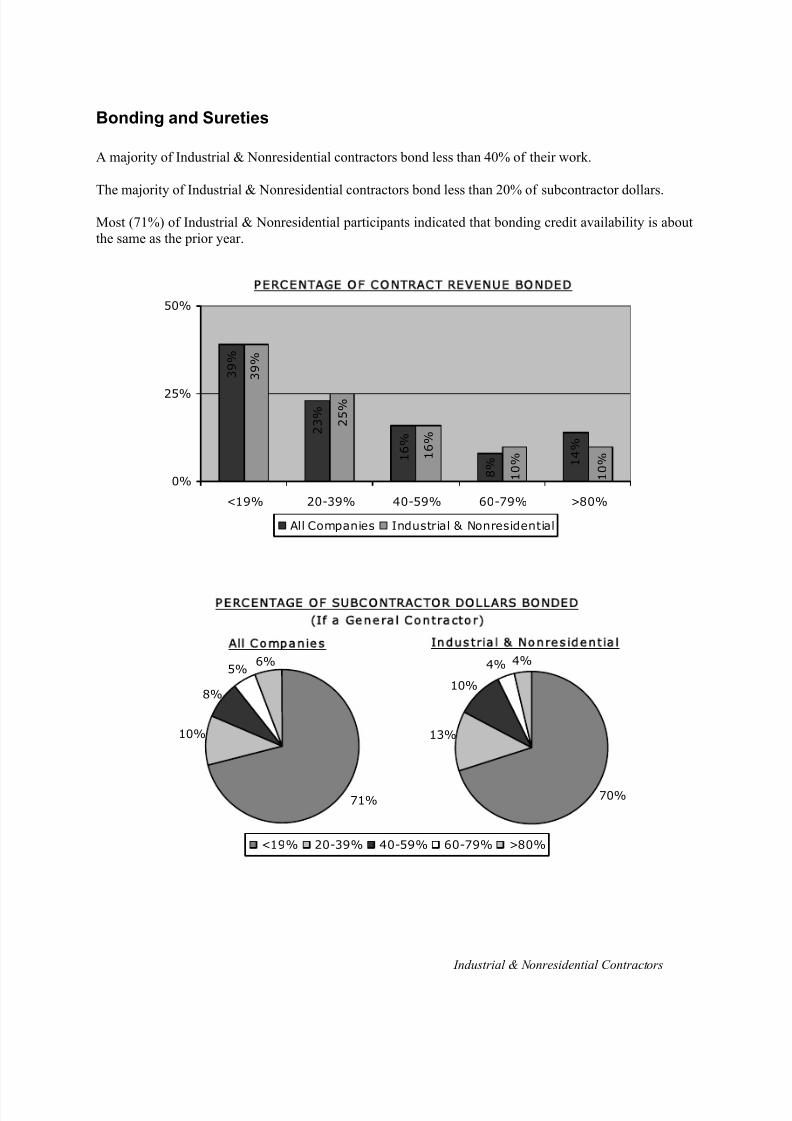
8/13/2019 2005 Financial Survey
http://slidepdf.com/reader/full/2005-financial-survey 106/284
Industrial & Nonresidential Contractors
Bonding and Sureties
A majority of Industrial & Nonresidential contractors bond less than 40% of their work.
The majority of Industrial & Nonresidential contractors bond less than 20% of subcontractor dollars.
Most (71%) of Industrial & Nonresidential participants indicated that bonding credit availability is aboutthe same as the prior year.
PE RCENTAGE OF CONTRACT REVENUE BONDED
8 %
1 6 %
2 3 %
3 9 %
1 4 %
2 5 %
3 9 %
1 6 %
1 0 %
1 0 %
0%
25%
50%
<19% 20-39% 40-59% 60-79% >80%
All Companies Industrial & Nonresidential
PERC ENTAGE O F SUBCONTRACTOR DOLLARS BONDED
(If a Gene ral Contractor)
4%4%
10%
70%
13%
<19% 20-39% 40-59% 60-79% >80%
Industrial & Nonresiden tial
6%
71%
10%
5%
8%
All Companies
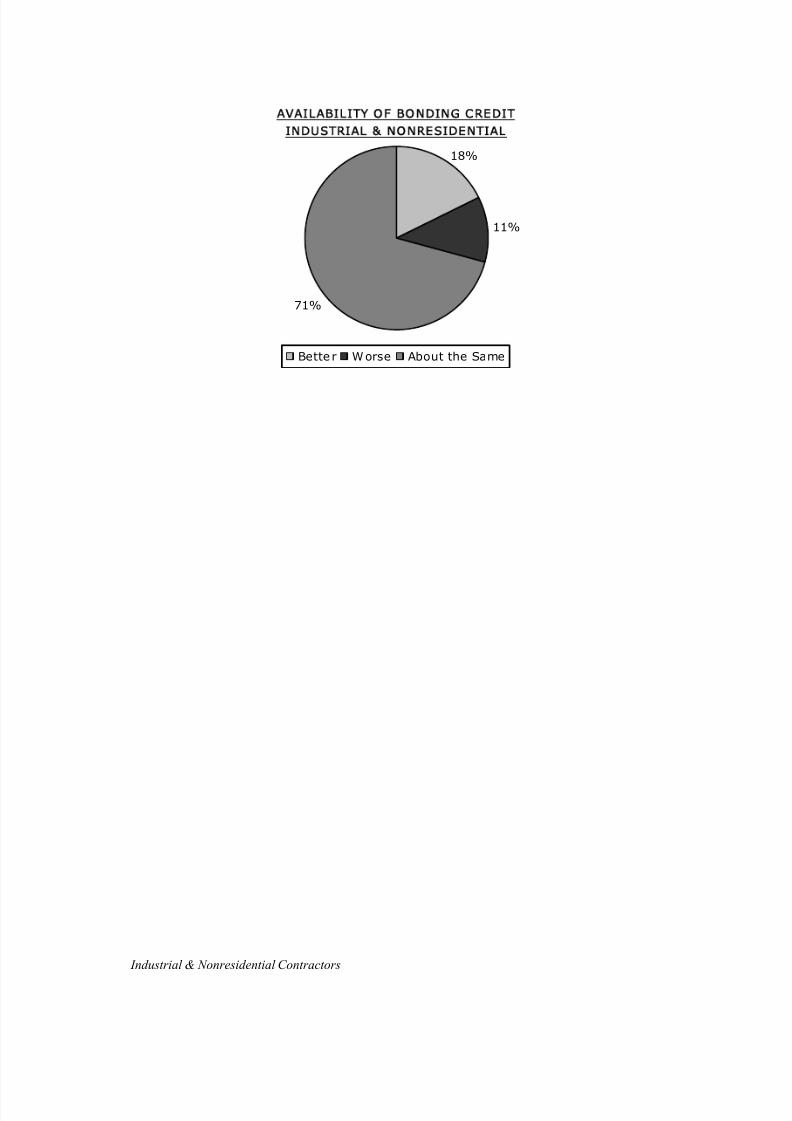
8/13/2019 2005 Financial Survey
http://slidepdf.com/reader/full/2005-financial-survey 107/284
Industrial & Nonresidential Contractors
AVAILABILITY OF BONDING CREDIT
INDUSTRIAL & NONRESIDENTIAL
11%
71%
18%
Bette r Worse About the Same
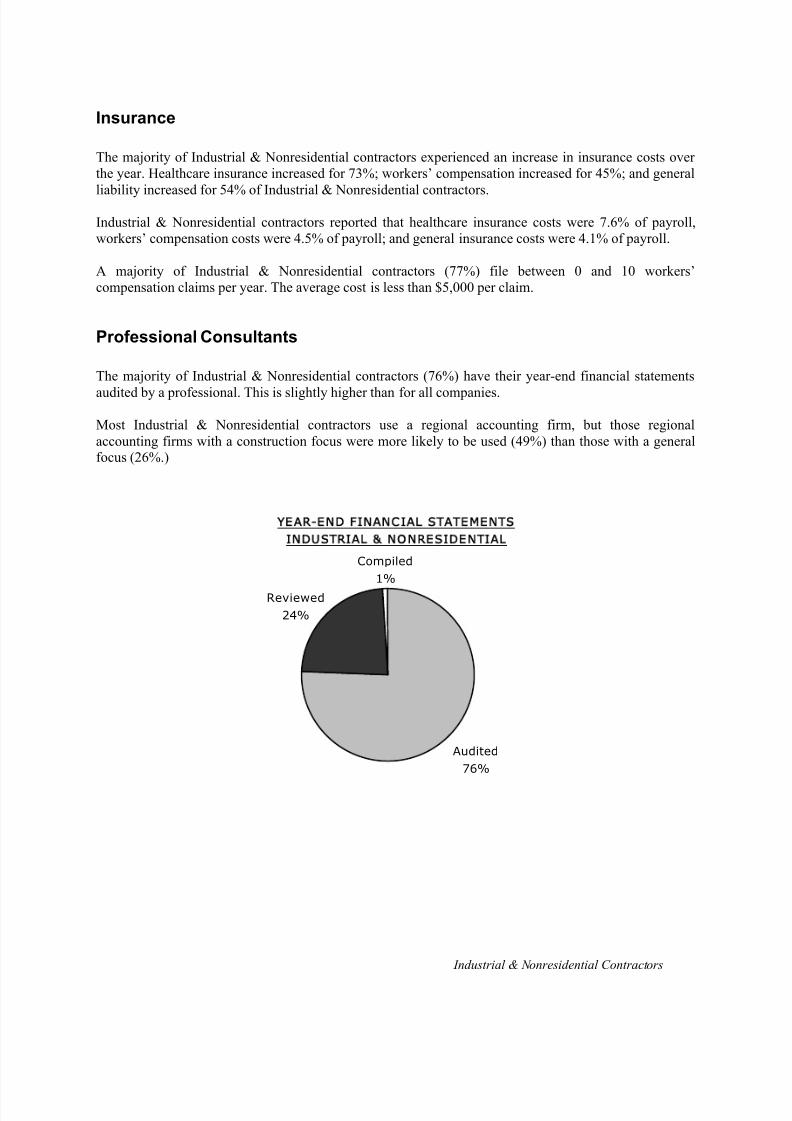
8/13/2019 2005 Financial Survey
http://slidepdf.com/reader/full/2005-financial-survey 108/284
Industrial & Nonresidential Contractors
Insurance
The majority of Industrial & Nonresidential contractors experienced an increase in insurance costs overthe year. Healthcare insurance increased for 73%; workers’ compensation increased for 45%; and general
liability increased for 54% of Industrial & Nonresidential contractors.
Industrial & Nonresidential contractors reported that healthcare insurance costs were 7.6% of payroll,workers’ compensation costs were 4.5% of payroll; and general insurance costs were 4.1% of payroll.
A majority of Industrial & Nonresidential contractors (77%) file between 0 and 10 workers’compensation claims per year. The average cost is less than $5,000 per claim.
Professional Consultants
The majority of Industrial & Nonresidential contractors (76%) have their year-end financial statements
audited by a professional. This is slightly higher than for all companies.
Most Industrial & Nonresidential contractors use a regional accounting firm, but those regionalaccounting firms with a construction focus were more likely to be used (49%) than those with a generalfocus (26%.)
YEAR-END FINANCIAL STATEMENTS
INDUSTRIAL & NONRESIDENTIAL
Reviewed
24%
Compiled
1%
Audited
76%
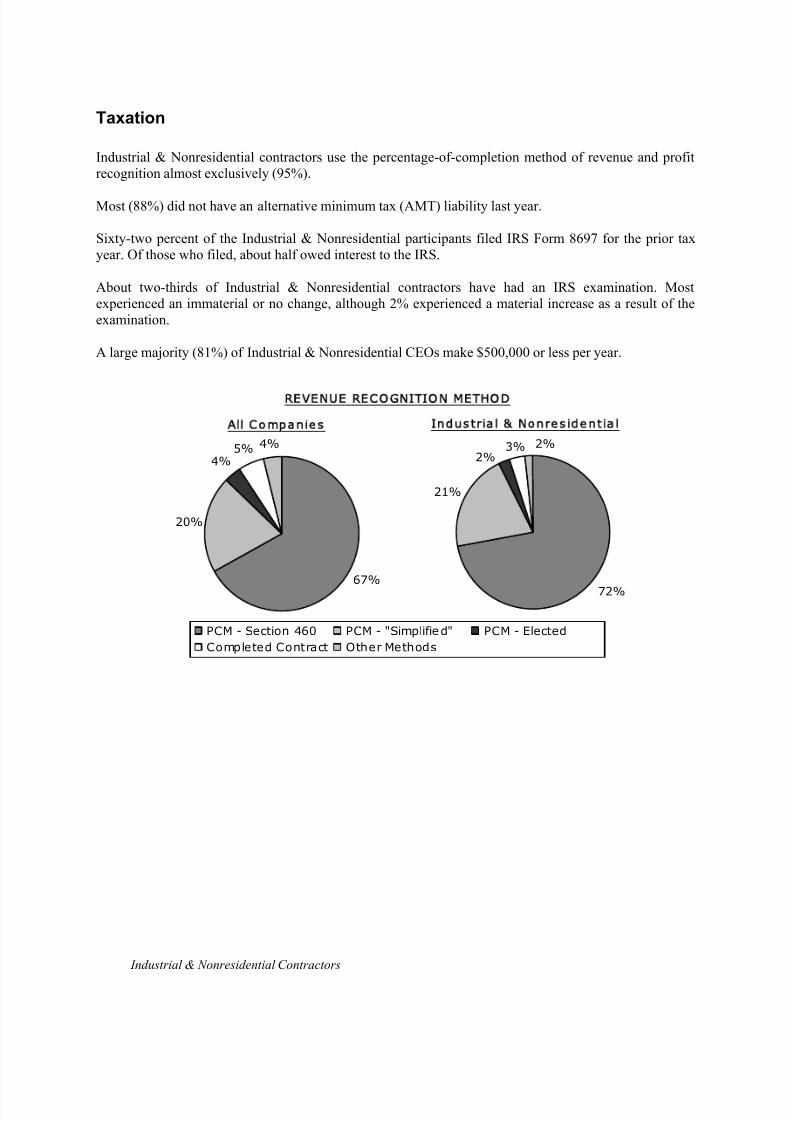
8/13/2019 2005 Financial Survey
http://slidepdf.com/reader/full/2005-financial-survey 109/284
Industrial & Nonresidential Contractors
Taxation
Industrial & Nonresidential contractors use the percentage-of-completion method of revenue and profitrecognition almost exclusively (95%).
Most (88%) did not have an alternative minimum tax (AMT) liability last year.
Sixty-two percent of the Industrial & Nonresidential participants filed IRS Form 8697 for the prior taxyear. Of those who filed, about half owed interest to the IRS.
About two-thirds of Industrial & Nonresidential contractors have had an IRS examination. Mostexperienced an immaterial or no change, although 2% experienced a material increase as a result of theexamination.
A large majority (81%) of Industrial & Nonresidential CEOs make $500,000 or less per year.
REVENUE RECOGNITION METHOD
72%
21%
2%3% 2%
PCM - Section 460 PCM - "Simplified" PCM - Elected
Completed Contract Other Methods
Industrial & Nonresiden tial
67%
20%
4%
4%5%
All Companies
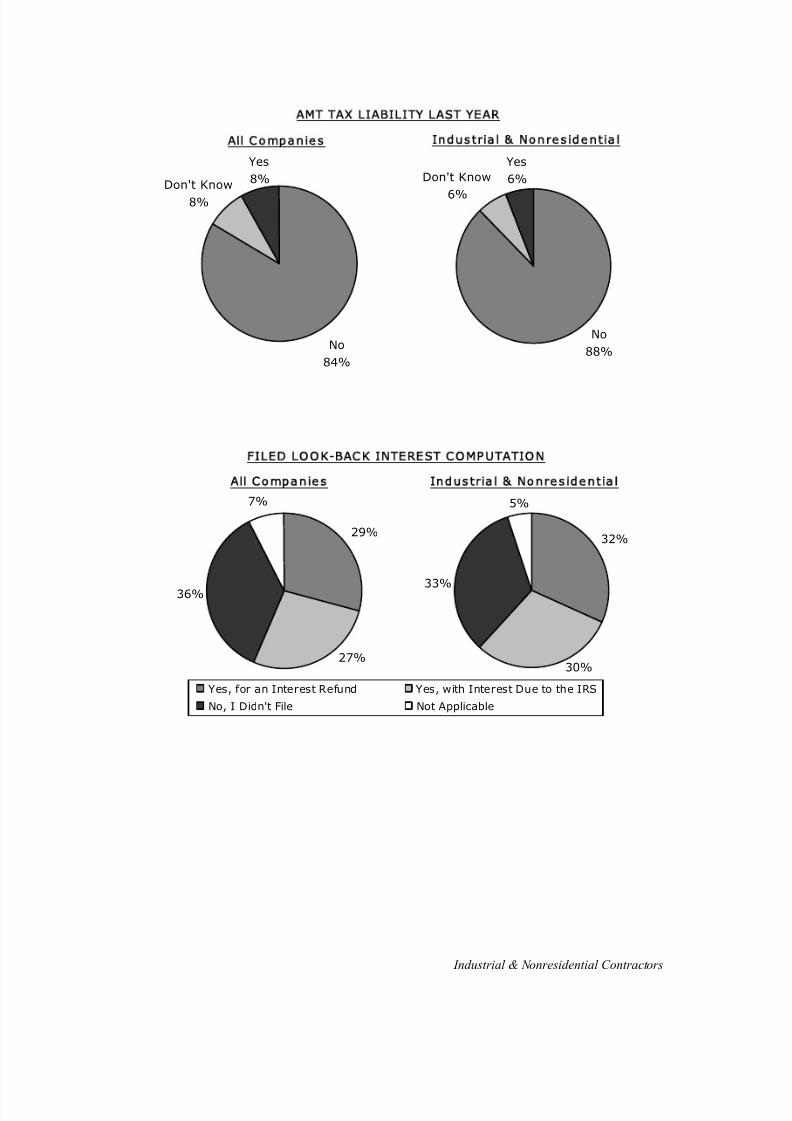
8/13/2019 2005 Financial Survey
http://slidepdf.com/reader/full/2005-financial-survey 110/284
Industrial & Nonresidential Contractors
AMT TAX LIABILITY LAST YEAR
No
88%
Yes
6%Don't Know
6%
Industrial & Nonres idential
No
84%
Yes
8%
All Companies
Don't Know
8%
F I L E D L O O K - BA C K I N TE R E S T C O M P U T A T I O N
32%
30%
5%
33%
Yes, for an Interest Refund Yes, with Interest Due to the IRS
No, I Didn't File Not Applicable
I n d u s t r i a l & N o n r e s i d e n t i a l
29%
36%
7%
27%
A ll C o m p a n i e s
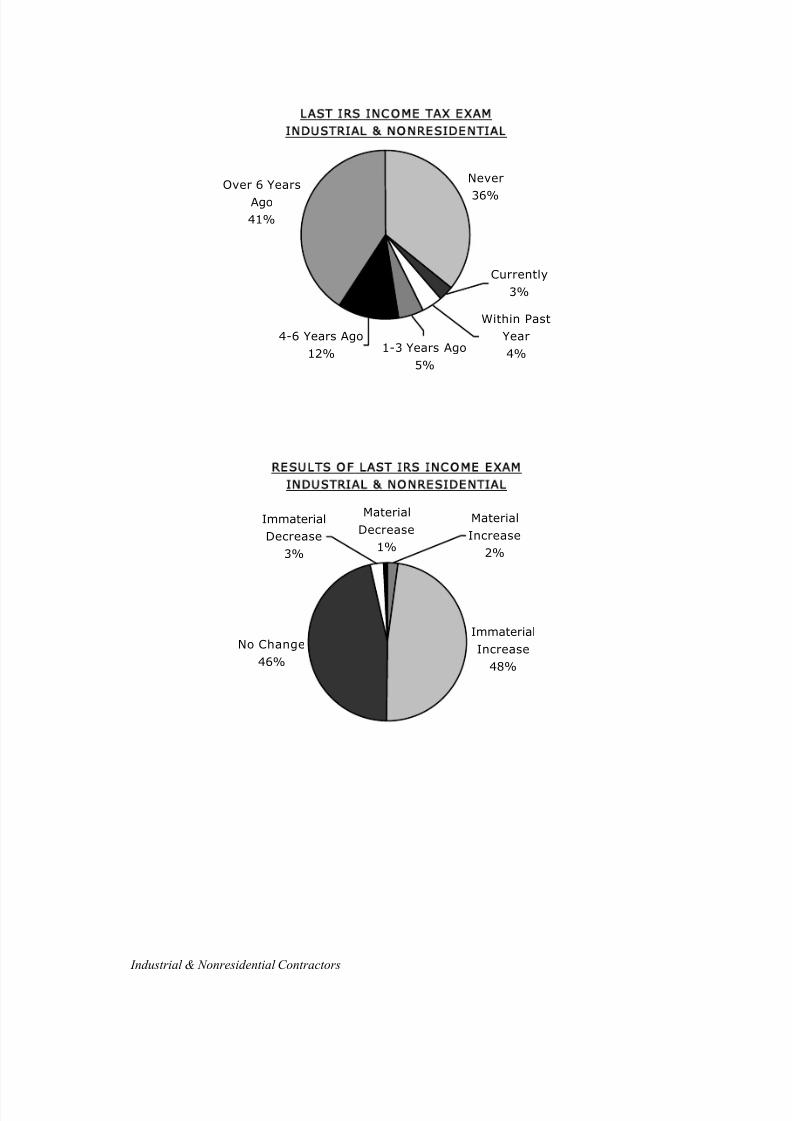
8/13/2019 2005 Financial Survey
http://slidepdf.com/reader/full/2005-financial-survey 111/284
Industrial & Nonresidential Contractors
L A S T I R S IN C O M E T A X E X A M
I N DU STR I AL & N ON R ES I DEN T I A L
Over 6 Years
Ago
41%
Within Past
Year
4%
Never
36%
4-6 Years Ago
12% 1-3 Years Ago
5%
Currently
3%
RESULTS OF LAST IRS INCOME EXAM
INDUSTRIAL & NONRESIDENTIAL
No Change
46%
Immaterial
Increase
48%
Immaterial
Decrease
3%
Material
Decrease
1%
Material
Increase
2%
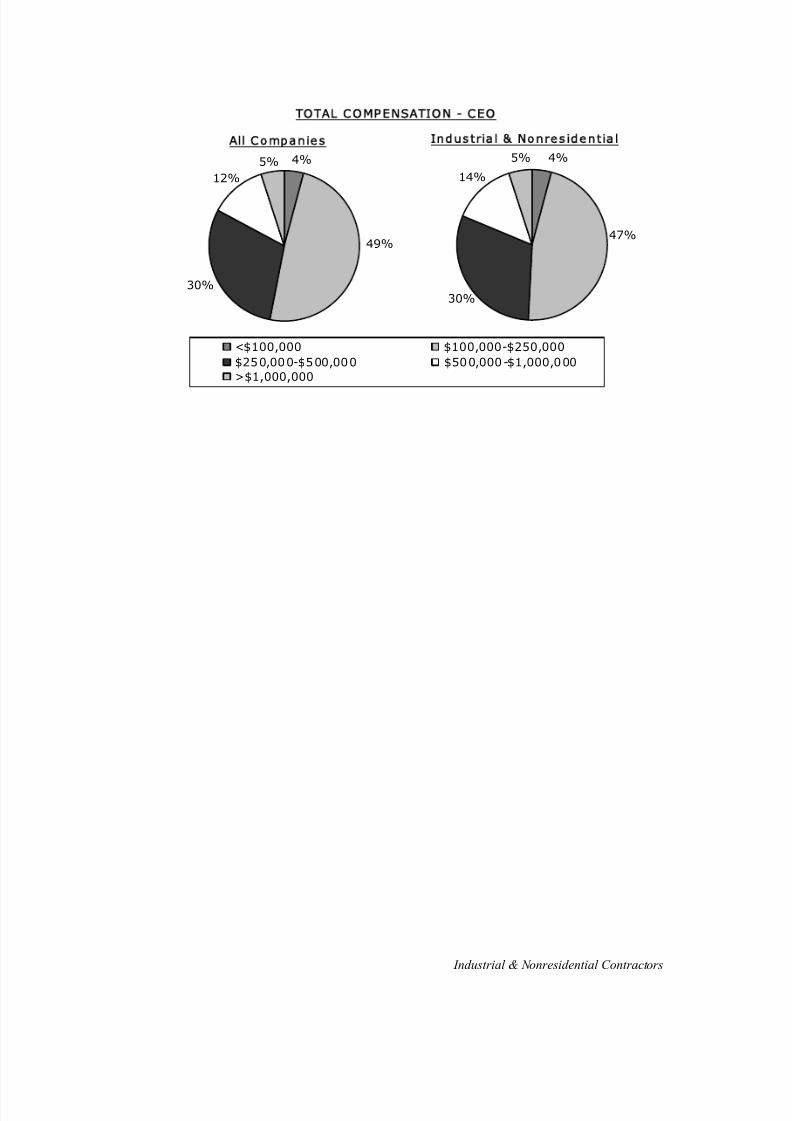
8/13/2019 2005 Financial Survey
http://slidepdf.com/reader/full/2005-financial-survey 112/284
Industrial & Nonresidential Contractors
T O T A L C O M P E N S A T IO N - C E O
47%
5%
14%
30%
4%
<$100,000 $100,000-$250,000
$250,000-$500,000 $500,000-$1,000,000
>$1,000,000
I n d u s t r i a l & N o n r e s i d e n t i a l
30%
5% 4%
12%
49%
A ll C o m p a n i e s
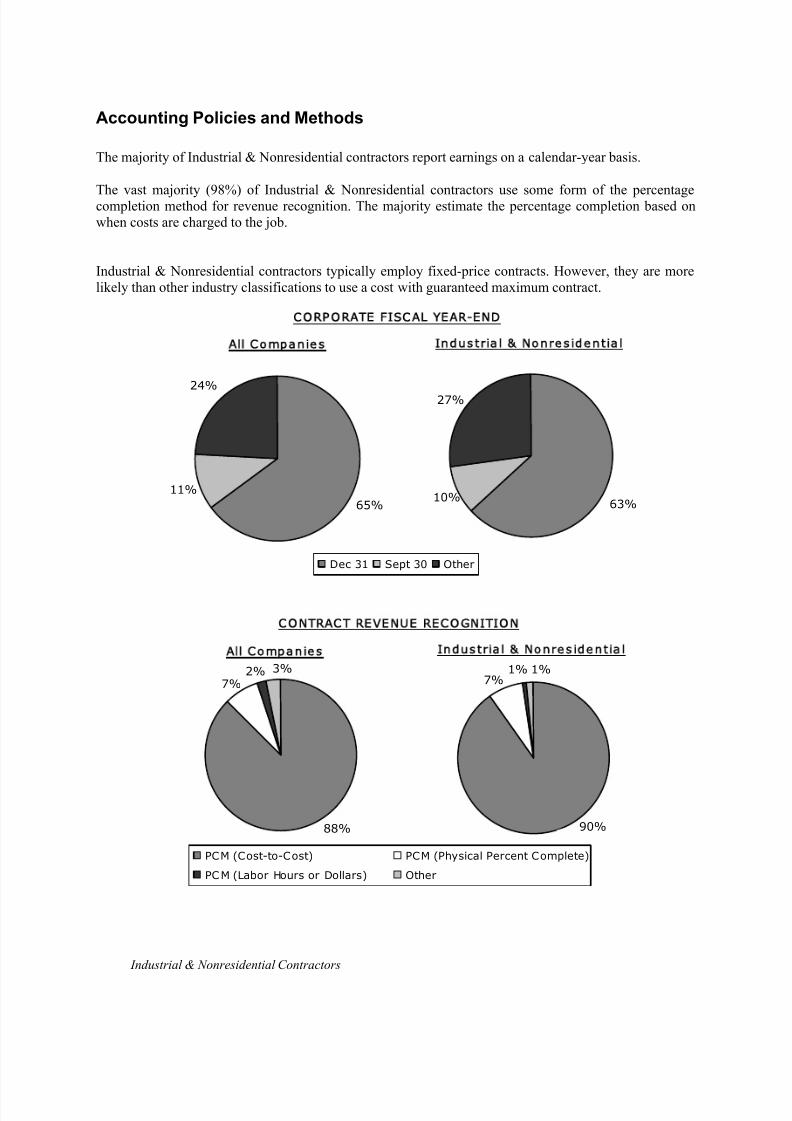
8/13/2019 2005 Financial Survey
http://slidepdf.com/reader/full/2005-financial-survey 113/284
Industrial & Nonresidential Contractors
Accounting Policies and Methods
The majority of Industrial & Nonresidential contractors report earnings on a calendar-year basis.
The vast majority (98%) of Industrial & Nonresidential contractors use some form of the percentagecompletion method for revenue recognition. The majority estimate the percentage completion based onwhen costs are charged to the job.
Industrial & Nonresidential contractors typically employ fixed-price contracts. However, they are morelikely than other industry classifications to use a cost with guaranteed maximum contract.
CORP ORATE FISCAL YEAR-END
63%
27%
10%
Dec 31 Sept 30 Other
Industrial & Nonresiden tial
24%
11%
65%
All Companies
CONTRACT REVENUE RECOGNITION
7%1%1%
90%
PCM (Cost-to-Cost) PCM (Physical Percent Complete)
PCM (Labor Hours or Dollars) Other
Industrial & Nonresidential
2%7%
3%
88%
All Companies
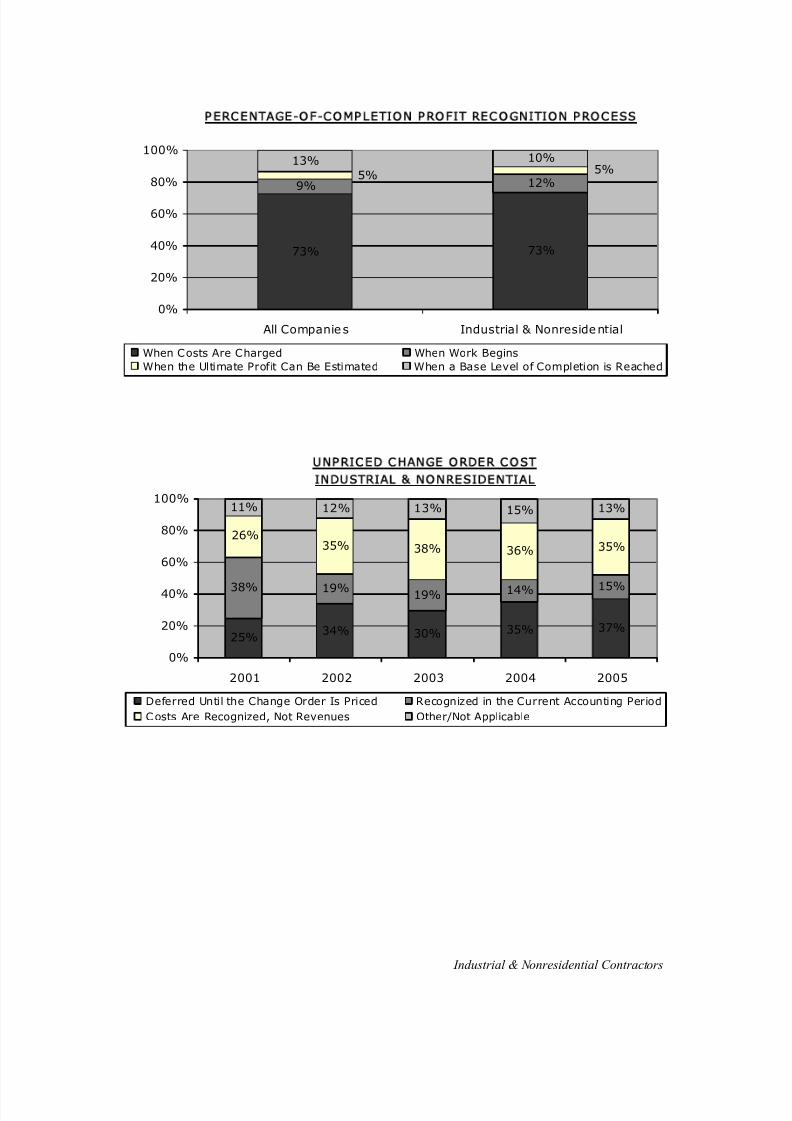
8/13/2019 2005 Financial Survey
http://slidepdf.com/reader/full/2005-financial-survey 114/284
Industrial & Nonresidential Contractors
73% 73%
9% 12%
13% 10%5%
5%
0%
20%
40%
60%
80%
100%
All Companies Industrial & Nonresidential
When Costs Are Charged When Work Begins
When the Ultimate Profit Can Be Estimated When a Base Level of Completion is Reached
P E R C E N T A G E -O F - C O M P L E T IO N P R O F I T R E C O G N I T IO N P R O C E S S
UNPRICED CHANGE ORDER COST
INDUSTRIAL & NONRESIDENTIAL
25%34% 30% 35% 37%
38% 19% 19% 14% 15%
38% 36% 35%
11% 12% 13% 15% 13%
35%26%
0%
20%
40%
60%
80%
100%
2001 2002 2003 2004 2005
Deferred Until the Change Order Is Priced Recognized in the Current Accounting Period
Costs Are Recognized, Not Revenues Other/Not Applicable
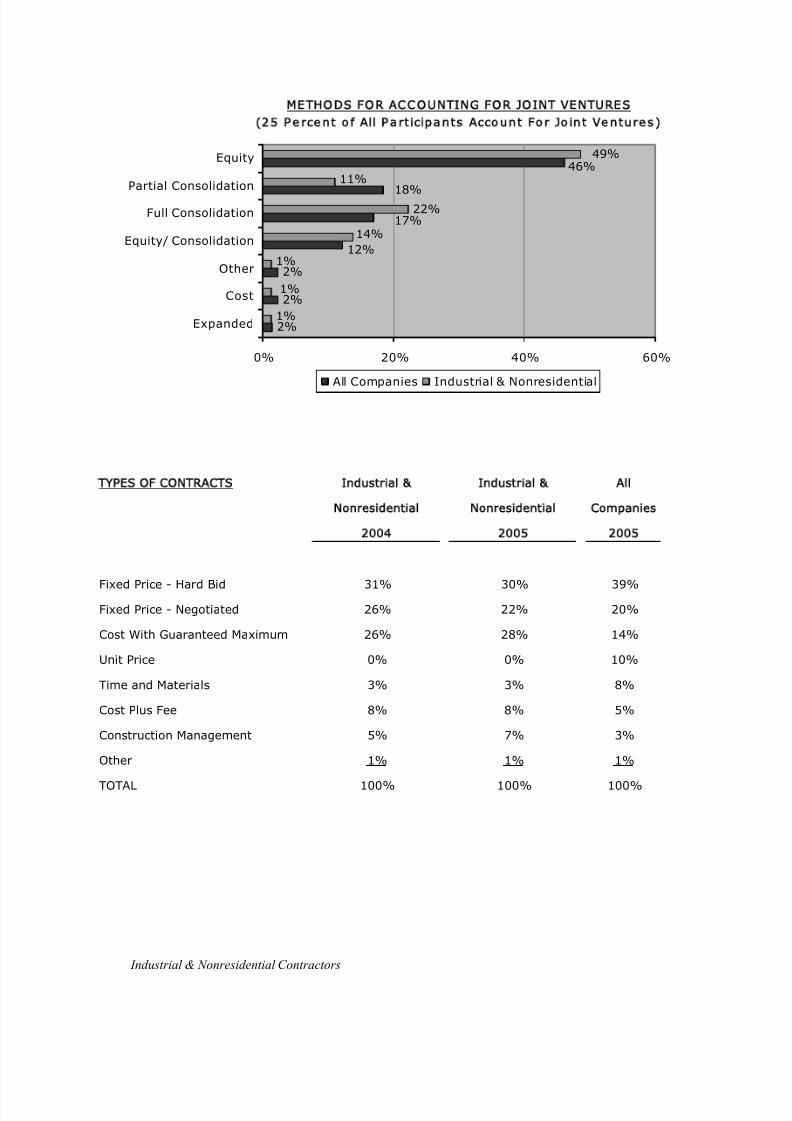
8/13/2019 2005 Financial Survey
http://slidepdf.com/reader/full/2005-financial-survey 115/284
Industrial & Nonresidential Contractors
2%
2%
2%
22%
12%
17%
18%
46%49%
11%
14%
1%
1%
1%
0% 20% 40% 60%
Expanded
Cost
Other
Equity/ Consolidation
Full Consolidation
Partial Consolidation
Equity
All Companies Industrial & Nonresidential
M E T H O D S F O R A C C O U N T I N G F O R J O I N T V E N T U R E S
( 2 5 P e r c e n t o f A ll P a r t ic ip a n t s A c c o u n t F o r Jo i n t V e n t u r e s )
TYPES OF CONTRACTS Industrial & Industrial & All
Nonresidential Nonresidential Companies
2004 2005 2005
Fixed Price - Hard Bid 31% 30% 39%
Fixed Price - Negotiated 26% 22% 20%
Cost With Guaranteed Maximum 26% 28% 14%
Unit Price 0% 0% 10%
Time and Materials 3% 3% 8%
Cost Plus Fee 8% 8% 5%
Construction Management 5% 7% 3%
Other 1% 1% 1%
TOTAL 100% 100% 100%
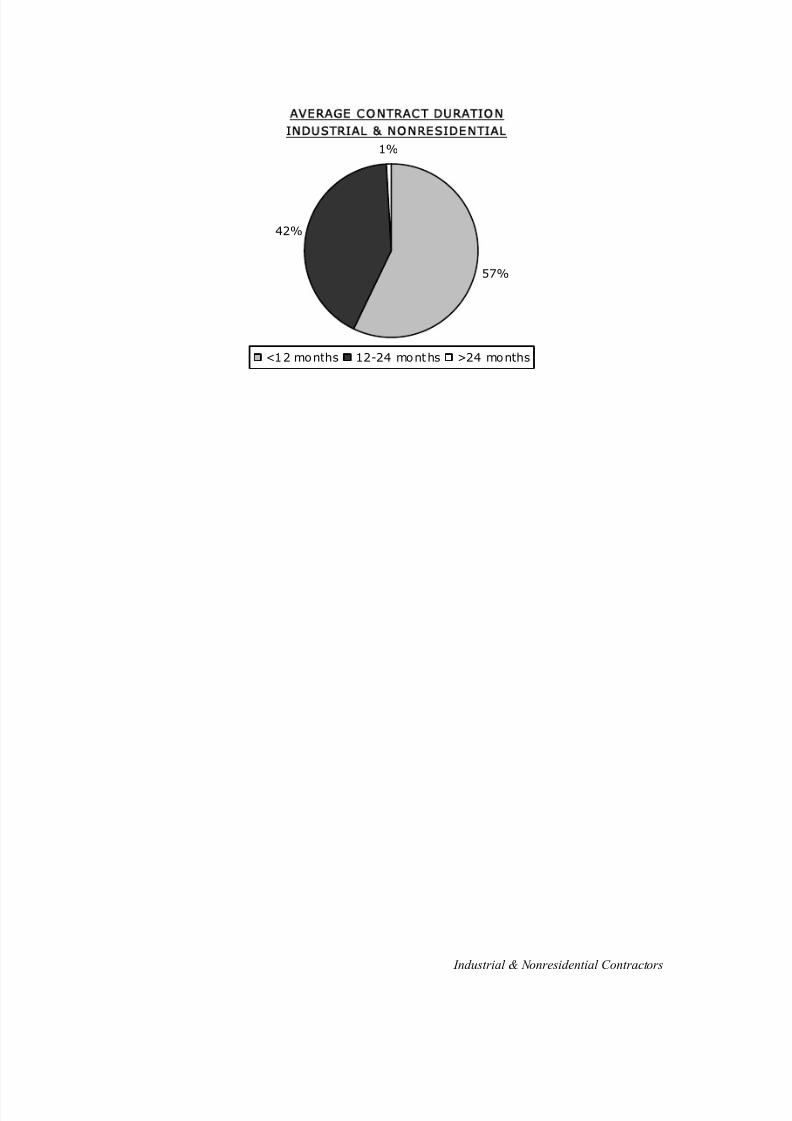
8/13/2019 2005 Financial Survey
http://slidepdf.com/reader/full/2005-financial-survey 116/284
Industrial & Nonresidential Contractors
AVERAGE CONTRACT DURATION
INDUSTRIAL & NONRESIDENTIAL
57%
42%
1%
<12 months 12-24 months >24 months

8/13/2019 2005 Financial Survey
http://slidepdf.com/reader/full/2005-financial-survey 117/284
Industrial & Nonresidential Contractors
Selected Financial Data
All Industrial &
All Companies Nonresidential
Number of Companies 532 227
Assets ( ) 33,053 41,193
Liabilities ( ) 22,937 31,511
Net Worth ( ) 10,071 9,633
Net Worth to Assets 30.5 % 23.4 %
Revenues ( ) 95,959 133,314
Gross Profit ( ) 7,444 7,111
Gross Profit Margin 7.8 % 5.3 %
SG&A Expense ( ) 5,844 5,763
SG&A Expense Margin 6.1 % 4.3 %
Net Earnings ( ) * 1,703 1,615
Net Earnings Margin * 1.8 % 1.2 %
Current Ratio 1.3 1.2Return on Assets 5.2 % 3.9 %
Return on Equity 16.9 % 16.8 %
* Before Taxes
Note: All dollar amounts are in thousands.
The level of participant overlap from year-to-year, usually around 60% to 70%, can impact financialresults materially. Differences seen in the financial statements between years are due in part to marketinfluences and individual company performance, as well as in part to the different makeup of the participant body each year.
Liquidity remained virtually constant in 2005. The current and quick ratios decreased slightly, but daysof cash increased from 17.1 to 19.7 days.
Profitability decreased in 2005. Income from operations went down from 1.2% to 1.0% due to anincrease in direct costs as a percentage of revenue. ROA declined from 4.6% to 3.9%, and ROE declinedfrom 19.4 to 16.8%.
Leverage increased slightly in 2005. Debt to equity was slightly higher, but the fixed asset ratiodecreased by 5.5% points to 20.2%.
Efficiency increased in 2005. The operating cycle extended by 1.8 days.
Backlog decreased in 2005. The average months in backlog went from 9.9 in 2004 to 8.6 in 2005.
The average total assets reported in the Industrial & Nonresidential sector was higher in 2005 at $41.2M,
compared to $31.6M in 2004.
The average total revenue reported was also higher at $133.3M in 2005 versus $105.5M in 2004.
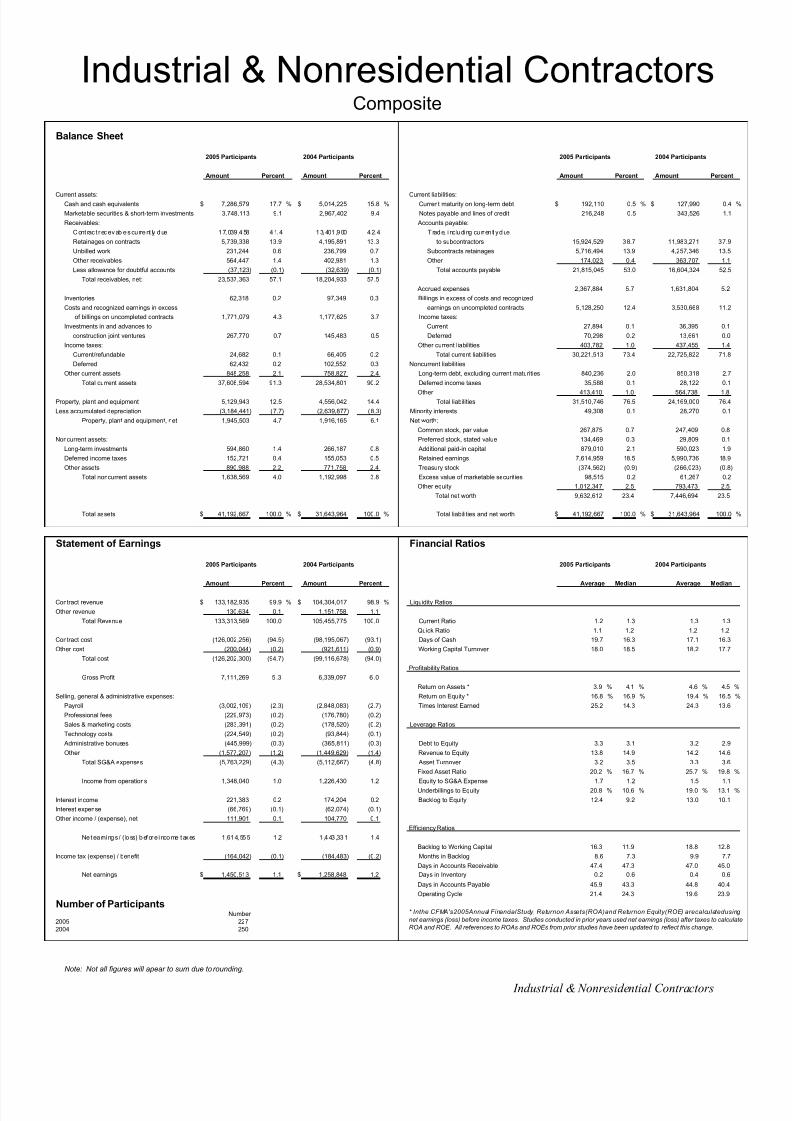
8/13/2019 2005 Financial Survey
http://slidepdf.com/reader/full/2005-financial-survey 118/284
Balance Sheet
2005 Participants 2004 Participants 2005 Participants 2004 Participants
Amount Percent Amount Percent Amount Percent Amount Percent
Current assets: Current liabilities:Cash and cash equivalents $ 7,286,579 17.7 % $ 5,014,225 15.8 % Current maturity on long-term debt $ 192,110 0.5 % $ 127,990 0.4 %
Marketable securities & short-term investments 3,748,113 9.1 2,967,402 9.4 Notes payable and lines of credit 216,248 0.5 343,526 1.1
Receivables: Accounts payable:
Cont rac t r eceivab les cu rrent ly due 17,039 ,458 41.4 13,401 ,900 42.4 T rade, i nc luding cu rren tl y due
Retainages on contracts 5,739,338 13.9 4,195,891 13.3 to subcontractors 15,924,529 38.7 11,983,271 37.9
Unbilled work 231,244 0.6 236,799 0.7 Subcontracts retainages 5,716,494 13.9 4,257,346 13.5
Other receivables 564,447 1.4 402,981 1.3 Other 174,023 0.4 363,707 1.1
Less allowance for doubtful accounts (37,123) (0.1) (32,639) (0.1) Total accounts payable 21,815,045 53.0 16,604,324 52.5
Total receivables, net: 23,537,363 57.1 18,204,933 57.5
Accrued expenses 2,367,884 5.7 1,631,804 5.2
Inventories 62,318 0.2 97,349 0.3 Billings in excess of costs and recognized
Costs and recognized earnings in excess earnings on uncompleted contracts 5,128,250 12.4 3,530,668 11.2
of billings on uncompleted contracts 1,771,079 4.3 1,177,625 3.7 Income taxes:
Investments in and advances to Current 27,894 0.1 36,395 0.1
construction joint ventures 267,770 0.7 145,483 0.5 Deferred 70,298 0.2 13,661 0.0
Income taxes: Other current liabilities 403,782 1.0 437,455 1.4
Current/refundable 24,682 0.1 66,405 0.2 Total current liabilities 30,221,513 73.4 22,725,822 71.8
Deferred 62,432 0.2 102,552 0.3 Noncurrent liabilities
Other current assets 848,258 2.1 758,827 2.4 Long-term debt, excluding current maturities 840,236 2.0 850,318 2.7
Total current assets 37,608,594 91.3 28,534,801 90.2 Deferred income taxes 35,588 0.1 28,122 0.1
Other 413,410 1.0 564,738 1.8Property, plant and equipment 5,129,943 12.5 4,556,042 14.4 Total liabilities 31,510,746 76.5 24,169,000 76.4
Less accumulated depreciation (3,184,441) (7.7) (2,639,877) (8.3) Minority interests 49,308 0.1 28,270 0.1
Property, plant and equipment, net 1,945,503 4.7 1,916,165 6.1 Net worth:
Common stock, par value 267,875 0.7 247,409 0.8
Noncurrent assets: Preferred stock, stated value 134,469 0.3 29,809 0.1
Long-term investments 594,860 1.4 266,187 0.8 Additional paid-in capital 879,010 2.1 590,023 1.9
Deferred income taxes 152,721 0.4 155,053 0.5 Retained earnings 7,614,959 18.5 5,990,736 18.9
Other assets 890,988 2.2 771,758 2.4 Treasury stock (374,562) (0.9) (266,023) (0.8)
Total noncurrent assets 1,638,569 4.0 1,192,998 3.8 Excess value of marketable securities 98,515 0.2 61,267 0.2
Other equity 1,012,347 2.5 793,473 2.5
Total net worth 9,632,612 23.4 7,446,694 23.5
Total assets $ 41,192,667 100.0 % $ 31,643,964 100.0 % Total liabilities and net worth $ 41,192,667 100.0 % $ 31,643,964 100.0 %
Statement of Earnings Financial Ratios
2005 Participants 2004 Participants 2005 Participants 2004 Participants
Amount Percent Amount Percent Average Median Average Median
Contract revenue $ 133,182,935 99.9 % $ 104,304,017 98.9 % Liquidity Ratios
Other revenue 130,634 0.1 1,151,758 1.1
Total Revenue 133,313,569 100.0 105,455,775 100.0 Current Ratio 1.2 1.3 1.3 1.3
Quick Ratio 1.1 1.2 1.2 1.2
Contract cost (126,002,256) (94.5) (98,195,067) (93.1) Days of Cash 19.7 16.3 17.1 16.3
Other cost (200,044) (0.2) (921,611) (0.9) Working Capital Turnover 18.0 18.5 18.2 17.7
Total cost (126,202,300) (94.7) (99,116,678) (94.0)
Profitability Ratios
Gross Profit 7,111,269 5.3 6,339,097 6.0
Return on Assets * 3.9 % 4.1 % 4.6 % 4.5 %
Selling, general & administrative expenses: Return on Equity * 16.8 % 16.9 % 19.4 % 16.5 %
Payroll (3,002,109) (2.3) (2,848,083) (2.7) Times Interest Earned 25.2 14.3 24.3 13.6
Professional fees (229,973) (0.2) (176,780) (0.2)
Sales & marketing costs (283,391) (0.2) (178,520) (0.2) Leverage Ratios
Technology costs (224,549) (0.2) (93,844) (0.1)
Administrative bonuses (445,999) (0.3) (365,811) (0.3) Debt to Equity 3.3 3.1 3.2 2.9
Other (1,577,207) (1.2) (1,449,629) (1.4) Revenue to Equity 13.8 14.9 14.2 14.6
Total SG&A expenses (5,763,229) (4.3) (5,112,667) (4.8) Asset Turnover 3.2 3.5 3.3 3.6
Fixed Asset Ratio 20.2 % 16.7 % 25.7 % 19.8 %
Income from operations 1,348,040 1.0 1,226,430 1.2 Equity to SG&A Expense 1.7 1.2 1.5 1.1
Underbillings to Equity 20.8 % 10.6 % 19.0 % 13.1 %
Interest income 221,383 0.2 174,204 0.2 Backlog to Equity 12.4 9.2 13.0 10.1
Interest expense (66,769) (0.1) (62,074) (0.1)
Other income / (expense), net 111,901 0.1 104,770 0.1
Efficiency Ratios
Ne t ea rnings / ( loss) before i ncome taxes 1 ,614,555 1 .2 1 ,443 ,331 1 .4
Backlog to Working Capital 16.3 11.9 18.8 12.8
Income tax (expense) / benefit (164,042) (0.1) (184,483) (0.2) Months in Backlog 8.6 7.3 9.9 7.7
Days in Accounts Receivable 47.4 47.3 47.0 45.0
Net earnings $ 1,450,513 1.1 $ 1,258,848 1.2 Days in Inventory 0.2 0.6 0.4 0.6
Days in Accounts Payable 45.9 43.3 44.8 40.4
Operating Cycle 21.4 24.3 19.6 23.9
Number of ParticipantsNumber
2005 2272004 250
Note: Not all figures will apear to sum due to rounding.
Composite
Industrial & Nonresidential Contractors
* Inthe CFMA's2005Annual FinancialStudy, Returnon Assets(ROA)and Returnon Equity(ROE) arecalculatedusing
net earnings (loss) before income taxes. Studies conducted in prior years used net earnings (loss) after taxes to calculate
ROA and ROE. All references to ROAs and ROEs from prior studies have been updated to reflect this change.
Industrial & Nonresidential Contractors
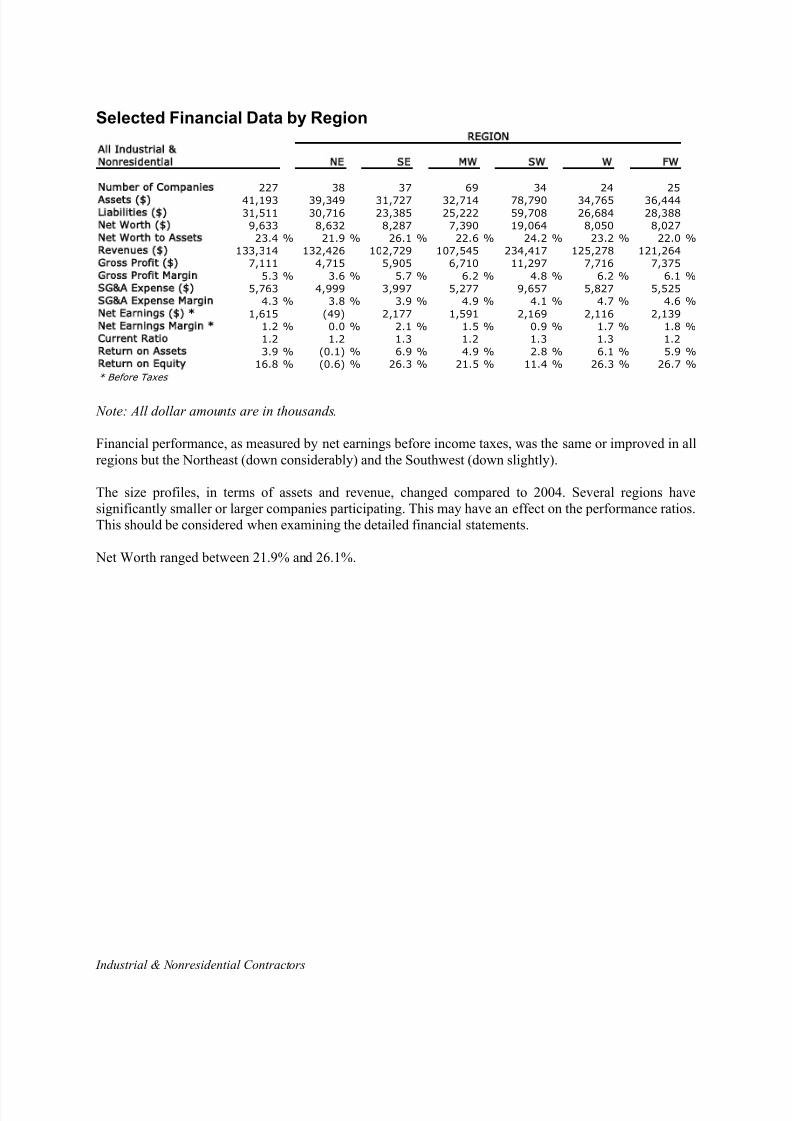
8/13/2019 2005 Financial Survey
http://slidepdf.com/reader/full/2005-financial-survey 119/284
Industrial & Nonresidential Contractors
Selected Financial Data by Region
All Industrial &
Nonresidential NE SE MW SW W FW
Number of Companies 227 38 37 69 34 24 25
Assets ( ) 41,193 39,349 31,727 32,714 78,790 34,765 36,444
Liabilities ( ) 31,511 30,716 23,385 25,222 59,708 26,684 28,388
Net Worth ( ) 9,633 8,632 8,287 7,390 19,064 8,050 8,027
Net Worth to A ssets 23.4 % 21.9 % 26.1 % 22.6 % 24.2 % 23.2 % 22.0 %
Revenues ( ) 133,314 132,426 102,729 107,545 234,417 125,278 121,264
Gross Profit ( ) 7,111 4,715 5,905 6,710 11,297 7,716 7,375
Gross Profit Margin 5.3 % 3.6 % 5.7 % 6.2 % 4.8 % 6.2 % 6.1 %
SG&A Expense ( ) 5,763 4,999 3,997 5,277 9,657 5,827 5,525
SG&A Expense Margin 4.3 % 3.8 % 3.9 % 4.9 % 4.1 % 4.7 % 4.6 %
Net Earnings ( ) * 1,615 (49) 2,177 1,591 2,169 2,116 2,139
Net Earnings Margin * 1.2 % 0.0 % 2.1 % 1.5 % 0.9 % 1.7 % 1.8 %
Current Ratio 1.2 1.2 1.3 1.2 1.3 1.3 1.2
Return on Assets 3.9 % (0.1) % 6.9 % 4.9 % 2.8 % 6.1 % 5.9 %
Return on Equity 16.8 % (0.6) % 26.3 % 21.5 % 11.4 % 26.3 % 26.7 %
* Before Taxes
REGION
Note: All dollar amounts are in thousands.
Financial performance, as measured by net earnings before income taxes, was the same or improved in allregions but the Northeast (down considerably) and the Southwest (down slightly).
The size profiles, in terms of assets and revenue, changed compared to 2004. Several regions havesignificantly smaller or larger companies participating. This may have an effect on the performance ratios.This should be considered when examining the detailed financial statements.
Net Worth ranged between 21.9% and 26.1%.

8/13/2019 2005 Financial Survey
http://slidepdf.com/reader/full/2005-financial-survey 120/284
Balance Sheet
2005 Participants 2004 Participants 2005 Participants 2004 Participants
Amount Percent Amount Percent Amount Percent Amount Percent
Current assets: Current liabilities:
Cash and cash equivalents $ 8,162,985 20.7 % $ 3,855,602 18.4 % Current maturity on long-term debt $ 430,091 1.1 % $ 93,971 0.4 %Marketable securities & short-term investments 1,326,224 3.4 1,295,167 6.2 Notes payable and lines of credit 141,006 0.4 282,281 1.3
Receivables: Accounts payable:
Contr act r ecei va ble s c urr ent ly du e 15, 592, 219 3 9.6 8 ,483 ,81 9 4 0.5 Tr ade, inc lu din g c urr ent ly due
Retainages on contracts 5,621,917 14.3 2,423,656 11.6 to subcontractors 15,949,653 40.5 9,473,026 4 5.3
Unbilled work 473,504 1.2 147,657 0.7 Subcontracts retainages 5,850,718 14.9 1,575,031 7.5
Other receivables 312,477 0.8 221,196 1.1 Other 133,345 0.3 20,500 0.1
Less allowance for doubtful accounts (42,589) (0.1) (32,637) (0.2) Total accounts payable 21,933,716 55.7 11,068,557 52.9
Total receivables, net: 21,957,528 55.8 11,243,690 53.7
Accrued expenses 2,080,541 5.3 1,041,641 5.0
Inventories 59,003 0.1 74,789 0.4 Billings in excess of costs and recognized
Costs and recognized earnings in excess earnings on uncompleted contracts 4,271,166 10.9 1,934,494 9.2
of billings on uncompleted contracts 1,761,403 4.5 783,687 3.7 Income taxes:
Investments in and advances to Current 13,108 0.0 25,064 0.1
construction joint ventures 402,187 1.0 226,799 1.1 Deferred 45,872 0.1 41,093 0.2
Income taxes: Other current liabilities 175,225 0.4 316,907 1.5
Current/refundable 42,809 0.1 9,675 0.0 Total current liabilities 29,090,724 73.9 14,804,008 70.7
Deferred 280,855 0.7 56,897 0.3 Noncurrent liabilities
Other current assets 815,520 2.1 589,033 2.8 Long-term debt, excluding current maturities 1,025,282 2.6 1,046,914 5.0
Total current assets 34,808,515 88.5 18,135,340 86.7 Deferred income taxes 37,354 0.1 7,399 0.0
Other 562,196 1.4 88,704 0.4
Property, plant and equipment 6,311,386 16.0 5,012,572 24.0 Total liabilities 30,715,556 78.1 15,947,025 76.2
Less accumulated depreciation (3,629,507) (9.2) (2,946,097) (14.1) Minority interests 944 0.0 3,287 0.0
Property, plant and equipment, net 2,681,879 6.8 2,066,475 9.9 Net worth:
Common stock, par value 112,540 0.3 223,212 1.1
Noncurrent assets: Preferred stock, stated value 6,189 0.0 5,843 0.0
Long-term investments 1,360,295 3.5 199,487 1.0 Additional paid-in capital 1,180,637 3.0 316,829 1.5
Deferred income taxes 194,566 0.5 5,878 0.0 Retained earnings 7,460,838 19.0 4,731,992 22.6
Other assets 303,468 0.8 520,249 2.5 Treasury stock (507,819) (1.3) (630,622) (3.0)
Total noncurrent assets 1,858,329 4.7 725,613 3.5 Excess value of marketable securities 7,028 0.0 7,111 0.0
Other equity 372,809 0.9 322,750 1.5
Total net worth 8,632,223 21.9 4,977,116 23.8
Total assets $ 39,348,722 100.0 % $ 20,927,428 100.0 % Total liabilities and net worth $ 39,348,722 100.0 % $ 20,927,428 100.0 %
Statement of Earnings Financial Ratios
2005 Participants 2004 Participants 2005 Participants 2004 Participants
Amount Percent Amount Percent Average Median Average Median
Contract revenue $ 132,362,360 100.0 % $ 69,581,502 100.0 % Liquidity Ratios
Other revenue 63,886 0.0 33,782 0.0
Total Revenue 132,426,246 100.0 69,615,284 100.0 Current Ratio 1.2 1.2 1.2 1.2
Quick Ratio 1.1 1.2 1.1 1.1
Contract cost (127,662,871) (96.4) (65,211,580) (93.7) Days of Cash 22.2 16.9 19.9 21.3
Other cost (48,187) (0.0) 0 0.0 Working Capital Turnover 23.2 16.8 20.9 15.5
Total cost (127,711,058) (96.4) (65,211,580) (93.7)
Profitability Ratios
Gross Profit 4,715,188 3.6 4,403,704 6.3
Return on Assets * (0.1) % 2.9 % 4.6 % 4.7 %
Selling, general & administrative expenses: Return on Equity * (0.6) % 14.1 % 19.3 % 18.8 %
Payroll (2,761,995) (2.1) (1,892,919) (2.7) Times Interest Earned 0.5 10.1 16.9 19.5
Professional fees (173,102) (0.1) (122,558) (0.2)
Sales & marketing costs (590,523) (0.4) (140,647) (0.2) Leverage Ratios
Technology costs (345,990) (0.3) (70,779) (0.1)
Administrative bonuses (341,821) (0.3) (217,775) (0.3) Debt to Equity 3.6 3.3 3.2 3.0
Other (785,160) (0.6) (1,286,914) (1.8) Revenue to Equity 15.3 14.3 14.0 15.3
Total SG&A expenses (4,998,591) (3.8) (3,731,591) (5.4) Asset Turnover 3.4 3.3 3.3 3.5
Fixed Asset Ratio 31.1 % 12.2 % 41.5 % 18.0 %
Income from operations (283,403) (0.2) 672,113 1.0 Equity to SG&A Expense 1.7 1.4 1.3 1.0
Underbillings to Equity 25.9 % 17.0 % 18.7 % 13.6 %
Interest income 173,032 0.1 36,461 0.1 Backlog to Equity 14.5 9.5 17.0 12.2
Interest expense (93,218) (0.1) (60,299) (0.1)
Other income / (expense), net 155,015 0.1 312,934 0.4
Efficiency Ratios
Net ear ni ngs / ( los s) bef or e i nco me t axes ( 48, 575) ( 0. 0) 961, 210 1. 4
Backlog to Working Capital 23.1 11.4 24.1 12.3
Income tax (expense) / benefit (286,146) (0.2) (56,670) (0.1) Months in Backlog 8.3 8.0 13.4 9.5
Days in Accounts Receivable 43.1 49.2 44.8 45.5
Net earnings $ (334,720) (0.3) % $ 904,539 1.3 % Days in Inventory 0.2 0.5 0.4 1.2
Days in Accounts Payable 45.3 47.4 52.4 49.5
Operating Cycle 20.1 24.0 12.8 20.2
Number of ParticipantsNumber
2005 382004 33
Note: Not all figures will apear to sum due to rounding.
Industrial & Nonresidential ContractorsNortheast Region
Industrial & Nonresidential Contractors
* In theCFMA's 2005 Annual Financial Study, Returnon Assets(ROA)and Returnon Equity (ROE) are calculated using
net earnings (loss) before income taxes. Studies conducted in prior years used net earnings (loss) after taxes to
calculate ROA and ROE. All references to ROAs and ROEs from prior studies have been updated to reflect this change.

8/13/2019 2005 Financial Survey
http://slidepdf.com/reader/full/2005-financial-survey 121/284
Balance Sheet
2005 Participants 2004 Participants 2005 Participants 2004 Participants
Amount Percent Amount Percent Amount Percent Amount Percent
Current assets: Current liabilities:
Cash and cash equivalents $ 4,878,814 15.4 % $ 4,584,306 13.6 % Current maturity on long-term debt $ 139,142 0.4 % $ 53,931 0.2 %
Marketable securities & short-term investments 3,452,596 10.9 2,904,027 8.6 Notes payable and lines of credit 34,922 0.1 108,736 0.3
Receivables: Accounts payable:
Contr act r ecei va ble s c urr ent ly du e 14, 138, 752 4 4.6 14, 180, 133 4 2.0 Tr ade, inc lu din g c urr ent ly due
Retainages on contracts 4,125,667 13.0 4,325,581 12.8 to subcontractors 11,117,997 35.0 10,407,931 30.8
Unbilled work 76,552 0.2 407,750 1.2 Subcontracts retainages 3,971,756 12.5 4,123,009 12.2
Other receivables 153,641 0.5 222,146 0.7 Other 101,174 0.3 102,273 0.3
Less allowance for doubtful accounts (29,244) (0.1) (23,717) (0.1) Total accounts payable 15,190,927 47.9 14,633,213 43.3
Total receivables, net: 18,465,368 58.2 19,111,892 56.6
Accrued expenses 1,224,092 3.9 2,204,725 6.5
Inventories 1,422 0.0 8,160 0.0 Billings in excess of costs and recognized
Costs and recognized earnings in excess earnings on uncompleted contracts 5,970,390 18.8 5,460,909 16.2
of billings on uncompleted contracts 1,249,838 3.9 1,402,835 4.2 Income taxes:
Investments in and advances to Current 25,215 0.1 13,878 0.0
construction joint ventures 49,772 0.2 136,702 0.4 Deferred 304 0.0 6,349 0.0
Income taxes: Other current liabilities 132,001 0.4 640,631 1.9
Current/refundable 7,850 0.0 219,838 0.7 Total current liabilities 22,716,993 71.6 23,122,371 68.5
Deferred 1,223 0.0 272,587 0.8 Noncurrent liabilities
Other current assets 360,881 1.1 652,905 1.9 Long-term debt, excluding current maturities 375,453 1.2 760,483 2.3
Total current assets 28,467,764 89.7 29,293,252 86.8 Deferred income taxes 3,463 0.0 60,574 0.2
Other 288,691 0.9 853,154 2.5
Property, plant and equipment 4,432,261 14.0 5,257,155 15.6 Total liabilities 23,384,600 73.7 24,796,582 73.4
Less accumulated depreciation (2,246,859) (7.1) (2,823,834) (8.4) Minority interests 55,398 0.2 85,615 0.3
Property, plant and equipment, net 2,185,402 6.9 2,433,322 7.2 Net worth:
Common stock, par value 142,522 0.4 201,048 0.6
Noncurrent assets: Preferred stock, stated value 6,720 0.0 119,646 0.4
Long-term investments 160,687 0.5 648,764 1.9 Additional paid-in capital 361,286 1.1 862,892 2.6
Deferred income taxes 10,540 0.0 353,366 1.0 Retained earnings 3,771,629 11.9 4,802,066 14.2
Other assets 902,250 2.8 1,033,638 3.1 Treasury stock (214,521) (0.7) (16,167) (0.0)
Total noncurrent assets 1,073,477 3.4 2,035,767 6.0 Excess value of marketable securities 419,331 1.3 229,802 0.7
Other equity 3,799,677 12.0 2,680,856 7.9
Total net worth 8,286,645 26.1 8,880,143 26.3
Total assets $ 31,726,643 100.0 % $ 33,762,340 100.0 % Total liabilities and net worth $ 31,726,643 100.0 % $ 33,762,340 100.0 %
Statement of Earnings Financial Ratios
2005 Participants 2004 Participants 2005 Participants 2004 Participants
Amount Percent Amount Percent Average Median Average Median
Contract revenue $ 102,688,507 100.0 % $ 116,777,723 96.6 % Liquidity Ratios
Other revenue 40,057 0.0 4,135,785 3.4
Total Revenue 102,728,564 100.0 120,913,508 100.0 Current Ratio 1.3 1.3 1.3 1.3
Quick Ratio 1.2 1.3 1.2 1.2
Contract cost (96,808,682) (94.2) (109,372,131) (90.5) Days of Cash 17.1 16.6 13.6 15.8
Other cost (15,155) (0.0) (3,262,689) (2.7) Working Capital Turnover 17.9 16.3 19.6 18.3
Total cost (96,823,837) (94.3) (112,634,821) (93.2)
Profitability Ratios
Gross Profit 5,904,726 5.7 8,278,688 6.8
Return on Assets * 6.9 % 4.4 % 6.1 % 4.4 %
Selling, general & administrative expenses: Return on Equity * 26.3 % 15.1 % 23.3 % 14.6 %
Payroll (1,701,515) (1.7) (3,533,506) (2.9) Times Interest Earned 56.6 17.9 37.6 16.3
Professional fees (102,489) (0.1) (182,751) (0.2)
Sales & marketing costs (175,736) (0.2) (205,320) (0.2) Leverage Ratios
Technology costs (89,808) (0.1) (104,165) (0.1)
Administrative bonuses (268,938) (0.3) (410,132) (0.3) Debt to Equity 2.8 2.5 2.8 2.5
Other (1,658,752) (1.6) (1,902,557) (1.6) Revenue to Equity 12.4 13.1 13.6 12.3
Total SG&A expenses (3,997,238) (3.9) (6,338,432) (5.2) Asset Turnover 3.2 3.6 3.6 3.8
Fixed Asset Ratio 26.4 % 17.7 % 27.4 % 25.2 %
Income from operations 1,907,488 1.9 1,940,256 1.6 Equity to SG&A Expense 2.1 1.2 1.4 1.1
Underbillings to Equity 16.0 % 15.2 % 20.4 % 11.5 %
Interest income 106,690 0.1 117,098 0.1 Backlog to Equity 9.1 7.8 9.9 7.1
Interest expense (39,169) (0.0) (56,551) (0.0)Other income / (expense), net 202,223 0.2 67,005 0.1
Efficiency Ratios
Net ear ni ngs / ( los s) bef or e i nco me t axes 2, 177 ,23 1 2. 1 2 ,06 7,80 9 1. 7
Backlog to Working Capital 15.7 10.2 15.5 9.0
Income tax (expense) / benefit (67,617) (0.1) (239,875) (0.2) Months in Backlog 8.1 6.8 7.5 7.0
Days in Accounts Receivable 50.0 47.5 42.8 42.1
Net earnings $ 2,109,614 2.1 % $ 1,827,934 1.5 % Days in Inventory 0.0 0.2 0.0 0.3
Days in Accounts Payable 41.7 40.7 33.6 35.2
Operating Cycle 25.4 30.5 22.9 26.7
Number of ParticipantsNumber
2005 372004 48
Industrial & Nonresidential Contractors
Note: Not all figures will apear to sum due to rounding.
Southeast Region
* In theCFMA's 2005 Annual Financial Study, Returnon Assets(ROA)and Returnon Equity (ROE) are calculated using
net earnings (loss) before income taxes. Studies conducted in prior years used net earnings (loss) after taxes to
calculate ROA and ROE. All references to ROAs and ROEs from prior studies have been updated to reflect this change.
Industrial & Nonresidential Contractors
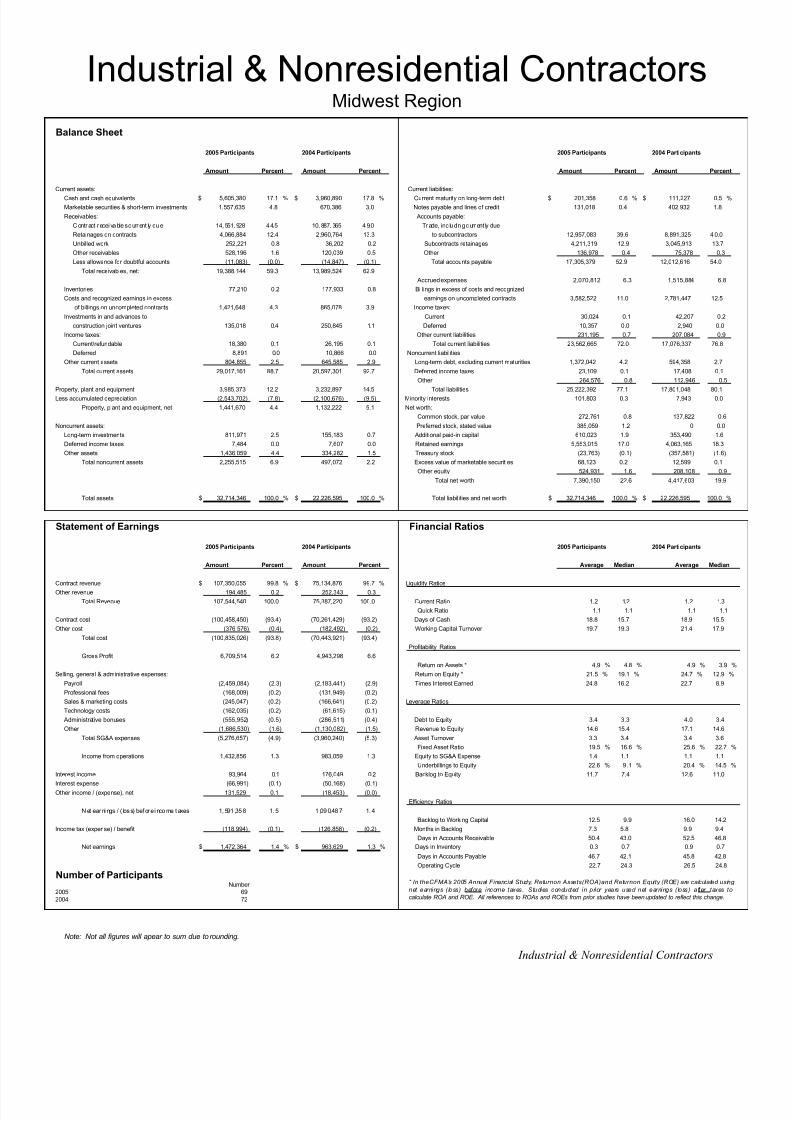
8/13/2019 2005 Financial Survey
http://slidepdf.com/reader/full/2005-financial-survey 122/284
Balance Sheet
2005 Participants 2004 Participants 2005 Participants 2004 Participants
Amount Percent Amount Percent Amount Percent Amount Percent
Current assets: Current liabilities:
Cash and cash equivalents $ 5,605,380 17.1 % $ 3,960,890 17.8 % Current maturity on long-term debt $ 201,358 0.6 % $ 111,227 0.5 %
Marketable securities & short-term investments 1,557,635 4.8 670,386 3.0 Notes payable and lines of credit 131,018 0.4 402,932 1.8
Receivables: Accounts payable:
Contr act r ecei va ble s c urr ent ly du e 14, 551, 928 4 4.5 10, 887, 365 4 9.0 Tr ade, inc lu din g c urr ent ly due
Retainages on contracts 4,066,884 12.4 2,960,764 13.3 to subcontractors 12,957,083 39.6 8,891,325 4 0.0
Unbilled work 252,221 0.8 36,202 0.2 Subcontracts retainages 4,211,319 12.9 3,045,913 13.7
Other receivables 528,196 1.6 120,039 0.5 Other 136,978 0.4 75,378 0.3
Less allowance for doubtful accounts (11,083) (0.0) (14,847) (0.1) Total accounts payable 17,305,379 52.9 12,012,616 54.0
Total receivables, net: 19,388,144 59.3 13,989,524 62.9
Accrued expenses 2,070,812 6.3 1,515,884 6.8
Inventories 77,210 0.2 177,933 0.8 Billings in excess of costs and recognized
Costs and recognized earnings in excess earnings on uncompleted contracts 3,582,522 11.0 2,781,447 12.5
of billings on uncompleted contracts 1,421,648 4.3 865,078 3.9 Income taxes:
Investments in and advances to Current 30,024 0.1 42,207 0.2
construction joint ventures 135,018 0.4 250,845 1.1 Deferred 10,357 0.0 2,940 0.0
Income taxes: Other current liabilities 231,195 0.7 207,084 0.9
Current/refundable 18,380 0.1 26,195 0.1 Total current liabilities 23,562,665 72.0 17,076,337 76.8
Deferred 8,891 0.0 10,866 0.0 Noncurrent liabilities
Other current assets 804,855 2.5 645,585 2.9 Long-term debt, excluding current maturities 1,372,042 4.2 594,358 2.7
Total current assets 29,017,161 88.7 20,597,301 92.7 Deferred income taxes 23,109 0.1 17,408 0.1
Other 264,576 0.8 112,946 0.5
Property, plant and equipment 3,985,373 12.2 3,232,897 14.5 Total liabilities 25,222,392 77.1 17,801,048 80.1
Less accumulated depreciation (2,543,702) (7.8) (2,100,676) (9.5) Minority interests 101,803 0.3 7,943 0.0
Property, plant and equipment, net 1,441,670 4.4 1,132,222 5.1 Net worth:
Common stock, par value 272,761 0.8 137,822 0.6
Noncurrent assets: Preferred stock, stated value 385,059 1.2 0 0.0
Long-term investments 811,971 2.5 155,183 0.7 Additional paid-in capital 610,023 1.9 353,490 1.6
Deferred income taxes 7,484 0.0 7,607 0.0 Retained earnings 5,553,015 17.0 4,063,165 18.3
Other assets 1,436,059 4.4 334,282 1.5 Treasury stock (23,763) (0.1) (357,581) (1.6)
Total noncurrent assets 2,255,515 6.9 497,072 2.2 Excess value of marketable securities 68,123 0.2 12,599 0.1
Other equity 524,931 1.6 208,108 0.9
Total net worth 7,390,150 22.6 4,417,603 19.9
Total assets $ 32,714,346 100.0 % $ 22,226,595 100.0 % Total liabilities and net worth $ 32,714,346 100.0 % $ 22,226,595 100.0 %
Statement of Earnings Financial Ratios
2005 Participants 2004 Participants 2005 Participants 2004 Participants
Amount Percent Amount Percent Average Median Average Median
Contract revenue $ 107,350,055 99.8 % $ 75,134,876 99.7 % Liquidity Ratios
Other revenue 194,485 0.2 252,343 0.3
Total Revenue 107,544,540 100.0 75,387,220 100.0 Current Ratio 1.2 1.2 1.2 1.3
Quick Ratio 1.1 1.1 1.1 1.1
Contract cost (100,458,450) (93.4) (70,261,429) (93.2) Days of Cash 18.8 15.7 18.9 15.5
Other cost (376,576) (0.4) (182,492) (0.2) Working Capital Turnover 19.7 19.3 21.4 17.9
Total cost (100,835,026) (93.8) (70,443,921) (93.4)
Profitability Ratios
Gross Profit 6,709,514 6.2 4,943,298 6.6
Return on Assets * 4.9 % 4.8 % 4.9 % 3.9 %
Selling, general & administrative expenses: Return on Equity * 21.5 % 19.1 % 24.7 % 12.9 %
Payroll (2,459,084) (2.3) (2,183,441) (2.9) Times Interest Earned 24.8 16.2 22.7 8.9
Professional fees (168,009) (0.2) (131,949) (0.2)
Sales & marketing costs (245,047) (0.2) (166,641) (0.2) Leverage Ratios
Technology costs (162,035) (0.2) (61,615) (0.1)
Administrative bonuses (555,952) (0.5) (286,511) (0.4) Debt to Equity 3.4 3.3 4.0 3.4
Other (1,686,530) (1.6) (1,130,082) (1.5) Revenue to Equity 14.6 15.4 17.1 14.6
Total SG&A expenses (5,276,657) (4.9) (3,960,240) (5.3) Asset Turnover 3.3 3.4 3.4 3.6
Fixed Asset Ratio 19.5 % 16.6 % 25.6 % 22.7 %
Income from operations 1,432,856 1.3 983,059 1.3 Equity to SG&A Expense 1.4 1.1 1.1 1.1
Underbillings to Equity 22.6 % 9 .1 % 20.4 % 14.5 %
Interest income 93,964 0.1 176,049 0.2 Backlog to Equity 11.7 7.4 12.6 11.0
Interest expense (66,991) (0.1) (50,168) (0.1)Other income / (expense), net 131,529 0.1 (18,453) (0.0)
Efficiency Ratios
Net ear ni ngs / ( los s) bef or e i nco me t axes 1, 591 ,35 8 1. 5 1 ,09 0,48 7 1. 4
Backlog to Working Capital 12.5 9.9 16.0 14.2
Income tax (expense) / benefit (118,994) (0.1) (126,858) (0.2) Months in Backlog 7.3 5.8 9.9 9.4
Days in Accounts Receivable 50.4 43.0 52.5 46.8
Net earnings $ 1,472,364 1.4 % $ 963,629 1.3 % Days in Inventory 0.3 0.7 0.9 0.7
Days in Accounts Payable 46.7 42.1 45.8 42.8
Operating Cycle 22.7 24.3 26.5 24.8
Number of ParticipantsNumber
2005 692004 72
Note: Not all figures will apear to sum due to rounding.
Industrial & Nonresidential ContractorsMidwest Region
* In theCFMA's 2005 Annual Financial Study, Returnon Assets(ROA)and Returnon Equity (ROE) are calculated using
net earnings (loss) before income taxes. Studies conducted in prior years used net earnings (loss) after taxes to
calculate ROA and ROE. All references to ROAs and ROEs from prior studies have been updated to reflect this change.
Industrial & Nonresidential Contractors

8/13/2019 2005 Financial Survey
http://slidepdf.com/reader/full/2005-financial-survey 123/284
Balance Sheet
2005 Participants 2004 Participants 2005 Participants 2004 Participants
Amount Percent Amount Percent Amount Percent Amount Percent
Current assets: Current liabilities:
Cash and cash equivalents $ 12,843,496 16.3 % $ 6,552,621 11.4 % Current maturity on long-term debt $ 102,729 0.1 % $ 30,699 0.1 %
Marketable securities & short-term investments 12,831,453 16.3 13,456,841 23.5 Notes payable and lines of credit 931,451 1.2 898,936 1.6
Receivables: Accounts payable:
Contr act r ecei va ble s c urr ent ly du e 28, 521, 878 3 6.2 19, 701, 703 3 4.4 Tr ade, inc lu din g c urr ent ly due
Retainages on contracts 11,181,108 14.2 7,779,765 13.6 to subcontractors 29,797,733 37.8 22,301,327 38.9
Unbilled work 199,715 0.3 12,346 0.0 Subcontracts retainages 10,802,986 13.7 7,196,488 12.6
Other receivables 1,638,042 2.1 468,465 0.8 Other 255,827 0.3 220,126 0.4
Less allowance for doubtful accounts (51,774) (0.1) (79,807) (0.1) Total accounts payable 40,856,546 51.9 29,717,940 51.9
Total receivables, net: 41,488,969 52.7 27,882,473 48.7
Accrued expenses 4,679,070 5.9 1,484,339 2.6
Inventories 60,011 0.1 36,644 0.1 Billings in excess of costs and recognized
Costs and recognized earnings in excess earnings on uncompleted contracts 9,740,647 12.4 6,042,379 10.5
of billings on uncompleted contracts 4,457,209 5.7 2,451,403 4.3 Income taxes:
Investments in and advances to Current 49,973 0.1 27,245 0.0
construction joint ventures 737,200 0.9 18,894 0.0 Deferred 393,340 0.5 3,338 0.0
Income taxes: Other current liabilities 1,609,172 2.0 1,345,311 2.3
Current/refundable 52,527 0.1 85,842 0.1 Total current liabilities 58,362,927 74.1 39,550,187 69.0
Deferred 77,557 0.1 157,845 0.3 Noncurrent liabilities
Other current assets 1,854,398 2.4 1,467,902 2.6 Long-term debt, excluding current maturities 411,123 0.5 289,396 0.5
Total current assets 74,402,820 94.4 52,110,464 90.9 Deferred income taxes 103,513 0.1 19,996 0.0
Other 829,944 1.1 1,446,865 2.5
Property, plant and equipment 7,751,979 9.8 6,315,141 11.0 Total liabilities 59,707,507 75.8 41,306,445 72.1
Less accumulated depreciation (5,306,285) (6.7) (4,332,839) (7.6) Minority interests 18,014 0.0 17,750 0.0
Property, plant and equipment, net 2,445,694 3.1 1,982,302 3.5 Net worth:
Common stock, par value 224,740 0.3 257,362 0.4
Noncurrent assets: Preferred stock, stated value 32,647 0.0 10,938 0.0
Long-term investments 103,895 0.1 170,835 0.3 Additional paid-in capital 1,997,676 2.5 619,163 1.1
Deferred income taxes 764,861 1.0 595,065 1.0 Retained earnings 16,958,421 21.5 14,282,213 24.9
Other assets 1,072,372 1.4 2,441,102 4.3 Treasury stock (1,181,436) (1.5) (457,392) (0.8)
Total noncurrent assets 1,941,128 2.5 3,207,003 5.6 Excess value of marketable securities 26,372 0.0 89,794 0.2
Other equity 1,005,701 1.3 1,173,497 2.0
Total net worth 19,064,122 24.2 15,975,573 27.9
Total assets $ 78,789,642 100.0 % $ 57,299,768 100.0 % Total liabilities and net worth $ 78,789,642 100.0 % $ 57,299,768 100.0 %
Statement of Earnings Financial Ratios
2005 Participants 2004 Participants 2005 Participants 2004 Participants
Amount Percent Amount Percent Average Median Average Median
Contract revenue $ 234,241,972 99.9 % $ 166,058,757 98.8 % Liquidity Ratios
Other revenue 174,978 0.1 1,969,859 1.2
Total Revenue 234,416,950 100.0 168,028,616 100.0 Current Ratio 1.3 1.2 1.3 1.4
Quick Ratio 1.2 1.1 1.2 1.2
Contract cost (222,732,055) (95.0) (157,966,375) (94.0) Days of Cash 19.7 13.5 14.0 16.8
Other cost (388,358) (0.2) (1,760,605) (1.0) Working Capital Turnover 14.6 19.6 13.4 14.0
Total cost (223,120,413) (95.2) (159,726,980) (95.1)
Profitability Ratios
Gross Profit 11,296,537 4.8 8,301,636 4.9
Return on Assets * 2.8 % 2.1 % 3.8 % 4.4 %
Selling, general & administrative expenses: Return on Equity * 11.4 % 7.7 % 13.6 % 14.4 %
Payroll (5,888,002) (2.5) (4,222,781) (2.5) Times Interest Earned 17.1 12.5 26.8 3.2
Professional fees (590,341) (0.3) (330,579) (0.2)
Sales & marketing costs (288,476) (0.1) (259,593) (0.2) Leverage Ratios
Technology costs (297,272) (0.1) (179,176) (0.1)
Administrative bonuses (409,829) (0.2) (477,975) (0.3) Debt to Equity 3.1 3.8 2.6 2.5
Other (2,183,496) (0.9) (1,329,535) (0.8) Revenue to Equity 12.3 17.3 10.5 13.9
Total SG&A expenses (9,657,415) (4.1) (6,799,640) (4.0) Asset Turnover 3.0 3.4 2.9 3.4
Fixed Asset Ratio 12.8 % 14.7 % 12.4 % 12.7 %
Income from operations 1,639,122 0.7 1,501,996 0.9 Equity to SG&A Expense 2.0 1.3 2.3 1.2
Underbillings to Equity 24.4 % 12.5 % 15.4 % 11.1 %
Interest income 713,795 0.3 545,575 0.3 Backlog to Equity 12.2 10.6 9.1 7.4
Interest expense (134,367) (0.1) (84,353) (0.1)Other income / (expense), net (49,855) (0.0) 217,267 0.1
Efficiency Ratios
Net ear ni ngs / ( los s) bef or e i nco me t axes 2, 168 ,69 4 0. 9 2 ,18 0,48 6 1. 3
Backlog to Working Capital 14.6 13.0 12.9 8.0
Income tax (expense) / benefit (366,914) (0.2) (147,332) (0.1) Months in Backlog 9.0 8.4 6.8 6.9
Days in Accounts Receivable 46.2 47.6 43.0 44.0
Net earnings $ 1,801,780 0.8 % $ 2,033,154 1.2 % Days in Inventory 0.1 0.6 0.1 0.2
Days in Accounts Payable 48.5 46.5 50.8 42.2
Operating Cycle 17.6 21.3 6.4 23.9
Number of ParticipantsNumber
2005 342004 32
Industrial & Nonresidential Contractors
Note: Not all figures will apear to sum due to rounding.
Industrial & Nonresidential ContractorsSouthwest Region
* In theCFMA's 2005 Annual Financial Study, Returnon Assets(ROA)and Returnon Equity (ROE) are calculated using
net earnings (loss) before income taxes. Studies conducted in prior years used net earnings (loss) after taxes to
calculate ROA and ROE. All references to ROAs and ROEs from prior studies have been updated to reflect this change.

8/13/2019 2005 Financial Survey
http://slidepdf.com/reader/full/2005-financial-survey 124/284
Balance Sheet
2005 Participants 2004 Participants 2005 Participants 2004 Participants
Amount Percent Amount Percent Amount Percent Amount Percent
Current assets: Current liabilities:
Cash and cash equivalents $ 5,152,989 14.8 % $ 7,549,458 19.5 % Current maturity on long-term debt $ 136,556 0.4 % $ 111,527 0.3 %
Marketable securities & short-term investments 4,074,946 11.7 877,224 2.3 Notes payable and lines of credit 23,148 0.1 25,431 0.1
Receivables: Accounts payable:
Contr act r ecei va ble s c urr ent ly du e 15, 803, 724 4 5.5 16, 803, 904 4 3.3 Tr ade, inc lu din g c urr ent ly due
Retainages on contracts 4,749,159 13.7 6,374,036 16.4 to subcontractors 12,396,271 35.7 20,675,288 53.3
Unbilled work 257,127 0.7 673,237 1.7 Subcontracts retainages 5,051,598 14.5 2,690,128 6.9
Other receivables 253,310 0.7 2,241,744 5.8 Other 366,721 1.1 61,257 0.2
Less allowance for doubtful accounts (60,583) (0.2) (5,000) (0.0) Total accounts payable 17,814,590 51.2 23,426,673 60.4
Total receivables, net: 21,002,738 60.4 26,087,920 67.3
Accrued expenses 2,540,138 7.3 1,312,707 3.4
Inventories 175,294 0.5 22,490 0.1 Billings in excess of costs and recognized
Costs and recognized earnings in excess earnings on uncompleted contracts 4,674,399 13.4 2,895,694 7.5
of billings on uncompleted contracts 723,007 2.1 781,906 2.0 Income taxes:
Investments in and advances to Current 26,333 0.1 108,157 0.3
construction joint ventures 342,783 1.0 92,616 0.2 Deferred 4,473 0.0 44,562 0.1
Income taxes: Other current liabilities 66,111 0.2 33,560 0.1
Current/refundable 5,951 0.0 7,839 0.0 Total current liabilities 25,285,748 72.7 27,958,311 72.1
Deferred 1,208 0.0 4,635 0.0 Noncurrent liabilities
Other current assets 576,481 1.7 977,087 2.5 Long-term debt, excluding current maturities 987,745 2.8 452,250 1.2
Total current assets 32,055,396 92.2 36,401,176 93.9 Deferred income taxes 33,162 0.1 (20,872) (0.1)
Other 377,563 1.1 1,516,297 3.9
Property, plant and equipment 5,465,020 15.7 4,190,770 10.8 Total liabilities 26,684,218 76.8 29,905,986 77.1
Less accumulated depreciation (3,555,102) (10.2) (2,492,022) (6.4) Minority interests 30,412 0.1 7,119 0.0
Property, plant and equipment, net 1,909,918 5.5 1,698,749 4.4 Net worth:
Common stock, par value 738,896 2.1 228,325 0.6
Noncurrent assets: Preferred stock, stated value 0 0.0 0 0.0
Long-term investments 591,296 1.7 251,206 0.6 Additional paid-in capital 391,487 1.1 461,611 1.2
Deferred income taxes 394 0.0 32,045 0.1 Retained earnings 7,434,084 21.4 8,206,643 21.2
Other assets 207,987 0.6 389,372 1.0 Treasury stock (517,201) (1.5) (21,597) (0.1)
Total noncurrent assets 799,677 2.3 672,623 1.7 Excess value of marketable securities 40,332 0.1 (511) (0.0)
Other equity (37,239) (0.1) (15,028) (0.0)
Total net worth 8,050,360 23.2 8,859,443 22.8
Total assets $ 34,764,991 100.0 % $ 38,772,548 100.0 % Total liabilities and net worth $ 34,764,991 100.0 % $ 38,772,548 X 100.0 %
Statement of Earnings Financial Ratios
2005 Participants 2004 Participants 2005 Participants 2004 Participants
Amount Percent Amount Percent Average Median Average Median
Contract revenue $ 125,228,145 100.0 % $ 147,663,458 100.0 % Liquidity Ratios
Other revenue 49,862 0.0 25,675 0.0
Total Revenue 125,278,007 100.0 147,689,133 100.0 Current Ratio 1.3 1.3 1.3 1.3
Quick Ratio 1.2 1.2 1.2 1.2
Contract cost (117,562,116) (93.8) (140,960,794) (95.4) Days of Cash 14.8 14.0 18.4 15.0
Other cost 0 0.0 (11,836) (0.0) Working Capital Turnover 18.5 21.2 17.5 21.2
Total cost (117,562,116) (93.8) (140,972,630) (95.5)
Profitability Ratios
Gross Profit 7,715,891 6.2 6,716,503 4.5
Return on Assets * 6.1 % 4.5 % 3.6 % 5.1 %
Selling, general & administrative expenses: Return on Equity * 26.3 % 21.6 % 15.8 % 16.9 %
Payroll (3,194,759) (2.6) (3,115,241) (2.1) Times Interest Earned 78.2 14.5 49.5 27.4
Professional fees (237,571) (0.2) (183,991) (0.1)
Sales & marketing costs (173,647) (0.1) (184,793) (0.1) Leverage Ratios
Technology costs (241,959) (0.2) (120,525) (0.1)
Administrative bonuses (693,092) (0.6) (374,231) (0.3) Debt to Equity 3.3 2.8 3.4 3.4
Other (1,285,746) (1.0) (1,563,274) (1.1) Revenue to Equity 15.6 17.7 16.7 16.6
Total SG&A expenses (5,826,774) (4.7) (5,542,056) (3.8) Asset Turnover 3.6 3.8 3.8 4.0
Fixed Asset Ratio 23.7 % 20.6 % 19.2 % 28.6 %
Income from operations 1,889,118 1.5 1,174,447 0.8 Equity to SG&A Expense 1.4 1.2 1.6 1.5
Underbillings to Equity 12.2 % 9.0 % 16.4 % 9.6 %
Interest income 187,777 0.1 136,209 0.1 Backlog to Equity 14.5 13.1 20.9 15.4
Interest expense (27,401) (0.0) (28,757) (0.0)Other income / (expense), net 66,165 0.1 113,752 0.1
Efficiency Ratios
Net ear ni ngs / ( los s) bef or e i nco me t axes 2, 115 ,65 9 1. 7 1 ,39 5,65 2 0. 9
Backlog to Working Capital 18.1 15.7 29.1 17.4
Income tax (expense) / benefit (55,162) (0.0) (452,667) (0.3) Months in Backlog 10.1 9.9 13.0 10.1
Days in Accounts Receivable 46.0 50.9 46.4 45.2
Net earnings $ 2,060,498 1.6 % $ 942,985 0.6 % Days in Inventory 0.5 0.1 0.1 0.1
Days in Accounts Payable 39.1 40.7 53.0 43.8
Operating Cycle 22.2 19.0 11.9 18.5
Number of ParticipantsNumber
2005 242004 21
Note: Not all figures will apear to sum due to rounding.
Industrial & Nonresidential Contractors
* In theCFMA's 2005 Annual Financial Study, Returnon Assets(ROA)and Returnon Equity (ROE) are calculated using
net earnings (loss) before income taxes. Studies conducted in prior years used net earnings (loss) after taxes to
calculate ROA and ROE. All references to ROAs and ROEs from prior studies have been updated to reflect this change.
Industrial & Nonresidential ContractorsWest Region

8/13/2019 2005 Financial Survey
http://slidepdf.com/reader/full/2005-financial-survey 125/284
Balance Sheet
2005 Participants 2004 Participants 2005 Participants 2004 Participants
Amount Percent Amount Percent Amount Percent Amount Percent
Current assets: Current liabilities:
Cash and cash equivalents $ 8,648,883 23.7 % $ 5,747,005 18.7 % Current maturity on long-term debt $ 58,143 0.2 % $ 340,339 1.1 %
Marketable securities & short-term investments 1,245,363 3.4 1,418,369 4.6 Notes payable and lines of credit 46,916 0.1 296,269 1.0
Receivables: Accounts payable:
Contr act r ecei va ble s c urr ent ly du e 15, 968, 099 4 3.8 14, 150, 816 4 6.1 Tr ade, inc lu din g c urr ent ly due
Retainages on contracts 6,471,789 17.8 3,758,682 12.2 to subcontractors 15,709,726 43.1 8,991,552 2 9.3
Unbilled work 52,089 0.1 400,352 1.3 Subcontracts retainages 5,969,636 16.4 7,008,411 22.8
Other receivables 494,094 1.4 274,375 0.9 Other 149,675 0.4 1,626,896 5.3
Less allowance for doubtful accounts (69,901) (0.2) (50,374) (0.2) Total accounts payable 21,829,038 59.9 17,626,859 57.4
Total receivables, net: 22,916,169 62.9 18,533,852 60.3
Accrued expenses 2,008,805 5.5 1,898,654 6.2
Inventories 11,059 0.0 159,581 0.5 Billings in excess of costs and recognized
Costs and recognized earnings in excess earnings on uncompleted contracts 3,613,699 9.9 2,324,436 7.6
of billings on uncompleted contracts 874,666 2.4 1,001,315 3.3 Income taxes:
Investments in and advances to Current 19,927 0.1 32,349 0.1
construction joint ventures 42,050 0.1 38,962 0.1 Deferred 309 0.0 11,366 0.0
Income taxes: Other current liabilities 314,601 0.9 215,699 0.7
Current/refundable 19,547 0.1 21,184 0.1 Total current liabilities 27,891,438 76.5 22,745,971 74.0
Deferred 7,000 0.0 107,852 0.4 Noncurrent liabilities
Other current assets 631,688 1.7 567,169 1.8 Long-term debt, excluding current maturities 221,043 0.6 1,817,647 5.9
Total current assets 34,396,425 94.4 27,595,288 89.8 Deferred income taxes 24,840 0.1 55,087 0.2
Other 250,543 0.7 250,722 0.8
Property, plant and equipment 3,638,094 10.0 4,508,930 14.7 Total liabilities 28,387,864 77.9 24,869,427 81.0
Less accumulated depreciation (2,422,455) (6.6) (1,931,183) (6.3) Minority interests 29,623 0.1 35,456 0.1
Property, plant and equipment, net 1,215,640 3.3 2,577,747 8.4 Net worth:
Common stock, par value 282,500 0.8 497,328 1.6
Noncurrent assets: Preferred stock, stated value 94,460 0.3 26,509 0.1
Long-term investments 145,885 0.4 156,997 0.5 Additional paid-in capital 875,803 2.4 924,390 3.0
Deferred income taxes 14,120 0.0 30,565 0.1 Retained earnings 6,694,848 18.4 4,297,972 14.0
Other assets 671,955 1.8 359,008 1.2 Treasury stock (142,800) (0.4) (92,801) (0.3)
Total noncurrent assets 831,961 2.3 546,570 1.8 Excess value of marketable securities 624 0.0 6,406 0.0
Other equity 221,103 0.6 154,917 0.5
Total net worth 8,026,539 22.0 5,814,722 18.9
Total assets $ 36,444,025 100.0 % $ 30,719,605 100.0 % Total liabilities and net worth $ 36,444,025 100.0 % $ 30,719,605 100.0 %
Statement of Earnings Financial Ratios
2005 Participants 2004 Participants 2005 Participants 2004 Participants
Amount Percent Amount Percent Average Median Average Median
Contract revenue $ 121,057,017 99.8 % $ 98,862,730 99.8 % Liquidity Ratios
Other revenue 207,148 0.2 149,174 0.2
Total Revenue 121,264,164 100.0 99,011,903 100.0 Current Ratio 1.2 1.3 1.2 1.3
Quick Ratio 1.2 1.2 1.1 1.2
Contract cost (113,735,523) (93.8) (92,568,153) (93.5) Days of Cash 25.7 21.9 20.9 18.2
Other cost (153,206) (0.1) (92,418) (0.1) Working Capital Turnover 18.6 15.8 20.4 17.2
Total cost (113,888,729) (93.9) (92,660,571) (93.6)
Profitability Ratios
Gross Profit 7,375,435 6.1 6,351,332 6.4
Return on Assets * 5.9 % 7.7 % 3.9 % 5.3 %
Selling, general & administrative expenses: Return on Equity * 26.7 % 26.7 % 20.4 % 18.8 %
Payroll (2,680,955) (2.2) (2,777,029) (2.8) Times Interest Earned 169.9 30.3 14.4 11.6
Professional fees (178,717) (0.1) (168,999) (0.2)
Sales & marketing costs (180,151) (0.1) (135,167) (0.1) Leverage Ratios
Technology costs (296,300) (0.2) (77,828) (0.1)
Administrative bonuses (374,915) (0.3) (472,659) (0.5) Debt to Equity 3.5 2.7 4.3 2.6
Other (1,813,947) (1.5) (1,633,559) (1.6) Revenue to Equity 15.1 13.0 17.0 14.3
Total SG&A expenses (5,524,986) (4.6) (5,265,241) (5.3) Asset Turnover 3.3 3.2 3.2 3.5
Fixed Asset Ratio 15.1 % 14.9 % 44.3 % 14.9 %
Income from operations 1,850,450 1.5 1,086,092 1.1 Equity to SG&A Expense 1.5 1.2 1.1 1.2
Underbillings to Equity 11.5 % 8 .2 % 24.1 % 15.5 %
Interest income 178,883 0.1 84,836 0.1 Backlog to Equity 14.1 11.6 12.6 9.4
Interest expense (12,662) (0.0) (88,609) (0.1)Other income / (expense), net 122,411 0.1 105,379 0.1
Efficiency Ratios
Net ear ni ngs / ( los s) bef or e i nco me t axes 2, 139 ,08 2 1. 8 1 ,18 7,69 8 1. 2
Backlog to Working Capital 18.8 14.4 22.9 13.0
Income tax (expense) / benefit (74,106) (0.1) (213,231) (0.2) Months in Backlog 11.5 10.0 10.6 8.0
Days in Accounts Receivable 48.7 47.0 52.3 47.8
Net earnings $ 2,064,976 1.7 % $ 974,467 1.0 % Days in Inventory 0.0 1.5 0.6 1.0
Days in Accounts Payable 50.1 45.8 41.3 38.4
Operating Cycle 24.2 24.7 32.5 25.2
Number of ParticipantsNumber
2005 252004 44
Industrial & Nonresidential Contractors
Note: Not all figures will apear to sum due to rounding.
* In theCFMA's 2005 Annual Financial Study, Returnon Assets(ROA)and Returnon Equity (ROE) are calculated using
net earnings (loss) before income taxes. Studies conducted in prior years used net earnings (loss) after taxes to
calculate ROA and ROE. All references to ROAs and ROEs from prior studies have been updated to reflect this change.
Industrial & Nonresidential ContractorsFar West Region
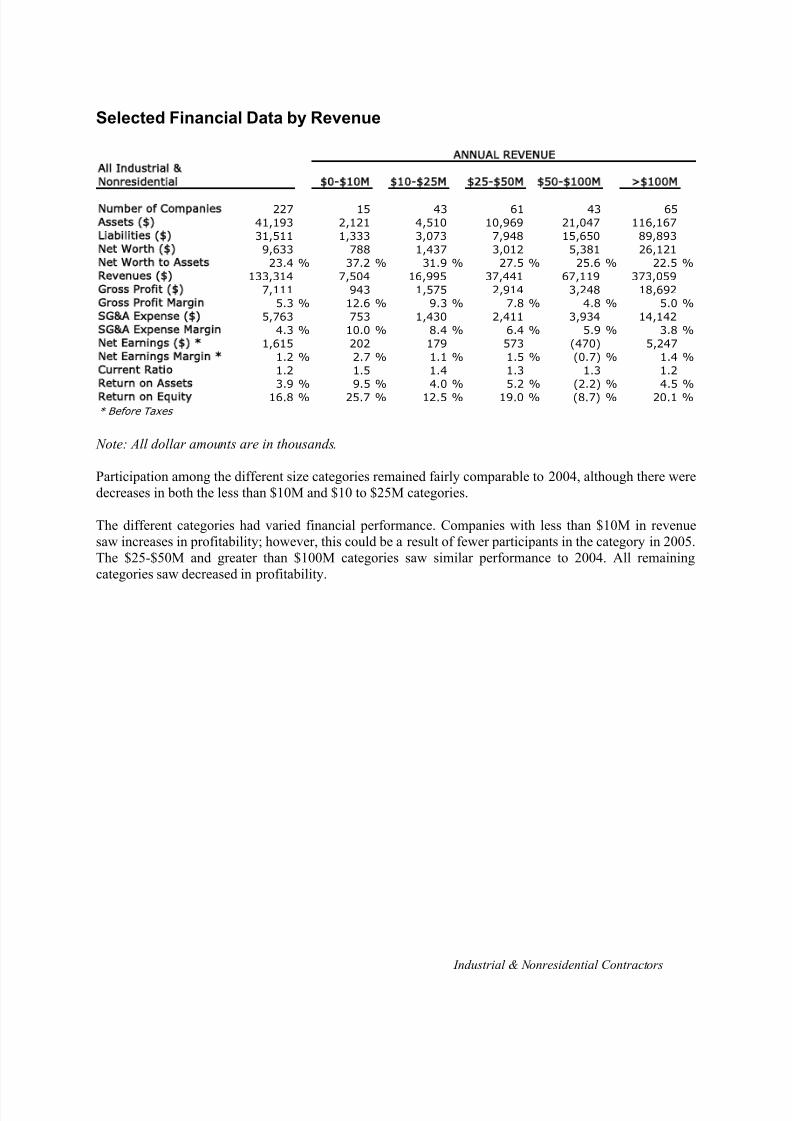
8/13/2019 2005 Financial Survey
http://slidepdf.com/reader/full/2005-financial-survey 126/284
Industrial & Nonresidential Contractors
Selected Financial Data by Revenue
All Industrial &
Nonresidential 0- 10M 10- 25M 25- 50M 50- 100M > 100M
Number of Companies 227 15 43 61 43 65
Assets ( ) 41,193 2,121 4,510 10,969 21,047 116,167
Liabilities ( ) 31,511 1,333 3,073 7,948 15,650 89,893
Net Worth ( ) 9,633 788 1,437 3,012 5,381 26,121
Net Worth to Assets 23.4 % 37.2 % 31.9 % 27.5 % 25.6 % 22.5 %
Revenues ( ) 133,314 7,504 16,995 37,441 67,119 373,059
Gross Profit ( ) 7,111 943 1,575 2,914 3,248 18,692
Gross Profit Margin 5.3 % 12.6 % 9.3 % 7.8 % 4.8 % 5.0 %
SG&A Expense ( ) 5,763 753 1,430 2,411 3,934 14,142
SG&A Expense Margin 4.3 % 10.0 % 8.4 % 6.4 % 5.9 % 3.8 %
Net Earnings ( ) * 1,615 202 179 573 (470) 5,247
Net Earnings Margin * 1.2 % 2.7 % 1.1 % 1.5 % (0.7) % 1.4 %
Current Ratio 1.2 1.5 1.4 1.3 1.3 1.2
Return on Assets 3.9 % 9.5 % 4.0 % 5.2 % (2.2) % 4.5 %
Return on Equity 16.8 % 25.7 % 12.5 % 19.0 % (8.7) % 20.1 %
* Before Taxes
ANNUAL REVENUE
Note: All dollar amounts are in thousands.
Participation among the different size categories remained fairly comparable to 2004, although there weredecreases in both the less than $10M and $10 to $25M categories.
The different categories had varied financial performance. Companies with less than $10M in revenuesaw increases in profitability; however, this could be a result of fewer participants in the category in 2005.The $25-$50M and greater than $100M categories saw similar performance to 2004. All remainingcategories saw decreased in profitability.
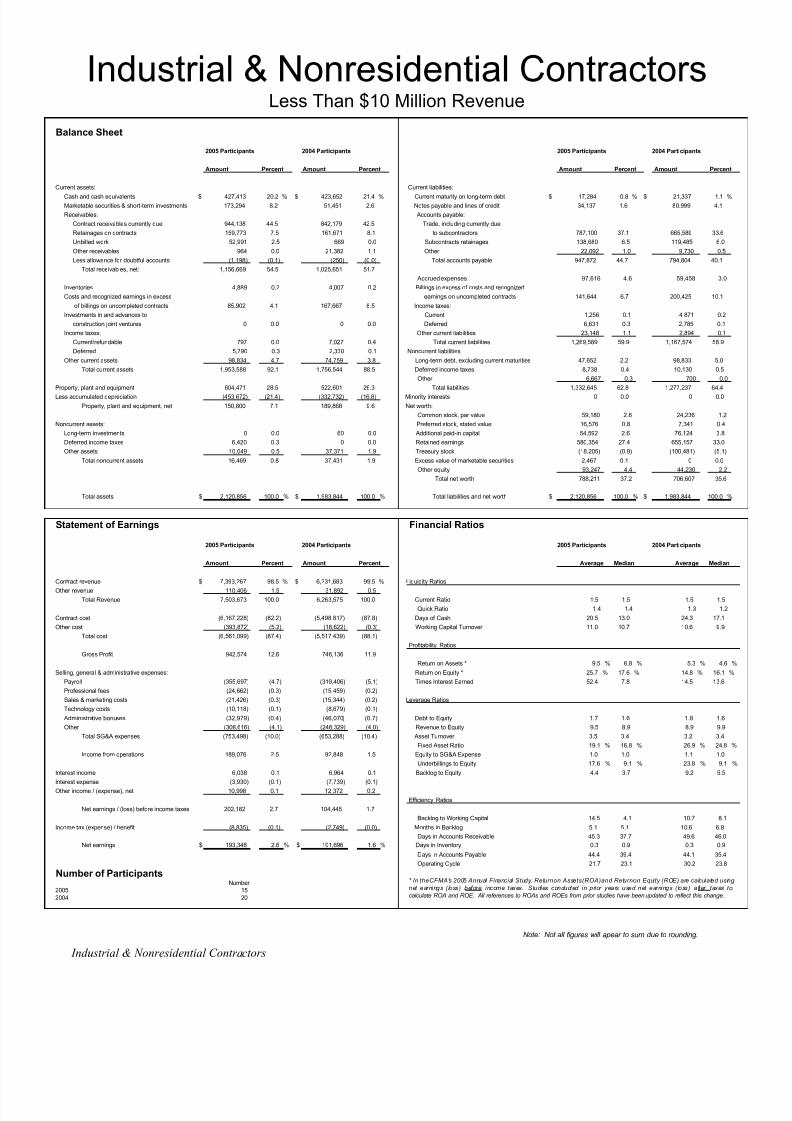
8/13/2019 2005 Financial Survey
http://slidepdf.com/reader/full/2005-financial-survey 127/284
Balance Sheet
2005 Participants 2004 Participants 2005 Participants 2004 Participants
Amount Percent Amount Percent Amount Percent Amount Percent
Current assets: Current liabilities:
Cash and cash equivalents $ 427,413 20.2 % $ 423,652 21.4 % Current maturity on long-term debt $ 17,284 0.8 % $ 21,337 1.1 %Marketable securities & short-term investments 173,294 8.2 51,451 2.6 Notes payable and lines of credit 34,137 1.6 80,999 4.1
Receivables: Accounts payable:
Contract receivables currently due 944,138 44.5 842,179 42.5 Trade, including currently due
Retainages on contracts 159,773 7.5 161,671 8.1 to subcontractors 787,100 37.1 665,589 33.6
Unbilled work 52,991 2.5 669 0.0 Subcontracts retainages 138,680 6.5 119,485 6.0
Other receivables 964 0.0 21,382 1.1 Other 22,092 1.0 9,730 0.5
Less allowance for doubtful accounts (1,198) (0.1) (250) (0.0) Total accounts payable 947,872 44.7 794,804 40.1
Total receivables, net: 1,156,669 54.5 1,025,651 51.7
Accrued expenses 97,616 4.6 59,458 3.0
Inventories 4,889 0.2 4,007 0.2 Billings in excess of costs and recognized
Costs and recognized earnings in excess earnings on uncompleted contracts 141,644 6.7 200,425 10.1
of billings on uncompleted contracts 85,902 4.1 167,667 8.5 Income taxes:
Investments in and advances to Current 1,256 0.1 4,871 0.2
construction joint ventures 0 0.0 0 0.0 Deferred 6,631 0.3 2,785 0.1
Income taxes: Other current liabilities 23,148 1.1 2,894 0.1
Current/refundable 797 0.0 7,027 0.4 Total current liabilities 1,269,589 59.9 1,167,574 58.9
Deferred 5,790 0.3 2,330 0.1 Noncurrent liabilities
Other current assets 98,834 4.7 74,759 3.8 Long-term debt, excluding current maturities 47,652 2.2 98,833 5.0
Total current assets 1,953,588 92.1 1,756,544 88.5 Deferred income taxes 8,738 0.4 10,130 0.5
Other 6,667 0.3 700 0.0
Property, plant and equipment 604,471 28.5 522,601 26.3 Total liabilities 1,332,645 62.8 1,277,237 64.4
Less accumulated depreciation (453,672) (21.4) (332,732) (16.8) Minority interests 0 0.0 0 0.0
Property, plant and equipment, net 150,800 7.1 189,868 9.6 Net worth:
Common stock, par value 59,180 2.8 24,236 1.2
Noncurrent assets: Preferred stock, stated value 16,576 0.8 7,341 0.4
Long-term investments 0 0.0 60 0.0 Additional paid-in capital 54,592 2.6 76,124 3.8
Deferred income taxes 6,420 0.3 0 0.0 Retained earnings 580,354 27.4 655,157 33.0
Other assets 10,049 0.5 37,371 1.9 Treasury stock (18,205) (0.9) (100,481) (5.1)
Total noncurrent assets 16,469 0.8 37,431 1.9 Excess value of marketable securities 2,467 0.1 0 0.0
Other equity 93,247 4.4 44,230 2.2
Total net worth 788,211 37.2 706,607 35.6
Total assets $ 2,120,856 100.0 % $ 1,983,844 100.0 % Total liabilities and net worth $ 2,120,856 100.0 % $ 1,983,844 100.0 %
Statement of Earnings Financial Ratios
2005 Participants 2004 Participants 2005 Participants 2004 Participants
Amount Percent Amount Percent Average Median Average Median
Contract revenue $ 7,393,267 98.5 % $ 6,231,683 99.5 % Liquidity Ratios
Other revenue 110,406 1.5 31,892 0.5
Total Revenue 7,503,673 100.0 6,263,575 100.0 Current Ratio 1.5 1.5 1.5 1.5
Quick Ratio 1.4 1.4 1.3 1.2
Contract cost (6,167,228) (82.2) (5,498,817) (87.8) Days of Cash 20.5 13.0 24.3 17.1
Other cost (393,872) (5.2) (18,622) (0.3) Working Capital Turnover 11.0 10.7 10.6 9.9
Total cost (6,561,099) (87.4) (5,517,439) (88.1)
Profitability Ratios
Gross Profit 942,574 12.6 746,136 11.9
Return on Assets * 9.5 % 6.8 % 5.3 % 4.6 %
Selling, general & administrative expenses: Return on Equity * 25.7 % 17.6 % 14.8 % 16.1 %
Payroll (355,697) (4.7) (319,406) (5.1) Times Interest Earned 52.4 7.8 14.5 13.6
Professional fees (24,662) (0.3) (15,459) (0.2)
Sales & marketing costs (21,426) (0.3) (15,344) (0.2) Leverage Ratios
Technology costs (10,118) (0.1) (8,679) (0.1)
Administrative bonuses (32,979) (0.4) (46,070) (0.7) Debt to Equity 1.7 1.6 1.8 1.6
Other (308,616) (4.1) (248,329) (4.0) Revenue to Equity 9.5 8.9 8.9 9.9
Total SG&A expenses (753,498) (10.0) (653,288) (10.4) Asset Turnover 3.5 3.4 3.2 3.4
Fixed Asset Ratio 19.1 % 16.8 % 26.9 % 24.8 %
Income from operations 189,076 2.5 92,848 1.5 Equity to SG&A Expense 1.0 1.0 1.1 1.0
Underbillings to Equity 17.6 % 9.1 % 23.8 % 9.1 %
Interest income 6,038 0.1 6,964 0.1 Backlog to Equity 4.4 3.7 9.2 5.5
Interest expense (3,930) (0.1) (7,739) (0.1)
Other income / (expense), net 10,998 0.1 12,372 0.2
Efficiency Ratios
Net earnings / (loss) before income taxes 202,182 2.7 104,445 1.7
Backlog to Working Capital 14.5 4.1 10.7 8.1
Income tax (expense) / benefit (8,835) (0.1) (2,749) (0.0) Months in Backlog 5.1 5.1 10.6 6.8
Days in Accounts Receivable 45.3 37.7 49.6 46.0
Net earnings $ 193,348 2.6 % $ 101,696 1.6 % Days in Inventory 0.3 0.9 0.3 0.9
Days in Accounts Payable 44.4 39.4 44.1 35.4
Operating Cycle 21.7 23.1 30.2 23.8
Number of ParticipantsNumber
2005 152004 20
Industrial & Nonresidential Contractors
Note: Not all figures will apear to sum due to rounding.
Industrial & Nonresidential ContractorsLess Than $10 Million Revenue
* In theCFMA's 2005 Annual Financial Study, Returnon Assets(ROA)and Returnon Equity (ROE) are calculated using
net earnings (loss) before income taxes. Studies conducted in prior years used net earnings (loss) after taxes to
calculate ROA and ROE. All references to ROAs and ROEs from prior studies have been updated to reflect this change.
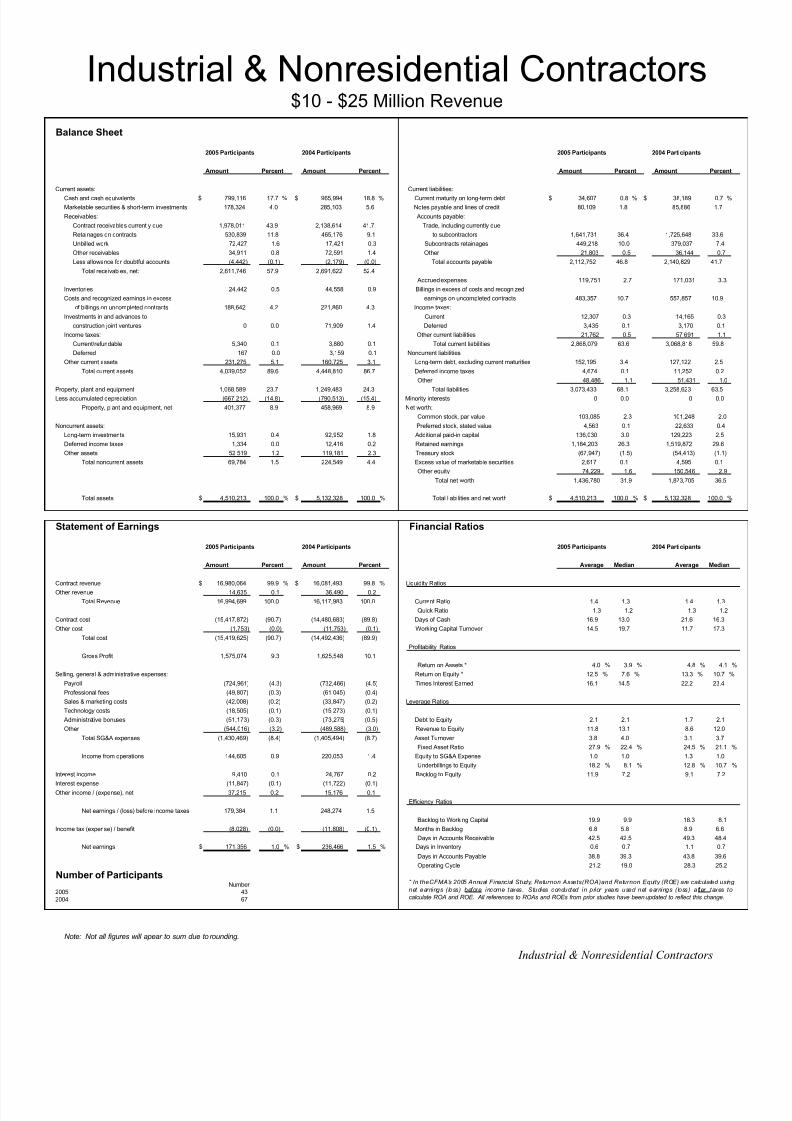
8/13/2019 2005 Financial Survey
http://slidepdf.com/reader/full/2005-financial-survey 128/284
Balance Sheet
2005 Participants 2004 Participants 2005 Participants 2004 Participants
Amount Percent Amount Percent Amount Percent Amount Percent
Current assets: Current liabilities:
Cash and cash equivalents $ 799,116 17.7 % $ 965,994 18.8 % Current maturity on long-term debt $ 34,607 0.8 % $ 38,189 0.7 %
Marketable securities & short-term investments 178,324 4.0 285,103 5.6 Notes payable and lines of credit 80,109 1.8 85,886 1.7
Receivables: Accounts payable:
Contract receivables currently due 1,978,011 43.9 2,138,614 41.7 Trade, including currently due
Retainages on contracts 530,839 11.8 465,176 9.1 to subcontractors 1,641,731 36.4 1,725,648 33.6
Unbilled work 72,427 1.6 17,421 0.3 Subcontracts retainages 449,218 10.0 379,037 7.4
Other receivables 34,911 0.8 72,591 1.4 Other 21,803 0.5 36,144 0.7
Less allowance for doubtful accounts (4,442) (0.1) (2,179) (0.0) Total accounts payable 2,112,752 46.8 2,140,829 41.7
Total receivables, net: 2,611,746 57.9 2,691,622 52.4
Accrued expenses 119,751 2.7 171,031 3.3
Inventories 24,442 0.5 44,558 0.9 Billings in excess of costs and recognized
Costs and recognized earnings in excess earnings on uncompleted contracts 483,357 10.7 557,857 10.9
of billings on uncompleted contracts 188,642 4.2 221,860 4.3 Income taxes:
Investments in and advances to Current 12,307 0.3 14,165 0.3
construction joint ventures 0 0.0 71,909 1.4 Deferred 3,435 0.1 3,170 0.1
Income taxes: Other current liabilities 21,762 0.5 57,691 1.1
Current/refundable 5,340 0.1 3,880 0.1 Total current liabilities 2,868,079 63.6 3,068,818 59.8
Deferred 167 0.0 3,159 0.1 Noncurrent liabilities
Other current assets 231,275 5.1 160,725 3.1 Long-term debt, excluding current maturities 152,195 3.4 127,122 2.5
Total current assets 4,039,052 89.6 4,448,810 86.7 Deferred income taxes 4,674 0.1 11,252 0.2
Other 48,486 1.1 51,431 1.0
Property, plant and equipment 1,068,589 23.7 1,249,483 24.3 Total liabilities 3,073,433 68.1 3,258,623 63.5
Less accumulated depreciation (667,212) (14.8) (790,513) (15.4) Minority interests 0 0.0 0 0.0
Property, plant and equipment, net 401,377 8.9 458,969 8.9 Net worth:
Common stock, par value 103,085 2.3 101,248 2.0
Noncurrent assets: Preferred stock, stated value 4,563 0.1 22,633 0.4
Long-term investments 15,931 0.4 92,952 1.8 Additional paid-in capital 136,030 3.0 129,223 2.5
Deferred income taxes 1,334 0.0 12,416 0.2 Retained earnings 1,184,203 26.3 1,519,872 29.6
Other assets 52,519 1.2 119,181 2.3 Treasury stock (67,947) (1.5) (54,413) (1.1)
Total noncurrent assets 69,784 1.5 224,549 4.4 Excess value of marketable securities 2,617 0.1 4,595 0.1
Other equity 74,229 1.6 150,546 2.9
Total net worth 1,436,780 31.9 1,873,705 36.5
Total assets $ 4,510,213 100.0 % $ 5,132,328 100.0 % Total liabilities and net worth $ 4,510,213 100.0 % $ 5,132,328 100.0 %
Statement of Earnings Financial Ratios
2005 Participants 2004 Participants 2005 Participants 2004 Participants
Amount Percent Amount Percent Average Median Average Median
Contract revenue $ 16,980,064 99.9 % $ 16,081,493 99.8 % Liquidity Ratios
Other revenue 14,635 0.1 36,490 0.2
Total Revenue 16,994,699 100.0 16,117,983 100.0 Current Ratio 1.4 1.3 1.4 1.3
Quick Ratio 1.3 1.2 1.3 1.2
Contract cost (15,417,872) (90.7) (14,480,683) (89.8) Days of Cash 16.9 13.0 21.6 16.3
Other cost (1,753) (0.0) (11,753) (0.1) Working Capital Turnover 14.5 19.7 11.7 17.3
Total cost (15,419,625) (90.7) (14,492,436) (89.9)
Profitability Ratios
Gross Profit 1,575,074 9.3 1,625,548 10.1
Return on Assets * 4.0 % 3.9 % 4.8 % 4.1 %
Selling, general & administrative expenses: Return on Equity * 12.5 % 7.6 % 13.3 % 10.7 %
Payroll (724,961) (4.3) (732,466) (4.5) Times Interest Earned 16.1 14.5 22.2 23.4
Professional fees (49,807) (0.3) (61,045) (0.4)
Sales & marketing costs (42,008) (0.2) (33,847) (0.2) Leverage Ratios
Technology costs (18,505) (0.1) (15,273) (0.1)
Administrative bonuses (51,173) (0.3) (73,275) (0.5) Debt to Equity 2.1 2.1 1.7 2.1
Other (544,016) (3.2) (489,588) (3.0) Revenue to Equity 11.8 13.1 8.6 12.0
Total SG&A expenses (1,430,469) (8.4) (1,405,494) (8.7) Asset Turnover 3.8 4.0 3.1 3.7
Fixed Asset Ratio 27.9 % 22.4 % 24.5 % 21.1 %
Income from operations 144,605 0.9 220,053 1.4 Equity to SG&A Expense 1.0 1.0 1.3 1.0
Underbillings to Equity 18.2 % 8.1 % 12.8 % 10.7 %
Interest income 9,410 0.1 24,767 0.2 Backlog to Equity 11.9 7.2 9.1 7.2
Interest expense (11,847) (0.1) (11,722) (0.1)Other income / (expense), net 37,215 0.2 15,176 0.1
Efficiency Ratios
Net earnings / (loss) before income taxes 179,384 1.1 248,274 1.5
Backlog to Working Capital 19.9 9.9 18.3 8.1
Income tax (expense) / benefit (8,028) (0.0) (11,808) (0.1) Months in Backlog 6.8 5.8 8.9 6.6
Days in Accounts Receivable 42.5 42.5 49.3 48.4
Net earnings $ 171,356 1.0 % $ 236,466 1.5 % Days in Inventory 0.6 0.7 1.1 0.7
Days in Accounts Payable 38.8 39.3 43.8 39.6
Operating Cycle 21.2 19.0 28.3 25.2
Number of ParticipantsNumber
2005 432004 67
Note: Not all figures will apear to sum due to rounding.
Industrial & Nonresidential Contractors$10 - $25 Million Revenue
* In theCFMA's 2005 Annual Financial Study, Returnon Assets(ROA)and Returnon Equity (ROE) are calculated using
net earnings (loss) before income taxes. Studies conducted in prior years used net earnings (loss) after taxes to
calculate ROA and ROE. All references to ROAs and ROEs from prior studies have been updated to reflect this change.
Industrial & Nonresidential Contractors

8/13/2019 2005 Financial Survey
http://slidepdf.com/reader/full/2005-financial-survey 129/284
Balance Sheet
2005 Participants 2004 Participants 2005 Participants 2004 Participants
Amount Percent Amount Percent Amount Percent Amount Percent
Current assets: Current liabilities:
Cash and cash equivalents $ 2,342,376 21.4 % $ 2,089,823 22.0 % Current maturity on long-term debt $ 80,313 0.7 % $ 64,156 0.7 %
Marketable securities & short-term investments 611,521 5.6 260,527 2.7 Notes payable and lines of credit 81,928 0.7 247,194 2.6
Receivables: Accounts payable:
Contract receivables currently due 5,078,011 46.3 4,321,976 45.4 Trade, including currently due
Retainages on contracts 1,187,594 10.8 930,992 9.8 to subcontractors 4,442,151 40.5 3,760,110 39.5
Unbilled work 112,320 1.0 14,544 0.2 Subcontracts retainages 1,353,834 12.3 893,161 9.4
Other receivables 93,875 0.9 45,001 0.5 Other 39,884 0.4 30,389 0.3
Less allowance for doubtful accounts (17,588) (0.2) (6,478) (0.1) Total accounts payable 5,835,869 53.2 4,683,661 49.2
Total receivables, net: 6,454,213 58.8 5,306,035 55.8
Accrued expenses 348,996 3.2 450,854 4.7
Inventories 50,093 0.5 157,714 1.7 Billings in excess of costs and recognized
Costs and recognized earnings in excess earnings on uncompleted contracts 1,174,437 10.7 1,055,941 11.1
of billings on uncompleted contracts 345,770 3.2 440,132 4.6 Income taxes:
Investments in and advances to Current 18,350 0.2 20,578 0.2
construction joint ventures 9,378 0.1 26,132 0.3 Deferred 2,614 0.0 4,068 0.0
Income taxes: Other current liabilities 74,976 0.7 42,490 0.4
Current/refundable 12,259 0.1 21,959 0.2 Total current liabilities 7,617,485 69.4 6,568,941 69.0
Deferred 19,982 0.2 3,516 0.0 Noncurrent liabilities
Other current assets 270,319 2.5 313,133 3.3 Long-term debt, excluding current maturities 286,644 2.6 300,640 3.2
Total current assets 10,115,911 92.2 8,618,972 90.6 Deferred income taxes 23,210 0.2 13,368 0.1
Other 20,367 0.2 12,646 0.1
Property, plant and equipment 1,951,650 17.8 1,663,323 17.5 Total liabilities 7,947,706 72.5 6,895,596 72.5
Less accumulated depreciation (1,314,623) (12.0) (1,063,976) (11.2) Minority interests 9,361 0.1 3,251 0.0
Property, plant and equipment, net 637,027 5.8 599,347 6.3 Net worth:
Common stock, par value 143,190 1.3 183,233 1.9
Noncurrent assets: Preferred stock, stated value 56,748 0.5 0 0.0
Long-term investments 33,954 0.3 85,094 0.9 Additional paid-in capital 176,219 1.6 255,923 2.7
Deferred income taxes 11,897 0.1 53,832 0.6 Retained earnings 2,462,011 22.4 1,939,250 20.4
Other assets 170,109 1.6 157,444 1.7 Treasury stock (23,638) (0.2) (38,915) (0.4)
Total noncurrent assets 215,959 2.0 296,370 3.1 Excess value of marketable securities 32,617 0.3 36,112 0.4
Other equity 164,684 1.5 240,241 2.5
Total net worth 3,011,830 27.5 2,615,843 27.5
Total assets $ 10,968,897 100.0 % $ 9,514,690 100.0 % Total liabilities and net worth $ 10,968,897 100.0 % $ 9,514,690 100.0 %
Statement of Earnings Financial Ratios
2005 Participants 2004 Participants 2005 Participants 2004 Participants
Amount Percent Amount Percent Average Median Average Median
Contract revenue $ 37,271,803 99.5 % $ 34,359,148 98.8 % Liquidity Ratios
Other revenue 169,429 0.5 404,126 1.2
Total Revenue 37,441,233 100.0 34,763,274 100.0 Current Ratio 1.3 1.3 1.3 1.3
Quick Ratio 1.2 1.2 1.2 1.2
Contract cost (34,186,708) (91.3) (31,739,441) (91.3) Days of Cash 22.5 18.6 21.6 20.2
Other cost (340,750) (0.9) (291,203) (0.8) Working Capital Turnover 15.0 17.0 17.0 14.8
Total cost (34,527,458) (92.2) (32,030,644) (92.1)
Profitability Ratios
Gross Profit 2,913,775 7.8 2,732,630 7.9
Return on Assets * 5.2 % 4.1 % 5.2 % 4.6 %
Selling, general & administrative expenses: Return on Equity * 19.0 % 16.2 % 19.0 % 17.5 %
Payroll (1,392,646) (3.7) (1,299,540) (3.7) Times Interest Earned 24.9 13.4 20.6 8.4
Professional fees (76,022) (0.2) (73,261) (0.2)
Sales & marketing costs (128,651) (0.3) (84,768) (0.2) Leverage Ratios
Technology costs (49,445) (0.1) (39,204) (0.1)
Administrative bonuses (148,365) (0.4) (132,851) (0.4) Debt to Equity 2.6 3.0 2.6 2.7
Other (615,529) (1.6) (681,958) (2.0) Revenue to Equity 12.4 14.8 13.3 14.1
Total SG&A expenses (2,410,659) (6.4) (2,311,582) (6.6) Asset Turnover 3.4 3.4 3.7 3.7
Fixed Asset Ratio 21.2 % 17.7 % 22.9 % 19.8 %
Income from operations 503,116 1.3 421,048 1.2 Equity to SG&A Expense 1.2 1.2 1.1 1.1
Underbillings to Equity 15.2 % 8.9 % 17.4 % 12.6 %
Interest income 42,699 0.1 32,994 0.1 Backlog to Equity 12.9 9.2 11.8 10.4
Interest expense (23,995) (0.1) (25,297) (0.1)Other income / (expense), net 50,800 0.1 67,960 0.2
Efficiency Ratios
Net earnings / (loss) before income taxes 572,619 1.5 496,705 1.4
Backlog to Working Capital 12.1 11.3 15.9 12.1
Income tax (expense) / benefit (12,856) (0.0) (17,476) (0.1) Months in Backlog 8.1 7.6 8.4 6.9
Days in Accounts Receivable 49.6 47.5 45.2 43.2
Net earnings $ 559,763 1.5 % $ 479,228 1.4 % Days in Inventory 0.5 0.8 1.8 0.6
Days in Accounts Payable 46.7 42.1 42.6 38.0
Operating Cycle 25.9 28.4 26.0 27.2
Number of ParticipantsNumber
2005 612004 60
Industrial & Nonresidential Contractors
Note: Not all figures will apear to sum due to rounding.
Industrial & Nonresidential Contractors$25 - $50 Million Revenue
* In theCFMA's 2005 Annual Financial Study, Returnon Assets(ROA)and Returnon Equity (ROE) are calculated using
net earnings (loss) before income taxes. Studies conducted in prior years used net earnings (loss) after taxes to
calculate ROA and ROE. All references to ROAs and ROEs from prior studies have been updated to reflect this change.
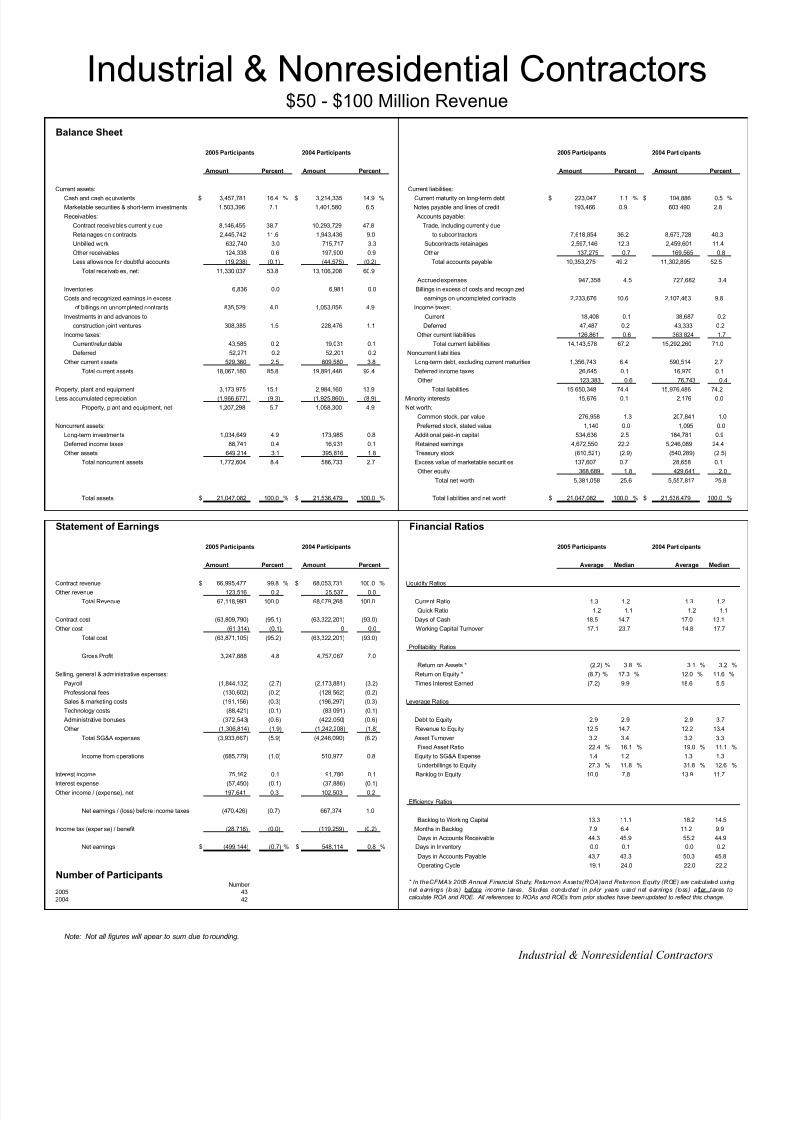
8/13/2019 2005 Financial Survey
http://slidepdf.com/reader/full/2005-financial-survey 130/284
Balance Sheet
2005 Participants 2004 Participants 2005 Participants 2004 Participants
Amount Percent Amount Percent Amount Percent Amount Percent
Current assets: Current liabilities:
Cash and cash equivalents $ 3,457,781 16.4 % $ 3,214,335 14.9 % Current maturity on long-term debt $ 223,047 1.1 % $ 104,886 0.5 %
Marketable securities & short-term investments 1,503,396 7.1 1,401,580 6.5 Notes payable and lines of credit 193,466 0.9 603,490 2.8
Receivables: Accounts payable:
Contract receivables currently due 8,146,455 38.7 10,293,729 47.8 Trade, including currently due
Retainages on contracts 2,445,742 11.6 1,943,436 9.0 to subcontractors 7,618,854 36.2 8,673,728 40.3
Unbilled work 632,740 3.0 715,717 3.3 Subcontracts retainages 2,597,146 12.3 2,459,601 11.4
Other receivables 124,338 0.6 197,900 0.9 Other 137,275 0.7 169,565 0.8
Less allowance for doubtful accounts (19,238) (0.1) (44,575) (0.2) Total accounts payable 10,353,275 49.2 11,302,895 52.5
Total receivables, net: 11,330,037 53.8 13,106,208 60.9
Accrued expenses 947,358 4.5 727,682 3.4
Inventories 6,836 0.0 6,981 0.0 Billings in excess of costs and recognized
Costs and recognized earnings in excess earnings on uncompleted contracts 2,233,676 10.6 2,107,463 9.8
of billings on uncompleted contracts 835,529 4.0 1,053,056 4.9 Income taxes:
Investments in and advances to Current 18,408 0.1 38,687 0.2
construction joint ventures 308,385 1.5 228,476 1.1 Deferred 47,487 0.2 43,333 0.2
Income taxes: Other current liabilities 126,861 0.6 363,824 1.7
Current/refundable 43,585 0.2 19,031 0.1 Total current liabilities 14,143,578 67.2 15,292,260 71.0
Deferred 52,271 0.2 52,201 0.2 Noncurrent liabilities
Other current assets 529,360 2.5 809,580 3.8 Long-term debt, excluding current maturities 1,356,743 6.4 590,514 2.7
Total current assets 18,067,180 85.8 19,891,446 92.4 Deferred income taxes 26,645 0.1 16,970 0.1
Other 123,383 0.6 76,743 0.4
Property, plant and equipment 3,173,975 15.1 2,984,160 13.9 Total liabilities 15,650,348 74.4 15,976,486 74.2
Less accumulated depreciation (1,966,677) (9.3) (1,925,860) (8.9) Minority interests 15,676 0.1 2,176 0.0
Property, plant and equipment, net 1,207,298 5.7 1,058,300 4.9 Net worth:
Common stock, par value 276,958 1.3 207,841 1.0
Noncurrent assets: Preferred stock, stated value 1,140 0.0 1,095 0.0
Long-term investments 1,034,649 4.9 173,985 0.8 Additional paid-in capital 534,636 2.5 184,781 0.9
Deferred income taxes 88,741 0.4 16,931 0.1 Retained earnings 4,672,550 22.2 5,246,089 24.4
Other assets 649,214 3.1 395,816 1.8 Treasury stock (610,521) (2.9) (540,289) (2.5)
Total noncurrent assets 1,772,604 8.4 586,733 2.7 Excess value of marketable securities 137,607 0.7 28,658 0.1
Other equity 368,689 1.8 429,641 2.0
Total net worth 5,381,058 25.6 5,557,817 25.8
Total assets $ 21,047,082 100.0 % $ 21,536,479 100.0 % Total liabilities and net worth $ 21,047,082 100.0 % $ 21,536,479 100.0 %
Statement of Earnings Financial Ratios
2005 Participants 2004 Participants 2005 Participants 2004 Participants
Amount Percent Amount Percent Average Median Average Median
Contract revenue $ 66,995,477 99.8 % $ 68,053,731 100.0 % Liquidity Ratios
Other revenue 123,516 0.2 25,537 0.0
Total Revenue 67,118,993 100.0 68,079,268 100.0 Current Ratio 1.3 1.2 1.3 1.2
Quick Ratio 1.2 1.1 1.2 1.1
Contract cost (63,809,790) (95.1) (63,322,201) (93.0) Days of Cash 18.5 14.7 17.0 13.1
Other cost (61,314) (0.1) 0 0.0 Working Capital Turnover 17.1 23.7 14.8 17.7
Total cost (63,871,105) (95.2) (63,322,201) (93.0)
Profitability Ratios
Gross Profit 3,247,888 4.8 4,757,067 7.0
Return on Assets * (2.2) % 3.8 % 3.1 % 3.2 %
Selling, general & administrative expenses: Return on Equity * (8.7) % 17.3 % 12.0 % 11.6 %
Payroll (1,844,132) (2.7) (2,173,881) (3.2) Times Interest Earned (7.2) 9.9 18.6 5.5
Professional fees (130,602) (0.2) (128,562) (0.2)
Sales & marketing costs (191,156) (0.3) (196,297) (0.3) Leverage Ratios
Technology costs (88,421) (0.1) (83,091) (0.1)
Administrative bonuses (372,543) (0.6) (422,050) (0.6) Debt to Equity 2.9 2.9 2.9 3.7
Other (1,306,814) (1.9) (1,242,208) (1.8) Revenue to Equity 12.5 14.7 12.2 13.4
Total SG&A expenses (3,933,667) (5.9) (4,246,090) (6.2) Asset Turnover 3.2 3.4 3.2 3.3
Fixed Asset Ratio 22.4 % 16.1 % 19.0 % 11.1 %
Income from operations (685,779) (1.0) 510,977 0.8 Equity to SG&A Expense 1.4 1.2 1.3 1.3
Underbillings to Equity 27.3 % 11.8 % 31.8 % 12.6 %
Interest income 75,162 0.1 91,780 0.1 Backlog to Equity 10.0 7.8 13.9 11.7
Interest expense (57,450) (0.1) (37,886) (0.1)Other income / (expense), net 197,641 0.3 102,503 0.2
Efficiency Ratios
Net earnings / (loss) before income taxes (470,426) (0.7) 667,374 1.0
Backlog to Working Capital 13.3 11.1 18.2 14.5
Income tax (expense) / benefit (28,718) (0.0) (119,259) (0.2) Months in Backlog 7.9 6.4 11.2 9.9
Days in Accounts Receivable 44.3 45.9 55.2 44.9
Net earnings $ (499,144) (0.7) % $ 548,114 0.8 % Days in Inventory 0.0 0.1 0.0 0.2
Days in Accounts Payable 43.7 43.3 50.3 45.8
Operating Cycle 19.1 24.0 22.0 22.2
Number of ParticipantsNumber
2005 432004 42
Note: Not all figures will apear to sum due to rounding.
$50 - $100 Million Revenue
* In theCFMA's 2005 Annual Financial Study, Returnon Assets(ROA)and Returnon Equity (ROE) are calculated using
net earnings (loss) before income taxes. Studies conducted in prior years used net earnings (loss) after taxes to
calculate ROA and ROE. All references to ROAs and ROEs from prior studies have been updated to reflect this change.
Industrial & Nonresidential Contractors
Industrial & Nonresidential Contractors

8/13/2019 2005 Financial Survey
http://slidepdf.com/reader/full/2005-financial-survey 131/284
Balance Sheet
2005 Participants 2004 Participants 2005 Participants 2004 Participants
Amount Percent Amount Percent Amount Percent Amount Percent
Current assets: Current liabilities:
Cash and cash equivalents $ 20,334,012 17.5 % $ 15,081,479 15.2 % Current maturity on long-term debt $ 421,101 0.4 % $ 340,286 0.3 %
Marketable securities & short-term investments 11,363,161 9.8 10,610,189 10.7 Notes payable and lines of credit 489,462 0.4 628,344 0.6
Receivables: Accounts payable:
Contract receivables currently due 47,825,909 41.2 40,962,118 41.3 Trade, including currently due
Retainages on contracts 16,923,028 14.6 14,378,504 14.5 to subcontractors 45,136,694 38.9 37,327,612 37.6
Unbilled work 223,443 0.2 444,040 0.4 Subcontracts retainages 16,645,943 14.3 14,420,630 14.5
Other receivables 1,777,554 1.5 1,384,299 1.4 Other 459,979 0.4 1,301,071 1.3
Less allowance for doubtful accounts (97,199) (0.1) (94,228) (0.1) Total accounts payable 62,242,616 53.6 53,049,313 53.5
Total receivables, net: 66,652,735 57.4 57,074,733 57.5
Accrued expenses 7,213,402 6.2 5,535,885 5.6
Inventories 148,802 0.1 188,784 0.2 Billings in excess of costs and recognized
Costs and recognized earnings in excess earnings on uncompleted contracts 14,977,155 12.9 11,301,839 11.4
of billings on uncompleted contracts 5,163,310 4.4 3,369,703 3.4 Income taxes:
Investments in and advances to Current 59,586 0.1 85,125 0.1
construction joint ventures 722,326 0.6 334,246 0.3 Deferred 207,832 0.2 17,754 0.0
Income taxes: Other current liabilities 1,236,108 1.1 1,436,239 1.4
Current/refundable 42,142 0.0 230,882 0.2 Total current liabilities 86,847,261 74.8 72,394,785 73.0
Deferred 163,255 0.1 376,661 0.4 Noncurrent liabilities
Other current assets 2,182,697 1.9 2,043,486 2.1 Long-term debt, excluding current maturities 1,656,140 1.4 2,610,585 2.6
Total current assets 106,772,440 91.9 89,310,162 90.0 Deferred income taxes 79,766 0.1 74,741 0.1
Other 1,309,404 1.1 2,192,501 2.2
Property, plant and equipment 13,137,680 11.3 13,437,854 13.5 Total liabilities 89,892,571 77.4 77,272,612 77.9
Less accumulated depreciation (8,040,211) (6.9) (7,469,271) (7.5) Minority interests 153,044 0.1 111,163 0.1
Property, plant and equipment, net 5,097,469 4.4 5,968,583 6.0 Net worth:
Common stock, par value 536,053 0.5 571,487 0.6
Noncurrent assets: Preferred stock, stated value 408,754 0.4 94,148 0.1
Long-term investments 1,350,572 1.2 785,324 0.8 Additional paid-in capital 2,448,128 2.1 1,872,279 1.9
Deferred income taxes 461,114 0.4 557,217 0.6 Retained earnings 20,274,882 17.5 17,148,502 17.3
Other assets 2,485,422 2.1 2,592,396 2.6 Treasury stock (832,869) (0.7) (587,269) (0.6)
Total noncurrent assets 4,297,108 3.7 3,934,937 4.0 Excess value of marketable securities 220,103 0.2 190,796 0.2
Other equity 3,066,351 2.6 2,539,964 2.6
Total net worth 26,121,402 22.5 21,829,907 22.0
Total assets $ 116,167,018 100.0 % $ 99,213,682 100.0 % Total liabilities and net worth $ 116,167,018 100.0 % $ 99,213,682 100.0 %
Statement of Earnings Financial Ratios
2005 Participants 2004 Participants 2005 Participants 2004 Participants
Amount Percent Amount Percent Average Median Average Median
Contract revenue $ 372,878,445 100.0 % $ 327,116,475 98.7 % Liquidity Ratios
Other revenue 180,341 0.0 4,254,702 1.3
Total Revenue 373,058,785 100.0 331,371,177 100.0 Current Ratio 1.2 1.2 1.2 1.2
Quick Ratio 1.1 1.1 1.1 1.1
Contract cost (354,120,385) (94.9) (309,912,881) (93.5) Days of Cash 19.6 17.8 16.4 15.0
Other cost (246,219) (0.1) (3,471,653) (1.0) Working Capital Turnover 18.7 19.7 19.6 25.2
Total cost (354,366,604) (95.0) (313,384,533) (94.6)
Profitability Ratios
Gross Profit 18,692,181 5.0 17,986,644 5.4
Return on Assets * 4.5 % 4.4 % 4.7 % 4.1 %
Selling, general & administrative expenses: Return on Equity * 20.1 % 23.7 % 21.3 % 20.3 %
Payroll (7,395,708) (2.0) (7,988,228) (2.4) Times Interest Earned 33.0 24.4 25.8 16.7
Professional fees (606,754) (0.2) (491,813) (0.1)
Sales & marketing costs (709,765) (0.2) (470,897) (0.1) Leverage Ratios
Technology costs (664,722) (0.2) (269,214) (0.1)
Administrative bonuses (1,130,417) (0.3) (982,374) (0.3) Debt to Equity 3.4 3.9 3.5 3.9
Other (3,634,826) (1.0) (3,795,870) (1.1) Revenue to Equity 14.3 17.3 15.2 20.1
Total SG&A expenses (14,142,191) (3.8) (13,998,396) (4.2) Asset Turnover 3.2 3.5 3.3 3.6
Fixed Asset Ratio 19.5 % 13.2 % 27.3 % 19.2 %
Income from operations 4,549,990 1.2 3,988,248 1.2 Equity to SG&A Expense 1.8 1.6 1.6 1.2
Underbillings to Equity 20.6 % 13.4 % 17.5 % 16.5 %
Interest income 675,726 0.2 588,819 0.2 Backlog to Equity 15.2 14.9 18.7 14.8
Interest expense (163,910) (0.0) (188,019) (0.1)Other income / (expense), net 185,214 0.0 271,239 0.1
Efficiency Ratios
Net earnings / (loss) before income taxes 5,247,019 1.4 4,660,287 1.4
Backlog to Working Capital 19.9 17.7 24.9 18.9
Income tax (expense) / benefit (534,473) (0.1) (642,902) (0.2) Months in Backlog 11.4 9.9 11.2 8.4
Days in Accounts Receivable 47.8 50.5 45.9 44.9
Net earnings $ 4,712,546 1.3 % $ 4,017,385 1.2 % Days in Inventory 0.2 0.7 0.2 0.8
Days in Accounts Payable 46.3 48.2 44.4 42.7
Operating Cycle 21.2 22.8 18.1 22.8
Number of ParticipantsNumber
2005 652004 61
Industrial & Nonresidential Contractors
Note: Not all figures will apear to sum due to rounding.
* In theCFMA's 2005 Annual Financial Study, Returnon Assets(ROA)and Returnon Equity (ROE) are calculated using
net earnings (loss) before income taxes. Studies conducted in prior years used net earnings (loss) after taxes to
calculate ROA and ROE. All references to ROAs and ROEs from prior studies have been updated to reflect this change.
Industrial & Nonresidential ContractorsMore Than $100 Million Revenue
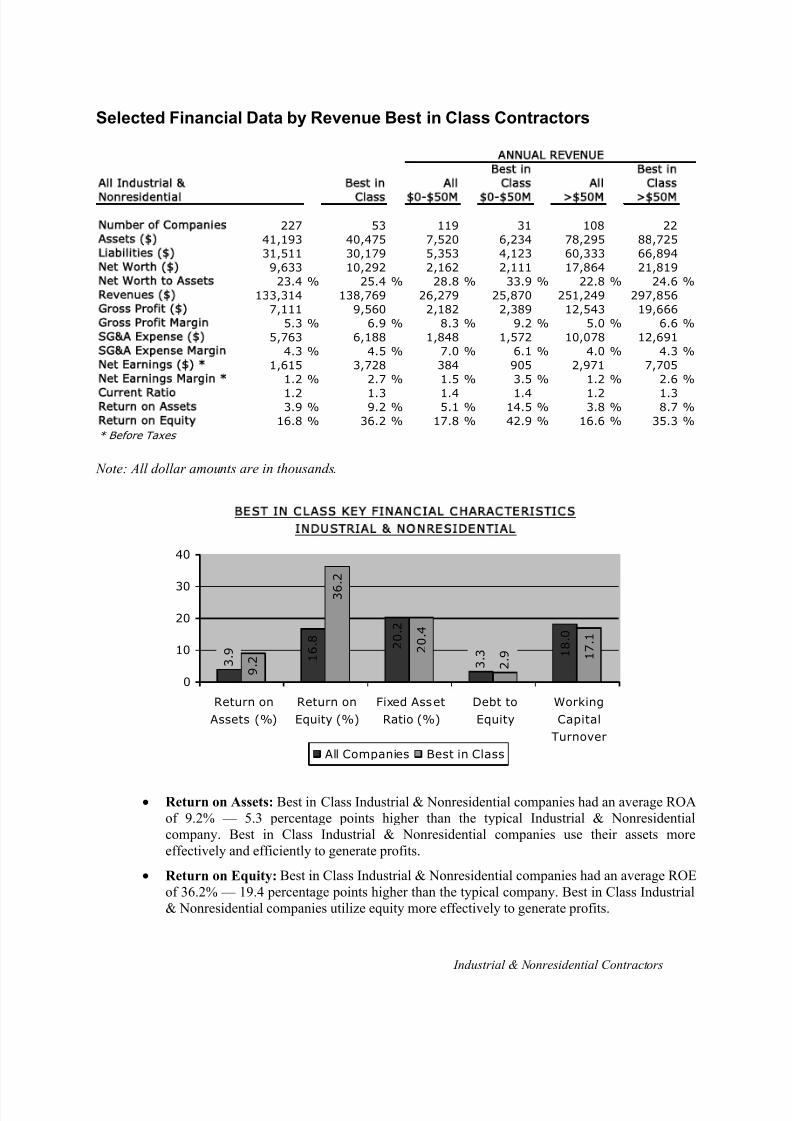
8/13/2019 2005 Financial Survey
http://slidepdf.com/reader/full/2005-financial-survey 132/284
Industrial & Nonresidential Contractors
Selected Financial Data by Revenue Best in Class Contractors
Best in Best in
All Industrial & Best in All Class All Class
Nonresidential Class 0- 50M 0- 50M > 50M > 50M
Number of Companies 227 53 119 31 108 22
Assets ( ) 41,193 40,475 7,520 6,234 78,295 88,725
Liabilities ( ) 31,511 30,179 5,353 4,123 60,333 66,894
Net Worth ( ) 9,633 10,292 2,162 2,111 17,864 21,819
Net Worth to Assets 23.4 % 25.4 % 28.8 % 33.9 % 22.8 % 24.6 %
Revenues ( ) 133,314 138,769 26,279 25,870 251,249 297,856
Gross Profit ( ) 7,111 9,560 2,182 2,389 12,543 19,666
Gross Profit Margin 5.3 % 6.9 % 8.3 % 9.2 % 5.0 % 6.6 %
SG&A Expense ( ) 5,763 6,188 1,848 1,572 10,078 12,691
SG&A Expense Margin 4.3 % 4.5 % 7.0 % 6.1 % 4.0 % 4.3 %
Net Earnings ( ) * 1,615 3,728 384 905 2,971 7,705
Net Earnings Margin * 1.2 % 2.7 % 1.5 % 3.5 % 1.2 % 2.6 %
Current Ratio 1.2 1.3 1.4 1.4 1.2 1.3Return on Assets 3.9 % 9.2 % 5.1 % 14.5 % 3.8 % 8.7 %
Return on Equity 16.8 % 36.2 % 17.8 % 42.9 % 16.6 % 35.3 %
* Before Taxes
ANNUAL REVENUE
Note: All dollar amounts are in thousands.
B E S T I N C L A S S K E Y F I N A N C I A L C H A R A C T E R I S TI C S
I N D U S TR I AL & N O N R E S I D E N T I A L
1 8
. 0 2 0
. 2
1 6
. 8
1 7
. 1 2 0
. 4
3 6
. 2
9 . 2
0
10
20
30
40
Return on
Assets (%)
Return on
Equity (%)
Fixed Asset
Ratio (%)
Debt to
Equity
Working
Capital
Turnover
All Companies Best in Class
• Return on Assets: Best in Class Industrial & Nonresidential companies had an average ROAof 9.2% — 5.3 percentage points higher than the typical Industrial & Nonresidentialcompany. Best in Class Industrial & Nonresidential companies use their assets moreeffectively and efficiently to generate profits.
• Return on Equity: Best in Class Industrial & Nonresidential companies had an average ROEof 36.2% — 19.4 percentage points higher than the typical company. Best in Class Industrial& Nonresidential companies utilize equity more effectively to generate profits.
2 . 9
3 . 3
3 . 9

8/13/2019 2005 Financial Survey
http://slidepdf.com/reader/full/2005-financial-survey 133/284
Industrial & Nonresidential Contractors
• Fixed Asset Ratio: Best in Class Industrial & Nonresidential companies had an averageFixed Asset Ratio of 20.4 — 0.2 percentage points higher than the typical company. Best inClass Industrial & Nonresidential companies are using slightly more equity to finance the purchase of fixed assets than the typical company.
• Debt to Equity: Best in Class Industrial & Nonresidential companies had an average Debt to
Equity ratio of 2.9 — 0.4 lower than the typical company. Best in Class Industrial & Nonresidential companies take less financial risk to generate superior financial performanceas compared to the typical company.
• Working Capital Turnover: Best in Class Industrial & Nonresidential companies turnedover their working capital an average of 17.1 times — 0.9 times less than the typicalcompany. The advantages held in other areas are making up for the lower working capitalturnover ratio.

8/13/2019 2005 Financial Survey
http://slidepdf.com/reader/full/2005-financial-survey 134/284
Balance Sheet
All Participants Best in Class All Participants Best in Class
Amount Percent Amount Percent Amount Percent Amount Percent
Current assets: Current liabilities:
Cash and cash equivalents $ 7,286,579 17.7 % $ 9,015,415 22.3 % Current maturity on long-term debt $ 192,110 0.5 % $ 63,499 0.2 %Marketable securities & short-term investments 3,748,113 9.1 3,167,140 7.8 Notes payable and lines of credit 216,248 0.5 38,597 0.1
Receivables: Accounts payable:
Contract receivables currently due 17,039,458 41.4 16,114,434 39.8 Trade, including currently due
Retainages on contracts 5,739,338 13.9 6,133,244 15.2 to subcontractors 15,924,529 38.7 13,444,905 33.2
Unbilled work 231,244 0.6 129,744 0.3 Subcontracts retainages 5,716,494 13.9 5,423,470 13.4
Other receivables 564,447 1.4 708,195 1.7 Other 174,023 0.4 257,912 0.6
Less allowance for doubtful accounts (37,123) (0.1) (31,230) (0.1) Total accounts payable 21,815,045 53.0 19,126,286 47.3
Total receivables, net: 23,537,363 57.1 23,054,388 57.0
Accrued expenses 2,367,884 5.7 2,719,623 6.7
Inventories 62,318 0.2 40,613 0.1 Billings in excess of costs and recognized
Costs and recognized earnings in excess earnings on uncompleted contracts 5,128,250 12.4 7,056,515 17.4
of billings on uncompleted contracts 1,771,079 4.3 1,236,654 3.1 Income taxes:
Investments in and advances to Current 27,894 0.1 16,822 0.0
construction joint ventures 267,770 0.7 381,659 0.9 Deferred 70,298 0.2 3,058 0.0
Income taxes: Other current liabilities 403,782 1.0 500,934 1.2
Current/refundable 24,682 0.1 14,232 0.0 Total current liabilities 30,221,513 73.4 29,525,335 72.9
Deferred 62,432 0.2 1,327 0.0 Noncurrent liabilities
Other current assets 848,258 2.1 728,932 1.8 Long-term debt, excluding current maturities 840,236 2.0 213,921 0.5
Total current assets 37,608,594 91.3 37,640,358 93.0 Deferred income taxes 35,588 0.1 13,191 0.0
Other 413,410 1.0 426,630 1.1
Property, plant and equipment 5,129,943 12.5 5,402,769 13.3 Total liabilities 31,510,746 76.5 30,179,077 74.6
Less accumulated depreciation (3,184,441) (7.7) (3,299,757) (8.2) Minority interests 49,308 0.1 4,514 0.0
Property, plant and equipment, net 1,945,503 4.7 2,103,012 5.2 Net worth:
Common stock, par value 267,875 0.7 271,637 0.7
Noncurrent assets: Preferred stock, stated value 134,469 0.3 44,557 0.1
Long-term investments 594,860 1.4 306,146 0.8 Additional paid-in capital 879,010 2.1 568,303 1.4
Deferred income taxes 152,721 0.4 0 0.0 Retained earnings 7,614,959 18.5 7,329,149 18.1
Other assets 890,988 2.2 425,849 1.1 Treasury stock (374,562) (0.9) (565,508) (1.4)
Total noncurrent assets 1,638,569 4.0 731,995 1.8 Excess value of marketable securities 98,515 0.2 215,164 0.5
Other equity 1,012,347 2.5 2,428,472 6.0
Total net worth 9,632,612 23.4 10,291,774 25.4
Total assets $ 41,192,667 100.0 % $ 40,475,365 100.0 % Total liabilities and net worth $ 41,192,667 100.0 % $ 40,475,365 100.0 %
Statement of Earnings Financial Ratios
All Participants Best in Class All Participants Best in Class
Amount Percent Amount Percent Average Median Average Median
Contract revenue $ 133,182,935 99.9 % $ 138,744,811 100.0 % Liquidity Ratios
Other revenue 130,634 0.1 24,572 0.0
Total Revenue 133,313,569 100.0 138,769,383 100.0 Current Ratio 1.2 1.3 1.3 1.4
Quick Ratio 1.1 1.2 1.2 1.3
Contract cost (126,002,256) (94.5) (129,180,980) (93.1) Days of Cash 19.7 16.3 23.4 19.8
Other cost (200,044) (0.2) (27,934) (0.0) Working Capital Turnover 18.0 18.5 17.1 17.3
Total cost (126,202,300) (94.7) (129,208,914) (93.1)
Profitability Ratios
Gross Profit 7,111,269 5.3 9,560,469 6.9
Return on Assets * 3.9 % 4.1 % 9.2 % 11.9 %
Selling, general & administrative expenses: Return on Equity * 16.8 % 16.9 % 36.2 % 40.2 %
Payroll (3,002,109) (2.3) (3,029,699) (2.2) Times Interest Earned 25.2 14.3 282.6 66.8
Professional fees (229,973) (0.2) (185,740) (0.1)
Sales & marketing costs (283,391) (0.2) (175,939) (0.1) Leverage Ratios
Technology costs (224,549) (0.2) (185,985) (0.1)
Administrative bonuses (445,999) (0.3) (541,135) (0.4) Debt to Equity 3.3 3.1 2.9 2.3
Other (1,577,207) (1.2) (2,069,020) (1.5) Revenue to Equity 13.8 14.9 13.5 13.2
Total SG&A expenses (5,763,229) (4.3) (6,187,518) (4.5) Asset Turnover 3.2 3.5 3.4 3.8
Fixed Asset Ratio 20.2 % 16.7 % 20.4 % 13.6 %
Income from operations 1,348,040 1.0 3,372,951 2.4 Equity to SG&A Expense 1.7 1.2 1.7 1.3
Underbillings to Equity 20.8 % 10.6 % 13.3 % 8.9 %
Interest income 221,383 0.2 189,615 0.1 Backlog to Equity 12.4 9.2 9.1 6.5
Interest expense (66,769) (0.1) (13,239) (0.0)
Other income / (expense), net 111,901 0.1 178,374 0.1
Efficiency Ratios
Net earnings / (loss) before income taxes 1,614,555 1.2 3,727,701 2.7
Backlog to Working Capital 16.3 11.9 11.0 9.8
Income tax (expense) / benefit (164,042) (0.1) (88,377) (0.1) Months in Backlog 8.6 7.3 8.0 6.2
Days in Accounts Receivable 47.4 47.3 43.6 39.4
Net earnings $ 1,450,513 1.1 % $ 3,639,324 2.6 % Days in Inventory 0.2 0.6 0.1 0.7
Days in Accounts Payable 45.9 43.3 38.2 35.7
Operating Cycle 21.4 24.3 28.9 29.7
Number of ParticipantsNumber Number
227 53
Note: Not all figures will apear to sum due to rounding.
Industrial & Nonresidential ContractorsComposite: Best in Class
* In theCFMA's 2005 Annual Financial Study, Return on Assets (ROA) andReturn on Equity (ROE) are calculated using
net earnings (loss) before income taxes. Studies conducted in prior years used net earnings (loss) after taxes to
calculate ROA and ROE. All references to ROAs and ROEs from prior studies have been updated to reflect this change.
Industrial & Nonresidential Contractors
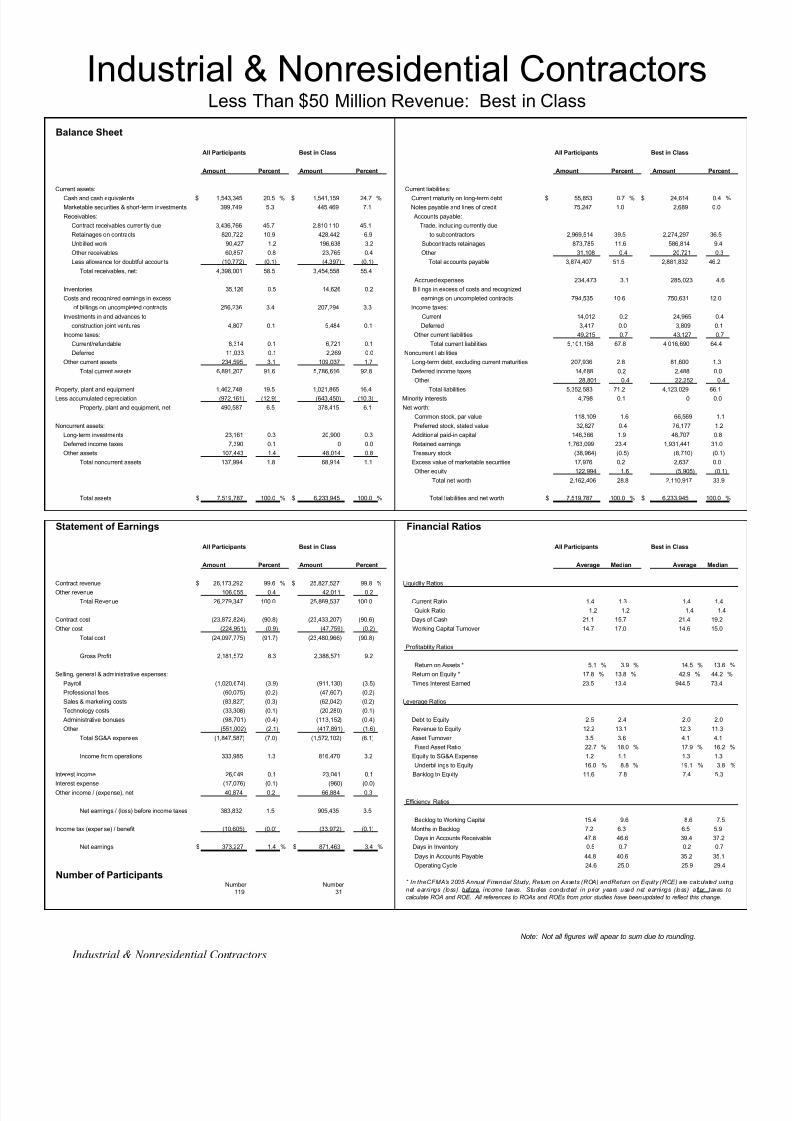
8/13/2019 2005 Financial Survey
http://slidepdf.com/reader/full/2005-financial-survey 135/284
Balance Sheet
All Participants Best in Class All Participants Best in Class
Amount Percent Amount Percent Amount Percent Amount Percent
Current assets: Current liabilities:
Cash and cash equivalents $ 1,543,345 20.5 % $ 1,541,159 24.7 % Current maturity on long-term debt $ 55,853 0.7 % $ 24,614 0.4 %
Marketable securities & short-term investments 399,749 5.3 445,469 7.1 Notes payable and lines of credit 75,247 1.0 2,689 0.0
Receivables: Accounts payable:
Contract receivables currently due 3,436,766 45.7 2,810,110 45.1 Trade, including currently due
Retainages on contracts 820,722 10.9 428,442 6.9 to subcontractors 2,969,514 39.5 2,274,297 36.5
Unbilled work 90,427 1.2 196,638 3.2 Subcontracts retainages 873,785 11.6 586,814 9.4
Other receivables 60,857 0.8 23,765 0.4 Other 31,108 0.4 20,721 0.3
Less allowance for doubtful accounts (10,772) (0.1) (4,397) (0.1) Total accounts payable 3,874,407 51.5 2,881,832 46.2
Total receivables, net: 4,398,001 58.5 3,454,558 55.4
Accrued expenses 234,473 3.1 285,023 4.6
Inventories 35,126 0.5 14,626 0.2 Billings in excess of costs and recognized
Costs and recognized earnings in excess earnings on uncompleted contracts 794,535 10.6 750,631 12.0
of billings on uncompleted contracts 256,236 3.4 207,294 3.3 Income taxes:
Investments in and advances to Current 14,012 0.2 24,965 0.4
construction joint ventures 4,807 0.1 5,484 0.1 Deferred 3,417 0.0 3,809 0.1
Income taxes: Other current liabilities 49,215 0.7 43,127 0.7
Current/refundable 8,314 0.1 6,721 0.1 Total current liabilities 5,101,158 67.8 4,016,690 64.4
Deferred 11,033 0.1 2,269 0.0 Noncurrent liabilities
Other current assets 234,595 3.1 109,037 1.7 Long-term debt, excluding current maturities 207,936 2.8 81,600 1.3
Total current assets 6,891,207 91.6 5,786,616 92.8 Deferred income taxes 14,688 0.2 2,488 0.0
Other 28,801 0.4 22,252 0.4
Property, plant and equipment 1,462,748 19.5 1,021,865 16.4 Total liabilities 5,352,583 71.2 4,123,029 66.1
Less accumulated depreciation (972,161) (12.9) (643,450) (10.3) Minority interests 4,798 0.1 0 0.0
Property, plant and equipment, net 490,587 6.5 378,415 6.1 Net worth:
Common stock, par value 118,109 1.6 66,569 1.1
Noncurrent assets: Preferred stock, stated value 32,827 0.4 76,177 1.2
Long-term investments 23,161 0.3 20,900 0.3 Additional paid-in capital 146,366 1.9 48,707 0.8
Deferred income taxes 7,390 0.1 0 0.0 Retained earnings 1,763,099 23.4 1,931,441 31.0
Other assets 107,443 1.4 48,014 0.8 Treasury stock (38,964) (0.5) (8,710) (0.1)
Total noncurrent assets 137,994 1.8 68,914 1.1 Excess value of marketable securities 17,976 0.2 2,637 0.0
Other equity 122,994 1.6 (5,905) (0.1)
Total net worth 2,162,406 28.8 2,110,917 33.9
Total assets $ 7,519,787 100.0 % $ 6,233,945 100.0 % Total liabilities and net worth $ 7,519,787 100.0 % $ 6,233,945 100.0 %
Statement of Earnings Financial Ratios
All Participants Best in Class All Participants Best in Class
Amount Percent Amount Percent Average Median Average Median
Contract revenue $ 26,173,292 99.6 % $ 25,827,527 99.8 % Liquidity Ratios
Other revenue 106,055 0.4 42,011 0.2
Total Revenue 26,279,347 100.0 25,869,537 100.0 Current Ratio 1.4 1.3 1.4 1.4
Quick Ratio 1.2 1.2 1.4 1.4
Contract cost (23,872,824) (90.8) (23,433,207) (90.6) Days of Cash 21.1 15.7 21.4 19.2
Other cost (224,951) (0.9) (47,759) (0.2) Working Capital Turnover 14.7 17.0 14.6 15.0
Total cost (24,097,775) (91.7) (23,480,966) (90.8)
Profitability Ratios
Gross Profit 2,181,572 8.3 2,388,571 9.2
Return on Assets * 5.1 % 3.9 % 14.5 % 13.6 %
Selling, general & administrative expenses: Return on Equity * 17.8 % 13.8 % 42.9 % 44.2 %
Payroll (1,020,674) (3.9) (911,130) (3.5) Times Interest Earned 23.5 13.4 944.5 73.4
Professional fees (60,075) (0.2) (47,607) (0.2)
Sales & marketing costs (83,827) (0.3) (62,042) (0.2) Leverage Ratios
Technology costs (33,308) (0.1) (20,280) (0.1)
Administrative bonuses (98,701) (0.4) (113,152) (0.4) Debt to Equity 2.5 2.4 2.0 2.0
Other (551,002) (2.1) (417,891) (1.6) Revenue to Equity 12.2 13.1 12.3 11.3
Total SG&A expenses (1,847,587) (7.0) (1,572,102) (6.1) Asset Turnover 3.5 3.6 4.1 4.1
Fixed Asset Ratio 22.7 % 18.0 % 17.9 % 16.2 %
Income from operations 333,985 1.3 816,470 3.2 Equity to SG&A Expense 1.2 1.1 1.3 1.3
Underbillings to Equity 16.0 % 8.8 % 19.1 % 3.8 %
Interest income 26,049 0.1 23,041 0.1 Backlog to Equity 11.6 7.8 7.4 5.3
Interest expense (17,076) (0.1) (960) (0.0)Other income / (expense), net 40,874 0.2 66,884 0.3
Efficiency Ratios
Net earnings / (loss) before income taxes 383,832 1.5 905,435 3.5
Backlog to Working Capital 15.4 9.6 8.6 7.5
Income tax (expense) / benefit (10,605) (0.0) (33,972) (0.1) Months in Backlog 7.2 6.3 6.5 5.9
Days in Accounts Receivable 47.8 46.6 39.4 37.2
Net earnings $ 373,227 1.4 % $ 871,463 3.4 % Days in Inventory 0.5 0.7 0.2 0.7
Days in Accounts Payable 44.8 40.6 35.2 35.1
Operating Cycle 24.6 25.0 25.9 29.4
Number of ParticipantsNumber Number
119 31
Industrial & Nonresidential Contractors
Note: Not all figures will apear to sum due to rounding.
* In theCFMA's 2005 Annual Financial Study, Return on Assets (ROA) andReturn on Equity (ROE) are calculated using
net earnings (loss) before income taxes. Studies conducted in prior years used net earnings (loss) after taxes to
calculate ROA and ROE. All references to ROAs and ROEs from prior studies have been updated to reflect this change.
Industrial & Nonresidential ContractorsLess Than $50 Million Revenue: Best in Class
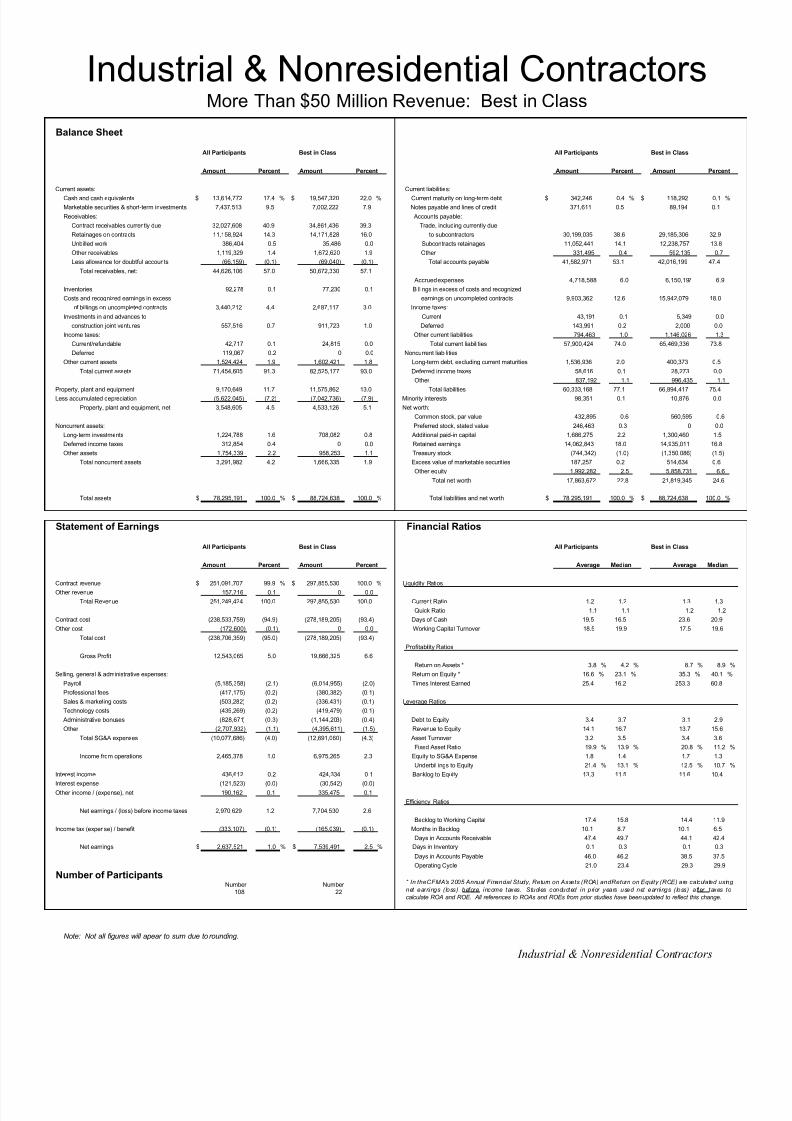
8/13/2019 2005 Financial Survey
http://slidepdf.com/reader/full/2005-financial-survey 136/284
Balance Sheet
All Participants Best in Class All Participants Best in Class
Amount Percent Amount Percent Amount Percent Amount Percent
Current assets: Current liabilities:
Cash and cash equivalents $ 13,614,772 17.4 % $ 19,547,320 22.0 % Current maturity on long-term debt $ 342,246 0.4 % $ 118,292 0.1 %
Marketable securities & short-term investments 7,437,513 9.5 7,002,222 7.9 Notes payable and lines of credit 371,611 0.5 89,194 0.1
Receivables: Accounts payable:
Contract receivables currently due 32,027,608 40.9 34,861,436 39.3 Trade, including currently due
Retainages on contracts 11,158,924 14.3 14,171,828 16.0 to subcontractors 30,199,035 38.6 29,185,306 32.9
Unbilled work 386,404 0.5 35,486 0.0 Subcontracts retainages 11,052,441 14.1 12,238,757 13.8
Other receivables 1,119,329 1.4 1,672,620 1.9 Other 331,495 0.4 592,135 0.7
Less allowance for doubtful accounts (66,159) (0.1) (69,040) (0.1) Total accounts payable 41,582,971 53.1 42,016,199 47.4
Total receivables, net: 44,626,106 57.0 50,672,330 57.1
Accrued expenses 4,718,588 6.0 6,150,197 6.9
Inventories 92,278 0.1 77,230 0.1 Billings in excess of costs and recognized
Costs and recognized earnings in excess earnings on uncompleted contracts 9,903,362 12.6 15,942,079 18.0
of billings on uncompleted contracts 3,440,212 4.4 2,687,117 3.0 Income taxes:
Investments in and advances to Current 43,191 0.1 5,349 0.0
construction joint ventures 557,516 0.7 911,723 1.0 Deferred 143,991 0.2 2,000 0.0
Income taxes: Other current liabilities 794,463 1.0 1,146,026 1.3
Current/refundable 42,717 0.1 24,815 0.0 Total current liabilities 57,900,424 74.0 65,469,336 73.8
Deferred 119,067 0.2 0 0.0 Noncurrent liabilities
Other current assets 1,524,424 1.9 1,602,421 1.8 Long-term debt, excluding current maturities 1,536,936 2.0 400,373 0.5
Total current assets 71,454,605 91.3 82,525,177 93.0 Deferred income taxes 58,616 0.1 28,273 0.0
Other 837,192 1.1 996,435 1.1
Property, plant and equipment 9,170,649 11.7 11,575,862 13.0 Total liabilities 60,333,168 77.1 66,894,417 75.4
Less accumulated depreciation (5,622,045) (7.2) (7,042,736) (7.9) Minority interests 98,351 0.1 10,876 0.0
Property, plant and equipment, net 3,548,605 4.5 4,533,126 5.1 Net worth:
Common stock, par value 432,895 0.6 560,595 0.6
Noncurrent assets: Preferred stock, stated value 246,463 0.3 0 0.0
Long-term investments 1,224,788 1.6 708,082 0.8 Additional paid-in capital 1,686,275 2.2 1,300,460 1.5
Deferred income taxes 312,854 0.4 0 0.0 Retained earnings 14,062,843 18.0 14,935,011 16.8
Other assets 1,754,339 2.2 958,253 1.1 Treasury stock (744,342) (1.0) (1,350,086) (1.5)
Total noncurrent assets 3,291,982 4.2 1,666,335 1.9 Excess value of marketable securities 187,257 0.2 514,634 0.6
Other equity 1,992,282 2.5 5,858,731 6.6
Total net worth 17,863,672 22.8 21,819,345 24.6
Total assets $ 78,295,191 100.0 % $ 88,724,638 100.0 % Total liabilities and net worth $ 78,295,191 100.0 % $ 88,724,638 100.0 %
Statement of Earnings Financial Ratios
All Participants Best in Class All Participants Best in Class
Amount Percent Amount Percent Average Median Average Median
Contract revenue $ 251,091,707 99.9 % $ 297,855,530 100.0 % Liquidity Ratios
Other revenue 157,716 0.1 0 0.0
Total Revenue 251,249,424 100.0 297,855,530 100.0 Current Ratio 1.2 1.2 1.3 1.3
Quick Ratio 1.1 1.1 1.2 1.2
Contract cost (238,533,759) (94.9) (278,189,205) (93.4) Days of Cash 19.5 16.5 23.6 20.9
Other cost (172,600) (0.1) 0 0.0 Working Capital Turnover 18.5 19.9 17.5 19.6
Total cost (238,706,359) (95.0) (278,189,205) (93.4)
Profitability Ratios
Gross Profit 12,543,065 5.0 19,666,325 6.6
Return on Assets * 3.8 % 4.2 % 8.7 % 8.9 %
Selling, general & administrative expenses: Return on Equity * 16.6 % 23.1 % 35.3 % 40.1 %
Payroll (5,185,358) (2.1) (6,014,955) (2.0) Times Interest Earned 25.4 16.2 253.3 60.8
Professional fees (417,175) (0.2) (380,382) (0.1)
Sales & marketing costs (503,282) (0.2) (336,431) (0.1) Leverage Ratios
Technology costs (435,269) (0.2) (419,479) (0.1)
Administrative bonuses (828,671) (0.3) (1,144,203) (0.4) Debt to Equity 3.4 3.7 3.1 2.9
Other (2,707,932) (1.1) (4,395,611) (1.5) Revenue to Equity 14.1 16.7 13.7 15.6
Total SG&A expenses (10,077,686) (4.0) (12,691,060) (4.3) Asset Turnover 3.2 3.5 3.4 3.6
Fixed Asset Ratio 19.9 % 13.9 % 20.8 % 11.2 %
Income from operations 2,465,378 1.0 6,975,265 2.3 Equity to SG&A Expense 1.8 1.4 1.7 1.3
Underbillings to Equity 21.4 % 13.1 % 12.5 % 10.7 %
Interest income 436,612 0.2 424,334 0.1 Backlog to Equity 13.3 11.5 11.6 10.4
Interest expense (121,523) (0.0) (30,542) (0.0)Other income / (expense), net 190,162 0.1 335,475 0.1
Efficiency Ratios
Net earnings / (loss) before income taxes 2,970,629 1.2 7,704,530 2.6
Backlog to Working Capital 17.4 15.8 14.4 11.9
Income tax (expense) / benefit (333,107) (0.1) (165,039) (0.1) Months in Backlog 10.1 8.7 10.1 6.5
Days in Accounts Receivable 47.4 49.7 44.1 42.4
Net earnings $ 2,637,521 1.0 % $ 7,539,491 2.5 % Days in Inventory 0.1 0.3 0.1 0.3
Days in Accounts Payable 46.0 46.2 38.5 37.5
Operating Cycle 21.0 23.4 29.3 29.9
Number of ParticipantsNumber Number
108 22
Note: Not all figures will apear to sum due to rounding.
* In theCFMA's 2005 Annual Financial Study, Return on Assets (ROA) andReturn on Equity (ROE) are calculated using
net earnings (loss) before income taxes. Studies conducted in prior years used net earnings (loss) after taxes to
calculate ROA and ROE. All references to ROAs and ROEs from prior studies have been updated to reflect this change.
More Than $50 Million Revenue: Best in Class
Industrial & Nonresidential Contractors
Industrial & Nonresidential Contractors

8/13/2019 2005 Financial Survey
http://slidepdf.com/reader/full/2005-financial-survey 137/284
C F M A ’s 2 0 0 5
Construction
Industry Annual
Financial Survey
HEAVY & HIGHWAY
CONTRACTORS
8/13/2019 2005 Financial Survey
http://slidepdf.com/reader/full/2005-financial-survey 138/284
Heavy & Highway Contractors
General Profile
Twenty percent of this year’s survey participants were Heavy & Highway contractors. The NAIC codesrepresented by this group include Highway and Street Construction (NAIC 23411), Bridge and TunnelConstruction (NAIC 23412), Water, Sewer and Pipeline Construction (NAIC 23491), Power andCommunication Transmission Line Construction (NAIC 23492), Industrial Non-Building StructureConstruction (NAIC 23493), and All Other Heavy Construction (NAIC 23499).
Two-thirds, or 67%, of this year’s participants also participated in 2004. A large majority (95%) areCFMA members.
The percentage of participants incorporated as S corporations increased to 60%; up from 57% in 2004.
As compared to the industry average, slightly more Heavy & Highway companies are employee-owned.There are more foreign-owned Heavy & Highway companies (2%) than all companies (1%).
Seventy-eight percent of Heavy & Highway companies are general contractors.
Consistent with prior years, almost two-thirds of Heavy & Highway revenue is derived from publicsources.
Heavy & Highway participants are fairly well distributed across the geographic regions. A quarter of participants were from the Midwest.
Seventy-six percent of the Heavy & Highway participants have been in business over 20 years.
Twenty-two percent of Heavy & Highway contractors have had a change in majority ownership over thelast five years. Of those, a sale to another domestic company is the most common form of transition.Other forms of transition included transfer to family or into an employee stock ownership plan trust(ESOP).
Eleven percent of Heavy & Highway contractors were eligible to bid on public projects as DisadvantagedBusiness Enterprises. The majority of those were Small Business Enterprises.
The number of accounting personnel at Heavy & Highway companies typically ranged from 3 to 21,depending on the size of the company.
For a complete breakdown of survey answers, please see Appendix A.
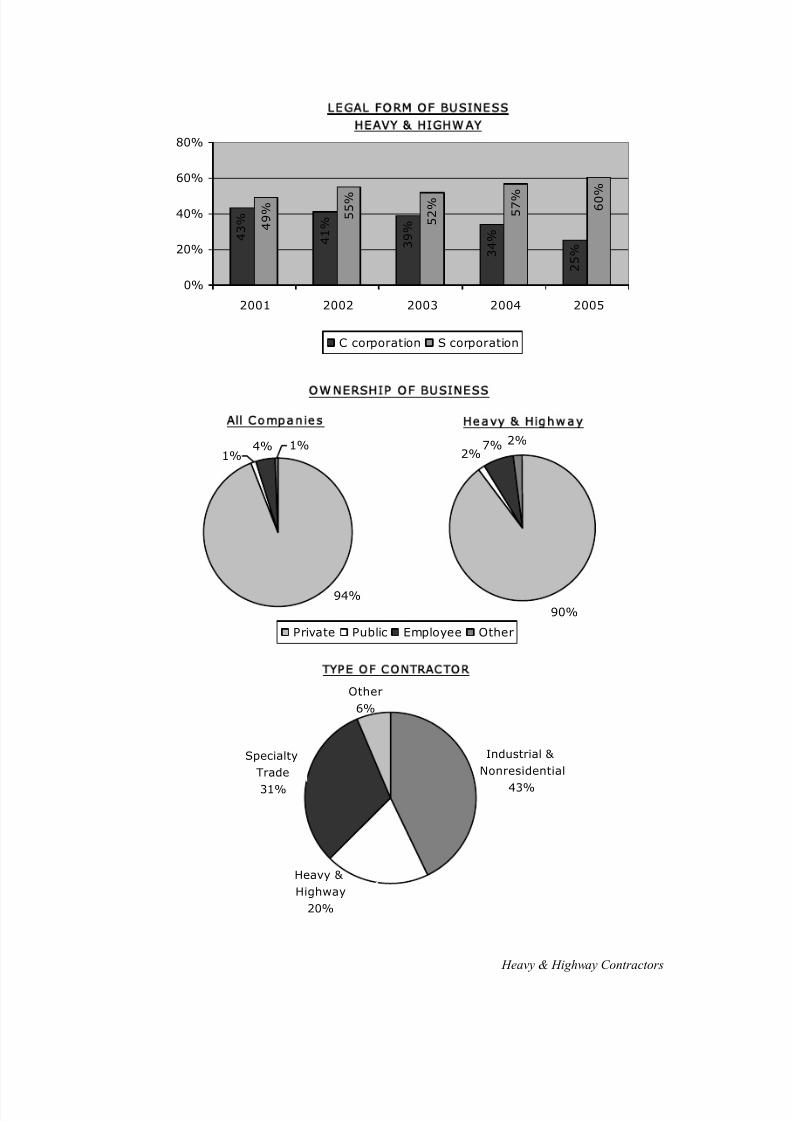
8/13/2019 2005 Financial Survey
http://slidepdf.com/reader/full/2005-financial-survey 139/284
Heavy & Highway Contractors
L E G A L F O R M O F B U S I N E S S
H E A V Y & H IG H W A Y
2 5 % 3
4 %
3 9 %
4 1 %
4 3 %
6 0 %
5 7 %
5 2 %
5 5 %
4 9 %
0%
20%
40%
60%
80%
2001 2002 2003 2004 2005
C corporation S corporation
OWNERSHIP OF BUSINESS
2%2%7%
90%
Private Public Employee Other
Heavy & Highw ay
4% 1%1%
94%
All Companies
TYPE OF C ONTRACTOR
Other
6%
Specialty
Trade
31%
Industrial &
Nonresidential
43%
Heavy &
Highway
20%
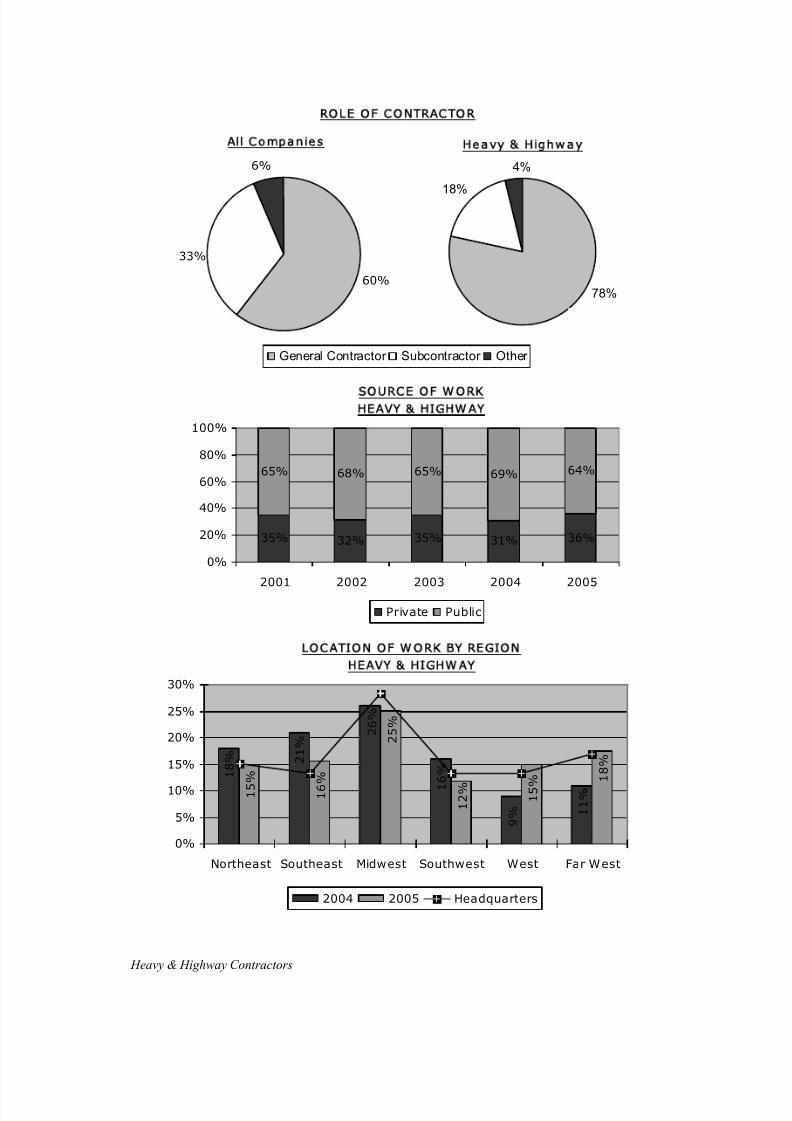
8/13/2019 2005 Financial Survey
http://slidepdf.com/reader/full/2005-financial-survey 140/284
Heavy & Highway Contractors
ROLE OF CONTRACTOR
18%
78%
4%
General Contractor Subcontractor Other
Heavy & Highwa y
6%
33%
60%
All Companies
S O U RC E O F W O R KH E A V Y & H IG H W A Y
35% 32% 35% 31% 36%
65% 68% 65% 69% 64%
0%
20%
40%
60%
80%
100%
2001 2002 2003 2004 2005
Private Public
LOC ATION OF W ORK BY REGION
HEAVY & HIGHWAY
1 8 % 2
1 %
2 6 %
1 6 %
9 % 1
1 % 1 5
%
1 6 %
2 5 %
1 2 % 1 5 %
1 8 %
0%
5%
10%
15%
20%
25%
30%
Northeast Southeast Midwest Southwest West Far West
2004 2005 Headquarters
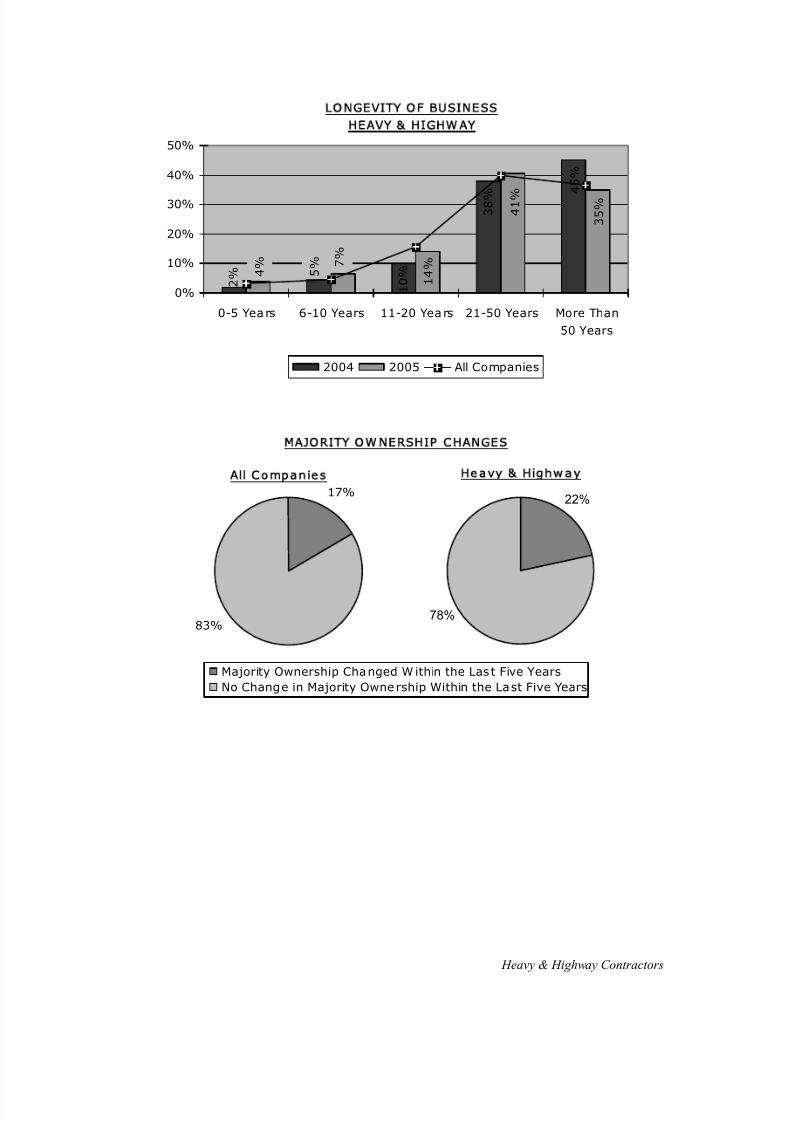
8/13/2019 2005 Financial Survey
http://slidepdf.com/reader/full/2005-financial-survey 141/284
Heavy & Highway Contractors
LONGEVITY OF BUSINESS
HEAVY & HIGHWAY
2 % 5
%
1 0 %
3 8 %
4 5 %
4 % 7
%
1 4 %
4 1 %
3 5 %
0%
10%
20%
30%
40%
50%
0-5 Years 6-10 Years 11-20 Years 21-50 Years More Than
50 Years
2004 2005 All Companies
MAJORITY OW NERSHIP CHANGES
78%
22%
Majority Ownership Changed W ithin the Las t Five Years
No Change in Majority Ownership Within the Last Five Years
Heavy & Highwa y
17%
83%
All Companies
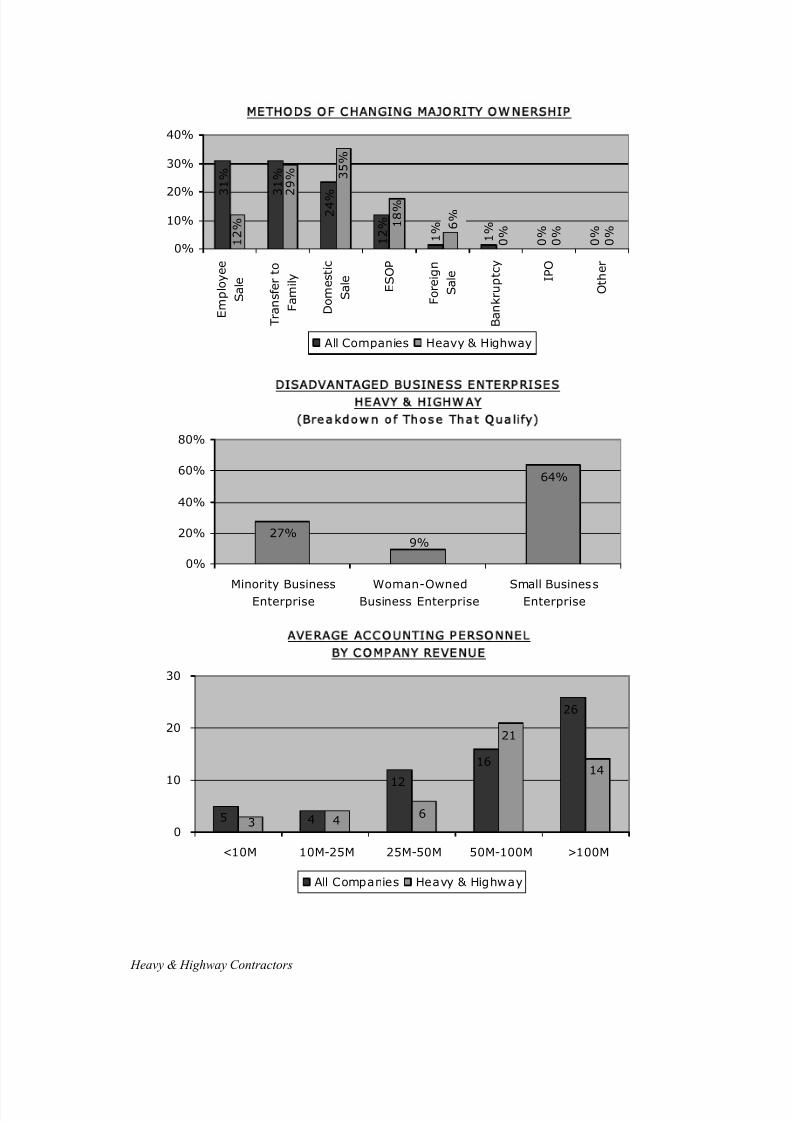
8/13/2019 2005 Financial Survey
http://slidepdf.com/reader/full/2005-financial-survey 142/284
Heavy & Highway Contractors
M E T H O D S O F C H A N G I N G M A JO R I T Y O W N E R S H I P
1 %
1 %
0 %
0 %
0 %
0 %
0 %
3 1 %
3 1 %
2 4 %
1 2 % 6
% 1 8 %
3 5 %
1 2 %
2 9 %
0%
10%
20%
30%
40%
E m p l o y e e
S a l e
T r a n s f e r t o
F a m i l y
D o m e s t i c
S a l e
E S O P
F o r e i g n
S a l e
B a n k r u p t c y
I P O
O t h e r
All Companies Heavy & Highway
DI SADVAN TAGED BU S I N ESS EN TER PR I SES
H E A V Y & H IG H W A Y
( Br e a k d o w n o f T h o s e T h a t Q u a l if y)
64%
9%27%
0%
20%
40%
60%
80%
Minority BusinessEnterprise
Woman-OwnedBusiness Enterprise
Small BusinessEnterprise
AVERAGE ACCO UNTING PERSONNEL
BY COMPANY REVENUE
26
5 4
12
1614
21
63 4
0
10
20
30
<10M 10M-25M 25M-50M 50M-100M >100M
All Companies Heavy & Highway
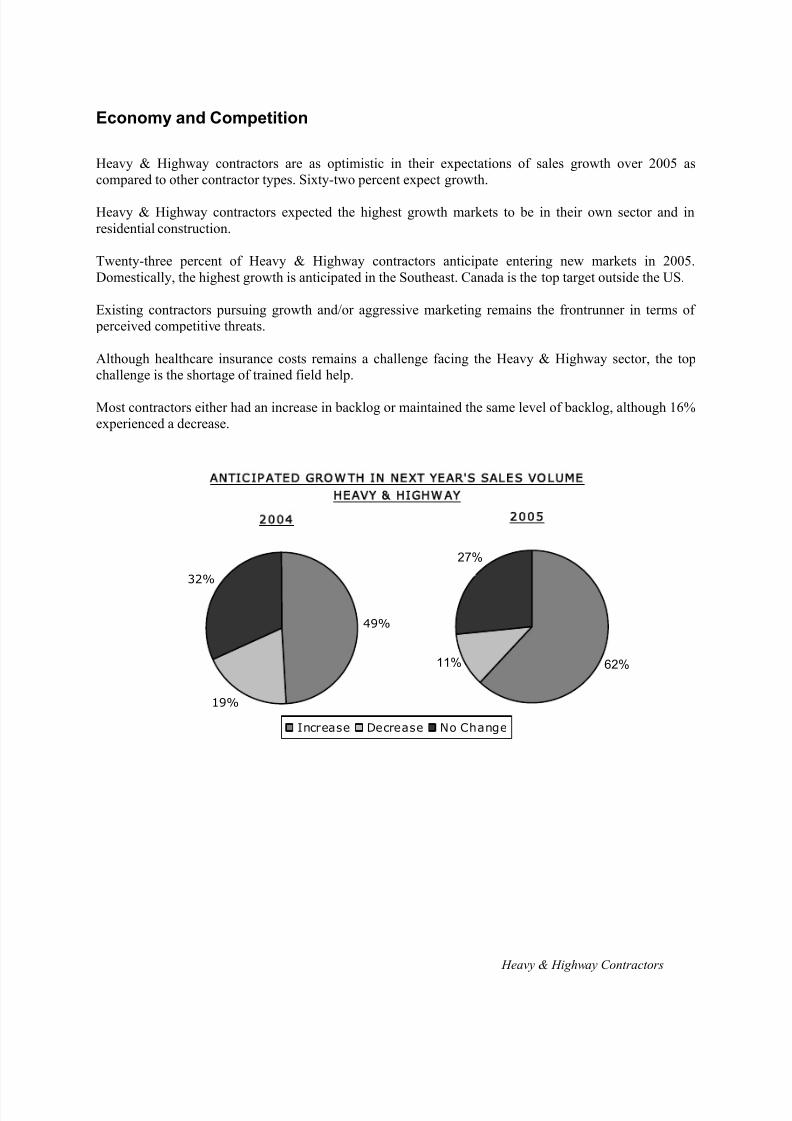
8/13/2019 2005 Financial Survey
http://slidepdf.com/reader/full/2005-financial-survey 143/284
Heavy & Highway Contractors
Economy and Competition
Heavy & Highway contractors are as optimistic in their expectations of sales growth over 2005 ascompared to other contractor types. Sixty-two percent expect growth.
Heavy & Highway contractors expected the highest growth markets to be in their own sector and inresidential construction.
Twenty-three percent of Heavy & Highway contractors anticipate entering new markets in 2005.Domestically, the highest growth is anticipated in the Southeast. Canada is the top target outside the US.
Existing contractors pursuing growth and/or aggressive marketing remains the frontrunner in terms of perceived competitive threats.
Although healthcare insurance costs remains a challenge facing the Heavy & Highway sector, the topchallenge is the shortage of trained field help.
Most contractors either had an increase in backlog or maintained the same level of backlog, although 16%experienced a decrease.
27%
62%11%
Increase Decrease No Change
2 0 0 5
A N T IC I P A T E D G R O W T H I N N E X T Y E A R' S SA L E S V O L U M E
H E A V Y & H IG H W A Y
49%
19%
32%
2 0 0 4
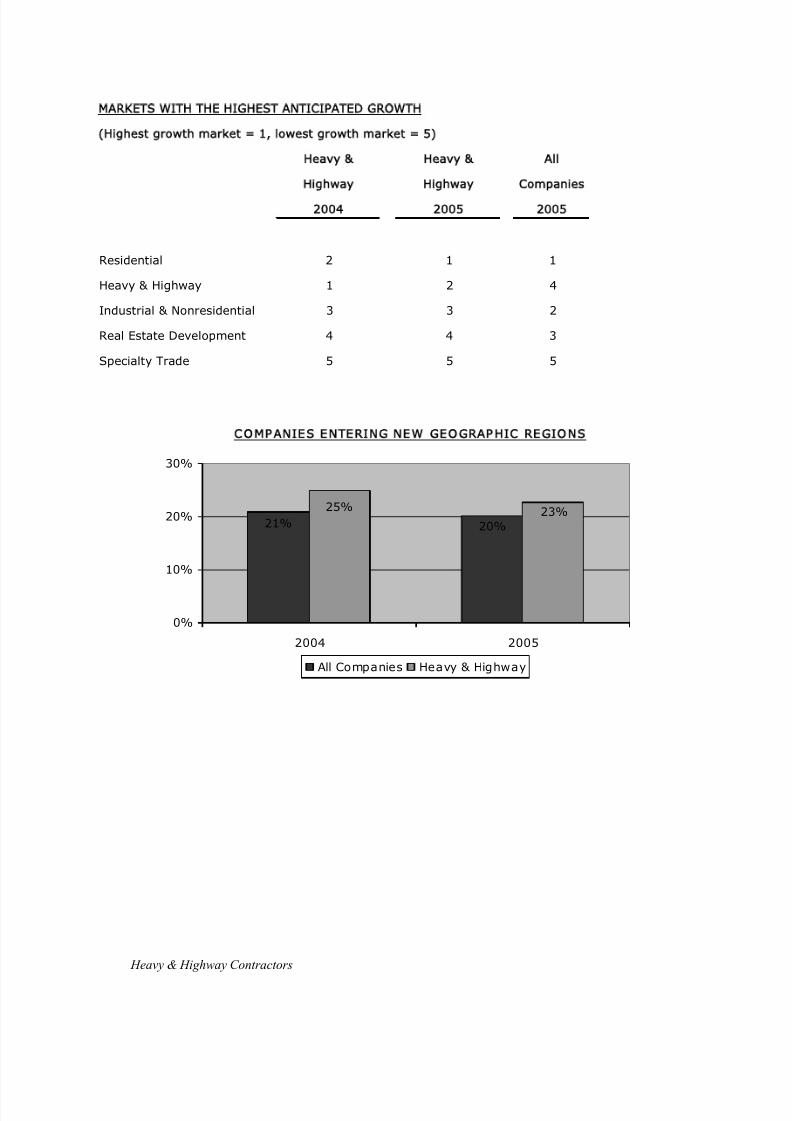
8/13/2019 2005 Financial Survey
http://slidepdf.com/reader/full/2005-financial-survey 144/284
Heavy & Highway Contractors
MARKETS WITH THE HIGHEST ANTICIPATED GROWTH
(Highest growth market = 1, lowest growth market = 5 )
Heavy & Heavy & All
Highway Highway Companies
2004 2005 2005
Residential 2 1 1
Heavy & Highway 1 2 4
Industrial & Nonresidential 3 3 2
Real Estate Development 4 4 3
Specialty Trade 5 5 5
COMPANIES ENTERING NEW GEOGRAPHIC REGIONS
20%21%23%25%
0%
10%
20%
30%
2004 2005
All Companies Heavy & Highway
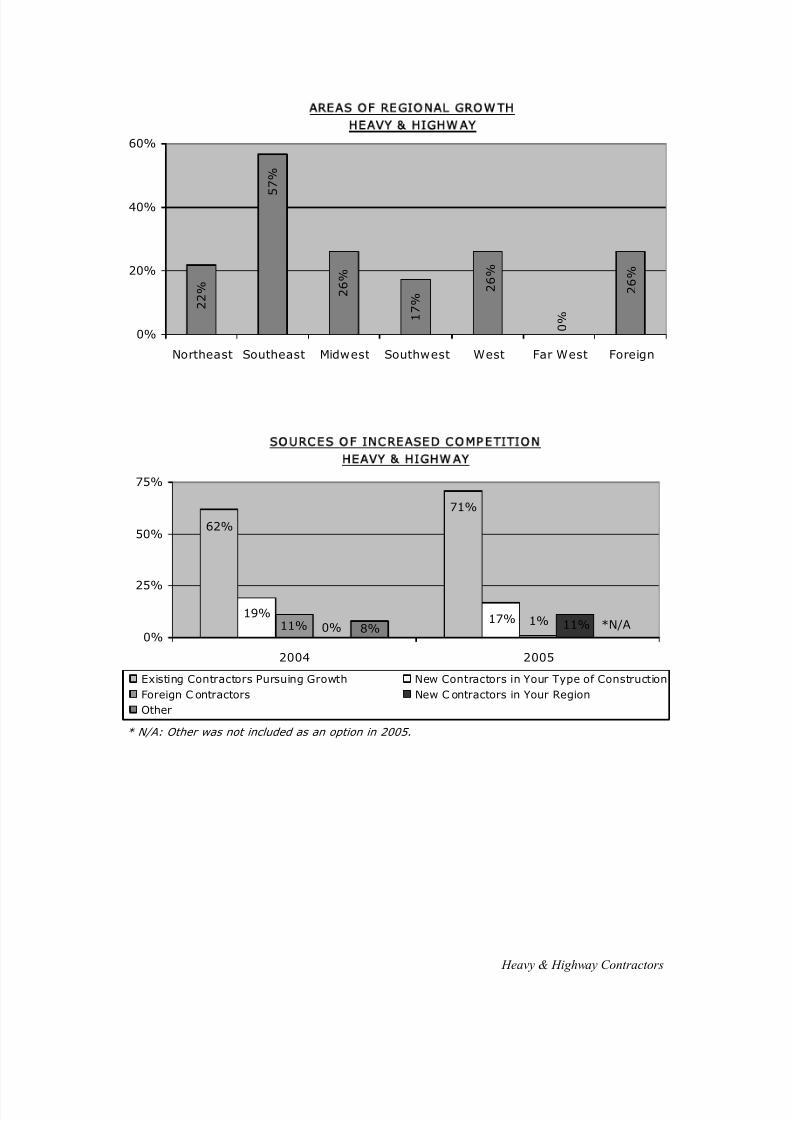
8/13/2019 2005 Financial Survey
http://slidepdf.com/reader/full/2005-financial-survey 145/284
Heavy & Highway Contractors
AREAS OF REGIONAL GROWTH
HEAVY & HIGHWAY
2 6 %
5 7 %
2 2 %
1 7 %
2 6 %
2 6 %
0 %
0%
20%
40%
60%
Northeast Southeast Midwest Southwest West Far West Foreign
S O U R C E S O F I N C R E A S E D C O M P E T IT IO N
H E A V Y & H IG H W A Y
1%
71%
62%
19%17%
11% 0% 11%8% *N/A0%
25%
50%
75%
2004 2005
Existing Contractors Pursuing Growth New Contractors in Your Type of Construction
Foreign C ontractors New C ontractors in Your Region
Other
* N/A: Other was not included as an option in 2005.
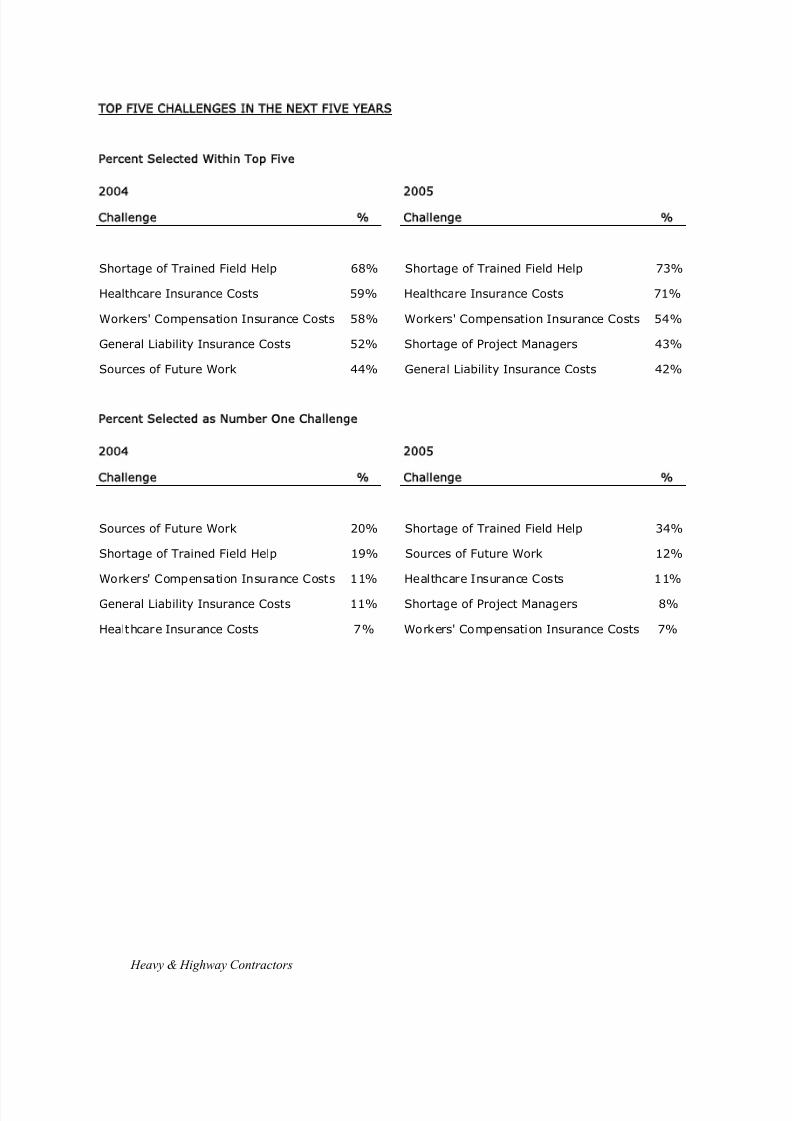
8/13/2019 2005 Financial Survey
http://slidepdf.com/reader/full/2005-financial-survey 146/284
Heavy & Highway Contractors
TOP FIVE CHALLENGES IN THE NEXT FIVE YEARS
Percent Selected Within Top Five
2004 2005
Challenge % Challenge %
Shortage of Trained Field Help 68% Shortage of Trained Field Help 73%
Healthcare Insurance Costs 59% Healthcare Insurance Costs 71%
Workers' Compensation Insurance Costs 58% Workers' Compensation Insurance Costs 54%
General Liability Insurance Costs 52% Shortage of Project Managers 43%
Sources of Future Work 44% General Liability Insurance Costs 42%
Percent Selected as Number One Challenge
2004 2005
Challenge % Challenge %
Sources of Future Work 20% Shortage of Trained Field Help 34%
Shortage of Trained Field Help 19% Sources of Future Work 12%
Workers' Compensation Insurance Costs 11% Healthcare Insurance Costs 11%
General Liability Insurance Costs 11% Shortage of Project Managers 8%
Healthcare Insurance Costs 7% Workers' Compensation Insurance Costs 7%
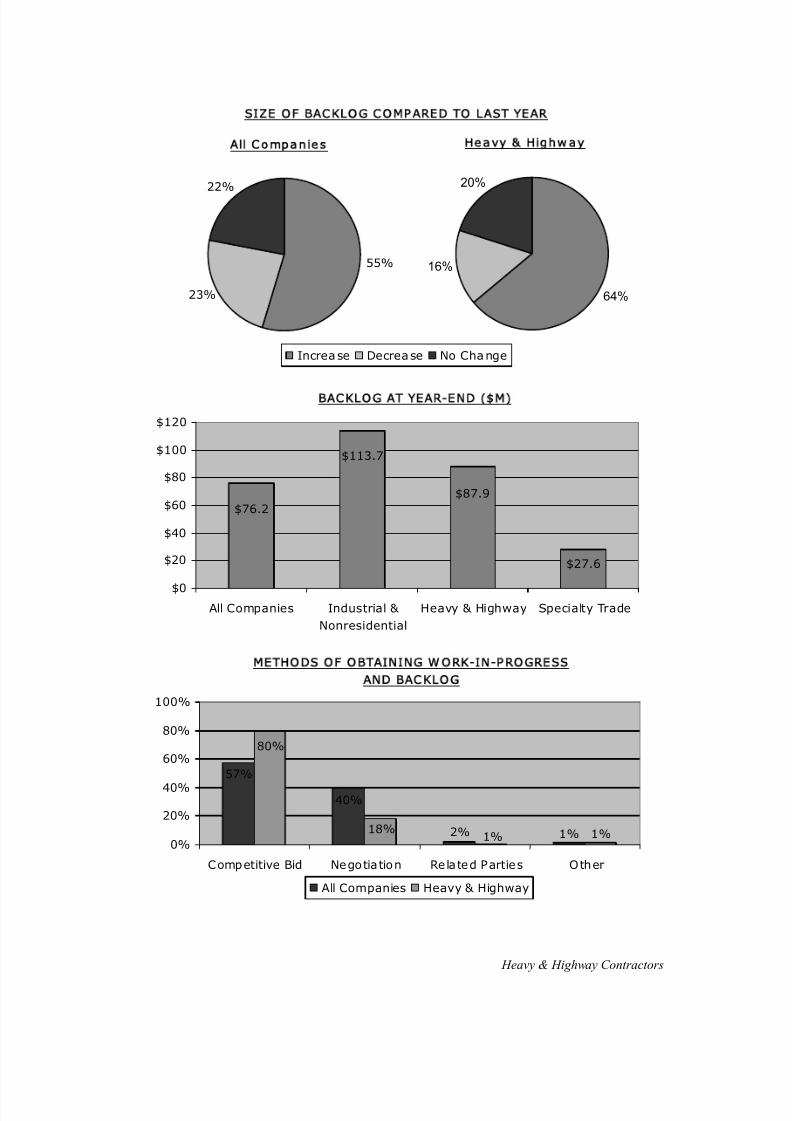
8/13/2019 2005 Financial Survey
http://slidepdf.com/reader/full/2005-financial-survey 147/284
Heavy & Highway Contractors
SIZE OF BACKLOG COMPARED TO LAST YEAR
16%
64%
20%
Increase Decrease No Change
Heavy & Highwa y
22%
23%
55%
All Companies
BACKLOG AT YEAR-END ( M)
$27.6
$76.2
$113.7
$87.9
$0
$20
$40
$60
$80
$100
$120
All Companies Industrial &
Nonresidential
Heavy & Highway Specialty Trade
M E T H O D S O F O B T AI N I N G W O R K - IN - P R O G R E S S
A N D B AC K L O G
57%
40%
2% 1% 1%1%
80%
18%
0%
20%
40%
60%
80%
100%
Competitive Bid Negotiation Related Parties Other
All Companies Heavy & Highway

8/13/2019 2005 Financial Survey
http://slidepdf.com/reader/full/2005-financial-survey 148/284
Heavy & Highway Contractors
S T RA T E G IE S T O I M P R O V E F U T U R E P R O F I T A B IL I T Y
1%
7%
91%
55%
48%
39%
38%
32%
8%
3%
5%
60%
11%
25%
35%
30%
56%
68%
90%
44%
0% 25% 50% 75% 100%
Other
Invest in Unrelated Business
M&A
Related Services
Cut Overhead
Design-Build
IT
Training
Risk Management
Do What We Do Better
All Companies Heavy & Highway
C H A N G E I N A M O U N T O F B I D W O R K
33%25%
12%
8%
56%66%
0%
20%
40%
60%
80%
100%
All Companies Heavy & Highway
Increase Decrease No Change
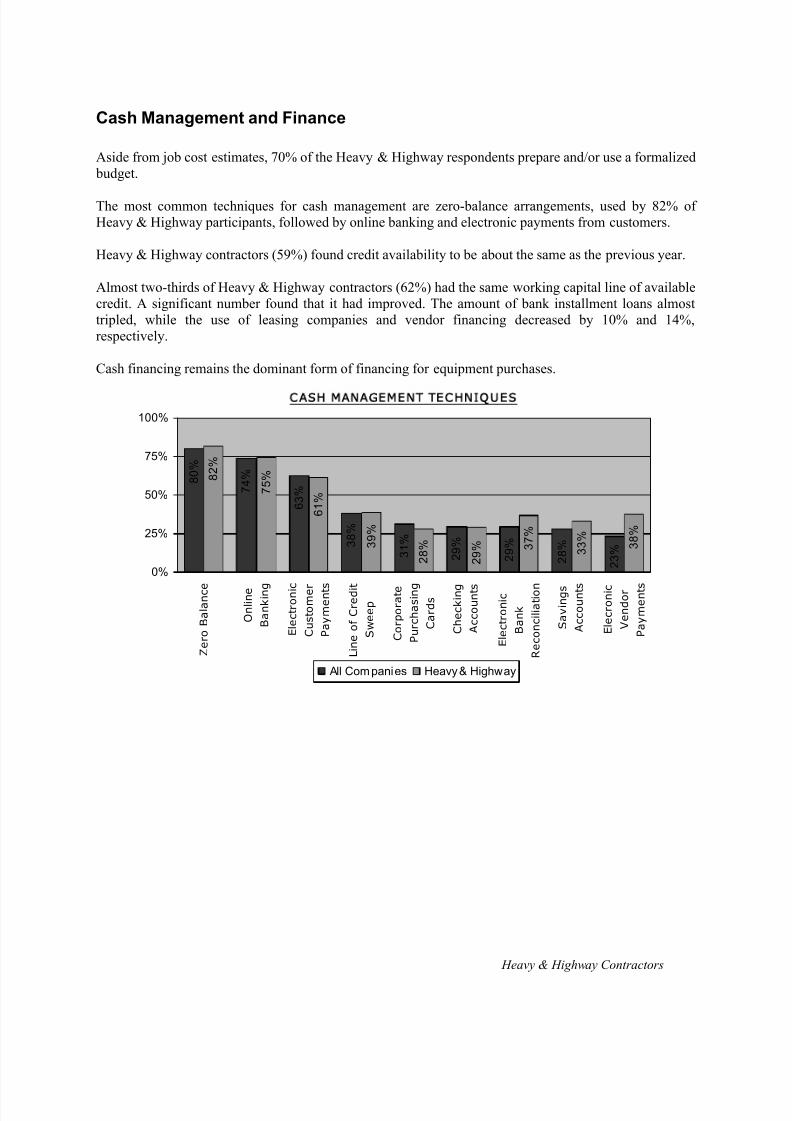
8/13/2019 2005 Financial Survey
http://slidepdf.com/reader/full/2005-financial-survey 149/284
Heavy & Highway Contractors
Cash Management and Finance
Aside from job cost estimates, 70% of the Heavy & Highway respondents prepare and/or use a formalized budget.
The most common techniques for cash management are zero-balance arrangements, used by 82% ofHeavy & Highway participants, followed by online banking and electronic payments from customers.
Heavy & Highway contractors (59%) found credit availability to be about the same as the previous year.
Almost two-thirds of Heavy & Highway contractors (62%) had the same working capital line of availablecredit. A significant number found that it had improved. The amount of bank installment loans almosttripled, while the use of leasing companies and vendor financing decreased by 10% and 14%,respectively.
Cash financing remains the dominant form of financing for equipment purchases.
CASH MANAGEMENT TEC HNIQUES
8 0 %
7 4 %
6 3 %
3 8 %
3 1 %
2 9 %
2 9 %
2 8 %
2 3 %
8 2 %
7 5 %
6 1 %
3 9 %
2 8 %
2 9 % 3
7 %
3 3 %
3 8 %
0%
25%
50%
75%
100%
Z e r o
B a
l a n c e
O n
l i n e
B a n
k i n g
E l e c t r o n i c
C u s t o m e r
P a y m e n t s
L i n e o
f C r e d i t
S w e e p
C o r p o r a t e
P u r c
h a s i n g
C a r d s
C h e c
k i n g
A c c o u n t s
E l e c t r o n
i c
B a n
k
R e c o n c
i l i a t i o n
S a v
i n g s
A c c o u n t s
E l e c r o n i c
V e n
d o r
P a y m e n t s
All Companies Heavy & Highway

8/13/2019 2005 Financial Survey
http://slidepdf.com/reader/full/2005-financial-survey 150/284
Heavy & Highway Contractors
R A T IO S B Y E Q U I P M E N T F I N A N C I N G M E T H O D
H E A V Y & H IG H W A Y
1.4
21.8
1.3
9.72.0
16.0
2.48.0
0
10
20
30
Days of Cash Debt to Equity
Cash Bank Loan Leasing Co. Loan Vendor Financing
61%
3%
35%
3%
38%
59%
0%
20%
40%
60%
80%
Better Worse About the Same
All Companies Heavy & Highway
AVAILABILITY OF BANK CREDIT COMPARED TO LAST YEAR
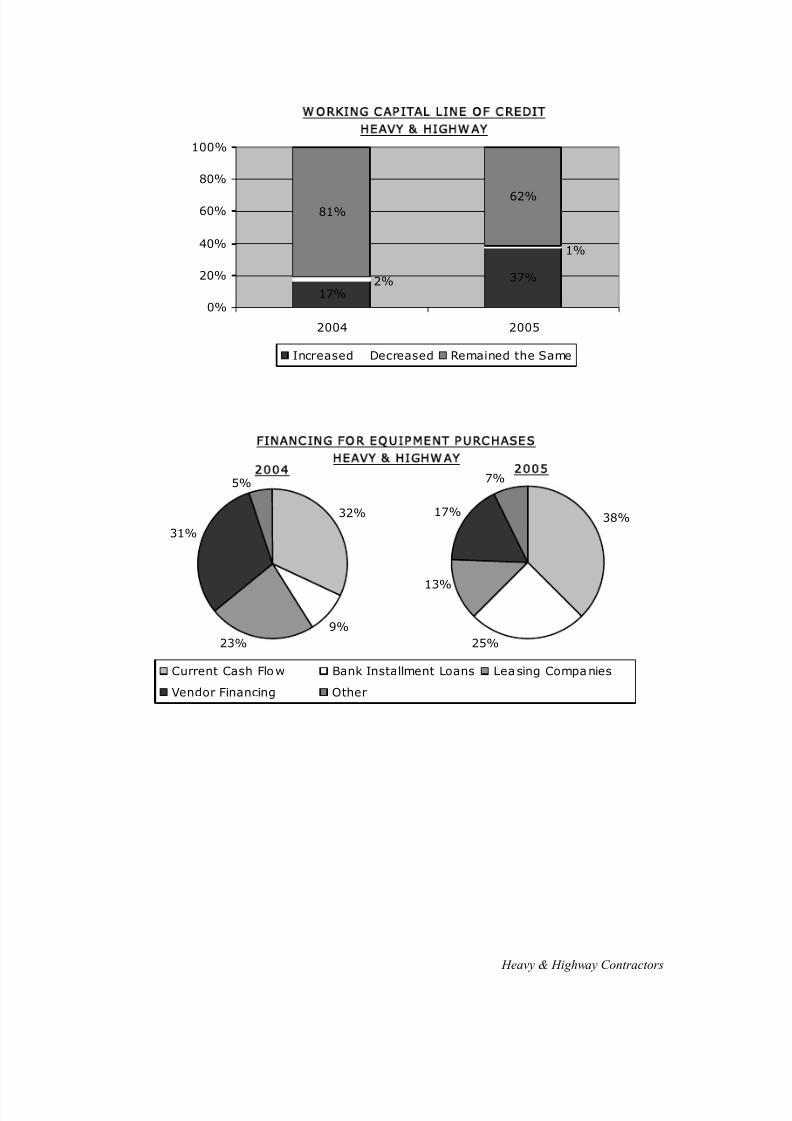
8/13/2019 2005 Financial Survey
http://slidepdf.com/reader/full/2005-financial-survey 151/284
Heavy & Highway Contractors
W O R K IN G C A P I T AL L I N E O F C R E D I T
H E A V Y & H IG H W A Y
17%
37%
81%62%
2%
1%
0%
20%
40%
60%
80%
100%
2004 2005
Increased Decreased Remained the Same
FINANCING FOR EQUIP MENT PURCHASES
HEAVY & HIGHWAY
17%
13%
38%
25%
7%
Current Cash Flow Bank Installment Loans Leasing Companies
Vendor Financing Other
20055%
23%
31%
9%
32%
2004

8/13/2019 2005 Financial Survey
http://slidepdf.com/reader/full/2005-financial-survey 152/284
Heavy & Highway Contractors
Bonding and Sureties
Heavy & Highway contractors bond a significantly higher percentage of contract revenue than other typesof contractors. A majority bond more than 40%. Heavy & Highway companies also tend to bond a greater
portion of subcontractor dollars.
Most Heavy & Highway contractors have found the availability of bonding credit to be about the samethis year as compared to last year. However, 7% have found availability has worsened.
P E R C E N T A G E O F C O N T R AC T R E V E N U E B O N D E D
8 %
1 6 %
2 3 %
3 9 %
1 4 %
1 3 %
1 6 %
1 8 %
1 2 %
4 0 %
0%
25%
50%
<19% 20-39% 40-59% 60-79% >80%
All Companies Heavy & Highway
PERC ENTAGE O F SUBCONTRACTOR DOLLARS BONDED
(If a Gene ral Contractor)
13%
11%
6%
64%6%
<19% 20-39% 40-59% 60-79% >80%
Heavy & Highwa y
6%
71%
10%
5%
8%
All Companies
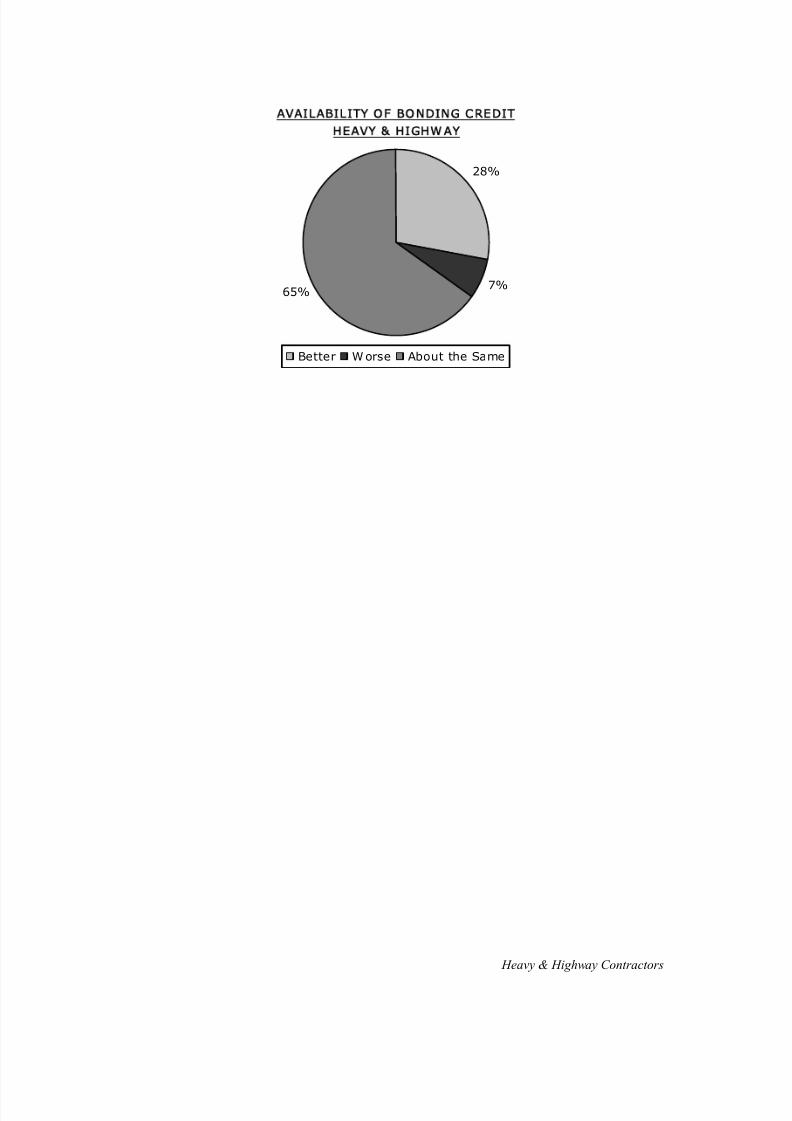
8/13/2019 2005 Financial Survey
http://slidepdf.com/reader/full/2005-financial-survey 153/284
Heavy & Highway Contractors
AVAILABILITY OF BONDING CREDIT
HEAVY & HIGHWAY
28%
7%65%
Better Worse About the Same
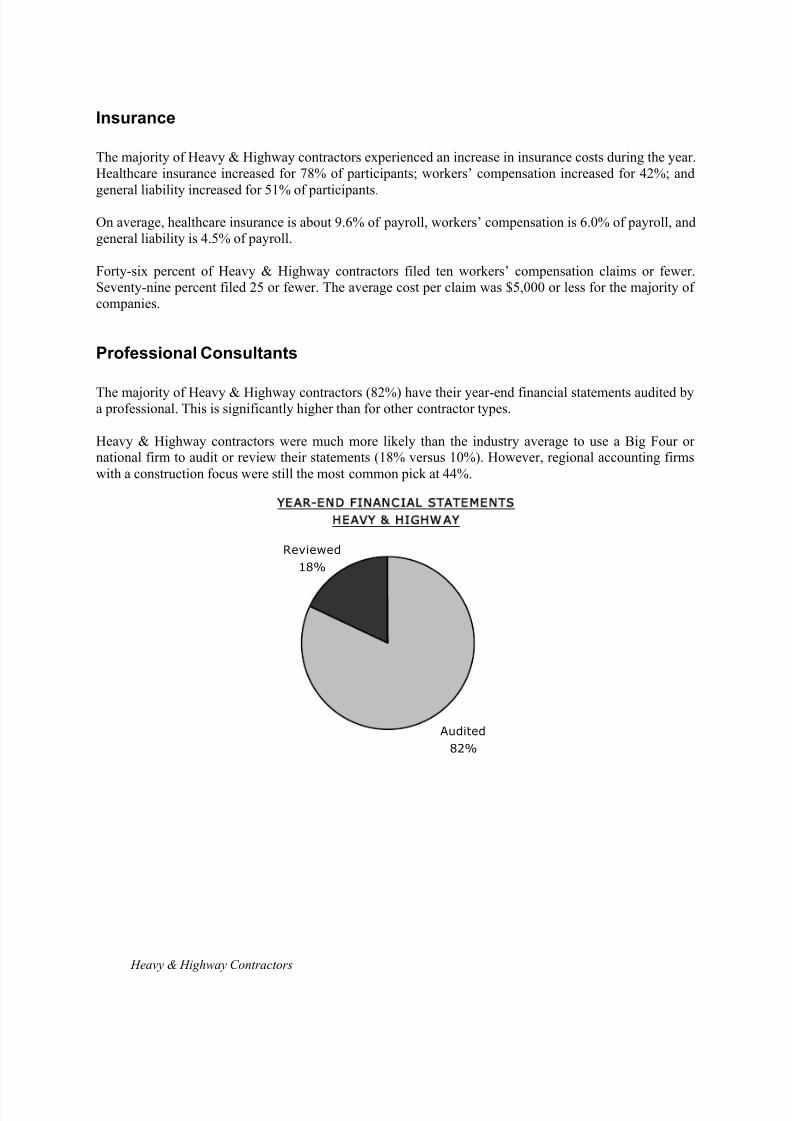
8/13/2019 2005 Financial Survey
http://slidepdf.com/reader/full/2005-financial-survey 154/284
Heavy & Highway Contractors
Insurance
The majority of Heavy & Highway contractors experienced an increase in insurance costs during the year.Healthcare insurance increased for 78% of participants; workers’ compensation increased for 42%; and
general liability increased for 51% of participants.
On average, healthcare insurance is about 9.6% of payroll, workers’ compensation is 6.0% of payroll, andgeneral liability is 4.5% of payroll.
Forty-six percent of Heavy & Highway contractors filed ten workers’ compensation claims or fewer.Seventy-nine percent filed 25 or fewer. The average cost per claim was $5,000 or less for the majority ofcompanies.
Professional Consultants
The majority of Heavy & Highway contractors (82%) have their year-end financial statements audited bya professional. This is significantly higher than for other contractor types.
Heavy & Highway contractors were much more likely than the industry average to use a Big Four ornational firm to audit or review their statements (18% versus 10%). However, regional accounting firmswith a construction focus were still the most common pick at 44%.
YEAR-END FINANCIAL STATEMENTS
HEAVY & HIGHWAY
Audited
82%
Reviewed
18%

8/13/2019 2005 Financial Survey
http://slidepdf.com/reader/full/2005-financial-survey 155/284
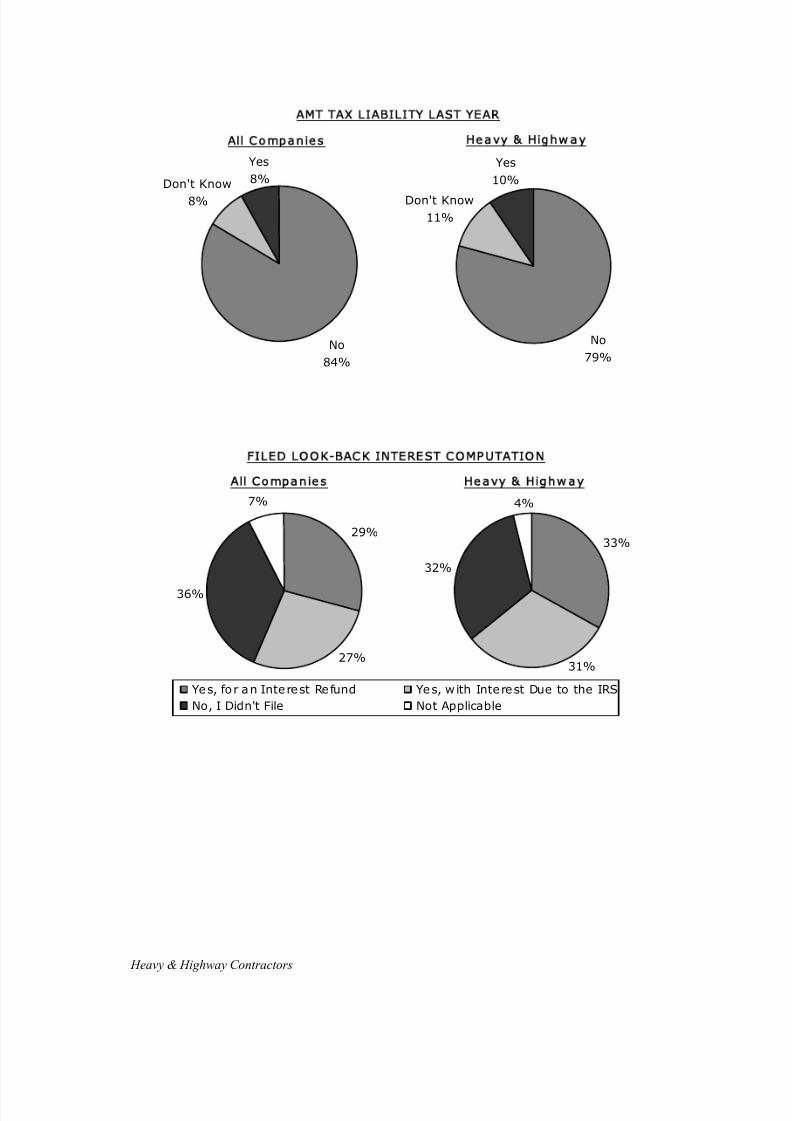
8/13/2019 2005 Financial Survey
http://slidepdf.com/reader/full/2005-financial-survey 156/284
Heavy & Highway Contractors
AMT TAX LIABILITY LAST YEAR
No
79%
Yes
10%
Don't Know
11%
Heavy & Highwa y
No
84%
Yes
8%
All Companies
Don't Know
8%
FILED LO OK-BACK INTEREST COMPUTATION
33%
31%
4%
32%
Yes, for an Interest Re fund Yes, with Interest Due to the IRS
No, I Didn't File Not Applicable
Heavy & Highwa y
29%
36%
7%
27%
All Companies
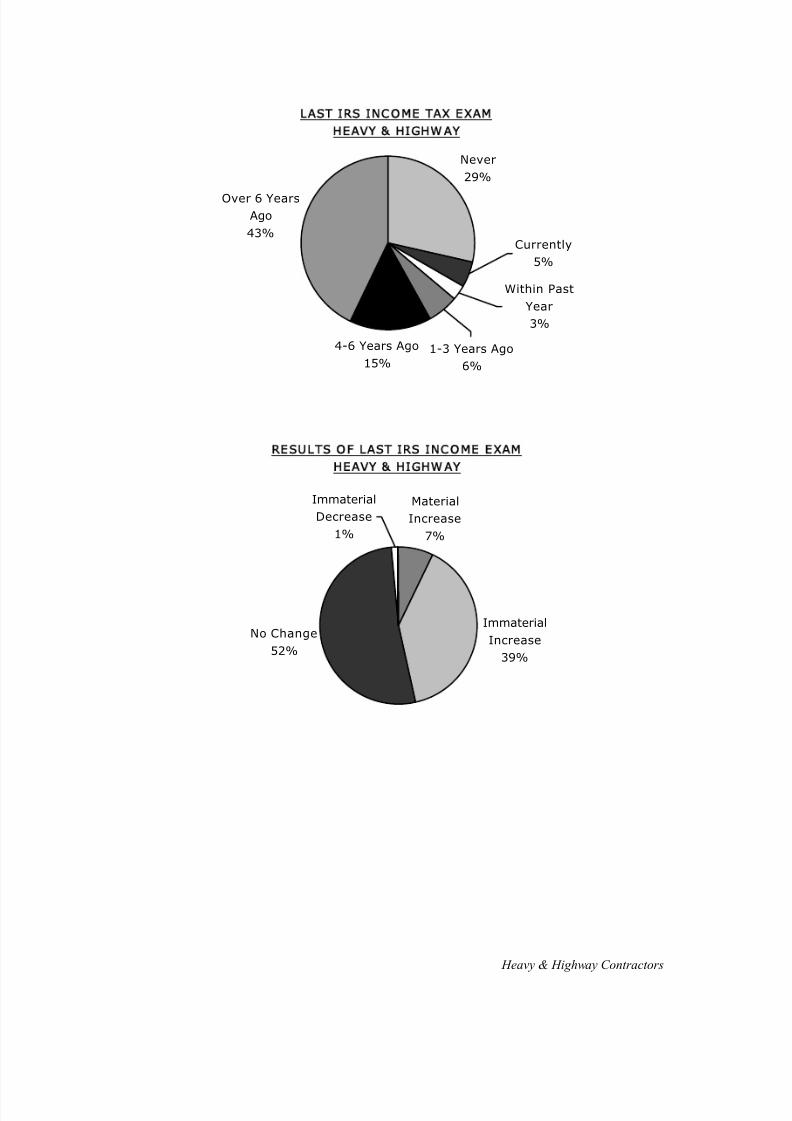
8/13/2019 2005 Financial Survey
http://slidepdf.com/reader/full/2005-financial-survey 157/284
Heavy & Highway Contractors
LAST IRS INCOME TAX EXAM
HEAVY & HIGHWAY
Over 6 Years
Ago
43%
4-6 Years Ago
15%
1-3 Years Ago
6%
Within Past
Year
3%
Currently
5%
Never
29%
RESULTS OF LAST IRS INCOME EXAM
HEAVY & HIGHWAY
No Change
52%
Immaterial
Increase
39%
Material
Increase
7%
Immaterial
Decrease
1%
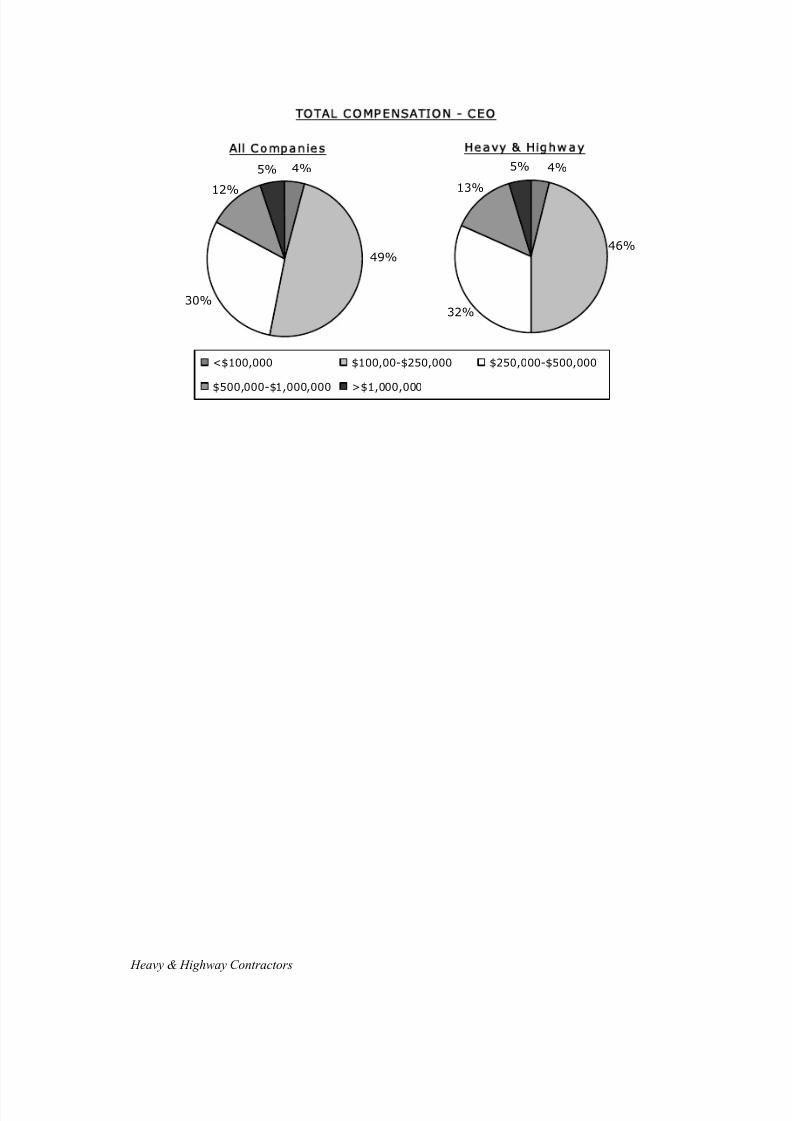
8/13/2019 2005 Financial Survey
http://slidepdf.com/reader/full/2005-financial-survey 158/284
Heavy & Highway Contractors
T O T A L C O M P E N S A T IO N - C E O
4%
32%
13%
5%
46%
<$100,000 $100,00-$250,000 $250,000-$500,000
$500,000-$1,000,000 >$1,000,000
H e a v y & H ig h w a y
30%
5% 4%
12%
49%
A ll C o m p a n i e s
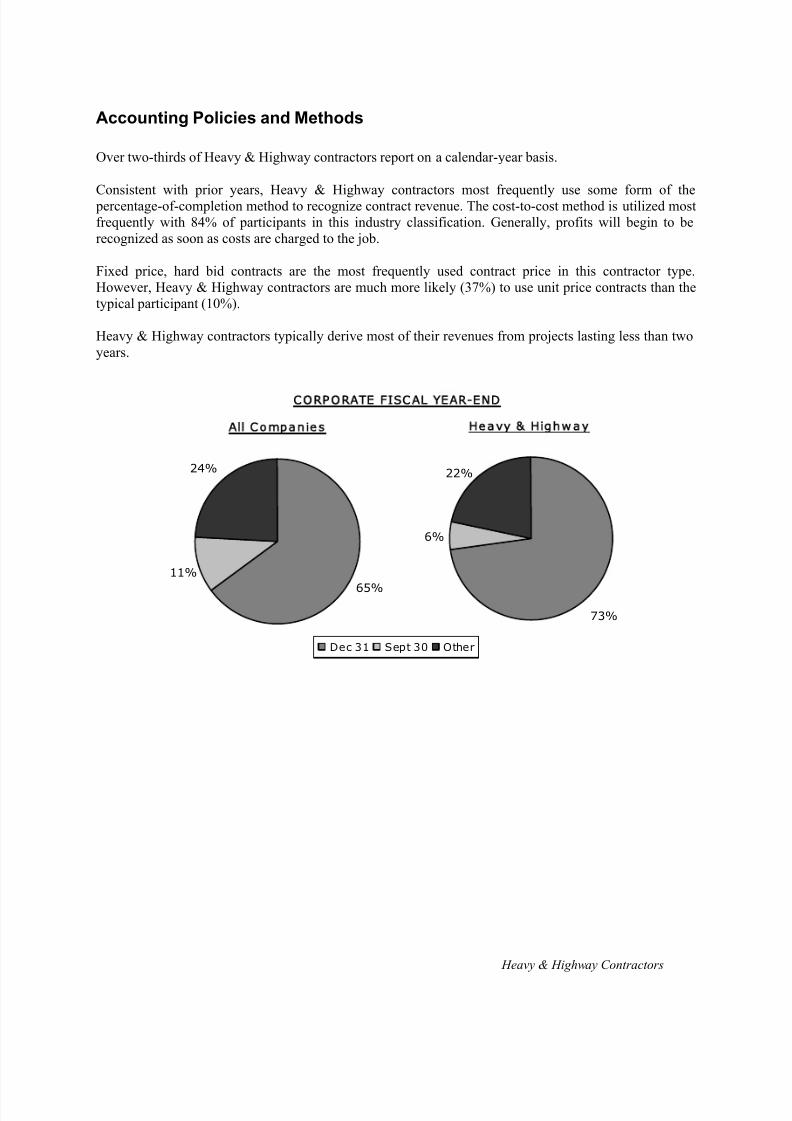
8/13/2019 2005 Financial Survey
http://slidepdf.com/reader/full/2005-financial-survey 159/284
Heavy & Highway Contractors
Accounting Policies and Methods
Over two-thirds of Heavy & Highway contractors report on a calendar-year basis.
Consistent with prior years, Heavy & Highway contractors most frequently use some form of the percentage-of-completion method to recognize contract revenue. The cost-to-cost method is utilized mostfrequently with 84% of participants in this industry classification. Generally, profits will begin to berecognized as soon as costs are charged to the job.
Fixed price, hard bid contracts are the most frequently used contract price in this contractor type.However, Heavy & Highway contractors are much more likely (37%) to use unit price contracts than thetypical participant (10%).
Heavy & Highway contractors typically derive most of their revenues from projects lasting less than twoyears.
CORP ORATE FISCAL YEAR-END
73%
22%
6%
Dec 31 Sept 30 Other
Heavy & Highw ay
24%
11%
65%
All Companies

8/13/2019 2005 Financial Survey
http://slidepdf.com/reader/full/2005-financial-survey 160/284
Heavy & Highway Contractors
CONTRACT REVENUE RECOGNITION
14%
2%
84%
PCM (Cost-to-Cost) PCM (Physical Percent Complete)
PCM (Labor Hours or Dollars) Other
Heavy & Highway
2%7%
3%
88%
All Companies
P E R C E N T A G E -O F - C O M P L E T IO N P R O F I T
R E C O G N I TI O N P R O C E S S
73%63%
9%
9%
13%22%
6%
5%
0%
20%
40%
60%
80%
100%
All Companies Heavy & Highway
When Costs Are Charged When Work Begins
When the Ultimate Profit Can Be Estimated When a Base Level of Completion Is Reached
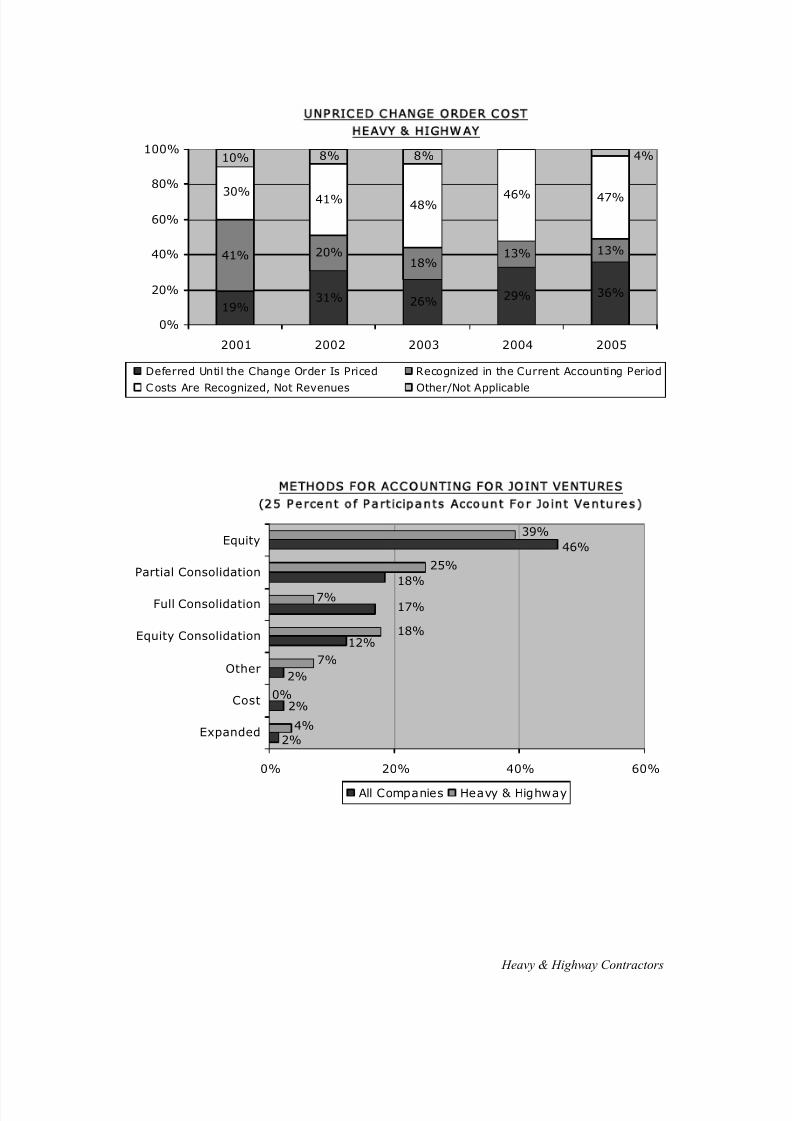
8/13/2019 2005 Financial Survey
http://slidepdf.com/reader/full/2005-financial-survey 161/284
Heavy & Highway Contractors
UNPRICED CHANGE ORDER COST
HEAVY & HIGHWAY
19%31% 26%
29% 36%
41% 20%18%
13% 13%
48% 46% 47%
10% 8% 8%
41%30%
4%
0%
20%
40%
60%
80%
100%
2001 2002 2003 2004 2005
Deferred Until the Change Order Is Priced Recognized in the Current Accounting Period
Costs Are Recognized, Not Revenues Other/Not Applicable
18%
46%
17%
2%
2%
2%
12%
39%
7%
18%
7%
4%
0%
25%
0% 20% 40% 60%
Expanded
Cost
Other
Equity Consolidation
Full Consolidation
Partial Consolidation
Equity
All Companies Heavy & Highway
METHODS FOR ACCOUNTING FOR JOINT VENTURES
(25 Percent of P artic ipant s Account Fo r Joint Ventures )
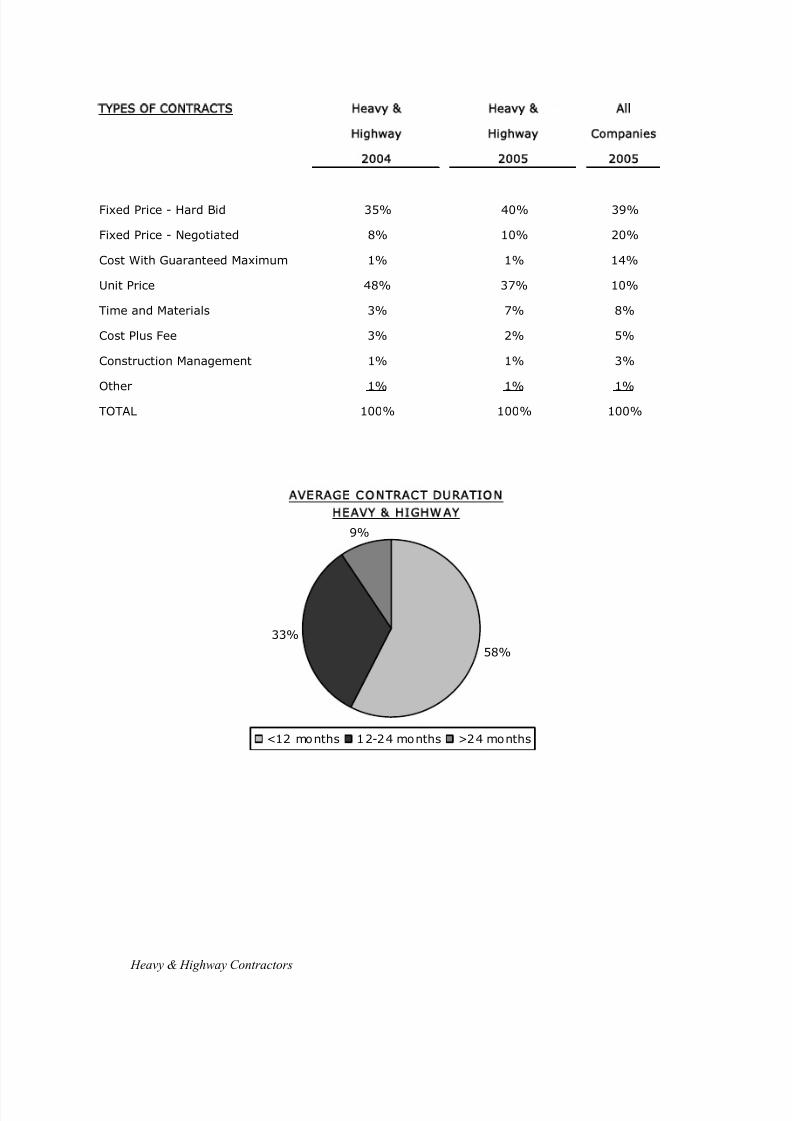
8/13/2019 2005 Financial Survey
http://slidepdf.com/reader/full/2005-financial-survey 162/284
Heavy & Highway Contractors
TYPES OF CONTRACTS Heavy & Heavy & All
Highway Highway Companies
2004 2005 2005
Fixed Price - Hard Bid 35% 40% 39%
Fixed Price - Negotiated 8% 10% 20%
Cost With Guaranteed Maximum 1% 1% 14%
Unit Price 48% 37% 10%
Time and Materials 3% 7% 8%
Cost Plus Fee 3% 2% 5%
Construction Management 1% 1% 3%
Other 1% 1% 1%
TOTAL 100% 100% 100%
AVERAGE CONTRACT DURATION
HEAVY & HIGHWAY
58%
33%
9%
<12 months 12-24 months >24 months
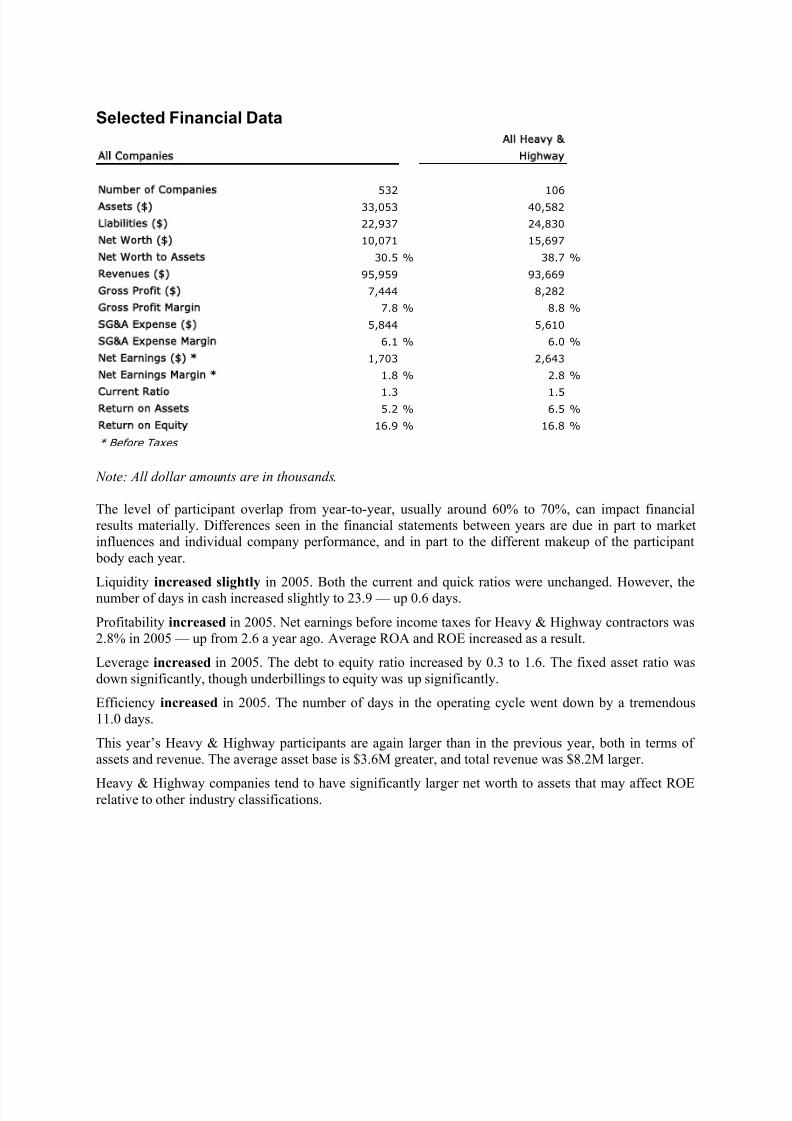
8/13/2019 2005 Financial Survey
http://slidepdf.com/reader/full/2005-financial-survey 163/284
Selected Financial Data
All Heavy &
All Companies Highway
Number of Companies 532 106
Assets ( ) 33,053 40,582
Liabilities ( ) 22,937 24,830
Net Worth ( ) 10,071 15,697
Net Worth to Assets 30.5 % 38.7 %
Revenues ( ) 95,959 93,669
Gross Profit ( ) 7,444 8,282
Gross Profit Margin 7.8 % 8.8 %
SG&A Expense ( ) 5,844 5,610
SG&A Expense Margin 6.1 % 6.0 %
Net Earnings ( ) * 1,703 2,643
Net Earnings Margin * 1.8 % 2.8 %
Current Ratio 1.3 1.5Return on Assets 5.2 % 6.5 %
Return on Equity 16.9 % 16.8 %
* Before Taxes
Note: All dollar amounts are in thousands.
The level of participant overlap from year-to-year, usually around 60% to 70%, can impact financialresults materially. Differences seen in the financial statements between years are due in part to marketinfluences and individual company performance, and in part to the different makeup of the participant body each year.
Liquidity increased slightly in 2005. Both the current and quick ratios were unchanged. However, thenumber of days in cash increased slightly to 23.9 — up 0.6 days.
Profitability increased in 2005. Net earnings before income taxes for Heavy & Highway contractors was2.8% in 2005 — up from 2.6 a year ago. Average ROA and ROE increased as a result.
Leverage increased in 2005. The debt to equity ratio increased by 0.3 to 1.6. The fixed asset ratio wasdown significantly, though underbillings to equity was up significantly.
Efficiency increased in 2005. The number of days in the operating cycle went down by a tremendous11.0 days.
This year’s Heavy & Highway participants are again larger than in the previous year, both in terms ofassets and revenue. The average asset base is $3.6M greater, and total revenue was $8.2M larger.
Heavy & Highway companies tend to have significantly larger net worth to assets that may affect ROErelative to other industry classifications.
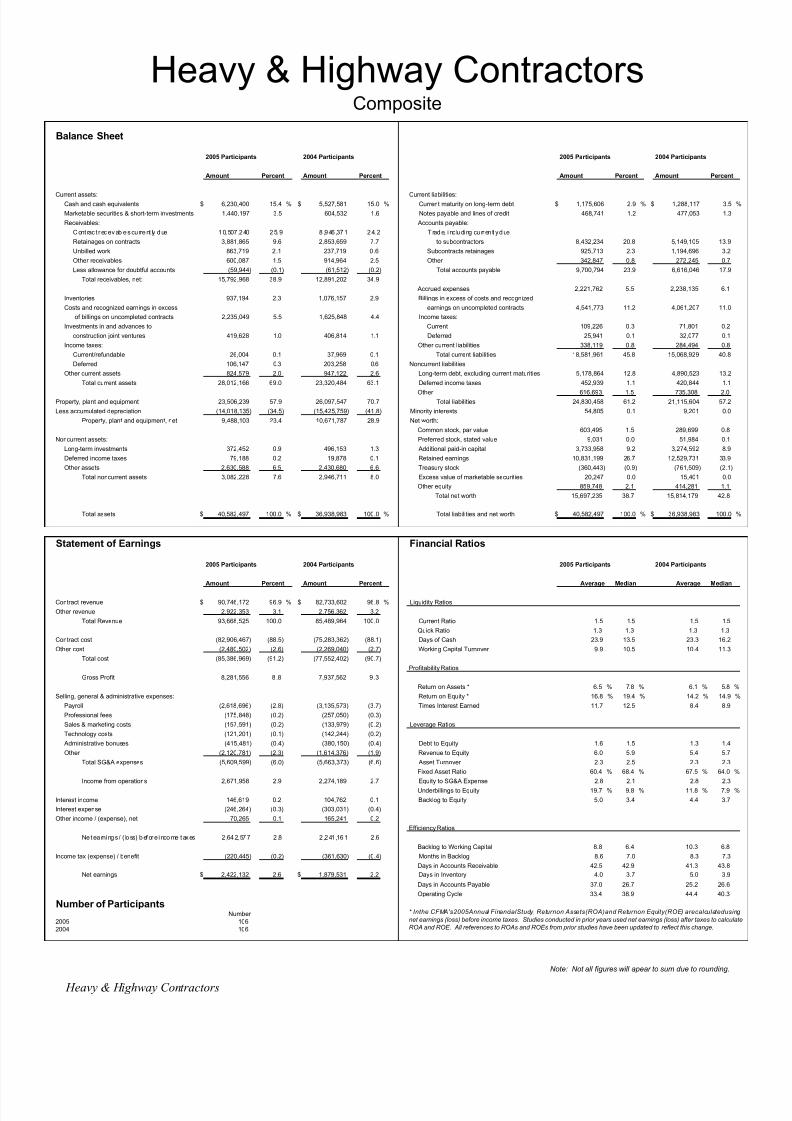
8/13/2019 2005 Financial Survey
http://slidepdf.com/reader/full/2005-financial-survey 164/284
Balance Sheet
2005 Participants 2004 Participants 2005 Participants 2004 Participants
Amount Percent Amount Percent Amount Percent Amount Percent
Current assets: Current liabilities:Cash and cash equivalents $ 6,230,400 15.4 % $ 5,527,581 15.0 % Current maturity on long-term debt $ 1,175,606 2.9 % $ 1,288,117 3.5 %
Marketable securities & short-term investments 1,440,197 3.5 604,532 1.6 Notes payable and lines of credit 468,741 1.2 477,053 1.3
Receivables: Accounts payable:
Cont rac t r eceivab les cu rrent ly due 10,507 ,240 25.9 8 ,946 ,371 24.2 T rade, i nc luding cu rren tl y due
Retainages on contracts 3,881,865 9.6 2,853,659 7.7 to subcontractors 8,432,234 20.8 5,149,105 13.9
Unbilled work 863,719 2.1 237,719 0.6 Subcontracts retainages 925,713 2.3 1,194,696 3.2
Other receivables 600,087 1.5 914,964 2.5 Other 342,847 0.8 272,245 0.7
Less allowance for doubtful accounts (59,944) (0.1) (61,512) (0.2) Total accounts payable 9,700,794 23.9 6,616,046 17.9
Total receivables, net: 15,792,968 38.9 12,891,202 34.9
Accrued expenses 2,221,762 5.5 2,238,135 6.1
Inventories 937,194 2.3 1,076,157 2.9 Billings in excess of costs and recognized
Costs and recognized earnings in excess earnings on uncompleted contracts 4,541,773 11.2 4,061,207 11.0
of billings on uncompleted contracts 2,235,049 5.5 1,625,848 4.4 Income taxes:
Investments in and advances to Current 109,226 0.3 71,801 0.2
construction joint ventures 419,628 1.0 406,814 1.1 Deferred 25,941 0.1 32,077 0.1
Income taxes: Other current liabilities 338,119 0.8 284,494 0.8
Current/refundable 26,004 0.1 37,969 0.1 Total current liabilities 18,581,961 45.8 15,068,929 40.8
Deferred 106,147 0.3 203,258 0.6 Noncurrent liabilities
Other current assets 824,579 2.0 947,122 2.6 Long-term debt, excluding current maturities 5,178,864 12.8 4,890,523 13.2
Total current assets 28,012,166 69.0 23,320,484 63.1 Deferred income taxes 452,939 1.1 420,844 1.1
Other 616,693 1.5 735,308 2.0Property, plant and equipment 23,506,239 57.9 26,097,547 70.7 Total liabilities 24,830,458 61.2 21,115,604 57.2
Less accumulated depreciation (14,018,135) (34.5) (15,425,759) (41.8) Minority interests 54,805 0.1 9,201 0.0
Property, plant and equipment, net 9,488,103 23.4 10,671,787 28.9 Net worth:
Common stock, par value 603,495 1.5 289,699 0.8
Noncurrent assets: Preferred stock, stated value 9,031 0.0 51,984 0.1
Long-term investments 372,452 0.9 496,153 1.3 Additional paid-in capital 3,733,958 9.2 3,274,592 8.9
Deferred income taxes 79,188 0.2 19,878 0.1 Retained earnings 10,831,199 26.7 12,529,731 33.9
Other assets 2,630,588 6.5 2,430,680 6.6 Treasury stock (360,443) (0.9) (761,509) (2.1)
Total noncurrent assets 3,082,228 7.6 2,946,711 8.0 Excess value of marketable securities 20,247 0.0 15,401 0.0
Other equity 859,748 2.1 414,281 1.1
Total net worth 15,697,235 38.7 15,814,179 42.8
Total assets $ 40,582,497 100.0 % $ 36,938,983 100.0 % Total liabilities and net worth $ 40,582,497 100.0 % $ 36,938,983 100.0 %
Statement of Earnings Financial Ratios
2005 Participants 2004 Participants 2005 Participants 2004 Participants
Amount Percent Amount Percent Average Median Average Median
Contract revenue $ 90,746,172 96.9 % $ 82,733,602 96.8 % Liquidity Ratios
Other revenue 2,922,353 3.1 2,756,362 3.2
Total Revenue 93,668,525 100.0 85,489,964 100.0 Current Ratio 1.5 1.5 1.5 1.5
Quick Ratio 1.3 1.3 1.3 1.3
Contract cost (82,906,467) (88.5) (75,283,362) (88.1) Days of Cash 23.9 13.5 23.3 16.2
Other cost (2,480,502) (2.6) (2,269,040) (2.7) Working Capital Turnover 9.9 10.5 10.4 11.3
Total cost (85,386,969) (91.2) (77,552,402) (90.7)
Profitability Ratios
Gross Profit 8,281,556 8.8 7,937,562 9.3
Return on Assets * 6.5 % 7.8 % 6.1 % 5.8 %
Selling, general & administrative expenses: Return on Equity * 16.8 % 19.4 % 14.2 % 14.9 %
Payroll (2,618,696) (2.8) (3,135,573) (3.7) Times Interest Earned 11.7 12.5 8.4 8.9
Professional fees (175,848) (0.2) (257,050) (0.3)
Sales & marketing costs (157,591) (0.2) (133,979) (0.2) Leverage Ratios
Technology costs (121,201) (0.1) (142,244) (0.2)
Administrative bonuses (415,481) (0.4) (380,150) (0.4) Debt to Equity 1.6 1.5 1.3 1.4
Other (2,120,781) (2.3) (1,614,376) (1.9) Revenue to Equity 6.0 5.9 5.4 5.7
Total SG&A expenses (5,609,599) (6.0) (5,663,373) (6.6) Asset Turnover 2.3 2.5 2.3 2.3
Fixed Asset Ratio 60.4 % 68.4 % 67.5 % 64.0 %
Income from operations 2,671,958 2.9 2,274,189 2.7 Equity to SG&A Expense 2.8 2.1 2.8 2.3
Underbillings to Equity 19.7 % 9.8 % 11.8 % 7.9 %
Interest income 146,619 0.2 104,762 0.1 Backlog to Equity 5.0 3.4 4.4 3.7
Interest expense (246,264) (0.3) (303,031) (0.4)
Other income / (expense), net 70,265 0.1 165,241 0.2
Efficiency Ratios
Ne t ea rnings / ( loss) before i ncome taxes 2 ,642,577 2 .8 2 ,241 ,161 2 .6
Backlog to Working Capital 8.8 6.4 10.3 6.8
Income tax (expense) / benefit (220,445) (0.2) (361,630) (0.4) Months in Backlog 8.6 7.0 8.3 7.3
Days in Accounts Receivable 42.5 42.9 41.3 43.8
Net earnings $ 2,422,132 2.6 $ 1,879,531 2.2 Days in Inventory 4.0 3.7 5.0 3.9
Days in Accounts Payable 37.0 26.7 25.2 26.6
Operating Cycle 33.4 38.9 44.4 40.3
Number of ParticipantsNumber
2005 1062004 106
Heavy & Highway Contractors
Note: Not all figures will apear to sum due to rounding.
Composite
Heavy & Highway Contractors
* Inthe CFMA's2005Annual FinancialStudy, Returnon Assets(ROA)and Returnon Equity(ROE) arecalculatedusing
net earnings (loss) before income taxes. Studies conducted in prior years used net earnings (loss) after taxes to calculate
ROA and ROE. All references to ROAs and ROEs from prior studies have been updated to reflect this change.

8/13/2019 2005 Financial Survey
http://slidepdf.com/reader/full/2005-financial-survey 165/284
Heavy & Highway Contractors
Selected Financial Data by Region
All Heavy &
Highway NE SE MW SW W FW
Number of Companies 106 16 14 30 14 14 18
Assets ( ) 40,582 33,100 25,794 71,793 36,427 31,005 17,400
Liabilities ( ) 24,830 21,707 14,786 45,273 19,811 17,429 11,009
Net Worth ( ) 15,697 11,393 11,007 26,501 16,616 13,576 6,100
Net Worth to A ssets 38.7 % 34.4 % 42.7 % 36.9 % 45.6 % 43.8 % 35.1 %
Revenues ( ) 93,669 70,869 50,710 177,546 75,856 58,476 48,778
Gross Profit ( ) 8,282 7,033 5,581 13,867 8,551 3,298 5,850
Gross Profit Margin 8.8 % 9.9 % 11.0 % 7.8 % 11.3 % 5.6 % 12.0 %
SG&A Expense ( ) 5,610 6,136 4,424 9,163 4,755 2,115 3,523
SG&A Expense Margin 6.0 % 8.7 % 8.7 % 5.2 % 6.3 % 3.6 % 7.2 %
Net Earnings ( ) * 2,643 951 1,204 4,683 3,467 1,103 2,420
Net Earnings Margin * 2.8 % 1.3 % 2.4 % 2.6 % 4.6 % 1.9 % 5.0 %
Current Ratio 1.5 1.5 1.4 1.5 1.8 1.5 1.4
Return on Assets 6.5 % 2.9 % 4.7 % 6.5 % 9.5 % 3.6 % 13.9 %
Return on Equity 16.8 % 8.3 % 10.9 % 17.7 % 20.9 % 8.1 % 39.7 %
* Before Taxes
REGION
Note: All dollar amounts are in thousands.
The Midwest region within the Heavy & Highway classification has a noticeably larger average asset base as compared to the prior year. Generally there were significant fluctuations based on changes in the participant body as compared to the prior study.
The Southeast, Southwest and Midwest (slight) showed improved profitability over the year; in terms ofnet earnings margin before income taxes.
There were fluctuations in net worth to assets, which has the propensity to impact equity returns. Thisshould be kept in mind when evaluating performance.

8/13/2019 2005 Financial Survey
http://slidepdf.com/reader/full/2005-financial-survey 166/284
Balance Sheet
2005 Participants 2004 Participants 2005 Participants 2004 Participants
Amount Percent Amount Percent Amount Percent Amount Percent
Current assets: Current liabilities:
Cash and cash equivalents $ 5,770,977 17.4 % $ 4,652,517 14.5 % Current maturity on long-term debt $ 1,538,711 4.6 % $ 1,055,068 3.3 %Marketable securities & short-term investments 1,258,057 3.8 855,549 2.7 Notes payable and lines of credit 934,586 2.8 798,049 2.5
Receivables: Accounts payable:
Contr act r ecei va ble s c urr ent ly du e 10, 037, 852 3 0.3 9 ,206 ,99 8 2 8.8 Tr ade, inc lu din g c urr ent ly due
Retainages on contracts 1,769,020 5.3 2,851,623 8.9 to subcontractors 6,198,296 18.7 6,078,883 19.0
Unbilled work 245,276 0.7 213,278 0.7 Subcontracts retainages 682,983 2.1 1,070,918 3.3
Other receivables 428,803 1.3 477,260 1.5 Other 429,618 1.3 18,008 0.1
Less allowance for doubtful accounts (58,812) (0.2) (67,591) (0.2) Total accounts payable 7,310,897 22.1 7,167,808 22.4
Total receivables, net: 12,422,138 37.5 12,681,569 39.6
Accrued expenses 1,985,523 6.0 1,674,244 5.2
Inventories 369,535 1.1 570,011 1.8 Billings in excess of costs and recognized
Costs and recognized earnings in excess earnings on uncompleted contracts 3,293,042 9.9 3,923,085 12.3
of billings on uncompleted contracts 2,041,531 6.2 2,434,362 7.6 Income taxes:
Investments in and advances to Current 109,275 0.3 96,403 0.3
construction joint ventures 137,650 0.4 307,526 1.0 Deferred 146,487 0.4 115,983 0.4
Income taxes: Other current liabilities 44,347 0.1 187,465 0.6
Current/refundable 34,440 0.1 47,135 0.1 Total current liabilities 15,362,867 46.4 15,018,106 46.9
Deferred 135,563 0.4 211,203 0.7 Noncurrent liabilities
Other current assets 629,912 1.9 640,757 2.0 Long-term debt, excluding current maturities 5,185,529 15.7 2,787,344 8.7
Total current assets 22,799,802 68.9 22,400,628 70.0 Deferred income taxes 643,897 1.9 765,021 2.4
Other 514,523 1.6 431,012 1.3
Property, plant and equipment 18,702,653 56.5 20,710,915 64.7 Total liabilities 21,706,816 65.6 19,001,483 59.4
Less accumulated depreciation (11,436,521) (34.6) (13,133,002) (41.0) Minority interests 0 0.0 0 0.0
Property, plant and equipment, net 7,266,132 22.0 7,577,913 23.7 Net worth:
Common stock, par value 233,245 0.7 289,760 0.9
Noncurrent assets: Preferred stock, stated value 0 0.0 2,253 0.0
Long-term investments 1,222,636 3.7 983,362 3.1 Additional paid-in capital 5,756,841 17.4 6,030,861 18.8
Deferred income taxes 8,000 0.0 8,211 0.0 Retained earnings 5,212,595 15.7 7,053,053 22.0
Other assets 1,803,592 5.4 1,037,552 3.2 Treasury stock (85,348) (0.3) (158,325) (0.5)
Total noncurrent assets 3,034,228 9.2 2,029,124 6.3 Excess value of marketable securities (7,294) (0.0) (383) (0.0)
Other equity 283,306 0.9 (211,035) (0.7)
Total net worth 11,393,345 34.4 13,006,183 40.6
Total assets $ 33,100,162 100.0 % $ 32,007,665 100.0 % Total liabilities and net worth $ 33,100,162 100.0 % $ 32,007,665 100.0 %
Statement of Earnings Financial Ratios
2005 Participants 2004 Participants 2005 Participants 2004 Participants
Amount Percent Amount Percent Average Median Average Median
Contract revenue $ 70,583,601 99.6 % $ 68,763,329 98.5 % Liquidity Ratios
Other revenue 285,555 0.4 1,066,061 1.5
Total Revenue 70,869,157 100.0 69,829,390 100.0 Current Ratio 1.5 1.5 1.5 4.9
Quick Ratio 1.3 1.3 1.2 11.3
Contract cost (63,598,358) (89.7) (62,328,474) (89.3) Days of Cash 29.3 13.2 24.0 14.7
Other cost (237,474) (0.3) (964,973) (1.4) Working Capital Turnover 9.5 10.2 9.5 11.5
Total cost (63,835,832) (90.1) (63,293,447) (90.6)
Profitability Ratios
Gross Profit 7,033,325 9.9 6,535,943 9.4
Return on Assets * 2.9 % 6.5 % 3.1 % 2.7 %
Selling, general & administrative expenses: Return on Equity * 8.3 % 13.2 % 7.6 % 8.0 %
Payroll (3,109,425) (4.4) (3,149,089) (4.5) Times Interest Earned 6.5 10.9 7.9 14.2
Professional fees (230,051) (0.3) (205,693) (0.3)
Sales & marketing costs (84,372) (0.1) (116,873) (0.2) Leverage Ratios
Technology costs (158,365) (0.2) (93,907) (0.1)
Administrative bonuses (776,054) (1.1) (332,226) (0.5) Debt to Equity 1.9 1.5 1.5 2.1
Other (1,778,176) (2.5) (1,739,662) (2.5) Revenue to Equity 6.2 5.6 5.4 5.3
Total SG&A expenses (6,136,444) (8.7) (5,637,450) (8.1) Asset Turnover 2.1 2.3 2.2 2.0
Fixed Asset Ratio 63.8 % 62.6 % 58.3 % 54.8 %
Income from operations 896,881 1.3 898,493 1.3 Equity to SG&A Expense 1.9 1.7 2.3 1.8
Underbillings to Equity 20.1 % 8 .8 % 20.4 % 16.8 %
Interest income 141,349 0.2 108,212 0.2 Backlog to Equity 5.8 3.5 4.4 4.1
Interest expense (172,847) (0.2) (142,595) (0.2)
Other income / (expense), net 85,588 0.1 122,452 0.2
Efficiency Ratios
Net earnings / (loss) before income taxes 950,971 1.3 986,563 1.4
Backlog to Working Capital 11.7 9.0 8.8 9.1
Income tax (expense) / benefit (316,715) (0.4) (368,164) (0.5) Months in Backlog 10.9 9.5 9.9 8.4
Days in Accounts Receivable 52.9 64.0 49.6 57.8
Net earnings $ 634,256 0.9 % $ 618,399 0.9 % Days in Inventory 2.1 3.1 3.2 2.1
Days in Accounts Payable 37.4 28.5 34.7 47.5
Operating Cycle 46.9 48.5 42.1 40.2
Number of ParticipantsNumber
2005 162004 19
Heavy & Highway Contractors
Note: Not all figures will apear to sum due to rounding.
* In theCFMA's 2005 Annual Financial Study, Returnon Assets(ROA)and Returnon Equity (ROE) are calculated using
net earnings (loss) before income taxes. Studies conducted in prior years used net earnings (loss) after taxes to
calculate ROA and ROE. All references to ROAs and ROEs from prior studies have been updated to reflect this change.
Heavy & Highway ContractorsNortheast Region
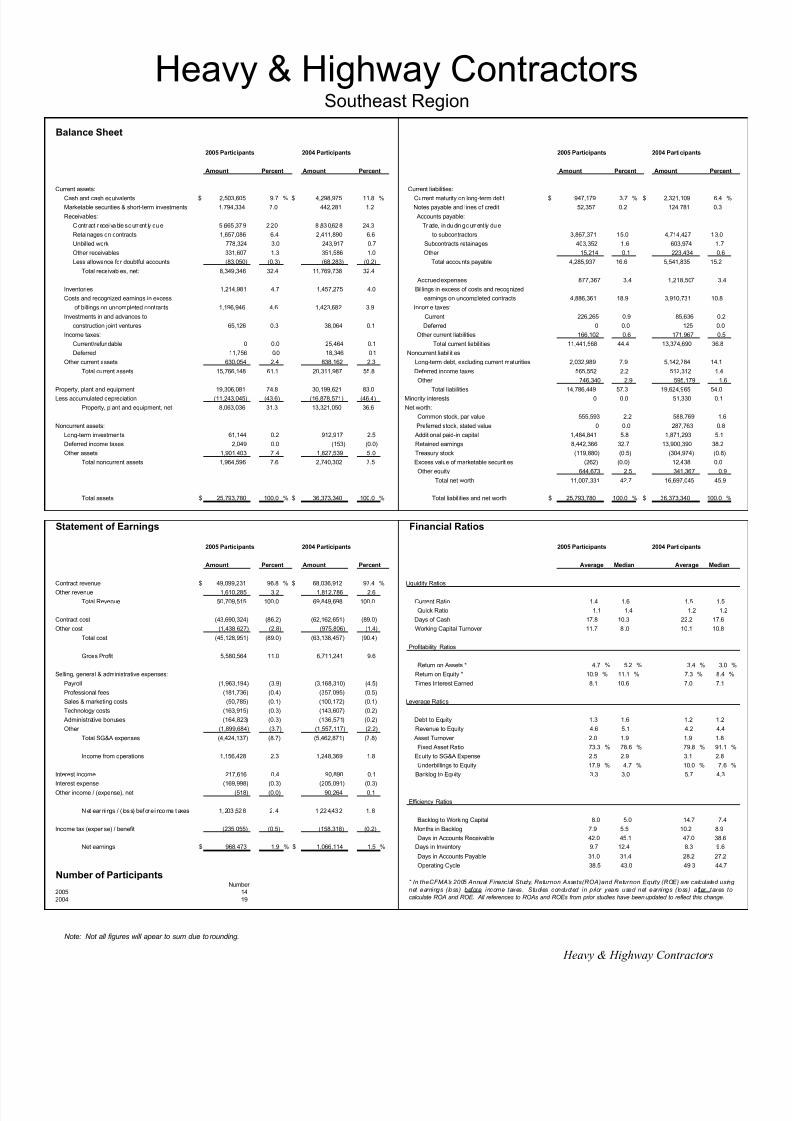
8/13/2019 2005 Financial Survey
http://slidepdf.com/reader/full/2005-financial-survey 167/284
Balance Sheet
2005 Participants 2004 Participants 2005 Participants 2004 Participants
Amount Percent Amount Percent Amount Percent Amount Percent
Current assets: Current liabilities:
Cash and cash equivalents $ 2,503,605 9.7 % $ 4,298,975 11.8 % Current maturity on long-term debt $ 947,179 3.7 % $ 2,321,109 6.4 %
Marketable securities & short-term investments 1,794,334 7.0 442,281 1.2 Notes payable and lines of credit 52,357 0.2 124,781 0.3
Receivables: Accounts payable:
Contr act r ecei va ble s c urr ent ly du e 5 ,665 ,37 9 2 2.0 8 ,83 0,62 8 24.3 Tr ade, in clu din g c urr ent ly du e
Retainages on contracts 1,657,086 6.4 2,411,890 6.6 to subcontractors 3,867,371 15.0 4,714,427 13.0
Unbilled work 778,324 3.0 243,917 0.7 Subcontracts retainages 403,352 1.6 603,974 1.7
Other receivables 331,607 1.3 351,586 1.0 Other 15,214 0.1 223,434 0.6
Less allowance for doubtful accounts (83,050) (0.3) (68,283) (0.2) Total accounts payable 4,285,937 16.6 5,541,835 15.2
Total receivables, net: 8,349,346 32.4 11,769,738 32.4
Accrued expenses 877,367 3.4 1,218,507 3.4
Inventories 1,214,981 4.7 1,457,275 4.0 Billings in excess of costs and recognized
Costs and recognized earnings in excess earnings on uncompleted contracts 4,886,361 18.9 3,910,731 10.8
of billings on uncompleted contracts 1,196,946 4.6 1,423,682 3.9 Income taxes:
Investments in and advances to Current 226,265 0.9 85,636 0.2
construction joint ventures 65,126 0.3 38,064 0.1 Deferred 0 0.0 125 0.0
Income taxes: Other current liabilities 166,102 0.6 171,967 0.5
Current/refundable 0 0.0 25,464 0.1 Total current liabilities 11,441,568 44.4 13,374,690 36.8
Deferred 11,756 0.0 18,346 0.1 Noncurrent liabilities
Other current assets 630,054 2.4 838,162 2.3 Long-term debt, excluding current maturities 2,032,989 7.9 5,142,784 14.1
Total current assets 15,766,148 61.1 20,311,987 55.8 Deferred income taxes 565,552 2.2 512,312 1.4
Other 746,340 2.9 595,179 1.6
Property, plant and equipment 19,306,081 74.8 30,199,621 83.0 Total liabilities 14,786,449 57.3 19,624,965 54.0
Less accumulated depreciation (11,243,045) (43.6) (16,878,571) (46.4) Minority interests 0 0.0 51,330 0.1
Property, plant and equipment, net 8,063,036 31.3 13,321,050 36.6 Net worth:
Common stock, par value 555,593 2.2 588,769 1.6
Noncurrent assets: Preferred stock, stated value 0 0.0 287,763 0.8
Long-term investments 61,144 0.2 912,917 2.5 Additional paid-in capital 1,484,841 5.8 1,871,293 5.1
Deferred income taxes 2,049 0.0 (153) (0.0) Retained earnings 8,442,366 32.7 13,900,390 38.2
Other assets 1,901,403 7.4 1,827,539 5.0 Treasury stock (119,880) (0.5) (304,974) (0.8)
Total noncurrent assets 1,964,596 7.6 2,740,302 7.5 Excess value of marketable securities (262) (0.0) 12,438 0.0
Other equity 644,673 2.5 341,367 0.9
Total net worth 11,007,331 42.7 16,697,045 45.9
Total assets $ 25,793,780 100.0 % $ 36,373,340 100.0 % Total liabilities and net worth $ 25,793,780 100.0 % $ 36,373,340 100.0 %
Statement of Earnings Financial Ratios
2005 Participants 2004 Participants 2005 Participants 2004 Participants
Amount Percent Amount Percent Average Median Average Median
Contract revenue $ 49,099,231 96.8 % $ 68,036,912 97.4 % Liquidity Ratios
Other revenue 1,610,285 3.2 1,812,786 2.6
Total Revenue 50,709,515 100.0 69,849,698 100.0 Current Ratio 1.4 1.6 1.5 1.5
Quick Ratio 1.1 1.4 1.2 1.2
Contract cost (43,690,324) (86.2) (62,162,651) (89.0) Days of Cash 17.8 10.3 22.2 17.6
Other cost (1,438,627) (2.8) (975,806) (1.4) Working Capital Turnover 11.7 8 .0 10.1 10.8
Total cost (45,128,951) (89.0) (63,138,457) (90.4)
Profitability Ratios
Gross Profit 5,580,564 11.0 6,711,241 9.6
Return on Assets * 4.7 % 5.2 % 3.4 % 3.0 %
Selling, general & administrative expenses: Return on Equity * 10.9 % 11.1 % 7.3 % 8.4 %
Payroll (1,963,194) (3.9) (3,168,310) (4.5) Times Interest Earned 8.1 10.6 7.0 7.1
Professional fees (181,736) (0.4) (357,095) (0.5)
Sales & marketing costs (50,785) (0.1) (100,172) (0.1) Leverage Ratios
Technology costs (163,915) (0.3) (143,607) (0.2)
Administrative bonuses (164,823) (0.3) (136,571) (0.2) Debt to Equity 1.3 1.6 1.2 1.2
Other (1,899,684) (3.7) (1,557,117) (2.2) Revenue to Equity 4.6 5.1 4.2 4.4
Total SG&A expenses (4,424,137) (8.7) (5,462,871) (7.8) Asset Turnover 2.0 1.9 1.9 1.8
Fixed Asset Ratio 73.3 % 78.6 % 79.8 % 91.1 %
Income from operations 1,156,428 2.3 1,248,369 1.8 Equity to SG&A Expense 2.5 2.9 3.1 2.8
Underbillings to Equity 17.9 % 4.7 % 10.0 % 7.6 %
Interest income 217,616 0.4 90,890 0.1 Backlog to Equity 3.3 3.0 5.7 4.3
Interest expense (169,998) (0.3) (205,091) (0.3)Other income / (expense), net (518) (0.0) 90,264 0.1
Efficiency Ratios
Net ear ni ngs / ( los s) bef or e i nco me t axes 1, 203 ,52 8 2. 4 1 ,22 4,43 2 1. 8
Backlog to Working Capital 8.0 5.0 14.7 7.4
Income tax (expense) / benefit (235,055) (0.5) (158,318) (0.2) Months in Backlog 7.9 5.5 10.2 8.9
Days in Accounts Receivable 42.0 45.1 47.0 38.6
Net earnings $ 968,473 1.9 % $ 1,066,114 1.5 % Days in Inventory 9.7 12.4 8.3 9.6
Days in Accounts Payable 31.0 31.4 28.2 27.2
Operating Cycle 38.5 43.0 49.3 44.7
Number of ParticipantsNumber
2005 142004 19
Note: Not all figures will apear to sum due to rounding.
Southeast Region
Heavy & Highway Contractors
Heavy & Highway Contractors
* In theCFMA's 2005 Annual Financial Study, Returnon Assets(ROA)and Returnon Equity (ROE) are calculated using
net earnings (loss) before income taxes. Studies conducted in prior years used net earnings (loss) after taxes to
calculate ROA and ROE. All references to ROAs and ROEs from prior studies have been updated to reflect this change.

8/13/2019 2005 Financial Survey
http://slidepdf.com/reader/full/2005-financial-survey 168/284
Balance Sheet
2005 Participants 2004 Participants 2005 Participants 2004 Participants
Amount Percent Amount Percent Amount Percent Amount Percent
Current assets: Current liabilities:
Cash and cash equivalents $ 11,115,642 15.5 % $ 5,453,948 13.6 % Current maturity on long-term debt $ 1,701,397 2.4 % $ 921,481 2.3 %
Marketable securities & short-term investments 1,164,378 1.6 812,298 2.0 Notes payable and lines of credit 315,254 0.4 761,741 1.9
Receivables: Accounts payable:
Contr act r ecei va ble s c urr ent ly du e 17, 844, 898 2 4.9 8 ,064 ,47 7 2 0.1 Tr ade, inc lu din g c urr ent ly due
Retainages on contracts 8,591,894 12.0 2,650,961 6.6 to subcontractors 17,898,900 24.9 4,655,543 11.6
Unbilled work 1,873,437 2.6 276,505 0.7 Subcontracts retainages 1,279,603 1.8 1,427,908 3.6
Other receivables 1,364,203 1.9 1,621,287 4.0 Other 489,871 0.7 329,548 0.8
Less allowance for doubtful accounts (80,320) (0.1) (50,805) (0.1) Total accounts payable 19,668,374 27.4 6,412,999 16.0
Total receivables, net: 29,594,112 41.2 12,562,426 31.3
Accrued expenses 3,907,923 5.4 2,196,627 5.5
Inventories 2,182,061 3.0 1,637,978 4.1 Billings in excess of costs and recognized
Costs and recognized earnings in excess earnings on uncompleted contracts 7,525,174 10.5 2,169,101 5.4
of billings on uncompleted contracts 4,079,247 5.7 2,226,469 5.6 Income taxes:
Investments in and advances to Current 73,396 0.1 67,434 0.2
construction joint ventures 827,409 1.2 206,142 0.5 Deferred 0 0.0 3,871 0.0
Income taxes: Other current liabilities 340,717 0.5 210,183 0.5
Current/refundable 47,478 0.1 22,822 0.1 Total current liabilities 33,532,234 46.7 12,743,437 31.8
Deferred 75,008 0.1 77,308 0.2 Noncurrent liabilities
Other current assets 1,284,743 1.8 999,997 2.5 Long-term debt, excluding current maturities 9,993,652 13.9 7,906,015 19.7
Total current assets 50,370,077 70.2 23,999,387 59.9 Deferred income taxes 339,588 0.5 210,019 0.5
Other 1,407,586 2.0 599,879 1.5
Property, plant and equipment 40,390,466 56.3 31,380,795 78.3 Total liabilities 45,273,060 63.1 21,459,349 53.5
Less accumulated depreciation (24,313,737) (33.9) (19,263,998) (48.1) Minority interests 18,589 0.0 0 0.0
Pro pert y, p lan t and equi pment , net 16, 076, 728 2 2.4 12, 116, 797 30.2 Ne t wort h:
Common stock, par value 227,255 0.3 380,533 0.9
Noncurrent assets: Preferred stock, stated value 0 0.0 0 0.0
Long-term investments 500,537 0.7 27,784 0.1 Additional paid-in capital 3,486,263 4.9 2,760,641 6.9
Deferred income taxes 0 0.0 55,766 0.1 Retained earnings 23,549,316 32.8 16,537,241 41.3
Other assets 4,845,314 6.7 3,882,925 9.7 Treasury stock (980,808) (1.4) (992,289) (2.5)
Total noncurrent assets 5,345,851 7.4 3,966,475 9.9 Excess value of marketable securities 2,764 0.0 2,112 0.0
Other equity 216,217 0.3 (64,927) (0.2)
Total net worth 26,501,007 36.9 18,623,310 46.5
Total assets $ 71,792,656 100.0 % $ 40,082,659 100.0 % Total liabilities and net worth $ 71,792,656 100.0 % $ 40,082,659 100.0 %
Statement of Earnings Financial Ratios
2005 Participants 2004 Participants 2005 Participants 2004 Participants
Amount Percent Amount Percent Average Median Average Median
Contract revenue $ 173,092,758 97.5 % $ 92,378,462 97.6 % Liquidity Ratios
Other revenue 4,453,248 2.5 2,271,338 2.4
Total Revenue 177,546,006 100.0 94,649,801 100.0 Current Ratio 1.5 1.7 1.9 1.8
Quick Ratio 1.2 1.4 1.5 1.5
Contract cost (160,160,028) (90.2) (84,346,007) (89.1) Days of Cash 22.5 13.8 20.7 13.5
Other cost (3,519,476) (2.0) (1,952,911) (2.1) Working Capital Turnover 10.5 12.0 8.4 10.9
Total cost (163,679,504) (92.2) (86,298,918) (91.2)
Profitability Ratios
Gross Profit 13,866,502 7.8 8,350,883 8.8
Return on Assets * 6.5 % 8.8 % 5.6 % 6.1 %
Selling, general & administrative expenses: Return on Equity * 17.7 % 19.9 % 12.1 % 15.0 %
Payroll (4,057,412) (2.3) (3,424,847) (3.6) Times Interest Earned 13.7 7.1 7.5 8.0
Professional fees (263,638) (0.1) (208,329) (0.2)
Sales & marketing costs (349,306) (0.2) (174,749) (0.2) Leverage Ratios
Technology costs (187,185) (0.1) (133,581) (0.1)
Administrative bonuses (540,424) (0.3) (364,857) (0.4) Debt to Equity 1.7 1.4 1.2 1.3
Other (3,765,509) (2.1) (1,682,219) (1.8) Revenue to Equity 6.7 6.0 5.1 6.0
Total SG&A expenses (9,163,474) (5.2) (5,988,582) (6.3) Asset Turnover 2.5 3.0 2.4 2.7
Fixed Asset Ratio 60.7 % 74.5 % 65.1 % 65.9 %
Income from operations 4,703,028 2.6 2,362,301 2.5 Equity to SG&A Expense 2.9 2.6 3.1 3.3
Underbillings to Equity 22.5 % 8.7 % 13.4 % 6.2 %
Interest income 171,005 0.1 75,596 0.1 Backlog to Equity 4.8 2.9 3.8 2.6
Interest expense (369,082) (0.2) (350,405) (0.4)Other income / (expense), net 178,452 0.1 173,959 0.2
Efficiency Ratios
Net ear ni ngs / ( los s) bef or e i nco me t axes 4, 683 ,40 4 2. 6 2 ,26 1,45 2 2. 4
Backlog to Working Capital 8.0 6.4 6.2 4.6
Income tax (expense) / benefit (310,406) (0.2) (87,660) (0.1) Months in Backlog 7.9 7.3 7.2 5.3
Days in Accounts Receivable 38.8 35.1 36.6 38.7
Net earnings $ 4,372,998 2.5 % $ 2,173,792 2.3 % Days in Inventory 4.8 3.6 6.8 3.4
Days in Accounts Payable 40.4 21.7 20.8 17.2
Operating Cycle 25.7 32.7 43.4 40.8
Number of ParticipantsNumber
2005 302004 31
Heavy & Highway Contractors
Note: Not all figures will apear to sum due to rounding.
Midwest Region
* In theCFMA's 2005 Annual Financial Study, Returnon Assets(ROA)and Returnon Equity (ROE) are calculated using
net earnings (loss) before income taxes. Studies conducted in prior years used net earnings (loss) after taxes to
calculate ROA and ROE. All references to ROAs and ROEs from prior studies have been updated to reflect this change.
Heavy & Highway Contractors

8/13/2019 2005 Financial Survey
http://slidepdf.com/reader/full/2005-financial-survey 169/284
Balance Sheet
2005 Participants 2004 Participants 2005 Participants 2004 Participants
Amount Percent Amount Percent Amount Percent Amount Percent
Current assets: Current liabilities:
Cash and cash equivalents $ 5,774,497 15.9 % $ 4,539,636 14.0 % Current maturity on long-term debt $ 1,445,465 4.0 % $ 1,594,870 4.9 %
Marketable securities & short-term investments 2,263,355 6.2 679,475 2.1 Notes payable and lines of credit 1,003,571 2.8 273,529 0.8
Receivables: Accounts payable:
Contr act r ecei va ble s c urr ent ly du e 8 ,846 ,62 5 2 4.3 5 ,92 0,19 7 18.3 Tr ade, in clu din g c urr ent ly du e
Retainages on contracts 2,454,832 6.7 1,841,386 5.7 to subcontractors 4,821,436 13.2 3,988,301 12.3
Unbilled work 635,831 1.7 34,091 0.1 Subcontracts retainages 724,845 2.0 593,762 1.8
Other receivables 309,432 0.8 986,563 3.0 Other 48,273 0.1 170,024 0.5
Less allowance for doubtful accounts (84,189) (0.2) (49,529) (0.2) Total accounts payable 5,594,554 15.4 4,752,088 14.6
Total receivables, net: 12,162,531 33.4 8,732,708 26.9
Accrued expenses 1,493,604 4.1 1,668,500 5.1
Inventories 397,955 1.1 1,364,021 4.2 Billings in excess of costs and recognized
Costs and recognized earnings in excess earnings on uncompleted contracts 3,743,300 10.3 2,429,626 7.5
of billings on uncompleted contracts 1,035,226 2.8 617,620 1.9 Income taxes:
Investments in and advances to Current 91,930 0.3 7,317 0.0
construction joint ventures 1,145,429 3.1 116,152 0.4 Deferred 13,052 0.0 20,952 0.1
Income taxes: Other current liabilities 24,173 0.1 225,458 0.7
Current/refundable 13,081 0.0 44,914 0.1 Total current liabilities 13,409,649 36.8 10,972,339 33.8
Deferred 5,593 0.0 19,325 0.1 Noncurrent liabilities
Other current assets 848,197 2.3 902,121 2.8 Long-term debt, excluding current maturities 5,722,177 15.7 5,096,166 15.7
Total current assets 23,645,864 64.9 17,015,973 52.5 Deferred income taxes 515,127 1.4 325,453 1.0
Other 163,929 0.5 762,891 2.4
Property, plant and equipment 22,068,183 60.6 30,857,418 95.1 Total liabilities 19,810,881 54.4 17,156,849 52.9
Less accumulated depreciation (12,990,855) (35.7) (17,704,791) (54.6) Minority interests 0 0.0 0 0.0
Property, plant and equipment, net 9,077,329 24.9 13,152,627 40.5 Net worth:
Common stock, par value 2,897,653 8.0 30,622 0.1
Noncurrent assets: Preferred stock, stated value 0 0.0 0 0.0
Long-term investments 272,357 0.7 645,836 2.0 Additional paid-in capital 472,807 1.3 2,913,108 9.0
Deferred income taxes 12,515 0.0 13,251 0.0 Retained earnings 9,534,088 26.2 12,646,392 39.0
Other assets 3,418,757 9.4 1,610,313 5.0 Treasury stock (378,010) (1.0) (2,245,664) (6.9)
Total noncurrent assets 3,703,630 10.2 2,269,401 7.0 Excess value of marketable securities 159,474 0.4 78,709 0.2
Other equity 3,929,929 10.8 1,857,983 5.7
Total net worth 16,615,941 45.6 15,281,151 47.1
Total assets $ 36,426,822 100.0 % $ 32,438,001 100.0 % Total liabilities and net worth $ 36,426,822 100.0 % $ 32,438,001 100.0 %
Statement of Earnings Financial Ratios
2005 Participants 2004 Participants 2005 Participants 2004 Participants
Amount Percent Amount Percent Average Median Average Median
Contract revenue $ 75,662,170 99.7 % $ 57,183,069 86.3 % Liquidity Ratios
Other revenue 194,101 0.3 9,045,892 13.7
Total Revenue 75,856,270 100.0 66,228,961 100.0 Current Ratio 1.8 1.7 1.6 1.5
Quick Ratio 1.5 1.4 1.3 1.3
Contract cost (67,096,265) (88.5) (51,662,472) (78.0) Days of Cash 27.4 28.7 24.7 29.2
Other cost (208,546) (0.3) (7,599,391) (11.5) Working Capital Turnover 7.4 7 .4 11.0 12.4
Total cost (67,304,812) (88.7) (59,261,863) (89.5)
Profitability Ratios
Gross Profit 8,551,459 11.3 6,967,098 10.5
Return on Assets * 9.5 % 7.6 % 8.1 % 6.1 %
Selling, general & administrative expenses: Return on Equity * 20.9 % 20.0 % 17.3 % 15.8 %
Payroll (2,314,794) (3.1) (2,422,202) (3.7) Times Interest Earned 7.8 9.4 8.3 10.0
Professional fees (151,149) (0.2) (257,901) (0.4)
Sales & marketing costs (86,408) (0.1) (62,083) (0.1) Leverage Ratios
Technology costs (76,776) (0.1) (161,535) (0.2)
Administrative bonuses (321,568) (0.4) (404,032) (0.6) Debt to Equity 1.2 1.5 1.1 1.3
Other (1,804,444) (2.4) (1,224,300) (1.8) Revenue to Equity 4.6 6.7 4.3 5.7
Total SG&A expenses (4,755,139) (6.3) (4,532,053) (6.8) Asset Turnover 2.1 2.4 2.0 2.5
Fixed Asset Ratio 54.6 % 52.8 % 86.1 % 64.4 %
Income from operations 3,796,320 5.0 2,435,045 3.7 Equity to SG&A Expense 3.5 2.6 3.4 2.7
Underbillings to Equity 10.1 % 8.9 % 4.3 % 2.4 %
Interest income 157,789 0.2 79,455 0.1 Backlog to Equity 4.6 4.7 4.3 3.6
Interest expense (512,852) (0.7) (361,600) (0.5)Other income / (expense), net 25,898 0.0 490,199 0.7
Efficiency Ratios
Net ear ni ngs / ( los s) bef or e i nco me t axes 3, 467 ,15 5 4. 6 2 ,64 3,09 9 4. 0
Backlog to Working Capital 7.1 7.8 14.8 7.4
Income tax (expense) / benefit (111,418) (0.1) (5,525) (0.0) Months in Backlog 8.7 6.9 8.0 6.9
Days in Accounts Receivable 43.1 37.8 37.3 29.7
Net earnings $ 3,355,736 4.4 % $ 2,637,574 4.0 % Days in Inventory 2.1 3.6 8.3 4.5
Days in Accounts Payable 26.0 22.2 25.3 27.5
Operating Cycle 46.5 42.7 45.0 40.3
Number of ParticipantsNumber
2005 142004 17
Note: Not all figures will apear to sum due to rounding.
Southwest Region
Heavy & Highway Contractors
* In theCFMA's 2005 Annual Financial Study, Returnon Assets(ROA)and Returnon Equity (ROE) are calculated using
net earnings (loss) before income taxes. Studies conducted in prior years used net earnings (loss) after taxes to
calculate ROA and ROE. All references to ROAs and ROEs from prior studies have been updated to reflect this change.
Heavy & Highway Contractors

8/13/2019 2005 Financial Survey
http://slidepdf.com/reader/full/2005-financial-survey 170/284
Balance Sheet
2005 Participants 2004 Participants 2005 Participants 2004 Participants
Amount Percent Amount Percent Amount Percent Amount Percent
Current assets: Current liabilities:
Cash and cash equivalents $ 4,459,989 14.4 % $ 13,077,388 21.4 % Current maturity on long-term debt $ 709,753 2.3 % $ 1,395,680 2.3 %
Marketable securities & short-term investments 2,376,817 7.7 58,346 0.1 Notes payable and lines of credit 454,272 1.5 274,941 0.4
Receivables: Accounts payable:
Contr act r ecei va ble s c urr ent ly du e 8 ,557 ,96 9 2 7.6 20, 461, 053 33.4 Tr ade, in clu din g c urr ent ly du e
Retainages on contracts 1,271,886 4.1 5,698,909 9.3 to subcontractors 5,773,859 18.6 9,573,204 15.6
Unbilled work 0 0.0 336,600 0.5 Subcontracts retainages 793,766 2.6 2,804,135 4.6
Other receivables 337,656 1.1 422,336 0.7 Other 870,387 2.8 851,975 1.4
Less allowance for doubtful accounts (7,446) (0.0) (118,995) (0.2) Total accounts payable 7,438,013 24.0 13,229,314 21.6
Total receivables, net: 10,160,065 32.8 26,799,903 43.8
Accrued expenses 1,453,946 4.7 7,628,903 12.5
Inventories 131,983 0.4 126,588 0.2 Billings in excess of costs and recognized
Costs and recognized earnings in excess earnings on uncompleted contracts 2,277,084 7.3 14,441,512 23.6
of billings on uncompleted contracts 2,529,720 8.2 1,412,695 2.3 Income taxes:
Investments in and advances to Current 209,952 0.7 58,279 0.1
construction joint ventures 0 0.0 2,781,100 4.5 Deferred 1,571 0.0 17,200 0.0
Income taxes: Other current liabilities 1,418,765 4.6 384,659 0.6
Current/refundable 16,114 0.1 93,807 0.2 Total current liabilities 13,963,356 45.0 37,430,487 61.1
Deferred 468,821 1.5 1,437,200 2.3 Noncurrent liabilities
Other current assets 863,228 2.8 2,280,390 3.7 Long-term debt, excluding current maturities 2,588,146 8.3 3,037,772 5.0
Total current assets 21,006,736 67.8 48,067,418 78.5 Deferred income taxes 770,786 2.5 740,600 1.2
Other 107,138 0.3 1,482,201 2.4
Property, plant and equipment 18,131,417 58.5 21,458,228 35.0 Total liabilities 17,429,426 56.2 42,691,060 69.7
Less accumulated depreciation (10,377,987) (33.5) (12,024,109) (19.6) Minority interests 0 0.0 0 0.0
Property, plant and equipment, net 7,753,430 25.0 9,434,119 15.4 Net worth:
Common stock, par value 126,154 0.4 117,824 0.2
Noncurrent assets: Preferred stock, stated value 0 0.0 0 0.0
Long-term investments 14,613 0.0 10,500 0.0 Additional paid-in capital 9,527,519 30.7 4,925,500 8.0
Deferred income taxes 575,857 1.9 0 0.0 Retained earnings 3,648,529 11.8 13,637,150 22.3
Other assets 1,654,771 5.3 3,711,823 6.1 Treasury stock (4,286) (0.0) (298,000) (0.5)
Total noncurrent assets 2,245,241 7.2 3,722,323 6.1 Excess value of marketable securities (3,500) (0.0) 0 0.0
Other equity 281,565 0.9 150,326 0.2
Total net worth 13,575,981 43.8 18,532,799 30.3
Total assets $ 31,005,406 100.0 % $ 61,223,859 100.0 % Total liabilities and net worth $ 31,005,406 100.0 % $ 61,223,859 100.0 %
Statement of Earnings Financial Ratios
2005 Participants 2004 Participants 2005 Participants 2004 Participants
Amount Percent Amount Percent Average Median Average Median
Contract revenue $ 58,475,633 100.0 % $ 189,450,403 99.7 % Liquidity Ratios
Other revenue 0 0.0 610,109 0.3
Total Revenue 58,475,633 100.0 190,060,512 100.0 Current Ratio 1.5 1.5 1.3 1.2
Quick Ratio 1.2 1.2 1.1 1.1
Contract cost (55,177,663) (94.4) (173,967,181) (91.5) Days of Cash 27.5 15.1 24.8 10.6
Other cost 0 0.0 (462,204) (0.2) Working Capital Turnover 8.3 10.3 17.9 25.5
Total cost (55,177,663) (94.4) (174,429,385) (91.8)
Profitability Ratios
Gross Profit 3,297,971 5.6 15,631,127 8.2
Return on Assets * 3.6 % 2.6 % 9.3 % 4.0 %
Selling, general & administrative expenses: Return on Equity * 8.1 % 7.8 % 30.8 % 14.0 %
Payroll (1,108,149) (1.9) (5,038,275) (2.7) Times Interest Earned 14.1 29.3 8.4 2.7
Professional fees (67,756) (0.1) (450,135) (0.2)
Sales & marketing costs (50,020) (0.1) (295,826) (0.2) Leverage Ratios
Technology costs (45,914) (0.1) (317,141) (0.2)
Administrative bonuses (62,094) (0.1) (1,083,854) (0.6) Debt to Equity 1.3 1.5 2.3 2.4
Other (781,265) (1.3) (2,294,520) (1.2) Revenue to Equity 4.3 6.0 10.3 10.3
Total SG&A expenses (2,115,198) (3.6) (9,479,752) (5.0) Asset Turnover 1.9 2.5 3.1 2.6
Fixed Asset Ratio 57.1 % 69.1 % 50.9 % 73.5 %
Income from operations 1,182,773 2.0 6,151,375 3.2 Equity to SG&A Expense 6.4 2.1 2.0 1.7
Underbillings to Equity 18.6 % 21.3 % 9.4 % 10.7 %
Interest income 56,186 0.1 188,740 0.1 Backlog to Equity 3.6 2.0 3.3 3.3
Interest expense (84,147) (0.1) (769,128) (0.4)Other income / (expense), net (51,510) (0.1) 141,132 0.1
Efficiency Ratios
Net ear ni ngs / ( los s) bef or e i nco me t axes 1, 103 ,30 3 1. 9 5 ,71 2,11 9 3. 0
Backlog to Working Capital 8.0 4.1 12.1 10.3
Income tax (expense) / benefit (16,247) (0.0) (2,415,942) (1.3) Months in Backlog 5.5 6.3 4.3 4.4
Days in Accounts Receivable 54.7 42.4 39.3 44.6
Net earnings $ 1,087,056 1.9 % $ 3,296,177 1.7 % Days in Inventory 0.9 3.9 0.3 5.4
Days in Accounts Payable 43.3 39.8 21.5 44.4
Operating Cycle 39.7 36.3 42.8 21.5
Number of ParticipantsNumber
2005 142004 10
Heavy & Highway Contractors
Note: Not all figures will apear to sum due to rounding.
Heavy & Highway ContractorsWest Region
* In theCFMA's 2005 Annual Financial Study, Returnon Assets(ROA)and Returnon Equity (ROE) are calculated using
net earnings (loss) before income taxes. Studies conducted in prior years used net earnings (loss) after taxes to
calculate ROA and ROE. All references to ROAs and ROEs from prior studies have been updated to reflect this change.

8/13/2019 2005 Financial Survey
http://slidepdf.com/reader/full/2005-financial-survey 171/284
Balance Sheet
2005 Participants 2004 Participants 2005 Participants 2004 Participants
Amount Percent Amount Percent Amount Percent Amount Percent
Current assets: Current liabilities:
Cash and cash equivalents $ 3,126,901 18.0 % $ 3,882,523 18.5 % Current maturity on long-term debt $ 306,632 1.8 % $ 275,750 1.3 %
Marketable securities & short-term investments 417,641 2.4 210,589 1.0 Notes payable and lines of credit 229,599 1.3 202,050 1.0
Receivables: Accounts payable:
Contr act r ecei va ble s c urr ent ly du e 5 ,268 ,62 3 3 0.3 5 ,03 4,77 8 24.0 Tr ade, in clu din g c urr ent ly du e
Retainages on contracts 2,780,186 16.0 3,200,860 15.2 to subcontractors 3,066,650 17.6 3,287,722 15.7
Unbilled work 646,029 3.7 399,434 1.9 Subcontracts retainages 1,216,796 7.0 1,241,437 5.9
Other receivables 117,811 0.7 998,327 4.8 Other 94,308 0.5 264,447 1.3
Less allowance for doubtful accounts (30,991) (0.2) (33,171) (0.2) Total accounts payable 4,377,754 25.2 4,793,606 22.8
Total receivables, net: 8,781,657 50.5 9,600,228 45.7
Accrued expenses 1,830,662 10.5 953,101 4.5
Inventories 196,629 1.1 32,261 0.2 Billings in excess of costs and recognized
Costs and recognized earnings in excess earnings on uncompleted contracts 2,793,866 16.1 2,868,460 13.7
of billings on uncompleted contracts 844,820 4.9 539,006 2.6 Income taxes:
Investments in and advances to Current 12,977 0.1 135,450 0.6
construction joint ventures 28,230 0.2 38,009 0.2 Deferred 11,177 0.1 54,593 0.3
Income taxes: Other current liabilities 132,386 0.8 913,208 4.3
Current/refundable 20,686 0.1 23,628 0.1 Total current liabilities 9,695,054 55.7 10,196,216 48.5
Deferred 1,444 0.0 8,685 0.0 Noncurrent liabilities
Other current assets 333,547 1.9 315,565 1.5 Long-term debt, excluding current maturities 1,187,514 6.8 562,400 2.7
Total current assets 13,751,555 79.0 14,650,492 69.7 Deferred income taxes 88,944 0.5 89,083 0.4
Other 36,991 0.2 1,205,762 5.7
Property, plant and equipment 8,201,408 47.1 8,707,670 41.5 Total liabilities 11,008,503 63.3 12,053,461 57.4
Less accumulated depreciation (4,942,192) (28.4) (4,650,408) (22.1) Minority interests 291,757 1.7 0 0.0
Property, plant and equipment, net 3,259,216 18.7 4,057,262 19.3 Net worth:
Common stock, par value 183,852 1.1 52,070 0.2
Noncurrent assets: Preferred stock, stated value 53,182 0.3 0 0.0
Long-term investments 1,556 0.0 461,738 2.2 Additional paid-in capital 2,128,323 12.2 1,260,808 6.0
Deferred income taxes 0 0.0 0 0.0 Retained earnings 3,082,019 17.7 6,602,140 31.4
Other assets 387,580 2.2 1,835,113 8.7 Treasury stock (21,482) (0.1) 0 0.0
Total noncurrent assets 389,136 2.2 2,296,851 10.9 Excess value of marketable securities 0 0.0 0 0.0
Other equity 673,751 3.9 1,036,126 4.9
Total net worth 6,099,646 35.1 8,951,144 42.6
Total assets $ 17,399,906 100.0 % $ 21,004,605 100.0 % Total liabilities and net worth $ 17,399,906 100.0 % $ 21,004,605 100.0 %
Statement of Earnings Financial Ratios
2005 Participants 2004 Participants 2005 Participants 2004 Participants
Amount Percent Amount Percent Average Median Average Median
Contract revenue $ 40,647,524 83.3 % $ 44,020,872 98.4 % Liquidity Ratios
Other revenue 8,130,092 16.7 718,348 1.6
Total Revenue 48,777,617 100.0 44,739,220 100.0 Current Ratio 1.4 1.5 1.4 1.5
Quick Ratio 1.3 1.2 1.3 1.3
Contract cost (35,678,412) (73.1) (38,204,497) (85.4) Days of Cash 23.1 14.4 31.2 29.1
Other cost (7,249,382) (14.9) (929,144) (2.1) Working Capital Turnover 12.0 11.4 10.0 10.1
Total cost (42,927,795) (88.0) (39,133,641) (87.5)
Profitability Ratios
Gross Profit 5,849,822 12.0 5,605,580 12.5
Return on Assets * 13.9 % 12.9 % 11.1 % 10.0 %
Selling, general & administrative expenses: Return on Equity * 39.7 % 34.3 % 26.1 % 30.5 %
Payroll (1,705,707) (3.5) (1,460,975) (3.3) Times Interest Earned 29.5 16.3 29.7 29.9
Professional fees (80,055) (0.2) (121,044) (0.3)
Sales & marketing costs (125,255) (0.3) (64,703) (0.1) Leverage Ratios
Technology costs (38,079) (0.1) (50,659) (0.1)
Administrative bonuses (429,590) (0.9) (237,113) (0.5) Debt to Equity 1.8 1.7 1.3 1.5
Other (1,143,954) (2.3) (1,257,801) (2.8) Revenue to Equity 8.0 7.1 5.0 4.7
Total SG&A expenses (3,522,641) (7.2) (3,192,295) (7.1) Asset Turnover 2.8 2.6 2.1 2.1
Fixed Asset Ratio 53.4 % 66.0 % 45.3 % 48.6 %
Income from operations 2,327,182 4.8 2,413,285 5.4 Equity to SG&A Expense 1.7 1.5 2.8 2.1
Underbillings to Equity 24.4 % 13.6 % 10.5 % 8 .0 %
Interest income 117,093 0.2 174,022 0.4 Backlog to Equity 7.0 5.0 4.5 4.0
Interest expense (84,894) (0.2) (81,426) (0.2)Other income / (expense), net 60,607 0.1 (166,350) (0.4)
Efficiency Ratios
Net ear ni ngs / ( los s) bef or e i nco me t axes 2, 419 ,98 7 5. 0 2 ,33 9,53 0 5. 2
Backlog to Working Capital 10.2 6.2 7.9 6.0
Income tax (expense) / benefit (217,192) (0.4) (135,884) (0.3) Months in Backlog 10.8 8.1 8.6 9.7
Days in Accounts Receivable 39.5 47.4 48.3 49.4
Net earnings $ 2,202,795 4.5 % $ 2,203,646 4.9 % Days in Inventory 1.6 3.4 0.3 3.1
Days in Accounts Payable 26.5 28.6 32.7 29.1
Operating Cycle 37.7 42.0 47.1 55.6
Number of ParticipantsNumber
2005 182004 10
Note: Not all figures will apear to sum due to rounding.
* In theCFMA's 2005 Annual Financial Study, Returnon Assets(ROA)and Returnon Equity (ROE) are calculated using
net earnings (loss) before income taxes. Studies conducted in prior years used net earnings (loss) after taxes to
calculate ROA and ROE. All references to ROAs and ROEs from prior studies have been updated to reflect this change.
Heavy & Highway ContractorsFar West Region
Heavy & Highway Contractors
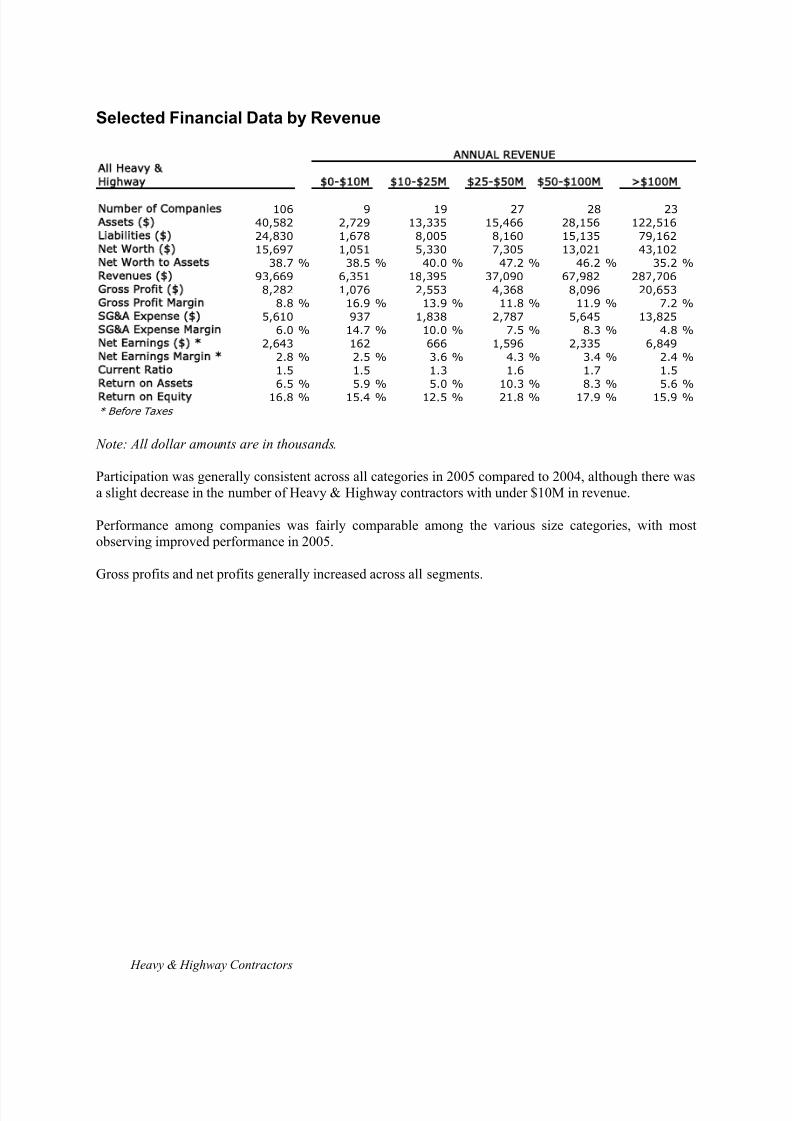
8/13/2019 2005 Financial Survey
http://slidepdf.com/reader/full/2005-financial-survey 172/284
Heavy & Highway Contractors
Selected Financial Data by Revenue
All Heavy &
Highway 0- 10M 10- 25M 25- 50M 50- 100M > 100M
Number of Companies 106 9 19 27 28 23
Assets ( ) 40,582 2,729 13,335 15,466 28,156 122,516
Liabilities ( ) 24,830 1,678 8,005 8,160 15,135 79,162
Net Worth ( ) 15,697 1,051 5,330 7,305 13,021 43,102
Net Worth to Assets 38.7 % 38.5 % 40.0 % 47.2 % 46.2 % 35.2 %
Revenues ( ) 93,669 6,351 18,395 37,090 67,982 287,706
Gross Profit ( ) 8,282 1,076 2,553 4,368 8,096 20,653
Gross Profit Margin 8.8 % 16.9 % 13.9 % 11.8 % 11.9 % 7.2 %
SG&A Expense ( ) 5,610 937 1,838 2,787 5,645 13,825
SG&A Expense Margin 6.0 % 14.7 % 10.0 % 7.5 % 8.3 % 4.8 %
Net Earnings ( ) * 2,643 162 666 1,596 2,335 6,849
Net Earnings Margin * 2.8 % 2.5 % 3.6 % 4.3 % 3.4 % 2.4 %
Current Ratio 1.5 1.5 1.3 1.6 1.7 1.5
Return on Assets 6.5 % 5.9 % 5.0 % 10.3 % 8.3 % 5.6 %
Return on Equity 16.8 % 15.4 % 12.5 % 21.8 % 17.9 % 15.9 %
* Before Taxes
ANNUAL REVENUE
Note: All dollar amounts are in thousands.
Participation was generally consistent across all categories in 2005 compared to 2004, although there wasa slight decrease in the number of Heavy & Highway contractors with under $10M in revenue.
Performance among companies was fairly comparable among the various size categories, with mostobserving improved performance in 2005.
Gross profits and net profits generally increased across all segments.

8/13/2019 2005 Financial Survey
http://slidepdf.com/reader/full/2005-financial-survey 173/284
Balance Sheet
2005 Participants 2004 Participants 2005 Participants 2004 Participants
Amount Percent Amount Percent Amount Percent Amount Percent
Current assets: Current liabilities:
Cash and cash equivalents $ 170,395 6.2 % $ 586,729 17.7 Current maturity on long-term debt $ 193,044 7.1 % $ 74,876 2.3 %Marketable securities & short-term investments 1,667 0.1 50,138 1.5 Notes payable and lines of credit 167,174 6.1 338,857 10.2
Receivables: Accounts payable:
Contract receivables currently due 935,018 34.3 864,821 26.1 Trade, including currently due
Retainages on contracts 164,543 6.0 179,721 5.4 to subcontractors 415,053 15.2 624,850 18.9
Unbilled work 24,953 0.9 12,242 0.4 Subcontracts retainages 18,654 0.7 43,977 1.3
Other receivables 1,864 0.1 82,388 2.5 Other 30,659 1.1 23,736 0.7
Less allowance for doubtful accounts 0 0.0 (7,083) (0.2) Total accounts payable 464,366 17.0 692,563 20.9
Total receivables, net: 1,126,378 41.3 1,132,088 34.2
Accrued expenses 92,880 3.4 73,156 2.2
Inventories 136,300 5.0 22,409 0.7 Billings in excess of costs and recognized
Costs and recognized earnings in excess earnings on uncompleted contracts 114,360 4.2 160,582 4.8
of billings on uncompleted contracts 67,736 2.5 228,095 6.9 Income taxes:
Investments in and advances to Current 12,000 0.4 12,925 0.4
construction joint ventures 0 0.0 0 0.0 Deferred 7,000 0.3 58,191 1.8
Income taxes: Other current liabilities 5,556 0.2 4,013 0.1
Current/refundable 1,078 0.0 31,925 1.0 Total current liabilities 1,056,380 38.7 1,415,162 42.7
Deferred 0 0.0 12,907 0.4 Noncurrent liabilities
Other current assets 133,324 4.9 72,246 2.2 Long-term debt, excluding current maturities 531,488 19.5 298,115 9.0
Total current assets 1,636,879 60.0 2,136,536 64.5 Deferred income taxes 13,000 0.5 132,335 4.0
Other 77,444 2.8 2,031 0.1
Property, plant and equipment 3,237,340 118.6 2,527,221 76.3 Total liabilities 1,678,313 61.5 1,847,643 55.8
Less accumulated depreciation (2,232,235) (81.8) (1,537,408) (46.4) Minority interests 0 0.0 0 0.0
Property, plant and equipment, net 1,005,105 36.8 989,813 29.9 Net worth:
Common stock, par value 146,889 5.4 45,642 1.4
Noncurrent assets: Preferred stock, stated value 0 0.0 0 0.0
Long-term investments 0 0.0 2,901 0.1 Additional paid-in capital 7,355 0.3 51,508 1.6
Deferred income taxes 0 0.0 0 0.0 Retained earnings 725,540 26.6 1,324,540 40.0
Other assets 87,086 3.2 183,597 5.5 Treasury stock 0 0.0 (43,182) (1.3)
Total noncurrent assets 87,086 3.2 186,498 5.6 Excess value of marketable securities 0 0.0 0 0.0
Other equity 170,973 6.3 86,696 2.6
Total net worth 1,050,757 38.5 1,465,203 44.2
Total assets $ 2,729,070 100.0 % $ 3,312,846 100.0 Total liabilities and net worth $ 2,729,070 100.0 % $ 3,312,846 100.0 %
Statement of Earnings Financial Ratios
2005 Participants 2004 Participants 2005 Participants 2004 Participants
Amount Percent Amount Percent Average Median Average Median
Contract revenue $ 6,351,457 100.0 % $ 6,254,265 99.7 % Liquidity Ratios
Other revenue 0 0.0 16,055 0.3
Total Revenue 6,351,457 100.0 6,270,320 100.0 Current Ratio 1.5 1.4 1.5 1.3
Quick Ratio 1.2 1.1 1.3 1.1
Contract cost (5,275,437) (83.1) (5,218,875) (83.2) Days of Cash 9.7 4.0 33.7 20.9
Other cost 0 0.0 (12,218) (0.2) Working Capital Turnover 10.9 13.8 8.7 11.7
Total cost (5,275,437) (83.1) (5,231,093) (83.4)
Profitability Ratios
Gross Profit 1,076,021 16.9 1,039,228 16.6
Return on Assets * 5.9 % 2.3 % 1.4 % 3.3 %
Selling, general & administrative expenses: Return on Equity * 15.4 % 4.1 % 3.2 % 10.7 %
Payroll (463,226) (7.3) (458,201) (7.3) Times Interest Earned 8.5 8.9 2.7 5.1
Professional fees (29,536) (0.5) (32,325) (0.5)
Sales & marketing costs (10,457) (0.2) (21,010) (0.3) Leverage Ratios
Technology costs (11,523) (0.2) (7,152) (0.1)
Administrative bonuses (21,346) (0.3) (24,842) (0.4) Debt to Equity 1.6 1.8 1.3 2.0
Other (400,660) (6.3) (372,244) (5.9) Revenue to Equity 6.0 6.3 4.3 5.4
Total SG&A expenses (936,748) (14.7) (915,773) (14.6) Asset Turnover 2.3 2.4 1.9 2.0
Fixed Asset Ratio 95.7 % 75.2 % 67.6 % 62.3 %
Income from operations 139,273 2.2 123,454 2.0 Equity to SG&A Expense 1.1 1.2 1.6 1.5
Underbillings to Equity 8.8 % 10.0 % 16.4 % 10.3 %
Interest income 1,664 0.0 14,488 0.2 Backlog to Equity 3.0 2.1 2.7 2.3
Interest expense (21,548) (0.3) (27,902) (0.4)
Other income / (expense), net 42,320 0.7 (63,572) (1.0)
Efficiency Ratios
Net earnings / (loss) before income taxes 161,709 2.5 46,468 0.7
Backlog to Working Capital 6.4 3.9 8.7 6.7
Income tax (expense) / benefit (8,455) (0.1) 20,693 0.3 Months in Backlog 5.5 4.0 5.1 4.6
Days in Accounts Receivable 53.1 44.6 54.0 47.8
Net earnings $ 153,255 2.4 % $ 67,161 1.1 % Days in Inventory 9.3 5.0 1.5 3.9
Days in Accounts Payable 30.4 26.5 44.6 45.3
Operating Cycle 41.6 28.4 44.6 31.8
Number of ParticipantsNumber
2005 92004 12
Note: Not all figures will apear to sum due to rounding.
Heavy & Highway ContractorsLess Than $10 Million Revenue
Heavy & Highway Contractors
* In theCFMA's 2005 Annual Financial Study, Returnon Assets(ROA) and Return on Equity (ROE) arecalculated using
net earnings (loss) before income taxes. Studies conducted in prior years used net earnings (loss) after taxes to
calculate ROA and ROE. All references to ROAs and ROEs from prior studies have been updated to reflect this change.

8/13/2019 2005 Financial Survey
http://slidepdf.com/reader/full/2005-financial-survey 174/284
Balance Sheet
2005 Participants 2004 Participants 2005 Participants 2004 Participants
Amount Percent Amount Percent Amount Percent Amount Percent
Current assets: Current liabilities:
Cash and cash equivalents $ 1,275,019 9.6 % $ 843,755 9.6 % Current maturity on long-term debt $ 888,974 6.7 % $ 685,586 7.8 %
Marketable securities & short-term investments 56,755 0.4 134,082 1.5 Notes payable and lines of credit 212,875 1.6 237,314 2.7
Receivables: Accounts payable:
Contract receivables currently due 3,883,620 29.1 2,355,244 26.8 Trade, including currently due
Retainages on contracts 617,510 4.6 564,349 6.4 to subcontractors 1,470,859 11.0 1,477,711 16.8
Unbilled work 11,137 0.1 66,266 0.8 Subcontracts retainages 144,300 1.1 132,605 1.5
Other receivables 194,086 1.5 154,236 1.8 Other 340,910 2.6 1,626 0.0
Less allowance for doubtful accounts (10,772) (0.1) (18,392) (0.2) Total accounts payable 1,956,069 14.7 1,611,942 18.4
Total receivables, net: 4,695,581 35.2 3,121,703 35.5
Accrued expenses 450,804 3.4 381,444 4.3
Inventories 100,783 0.8 111,307 1.3 Billings in excess of costs and recognized
Costs and recognized earnings in excess earnings on uncompleted contracts 791,459 5.9 498,010 5.7
of billings on uncompleted contracts 481,475 3.6 228,441 2.6 Income taxes:
Investments in and advances to Current 148,253 1.1 15,017 0.2
construction joint ventures 0 0.0 0 0.0 Deferred 1,402 0.0 6,316 0.1
Income taxes: Other current liabilities 1,121,769 8.4 74,734 0.9
Current/refundable 21,562 0.2 18,536 0.2 Total current liabilities 5,571,605 41.8 3,510,362 40.0
Deferred 231,113 1.7 9,563 0.1 Noncurrent liabilities
Other current assets 589,383 4.4 209,372 2.4 Long-term debt, excluding current maturities 1,869,050 14.0 1,707,692 19.4
Total current assets 7,451,670 55.9 4,676,759 53.3 Deferred income taxes 543,571 4.1 95,811 1.1
Other 20,759 0.2 53,644 0.6
Property, plant and equipment 12,405,274 93.0 8,309,396 94.6 Total liabilities 8,004,985 60.0 5,367,509 61.1
Less accumulated depreciation (7,320,153) (54.9) (4,780,675) (54.4) Minority interests 0 0.0 0 0.0
Property, plant and equipment, net 5,085,122 38.1 3,528,721 40.2 Net worth:
Common stock, par value 35,256 0.3 36,721 0.4
Noncurrent assets: Preferred stock, stated value 24,737 0.2 2,253 0.0
Long-term investments 4,786 0.0 54,775 0.6 Additional paid-in capital 1,353,040 10.1 281,826 3.2
Deferred income taxes 0 0.0 0 0.0 Retained earnings 3,899,975 29.2 3,092,264 35.2
Other assets 793,622 6.0 521,530 5.9 Treasury stock (199,711) (1.5) (338,859) (3.9)
Total noncurrent assets 798,409 6.0 576,306 6.6 Excess value of marketable securities 4,364 0.0 5,006 0.1
Other equity 212,554 1.6 335,065 3.8
Total net worth 5,330,215 40.0 3,414,276 38.9
Total assets $ 13,335,200 100.0 % $ 8,781,785 100.0 % Total liabilities and net worth $ 13,335,200 100.0 % $ 8,781,785 100.0 %
Statement of Earnings Financial Ratios
2005 Participants 2004 Participants 2005 Participants 2004 Participants
Amount Percent Amount Percent Average Median Average Median
Contract revenue $ 17,853,254 97.1 % $ 16,153,305 95.4 % Liquidity Ratios
Other revenue 541,985 2.9 777,182 4.6
Total Revenue 18,395,239 100.0 16,930,487 100.0 Current Ratio 1.3 1.3 1.3 1.4
Quick Ratio 1.1 1.2 1.2 1.3
Contract cost (15,443,265) (84.0) (14,206,907) (83.9) Days of Cash 25.0 12.8 17.9 11.4
Other cost (398,949) (2.2) (604,492) (3.6) Working Capital Turnover 9.8 8.0 14.5 12.8
Total cost (15,842,214) (86.1) (14,811,398) (87.5)
Profitability Ratios
Gross Profit 2,553,026 13.9 2,119,089 12.5
Return on Assets * 5.0 % 10.4 % 5.2 % 8.3 %
Selling, general & administrative expenses: Return on Equity * 12.5 % 30.5 % 13.4 % 16.3 %
Payroll (987,637) (5.4) (752,860) (4.4) Times Interest Earned 7.2 18.8 4.8 16.2
Professional fees (62,891) (0.3) (78,795) (0.5)
Sales & marketing costs (38,132) (0.2) (50,184) (0.3) Leverage Ratios
Technology costs (20,031) (0.1) (16,002) (0.1)
Administrative bonuses (129,375) (0.7) (135,948) (0.8) Debt to Equity 1.5 1.8 1.6 1.3
Other (600,102) (3.3) (532,902) (3.1) Revenue to Equity 3.5 5.9 5.0 6.0
Total SG&A expenses (1,838,169) (10.0) (1,566,692) (9.3) Asset Turnover 1.4 2.3 1.9 2.1
Fixed Asset Ratio 95.4 % 76.0 % 103.4 % 79.0 %
Income from operations 714,857 3.9 552,397 3.3 Equity to SG&A Expense 2.9 1.6 2.2 1.8
Underbillings to Equity 9.2 % 13.3 % 8.6 % 7.6 %
Interest income 19,281 0.1 24,501 0.1 Backlog to Equity 4.5 2.9 4.3 3.1
Interest expense (106,763) (0.6) (118,813) (0.7)Other income / (expense), net 38,839 0.2 (1,063) (0.0)
Efficiency Ratios
Net earnings / (loss) before income taxes 666,215 3.6 457,022 2.7
Backlog to Working Capital 7.6 5.7 15.2 6.7
Income tax (expense) / benefit (89,834) (0.5) (39,957) (0.2) Months in Backlog 7.6 5.1 6.6 5.8
Days in Accounts Receivable 79.6 50.9 53.0 39.1
Net earnings $ 576,380 3.1 % $ 417,065 2.5 % Days in Inventory 2.3 4.1 2.7 6.9
Days in Accounts Payable 41.2 30.5 36.0 21.1
Operating Cycle 65.7 39.3 37.7 37.8
Number of ParticipantsNumber
2005 192004 19
Heavy & Highway Contractors
Note: Not all figures will apear to sum due to rounding.
Heavy & Highway Contractors$10 - $25 Million Revenue
* In theCFMA's 2005 Annual Financial Study, Returnon Assets(ROA) and Return on Equity (ROE) arecalculated using
net earnings (loss) before income taxes. Studies conducted in prior years used net earnings (loss) after taxes to
calculate ROA and ROE. All references to ROAs and ROEs from prior studies have been updated to reflect this change.

8/13/2019 2005 Financial Survey
http://slidepdf.com/reader/full/2005-financial-survey 175/284
Balance Sheet
2005 Participants 2004 Participants 2005 Participants 2004 Participants
Amount Percent Amount Percent Amount Percent Amount Percent
Current assets: Current liabilities:
Cash and cash equivalents $ 2,867,720 18.5 % $ 2,808,985 14.4 % Current maturity on long-term debt $ 306,770 2.0 % $ 721,999 3.7 %
Marketable securities & short-term investments 491,032 3.2 410,231 2.1 Notes payable and lines of credit 322,429 2.1 347,489 1.8
Receivables: Accounts payable:
Contract receivables currently due 4,607,216 29.8 4,808,436 24.6 Trade, including currently due
Retainages on contracts 1,211,225 7.8 1,384,753 7.1 to subcontractors 2,895,319 18.7 2,873,195 14.7
Unbilled work 19,676 0.1 257,823 1.3 Subcontracts retainages 393,718 2.5 456,234 2.3
Other receivables 120,517 0.8 787,956 4.0 Other 24,063 0.2 239,172 1.2
Less allowance for doubtful accounts (26,864) (0.2) (52,891) (0.3) Total accounts payable 3,313,100 21.4 3,568,600 18.3
Total receivables, net: 5,931,770 38.4 7,186,077 36.8
Accrued expenses 805,032 5.2 703,165 3.6
Inventories 193,557 1.3 132,836 0.7 Billings in excess of costs and recognized
Costs and recognized earnings in excess earnings on uncompleted contracts 1,649,893 10.7 1,508,346 7.7
of billings on uncompleted contracts 533,976 3.5 868,285 4.4 Income taxes:
Investments in and advances to Current 30,123 0.2 57,833 0.3
construction joint ventures 30,724 0.2 350,285 1.8 Deferred 8,262 0.1 78,853 0.4
Income taxes: Other current liabilities 18,295 0.1 471,962 2.4
Current/refundable 12,107 0.1 20,666 0.1 Total current liabilities 6,453,905 41.7 7,458,247 38.2
Deferred 6,850 0.0 3,688 0.0 Noncurrent liabilities
Other current assets 293,367 1.9 397,161 2.0 Long-term debt, excluding current maturities 1,442,397 9.3 2,351,700 12.0
Total current assets 10,361,102 67.0 12,178,215 62.4 Deferred income taxes 93,909 0.6 156,748 0.8
Other 170,068 1.1 482,369 2.5
Property, plant and equipment 12,158,165 78.6 15,252,309 78.1 Total liabilities 8,160,279 52.8 10,449,064 53.5
Less accumulated depreciation (7,589,290) (49.1) (9,199,445) (47.1) Minority interests 0 0.0 0 0.0
Property, plant and equipment, net 4,568,876 29.5 6,052,864 31.0 Net worth:
Common stock, par value 85,723 0.6 127,398 0.7
Noncurrent assets: Preferred stock, stated value 0 0.0 0 0.0
Long-term investments 14,969 0.1 220,959 1.1 Additional paid-in capital 890,016 5.8 776,813 4.0
Deferred income taxes 1,185 0.0 0 0.0 Retained earnings 6,010,960 38.9 7,325,021 37.5
Other assets 519,551 3.4 1,076,710 5.5 Treasury stock (45,770) (0.3) (17,520) (0.1)
Total noncurrent assets 535,705 3.5 1,297,669 6.6 Excess value of marketable securities (9,081) (0.1) 2,198 0.0
Other equity 373,556 2.4 865,773 4.4
Total net worth 7,305,403 47.2 9,079,683 46.5
Total assets $ 15,465,683 100.0 % $ 19,528,747 100.0 % Total liabilities and net worth $ 15,465,683 100.0 % $ 19,528,747 100.0 %
Statement of Earnings Financial Ratios
2005 Participants 2004 Participants 2005 Participants 2004 Participants
Amount Percent Amount Percent Average Median Average Median
Contract revenue $ 36,847,843 99.3 % $ 38,536,379 98.9 % Liquidity Ratios
Other revenue 242,465 0.7 427,320 1.1
Total Revenue 37,090,308 100.0 38,963,698 100.0 Current Ratio 1.6 1.7 1.6 1.5
Quick Ratio 1.4 1.4 1.4 1.3
Contract cost (32,466,120) (87.5) (34,439,314) (88.4) Days of Cash 27.8 34.3 26.0 18.7
Other cost (256,655) (0.7) (236,280) (0.6) Working Capital Turnover 9.5 10.0 8.3 10.5
Total cost (32,722,774) (88.2) (34,675,594) (89.0)
Profitability Ratios
Gross Profit 4,367,534 11.8 4,288,104 11.0
Return on Assets * 10.3 % 14.1 % 6.3 % 7.0 %
Selling, general & administrative expenses: Return on Equity * 21.8 % 23.8 % 13.5 % 12.1 %
Payroll (1,533,234) (4.1) (1,707,443) (4.4) Times Interest Earned 19.3 19.9 15.1 27.3
Professional fees (75,221) (0.2) (109,486) (0.3)
Sales & marketing costs (42,111) (0.1) (44,203) (0.1) Leverage Ratios
Technology costs (35,620) (0.1) (42,812) (0.1)
Administrative bonuses (209,268) (0.6) (140,011) (0.4) Debt to Equity 1.1 1.1 1.2 1.4
Other (891,107) (2.4) (1,162,392) (3.0) Revenue to Equity 5.1 5.3 4.3 4.8
Total SG&A expenses (2,786,562) (7.5) (3,206,346) (8.2) Asset Turnover 2.4 2.5 2.0 2.0
Fixed Asset Ratio 62.5 % 60.0 % 66.7 % 61.4 %
Income from operations 1,580,972 4.3 1,081,758 2.8 Equity to SG&A Expense 2.6 2.7 2.8 2.5
Underbillings to Equity 7.6 % 6.5 % 12.4 % 8.2 %
Interest income 63,148 0.2 100,533 0.3 Backlog to Equity 4.5 3.3 4.1 4.0
Interest expense (87,283) (0.2) (86,813) (0.2)Other income / (expense), net 38,977 0.1 130,678 0.3
Efficiency Ratios
Net earnings / (loss) before income taxes 1,595,814 4.3 1,226,155 3.1
Backlog to Working Capital 9.3 5.7 8.0 6.3
Income tax (expense) / benefit (60,515) (0.2) (70,918) (0.2) Months in Backlog 8.6 7.0 9.2 7.3
Days in Accounts Receivable 45.6 44.2 51.2 52.3
Net earnings $ 1,535,300 4.1 % $ 1,155,237 3.0 % Days in Inventory 2.1 0.6 1.4 0.9
Days in Accounts Payable 32.1 31.5 32.3 28.8
Operating Cycle 43.5 44.6 46.2 43.9
Number of ParticipantsNumber
2005 272004 25
Note: Not all figures will apear to sum due to rounding.
* In theCFMA's 2005 Annual Financial Study, Returnon Assets(ROA) and Return on Equity (ROE) arecalculated using
net earnings (loss) before income taxes. Studies conducted in prior years used net earnings (loss) after taxes to
calculate ROA and ROE. All references to ROAs and ROEs from prior studies have been updated to reflect this change.
Heavy & Highway Contractors
Heavy & Highway Contractors
$25 - $50 Million Revenue

8/13/2019 2005 Financial Survey
http://slidepdf.com/reader/full/2005-financial-survey 176/284
Balance Sheet
2005 Participants 2004 Participants 2005 Participants 2004 Participants
Amount Percent Amount Percent Amount Percent Amount Percent
Current assets: Current liabilities:
Cash and cash equivalents $ 4,030,593 14.3 % $ 5,200,658 16.9 % Current maturity on long-term debt $ 981,755 3.5 % $ 915,458 3.0 %
Marketable securities & short-term investments 1,759,234 6.2 1,051,040 3.4 Notes payable and lines of credit 724,100 2.6 582,233 1.9
Receivables: Accounts payable:
Contract receivables currently due 7,292,436 25.9 7,993,406 25.9 Trade, including currently due
Retainages on contracts 1,724,006 6.1 2,623,960 8.5 to subcontractors 3,911,248 13.9 4,894,623 15.9
Unbilled work 595,696 2.1 182,292 0.6 Subcontracts retainages 699,242 2.5 826,499 2.7
Other receivables 472,945 1.7 116,401 0.4 Other 158,845 0.6 74,994 0.2
Less allowance for doubtful accounts (72,697) (0.3) (52,284) (0.2) Total accounts payable 4,769,335 16.9 5,796,115 18.8
Total receivables, net: 10,012,387 35.6 10,863,775 35.3
Accrued expenses 1,558,747 5.5 1,301,783 4.2
Inventories 626,140 2.2 1,134,246 3.7 Billings in excess of costs and recognized
Costs and recognized earnings in excess earnings on uncompleted contracts 2,731,649 9.7 3,236,895 10.5
of billings on uncompleted contracts 1,396,236 5.0 1,285,892 4.2 Income taxes:
Investments in and advances to Current 56,530 0.2 35,806 0.1
construction joint ventures 634,063 2.3 152,506 0.5 Deferred 78,064 0.3 0 0.0
Income taxes: Other current liabilities 165,543 0.6 305,523 1.0
Current/refundable 71,400 0.3 58,879 0.2 Total current liabilities 11,065,722 39.3 12,173,813 39.5
Deferred 77,618 0.3 116,415 0.4 Noncurrent liabilities
Other current assets 736,806 2.6 812,334 2.6 Long-term debt, excluding current maturities 3,152,756 11.2 2,776,234 9.0
Total current assets 19,344,477 68.7 20,675,744 67.1 Deferred income taxes 335,459 1.2 295,881 1.0
Other 580,937 2.1 793,005 2.6
Property, plant and equipment 18,065,525 64.2 19,164,920 62.2 Total liabilities 15,134,874 53.8 16,038,932 52.0
Less accumulated depreciation (11,267,288) (40.0) (11,739,337) (38.1) Minority interests 0 0.0 0 0.0
Property, plant and equipment, net 6,798,237 24.1 7,425,583 24.1 Net worth:
Common stock, par value 481,062 1.7 621,747 2.0
Noncurrent assets: Preferred stock, stated value 17,403 0.1 0 0.0
Long-term investments 227,284 0.8 740,024 2.4 Additional paid-in capital 3,051,260 10.8 2,732,692 8.9
Deferred income taxes 10,711 0.0 75,254 0.2 Retained earnings 8,447,623 30.0 12,239,900 39.7
Other assets 1,775,307 6.3 1,898,575 6.2 Treasury stock (390,510) (1.4) (840,742) (2.7)
Total noncurrent assets 2,013,302 7.2 2,713,854 8.8 Excess value of marketable securities 74,776 0.3 33,571 0.1
Other equity 1,339,528 4.8 (10,920) (0.0)
Total net worth 13,021,142 46.2 14,776,248 48.0
Total assets $ 28,156,016 100.0 % $ 30,815,181 100.0 % Total liabilities and net worth $ 28,156,016 100.0 % $ 30,815,181 100.0 %
Statement of Earnings Financial Ratios
2005 Participants 2004 Participants 2005 Participants 2004 Participants
Amount Percent Amount Percent Average Median Average Median
Contract revenue $ 67,354,076 99.1 % $ 66,255,641 95.3 % Liquidity Ratios
Other revenue 628,422 0.9 3,238,876 4.7
Total Revenue 67,982,498 100.0 69,494,517 100.0 Current Ratio 1.7 1.7 1.7 1.7
Quick Ratio 1.4 1.4 1.4 1.4
Contract cost (59,392,074) (87.4) (59,782,336) (86.0) Days of Cash 21.3 13.3 26.9 16.8
Other cost (493,988) (0.7) (2,909,160) (4.2) Working Capital Turnover 8.2 9.9 8.2 9.6
Total cost (59,886,063) (88.1) (62,691,496) (90.2)
Profitability Ratios
Gross Profit 8,096,435 11.9 6,803,021 9.8
Return on Assets * 8.3 % 7.8 % 6.8 % 5.9 %
Selling, general & administrative expenses: Return on Equity * 17.9 % 21.5 % 14.2 % 17.7 %
Payroll (2,582,729) (3.8) (2,878,802) (4.1) Times Interest Earned 8.9 9.8 11.2 11.1
Professional fees (188,761) (0.3) (193,329) (0.3)
Sales & marketing costs (128,961) (0.2) (75,288) (0.1) Leverage Ratios
Technology costs (150,826) (0.2) (152,530) (0.2)
Administrative bonuses (733,284) (1.1) (233,976) (0.3) Debt to Equity 1.2 1.4 1.1 1.2
Other (1,860,269) (2.7) (1,310,697) (1.9) Revenue to Equity 5.2 5.9 4.7 6.0
Total SG&A expenses (5,644,829) (8.3) (4,844,622) (7.0) Asset Turnover 2.4 2.6 2.3 2.4
Fixed Asset Ratio 52.2 % 58.8 % 50.3 % 49.6 %
Income from operations 2,451,606 3.6 1,958,399 2.8 Equity to SG&A Expense 2.3 2.4 3.1 3.0
Underbillings to Equity 15.3 % 9.0 % 9.9 % 5.0 %
Interest income 140,830 0.2 83,581 0.1 Backlog to Equity 5.6 4.3 4.3 3.7
Interest expense (295,674) (0.4) (206,168) (0.3)Other income / (expense), net 38,184 0.1 264,883 0.4
Efficiency Ratios
Net earnings / (loss) before income taxes 2,334,946 3.4 2,100,695 3.0
Backlog to Working Capital 8.5 6.0 7.4 6.8
Income tax (expense) / benefit (303,814) (0.4) (160,038) (0.2) Months in Backlog 9.5 7.3 8.9 7.7
Days in Accounts Receivable 40.7 36.4 41.7 39.3
Net earnings $ 2,031,132 3.0 % $ 1,940,657 2.8 % Days in Inventory 3.8 5.2 6.5 5.4
Days in Accounts Payable 24.5 23.6 28.5 25.0
Operating Cycle 41.4 40.3 46.7 50.4
Number of ParticipantsNumber
2005 282004 28
Heavy & Highway Contractors
Note: Not all figures will apear to sum due to rounding.
* In theCFMA's 2005 Annual Financial Study, Returnon Assets(ROA) and Return on Equity (ROE) arecalculated using
net earnings (loss) before income taxes. Studies conducted in prior years used net earnings (loss) after taxes to
calculate ROA and ROE. All references to ROAs and ROEs from prior studies have been updated to reflect this change.
Heavy & Highway Contractors$50 - $100 Million Revenue
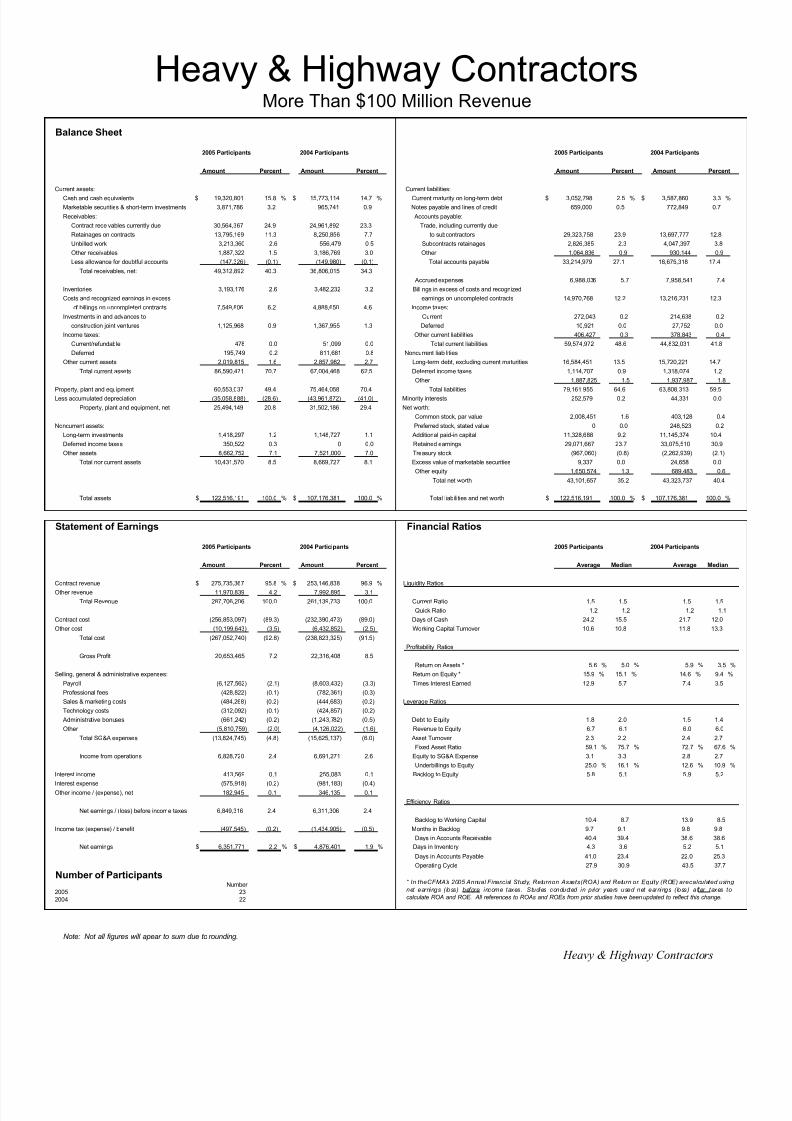
8/13/2019 2005 Financial Survey
http://slidepdf.com/reader/full/2005-financial-survey 177/284
Balance Sheet
2005 Participants 2004 Participants 2005 Participants 2004 Participants
Amount Percent Amount Percent Amount Percent Amount Percent
Current assets: Current liabilities:
Cash and cash equivalents $ 19,320,801 15.8 % $ 15,773,114 14.7 % Current maturity on long-term debt $ 3,052,798 2.5 % $ 3,587,860 3.3 %
Marketable securities & short-term investments 3,871,786 3.2 965,741 0.9 Notes payable and lines of credit 659,000 0.5 772,849 0.7
Receivables: Accounts payable:
Contract receivables currently due 30,564,367 24.9 24,961,892 23.3 Trade, including currently due
Retainages on contracts 13,795,169 11.3 8,250,856 7.7 to subcontractors 29,323,758 23.9 13,697,777 12.8
Unbilled work 3,213,360 2.6 556,479 0.5 Subcontracts retainages 2,826,385 2.3 4,047,397 3.8
Other receivables 1,887,322 1.5 3,186,769 3.0 Other 1,064,836 0.9 930,144 0.9
Less allowance for doubtful accounts (147,326) (0.1) (149,980) (0.1) Total accounts payable 33,214,979 27.1 18,675,318 17.4
Total receivables, net: 49,312,892 40.3 36,806,015 34.3
Accrued expenses 6,988,036 5.7 7,958,541 7.4
Inventories 3,193,176 2.6 3,482,232 3.2 Billings in excess of costs and recognized
Costs and recognized earnings in excess earnings on uncompleted contracts 14,970,768 12.2 13,216,231 12.3
of billings on uncompleted contracts 7,549,806 6.2 4,888,650 4.6 Income taxes:
Investments in and advances to Current 272,043 0.2 214,638 0.2
construction joint ventures 1,125,968 0.9 1,367,955 1.3 Deferred 10,921 0.0 27,752 0.0
Income taxes: Other current liabilities 406,427 0.3 378,843 0.4
Current/refundable 478 0.0 51,099 0.0 Total current liabilities 59,574,972 48.6 44,832,031 41.8
Deferred 195,749 0.2 811,681 0.8 Noncurrent liabilities
Other current assets 2,019,815 1.6 2,857,982 2.7 Long-term debt, excluding current maturities 16,584,451 13.5 15,720,221 14.7
Total current assets 86,590,471 70.7 67,004,468 62.5 Deferred income taxes 1,114,707 0.9 1,318,074 1.2
Other 1,887,825 1.5 1,937,987 1.8
Property, plant and equipment 60,553,037 49.4 75,464,058 70.4 Total liabilities 79,161,955 64.6 63,808,313 59.5
Less accumulated depreciation (35,058,888) (28.6) (43,961,872) (41.0) Minority interests 252,579 0.2 44,331 0.0
Property, plant and equipment, net 25,494,149 20.8 31,502,186 29.4 Net worth:
Common stock, par value 2,008,451 1.6 403,128 0.4
Noncurrent assets: Preferred stock, stated value 0 0.0 248,523 0.2
Long-term investments 1,418,297 1.2 1,148,727 1.1 Additional paid-in capital 11,328,688 9.2 11,145,374 10.4
Deferred income taxes 350,522 0.3 0 0.0 Retained earnings 29,071,667 23.7 33,075,510 30.9
Other assets 8,662,752 7.1 7,521,000 7.0 Treasury stock (967,060) (0.8) (2,262,939) (2.1)
Total noncurrent assets 10,431,570 8.5 8,669,727 8.1 Excess value of marketable securities 9,337 0.0 24,658 0.0
Other equity 1,650,574 1.3 689,483 0.6
Total net worth 43,101,657 35.2 43,323,737 40.4
Total assets $ 122,516,191 100.0 % $ 107,176,381 100.0 % Total liabilities and net worth $ 122,516,191 100.0 % $ 107,176,381 100.0 %
Statement of Earnings Financial Ratios
2005 Participants 2004 Participants 2005 Participants 2004 Participants
Amount Percent Amount Percent Average Median Average Median
Contract revenue $ 275,735,367 95.8 % $ 253,146,838 96.9 % Liquidity Ratios
Other revenue 11,970,839 4.2 7,992,895 3.1
Total Revenue 287,706,206 100.0 261,139,733 100.0 Current Ratio 1.5 1.5 1.5 1.5
Quick Ratio 1.2 1.2 1.2 1.1
Contract cost (256,853,097) (89.3) (232,390,473) (89.0) Days of Cash 24.2 15.5 21.7 12.0
Other cost (10,199,643) (3.5) (6,432,852) (2.5) Working Capital Turnover 10.6 10.8 11.8 13.3
Total cost (267,052,740) (92.8) (238,823,325) (91.5)
Profitability Ratios
Gross Profit 20,653,465 7.2 22,316,408 8.5
Return on Assets * 5.6 % 5.0 % 5.9 % 3.5 %
Selling, general & administrative expenses: Return on Equity * 15.9 % 15.1 % 14.6 % 9.4 %
Payroll (6,127,562) (2.1) (8,603,432) (3.3) Times Interest Earned 12.9 5.7 7.4 3.5
Professional fees (428,822) (0.1) (782,361) (0.3)
Sales & marketing costs (484,268) (0.2) (444,683) (0.2) Leverage Ratios
Technology costs (312,092) (0.1) (424,857) (0.2)
Administrative bonuses (661,242) (0.2) (1,243,782) (0.5) Debt to Equity 1.8 2.0 1.5 1.4
Other (5,810,759) (2.0) (4,126,022) (1.6) Revenue to Equity 6.7 6.1 6.0 6.0
Total SG&A expenses (13,824,745) (4.8) (15,625,137) (6.0) Asset Turnover 2.3 2.2 2.4 2.7
Fixed Asset Ratio 59.1 % 75.7 % 72.7 % 67.6 %
Income from operations 6,828,720 2.4 6,691,271 2.6 Equity to SG&A Expense 3.1 3.3 2.8 2.7
Underbillings to Equity 25.0 % 16.1 % 12.6 % 10.9 %
Interest income 413,569 0.1 255,083 0.1 Backlog to Equity 5.8 5.1 5.9 5.2
Interest expense (575,918) (0.2) (981,183) (0.4)Other income / (expense), net 182,945 0.1 346,135 0.1
Efficiency Ratios
Net earnings / (loss) before income taxes 6,849,316 2.4 6,311,306 2.4
Backlog to Working Capital 10.4 8.7 13.9 8.5
Income tax (expense) / benefit (497,545) (0.2) (1,434,905) (0.5) Months in Backlog 9.7 9.1 9.8 9.8
Days in Accounts Receivable 40.4 39.4 38.6 38.6
Net earnings $ 6,351,771 2.2 % $ 4,876,401 1.9 % Days in Inventory 4.3 3.6 5.2 5.1
Days in Accounts Payable 41.0 23.4 22.0 25.3
Operating Cycle 27.9 30.9 43.5 37.7
Number of ParticipantsNumber
2005 232004 22
Note: Not all figures will apear to sum due to rounding.
* In theCFMA's 2005 Annual Financial Study, Returnon Assets(ROA) and Return on Equity (ROE) arecalculated using
net earnings (loss) before income taxes. Studies conducted in prior years used net earnings (loss) after taxes to
calculate ROA and ROE. All references to ROAs and ROEs from prior studies have been updated to reflect this change.
More Than $100 Million Revenue
Heavy & Highway Contractors
Heavy & Highway Contractors

8/13/2019 2005 Financial Survey
http://slidepdf.com/reader/full/2005-financial-survey 178/284
Heavy & Highway Contractors
Selected Financial Data by Revenue — Best in Class Contractors
Best in Best in
All Heavy & Best in All Class All Class
Highway Class 0- 50M 0- 50M > 50M > 50M
Number of Companies 106 22 55 17 51 5
Assets ( ) 40,582 14,976 12,646 10,198 70,711 31,219
Liabilities ( ) 24,830 7,797 7,046 5,735 44,010 14,806
Net Worth ( ) 15,697 7,179 5,600 4,463 26,587 16,413
Net Worth to Assets 38.7 % 47.9 % 44.3 % 43.8 % 37.6 % 52.6 %
Revenues ( ) 93,669 41,055 25,602 29,338 167,074 80,894
Gross Profit ( ) 8,282 5,039 3,202 3,852 13,759 9,076
Gross Profit Margin 8.8 % 12.3 % 12.5 % 13.1 % 8.2 % 11.2 %
SG&A Expense ( ) 5,610 2,765 2,156 2,076 9,334 5,107
SG&A Expense Margin 6.0 % 6.7 % 8.4 % 7.1 % 5.6 % 6.3 %
Net Earnings ( ) * 2,643 2,353 1,040 1,799 4,371 4,238
Net Earnings Margin * 2.8 % 5.7 % 4.1 % 6.1 % 2.6 % 5.2 %
Current Ratio 1.5 1.5 1.5 1.5 1.5 1.4Return on Assets 6.5 % 15.7 % 8.2 % 17.6 % 6.2 % 13.6 %
Return on Equity 16.8 % 32.8 % 18.6 % 40.3 % 16.4 % 25.8 %
* Before Taxes
ANNUAL REVENUE
Note: All dollar amounts are in thousands.
BEST IN CLASS KEY FINANCIAL CHARACTERISTICS
HEAVY & HIGHWAY
6 . 5
1 . 6
1 . 1 9
. 9
6 0 . 4
1 6 . 8
1 5 . 7
1 3 . 1
5 5
3 2 . 8
0
25
50
75
Return on
Assets (%)
Return on
Equity (%)
Fixed Asset
Ratio (%)
Debt To
Equity
Working
Capital
Turnover
All Heavy & Highway Companies Best in Class Heavy & Highway
• Return on Assets: Best in Class Heavy & Highway companies had an average ROA of
15.7% — 9.2 percentage points higher than the typical company. Best in Class Heavy &Highway companies use their assets more effectively and efficiently to generate profits.
• Return on Equity: Best in Class Heavy & Highway companies had an average ROE of32.8% — 16.0 percentage points higher than the typical Heavy & Highway company. Best inClass Heavy & Highway companies utilize equity more effectively to generate profits.
8/13/2019 2005 Financial Survey
http://slidepdf.com/reader/full/2005-financial-survey 179/284
Heavy & Highway Contractors
• Fixed Asset Ratio: Best in Class Heavy & Highway companies had an average Fixed AssetRatio of 55.0 — 5.4 percentage points lower than the typical Heavy & Highway company.Best in Class Heavy & Highway companies use less equity to finance the purchase of fixedassets than the typical Heavy & Highway company and have superior liquidity.
• Debt to Equity: Best in Class Heavy & Highway companies had an average Debt to Equity
ratio of 1.1 — 0.5 lower than the typical Heavy & Highway company. Best in Class Heavy &Highway companies are taking slightly less financial risk to generate superior financial performance as compared to the typical Heavy & Highway company.
• Working Capital Turnover: Best in Class Heavy & Highway companies turned over theirworking capital an average of 13.1 times — 3.2 times more than the typical Heavy &Highway company. This indicates that for every dollar of working capital, the Best in ClassHeavy & Highway companies generate $3.20 more in sales, which indicates either a morestrategic pursuit of projects and/or better sales and marketing.
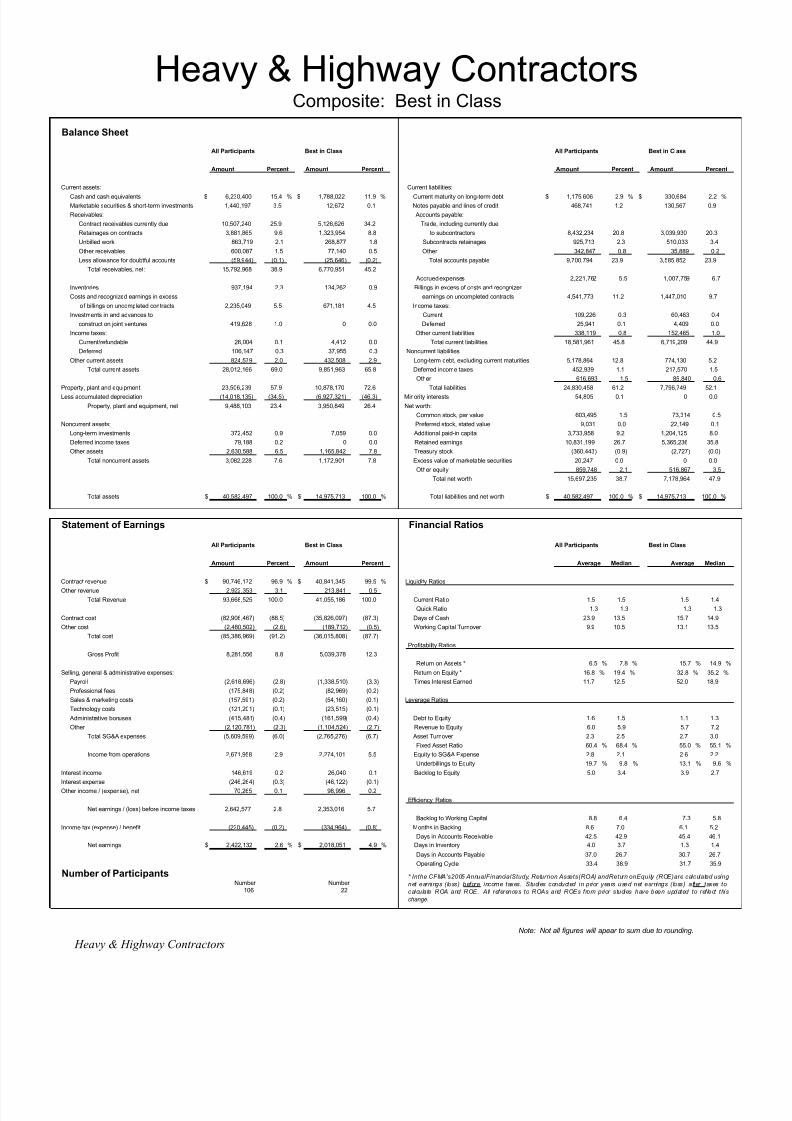
8/13/2019 2005 Financial Survey
http://slidepdf.com/reader/full/2005-financial-survey 180/284
Balance Sheet
All Participants Best in Class All Participants Best in Class
Amount Percent Amount Percent Amount Percent Amount Percent
Current assets: Current liabilities:
Cash and cash equivalents $ 6,230,400 15.4 % $ 1,788,022 11.9 % Current maturity on long-term debt $ 1,175,606 2.9 % $ 330,684 2.2 %Marketable securities & short-term investments 1,440,197 3.5 12,672 0.1 Notes payable and lines of credit 468,741 1.2 130,567 0.9
Receivables: Accounts payable:
Contract receivables currently due 10,507,240 25.9 5,126,626 34.2 Trade, including currently due
Retainages on contracts 3,881,865 9.6 1,323,954 8.8 to subcontractors 8,432,234 20.8 3,039,930 20.3
Unbilled work 863,719 2.1 268,877 1.8 Subcontracts retainages 925,713 2.3 510,033 3.4
Other receivables 600,087 1.5 77,140 0.5 Other 342,847 0.8 35,889 0.2
Less allowance for doubtful accounts (59,944) (0.1) (25,646) (0.2) Total accounts payable 9,700,794 23.9 3,585,852 23.9
Total receivables, net: 15,792,968 38.9 6,770,951 45.2
Accrued expenses 2,221,762 5.5 1,007,759 6.7
Inventories 937,194 2.3 134,262 0.9 Billings in excess of costs and recognized
Costs and recognized earnings in excess earnings on uncompleted contracts 4,541,773 11.2 1,447,010 9.7
of billings on uncompleted contracts 2,235,049 5.5 671,181 4.5 Income taxes:
Investments in and advances to Current 109,226 0.3 60,463 0.4
construction joint ventures 419,628 1.0 0 0.0 Deferred 25,941 0.1 4,409 0.0
Income taxes: Other current liabilities 338,119 0.8 152,465 1.0
Current/refundable 26,004 0.1 4,412 0.0 Total current liabilities 18,581,961 45.8 6,719,209 44.9
Deferred 106,147 0.3 37,955 0.3 Noncurrent liabilities
Other current assets 824,579 2.0 432,508 2.9 Long-term debt, excluding current maturities 5,178,864 12.8 774,130 5.2
Total current assets 28,012,166 69.0 9,851,963 65.8 Deferred income taxes 452,939 1.1 217,570 1.5
Other 616,693 1.5 85,840 0.6
Property, plant and equipment 23,506,239 57.9 10,878,170 72.6 Total liabilities 24,830,458 61.2 7,796,749 52.1
Less accumulated depreciation (14,018,135) (34.5) (6,927,321) (46.3) Minority interests 54,805 0.1 0 0.0
Property, plant and equipment, net 9,488,103 23.4 3,950,849 26.4 Net worth:
Common stock, par value 603,495 1.5 73,314 0.5
Noncurrent assets: Preferred stock, stated value 9,031 0.0 22,149 0.1
Long-term investments 372,452 0.9 7,059 0.0 Additional paid-in capital 3,733,958 9.2 1,204,125 8.0
Deferred income taxes 79,188 0.2 0 0.0 Retained earnings 10,831,199 26.7 5,365,236 35.8
Other assets 2,630,588 6.5 1,165,842 7.8 Treasury stock (360,443) (0.9) (2,727) (0.0)
Total noncurrent assets 3,082,228 7.6 1,172,901 7.8 Excess value of marketable securities 20,247 0.0 0 0.0
Other equity 859,748 2.1 516,867 3.5
Total net worth 15,697,235 38.7 7,178,964 47.9
Total assets $ 40,582,497 100.0 % $ 14,975,713 100.0 % Total liabilities and net worth $ 40,582,497 100.0 % $ 14,975,713 100.0 %
Statement of Earnings Financial Ratios
All Participants Best in Class All Participants Best in Class
Amount Percent Amount Percent Average Median Average Median
Contract revenue $ 90,746,172 96.9 % $ 40,841,345 99.5 % Liquidity Ratios
Other revenue 2,922,353 3.1 213,841 0.5
Total Revenue 93,668,525 100.0 41,055,186 100.0 Current Ratio 1.5 1.5 1.5 1.4
Quick Ratio 1.3 1.3 1.3 1.3
Contract cost (82,906,467) (88.5) (35,826,097) (87.3) Days of Cash 23.9 13.5 15.7 14.9
Other cost (2,480,502) (2.6) (189,712) (0.5) Working Capital Turnover 9.9 10.5 13.1 13.5
Total cost (85,386,969) (91.2) (36,015,808) (87.7)
Profitability Ratios
Gross Profit 8,281,556 8.8 5,039,378 12.3
Return on Assets * 6.5 % 7.8 % 15.7 % 14.9 %
Selling, general & administrative expenses: Return on Equity * 16.8 % 19.4 % 32.8 % 35.2 %
Payroll (2,618,696) (2.8) (1,338,510) (3.3) Times Interest Earned 11.7 12.5 52.0 18.9
Professional fees (175,848) (0.2) (82,969) (0.2)
Sales & marketing costs (157,591) (0.2) (54,160) (0.1) Leverage Ratios
Technology costs (121,201) (0.1) (23,515) (0.1)
Administrative bonuses (415,481) (0.4) (161,599) (0.4) Debt to Equity 1.6 1.5 1.1 1.3
Other (2,120,781) (2.3) (1,104,524) (2.7) Revenue to Equity 6.0 5.9 5.7 7.2
Total SG&A expenses (5,609,599) (6.0) (2,765,276) (6.7) Asset Turnover 2.3 2.5 2.7 3.0
Fixed Asset Ratio 60.4 % 68.4 % 55.0 % 55.1 %
Income from operations 2,671,958 2.9 2,274,101 5.5 Equity to SG&A Expense 2.8 2.1 2.6 2.2
Underbillings to Equity 19.7 % 9.8 % 13.1 % 9.6 %
Interest income 146,619 0.2 26,040 0.1 Backlog to Equity 5.0 3.4 3.9 2.7
Interest expense (246,264) (0.3) (46,122) (0.1)
Other income / (expense), net 70,265 0.1 98,996 0.2
Efficiency Ratios
Net earnings / (loss) before income taxes 2,642,577 2.8 2,353,016 5.7
Backlog to Working Capital 8.8 6.4 7.3 5.8
Income tax (expense) / benefit (220,445) (0.2) (334,964) (0.8) Months in Backlog 8.6 7.0 6.1 5.2
Days in Accounts Receivable 42.5 42.9 45.4 46.1
Net earnings $ 2,422,132 2.6 % $ 2,018,051 4.9 % Days in Inventory 4.0 3.7 1.3 1.4
Days in Accounts Payable 37.0 26.7 30.7 26.7
Operating Cycle 33.4 38.9 31.7 35.9
Number of ParticipantsNumber Number
106 22
Heavy & Highway Contractors
Note: Not all figures will apear to sum due to rounding.
Heavy & Highway ContractorsComposite: Best in Class
* Inthe CFMA's2005 AnnualFinancialStudy, Returnon Assets(ROA) andReturn onEquity (ROE)are calculated using
net earnings (loss) before income taxes. Studies conducted in prior years used net earnings (loss) after taxes to
calculate ROA and ROE. All references to ROAs and ROEs from prior studies have been updated to ref lect this
change.
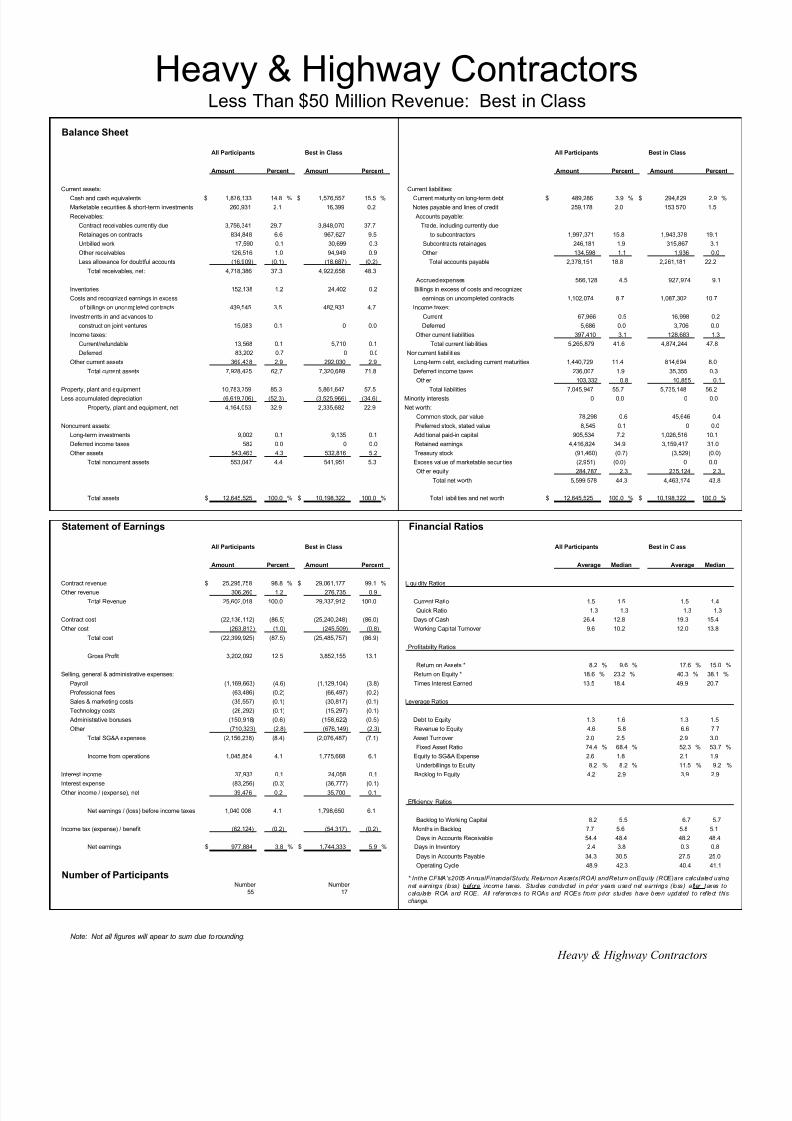
8/13/2019 2005 Financial Survey
http://slidepdf.com/reader/full/2005-financial-survey 181/284
Balance Sheet
All Participants Best in Class All Participants Best in Class
Amount Percent Amount Percent Amount Percent Amount Percent
Current assets: Current liabilities:
Cash and cash equivalents $ 1,876,133 14.8 % $ 1,576,557 15.5 % Current maturity on long-term debt $ 489,286 3.9 % $ 294,829 2.9 %
Marketable securities & short-term investments 260,931 2.1 16,399 0.2 Notes payable and lines of credit 259,178 2.0 153,570 1.5
Receivables: Accounts payable:
Contract receivables currently due 3,756,341 29.7 3,848,070 37.7 Trade, including currently due
Retainages on contracts 834,848 6.6 967,627 9.5 to subcontractors 1,997,371 15.8 1,943,378 19.1
Unbilled work 17,590 0.1 30,699 0.3 Subcontracts retainages 246,181 1.9 315,867 3.1
Other receivables 126,516 1.0 94,949 0.9 Other 134,598 1.1 1,936 0.0
Less allowance for doubtful accounts (16,909) (0.1) (18,687) (0.2) Total accounts payable 2,378,151 18.8 2,261,181 22.2
Total receivables, net: 4,718,386 37.3 4,922,658 48.3
Accrued expenses 566,128 4.5 927,974 9.1
Inventories 152,138 1.2 24,402 0.2 Billings in excess of costs and recognized
Costs and recognized earnings in excess earnings on uncompleted contracts 1,102,074 8.7 1,087,302 10.7
of billings on uncompleted contracts 439,545 3.5 482,933 4.7 Income taxes:
Investments in and advances to Current 67,966 0.5 16,998 0.2
construction joint ventures 15,083 0.1 0 0.0 Deferred 5,686 0.0 3,706 0.0
Income taxes: Other current liabilities 397,410 3.1 128,683 1.3
Current/refundable 13,568 0.1 5,710 0.1 Total current liabilities 5,265,879 41.6 4,874,244 47.8
Deferred 83,202 0.7 0 0.0 Noncurrent liabilities
Other current assets 369,438 2.9 292,030 2.9 Long-term debt, excluding current maturities 1,440,729 11.4 814,694 8.0
Total current assets 7,928,425 62.7 7,320,689 71.8 Deferred income taxes 236,007 1.9 35,355 0.3
Other 103,332 0.8 10,855 0.1
Property, plant and equipment 10,783,759 85.3 5,861,647 57.5 Total liabilities 7,045,947 55.7 5,735,148 56.2
Less accumulated depreciation (6,619,706) (52.3) (3,525,966) (34.6) Minority interests 0 0.0 0 0.0
Property, plant and equipment, net 4,164,053 32.9 2,335,682 22.9 Net worth:
Common stock, par value 78,298 0.6 45,646 0.4
Noncurrent assets: Preferred stock, stated value 8,545 0.1 0 0.0
Long-term investments 9,002 0.1 9,135 0.1 Additional paid-in capital 905,534 7.2 1,026,516 10.1
Deferred income taxes 582 0.0 0 0.0 Retained earnings 4,416,824 34.9 3,159,417 31.0
Other assets 543,463 4.3 532,816 5.2 Treasury stock (91,460) (0.7) (3,529) (0.0)
Total noncurrent assets 553,047 4.4 541,951 5.3 Excess value of marketable securities (2,951) (0.0) 0 0.0
Other equity 284,787 2.3 235,124 2.3
Total net worth 5,599,578 44.3 4,463,174 43.8
Total assets $ 12,645,525 100.0 % $ 10,198,322 100.0 % Total liabilities and net worth $ 12,645,525 100.0 % $ 10,198,322 100.0 %
Statement of Earnings Financial Ratios
All Participants Best in Class All Participants Best in Class
Amount Percent Amount Percent Average Median Average Median
Contract revenue $ 25,295,758 98.8 % $ 29,061,177 99.1 % Liquidity Ratios
Other revenue 306,260 1.2 276,735 0.9
Total Revenue 25,602,018 100.0 29,337,912 100.0 Current Ratio 1.5 1.5 1.5 1.4
Quick Ratio 1.3 1.3 1.3 1.3
Contract cost (22,136,112) (86.5) (25,240,248) (86.0) Days of Cash 26.4 12.8 19.3 15.4
Other cost (263,813) (1.0) (245,509) (0.8) Working Capital Turnover 9.6 10.2 12.0 13.8
Total cost (22,399,925) (87.5) (25,485,757) (86.9)
Profitability Ratios
Gross Profit 3,202,092 12.5 3,852,155 13.1
Return on Assets * 8.2 % 9.6 % 17.6 % 15.0 %
Selling, general & administrative expenses: Return on Equity * 18.6 % 23.2 % 40.3 % 38.1 %
Payroll (1,169,663) (4.6) (1,129,104) (3.8) Times Interest Earned 13.5 18.4 49.9 20.7
Professional fees (63,486) (0.2) (66,497) (0.2)
Sales & marketing costs (35,557) (0.1) (30,817) (0.1) Leverage Ratios
Technology costs (26,292) (0.1) (15,297) (0.1)
Administrative bonuses (150,918) (0.6) (158,622) (0.5) Debt to Equity 1.3 1.6 1.3 1.5
Other (710,323) (2.8) (676,149) (2.3) Revenue to Equity 4.6 5.8 6.6 7.7
Total SG&A expenses (2,156,238) (8.4) (2,076,487) (7.1) Asset Turnover 2.0 2.5 2.9 3.0
Fixed Asset Ratio 74.4 % 68.4 % 52.3 % 53.7 %
Income from operations 1,045,854 4.1 1,775,668 6.1 Equity to SG&A Expense 2.6 1.8 2.1 1.9
Underbillings to Equity 8.2 % 8.2 % 11.5 % 9.2 %
Interest income 37,933 0.1 24,058 0.1 Backlog to Equity 4.2 2.9 3.9 2.9
Interest expense (83,256) (0.3) (36,777) (0.1)Other income / (expense), net 39,476 0.2 35,700 0.1
Efficiency Ratios
Net earnings / (loss) before income taxes 1,040,008 4.1 1,798,650 6.1
Backlog to Working Capital 8.2 5.5 6.7 5.7
Income tax (expense) / benefit (62,124) (0.2) (54,317) (0.2) Months in Backlog 7.7 5.6 5.8 5.1
Days in Accounts Receivable 54.4 48.4 48.2 48.4
Net earnings $ 977,884 3.8 % $ 1,744,333 5.9 % Days in Inventory 2.4 3.8 0.3 0.8
Days in Accounts Payable 34.3 30.5 27.5 25.0
Operating Cycle 48.9 42.3 40.4 41.1
Number of ParticipantsNumber Number
55 17
Note: Not all figures will apear to sum due to rounding.
* Inthe CFMA's2005 AnnualFinancialStudy, Returnon Assets(ROA) andReturn onEquity (ROE)are calculated using
net earnings (loss) before income taxes. Studies conducted in prior years used net earnings (loss) after taxes to
calculate ROA and ROE. All references to ROAs and ROEs from prior studies have been updated to ref lect this
change.
Heavy & Highway Contractors
Heavy & Highway ContractorsLess Than $50 Million Revenue: Best in Class

8/13/2019 2005 Financial Survey
http://slidepdf.com/reader/full/2005-financial-survey 182/284
Balance Sheet
All Participants Best in Class All Participants Best in Class
Amount Percent Amount Percent Amount Percent Amount Percent
Current assets: Current liabilities:
Cash and cash equivalents $ 10,926,177 15.5 % $ 2,507,002 8.0 % Current maturity on long-term debt $ 1,915,755 2.7 % $ 452,589 1.4 %
Marketable securities & short-term investments 2,711,953 3.8 0 0.0 Notes payable and lines of credit 694,741 1.0 52,358 0.2
Receivables: Accounts payable:
Contract receivables currently due 17,787,621 25.2 9,473,719 30.3 Trade, including currently due
Retainages on contracts 7,167,864 10.1 2,535,468 8.1 to subcontractors 15,371,791 21.7 6,768,209 21.7
Unbilled work 1,776,211 2.5 1,078,682 3.5 Subcontracts retainages 1,658,542 2.3 1,170,197 3.7
Other receivables 1,110,801 1.6 16,589 0.1 Other 567,429 0.8 151,327 0.5
Less allowance for doubtful accounts (106,353) (0.2) (49,309) (0.2) Total accounts payable 17,597,763 24.9 8,089,734 25.9
Total receivables, net: 27,736,144 39.2 13,055,149 41.8
Accrued expenses 4,007,250 5.7 1,279,025 4.1
Inventories 1,783,823 2.5 507,786 1.6 Billings in excess of costs and recognized
Costs and recognized earnings in excess earnings on uncompleted contracts 8,251,251 11.7 2,670,020 8.6
of billings on uncompleted contracts 4,171,375 5.9 1,311,224 4.2 Income taxes:
Investments in and advances to Current 153,722 0.2 208,241 0.7
construction joint ventures 855,902 1.2 0 0.0 Deferred 47,784 0.1 6,800 0.0
Income taxes: Other current liabilities 274,177 0.4 233,323 0.7
Current/refundable 39,416 0.1 0 0.0 Total current liabilities 32,942,442 46.6 12,992,089 41.6
Deferred 130,893 0.2 167,000 0.5 Noncurrent liabilities
Other current assets 1,315,418 1.9 910,133 2.9 Long-term debt, excluding current maturities 9,210,187 13.0 636,212 2.0
Total current assets 49,671,102 70.2 18,458,293 59.1 Deferred income taxes 686,884 1.0 837,100 2.7
Other 1,170,318 1.7 340,790 1.1
Property, plant and equipment 37,226,560 52.6 27,934,346 89.5 Total liabilities 44,009,832 62.2 14,806,192 47.4
Less accumulated depreciation (21,996,833) (31.1) (18,491,927) (59.2) Minority interests 113,908 0.2 0 0.0
Property, plant and equipment, net 15,229,727 21.5 9,442,419 30.2 Net worth:
Common stock, par value 1,169,884 1.7 167,388 0.5
Noncurrent assets: Preferred stock, stated value 9,555 0.0 97,456 0.3
Long-term investments 764,408 1.1 0 0.0 Additional paid-in capital 6,784,218 9.6 1,807,993 5.8
Deferred income taxes 163,959 0.2 0 0.0 Retained earnings 17,748,663 25.1 12,865,020 41.2
Other assets 4,881,410 6.9 3,318,131 10.6 Treasury stock (650,522) (0.9) 0 0.0
Total noncurrent assets 5,809,776 8.2 3,318,131 10.6 Excess value of marketable securities 45,264 0.1 0 0.0
Other equity 1,479,803 2.1 1,474,794 4.7
Total net worth 26,586,864 37.6 16,412,651 52.6
Total assets $ 70,710,605 100.0 % $ 31,218,843 100.0 % Total liabilities and net worth $ 70,710,605 100.0 % $ 31,218,843 100.0 %
Statement of Earnings Financial Ratios
All Participants Best in Class All Participants Best in Class
Amount Percent Amount Percent Average Median Average Median
Contract revenue $ 161,329,952 96.6 % $ 80,893,916 100.0 % Liquidity Ratios
Other revenue 5,743,629 3.4 0 0.0
Total Revenue 167,073,582 100.0 80,893,916 100.0 Current Ratio 1.5 1.6 1.4 1.4
Quick Ratio 1.3 1.3 1.2 1.2
Contract cost (148,443,124) (88.8) (71,817,983) (88.8) Days of Cash 23.5 14.4 11.2 14.4
Other cost (4,871,048) (2.9) 0 0.0 Working Capital Turnover 10.0 10.6 14.8 13.2
Total cost (153,314,172) (91.8) (71,817,983) (88.8)
Profitability Ratios
Gross Profit 13,759,409 8.2 9,075,934 11.2
Return on Assets * 6.2 % 6.3 % 13.6 % 14.3 %
Selling, general & administrative expenses: Return on Equity * 16.4 % 18.0 % 25.8 % 32.9 %
Payroll (4,181,379) (2.5) (2,050,488) (2.5) Times Interest Earned 11.4 8.1 55.4 14.6
Professional fees (297,024) (0.2) (138,971) (0.2)
Sales & marketing costs (289,198) (0.2) (133,527) (0.2) Leverage Ratios
Technology costs (223,554) (0.1) (51,454) (0.1)
Administrative bonuses (700,794) (0.4) (171,721) (0.2) Debt to Equity 1.7 1.5 0.9 0.8
Other (3,641,862) (2.2) (2,560,998) (3.2) Revenue to Equity 6.3 6.0 4.9 5.2
Total SG&A expenses (9,333,811) (5.6) (5,107,159) (6.3) Asset Turnover 2.4 2.4 2.6 3.2
Fixed Asset Ratio 57.3 % 68.3 % 57.5 % 56.5 %
Income from operations 4,425,599 2.6 3,968,774 4.9 Equity to SG&A Expense 2.8 2.8 3.2 3.4
Underbillings to Equity 22.4 % 13.7 % 14.6 % 11.9 %
Interest income 263,830 0.2 32,775 0.0 Backlog to Equity 5.7 4.3 3.8 2.5
Interest expense (422,058) (0.3) (77,894) (0.1)Other income / (expense), net 103,468 0.1 314,204 0.4
Efficiency Ratios
Net earnings / (loss) before income taxes 4,370,838 2.6 4,237,860 5.2
Backlog to Working Capital 9.4 8.0 9.2 11.2
Income tax (expense) / benefit (391,183) (0.2) (1,289,167) (1.6) Months in Backlog 9.6 8.2 7.1 6.6
Days in Accounts Receivable 40.5 37.1 42.0 37.6
Net earnings $ 3,979,656 2.4 % $ 2,948,694 3.6 % Days in Inventory 4.2 3.7 2.5 2.1
Days in Accounts Payable 37.4 23.4 34.7 34.0
Operating Cycle 30.8 36.5 21.0 29.7
Number of ParticipantsNumber Number
51 5
Heavy & Highway Contractors
Note: Not all figures will apear to sum due to rounding.
* Inthe CFMA's2005 AnnualFinancialStudy, Returnon Assets(ROA) andReturn onEquity (ROE)are calculated using
net earnings (loss) before income taxes. Studies conducted in prior years used net earnings (loss) after taxes to
calculate ROA and ROE. All references to ROAs and ROEs from prior studies have been updated to ref lect this
change.
Heavy & Highway ContractorsMore Than $50 Million Revenue: Best in Class

8/13/2019 2005 Financial Survey
http://slidepdf.com/reader/full/2005-financial-survey 183/284
C F M A ’s 2 0 0 5
Construction
Industry Annual
Financial Survey
SPECIALTY TRADE
CONTRACTORS

8/13/2019 2005 Financial Survey
http://slidepdf.com/reader/full/2005-financial-survey 184/284
Specialty Trade Contractors
General Profile
A total of 31% of this year’s participants were Specialty Trade contractors. Of those, over two-thirds(69%) participated in last year’s survey and 97% are CFMA members.
The following NAIC codes are represented in this classification:
23511 Plumbing, Heating and Air Conditioning Contractors23521 Painting and Wall Covering Contractors23531 Electrical Contractors23541 Masonry and Stone Contractors23542 Drywall, Plastering, Acoustical, and Insulation Contractors23543 Tile, Marble, Terrazzo, and Mosaic Contractors23551 Carpentry Contractors23552 Floor Laying and Other Floor Contractors23561 Roofing, Siding, and Sheet Metal Contractors23571 Concrete Contractors
23581 Water Well Drilling Contractors23591 Structural Steel Erection Contractors23592 Glass and Glazing Contractors23593 Excavation Contractors23594 Wrecking and Demolition Contractors23595 Building Equipment and Other Machinery Installation23599 All Other Special Trade Contractors56162 Security Systems Services (except Locksmiths)56291 Environmental Remediation Services
The trend towards incorporation as an S corporation continues within the Specialty Trade sector. Thisyear 62% of respondents in this classification were S corporations.
Specialty Trade contractors are almost exclusively privately owned companies.
Not surprisingly, and in contrast to the other classifications, Specialty Trade predominantly operate assubcontractors.
Consistent with prior years, nearly three-quarters of Specialty Trade revenues come from the privatesector.
Specialty Trade participants continue to be well represented in the Midwest region, however, there is stillsomewhat low representation in the West and Southwest again this year.
The majority of Specialty Trade contractors have been in business for more than 20 years.
For a complete breakdown of survey answers, please see Appendix A.
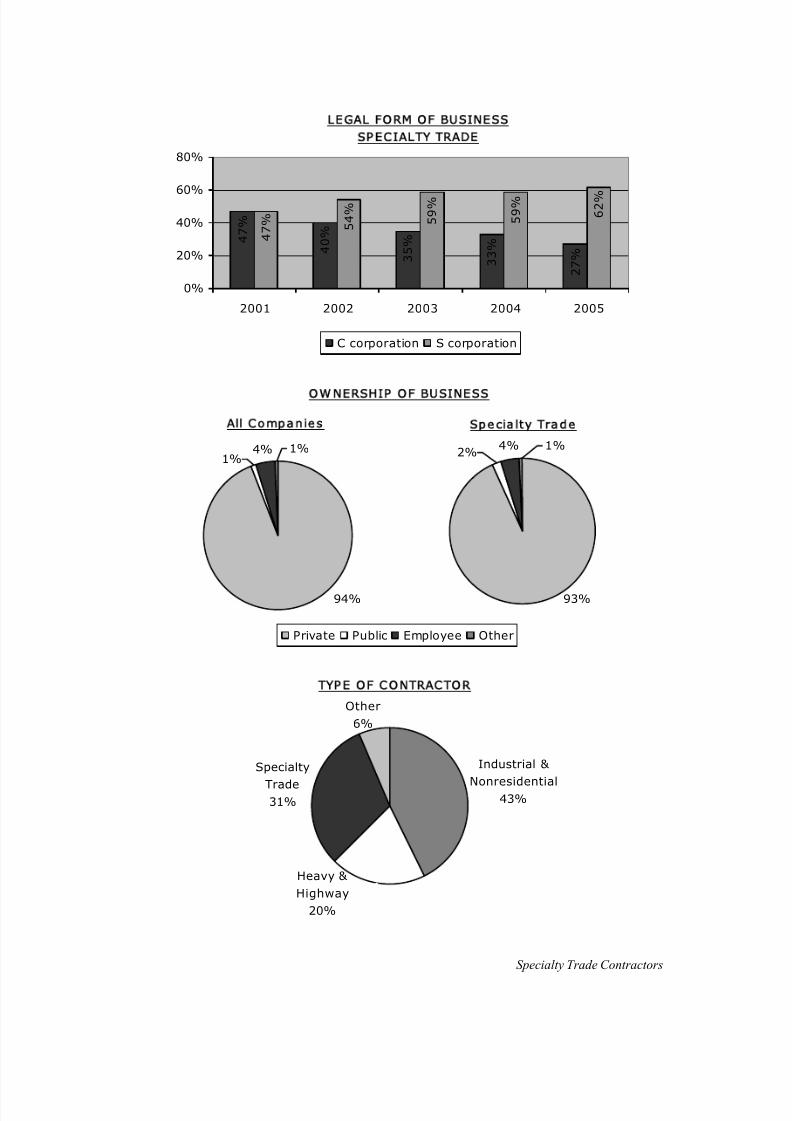
8/13/2019 2005 Financial Survey
http://slidepdf.com/reader/full/2005-financial-survey 185/284
Specialty Trade Contractors
L E G A L F O R M O F B U S I N E S S
SPEC I ALTY TR ADE
4 7 %
4 0 %
3 5 %
3 3 %
2 7 %
4 7 % 5
4 %
5 9 %
5 9 %
6 2 %
0%
20%
40%
60%
80%
2001 2002 2003 2004 2005
C corporation S corporation
OWNERSHIP OF BUSINESS
2%
93%
4% 1%
Private Public Employee Other
Specialty Trade
4% 1%1%
94%
All Companies
TYPE OF CONTRACTOR
Heavy &
Highway
20%
Industrial &
Nonresidential43%
Specialty
Trade31%
Other
6%
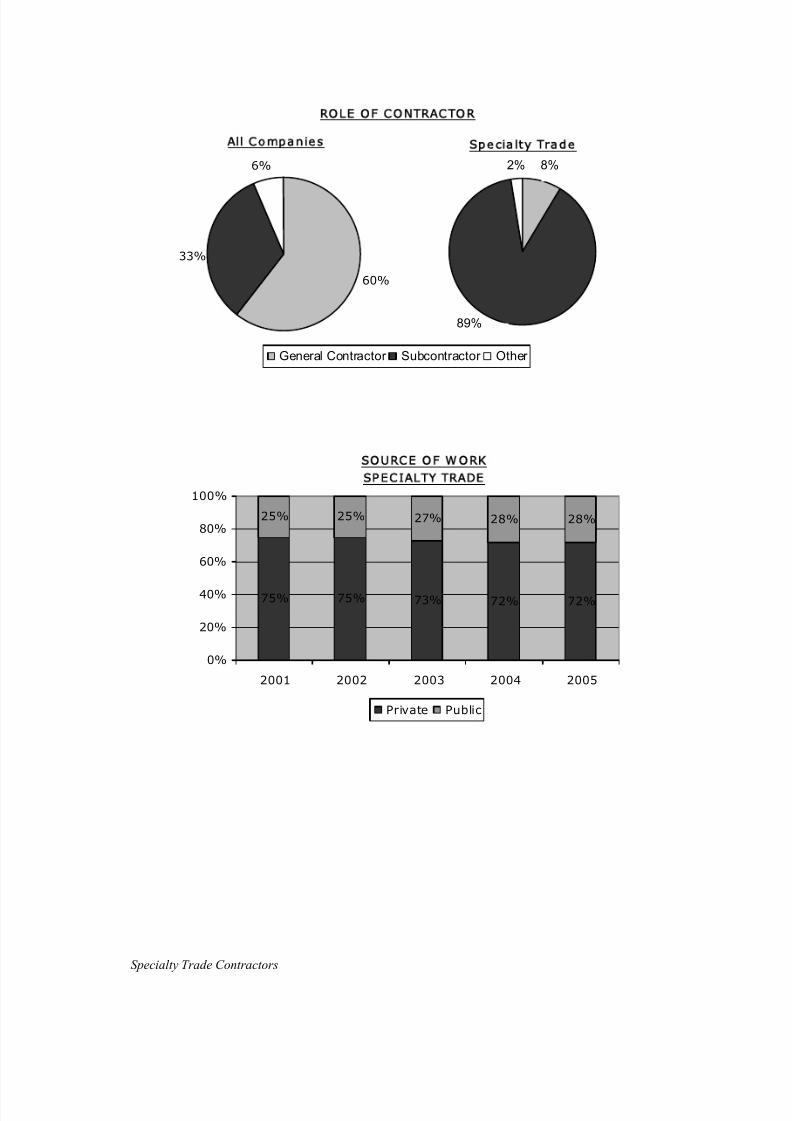
8/13/2019 2005 Financial Survey
http://slidepdf.com/reader/full/2005-financial-survey 186/284
Specialty Trade Contractors
ROLE OF CONTRACTOR
89%
8%2%
General Contractor Subcontractor Other
Specialty Trade
6%
33%
60%
All Companies
S O U RC E O F W O R K
SPEC I ALTY TR ADE
75% 75% 73% 72% 72%
25% 25% 27% 28% 28%
0%
20%
40%
60%
80%
100%
2001 2002 2003 2004 2005
Private Public
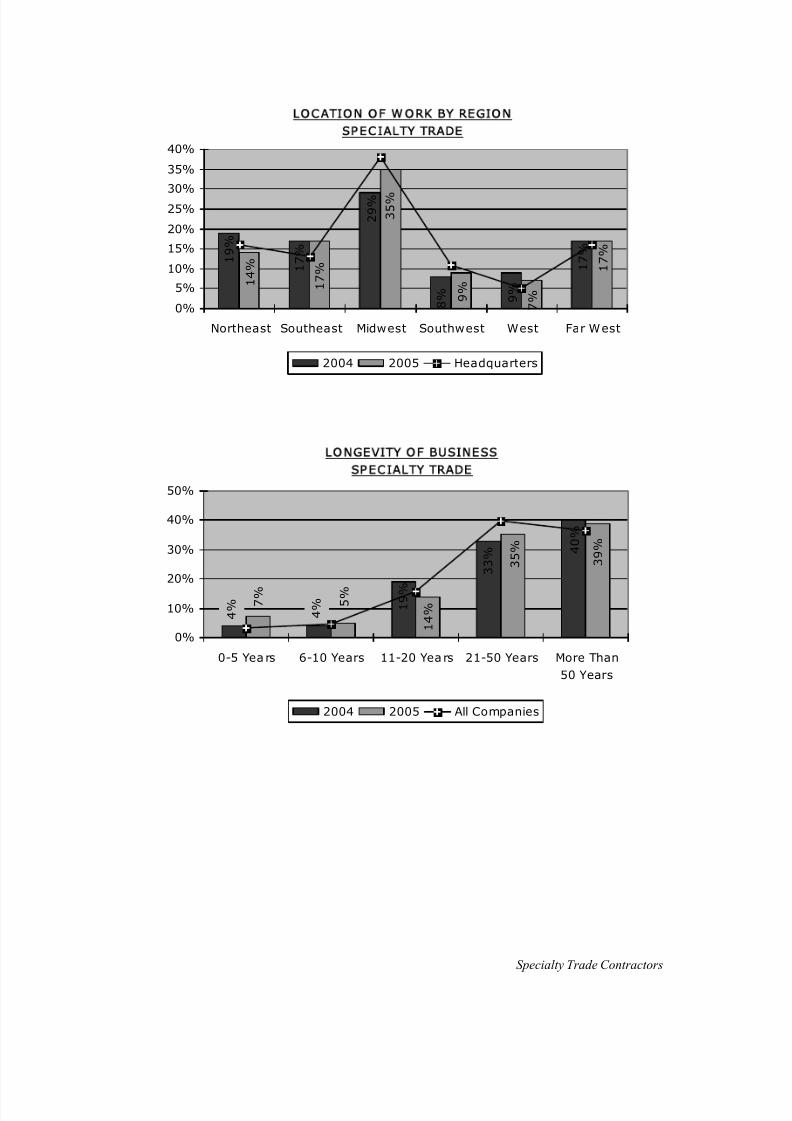
8/13/2019 2005 Financial Survey
http://slidepdf.com/reader/full/2005-financial-survey 187/284
Specialty Trade Contractors
LOC ATION OF W ORK BY REGION
SPECIALTY TRADE
1 9 %
1 7 %
2 9 %
8 % 9
%
1 7 %
1 4 %
1 7 %
3 5 %
9 %
7 %
1 7 %
0%
5%
10%
15%
20%
25%
30%
35%
40%
Northeast Southeast Midwest Southwest West Far West
2004 2005 Headquarters
LONGEVITY OF BUSINESS
SPECIALTY TRADE
4 0 %
3 3 %
1 9 %
4 %
4 %
3 9 %
3 5 %
1 4 %
5 % 7 %
0%
10%
20%
30%
40%
50%
0-5 Years 6-10 Years 11-20 Years 21-50 Years More Than
50 Years
2004 2005 All Companies
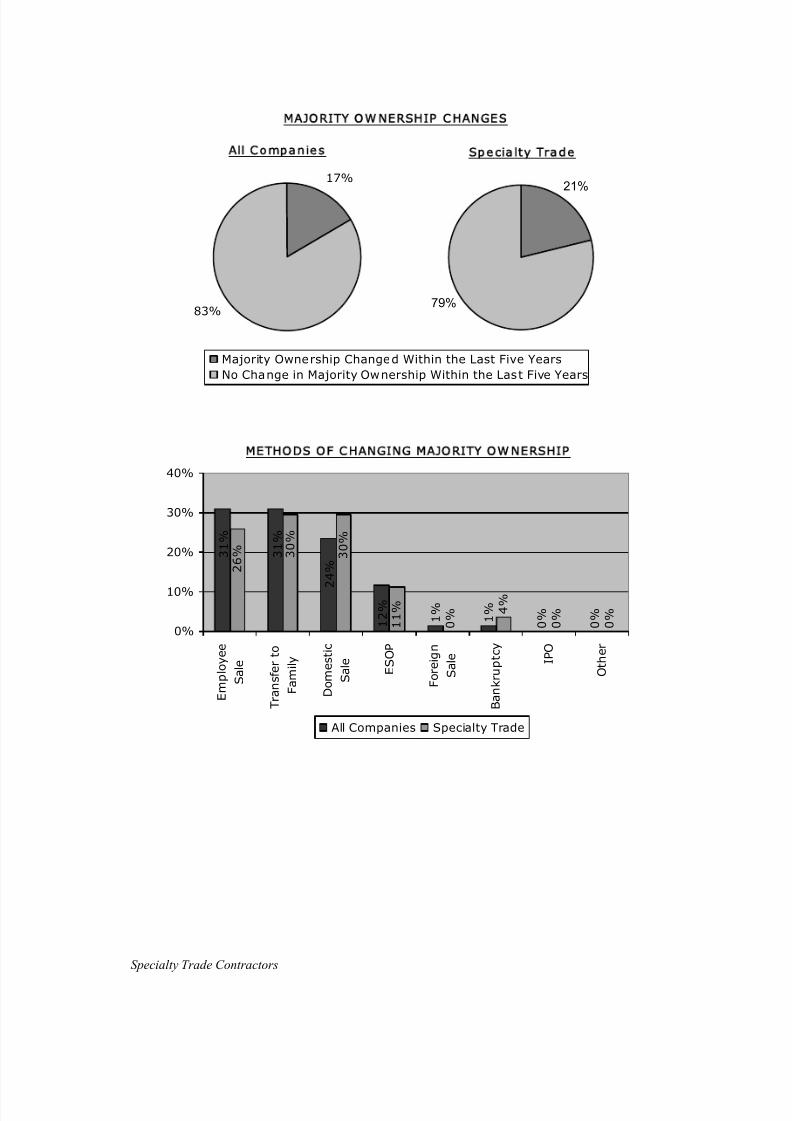
8/13/2019 2005 Financial Survey
http://slidepdf.com/reader/full/2005-financial-survey 188/284
Specialty Trade Contractors
MAJORITY OW NERSHIP C HANGES
79%
21%
Majority Ownership Changed Within the Last Five Years
No Change in Majority Ownership Within the Last Five Years
Specialty Trade
17%
83%
All Companies
M E T H O D S O F C H A N G I N G M A JO R I T Y O W N E R S H I P
1 %
1 %
0 %
0 %
0 %
4 %
0 %
0 %
1 2 %
2 4 %
3 1 %
3 1 %
3 0 %
2 6 % 3
0 %
1 1 %
0%
10%
20%
30%
40%
E m p l o y e e
S a l e
T r a n s f e r t o
F a m i l y
D o m e s t i c
S a l e
E S O P
F o r e i g n
S a l e
B a n k r u p t c y
I P O
O t h e r
All Companies Specialty Trade

8/13/2019 2005 Financial Survey
http://slidepdf.com/reader/full/2005-financial-survey 189/284
Specialty Trade Contractors
DI SADVAN TAGED BU S I N ESS EN TER PR I SES
SPEC I ALTY TR ADE
( Br e a k d o w n o f T h o s e T h a t Q u a lif y)
65%
20%15%
0%
20%
40%
60%
80%
Minority Business
Enterprise
Woman-Owned
Business Enterprise
Small Business
Enterprise
26
54
12
16
2426
14
8
5
0
10
20
30
<10M 10M-25M 25M-50M 50M-100M >100M
All Companies Specialty Trade
AVERAGE ACCOUNTING PERSONNEL BY COMPANY REVENUE
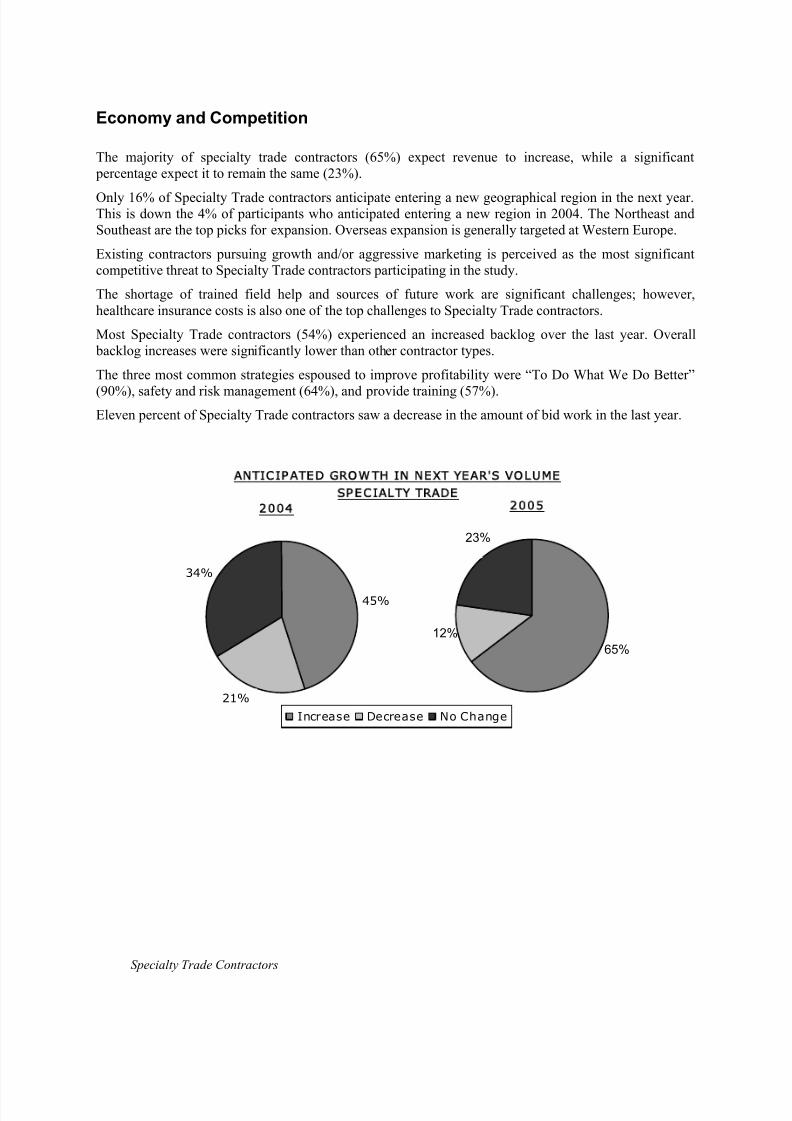
8/13/2019 2005 Financial Survey
http://slidepdf.com/reader/full/2005-financial-survey 190/284
Specialty Trade Contractors
Economy and Competition
The majority of specialty trade contractors (65%) expect revenue to increase, while a significant percentage expect it to remain the same (23%).
Only 16% of Specialty Trade contractors anticipate entering a new geographical region in the next year.This is down the 4% of participants who anticipated entering a new region in 2004. The Northeast andSoutheast are the top picks for expansion. Overseas expansion is generally targeted at Western Europe.
Existing contractors pursuing growth and/or aggressive marketing is perceived as the most significantcompetitive threat to Specialty Trade contractors participating in the study.
The shortage of trained field help and sources of future work are significant challenges; however,healthcare insurance costs is also one of the top challenges to Specialty Trade contractors.
Most Specialty Trade contractors (54%) experienced an increased backlog over the last year. Overall backlog increases were significantly lower than other contractor types.
The three most common strategies espoused to improve profitability were “To Do What We Do Better”
(90%), safety and risk management (64%), and provide training (57%).Eleven percent of Specialty Trade contractors saw a decrease in the amount of bid work in the last year.
A N T IC I P A T E D G R O W T H I N N E X T Y E A R' S V O L U M E
SPEC I ALTY TR ADE
23%
65%
12%
Increase Decrease No Change
2 0 0 5
45%
21%
34%
2 0 0 4
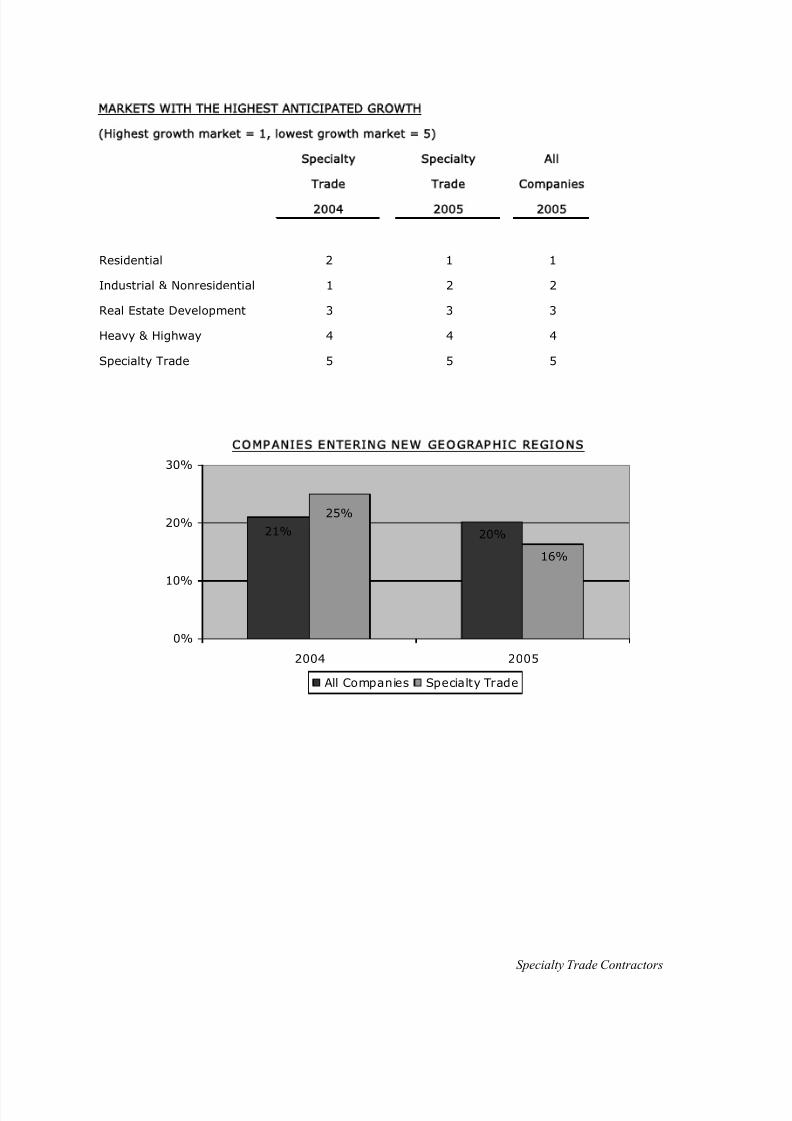
8/13/2019 2005 Financial Survey
http://slidepdf.com/reader/full/2005-financial-survey 191/284
Specialty Trade Contractors
MARKETS WITH THE HIGHEST ANTICIPATED GROWTH
(Highest growth market = 1, lowest growth market = 5 )
Specialty Specialty All
Trade Trade Companies
2004 2005 2005
Residential 2 1 1
Industrial & Nonresidential 1 2 2
Real Estate Development 3 3 3
Heavy & Highway 4 4 4
Specialty Trade 5 5 5
COMPANIES ENTERING NEW GEOGRAPHIC REGIONS
20%21%
16%
25%
0%
10%
20%
30%
2004 2005
All Companies Specialty Trade
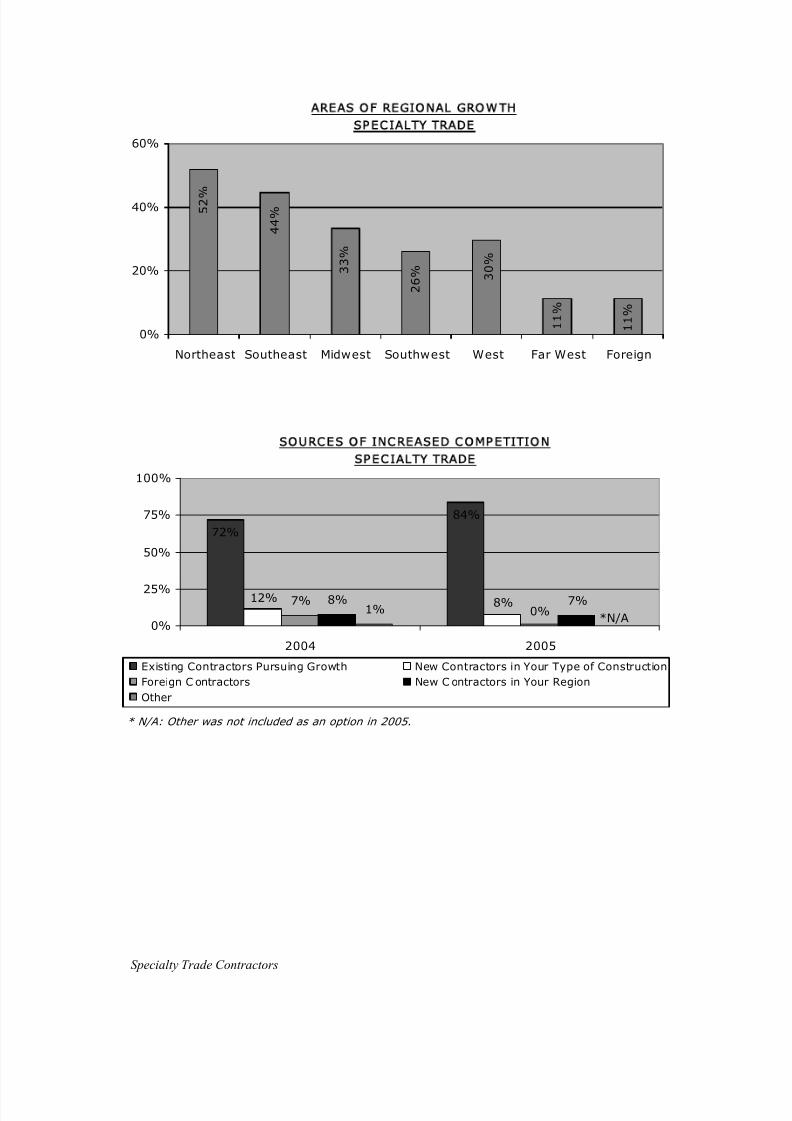
8/13/2019 2005 Financial Survey
http://slidepdf.com/reader/full/2005-financial-survey 192/284
Specialty Trade Contractors
AREAS OF REGIONAL GROWTH
SPECIALTY TRADE
11%
11%
30%
26%
52%
44%
33%
0%
20%
40%
60%
Northeast Southeast Midwest Southwest West Far West Foreign
S O U R C E S O F I N C R E A S E D C O M P E T IT IO N
SPEC I ALTY TR ADE
7% 8% 7%1%
84%
72%
12% 8%0%
*N/A0%
25%
50%
75%
100%
2004 2005
Existing Contractors Pursuing Growth New Contractors in Your Type of Construction
Foreign C ontractors New C ontractors in Your Region
Other
* N/A: Other was not included as an option in 2005.
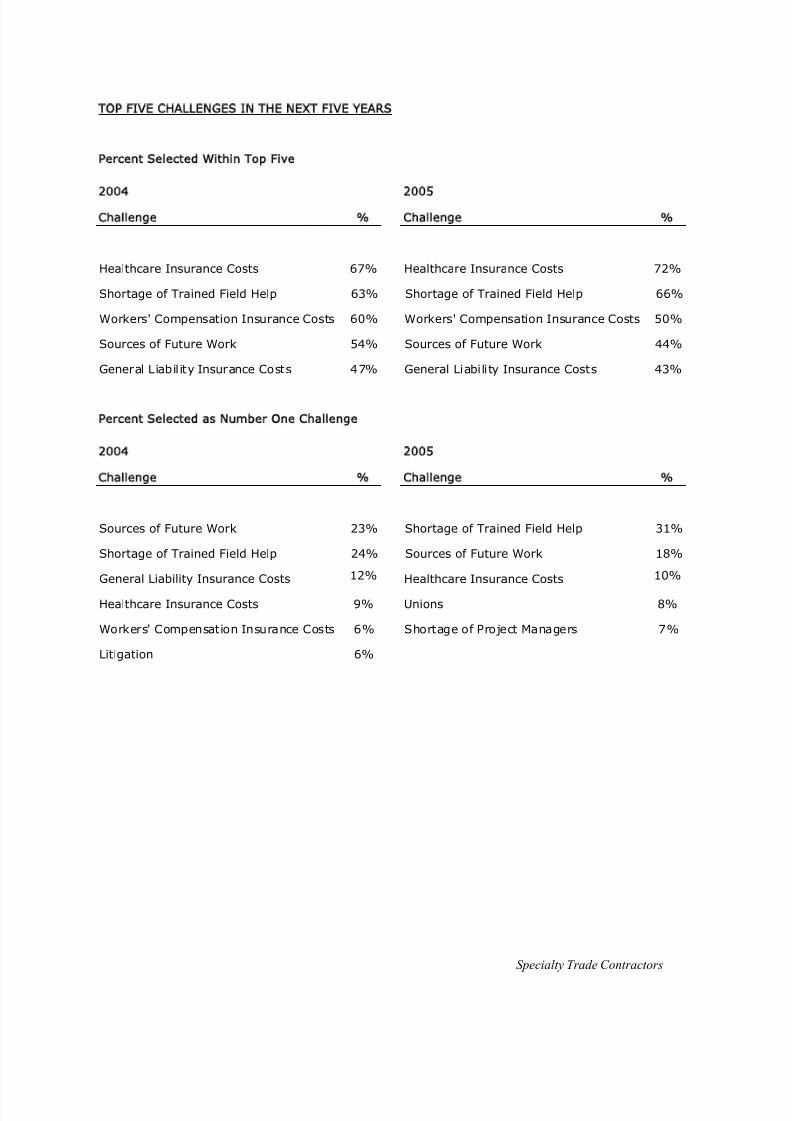
8/13/2019 2005 Financial Survey
http://slidepdf.com/reader/full/2005-financial-survey 193/284
Specialty Trade Contractors
TOP FIVE CHALLENGES IN THE NEXT FIVE YEARS
Percent Selected Within Top Five
2004 2005
Challenge % Challenge %
Healthcare Insurance Costs 67% Healthcare Insurance Costs 72%
Shortage of Trained Field Help 63% Shortage of Trained Field Help 66%
Workers' Compensation Insurance Costs 60% Workers' Compensation Insurance Costs 50%
Sources of Future Work 54% Sources of Future Work 44%
General Liability Insurance Costs 47% General Liability Insurance Costs 43%
Percent Selected as Number One Challenge
2004 2005
Challenge % Challenge %
Sources of Future Work 23% Shortage of Trained Field Help 31%
Shortage of Trained Field Help 24% Sources of Future Work 18%
12% Healthcare Insurance Costs 10%
Healthcare Insurance Costs 9% Unions 8%
Workers' Compensation Insurance Costs 6% Shortage of Project Managers 7%
Litigation 6%
General Liability Insurance Costs
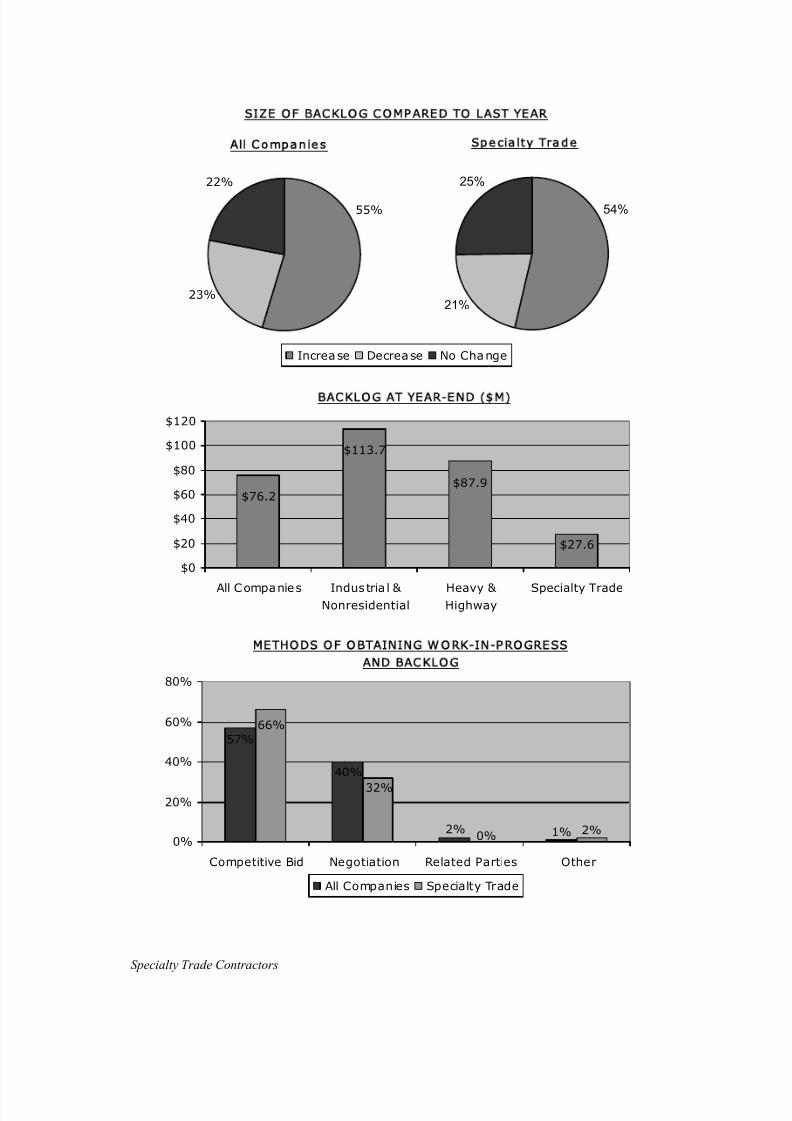
8/13/2019 2005 Financial Survey
http://slidepdf.com/reader/full/2005-financial-survey 194/284
Specialty Trade Contractors
SIZE OF BACKLOG COMPARED TO LAST YEAR
21%
54%
25%
Increase Decrease No Change
Specialty Trade
22%
23%
55%
All Companies
BACKLOG AT YEAR-END ( M)
$27.6
$76.2
$113.7
$87.9
$0
$20
$40
$60
$80
$100
$120
All Companies Industria l & Nonresidential
Heavy & Highway
Specialty Trade
METHODS OF OBTAINING W ORK-IN-PROGRESS
AND BACKLOG
57%
40%
2% 1% 2%0%
66%
32%
0%
20%
40%
60%
80%
Competitive Bid Negotiation Related Parties Other
All Companies Specialty Trade
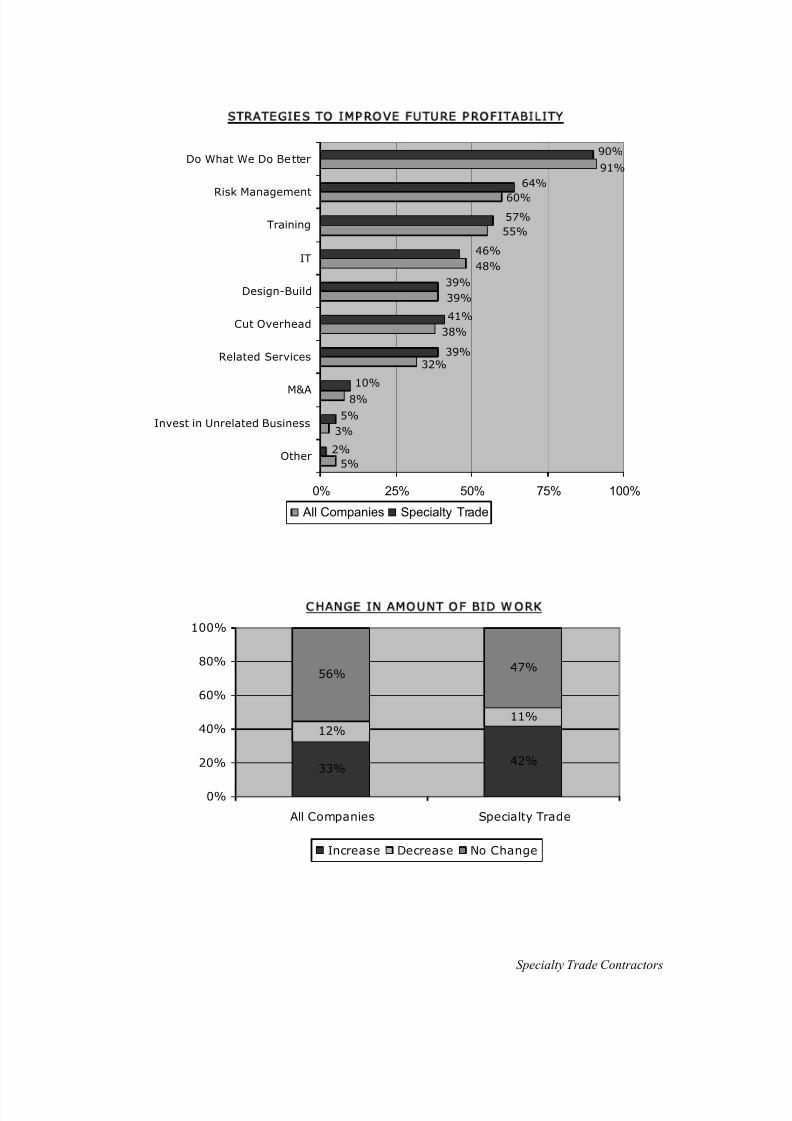
8/13/2019 2005 Financial Survey
http://slidepdf.com/reader/full/2005-financial-survey 195/284
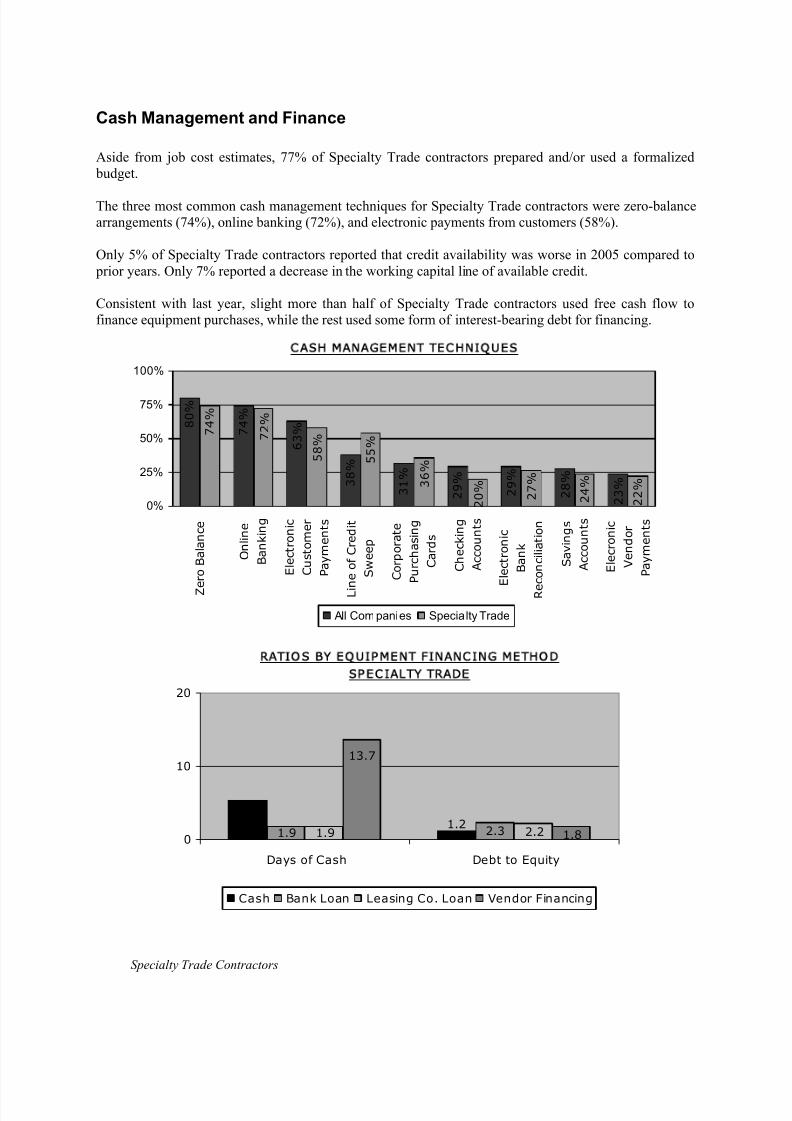
8/13/2019 2005 Financial Survey
http://slidepdf.com/reader/full/2005-financial-survey 196/284
Specialty Trade Contractors
Cash Management and Finance
Aside from job cost estimates, 77% of Specialty Trade contractors prepared and/or used a formalized budget.
The three most common cash management techniques for Specialty Trade contractors were zero-balancearrangements (74%), online banking (72%), and electronic payments from customers (58%).
Only 5% of Specialty Trade contractors reported that credit availability was worse in 2005 compared to prior years. Only 7% reported a decrease in the working capital line of available credit.
Consistent with last year, slight more than half of Specialty Trade contractors used free cash flow tofinance equipment purchases, while the rest used some form of interest-bearing debt for financing.
CASH MANAGEMENT TECHNIQUE S
8 0 %
7 4 %
6 3 %
3 8 %
3 1 %
2 9 %
2 9 %
2 8 %
2 3 %
7 4 %
7 2 %
5 8 %
5 5 %
3 6 %
2 0 %
2 7 %
2 4 %
2 2 %
0%
25%
50%
75%
100%
Z e r o
B a
l a n c e
O n
l i n e
B a n
k i n g
E l e c t r o n
i c
C u s t o m e r
P a y m e n t s
L i n e o
f C r e
d i t
S w e e p
C o r p o r a t e
P u r c
h a s i n g
C a r d s
C h e c k
i n g
A c c o u n t s
E l e c t r o n
i c
B a n
k
R e
c o n c i l i a t i o n
S a v
i n g s
A c c o u n t s
E l e c r o n
i c
V e n
d o r
P a y m e n t s
All Companies Specialty Trade
R A T IO S B Y E Q U I P M E N T F I N A N C I N G M E T H O D
SPEC I ALTY TR ADE
5.41.2
1.9 2.31.9 2.2
13.7
1.80
10
20
Days of Cash Debt to Equity
Cash Bank Loan Leasing Co. Loan Vendor Financing
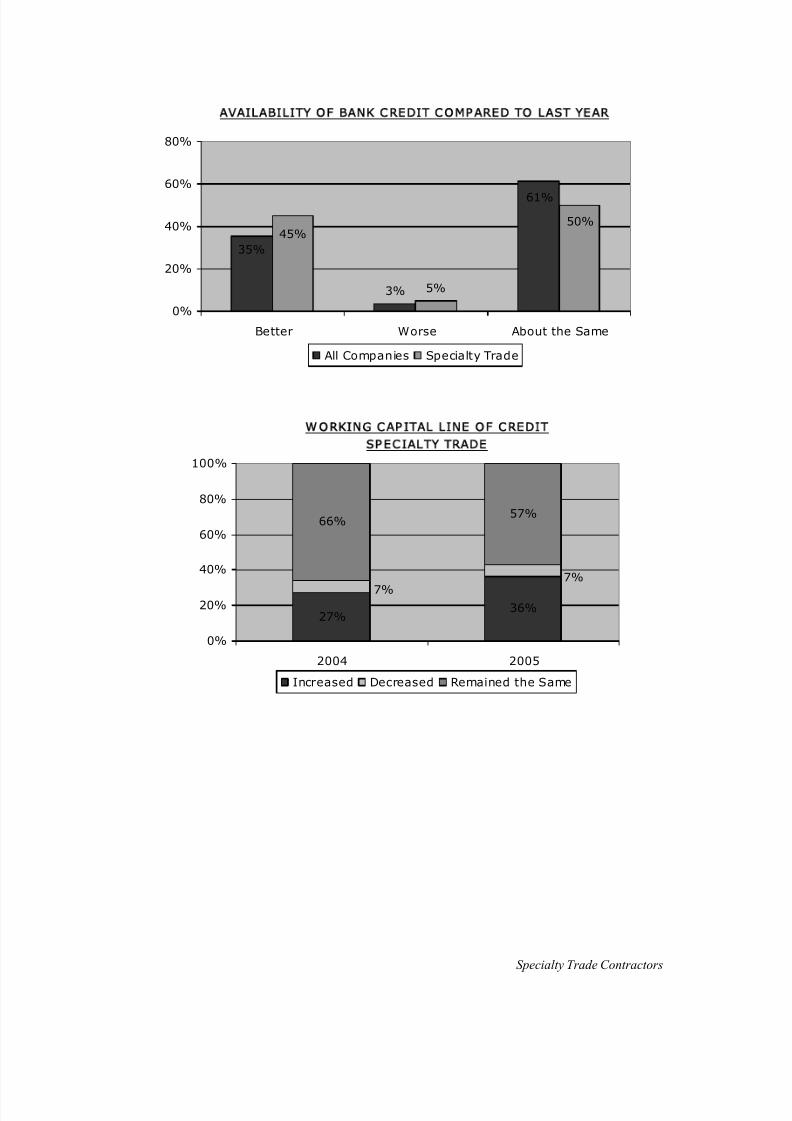
8/13/2019 2005 Financial Survey
http://slidepdf.com/reader/full/2005-financial-survey 197/284
Specialty Trade Contractors
61%
3%
35%
5%
45%50%
0%
20%
40%
60%
80%
Better Worse About the Same
All Companies Specialty Trade
AVAILABILITY OF BANK CREDIT COMPARED TO LAST YEAR
W O R K I N G C A P I T A L L I N E O F C R E D I T
SPEC I ALTY TR ADE
27% 36%
66% 57%
7%
7%
0%
20%
40%
60%
80%
100%
2004 2005
Increased Decreased Remained the Same
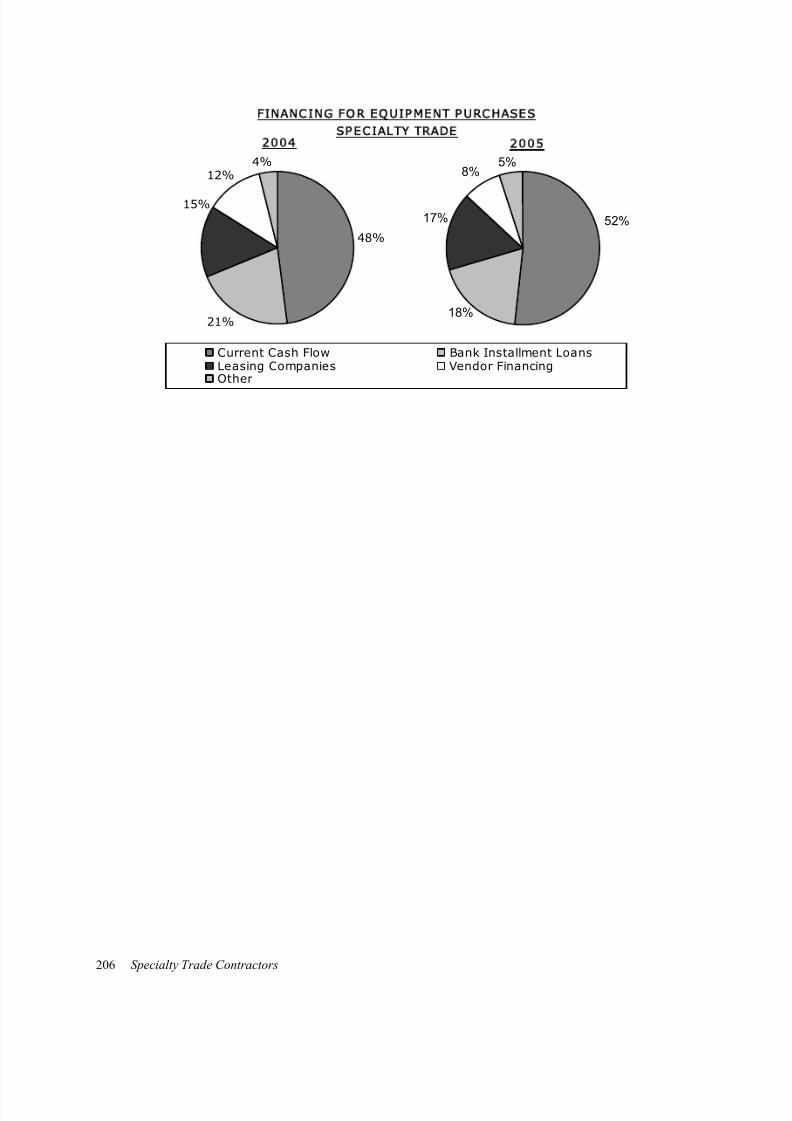
8/13/2019 2005 Financial Survey
http://slidepdf.com/reader/full/2005-financial-survey 198/284
Specialty Trade Contractors206
FINANCING FOR EQUIPMENT PURCHASES
SPECIALTY TRADE
8%
17% 52%
18%
5%
Current Cash Flow Bank Installment LoansLeasing Companies Vendor FinancingOther
2005
4%
15%
12%
21%
48%
2004
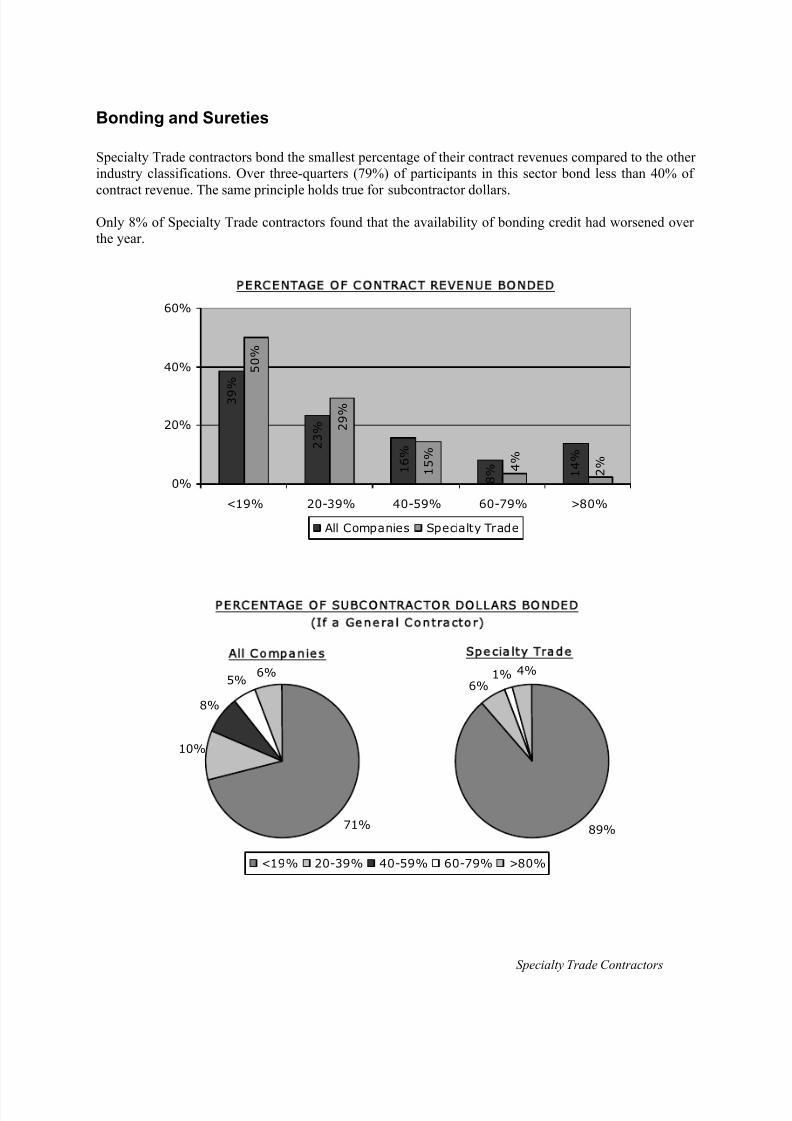
8/13/2019 2005 Financial Survey
http://slidepdf.com/reader/full/2005-financial-survey 199/284
Specialty Trade Contractors
Bonding and Sureties
Specialty Trade contractors bond the smallest percentage of their contract revenues compared to the otherindustry classifications. Over three-quarters (79%) of participants in this sector bond less than 40% of
contract revenue. The same principle holds true for subcontractor dollars.
Only 8% of Specialty Trade contractors found that the availability of bonding credit had worsened overthe year.
PERCE NTAGE OF C ONTRACT REVENUE BONDED
8 % 1
6 %
2 3 %
3 9
%
1 4 %
2 9 %
5 0 %
1 5 %
4 %
2 %
0%
20%
40%
60%
<19% 20-39% 40-59% 60-79% >80%
All Companies Specialty Trade
PERC ENTAGE O F SUBCONTRACTOR DOLLARS BONDED
(If a Gene ral Contractor)
89%
1% 4%
6%
<19% 20-39% 40-59% 60-79% >80%
Specialty Trade
6%
71%
10%
5%
8%
All Companies
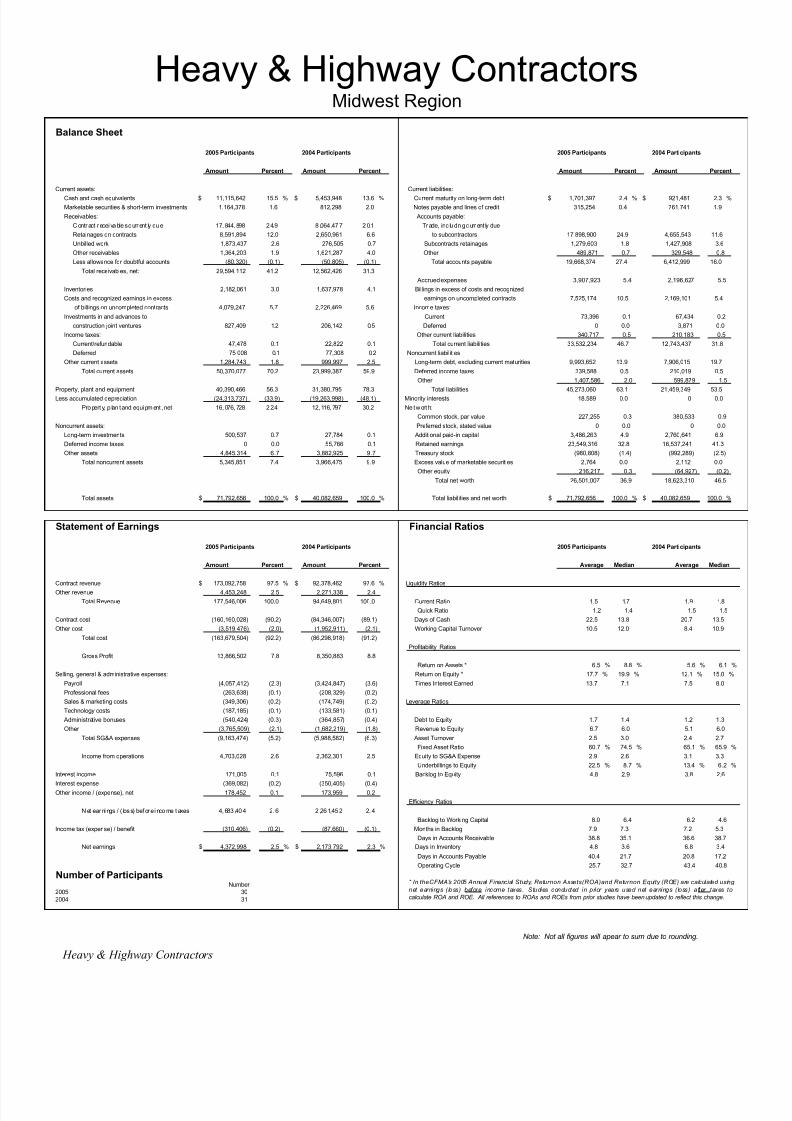
8/13/2019 2005 Financial Survey
http://slidepdf.com/reader/full/2005-financial-survey 200/284
Balance Sheet
2005 Participants 2004 Participants 2005 Participants 2004 Participants
Amount Percent Amount Percent Amount Percent Amount Percent
Current assets: Current liabilities:
Cash and cash equivalents $ 11,115,642 15.5 % $ 5,453,948 13.6 % Current maturity on long-term debt $ 1,701,397 2.4 % $ 921,481 2.3 %
Marketable securities & short-term investments 1,164,378 1.6 812,298 2.0 Notes payable and lines of credit 315,254 0.4 761,741 1.9
Receivables: Accounts payable:
Contr act r ecei va ble s c urr ent ly du e 17, 844, 898 2 4.9 8 ,064 ,47 7 2 0.1 Tr ade, inc lu din g c urr ent ly due
Retainages on contracts 8,591,894 12.0 2,650,961 6.6 to subcontractors 17,898,900 24.9 4,655,543 11.6
Unbilled work 1,873,437 2.6 276,505 0.7 Subcontracts retainages 1,279,603 1.8 1,427,908 3.6
Other receivables 1,364,203 1.9 1,621,287 4.0 Other 489,871 0.7 329,548 0.8
Less allowance for doubtful accounts (80,320) (0.1) (50,805) (0.1) Total accounts payable 19,668,374 27.4 6,412,999 16.0
Total receivables, net: 29,594,112 41.2 12,562,426 31.3
Accrued expenses 3,907,923 5.4 2,196,627 5.5
Inventories 2,182,061 3.0 1,637,978 4.1 Billings in excess of costs and recognized
Costs and recognized earnings in excess earnings on uncompleted contracts 7,525,174 10.5 2,169,101 5.4
of billings on uncompleted contracts 4,079,247 5.7 2,226,469 5.6 Income taxes:
Investments in and advances to Current 73,396 0.1 67,434 0.2
construction joint ventures 827,409 1.2 206,142 0.5 Deferred 0 0.0 3,871 0.0
Income taxes: Other current liabilities 340,717 0.5 210,183 0.5
Current/refundable 47,478 0.1 22,822 0.1 Total current liabilities 33,532,234 46.7 12,743,437 31.8
Deferred 75,008 0.1 77,308 0.2 Noncurrent liabilities
Other current assets 1,284,743 1.8 999,997 2.5 Long-term debt, excluding current maturities 9,993,652 13.9 7,906,015 19.7
Total current assets 50,370,077 70.2 23,999,387 59.9 Deferred income taxes 339,588 0.5 210,019 0.5
Other 1,407,586 2.0 599,879 1.5
Property, plant and equipment 40,390,466 56.3 31,380,795 78.3 Total liabilities 45,273,060 63.1 21,459,349 53.5
Less accumulated depreciation (24,313,737) (33.9) (19,263,998) (48.1) Minority interests 18,589 0.0 0 0.0
Pro pert y, p lan t and equi pment , net 16, 076, 728 2 2.4 12, 116, 797 30.2 Ne t wort h:
Common stock, par value 227,255 0.3 380,533 0.9
Noncurrent assets: Preferred stock, stated value 0 0.0 0 0.0
Long-term investments 500,537 0.7 27,784 0.1 Additional paid-in capital 3,486,263 4.9 2,760,641 6.9
Deferred income taxes 0 0.0 55,766 0.1 Retained earnings 23,549,316 32.8 16,537,241 41.3
Other assets 4,845,314 6.7 3,882,925 9.7 Treasury stock (980,808) (1.4) (992,289) (2.5)
Total noncurrent assets 5,345,851 7.4 3,966,475 9.9 Excess value of marketable securities 2,764 0.0 2,112 0.0
Other equity 216,217 0.3 (64,927) (0.2)
Total net worth 26,501,007 36.9 18,623,310 46.5
Total assets $ 71,792,656 100.0 % $ 40,082,659 100.0 % Total liabilities and net worth $ 71,792,656 100.0 % $ 40,082,659 100.0 %
Statement of Earnings Financial Ratios
2005 Participants 2004 Participants 2005 Participants 2004 Participants
Amount Percent Amount Percent Average Median Average Median
Contract revenue $ 173,092,758 97.5 % $ 92,378,462 97.6 % Liquidity Ratios
Other revenue 4,453,248 2.5 2,271,338 2.4
Total Revenue 177,546,006 100.0 94,649,801 100.0 Current Ratio 1.5 1.7 1.9 1.8
Quick Ratio 1.2 1.4 1.5 1.5
Contract cost (160,160,028) (90.2) (84,346,007) (89.1) Days of Cash 22.5 13.8 20.7 13.5
Other cost (3,519,476) (2.0) (1,952,911) (2.1) Working Capital Turnover 10.5 12.0 8.4 10.9
Total cost (163,679,504) (92.2) (86,298,918) (91.2)
Profitability Ratios
Gross Profit 13,866,502 7.8 8,350,883 8.8
Return on Assets * 6.5 % 8.8 % 5.6 % 6.1 %
Selling, general & administrative expenses: Return on Equity * 17.7 % 19.9 % 12.1 % 15.0 %
Payroll (4,057,412) (2.3) (3,424,847) (3.6) Times Interest Earned 13.7 7.1 7.5 8.0
Professional fees (263,638) (0.1) (208,329) (0.2)
Sales & marketing costs (349,306) (0.2) (174,749) (0.2) Leverage Ratios
Technology costs (187,185) (0.1) (133,581) (0.1)
Administrative bonuses (540,424) (0.3) (364,857) (0.4) Debt to Equity 1.7 1.4 1.2 1.3
Other (3,765,509) (2.1) (1,682,219) (1.8) Revenue to Equity 6.7 6.0 5.1 6.0
Total SG&A expenses (9,163,474) (5.2) (5,988,582) (6.3) Asset Turnover 2.5 3.0 2.4 2.7
Fixed Asset Ratio 60.7 % 74.5 % 65.1 % 65.9 %
Income from operations 4,703,028 2.6 2,362,301 2.5 Equity to SG&A Expense 2.9 2.6 3.1 3.3
Underbillings to Equity 22.5 % 8.7 % 13.4 % 6.2 %
Interest income 171,005 0.1 75,596 0.1 Backlog to Equity 4.8 2.9 3.8 2.6
Interest expense (369,082) (0.2) (350,405) (0.4)Other income / (expense), net 178,452 0.1 173,959 0.2
Efficiency Ratios
Net ear ni ngs / ( los s) bef or e i nco me t axes 4, 683 ,40 4 2. 6 2 ,26 1,45 2 2. 4
Backlog to Working Capital 8.0 6.4 6.2 4.6
Income tax (expense) / benefit (310,406) (0.2) (87,660) (0.1) Months in Backlog 7.9 7.3 7.2 5.3
Days in Accounts Receivable 38.8 35.1 36.6 38.7
Net earnings $ 4,372,998 2.5 % $ 2,173,792 2.3 % Days in Inventory 4.8 3.6 6.8 3.4
Days in Accounts Payable 40.4 21.7 20.8 17.2
Operating Cycle 25.7 32.7 43.4 40.8
Number of ParticipantsNumber
2005 302004 31
Heavy & Highway Contractors
Note: Not all figures will apear to sum due to rounding.
Midwest Region
* In theCFMA's 2005 Annual Financial Study, Returnon Assets(ROA)and Returnon Equity (ROE) are calculated using
net earnings (loss) before income taxes. Studies conducted in prior years used net earnings (loss) after taxes to
calculate ROA and ROE. All references to ROAs and ROEs from prior studies have been updated to reflect this change.
Heavy & Highway Contractors
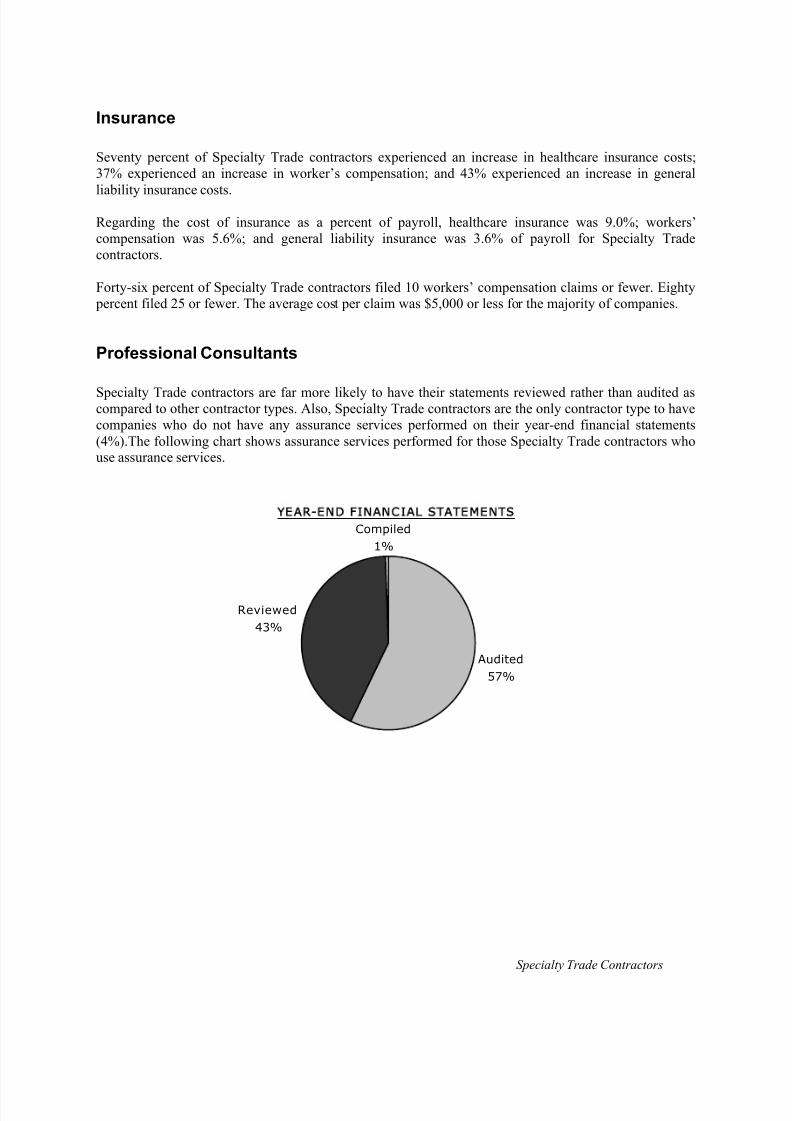
8/13/2019 2005 Financial Survey
http://slidepdf.com/reader/full/2005-financial-survey 201/284
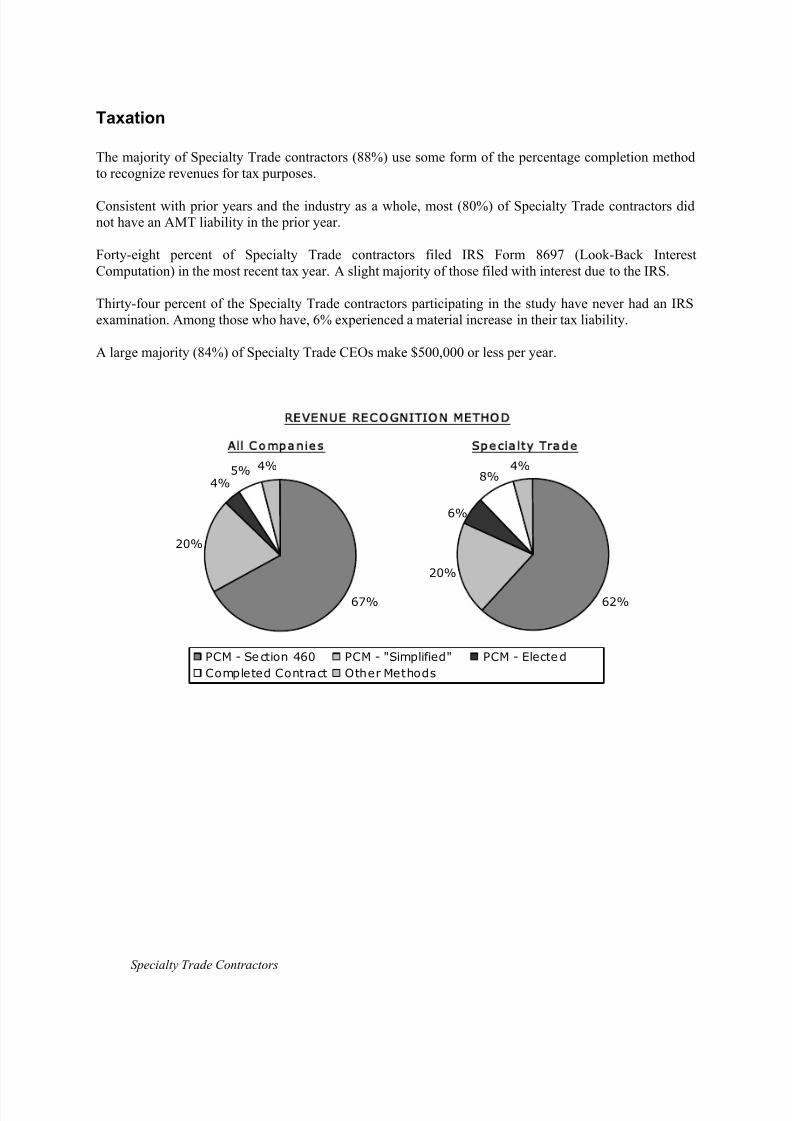
8/13/2019 2005 Financial Survey
http://slidepdf.com/reader/full/2005-financial-survey 202/284

8/13/2019 2005 Financial Survey
http://slidepdf.com/reader/full/2005-financial-survey 203/284
Specialty Trade Contractors 211
AMT TAX LIABILITY LAST YEAR
No
80%
Yes
10%
Don't Know
10%
Specialty Trade
No
84%
Yes
8%
All Companies
Don't Know
8%
FILED LO OK-BACK INTEREST COMPUTATION
23%
25%
13%
39%
Yes, for an Interest Re fund Yes, with Interest Due to the IRS
No, I Didn't File Not Applicable
Specialty Trade
29%
36%
7%
27%
All Companies
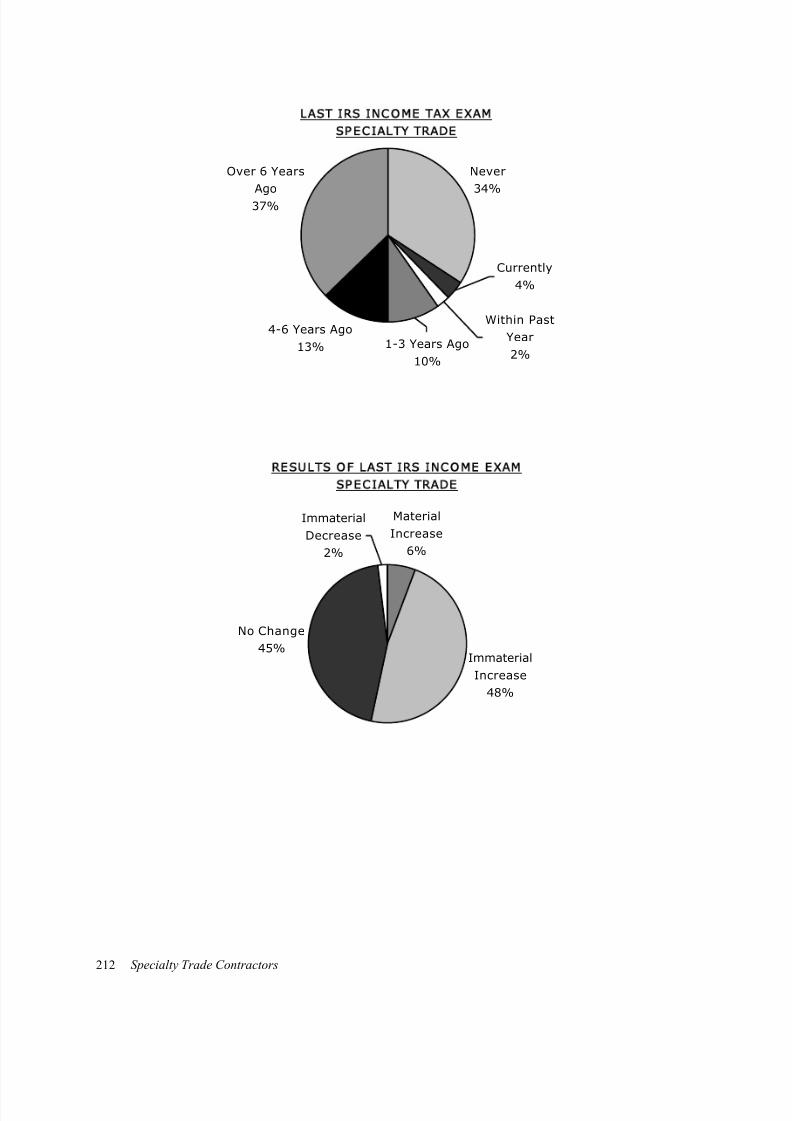
8/13/2019 2005 Financial Survey
http://slidepdf.com/reader/full/2005-financial-survey 204/284
Specialty Trade Contractors212
LAST IRS INCOME TAX EXAM
SPECIALTY TRADE
Over 6 Years
Ago
37%
4-6 Years Ago
13% 1-3 Years Ago
10%
Within Past
Year
2%
Currently
4%
Never
34%
RESULTS OF LAST IRS INCOME EXAM
SPECIALTY TRADE
Immaterial
Increase
48%
No Change
45%
Immaterial
Decrease
2%
Material
Increase
6%
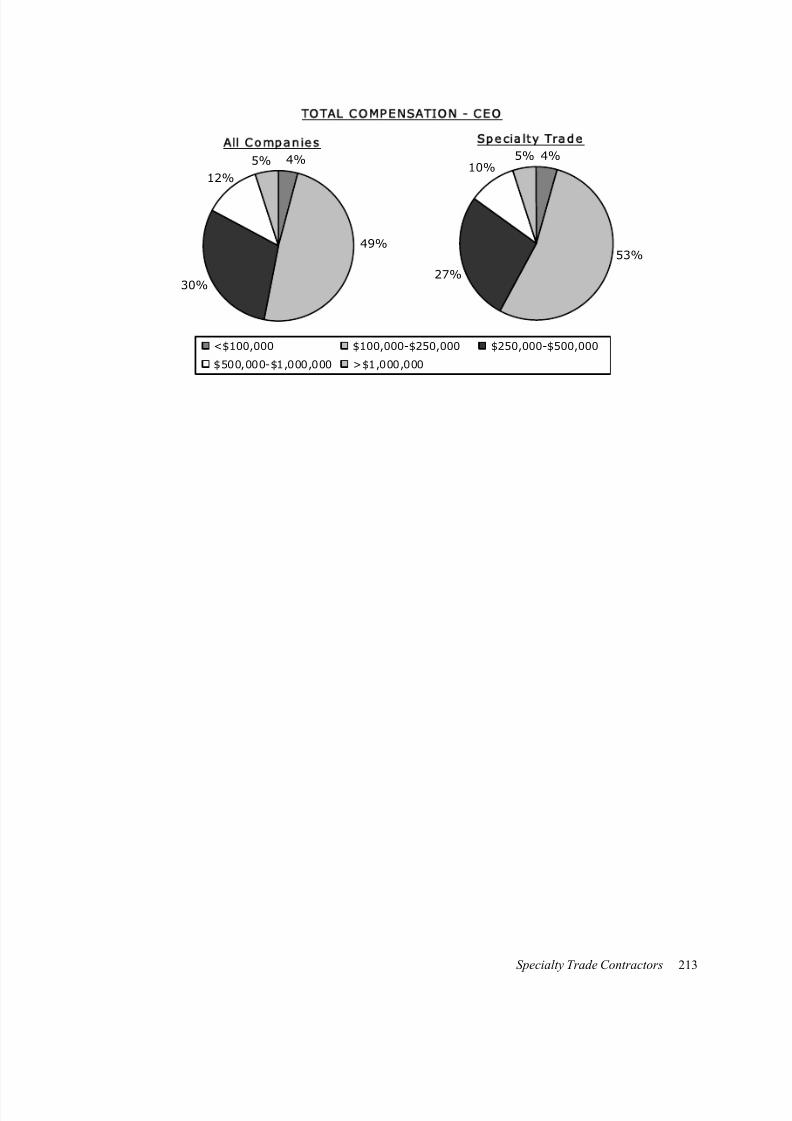
8/13/2019 2005 Financial Survey
http://slidepdf.com/reader/full/2005-financial-survey 205/284
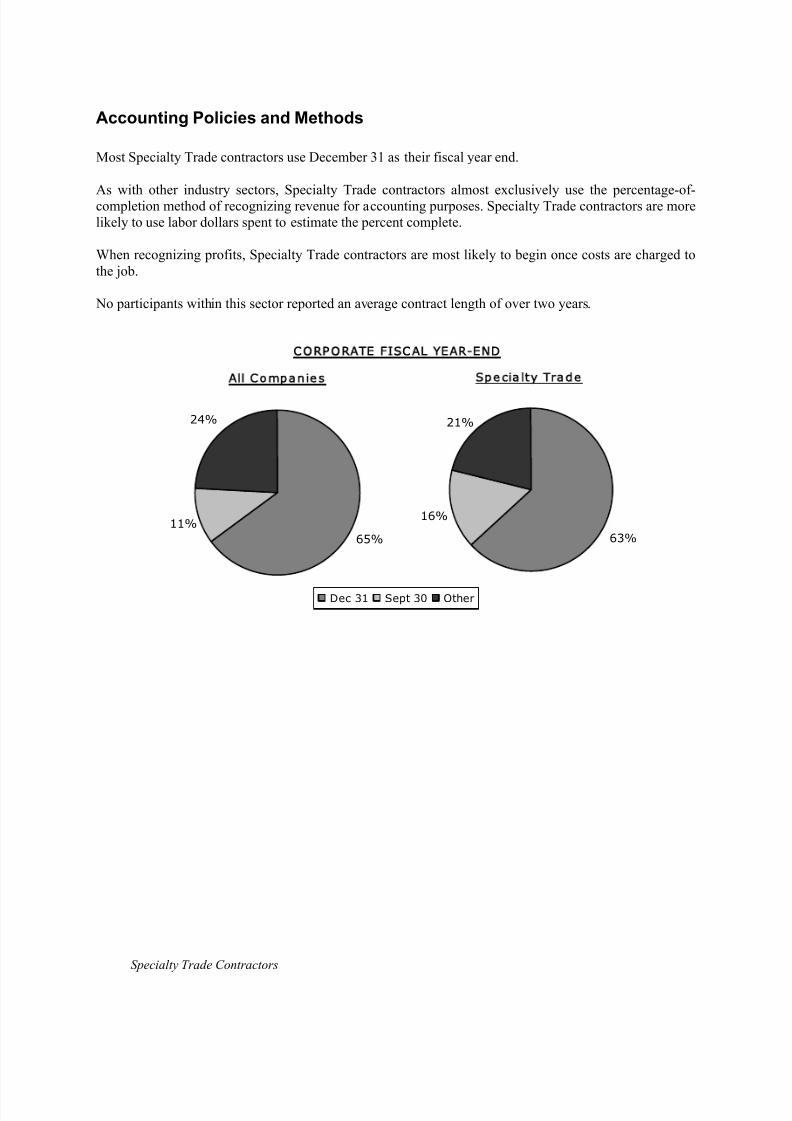
8/13/2019 2005 Financial Survey
http://slidepdf.com/reader/full/2005-financial-survey 206/284
Specialty Trade Contractors
Accounting Policies and Methods
Most Specialty Trade contractors use December 31 as their fiscal year end.
As with other industry sectors, Specialty Trade contractors almost exclusively use the percentage-of-completion method of recognizing revenue for accounting purposes. Specialty Trade contractors are morelikely to use labor dollars spent to estimate the percent complete.
When recognizing profits, Specialty Trade contractors are most likely to begin once costs are charged tothe job.
No participants within this sector reported an average contract length of over two years.
CORP ORATE FISCAL YEAR-END
63%
21%
16%
Dec 31 Sept 30 Other
Specialty Trade
24%
11%
65%
All Companies
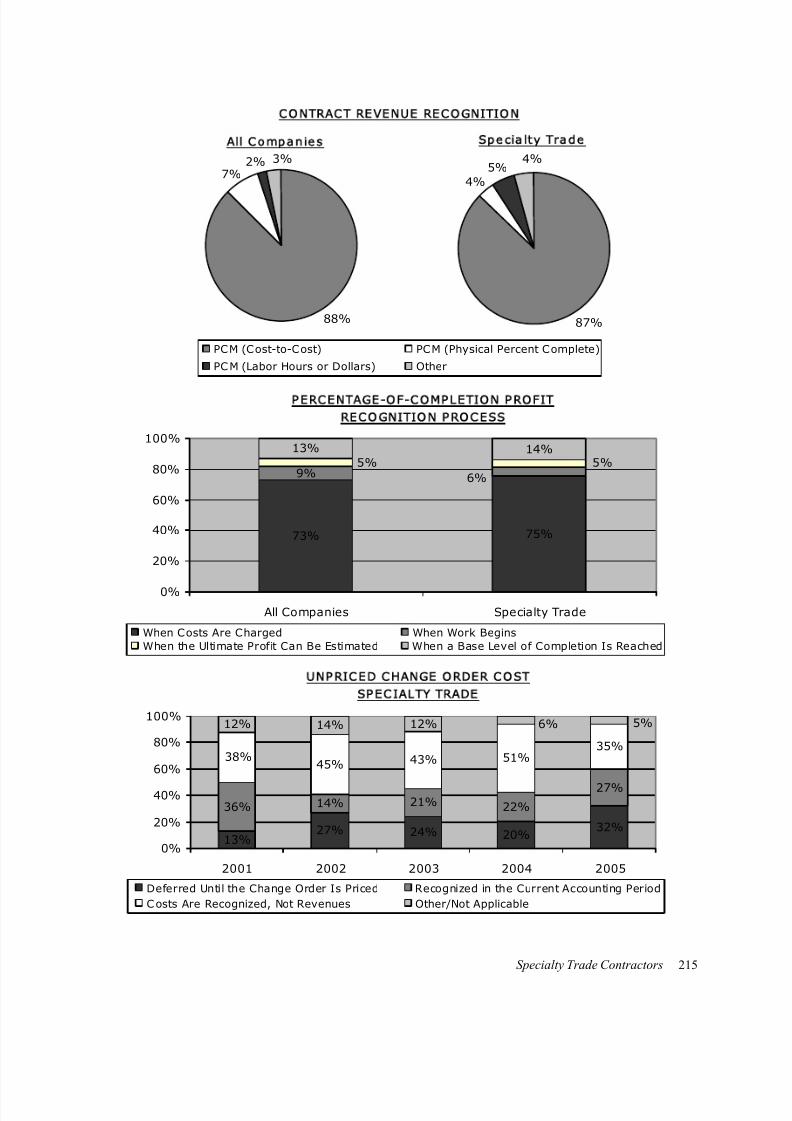
8/13/2019 2005 Financial Survey
http://slidepdf.com/reader/full/2005-financial-survey 207/284
Specialty Trade Contractors 215
CONTRACT REVENUE RECOGNITION
4%
4%5%
87%
PCM (Cost-to-Cost) PCM (Physical Percent Complete)
PCM (Labor Hours or Dollars) Other
Specialty Trade
2%7%
3%
88%
All Companies
PERCENTAGE-OF-COMPLETION PROFIT
RECOGNITION PROCESS
73% 75%
9%
13% 14%
6%
5% 5%
0%
20%
40%
60%
80%
100%
All Companies Specialty Trade
When Costs Are Charged When Work Begins
When the Ultimate Profit Can Be Estimated When a Base Level of Completion Is Reached
U N P R I C E D C H A N G E O R D E R C O S T
SPEC I ALTY TR ADE
13%27% 24% 20%
32%
36% 14% 21% 22%
27%
43% 51%35%
12% 14% 12%
45%38%
6% 5%
0%
20%
40%
60%
80%
100%
2001 2002 2003 2004 2005
Deferred Until the Change Order Is Priced Recognized in the Current Accounting Period
Costs Are Recognized, Not Revenues Other/Not Applicable

8/13/2019 2005 Financial Survey
http://slidepdf.com/reader/full/2005-financial-survey 208/284
Specialty Trade Contractors216
6%
12%
17%
18%
46%
2%
2%
2%
0%
28%
44%
17%
6%
0%
0% 20% 40% 60%
Equity
Partial Consolidation
Full Consolidation
Equity Consolidation
Expanded
Cost
Other
All Companies Specialty Trade
METHODS FOR ACC OUNTING FOR JOINT VENTURES
(25 Percent o f Partic ipants Account For Joint Ventures)
TYPES OF CONTRACTS Specialty Specialty All
Trade Trade Companies
2004 2005 2005
Fixed Price - Hard Bid 55% 50% 39%
Fixed Price - Negotiated 20% 23% 20%
Cost With Guaranteed Maximum 4% 5% 14%
Unit Price 4% 3% 10%
Time and Materials 14% 15% 8%
Cost Plus Fee 3% 2% 5%
Construction Management 0% 0% 3%
Other 0% 1% 1%
TOTAL 100% 100% 100%

8/13/2019 2005 Financial Survey
http://slidepdf.com/reader/full/2005-financial-survey 209/284
Specialty Trade Contractors 217
AVERAGE CONTRACT DURATION
SPECIALTY TRADE
72%
28%
<12 months 12-24 months >24 months
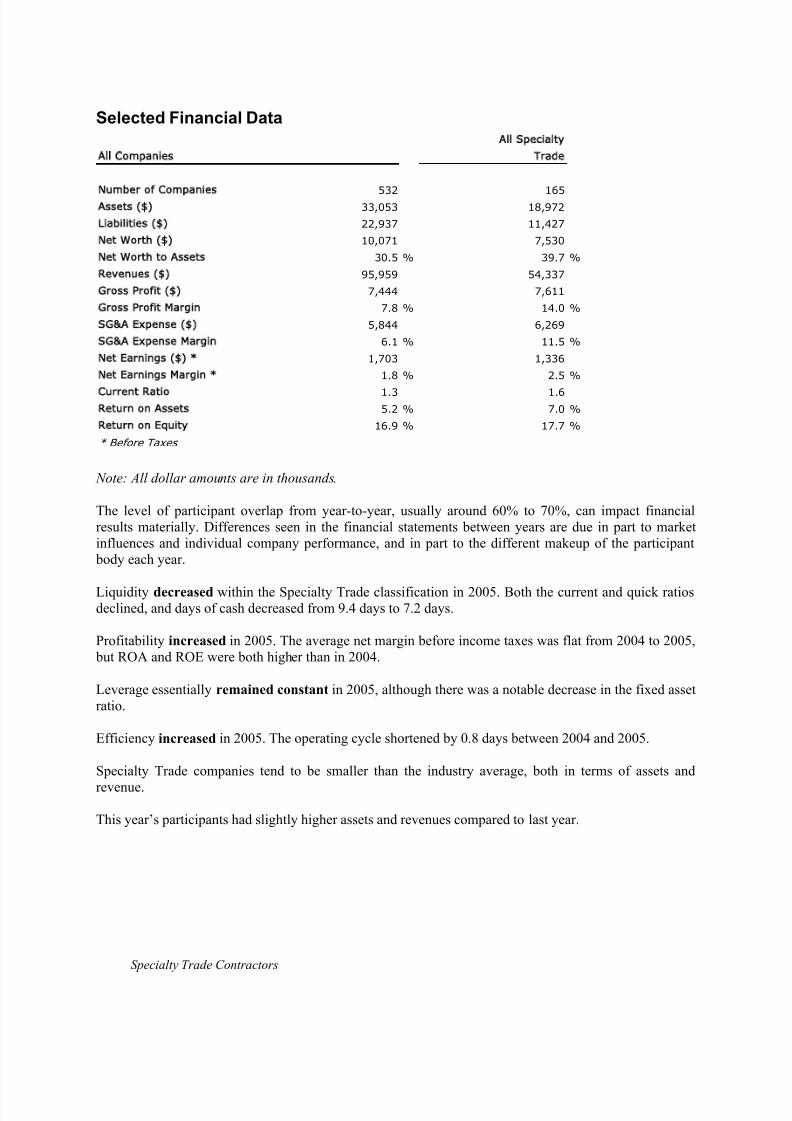
8/13/2019 2005 Financial Survey
http://slidepdf.com/reader/full/2005-financial-survey 210/284
Specialty Trade Contractors
Selected Financial Data
All Specialty
All Companies Trade
Number of Companies 532 165
Assets ( ) 33,053 18,972
Liabilities ( ) 22,937 11,427
Net Worth ( ) 10,071 7,530
Net Worth to Assets 30.5 % 39.7 %
Revenues ( ) 95,959 54,337
Gross Profit ( ) 7,444 7,611
Gross Profit Margin 7.8 % 14.0 %
SG&A Expense ( ) 5,844 6,269
SG&A Expense Margin 6.1 % 11.5 %
Net Earnings ( ) * 1,703 1,336
Net Earnings Margin * 1.8 % 2.5 %
Current Ratio 1.3 1.6Return on Assets 5.2 % 7.0 %
Return on Equity 16.9 % 17.7 %
* Before Taxes
Note: All dollar amounts are in thousands.
The level of participant overlap from year-to-year, usually around 60% to 70%, can impact financialresults materially. Differences seen in the financial statements between years are due in part to marketinfluences and individual company performance, and in part to the different makeup of the participant body each year.
Liquidity decreased within the Specialty Trade classification in 2005. Both the current and quick ratiosdeclined, and days of cash decreased from 9.4 days to 7.2 days.
Profitability increased in 2005. The average net margin before income taxes was flat from 2004 to 2005, but ROA and ROE were both higher than in 2004.
Leverage essentially remained constant in 2005, although there was a notable decrease in the fixed assetratio.
Efficiency increased in 2005. The operating cycle shortened by 0.8 days between 2004 and 2005.
Specialty Trade companies tend to be smaller than the industry average, both in terms of assets and
revenue.
This year’s participants had slightly higher assets and revenues compared to last year.

8/13/2019 2005 Financial Survey
http://slidepdf.com/reader/full/2005-financial-survey 211/284
Balance Sheet
2005 Participants 2004 Participants 2005 Participants 2004 Participants
Amount Percent Amount Percent Amount Percent Amount Percent
Current assets: Current liabilities:Cash and cash equivalents $ 1,088,211 5.7 % $ 1,201,618 7.0 % Current maturity on long-term debt $ 298,946 1.6 % $ 260,336 1.5 %
Marketable securities & short-term investments 207,217 1.1 341,095 2.0 Notes payable and lines of credit 1,000,402 5.3 577,931 3.4
Receivables: Accounts payable:
Contract receivables currently due 9,631,845 50.8 8,263,335 48.1 Trade, including currently due
Retainages on contracts 1,897,498 10.0 1,563,383 9.1 to subcontractors 3,243,596 17.1 2,913,802 17.0
Unbilled work 187,032 1.0 128,065 0.7 Subcontracts retainages 259,732 1.4 219,170 1.3
Other receivables 141,500 0.7 317,591 1.8 Other 166,585 0.9 327,121 1.9
Less allowance for doubtful accounts (104,242) (0.5) (109,898) (0.6) Total accounts payable 3,669,913 19.3 3,460,094 20.1
Total receivables, net: 11,753,632 62.0 10,162,476 59.2
Accrued expenses 1,920,132 10.1 1,332,597 7.8
Inventories 348,254 1.8 269,500 1.6 Billings in excess of costs and recognized
Costs and recognized earnings in excess earnings on uncompleted contracts 2,501,947 13.2 2,310,444 13.5
of billings on uncompleted contracts 1,434,561 7.6 1,143,435 6.7 Income taxes:
Investments in and advances to Current 43,294 0.2 15,065 0.1
construction joint ventures 20,934 0.1 25,425 0.1 Deferred 17,993 0.1 15,189 0.1
Income taxes: Other current liabilities 366,373 1.9 206,059 1.2
Current/refundable 10,216 0.1 22,277 0.1 Total current liabilities 9,819,000 51.8 8,177,715 47.6
Deferred 38,629 0.2 27,008 0.2 Noncurrent liabilities
Other current assets 453,047 2.4 460,023 2.7 Long-term debt, excluding current maturities 1,387,425 7.3 2,016,719 11.7
Total current assets 15,354,703 80.9 13,652,857 79.5 Deferred income taxes 76,990 0.4 67,193 0.4
Other 143,594 0.8 364,493 2.1Property, plant and equipment 5,245,272 27.6 5,402,358 31.5 Total liabilities 11,427,010 60.2 10,626,120 61.9
Less accumulated depreciation (3,248,038) (17.1) (3,404,518) (19.8) Minority interests 15,266 0.1 7,273 0.0
Property, plant and equipment, net 1,997,235 10.5 1,997,840 11.6 Net worth:
Common stock, par value 237,508 1.3 482,636 2.8
Noncurrent assets: Preferred stock, stated value 11,663 0.1 45,887 0.3
Long-term investments 68,375 0.4 82,925 0.5 Additional paid-in capital 2,421,325 12.8 1,421,356 8.3
Deferred income taxes 29,033 0.2 17,260 0.1 Retained earnings 5,116,098 27.0 4,744,449 27.6
Other assets 1,522,569 8.0 1,421,347 8.3 Treasury stock (822,400) (4.3) (416,361) (2.4)
Total noncurrent assets 1,619,977 8.5 1,521,532 8.9 Excess value of marketable securities 17,474 0.1 19,881 0.1
Other equity 547,970 2.9 240,989 1.4
Total net worth 7,529,638 39.7 6,538,837 38.1
Total assets $ 18,971,914 100.0 % $ 17,172,230 100.0 % Total liabilities and net worth $ 18,971,914 100.0 % $ 17,172,230 100.0 %
Statement of Earnings Financial Ratios
2005 Participants 2004 Participants 2005 Participants 2004 Participants
Amount Percent Amount Percent Average Median Average Median
Contract revenue $ 52,768,222 97.1 % $ 44,798,872 97.1 % Liquidity Ratios
Other revenue 1,568,925 2.9 1,358,851 2.9
Total Revenue 54,337,147 100.0 46,157,723 100.0 Current Ratio 1.6 1.6 1.7 1.6
Quick Ratio 1.3 1.3 1.4 1.4
Contract cost (45,528,011) (83.8) (38,125,762) (82.6) Days of Cash 7.2 4.1 9.4 4.8
Other cost (1,198,314) (2.2) (1,618,423) (3.5) Working Capital Turnover 9.8 9 .7 8.4 9.7
Total cost (46,726,324) (86.0) (39,744,185) (86.1)
Profitability Ratios
Gross Profit 7,610,823 14.0 6,413,537 13.9
Return on Assets * 7.0 % 6.8 % 6.6 % 5.1 %
Selling, general & administrative expenses: Return on Equity * 17.7 % 19.9 % 17.4 % 14.9 %
Payroll (2,865,192) (5.3) (2,806,534) (6.1) Times Interest Earned 11.6 11.1 8.8 6.4
Professional fees (147,747) (0.3) (143,587) (0.3)
Sales & marketing costs (208,037) (0.4) (200,193) (0.4) Leverage Ratios
Technology costs (97,418) (0.2) (123,516) (0.3)
Administrative bonuses (273,443) (0.5) (317,708) (0.7) Debt to Equity 1.5 1.7 1.6 1.6
Other (2,677,039) (4.9) (1,725,597) (3.7) Revenue to Equity 7.2 8.4 7.1 7.8
Total SG&A expenses (6,268,875) (11.5) (5,317,134) (11.5) Asset Turnover 2.9 3.0 2.7 2.9
Fixed Asset Ratio 26.5 % 25.8 % 30.6 % 29.5 %
Income from operations 1,341,947 2.5 1,096,403 2.4 Equity to SG&A Expense 1.2 1.0 1.2 1.0
Underbillings to Equity 21.5 % 20.1 % 19.4 % 15.8 %
Interest income 20,603 0.0 24,404 0.1 Backlog to Equity 6.0 3.4 4.8 3.7
Interest expense (125,746) (0.2) (146,426) (0.3)
Other income / (expense), net 99,088 0.2 162,826 0.4
Efficiency Ratios
Ne t ea rnings / ( loss) before i ncome taxes 1 ,335,892 2 .5 1 ,137 ,207 2 .5
Backlog to Working Capital 8.2 4.3 6.7 4.3
Income tax (expense) / benefit (172,942) (0.3) (58,383) (0.1) Months in Backlog 6.0 5.3 5.9 5.6
Days in Accounts Receivable 64.1 61.8 66.1 62.7
Net earnings $ 1,162,950 2.1 $ 1,078,823 2.3 Days in Inventory 2.7 3.0 2.4 2.4
Days in Accounts Payable 26.3 27.4 29.4 26.4
Operating Cycle 47.7 45.7 48.5 49.4
Number of ParticipantsNumber
2005 1652004 171
Note: Not all figures will apear to sum due to rounding.
Composite
Specialty Trade Contractors
* Inthe CFMA's2005Annual FinancialStudy, Returnon Assets(ROA)and Returnon Equity(ROE) arecalculatedusing
net earnings (loss) before income taxes. Studies conducted in prior years used net earnings (loss) after taxes to calculate
ROA and ROE. All references to ROAs and ROEs from prior studies have been updated to reflect this change.
Specialty Trade Contractors
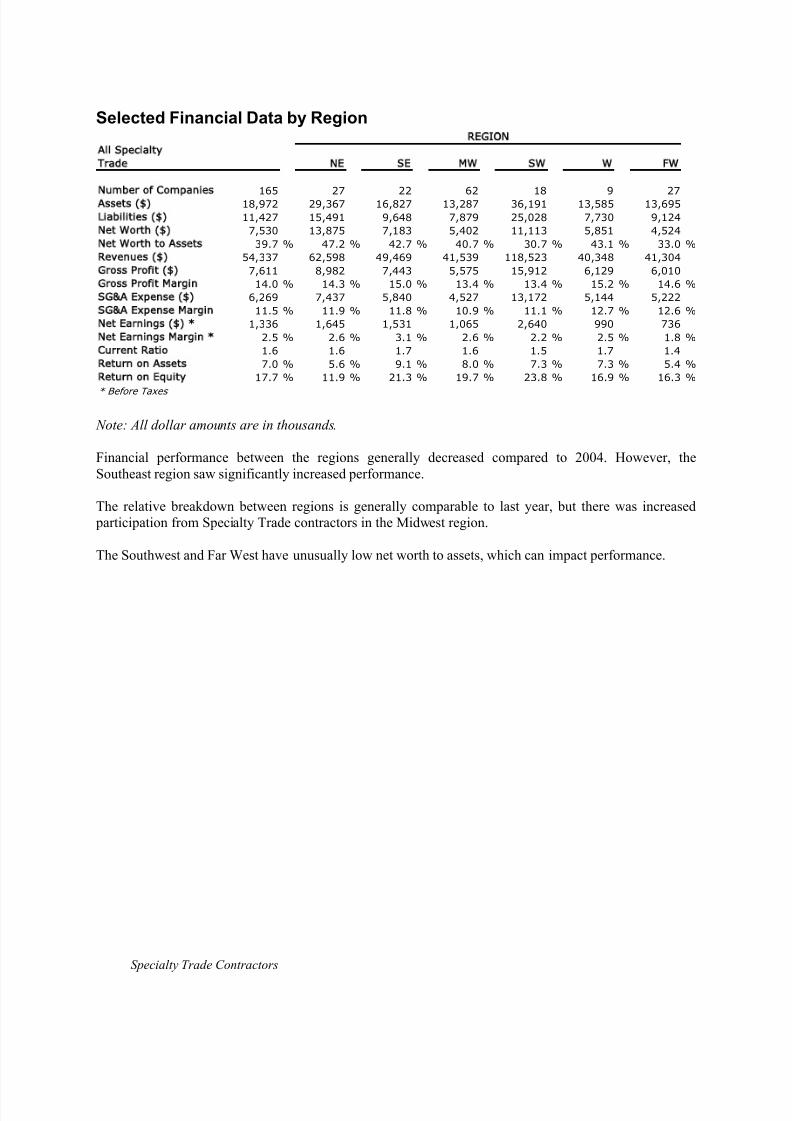
8/13/2019 2005 Financial Survey
http://slidepdf.com/reader/full/2005-financial-survey 212/284
Specialty Trade Contractors
Selected Financial Data by Region
All Specialty
Trade NE SE MW SW W FW
Number of Companies 165 27 22 62 18 9 27Assets ( ) 18,972 29,367 16,827 13,287 36,191 13,585 13,695
Liabilities ( ) 11,427 15,491 9,648 7,879 25,028 7,730 9,124
Net Worth ( ) 7,530 13,875 7,183 5,402 11,113 5,851 4,524
Net Worth to A ssets 39.7 % 47.2 % 42.7 % 40.7 % 30.7 % 43.1 % 33.0 %
Revenues ( ) 54,337 62,598 49,469 41,539 118,523 40,348 41,304
Gross Profit ( ) 7,611 8,982 7,443 5,575 15,912 6,129 6,010
Gross Profit Margin 14.0 % 14.3 % 15.0 % 13.4 % 13.4 % 15.2 % 14.6 %
SG&A Expense ( ) 6,269 7,437 5,840 4,527 13,172 5,144 5,222
SG&A Expense Margin 11.5 % 11.9 % 11.8 % 10.9 % 11.1 % 12.7 % 12.6 %
Net Earnings ( ) * 1,336 1,645 1,531 1,065 2,640 990 736
Net Earnings Margin * 2.5 % 2.6 % 3.1 % 2.6 % 2.2 % 2.5 % 1.8 %
Current Ratio 1.6 1.6 1.7 1.6 1.5 1.7 1.4
Return on Assets 7.0 % 5.6 % 9.1 % 8.0 % 7.3 % 7.3 % 5.4 %
Return on Equity 17.7 % 11.9 % 21.3 % 19.7 % 23.8 % 16.9 % 16.3 %
* Before Taxes
REGION
Note: All dollar amounts are in thousands.
Financial performance between the regions generally decreased compared to 2004. However, theSoutheast region saw significantly increased performance.
The relative breakdown between regions is generally comparable to last year, but there was increased participation from Specialty Trade contractors in the Midwest region.
The Southwest and Far West have unusually low net worth to assets, which can impact performance.

8/13/2019 2005 Financial Survey
http://slidepdf.com/reader/full/2005-financial-survey 213/284
Balance Sheet
2005 Participants 2004 Participants 2005 Participants 2004 Participants
Amount Percent Amount Percent Amount Percent Amount Percent
Current assets: Current liabilities:
Cash and cash equivalents $ 1,167,374 4.0 % $ 1,375,818 6.1 % Current maturity on long-term debt $ 549,235 1.9 % $ 307,340 1.4 %Marketable securities & short-term investments 137,079 0.5 755,128 3.3 Notes payable and lines of credit 1,025,927 3.5 850,188 3.8
Receivables: Accounts payable:
Contr act r ecei va ble s c urr ent ly du e 12, 153, 155 4 1.4 10, 477, 303 4 6.4 Tr ade, inc lu din g c urr ent ly due
Retainages on contracts 2,550,464 8.7 2,012,285 8.9 to subcontractors 4,506,051 15.3 3,833,955 17.0
Unbilled work 158,896 0.5 69,895 0.3 Subcontracts retainages 440,989 1.5 329,471 1.5
Other receivables 8,501 0.0 220,746 1.0 Other 511,662 1.7 206,220 0.9
Less allowance for doubtful accounts (243,189) (0.8) (177,346) (0.8) Total accounts payable 5,458,701 18.6 4,369,646 19.4
Total receivables, net: 14,627,827 49.8 12,602,883 55.8
Accrued expenses 2,184,749 7.4 1,199,624 5.3
Inventories 522,179 1.8 325,568 1.4 Billings in excess of costs and recognized
Costs and recognized earnings in excess earnings on uncompleted contracts 2,719,738 9.3 3,276,341 14.5
of billings on uncompleted contracts 1,885,243 6.4 1,358,958 6.0 Income taxes:
Investments in and advances to Current 62,999 0.2 78,269 0.3
construction joint ventures 0 0.0 2,954 0.0 Deferred 19,467 0.1 (3,048) (0.0)
Income taxes: Other current liabilities 91,702 0.3 258,158 1.1
Current/refundable 5,140 0.0 10,678 0.0 Total current liabilities 12,112,519 41.2 10,336,517 45.8
Deferred 146,585 0.5 40,582 0.2 Noncurrent liabilities
Other current assets 706,229 2.4 527,224 2.3 Long-term debt, excluding current maturities 2,846,780 9.7 1,456,509 6.5
Total current assets 19,197,656 65.4 16,999,794 75.3 Deferred income taxes 438,203 1.5 172,109 0.8
Other 93,492 0.3 235,729 1.0
Property, plant and equipment 7,854,530 26.7 6,180,832 27.4 Total liabilities 15,490,994 52.7 12,200,864 54.1
Less accumulated depreciation (4,829,906) (16.4) (4,346,127) (19.3) Minority interests 943 0.0 2,366 0.0
Property, plant and equipment, net 3,024,624 10.3 1,834,704 8.1 Net worth:
Common stock, par value 86,092 0.3 138,427 0.6
Noncurrent assets: Preferred stock, stated value 55,148 0.2 146,999 0.7
Long-term investments 133,919 0.5 172,716 0.8 Additional paid-in capital 8,652,557 29.5 4,951,726 21.9
Deferred income taxes 7,730 0.0 43,913 0.2 Retained earnings 5,331,095 18.2 5,580,225 24.7
Other assets 7,003,161 23.8 3,518,127 15.6 Treasury stock (248,220) (0.8) (335,712) (1.5)
Total noncurrent assets 7,144,810 24.3 3,734,756 16.5 Excess value of marketable securities 24,791 0.1 23,806 0.1
Other equity (26,310) (0.1) (139,448) (0.6)
Total net worth 13,875,153 47.2 10,366,023 45.9
Total assets $ 29,367,090 100.0 % $ 22,569,254 100.0 % Total liabilities and net worth $ 29,367,090 100.0 % $ 22,569,254 100.0 %
Statement of Earnings Financial Ratios
2005 Participants 2004 Participants 2005 Participants 2004 Participants
Amount Percent Average Median Average Median Average Median
Contract revenue $ 58,429,804 93.3 % $ 51,424,237 96.5 % Liquidity Ratios
Other revenue 4,168,167 6.7 1,867,073 3.5
Total Revenue 62,597,971 100.0 53,291,310 100.0 Current Ratio 1.6 1.5 1.6 1.6
Quick Ratio 1.3 1.2 1.4 1.4
Contract cost (50,191,694) (80.2) (44,324,818) (83.2) Days of Cash 6.7 3.4 9.3 4.7
Other cost (3,424,053) (5.5) (1,384,310) (2.6) Working Capital Turnover 8.8 9.8 8.0 9.5
Total cost (53,615,747) (85.7) (45,709,128) (85.8)
Profitability Ratios
Gross Profit 8,982,224 14.3 7,582,182 14.2
Return on Assets * 5.6 % 6.1 % 6.7 % 3.4 %
Selling, general & administrative expenses: Return on Equity * 11.9 % 16.7 % 14.7 % 8.8 %
Payroll (3,578,787) (5.7) (3,266,625) (6.1) Times Interest Earned 8.3 8.5 14.6 4.3
Professional fees (185,647) (0.3) (189,433) (0.4)
Sales & marketing costs (166,689) (0.3) (209,422) (0.4) Leverage Ratios
Technology costs (66,793) (0.1) (81,483) (0.2)
Administrative bonuses (217,990) (0.3) (354,595) (0.7) Debt to Equity 1.1 1.6 1.2 1.6
Other (3,220,641) (5.1) (1,943,420) (3.6) Revenue to Equity 4.5 7.9 5.1 8.1
Total SG&A expenses (7,436,547) (11.9) (6,044,979) (11.3) Asset Turnover 2.1 2.9 2.4 2.8
Fixed Asset Ratio 21.8 % 19.6 % 17.7 % 20.1 %
Income from operations 1,545,677 2.5 1,537,203 2.9 Equity to SG&A Expense 1.9 1.2 1.7 1.1
Underbillings to Equity 14.7 % 16.6 % 13.8 % 13.3 %
Interest income 16,885 0.0 39,724 0.1 Backlog to Equity 10.6 4.1 4.0 3.9
Interest expense (224,016) (0.4) (111,751) (0.2)
Other income / (expense), net 306,160 0.5 55,112 0.1
Efficiency Ratios
Net ear ni ngs / ( los s) bef or e i nco me t axes 1, 644 ,70 6 2. 6 1 ,52 0,28 8 2. 9
Backlog to Working Capital 8.3 5.4 5.4 4.4
Income tax (expense) / benefit (381,204) (0.6) (121,941) (0.2) Months in Backlog 7.7 6.3 5.4 5.6
Days in Accounts Receivable 68.5 70.1 71.1 66.7
Net earnings $ 1,263,502 2.0 % $ 1,398,347 2.6 % Days in Inventory 3.5 5.1 2.6 2.6
Days in Accounts Payable 33.7 30.5 31.8 24.2
Operating Cycle 45.1 45.6 51.1 49.4
Number of ParticipantsNumber
2005 272004 35
Note: Not all figures will apear to sum due to rounding.
* In theCFMA's 2005 Annual Financial Study, Returnon Assets(ROA)and Returnon Equity (ROE) are calculated using
net earnings (loss) before income taxes. Studies conducted in prior years used net earnings (loss) after taxes to
calculate ROA and ROE. All references to ROAs and ROEs from prior studies have been updated to reflect this change.
Specialty Trade Contractors
Specialty Trade ContractorsNortheast Region
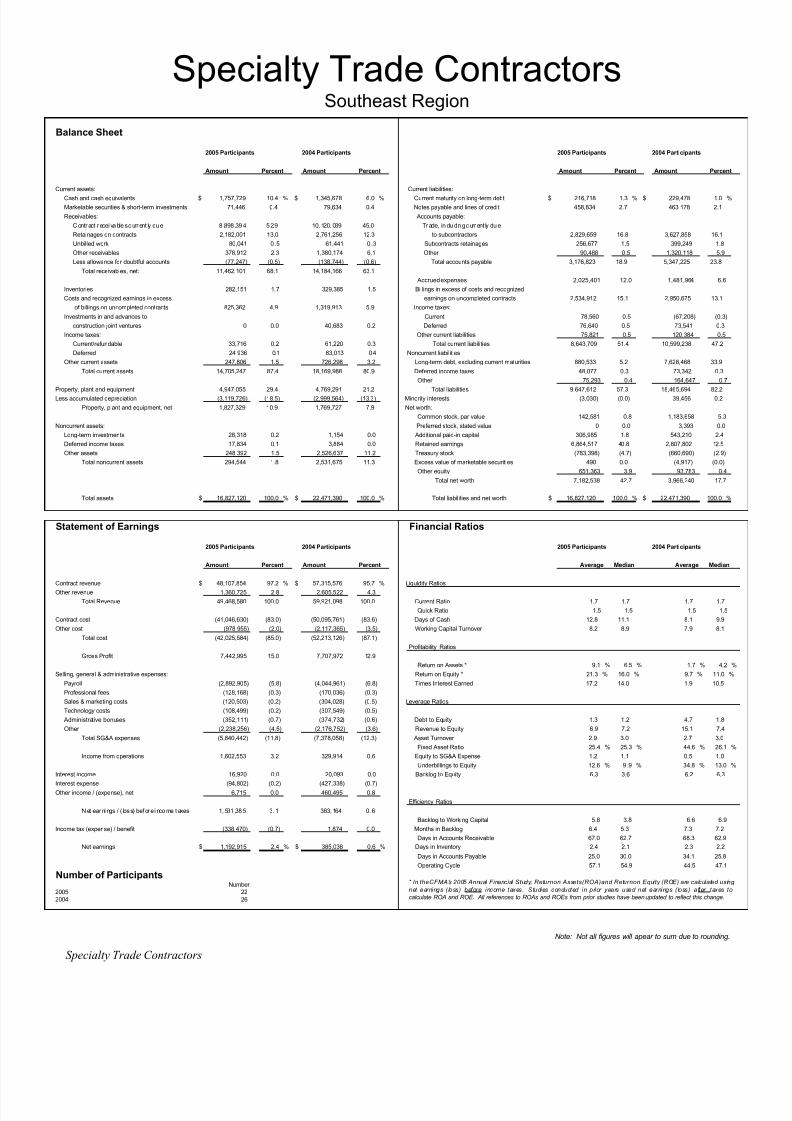
8/13/2019 2005 Financial Survey
http://slidepdf.com/reader/full/2005-financial-survey 214/284
Balance Sheet
2005 Participants 2004 Participants 2005 Participants 2004 Participants
Amount Percent Amount Percent Amount Percent Amount Percent
Current assets: Current liabilities:
Cash and cash equivalents $ 1,757,729 10.4 % $ 1,345,678 6.0 % Current maturity on long-term debt $ 216,718 1.3 % $ 229,478 1.0 %
Marketable securities & short-term investments 71,446 0.4 79,634 0.4 Notes payable and lines of credit 458,834 2.7 463,178 2.1
Receivables: Accounts payable:
Contr act r ecei va ble s c urr ent ly du e 8 ,898 ,39 4 5 2.9 10, 120, 039 45.0 Tr ade, in clu din g c urr ent ly du e
Retainages on contracts 2,182,001 13.0 2,761,256 12.3 to subcontractors 2,829,659 16.8 3,627,858 16.1
Unbilled work 80,041 0 .5 61,441 0 .3 Subcontracts retainages 256,677 1.5 399,249 1.8
Other receivables 378,912 2.3 1,380,174 6.1 Other 90,488 0.5 1,320,118 5.9
Less allowance for doubtful accounts (77,247) (0.5) (138,744) (0.6) Total accounts payable 3,176,823 18.9 5,347,225 23.8
Total receivables, net: 11,462,101 68.1 14,184,166 63.1
Accrued expenses 2,025,401 12.0 1,481,964 6.6
Inventories 282,151 1.7 329,385 1.5 Billings in excess of costs and recognized
Costs and recognized earnings in excess earnings on uncompleted contracts 2,534,912 15.1 2,950,675 13.1
of billings on uncompleted contracts 825,362 4.9 1,319,913 5.9 Income taxes:
Investments in and advances to Current 78,560 0.5 (67,208) (0.3)
construction joint ventures 0 0.0 40,683 0.2 Deferred 76,640 0.5 73,541 0.3
Income taxes: Other current liabilities 75,821 0.5 120,384 0.5
Current/refundable 33,716 0.2 61,220 0.3 Total current liabilities 8,643,709 51.4 10,599,238 47.2
Deferred 24,936 0.1 83,013 0.4 Noncurrent liabilities
Other current assets 247,806 1.5 726,298 3.2 Long-term debt, excluding current maturities 880,533 5.2 7,628,468 33.9
Total current assets 14,705,247 87.4 18,169,988 80.9 Deferred income taxes 48,077 0.3 73,342 0.3
Other 75,293 0.4 164,647 0.7
Property, plant and equipment 4,947,055 29.4 4,769,291 21.2 Total liabilities 9,647,612 57.3 18,465,694 82.2
Less accumulated depreciation (3,119,726) (18.5) (2,999,564) (13.3) Minority interests (3,030) (0.0) 39,456 0.2
Property, plant and equipment, net 1,827,329 10.9 1,769,727 7.9 Net worth:
Common stock, par value 142,581 0.8 1,183,658 5.3
Noncurrent assets: Preferred stock, stated value 0 0.0 3,393 0.0
Long-term investments 28,318 0.2 1,154 0.0 Additional paid-in capital 306,985 1.8 543,210 2.4
Deferred income taxes 17,834 0.1 3,884 0.0 Retained earnings 6,864,517 40.8 2,807,802 12.5
Other assets 248,392 1.5 2,526,637 11.2 Treasury stock (783,398) (4.7) (660,690) (2.9)
Total noncurrent assets 294,544 1.8 2,531,675 11.3 Excess value of marketable securities 490 0.0 (4,917) (0.0)
Other equity 651,363 3.9 93,783 0.4
Total net worth 7,182,538 42.7 3,966,240 17.7
Total assets $ 16,827,120 100.0 % $ 22,471,390 100.0 % Total liabilities and net worth $ 16,827,120 100.0 % $ 22,471,390 100.0 %
Statement of Earnings Financial Ratios
2005 Participants 2004 Participants 2005 Participants 2004 Participants
Amount Percent Amount Percent Average Median Average Median
Contract revenue $ 48,107,854 97.2 % $ 57,315,576 95.7 % Liquidity Ratios
Other revenue 1,360,725 2.8 2,605,522 4.3
Total Revenue 49,468,580 100.0 59,921,098 100.0 Current Ratio 1.7 1.7 1.7 1.7
Quick Ratio 1.5 1.5 1.5 1.5
Contract cost (41,046,630) (83.0) (50,095,761) (83.6) Days of Cash 12.8 11.1 8.1 9.9
Other cost (978,955) (2.0) (2,117,365) (3.5) Working Capital Turnover 8.2 8.9 7.9 8.1
Total cost (42,025,584) (85.0) (52,213,126) (87.1)
Profitability Ratios
Gross Profit 7,442,995 15.0 7,707,972 12.9
Return on Assets * 9.1 % 6.5 % 1.7 % 4.2 %
Selling, general & administrative expenses: Return on Equity * 21.3 % 16.0 % 9.7 % 11.0 %
Payroll (2,892,905) (5.8) (4,044,961) (6.8) Times Interest Earned 17.2 14.0 1.9 10.5
Professional fees (128,168) (0.3) (170,036) (0.3)
Sales & marketing costs (120,503) (0.2) (304,028) (0.5) Leverage Ratios
Technology costs (108,499) (0.2) (307,549) (0.5)
Administrative bonuses (352,111) (0.7) (374,732) (0.6) Debt to Equity 1.3 1.2 4.7 1.8
Other (2,238,256) (4.5) (2,176,752) (3.6) Revenue to Equity 6.9 7.2 15.1 7.4
Total SG&A expenses (5,840,442) (11.8) (7,378,058) (12.3) Asset Turnover 2.9 3.0 2.7 3.0
Fixed Asset Ratio 25.4 % 25.3 % 44.6 % 26.1 %
Income from operations 1,602,553 3.2 329,914 0.6 Equity to SG&A Expense 1.2 1.1 0.5 1.0
Underbillings to Equity 12.6 % 9 .9 % 34.8 % 13.0 %
Interest income 16,920 0.0 20,093 0.0 Backlog to Equity 6.3 3.6 6.2 6.3
Interest expense (94,802) (0.2) (427,338) (0.7)Other income / (expense), net 6,715 0.0 460,495 0.8
Efficiency Ratios
Net ear ni ngs / ( los s) bef or e i nco me t axes 1, 531 ,38 5 3. 1 383, 164 0. 6
Backlog to Working Capital 5.8 3.8 6.6 6.9
Income tax (expense) / benefit (338,470) (0.7) 1,874 0.0 Months in Backlog 6.4 5.3 7.3 7.2
Days in Accounts Receivable 67.0 62.7 68.3 62.9
Net earnings $ 1,192,915 2.4 % $ 385,038 0.6 % Days in Inventory 2.4 2.1 2.3 2.2
Days in Accounts Payable 25.0 30.0 34.1 25.8
Operating Cycle 57.1 54.9 44.5 47.1
Number of ParticipantsNumber
2005 222004 26
Note: Not all figures will apear to sum due to rounding.
Specialty Trade Contractors
Specialty Trade Contractors
Southeast Region
* In theCFMA's 2005 Annual Financial Study, Returnon Assets(ROA)and Returnon Equity (ROE) are calculated using
net earnings (loss) before income taxes. Studies conducted in prior years used net earnings (loss) after taxes to
calculate ROA and ROE. All references to ROAs and ROEs from prior studies have been updated to reflect this change.

8/13/2019 2005 Financial Survey
http://slidepdf.com/reader/full/2005-financial-survey 215/284

8/13/2019 2005 Financial Survey
http://slidepdf.com/reader/full/2005-financial-survey 216/284
Balance Sheet
2005 Participants 2004 Participants 2005 Participants 2004 Participants
Amount Percent Amount Percent Amount Percent Amount Percent
Current assets: Current liabilities:
Cash and cash equivalents $ 2,127,989 5.9 % $ 1,446,885 5.9 % Current maturity on long-term debt $ 500,357 1.4 % $ 263,541 1.1 %
Marketable securities & short-term investments 214,815 0.6 287,449 1.2 Notes payable and lines of credit 2,401,286 6.6 645,138 2.6
Receivables: Accounts payable:
Contr act r ecei va ble s c urr ent ly du e 20, 843, 816 5 7.6 13, 098, 428 5 3.7 Tr ade, inc lu din g c urr ent ly due
Retainages on contracts 3,979,810 11.0 2,142,463 8.8 to subcontractors 5,315,964 14.7 3,634,388 14.9
Unbilled work 30,306 0.1 58,867 0.2 Subcontracts retainages 92,189 0.3 113,649 0.5
Other receivables 162,457 0.4 183,793 0.8 Other 101,705 0.3 109,132 0.4
Less allowance for doubtful accounts (174,831) (0.5) (222,496) (0.9) Total accounts payable 5,509,858 15.2 3,857,168 15.8
Total receivables, net: 24,841,558 68.6 15,261,054 62.6
Accrued expenses 5,036,173 13.9 2,280,936 9.4
Inventories 650,720 1.8 309,191 1.3 Billings in excess of costs and recognized
Costs and recognized earnings in excess earnings on uncompleted contracts 5,717,035 15.8 4,399,905 18.0
of billings on uncompleted contracts 2,514,742 6.9 2,081,676 8.5 Income taxes:
Investments in and advances to Current 35,171 0.1 52,991 0.2
construction joint ventures 105,722 0.3 160,580 0.7 Deferred 27,239 0.1 2,111 0.0
Income taxes: Other current liabilities 1,576,603 4.4 385,127 1.6
Current/refundable 10,164 0.0 38,783 0.2 Total current liabilities 20,803,722 57.5 11,886,919 48.7
Deferred 14,171 0.0 0 0.0 Noncurrent liabilities
Other current assets 1,285,031 3.6 498,119 2.0 Long-term debt, excluding current maturities 3,513,911 9.7 1,741,412 7.1
Total current assets 31,764,912 87.8 20,083,737 82.4 Deferred income taxes 50,657 0.1 57,653 0.2
Other 660,189 1.8 2,082,775 8.5
Property, plant and equipment 8,029,756 22.2 7,952,754 32.6 Total liabilities 25,028,478 69.2 15,768,758 64.7
Less accumulated depreciation (4,724,153) (13.1) (5,167,380) (21.2) Minority interests 48,893 0.1 64 0.0
Property, plant and equipment, net 3,305,603 9.1 2,785,375 11.4 Net worth:
Common stock, par value 231,665 0.6 866,548 3.6
Noncurrent assets: Preferred stock, stated value 0 0.0 0 0.0
Long-term investments 147,745 0.4 186,270 0.8 Additional paid-in capital 4,746,837 13.1 374,786 1.5
Deferred income taxes 114,724 0.3 0 0.0 Retained earnings 9,240,956 25.5 7,829,455 32.1
Other assets 857,777 2.4 1,332,129 5.5 Treasury stock (5,299,934) (14.6) (1,054,929) (4.3)
Total noncurrent assets 1,120,246 3.1 1,518,399 6.2 Excess value of marketable securities 0 0.0 5,458 0.0
Other equity 2,193,865 6.1 597,370 2.4
Total net worth 11,113,390 30.7 8,618,688 35.3
Total assets $ 36,190,761 100.0 % $ 24,387,510 100.0 % Total liabilities and net worth $ 36,190,761 100.0 % $ 24,387,510 100.0 %
Statement of Earnings Financial Ratios
2005 Participants 2004 Participants 2005 Participants 2004 Participants
Amount Percent Amount Percent Average Median Average Median
Contract revenue $ 115,125,380 97.1 % $ 69,769,675 99.1 % Liquidity Ratios
Other revenue 3,397,227 2.9 661,116 0.9
Total Revenue 118,522,608 100.0 70,430,790 100.0 Current Ratio 1.5 1.6 1.7 1.5
Quick Ratio 1.3 1.4 1.4 1.3
Contract cost (100,211,609) (84.6) (60,623,647) (86.1) Days of Cash 6.5 7.0 7.4 5.8
Other cost (2,399,017) (2.0) (613,456) (0.9) Working Capital Turnover 10.8 11.0 8.6 11.2
Total cost (102,610,626) (86.6) (61,237,104) (86.9)
Profitability Ratios
Gross Profit 15,911,982 13.4 9,193,687 13.1
Return on Assets * 7.3 % 7.3 % 8.3 % 7.1 %
Selling, general & administrative expenses: Return on Equity * 23.8 % 23.8 % 23.4 % 13.0 %
Payroll (5,103,397) (4.3) (3,661,521) (5.2) Times Interest Earned 12.9 9.2 13.7 8.7
Professional fees (318,015) (0.3) (227,459) (0.3)
Sales & marketing costs (181,628) (0.2) (399,458) (0.6) Leverage Ratios
Technology costs (248,007) (0.2) (162,474) (0.2)
Administrative bonuses (401,381) (0.3) (414,364) (0.6) Debt to Equity 2.3 1.8 1.8 1.8
Other (6,919,989) (5.8) (2,601,727) (3.7) Revenue to Equity 10.7 9.8 8.2 7.5
Total SG&A expenses (13,172,417) (11.1) (7,467,002) (10.6) Asset Turnover 3.3 3.0 2.9 2.8
Fixed Asset Ratio 29.7 % 23.9 % 32.3 % 34.1 %
Income from operations 2,739,565 2.3 1,726,685 2.5 Equity to SG&A Expense 0.8 0.9 1.2 1.1
Underbillings to Equity 22.9 % 15.6 % 24.8 % 18.2 %
Interest income 39,305 0.0 34,204 0.0 Backlog to Equity 5.9 4.3 5.1 2.3
Interest expense (221,304) (0.2) (159,099) (0.2)Other income / (expense), net 82,397 0.1 412,276 0.6
Efficiency Ratios
Net ear ni ngs / ( los s) bef or e i nco me t axes 2, 639 ,96 3 2. 2 2 ,01 4,06 6 2. 9
Backlog to Working Capital 5.7 5.4 11.6 3.1
Income tax (expense) / benefit (111,834) (0.1) (97,186) (0.1) Months in Backlog 5.2 6.1 5.2 5.0
Days in Accounts Receivable 63.3 69.9 66.8 62.9
Net earnings $ 2,528,129 2.1 % $ 1,916,880 2.7 % Days in Inventory 2.3 2.9 1.8 1.3
Days in Accounts Payable 19.0 25.1 22.0 22.3
Operating Cycle 53.0 53.3 54.0 51.8
Number of ParticipantsNumber
2005 182004 18
Note: Not all figures will apear to sum due to rounding.
* In theCFMA's 2005 Annual Financial Study, Returnon Assets(ROA)and Returnon Equity (ROE) are calculated using
net earnings (loss) before income taxes. Studies conducted in prior years used net earnings (loss) after taxes to
calculate ROA and ROE. All references to ROAs and ROEs from prior studies have been updated to reflect this change.
Southwest Region
Specialty Trade Contractors
Specialty Trade Contractors

8/13/2019 2005 Financial Survey
http://slidepdf.com/reader/full/2005-financial-survey 217/284
Balance Sheet
2005 Participants 2004 Participants 2005 Participants 2004 Participants
Amount Percent Amount Percent Amount Percent Amount Percent
Current assets: Current liabilities:
Cash and cash equivalents $ 574,449 4.2 % $ 598,479 6.7 % Current maturity on long-term debt $ 161,939 1.2 % $ 228,604 2.5 %
Marketable securities & short-term investments 101,323 0.7 104,778 1.2 Notes payable and lines of credit 999,055 7.4 903,103 10.1
Receivables: Accounts payable:
Contr act r ecei va ble s c urr ent ly du e 7 ,890 ,89 0 5 8.1 4 ,61 0,49 0 51.3 Tr ade, in clu din g c urr ent ly du e
Retainages on contracts 1,554,812 11.4 601,887 6.7 to subcontractors 2,728,715 20.1 1,541,001 17.2
Unbilled work 9,004 0.1 544,564 6.1 Subcontracts retainages 237,369 1.7 72,889 0.8
Other receivables 92,029 0.7 70,419 0.8 Other 12,677 0.1 86,547 1.0
Less allowance for doubtful accounts (1,111) (0.0) (11,422) (0.1) Total accounts payable 2,978,760 21.9 1,700,436 18.9
Total receivables, net: 9,545,623 70.3 5,815,938 64.8
Accrued expenses 1,534,517 11.3 750,345 8.4
Inventories 144,644 1.1 92,059 1.0 Billings in excess of costs and recognized
Costs and recognized earnings in excess earnings on uncompleted contracts 1,518,808 11.2 1,022,842 11.4
of billings on uncompleted contracts 1,464,485 10.8 791,217 8.8 Income taxes:
Investments in and advances to Current 0 0.0 4,128 0.0
construction joint ventures 0 0.0 0 0.0 Deferred 0 0.0 10,426 0.1
Income taxes: Other current liabilities 8,223 0.1 179,740 2.0
Current/refundable 15,418 0.1 0 0.0 Total current liabilities 7,201,303 53.0 4,799,624 53.5
Deferred 0 0.0 8,888 0.1 Noncurrent liabilities
Other current assets 211,659 1.6 326,595 3.6 Long-term debt, excluding current maturities 443,041 3.3 1,272,012 14.2
Total current assets 12,057,601 88.8 7,737,953 86.2 Deferred income taxes 0 0.0 10,332 0.1
Other 85,530 0.6 162,073 1.8
Property, plant and equipment 2,715,373 20.0 2,249,984 25.1 Total liabilities 7,729,874 56.9 6,244,041 69.5
Less accumulated depreciation (1,342,812) (9.9) (1,177,117) (13.1) Minority interests 4,648 0.0 3,240 0.0
Property, plant and equipment, net 1,372,561 10.1 1,072,866 11.9 Net worth:
Common stock, par value 258,268 1.9 62,244 0.7
Noncurrent assets: Preferred stock, stated value 0 0.0 6,687 0.1
Long-term investments 0 0.0 0 0.0 Additional paid-in capital 116,051 0.9 88,379 1.0
Deferred income taxes 0 0.0 18,554 0.2 Retained earnings 5,481,144 40.3 2,630,003 29.3
Other assets 155,326 1.1 149,866 1.7 Treasury stock (2,500) (0.0) (150,511) (1.7)
Total noncurrent assets 155,326 1.1 168,420 1.9 Excess value of marketable securities (1,997) (0.0) 0 0.0
Other equity 0 0.0 95,158 1.1
Total net worth 5,850,966 43.1 2,731,959 30.4
Total assets $ 13,585,488 100.0 % $ 8,979,239 100.0 % Total liabilities and net worth $ 13,585,488 100.0 % $ 8,979,239 100.0 %
Statement of Earnings Financial Ratios
2005 Participants 2004 Participants 2005 Participants 2004 Participants
Amount Percent Amount Percent Average Median Average Median
Contract revenue $ 39,799,405 98.6 % $ 26,579,002 98.4 % Liquidity Ratios
Other revenue 548,749 1.4 435,566 1.6
Total Revenue 40,348,155 100.0 27,014,569 100.0 Current Ratio 1.7 1.5 1.6 1.9
Quick Ratio 1.4 1.2 1.4 1.5
Contract cost (33,957,412) (84.2) (22,987,567) (85.1) Days of Cash 5.1 1.6 8.0 8.3
Other cost (261,315) (0.6) (392,296) (1.5) Working Capital Turnover 8.3 12.6 9.2 9.7
Total cost (34,218,728) (84.8) (23,379,863) (86.5)
Profitability Ratios
Gross Profit 6,129,427 15.2 3,634,706 13.5
Return on Assets * 7.3 % 3.4 % 8.1 % 7.2 %
Selling, general & administrative expenses: Return on Equity * 16.9 % 19.4 % 26.5 % 16.4 %
Payroll (2,015,413) (5.0) (1,185,651) (4.4) Times Interest Earned 16.2 12.9 8.4 6.6
Professional fees (156,880) (0.4) (77,535) (0.3)
Sales & marketing costs (190,768) (0.5) (29,838) (0.1) Leverage Ratios
Technology costs (71,639) (0.2) (29,238) (0.1)
Administrative bonuses (186,964) (0.5) (193,088) (0.7) Debt to Equity 1.3 2.1 2.3 1.3
Other (2,522,220) (6.3) (1,474,990) (5.5) Revenue to Equity 6.9 9.5 9.9 7.5
Total SG&A expenses (5,143,885) (12.7) (2,990,339) (11.1) Asset Turnover 3.0 3.1 3.0 3.0
Fixed Asset Ratio 23.5 % 41.1 % 39.3 % 41.7 %
Income from operations 985,542 2.4 644,367 2.4 Equity to SG&A Expense 1.1 0.7 0.9 0.8
Underbillings to Equity 25.2 % 27.2 % 48.9 % 21.8 %
Interest income 8,947 0.0 12,824 0.0 Backlog to Equity 5.8 5.9 6.0 3.5
Interest expense (64,912) (0.2) (97,378) (0.4)Other income / (expense), net 60,213 0.1 163,583 0.6
Efficiency Ratios
Net earnings / (loss) before income taxes 989,790 2.5 723,395 2.7
Backlog to Working Capital 7.7 7.2 4.5 4.5
Income tax (expense) / benefit (42,550) (0.1) (33,028) (0.1) Months in Backlog 8.3 7.5 6.2 6.4
Days in Accounts Receivable 71.2 59.7 62.2 63.0
Net earnings $ 947,240 2.3 % $ 690,367 2.6 % Days in Inventory 1.5 1.7 1.4 1.4
Days in Accounts Payable 28.8 28.3 25.1 27.0
Operating Cycle 49.0 41.4 46.6 45.5
Number of ParticipantsNumber
2005 92004 11
Note: Not all figures will apear to sum due to rounding.
* In theCFMA's 2005 Annual Financial Study, Returnon Assets(ROA)and Returnon Equity (ROE) are calculated using
net earnings (loss) before income taxes. Studies conducted in prior years used net earnings (loss) after taxes to
calculate ROA and ROE. All references to ROAs and ROEs from prior studies have been updated to reflect this change.
West Region
Specialty Trade Contractors
Specialty Trade Contractors

8/13/2019 2005 Financial Survey
http://slidepdf.com/reader/full/2005-financial-survey 218/284
Balance Sheet
2005 Participants 2004 Participants 2005 Participants 2004 Participants
Amount Percent Amount Percent Amount Percent Amount Percent
Current assets: Current liabilities:
Cash and cash equivalents $ 1,018,558 7.4 % $ 1,109,086 9.6 % Current maturity on long-term debt $ 353,966 2.6 % $ 242,308 2.1 %
Marketable securities & short-term investments 578,634 4.2 67,693 0.6 Notes payable and lines of credit 1,317,269 9.6 484,428 4.2
Receivables: Accounts payable:
Contr act r ecei va ble s c urr ent ly du e 6 ,293 ,23 9 4 6.0 6 ,44 9,54 1 55.7 Tr ade, in clu din g c urr ent ly du e
Retainages on contracts 1,429,823 10.4 1,057,789 9.1 to subcontractors 2,787,455 20.4 2,270,633 19.6
Unbilled work 418,880 3.1 180,438 1.6 Subcontracts retainages 220,554 1.6 185,433 1.6
Other receivables 260,642 1.9 88,116 0.8 Other 97,902 0.7 149,238 1.3
Less allowance for doubtful accounts (28,621) (0.2) (90,644) (0.8) Total accounts payable 3,105,911 22.7 2,605,304 22.5
Total receivables, net: 8,373,962 61.1 7,685,239 66.4
Accrued expenses 1,289,399 9.4 1,329,664 11.5
Inventories 222,236 1.6 183,663 1.6 Billings in excess of costs and recognized
Costs and recognized earnings in excess earnings on uncompleted contracts 2,105,644 15.4 1,340,659 11.6
of billings on uncompleted contracts 1,407,619 10.3 838,838 7.2 Income taxes:
Investments in and advances to Current 15,449 0.1 7,316 0.1
construction joint ventures 57,447 0.4 0 0.0 Deferred 4,903 0.0 18,785 0.2
Income taxes: Other current liabilities 397,578 2.9 165,213 1.4
Current/refundable 9,434 0.1 19,624 0.2 Total current liabilities 8,590,118 62.7 6,193,678 53.5
Deferred 13,985 0.1 23,401 0.2 Noncurrent liabilities
Other current assets 383,173 2.8 331,712 2.9 Long-term debt, excluding current maturities 449,262 3.3 318,816 2.8
Total current assets 12,065,048 88.1 10,259,256 88.6 Deferred income taxes 18,651 0.1 41,818 0.4
Other 66,001 0.5 50,232 0.4
Property, plant and equipment 3,950,841 28.8 2,910,975 25.1 Total liabilities 9,124,031 66.6 6,604,543 57.0
Less accumulated depreciation (2,543,610) (18.6) (1,756,255) (15.2) Minority interests 47,720 0.3 0 0.0
Property, plant and equipment, net 1,407,231 10.3 1,154,720 10.0 Net worth:
Common stock, par value 320,778 2.3 262,005 2.3
Noncurrent assets: Preferred stock, stated value 2,593 0.0 84,667 0.7
Long-term investments 47,476 0.3 0 0.0 Additional paid-in capital 561,095 4.1 843,305 7.3
Deferred income taxes 557 0.0 987 0.0 Retained earnings 2,472,545 18.1 3,372,715 29.1
Other assets 174,983 1.3 165,319 1.4 Treasury stock 0 0.0 (41,008) (0.4)
Total noncurrent assets 223,016 1.6 166,306 1.4 Excess value of marketable securities 6,396 0.0 2,580 0.0
Other equity 1,160,137 8.5 451,474 3.9
Total net worth 4,523,543 33.0 4,975,739 43.0
Total assets $ 13,695,294 100.0 % $ 11,580,282 100.0 % Total liabilities and net worth $ 13,695,294 100.0 % $ 11,580,282 100.0 %
Statement of Earnings Financial Ratios
2005 Participants 2004 Participants 2005 Participants 2004 Participants
Amount Percent Amount Percent Average Median Average Median
Contract revenue $ 40,598,380 98.3 % $ 33,290,690 96.2 Liquidity Ratios
Other revenue 705,539 1.7 1,302,507 3.8
Total Revenue 41,303,919 100.0 34,593,198 100.0 Current Ratio 1.4 1.5 1.7 1.5
Quick Ratio 1.2 1.3 1.4 1.3
Contract cost (34,744,633) (84.1) (28,559,365) (82.6) Days of Cash 8.9 5.7 11.5 6.4
Other cost (549,507) (1.3) (981,142) (2.8) Working Capital Turnover 11.9 9.7 8.5 10.2
Total cost (35,294,140) (85.4) (29,540,507) (85.4)
Profitability Ratios
Gross Profit 6,009,778 14.6 5,052,691 14.6
Return on Assets * 5.4 % 7.9 % 8.6 % 3.7 %
Selling, general & administrative expenses: Return on Equity * 16.3 % 18.0 % 20.1 % 16.4 %
Payroll (2,176,652) (5.3) (2,258,839) (6.5) Times Interest Earned 8.8 8.4 15.1 5.3
Professional fees (99,290) (0.2) (98,831) (0.3)
Sales & marketing costs (427,659) (1.0) (83,326) (0.2) Leverage Ratios
Technology costs (53,698) (0.1) (89,728) (0.3)
Administrative bonuses (217,194) (0.5) (206,256) (0.6) Debt to Equity 2.0 1.7 1.3 1.5
Other (2,247,467) (5.4) (1,283,024) (3.7) Revenue to Equity 9.1 8.5 7.0 7.8
Total SG&A expenses (5,221,959) (12.6) (4,020,003) (11.6) Asset Turnover 3.0 2.9 3.0 2.9
Fixed Asset Ratio 31.1 % 23.5 % 23.2 % 35.5 %
Income from operations 787,819 1.9 1,032,688 3.0 Equity to SG&A Expense 0.9 1.1 1.2 1.0
Underbillings to Equity 40.4 % 19.2 % 20.5 % 13.3 %
Interest income 36,672 0.1 15,054 0.0 Backlog to Equity 4.3 2.3 4.5 3.3
Interest expense (94,746) (0.2) (71,192) (0.2)Other income / (expense), net 5,909 0.0 24,618 0.1
Efficiency Ratios
Net ear ni ngs / ( los s) bef or e i nco me t axes 735, 655 1. 8 1 ,00 1,16 7 2. 9
Backlog to Working Capital 18.1 2.9 4.9 3.8
Income tax (expense) / benefit (49,565) (0.1) (41,510) (0.1) Months in Backlog 5.9 4.9 6.4 6.4
Days in Accounts Receivable 56.9 58.6 67.1 61.8
Net earnings $ 686,090 1.7 % $ 959,657 2.8 Days in Inventory 2.3 2.3 2.2 2.0
Days in Accounts Payable 29.4 26.5 29.5 27.4
Operating Cycle 38.6 56.4 51.4 54.0
Number of ParticipantsNumber
2005 272004 30
Note: Not all figures will apear to sum due to rounding.
* In theCFMA's 2005 Annual Financial Study, Returnon Assets(ROA)and Returnon Equity (ROE) are calculated using
net earnings (loss) before income taxes. Studies conducted in prior years used net earnings (loss) after taxes to
calculate ROA and ROE. All references to ROAs and ROEs from prior studies have been updated to reflect this change.
Specialty Trade Contractors
Specialty Trade Contractors
Far West Region

8/13/2019 2005 Financial Survey
http://slidepdf.com/reader/full/2005-financial-survey 219/284
Specialty Trade Contractors
Selected Financial Data by Revenue
All Sp ecialty
Trade 0- 10M 10- 25M 25- 50M 50- 100M > 100M
Number of Companies 165 26 48 36 28 27Assets ( ) 18,972 2,288 6,196 12,747 22,024 62,885
Liabilities ( ) 11,427 1,490 3,474 7,938 14,058 37,058
Net Worth ( ) 7,530 799 2,720 4,804 7,965 25,746
Net Worth to Assets 39.7 % 34.9 % 43.9 % 37.7 % 36.2 % 40.9 %
Revenues ( ) 54,337 6,759 17,072 34,882 65,035 181,249
Gross Profit ( ) 7,611 1,259 2,960 4,962 8,958 24,131
Gross Profit Margin 14.0 % 18.6 % 17.3 % 14.2 % 13.8 % 13.3 %
SG&A Expense ( ) 6,269 1,092 2,430 4,374 7,593 19,232
SG&A Expense Margin 11.5 % 16.2 % 14.2 % 12.5 % 11.7 % 10.6 %
Net Earnings ( ) * 1,336 138 550 642 1,244 4,906
Net Earnings Margin * 2.5 % 2.0 % 3.2 % 1.8 % 1.9 % 2.7 %
Current Ratio 1.6 1.5 1.7 1.5 1.5 1.6
Return on Assets 7.0 % 6.0 % 8.9 % 5.0 % 5.6 % 7.8 %
Return on Equity 17.7 % 17.3 % 20.2 % 13.4 % 15.6 % 19.1 %* Before Taxes
ANNUAL REVENUE
Note: All dollar amounts are in thousands.
ROA and ROE were highest for Specialty Trade contractors with $10–$25M and greater than $100M inrevenue.
The smaller companies (less than $25M) saw increases in the net margin before income taxes. However,the larger companies generally experienced decreases.
There was a significant increase in the number of participants with greater than $100M of revenue.
However, participation among firms with $10-$25M and $25-$50M decreased.

8/13/2019 2005 Financial Survey
http://slidepdf.com/reader/full/2005-financial-survey 220/284
Balance Sheet
2005 Participants 2004 Participants 2005 Participants 2004 Participants
Amount Percent Amount Percent Amount Percent Amount Percent
Current assets: Current liabilities:
Cash and cash equivalents $ 185,942 8.1 % $ 329,327 13.8 % Current maturity on long-term debt $ 56,444 2.5 % $ 98,300 4.1 %Marketable securities & short-term investments 94,471 4.1 76,374 3.2 Notes payable and lines of credit 340,862 14.9 86,732 3.6
Receivables: Accounts payable:
Contract receivables currently due 1,113,447 48.7 982,809 41.2 Trade, including currently due
Retainages on contracts 165,810 7.2 122,254 5.1 to subcontractors 446,837 19.5 344,031 14.4
Unbilled work 31,128 1.4 9,962 0.4 Subcontracts retainages 3,865 0.2 3,795 0.2
Other receivables 15,285 0.7 8,231 0.3 Other 37,728 1.6 7,055 0.3
Less allowance for doubtful accounts (10,845) (0.5) (13,927) (0.6) Total accounts payable 488,431 21.3 354,881 14.9
Total receivables, net: 1,314,825 57.5 1,109,330 46.5
Accrued expenses 172,493 7.5 115,983 4.9
Inventories 91,678 4.0 69,398 2.9 Billings in excess of costs and recognized
Costs and recognized earnings in excess earnings on uncompleted contracts 184,617 8.1 229,594 9.6
of billings on uncompleted contracts 126,540 5.5 104,972 4.4 Income taxes:
Investments in and advances to Current 4,674 0.2 2,281 0.1
construction joint ventures 0 0.0 0 0.0 Deferred 2,488 0.1 29,995 1.3
Income taxes: Other current liabilities 11,585 0.5 296 0.0
Current/refundable 5,799 0.3 11,755 0.5 Total current liabilities 1,261,593 55.1 918,063 38.5
Deferred 953 0.0 2,139 0.1 Noncurrent liabilities
Other current assets 50,510 2.2 84,889 3.6 Long-term debt, excluding current maturities 223,100 9.8 210,927 8.8
Total current assets 1,870,717 81.8 1,788,185 74.9 Deferred income taxes 4,819 0.2 40,544 1.7
Other 0 0.0 80,699 3.4
Property, plant and equipment 933,866 40.8 1,510,477 63.3 Total liabilities 1,489,512 65.1 1,250,234 52.4
Less accumulated depreciation (577,987) (25.3) (967,409) (40.5) Minority interests 0 0.0 0 0.0
Property, plant and equipment, net 355,879 15.6 543,068 22.8 Net worth:
Common stock, par value 32,797 1.4 30,782 1.3
Noncurrent assets: Preferred stock, stated value 792 0.0 0 0.0
Long-term investments 1,225 0.1 0 0.0 Additional paid-in capital 91,347 4.0 54,399 2.3
Deferred income taxes 3,835 0.2 6,160 0.3 Retained earnings 695,235 30.4 1,064,495 44.6
Other assets 56,369 2.5 48,873 2.0 Treasury stock (8,462) (0.4) (6,975) (0.3)
Total noncurrent assets 61,429 2.7 55,033 2.3 Excess value of marketable securities 723 0.0 (4,855) (0.2)
Other equity (13,920) (0.6) (1,794) (0.1)
Total net worth 798,513 34.9 1,136,051 47.6
Total assets $ 2,288,025 100.0 % $ 2,386,285 100.0 % Total liabilities and net worth $ 2,288,025 100.0 % $ 2,386,285 100.0 %
Statement of Earnings Financial Ratios
2005 Participants 2004 Participants 2005 Participants 2004 Participants
Amount Percent Amount Percent Average Median Average Median
Contract revenue $ 6,432,192 95.2 % $ 5,643,285 99.5 % Liquidity Ratios
Other revenue 326,587 4.8 27,927 0.5
Total Revenue 6,758,778 100.0 5,671,212 100.0 Current Ratio 1.5 1.5 1.9 1.8
Quick Ratio 1.3 1.1 1.7 1.4
Contract cost (5,285,745) (78.2) (4,563,192) (80.5) Days of Cash 9.9 4.2 20.9 17.1
Other cost (214,052) (3.2) (23,581) (0.4) Working Capital Turnover 11.1 9.3 6.5 9.5
Total cost (5,499,797) (81.4) (4,586,773) (80.9)
Profitability Ratios
Gross Profit 1,258,982 18.6 1,084,439 19.1
Return on Assets * 6.0 % 4.2 % 0.5 % 3.5 %
Selling, general & administrative expenses: Return on Equity * 17.3 % 28.3 % 1.0 % 9.1 %
Payroll (627,360) (9.3) (624,621) (11.0) Times Interest Earned 5.9 8.3 1.5 5.9
Professional fees (20,274) (0.3) (32,457) (0.6)
Sales & marketing costs (41,401) (0.6) (22,321) (0.4) Leverage Ratios
Technology costs (9,525) (0.1) (14,287) (0.3)
Administrative bonuses (56,029) (0.8) (37,640) (0.7) Debt to Equity 1.9 1.9 1.1 1.5
Other (336,959) (5.0) (336,082) (5.9) Revenue to Equity 8.5 9.4 5.0 7.3
Total SG&A expenses (1,091,549) (16.2) (1,067,409) (18.8) Asset Turnover 3.0 3.1 2.4 2.7
Fixed Asset Ratio 44.6 % 46.5 % 47.8 % 42.6 %
Income from operations 167,433 2.5 17,030 0.3 Equity to SG&A Expense 0.7 0.6 1.1 0.8
Underbillings to Equity 19.7 % 28.9 % 10.1 % 12.3 %
Interest income 6,901 0.1 3,886 0.1 Backlog to Equity 6.8 4.4 3.9 2.3
Interest expense (28,068) (0.4) (21,206) (0.4)
Other income / (expense), net (7,880) (0.1) 11,333 0.2
Efficiency Ratios
Net earnings / (loss) before income taxes 138,385 2.0 11,043 0.2
Backlog to Working Capital 24.0 3.4 3.5 2.4
Income tax (expense) / benefit (149) (0.0) 24,020 0.4 Months in Backlog 5.1 4.9 3.9 3.5
Days in Accounts Receivable 59.5 58.7 62.0 56.6
Net earnings $ 138,237 2.0 % $ 35,064 0.6 % Days in Inventory 6.0 4.7 5.4 4.2
Days in Accounts Payable 31.7 27.1 27.6 24.2
Operating Cycle 43.7 46.3 60.8 60.5
Number of ParticipantsNumber
2005 262004 25
Note: Not all figures will apear to sum due to rounding.
* Inthe CFMA's2005 AnnualFinancial Study,Returnon Assets (ROA)and Return onEquity (ROE)are calculated using
net earnings (loss) before income taxes. Studies conducted in prior years used net earnings (loss) after taxes to
calculate ROA and ROE. All references to ROAs and ROEs from prior studies have been updated to ref lect this
change.
Specialty Trade ContractorsLess Than $10 Million Revenue
Specialty Trade Contractors

8/13/2019 2005 Financial Survey
http://slidepdf.com/reader/full/2005-financial-survey 221/284
Balance Sheet
2005 Participants 2004 Participants 2005 Participants 2004 Participants
Amount Percent Amount Percent Amount Percent Amount Percent
Current assets: Current liabilities:
Cash and cash equivalents $ 516,072 8.3 % $ 569,840 9.8 % Current maturity on long-term debt $ 121,786 2.0 % $ 111,737 1.9 %
Marketable securities & short-term investments 106,936 1.7 70,023 1.2 Notes payable and lines of credit 571,429 9.2 359,653 6.2
Receivables: Accounts payable:
Contract receivables currently due 3,017,658 48.7 2,943,558 50.6 Trade, including currently due
Retainages on contracts 688,480 11.1 527,602 9.1 to subcontractors 1,170,958 18.9 1,053,994 18.1
Unbilled work 57,966 0.9 61,758 1.1 Subcontracts retainages 84,526 1.4 95,894 1.6
Other receivables 88,662 1.4 158,891 2.7 Other 39,915 0.6 135,540 2.3
Less allowance for doubtful accounts (25,060) (0.4) (18,707) (0.3) Total accounts payable 1,295,399 20.9 1,285,428 22.1
Total receivables, net: 3,827,705 61.8 3,673,101 63.1
Accrued expenses 412,476 6.7 407,501 7.0
Inventories 182,453 2.9 144,234 2.5 Billings in excess of costs and recognized
Costs and recognized earnings in excess earnings on uncompleted contracts 600,532 9.7 689,711 11.9
of billings on uncompleted contracts 346,204 5.6 248,736 4.3 Income taxes:
Investments in and advances to Current 17,933 0.3 8,907 0.2
construction joint ventures 0 0.0 5,287 0.1 Deferred 37,386 0.6 17,045 0.3
Income taxes: Other current liabilities 50,334 0.8 54,628 0.9
Current/refundable 11,266 0.2 14,008 0.2 Total current liabilities 3,107,275 50.1 2,934,611 50.4
Deferred 6,636 0.1 12,792 0.2 Noncurrent liabilities
Other current assets 178,018 2.9 171,723 3.0 Long-term debt, excluding current maturities 323,596 5.2 401,797 6.9
Total current assets 5,175,289 83.5 4,909,744 84.4 Deferred income taxes 17,354 0.3 8,019 0.1
Other 25,868 0.4 58,257 1.0
Property, plant and equipment 2,084,311 33.6 1,940,162 33.4 Total liabilities 3,474,093 56.1 3,402,685 58.5
Less accumulated depreciation (1,339,155) (21.6) (1,265,778) (21.8) Minority interests 2,337 0.0 0 0.0
Property, plant and equipment, net 745,156 12.0 674,384 11.6 Net worth:
Common stock, par value 125,935 2.0 104,753 1.8
Noncurrent assets: Preferred stock, stated value 14,661 0.2 9,643 0.2
Long-term investments 36,222 0.6 50,050 0.9 Additional paid-in capital 166,449 2.7 330,252 5.7
Deferred income taxes 13,566 0.2 5,467 0.1 Retained earnings 2,407,371 38.9 2,036,379 35.0
Other assets 225,953 3.6 177,869 3.1 Treasury stock (140,982) (2.3) (153,137) (2.6)
Total noncurrent assets 275,741 4.5 233,387 4.0 Excess value of marketable securities 2,936 0.0 4,227 0.1
Other equity 143,387 2.3 82,714 1.4
Total net worth 2,719,756 43.9 2,414,831 41.5
Total assets $ 6,196,186 100.0 % $ 5,817,515 100.0 % Total liabilities and net worth $ 6,196,186 100.0 % $ 5,817,515 100.0 %
Statement of Earnings Financial Ratios
2005 Participants 2004 Participants 2005 Participants 2004 Participants
Amount Percent Amount Percent Average Median Average Median
Contract revenue $ 16,461,049 96.4 % $ 15,877,980 96.6 % Liquidity Ratios
Other revenue 610,717 3.6 553,307 3.4
Total Revenue 17,071,766 100.0 16,431,287 100.0 Current Ratio 1.7 1.7 1.7 1.6
Quick Ratio 1.4 1.4 1.5 1.4
Contract cost (13,664,169) (80.0) (13,539,222) (82.4) Days of Cash 10.9 4.7 12.5 4.8
Other cost (447,751) (2.6) (375,464) (2.3) Working Capital Turnover 8.3 9.5 8.3 9.8
Total cost (14,111,919) (82.7) (13,914,687) (84.7)
Profitability Ratios
Gross Profit 2,959,846 17.3 2,516,600 15.3
Return on Assets * 8.9 % 7.6 % 4.9 % 6.3 %
Selling, general & administrative expenses: Return on Equity * 20.2 % 18.3 % 11.7 % 14.3 %
Payroll (1,228,886) (7.2) (1,102,686) (6.7) Times Interest Earned 11.3 11.8 6.6 6.3
Professional fees (61,267) (0.4) (62,859) (0.4)
Sales & marketing costs (69,720) (0.4) (45,408) (0.3) Leverage Ratios
Technology costs (22,829) (0.1) (31,962) (0.2)
Administrative bonuses (87,173) (0.5) (116,567) (0.7) Debt to Equity 1.3 1.4 1.4 1.8
Other (960,211) (5.6) (830,417) (5.1) Revenue to Equity 6.3 7.4 6.8 8.0
Total SG&A expenses (2,430,086) (14.2) (2,189,900) (13.3) Asset Turnover 2.8 2.8 2.8 3.0
Fixed Asset Ratio 27.4 % 26.2 % 27.9 % 25.4 %
Income from operations 529,760 3.1 326,700 2.0 Equity to SG&A Expense 1.1 1.0 1.1 1.0
Underbillings to Equity 14.9 % 13.1 % 12.9 % 12.5 %
Interest income 12,386 0.1 14,636 0.1 Backlog to Equity 6.4 2.1 5.6 4.0
Interest expense (53,397) (0.3) (50,573) (0.3)Other income / (expense), net 61,357 0.4 (7,413) (0.0)
Efficiency Ratios
Net earnings / (loss) before income taxes 550,106 3.2 283,349 1.7
Backlog to Working Capital 4.9 2.7 7.7 4.4
Income tax (expense) / benefit (60,320) (0.4) (28,323) (0.2) Months in Backlog 5.4 4.7 6.1 5.6
Days in Accounts Receivable 65.0 62.2 67.6 63.5
Net earnings $ 489,786 2.9 % $ 255,026 1.6 % Days in Inventory 4.7 3.3 3.7 2.9
Days in Accounts Payable 30.9 25.3 30.8 26.8
Operating Cycle 49.6 51.1 53.0 52.8
Number of ParticipantsNumber
2005 482004 56
Note: Not all figures will apear to sum due to rounding.
* Inthe CFMA's2005 AnnualFinancial Study,Returnon Assets (ROA)and Return onEquity (ROE)are calculated using
net earnings (loss) before income taxes. Studies conducted in prior years used net earnings (loss) after taxes to
calculate ROA and ROE. All references to ROAs and ROEs from prior studies have been updated to ref lect this
change.
Specialty Trade Contractors$10 - $25 Million Revenue
Specialty Trade Contractors
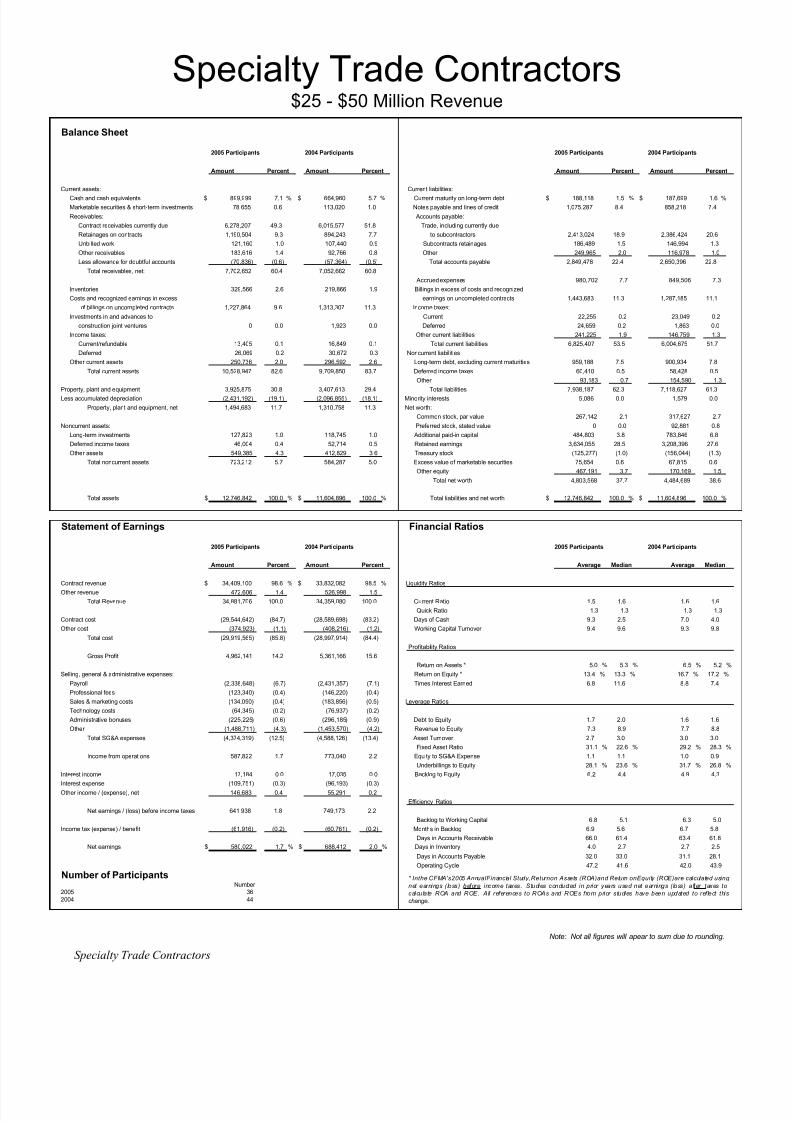
8/13/2019 2005 Financial Survey
http://slidepdf.com/reader/full/2005-financial-survey 222/284
Balance Sheet
2005 Participants 2004 Participants 2005 Participants 2004 Participants
Amount Percent Amount Percent Amount Percent Amount Percent
Current assets: Current liabilities:
Cash and cash equivalents $ 899,999 7.1 % $ 664,960 5.7 % Current maturity on long-term debt $ 188,118 1.5 % $ 187,699 1.6 %
Marketable securities & short-term investments 78,655 0.6 113,020 1.0 Notes payable and lines of credit 1,075,287 8.4 858,218 7.4
Receivables: Accounts payable:
Contract receivables currently due 6,278,207 49.3 6,015,577 51.8 Trade, including currently due
Retainages on contracts 1,190,504 9.3 894,243 7.7 to subcontractors 2,413,024 18.9 2,386,424 20.6
Unbilled work 121,160 1.0 107,440 0.9 Subcontracts retainages 186,489 1.5 146,994 1.3
Other receivables 183,616 1.4 92,766 0.8 Other 249,965 2.0 116,978 1.0
Less allowance for doubtful accounts (70,836) (0.6) (57,364) (0.5) Total accounts payable 2,849,478 22.4 2,650,396 22.8
Total receivables, net: 7,702,652 60.4 7,052,662 60.8
Accrued expenses 980,702 7.7 849,506 7.3
Inventories 329,566 2.6 219,866 1.9 Billings in excess of costs and recognized
Costs and recognized earnings in excess earnings on uncompleted contracts 1,443,683 11.3 1,287,185 11.1
of billings on uncompleted contracts 1,227,864 9.6 1,313,307 11.3 Income taxes:
Investments in and advances to Current 22,255 0.2 23,049 0.2
construction joint ventures 0 0.0 1,923 0.0 Deferred 24,659 0.2 1,863 0.0
Income taxes: Other current liabilities 241,225 1.9 146,759 1.3
Current/refundable 13,405 0.1 16,849 0.1 Total current liabilities 6,825,407 53.5 6,004,675 51.7
Deferred 26,069 0.2 30,672 0.3 Noncurrent liabilities
Other current assets 250,736 2.0 296,592 2.6 Long-term debt, excluding current maturities 959,188 7.5 900,934 7.8
Total current assets 10,528,947 82.6 9,709,850 83.7 Deferred income taxes 60,410 0.5 58,428 0.5
Other 93,183 0.7 154,590 1.3
Property, plant and equipment 3,925,875 30.8 3,407,613 29.4 Total liabilities 7,938,187 62.3 7,118,627 61.3
Less accumulated depreciation (2,431,192) (19.1) (2,096,855) (18.1) Minority interests 5,086 0.0 1,579 0.0
Property, plant and equipment, net 1,494,683 11.7 1,310,758 11.3 Net worth:
Common stock, par value 267,142 2.1 317,627 2.7
Noncurrent assets: Preferred stock, stated value 0 0.0 92,881 0.8
Long-term investments 127,823 1.0 118,745 1.0 Additional paid-in capital 484,803 3.8 783,846 6.8
Deferred income taxes 46,004 0.4 52,714 0.5 Retained earnings 3,634,055 28.5 3,208,396 27.6
Other assets 549,385 4.3 412,829 3.6 Treasury stock (125,277) (1.0) (156,044) (1.3)
Total noncurrent assets 723,212 5.7 584,287 5.0 Excess value of marketable securities 75,654 0.6 67,815 0.6
Other equity 467,191 3.7 170,169 1.5
Total net worth 4,803,568 37.7 4,484,689 38.6
Total assets $ 12,746,842 100.0 % $ 11,604,896 100.0 % Total liabilities and net worth $ 12,746,842 100.0 % $ 11,604,896 100.0 %
Statement of Earnings Financial Ratios
2005 Participants 2004 Participants 2005 Participants 2004 Participants
Amount Percent Amount Percent Average Median Average Median
Contract revenue $ 34,409,100 98.6 % $ 33,832,082 98.5 % Liquidity Ratios
Other revenue 472,606 1.4 526,998 1.5
Total Revenue 34,881,706 100.0 34,359,080 100.0 Current Ratio 1.5 1.6 1.6 1.6
Quick Ratio 1.3 1.3 1.3 1.3
Contract cost (29,544,642) (84.7) (28,589,698) (83.2) Days of Cash 9.3 2.5 7.0 4.0
Other cost (374,923) (1.1) (408,216) (1.2) Working Capital Turnover 9.4 9.6 9.3 9.8
Total cost (29,919,565) (85.8) (28,997,914) (84.4)
Profitability Ratios
Gross Profit 4,962,141 14.2 5,361,166 15.6
Return on Assets * 5.0 % 5.3 % 6.5 % 5.2 %
Selling, general & administrative expenses: Return on Equity * 13.4 % 13.3 % 16.7 % 17.2 %
Payroll (2,338,648) (6.7) (2,431,357) (7.1) Times Interest Earned 6.8 11.6 8.8 7.4
Professional fees (123,340) (0.4) (146,220) (0.4)
Sales & marketing costs (134,050) (0.4) (183,856) (0.5) Leverage Ratios
Technology costs (64,345) (0.2) (76,937) (0.2)
Administrative bonuses (225,225) (0.6) (296,185) (0.9) Debt to Equity 1.7 2.0 1.6 1.6
Other (1,488,711) (4.3) (1,453,570) (4.2) Revenue to Equity 7.3 8.9 7.7 8.8
Total SG&A expenses (4,374,319) (12.5) (4,588,126) (13.4) Asset Turnover 2.7 3.0 3.0 3.0
Fixed Asset Ratio 31.1 % 22.6 % 29.2 % 28.3 %
Income from operations 587,822 1.7 773,040 2.2 Equity to SG&A Expense 1.1 1.1 1.0 0.9
Underbillings to Equity 28.1 % 23.6 % 31.7 % 26.8 %
Interest income 17,184 0.0 17,035 0.0 Backlog to Equity 6.2 4.4 4.9 4.3
Interest expense (109,751) (0.3) (96,193) (0.3)Other income / (expense), net 146,683 0.4 55,291 0.2
Efficiency Ratios
Net earnings / (loss) before income taxes 641,938 1.8 749,173 2.2
Backlog to Working Capital 6.8 5.1 6.3 5.0
Income tax (expense) / benefit (61,916) (0.2) (60,761) (0.2) Months in Backlog 6.9 5.6 6.7 5.8
Days in Accounts Receivable 66.0 61.4 63.4 61.8
Net earnings $ 580,022 1.7 % $ 688,412 2.0 % Days in Inventory 4.0 2.7 2.7 2.5
Days in Accounts Payable 32.0 33.0 31.1 28.1
Operating Cycle 47.2 41.6 42.0 43.9
Number of ParticipantsNumber
2005 362004 44
Note: Not all figures will apear to sum due to rounding.
Specialty Trade Contractors$25 - $50 Million Revenue
* Inthe CFMA's2005 AnnualFinancial Study,Returnon Assets (ROA)and Return onEquity (ROE)are calculated using
net earnings (loss) before income taxes. Studies conducted in prior years used net earnings (loss) after taxes to
calculate ROA and ROE. All references to ROAs and ROEs from prior studies have been updated to ref lect this
change.
Specialty Trade Contractors
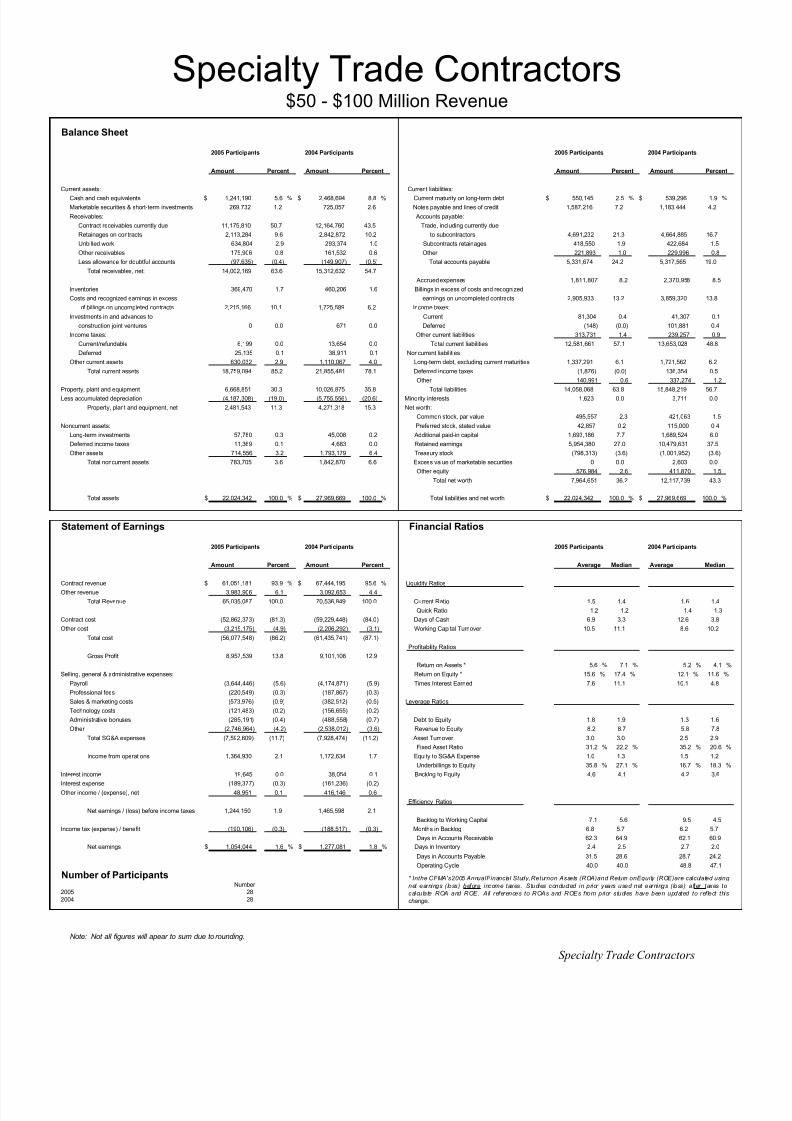
8/13/2019 2005 Financial Survey
http://slidepdf.com/reader/full/2005-financial-survey 223/284
Balance Sheet
2005 Participants 2004 Participants 2005 Participants 2004 Participants
Amount Percent Amount Percent Amount Percent Amount Percent
Current assets: Current liabilities:
Cash and cash equivalents $ 1,241,190 5.6 % $ 2,468,694 8.8 % Current maturity on long-term debt $ 550,145 2.5 % $ 539,296 1.9 %
Marketable securities & short-term investments 269,732 1.2 725,057 2.6 Notes payable and lines of credit 1,587,216 7.2 1,183,444 4.2
Receivables: Accounts payable:
Contract receivables currently due 11,175,810 50.7 12,164,760 43.5 Trade, including currently due
Retainages on contracts 2,113,284 9.6 2,842,872 10.2 to subcontractors 4,691,232 21.3 4,664,885 16.7
Unbilled work 634,804 2.9 293,374 1.0 Subcontracts retainages 418,550 1.9 422,684 1.5
Other receivables 175,906 0.8 161,532 0.6 Other 221,893 1.0 229,996 0.8
Less allowance for doubtful accounts (97,635) (0.4) (149,907) (0.5) Total accounts payable 5,331,674 24.2 5,317,565 19.0
Total receivables, net: 14,002,169 63.6 15,312,632 54.7
Accrued expenses 1,811,807 8.2 2,370,958 8.5
Inventories 369,470 1.7 460,206 1.6 Billings in excess of costs and recognized
Costs and recognized earnings in excess earnings on uncompleted contracts 2,905,933 13.2 3,859,320 13.8
of billings on uncompleted contracts 2,215,166 10.1 1,725,589 6.2 Income taxes:
Investments in and advances to Current 81,304 0.4 41,307 0.1
construction joint ventures 0 0.0 671 0.0 Deferred (148) (0.0) 101,881 0.4
Income taxes: Other current liabilities 313,731 1.4 239,257 0.9
Current/refundable 6,199 0.0 13,654 0.0 Total current liabilities 12,581,661 57.1 13,653,028 48.8
Deferred 25,135 0.1 38,911 0.1 Noncurrent liabilities
Other current assets 630,032 2.9 1,110,067 4.0 Long-term debt, excluding current maturities 1,337,291 6.1 1,721,562 6.2
Total current assets 18,759,094 85.2 21,855,481 78.1 Deferred income taxes (1,876) (0.0) 136,354 0.5
Other 140,991 0.6 337,274 1.2
Property, plant and equipment 6,668,851 30.3 10,026,875 35.8 Total liabilities 14,058,068 63.8 15,848,219 56.7
Less accumulated depreciation (4,187,308) (19.0) (5,755,556) (20.6) Minority interests 1,623 0.0 3,711 0.0
Property, plant and equipment, net 2,481,543 11.3 4,271,318 15.3 Net worth:
Common stock, par value 495,557 2.3 421,063 1.5
Noncurrent assets: Preferred stock, stated value 42,857 0.2 115,000 0.4
Long-term investments 57,780 0.3 45,008 0.2 Additional paid-in capital 1,693,186 7.7 1,689,524 6.0
Deferred income taxes 11,369 0.1 4,683 0.0 Retained earnings 5,954,380 27.0 10,479,631 37.5
Other assets 714,556 3.2 1,793,179 6.4 Treasury stock (798,313) (3.6) (1,001,952) (3.6)
Total noncurrent assets 783,705 3.6 1,842,870 6.6 Excess value of marketable securities 0 0.0 2,603 0.0
Other equity 576,984 2.6 411,870 1.5
Total net worth 7,964,651 36.2 12,117,739 43.3
Total assets $ 22,024,342 100.0 % $ 27,969,669 100.0 % Total liabilities and net worth $ 22,024,342 100.0 % $ 27,969,669 100.0 %
Statement of Earnings Financial Ratios
2005 Participants 2004 Participants 2005 Participants 2004 Participants
Amount Percent Amount Percent Average Median Average Median
Contract revenue $ 61,051,181 93.9 % $ 67,444,195 95.6 % Liquidity Ratios
Other revenue 3,983,906 6.1 3,092,653 4.4
Total Revenue 65,035,087 100.0 70,536,849 100.0 Current Ratio 1.5 1.4 1.6 1.4
Quick Ratio 1.2 1.2 1.4 1.3
Contract cost (52,862,373) (81.3) (59,229,448) (84.0) Days of Cash 6.9 3.3 12.6 3.8
Other cost (3,215,175) (4.9) (2,206,292) (3.1) Working Capital Turnover 10.5 11.1 8.6 10.2
Total cost (56,077,548) (86.2) (61,435,741) (87.1)
Profitability Ratios
Gross Profit 8,957,539 13.8 9,101,108 12.9
Return on Assets * 5.6 % 7.1 % 5.2 % 4.1 %
Selling, general & administrative expenses: Return on Equity * 15.6 % 17.4 % 12.1 % 11.6 %
Payroll (3,644,446) (5.6) (4,174,871) (5.9) Times Interest Earned 7.6 11.1 10.1 4.8
Professional fees (220,549) (0.3) (187,867) (0.3)
Sales & marketing costs (573,976) (0.9) (382,512) (0.5) Leverage Ratios
Technology costs (121,483) (0.2) (156,655) (0.2)
Administrative bonuses (285,191) (0.4) (488,558) (0.7) Debt to Equity 1.8 1.9 1.3 1.6
Other (2,746,964) (4.2) (2,538,012) (3.6) Revenue to Equity 8.2 8.7 5.8 7.8
Total SG&A expenses (7,592,609) (11.7) (7,928,474) (11.2) Asset Turnover 3.0 3.0 2.5 2.9
Fixed Asset Ratio 31.2 % 22.2 % 35.2 % 20.6 %
Income from operations 1,364,930 2.1 1,172,634 1.7 Equity to SG&A Expense 1.0 1.3 1.5 1.2
Underbillings to Equity 35.8 % 27.1 % 16.7 % 18.3 %
Interest income 19,645 0.0 38,054 0.1 Backlog to Equity 4.6 4.1 4.2 3.6
Interest expense (189,377) (0.3) (161,236) (0.2)Other income / (expense), net 48,951 0.1 416,146 0.6
Efficiency Ratios
Net earnings / (loss) before income taxes 1,244,150 1.9 1,465,598 2.1
Backlog to Working Capital 7.1 5.6 9.5 4.5
Income tax (expense) / benefit (190,106) (0.3) (188,517) (0.3) Months in Backlog 6.8 5.7 6.2 5.7
Days in Accounts Receivable 62.3 64.9 62.1 60.9
Net earnings $ 1,054,044 1.6 % $ 1,277,081 1.8 % Days in Inventory 2.4 2.5 2.7 2.0
Days in Accounts Payable 31.5 28.6 28.7 24.2
Operating Cycle 40.0 40.0 48.8 47.1
Number of ParticipantsNumber
2005 282004 28
Note: Not all figures will apear to sum due to rounding.
Specialty Trade Contractors$50 - $100 Million Revenue
* Inthe CFMA's2005 AnnualFinancial Study,Returnon Assets (ROA)and Return onEquity (ROE)are calculated using
net earnings (loss) before income taxes. Studies conducted in prior years used net earnings (loss) after taxes to
calculate ROA and ROE. All references to ROAs and ROEs from prior studies have been updated to ref lect this
change.
Specialty Trade Contractors

8/13/2019 2005 Financial Survey
http://slidepdf.com/reader/full/2005-financial-survey 224/284
Balance Sheet
2005 Participants 2004 Participants 2005 Participants 2004 Participants
Amount Percent Amount Percent Amount Percent Amount Percent
Current assets: Current liabilities:
Cash and cash equivalents $ 3,066,501 4.9 % $ 3,719,489 5.3 % Current maturity on long-term debt $ 734,686 1.2 % $ 691,313 1.0 %
Marketable securities & short-term investments 600,651 1.0 1,512,343 2.2 Notes payable and lines of credit 1,689,741 2.7 312,185 0.4
Receivables: Accounts payable:
Contract receivables currently due 32,463,668 51.6 34,351,232 49.2 Trade, including currently due
Retainages on contracts 6,433,297 10.2 6,432,740 9.2 to subcontractors 9,227,638 14.7 10,834,238 15.5
Unbilled work 190,083 0.3 291,651 0.4 Subcontracts retainages 750,556 1.2 761,682 1.1
Other receivables 265,138 0.4 2,033,324 2.9 Other 347,333 0.6 2,032,459 2.9
Less allowance for doubtful accounts (386,341) (0.6) (593,079) (0.8) Total accounts payable 10,325,527 16.4 13,628,379 19.5
Total receivables, net: 38,965,846 62.0 42,515,869 60.9
Accrued expenses 7,648,229 12.2 5,466,074 7.8
Inventories 893,001 1.4 761,804 1.1 Billings in excess of costs and recognized
Costs and recognized earnings in excess earnings on uncompleted contracts 9,105,815 14.5 10,334,731 14.8
of billings on uncompleted contracts 4,095,075 6.5 4,048,441 5.8 Income taxes:
Investments in and advances to Current 114,206 0.2 (8,362) (0.0)
construction joint ventures 127,928 0.2 219,345 0.3 Deferred 8,370 0.0 (113,430) (0.2)
Income taxes: Other current liabilities 1,491,322 2.4 1,056,272 1.5
Current/refundable 12,519 0.0 89,305 0.1 Total current liabilities 31,117,896 49.5 31,367,162 44.9
Deferred 162,529 0.3 78,301 0.1 Noncurrent liabilities
Other current assets 1,415,827 2.3 1,266,297 1.8 Long-term debt, excluding current maturities 5,022,854 8.0 12,735,572 18.2
Total current assets 49,339,877 78.5 54,211,192 77.6 Deferred income taxes 356,404 0.6 202,143 0.3
Other 561,075 0.9 2,266,820 3.2
Property, plant and equipment 15,299,378 24.3 19,261,373 27.6 Total liabilities 37,058,229 58.9 46,571,697 66.7
Less accumulated depreciation (9,327,836) (14.8) (12,982,583) (18.6) Minority interests 80,675 0.1 59,464 0.1
Property, plant and equipment, net 5,971,542 9.5 6,278,790 9.0 Net worth:
Common stock, par value 325,871 0.5 2,784,981 4.0
Noncurrent assets: Preferred stock, stated value 0 0.0 0 0.0
Long-term investments 121,925 0.2 271,803 0.4 Additional paid-in capital 12,010,813 19.1 7,855,656 11.2
Deferred income taxes 76,483 0.1 2,268 0.0 Retained earnings 15,295,469 24.3 13,114,002 18.8
Other assets 7,375,078 11.7 9,083,015 13.0 Treasury stock (3,772,076) (6.0) (1,529,279) (2.2)
Total noncurrent assets 7,573,486 12.0 9,357,086 13.4 Excess value of marketable securities 0 0.0 12,648 0.0
Other equity 1,885,923 3.0 977,898 1.4
Total net worth 25,746,000 40.9 23,215,907 33.2
Total assets $ 62,884,905 100.0 % $ 69,847,068 100.0 % Total liabilities and net worth $ 62,884,905 100.0 % $ 69,847,068 100.0 %
Statement of Earnings Financial Ratios
2005 Participants 2004 Participants 2005 Participants 2004 Participants
Amount Percent Amount Percent Average Median Average Median
Contract revenue $ 177,823,284 98.1 % $ 180,739,389 97.3 % Liquidity Ratios
Other revenue 3,426,065 1.9 5,049,887 2.7
Total Revenue 181,249,349 100.0 185,789,275 100.0 Current Ratio 1.6 1.6 1.7 1.7
Quick Ratio 1.4 1.4 1.5 1.5
Contract cost (154,631,804) (85.3) (151,714,322) (81.7) Days of Cash 6.1 5.2 7.2 4.3
Other cost (2,486,750) (1.4) (9,744,289) (5.2) Working Capital Turnover 9.9 10.7 8.1 9.6
Total cost (157,118,554) (86.7) (161,458,610) (86.9)
Profitability Ratios
Gross Profit 24,130,795 13.3 24,330,665 13.1
Return on Assets * 7.8 % 8.6 % 8.3 % 8.7 %
Selling, general & administrative expenses: Return on Equity * 19.1 % 23.9 % 25.0 % 21.1 %
Payroll (7,823,071) (4.3) (9,926,407) (5.3) Times Interest Earned 17.2 10.6 9.1 30.7
Professional fees (381,282) (0.2) (473,765) (0.3)
Sales & marketing costs (333,554) (0.2) (685,114) (0.4) Leverage Ratios
Technology costs (333,798) (0.2) (622,369) (0.3)
Administrative bonuses (866,061) (0.5) (1,119,307) (0.6) Debt to Equity 1.4 1.7 2.0 1.5
Other (9,494,513) (5.2) (5,841,678) (3.1) Revenue to Equity 7.0 9.8 8.0 7.1
Total SG&A expenses (19,232,279) (10.6) (18,668,640) (10.0) Asset Turnover 2.9 3.2 2.7 2.9
Fixed Asset Ratio 23.2 % 21.2 % 27.0 % 25.0 %
Income from operations 4,898,516 2.7 5,662,025 3.0 Equity to SG&A Expense 1.3 1.0 1.2 1.7
Underbillings to Equity 16.6 % 22.5 % 18.7 % 10.0 %
Interest income 53,955 0.0 80,068 0.0 Backlog to Equity 5.7 3.4 4.8 3.7
Interest expense (303,765) (0.2) (718,310) (0.4)Other income / (expense), net 257,707 0.1 771,681 0.4
Efficiency Ratios
Net earnings / (loss) before income taxes 4,906,413 2.7 5,795,464 3.1
Backlog to Working Capital 5.4 4.3 4.7 4.2
Income tax (expense) / benefit (669,786) (0.4) (58,109) (0.0) Months in Backlog 5.8 6.0 5.7 6.3
Days in Accounts Receivable 64.2 62.5 69.4 63.8
Net earnings $ 4,236,627 2.3 % $ 5,737,354 3.1 % Days in Inventory 2.0 2.3 1.7 2.3
Days in Accounts Payable 21.9 24.0 28.7 21.8
Operating Cycle 50.4 55.5 49.6 51.6
Number of ParticipantsNumber
2005 272004 18
Note: Not all figures will apear to sum due to rounding.
Specialty Trade Contractors
Specialty Trade ContractorsMore Than $100 Million Revenue
* Inthe CFMA's2005 AnnualFinancial Study,Returnon Assets (ROA)and Return onEquity (ROE)are calculated using
net earnings (loss) before income taxes. Studies conducted in prior years used net earnings (loss) after taxes to
calculate ROA and ROE. All references to ROAs and ROEs from prior studies have been updated to ref lect this
change.

8/13/2019 2005 Financial Survey
http://slidepdf.com/reader/full/2005-financial-survey 225/284
Balance Sheet
2005 Participants 2004 Participants 2005 Participants 2004 Participants
Amount Percent Amount Percent Amount Percent Amount Percent
Current assets: Current liabilities:
Cash and cash equivalents $ 1,251,164 5.9 % $ 1,265,199 6.7 % Current maturity on long-term debt $ 236,871 1.1 % $ 215,745 1.1 %
Marketable securities & short-term investments 248,782 1.2 255,562 1.4 Notes payable and lines of credit 638,688 3.0 439,858 2.3
Receivables: Accounts payable:
Contract receivables currently due 10,961,501 51.8 9,355,053 49.5 Trade, including currently due
Retainages on contracts 1,694,982 8.0 1,742,533 9.2 to subcontractors 4,435,944 21.0 3,507,232 18.5
Unbilled work 327,833 1.6 124,740 0.7 Subcontracts retainages 446,322 2.1 367,951 1.9
Other receivables 131,545 0.6 110,195 0.6 Other 243,325 1.2 246,487 1.3
Less allowance for doubtful accounts (85,347) (0.4) (130,865) (0.7) Total accounts payable 5,125,592 24.2 4,121,670 21.8
Total receivables, net: 13,030,514 61.6 11,201,656 59.2
Accrued expenses 1,828,841 8.7 1,584,106 8.4
Inventories 421,009 2.0 308,234 1.6 Billings in excess of costs and recognized
Costs and recognized earnings in excess earnings on uncompleted contracts 2,843,423 13.4 2,582,935 13.7
of billings on uncompleted contracts 1,398,251 6.6 1,172,193 6.2 Income taxes:
Investments in and advances to Current 25,780 0.1 26,626 0.1
construction joint ventures 0 0.0 517 0.0 Deferred 17,934 0.1 (20,347) (0.1)
Income taxes: Other current liabilities 446,379 2.1 338,725 1.8
Current/refundable 10,625 0.1 17,638 0.1 Total current liabilities 11,163,507 52.8 9,289,318 49.1
Deferred 22,724 0.1 38,398 0.2 Noncurrent liabilities
Other current assets 388,457 1.8 616,783 3.3 Long-term debt, excluding current maturities 788,813 3.7 1,062,956 5.6
Total current assets 16,771,525 79.3 14,876,179 78.7 Deferred income taxes 62,701 0.3 100,000 0.5
Other 205,494 1.0 481,858 2.5
Property, plant and equipment 6,004,318 28.4 5,606,237 29.6 Total liabilities 12,220,515 57.8 10,934,133 57.8Less accumulated depreciation (3,725,342) (17.6) (3,583,457) (18.9) Minority interests 17,753 0.1 1,684 0.0
Property, plant and equipment, net 2,278,976 10.8 2,022,780 10.7 Net worth:
Common stock, par value 377,906 1.8 377,136 2.0
Noncurrent assets: Preferred stock, stated value 5,943 0.0 65,474 0.3
Long-term investments 31,124 0.1 78,176 0.4 Additional paid-in capital 3,468,772 16.4 2,779,752 14.7
Deferred income taxes 46,053 0.2 38,929 0.2 Retained earnings 4,702,134 22.2 5,128,346 27.1
Other assets 2,014,356 9.5 1,897,269 10.0 Treasury stock (780,970) (3.7) (724,045) (3.8)
Total noncurrent assets 2,091,533 9.9 2,014,374 10.7 Excess value of marketable securities 35,517 0.2 36,810 0.2
Other equity 1,094,465 5.2 314,043 1.7
Total net worth 8,903,767 42.1 7,977,516 42.2
Total assets $ 21,142,035 100.0 % $ 18,913,333 100.0 % Total liabilities and net worth $ 21,142,035 100.0 % $ 18,913,333 100.0 %
Statement of Earnings Financial Ratios
2005 Participants 2004 Participants 2005 Participants 2004 Participants
Amount Percent Amount Percent Average Median Average Median
Contract revenue $ 59,308,531 96.2 % $ 51,035,502 94.9 % Liquidity RatiosOther revenue 2,338,832 3.8 2,732,394 5.1
Total Revenue 61,647,363 100.0 53,767,896 100.0 Current Ratio 1.5 1.5 1.6 1.6
Quick Ratio 1.3 1.3 1.4 1.3
Contract cost (51,701,774) (83.9) (43,111,596) (80.2) Days of Cash 7.3 3.6 8.5 5.6
Other cost (1,614,659) (2.6) (3,530,233) (6.6) Working Capital Turnover 11.0 11.1 9.6 10.5
Total cost (53,316,433) (86.5) (46,641,829) (86.7)
Profitability Ratios
Gross Profit 8,330,930 13.5 7,126,067 13.3
Return on Assets * 6.8 % 7.6 % 5.7 % 5.6 %
Selling, general & administrative expenses: Return on Equity * 16.3 % 20.9 % 13.4 % 14.7 %
Payroll (3,301,082) (5.4) (3,228,373) (6.0) Times Interest Earned 15.6 13.8 11.8 7.7
Professional fees (183,381) (0.3) (179,967) (0.3)
Sales & marketing costs (320,722) (0.5) (177,830) (0.3) Leverage Ratios
Technology costs (117,460) (0.2) (125,540) (0.2)
Administrative bonuses (283,864) (0.5) (348,292) (0.6) Debt to Equity 1.4 2.1 1.4 1.7
Other (2,740,800) (4.4) (2,081,937) (3.9) Revenue to Equity 6.9 9.7 6.7 8.8
Total SG&A expenses (6,947,310) (11.3) (6,141,939) (11.4) Asset Turnover 2.9 3.1 2.8 3.0
Fixed Asset Ratio 25.6 % 21.9 % 25.4 % 29.6 %
Income from operations 1,383,620 2.2 984,128 1.8 Equity to SG&A Expense 1.3 0.9 1.3 1.0
Underbillings to Equity 19.4 % 17.4 % 16.3 % 20.5 %
Interest income 22,683 0.0 26,623 0.0 Backlog to Equity 5.3 4.4 5.5 3.5
Interest expense (98,861) (0.2) (98,885) (0.2)
Other income / (expense), net 139,976 0.2 157,889 0.3
Efficiency Ratios
Net earnings / (loss) before income taxes 1,447,418 2.3 1,069,755 2.0
Backlog to Working Capital 12.9 5.4 6.9 4.5
Income tax (expense) / benefit (230,156) (0.4) (81,401) (0.2) Months in Backlog 6.3 6.0 6.0 5.6
Days in Accounts Receivable 64.3 62.2 62.5 59.3
Net earnings $ 1,217,262 2.0 % $ 988,354 1.8 % Days in Inventory 2.8 3.4 2.4 2.3
Days in Accounts Payable 31.6 29.0 29.0 26.4
Operating Cycle 42.8 41.3 44.4 44.7
Number of ParticipantsNumber
2005 582004 67
Note: Not all figures will apear to sum due to rounding.
* In the CFMA's 2005AnnualFinancialStudy, Return on Assets (ROA)and Return on Equity (ROE)are calculated using
net earnings (loss) before income taxes. Studies conducted in prior years used net earnings (loss) after taxes to
calculate ROA and ROE. All references to ROAs and ROEs from prior studies have been updated to reflect this change.
Specialty Trade Contractors23511 Plumbing, Heating, and Air-Conditioning Contractors
Specialty Trade Contractors
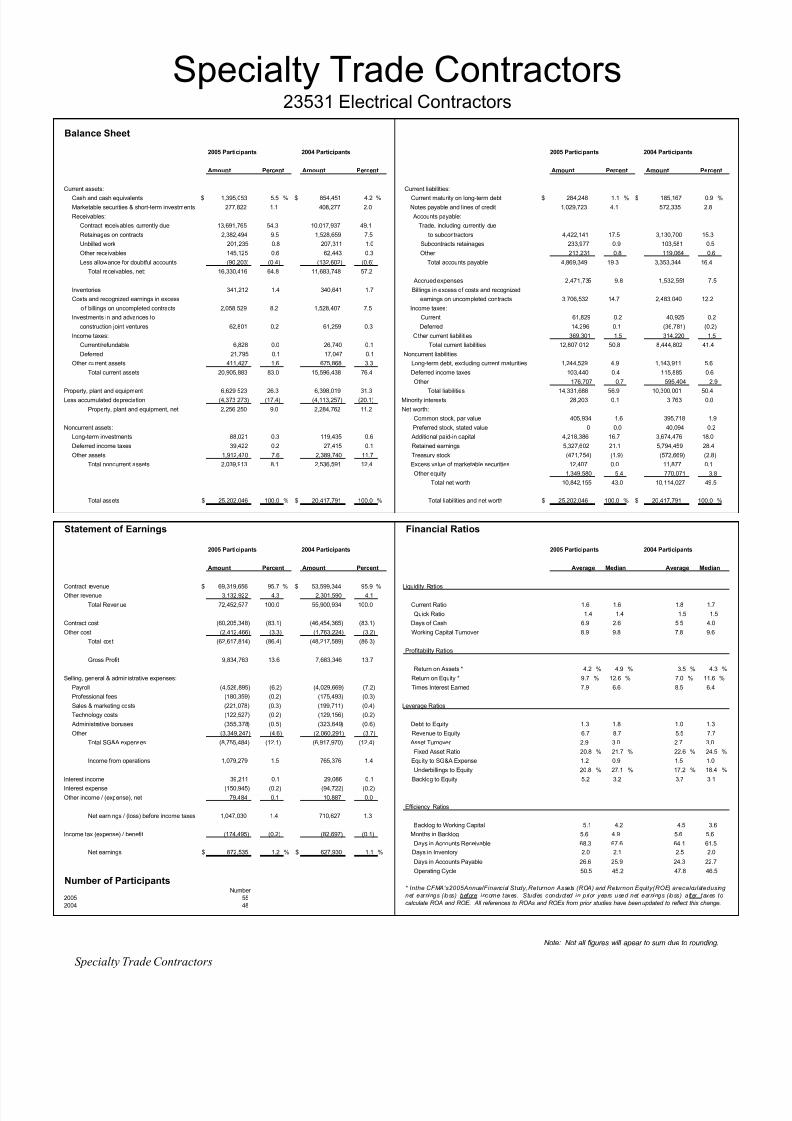
8/13/2019 2005 Financial Survey
http://slidepdf.com/reader/full/2005-financial-survey 226/284
Balance Sheet
2005 Participants 2004 Participants 2005 Participants 2004 Participants
Amount Percent Amount Percent Amount Percent Amount Percent
Current assets: Current liabilities:
Cash and cash equivalents $ 1,395,053 5.5 % $ 854,451 4.2 % Current maturity on long-term debt $ 284,248 1.1 % $ 185,167 0.9 %
Marketable securities & short-term investments 277,822 1.1 408,277 2.0 Notes payable and lines of credit 1,029,723 4.1 572,335 2.8
Receivables: Accounts payable:
Contract receivables currently due 13,691,765 54.3 10,017,937 49.1 Trade, including currently due
Retainages on contracts 2,382,494 9.5 1,528,659 7.5 to subcontractors 4,422,141 17.5 3,130,700 15.3
Unbilled work 201,235 0.8 207,311 1.0 Subcontracts retainages 233,977 0.9 103,581 0.5
Other receivables 145,125 0.6 62,443 0.3 Other 213,231 0.8 119,064 0.6
Less allowance for doubtful accounts (90,203) (0.4) (132,602) (0.6) Total accounts payable 4,869,349 19.3 3,353,344 16.4
Total receivables, net: 16,330,416 64.8 11,683,748 57.2
Accrued expenses 2,471,735 9.8 1,532,551 7.5
Inventories 341,212 1.4 340,641 1.7 Billings in excess of costs and recognized
Costs and recognized earnings in excess earnings on uncompleted contracts 3,706,532 14.7 2,483,040 12.2
o f billings on uncompleted contracts 2,058,529 8.2 1,528,407 7.5 Income taxes:
Investments in and advances to Current 61,829 0.2 40,925 0.2
construction joint ventures 62,801 0.2 61,259 0.3 Deferred 14,296 0.1 (36,781) (0.2)
Income taxes: Other current liabilities 369,301 1.5 314,220 1.5
Current/refundable 6,828 0.0 26,740 0.1 Total current liabilities 12,807,012 50.8 8,444,802 41.4
Deferred 21,795 0.1 17,047 0.1 Noncurrent liabilities
Other current assets 411,427 1.6 675,868 3.3 Long-term debt, excluding current maturities 1,244,529 4.9 1,143,911 5.6
Total current assets 20,905,883 83.0 15,596,438 76.4 Deferred income taxes 103,440 0.4 115,885 0.6
Other 176,707 0.7 595,404 2.9
Property, plant and equipment 6,629,523 26.3 6,398,019 31.3 Total liabilities 14,331,688 56.9 10,300,001 50.4Less accumulated depreciation (4,373,273) (17.4) (4,113,257) (20.1) Minority interests 28,203 0.1 3,763 0.0
Property, plant and equipment, net 2,256,250 9.0 2,284,762 11.2 Net worth:
Common stock, par value 405,934 1.6 395,718 1.9
Noncurrent assets: Preferred stock, stated value 0 0.0 40,094 0.2
Long-term investments 88,021 0.3 119,435 0.6 Additional paid-in capital 4,218,386 16.7 3,674,476 18.0
Deferred income taxes 39,422 0.2 27,415 0.1 Retained earnings 5,327,602 21.1 5,794,459 28.4
Other assets 1,912,470 7.6 2,389,740 11.7 Treasury stock (471,754) (1.9) (572,669) (2.8)
Total noncurrent assets 2,039,913 8.1 2,536,591 12.4 Excess value of marketable securities 12,407 0.0 11,877 0.1
Other equity 1,349,580 5.4 770,071 3.8
Total net worth 10,842,155 43.0 10,114,027 49.5
Total assets $ 25,202,046 100.0 % $ 20,417,791 100.0 % Total liabilities and net worth $ 25,202,046 100.0 % $ 20,417,791 100.0 %
Statement of Earnings Financial Ratios
2005 Participants 2004 Participants 2005 Participants 2004 Participants
Amount Percent Amount Percent Average Median Average Median
Contract revenue $ 69,319,656 95.7 % $ 53,599,344 95.9 % Liquidity RatiosOther revenue 3,132,922 4.3 2,301,590 4.1
Total Revenue 72,452,577 100.0 55,900,934 100.0 Current Ratio 1.6 1.6 1.8 1.7
Quick Ratio 1.4 1.4 1.5 1.5
Contract cost (60,205,348) (83.1) (46,454,365) (83.1) Days of Cash 6.9 2.6 5.5 4.0
Other cost (2,412,466) (3.3) (1,763,224) (3.2) Working Capital Turnover 8.9 9.8 7.8 9.6
Total cost (62,617,814) (86.4) (48,217,589) (86.3)
Profitability Ratios
Gross Profit 9,834,763 13.6 7,683,346 13.7
Return on Assets * 4.2 % 4.9 % 3.5 % 4.3 %
Selling, general & administrative expenses: Return on Equity * 9.7 % 12.6 % 7.0 % 11.6 %
Payroll (4,526,895) (6.2) (4,029,669) (7.2) Times Interest Earned 7.9 6.6 8.5 6.4
Professional fees (180,359) (0.2) (175,493) (0.3)
Sales & marketing costs (221,078) (0.3) (199,711) (0.4) Leverage Ratios
Technology costs (122,527) (0.2) (129,156) (0.2)
Administrative bonuses (355,378) (0.5) (323,649) (0.6) Debt to Equity 1.3 1.8 1.0 1.3
Other (3,349,247) (4.6) (2,060,291) (3.7) Revenue to Equity 6.7 8.7 5.5 7.7
Total SG&A expenses (8,755,484) (12.1) (6,917,970) (12.4) Asset Turnover 2.9 3.0 2.7 3.0
Fixed Asset Ratio 20.8 % 21.7 % 22.6 % 24.5 %
Income from operations 1,079,279 1.5 765,376 1.4 Equity to SG&A Expense 1.2 0.9 1.5 1.0
Underbillings to Equity 20.8 % 27.1 % 17.2 % 18.4 %
Interest income 39,211 0.1 29,086 0.1 Backlog to Equity 5.2 3.2 3.7 3.1
Interest expense (150,945) (0.2) (94,722) (0.2)
Other income / (expense), net 79,484 0.1 10,887 0.0
Efficiency Ratios
Net earnings / (loss) before income taxes 1,047,030 1.4 710,627 1.3
Backlog to Working Capital 5.1 4.2 4.5 3.6
Income tax (expense) / benefit (174,495) (0.2) (82,697) (0.1) Months in Backlog 5.6 4.9 5.6 5.6
Days in Accounts Receivable 68.3 67.6 64.1 61.5
Net earnings $ 872,535 1.2 % $ 627,930 1.1 % Days in Inventory 2.0 2.1 2.5 2.0
Days in Accounts Payable 26.6 25.9 24.3 22.7
Operating Cycle 50.5 45.2 47.8 46.5
Number of ParticipantsNumber
2005 552004 48
Note: Not all figures will apear to sum due to rounding.
* Inthe CFMA's2005AnnualFinancial Study,Returnon Assets (ROA) and Returnon Equity(ROE) arecalculatedusing
net earnings (loss) before income taxes. Studies conducted in prior years used net earnings (loss) after taxes to
calculate ROA and ROE. All references to ROAs and ROEs from prior studies have been updated to reflect this change.
Specialty Trade Contractors23531 Electrical Contractors
Specialty Trade Contractors
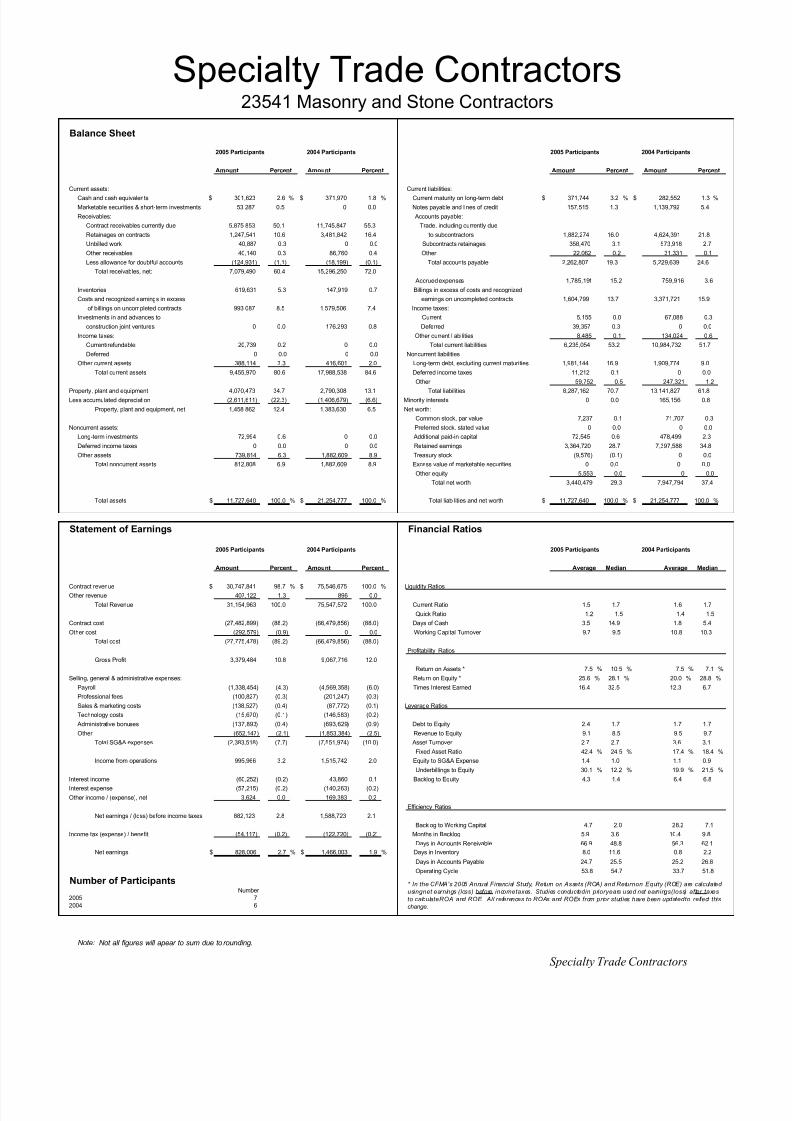
8/13/2019 2005 Financial Survey
http://slidepdf.com/reader/full/2005-financial-survey 227/284
Balance Sheet
2005 Participants 2004 Participants 2005 Participants 2004 Participants
Amount Percent Amount Percent Amount Percent Amount Percent
Current assets: Current liabilities:
Cash and cash equivalents $ 301,623 2.6 % $ 371,970 1.8 % Current maturity on long-term debt $ 371,744 3.2 % $ 282,552 1.3 %
Marketable securities & short-term investments 53,287 0.5 0 0.0 Notes payable and lines of credit 157,515 1.3 1,139,792 5.4
Receivables: Accounts payable:
Contract receivables currently due 5,875,853 50.1 11,745,847 55.3 Trade, including currently due
Retainages on contracts 1,247,541 10.6 3,481,842 16.4 to subcontractors 1,882,274 16.0 4,624,391 21.8
Unbilled work 40,887 0.3 0 0.0 Subcontracts retainages 358,470 3.1 573,918 2.7
Other receivables 40,140 0.3 86,760 0.4 Other 22,062 0.2 31,331 0.1
Less allowance for doubtful accounts (124,931) (1.1) (18,199) (0.1) Total accounts payable 2,262,807 19.3 5,229,639 24.6
Total receivables, net: 7,079,490 60.4 15,296,250 72.0
Accrued expenses 1,785,191 15.2 759,916 3.6
Inventories 619,631 5.3 147,919 0.7 Billings in excess of costs and recognized
Costs and recognized earnings in excess earnings on uncompleted contracts 1,604,799 13.7 3,371,721 15.9
of billings on uncompleted contracts 993,087 8.5 1,579,506 7.4 Income taxes:
Investments in and advances to Current 5,155 0.0 67,088 0.3
construction joint ventures 0 0.0 176,293 0.8 Deferred 39,357 0.3 0 0.0
Income taxes: Other current liabilities 8,485 0.1 134,024 0.6
Current/refundable 20,739 0.2 0 0.0 Total current liabilities 6,235,054 53.2 10,984,732 51.7
Deferred 0 0.0 0 0.0 Noncurrent liabilities
Other current assets 388,114 3.3 416,601 2.0 Long-term debt, excluding current maturities 1,981,144 16.9 1,909,774 9.0
Total current assets 9,455,970 80.6 17,988,538 84.6 Deferred income taxes 11,212 0.1 0 0.0
Other 59,752 0.5 247,321 1.2
Property, plant and equipment 4,070,473 34.7 2,790,308 13.1 Total liabilities 8,287,162 70.7 13,141,827 61.8Less accumulated depreciation (2,611,611) (22.3) (1,406,679) (6.6) Minority interests 0 0.0 165,156 0.8
Property, plant and equipment, net 1,458,862 12.4 1,383,630 6.5 Net worth:
Common stock, par value 7,237 0.1 71,707 0.3
Noncurrent assets: Preferred stock, stated value 0 0.0 0 0.0
Long-term investments 72,994 0.6 0 0.0 Additional paid-in capital 72,545 0.6 478,499 2.3
Deferred income taxes 0 0.0 0 0.0 Retained earnings 3,364,720 28.7 7,397,588 34.8
Other assets 739,814 6.3 1,882,609 8.9 Treasury stock (9,576) (0.1) 0 0.0
Total noncurrent assets 812,808 6.9 1,882,609 8.9 Excess value of marketable securities 0 0.0 0 0.0
Other equity 5,553 0.0 0 0.0
Total net worth 3,440,479 29.3 7,947,794 37.4
Total assets $ 11,727,640 100.0 % $ 21,254,777 100.0 % Total liabilities and net worth $ 11,727,640 100.0 % $ 21,254,777 100.0 %
Statement of Earnings Financial Ratios
2005 Participants 2004 Participants 2005 Participants 2004 Participants
Amount Percent Amount Percent Average Median Average Median
Contract revenue $ 30,747,841 98.7 % $ 75,546,675 100.0 % Liquidity RatiosOther revenue 407,122 1.3 896 0.0
Total Revenue 31,154,963 100.0 75,547,572 100.0 Current Ratio 1.5 1.7 1.6 1.7
Quick Ratio 1.2 1.5 1.4 1.5
Contract cost (27,482,899) (88.2) (66,479,856) (88.0) Days of Cash 3.5 14.9 1.8 5.4
Other cost (292,579) (0.9) 0 0.0 Working Capital Turnover 9.7 9.5 10.8 10.3
Total cost (27,775,478) (89.2) (66,479,856) (88.0)
Profitability Ratios
Gross Profit 3,379,484 10.8 9,067,716 12.0
Return on Assets * 7.5 % 10.5 % 7.5 % 7.1 %
Selling, general & administrative expenses: Return on Equity * 25.6 % 28.1 % 20.0 % 28.8 %
Payroll (1,338,454) (4.3) (4,569,358) (6.0) Times Interest Earned 16.4 32.5 12.3 6.7
Professional fees (100,827) (0.3) (201,247) (0.3)
Sales & marketing costs (138,527) (0.4) (87,772) (0.1) Leverage Ratios
Technology costs (15,670) (0.1) (146,583) (0.2)
Administrative bonuses (137,893) (0.4) (693,629) (0.9) Debt to Equity 2.4 1.7 1.7 1.7
Other (652,147) (2.1) (1,853,384) (2.5) Revenue to Equity 9.1 8.5 9.5 9.7
Total SG&A expenses (2,383,518) (7.7) (7,551,974) (10.0) Asset Turnover 2.7 2.7 3.6 3.1
Fixed Asset Ratio 42.4 % 24.5 % 17.4 % 18.4 %
Income from operations 995,966 3.2 1,515,742 2.0 Equity to SG&A Expense 1.4 1.0 1.1 0.9
Underbillings to Equity 30.1 % 12.2 % 19.9 % 21.5 %
Interest income (60,252) (0.2) 43,860 0.1 Backlog to Equity 4.3 1.4 6.4 6.8
Interest expense (57,215) (0.2) (140,263) (0.2)
Other income / (expense), net 3,624 0.0 169,383 0.2
Efficiency Ratios
Net earnings / (loss) before income taxes 882,123 2.8 1,588,723 2.1
Backlog to Working Capital 4.7 2.0 28.2 7.1
Income tax (expense) / benefit (54,117) (0.2) (122,720) (0.2) Months in Backlog 5.9 3.6 10.4 9.8
Days in Accounts Receivable 66.9 48.8 56.3 62.1
Net earnings $ 828,006 2.7 % $ 1,466,003 1.9 % Days in Inventory 8.0 11.6 0.8 2.2
Days in Accounts Payable 24.7 25.5 25.2 26.8
Operating Cycle 53.8 54.7 33.7 51.8
Number of ParticipantsNumber
2005 72004 6
Note: Not all figures will apear to sum due to rounding.
* In the CFMA's 2005 Annual Financial Study, Return on Assets (ROA) and Returnon Equity (ROE) are calculated
usingnet earnings (loss) before incometaxes. Studies conductedin prioryears used net earnings(loss) after taxes
to calculateROA and ROE. All references to ROAs and ROEs from prior studies have been updatedto reflect this
change.
23541 Masonry and Stone Contractors
Specialty Trade Contractors
Specialty Trade Contractors
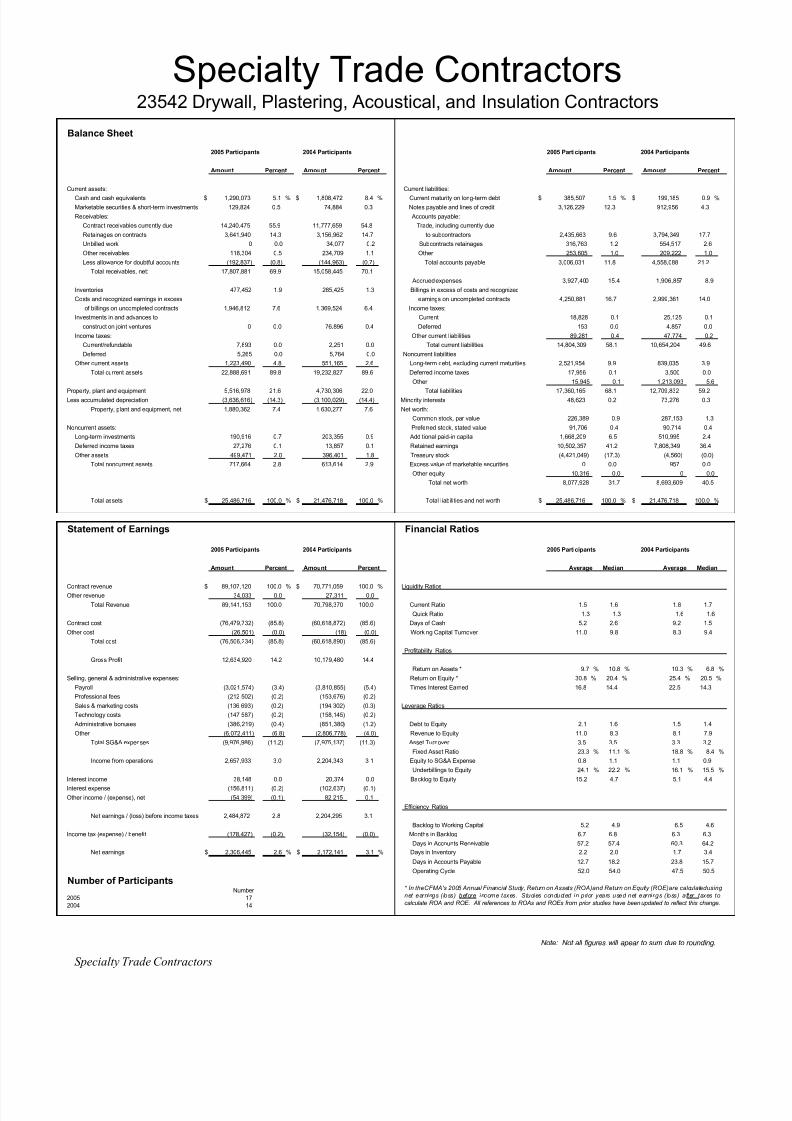
8/13/2019 2005 Financial Survey
http://slidepdf.com/reader/full/2005-financial-survey 228/284
Balance Sheet
2005 Participants 2004 Participants 2005 Participants 2004 Participants
Amount Percent Amount Percent Amount Percent Amount Percent
Current assets: Current liabilities:
Cash and cash equivalents $ 1,290,073 5.1 % $ 1,808,472 8.4 % Current maturity on long-term debt $ 385,507 1.5 % $ 199,185 0.9 %
Marketable securities & short-term investments 129,824 0.5 74,884 0.3 Notes payable and lines of credit 3,126,229 12.3 912,956 4.3
Receivables: Accounts payable:
Contract receivables currently due 14,240,475 55.9 11,777,659 54.8 Trade, including currently due
Retainages on contracts 3,641,940 14.3 3,156,962 14.7 to subcontractors 2,435,663 9.6 3,794,349 17.7
Unbilled work 0 0.0 34,077 0.2 Subcontracts retainages 316,763 1.2 554,517 2.6
Other receivables 118,304 0.5 234,709 1.1 Other 253,605 1.0 209,222 1.0
Less allowance for doubtful accounts (192,837) (0.8) (144,963) (0.7) Total accounts payable 3,006,031 11.8 4,558,088 21.2
Total receivables, net: 17,807,881 69.9 15,058,445 70.1
Accrued expenses 3,927,400 15.4 1,906,857 8.9
Inventories 477,452 1.9 285,425 1.3 Billings in excess of costs and recognized
Costs and recognized earnings in excess earnings on uncompleted contracts 4,250,881 16.7 2,999,361 14.0
of billings on uncompleted contracts 1,946,812 7.6 1,369,524 6.4 Income taxes:
Investments in and advances to Current 18,828 0.1 25,125 0.1
construction joint ventures 0 0.0 76,896 0.4 Deferred 153 0.0 4,857 0.0
Income taxes: Other current liabilities 89,281 0.4 47,774 0.2
Current/refundable 7,893 0.0 2,251 0.0 Total current liabilities 14,804,309 58.1 10,654,204 49.6
Deferred 5,265 0.0 5,764 0.0 Noncurrent liabilities
Other current assets 1,223,490 4.8 551,165 2.6 Long-term debt, excluding current maturities 2,521,954 9.9 839,035 3.9
Total current assets 22,888,691 89.8 19,232,827 89.6 Deferred income taxes 17,956 0.1 3,500 0.0
Other 15,945 0.1 1,213,093 5.6
Property, plant and equipment 5,516,978 21.6 4,730,306 22.0 Total liabilities 17,360,165 68.1 12,709,832 59.2Less accumulated depreciation (3,636,616) (14.3) (3,100,029) (14.4) Minority interests 48,623 0.2 73,276 0.3
Property, plant and equipment, net 1,880,362 7.4 1,630,277 7.6 Net worth:
Common stock, par value 226,389 0.9 287,153 1.3
Noncurrent assets: Preferred stock, stated value 91,706 0.4 90,714 0.4
Long-term investments 190,916 0.7 203,355 0.9 Additional paid-in capital 1,668,209 6.5 510,995 2.4
Deferred income taxes 27,276 0.1 13,857 0.1 Retained earnings 10,502,357 41.2 7,808,349 36.4
Other assets 499,471 2.0 396,401 1.8 Treasury stock (4,421,049) (17.3) (4,560) (0.0)
Total noncurrent assets 717,664 2.8 613,614 2.9 Excess value of marketable securities 0 0.0 957 0.0
Other equity 10,316 0.0 0 0.0
Total net worth 8,077,928 31.7 8,693,609 40.5
Total assets $ 25,486,716 100.0 % $ 21,476,718 100.0 % Total liabilities and net worth $ 25,486,716 100.0 % $ 21,476,718 100.0 %
Statement of Earnings Financial Ratios
2005 Participants 2004 Participants 2005 Participants 2004 Participants
Amount Percent Amount Percent Average Median Average Median
Contract revenue $ 89,107,120 100.0 % $ 70,771,059 100.0 % Liquidity RatiosOther revenue 34,033 0.0 27,311 0.0
Total Revenue 89,141,153 100.0 70,798,370 100.0 Current Ratio 1.5 1.6 1.8 1.7
Quick Ratio 1.3 1.3 1.6 1.6
Contract cost (76,479,732) (85.8) (60,618,872) (85.6) Days of Cash 5.2 2.6 9.2 1.5
Other cost (26,501) (0.0) (18) (0.0) Working Capital Turnover 11.0 9.8 8.3 9.4
Total cost (76,506,234) (85.8) (60,618,890) (85.6)
Profitability Ratios
Gross Profit 12,634,920 14.2 10,179,480 14.4
Return on Assets * 9.7 % 10.8 % 10.3 % 6.8 %
Selling, general & administrative expenses: Return on Equity * 30.8 % 20.4 % 25.4 % 20.5 %
Payroll (3,021,574) (3.4) (3,810,855) (5.4) Times Interest Earned 16.8 14.4 22.5 14.3
Professional fees (212,502) (0.2) (153,676) (0.2)
Sales & marketing costs (136,693) (0.2) (194,302) (0.3) Leverage Ratios
Technology costs (147,587) (0.2) (158,145) (0.2)
Administrative bonuses (386,219) (0.4) (851,380) (1.2) Debt to Equity 2.1 1.6 1.5 1.4
Other (6,072,411) (6.8) (2,806,778) (4.0) Revenue to Equity 11.0 8.3 8.1 7.9
Total SG&A expenses (9,976,986) (11.2) (7,975,137) (11.3) Asset Turnover 3.5 3.5 3.3 3.2
Fixed Asset Ratio 23.3 % 11.1 % 18.8 % 8.4 %
Income from operations 2,657,933 3.0 2,204,343 3.1 Equity to SG&A Expense 0.8 1.1 1.1 0.9
Underbillings to Equity 24.1 % 22.2 % 16.1 % 15.5 %
Interest income 38,148 0.0 20,374 0.0 Backlog to Equity 15.2 4.7 5.1 4.4
Interest expense (156,811) (0.2) (102,637) (0.1)
Other income / (expense), net (54,399) (0.1) 82,215 0.1
Efficiency Ratios
Net earnings / (loss) before income taxes 2,484,872 2.8 2,204,295 3.1
Backlog to Working Capital 5.2 4.9 6.5 4.6
Income tax (expense) / benefit (178,427) (0.2) (32,154) (0.0) Months in Backlog 6.7 6.8 6.3 6.3
Days in Accounts Receivable 57.2 57.4 60.3 64.2
Net earnings $ 2,306,445 2.6 % $ 2,172,141 3.1 % Days in Inventory 2.2 2.0 1.7 3.4
Days in Accounts Payable 12.7 18.2 23.8 15.7
Operating Cycle 52.0 54.0 47.5 50.5
Number of ParticipantsNumber
2005 172004 14
Note: Not all figures will apear to sum due to rounding.
* In theCFMA's 2005 Annual Financial Study, Return on Assets (ROA)and Return on Equity (ROE)are calculatedusing
net earnings (loss) before income taxes. Studies conducted in prior years used net earnings (loss) after taxes to
calculate ROA and ROE. All references to ROAs and ROEs from prior studies have been updated to reflect this change.
Specialty Trade Contractors23542 Drywall, Plastering, Acoustical, and Insulation Contractors
Specialty Trade Contractors

8/13/2019 2005 Financial Survey
http://slidepdf.com/reader/full/2005-financial-survey 229/284
Balance Sheet
2005 Participants 2004 Participants 2005 Participants 2004 Participants
Amount Percent Amount Percent Amount Percent Amount Percent
Current assets: Current liabilities:
Cash and cash equivalents $ 982,063 7.7 % $ 1,231,581 6.0 % Current maturity on long-term debt $ 87,705 0.7 % $ 268,139 1.3 %
Marketable securities & short-term investments 177,936 1.4 75,695 0.4 Notes payable and lines of credit 579,377 4.5 565,857 2.7
Receivables: Accounts payable:
Contract receivables currently due 6,210,983 48.4 11,117,989 54.0 Trade, including currently due
Retainages on contracts 1,142,155 8.9 2,378,238 11.6 to subcontractors 2,469,054 19.2 3,954,555 19.2
Unbilled work 53,293 0.4 31,898 0.2 Subcontracts retainages 606,533 4.7 551,120 2.7
Other receivables 182,149 1.4 111,005 0.5 Other 62,303 0.5 12,535 0.1
Less allowance for doubtful accounts (66,223) (0.5) (36,089) (0.2) Total accounts payable 3,137,890 24.5 4,518,210 22.0
Total receivables, net: 7,522,357 58.6 13,603,041 66.1
Accrued expenses 1,263,584 9.9 1,800,705 8.7
Inventories 324,013 2.5 421,925 2.1 Billings in excess of costs and recognized
Costs and recognized earnings in excess earnings on uncompleted contracts 890,928 6.9 2,734,662 13.3
of billings on uncompleted contracts 967,295 7.5 1,421,530 6.9 Income taxes:
Investments in and advances to Current 47,178 0.4 34,250 0.2
construction joint ventures 0 0.0 81,366 0.4 Deferred 4,062 0.0 25,815 0.1
Income taxes: Other current liabilities 19,465 0.2 18,921 0.1
Current/refundable 5,498 0.0 5,438 0.0 Total current liabilities 6,030,188 47.0 9,966,559 48.4
Deferred 5,623 0.0 57,661 0.3 Noncurrent liabilities
Other current assets 367,565 2.9 549,582 2.7 Long-term debt, excluding current maturities 339,826 2.6 1,583,884 7.7
Total current assets 10,352,351 80.7 17,447,819 84.8 Deferred income taxes 30,809 0.2 29,774 0.1
Other 50,889 0.4 124,926 0.6
Property, plant and equipment 5,423,313 42.3 6,248,616 30.4 Total liabilities 6,451,711 50.3 11,705,143 56.9Less accumulated depreciation (3,456,121) (26.9) (3,752,104) (18.2) Minority interests 0 0.0 76,226 0.4
Property, plant and equipment, net 1,967,191 15.3 2,496,512 12.1 Net worth:
Common stock, par value 176,055 1.4 297,380 1.4
Noncurrent assets: Preferred stock, stated value 0 0.0 0 0.0
Long-term investments 84,775 0.7 126,665 0.6 Additional paid-in capital 533,077 4.2 440,013 2.1
Deferred income taxes 71,487 0.6 20,128 0.1 Retained earnings 7,172,405 55.9 9,751,074 47.4
Other assets 352,211 2.7 488,999 2.4 Treasury stock (1,482,238) (11.6) (1,820,991) (8.8)
Total noncurrent assets 508,473 4.0 635,793 3.1 Excess value of marketable securities 7,078 0.1 6,144 0.0
Other equity (30,073) (0.2) 125,133 0.6
Total net worth 6,376,304 49.7 8,798,754 42.8
Total assets $ 12,828,016 100.0 % $ 20,580,123 100.0 % Total liabilities and net worth $ 12,828,016 100.0 % $ 20,580,123 100.0 %
Statement of Earnings Financial Ratios
2005 Participants 2004 Participants 2005 Participants 2004 Participants
Amount Percent Amount Percent Average Median Average Median
Contract revenue $ 41,603,144 98.2 % $ 68,579,549 99.0 % Liquidity RatiosOther revenue 771,319 1.8 668,447 1.0
Total Revenue 42,374,463 100.0 69,247,996 100.0 Current Ratio 1.7 1.7 1.8 1.8
Quick Ratio 1.4 1.3 1.5 1.5
Contract cost (35,041,793) (82.7) (60,007,890) (86.7) Days of Cash 8.3 2.8 6.4 4.0
Other cost (541,128) (1.3) (438,067) (0.6) Working Capital Turnover 9.8 8.8 9.3 8.3
Total cost (35,582,922) (84.0) (60,445,957) (87.3)
Profitability Ratios
Gross Profit 6,791,541 16.0 8,802,039 12.7
Return on Assets * 10.7 % 11.6 % 8.2 % 3.9 %
Selling, general & administrative expenses: Return on Equity * 21.5 % 16.8 % 19.2 % 14.5 %
Payroll (2,946,723) (7.0) (3,881,158) (5.6) Times Interest Earned 16.8 10.1 16.5 8.5
Professional fees (133,451) (0.3) (146,647) (0.2)
Sales & marketing costs (73,636) (0.2) (379,275) (0.5) Leverage Ratios
Technology costs (68,151) (0.2) (111,308) (0.2)
Administrative bonuses (238,709) (0.6) (482,562) (0.7) Debt to Equity 1.0 1.5 1.3 1.3
Other (1,941,993) (4.6) (2,132,588) (3.1) Revenue to Equity 6.6 7.1 7.9 6.8
Total SG&A expenses (5,402,663) (12.7) (7,133,538) (10.3) Asset Turnover 3.3 3.1 3.4 3.0
Fixed Asset Ratio 30.9 % 27.8 % 28.4 % 37.5 %
Income from operations 1,388,878 3.3 1,668,501 2.4 Equity to SG&A Expense 1.2 0.9 1.2 1.1
Underbillings to Equity 16.0 % 12.6 % 16.5 % 14.2 %
Interest income 25,473 0.1 23,077 0.0 Backlog to Equity 3.7 1.9 4.9 3.7
Interest expense (86,904) (0.2) (108,743) (0.2)
Other income / (expense), net 41,487 0.1 104,182 0.2
Efficiency Ratios
Net earnings / (loss) before income taxes 1,368,935 3.2 1,687,017 2.4
Backlog to Working Capital 5.1 2.2 7.0 4.8
Income tax (expense) / benefit (96,517) (0.2) (120,515) (0.2) Months in Backlog 4.9 5.4 7.1 6.2
Days in Accounts Receivable 53.8 55.0 58.2 59.1
Net earnings $ 1,272,418 3.0 % $ 1,566,502 2.3 % Days in Inventory 3.3 6.1 2.5 5.3
Days in Accounts Payable 25.6 21.5 23.6 27.9
Operating Cycle 39.8 43.1 43.5 48.8
Number of ParticipantsNumber
2005 132004 13
Note: Not all figures will apear to sum due to rounding.
* In theCFMA's 2005Annual Financial Study, Return on Assets (ROA)and Return on Equity (ROE)are calculatedusing
net earnings (loss) before income taxes. Studies conducted in prior years used net earnings (loss) after taxes to
calculate ROA and ROE. All references to ROAs and ROEs from prior studies have been updated to reflect this change.
Specialty Trade Contractors23561 Roofing, Siding, and Sheetmetal Contractors
Specialty Trade Contractors
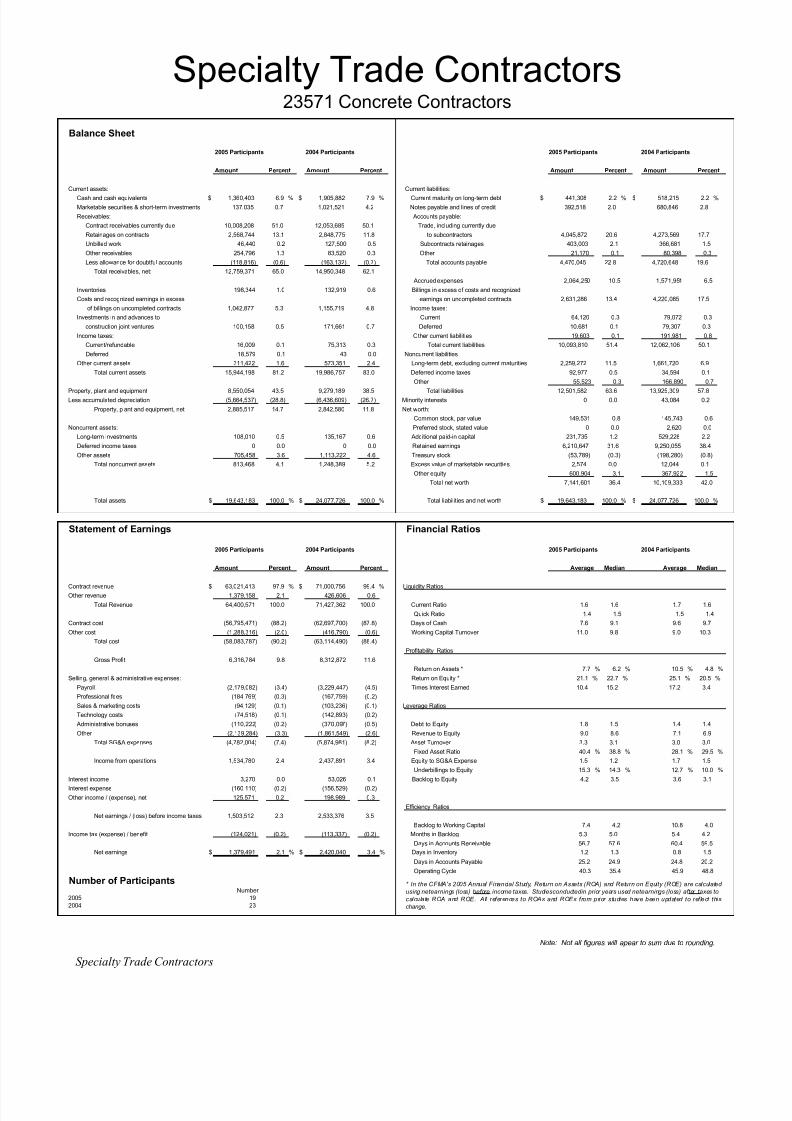
8/13/2019 2005 Financial Survey
http://slidepdf.com/reader/full/2005-financial-survey 230/284
Balance Sheet
2005 Participants 2004 Participants 2005 Participants 2004 Participants
Amount Percent Amount Percent Amount Percent Amount Percent
Current assets: Current liabilities:
Cash and cash equivalents $ 1,360,403 6.9 % $ 1,905,882 7.9 % Current maturity on long-term debt $ 441,308 2.2 % $ 518,215 2.2 %
Marketable securities & short-term investments 137,035 0.7 1,021,521 4.2 Notes payable and lines of credit 392,518 2.0 680,846 2.8
Receivables: Accounts payable:
Contract receivables currently due 10,008,208 51.0 12,053,685 50.1 Trade, including currently due
Retainages on contracts 2,568,744 13.1 2,848,775 11.8 to subcontractors 4,045,872 20.6 4,273,569 17.7
Unbilled work 46,440 0.2 127,500 0.5 Subcontracts retainages 403,003 2.1 366,681 1.5
Other receivables 254,796 1.3 83,520 0.3 Other 21,170 0.1 80,398 0.3
Less allowance for doubtful accounts (118,816) (0.6) (163,132) (0.7) Total accounts payable 4,470,045 22.8 4,720,648 19.6
Total receivables, net: 12,759,371 65.0 14,950,348 62.1
Accrued expenses 2,064,250 10.5 1,571,951 6.5
Inventories 198,344 1.0 132,919 0.6 Billings in excess of costs and recognized
Costs and recognized earnings in excess earnings on uncompleted contracts 2,631,286 13.4 4,220,085 17.5
of billings on uncompleted contracts 1,042,877 5.3 1,155,719 4.8 Income taxes:
Investments in and advances to Current 64,120 0.3 79,072 0.3
construction joint ventures 100,158 0.5 171,661 0.7 Deferred 10,681 0.1 79,307 0.3
Income taxes: Other current liabilities 19,603 0.1 191,981 0.8
Current/refundable 16,009 0.1 75,313 0.3 Total current liabilities 10,093,810 51.4 12,062,106 50.1
Deferred 18,579 0.1 43 0.0 Noncurrent liabilities
Other current assets 311,422 1.6 573,351 2.4 Long-term debt, excluding current maturities 2,259,272 11.5 1,661,720 6.9
Total current assets 15,944,198 81.2 19,986,757 83.0 Deferred income taxes 92,977 0.5 34,594 0.1
Other 55,523 0.3 166,890 0.7
Property, plant and equipment 8,550,054 43.5 9,279,189 38.5 Total liabilities 12,501,582 63.6 13,925,309 57.8Less accumulated depreciation (5,664,537) (28.8) (6,436,609) (26.7) Minority interests 0 0.0 43,084 0.2
Property, plant and equipment, net 2,885,517 14.7 2,842,580 11.8 Net worth:
Common stock, par value 149,531 0.8 145,743 0.6
Noncurrent assets: Preferred stock, stated value 0 0.0 2,620 0.0
Long-term investments 108,010 0.5 135,167 0.6 Additional paid-in capital 231,735 1.2 529,228 2.2
Deferred income taxes 0 0.0 0 0.0 Retained earnings 6,210,647 31.6 9,250,055 38.4
Other assets 705,458 3.6 1,113,222 4.6 Treasury stock (53,789) (0.3) (198,280) (0.8)
Total noncurrent assets 813,468 4.1 1,248,389 5.2 Excess value of marketable securities 2,574 0.0 12,044 0.1
Other equity 600,904 3.1 367,922 1.5
Total net worth 7,141,601 36.4 10,109,333 42.0
Total assets $ 19,643,183 100.0 % $ 24,077,726 100.0 % Total liabilities and net worth $ 19,643,183 100.0 % $ 24,077,726 100.0 %
Statement of Earnings Financial Ratios
2005 Participants 2004 Participants 2005 Participants 2004 Participants
Amount Percent Amount Percent Average Median Average Median
Contract revenue $ 63,021,413 97.9 % $ 71,000,756 99.4 % Liquidity RatiosOther revenue 1,379,158 2.1 426,606 0.6
Total Revenue 64,400,571 100.0 71,427,362 100.0 Current Ratio 1.6 1.6 1.7 1.6
Quick Ratio 1.4 1.5 1.5 1.4
Contract cost (56,795,471) (88.2) (62,697,700) (87.8) Days of Cash 7.6 9.1 9.6 9.7
Other cost (1,288,316) (2.0) (416,790) (0.6) Working Capital Turnover 11.0 9.8 9.0 10.3
Total cost (58,083,787) (90.2) (63,114,490) (88.4)
Profitability Ratios
Gross Profit 6,316,784 9.8 8,312,872 11.6
Return on Assets * 7.7 % 6.2 % 10.5 % 4.8 %
Selling, general & administrative expenses: Return on Equity * 21.1 % 22.7 % 25.1 % 20.5 %
Payroll (2,179,082) (3.4) (3,229,447) (4.5) Times Interest Earned 10.4 15.2 17.2 3.4
Professional fees (184,769) (0.3) (167,759) (0.2)
Sales & marketing costs (94,129) (0.1) (103,236) (0.1) Leverage Ratios
Technology costs (74,518) (0.1) (142,893) (0.2)
Administrative bonuses (110,222) (0.2) (370,097) (0.5) Debt to Equity 1.8 1.5 1.4 1.4
Other (2,139,284) (3.3) (1,861,549) (2.6) Revenue to Equity 9.0 8.6 7.1 6.9
Total SG&A expenses (4,782,004) (7.4) (5,874,981) (8.2) Asset Turnover 3.3 3.1 3.0 3.0
Fixed Asset Ratio 40.4 % 38.8 % 28.1 % 29.5 %
Income from operations 1,534,780 2.4 2,437,891 3.4 Equity to SG&A Expense 1.5 1.2 1.7 1.5
Underbillings to Equity 15.3 % 14.3 % 12.7 % 10.0 %
Interest income 3,270 0.0 53,026 0.1 Backlog to Equity 4.2 3.5 3.6 3.1
Interest expense (160,110) (0.2) (156,529) (0.2)
Other income / (expense), net 125,571 0.2 198,989 0.3
Efficiency Ratios
Net earnings / (loss) before income taxes 1,503,512 2.3 2,533,376 3.5
Backlog to Working Capital 7.4 4.2 10.8 4.0
Income tax (expense) / benefit (124,021) (0.2) (113,337) (0.2) Months in Backlog 5.3 5.0 5.4 4.2
Days in Accounts Receivable 56.7 57.6 60.4 59.5
Net earnings $ 1,379,491 2.1 % $ 2,420,040 3.4 % Days in Inventory 1.2 1.3 0.8 1.5
Days in Accounts Payable 25.2 24.9 24.8 20.2
Operating Cycle 40.3 35.4 45.9 48.8
Number of ParticipantsNumber
2005 192004 23
Note: Not all figures will apear to sum due to rounding.
* In the CFMA's 2005 Annual Financial Study, Return on Assets (ROA) and Return on Equity (ROE) are calculated
using netearnings (loss) before income taxes. Studiesconductedin prior years used netearnings (loss) after taxes to
calculate ROA and ROE. All references to ROAs and ROEs from prior studies have been updated to ref lect this
change.
Specialty Trade Contractors23571 Concrete Contractors
Specialty Trade Contractors

8/13/2019 2005 Financial Survey
http://slidepdf.com/reader/full/2005-financial-survey 231/284
Balance Sheet
2005 Participants 2004 Participants 2005 Participants 2004 Participants
Amount Percent Amount Percent Amount Percent Amount Percent
Current assets: Current liabilities:
Cash and cash equivalents $ 903,416 4.1 % $ 1,155,359 6.2 % Current maturity on long-term debt $ 312,091 1.4 % $ 292,044 1.6 %
Marketable securities & short-term investments 3,545 0.0 2,610 0.0 Notes payable and lines of credit 1,647,890 7.5 1,170,380 6.3
Receivables: Accounts payable:
Contract receivables currently due 10,615,225 48.3 9,610,012 51.9 Trade, including currently due
Retainages on contracts 1,767,873 8.0 819,632 4.4 to subcontractors 4,473,605 20.3 3,300,184 17.8
Unbilled work 417,658 1.9 48,493 0.3 Subcontracts retainages 496,373 2.3 224,760 1.2
Other receivables 137,592 0.6 11,586 0.1 Other 247,658 1.1 124,727 0.7
Less allowance for doubtful accounts (137,656) (0.6) (64,338) (0.3) Total accounts payable 5,217,636 23.7 3,649,671 19.7
Total receivables, net: 12,800,692 58.2 10,425,386 56.3
Accrued expenses 1,900,423 8.6 1,849,080 10.0
Inventories 345,402 1.6 182,469 1.0 Billings in excess of costs and recognized
Costs and recognized earnings in excess earnings on uncompleted contracts 1,723,768 7.8 1,528,069 8.3
of billings on uncompleted contracts 1,803,268 8.2 1,185,771 6.4 Income taxes:
Investments in and advances to Current 139,484 0.6 7,921 0.0
construction joint ventures 173,000 0.8 361,306 2.0 Deferred 0 0.0 27,095 0.1
Income taxes: Other current liabilities 26,036 0.1 78,637 0.4
Current/refundable 9 0.0 90,995 0.5 Total current liabilities 10,967,327 49.9 8,602,896 46.5
Deferred 43,372 0.2 43,275 0.2 Noncurrent liabilities
Other current assets 312,022 1.4 380,216 2.1 Long-term debt, excluding current maturities 2,072,993 9.4 1,550,158 8.4
Total current assets 16,384,727 74.5 13,827,386 74.7 Deferred income taxes (187,814) (0.9) 124,607 0.7
Other 6,697 0.0 197,082 1.1
Property, plant and equipment 11,446,504 52.1 11,436,599 61.8 Total liabilities 12,859,203 58.5 10,474,743 56.6Less accumulated depreciation (7,512,427) (34.2) (7,499,862) (40.5) Minority interests 116 0.0 (194) (0.0)
Property, plant and equipment, net 3,934,076 17.9 3,936,737 21.3 Net worth:
Common stock, par value 225,296 1.0 339,351 1.8
Noncurrent assets: Preferred stock, stated value 0 0.0 0 0.0
Long-term investments 204,348 0.9 168,146 0.9 Additional paid-in capital 1,774,733 8.1 509,176 2.7
Deferred income taxes 143,000 0.7 69,025 0.4 Retained earnings 6,217,196 28.3 7,265,293 39.2
Other assets 1,318,501 6.0 517,263 2.8 Treasury stock (4,861) (0.0) (71,899) (0.4)
Total noncurrent assets 1,665,849 7.6 754,434 4.1 Excess value of marketable securities 0 0.0 0 0.0
Other equity 912,971 4.2 2,088 0.0
Total net worth 9,125,334 41.5 8,044,008 43.4
Total assets $ 21,984,653 100.0 % $ 18,518,557 100.0 % Total liabilities and net worth $ 21,984,653 100.0 % $ 18,518,557 100.0 %
Statement of Earnings Financial Ratios
2005 Participants 2004 Participants 2005 Participants 2004 Participants
Amount Percent Amount Percent Average Median Average Median
Contract revenue $ 64,141,500 96.3 % $ 57,587,060 97.9 % Liquidity RatiosOther revenue 2,481,455 3.7 1,225,820 2.1
Total Revenue 66,622,954 100.0 58,812,880 100.0 Current Ratio 1.5 1.5 1.6 1.5
Quick Ratio 1.2 1.3 1.3 1.3
Contract cost (57,717,583) (86.6) (51,392,629) (87.4) Days of Cash 4.9 1.1 7.1 3.5
Other cost (2,326,385) (3.5) (1,198,271) (2.0) Working Capital Turnover 12.3 12.6 11.3 10.9
Total cost (60,043,968) (90.1) (52,590,900) (89.4)
Profitability Ratios
Gross Profit 6,578,987 9.9 6,221,980 10.6
Return on Assets * 6.4 % 6.2 % 2.6 % 0.2 %
Selling, general & administrative expenses: Return on Equity * 15.4 % 13.7 % 6.0 % 0.3 %
Payroll (2,654,136) (4.0) (3,209,859) (5.5) Times Interest Earned 8.1 11.5 3.8 1.6
Professional fees (155,761) (0.2) (172,130) (0.3)
Sales & marketing costs (188,200) (0.3) (148,375) (0.3) Leverage Ratios
Technology costs (170,831) (0.3) (189,479) (0.3)
Administrative bonuses (169,050) (0.3) (111,338) (0.2) Debt to Equity 1.4 2.3 1.3 2.4
Other (1,890,633) (2.8) (1,866,510) (3.2) Revenue to Equity 7.3 6.8 7.3 10.2
Total SG&A expenses (5,228,611) (7.8) (5,697,692) (9.7) Asset Turnover 3.0 2.6 3.2 2.8
Fixed Asset Ratio 43.1 % 37.9 % 48.9 % 41.7 %
Income from operations 1,350,376 2.0 524,289 0.9 Equity to SG&A Expense 1.7 1.7 1.4 0.8
Underbillings to Equity 24.3 % 19.9 % 15.3 % 27.5 %
Interest income 26,836 0.0 19,847 0.0 Backlog to Equity 3.6 2.8 6.7 3.8
Interest expense (197,488) (0.3) (171,590) (0.3)
Other income / (expense), net 228,683 0.3 106,310 0.2
Efficiency Ratios
Net earnings / (loss) before income taxes 1,408,408 2.1 478,856 0.8
Backlog to Working Capital 6.8 4.1 7.7 4.2
Income tax (expense) / benefit (147,350) (0.2) 29,224 0.0 Months in Backlog 4.9 4.4 5.0 4.8
Days in Accounts Receivable 57.4 64.0 58.5 70.8
Net earnings $ 1,261,058 1.9 % $ 508,080 0.9 % Days in Inventory 2.1 0.9 1.2 1.4
Days in Accounts Payable 28.3 26.6 23.4 27.4
Operating Cycle 36.0 36.3 43.4 49.8
Number of ParticipantsNumber
2005 112004 8
Note: Not all figures will apear to sum due to rounding.
* In theCFMA's 2005 Annual Financial Study, Return on Assets (ROA)and Returnon Equity (ROE)are calculatedusing net
earnings (loss) before income taxes. Studies conducted in prior years used net earnings (loss) after taxes to calculate
ROA and ROE. All references to ROAs and ROEs from prior studies have been updated to reflect this change.
Specialty Trade Contractors23591 Structural Steel Erection Contractors
Specialty Trade Contractors
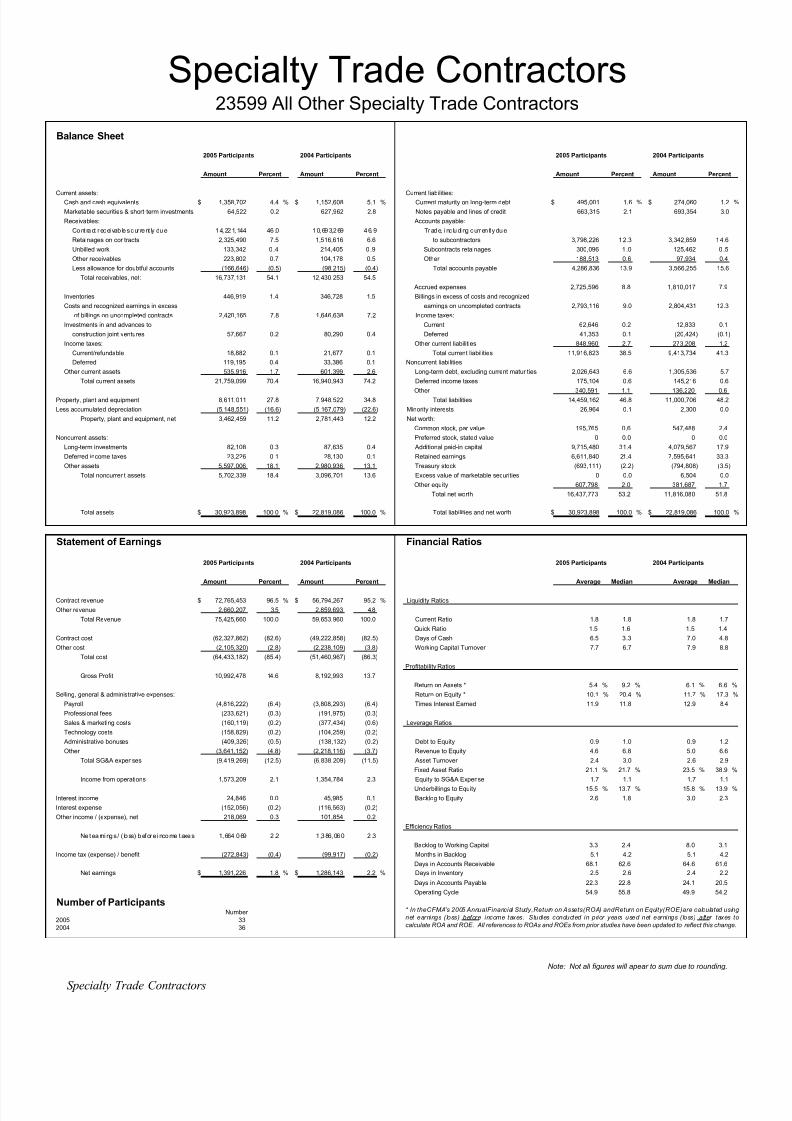
8/13/2019 2005 Financial Survey
http://slidepdf.com/reader/full/2005-financial-survey 232/284
Balance Sheet
2005 Participants 2004 Participants 2005 Participants 2004 Participants
Amount Percent Amount Percent Amount Percent Amount Percent
Current assets: Current liabilities:Cash and cash equivalents $ 1,358,702 4.4 % $ 1,152,608 5.1 % Current maturity on long-term debt $ 495,001 1.6 % $ 274,060 1.2 %
Marketable securities & short-term investments 64,522 0.2 627,962 2.8 Notes payable and lines of credit 663,315 2.1 693,354 3.0
Receivables: Accounts payable:
Cont ract r ecei vab les cur rent ly due 14,221,144 46 .0 10,693,269 46.9 Trade, i nc luding curren tl y due
Retainages on contracts 2,325,490 7.5 1,516,616 6.6 to subcontractors 3,798,226 12.3 3,342,859 14.6
Unbilled work 133,342 0.4 214,405 0.9 Subcontracts retainages 300,096 1.0 125,462 0.5
Other receivables 223,802 0.7 104,178 0.5 Other 188,513 0.6 97,934 0.4
Less allowance for doubtful accounts (166,646) (0.5) (98,215) (0.4) Total accounts payable 4,286,836 13.9 3,566,255 15.6
Total receivables, net: 16,737,131 54.1 12,430,253 54.5
Accrued expenses 2,725,596 8.8 1,810,017 7.9
Inventories 446,919 1.4 346,728 1.5 Billings in excess of costs and recognized
Costs and recognized earnings in excess earnings on uncompleted contracts 2,793,116 9.0 2,804,431 12.3
of billings on uncompleted contracts 2,420,165 7.8 1,646,638 7.2 Income taxes:
Investments in and advances to Current 62,646 0.2 12,833 0.1
construction joint ventures 57,667 0.2 80,290 0.4 Deferred 41,353 0.1 (20,424) (0.1)
Income taxes: Other current liabilities 848,960 2.7 273,208 1.2
Current/refundable 18,882 0.1 21,677 0.1 Total current liabilities 11,916,823 38.5 9,413,734 41.3
Deferred 119,195 0.4 33,386 0.1 Noncurrent liabilities
Other current assets 535,916 1.7 601,399 2.6 Long-term debt, excluding current maturities 2,026,643 6.6 1,305,536 5.7
Total current assets 21,759,099 70.4 16,940,943 74.2 Deferred income taxes 175,104 0.6 145,216 0.6
Other 340,591 1.1 136,220 0.6Property, plant and equipment 8,611,011 27.8 7,948,522 34.8 Total liabilities 14,459,162 46.8 11,000,706 48.2
Less accumulated depreciation (5,148,551) (16.6) (5,167,079) (22.6) Minority interests 26,964 0.1 2,300 0.0
Property, plant and equipment, net 3,462,459 11.2 2,781,443 12.2 Net worth:
Common stock, par value 195,765 0.6 547,488 2.4
Noncurrent assets: Preferred stock, stated value 0 0.0 0 0.0
Long-term investments 82,108 0.3 87,635 0.4 Additional paid-in capital 9,715,480 31.4 4,079,567 17.9
Deferred income taxes 23,226 0.1 28,130 0.1 Retained earnings 6,611,840 21.4 7,595,641 33.3
Other assets 5,597,006 18.1 2,980,936 13.1 Treasury stock (693,111) (2.2) (794,808) (3.5)
Total noncurrent assets 5,702,339 18.4 3,096,701 13.6 Excess value of marketable securities 0 0.0 6,504 0.0
Other equity 607,798 2.0 381,687 1.7
Total net worth 16,437,773 53.2 11,816,080 51.8
Total assets $ 30,923,898 100.0 % $ 22,819,086 100.0 % Total liabilities and net worth $ 30,923,898 100.0 % $ 22,819,086 100.0 %
Statement of Earnings Financial Ratios
2005 Participants 2004 Participants 2005 Participants 2004 Participants
Amount Percent Amount Percent Average Median Average Median
Contract revenue $ 72,765,453 96.5 % $ 56,794,267 95.2 % Liquidity Ratios
Other revenue 2,660,207 3.5 2,859,693 4.8
Total Revenue 75,425,660 100.0 59,653,960 100.0 Current Ratio 1.8 1.8 1.8 1.7
Quick Ratio 1.5 1.6 1.5 1.4
Contract cost (62,327,862) (82.6) (49,222,858) (82.5) Days of Cash 6.5 3.3 7.0 4.8
Other cost (2,105,320) (2.8) (2,238,109) (3.8) Working Capital Turnover 7.7 6.7 7.9 8.8
Total cost (64,433,182) (85.4) (51,460,967) (86.3)
Profitability Ratios
Gross Profit 10,992,478 14.6 8,192,993 13.7
Return on Assets * 5.4 % 9.2 % 6.1 % 6.6 %
Selling, general & administrative expenses: Return on Equity * 10.1 % 20.4 % 11.7 % 17.3 %
Payroll (4,816,222) (6.4) (3,808,293) (6.4) Times Interest Earned 11.9 11.8 12.9 8.4
Professional fees (233,621) (0.3) (191,975) (0.3)
Sales & marketing costs (160,119) (0.2) (377,434) (0.6) Leverage Ratios
Technology costs (158,829) (0.2) (104,259) (0.2)
Administrative bonuses (409,326) (0.5) (138,132) (0.2) Debt to Equity 0.9 1.0 0.9 1.2
Other (3,641,152) (4.8) (2,218,116) (3.7) Revenue to Equity 4.6 6.8 5.0 6.6
Total SG&A expenses (9,419,269) (12.5) (6,838,209) (11.5) Asset Turnover 2.4 3.0 2.6 2.9
Fixed Asset Ratio 21.1 % 21.7 % 23.5 % 38.9 %
Income from operations 1,573,209 2.1 1,354,784 2.3 Equity to SG&A Expense 1.7 1.1 1.7 1.1
Underbillings to Equity 15.5 % 13.7 % 15.8 % 13.9 %
Interest income 24,846 0.0 45,985 0.1 Backlog to Equity 2.6 1.8 3.0 2.3
Interest expense (152,056) (0.2) (116,563) (0.2)
Other income / (expense), net 218,069 0.3 101,854 0.2
Efficiency Ratios
Ne t ea rnings / ( loss) before i ncome taxes 1,664 ,069 2 .2 1 ,386,060 2 .3
Backlog to Working Capital 3.3 2.4 8.0 3.1
Income tax (expense) / benefit (272,843) (0.4) (99,917) (0.2) Months in Backlog 5.1 4.2 5.1 4.2
Days in Accounts Receivable 68.1 62.6 64.6 61.6
Net earnings $ 1,391,226 1.8 % $ 1,286,143 2.2 % Days in Inventory 2.5 2.6 2.4 2.2
Days in Accounts Payable 22.3 22.8 24.1 20.5
Operating Cycle 54.9 55.8 49.9 54.2
Number of ParticipantsNumber
2005 332004 36
Note: Not all figures will apear to sum due to rounding.
* In theCFMA's 2005 AnnualFinancial Study,Return on Assets(ROA) andReturn on Equity(ROE)are calculated using
net earnings (loss) before income taxes. Studies conducted in prior years used net earnings (loss) after taxes to
calculate ROA and ROE. All references to ROAs and ROEs from prior studies have been updated to reflect this change.
Specialty Trade Contractors23599 All Other Specialty Trade Contractors
Specialty Trade Contractors
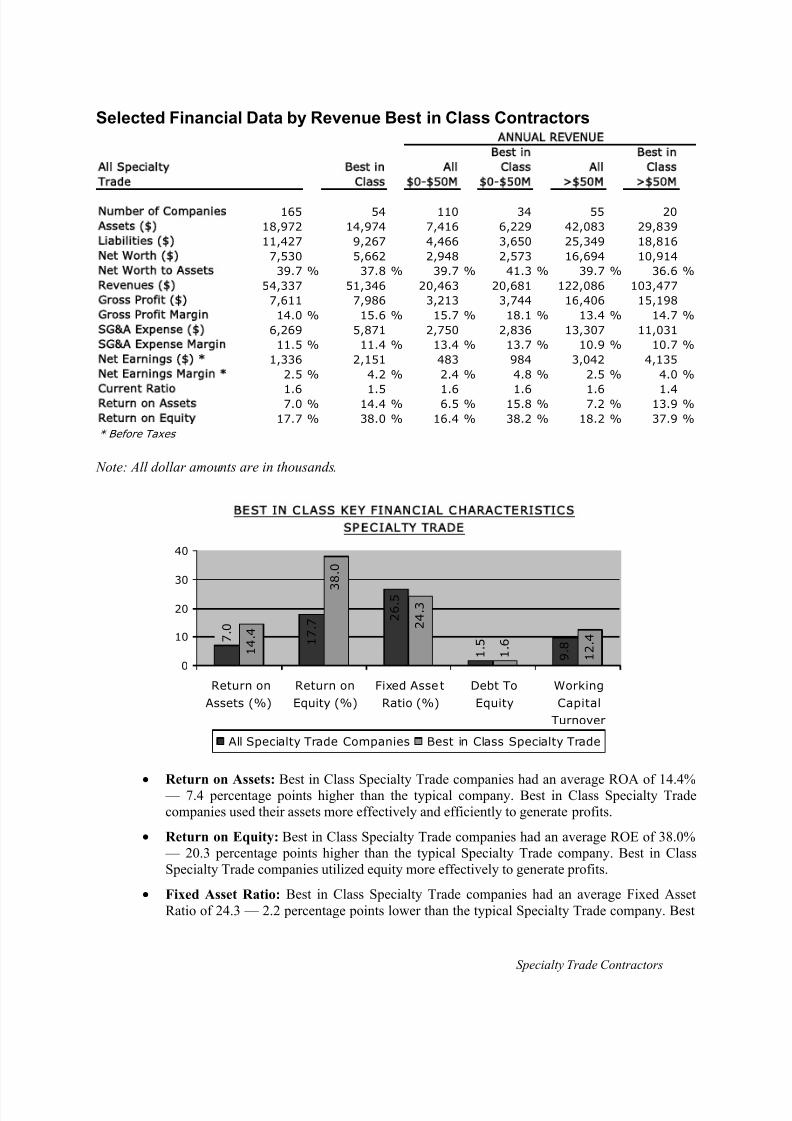
8/13/2019 2005 Financial Survey
http://slidepdf.com/reader/full/2005-financial-survey 233/284
Specialty Trade Contractors
Selected Financial Data by Revenue Best in Class Contractors
Best in Best in
All Specialty Best in All Class All Class
Trade Class 0- 50M 0- 50M > 50M > 50M
Number of Companies 165 54 110 34 55 20
Assets ( ) 18,972 14,974 7,416 6,229 42,083 29,839
Liabilities ( ) 11,427 9,267 4,466 3,650 25,349 18,816
Net Worth ( ) 7,530 5,662 2,948 2,573 16,694 10,914
Net Worth to Assets 39.7 % 37.8 % 39.7 % 41.3 % 39.7 % 36.6 %
Revenues ( ) 54,337 51,346 20,463 20,681 122,086 103,477
Gross Profit ( ) 7,611 7,986 3,213 3,744 16,406 15,198
Gross Profit Margin 14.0 % 15.6 % 15.7 % 18.1 % 13.4 % 14.7 %
SG&A Expense ( ) 6,269 5,871 2,750 2,836 13,307 11,031
SG&A Expense Margin 11.5 % 11.4 % 13.4 % 13.7 % 10.9 % 10.7 %
Net Earnings ( ) * 1,336 2,151 483 984 3,042 4,135
Net Earnings Margin * 2.5 % 4.2 % 2.4 % 4.8 % 2.5 % 4.0 %
Current Ratio 1.6 1.5 1.6 1.6 1.6 1.4Return on Assets 7.0 % 14.4 % 6.5 % 15.8 % 7.2 % 13.9 %
Return on Equity 17.7 % 38.0 % 16.4 % 38.2 % 18.2 % 37.9 %
* Before Taxes
ANNUAL REVENUE
Note: All dollar amounts are in thousands.
B E S T I N C L A S S K E Y F I N A N C I A L C H A R A C T E R I S T IC S
SPEC I ALTY TR ADE
1 . 6 1
7 . 7 2
6 . 5
9 . 8
7 . 0
1 . 5
1 2
. 4 2 4
. 3 3
8 . 0
1 4
. 4
0
10
20
30
40
Return on
Assets (%)
Return on
Equity (%)
Fixed Asset
Ratio (%)
Debt To
Equity
Working
Capital
Turnover
All Specialty Trade Companies Best in Class Specialty Trade
•
Return on Assets: Best in Class Specialty Trade companies had an average ROA of 14.4% — 7.4 percentage points higher than the typical company. Best in Class Specialty Tradecompanies used their assets more effectively and efficiently to generate profits.
• Return on Equity: Best in Class Specialty Trade companies had an average ROE of 38.0% — 20.3 percentage points higher than the typical Specialty Trade company. Best in ClassSpecialty Trade companies utilized equity more effectively to generate profits.
• Fixed Asset Ratio: Best in Class Specialty Trade companies had an average Fixed AssetRatio of 24.3 — 2.2 percentage points lower than the typical Specialty Trade company. Best

8/13/2019 2005 Financial Survey
http://slidepdf.com/reader/full/2005-financial-survey 234/284
Specialty Trade Contractors242
in Class Specialty Trade companies use using less equity to finance the purchase of fixedassets than the typical Specialty Trade company and have superior liquidity.
• Debt to Equity: Best in Class Specialty Trade companies had an average Debt to Equity ratioof 1.6 — 0.1 higher than the typical Specialty Trade company.
• Working Capital Turnover: Best in Class Specialty Trade companies turned over their
working capital an average of 12.4 times — 2.6 times more than the typical Specialty Tradecompany. This indicates that for every dollar of working capital, the Best in Class SpecialtyTrade companies generate $2.60 more in sales, which indicates either a more strategic pursuitof projects and/or better sales and marketing.
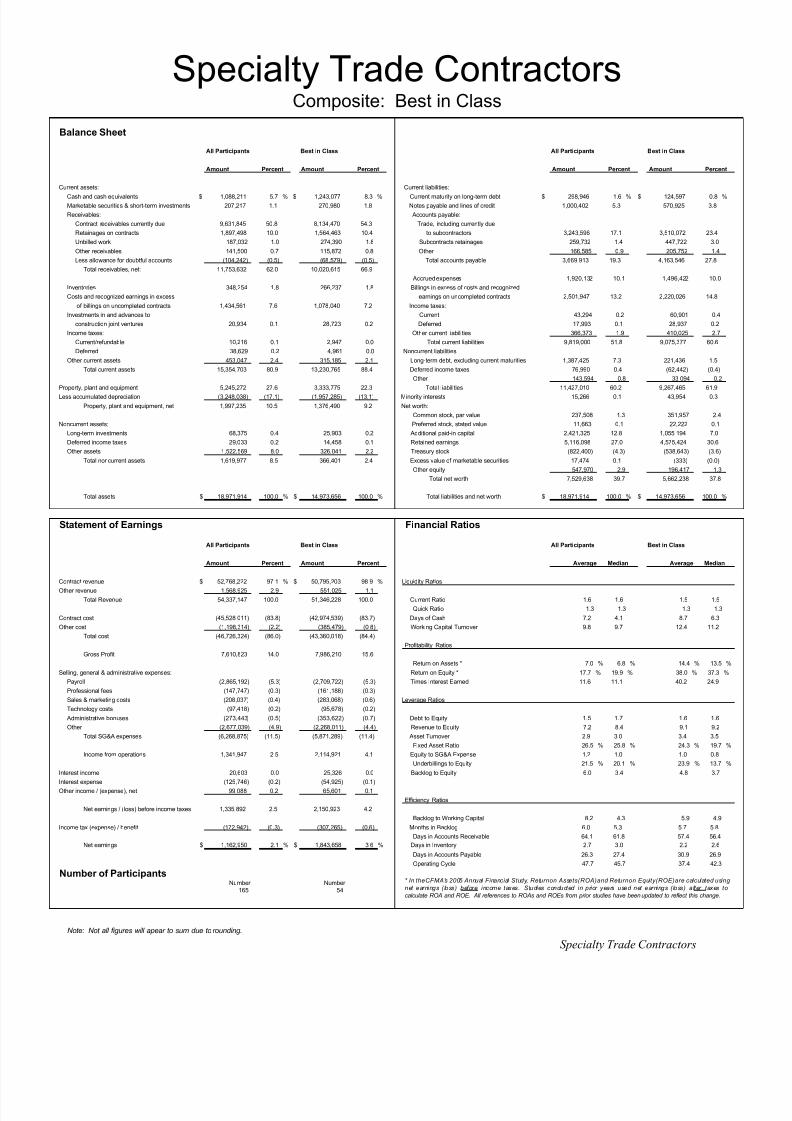
8/13/2019 2005 Financial Survey
http://slidepdf.com/reader/full/2005-financial-survey 235/284
Balance Sheet
All Participants Best in Class All Participants Best in Class
Amount Percent Amount Percent Amount Percent Amount Percent
Current assets: Current liabilities:
Cash and cash equivalents $ 1,088,211 5.7 % $ 1,243,077 8.3 % Current maturity on long-term debt $ 298,946 1.6 % $ 124,597 0.8 %Marketable securities & short-term investments 207,217 1.1 270,980 1.8 Notes payable and lines of credit 1,000,402 5.3 570,925 3.8
Receivables: Accounts payable:
Contract receivables currently due 9,631,845 50.8 8,134,470 54.3 Trade, including currently due
Retainages on contracts 1,897,498 10.0 1,564,463 10.4 to subcontractors 3,243,596 17.1 3,510,072 23.4
Unbilled work 187,032 1.0 274,390 1.8 Subcontracts retainages 259,732 1.4 447,722 3.0
Other receivables 141,500 0.7 115,872 0.8 Other 166,585 0.9 205,752 1.4
Less allowance for doubtful accounts (104,242) (0.5) (68,579) (0.5) Total accounts payable 3,669,913 19.3 4,163,546 27.8
Total receivables, net: 11,753,632 62.0 10,020,615 66.9
Accrued expenses 1,920,132 10.1 1,496,422 10.0
Inventories 348,254 1.8 266,237 1.8 Billings in excess of costs and recognized
Costs and recognized earnings in excess earnings on uncompleted contracts 2,501,947 13.2 2,220,026 14.8
of billings on uncompleted contracts 1,434,561 7.6 1,078,040 7.2 Income taxes:
Investments in and advances to Current 43,294 0.2 60,901 0.4
construction joint ventures 20,934 0.1 28,723 0.2 Deferred 17,993 0.1 28,937 0.2
Income taxes: Other current liabilities 366,373 1.9 410,025 2.7
Current/refundable 10,216 0.1 2,947 0.0 Total current liabilities 9,819,000 51.8 9,075,377 60.6
Deferred 38,629 0.2 4,961 0.0 Noncurrent liabilities
Other current assets 453,047 2.4 315,185 2.1 Long-term debt, excluding current maturities 1,387,425 7.3 221,436 1.5
Total current assets 15,354,703 80.9 13,230,765 88.4 Deferred income taxes 76,990 0.4 (62,442) (0.4)
Other 143,594 0.8 33,094 0.2
Property, plant and equipment 5,245,272 27.6 3,333,775 22.3 Total liabilities 11,427,010 60.2 9,267,465 61.9
Less accumulated depreciation (3,248,038) (17.1) (1,957,285) (13.1) Minority interests 15,266 0.1 43,954 0.3
Property, plant and equipment, net 1,997,235 10.5 1,376,490 9.2 Net worth:
Common stock, par value 237,508 1.3 351,957 2.4
Noncurrent assets: Preferred stock, stated value 11,663 0.1 22,222 0.1
Long-term investments 68,375 0.4 25,903 0.2 Additional paid-in capital 2,421,325 12.8 1,055,194 7.0
Deferred income taxes 29,033 0.2 14,458 0.1 Retained earnings 5,116,098 27.0 4,575,424 30.6
Other assets 1,522,569 8.0 326,041 2.2 Treasury stock (822,400) (4.3) (538,643) (3.6)
Total noncurrent assets 1,619,977 8.5 366,401 2.4 Excess value of marketable securities 17,474 0.1 (333) (0.0)
Other equity 547,970 2.9 196,417 1.3
Total net worth 7,529,638 39.7 5,662,238 37.8
Total assets $ 18,971,914 100.0 % $ 14,973,656 100.0 % Total liabilities and net worth $ 18,971,914 100.0 % $ 14,973,656 100.0 %
Statement of Earnings Financial Ratios
All Participants Best in Class All Participants Best in Class
Amount Percent Amount Percent Average Median Average Median
Contract revenue $ 52,768,222 97.1 % $ 50,795,203 98.9 % Liquidity Ratios
Other revenue 1,568,925 2.9 551,025 1.1
Total Revenue 54,337,147 100.0 51,346,228 100.0 Current Ratio 1.6 1.6 1.5 1.5
Quick Ratio 1.3 1.3 1.3 1.3
Contract cost (45,528,011) (83.8) (42,974,539) (83.7) Days of Cash 7.2 4.1 8.7 6.3
Other cost (1,198,314) (2.2) (385,479) (0.8) Working Capital Turnover 9.8 9.7 12.4 11.2
Total cost (46,726,324) (86.0) (43,360,018) (84.4)
Profitability Ratios
Gross Profit 7,610,823 14.0 7,986,210 15.6
Return on Assets * 7.0 % 6.8 % 14.4 % 13.5 %
Selling, general & administrative expenses: Return on Equity * 17.7 % 19.9 % 38.0 % 37.3 %
Payroll (2,865,192) (5.3) (2,709,722) (5.3) Times Interest Earned 11.6 11.1 40.2 24.9
Professional fees (147,747) (0.3) (161,188) (0.3)
Sales & marketing costs (208,037) (0.4) (283,068) (0.6) Leverage Ratios
Technology costs (97,418) (0.2) (95,678) (0.2)
Administrative bonuses (273,443) (0.5) (353,622) (0.7) Debt to Equity 1.5 1.7 1.6 1.6
Other (2,677,039) (4.9) (2,268,011) (4.4) Revenue to Equity 7.2 8.4 9.1 9.2
Total SG&A expenses (6,268,875) (11.5) (5,871,289) (11.4) Asset Turnover 2.9 3.0 3.4 3.5
Fixed Asset Ratio 26.5 % 25.8 % 24.3 % 19.7 %
Income from operations 1,341,947 2.5 2,114,921 4.1 Equity to SG&A Expense 1.2 1.0 1.0 0.8
Underbillings to Equity 21.5 % 20.1 % 23.9 % 13.7 %
Interest income 20,603 0.0 25,326 0.0 Backlog to Equity 6.0 3.4 4.8 3.7
Interest expense (125,746) (0.2) (54,925) (0.1)
Other income / (expense), net 99,088 0.2 65,601 0.1
Efficiency Ratios
Net earnings / (loss) before income taxes 1,335,892 2.5 2,150,923 4.2
Backlog to Working Capital 8.2 4.3 5.9 4.9
Income tax (expense) / benefit (172,942) (0.3) (307,265) (0.6) Months in Backlog 6.0 5.3 5.7 5.8
Days in Accounts Receivable 64.1 61.8 57.4 56.4
Net earnings $ 1,162,950 2.1 % $ 1,843,658 3.6 % Days in Inventory 2.7 3.0 2.2 2.6
Days in Accounts Payable 26.3 27.4 30.9 26.9
Operating Cycle 47.7 45.7 37.4 42.3
Number of ParticipantsNumber Number
165 54
Note: Not all figures will apear to sum due to rounding.
Specialty Trade ContractorsComposite: Best in Class
* In theCFMA's 2005 Annual Financial Study, Returnon Assets(ROA)and Returnon Equity(ROE)are calculated using
net earnings (loss) before income taxes. Studies conducted in prior years used net earnings (loss) after taxes to
calculate ROA and ROE. All references to ROAs and ROEs from prior studies have been updated to reflect this change.
Specialty Trade Contractors

8/13/2019 2005 Financial Survey
http://slidepdf.com/reader/full/2005-financial-survey 236/284
Balance Sheet
All Participants Best in Class All Participants Best in Class
Amount Percent Amount Percent Amount Percent Amount Percent
Current assets: Current liabilities:
Cash and cash equivalents $ 563,690 7.6 % $ 778,604 12.5 % Current maturity on long-term debt $ 128,050 1.7 % $ 114,198 1.8 %
Marketable securities & short-term investments 94,734 1.3 37,792 0.6 Notes payable and lines of credit 681,830 9.2 310,854 5.0
Receivables: Accounts payable:
Contract receivables currently due 3,634,661 49.0 3,210,621 51.5 Trade, including currently due
Retainages on contracts 729,239 9.8 666,832 10.7 to subcontractors 1,406,297 19.0 1,151,462 18.5
Unbilled work 72,304 1.0 49,821 0.8 Subcontracts retainages 98,830 1.3 80,861 1.3
Other receivables 102,394 1.4 47,786 0.8 Other 108,142 1.5 115,137 1.8
Less allowance for doubtful accounts (36,681) (0.5) (28,509) (0.5) Total accounts payable 1,613,269 21.8 1,347,460 21.6
Total receivables, net: 4,501,916 60.7 3,946,552 63.4
Accrued expenses 541,718 7.3 553,106 8.9
Inventories 209,143 2.8 188,795 3.0 Billings in excess of costs and recognized
Costs and recognized earnings in excess earnings on uncompleted contracts 778,165 10.5 865,945 13.9
of billings on uncompleted contracts 582,826 7.9 403,405 6.5 Income taxes:
Investments in and advances to Current 16,213 0.2 35,135 0.6
construction joint ventures 0 0.0 0 0.0 Deferred 24,972 0.3 39,705 0.6
Income taxes: Other current liabilities 103,648 1.4 161,202 2.6
Current/refundable 10,674 0.1 2,579 0.0 Total current liabilities 3,887,866 52.4 3,427,605 55.0
Deferred 11,652 0.2 4,092 0.1 Noncurrent liabilities
Other current assets 171,678 2.3 137,552 2.2 Long-term debt, excluding current maturities 507,854 6.8 193,554 3.1
Total current assets 6,146,315 82.9 5,499,370 88.3 Deferred income taxes 28,482 0.4 7,458 0.1
Other 41,784 0.6 21,796 0.3
Property, plant and equipment 2,415,081 32.6 1,333,853 21.4 Total liabilities 4,465,987 60.2 3,650,414 58.6
Less accumulated depreciation (1,516,636) (20.5) (795,549) (12.8) Minority interests 2,684 0.0 6,067 0.1
Property, plant and equipment, net 898,445 12.1 538,304 8.6 Net worth:
Common stock, par value 150,134 2.0 212,244 3.4
Noncurrent assets: Preferred stock, stated value 6,585 0.1 0 0.0
Long-term investments 57,928 0.8 9,917 0.2 Additional paid-in capital 252,886 3.4 483,716 7.8
Deferred income taxes 21,882 0.3 13,600 0.2 Retained earnings 2,404,145 32.4 1,985,767 31.9
Other assets 291,720 3.9 168,160 2.7 Treasury stock (104,519) (1.4) (132,462) (2.1)
Total noncurrent assets 371,530 5.0 191,676 3.1 Excess value of marketable securities 26,211 0.4 (529) (0.0)
Other equity 212,177 2.9 24,132 0.4
Total net worth 2,947,619 39.7 2,572,869 41.3
Total assets $ 7,416,290 100.0 % $ 6,229,350 100.0 % Total liabilities and net worth $ 7,416,290 100.0 % $ 6,229,350 100.0 %
Statement of Earnings Financial Ratios
All Participants Best in Class All Participants Best in Class
Amount Percent Amount Percent Average Median Average Median
Contract revenue $ 19,964,499 97.6 % $ 20,288,127 98.1 % Liquidity Ratios
Other revenue 498,359 2.4 393,139 1.9
Total Revenue 20,462,858 100.0 20,681,265 100.0 Current Ratio 1.6 1.6 1.6 1.6
Quick Ratio 1.3 1.3 1.4 1.4
Contract cost (16,881,060) (82.5) (16,646,739) (80.5) Days of Cash 9.9 4.0 13.6 9.5
Other cost (368,678) (1.8) (290,709) (1.4) Working Capital Turnover 9.1 9.4 10.0 10.7
Total cost (17,249,738) (84.3) (16,937,447) (81.9)
Profitability Ratios
Gross Profit 3,213,120 15.7 3,743,818 18.1
Return on Assets * 6.5 % 6.0 % 15.8 % 14.8 %
Selling, general & administrative expenses: Return on Equity * 16.4 % 18.0 % 38.2 % 37.5 %
Payroll (1,449,902) (7.1) (1,441,739) (7.0) Times Interest Earned 8.3 11.2 28.0 19.8
Professional fees (71,893) (0.4) (81,489) (0.4)
Sales & marketing costs (84,080) (0.4) (58,522) (0.3) Leverage Ratios
Technology costs (33,271) (0.2) (34,047) (0.2)
Administrative bonuses (124,993) (0.6) (157,934) (0.8) Debt to Equity 1.5 1.6 1.4 1.5
Other (985,860) (4.8) (1,062,339) (5.1) Revenue to Equity 6.9 8.2 8.0 8.8
Total SG&A expenses (2,749,999) (13.4) (2,836,071) (13.7) Asset Turnover 2.8 2.9 3.3 3.5
Fixed Asset Ratio 30.5 % 27.2 % 20.9 % 20.5 %
Income from operations 463,121 2.3 907,747 4.4 Equity to SG&A Expense 1.1 1.0 0.9 0.8
Underbillings to Equity 22.2 % 17.9 % 17.6 % 11.2 %
Interest income 12,660 0.1 9,716 0.0 Backlog to Equity 6.4 2.9 4.1 2.8
Interest expense (65,853) (0.3) (36,420) (0.2)Other income / (expense), net 72,917 0.4 102,849 0.5
Efficiency Ratios
Net earnings / (loss) before income taxes 482,844 2.4 983,893 4.8
Backlog to Working Capital 9.2 3.8 4.8 3.8
Income tax (expense) / benefit (46,620) (0.2) (65,739) (0.3) Months in Backlog 5.8 5.1 5.1 4.0
Days in Accounts Receivable 65.1 61.1 56.2 53.2
Net earnings $ 436,224 2.1 % $ 918,154 4.4 % Days in Inventory 4.4 3.3 4.0 3.1
Days in Accounts Payable 31.6 27.5 26.9 23.8
Operating Cycle 47.8 45.7 46.9 44.8
Number of ParticipantsNumber Number
110 34
Note: Not all figures will apear to sum due to rounding.
* In theCFMA's 2005 Annual Financial Study, Returnon Assets(ROA)and Returnon Equity(ROE)are calculated using
net earnings (loss) before income taxes. Studies conducted in prior years used net earnings (loss) after taxes to
calculate ROA and ROE. All references to ROAs and ROEs from prior studies have been updated to reflect this change.
Less Than $50 Million Revenue: Best in Class
Specialty Trade Contractors
Specialty Trade Contractors
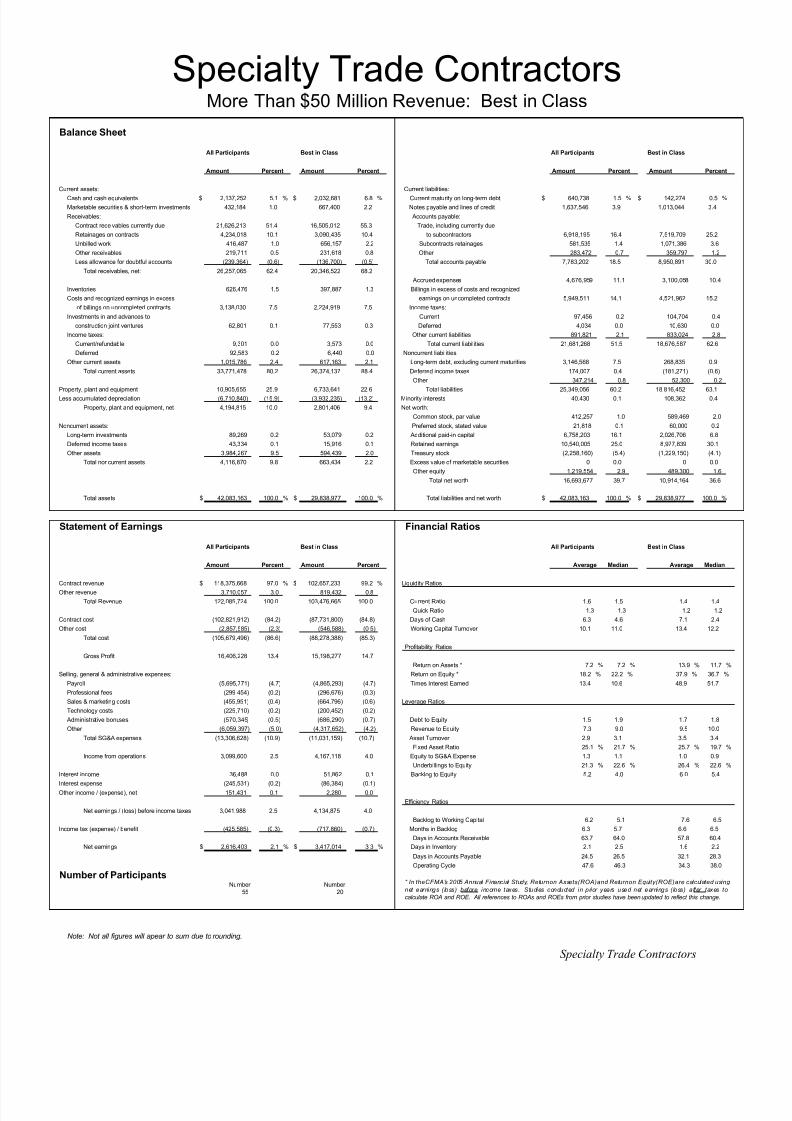
8/13/2019 2005 Financial Survey
http://slidepdf.com/reader/full/2005-financial-survey 237/284
Balance Sheet
All Participants Best in Class All Participants Best in Class
Amount Percent Amount Percent Amount Percent Amount Percent
Current assets: Current liabilities:
Cash and cash equivalents $ 2,137,252 5.1 % $ 2,032,681 6.8 % Current maturity on long-term debt $ 640,738 1.5 % $ 142,274 0.5 %
Marketable securities & short-term investments 432,184 1.0 667,400 2.2 Notes payable and lines of credit 1,637,546 3.9 1,013,044 3.4
Receivables: Accounts payable:
Contract receivables currently due 21,626,213 51.4 16,505,012 55.3 Trade, including currently due
Retainages on contracts 4,234,018 10.1 3,090,435 10.4 to subcontractors 6,918,195 16.4 7,519,709 25.2
Unbilled work 416,487 1.0 656,157 2.2 Subcontracts retainages 581,535 1.4 1,071,386 3.6
Other receivables 219,711 0.5 231,618 0.8 Other 283,472 0.7 359,797 1.2
Less allowance for doubtful accounts (239,364) (0.6) (136,700) (0.5) Total accounts payable 7,783,202 18.5 8,950,891 30.0
Total receivables, net: 26,257,065 62.4 20,346,522 68.2
Accrued expenses 4,676,959 11.1 3,100,058 10.4
Inventories 626,476 1.5 397,887 1.3 Billings in excess of costs and recognized
Costs and recognized earnings in excess earnings on uncompleted contracts 5,949,511 14.1 4,521,962 15.2
of billings on uncompleted contracts 3,138,030 7.5 2,224,919 7.5 Income taxes:
Investments in and advances to Current 97,456 0.2 104,704 0.4
construction joint ventures 62,801 0.1 77,553 0.3 Deferred 4,034 0.0 10,630 0.0
Income taxes: Other current liabilities 891,821 2.1 833,024 2.8
Current/refundable 9,301 0.0 3,573 0.0 Total current liabilities 21,681,268 51.5 18,676,587 62.6
Deferred 92,583 0.2 6,440 0.0 Noncurrent liabilities
Other current assets 1,015,786 2.4 617,163 2.1 Long-term debt, excluding current maturities 3,146,568 7.5 268,835 0.9
Total current assets 33,771,478 80.2 26,374,137 88.4 Deferred income taxes 174,007 0.4 (181,271) (0.6)
Other 347,214 0.8 52,300 0.2
Property, plant and equipment 10,905,655 25.9 6,733,641 22.6 Total liabilities 25,349,056 60.2 18,816,452 63.1
Less accumulated depreciation (6,710,840) (15.9) (3,932,235) (13.2) Minority interests 40,430 0.1 108,362 0.4
Property, plant and equipment, net 4,194,815 10.0 2,801,406 9.4 Net worth:
Common stock, par value 412,257 1.0 589,469 2.0
Noncurrent assets: Preferred stock, stated value 21,818 0.1 60,000 0.2
Long-term investments 89,269 0.2 53,079 0.2 Additional paid-in capital 6,758,203 16.1 2,026,706 6.8
Deferred income taxes 43,334 0.1 15,916 0.1 Retained earnings 10,540,005 25.0 8,977,839 30.1
Other assets 3,984,267 9.5 594,439 2.0 Treasury stock (2,258,160) (5.4) (1,229,150) (4.1)
Total noncurrent assets 4,116,870 9.8 663,434 2.2 Excess value of marketable securities 0 0.0 0 0.0
Other equity 1,219,554 2.9 489,300 1.6
Total net worth 16,693,677 39.7 10,914,164 36.6
Total assets $ 42,083,163 100.0 % $ 29,838,977 100.0 % Total liabilities and net worth $ 42,083,163 100.0 % $ 29,838,977 100.0 %
Statement of Earnings Financial Ratios
All Participants Best in Class All Participants Best in Class
Amount Percent Amount Percent Average Median Average Median
Contract revenue $ 118,375,668 97.0 % $ 102,657,233 99.2 % Liquidity Ratios
Other revenue 3,710,057 3.0 819,432 0.8
Total Revenue 122,085,724 100.0 103,476,665 100.0 Current Ratio 1.6 1.5 1.4 1.4
Quick Ratio 1.3 1.3 1.2 1.2
Contract cost (102,821,912) (84.2) (87,731,800) (84.8) Days of Cash 6.3 4.6 7.1 2.4
Other cost (2,857,585) (2.3) (546,588) (0.5) Working Capital Turnover 10.1 11.0 13.4 12.2
Total cost (105,679,496) (86.6) (88,278,388) (85.3)
Profitability Ratios
Gross Profit 16,406,228 13.4 15,198,277 14.7
Return on Assets * 7.2 % 7.2 % 13.9 % 11.7 %
Selling, general & administrative expenses: Return on Equity * 18.2 % 22.2 % 37.9 % 36.7 %
Payroll (5,695,771) (4.7) (4,865,293) (4.7) Times Interest Earned 13.4 10.6 48.9 51.7
Professional fees (299,454) (0.2) (296,676) (0.3)
Sales & marketing costs (455,951) (0.4) (664,796) (0.6) Leverage Ratios
Technology costs (225,710) (0.2) (200,452) (0.2)
Administrative bonuses (570,345) (0.5) (686,290) (0.7) Debt to Equity 1.5 1.9 1.7 1.8
Other (6,059,397) (5.0) (4,317,652) (4.2) Revenue to Equity 7.3 9.0 9.5 10.0
Total SG&A expenses (13,306,628) (10.9) (11,031,159) (10.7) Asset Turnover 2.9 3.1 3.5 3.4
Fixed Asset Ratio 25.1 % 21.7 % 25.7 % 19.7 %
Income from operations 3,099,600 2.5 4,167,118 4.0 Equity to SG&A Expense 1.3 1.1 1.0 0.9
Underbillings to Equity 21.3 % 22.6 % 26.4 % 22.6 %
Interest income 36,488 0.0 51,862 0.1 Backlog to Equity 5.2 4.0 6.0 5.4
Interest expense (245,531) (0.2) (86,384) (0.1)Other income / (expense), net 151,431 0.1 2,280 0.0
Efficiency Ratios
Net earnings / (loss) before income taxes 3,041,988 2.5 4,134,875 4.0
Backlog to Working Capital 6.2 5.1 7.6 6.5
Income tax (expense) / benefit (425,585) (0.3) (717,860) (0.7) Months in Backlog 6.3 5.7 6.6 6.5
Days in Accounts Receivable 63.7 64.0 57.8 60.4
Net earnings $ 2,616,403 2.1 % $ 3,417,014 3.3 % Days in Inventory 2.1 2.5 1.6 2.2
Days in Accounts Payable 24.5 26.5 32.1 28.3
Operating Cycle 47.6 46.3 34.3 38.0
Number of ParticipantsNumber Number
55 20
Note: Not all figures will apear to sum due to rounding.
* In theCFMA's 2005 Annual Financial Study, Returnon Assets(ROA)and Returnon Equity(ROE)are calculated using
net earnings (loss) before income taxes. Studies conducted in prior years used net earnings (loss) after taxes to
calculate ROA and ROE. All references to ROAs and ROEs from prior studies have been updated to reflect this change.
Specialty Trade ContractorsMore Than $50 Million Revenue: Best in Class
Specialty Trade Contractors
8/13/2019 2005 Financial Survey
http://slidepdf.com/reader/full/2005-financial-survey 238/284

8/13/2019 2005 Financial Survey
http://slidepdf.com/reader/full/2005-financial-survey 239/284
Additional Composite Financial Data
Selected Financial Data for S corporations
All Companies S Corp
Number of Companies 532 341
Assets ( ) 33,053 31,599
Liabilities ( ) 22,937 22,337Net Worth ( ) 10,071 9,225
Net Worth to Assets 30.5 % 29.2 %
Revenues ( ) 95,959 93,853
Gross Profit ( ) 7,444 7,495
Gross Profit Margin 7.8 % 8.0 %
SG&A Expense ( ) 5,844 5,762
SG&A Expense Margin 6.1 % 6.1 %
Net Earnings ( ) * 1,703 1,806
Net Earnings Margin * 1.8 % 1.9 %
Current Ratio 1.3 1.3
Return on Assets 5.2 % 5.7 %
Return on Equity 16.9 % 19.6 %
* Before Taxes
Note: All dollar amounts are in thousands.
The percentage of companies operating as S corporations for legal purposes increased from 60% in 2004to 64% in 2005, continuing a multi-year trend. S corporations are often a preferred form of organization, because they combine the benefits of limited liability, similar to C corporations, and pass-through taxstatus (i.e., income is passed directly to owners and not taxed at the corporate level).
In prior years, S corporations were smaller than the participant body as a whole, both in terms of assetsand revenue. However, in 2005 the average S corporation is only slightly smaller than the average
participant. In terms of profitability, S corporations tend to be superior to that of the industry average.
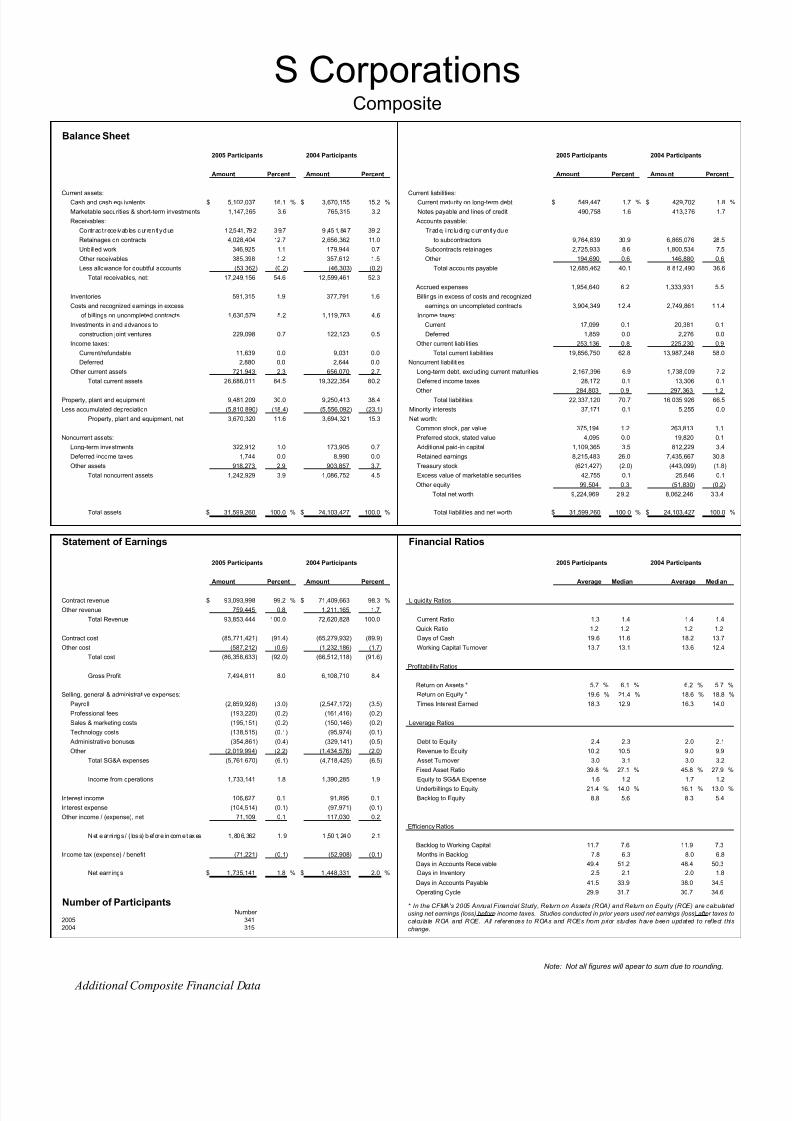
8/13/2019 2005 Financial Survey
http://slidepdf.com/reader/full/2005-financial-survey 240/284
Balance Sheet
2005 Participants 2004 Participants 2005 Participants 2004 Participants
Amount Percent Amount Percent Amount Percent Amount Percent
Current assets: Current liabilities:Cash and cash equivalents $ 5,102,037 16.1 % $ 3,670,155 15.2 % Current maturity on long-term debt $ 549,447 1.7 % $ 429,702 1.8 %
Marketable securities & short-term investments 1,147,365 3.6 765,315 3.2 Notes payable and lines of credit 490,758 1.6 413,376 1.7
Receivables: Accounts payable:
Contrac t r ece ivab les cur ren tl y due 12,541,792 39.7 9 ,451,847 39 .2 Trade, i nc luding curren tl y due
Retainages on contracts 4,028,404 12.7 2,656,362 11.0 to subcontractors 9,764,839 30.9 6,865,076 28.5
Unbilled work 346,925 1.1 179,944 0.7 Subcontracts retainages 2,725,933 8.6 1,800,534 7.5
Other receivables 385,398 1.2 357,612 1.5 Other 194,690 0.6 146,880 0.6
Less allowance for doubtful accounts (53,362) (0.2) (46,303) (0.2) Total accounts payable 12,685,462 40.1 8,812,490 36.6
Total receivables, net: 17,249,156 54.6 12,599,461 52.3
Accrued expenses 1,954,640 6.2 1,333,931 5.5
Inventories 591,315 1.9 377,791 1.6 Billings in excess of costs and recognized
Costs and recognized earnings in excess earnings on uncompleted contracts 3,904,349 12.4 2,749,861 11.4
of billings on uncompleted contracts 1,630,579 5.2 1,119,763 4.6 Income taxes:
Investments in and advances to Current 17,099 0.1 20,381 0.1
construction joint ventures 229,098 0.7 122,123 0.5 Deferred 1,859 0.0 2,276 0.0
Income taxes: Other current liabilities 253,136 0.8 225,230 0.9
Current/refundable 11,639 0.0 9,031 0.0 Total current liabilities 19,856,750 62.8 13,987,248 58.0
Deferred 2,880 0.0 2,644 0.0 Noncurrent liabilities
Other current assets 721,943 2.3 656,070 2.7 Long-term debt, excluding current maturities 2,167,396 6.9 1,738,009 7.2
Total current assets 26,686,011 84.5 19,322,354 80.2 Deferred income taxes 28,172 0.1 13,306 0.1
Other 284,803 0.9 297,363 1.2Property, plant and equipment 9,481,209 30.0 9,250,413 38.4 Total liabilities 22,337,120 70.7 16,035,926 66.5
Less accumulated depreciation (5,810,890) (18.4) (5,556,092) (23.1) Minority interests 37,171 0.1 5,255 0.0
Property, plant and equipment, net 3,670,320 11.6 3,694,321 15.3 Net worth:
Common stock, par value 375,194 1.2 263,813 1.1
Noncurrent assets: Preferred stock, stated value 4,095 0.0 19,820 0.1
Long-term investments 322,912 1.0 173,905 0.7 Additional paid-in capital 1,109,365 3.5 812,229 3.4
Deferred income taxes 1,744 0.0 8,990 0.0 Retained earnings 8,215,483 26.0 7,435,667 30.8
Other assets 918,273 2.9 903,857 3.7 Treasury stock (621,427) (2.0) (443,099) (1.8)
Total noncurrent assets 1,242,929 3.9 1,086,752 4.5 Excess value of marketable securities 42,755 0.1 25,646 0.1
Other equity 99,504 0.3 (51,830) (0.2)
Total net worth 9,224,969 29.2 8,062,246 33.4
Total assets $ 31,599,260 100.0 % $ 24,103,427 100.0 % Total liabilities and net worth $ 31,599,260 100.0 % $ 24,103,427 100.0 %
Statement of Earnings Financial Ratios
2005 Participants 2004 Participants 2005 Participants 2004 Participants
Amount Percent Amount Percent Average Median Average Median
Contract revenue $ 93,093,998 99.2 % $ 71,409,663 98.3 % Liquidity Ratios
Other revenue 759,445 0.8 1,211,165 1.7
Total Revenue 93,853,444 100.0 72,620,828 100.0 Current Ratio 1.3 1.4 1.4 1.4
Quick Ratio 1.2 1.2 1.2 1.2
Contract cost (85,771,421) (91.4) (65,279,932) (89.9) Days of Cash 19.6 11.6 18.2 13.7
Other cost (587,212) (0.6) (1,232,186) (1.7) Working Capital Turnover 13.7 13.1 13.6 12.4
Total cost (86,358,633) (92.0) (66,512,118) (91.6)
Profitability Ratios
Gross Profit 7,494,811 8.0 6,108,710 8.4
Return on Assets * 5.7 % 6.1 % 6.2 % 5.7 %
Selling, general & administrative expenses: Return on Equity * 19.6 % 21.4 % 18.6 % 18.8 %
Payroll (2,859,928) (3.0) (2,547,172) (3.5) Times Interest Earned 18.3 12.9 16.3 14.0
Professional fees (193,220) (0.2) (161,416) (0.2)
Sales & marketing costs (195,151) (0.2) (150,146) (0.2) Leverage Ratios
Technology costs (138,515) (0.1) (95,974) (0.1)
Administrative bonuses (354,861) (0.4) (329,141) (0.5) Debt to Equity 2.4 2.3 2.0 2.1
Other (2,019,994) (2.2) (1,434,576) (2.0) Revenue to Equity 10.2 10.5 9.0 9.9
Total SG&A expenses (5,761,670) (6.1) (4,718,425) (6.5) Asset Turnover 3.0 3.1 3.0 3.2
Fixed Asset Ratio 39.8 % 27.1 % 45.8 % 27.9 %
Income from operations 1,733,141 1.8 1,390,285 1.9 Equity to SG&A Expense 1.6 1.2 1.7 1.2
Underbillings to Equity 21.4 % 14.0 % 16.1 % 13.0 %
Interest income 106,627 0.1 91,895 0.1 Backlog to Equity 8.8 5.6 8.3 5.4
Interest expense (104,514) (0.1) (97,971) (0.1)
Other income / (expense), net 71,109 0.1 117,030 0.2
Efficiency Ratios
Net earnings / ( loss) before income taxes 1,806,362 1.9 1 ,501,240 2 .1
Backlog to Working Capital 11.7 7.6 11.9 7.3
Income tax (expense) / benefit (71,221) (0.1) (52,908) (0.1) Months in Backlog 7.8 6.3 8.0 6.8
Days in Accounts Receivable 49.4 51.2 48.4 50.3
Net earnings $ 1,735,141 1.8 % $ 1,448,331 2.0 % Days in Inventory 2.5 2.1 2.0 1.8
Days in Accounts Payable 41.5 33.9 38.0 34.5
Operating Cycle 29.9 31.7 30.7 34.6
Number of ParticipantsNumber
2005 3412004 315
Note: Not all figures will apear to sum due to rounding.
* In the CFMA's 2005 Annual Financial Study, Return on Assets (ROA) and Return on Equity (ROE) are calculated
using net earnings (loss) before income taxes. Studies conducted in prior years used net earnings (loss) after taxes to
calculate ROA and ROE. All references to ROAs and ROEs from prior studies have been updated to reflect this
change.
S CorporationsComposite
Additional Composite Financial Data
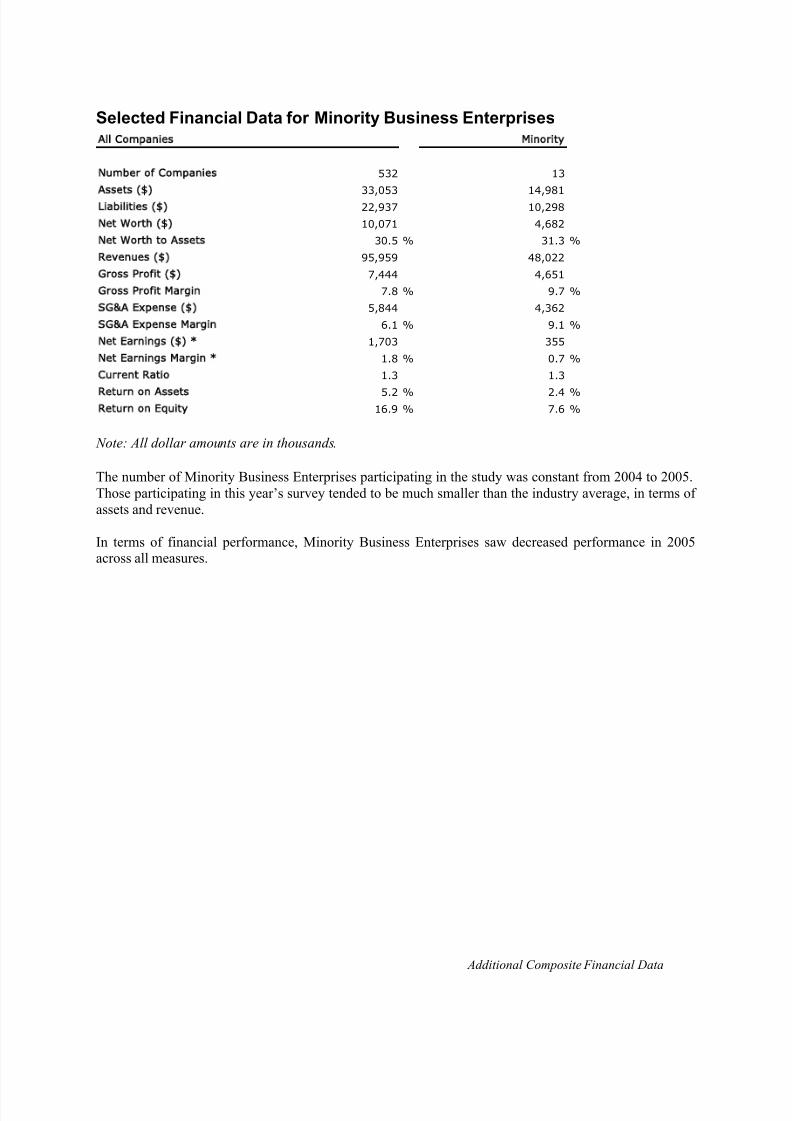
8/13/2019 2005 Financial Survey
http://slidepdf.com/reader/full/2005-financial-survey 241/284
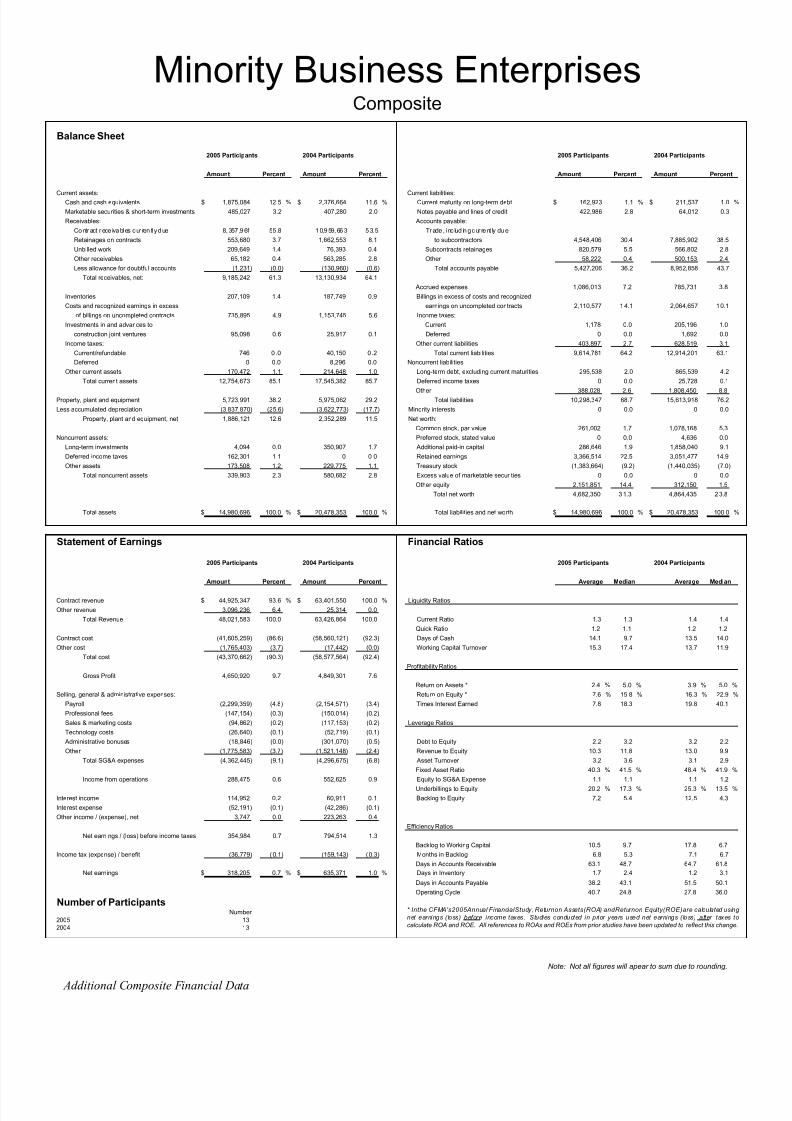
8/13/2019 2005 Financial Survey
http://slidepdf.com/reader/full/2005-financial-survey 242/284
Balance Sheet
2005 Participants 2004 Participants 2005 Participants 2004 Participants
Amount Percent Amount Percent Amount Percent Amount Percent
Current assets: Current liabilities:Cash and cash equivalents $ 1,875,084 12.5 % $ 2,376,664 11.6 % Current maturity on long-term debt $ 162,923 1.1 % $ 211,537 1.0 %
Marketable securities & short-term investments 485,027 3.2 407,280 2.0 Notes payable and lines of credit 422,986 2.8 64,012 0.3
Receivables: Accounts payable:
Contract r ece ivables cur ren tl y due 8,357 ,961 55 .8 10,959,663 53.5 Trade , i nc lud ing cur rent ly due
Retainages on contracts 553,680 3.7 1,662,553 8.1 to subcontractors 4,548,406 30.4 7,885,902 38.5
Unbilled work 209,649 1.4 76,393 0.4 Subcontracts retainages 820,579 5.5 566,802 2.8
Other receivables 65,182 0.4 563,285 2.8 Other 58,222 0.4 500,153 2.4
Less allowance for doubtful accounts (1,231) (0.0) (130,960) (0.6) Total accounts payable 5,427,206 36.2 8,952,858 43.7
Total receivables, net: 9,185,242 61.3 13,130,934 64.1
Accrued expenses 1,086,013 7.2 785,731 3.8
Inventories 207,109 1.4 187,749 0.9 Billings in excess of costs and recognized
Costs and recognized earnings in excess earnings on uncompleted contracts 2,110,577 14.1 2,064,657 10.1
of billings on uncompleted contracts 735,895 4.9 1,153,745 5.6 Income taxes:
Investments in and advances to Current 1,178 0.0 205,196 1.0
construction joint ventures 95,098 0.6 25,917 0.1 Deferred 0 0.0 1,692 0.0
Income taxes: Other current liabilities 403,897 2.7 628,519 3.1
Current/refundable 746 0 .0 40,150 0.2 Total current liabilities 9,614,781 64.2 12,914,201 63.1
Deferred 0 0.0 8,296 0.0 Noncurrent liabilities
Other current assets 170,472 1.1 214,648 1.0 Long-term debt, excluding current maturities 295,538 2.0 865,539 4.2
Total current assets 12,754,673 85.1 17,545,382 85.7 Deferred income taxes 0 0.0 25,728 0.1
Other 388,028 2.6 1,808,450 8.8Property, plant and equipment 5,723,991 38.2 5,975,062 29.2 Total liabilities 10,298,347 68.7 15,613,918 76.2
Less accumulated depreciation (3,837,870) (25.6) (3,622,773) (17.7) Minority interests 0 0.0 0 0.0
Property, plant and equipment, net 1,886,121 12.6 2,352,289 11.5 Net worth:
Common stock, par value 261,002 1.7 1,078,168 5.3
Noncurrent assets: Preferred stock, stated value 0 0.0 4,636 0.0
Long-term investments 4,094 0.0 350,907 1.7 Additional paid-in capital 286,646 1.9 1,858,040 9.1
Deferred income taxes 162,301 1.1 0 0.0 Retained earnings 3,366,514 22.5 3,051,477 14.9
Other assets 173,508 1.2 229,775 1.1 Treasury stock (1,383,664) (9.2) (1,440,035) (7.0)
Total noncurrent assets 339,903 2.3 580,682 2.8 Excess value of marketable securities 0 0.0 0 0.0
Other equity 2,151,851 14.4 312,150 1.5
Total net worth 4,682,350 31.3 4,864,435 23.8
Total assets $ 14,980,696 100.0 % $ 20,478,353 100.0 % Total liabilities and net worth $ 14,980,696 100.0 % $ 20,478,353 100.0 %
Statement of Earnings Financial Ratios
2005 Participants 2004 Participants 2005 Participants 2004 Participants
Amount Percent Amount Percent Average Median Average Median
Contract revenue $ 44,925,347 93.6 % $ 63,401,550 100.0 % Liquidity Ratios
Other revenue 3,096,236 6.4 25,314 0.0
Total Revenue 48,021,583 100.0 63,426,864 100.0 Current Ratio 1.3 1.3 1.4 1.4
Quick Ratio 1.2 1.1 1.2 1.2
Contract cost (41,605,259) (86.6) (58,560,121) (92.3) Days of Cash 14.1 9.7 13.5 14.0
Other cost (1,765,403) (3.7) (17,442) (0.0) Working Capital Turnover 15.3 17.4 13.7 11.9
Total cost (43,370,662) (90.3) (58,577,564) (92.4)
Profitability Ratios
Gross Profit 4,650,920 9.7 4,849,301 7.6
Return on Assets * 2.4 % 5.0 % 3.9 % 5.0 %
Selling, general & administrative expenses: Return on Equity * 7.6 % 15.8 % 16.3 % 22.9 %
Payroll (2,299,359) (4.8) (2,154,571) (3.4) Times Interest Earned 7.8 18.3 19.8 40.1
Professional fees (147,154) (0.3) (150,014) (0.2)
Sales & marketing costs (94,862) (0.2) (117,153) (0.2) Leverage Ratios
Technology costs (26,640) (0.1) (52,719) (0.1)
Administrative bonuses (18,846) (0.0) (301,070) (0.5) Debt to Equity 2.2 3.2 3.2 2.2
Other (1,775,583) (3.7) (1,521,148) (2.4) Revenue to Equity 10.3 11.8 13.0 9.9
Total SG&A expenses (4,362,445) (9.1) (4,296,675) (6.8) Asset Turnover 3.2 3.6 3.1 2.9
Fixed Asset Ratio 40.3 % 41.5 % 48.4 % 41.9 %
Income from operations 288,475 0.6 552,625 0.9 Equity to SG&A Expense 1.1 1.1 1.1 1.2
Underbillings to Equity 20.2 % 17.3 % 25.3 % 13.5 %
Interest income 114,952 0.2 60,911 0.1 Backlog to Equity 7.2 5.4 12.5 4.3
Interest expense (52,191) (0.1) (42,286) (0.1)
Other income / (expense), net 3,747 0.0 223,263 0.4
Efficiency Ratios
Net earnings / (loss) before income taxes 354,984 0.7 794,514 1.3
Backlog to Working Capital 10.5 9.7 17.8 6.7
Income tax (expense) / benefit (36,779) (0.1) (159,143) (0.3) Months in Backlog 6.8 5.3 7.1 6.7
Days in Accounts Receivable 63.1 48.7 64.7 61.8
Net earnings $ 318,205 0.7 % $ 635,371 1.0 % Days in Inventory 1.7 2.4 1.2 3.1
Days in Accounts Payable 38.2 43.1 51.5 50.1
Operating Cycle 40.7 24.8 27.8 36.0
Number of ParticipantsNumber
2005 132004 13
Note: Not all figures will apear to sum due to rounding.
* Inthe CFMA's2005Annual FinancialStudy, Returnon Assets(ROA) andReturnon Equity(ROE)are calculated using
net earnings (loss) before income taxes. Studies conducted in prior years used net earnings (loss) after taxes to
calculate ROA and ROE. All references to ROAs and ROEs from prior studies have been updated to reflect this change.
Minority Business EnterprisesComposite
Additional Composite Financial Data
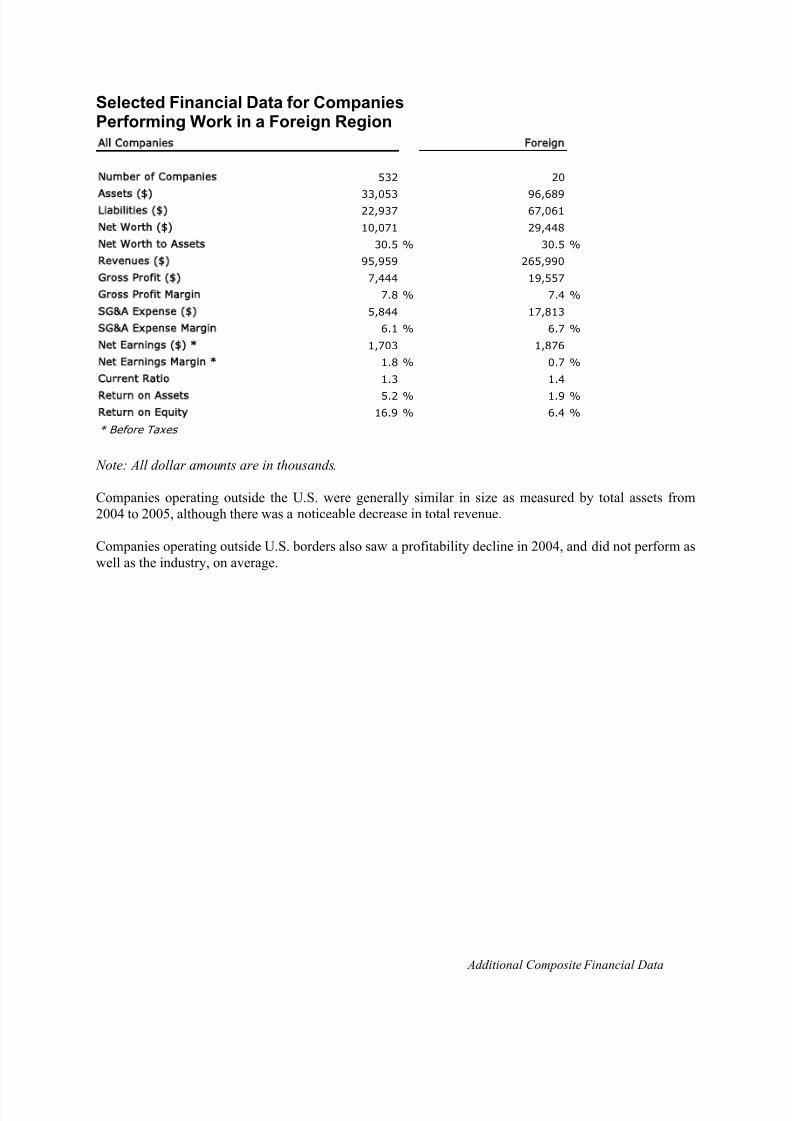
8/13/2019 2005 Financial Survey
http://slidepdf.com/reader/full/2005-financial-survey 243/284
Additional Composite Financial Data
Selected Financial Data for CompaniesPerforming Work in a Foreign Region
All Companies Foreign
Number of Companies 532 20
Assets ( ) 33,053 96,689Liabilities ( ) 22,937 67,061
Net Worth ( ) 10,071 29,448
Net Worth to Assets 30.5 % 30.5 %
Revenues ( ) 95,959 265,990
Gross Profit ( ) 7,444 19,557
Gross Profit Margin 7.8 % 7.4 %
SG&A Expense ( ) 5,844 17,813
SG&A Expense Margin 6.1 % 6.7 %
Net Earnings ( ) * 1,703 1,876
Net Earnings Margin * 1.8 % 0.7 %
Current Ratio 1.3 1.4
Return on Assets 5.2 % 1.9 %
Return on Equity 16.9 % 6.4 %
* Before Taxes
Note: All dollar amounts are in thousands.
Companies operating outside the U.S. were generally similar in size as measured by total assets from2004 to 2005, although there was a noticeable decrease in total revenue.
Companies operating outside U.S. borders also saw a profitability decline in 2004, and did not perform aswell as the industry, on average.

8/13/2019 2005 Financial Survey
http://slidepdf.com/reader/full/2005-financial-survey 244/284
Balance Sheet
2005 Participants 2004 Participants 2005 Participants 2004 Participants
Amount Percent Amount Percent Amount Percent Amount Percent
Current assets: Current liabilities:Cash and cash equivalents $ 9,558,762 9.9 % $ 15,571,265 16.5 % Current maturity on long-term debt $ 1,503,253 1.6 % $ 499,741 0.5 %
Marketable securities & short-term investments 4,197,928 4.3 1,317,660 1.4 Notes payable and lines of credit 3,404,016 3.5 851,377 0.9
Receivables: Accounts payable:
Cont ract r ecei vables cu rren tl y due 32,746,041 33.9 38,258,049 40.5 T rade, i nc luding cu rren tl y due
Retainages on contracts 9,684,536 10.0 10,416,591 11.0 to subcontractors 20,530,857 21.2 21,780,635 23.1
Unbilled work 504,758 0.5 554,468 0.6 Subcontracts retainages 7,035,627 7.3 6,363,655 6.7
Other receivables 1,779,463 1.8 2,289,807 2.4 Other 791,191 0.8 369,211 0.4
Less allowance for doubtful accounts (386,054) (0.4) (106,373) (0.1) Total accounts payable 28,357,675 29.3 28,513,501 30.2
Total receivables, net: 44,328,743 45.8 51,412,543 54.5
Accrued expenses 7,089,699 7.3 9,702,143 10.3
Inventories 1,960,842 2.0 834,216 0.9 Billings in excess of costs and recognized
Costs and recognized earnings in excess earnings on uncompleted contracts 11,046,896 11.4 17,122,002 18.1
of billings on uncompleted contracts 9,343,453 9.7 4,367,011 4.6 Income taxes:
Investments in and advances to Current 127,910 0.1 311,133 0.3
construction joint ventures 949,328 1.0 2,562,555 2.7 Deferred 60,717 0.1 1,311 0.0
Income taxes: Other current liabilities 961,868 1.0 1 ,963,151 2.1
Current/refundable 105,681 0.1 836,886 0.9 Total current liabilities 52,552,034 54.4 58,964,359 62.5
Deferred 464,522 0.5 1,824,420 1.9 Noncurrent liabilities
Other current assets 2,906,252 3.0 2,627,182 2.8 Long-term debt, excluding current maturities 11,655,523 12.1 3,172,114 3.4
Total current assets 73,815,512 76.3 81,353,738 86.2 Deferred income taxes 329,249 0.3 172,832 0.2
Other 2,523,857 2.6 2,566,735 2.7Property, plant and equipment 27,156,387 28.1 17,989,892 19.1 Total liabilities 67,060,661 69.4 64,876,041 68.7
Less accumulated depreciation (16,287,147) (16.8) (10,475,852) (11.1) Minority interests 180,799 0.2 293,536 0.3
Property, plant and equipment, net 10,869,240 11.2 7,514,039 8.0 Net worth:
Common stock, par value 406,174 0.4 754,453 0.8
Noncurrent assets: Preferred stock, stated value 0 0.0 395,929 0.4
Long-term investments 176,400 0.2 1,529,030 1.6 Additional paid-in capital 16,244,113 16.8 3,305,922 3.5
Deferred income taxes 1,601,270 1.7 1,201,571 1.3 Retained earnings 14,553,525 15.1 23,355,354 24.7
Other assets 10,226,645 10.6 2,787,329 3.0 Treasury stock (3,823,947) (4.0) (230,263) (0.2)
Total noncurrent assets 12,004,315 12.4 5,517,930 5.8 Excess value of marketable securities 48,135 0.0 49,701 0.1
Other equity 2,019,606 2.1 1,585,035 1.7
Total net worth 29,447,607 30.5 29,216,131 31.0
Total assets $ 96,689,067 100.0 % $ 94,385,708 100.0 % Total liabilities and net worth $ 96,689,067 100.0 % $ 94,385,708 100.0 %
Statement of Earnings Financial Ratios
2005 Participants 2004 Participants 2005 Participants 2004 Participants
Amount Percent Amount Percent Average Median Average Median
Contract revenue $ 259,374,825 97.5 % $ 294,010,814 94.4 % Liquidity Ratios
Other revenue 6,614,926 2.5 17,409,895 5.6
Total Revenue 265,989,751 100.0 311,420,709 100.0 Current Ratio 1.4 1.4 1.4 1.4
Quick Ratio 1.1 1.2 1.2 1.3
Contract cost (241,135,363) (90.7) (270,141,756) (86.7) Days of Cash 12.9 8.2 18.0 10.7
Other cost (5,297,496) (2.0) (14,281,256) (4.6) Working Capital Turnover 12.5 9.2 13.9 13.8
Total cost (246,432,859) (92.6) (284,423,011) (91.3)
Profitability Ratios
Gross Profit 19,556,892 7.4 26,997,697 8.7
Return on Assets * 1.9 % 4.5 % 6.2 % 5.7 %
Selling, general & administrative expenses: Return on Equity * 6.4 % 13.2 % 20.0 % 16.3 %
Payroll (6,435,406) (2.4) (11,638,649) (3.7) Times Interest Earned 4.2 10.6 11.9 4.7
Professional fees (490,928) (0.2) (737,668) (0.2)
Sales & marketing costs (825,467) (0.3) (673,921) (0.2) Leverage Ratios
Technology costs (438,490) (0.2) (476,757) (0.2)
Administrative bonuses (931,398) (0.4) (1,673,600) (0.5) Debt to Equity 2.3 2.7 2.2 2.1
Other (8,691,277) (3.3) (5,525,415) (1.8) Revenue to Equity 9.0 12.6 10.7 10.4
Total SG&A expenses (17,812,967) (6.7) (20,726,009) (6.7) Asset Turnover 2.8 3.1 3.3 3.2
Fixed Asset Ratio 36.9 % 31.3 % 25.7 % 21.6 %
Income from operations 1,743,926 0.7 6,271,688 2.0 Equity to SG&A Expense 1.7 1.4 1.4 1.2
Underbillings to Equity 33.4 % 25.3 % 16.8 % 16.5 %
Interest income 151,872 0.1 276,907 0.1 Backlog to Equity 7.4 5.9 5.0 2.6
Interest expense (583,565) (0.2) (535,567) (0.2)
Other income / (expense), net 564,088 0.2 (176,663) (0.1)
Efficiency Ratios
Ne t ea rnings / ( loss) before i ncome taxes 1,876,320 0.7 5,836 ,365 1.9
Backlog to Working Capital 8.7 5.5 6.2 3.4
Income tax (expense) / benefit 165,214 0.1 (2,292,628) (0.7) Months in Backlog 8.9 7.5 5.6 5.1
Days in Accounts Receivable 46.2 50.6 46.8 52.5
Net earnings $ 2,041,534 0.8 % $ 3,543,738 1.1 % Days in Inventory 2.9 3.0 1.1 0.8
Days in Accounts Payable 31.1 32.6 28.0 28.1
Operating Cycle 30.9 35.3 37.8 35.3
Number of ParticipantsNumber
2005 202004 14
Note: Not all figures will apear to sum due to rounding.
* In the CFMA's 2005 Annual Financial Study, Return on Assets (ROA) and Return on Equity (ROE) are calculated
usingnet earnings(loss) before incometaxes. Studies conductedin prioryearsusednetearnings(loss) after taxesto
calculate ROA and ROE. All references to ROAs and ROEs from prior studies have been updated to reflect this
change.
Companies Working in a Foreign RegionComposite
Additional Composite Financial Data
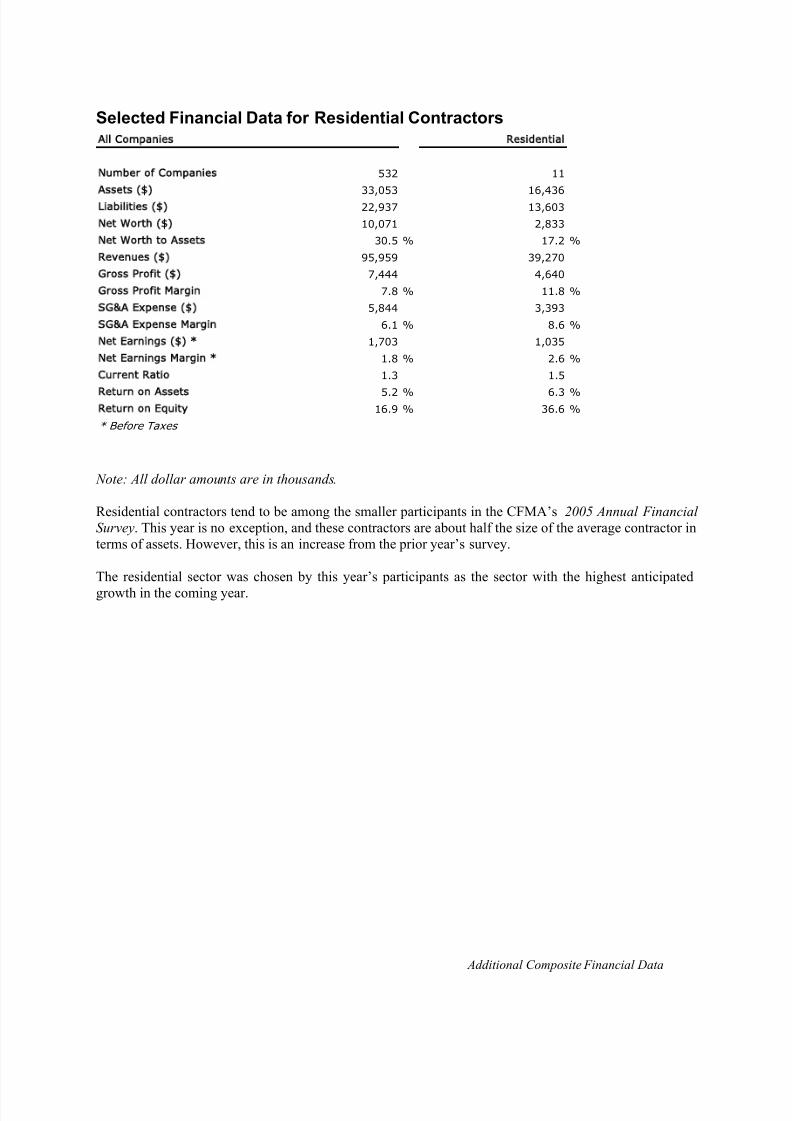
8/13/2019 2005 Financial Survey
http://slidepdf.com/reader/full/2005-financial-survey 245/284
Additional Composite Financial Data
Selected Financial Data for Residential Contractors
All Companies Residential
Number of Companies 532 11
Assets ( ) 33,053 16,436
Liabilities ( ) 22,937 13,603
Net Worth ( ) 10,071 2,833
Net Worth to Assets 30.5 % 17.2 %
Revenues ( ) 95,959 39,270
Gross Profit ( ) 7,444 4,640
Gross Profit Margin 7.8 % 11.8 %
SG&A Expense ( ) 5,844 3,393
SG&A Expense Margin 6.1 % 8.6 %
Net Earnings ( ) * 1,703 1,035
Net Earnings Margin * 1.8 % 2.6 %
Current Ratio 1.3 1.5
Return on Assets 5.2 % 6.3 %Return on Equity 16.9 % 36.6 %
* Before Taxes
Note: All dollar amounts are in thousands.
Residential contractors tend to be among the smaller participants in the CFMA’s 2005 Annual Financial
Survey. This year is no exception, and these contractors are about half the size of the average contractor interms of assets. However, this is an increase from the prior year’s survey.
The residential sector was chosen by this year’s participants as the sector with the highest anticipated
growth in the coming year.
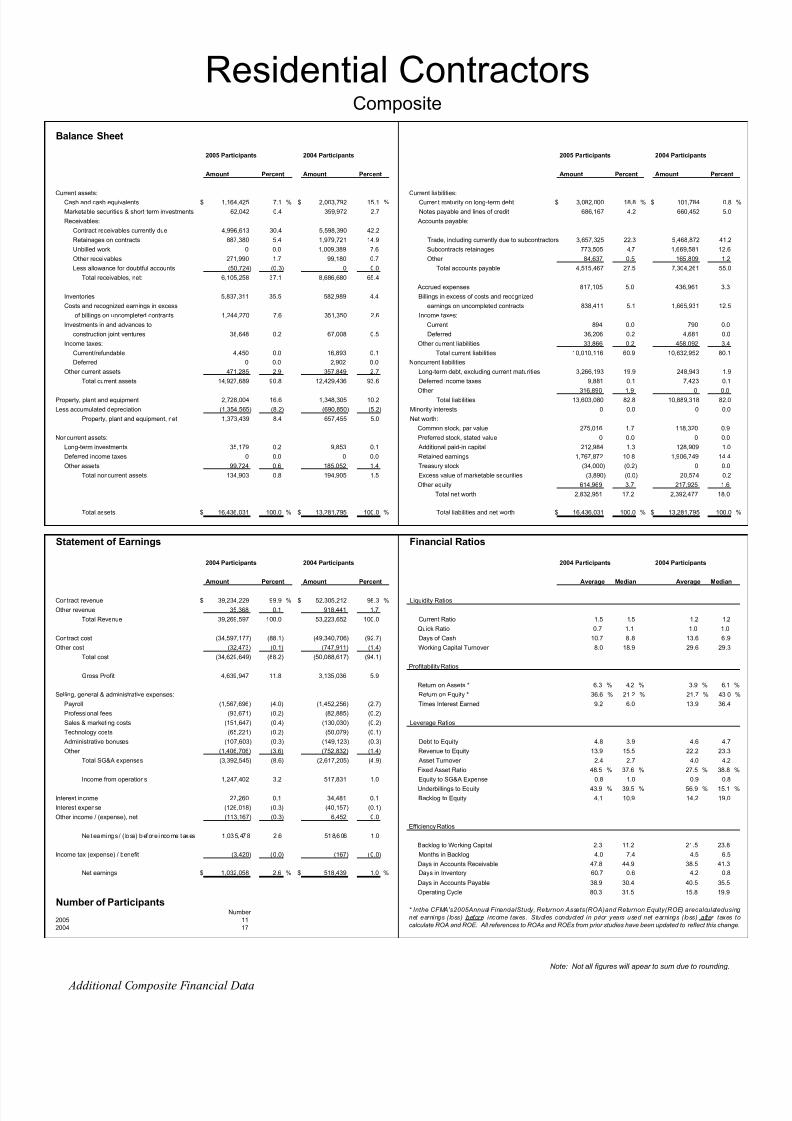
8/13/2019 2005 Financial Survey
http://slidepdf.com/reader/full/2005-financial-survey 246/284
Balance Sheet
2005 Participants 2004 Participants 2005 Participants 2004 Participants
Amount Percent Amount Percent Amount Percent Amount Percent
Current assets: Current liabilities:Cash and cash equivalents $ 1,164,425 7.1 % $ 2,003,792 15.1 % Current maturity on long-term debt $ 3,082,000 18.8 % $ 101,784 0.8 %
Marketable securities & short-term investments 62,042 0.4 359,972 2.7 Notes payable and lines of credit 686,167 4.2 660,452 5.0
Receivables: Accounts payable:
Contract receivables currently due 4,996,613 30.4 5,598,390 42.2
Retainages on contracts 887,380 5.4 1,979,721 14.9 Trade, including currently due to subcontractors 3,657,325 22.3 5,468,872 41.2
Unbilled work 0 0.0 1,009,389 7.6 Subcontracts retainages 773,505 4.7 1,669,581 12.6
Other receivables 271,990 1.7 99,180 0.7 Other 84,637 0.5 165,809 1.2
Less allowance for doubtful accounts (50,724) (0.3) 0 0.0 Total accounts payable 4,515,467 27.5 7,304,261 55.0
Total receivables, net: 6,105,258 37.1 8,686,680 65.4
Accrued expenses 817,105 5.0 436,961 3.3
Inventories 5,837,311 35.5 582,989 4.4 Billings in excess of costs and recognized
Costs and recognized earnings in excess earnings on uncompleted contracts 838,411 5.1 1,665,931 12.5
of billings on uncompleted contracts 1,244,270 7.6 351,350 2.6 Income taxes:
Investments in and advances to Current 894 0.0 790 0.0
construction joint ventures 38,648 0.2 67,008 0.5 Deferred 36,206 0.2 4,681 0.0
Income taxes: Other current liabilities 33,866 0.2 458,092 3.4
Current/refundable 4,450 0.0 16,893 0.1 Total current liabilities 10,010,116 60.9 10,632,952 80.1
Deferred 0 0.0 2,902 0.0 Noncurrent liabilities
Other current assets 471,285 2.9 357,849 2.7 Long-term debt, excluding current maturities 3,266,193 19.9 248,943 1.9
Total current assets 14,927,689 90.8 12,429,436 93.6 Deferred income taxes 9,881 0.1 7,423 0.1
Other 316,890 1.9 0 0.0Property, plant and equipment 2,728,004 16.6 1,348,305 10.2 Total liabilities 13,603,080 82.8 10,889,318 82.0
Less accumulated depreciation (1,354,565) (8.2) (690,850) (5.2) Minority interests 0 0.0 0 0.0
Property, plant and equipment, net 1,373,439 8.4 657,455 5.0 Net worth:
Common stock, par value 275,016 1.7 118,320 0.9
Noncurrent assets: Preferred stock, stated value 0 0.0 0 0.0
Long-term investments 35,179 0.2 9,853 0.1 Additional paid-in capital 212,984 1.3 128,909 1.0
Deferred income taxes 0 0.0 0 0.0 Retained earnings 1,767,872 10.8 1,906,749 14.4
Other assets 99,724 0.6 185,052 1.4 Treasury stock (34,000) (0.2) 0 0.0
Total noncurrent assets 134,903 0.8 194,905 1.5 Excess value of marketable securities (3,890) (0.0) 20,574 0.2
Other equity 614,969 3.7 217,925 1.6
Total net worth 2,832,951 17.2 2,392,477 18.0
Total assets $ 16,436,031 100.0 % $ 13,281,795 100.0 % Total liabilities and net worth $ 16,436,031 100.0 % $ 13,281,795 100.0 %
Statement of Earnings Financial Ratios
2004 Participants 2004 Participants 2004 Participants 2004 Participants
Amount Percent Amount Percent Average Median Average Median
Contract revenue $ 39,234,229 99.9 % $ 52,305,212 98.3 % Liquidity Ratios
Other revenue 35,368 0.1 918,441 1.7
Total Revenue 39,269,597 100.0 53,223,652 100.0 Current Ratio 1.5 1.5 1.2 1.2
Quick Ratio 0.7 1.1 1.0 1.0
Contract cost (34,597,177) (88.1) (49,340,706) (92.7) Days of Cash 10.7 8.8 13.6 6.9
Other cost (32,473) (0.1) (747,911) (1.4) Working Capital Turnover 8.0 18.9 29.6 29.3
Total cost (34,629,649) (88.2) (50,088,617) (94.1)
Profitability Ratios
Gross Profit 4,639,947 11.8 3,135,036 5.9
Return on Assets * 6.3 % 4.2 % 3.9 % 6.1 %
Selling, general & administrative expenses: Return on Equity * 36.6 % 21.2 % 21.7 % 43.0 %
Payroll (1,567,696) (4.0) (1,452,256) (2.7) Times Interest Earned 9.2 6.0 13.9 36.4
Professional fees (93,671) (0.2) (82,885) (0.2)
Sales & marketing costs (151,647) (0.4) (130,030) (0.2) Leverage Ratios
Technology costs (65,221) (0.2) (50,079) (0.1)
Administrative bonuses (107,603) (0.3) (149,123) (0.3) Debt to Equity 4.8 3.9 4.6 4.7
Other (1,406,706) (3.6) (752,832) (1.4) Revenue to Equity 13.9 15.5 22.2 23.3
Total SG&A expenses (3,392,545) (8.6) (2,617,205) (4.9) Asset Turnover 2.4 2.7 4.0 4.2
Fixed Asset Ratio 48.5 % 37.6 % 27.5 % 38.8 %
Income from operations 1,247,402 3.2 517,831 1.0 Equity to SG&A Expense 0.8 1.0 0.9 0.8
Underbillings to Equity 43.9 % 39.5 % 56.9 % 15.1 %
Interest income 27,260 0.1 34,481 0.1 Backlog to Equity 4.1 10.9 14.2 19.0
Interest expense (126,018) (0.3) (40,157) (0.1)
Other income / (expense), net (113,167) (0.3) 6,452 0.0
Efficiency Ratios
Ne t ea rnings / ( loss) before i ncome taxes 1 ,035,478 2 .6 518,606 1 .0
Backlog to Working Capital 2.3 11.2 21.5 23.8
Income tax (expense) / benefit (3,420) (0.0) (167) (0.0) Months in Backlog 4.0 7.4 4.5 6.5
Days in Accounts Receivable 47.8 44.9 38.5 41.3
Net earnings $ 1,032,058 2.6 % $ 518,439 1.0 % Days in Inventory 60.7 0.6 4.2 0.8
Days in Accounts Payable 38.9 30.4 40.5 35.5
Operating Cycle 80.3 31.5 15.8 19.9
Number of ParticipantsNumber
2005 112004 17
Note: Not all figures will apear to sum due to rounding.
* Inthe CFMA's2005Annual FinancialStudy, Returnon Assets(ROA)and Returnon Equity(ROE) arecalculatedusing
net earnings (loss) before income taxes. Studies conducted in prior years used net earnings (loss) after taxes to
calculate ROA and ROE. All references to ROAs and ROEs from prior studies have been updated to reflect this change.
Additional Composite Financial Data
Residential ContractorsComposite

8/13/2019 2005 Financial Survey
http://slidepdf.com/reader/full/2005-financial-survey 247/284
C F M A ’s 2 0 0 5
Construction
Industry Annual
Financial Survey
APPENDICES

8/13/2019 2005 Financial Survey
http://slidepdf.com/reader/full/2005-financial-survey 248/284
Note: Not all figures will appear to sum due to rounding. Appendices
APPENDIX A — COMPLETE SURVEY ANSWERS
All Industrial & Heavy & Specialty
Companies Nonresidential Highway Trade
1 Did you participate in the 2004 survey?
72% 75% 67% 69%
2 Is someone in your company a member of CFMA?
Yes 97% 97% 95% 97%
3 What is the ownership of the business?
Private - Domestic U.S. 94% 96% 88% 93%
Public - Domestic U.S. (SEC Registrant) 1% 0% 0% 1%
Private - Foreign 0% 0% 2% 0%
Public - Foreign 1% 0% 2% 1%
ESOP - Employee Stock Ownership Plan 4% 3% 7% 4%Other 1% 0% 2% 1%
4 How many full-time accounting personnel did you employ in 2004?
<$10M in Revenue 5 2 3 8
$10M - $25M in Revenue 4 3 4 5
$25M - $50M in Revenue 12 12 6 14
$50M - $100M in Revenue 16 9 21 26
>$100M in Revenue 26 26 14 24
5 Does your company qualify under any of the DBE categories?
Minority business enterprise 2% 2% 3% 2%
Woman-owned business enterprise 2% 3% 1% 2%
Small business enterprise 7% 5% 7% 8%
6 Has majority ownership changed in the last five years?
Yes 17% 11% 22% 21%
7 If yes, how was the transaction accomplished?
Sale to another domestic company 24% 10% 35% 30%
Sale to a foreign entity 1% 0% 6% 0%
Direct sale to employees 31% 48% 12% 26%
Employee stock ownership plan trust (ESOT) 12% 5% 18% 11%
Transfer to family 31% 38% 29% 30%
Initial public offering (IPO) 0% 0% 0% 0%
Bankruptcy/reorganization 1% 0% 0% 4%
Other 0% 0% 0% 0%
8 What is the legal form of the business?
Regular C Corporation 25% 23% 25% 27%
S Corporation 64% 67% 60% 62%
General Partnership 1% 1% 1% 1%
Limited Partnership 3% 3% 3% 2%
Joint Venture 0% 0% 0% 0%
Limited Liability Company 7% 6% 9% 8%
Sole Proprietorship 0% 0% 0% 0%
Other 1% 0% 1% 1%
General Profile
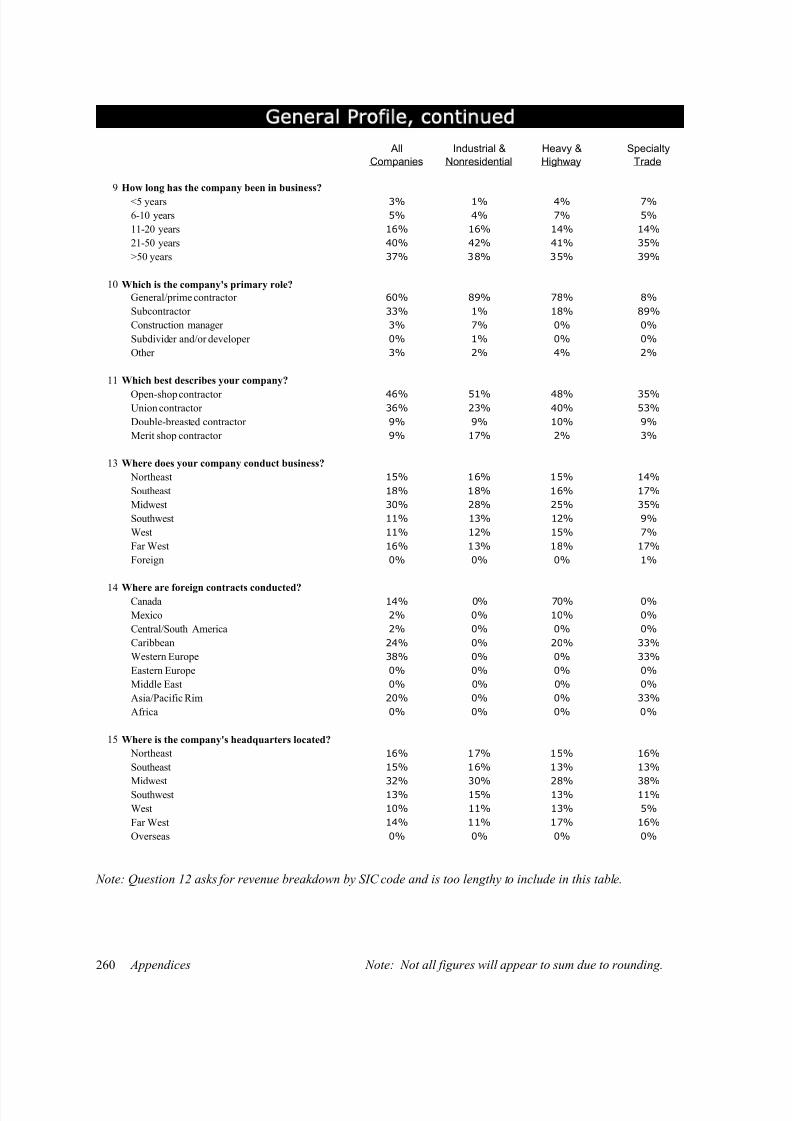
8/13/2019 2005 Financial Survey
http://slidepdf.com/reader/full/2005-financial-survey 249/284
Appendices Note: Not all figures will appear to sum due to rounding.260
All Industrial & Heavy & Specialty
Companies Nonresidential Highway Trade
9 How long has the company been in business?
<5 years 3% 1% 4% 7%
6-10 years 5% 4% 7% 5%
11-20 years 16% 16% 14% 14%
21-50 years 40% 42% 41% 35%
>50 years 37% 38% 35% 39%
10 Which is the company's primary role?
General/prime contractor 60% 89% 78% 8%
Subcontractor 33% 1% 18% 89%
Construction manager 3% 7% 0% 0%
Subdivider and/or developer 0% 1% 0% 0%
Other 3% 2% 4% 2%
11 Which best describes your company?
Open-shop contractor 46% 51% 48% 35%Union contractor 36% 23% 40% 53%
Double-breasted contractor 9% 9% 10% 9%
Merit shop contractor 9% 17% 2% 3%
13 Where does your company conduct business?
Northeast 15% 16% 15% 14%
Southeast 18% 18% 16% 17%
Midwest 30% 28% 25% 35%
Southwest 11% 13% 12% 9%
West 11% 12% 15% 7%
Far West 16% 13% 18% 17%
Foreign 0% 0% 0% 1%
14 Where are foreign contracts conducted?Canada 14% 0% 70% 0%
Mexico 2% 0% 10% 0%
Central/South America 2% 0% 0% 0%
Caribbean 24% 0% 20% 33%
Western Europe 38% 0% 0% 33%
Eastern Europe 0% 0% 0% 0%
Middle East 0% 0% 0% 0%
Asia/Pacific Rim 20% 0% 0% 33%
Africa 0% 0% 0% 0%
15 Where is the company's headquarters located?
Northeast 16% 17% 15% 16%
Southeast 15% 16% 13% 13%
Midwest 32% 30% 28% 38%Southwest 13% 15% 13% 11%
West 10% 11% 13% 5%
Far West 14% 11% 17% 16%
Overseas 0% 0% 0% 0%
General Profile, continued
Note: Question 12 asks for revenue breakdown by SIC code and is too lengthy to include in this table.

8/13/2019 2005 Financial Survey
http://slidepdf.com/reader/full/2005-financial-survey 250/284
Note: Not all figures will appear to sum due to rounding. Appendices 261
All Industrial & Heavy & Specialty
Companies Nonresidential Highway Trade
16 What are the company's revenue sources?
Public - federal 6% 4% 8% 7%
Public - state 13% 7% 31% 11%
Public - local 13% 11% 25% 10%
Public - foreign 0% 0% 0% 1%
Private 66% 76% 35% 71%
Self or related party 1% 1% 1% 0%
17 What types of contracts does the company perform?
Fixed price (lump sum, hard bid) 39% 30% 40% 50%
Fixed price (lump sum, negotiated) 20% 22% 10% 23%
Cost plus fee with guaranteed maximum price 14% 28% 1% 5%
Unit price 10% 0% 37% 3%
Time and materials 8% 3% 7% 15%
Cost plus fee 5% 8% 2% 2%
Construction management 3% 7% 1% 0%
Other 1% 1% 1% 1%
18 On average, how many full-time or equivalent full-time project managers did your company employ in 2004?
<$10M in Revenue 4 3 3 6
$10M - $25M in Revenue 5 4 6 5
$25M - $50M in Revenue 7 7 5 9
$50M - $100M in Revenue 13 14 11 15
>$100M in Revenue 47 55 37 40
19 On average, how many full-time or equivalent full-time estimators did your company employ in 2004?
<$10M in Revenue 2 2 2 2
$10M - $25M in Revenue 3 2 3 3
$25M - $50M in Revenue 4 3 3 6
$50M - $100M in Revenue 5 4 5 6>$100M in Revenue 16 16 13 19
20 What is the average length of the contracts performed by your company?
< 12 months 62% 57% 58% 72%
12 - 24 months 35% 42% 33% 28%
> 24 months 2% 1% 9% 0%
21 What percent of your contracts are performed by the design-build method?
>80% 4% 5% 2% 2%
40% - 79% 11% 15% 5% 10%
<39% 56% 62% 45% 57%
None 29% 19% 49% 30%
22 How many contracts did your company perform in 2004?<$10M in Revenue 108 77 57 144
$10M - $25M in Revenue 145 72 106 228
$25M - $50M in Revenue 146 71 99 345
$50M - $100M in Revenue 300 142 159 669
>$100M in Revenue 547 276 250 1,458
General Profile, continued
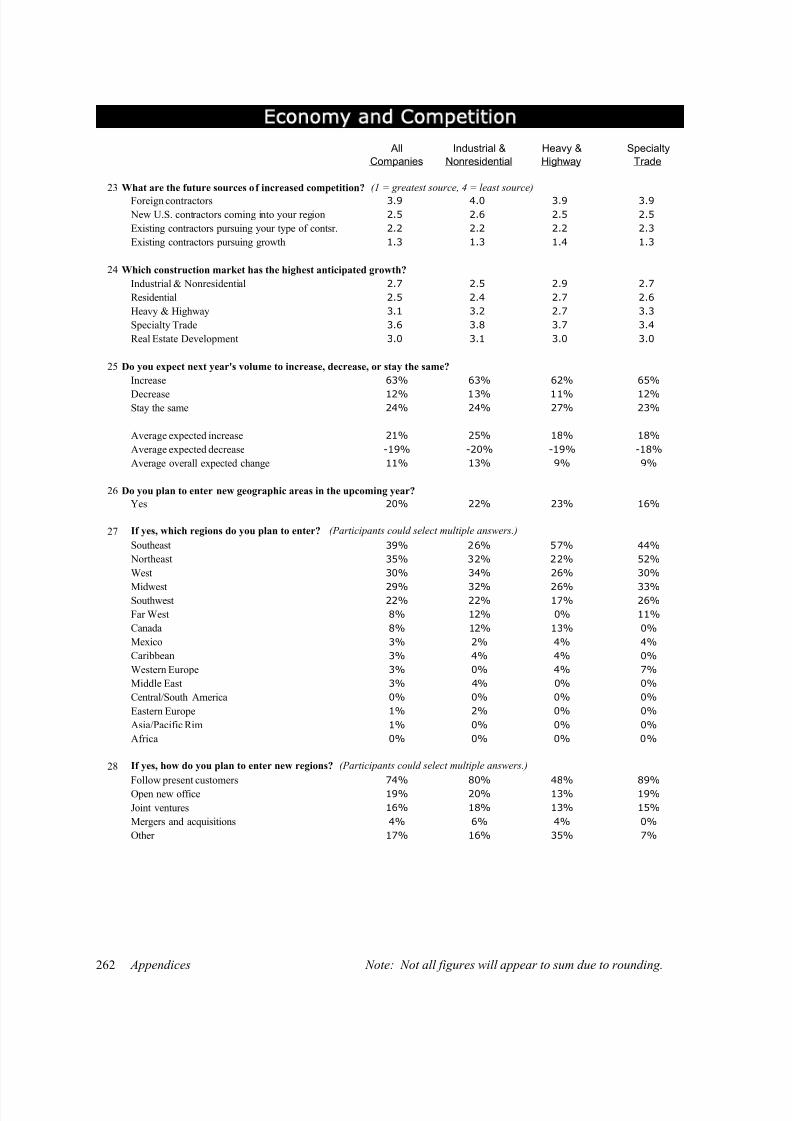
8/13/2019 2005 Financial Survey
http://slidepdf.com/reader/full/2005-financial-survey 251/284
Appendices Note: Not all figures will appear to sum due to rounding.262
All Industrial & Heavy & Specialty
Companies Nonresidential Highway Trade
23 What are the future sources of increased competition? (1 = greatest source, 4 = least source)
Foreign contractors 3.9 4.0 3.9 3.9
New U.S. contractors coming into your region 2.5 2.6 2.5 2.5
Existing contractors pursuing your type of contsr. 2.2 2.2 2.2 2.3
Existing contractors pursuing growth 1.3 1.3 1.4 1.3
24 Which construction market has the highest anticipated growth?
Industrial & Nonresidential 2.7 2.5 2.9 2.7
Residential 2.5 2.4 2.7 2.6
Heavy & Highway 3.1 3.2 2.7 3.3
Specialty Trade 3.6 3.8 3.7 3.4
Real Estate Development 3.0 3.1 3.0 3.0
25 Do you expect next year's volume to increase, decrease, or stay the same?
Increase 63% 63% 62% 65%
Decrease 12% 13% 11% 12%Stay the same 24% 24% 27% 23%
Average expected increase 21% 25% 18% 18%
Average expected decrease -19% -20% -19% -18%
Average overall expected change 11% 13% 9% 9%
26 Do you plan to enter new geographic areas in the upcoming year?
Yes 20% 22% 23% 16%
27 If yes, which regions do you plan to enter? (Participants could select multiple answers.)
Southeast 39% 26% 57% 44%
Northeast 35% 32% 22% 52%
West 30% 34% 26% 30%
Midwest 29% 32% 26% 33%Southwest 22% 22% 17% 26%
Far West 8% 12% 0% 11%
Canada 8% 12% 13% 0%
Mexico 3% 2% 4% 4%
Caribbean 3% 4% 4% 0%
Western Europe 3% 0% 4% 7%
Middle East 3% 4% 0% 0%
Central/South America 0% 0% 0% 0%
Eastern Europe 1% 2% 0% 0%
Asia/Pacific Rim 1% 0% 0% 0%
Africa 0% 0% 0% 0%
28 If yes, how do you plan to enter new regions? (Participants could select multiple answers.)
Follow present customers 74% 80% 48% 89%
Open new office 19% 20% 13% 19%
Joint ventures 16% 18% 13% 15%
Mergers and acquisitions 4% 6% 4% 0%
Other 17% 16% 35% 7%
Economy and Competition
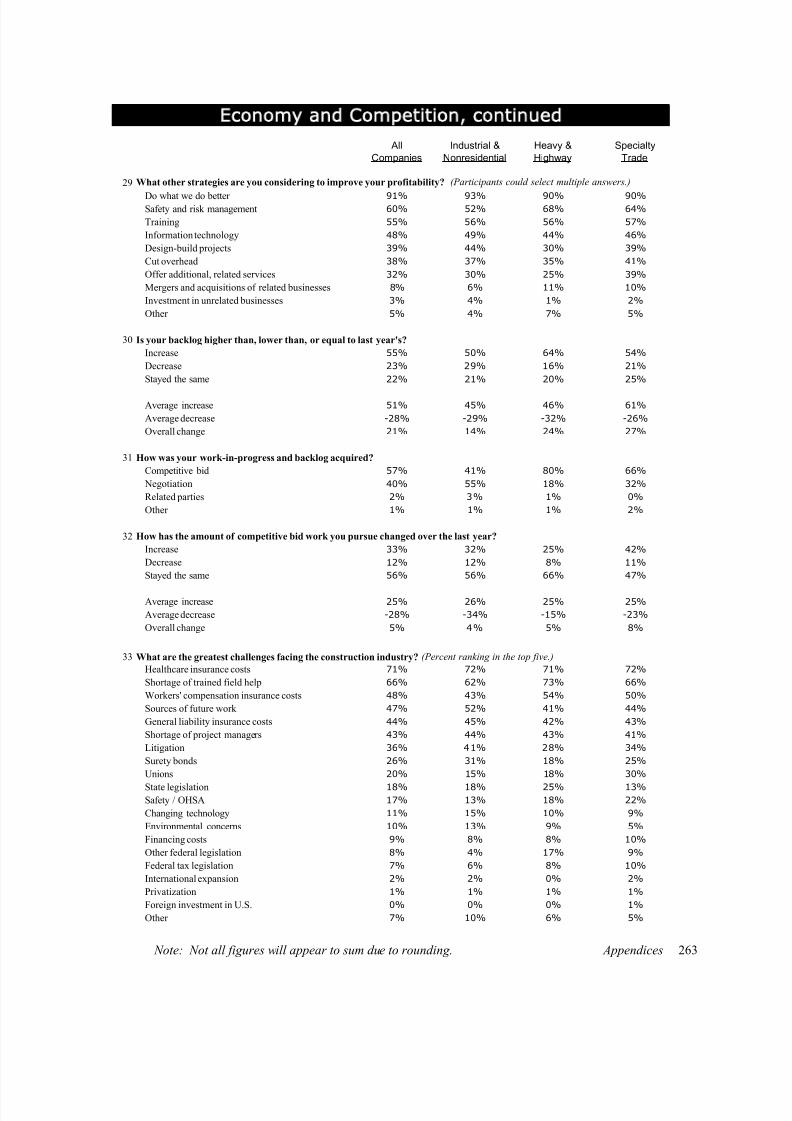
8/13/2019 2005 Financial Survey
http://slidepdf.com/reader/full/2005-financial-survey 252/284
Note: Not all figures will appear to sum due to rounding. Appendices 263
All Industrial & Heavy & Specialty
Companies Nonresidential Highway Trade
29 What other strategies are you considering to improve your profitability? (Participants could select multiple answers.)
Do what we do better 91% 93% 90% 90%Safety and risk management 60% 52% 68% 64%
Training 55% 56% 56% 57%
Information technology 48% 49% 44% 46%
Design-build projects 39% 44% 30% 39%
Cut overhead 38% 37% 35% 41%
Offer additional, related services 32% 30% 25% 39%
Mergers and acquisitions of related businesses 8% 6% 11% 10%
Investment in unrelated businesses 3% 4% 1% 2%
Other 5% 4% 7% 5%
30 Is your backlog higher than, lower than, or equal to last year's?
Increase 55% 50% 64% 54%
Decrease 23% 29% 16% 21%
Stayed the same 22% 21% 20% 25%
Average increase 51% 45% 46% 61%
Average decrease -28% -29% -32% -26%
Overall change 21% 14% 24% 27%
31 How was your work-in-progress and backlog acquired?
Competitive bid 57% 41% 80% 66%
Negotiation 40% 55% 18% 32%
Related parties 2% 3% 1% 0%
Other 1% 1% 1% 2%
32 How has the amount of competitive bid work you pursue changed over the last year?
Increase 33% 32% 25% 42%
Decrease 12% 12% 8% 11%
Stayed the same 56% 56% 66% 47%
Average increase 25% 26% 25% 25%
Average decrease -28% -34% -15% -23%
Overall change 5% 4% 5% 8%
33
Healthcare insurance costs 71% 72% 71% 72%
Shortage of trained field help 66% 62% 73% 66%
Workers' compensation insurance costs 48% 43% 54% 50%
Sources of future work 47% 52% 41% 44%
General liability insurance costs 44% 45% 42% 43%
Shortage of project managers 43% 44% 43% 41%
Litigation 36% 41% 28% 34%
Surety bonds 26% 31% 18% 25%
Unions 20% 15% 18% 30%
State legislation 18% 18% 25% 13%Safety / OHSA 17% 13% 18% 22%
Changing technology 11% 15% 10% 9%
Environmental concerns 10% 13% 9% 5%
Financing costs 9% 8% 8% 10%
Other federal legislation 8% 4% 17% 9%
Federal tax legislation 7% 6% 8% 10%
International expansion 2% 2% 0% 2%
Privatization 1% 1% 1% 1%
Foreign investment in U.S. 0% 0% 0% 1%
Other 7% 10% 6% 5%
What are the greatest challenges facing the construction industry? (Percent ranking in the top five.)
Economy and Competition, continued

8/13/2019 2005 Financial Survey
http://slidepdf.com/reader/full/2005-financial-survey 253/284
Appendices Note: Not all figures will appear to sum due to rounding.264
All Industrial & Heavy & Specialty
Companies Nonresidential Highway Trade
34 Aside from estimating, do you prepare a formalized budget?
Yes 78% 84% 70% 77%
35 Is the availability of bank credit better or worse than twelve months ago?
Better 35% 25% 38% 45%
Worse 3% 3% 3% 5%
About the same 61% 72% 59% 50%
36 Do you have bank debt covered by covenants?
Have bank debt covered by covenants 55% 40% 62% 72%
Current ratio 20% 17% 19% 26%
Median covenant value 1.2 1.1 1.3 1.2
Minimum working capital 14% 9% 19% 17%
Debt to equity 19% 12% 26% 23%
Median covenant value 2.9 3.5 2.1 2.5
Total liability to tangible net worth 15% 8% 13% 26%
Median covenant value 2.6 3.2 2.3 2.5
Minimum tangible net worth 34% 24% 41% 41%
Minimum EBITDA 11% 5% 17% 15%
Other 13% 9% 17% 13%
37 How has your working capital line of credit changed over the year?
Increased 29% 20% 35% 35%
Decreased 4% 3% 1% 7%
Remained the same 60% 69% 58% 55% N/A, no line of credit 7% 8% 6% 3%
38 Is your working capital line of credit secured?
Yes 67% 53% 72% 78%
39 Does ownership provide personal guarantees on any financing arrangements?
Yes 52% 49% 46% 56%
40 Primary sources of financing for equipment purchases:
Current cash flow 54% 66% 38% 52%
Bank installment loans 18% 13% 25% 18%
Leasing companies 12% 7% 13% 17%
Vendor financing 9% 7% 17% 8%
Vendor lease-purchase 3% 3% 3% 2%
Related-party lease/financing 3% 2% 3% 2%
Brokerage firm 0% 0% 0% 0%
Other 1% 2% 1% 1%
Cash Management and Finance

8/13/2019 2005 Financial Survey
http://slidepdf.com/reader/full/2005-financial-survey 254/284
Note: Not all figures will appear to sum due to rounding. Appendices 265
All Industrial & Heavy & Specialty
Companies Nonresidential Highway Trade
41 Cash management techniques: (Participants could select multiple answers.)
Zero balance / sweep account 80% 84% 82% 74%
Online banking 74% 77% 75% 72%
Electronic payments from customers 63% 68% 61% 58%
Sweep against line of credit 38% 25% 39% 55%
Corporate purchasing cards 31% 30% 28% 36%
Interest-bearing checking account 29% 37% 29% 20%
Electronic bank reconciliation/download 29% 28% 37% 27%
Savings account 28% 30% 33% 24%
Electronic payments to vendors 23% 19% 38% 22%
Positive pay 22% 25% 16% 22%
Remote disbursement bank account 17% 16% 23% 17%
Lockbox 12% 10% 12% 16%
Electronic data interchange (EDI) 10% 7% 8% 15%
Non-bank checking account 3% 2% 4% 3%
Other 3% 4% 3% 2%
42 Percentage of contracts bonded:
>80% 13.9% 10% 40% 2%
60% - 79% 8.4% 10% 12% 4%
40% - 59% 15.8% 16% 18% 15%
20% - 39% 23% 25% 13% 29%
<20% 33% 34% 14% 44%
N/A 6% 4% 2% 6%
43
Better 23% 18% 28% 27%
Worse 9% 11% 7% 8%
About the same 67% 71% 65% 65%
44 Is your bonding credit secured by personal guarantees?
Yes 43% 42% 36% 46%
45 Which of the following describes your current bonding program?
Actively bond with more than one surety 6% 7% 7% 3%
Actively bond with one surety, but have standby 24% 26% 32% 17%
Bond with only one surety 71% 67% 61% 79%
46 If a general contractor, percent of subcontractor dollars bonded:
>80% 6% 4% 13% 4%
60% - 79% 5% 4% 11% 1%
40% - 59% 8% 10% 6% 0%20% - 39% 10% 13% 6% 6%
<19% 40% 49% 38% 16%
N/A 31% 21% 26% 73%
Bonding and Sureties
Is the general availability of bonding credit for your company better or worse than 12 months ago?
Cash Management and Finance, continued
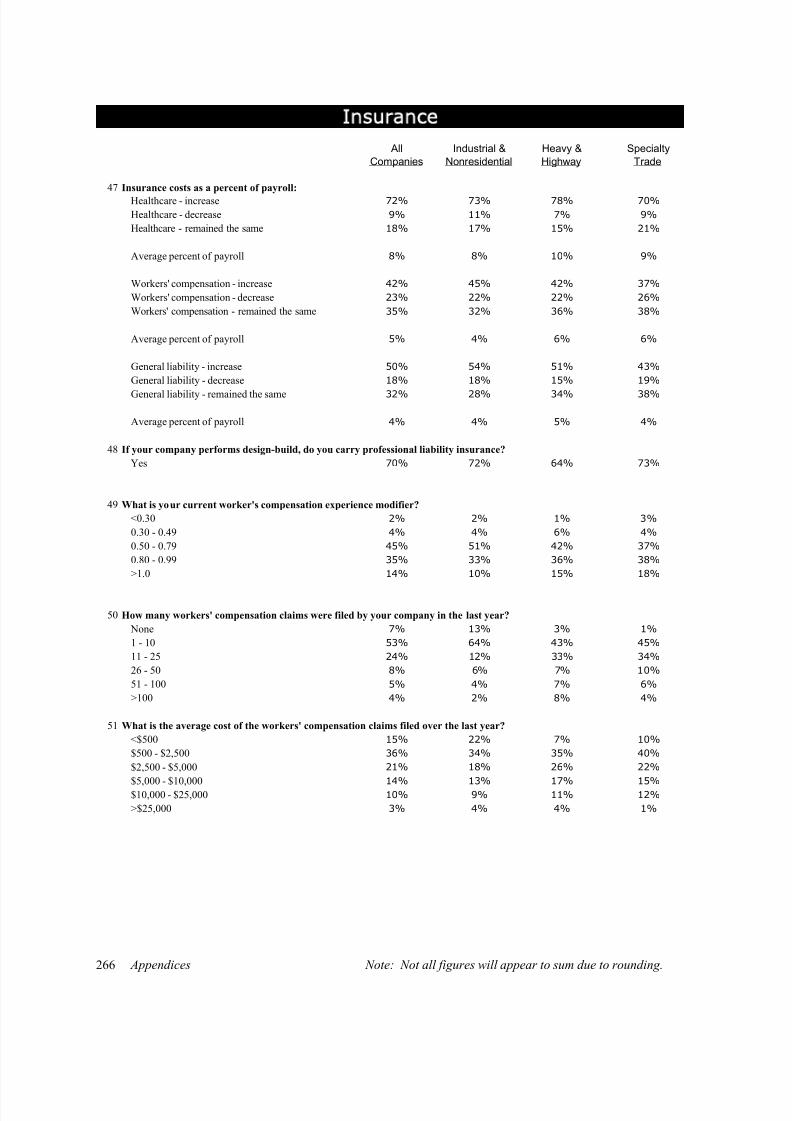
8/13/2019 2005 Financial Survey
http://slidepdf.com/reader/full/2005-financial-survey 255/284
Appendices Note: Not all figures will appear to sum due to rounding.266
All Industrial & Heavy & Specialty
Companies Nonresidential Highway Trade
47 Insurance costs as a percent of payroll:
Healthcare - increase 72% 73% 78% 70%
Healthcare - decrease 9% 11% 7% 9%
Healthcare - remained the same 18% 17% 15% 21%
Average percent of payroll 8% 8% 10% 9%
Workers' compensation - increase 42% 45% 42% 37%
Workers' compensation - decrease 23% 22% 22% 26%
Workers' compensation - remained the same 35% 32% 36% 38%
Average percent of payroll 5% 4% 6% 6%
General liability - increase 50% 54% 51% 43%
General liability - decrease 18% 18% 15% 19%
General liability - remained the same 32% 28% 34% 38%
Average percent of payroll 4% 4% 5% 4%
48 If your company performs design-build, do you carry professional liability insurance?
Yes 70% 72% 64% 73%
49 What is your current worker's compensation experience modifier?
<0.30 2% 2% 1% 3%
0.30 - 0.49 4% 4% 6% 4%
0.50 - 0.79 45% 51% 42% 37%
0.80 - 0.99 35% 33% 36% 38%
>1.0 14% 10% 15% 18%
50 How many workers' compensation claims were filed by your company in the last year?
None 7% 13% 3% 1%
1 - 10 53% 64% 43% 45%
11 - 25 24% 12% 33% 34%
26 - 50 8% 6% 7% 10%
51 - 100 5% 4% 7% 6%
>100 4% 2% 8% 4%
51 What is the average cost of the workers' compensation claims filed over the last year?
<$500 15% 22% 7% 10%
$500 - $2,500 36% 34% 35% 40%
$2,500 - $5,000 21% 18% 26% 22%
$5,000 - $10,000 14% 13% 17% 15%$10,000 - $25,000 10% 9% 11% 12%
>$25,000 3% 4% 4% 1%
Insurance
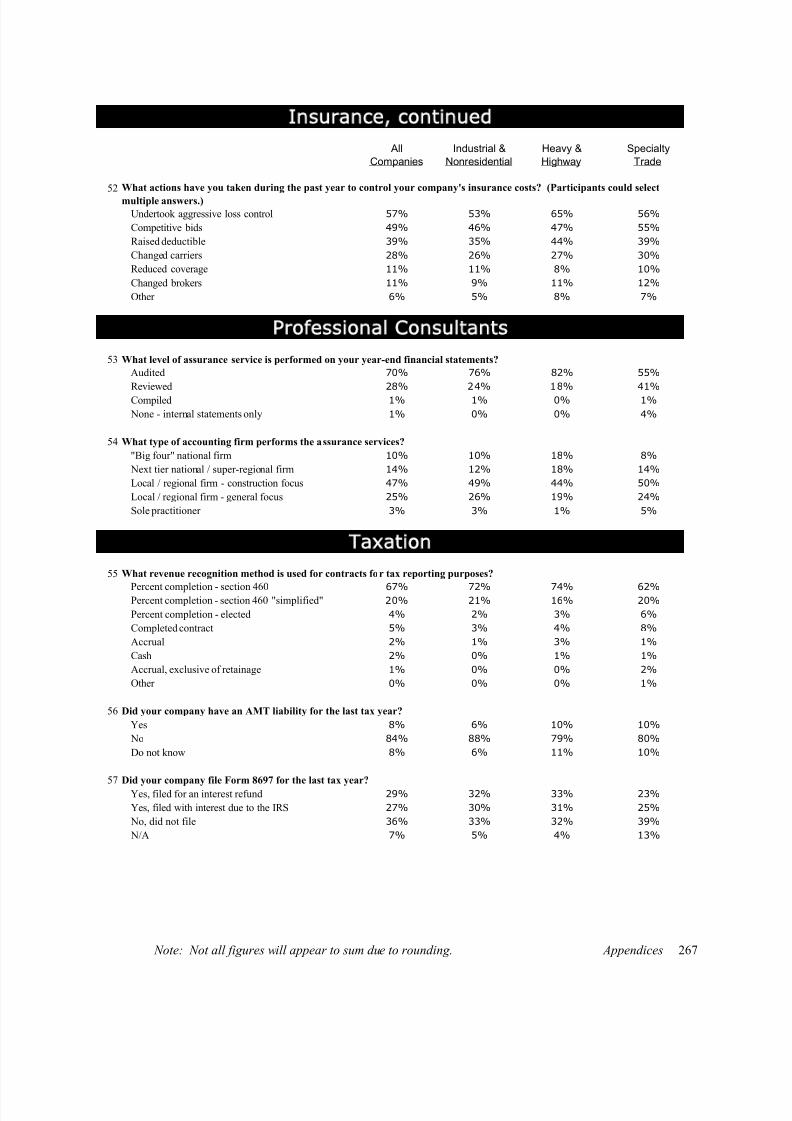
8/13/2019 2005 Financial Survey
http://slidepdf.com/reader/full/2005-financial-survey 256/284
Note: Not all figures will appear to sum due to rounding. Appendices 267
All Industrial & Heavy & Specialty
Companies Nonresidential Highway Trade
52
Undertook aggressive loss control 57% 53% 65% 56%
Competitive bids 49% 46% 47% 55%
Raised deductible 39% 35% 44% 39%
Changed carriers 28% 26% 27% 30%
Reduced coverage 11% 11% 8% 10%
Changed brokers 11% 9% 11% 12%
Other 6% 5% 8% 7%
53 What level of assurance service is performed on your year-end financial statements?
Audited 70% 76% 82% 55%
Reviewed 28% 24% 18% 41%
Compiled 1% 1% 0% 1%
None - internal statements only 1% 0% 0% 4%
54 What type of accounting firm performs the assurance services?
"Big four" national firm 10% 10% 18% 8%
Next tier national / super-regional firm 14% 12% 18% 14%
Local / regional firm - construction focus 47% 49% 44% 50%
Local / regional firm - general focus 25% 26% 19% 24%
Sole practitioner 3% 3% 1% 5%
55 What revenue recognition method is used for contracts for tax reporting purposes?
Percent completion - section 460 67% 72% 74% 62%Percent completion - section 460 "simplified" 20% 21% 16% 20%
Percent completion - elected 4% 2% 3% 6%
Completed contract 5% 3% 4% 8%
Accrual 2% 1% 3% 1%
Cash 2% 0% 1% 1%
Accrual, exclusive of retainage 1% 0% 0% 2%
Other 0% 0% 0% 1%
56 Did your company have an AMT liability for the last tax year?
Yes 8% 6% 10% 10%
No 84% 88% 79% 80%
Do not know 8% 6% 11% 10%
57 Did your company file Form 8697 for the last tax year?
Yes, filed for an interest refund 29% 32% 33% 23%
Yes, filed with interest due to the IRS 27% 30% 31% 25%
No, did not file 36% 33% 32% 39%
N/A 7% 5% 4% 13%
What actions have you taken during the past year to control your company's insurance costs? (Participants could select
multiple answers.)
Professional Consultants
Taxation
Insurance, continued
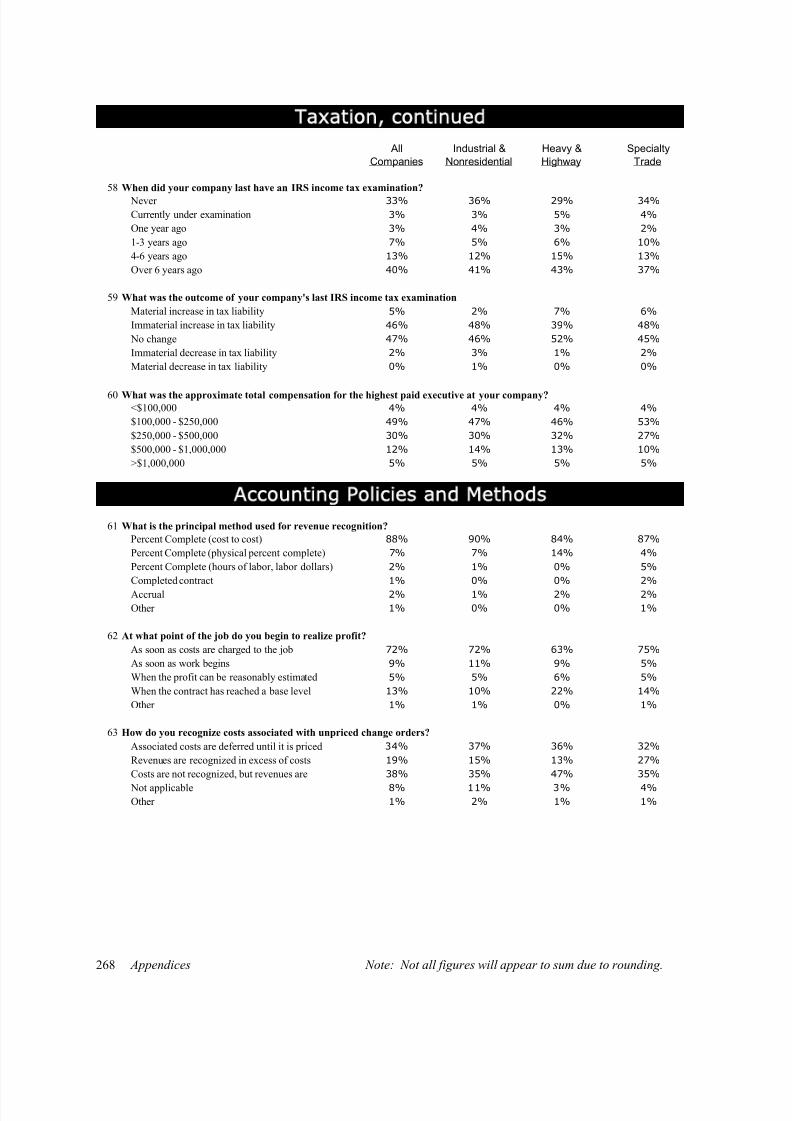
8/13/2019 2005 Financial Survey
http://slidepdf.com/reader/full/2005-financial-survey 257/284
Appendices Note: Not all figures will appear to sum due to rounding.268
All Industrial & Heavy & Specialty
Companies Nonresidential Highway Trade
58 When did your company last have an IRS income tax examination?
Never 33% 36% 29% 34%
Currently under examination 3% 3% 5% 4%
One year ago 3% 4% 3% 2%
1-3 years ago 7% 5% 6% 10%
4-6 years ago 13% 12% 15% 13%
Over 6 years ago 40% 41% 43% 37%
59 What was the outcome of your company's last IRS income tax examination
Material increase in tax liability 5% 2% 7% 6%
Immaterial increase in tax liability 46% 48% 39% 48%
No change 47% 46% 52% 45%
Immaterial decrease in tax liability 2% 3% 1% 2%
Material decrease in tax liability 0% 1% 0% 0%
60<$100,000 4% 4% 4% 4%
$100,000 - $250,000 49% 47% 46% 53%
$250,000 - $500,000 30% 30% 32% 27%
$500,000 - $1,000,000 12% 14% 13% 10%
>$1,000,000 5% 5% 5% 5%
61 What is the principal method used for revenue recognition?
Percent Complete (cost to cost) 88% 90% 84% 87%
Percent Complete (physical percent complete) 7% 7% 14% 4%
Percent Complete (hours of labor, labor dollars) 2% 1% 0% 5%
Completed contract 1% 0% 0% 2%
Accrual 2% 1% 2% 2%
Other 1% 0% 0% 1%
62 At what point of the job do you begin to realize profit?
As soon as costs are charged to the job 72% 72% 63% 75%
As soon as work begins 9% 11% 9% 5%
When the profit can be reasonably estimated 5% 5% 6% 5%
When the contract has reached a base level 13% 10% 22% 14%
Other 1% 1% 0% 1%
63 How do you recognize costs associated with unpriced change orders?
Associated costs are deferred until it is priced 34% 37% 36% 32%
Revenues are recognized in excess of costs 19% 15% 13% 27%
Costs are not recognized, but revenues are 38% 35% 47% 35%
Not applicable 8% 11% 3% 4%Other 1% 2% 1% 1%
Taxation, continued
What was the approximate total compensation for the highest paid executive at your company?
Accounting Policies and Methods
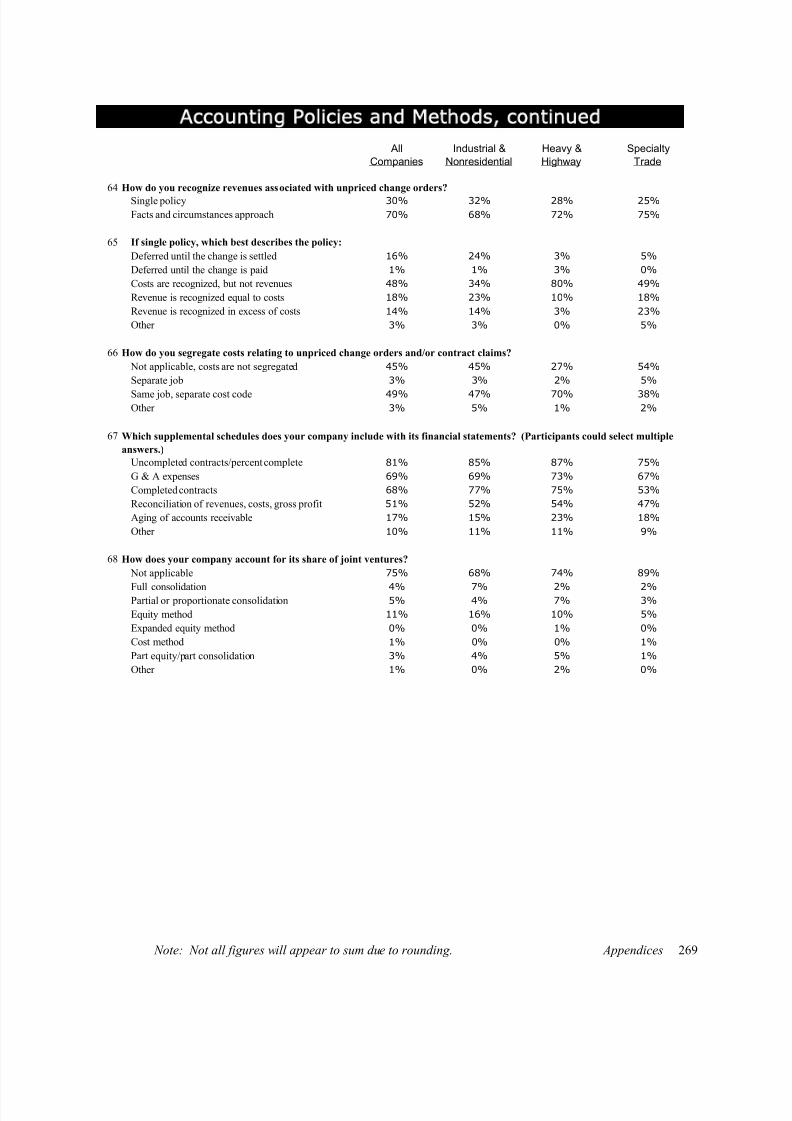
8/13/2019 2005 Financial Survey
http://slidepdf.com/reader/full/2005-financial-survey 258/284
Note: Not all figures will appear to sum due to rounding. Appendices 269
All Industrial & Heavy & Specialty
Companies Nonresidential Highway Trade
64 How do you recognize revenues associated with unpriced change orders?
Single policy 30% 32% 28% 25%
Facts and circumstances approach 70% 68% 72% 75%
65 If single policy, which best describes the policy:
Deferred until the change is settled 16% 24% 3% 5%
Deferred until the change is paid 1% 1% 3% 0%
Costs are recognized, but not revenues 48% 34% 80% 49%
Revenue is recognized equal to costs 18% 23% 10% 18%
Revenue is recognized in excess of costs 14% 14% 3% 23%
Other 3% 3% 0% 5%
66 How do you segregate costs relating to unpriced change orders and/or contract claims?
Not applicable, costs are not segregated 45% 45% 27% 54%
Separate job 3% 3% 2% 5%
Same job, separate cost code 49% 47% 70% 38%Other 3% 5% 1% 2%
67
Uncompleted contracts/percent complete 81% 85% 87% 75%
G & A expenses 69% 69% 73% 67%
Completed contracts 68% 77% 75% 53%
Reconciliation of revenues, costs, gross profit 51% 52% 54% 47%
Aging of accounts receivable 17% 15% 23% 18%
Other 10% 11% 11% 9%
68 How does your company account for its share of joint ventures?
Not applicable 75% 68% 74% 89%
Full consolidation 4% 7% 2% 2%Partial or proportionate consolidation 5% 4% 7% 3%
Equity method 11% 16% 10% 5%
Expanded equity method 0% 0% 1% 0%
Cost method 1% 0% 0% 1%
Part equity/part consolidation 3% 4% 5% 1%
Other 1% 0% 2% 0%
Accounting Policies and Methods, continued
Which supplemental schedules does your company include with its financial statements? (Participants could select multiple
answers.)
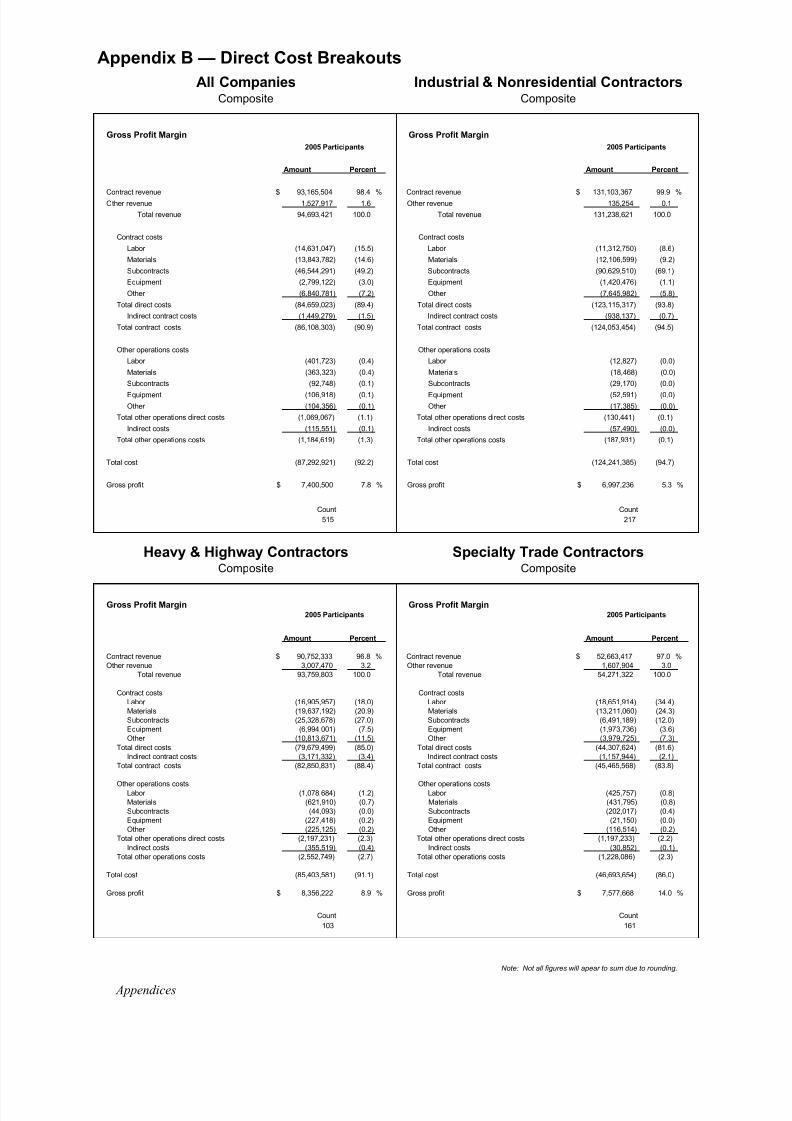
8/13/2019 2005 Financial Survey
http://slidepdf.com/reader/full/2005-financial-survey 259/284
Appendix B — Direct Cost Breakouts
Gross Profit Margin Gross Profit Margin
Amount Percent Amount Percent
Contract revenue $ 93,165,504 98.4 % Contract revenue $ 131,103,367 99.9 %
Other revenue 1,527,917 1.6 Other revenue 135,254 0.1
Total revenue 94,693,421 100.0 Total revenue 131,238,621 100.0
Contract costs Contract costs
Labor (14,631,047) (15.5) Labor (11,312,750) (8.6)
Materials (13,843,782) (14.6) Materials (12,106,599) (9.2)
Subcontracts (46,544,291) (49.2) Subcontracts (90,629,510) (69.1)
Equipment (2,799,122) (3.0) Equipment (1,420,476) (1.1)
Other (6,840,781) (7.2) Other (7,645,982) (5.8)
Total direct costs (84,659,023) (89.4) Total direct costs (123,115,317) (93.8)
Indirect contract costs (1,449,279) (1.5) Indirect contract costs (938,137) (0.7)
Total contract costs (86,108,303) (90.9) Total contract costs (124,053,454) (94.5)
Other operations costs Other operations costs
Labor (401,723) (0.4) Labor (12,827) (0.0)
Materials (363,323) (0.4) Materials (18,468) (0.0)
Subcontracts (92,748) (0.1) Subcontracts (29,170) (0.0)
Equipment (106,918) (0.1) Equipment (52,591) (0.0)
Other (104,356) (0.1) Other (17,385) (0.0)
Total other operations direct costs (1,069,067) (1.1) Total other operations direct costs (130,441) (0.1)
Indirect costs (115,551) (0.1) Indirect costs (57,490) (0.0)
Total other operations costs (1,184,619) (1.3) Total other operations costs (187,931) (0.1)
Total cost (87,292,921) (92.2) Total cost (124,241,385) (94.7)
Gross profit $ 7,400,500 7.8 % Gross profit $ 6,997,236 5.3 %
Count Count
515 217
Gross Profit Margin Gross Profit Margin
Amount Percent Amount Percent
Contract revenue $ 90,752,333 96.8 % Contract revenue $ 52,663,417 97.0 %Other revenue 3,007,470 3.2 Other revenue 1,607,904 3.0
Total revenue 93,759,803 100.0 Total revenue 54,271,322 100.0
Contract costs Contract costsLabor (16,905,957) (18.0) Labor (18,651,914) (34.4)Materials (19,637,192) (20.9) Materials (13,211,060) (24.3)Subcontracts (25,328,678) (27.0) Subcontracts (6,491,189) (12.0)Equipment (6,994,001) (7.5) Equipment (1,973,736) (3.6)Other (10,813,671) (11.5) Other (3,979,725) (7.3)
Total direct costs (79,679,499) (85.0) Total direct costs (44,307,624) (81.6)Indirect contract costs (3,171,332) (3.4) Indirect contract costs (1,157,944) (2.1)
Total contract costs (82,850,831) (88.4) Total contract costs (45,465,568) (83.8)
Other operations costs Other operations costsLabor (1,078,684) (1.2) Labor (425,757) (0.8)Materials (621,910) (0.7) Materials (431,795) (0.8)Subcontracts (44,093) (0.0) Subcontracts (202,017) (0.4)Equipment (227,418) (0.2) Equipment (21,150) (0.0)Other (225,125) (0.2) Other (116,514) (0.2)
Total other operations direct costs (2,197,231) (2.3) Total other operations direct costs (1,197,233) (2.2)
Indirect costs (355,519) (0.4) Indirect costs (30,852) (0.1)Total other operations costs (2,552,749) (2.7) Total other operations costs (1,228,086) (2.3)
Total cost (85,403,581) (91.1) Total cost (46,693,654) (86.0)
Gross profit $ 8,356,222 8.9 % Gross profit $ 7,577,668 14.0 %
Count Count
103 161
Composite Composite
All CompaniesComposite
Industrial & Nonresidential ContractorsComposite
Appendices
Note: Not all figures will apear to sum due to rounding.
2005 Participants 2005 Participants
2005 Participants 2005 Participants
Heavy & Highway Contractors Specialty Trade Contractors
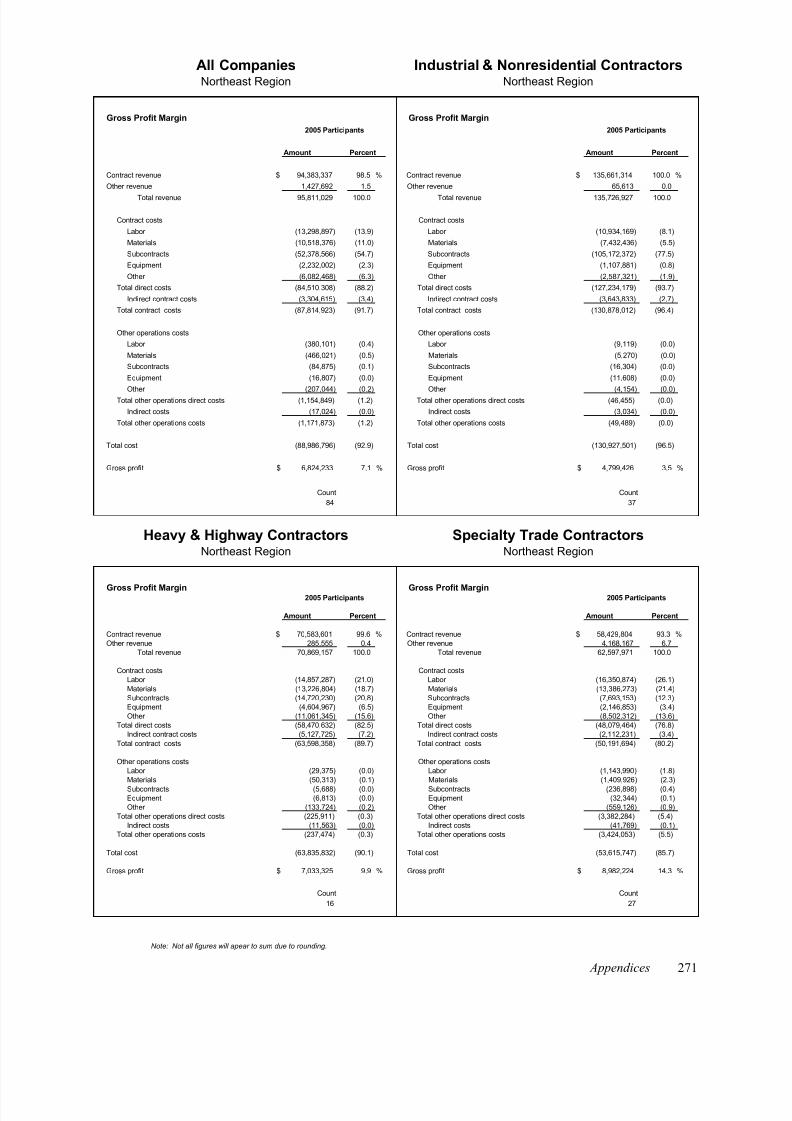
8/13/2019 2005 Financial Survey
http://slidepdf.com/reader/full/2005-financial-survey 260/284
Gross Profit Margin Gross Profit Margin
Amount Percent Amount Percent
Contract revenue $ 94,383,337 98.5 % Contract revenue $ 135,661,314 100.0 %
Other revenue 1,427,692 1.5 Other revenue 65,613 0.0
Total revenue 95,811,029 100.0 Total revenue 135,726,927 100.0
Contract costs Contract costs
Labor (13,298,897) (13.9) Labor (10,934,169) (8.1)
Materials (10,518,376) (11.0) Materials (7,432,436) (5.5)
Subcontracts (52,378,566) (54.7) Subcontracts (105,172,372) (77.5)
Equipment (2,232,002) (2.3) Equipment (1,107,881) (0.8)
Other (6,082,468) (6.3) Other (2,587,321) (1.9)
Total direct costs (84,510,308) (88.2) Total direct costs (127,234,179) (93.7)
Indirect contract costs (3,304,615) (3.4) Indirect contract costs (3,643,833) (2.7)
Total contract costs (87,814,923) (91.7) Total contract costs (130,878,012) (96.4)
Other operations costs Other operations costs
Labor (380,101) (0.4) Labor (9,119) (0.0)
Materials (466,021) (0.5) Materials (5,270) (0.0)
Subcontracts (84,875) (0.1) Subcontracts (16,304) (0.0)
Equipment (16,807) (0.0) Equipment (11,608) (0.0)
Other (207,044) (0.2) Other (4,154) (0.0)Total other operations direct costs (1,154,849) (1.2) Total other operations direct costs (46,455) (0.0)
Indirect costs (17,024) (0.0) Indirect costs (3,034) (0.0)
Total other operations costs (1,171,873) (1.2) Total other operations costs (49,489) (0.0)
Total cost (88,986,796) (92.9) Total cost (130,927,501) (96.5)
Gross profit $ 6,824,233 7.1 % Gross profit $ 4,799,426 3.5 %
Count Count
84 37
Gross Profit Margin Gross Profit Margin
Amount Percent Amount Percent
Contract revenue $ 70,583,601 99.6 % Contract revenue $ 58,429,804 93.3 %Other revenue 285,555 0.4 Other revenue 4,168,167 6.7
Total revenue 70,869,157 100.0 Total revenue 62,597,971 100.0
Contract costs Contract costsLabor (14,857,287) (21.0) Labor (16,350,874) (26.1)
Materials (13,226,804) (18.7) Materials (13,386,273) (21.4)Subcontracts (14,720,230) (20.8) Subcontracts (7,693,153) (12.3)Equipment (4,604,967) (6.5) Equipment (2,146,853) (3.4)Other (11,061,345) (15.6) Other (8,502,312) (13.6)
Total direct costs (58,470,632) (82.5) Total direct costs (48,079,464) (76.8)Indirect contract costs (5,127,725) (7.2) Indirect contract costs (2,112,231) (3.4)
Total contract costs (63,598,358) (89.7) Total contract costs (50,191,694) (80.2)
Other operations costs Other operations costsLabor (29,375) (0.0) Labor (1,143,990) (1.8)Materials (50,313) (0.1) Materials (1,409,926) (2.3)
Subcontracts (5,688) (0.0) Subcontracts (236,898) (0.4)Equipment (6,813) (0.0) Equipment (32,344) (0.1)Other (133,724) (0.2) Other (559,126) (0.9)
Total other operations direct costs (225,911) (0.3) Total other operations direct costs (3,382,284) (5.4)Indirect costs (11,563) (0.0) Indirect costs (41,769) (0.1)
Total other operations costs (237,474) (0.3) Total other operations costs (3,424,053) (5.5)
Total cost (63,835,832) (90.1) Total cost (53,615,747) (85.7)
Gross profit $ 7,033,325 9.9 % Gross profit $ 8,982,224 14.3 %
Count Count
16 27
2005 Participants 2005 Participants
2005 Participants 2005 Participants
Heavy & Highway Contractors Specialty Trade ContractorsNortheast Region Northeast Region
All CompaniesNortheast Region
Industrial & Nonresidential ContractorsNortheast Region
Note: Not all figures will apear to sum due to rounding.
Appendices 271

8/13/2019 2005 Financial Survey
http://slidepdf.com/reader/full/2005-financial-survey 261/284
Gross Profit Margin Gross Profit Margin
Amount Percent Amount Percent
Contract revenue $ 62,307,466 96.7 % Contract revenue $ 72,417,192 100.0 %
Other revenue 2,109,050 3.3 Other revenue 35,706 0.0
Total revenue 64,416,516 100.0 Total revenue 72,452,897 100.0
Contract costs Contract costs
Labor (8,917,415) (13.8) Labor (4,420,211) (6.1)
Materials (11,831,177) (18.4) Materials (7,561,533) (10.4)
Subcontracts (31,190,927) (48.4) Subcontracts (52,847,756) (72.9)
Equipment (2,052,130) (3.2) Equipment (506,011) (0.7)
Other (2,506,027) (3.9) Other (2,263,406) (3.1)
Total direct costs (56,497,676) (87.7) Total direct costs (67,598,917) (93.3)
Indirect contract costs (644,507) (1.0) Indirect contract costs (484,597) (0.7)
Total contract costs (57,142,184) (88.7) Total contract costs (68,083,514) (94.0)
Other operations costs Other operations costs
Labor (356,399) (0.6) Labor 0 0.0
Materials (609,034) (0.9) Materials 0 0.0
Subcontracts (19,244) (0.0) Subcontracts 0 0.0
Equipment (251,089) (0.4) Equipment 0 0.0
Other (115,056) (0.2) Other (2,284) (0.0)Total other operations direct costs (1,350,822) (2.1) Total other operations direct costs (2,284) (0.0)
Indirect costs (23,805) (0.0) Indirect costs (271) (0.0)
Total other operations costs (1,374,627) (2.1) Total other operations costs (2,555) (0.0)
Total cost (58,516,810) (90.8) Total cost (68,086,069) (94.0)
Gross profit $ 5,899,706 9.2 % Gross profit $ 4,366,828 6.0 %
Count Count
71 33
Gross Profit Margin Gross Profit Margin
Amount Percent Amount Percent
Contract revenue $ 48,032,296 96.5 % Contract revenue $ 52,072,965 97.1 %Other revenue 1,734,153 3.5 Other revenue 1,575,577 2.9
Total revenue 49,766,449 100.0 Total revenue 53,648,541 100.0
Contract costs Contract costsLabor (7,095,451) (14.3) Labor (16,169,410) (30.1)
Materials (13,738,928) (27.6) Materials (15,524,544) (28.9)Subcontracts (13,655,629) (27.4) Subcontracts (6,787,651) (12.7)Equipment (4,994,396) (10.0) Equipment (2,532,915) (4.7)Other (2,751,721) (5.5) Other (2,075,241) (3.9)
Total direct costs (42,236,124) (84.9) Total direct costs (43,089,761) (80.3)Indirect contract costs (393,934) (0.8) Indirect contract costs (1,209,957) (2.3)
Total contract costs (42,630,058) (85.7) Total contract costs (44,299,718) (82.6)
Other operations costs Other operations costsLabor (87,837) (0.2) Labor (399,671) (0.7)Materials (1,203,073) (2.4) Materials (518,119) (1.0)
Subcontracts (73,425) (0.1) Subcontracts (14,516) (0.0)Equipment (121,866) (0.2) Equipment (445) (0.0)Other (74,593) (0.1) Other (125,209) (0.2)
Total other operations direct costs (1,560,794) (3.1) Total other operations direct costs (1,057,960) (2.0)Indirect costs 11,504 0.0 Indirect costs (75,566) (0.1)
Total other operations costs (1,549,291) (3.1) Total other operations costs (1,133,526) (2.1)
Total cost (44,179,348) (88.8) Total cost (45,433,244) (84.7)
Gross profit $ 5,587,100 11.2 % Gross profit $ 8,215,297 15.3 %
Count Count
13 19
All Companies Industrial & Nonresidential ContractorsSoutheast Region Southeast Region
2005 Participants 2005 Participants
Heavy & Highway Contractors Specialty Trade ContractorsSoutheast Region Southeast Region
2005 Participants 2005 Participants
272 Appendices
Note: Not all figures will apear to sum due to rounding.

8/13/2019 2005 Financial Survey
http://slidepdf.com/reader/full/2005-financial-survey 262/284
Gross Profit Margin Gross Profit Margin
Amount Percent Amount Percent
Contract revenue $ 90,838,527 98.7 % Contract revenue $ 110,115,233 99.8 %
Other revenue 1,155,554 1.3 Other revenue 200,290 0.2
Total revenue 91,994,081 100.0 Total revenue 110,315,523 100.0
Contract costs Contract costs
Labor (16,735,300) (18.2) Labor (12,794,785) (11.6)
Materials (15,476,478) (16.8) Materials (12,510,198) (11.3)
Subcontracts (41,381,117) (45.0) Subcontracts (71,408,809) (64.7)
Equipment (3,550,915) (3.9) Equipment (1,554,642) (1.4)
Other (5,189,098) (5.6) Other (4,297,887) (3.9)
Total direct costs (82,332,908) (89.5) Total direct costs (102,566,320) (93.0)
Indirect contract costs (1,463,488) (1.6) Indirect contract costs (551,824) (0.5)
Total contract costs (83,796,397) (91.1) Total contract costs (103,118,145) (93.5)
Other operations costs Other operations costs
Labor (145,526) (0.2) Labor (18,836) (0.0)
Materials (304,117) (0.3) Materials (51,681) (0.0)
Subcontracts (31,311) (0.0) Subcontracts (58,181) (0.1)
Equipment (111,180) (0.1) Equipment (163,892) (0.1)
Other (96,064) (0.1) Other (8,880) (0.0)Total other operations direct costs (688,198) (0.7) Total other operations direct costs (301,470) (0.3)
Indirect costs (212,102) (0.2) Indirect costs (24,370) (0.0)
Total other operations costs (900,299) (1.0) Total other operations costs (325,840) (0.3)
Total cost (84,696,696) (92.1) Total cost (103,443,984) (93.8)
Gross profit $ 7,297,385 7.9 % Gross profit $ 6,871,539 6.2 %
Count Count
169 67
Gross Profit Margin Gross Profit Margin
Amount Percent Amount Percent
Contract revenue $ 173,092,758 97.5 % Contract revenue $ 39,101,826 98.7 %Other revenue 4,453,248 2.5 Other revenue 512,423 1.3
Total revenue 177,546,006 100.0 Total revenue 39,614,249 100.0
Contract costs Contract costsLabor (31,663,862) (17.8) Labor (15,293,791) (38.6)
Materials (37,480,793) (21.1) Materials (9,462,853) (23.9)Subcontracts (58,342,239) (32.9) Subcontracts (5,684,892) (14.4)Equipment (11,958,152) (6.7) Equipment (1,366,735) (3.5)Other (15,778,632) (8.9) Other (1,262,039) (3.2)
Total direct costs (155,223,677) (87.4) Total direct costs (33,070,311) (83.5)Indirect contract costs (4,936,351) (2.8) Indirect contract costs (955,187) (2.4)
Total contract costs (160,160,028) (90.2) Total contract costs (34,025,498) (85.9)
Other operations costs Other operations costsLabor (331,618) (0.2) Labor (208,079) (0.5)Materials (1,368,146) (0.8) Materials (112,653) (0.3)
Subcontracts (17,502) (0.0) Subcontracts (12,850) (0.0)Equipment (189,308) (0.1) Equipment (30,697) (0.1)Other (492,637) (0.3) Other (13,369) (0.0)
Total other operations direct costs (2,399,210) (1.4) Total other operations direct costs (377,649) (1.0)Indirect costs (1,120,266) (0.6) Indirect costs (5,376) (0.0)
Total other operations costs (3,519,476) (2.0) Total other operations costs (383,025) (1.0)
Total cost (163,679,504) (92.2) Total cost (34,408,522) (86.9)
Gross profit $ 13,866,502 7.8 % Gross profit $ 5,205,726 13.1 %
Count Count
30 61
All Companies Industrial & Nonresidential ContractorsMidwest Region Midwest Region
2005 Participants 2005 Participants
Heavy & Highway Contractors Specialty Trade ContractorsMidwest Region Midwest Region
2005 Participants 2005 Participants
Note: Not all figures will apear to sum due to rounding.
Appendices 273

8/13/2019 2005 Financial Survey
http://slidepdf.com/reader/full/2005-financial-survey 263/284
Gross Profit Margin Gross Profit Margin
Amount Percent Amount Percent
Contract revenue $ 168,072,596 99.3 % Contract revenue $ 239,478,035 99.9 %
Other revenue 1,219,198 0.7 Other revenue 185,914 0.1
Total revenue 169,291,794 100.0 Total revenue 239,663,950 100.0
Contract costs Contract costs
Labor (26,706,316) (15.8) Labor (21,136,898) (8.8)
Materials (24,957,172) (14.7) Materials (26,106,917) (10.9)
Subcontracts (94,554,687) (55.9) Subcontracts (173,510,980) (72.4)
Equipment (3,678,195) (2.2) Equipment (2,337,803) (1.0)
Other (5,087,804) (3.0) Other (4,188,870) (1.7)
Total direct costs (154,984,174) (91.5) Total direct costs (227,281,469) (94.8)
Indirect contract costs (1,216,306) (0.7) Indirect contract costs (385,329) (0.2)
Total contract costs (156,200,480) (92.3) Total contract costs (227,666,798) (95.0)
Other operations costs Other operations costs
Labor (178,624) (0.1) Labor (37,005) (0.0)
Materials (274,541) (0.2) Materials (10,933) (0.0)
Subcontracts (399,431) (0.2) Subcontracts (57,142) (0.0)
Equipment (22,110) (0.0) Equipment (62) (0.0)
Other 66,181 0.0 Other (3,827) (0.0)Total other operations direct costs (808,524) (0.5) Total other operations direct costs (108,970) (0.0)
Indirect costs (183,791) (0.1) Indirect costs (303,661) (0.1)
Total other operations costs (992,315) (0.6) Total other operations costs (412,631) (0.2)
Total cost (157,192,795) (92.9) Total cost (228,079,429) (95.2)
Gross profit $ 12,099,000 7.1 % Gross profit $ 11,584,521 4.8 %
Count Count
65 32
Gross Profit Margin Gross Profit Margin
Amount Percent Amount Percent
Contract revenue $ 67,943,567 99.7 % Contract revenue $ 115,125,380 97.1 %Other revenue 209,031 0.3 Other revenue 3,397,227 2.9
Total revenue 68,152,599 100.0 Total revenue 118,522,608 100.0
Contract costs Contract costsLabor (14,899,917) (21.9) Labor (47,017,236) (39.7)
Materials (17,983,975) (26.4) Materials (30,397,282) (25.6)Subcontracts (12,492,516) (18.3) Subcontracts (11,140,562) (9.4)Equipment (8,491,649) (12.5) Equipment (2,835,356) (2.4)Other (2,425,370) (3.6) Other (7,580,853) (6.4)
Total direct costs (56,293,427) (82.6) Total direct costs (98,971,289) (83.5)Indirect contract costs (3,164,551) (4.6) Indirect contract costs (1,240,320) (1.0)
Total contract costs (59,457,978) (87.2) Total contract costs (100,211,609) (84.6)
Other operations costs Other operations costsLabor 0 0.0 Labor (513,290) (0.4)Materials (431,496) (0.6) Materials (543,613) (0.5)
Subcontracts 0 0.0 Subcontracts (1,305,167) (1.1)Equipment (106,950) (0.2) Equipment 0 0.0Other 313,857 0.5 Other 20,510 0.0
Total other operations direct costs (224,588) (0.3) Total other operations direct costs (2,341,559) (2.0)Indirect costs 0 0.0 Indirect costs (57,458) (0.0)
Total other operations costs (224,588) (0.3) Total other operations costs (2,399,017) (2.0)
Total cost (59,682,566) (87.6) Total cost (102,610,626) (86.6)
Gross profit $ 8,470,033 12.4 % Gross profit $ 15,911,982 13.4 %
Count Count
13 18
All Companies Industrial & Nonresidential ContractorsSouthwest Region Southwest Region
2005 Participants 2005 Participants
Heavy & Highway Contractors Specialty Trade ContractorsSouthwest Region Southwest Region
2005 Participants 2005 Participants
274 Appendices
Note: Not all figures will apear to sum due to rounding.
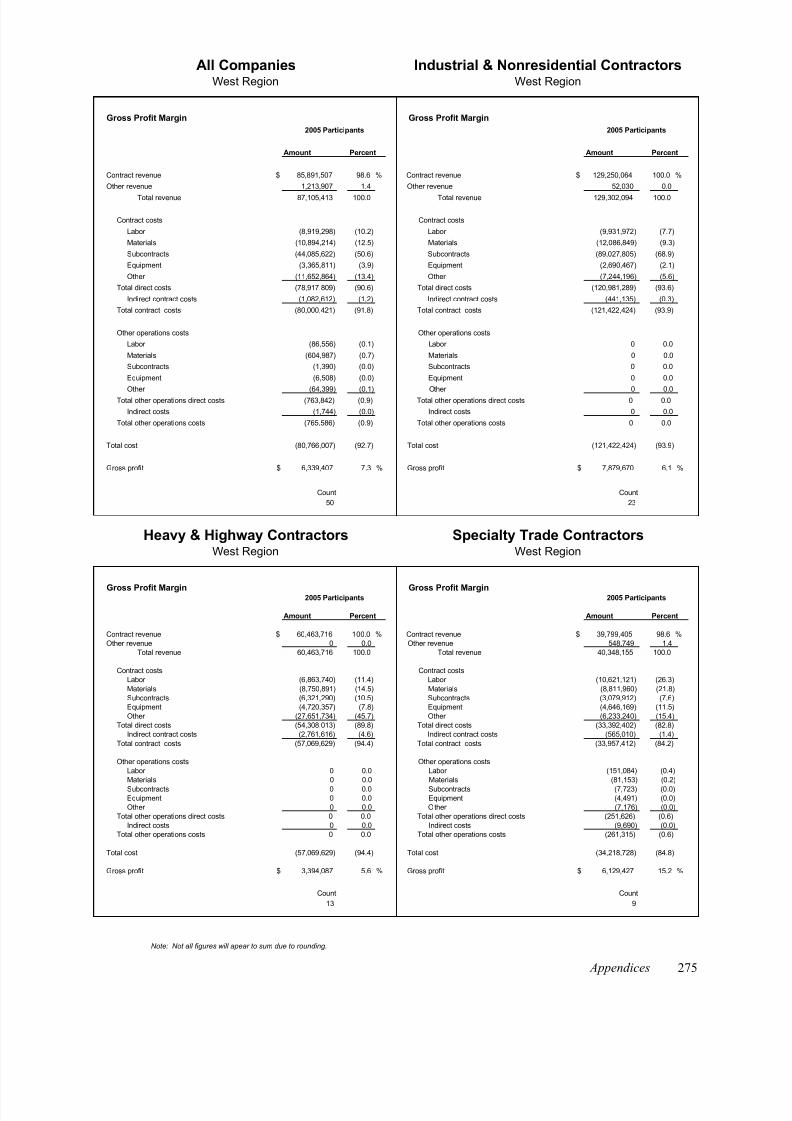
8/13/2019 2005 Financial Survey
http://slidepdf.com/reader/full/2005-financial-survey 264/284
Gross Profit Margin Gross Profit Margin
Amount Percent Amount Percent
Contract revenue $ 85,891,507 98.6 % Contract revenue $ 129,250,064 100.0 %
Other revenue 1,213,907 1.4 Other revenue 52,030 0.0
Total revenue 87,105,413 100.0 Total revenue 129,302,094 100.0
Contract costs Contract costs
Labor (8,919,298) (10.2) Labor (9,931,972) (7.7)
Materials (10,894,214) (12.5) Materials (12,086,849) (9.3)
Subcontracts (44,085,622) (50.6) Subcontracts (89,027,805) (68.9)
Equipment (3,365,811) (3.9) Equipment (2,690,467) (2.1)
Other (11,652,864) (13.4) Other (7,244,196) (5.6)
Total direct costs (78,917,809) (90.6) Total direct costs (120,981,289) (93.6)
Indirect contract costs (1,082,612) (1.2) Indirect contract costs (441,135) (0.3)
Total contract costs (80,000,421) (91.8) Total contract costs (121,422,424) (93.9)
Other operations costs Other operations costs
Labor (86,556) (0.1) Labor 0 0.0
Materials (604,987) (0.7) Materials 0 0.0
Subcontracts (1,390) (0.0) Subcontracts 0 0.0
Equipment (6,508) (0.0) Equipment 0 0.0
Other (64,399) (0.1) Other 0 0.0Total other operations direct costs (763,842) (0.9) Total other operations direct costs 0 0.0
Indirect costs (1,744) (0.0) Indirect costs 0 0.0
Total other operations costs (765,586) (0.9) Total other operations costs 0 0.0
Total cost (80,766,007) (92.7) Total cost (121,422,424) (93.9)
Gross profit $ 6,339,407 7.3 % Gross profit $ 7,879,670 6.1 %
Count Count
50 23
Gross Profit Margin Gross Profit Margin
Amount Percent Amount Percent
Contract revenue $ 60,463,716 100.0 % Contract revenue $ 39,799,405 98.6 %Other revenue 0 0.0 Other revenue 548,749 1.4
Total revenue 60,463,716 100.0 Total revenue 40,348,155 100.0
Contract costs Contract costsLabor (6,863,740) (11.4) Labor (10,621,121) (26.3)
Materials (8,750,891) (14.5) Materials (8,811,960) (21.8)Subcontracts (6,321,290) (10.5) Subcontracts (3,079,912) (7.6)Equipment (4,720,357) (7.8) Equipment (4,646,169) (11.5)Other (27,651,734) (45.7) Other (6,233,240) (15.4)
Total direct costs (54,308,013) (89.8) Total direct costs (33,392,402) (82.8)Indirect contract costs (2,761,616) (4.6) Indirect contract costs (565,010) (1.4)
Total contract costs (57,069,629) (94.4) Total contract costs (33,957,412) (84.2)
Other operations costs Other operations costsLabor 0 0.0 Labor (151,084) (0.4)Materials 0 0.0 Materials (81,153) (0.2)
Subcontracts 0 0.0 Subcontracts (7,723) (0.0)Equipment 0 0.0 Equipment (4,491) (0.0)Other 0 0.0 Other (7,176) (0.0)
Total other operations direct costs 0 0.0 Total other operations direct costs (251,626) (0.6)Indirect costs 0 0.0 Indirect costs (9,690) (0.0)
Total other operations costs 0 0.0 Total other operations costs (261,315) (0.6)
Total cost (57,069,629) (94.4) Total cost (34,218,728) (84.8)
Gross profit $ 3,394,087 5.6 % Gross profit $ 6,129,427 15.2 %
Count Count
13 9
All Companies Industrial & Nonresidential ContractorsWest Region West Region
2005 Participants 2005 Participants
Heavy & Highway Contractors Specialty Trade ContractorsWest Region West Region
2005 Participants 2005 Participants
Note: Not all figures will apear to sum due to rounding.
Appendices 275
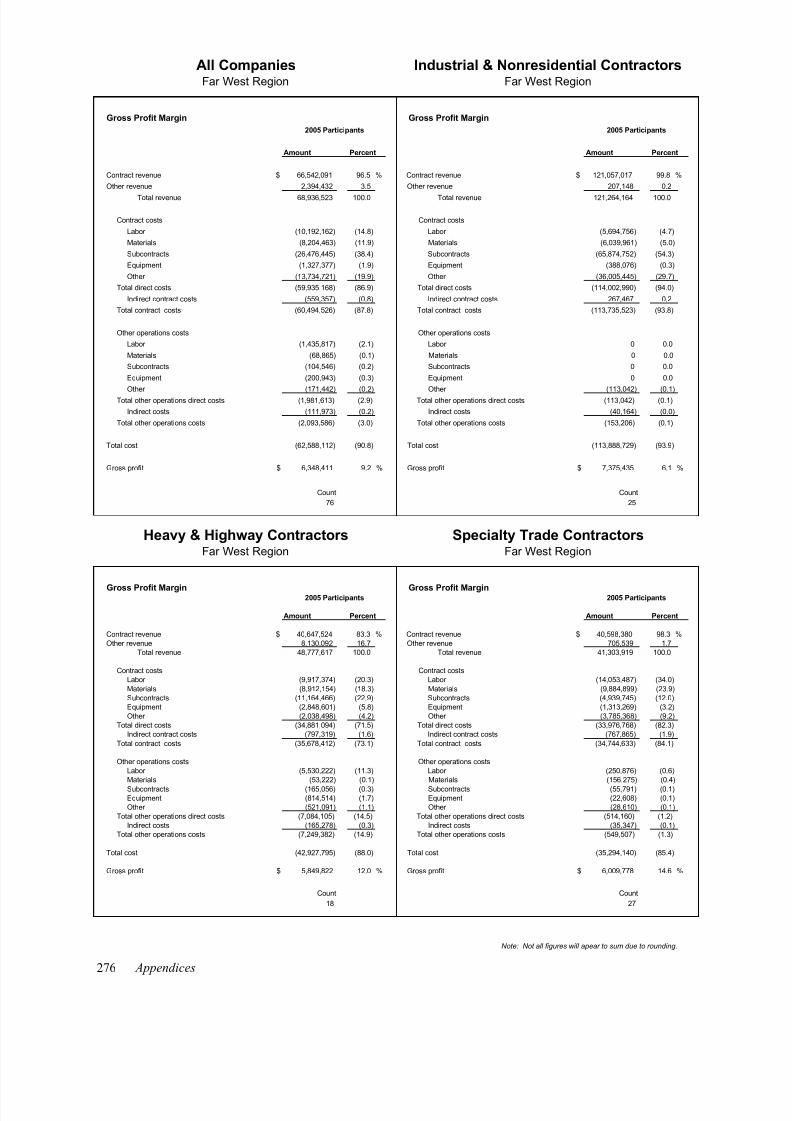
8/13/2019 2005 Financial Survey
http://slidepdf.com/reader/full/2005-financial-survey 265/284
Gross Profit Margin Gross Profit Margin
Amount Percent Amount Percent
Contract revenue $ 66,542,091 96.5 % Contract revenue $ 121,057,017 99.8 %
Other revenue 2,394,432 3.5 Other revenue 207,148 0.2
Total revenue 68,936,523 100.0 Total revenue 121,264,164 100.0
Contract costs Contract costs
Labor (10,192,162) (14.8) Labor (5,694,756) (4.7)
Materials (8,204,463) (11.9) Materials (6,039,961) (5.0)
Subcontracts (26,476,445) (38.4) Subcontracts (65,874,752) (54.3)
Equipment (1,327,377) (1.9) Equipment (388,076) (0.3)
Other (13,734,721) (19.9) Other (36,005,445) (29.7)
Total direct costs (59,935,168) (86.9) Total direct costs (114,002,990) (94.0)
Indirect contract costs (559,357) (0.8) Indirect contract costs 267,467 0.2
Total contract costs (60,494,526) (87.8) Total contract costs (113,735,523) (93.8)
Other operations costs Other operations costs
Labor (1,435,817) (2.1) Labor 0 0.0
Materials (68,865) (0.1) Materials 0 0.0
Subcontracts (104,546) (0.2) Subcontracts 0 0.0
Equipment (200,943) (0.3) Equipment 0 0.0
Other (171,442) (0.2) Other (113,042) (0.1)Total other operations direct costs (1,981,613) (2.9) Total other operations direct costs (113,042) (0.1)
Indirect costs (111,973) (0.2) Indirect costs (40,164) (0.0)
Total other operations costs (2,093,586) (3.0) Total other operations costs (153,206) (0.1)
Total cost (62,588,112) (90.8) Total cost (113,888,729) (93.9)
Gross profit $ 6,348,411 9.2 % Gross profit $ 7,375,435 6.1 %
Count Count
76 25
Gross Profit Margin Gross Profit Margin
Amount Percent Amount Percent
Contract revenue $ 40,647,524 83.3 % Contract revenue $ 40,598,380 98.3 %Other revenue 8,130,092 16.7 Other revenue 705,539 1.7
Total revenue 48,777,617 100.0 Total revenue 41,303,919 100.0
Contract costs Contract costsLabor (9,917,374) (20.3) Labor (14,053,487) (34.0)
Materials (8,912,154) (18.3) Materials (9,884,899) (23.9)Subcontracts (11,164,466) (22.9) Subcontracts (4,939,745) (12.0)Equipment (2,848,601) (5.8) Equipment (1,313,269) (3.2)Other (2,038,498) (4.2) Other (3,785,368) (9.2)
Total direct costs (34,881,094) (71.5) Total direct costs (33,976,768) (82.3)Indirect contract costs (797,319) (1.6) Indirect contract costs (767,865) (1.9)
Total contract costs (35,678,412) (73.1) Total contract costs (34,744,633) (84.1)
Other operations costs Other operations costsLabor (5,530,222) (11.3) Labor (250,876) (0.6)Materials (53,222) (0.1) Materials (156,275) (0.4)
Subcontracts (165,056) (0.3) Subcontracts (55,791) (0.1)Equipment (814,514) (1.7) Equipment (22,608) (0.1)Other (521,091) (1.1) Other (28,610) (0.1)
Total other operations direct costs (7,084,105) (14.5) Total other operations direct costs (514,160) (1.2)Indirect costs (165,278) (0.3) Indirect costs (35,347) (0.1)
Total other operations costs (7,249,382) (14.9) Total other operations costs (549,507) (1.3)
Total cost (42,927,795) (88.0) Total cost (35,294,140) (85.4)
Gross profit $ 5,849,822 12.0 % Gross profit $ 6,009,778 14.6 %
Count Count
18 27
All Companies Industrial & Nonresidential ContractorsFar West Region Far West Region
2005 Participants 2005 Participants
Heavy & Highway Contractors Specialty Trade ContractorsFar West Region Far West Region
2005 Participants 2005 Participants
276 Appendices
Note: Not all figures will apear to sum due to rounding.
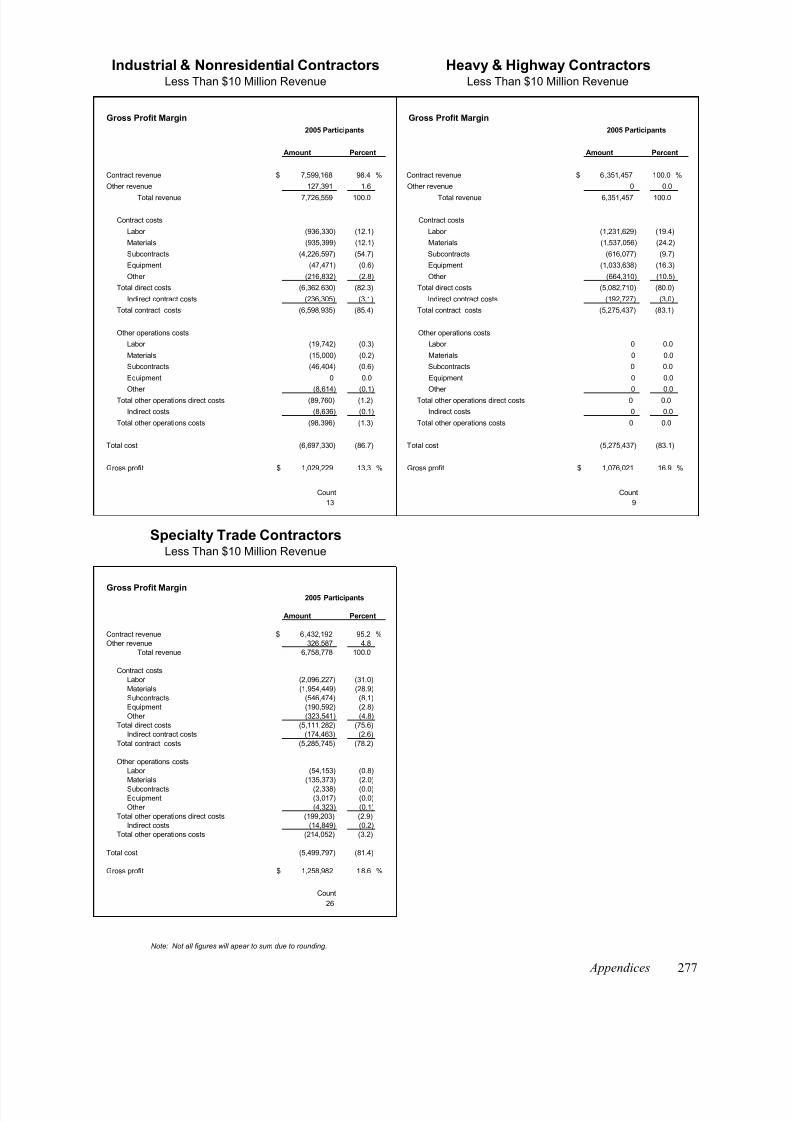
8/13/2019 2005 Financial Survey
http://slidepdf.com/reader/full/2005-financial-survey 266/284
Gross Profit Margin Gross Profit Margin
Amount Percent Amount Percent
Contract revenue $ 7,599,168 98.4 % Contract revenue $ 6,351,457 100.0 %
Other revenue 127,391 1.6 Other revenue 0 0.0
Total revenue 7,726,559 100.0 Total revenue 6,351,457 100.0
Contract costs Contract costs
Labor (936,330) (12.1) Labor (1,231,629) (19.4)
Materials (935,399) (12.1) Materials (1,537,056) (24.2)
Subcontracts (4,226,597) (54.7) Subcontracts (616,077) (9.7)
Equipment (47,471) (0.6) Equipment (1,033,638) (16.3)
Other (216,832) (2.8) Other (664,310) (10.5)
Total direct costs (6,362,630) (82.3) Total direct costs (5,082,710) (80.0)
Indirect contract costs (236,305) (3.1) Indirect contract costs (192,727) (3.0)
Total contract costs (6,598,935) (85.4) Total contract costs (5,275,437) (83.1)
Other operations costs Other operations costs
Labor (19,742) (0.3) Labor 0 0.0
Materials (15,000) (0.2) Materials 0 0.0
Subcontracts (46,404) (0.6) Subcontracts 0 0.0
Equipment 0 0.0 Equipment 0 0.0
Other (8,614) (0.1) Other 0 0.0Total other operations direct costs (89,760) (1.2) Total other operations direct costs 0 0.0
Indirect costs (8,636) (0.1) Indirect costs 0 0.0
Total other operations costs (98,396) (1.3) Total other operations costs 0 0.0
Total cost (6,697,330) (86.7) Total cost (5,275,437) (83.1)
Gross profit $ 1,029,229 13.3 % Gross profit $ 1,076,021 16.9 %
Count Count
13 9
Gross Profit Margin
Amount Percent
Contract revenue $ 6,432,192 95.2 %Other revenue 326,587 4.8
Total revenue 6,758,778 100.0
Contract costsLabor (2,096,227) (31.0)
Materials (1,954,449) (28.9)Subcontracts (546,474) (8.1)Equipment (190,592) (2.8)Other (323,541) (4.8)
Total direct costs (5,111,282) (75.6)Indirect contract costs (174,463) (2.6)
Total contract costs (5,285,745) (78.2)
Other operations costsLabor (54,153) (0.8)Materials (135,373) (2.0)
Subcontracts (2,338) (0.0)Equipment (3,017) (0.0)Other (4,323) (0.1)
Total other operations direct costs (199,203) (2.9)Indirect costs (14,849) (0.2)
Total other operations costs (214,052) (3.2)
Total cost (5,499,797) (81.4)
Gross profit $ 1,258,982 18.6 %
Count
26
Industrial & Nonresidential ContractorsLess Than $10 Million Revenue
Heavy & Highway ContractorsLess Than $10 Million Revenue
2005 Participants 2005 Participants
2005 Participants
Specialty Trade ContractorsLess Than $10 Million Revenue
Note: Not all figures will apear to sum due to rounding.
Appendices 277
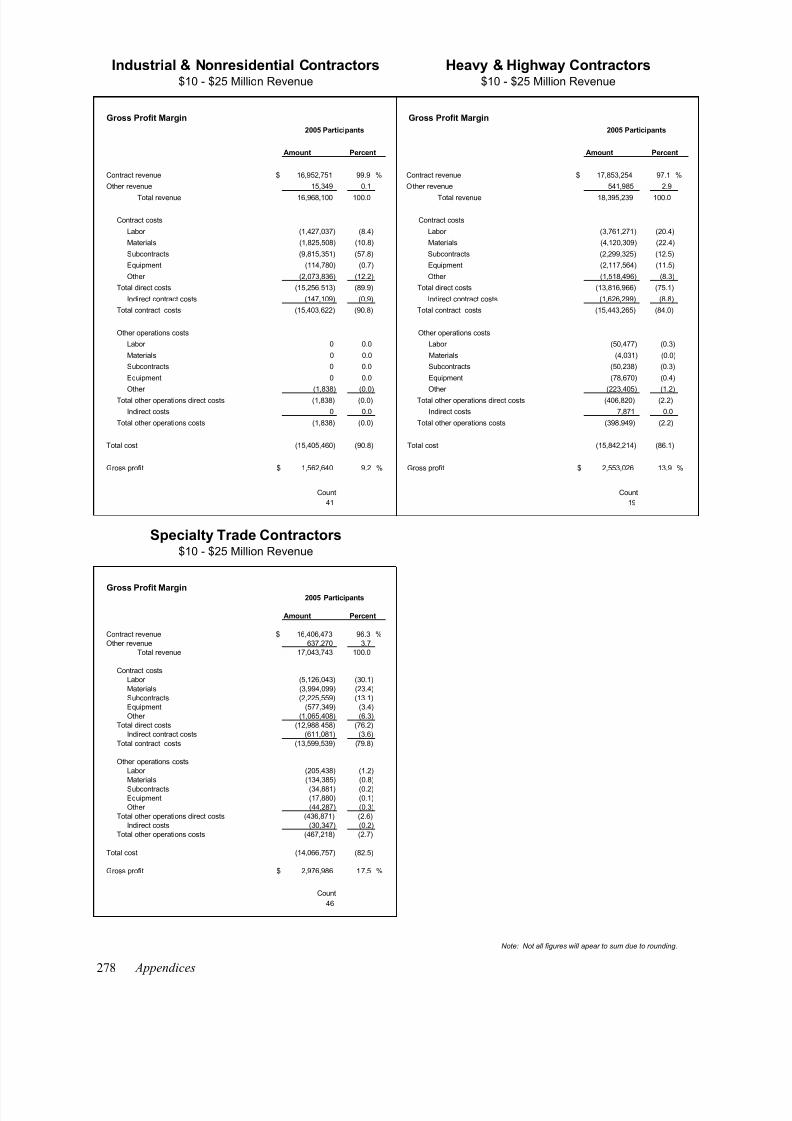
8/13/2019 2005 Financial Survey
http://slidepdf.com/reader/full/2005-financial-survey 267/284
Gross Profit Margin Gross Profit Margin
Amount Percent Amount Percent
Contract revenue $ 16,952,751 99.9 % Contract revenue $ 17,853,254 97.1 %
Other revenue 15,349 0.1 Other revenue 541,985 2.9
Total revenue 16,968,100 100.0 Total revenue 18,395,239 100.0
Contract costs Contract costs
Labor (1,427,037) (8.4) Labor (3,761,271) (20.4)
Materials (1,825,508) (10.8) Materials (4,120,309) (22.4)
Subcontracts (9,815,351) (57.8) Subcontracts (2,299,325) (12.5)
Equipment (114,780) (0.7) Equipment (2,117,564) (11.5)
Other (2,073,836) (12.2) Other (1,518,496) (8.3)
Total direct costs (15,256,513) (89.9) Total direct costs (13,816,966) (75.1)
Indirect contract costs (147,109) (0.9) Indirect contract costs (1,626,299) (8.8)
Total contract costs (15,403,622) (90.8) Total contract costs (15,443,265) (84.0)
Other operations costs Other operations costs
Labor 0 0.0 Labor (50,477) (0.3)
Materials 0 0.0 Materials (4,031) (0.0)
Subcontracts 0 0.0 Subcontracts (50,238) (0.3)
Equipment 0 0.0 Equipment (78,670) (0.4)
Other (1,838) (0.0) Other (223,405) (1.2)Total other operations direct costs (1,838) (0.0) Total other operations direct costs (406,820) (2.2)
Indirect costs 0 0.0 Indirect costs 7,871 0.0
Total other operations costs (1,838) (0.0) Total other operations costs (398,949) (2.2)
Total cost (15,405,460) (90.8) Total cost (15,842,214) (86.1)
Gross profit $ 1,562,640 9.2 % Gross profit $ 2,553,026 13.9 %
Count Count
41 19
Gross Profit Margin
Amount Percent
Contract revenue $ 16,406,473 96.3 %Other revenue 637,270 3.7
Total revenue 17,043,743 100.0
Contract costsLabor (5,126,043) (30.1)
Materials (3,994,099) (23.4)Subcontracts (2,225,559) (13.1)Equipment (577,349) (3.4)Other (1,065,408) (6.3)
Total direct costs (12,988,458) (76.2)Indirect contract costs (611,081) (3.6)
Total contract costs (13,599,539) (79.8)
Other operations costsLabor (205,438) (1.2)Materials (134,385) (0.8)
Subcontracts (34,881) (0.2)Equipment (17,880) (0.1)Other (44,287) (0.3)
Total other operations direct costs (436,871) (2.6)Indirect costs (30,347) (0.2)
Total other operations costs (467,218) (2.7)
Total cost (14,066,757) (82.5)
Gross profit $ 2,976,986 17.5 %
Count
46
Specialty Trade Contractors$10 - $25 Million Revenue
2005 Participants
2005 Participants 2005 Participants
Industrial & Nonresidential Contractors Heavy & Highway Contractors$10 - $25 Million Revenue $10 - $25 Million Revenue
278 Appendices
Note: Not all figures will apear to sum due to rounding.

8/13/2019 2005 Financial Survey
http://slidepdf.com/reader/full/2005-financial-survey 268/284
Gross Profit Margin Gross Profit Margin
Amount Percent Amount Percent
Contract revenue $ 37,525,004 99.5 % Contract revenue $ 37,010,046 99.3 %
Other revenue 178,193 0.5 Other revenue 251,791 0.7
Total revenue 37,703,196 100.0 Total revenue 37,261,837 100.0
Contract costs Contract costs
Labor (3,010,084) (8.0) Labor (7,925,548) (21.3)
Materials (3,838,386) (10.2) Materials (9,507,017) (25.5)
Subcontracts (24,999,793) (66.3) Subcontracts (8,339,711) (22.4)
Equipment (305,671) (0.8) Equipment (4,105,434) (11.0)
Other (1,830,885) (4.9) Other (2,173,217) (5.8)
Total direct costs (33,984,819) (90.1) Total direct costs (32,050,926) (86.0)
Indirect contract costs (454,108) (1.2) Indirect contract costs (487,655) (1.3)
Total contract costs (34,438,927) (91.3) Total contract costs (32,538,582) (87.3)
Other operations costs Other operations costs
Labor (15,917) (0.0) Labor (7,032) (0.0)
Materials (45,332) (0.1) Materials (302,495) (0.8)
Subcontracts (66,047) (0.2) Subcontracts 0 0.0
Equipment (188,651) (0.5) Equipment (56,919) (0.2)
Other (224) (0.0) Other 99,919 0.3Total other operations direct costs (316,172) (0.8) Total other operations direct costs (266,526) (0.7)
Indirect costs (42,202) (0.1) Indirect costs 0 0.0
Total other operations costs (358,375) (1.0) Total other operations costs (266,526) (0.7)
Total cost (34,797,301) (92.3) Total cost (32,805,108) (88.0)
Gross profit $ 2,905,895 7.7 % Gross profit $ 4,456,729 12.0 %
Count Count
58 26
Gross Profit Margin
Amount Percent
Contract revenue $ 34,433,535 98.6 %Other revenue 486,109 1.4
Total revenue 34,919,644 100.0
Contract costsLabor (12,503,545) (35.8)
Materials (8,855,679) (25.4)Subcontracts (4,231,157) (12.1)Equipment (1,479,654) (4.2)Other (1,420,759) (4.1)
Total direct costs (28,490,794) (81.6)Indirect contract costs (1,011,411) (2.9)
Total contract costs (29,502,205) (84.5)
Other operations costsLabor (112,329) (0.3)Materials (214,712) (0.6)
Subcontracts (5,492) (0.0)Equipment (1,139) (0.0)Other (41,188) (0.1)
Total other operations direct costs (374,859) (1.1)Indirect costs (10,776) (0.0)
Total other operations costs (385,635) (1.1)
Total cost (29,887,841) (85.6)
Gross profit $ 5,031,803 14.4 %
Count
35
Specialty Trade Contractors$25 - $50 Million Revenue
2005 Participants
2005 Participants 2005 Participants
Industrial & Nonresidential Contractors Heavy & Highway Contractors$25 - $50 Million Revenue $25 - $50 Million Revenue
Note: Not all figures will apear to sum due to rounding.
Appendices 279

8/13/2019 2005 Financial Survey
http://slidepdf.com/reader/full/2005-financial-survey 269/284
Gross Profit Margin Gross Profit Margin
Amount Percent Amount Percent
Contract revenue $ 66,995,477 99.8 % Contract revenue $ 67,516,472 99.0 %
Other revenue 123,516 0.2 Other revenue 651,697 1.0
Total revenue 67,118,993 100.0 Total revenue 68,168,169 100.0
Contract costs Contract costs
Labor (5,396,346) (8.0) Labor (16,534,269) (24.3)
Materials (6,650,302) (9.9) Materials (17,242,872) (25.3)
Subcontracts (45,076,373) (67.2) Subcontracts (14,359,866) (21.1)
Equipment (560,053) (0.8) Equipment (5,457,167) (8.0)
Other (4,390,977) (6.5) Other (3,381,555) (5.0)
Total direct costs (62,074,050) (92.5) Total direct costs (56,975,729) (83.6)
Indirect contract costs (1,735,740) (2.6) Indirect contract costs (2,487,393) (3.6)
Total contract costs (63,809,790) (95.1) Total contract costs (59,463,122) (87.2)
Other operations costs Other operations costs
Labor (9,757) (0.0) Labor 0 0.0
Materials (19,380) (0.0) Materials 0 0.0
Subcontracts (1,568) (0.0) Subcontracts 0 0.0
Equipment (10,894) (0.0) Equipment 0 0.0
Other (15,109) (0.0) Other (169,852) (0.2)Total other operations direct costs (56,708) (0.1) Total other operations direct costs (169,852) (0.2)
Indirect costs (4,606) (0.0) Indirect costs (342,432) (0.5)
Total other operations costs (61,314) (0.1) Total other operations costs (512,284) (0.8)
Total cost (63,871,105) (95.2) Total cost (59,975,406) (88.0)
Gross profit $ 3,247,888 4.8 % Gross profit $ 8,192,762 12.0 %
Count Count
43 27
Gross Profit Margin
Amount Percent
Contract revenue $ 61,051,181 93.9 %Other revenue 3,983,906 6.1
Total revenue 65,035,087 100.0
Contract costsLabor (19,524,534) (30.0)
Materials (14,740,635) (22.7)Subcontracts (7,103,266) (10.9)Equipment (3,435,682) (5.3)Other (6,389,112) (9.8)
Total direct costs (51,193,227) (78.7)Indirect contract costs (1,669,145) (2.6)
Total contract costs (52,862,373) (81.3)
Other operations costsLabor (1,485,093) (2.3)Materials (837,200) (1.3)
Subcontracts (143,115) (0.2)Equipment (88,013) (0.1)Other (596,646) (0.9)
Total other operat ions d irect costs (3,150,066) (4.8)Indirect costs (65,109) (0.1)
Total other operations costs (3,215,175) (4.9)
Total cost (56,077,548) (86.2)
Gross profit $ 8,957,539 13.8 %
Count
28
Specialty Trade Contractors$50 - $100 Million Revenue
2005 Participants
2005 Participants 2005 Participants
Industrial & Nonresidential Contractors Heavy & Highway Contractors$50 - $100 Million Revenue $50 - $100 Million Revenue
280 Appendices
Note: Not all figures will apear to sum due to rounding.
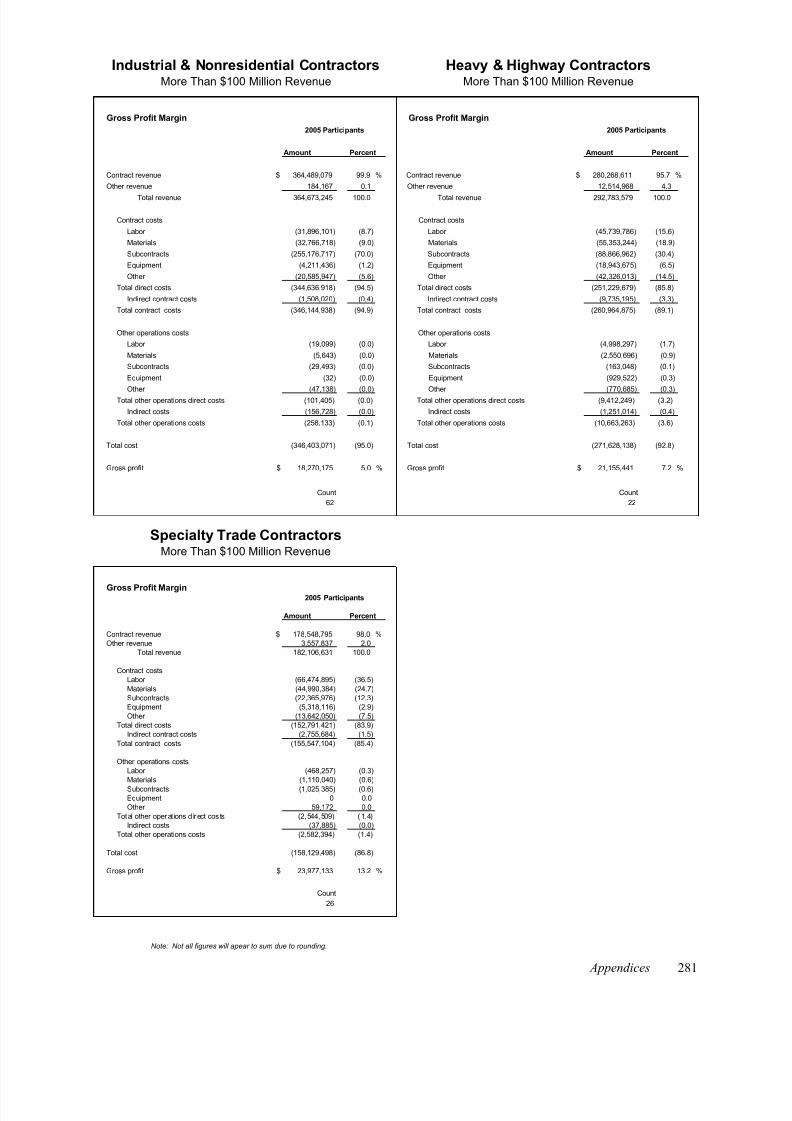
8/13/2019 2005 Financial Survey
http://slidepdf.com/reader/full/2005-financial-survey 270/284
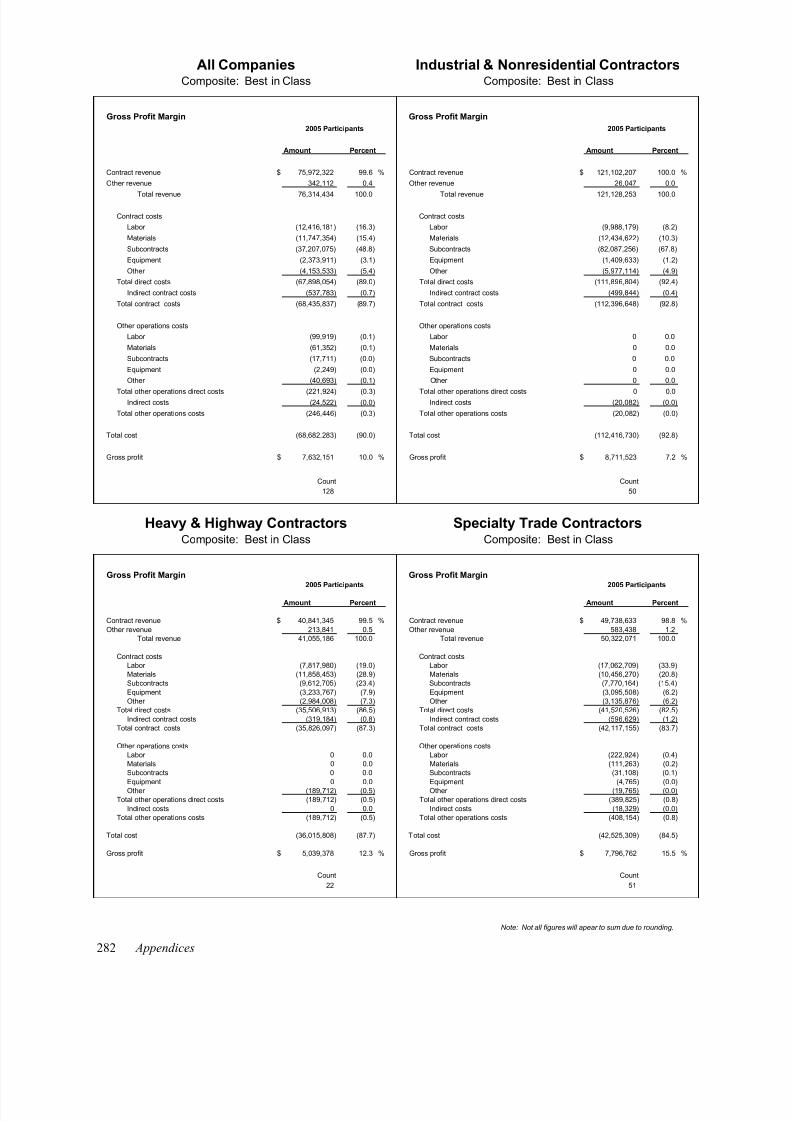
8/13/2019 2005 Financial Survey
http://slidepdf.com/reader/full/2005-financial-survey 271/284
Gross Profit Margin Gross Profit Margin
Amount Percent Amount Percent
Contract revenue $ 75,972,322 99.6 % Contract revenue $ 121,102,207 100.0 %
Other revenue 342,112 0.4 Other revenue 26,047 0.0
Total revenue 76,314,434 100.0 Total revenue 121,128,253 100.0
Contract costs Contract costs
Labor (12,416,181) (16.3) Labor (9,988,179) (8.2)
Materials (11,747,354) (15.4) Materials (12,434,622) (10.3)
Subcontracts (37,207,075) (48.8) Subcontracts (82,087,256) (67.8)
Equipment (2,373,911) (3.1) Equipment (1,409,633) (1.2)
Other (4,153,533) (5.4) Other (5,977,114) (4.9)
Total direct costs (67,898,054) (89.0) Total direct costs (111,896,804) (92.4)
Indirect contract costs (537,783) (0.7) Indirect contract costs (499,844) (0.4)
Total contract costs (68,435,837) (89.7) Total contract costs (112,396,648) (92.8)
Other operations costs Other operations costs
Labor (99,919) (0.1) Labor 0 0.0
Materials (61,352) (0.1) Materials 0 0.0
Subcontracts (17,711) (0.0) Subcontracts 0 0.0
Equipment (2,249) (0.0) Equipment 0 0.0
Other (40,693) (0.1) Other 0 0.0
Total other operations direct costs (221,924) (0.3) Total other operations direct costs 0 0.0Indirect costs (24,522) (0.0) Indirect costs (20,082) (0.0)
Total other operations costs (246,446) (0.3) Total other operations costs (20,082) (0.0)
Total cost (68,682,283) (90.0) Total cost (112,416,730) (92.8)
Gross profit $ 7,632,151 10.0 % Gross profit $ 8,711,523 7.2 %
Count Count
128 50
Gross Profit Margin Gross Profit Margin
Amount Percent Amount Percent
Contract revenue $ 40,841,345 99.5 % Contract revenue $ 49,738,633 98.8 %
Other revenue 213,841 0.5 Other revenue 583,438 1.2Total revenue 41,055,186 100.0 Total revenue 50,322,071 100.0
Contract costs Contract costsLabor (7,817,980) (19.0) Labor (17,062,709) (33.9)Materials (11,858,453) (28.9) Materials (10,456,270) (20.8)Subcontracts (9,612,705) (23.4) Subcontracts (7,770,164) (15.4)
Equipment (3,233,767) (7.9) Equipment (3,095,508) (6.2)Other (2,984,008) (7.3) Other (3,135,876) (6.2)
Total direct costs (35,506,913) (86.5) Total direct costs (41,520,526) (82.5)
Indirect contract costs (319,184) (0.8) Indirect contract costs (596,629) (1.2)Total contract costs (35,826,097) (87.3) Total contract costs (42,117,155) (83.7)
Other operations costs Other operations costsLabor 0 0.0 Labor (222,924) (0.4)Materials 0 0.0 Materials (111,263) (0.2)Subcontracts 0 0.0 Subcontracts (31,108) (0.1)
Equipment 0 0.0 Equipment (4,765) (0.0)Other (189,712) (0.5) Other (19,765) (0.0)
Total other operations direct costs (189,712) (0.5) Total other operations direct costs (389,825) (0.8)
Indirect costs 0 0.0 Indirect costs (18,329) (0.0)Total other operations costs (189,712) (0.5) Total other operations costs (408,154) (0.8)
Total cost (36,015,808) (87.7) Total cost (42,525,309) (84.5)
Gross profit $ 5,039,378 12.3 % Gross profit $ 7,796,762 15.5 %
Count Count
22 51
All CompaniesComposite: Best in Class
Industrial & Nonresidential ContractorsComposite: Best in Class
2005 Participants 2005 Participants
Heavy & Highway Contractors Specialty Trade ContractorsComposite: Best in Class Composite: Best in Class
2005 Participants 2005 Participants
282 Appendices
Note: Not all figures will apear to sum due to rounding.

8/13/2019 2005 Financial Survey
http://slidepdf.com/reader/full/2005-financial-survey 272/284
Gross Profit Margin Gross Profit Margin
Amount Percent Amount Percent
Contract revenue $ 24,641,301 99.0 % Contract revenue $ 26,223,234 99.8 %
Other revenue 243,983 1.0 Other revenue 44,908 0.2
Total revenue 24,885,284 100.0 Total revenue 26,268,142 100.0
Contract costs Contract costs
Labor (5,057,446) (20.3) Labor (2,344,602) (8.9)
Materials (4,441,466) (17.8) Materials (2,095,424) (8.0)
Subcontracts (9,193,865) (36.9) Subcontracts (18,068,882) (68.8)
Equipment (1,171,213) (4.7) Equipment (154,435) (0.6)
Other (1,072,604) (4.3) Other (830,394) (3.2)
Total direct costs (20,936,595) (84.1) Total direct costs (23,493,736) (89.4)
Indirect contract costs (480,231) (1.9) Indirect contract costs (331,509) (1.3)
Total contract costs (21,416,826) (86.1) Total contract costs (23,825,246) (90.7)
Other operations costs Other operations costs
Labor (57,287) (0.2) Labor 0 0.0
Materials (42,037) (0.2) Materials 0 0.0
Subcontracts (16,833) (0.1) Subcontracts 0 0.0
Equipment (3,000) (0.0) Equipment 0 0.0
Other (56,570) (0.2) Other 0 0.0
Total other operations direct costs (175,728) (0.7) Total other operations direct costs 0 0.0Indirect costs (14,631) (0.1) Indirect costs (34,624) (0.1)
Total other operations costs (190,359) (0.8) Total other operations costs (34,624) (0.1)
Total cost (21,607,184) (86.8) Total cost (23,859,870) (90.8)
Gross profit $ 3,278,100 13.2 % Gross profit $ 2,408,273 9.2 %
Count Count
81 29
Gross Profit Margin Gross Profit Margin
Amount Percent Amount Percent
Contract revenue $ 29,061,177 99.1 % Contract revenue $ 20,077,675 98.0 %
Other revenue 276,735 0.9 Other revenue 417,710 2.0Total revenue 29,337,912 100.0 Total revenue 20,495,385 100.0
Contract costs Contract costsLabor (6,389,481) (21.8) Labor (6,845,687) (33.4)Materials (6,819,388) (23.2) Materials (5,010,301) (24.4)Subcontracts (6,423,379) (21.9) Subcontracts (1,968,051) (9.6)
Equipment (3,024,566) (10.3) Equipment (1,170,373) (5.7)Other (2,244,951) (7.7) Other (654,751) (3.2)
Total direct costs (24,901,765) (84.9) Total direct costs (15,649,162) (76.4)
Indirect contract costs (338,483) (1.2) Indirect contract costs (731,241) (3.6)Total contract costs (25,240,248) (86.0) Total contract costs (16,380,404) (79.9)
Other operations costs Other operations costsLabor 0 0.0 Labor (137,714) (0.7)Materials 0 0.0 Materials (103,975) (0.5)Subcontracts 0 0.0 Subcontracts (41,391) (0.2)
Equipment 0 0.0 Equipment (7,595) (0.0)Other (245,509) (0.8) Other (12,704) (0.1)
Total other operations direct costs (245,509) (0.8) Total other operations direct costs (303,378) (1.5)
Indirect costs 0 0.0 Indirect costs (5,500) (0.0)Total other operations costs (245,509) (0.8) Total other operations costs (308,878) (1.5)
Total cost (25,485,757) (86.9) Total cost (16,689,281) (81.4)
Gross profit $ 3,852,155 13.1 % Gross profit $ 3,806,104 18.6 %
Count Count
17 32
2005 Participants 2005 Participants
Heavy & Highway Contractors Specialty Trade ContractorsLess Than $50 Million Revenue: Best in Class Less Than $50 Million Revenue: Best in Class
2005 Participants 2005 Participants
All Companies Industrial & Nonresidential ContractorsLess Than $50 Million Revenue: Best in Class Less Than $50 Million Revenue: Best in Class
Note: Not all figures will apear to sum due to rounding.
Appendices 283
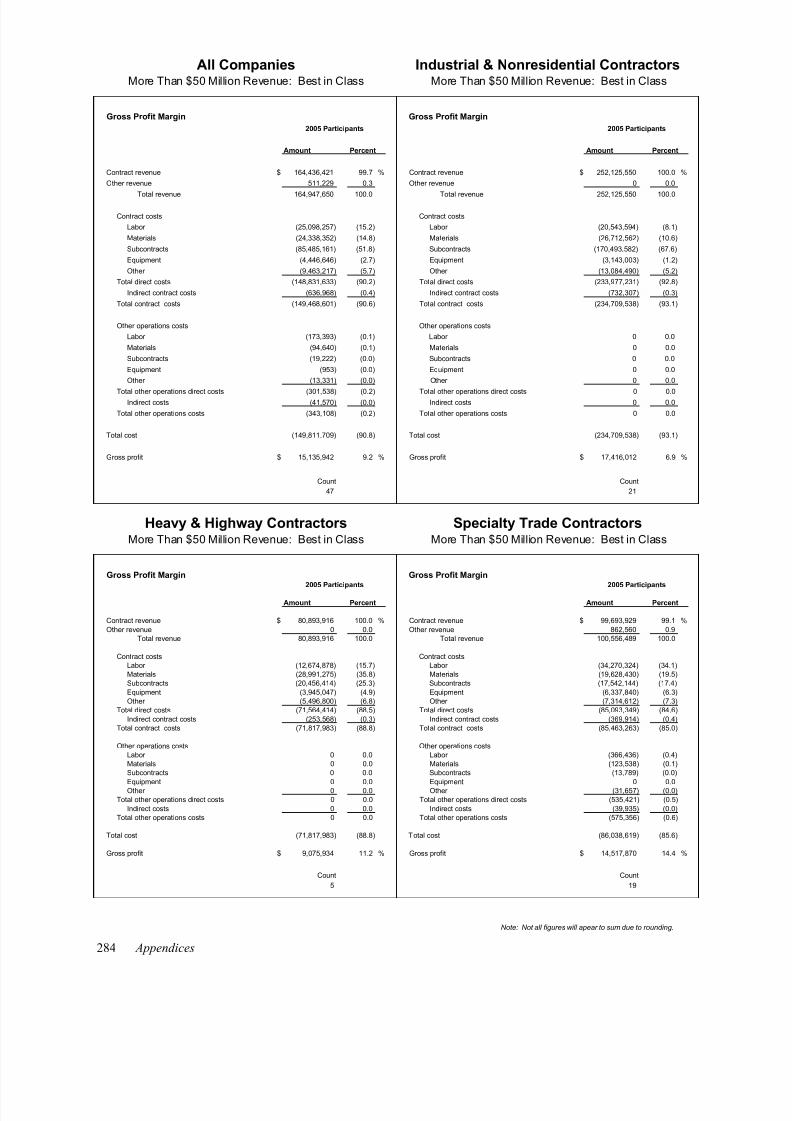
8/13/2019 2005 Financial Survey
http://slidepdf.com/reader/full/2005-financial-survey 273/284
Gross Profit Margin Gross Profit Margin
Amount Percent Amount Percent
Contract revenue $ 164,436,421 99.7 % Contract revenue $ 252,125,550 100.0 %
Other revenue 511,229 0.3 Other revenue 0 0.0
Total revenue 164,947,650 100.0 Total revenue 252,125,550 100.0
Contract costs Contract costs
Labor (25,098,257) (15.2) Labor (20,543,594) (8.1)
Materials (24,338,352) (14.8) Materials (26,712,562) (10.6)
Subcontracts (85,485,161) (51.8) Subcontracts (170,493,582) (67.6)
Equipment (4,446,646) (2.7) Equipment (3,143,003) (1.2)
Other (9,463,217) (5.7) Other (13,084,490) (5.2)
Total direct costs (148,831,633) (90.2) Total direct costs (233,977,231) (92.8)
Indirect contract costs (636,968) (0.4) Indirect contract costs (732,307) (0.3)
Total contract costs (149,468,601) (90.6) Total contract costs (234,709,538) (93.1)
Other operations costs Other operations costs
Labor (173,393) (0.1) Labor 0 0.0
Materials (94,640) (0.1) Materials 0 0.0
Subcontracts (19,222) (0.0) Subcontracts 0 0.0
Equipment (953) (0.0) Equipment 0 0.0
Other (13,331) (0.0) Other 0 0.0
Total other operations direct costs (301,538) (0.2) Total other operations direct costs 0 0.0Indirect costs (41,570) (0.0) Indirect costs 0 0.0
Total other operations costs (343,108) (0.2) Total other operations costs 0 0.0
Total cost (149,811,709) (90.8) Total cost (234,709,538) (93.1)
Gross profit $ 15,135,942 9.2 % Gross profit $ 17,416,012 6.9 %
Count Count
47 21
Gross Profit Margin Gross Profit Margin
Amount Percent Amount Percent
Contract revenue $ 80,893,916 100.0 % Contract revenue $ 99,693,929 99.1 %
Other revenue 0 0.0 Other revenue 862,560 0.9Total revenue 80,893,916 100.0 Total revenue 100,556,489 100.0
Contract costs Contract costsLabor (12,674,878) (15.7) Labor (34,270,324) (34.1)Materials (28,991,275) (35.8) Materials (19,628,430) (19.5)Subcontracts (20,456,414) (25.3) Subcontracts (17,542,144) (17.4)
Equipment (3,945,047) (4.9) Equipment (6,337,840) (6.3)Other (5,496,800) (6.8) Other (7,314,612) (7.3)
Total direct costs (71,564,414) (88.5) Total direct costs (85,093,349) (84.6)
Indirect contract costs (253,568) (0.3) Indirect contract costs (369,914) (0.4)Total contract costs (71,817,983) (88.8) Total contract costs (85,463,263) (85.0)
Other operations costs Other operations costsLabor 0 0.0 Labor (366,436) (0.4)Materials 0 0.0 Materials (123,538) (0.1)Subcontracts 0 0.0 Subcontracts (13,789) (0.0)
Equipment 0 0.0 Equipment 0 0.0Other 0 0.0 Other (31,657) (0.0)
Total other operations direct costs 0 0.0 Total other operations direct costs (535,421) (0.5)
Indirect costs 0 0.0 Indirect costs (39,935) (0.0)Total other operations costs 0 0.0 Total other operations costs (575,356) (0.6)
Total cost (71,817,983) (88.8) Total cost (86,038,619) (85.6)
Gross profit $ 9,075,934 11.2 % Gross profit $ 14,517,870 14.4 %
Count Count
5 19
2005 Participants 2005 Participants
Heavy & Highway Contractors Specialty Trade ContractorsMore Than $50 Million Revenue: Best in Class More Than $50 Million Revenue: Best in Class
2005 Participants 2005 Participants
All Companies Industrial & Nonresidential ContractorsMore Than $50 Million Revenue: Best in Class More Than $50 Million Revenue: Best in Class
284 Appendices
Note: Not all figures will apear to sum due to rounding.

8/13/2019 2005 Financial Survey
http://slidepdf.com/reader/full/2005-financial-survey 274/284
Gross Profit Margin Gross Profit Margin
Amount Percent Amount Percent
Contract revenue $ 58,201,054 96.0 % Contract revenue $ 69,319,656 95.7 %
Other revenue 2,422,361 4.0 Other revenue 3,132,922 4.3
Total revenue 60,623,415 100.0 Total revenue 72,452,577 100.0
Contract costs Contract costs
Labor (19,842,960) (32.7) Labor (24,888,541) (34.4)
Materials (13,761,977) (22.7) Materials (21,128,651) (29.2)
Subcontracts (10,051,644) (16.6) Subcontracts (7,190,424) (9.9)
Equipment (2,631,537) (4.3) Equipment (1,495,147) (2.1)
Other (3,587,375) (5.9) Other (4,195,261) (5.8)
Total direct costs (49,875,493) (82.3) Total direct costs (58,898,023) (81.3)
Indirect contract costs (987,968) (1.6) Indirect contract costs (1,307,325) (1.8)
Total contract costs (50,863,462) (83.9) Total contract costs (60,205,348) (83.1)
Other operations costs Other operations costs
Labor (703,127) (1.2) Labor (705,698) (1.0)
Materials (756,700) (1.2) Materials (864,263) (1.2)
Subcontracts (84,213) (0.1) Subcontracts (540,490) (0.7)
Equipment (42,046) (0.1) Equipment (16,457) (0.0)
Other (19,553) (0.0) Other (263,356) (0.4)Total other operations direct costs (1,605,639) (2.6) Total other operations direct costs (2,390,264) (3.3)
Indirect costs (66,686) (0.1) Indirect costs (22,201) (0.0)
Total other operations costs (1,672,325) (2.8) Total other operations costs (2,412,466) (3.3)
Total cost (52,535,787) (86.7) Total cost (62,617,814) (86.4)
Gross profit $ 8,087,628 13.3 % Gross profit $ 9,834,763 13.6 %
Count Count
56 55
Gross Profit Margin Gross Profit Margin
Amount Percent Amount Percent
Contract revenue $ 30,747,841 98.7 % Contract revenue $ 89,107,120 100.0 %Other revenue 407,122 1.3 Other revenue 34,033 0.0
Total revenue 31,154,963 100.0 Total revenue 89,141,153 100.0
Contract costs Contract costsLabor (8,946,394) (28.7) Labor (43,003,144) (48.2)
Materials (7,650,182) (24.6) Materials (18,831,270) (21.1)Subcontracts (4,223,594) (13.6) Subcontracts (9,767,264) (11.0)Equipment (832,883) (2.7) Equipment (1,635,935) (1.8)Other (2,830,904) (9.1) Other (2,963,410) (3.3)
Total direct costs (24,483,958) (78.6) Total direct costs (76,201,023) (85.5)Indirect contract costs (2,998,942) (9.6) Indirect contract costs (278,709) (0.3)
Total contract costs (27,482,899) (88.2) Total contract costs (76,479,732) (85.8)
Other operations costs Other operations costsLabor 0 0.0 Labor 0 0.0Materials (292,579) (0.9) Materials (26,501) (0.0)
Subcontracts 0 0.0 Subcontracts 0 0.0Equipment 0 0.0 Equipment 0 0.0Other 0 0.0 Other 0 0.0
Total other operations direct costs (292,579) (0.9) Total other operations direct costs (26,501) (0.0)Indirect costs 0 0.0 Indirect costs 0 0.0
Total other operations costs (292,579) (0.9) Total other operations costs (26,501) (0.0)
Total cost (27,775,478) (89.2) Total cost (76,506,234) (85.8)
Gross profit $ 3,379,484 10.8 % Gross profit $ 12,634,920 14.2 %
Count Count
7 17
Specialty Trade Contractors23511 Plumbing, Heating, and Air-Conditioning Contractors
Specialty Trade Contractors23531 Electrical Contractors
2005 Participants 2005 Participants
Specialty Trade Contractors Specialty Trade Contractors23541 Masonry and Stone Contractors 23542 Drywall, Plastering, Acoustical, and Insulation Contractors
2005 Participants 2005 Participants
Note: Not all figures will apear to sum due to rounding.
Appendices 285

8/13/2019 2005 Financial Survey
http://slidepdf.com/reader/full/2005-financial-survey 275/284
Gross Profit Margin Gross Profit Margin
Amount Percent Amount Percent
Contract revenue $ 41,603,144 98.2 % Contract revenue $ 64,658,498 97.8 %
Other revenue 771,319 1.8 Other revenue 1,455,778 2.2
Total revenue 42,374,463 100.0 Total revenue 66,114,276 100.0
Contract costs Contract costs
Labor (16,863,278) (39.8) Labor (24,721,163) (37.4)
Materials (10,080,764) (23.8) Materials (14,761,307) (22.3)
Subcontracts (5,630,687) (13.3) Subcontracts (9,401,009) (14.2)
Equipment (1,127,031) (2.7) Equipment (2,800,897) (4.2)
Other (955,861) (2.3) Other (4,922,419) (7.4)
Total direct costs (34,657,620) (81.8) Total direct costs (56,606,795) (85.6)
Indirect contract costs (384,173) (0.9) Indirect contract costs (1,620,095) (2.5)
Total contract costs (35,041,793) (82.7) Total contract costs (58,226,890) (88.1)
Other operations costs Other operations costs
Labor (345,202) (0.8) Labor 0 0.0
Materials (117,119) (0.3) Materials 0 0.0
Subcontracts (8,735) (0.0) Subcontracts (1,305,167) (2.0)
Equipment (11,077) (0.0) Equipment 0 0.0
Other (58,995) (0.1) Other 0 0.0Total other operations direct costs (541,128) (1.3) Total other operations direct costs (1,305,167) (2.0)
Indirect costs 0 0.0 Indirect costs (54,722) (0.1)
Total other operations costs (541,128) (1.3) Total other operations costs (1,359,889) (2.1)
Total cost (35,582,922) (84.0) Total cost (59,586,779) (90.1)
Gross profit $ 6,791,541 16.0 % Gross profit $ 6,527,497 9.9 %
Count Count
13 18
Gross Profit Margin Gross Profit Margin
Amount Percent Amount Percent
Contract revenue $ 64,141,500 96.3 % Contract revenue $ 86,974,678 100.0 %Other revenue 2,481,455 3.7 Other revenue 0 0.0
Total revenue 66,622,954 100.0 Total revenue 86,974,678 100.0
Contract costs Contract costsLabor (24,742,075) (37.1) Labor (32,097,990) (36.9)
Materials (11,343,644) (17.0) Materials (18,306,887) (21.0)Subcontracts (11,899,557) (17.9) Subcontracts (18,870,571) (21.7)Equipment (2,601,135) (3.9) Equipment (2,407,000) (2.8)Other (5,047,508) (7.6) Other (1,690,000) (1.9)
Total direct costs (55,633,920) (83.5) Total direct costs (73,372,448) (84.4)Indirect contract costs (2,083,663) (3.1) Indirect contract costs (4,201,520) (4.8)
Total contract costs (57,717,583) (86.6) Total contract costs (77,573,968) (89.2)
Other operations costs Other operations costsLabor (30,636) (0.0) Labor 0 0.0Materials (9,455) (0.0) Materials 0 0.0
Subcontracts (2,135,727) (3.2) Subcontracts 0 0.0Equipment (13,091) (0.0) Equipment 0 0.0Other (43,455) (0.1) Other 0 0.0
Total other operations direct costs (2,232,364) (3.4) Total other operations direct costs 0 0.0Indirect costs (94,021) (0.1) Indirect costs (24,618) (0.0)
Total other operations costs (2,326,385) (3.5) Total other operations costs (24,618) (0.0)
Total cost (60,043,968) (90.1) Total cost (77,598,585) (89.2)
Gross profit $ 6,578,987 9.9 % Gross profit $ 9,376,093 10.8 %
Count Count
11 2
2005 Participants 2005 Participants
Specialty Trade Contractors Specialty Trade Contractors23591 Structural Steel Erection Contractors 23592 Glass and Glazing Contractors
2005 Participants 2005 Participants
Specialty Trade Contractors Specialty Trade Contractors23561 Roofing, Siding, and Sheetmetal Contractors 23571 Concrete Contractors
286 Appendices
Note: Not all figures will apear to sum due to rounding.
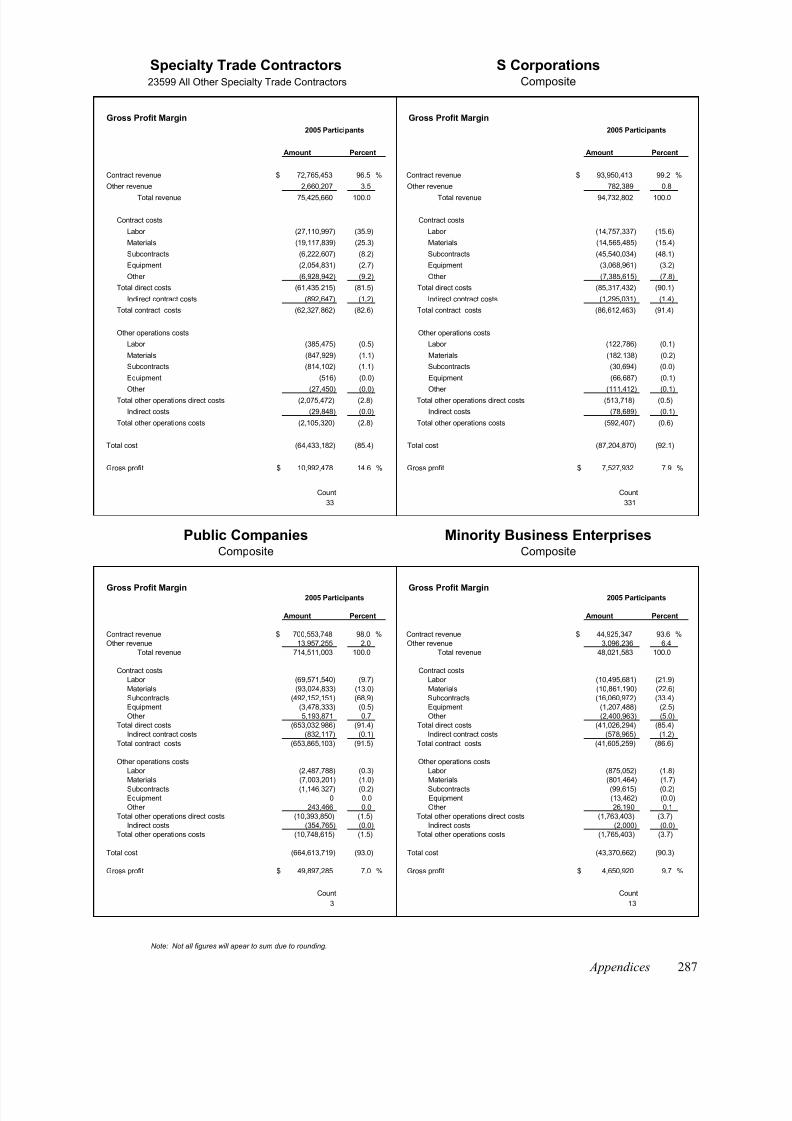
8/13/2019 2005 Financial Survey
http://slidepdf.com/reader/full/2005-financial-survey 276/284
Gross Profit Margin Gross Profit Margin
Amount Percent Amount Percent
Contract revenue $ 72,765,453 96.5 % Contract revenue $ 93,950,413 99.2 %
Other revenue 2,660,207 3.5 Other revenue 782,389 0.8
Total revenue 75,425,660 100.0 Total revenue 94,732,802 100.0
Contract costs Contract costs
Labor (27,110,997) (35.9) Labor (14,757,337) (15.6)
Materials (19,117,839) (25.3) Materials (14,565,485) (15.4)
Subcontracts (6,222,607) (8.2) Subcontracts (45,540,034) (48.1)
Equipment (2,054,831) (2.7) Equipment (3,068,961) (3.2)
Other (6,928,942) (9.2) Other (7,385,615) (7.8)
Total direct costs (61,435,215) (81.5) Total direct costs (85,317,432) (90.1)
Indirect contract costs (892,647) (1.2) Indirect contract costs (1,295,031) (1.4)
Total contract costs (62,327,862) (82.6) Total contract costs (86,612,463) (91.4)
Other operations costs Other operations costs
Labor (385,475) (0.5) Labor (122,786) (0.1)
Materials (847,929) (1.1) Materials (182,138) (0.2)
Subcontracts (814,102) (1.1) Subcontracts (30,694) (0.0)
Equipment (516) (0.0) Equipment (66,687) (0.1)
Other (27,450) (0.0) Other (111,412) (0.1)Total other operations direct costs (2,075,472) (2.8) Total other operations direct costs (513,718) (0.5)
Indirect costs (29,848) (0.0) Indirect costs (78,689) (0.1)
Total other operations costs (2,105,320) (2.8) Total other operations costs (592,407) (0.6)
Total cost (64,433,182) (85.4) Total cost (87,204,870) (92.1)
Gross profit $ 10,992,478 14.6 % Gross profit $ 7,527,932 7.9 %
Count Count
33 331
Gross Profit Margin Gross Profit Margin
Amount Percent Amount Percent
Contract revenue $ 700,553,748 98.0 % Contract revenue $ 44,925,347 93.6 %Other revenue 13,957,255 2.0 Other revenue 3,096,236 6.4
Total revenue 714,511,003 100.0 Total revenue 48,021,583 100.0
Contract costs Contract costsLabor (69,571,540) (9.7) Labor (10,495,681) (21.9)
Materials (93,024,833) (13.0) Materials (10,861,190) (22.6)Subcontracts (492,152,151) (68.9) Subcontracts (16,060,972) (33.4)Equipment (3,478,333) (0.5) Equipment (1,207,488) (2.5)Other 5,193,871 0.7 Other (2,400,963) (5.0)
Total direct costs (653,032,986) (91.4) Total direct costs (41,026,294) (85.4)Indirect contract costs (832,117) (0.1) Indirect contract costs (578,965) (1.2)
Total contract costs (653,865,103) (91.5) Total contract costs (41,605,259) (86.6)
Other operations costs Other operations costsLabor (2,487,788) (0.3) Labor (875,052) (1.8)Materials (7,003,201) (1.0) Materials (801,464) (1.7)
Subcontracts (1,146,327) (0.2) Subcontracts (99,615) (0.2)Equipment 0 0.0 Equipment (13,462) (0.0)Other 243,466 0.0 Other 26,190 0.1
Total other operations direct costs (10,393,850) (1.5) Total other operations direct costs (1,763,403) (3.7)Indirect costs (354,765) (0.0) Indirect costs (2,000) (0.0)
Total other operations costs (10,748,615) (1.5) Total other operations costs (1,765,403) (3.7)
Total cost (664,613,719) (93.0) Total cost (43,370,662) (90.3)
Gross profit $ 49,897,285 7.0 % Gross profit $ 4,650,920 9.7 %
Count Count
3 13
2005 Participants 2005 Participants
Public Companies Minority Business EnterprisesComposite Composite
2005 Participants 2005 Participants
Specialty Trade Contractors S Corporations23599 All Other Specialty Trade Contractors Composite
Note: Not all figures will apear to sum due to rounding.
Appendices 287
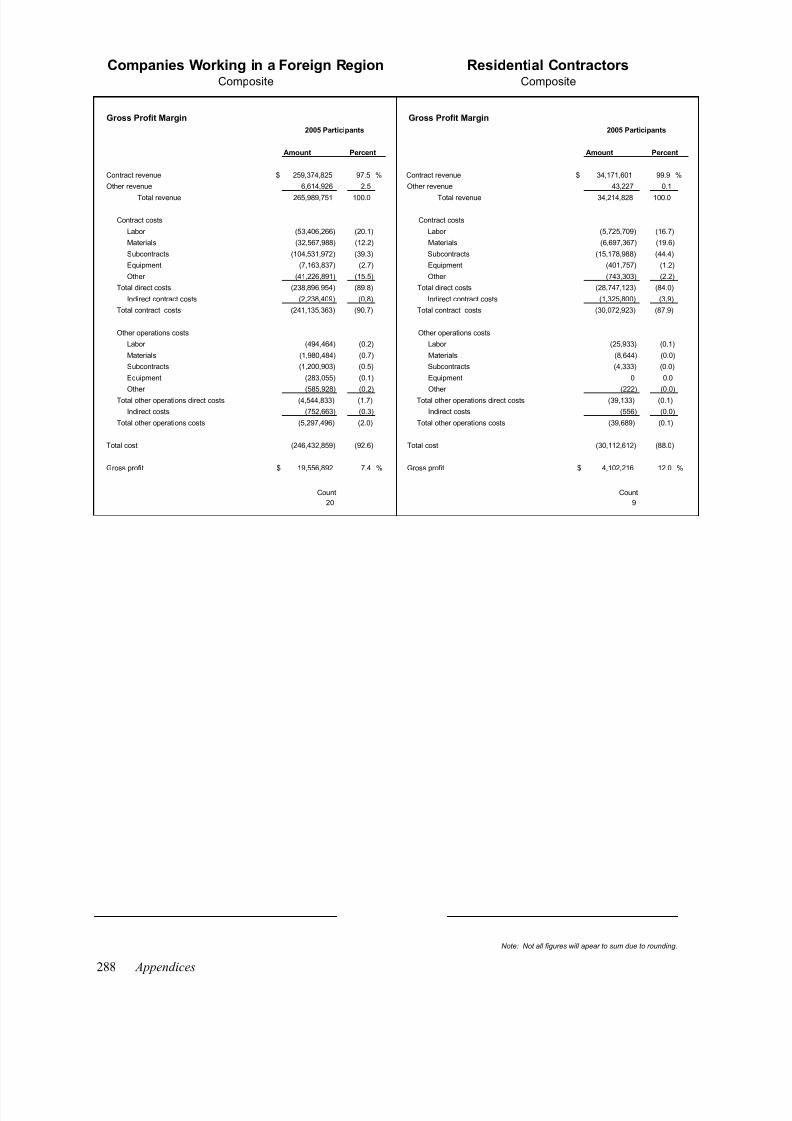
8/13/2019 2005 Financial Survey
http://slidepdf.com/reader/full/2005-financial-survey 277/284
Gross Profit Margin Gross Profit Margin
Amount Percent Amount Percent
Contract revenue $ 259,374,825 97.5 % Contract revenue $ 34,171,601 99.9 %
Other revenue 6,614,926 2.5 Other revenue 43,227 0.1
Total revenue 265,989,751 100.0 Total revenue 34,214,828 100.0
Contract costs Contract costs
Labor (53,406,266) (20.1) Labor (5,725,709) (16.7)
Materials (32,567,988) (12.2) Materials (6,697,367) (19.6)
Subcontracts (104,531,972) (39.3) Subcontracts (15,178,988) (44.4)
Equipment (7,163,837) (2.7) Equipment (401,757) (1.2)
Other (41,226,891) (15.5) Other (743,303) (2.2)
Total direct costs (238,896,954) (89.8) Total direct costs (28,747,123) (84.0)
Indirect contract costs (2,238,409) (0.8) Indirect contract costs (1,325,800) (3.9)
Total contract costs (241,135,363) (90.7) Total contract costs (30,072,923) (87.9)
Other operations costs Other operations costs
Labor (494,464) (0.2) Labor (25,933) (0.1)
Materials (1,980,484) (0.7) Materials (8,644) (0.0)
Subcontracts (1,200,903) (0.5) Subcontracts (4,333) (0.0)
Equipment (283,055) (0.1) Equipment 0 0.0
Other (585,928) (0.2) Other (222) (0.0)Total other operations direct costs (4,544,833) (1.7) Total other operations direct costs (39,133) (0.1)
Indirect costs (752,663) (0.3) Indirect costs (556) (0.0)
Total other operations costs (5,297,496) (2.0) Total other operations costs (39,689) (0.1)
Total cost (246,432,859) (92.6) Total cost (30,112,612) (88.0)
Gross profit $ 19,556,892 7.4 % Gross profit $ 4,102,216 12.0 %
Count Count
20 9
2005 Participants 2005 Participants
Companies Working in a Foreign Region Residential ContractorsComposite Composite
288 Appendices
Note: Not all figures will apear to sum due to rounding.

8/13/2019 2005 Financial Survey
http://slidepdf.com/reader/full/2005-financial-survey 278/284
Note: Not all figures will appear to sum due to rounding. Appendices
Appendix C — Definitions of Key Terms COMPOSITE FINANCIAL DATA
This financial data includes balance sheets, statements of earnings, and financial ratios. The balance sheets andstatements of earnings represent an average of all companies included in each classification. Percentages are
presented for each dollar amount in the financial statements. Due to rounding, the totals may not agree to the sum of
various accounts. Such variations are few and insignificant.
The financial ratios are calculated from the composite balance sheets and statements of earnings data. They are not
averages of ratios for all companies included in the classification, except where specifically indicated.
AVERAGE FINANCIAL RATIOS
Certain financial ratios included in the survey represent the simple average of those ratios for each company
reporting financial information in the survey. These ratios are not calculated from the composite financial
information because the elements needed to calculate the ratio were not compiled on a composite basis. These ratios
are labeled “average” and include Backlog to Equity, Backlog to Working Capital, and Months in Backlog.
TYPE OF CONTRACTOR
The survey respondents were classified into three categories of construction based on the type of work performed.
Classification was based on the level of contract volume completed for various SIC codes. A contractor was
included in a classification if the majority of its annual contract revenue was completed within that classification.
The classifications and SIC codes included for each are as follows:
1987 Standard Industrial
Classification (SIC) Codes
1997 North American Industrial
Classification (NAIC) Codes
INDUSTRIAL & NONRESIDENTIAL CONTRACTORS
1541 General Contractors - Industrial Buildingsand Warehouses
23332 Commercial and Institutional BuildingConstruction
23331 Manufacturing and Light Industrial BuildingConstruction (Except Warehouse Construction)
1542 General Contractors - NonresidentialBuildings
HEAVY & HIGHWAY CONTRACTORS
1611 Highway and Street Construction (ExceptElevated Highways)
23411 Highway and Street Construction
1622 Bridge, Tunnel, and Elevated Highway
Construction
23412 Bridge and Tunnel Construction
1623 Water, Sewer, Pipeline, andCommunications, Power Line Construction
23491 Water, Sewer, and Pipeline Construction
23492 Power and Communication Transmission LineConstruction
1629 Heavy Construction, NEC 23493 Industrial Non-Building Structure Construction
23499 All Other Heavy Construction
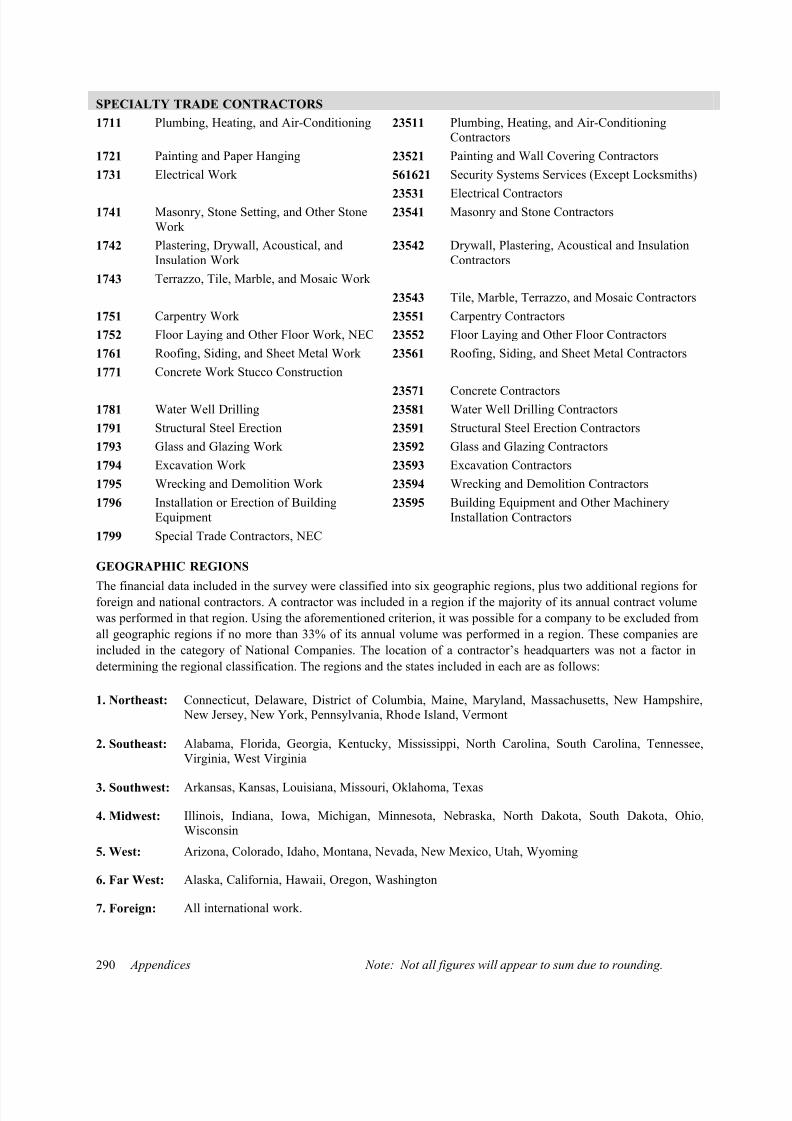
8/13/2019 2005 Financial Survey
http://slidepdf.com/reader/full/2005-financial-survey 279/284
Appendices Note: Not all figures will appear to sum due to rounding.290
SPECIALTY TRADE CONTRACTORS
1711 Plumbing, Heating, and Air-Conditioning 23511 Plumbing, Heating, and Air-ConditioningContractors
1721 Painting and Paper Hanging 23521 Painting and Wall Covering Contractors
1731 Electrical Work 561621 Security Systems Services (Except Locksmiths)
23531 Electrical Contractors1741 Masonry, Stone Setting, and Other Stone
Work23541 Masonry and Stone Contractors
1742 Plastering, Drywall, Acoustical, andInsulation Work
23542 Drywall, Plastering, Acoustical and InsulationContractors
1743 Terrazzo, Tile, Marble, and Mosaic Work
23543 Tile, Marble, Terrazzo, and Mosaic Contractors
1751 Carpentry Work 23551 Carpentry Contractors
1752 Floor Laying and Other Floor Work, NEC 23552 Floor Laying and Other Floor Contractors
1761 Roofing, Siding, and Sheet Metal Work 23561 Roofing, Siding, and Sheet Metal Contractors
1771 Concrete Work Stucco Construction
23571 Concrete Contractors1781 Water Well Drilling 23581 Water Well Drilling Contractors
1791 Structural Steel Erection 23591 Structural Steel Erection Contractors
1793 Glass and Glazing Work 23592 Glass and Glazing Contractors
1794 Excavation Work 23593 Excavation Contractors
1795 Wrecking and Demolition Work 23594 Wrecking and Demolition Contractors
1796 Installation or Erection of BuildingEquipment
23595 Building Equipment and Other MachineryInstallation Contractors
1799 Special Trade Contractors, NEC
GEOGRAPHIC REGIONS
The financial data included in the survey were classified into six geographic regions, plus two additional regions forforeign and national contractors. A contractor was included in a region if the majority of its annual contract volume
was performed in that region. Using the aforementioned criterion, it was possible for a company to be excluded from
all geographic regions if no more than 33% of its annual volume was performed in a region. These companies are
included in the category of National Companies. The location of a contractor’s headquarters was not a factor in
determining the regional classification. The regions and the states included in each are as follows:
1. Northeast: Connecticut, Delaware, District of Columbia, Maine, Maryland, Massachusetts, New Hampshire, New Jersey, New York, Pennsylvania, Rhode Island, Vermont
2. Southeast: Alabama, Florida, Georgia, Kentucky, Mississippi, North Carolina, South Carolina, Tennessee,Virginia, West Virginia
3. Southwest: Arkansas, Kansas, Louisiana, Missouri, Oklahoma, Texas
4. Midwest: Illinois, Indiana, Iowa, Michigan, Minnesota, Nebraska, North Dakota, South Dakota, Ohio,Wisconsin
5. West: Arizona, Colorado, Idaho, Montana, Nevada, New Mexico, Utah, Wyoming
6. Far West: Alaska, California, Hawaii, Oregon, Washington
7. Foreign: All international work.
8/13/2019 2005 Financial Survey
http://slidepdf.com/reader/full/2005-financial-survey 280/284
Note: Not all figures will appear to sum due to rounding. Appendices 291
8. National: Contractors performing less than one-third of their annual contract volume in any one geographicregion.
NUMBER OF COMPANIES
This term represents the number of companies included in a given classification, such as a geographic region or typeof contractor. Because of the criteria used to determine classifications, there may be situations where the sum of the
number of companies in a classification exceeds the total for all companies in that classification. This situation does
not materially distort the analysis of data or conclusions stated in the survey.
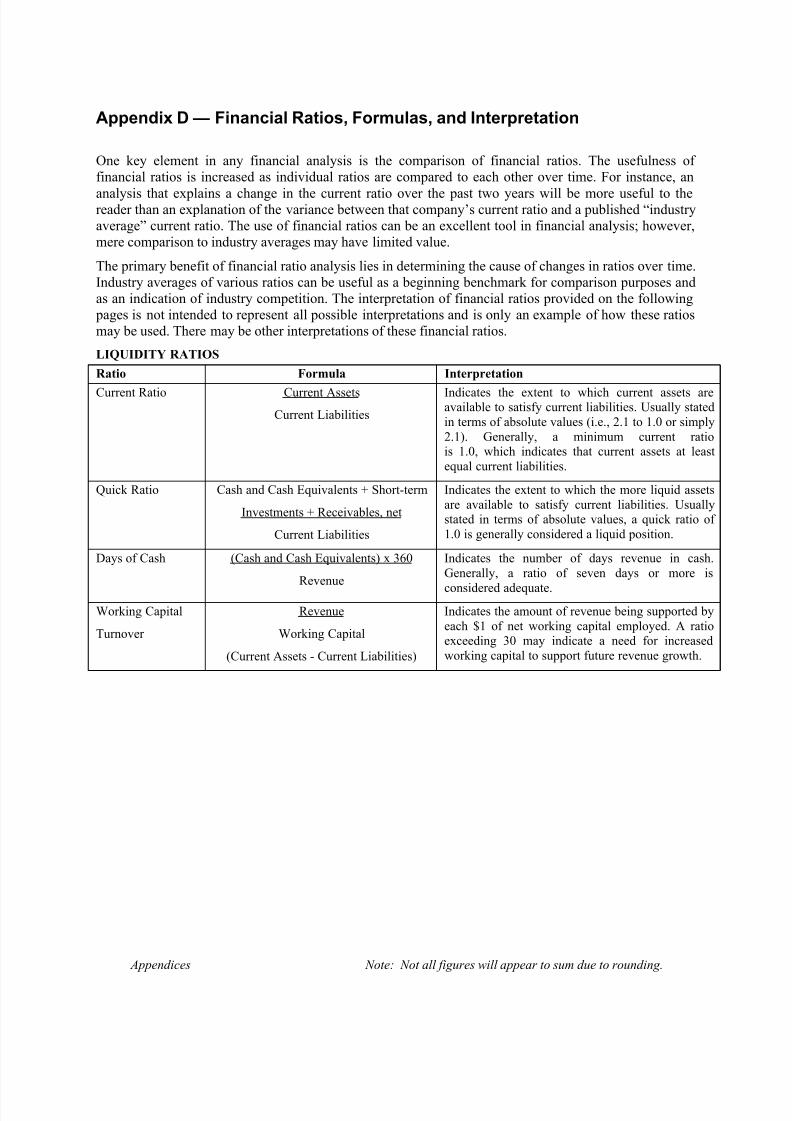
8/13/2019 2005 Financial Survey
http://slidepdf.com/reader/full/2005-financial-survey 281/284
Appendices Note: Not all figures will appear to sum due to rounding.
Appendix D — Financial Ratios, Formulas, and Interpretation
One key element in any financial analysis is the comparison of financial ratios. The usefulness offinancial ratios is increased as individual ratios are compared to each other over time. For instance, an
analysis that explains a change in the current ratio over the past two years will be more useful to thereader than an explanation of the variance between that company’s current ratio and a published “industryaverage” current ratio. The use of financial ratios can be an excellent tool in financial analysis; however,mere comparison to industry averages may have limited value.
The primary benefit of financial ratio analysis lies in determining the cause of changes in ratios over time.Industry averages of various ratios can be useful as a beginning benchmark for comparison purposes andas an indication of industry competition. The interpretation of financial ratios provided on the following pages is not intended to represent all possible interpretations and is only an example of how these ratiosmay be used. There may be other interpretations of these financial ratios.
LIQUIDITY RATIOS
Ratio Formula Interpretation
Current Ratio Current Assets
Current Liabilities
Indicates the extent to which current assets areavailable to satisfy current liabilities. Usually statedin terms of absolute values (i.e., 2.1 to 1.0 or simply2.1). Generally, a minimum current ratiois 1.0, which indicates that current assets at leastequal current liabilities.
Quick Ratio Cash and Cash Equivalents + Short-term
Investments + Receivables, net
Current Liabilities
Indicates the extent to which the more liquid assetsare available to satisfy current liabilities. Usuallystated in terms of absolute values, a quick ratio of1.0 is generally considered a liquid position.
Days of Cash (Cash and Cash Equivalents) x 360
Revenue
Indicates the number of days revenue in cash.Generally, a ratio of seven days or more is
considered adequate.
Working Capital
Turnover
Revenue
Working Capital
(Current Assets - Current Liabilities)
Indicates the amount of revenue being supported byeach $1 of net working capital employed. A ratioexceeding 30 may indicate a need for increasedworking capital to support future revenue growth.
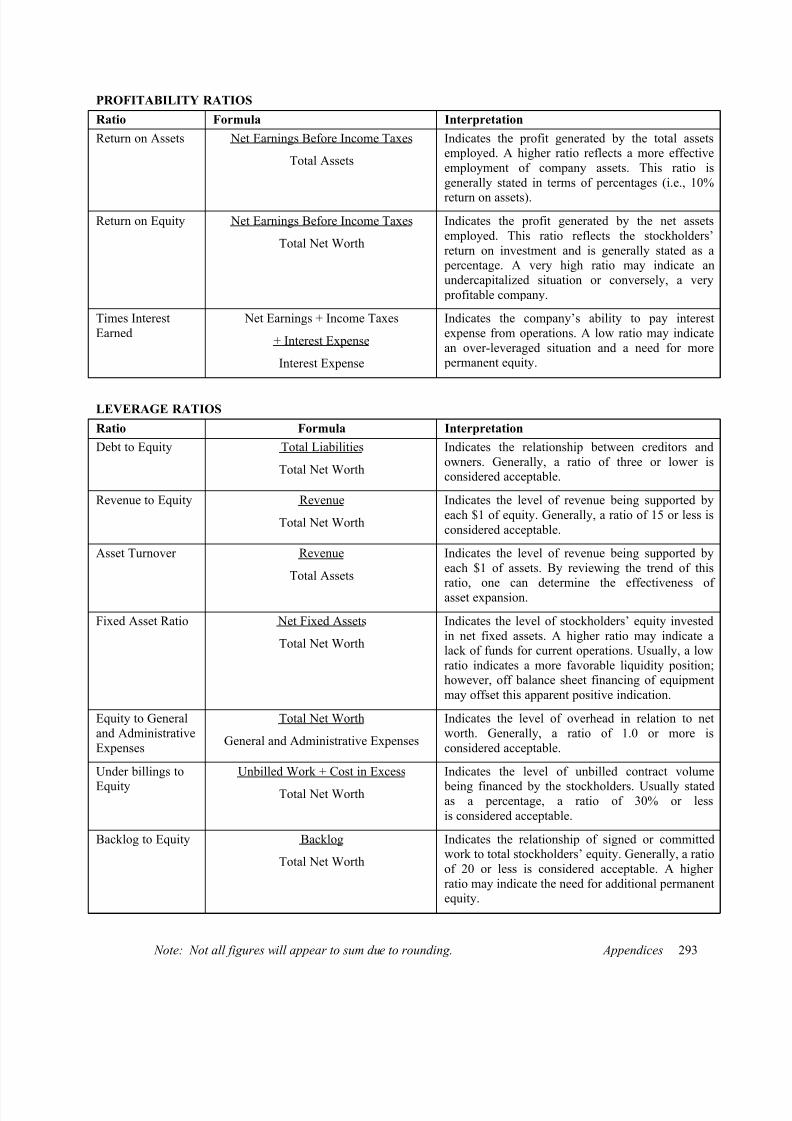
8/13/2019 2005 Financial Survey
http://slidepdf.com/reader/full/2005-financial-survey 282/284
Note: Not all figures will appear to sum due to rounding. Appendices 293
PROFITABILITY RATIOS
Ratio Formula Interpretation
Return on Assets Net Earnings Before Income Taxes
Total Assets
Indicates the profit generated by the total assetsemployed. A higher ratio reflects a more effectiveemployment of company assets. This ratio isgenerally stated in terms of percentages (i.e., 10%
return on assets).
Return on Equity Net Earnings Before Income Taxes
Total Net Worth
Indicates the profit generated by the net assetsemployed. This ratio reflects the stockholders’return on investment and is generally stated as a percentage. A very high ratio may indicate anundercapitalized situation or conversely, a very profitable company.
Times InterestEarned
Net Earnings + Income Taxes
+ Interest Expense
Interest Expense
Indicates the company’s ability to pay interestexpense from operations. A low ratio may indicatean over-leveraged situation and a need for more permanent equity.
LEVERAGE RATIOS
Ratio Formula Interpretation
Debt to Equity Total Liabilities
Total Net Worth
Indicates the relationship between creditors andowners. Generally, a ratio of three or lower isconsidered acceptable.
Revenue to Equity Revenue
Total Net Worth
Indicates the level of revenue being supported byeach $1 of equity. Generally, a ratio of 15 or less isconsidered acceptable.
Asset Turnover Revenue
Total Assets
Indicates the level of revenue being supported byeach $1 of assets. By reviewing the trend of this
ratio, one can determine the effectiveness ofasset expansion.
Fixed Asset Ratio Net Fixed Assets
Total Net Worth
Indicates the level of stockholders’ equity investedin net fixed assets. A higher ratio may indicate alack of funds for current operations. Usually, a lowratio indicates a more favorable liquidity position;however, off balance sheet financing of equipmentmay offset this apparent positive indication.
Equity to Generaland AdministrativeExpenses
Total Net Worth
General and Administrative Expenses
Indicates the level of overhead in relation to networth. Generally, a ratio of 1.0 or more isconsidered acceptable.
Under billings to
Equity
Unbilled Work + Cost in Excess
Total Net Worth
Indicates the level of unbilled contract volume
being financed by the stockholders. Usually statedas a percentage, a ratio of 30% or lessis considered acceptable.
Backlog to Equity Backlog
Total Net Worth
Indicates the relationship of signed or committedwork to total stockholders’ equity. Generally, a ratioof 20 or less is considered acceptable. A higherratio may indicate the need for additional permanentequity.

8/13/2019 2005 Financial Survey
http://slidepdf.com/reader/full/2005-financial-survey 283/284
Appendices Note: Not all figures will appear to sum due to rounding.294
EFFICIENCY RATIOS
Ratio Formula Interpretation
Backlog to
Working Capital
Backlog
Current Assets - Current Liabilities
Indicates the relationship between signed orcommitted work and working capital. A higher ratio
may indicate a need for an increase in permanentworking capital.
Months in Backlog Backlog
Revenue/12
Indicates the average number of monthsit will take to complete all signed or committedwork.
Days in Accounts
Receivable
(Contract Accounts Receivable +
Other Accounts Receivable -
Allowance for Doubtful Accounts) x 360
Revenue
Indicates the number of days to collect accountsreceivable. A lower ratio indicates a fastercollection of receivables, thus more liquidity.Consideration should be given to the days inaccounts payable ratio, because higher days inaccounts receivable ratio may indicate a drain oncash flow.
Days in Inventory Inventory x 360
Cost of Sales
Indicates the number of days required to sellinventory. A high ratio may indicate overstockingof inventory.
Days in Accounts
Payable
(Accounts Payable - Retainage) x 360
Total Cost
Indicates the average number of days it takes toliquidate trade payables. The ratio should becompared to credit terms of vendors. Retainage has been excluded.
Operating Cycle Days in Cash + Days in Accounts
Receivable + Days in Inventory –
Days in Accounts Payable
Indicates the length of time it takes for the companyto complete a normal operating cycle. A low ratiomay indicate a need for more permanent workingcapital.

8/13/2019 2005 Financial Survey
http://slidepdf.com/reader/full/2005-financial-survey 284/284