Embed Size (px)
DESCRIPTION
831 E. Morehead Street, Suite 150 Charlotte, North Carolina 28202. 2005 Citizen Survey Final Report Results For Total Sample February 14, 2005. Table of Contents. Objectives 3 Methodology 4 Rating Scales 5 Executive Summary 6 Conclusions21 - PowerPoint PPT Presentation
Citation preview

2005 Citizen Survey
Final ReportResults For Total Sample
February 14, 2005
831 E. Morehead Street, Suite 150Charlotte, North Carolina 28202

2
Table of Contents
Objectives 3Methodology 4Rating Scales 5 Executive Summary 6Conclusions 21Detailed Findings 27
Citizen Perceptions of CMPD 28Perceptions of Crime and Safety in Charlotte-Mecklenburg Overall and in Neighborhood 33Perceptions of Uptown Charlotte 42Crime in Charlotte-Mecklenburg 53Interaction with CMPD 57Sources that Shape Perceptions of the CMPD 62Perceptions of Policing Philosophies 72Respondent Profile 74

3
Objectives
•The Citizen Satisfaction Survey was conducted by MarketWise, Inc.
•The research objectives of the study were the following:
–Measure overall perceptions of the CMPD
–Measure satisfaction with the services
–Explore perceptions of safety and crime levels for:
Charlotte-Mecklenburg overall, neighborhoods, and Uptown.
–Examine sources that shape perceptions of the CMPD
–Explore perceptions of policing philosophies
–Compare changes in perceptions from 2004 to 2005 on keyissues

4
Methodology
• 648 telephone interviews were completed in Nov. & Dec. of 2005.
• Respondents were age 18 or older.
• The sample was stratified by the 12 CMPD Divisions.
– Divisions were defined by Census track & block groups, corresponding to the 12 CMPD Divisions.
• Hispanics and Latinos who did not speak English were interviewed in Spanish. Hispanics and Latino were over-sampled to ensure adequate representation.
• Margin of error for the total sample of 648 is + 3.9 percentage points at the 95% confidence level.

5
Rating Scales
• To measure perceptions, respondents used rating scales from 1 to 10.
1=Extremely Negative to 10=Extremely Positive
• With a 10-point scale there is no exact mid-point. Ratings of 5 and 6 are equally in the middle of the scale.
• To simplify interpretation, the data have been collapsed into categories and labeled. For example:
9,10=Very positive 7,8=Positive 5,6=Average 1-4=Poor
• Ratings of 1-2 and 3-4 have been combined due to the low percentage of responses.
• NOTE: Responses may not add to exactly 100% due to rounding. Mean ratings are always calculated with “don’t know” responses dropped from the base.

Executive Summary

7
Executive Summary
• As in 2004, the majority of adults in Charlotte-Mecklenburg have a positive impression of the CMPD. 70% of respondents in this survey rate the CMPD 7 or higher on a 10-point scale; only 1 in 10 give a low rating (1 to 4). The percentage giving a rating of 7 to 10 is almost the same this year as in 2004 (70% in 2005 vs. 71% in 2004).
• 73% or more respondents able to rate the item give the CMPD high ratings (7 or higher) on the following measures related to character:
Courteous Professional Performing job with integrity and honesty Good judgment in use of force.
Perceptions of the CMPD

8
Executive Summary
• A high percentage (70% or more) of respondents able to rate give high ratings (7 to 10) on the following CMPD services:
911 Call Center (Mean ratings show improvement from 2004 to 2005: 7.6 to 8.1)
Officer response to emergencies Working with communities to solve problems (Mean ratings show improvement
from 2004 to 2005: 7.1 to 7.6)
• More than 60% of respondents able to rate give high ratings (7 to 10) on: Traffic law enforcement Crime prevention efforts Drug law enforcement NEPS (Mean ratings show improvement from 2004 to 2005: 6.1 to 6.6)
Animal Control services
• Mean ratings show no decline in perceptions of any of these services.
Perceptions of Services Provided by the CMPD

9
Executive SummaryPerceptions of the Need for Police
• The majority of respondents agree that the need for police has increased.
In 2004, 77% of respondents agreed (rated 7 to 10) the need for police had increased in the past two years, and less than half (45%) agreed (rated 7 to10) the CMPD had an adequate number of police.
In 2005, 81% agree the need for police has increased in the past year; 33% agree (rate 7 to 10) and 35% disagree (rate 1 to 4) that we have an adequate number of police.

10
Executive SummaryPerceptions of Safety and Effectiveness of CMPD
• More respondents indicate they feel safe in their neighborhoods (74% rate 7-10), than say Charlotte-Mecklenburg overall is a safe place to live (62% rate 7-10). Respondents also believe Uptown is a safe place to work (73% rate 7-10) and to visit (68% rate 7-10), but fewer believe it is a safe place to live (60% rate 7-10). Only 1 in 10 respondents give low ratings (1- 4=not safe) on any of these measures.
• Most respondents believe (68% rate 7-10) that the CMPD is effective in making Charlotte-Mecklenburg safer. Less than half of the respondents (41%) say they feel less safe than they did a year ago.
• For Charlotte-Mecklenburg overall, robberies (23%), break-ins (20%), gangs (19%), theft (13%), and the need for more police (13%) are the primary concerns about safety.

11
Executive SummaryPerceptions of Safety and Effectiveness of CMPD
• Most respondents believe (64% rate 7-10) that the CMPD is effective in working with their neighborhood to solve problems. Only slightly more than a quarter of respondents (29%) do not feel as safe as they did a year ago. Break-ins (32%), theft (16%), and robberies (13%) are the primary safety concerns for neighborhoods.
• Almost a third (30%) of respondents (about the same as in 2004) are active in a neighborhood group.
• Almost half (47%) of the respondents (the same as in 2004) are aware they have an assigned community/neighborhood police officer.
• About a third (32%) of respondents have spoken with a police officer about a neighborhood problem (does not include 911 calls) in the past year.
– In 2004, 41% indicated they had ever spoken with police about a neighborhood problem.

12
Executive SummaryPerceptions of Safety and Effectiveness of CMPD
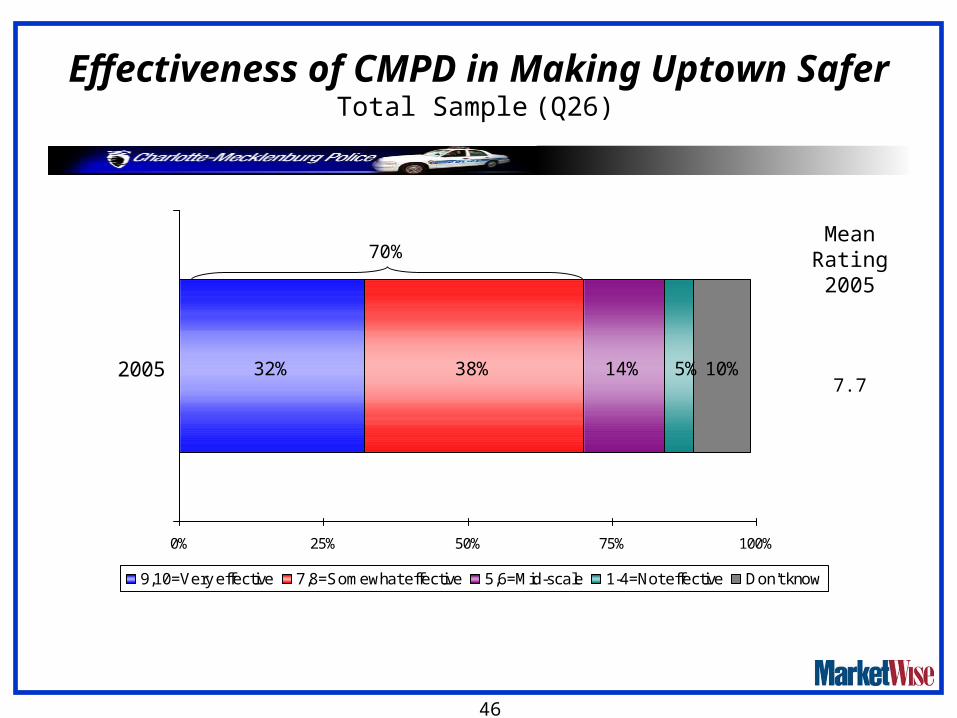
• Most respondents believe (70% rate 7-10) that the CMPD is effective in making Uptown safer. Less than a quarter of respondents (22%) do not feel as safe as they did a year ago. Robberies (23%), loitering/ panhandling (12%), personal safety in general (12%), and assault (10%) are the primary safety concerns for Uptown.
• Most respondents (85%) are aware of the police bicycle units operating in Uptown and most believe (72% rate 7-10) they are effective for patrolling Uptown.
13
Executive SummaryPerceptions of Safety in Uptown Charlotte
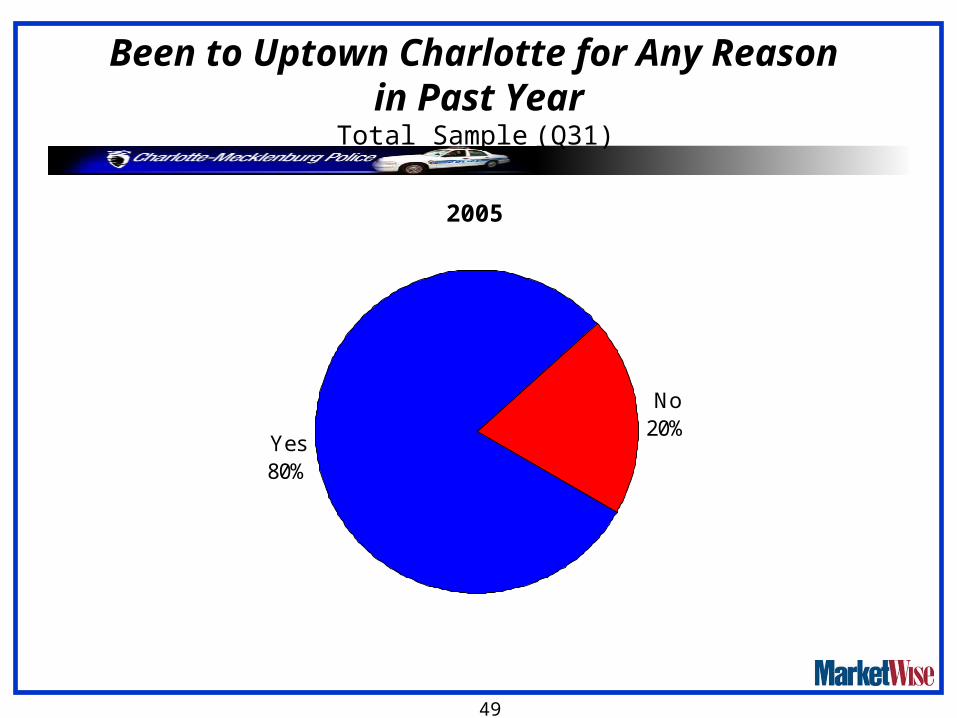
• Most respondents (80%) have been Uptown in the past year.
5% indicated they live Uptown and more than a third (36%) work or have been Uptown for work in the past year. Almost half (48%) have dined out and 18% have been Uptown to shop in the past year. Many have been to entertainment events at the Bank of America Stadium (31%), Discovery Place (25%), and the Bobcat’s Arena (16%). 29% used the Uptown Public Library and 23% used CATS.
• Respondents feel much safer Uptown during the day than at night.
90% indicate they feel safe (rate 7-10) during the day, while only 56% feel safe Uptown at night.
38% have brought a child Uptown during the past year. Among these respondents, 86% reported feeling it was safe (rate 7-10) to do so.
• 20% of respondents have not been Uptown in the past year.
Of those, 70% say they would feel safe (rate 7-10) going Uptown during the day, but only 34% would feel safe going Uptown at night.
14
Executive SummaryCrime
• Less than a third (30%) of respondents report that either they or other family members were the victims of some type of crime, in Charlotte-Mecklenburg, during the past year. In 2004, 37% reported being a victim during the past two years.
Many more respondents reported being a victim of a property crime during the past year (27%), than reported being a victim of a violent crime (6%). 21% of total respondents reported the property crime to the CMPD, but 6% did not report the crime. 5% reported being a victim of a violent crime, and 1% did not report the crime.
In 2004, 35% had been a victim of a property crime in the past two years and 5% had been a victim of a violent crime.
15
Executive SummaryCitizen Interaction with CMPD
• Almost 2 out of 3 respondents (64%) have interacted with the CMPD, either on the phone or in person, in the past year.
45% have interacted with the police on the phone: 29% called 911, 28% called NEPS.
48% have interacted with the police in person: 18% for traffic violation or accident, 15% during a community related activity, 12% when they were a victim of a crime, 9% during an emergency, 4% for social circumstances, and 4% to file a report.
• 28% of respondents called NEPS during the past year. 65% of these respondents were satisfied with the time it took to handle the non-emergency reporting.
• 64% of respondents indicated it is appropriate for police to have slower response times for non-emergency situations, while another 8% said it is sometimes appropriate. 28% indicated the response times should not be slower for non-emergencies than emergencies.
16
Executive SummaryNewspapers as a Source of Influence on Opinions of the CMPD
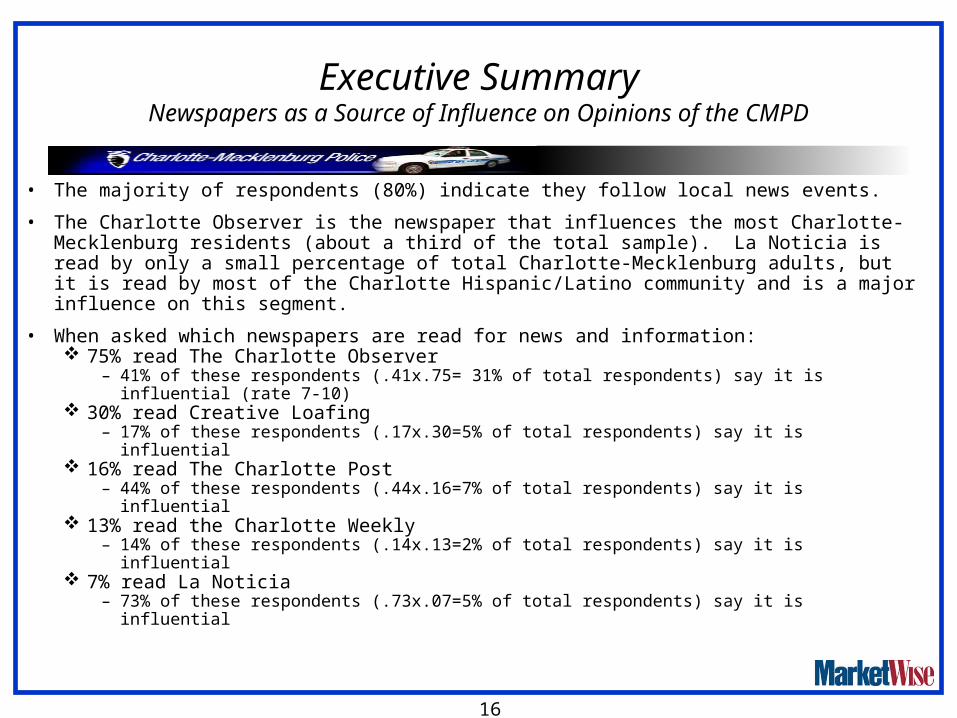
• The majority of respondents (80%) indicate they follow local news events.
• The Charlotte Observer is the newspaper that influences the most Charlotte-Mecklenburg residents (about a third of the total sample). La Noticia is read by only a small percentage of total Charlotte-Mecklenburg adults, but it is read by most of the Charlotte Hispanic/Latino community and is a major influence on this segment.
• When asked which newspapers are read for news and information: 75% read The Charlotte Observer
– 41% of these respondents (.41x.75= 31% of total respondents) say it is influential (rate 7-10)
30% read Creative Loafing– 17% of these respondents (.17x.30=5% of total respondents) say it is influential
16% read The Charlotte Post– 44% of these respondents (.44x.16=7% of total respondents) say it is influential
13% read the Charlotte Weekly– 14% of these respondents (.14x.13=2% of total respondents) say it is influential
7% read La Noticia– 73% of these respondents (.73x.07=5% of total respondents) say it is influential

17
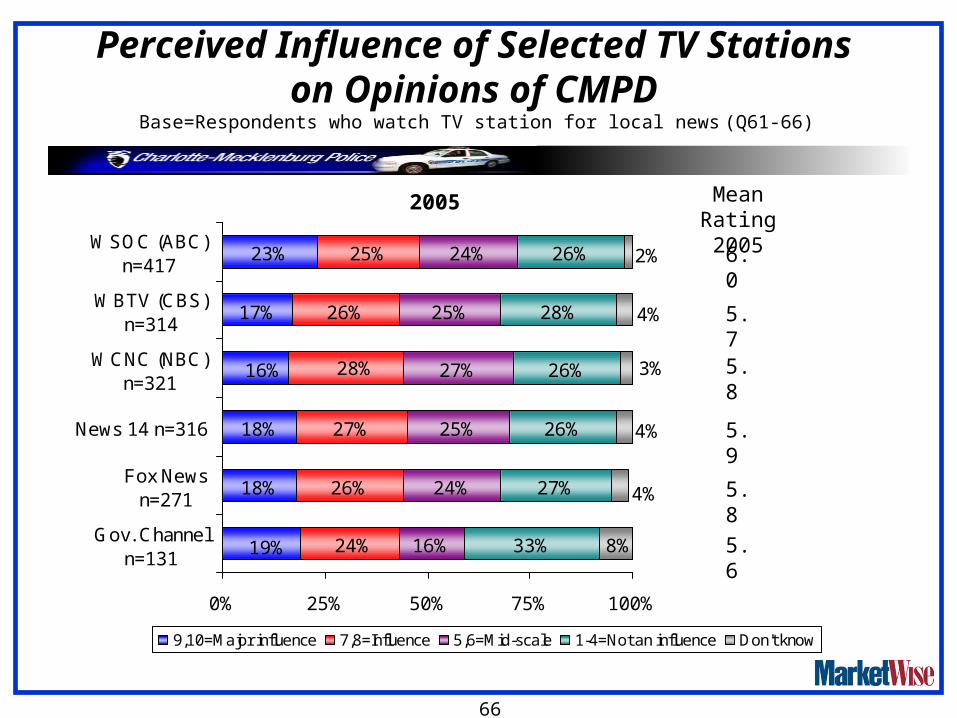
Executive SummaryTelevision as a Source of Influence on Opinions of the CMPD
• WSOC is the television station that influences the most Charlotte-Mecklenburg adults (about 32% of the total adult population of Charlotte-Mecklenburg). However, other stations also have a significant influence.
• When asked which television stations are watched for local news and information: 66% watch WSOC (ABC)
– 48% of these respondents (.48 x .66= 32% of total respondents) say it is influential (rate 7-10)
50% watch WCNC (NBC)– 44% of these respondents (.44x.50=22% of total respondents) say it is influential
49% watch WBTV (CBS)– 43% of these respondents (.43x.49=21% of total respondents) say it is influential
49% watch News 14– 46% of these respondents (.46x.49=23% of total respondents) say it is influential
42% watch Fox News– 44% of these respondents (.44x.42=18% of total respondents) say it is influential
20% watch the Government Channel for local news– 43% of these respondents (.43x.20=9% of total respondents) say it is influential
7% watch CMPD Today (Formerly Police Beat). – 56% of these respondents (.56x.07=4% of total respondents) say it is influential

18
Executive SummaryRadio & CMPD Website as Sources of Influence on Opinions of the CMPD
• About the same percentages (within sampling error) of respondents say WBT and WFAE have an influence (rate 7-10) on their opinions of the CMPD.
• When asked which radio stations are listened to for local news and information: 21% listen to WBT
– 47% of these respondents (.47x.21=10% of total respondents) say it is influential 18% listen to WFAE
– 46% of these respondents (.46x.18=8% of total respondents) say it is influential
• 18% of total respondents have been to the the CMPD Website and 38% of these respondents (.38x.18=7% of total respondents) say it is influential (rate 7-10) on their opinions of the CMPD.

19
Executive SummaryOther Sources of Influence on Opinions of the CMPD
• When asked about other sources that influence opinions of the CMPD: 46% indicated word of mouth 27% indicated publications by the City 27% indicated City-Council meetings
• Interactions with police have the most influence on opinions about police; 62% of the total respondents indicate it is influential (rate 7-10).

20
Executive Summary Policing Philosophies
• The majority of respondents (80% or more) agreed (rate 7-10) with each of the six statements related to policing philosophies.
• Examination of strong agreement (rate 9-10) show that 60% or more strongly agree that effective policing should: Emphasize a partnership where citizens share responsibility for a safe city Place heavy emphasis on preventing crimes before they occur Place strong emphasis on long term solutions Emphasize the use of crime data & information technology as crime fighting
tools
• Examination of strong agreement (rate 9-10) show that only 50% strongly agree that effective policing should: Focus primarily on officers arresting people who break laws Focus on locations where repeat crimes occur, instead of random patrols

Conclusions

22
In Conclusion
• Perceptions of the CMPD have remained positive.
– No declines in perceptions on character related issues or on services provided.
– 911 Call Center, working with communities, and NEPS reporting show improvement in perceptions.
• Majority of adults in Charlotte-Mecklenburg feel safe in Charlotte-Mecklenburg and in their neighborhood.
– Most believe the CMPD is effective in making Charlotte-Mecklenburg and neighborhoods safer.

23
In Conclusion
• Most adults who have been Uptown and those who have not been in the past year say they feel safe going Uptown during daytime hours.
• Perceptions of safety Uptown are much lower for evening hours than daytime hours.
– Slightly more than half of those who have been Uptown feel safe there in the evening hours
– Only a third of those who have not been say they would feel safe going Uptown during the evening.
• Most adults say the CMPD has been effective at making Uptown safer.
24
In Conclusion
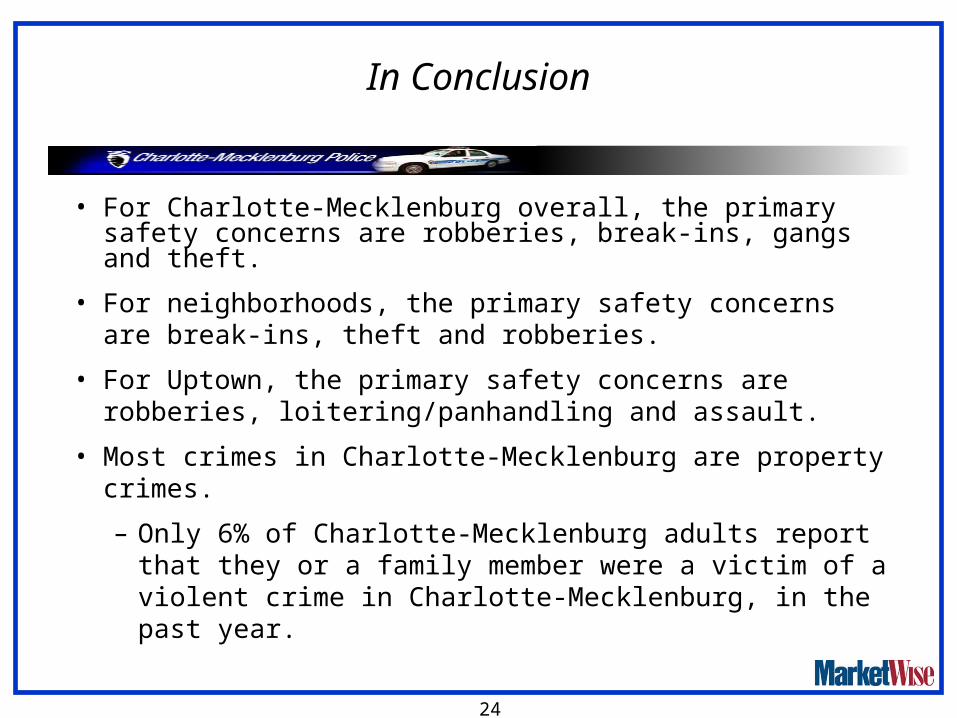
• For Charlotte-Mecklenburg overall, the primary safety concerns are robberies, break-ins, gangs and theft.
• For neighborhoods, the primary safety concerns are break-ins, theft and robberies.
• For Uptown, the primary safety concerns are robberies, loitering/panhandling and assault.
• Most crimes in Charlotte-Mecklenburg are property crimes.
– Only 6% of Charlotte-Mecklenburg adults report that they or a family member were a victim of a violent crime in Charlotte-Mecklenburg, in the past year.

25
In Conclusion
• Almost two out of three adults in Charlotte-Mecklenburg have had contact in-person and/or contact by phone with a police officer in the past year.
– Citizens state that personal contact with police has the most influence on their opinions of the police.
• The other sources that have the most influence on opinions of the CMPD are: The Charlotte Observer, WSOC, La Noticia (among Hispanic/Latino community), and word of mouth.

26
In Conclusion
• Perceptions of policing philosophies indicate that the public wants all forms of policing.
– However, there is stronger support for focusing on long term solutions, crime prevention, and patrolling where repeat crime occurs, than for focusing mostly on making arrests and random patrols.

Detailed Findings

Perceptions of CMPD and CMPD Services

29
26%
26%
45%
44%
18%
19%
8%
10%
2%
0% 25% 50% 75% 100%
2004
2005
9,10=Very Positive 7,8=Positive 5,6=Mid-scale 1-4=Negative Don't know
Overall Perception of the CMPD Total Sample (Q5)
Mean Ratings
7.2
7.3
70%
71%

30
30%
36%
43%
43%
34%
36%
38%
35%
15%
16%
11%
12%
9%
7%
6%
8%
11%
0% 20% 40% 60% 80% 100%
Use good judgementin use of force
Perform job w/integrity & honesty
Are professional
Are courteous
9,10=Strongly agree 7,8=Agree 5,6=Mid-scale 1-4=Disagree Don't know
Perceptions of the CMPDTotal Sample (Q6-9)
Mean Ratings2004 2005
7.7 7.9
7.7 7.9
7.3 7.5
7.0 7.4
2005
80% 78%
82% 81%
73% 64%
75% 72%
% Rating 7 to 10 Able to Total Rate * Sample
* “DK” Dropped
From Base

31
17%
23%
26%
26%
27%
33%
33%
41%
28%
28%
28%
35%
37%
34%
36%
29%
14%
18%
14%
19%
19%
14%
11%
10%
15%
8%
8%
26%
18%
23%
11%
12%
14%
17%
13%
8%
13%
4%
7%
5%
0% 20% 40% 60% 80% 100%
NEPS reporting
Drug law enforcement
Animal control
Crime prevention
Traffic law enforcement
Work with communities
Response to emergencies
911 Call Center
9,10=Very Good 7,8=Good 5,6=Mid-scale 1-4=Poor Don't know
Perceptions of Services Provided by the CMPDTotal Sample (Q45-52)
Mean Ratings2004 2005
7.1 7.6
7.4 7.7
7.0 7.1 6.9 7.2 6.9 7.3 6.7 6.9 6.1 6.6
2005
7.6 8.1
83% 70%
80% 69%
75% 67%
67% 64%
69% 61%
70% 54%
62% 51%
62% 45%
% Rating 7 to 10 Able to Total Rate * Sample
* “DK” Dropped
From Base

32
60%
15%
21%
18%
9%
23% 35%
6%
10%
5%
0% 25% 50% 75% 100%
The need forpolice has
increased in pastyear *
Have an adequatenumber of police
9,10=Strongly Agree 7,8=Agree 5,6=Mid-scale 1-4=Disagree Don’t know
Perceptions of the CMPDTotal Sample (Q10-11)
* In 2004, question read as “past two years.”
Mean Rating2004* 2005
6.0 5.3
8.2 * 8.5
200533%
81%
Perceptions of Crime & Safety in
Charlotte-Mecklenburg Overall and in Neighborhood

34
21%
41%
41%
33%
26%
14%
11%
11%
0% 25% 50% 75% 100%
Charlotte-Mecklenburg is asafe place to live
I feel safe inneighborhood
where I live
9,10=Strongly agree 7,8=Somewhat agree 5,6=Mid-scale 1-4=Disagree Don't know
Perceptions of SafetySample (Q12-13)
Mean Rating2004 2005
7.6 7.6
6.9 6.9
74%
62%
2005

35
Perceptions of Feeling Safer, as Safe, or Less Safe than a Year Ago
Total Sample (Q18 & 21)
2%
41%
48%
10%
0% 60%
Don't know
Feel lesssafe than ayear ago
Feel as safeas a year
ago
Feel safernow than ayear ago
2005
In Charlotte-Mecklenburg Overall
2%
29%
54%
15%
0% 60%
Don't know
Feel lesssafe than ayear ago
Feel as safeas a year
ago
Feel safernow than ayear ago
2005
58% 69%
In Your Neighborhood

36
Primary Concerns about Crime and SafetyUnaided, Multiple Answers Allowed
Total Sample (Q19 &22)
7%
8%
9%
9%
10%
11%
11%
13%
13%
19%
20%
23%
0% 30%
Drugs
Carjackings
Murders
Personal safety
Safety of children
Assault/rape
Unsafe drivers
Need more police
Theft
Gangs
Break-ins
Robberies
2005
8%
8%
10%
11%
12%
13%
13%
16%
32%
0% 40%
Property crimes
Assault/rape
Drugs
Need more police
Unsafe drivers
No concerns
Robberies
Theft
Break-ins
2005
In Charlotte-Mecklenburg Overall In Your Neighborhood

37
21% 47% 21% 9% 2%
0% 20% 40% 60% 80% 100%
2005
9,10=Very effective 7,8=Somewhat effective 5,6=Average 1-4=Not Effective Don't know
Effectiveness of CMPD in Making Charlotte-Mecklenburg Safer
Total Sample (Q17)
Mean Rating2005
7.1
68%

38
25%
34%
36%
30%
23%
18%
10%
11% 6%
5%
0% 25% 50% 75% 100%
2004
2005
9,10=Very Effective 7,8=Somewhat Effective 5,6=Average 1-4=Not Effective Don't know
Mean Rating
7.3
7.0
64%
61%
Effectiveness of CMPD in Working with Your Neighborhood to Solve Problems
Total Sample (Q20)

39
Active Member of a Neighborhood Group Total Sample (Q23)
Yes30% No
70%
In 2004, 33% of respondents were active.
2005

40
Awareness of AssignedCommunity/Neighborhood Police Officer
Total Sample (Q24)
Yes47% No
53%
In 2004, 47% were aware.
2005

41
Not Including 911 Calls, Have You Spoken with Police about Neighborhood Problems In Past Year
Total Sample (Q25)
Yes32%
No68%
In 2004, 41% had ever spoken with a police officer about a neighborhood problem.
2005

Perceptions of Uptown Charlotte

43
25%
31%
35%
35%
37%
38%
20%
17%
15%
10%
9%
6%7%
5%
10%
0% 25% 50% 75% 100%
Uptown is a safeplace to live
Uptown is a safeplace to visit
Uptown is a safeplace to work
9,10=Strongly agree 7,8=Somewhat agree 5,6=Mid-scale 1-4=Disagree Don't know
Perceptions of Uptown Charlotte as Safe Place to Work, Visit, and Live
Sample (Q14-16)
Mean Rating2005
7.7
7.3
7.1
73%
68%
60%

44
8%
22%
43%
27%
0% 60%
Don't know
Feel less safe than ayear ago
Feel as safe as ayear ago
Feel safer now thana year ago
2005
In Uptown Charlotte
Perceptions of Feeling Safer, as Safe, or Less Safe than a Year Ago
Total Sample (Q27)
70%

45
Primary Concerns about Crime and Safety in Uptown Charlotte
Total Sample (Q28)
8%
8%
10%
12%
12%
12%
15%
16%
23%
0% 25%
Gangs
Break-ins
Assault
Personal safety
Loitering/panhandling
Need more police
No concerns
Don't know
Robberies
2005
Unaided, Multiple Answers Allowed
46
32% 38% 14% 5% 10%
0% 25% 50% 75% 100%
2005
9,10=Very effective 7,8=Somewhat effective 5,6=Mid-scale 1-4=Not effective Don't know
Effectiveness of CMPD in Making Uptown SaferTotal Sample (Q26)
Mean Rating2005
7.7
70%

47
Awareness of Police Bicycle Units Operating in Uptown Charlotte
Total Sample (Q29)
Yes85% No
15%
2005

48
39% 33% 13% 4%11%
0% 25% 50% 75% 100%
2005
9,10=Very effective 7,8=Somewhat effective 5,6=Mid-scale 1-4=Not effective Don't know
Effectiveness of CMPD Bicycle UnitsPatrolling in Uptown Charlotte
Total Sample (Q30)
Mean Rating2005
7.9
72%
49
Been to Uptown Charlotte for Any Reason in Past Year
Total Sample (Q31)
Yes80%
No20%
2005

50
Reasons for Being in Uptown Charlottein Past Year
Total Sample (Q32)
5%
7%
17%
16%
18%
23%
25%
29%
31%
36%
43%
48%
0% 75%
Live Uptown
ImaginOn
Other
Bobcat's Arena
Shop
CATS
Discovery Place
Public Library
Bank of Am. Stadium
Work/business
Other events in entertainment district
Dine
2005

51
50%
21%
63%
36%
35%
27%
21%
8%
11%
16% 7%
1%
0% 25% 50% 75% 100%
Feel safe bringing child (Among thosewho brought child Uptown in past
year) *
Feel safe during evening hours
Feel safe during daytime hours
9,10=Very safe 7,8=Somewhat safe 5,6=Mid-scale 1-4=Not safe Don't know
Perceptions of Safety in Uptown Charlottein Past Year
Base= Respondents who have been Uptown, n=515 (Q33-36)
* Note: 38% of the total respondents brought a child to the Uptown area in the past year. (Q35)
Mean Ratings2005
8.7
6.7
8.3
2005
92%
56%
86%

52
14%
38%
20%
32%
26%
15%
30%
7%
11%
8%
0% 25% 50% 75% 100%
How safe would youfeel about beingUptown duringevening hours?
How safe would youfeel about beingUptown duringdaytime hours?
9,10=Very safe 7,8=Somewhat safe 5,6=Mid-scale 1-4=Not safe Don't know
Perceptions of Safety in Uptown CharlotteBase= Respondents who have NOT been Uptown In Past Year, n=133
(Q37-38)
Mean Ratings2005
7.6
5.4
2005
70%
34%

Crime in Charlotte-Mecklenburg

54
Victims (Respondent/Family Member) of Crime in Past Year, Regardless of Whether or Not It Was Reported
Total Sample (Q39)
Yes30%No
70%
In 2004, 37% reported being a victim of a crime during the past two years.
2005

55
Victims (Respondent/Family Member) of Crimesin Past YearTotal Sample (Q39)
2004: Victims of a property crime during past two years =35%
2005 Property Crime 2005 Violent Crime
No94%
Yes6%
2004: Victims of violent crime during past two years=5%
No73%
Yes27%

56
Reporting of Crime to CMPDTotal Sample (Q40–41)
2004: Victims of a property crime past 2 years=35%; 10% did not report the crime.
2005 Property Crimes 2005 Violent Crimes
6%
21%
73%
0% 100%
Not victim ofproperty crime
Victim, did notreport
Victim, reported
1%
5%
94%
0% 100%
Not victimof violent
crime
Victim,did notreport
Victim,reported
2004: Victims of a violent crime past 2 years=5%; <1% did not report the crime.
27% were victims of property crime
6% were victims of violent crime

Interaction with CMPD

58
24%
20%
26%
33%
33%
34%
38%
0% 75%
No contact
In-person, victim
In-person, other
Call to NEPS
Communityactivity
In-person- trafficaccident/violation
Call to 911
Interaction with the CMPD 2004 & 2005Total Sample (Q42a & 42b)
2004 Interaction in past two years 2005 Interaction in past year
36%
12%
21%
28%
16%
18%
29%
0% 75%
No contact
In-person, victim
In-person, other
Call to NEPS
Communityactivity
In-person- trafficaccident/violation
Call to 911

59
55%
5%
28%
29%
0% 100%
No contact onphone
On phone,other
Call to NEPS
Call to 911
Interaction with the CMPD In Past YearTotal Sample (Q42a-42b)
2005 Interaction on phone in past year 2005 Interaction in person in past year
52%
4%
4%
4%
9%
12%
15%
18%
0% 100%
No contact inperson
In-person, other
File report orcomplaint
Socialcircumstance
Duringemergency
Victim of crime
Communityactivity
Traffic violation
36% have had no interaction with CMPD in past year.

60
Satisfied with Time to Handle Non-Emergency Reporting
Base=Respondents who called non-emergency reporting number, n=142 (Q43)
2005
No35%
Yes65%
2004: 69% of respondents who had called NEPS in past 2 years, said their call was handled in a timely manner.

61
Appropriate for Police to Have Slower Response Times for Non-Emergency Situations
Total Sample (Q44)
2005
Depends8%
No28%
Yes64%

Sources that Shape Perceptions of the CMPD

63
1%
2%
6%
7%
13%
16%
19%
30%
75%
0% 100%
Business Journal
El Progreso Hispano
Rhinoceros Times
La Noticia
Charlotte Weekly
Charlotte Post
None
Creative Loafing
Charlotte Observer
2005
Newspapers Read for Local News and Information
Total Sample (Q54)

64
49%
16%
33%
24%
25%
20%
25%
52%
31%
60%
32%
11%
6%
12%
11%
26%
11%
17%
13%
5%
6%
7%
0% 25% 50% 75% 100%
Charlotte Weekly, n=86
Charlotte Post, n=104
La Noticia, n=45
Creative Loafing, n=196
Charlotte Observer, n=489
9,10=Major influence 7,8=Influence 5,6=Mid-scale 1-4=Not an influence Don't know
Perceived Influence of Selected Newspapers on Opinions of CMPD
Base=Respondents who read newspaper for local news (Q55-59)
Mean Rating2005
5.5
2005
3.7
7.9
5.5
3.7

65
8%
20%
42%
49%
49%
50%
66%
0% 100%
None
Gov. Channel
Fox News
News 14
WBTV (CBS)
WCNC (NBC)
WSOC (ABC)
2005
Television Stations Watched for Local News and Information
Total Sample (Q60)
66
18%
18%
17%
23%
26%
27%
26%
25%
16%
24%
25%
27%
25%
24%
33%
27%
26%
26%
28%
26%
16%
19% 24%
28%
2%
4%
3%
4%
4%
8%
0% 25% 50% 75% 100%
Gov. Channeln=131
Fox Newsn=271
News 14 n=316
WCNC (NBC)n=321
WBTV (CBS)n=314
WSOC (ABC)n=417
9,10=Major influence 7,8=Influence 5,6=Mid-scale 1-4=Not an influence Don't know
Perceived Influence of Selected TV Stations on Opinions of CMPD
Base=Respondents who watch TV station for local news (Q61-66)
Mean Rating2005
6.0
2005
5.7 5.8
5.9
5.8
5.6

67
17%
29%
29%
25%
0% 60%
1-4=Noinfluence
5,6=Mid-scale
7,8=Someinfluence
9,10=Majorinfluence
No13%
Yes7%
Gov. Ch. not
mentioned80%
CMPD TodayTotal Sample (Q67-68)
Watch CMPD Today, Formerly Police BeatAsked only of those who mentioned Gov. Channel
as primary source for news and information Base= Total Sample
Influence of CMPD Today on Opinion of CMPDBase= Respondents who watch, n=48
Mean Rating20056.6

68
18%
21%
48%
0% 100%
WFAE
WBT
None
2005
Radio Stations Listened to for Local News and Information
Total Sample (Q69)

69
15% 32%
15%
23%
34%
27%
12% 34%
4%
5%
0% 25% 50% 75% 100%
WFAE, n=111
WBT, n=136
9,10=Major influence 7,8=Influence 5,6=Mid-scale 1-4=Not an influence Don't know
Perceived Influence of Selected Radio Stationson Opinions of CMPD
Base=Respondents who listen to station for local news (Q60-66)
Mean Rating2005
5.9
2005
5.4

70
35% 27%
24%
14%
27%
13%
40%
38%
10%
10%
14%
17%
32%
17% 18%
18%
17%
15%
12%
4%
0% 25% 50% 75% 100%
Word of mouth
Personalinteraction with
police
City CouncilMeetings on TV
or in-person
Publications byCity
9,10=Major influence 7,8=Influence 5,6=Mid-scale 1-4=Not an influence Don't know
Perceived Influence of Other Sources on Opinions of CMPD
Total Sample (Q73-76)
Mean Rating2005
4.7
2005
4.6
7.2
5.8

71
7%
40%
15%
27%
11%
0% 60%
Don't know
1-4=Noinfluence
5,6=Mid-scale
7,8=Someinfluence
9,10=Majorinfluence
CMPD WebsiteTotal Sample (Q42c & Q72)
Been to CMPD Website for anyTotal Sample
Influence of Website on Opinion of CMPDBase= Respondents who have visited site, n=117
Mean Rating20055.4
No82%
Yes18%

Perceptions of Policing Philosophies

73
51%
60%
64%
65%
29%
26%
24%
25%
13%
13%
64%
49% 32%
22%
7%
7%
8%
8%
4%
6%
4%
4%
4%
0% 25% 50% 75% 100%
Focus on locations where repeat crimesoccur not random patrols
Focus primarily on officers arresting peoplewho break laws
Emphasize use of crime data & info tech ascrime fighting tools
Place strong emphasis on long termsolutions
Place heavy emphasis on preventingcrimes before they occur
Emphasize partnership where citizensshare responsibility for safe city
9,10=Agree strongly 7,8=Agree somewhat 5,6=Mid-scale 1-4=Disagree Don't know
Agreement with Statements About Policing Philosophies
Total Sample (Q77-82)
Mean Rating2005
8.8
2005
8.7
8.6
8.6
8.1
8.1
Effective policing should . . .

Respondent Profile

75
Respondent ProfileDivision & Race/Ethnicity (Q2 & 3)
3%
30%
59%
8%
0% 100%
Some other race
Black or AfricanAmerican
Hispanic or Latino ofany race
White
Race/Ethnicity
Male51%
Female49%
Gender

76
50%
7%
26%
1%
8%
4%
3%
0% 100%
Employed full-time
Employedpart-time
Retired
Student
Homemaker
Disabled
Not Employed
Respondent ProfileEducation & Employment Status (Q84-85)
9%
25%
26%
28%
12%
0% 100%
Less thanHS
HS grad
Somecollege orvocational
Collegegrad
Gradschool
Education Employment

77
Respondent ProfileMarital Status & Type of Home (Q86 & 92)
23%
12%
14%
51%
0% 100%
NeverMarried
Widowed
Separated/Divorced
Married
Marital Status
1%
18%
8%
72%
0% 100%
Other
Apartment
Townhomeor condo
Detached,single family
Type of Home

78
61%
38%
0% 100%
No
Yes
Respondent ProfileChildren in Household & Age of Children (Q87 & 88-91)
Children in Household
61%
10%
12%
16%
16%
0% 100%
Nochildren
18 orolder
13 to 17
6 to 12
Under 6
Ages of Children

79
17%
6%
10%
19%
30%
18%
0% 100%
$100K+
$80K to <$100K
$60K to <$80K
$40K to <$60K
$20K to <$40K
< $20K
Respondent ProfileAge and Income (Q93 & 95)
Age Income(Refusals dropped from base, n=551)
24%
39%
37%
0% 100%
55+
35-54
18-34
80
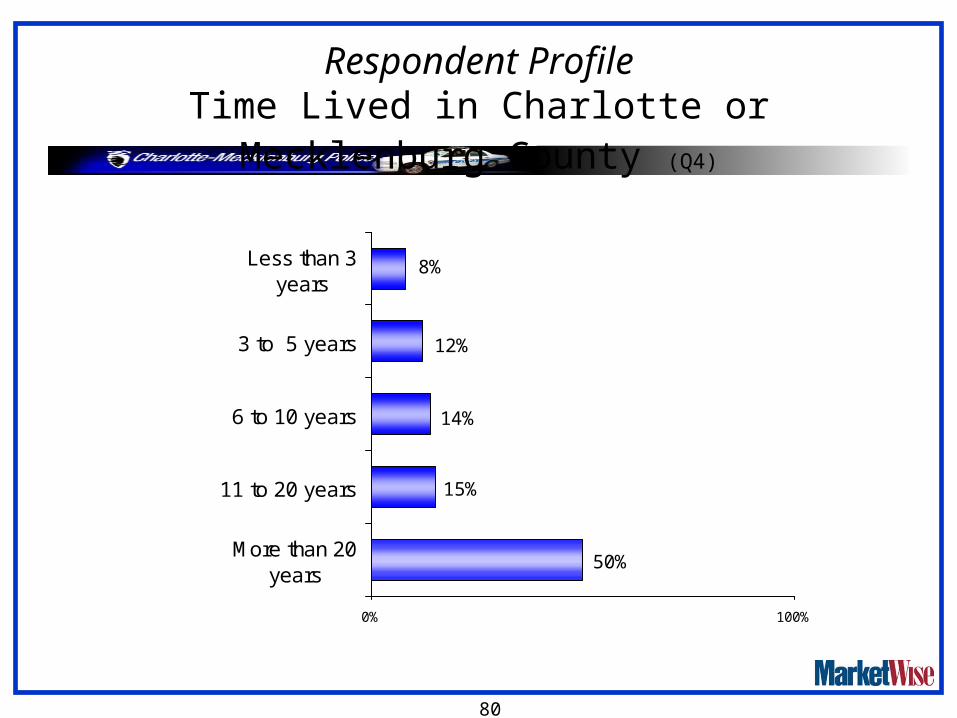
Respondent ProfileTime Lived in Charlotte or Mecklenburg County (Q4)
8%
12%
14%
50%
15%
0% 100%
More than 20years
11 to 20 years
6 to 10 years
3 to 5 years
Less than 3years