Embed Size (px)
Citation preview

2005 Annual Report

Fiscal 2005 was an important –and transformational – year forArvinMeritor. Thanks to the ongoingcommitment of our 29,000employees and a managementteam that is rich in industryexpertise, we made significantprogress in positioning thecompany for long-term success.
Our accomplishments this yearwere especially notable, given themany challenges our industry isfacing – including marginpressures driven by excess global
capacity; high commodity prices, particularly steel and energy; volatileproduction volumes at our customers; and a changing product mix inNorth America. In fiscal year 2005, sales from continuing operationswere $8.9 billion, an 11-percent increase over fiscal year 2004. Netincome was $12 million, or $0.17 per diluted share, compared to a netloss of $42 million last year.
Improving Our Cost Structure
In light of current market dynamics, we took a hard look at our globaloperations this year and implemented a series of difficult but necessarychanges to make the company stronger and more competitive. Most ofthese changes – which included workforce reductions, and plantclosings and consolidations – were either completed or announced thisyear. As a result, we recorded $117 million of restructuring charges infiscal year 2005. We are confident that these actions will greatlyimprove our cost structure, resulting in annual savings of $50-60million beginning in 2007.
We also addressed the need to focus on our core businesses in orderto be a leaner, more flexible and efficient company. We accomplishedthis in part by divesting certain components of our business that arenot an integral part of our strategy. These divestitures, which generatedcash proceeds of $235 million, included:
• Steel coil-coating business – November 2004
• Stampings and components manufacturing business –December 2004
• Certain assets of our commercial vehicle off-highway brakebusiness – October 2005
Also, in October 2004, we announced the decision to sell our LightVehicle Aftermarket (LVA) business. Later in the fiscal year, marketconditions prompted us to change our divestiture strategy.We announced at that time that we would sell the LVA businessesindividually, rather than as a whole, to maximize the return to ourshareowners. This has proven to be the right course of action based onthe level of interest we have experienced to date. The aftermarketoperations supply filters, ride control, motion control, and exhaustcomponents to the passenger car, light-duty truck and sport utilityaftermarkets. These are well-established businesses with high brandequity, and we are committed to selling each at a fair market value.
ArvinMeritor, Inc. | 2005 Annual Report
Growing through Joint Ventures
Joint ventures continue to be a vital element of our global expansionand technology strategy. Our continuing operations are currentlyinvolved in 26 joint ventures, with interests in 13 countries. Our equityearnings from joint ventures were $28 million, an increase of 47percent over the prior year. Arvin Sango, a U.S. joint venture thatproduces light vehicle exhaust systems, received Toyota’s BreakthroughSupplier Quality Recognition this year. And, in March 2005, MeritorWABCO Vehicle Control Systems, our joint venture that produces anti-lock braking systems, announced a new electronic stability controlsystem for commercial truck, tractor and bus applications. This majordevelopment extends our family of vehicle stability enhancementsystems and represents another milestone in our commitment toimprove highway safety.
New joint ventures formed this year include:
• Two 51-percent owned joint ventures with AB Volvo in Europe toproduce commercial vehicle drive axles in France and supplythem to AB Volvo, under the terms of a new supply agreement
• Sixty-percent owned joint venture with First Auto Works SihuanAxle Brake Group in Changchun, China, to manufacture 90,000brakes annually for both the domestic commercial vehicle marketand for export
• Fifty-percent owned joint venture with DongWon PrecisionIndustrial Co. Ltd. to supply diesel particulate filters and relatedexhaust system components to automotive manufacturersin Korea
Leading the Way
Our management team’s diverse industry experience is the motivatingforce behind ArvinMeritor’s many accomplishments this year.This group drives the vision for the future that is essential in anindustry experiencing such dramatic change. We made severalnoteworthy appointments to our board of directors and the corporateofficer team in fiscal year 2005:
To our board of directors:
• Steven G. Rothmeier, former chairman and CEO of NorthwestAirlines, and current chairman and CEO of Great Northern Capital,was elected to ArvinMeritor’s board of directors in November 2004.
• Andrew J. Schindler, who also joined the board in November 2004,is chairman of Reynolds American, the parent company of R.J.Reynolds Tobacco Co., Santa Fe Natural Tobacco Co., Lane Ltd.and R.J. Reynolds Global Products, Inc.
• Ivor “Ike” J. Evans joined the board in May of this year, andpreviously held the position of president and COO of Union PacificRailroad; Ike also spent 21 years at General Motors.
I also want to acknowledge the many contributions of James E. Perrellaand Martin D. Walker, who retired from our board of directors earlierthis year.

We increased spending in research, development and engineering by 12percent this year and are focused on developing advanced solutions in theareas of safety, mobility and the environment. These solutions include activeintelligent systems to address emissions and safety regulations worldwide,and improve the performance and reliability of our customer’s vehicles.
We are emerging as a major player in the global emissions arena.An exciting outcome of the ArvinMeritor merger is our success in applyinglight vehicle design and manufacturing expertise to emissions solutions forour commercial vehicle customers. In the United States, new dieselemissions standards are scheduled to take place in 2007 and 2010 thatdemand a 90- to 95-percent reduction in particulate matter and nitrogenoxides (NOx). Similar standards are taking place in Europe this year and in2008. We are currently a leader in the European diesel aftertreatmentmarket, and we intend to lead the global industry in offering a completeportfolio of clean air solutions for both light and commercial vehicles.
Additional technologies in our portfolio include on-demand power steeringsystems, highly-integrated plastic door modules, large-opening roofsystems and cross-car cradle suspension modules for passenger cars andlight-duty trucks. For trucks and trailers, we introduced the first phases ofthe new DuraSlide™ trailer air suspension, composite springs, and anelectric drivetrain program.
Positioning ArvinMeritor to Thrive
With approximately 50 percent of our business outside of North America,we are well-positioned to capitalize on the growing transportationinfrastructure in China and India. We will also deploy new capital investmentin the global growth markets and capture the considerable manufacturingopportunities that exist in leading cost competitive countries.
We are committed to sustaining and improving our leadership position in anindustry that continues to offer extraordinary promise and opportunity.
Sincerely,
Charles G. “Chip” McClure Chairman, CEO and President
December 16, 2005
ArvinMeritor, Inc. | 2005 Annual Report
Innovating in Safety, Mobility and the Environment
Through our focus on technology in the areas of safety, mobility and theenvironment, we will create value for our customers who manufacture thevehicles, and for their customers who drive them.
We have the passion and the fortitude to succeed in the motor vehicleindustry. We’ve taken steps to improve our operational performance;eliminate inefficiencies in all areas of the company; deliver the highestquality of service to our customers; diversify our business to achieve anoptimal balance in terms of geography, product and customer mix;develop technology that meets our customers’ needs; and maximizeshareowner return.
To our corporate officer team:
• Jim Donlon was appointed senior vice president and chief financialofficer (CFO) in April 2005. Jim was previously the senior vicepresident and CFO for Kmart Corp., and prior to that, was senior vicepresident and controller for the Chrysler Group at DaimlerChryslerCorp., where he spent 25 years. In his short time with ArvinMeritor,Jim has implemented new processes that will improve the company’sfinancial picture, including a framework for evaluating new businessand capital expenditures, and a greater focus on cash flow, liquidity,and financial planning and forecasting.
• Rakesh Sachdev was named senior vice president of Strategy andCorporate Development, also in April. Rakesh most recently held theposition of vice president and controller. He has significant operationsexperience with ArvinMeritor in the Commercial Vehicle Systems groupand, prior to that, 18 years with Cummins Inc. Rakesh is responsiblefor leading the company’s merger, acquisition and divestiture activities;developing new business opportunities in emerging markets, andexecuting ArvinMeritor’s global business strategies. He has beeninstrumental in the progress we made this year to restructureArvinMeritor and lay the groundwork for future growth objectives.
Winning New Business
Our Light Vehicle Systems business, led by Juan De La Riva, earned manysignificant business contracts despite the challenging market dynamics thataffected this part of our operations in fiscal year 2005. Higher raw-materialcosts, downward pricing pressures and fluctuations in our customers’production schedules challenged our current processes – and forced us toexplore and discover new ways of working. Through an intense focus oncustomer satisfaction, on-time delivery and quality, we secured thefollowing new business contracts this year:
• Multi-panel sunroof system award with a major European OEM; initialproduction to begin in April 2007
• Multi-platform steel wheel contract in North America; production tobegin in January 2007
• Production of the company’s first U.S. diesel particulate filter assemblyfor a popular North American vehicle; scheduled to launch for the2008 model year
• Multi-year contract to provide a leading automotive manufacturer inChina with a complete sealed door module for China’s domesticmarket; shipments are scheduled to start in October 2006
Commercial Vehicle Systems, led by Tom Gosnell, saw record sales andvolumes this year, with a resulting operating income improvement of 18percent over the prior year. We were also successful in further diversifyingour customer base and expanding into new regions of the world.New business contracts within Commercial Vehicle Systems include:
• Nine diesel emissions contracts with seven different customers
• New hybrid vehicle program in partnership with Unicell, Ltd.
• Three-year brake contract with Volvo/Mack

ArvinMeritor, Inc. | 2005 Annual Report
Board of Directors
Charles G. McClure
Chairman of the Board Chief Executive Officerand President
ArvinMeritor, Inc.
Joseph B. Anderson, Jr.
Chairman of the Boardand Chief ExecutiveOfficer
TAG Holdings, LLC
Rhonda L. Brooks
President
R. Brooks Advisors, Inc.
David W. Devonshire
Executive Vice Presidentand Chief FinancialOfficer
Motorola, Inc.
Ivor J. Evans
Retired Vice Chairman
Union Pacific
Joseph P. Flannery
Chairman of the Board President and ChiefExecutive Officer
Uniroyal Holding, Inc.
William D. George, Jr.
Retired President and Chief Executive Officer
S.C. Johnson Wax
Richard W. Hanselman
Chairman of the Board
Forward Air Corporation
Charles H. Harff
Retired SeniorVice President,General Counseland Secretary
Rockwell
Victoria B. Jackson
President
Victoria Bellè, Inc.
James E. Marley
Retired Chairmanof the Board
AMP, Inc.
William R. Newlin
Executive Vice Presidentand Chief AdministrativeOfficer
Dick’s SportingGoods, Inc.
Steven G. Rothmeier
Chairman and Chief Executive Officer
Great Northern Capital
Andrew J. Schindler
Chairman
Reynolds American, Inc.
Corporation

UNITED STATESSECURITIES AND EXCHANGE COMMISSION
Washington, D.C. 20549
FORM 10-KANNUAL REPORT PURSUANT TO SECTION 13 OR 15(D) OF
THE SECURITIES EXCHANGE ACT OF 1934For the Fiscal Year Ended October 2, 2005
Commission file number 1-15983
ARVINMERITOR, INC.(Exact name of registrant as specified in its charter)
Indiana 38-3354643(State or other jurisdiction ofincorporation or organization)
(I.R.S. EmployerIdentification No.)
2135 West Maple RoadTroy, Michigan 48084-7186
(Address of principal executive offices) (Zip Code)
Registrant’s telephone number, including area code: (248) 435-1000
SECURITIES REGISTERED PURSUANT TO SECTION 12(b) OF THE ACT:
Title of each class Name of each exchange on which registered
Common Stock, $1 Par Value (including theassociated Preferred Share Purchase Rights)
New York Stock Exchange
SECURITIES REGISTERED PURSUANT TO SECTION 12(g) OF THE ACT: None
Indicate by check mark whether the registrant is a well-known seasoned issuer, as defined in Rule 405 of the Securities Act.Yes H No h
Indicate by check mark if the registrant is not required to file reports pursuant to Section 13 or Section 15(d) of the Act. Yes h No H
Indicate by check mark whether the registrant (1) has filed all reports required to be filed by Section 13 or 15(d) of the Securities ExchangeAct of 1934 during the preceding 12 months (or for such shorter period that the registrant was required to file such reports), and (2) has beensubject to such filing requirements for the past 90 days. Yes H No h
Indicate by check mark if disclosure of delinquent filers pursuant to Item 405 of Regulation S-K is not contained herein, and willnot be contained, to the best of registrant’s knowledge, in definitive proxy or information statements incorporated by reference in PartIII of this Form 10-K or any amendment to this Form 10-K
Indicate by check mark whether the registrant is an accelerated filer (as defined in Rule 12b-2 of the Act). Yes H No h
Indicate by check mark whether the registrant is a shell company (as defined in Rule 12b-2 of the Act). Yes h No H
The aggregate market value of the registrant’s voting and non-voting common equity held by non-affiliates of the registrant onApril 1, 2005 (the last business day of the most recently completed second fiscal quarter) was approximately $1,067.2 million.
70,315,961 shares of the registrant’s Common Stock, par value $1 per share, were outstanding on October 31, 2005.
DOCUMENTS INCORPORATED BY REFERENCE
Certain information contained in the Proxy Statement for the Annual Meeting of Shareowners of the registrant to be held onJanuary 31, 2006 is incorporated by reference into Part III.


PART I
Item 1. Business.
ArvinMeritor, Inc. (the “company” or “ArvinMeritor”), headquartered in Troy, Michigan, is a global supplier of a broad range ofintegrated systems, modules and components serving light vehicle, commercial truck, trailer and specialty original equipmentmanufacturers and certain aftermarkets.
ArvinMeritor was incorporated in Indiana in 2000 in connection with the merger of Meritor Automotive, Inc. (“Meritor”) and ArvinIndustries, Inc. (“Arvin”). As used in this Annual Report on Form 10-K, the terms “company,” “ArvinMeritor,” “we,” “us” and “our”include ArvinMeritor, its consolidated subsidiaries and its predecessors unless the context indicates otherwise.
The company’s fiscal quarters end on the Sundays nearest December 31, March 31 and June 30, and its fiscal year ends on theSunday nearest September 30. Fiscal year 2005 ended on October 2, 2005 and fiscal year 2004 ended on October 3, 2004. All yearand quarter references relate to our fiscal year and fiscal quarters unless otherwise stated. For ease of presentation, September 30 isutilized consistently throughout this report to represent the fiscal year end.
Whenever an item of this Annual Report on Form 10-K refers to information in the Proxy Statement for the Annual Meeting ofShareowners of ArvinMeritor to be held on January 31, 2006 (the “2006 Proxy Statement”), or under specific captions in Item 7.Management’s Discussion and Analysis of Financial Condition and Results of Operations or Item 8. Financial Statements and SupplementaryData, the information is incorporated in that item by reference.
ArvinMeritor serves a broad range of original equipment manufacturer (“OEM”) customers worldwide, including truck OEMs,light vehicle OEMs, trailer producers and specialty vehicle manufacturers, and certain aftermarkets. Our total sales from continuingoperations in fiscal year 2005 were $8.9 billion. Our ten largest customers accounted for approximately 74% of fiscal year 2005 salesfrom continuing operations. We operated over 120 manufacturing facilities in 25 countries around the world in fiscal year 2005,including facilities operated by discontinued operations and joint ventures in which we have interests. Sales from continuing operationsoutside North America accounted for approximately 49% of total sales from continuing operations in fiscal year 2005. Our continuingoperations also participated in 10 significant non-consolidated joint ventures that generated revenues of approximately $1.5 billionin fiscal year 2005.
In fiscal year 2005, we served customers worldwide through the following businesses:
Continuing Operations:
• Light Vehicle Systems (“LVS”) supplies emissions systems, aperture systems (roof and door systems), undercarriage systems(suspension and ride control systems and wheel products) for passenger cars, all-terrain vehicles, light trucks and sport utilityvehicles to OEMs.
• Commercial Vehicle Systems (“CVS”) supplies drivetrain systems and components, including axles and drivelines, brakingsystems, suspension systems, and exhaust and ride control products for medium- and heavy-duty trucks, trailers andspecialty vehicles to OEMs and to the commercial vehicle aftermarket.
Discontinued Operations:
• Light Vehicle Aftermarket (“LVA”) supplies exhaust, ride control, motion control and filter products and other automotive partsto the passenger car, light truck and sport utility aftermarket.
In October 2004, we announced our intention to divest our LVA business and our coil coating operations, and we transferred thesebusinesses to discontinued operations for accounting purposes. We sold the coil coating operations in November 2004. We continue topursue divestiture of LVA’s operations. See “Strategic Initiatives” below.
Note 23 of the Notes to Consolidated Financial Statements under Item 8. Financial Statements and Supplementary Data containsfinancial information by segment for continuing operations for each of the three years ended September 30, 2005, includinginformation on sales and assets by geographic area for each segment. The heading “Products” below includes information on LVSand CVS sales by product for each of the three fiscal years ended September 30, 2005.
References in this Annual Report on Form 10-K to our being a leading supplier or the world’s leading supplier, and other similarstatements as to our relative market position are based principally on calculations we have made. These calculations are based on
1

information we have collected, including company and industry sales data obtained from internal and available external sources, aswell as our estimates. In addition to such quantitative data, our statements are based on other competitive factors such as ourtechnological capabilities, our research and development efforts and innovations and the quality of our products and services, in eachcase relative to that of our competitors in the markets we address.
Certain Risk Factors
The following industry and market factors could have an adverse effect (which could be material) on our business, results ofoperations or financial condition in the future:
• Cyclicality — We operate in an industry that is cyclical and that has periodically experienced significant year-to-yearfluctuations in demand for vehicles. Production and sales of the vehicles for which we supply products generally depend oneconomic conditions and a variety of other factors, including customer spending and preferences, labor relations andregulatory requirements. Industry cycles are outside our control and cannot be predicted with certainty. See “Seasonality;Cyclicality” below.
• Dependence on Large Customers — We are dependent on large OEM customers that have substantial bargaining powerwith respect to price and other commercial terms. There can be no assurance that we will not lose all or a portion of salesto our large volume customers, or that we will be able to offset continued reduction of prices to these customers withreductions in our costs. In addition, the level of our sales to these customers is dependent on their production and salesvolumes. To the extent that the financial condition, including bankruptcy, or market share of any of our largest customersdeteriorates or their sales otherwise decline, our financial position and results of operations could be adversely affected. See“Customers; Sales and Marketing” below.
• Competition — We operate in a highly competitive industry. Some of our competitors are larger and have greater financialresources or have established relationships with significant customers. In addition, some OEMs manufacture products of thetypes we supply, which can displace our sales. See “Competition” below.
• Raw Materials — A disruption in supply or a significant increase in price of raw materials could impact our production andincrease our costs. In addition, we are dependent on the ability of our suppliers to meet performance and quality specificationsand delivery schedules in order to meet our commitments to our customers. See “Raw Materials and Supplies” below.
• International Operations — We have a significant amount of facilities and operations outside the United States, includinginvestments and joint ventures in developing countries. International operations are subject to a number of risks, including,among others, risks with respect to currency exchange rate fluctuations, local economic and political conditions, difficultiesin repatriating funds, and restrictive legal or regulatory requirements. See “International Operations” below.
• Litigation, Regulatory and Product Liability Exposure — Our business is subject to risks related to the outcome of litigationwith respect to, among other things, environmental and asbestos-related liability. In addition, we are required to comply withfederal, state, local and foreign laws and regulations governing the protection of the environment and occupational healthand safety. There is also an inherent risk of exposure to warranty and product liability claims, as well as product recalls, inthe automotive industry if our products fail to perform to specifications and are alleged to cause property damage, injury ordeath. See “Environmental Matters” and Item 3. Legal Proceedings below.
• Liquidity — Our ability to access the capital markets, and our cost of capital, is dependent in part on our credit ratings. Inthe third quarter of fiscal year 2005, Standard & Poor’s lowered our credit rating to BB from BB+, and Moody’s InvestorsService lowered our credit rating to Ba2 from Ba1. Further declines in our ratings could limit our access to capital marketsand further increase our borrowing costs. See Item 7. Management’s Discussion and Analysis of Financial Condition andResults of Operations — Liquidity and Contractual Obligations below.
• Strategic Initiatives — As part of our business strategy, we continue to review our existing businesses to determine whetherany of them should be modified, restructured, sold or otherwise discontinued, and we regularly consider various strategicand business opportunities to grow our business. We cannot predict with certainty whether any future strategic transactionswill be beneficial to the company. In addition, any future acquisitions could involve risks with respect to successful integrationof operations, increases in debt to finance the acquisition, and achieving projected savings from synergies. See “StrategicInitiatives” below.
• Pension and Retiree Medical Benefits — The automotive industry, like other industries, continues to be impacted by the risingcost of pension and other post-retirement benefits. To partially address this impact, we amended certain retiree medical plans
2

in fiscal year 2004, to phase out current benefits by no later than fiscal year 2023, and to eliminate benefits for Medicaid-eligible retirees beginning in January 2006. (See Item 3. Legal Proceedings for information on class action lawsuits filed inresponse to these amendments.) We also discontinued participation in our defined benefit pension plan for non-union U.S.employees hired after September 30, 2005 and replaced it with additional defined contributions to the company savings plan.
The effect of these and other factors on our financial performance in 2005 is discussed in Item 7. Management’s Discussionand Analysis of Financial Condition and Results of Operations below.
Business Strategies
We are a global supplier of a broad range of integrated systems, modules and components for use in commercial, specialty andlight vehicles worldwide and we have developed market positions as a leader in most of our served markets. We are working to enhanceour leadership positions and capitalize on our existing customer, product and geographic strengths, and to increase sales, earnings andprofitability. To achieve these goals, we are working to: (a) rationalize our operations by eliminating excess capacity, (b) refocus ourbusiness by evaluating our product portfolio to identify our core competencies, and (c) regenerate and grow the businesses that offerattractive returns.
Several significant factors and trends in the automotive industry present opportunities and challenges to industry suppliers andinfluence our business strategies. These factors and trends include the cyclicality of the industry; consolidation and globalization of OEMsand their suppliers; increased outsourcing by OEMs; increased demand for modules and systems by OEMs; pricing pressures from OEMsthat could negatively impact suppliers’ earnings even when sales volumes are increasing; the rising cost of raw materials, primarily steeland energy; and an increasing emphasis on engineering and technology. Our specific business strategies, described below, areinfluenced by these industry factors and trends and are focused on leveraging our resources to create a competitive cost structure.
Minimize the Risks of Cyclicality Through Business Diversity. The automotive industry is cyclical in nature and subject to periodicfluctuations in demand for vehicles. This in turn results in fluctuation in demand for our products. We seek to diversify our businessin order to mitigate the effects of market downturns and better accommodate the changing needs of OEMs. We strive to maintaindiversity in three areas:
• Products. We manufacture and sell a wide range of products in various segments of the automotive market. For fiscal year2005, our annual sales from continuing operations include $4.85 billion for LVS and $4.05 billion for CVS.
• Customers. A diverse customer base helps to mitigate market fluctuations. We have a large customer base comprised of mostmajor vehicle producers.
• Global Presence. Cycles in the major geographic markets of the automotive industry are not necessarily concurrent or related.We seek to maintain a strong global presence and to expand our global operations to mitigate the effect of periodic fluctuationsin demand in one or more geographic areas. A strong global presence also helps to meet the global sourcing needs of ourcustomers.
Focus on Organic Growth While Reviewing Strategic Opportunities. Our goal is to grow businesses that offer attractive returns andare core to our operations. We have identified the areas of our core business that we believe have the most potential for leveraging intoother products and markets, and we are focusing our resources on these areas. We also seek to take advantage of opportunities foroperating synergies and cross selling of products between our light vehicle and commercial vehicle businesses. For example, CVScontinues to adapt products and technologies, originally developed by the LVS emissions technologies business unit, in the developmentof emissions control products for its commercial vehicle customers. See “Products — Commercial Vehicle Systems — Undercarriageand Drivetrain Systems — Emissions Systems” below. In addition, we are exploring opportunities to apply our CVS drivetrain expertisein the development of undercarriage component systems for our LVS customers.
We also consider strategic opportunities that could enhance the company’s growth. Automotive suppliers continue toconsolidate into larger, more efficient and more capable companies and collaborate with each other in an effort to better serve theglobal needs of their OEM customers. We regularly evaluate various strategic and business development opportunities, includinglicensing agreements, marketing arrangements, joint ventures, acquisitions and dispositions. We remain committed to selectivelypursuing alliances and acquisitions that would allow us to leverage our capabilities, gain access to new customers and technologies,enter new product markets and implement our business strategies. We also continue to review the prospects of our existing businessesto determine whether any of them should be modified, restructured, sold or otherwise discontinued. See “Strategic Initiatives” and“Joint Ventures” below for information on recent activities in these areas.
3
Grow Content Per Vehicle Through Technologically Advanced Systems and Modules. Increased outsourcing by OEMs hasresulted in higher overall per vehicle sales by independent suppliers and presents an opportunity for supplier sales growth at a fasterrate than the overall automotive industry growth trend. OEMs are also demanding modules and integrated systems that require littleassembly by the OEM customer.
One of our significant growth strategies is to provide engineering and design expertise, develop new products and improveexisting products that meet these customer needs. We will continue to invest in new technologies and product development and workclosely with our customers to develop and implement design, engineering, manufacturing and quality improvements. We will alsocontinue to integrate our existing product lines by using our design, engineering and manufacturing expertise and teaming withtechnology partners to expand sales of higher-value modules and systems.
Management believes that the strategy of continuing to introduce new and improved systems and technologies will be animportant factor in our efforts to achieve our growth objectives. We will draw upon the engineering resources of our Technical Centersin Detroit, Michigan; Columbus, Indiana; and Augsburg, Germany, and our engineering centers of expertise in the United States, Brazil,Canada, France, Germany, India and the United Kingdom. See “Research and Development” below.
Enhance Core Products to Address Safety and Environmental Issues. Another industry trend is the increasing amount of equipmentrequired for changes in environmental and safety-related regulatory provisions. OEMs select suppliers based not only on the cost and qualityof products, but also on their ability to meet these demands. We use our technological expertise to anticipate trends and to develop productsthat address safety and environmental concerns.
To address safety, our LVS group designs its aperture systems with stronger materials, creates designs that enhance thevehicle’s crashworthiness and develops undercarriage systems that offer improved ride and vehicle control dynamics. Our CVS groupis focusing on the integration of braking and stability products and suspension products, as well as the development of electroniccontrol capabilities. CVS, through its Meritor WABCO joint venture, is also developing braking systems technology to improve brakingperformance and reduce stopping distances for commercial motor vehicles.
With respect to emissions regulations, LVS is an industry leader in emissions technologies that improve fuel economy andreduce air pollutants, while CVS is leveraging our expertise in light vehicle emissions technologies to bring products to the commercialvehicle market. Looking forward, we will continue to seek to develop products that will permit us to assist customers in meeting newand more stringent emissions requirements that will be phased in over the next several years in our North America, European andAsia/Pacific markets.
We believe these more stringent emissions regulations will result in continued growth in Europe, and potential growth in NorthAmerica, of diesel engines. Diesel engines today have the advantage of improved fuel economy, better performance and improvingemissions levels. Through a German subsidiary, LVS began production in 2004 under contracts to provide diesel emissions systemsto light vehicle OEMs in Europe. Approximately 49% of all new vehicles in Europe are sold with diesel engine powertrains.
Strengthen our Presence in Emerging Global Markets. Geographic expansion to meet the global sourcing needs of customersand toaddressnewmarkets is an important element of our growth strategy.ArvinMeritor currently has joint venturesandwholly-ownedsubsidiaries in China and India and participates in programs to support customers as they establish and expand operations inthose markets. We also have wholly-owned operations and regional joint ventures in South America, a market with potential forsignificant growth.
Drive a Continuous Improvement Culture Focused on Return on Capital. The ArvinMeritor Performance System (AMPS) is acontinuous improvement initiative that guides our philosophy for achieving operational excellence, eliminating waste, improvingquality and earning customer loyalty. Throughout the company, continuous improvement teams work to achieve significant costsavings, increase productivity and efficiency and streamline operations. They focus on eliminating non-value-added tasks, reducinglead and cycle times and improving customer service.
A continuous improvement culture is important to our business operations and to maintaining and improving our earnings.Process improvement initiatives are required to achieve our goals with respect to return on invested capital (defined as net incomeplus minority interest plus tax effected interest, divided by total debt plus equity plus minority interest liability) (“ROIC”). We believethat ROIC is a key performance measure, and that our focus on ROIC will help us achieve higher margins, strong cash flow anddebt reduction.
4

Products
ArvinMeritor designs, develops, manufactures, markets, distributes, sells, services and supports a broad range of products for use incommercial, specialty and light vehicles. In addition to sales of original equipment systems and components, we provide our products toOEMs, dealers, distributors, fleets and other end-users in certain aftermarkets.
The following chart sets forth operating segment sales as a percentage of total sales for continuing operations by product foreach of the three fiscal years ended September 30, 2005. A narrative description of the principal products of the two operatingsegments that comprise our continuing operations, as well as the principal products of our discontinued operations (LVA), followsthe chart.
Fiscal Year EndedSeptember 30,
2005 2004 2003
LVS:Emissions Technologies (1) . . . . . . . . . . . . . . . . . . . . . . . . . . . . . . . . . . . . . . . . . . . . . . . . . 29% 33% 35%Aperture Systems . . . . . . . . . . . . . . . . . . . . . . . . . . . . . . . . . . . . . . . . . . . . . . . . . . . . . . . . . 15% 18% 18%Undercarriage Systems . . . . . . . . . . . . . . . . . . . . . . . . . . . . . . . . . . . . . . . . . . . . . . . . . . . . 10% 9% 11%
Total LVS . . . . . . . . . . . . . . . . . . . . . . . . . . . . . . . . . . . . . . . . . . . . . . . . . . . . . . . . . . . . . . 54% 60% 64%
CVS:Undercarriage and Drivetrain Systems . . . . . . . . . . . . . . . . . . . . . . . . . . . . . . . . . . . . . . . 40% 34% 29%Specialty Products (2) . . . . . . . . . . . . . . . . . . . . . . . . . . . . . . . . . . . . . . . . . . . . . . . . . . . . . . 6% 6% 7%
Total CVS . . . . . . . . . . . . . . . . . . . . . . . . . . . . . . . . . . . . . . . . . . . . . . . . . . . . . . . . . . . . . . 46% 40% 36%
Total . . . . . . . . . . . . . . . . . . . . . . . . . . . . . . . . . . . . . . . . . . . . . . . . . . . . . . . . . . . . . . . . . . . . . . . 100% 100% 100%
(1) Prior to January 2003, we owned a minority interest in Zeuna Starker & Co. KG (“Zeuna Starker”), a German emissions systemscompany. At that time, we acquired the remaining interest in Zeuna Starker, and its sales are included in LVS EmissionsTechnologies for fiscal years 2005 and 2004 and for the last three quarters of fiscal year 2003.
(2) In December 2002, we sold our off-highway planetary axle business. Sales from these products are included in CVS SpecialtyProducts for the first quarter of fiscal year 2003.
Light Vehicle Systems
Emissions Technologies
Wearea leadingglobal supplier of a complete lineof exhaust systemsandexhaust systemcomponents, includingmufflers, exhaustpipes, catalytic converters, diesel particulate filters and exhaust manifolds. We sell these products to OEMs primarily as originalequipment, while also supporting manufacturers’ needs for replacement parts and dealers’ needs for service parts. We participate in thisbusiness both directly and through joint ventures and affiliates. These alliances include our 50% interest in Arvin Sango Inc., an exhaustjoint venture based in North America.
See “Business Strategies — Enhance Core Products to Address Safety and Environmental Issues” above for information on theimportance of diesel technology to LVS strategies for future growth.
Aperture Systems
Roof Systems. ArvinMeritor is one of the world’s leading independent suppliers of sunroofs and roof systems products for usein passenger cars, light trucks and sport utility vehicles, including our GoldeT brand sunroofs. We make complete roofs, some of whichincorporate sunroofs, that provide OEMs with cost savings by reducing assembly time and parts. Our roof system manufacturingfacilities are located in North America and Europe.
Door Systems. We are a leading supplier of integrated door modules and systems, including manual and power windowregulators and latch systems. Our power and manual door system products utilize numerous technologies, including our own electricmotors with electronic function capabilities, including anti-squeeze technologies, which are custom designed for individualapplications to maximize operating efficiency and reduce noise levels. We manufacture window regulators at plants in North and SouthAmerica, Europe and the Asia/Pacific region for light vehicle and heavy-duty commercial vehicle OEMs.
5

We also supply manual and power activated latch systems to light vehicle manufacturers. Our access control products includemodular and integrated door latches, actuators, trunk and hood latches and fuel flap locking devices, with a leadership marketposition in Europe. We manufacture access control systems at assembly facilities in North and South America, Europe and theAsia/Pacific region.
Undercarriage Systems
Suspension Systems. Through our 57%-owned joint venture with Mitsubishi Steel Manufacturing Co., we are one of the leadingindependent suppliers of products used in suspension systems for passenger cars, light trucks and sport utility vehicles in NorthAmerica. Our suspension system products, which are manufactured at facilities in the United States and Canada, include coil springs,stabilizer bars and torsion bars.
Suspension Modules. Using our expertise in ride control and vehicle dynamics, we offer final assembly of upper and completecorner modules as well as front and rear cross vehicle modules. This capability gives us the ability to incorporate components thatwe manufacture into these modules, thus enhancing value content.
Ride Control Systems. We provide ride control products, including shock absorbers, struts, ministruts and corner modules.
Wheel Products. We are a leading supplier of steel wheel products to the light vehicle OEM market, principally in North and SouthAmerica. We have wheel manufacturing facilities in Brazil and Mexico. Our wheel products include fabricated steel wheels, bead seatattached wheels, full-face designed wheels and clad wheels with the appearance of a chrome finish. Our cladding process offersenhanced styling options previously available only in aluminum wheels.
Commercial Vehicle Systems
Undercarriage and Drivetrain Systems
Truck Axles. We are one of the world’s leading independent suppliers of axles for medium- and heavy-duty commercial vehicles, withaxle manufacturing facilities located in North America, South America, Europe and the Asia/Pacific region. Our extensive truck axle productline includes a wide range of drive and non-drive front steer axles and single and tandem rear drive axles, which can include driver-controlleddifferential lock for extra traction, aluminum carriers to reduce weight and pressurized filtered lubrication systems for longer life. Our frontsteer and rear drive axles can be equipped with our cam, wedge or disc brakes, automatic slack adjusters and anti-lock braking systems.
Drivelines and Other Products. We also supply universal joints and driveline components, including our PermalubeTM
universal joint and PermalubeTM driveline, which are low maintenance, permanently lubricated designs used in the high mileage on-highway market.
Suspension Systems and Trailer Products. We are one of the world’s leading manufacturers of heavy-duty trailer axles, withleadership positions in North America and in Europe. Our trailer axles are available in over 40 models in capacities from 20,000 to30,000 pounds for virtually all heavy trailer applications and are available with our broad range of brake products, including ABS. Inaddition, we supply trailer air suspension systems and products for which we have strong market positions in Europe and an increasingmarket presence in North America.
Through our 50%-owned joint venture with Randon Participacoes, we develop, manufacture and sell truck suspensions, traileraxles and suspensions and related wheel-end products in the South American market.
Braking Systems. We are a leading independent supplier of air and hydraulic brakes to medium- and heavy-duty commercialvehicle manufacturers in North America and Europe. In Brazil, the third largest truck and trailer market in the world, our 49%-ownedjoint venture with Randon S. A. Veiculos e Implementos is a leading supplier of brakes and brake-related products.
Through manufacturing facilities located in North America and Europe, we manufacture a broad range of foundation air brakes,as well as automatic slack adjusters for brake systems. Our foundation air brake products include cam drum brakes, which offer improvedlining life and tractor/trailer interchangeability; air disc brakes, which provide fade resistant braking for demanding applications; wedgedrum brakes, which are lightweight and provide automatic internal wear adjustment; hydraulic brakes; and wheel end components suchas hubs, drums and rotors.
Federal regulations require that new heavy- and medium-duty vehicles sold in the United States be equipped with anti-lock brakingsystems (“ABS”). Our 50%-owned joint venture with WABCO Automotive Products (“WABCO”), a wholly-owned subsidiary of American
6

Standard Inc., is the leading supplier of ABS and a supplier of other electronic and pneumatic control systems for North American heavy-dutycommercial vehicles. The joint venture also supplies hydraulic ABS to the North American medium-duty truck market and produces stabilitycontrol systems for tractors and trailers, which are designed to help maintain vehicle stability and aid in reducing tractor-trailer rollovers.
Transmissions. In the second quarter of fiscal year 2004, we dissolved our 50%-owned joint venture with ZF FriedrichshafenAG (“ZF”), which produced transmission components and systems for heavy vehicle OEMs and the aftermarket in the United States,Canada and Mexico. The joint venture was replaced by a marketing arrangement that allows us to provide the redesignedFreedomLineTM, a fully automated mechanical truck transmission without a clutch pedal, to our customers. This transmission productline enables us to supply a complete drivetrain system to heavy-duty commercial vehicle manufacturers in North America.
Emissions Systems. CVS has adapted products and applications from the LVS emissions technologies business unit andintroduced new technologies to develop a portfolio of technologically advanced emissions control products and applications to addressincreasingly stringent regulatory standards for diesel particulate matter and nitrogen oxide (NOx) emissions in commercial vehicles.To date, we have nine contracts related to these products and applications, which include:
• Diesel Oxidation Catalysts — capable of removing up to 90% of hydrocarbon and carbon monoxide emissions and 30% ofparticulate matter. This technology is available currently.
• Thermal Regenerator — on demand, active regeneration technology that offers a safe and effective way to remove dieselparticulate matter, using diesel fuel as a heat source, without the use of a catalytic coating or precious metals. This technologyis expected to be released for OEM use in 2006, in preparation for the EPA’s 2007 particulate matter emission standards.
• Catalyzed Diesel Particulate Filter — a filter that traps the diesel particulate matter from the exhaust and prevents it from reachingthe atmosphere. It is expected to be available in 2007 to meet the new 2007 U.S. regulations.
• Selective Catalytic Reduction (SCR) System — a compact, low-weight option to effectively reduce NOx emissions to the levelsrequired tomeet2006and2008Europeanstandards. Thesystemalsoachieves reductionof diesel particulatematter andallowsthe engine to operate in ways that could maximize fuel economy.
• Plasmatron (Plasma Fuel Reformer) — a system that creates a hydrogen-rich gas from any hydrocarbon fuel source, whichenables more efficient control of NOx from diesel engine exhaust, through effective regeneration of “NOx adsorbers” or “leanNOx traps.” This technology could be less sensitive to sulfur contamination and could use less fuel than conventionalregeneration and consume minimal power. This technology, which is expected to be available for production in 2010, alsohas potential for future applications in gasoline combustion engines.
Specialty Products
Off-Highway Vehicle Products. In fiscal year 2005, we supplied brakes in North America, South America, Europe and the Asia/Pacific region, and heavy-duty axles and drivelines in the Asia/Pacific region, for use in numerous off-highway vehicle applications,including construction, material handling, agriculture, mining and forestry. These products are designed to tolerate high tonnagesand operate under extreme conditions. We sold the off-highway brakes business in the first quarter of fiscal year 2006 (see “StrategicInitiatives” below).
Government Products. We supply axles, brakes and brake system components including ABS, trailer products, transfer casesand drivelines for use in medium-duty and heavy-duty military tactical wheeled vehicles, principally in North America.
Specialty Vehicle Products. We supply axles, brakes and transfer cases for use in buses, coaches and recreational, fire and otherspecialty vehicles in North America and Europe, and we are the leading supplier of bus and coach axles and brakes in North America.
Light Vehicle Aftermarket
The principal LVA products include mufflers; exhaust and tail pipes; catalytic converters; shock absorbers; struts; gas liftsupports and vacuum actuators; and automotive oil, air, and fuel filters. These products are sold under the brand names ArvinT
(mufflers); GabrielT (shock absorbers); and PurolatorT (filters). LVA also markets products under private label to customers such asCARQUEST, NAPA and AC Delco (ride control) and Motorcraft, Quaker State, Shell and Mobil (filters).
Customers; Sales and Marketing
ArvinMeritor’s operating segments have numerous customers worldwide and have developed long-standing businessrelationships with many of these customers. Our ten largest customers accounted for approximately 74% of our total sales fromcontinuing operations in fiscal year 2005.
7

Original Equipment. Both LVS and CVS market and sell products principally to OEMs. In North America, CVS also markets truckand trailer products directly to dealers, fleets and other end-users, which may designate the components and systems of a particularsupplier for installation in the vehicles they purchase from OEMs.
Consistent with industry practice, LVS and CVS make most of their sales to OEMs through open purchase orders, which do notrequire the purchase of a minimum number of products. The customer typically may cancel these purchase orders on reasonablenotice. LVS and CVS also sell products to certain customers under long-term arrangements that require us to provide annual costreductions (through price reductions or other cost benefits for the OEMs). If we are unable to generate sufficient cost savings in thefuture to offset such price reductions, our gross margins will be adversely affected (see Item 7. Management’s Discussion and Analysisof Financial Condition and Results of Operations below).
Both LVS and CVS are dependent upon large OEM customers with substantial bargaining power with respect to price and othercommercial terms. Although we believe that our businesses generally enjoy good relations with our OEM customers, loss of all or asubstantial portion of sales to any of our large volume customers for whatever reason (including, but not limited to, loss of marketshare by these customers, loss of contracts, reduced or delayed customer requirements, plant shutdowns, strikes or other workstoppages affecting production by such customers), or continued reduction of prices to these customers, could have a significantadverse effect on our financial results. During fiscal year 2005, DaimlerChrysler AG (which owns Chrysler, Mercedes-Benz AG andFreightliner Corporation), a significant customer of LVS and CVS, accounted for approximately 21% of our total sales from continuingoperations. In addition, sales to General Motors Corporation accounted for approximately 10% and sales to Volkswagen accountedfor approximately 10% of our total sales from continuing operations. No other customer accounted for 10% or more of our total salesfrom continuing operations in fiscal year 2005. These sales include pass-through components that are acquired and incorporatedinto our systems or modules at the customer’s request.
In fiscal year 2005, we were adversely impacted by the weakening financial strength of certain of our customers, which resultedin several customers’ filing for protection under bankruptcy and administration laws. See Item 7. Management’s Discussion andAnalysis of Financial Condition and Results of Operations — Overview and — Results of Operations.
Except as noted above with respect to the North American market for heavy-duty trucks and trailers, LVS and CVS generallycompete for new business from OEMs, both at the beginning of the development of new vehicle platforms and upon the redesign ofexisting platforms. New platform development generally begins two to four years prior to start-up of production.
Aftermarkets. CVS also provides truck and trailer products and off-highway and specialty products to OEMs, dealers anddistributors in the aftermarket. LVA sells products primarily to wholesale distributors, retailers and installers. The light vehicleaftermarket includes fewer and larger customers, as the market consolidates and as OEMs increase their presence in the market.
Competition
Each of ArvinMeritor’s businesses operates in a highly competitive environment. LVS and CVS compete worldwide with a numberof North American and international providers of components and systems, some of which belong to, or are associated with, someof our customers. Some of these competitors are larger and some are smaller than the company in terms of resources and marketshares. The principal competitive factors are price, quality, service, product performance, design and engineering capabilities, newproduct innovation and timely delivery. LVS has numerous competitors across its various product lines worldwide, including Tenneco,Faurecia, Eberspaecher and Benteler (emissions technologies); Webasto, Inalfa and Aisin (roof systems); Brose, Intier, Kiekert AG,Valeo, Aisin and Grupo Antolin (door and access control systems); Tenneco Automotive, ZF, Thyssen-Krupp, Benteler and TRW(suspension modules); Thyssen-Krupp, NHK Spring, Rassini, Mubea and Sogefi (suspension systems); Kayaba Industries, Inc.(“Kayaba”), Tenneco Automotive and Sachs (ride control systems); and Hayes-Lemmerz, Topy, Accuride and CMW (wheel products).The major competitors of CVS are Dana Corporation (“Dana”) (truck axles and drivelines); Knorr/Bremse, Haldex and Dana (brakingsystems); Hendrickson and Neway (suspension systems); Hendrickson and Dana (trailer products); and Eaton Corporation(transmissions). In addition, certain OEMs manufacture for their own use products of the types we supply, and any future increasein this activity could displace LVS and CVS sales.
LVA competes with both OEMs and independent suppliers in North America and Europe and serves the market through our ownsales force, as well as through a network of manufacturers’ representatives. Major competitors include Tenneco Automotive,Goerlich’s, Bosal, Flowmaster, Sebring and Remus (exhaust products); Tenneco Automotive, Kayaba and Sachs (ride controlproducts); Stabilus and Suspa (motion control products); and Champion Laboratories, Honeywell, Dana, Mann & Hummel, SogefiFiltration and Mahle (filtration products). Competitive factors include customer loyalty, competitive pricing, customized service, quality,product availability, timely delivery, product development and manufacturing process efficiency.
8

Raw Materials and Supplies
Prices of raw materials, primarily steel, for our business segments’ manufacturing needs negatively impacted our operatingincome in fiscal year 2005. In addition, we concentrate our purchases of certain raw materials and parts over a limited number ofsuppliers, some of which are located in developing countries, and we are dependent upon the ability of our suppliers to meetperformance and quality specifications and delivery schedules. The loss of a significant supplier or the inability of a supplier to meetperformance and quality specifications or delivery schedules could have an adverse effect on us.
Beginning in the second half of fiscal year 2002, we, along with the automotive industry globally, experienced rising steel pricesand spot shortages of certain steel products. Although availability of steel has improved and we have had some success in recoveringa portion of higher steel prices from our customers, increased steel costs, net of recoveries, negatively impacted our financial resultsin fiscal year 2005. See Item 7. Management’s Discussion and Analysis of Financial Condition and Results of Operations — Resultsof Operations for further information on the effect of these factors on our financial results. While we believe that steel prices arebeginning to moderate, we cannot predict the availability or price of steel in fiscal year 2006 and beyond. We are taking actions tomitigate the effects of steel prices, including alternative sourcing of materials or components, consolidating and selling scrap fromour facilities, re-engineering our products to be less dependent on steel, and negotiating with customers to recover some of theincreased costs. However, if supplies are inadequate for our needs, or if prices remain at current levels or increase and we are unableto either pass these prices to our customer base or otherwise mitigate the costs, our sales and operating income could continue tobe adversely affected.
Some companies in the automotive industry experienced weakening financial strength in fiscal year 2005 that resulted for somein filing for protection under bankruptcy laws. If the weakened financial condition of a significant supplier, or any related labor issuesor work stoppages, were to cause a significant disruption in the supply of parts to our facilities, it could have an adverse effect onus. See Item 7. Management’s Discussion and Analysis of Financial Condition and Results of Operations — Overview.
Strategic Initiatives
As part of our strategy to rationalize and refocus our business, we regularly review the prospects of our existing businesses todetermine whether any of them should be modified, restructured, sold or otherwise discontinued. As part of our strategy to regenerateour profitable businesses, we regularly consider various strategic and business opportunities, including licensing agreements,marketing arrangements and acquisitions.
We believe that the industry in which we operate could experience significant further consolidation among suppliers. This trendis due in part to globalization and increased outsourcing of product engineering and manufacturing by OEMs, and in part to OEMsreducing the total number of their suppliers by more frequently awarding long-term, sole-source or preferred supplier contracts tothe most capable global suppliers. Scale is an important competitive factor, with the largest industry participants able to maximizekey resources and contain costs.
We completed the following strategic initiatives since the beginning of fiscal year 2005 (see Notes 3 and 5 of the Notes toConsolidated Financial Statements under Item 8. Financial Statements and Supplementary Data below):
• In the first quarter of fiscal year 2005, we sold Roll Coater, Inc., a wholly-owned subsidiary that constituted our coil coatingoperations. The transaction, which was part of our strategy to divest non-core businesses, was structured as a stock saleand included five facilities.
• In the first quarter of fiscal year 2005, we sold our LVS automotive stamping and components manufacturing facility inColumbus, Indiana.
• In the first quarter of fiscal year 2006, we sold certain assets of our CVS off-highway brakes business.
In October 2004, we announced our intention to divest the LVA business segment. We believe the divestiture will enable thecompany to focus more resources on our core competencies and thereby better support our OEM customers. We expect to completethe divestiture of LVA in fiscal year 2006. LVA is reported in our financial statements as discontinued operations. See Note 3 of theNotes to Consolidated Financial Statements under Item 8. Financial Statements and Supplementary Data below.
In fiscal year 2005, we announced restructuring plans with respect to continuing operations to eliminate approximately 700–800salaried positions and 1,550 hourly positions and to consolidate, downsize, close or sell 11 global facilities, primarily in the LVS segment.These actions are intended to align capacity with industry conditions, utilize assets more efficiently, improve operations and lower costs.
9

Estimated total costs of $135 million include employee severance and other exit costs, as well as asset impairments. We recordedrestructuring costs of $101 million related to these actions in fiscal year 2005 and expect the remainder of the costs to be recorded byDecember 2006. In fiscal year 2005 we also recorded restructuring charges of (i) $16 million in the LVS segment for severance and otheremployee termination costs (20 salaried and 355 hourly employees) and other costs related to the closure of a Sheffield, England stabilizerbar facility, consolidation of two facilities in Brazil and a reduction in workforce in our operations in Spain, and (ii) $4 million in theCVS segment, relating to severance and other termination benefits (20 employees) as a result of integration of two consolidated jointventures with AB Volvo. See Note 4 of the Notes to Consolidated Financial Statements under Item 8. Financial Statements andSupplementary Data below.
No assurance can be given as to whether or when any additional strategic initiatives will be consummated in the future. We willcontinue to consider acquisitions as a means of growing the company or adding needed technologies, but cannot predict whetherour participation or lack of participation in industry consolidation will ultimately be beneficial to us. If an agreement with respect toany additional acquisitions were to be reached, we may be able to finance such acquisitions by using the cash proceeds of divestituresor by issuing additional debt or equity securities. The additional debt from any such acquisitions, if consummated, could increase ourdebt to capitalization ratio. In addition, the ultimate benefit of any acquisition would depend on our ability to successfully integratethe acquired entity or assets into our existing business and to achieve any projected synergies.
Joint Ventures
As the automotive industry has become more globalized, joint ventures and other cooperative arrangements have become animportant element of our business strategies. As of September 30, 2005, our continuing operations participated in 26 joint ventureswith interests in the United States, Brazil, Canada, China, the Czech Republic, France, Germany, India, Italy, Korea, Mexico, Turkeyand the United Kingdom. At that date, our discontinued operations participated in two joint ventures with interests in India, Venezuelaand Colombia.
In accordance with accounting principles generally accepted in the United States, our consolidated financial statements includethe operating results of those majority-owned joint ventures in which we have control. Significant consolidated joint ventures includeour 57%-owned North American joint venture with Mitsubishi Steel Manufacturing Co. (suspension products for passenger cars, lighttrucks and sport utility vehicles). Significant unconsolidated joint ventures include our 50%-owned North American joint venture withWABCO (ABS systems for heavy-duty commercial vehicles) and our 50% interest in Arvin Sango Inc. (emissions technologies) in theUnited States (see Note 12 of the Notes to Consolidated Financial Statements under Item 8. Financial Statements and SupplementaryData below).
Since the beginning of fiscal year 2005, we completed the following significant initiatives with respect to our joint ventures:
• In the first quarter of fiscal year 2005, we entered into two 51%-owned joint ventures with AB Volvo to produce commercialvehicle drive axles. The joint ventures will manufacture axles at a facility in France and supply them to AB Volvo under theterms of a new supply agreement. We have an option to purchase the remaining interest in one of the joint ventures beginningin 2008.
• In the third quarter of fiscal year 2005, we formed a 60%-owned joint venture with First Auto Works Sihuan Axle Brake Groupin China. The joint venture expects to establish a new facility in the Changchun area to manufacture brakes for the domesticmarket and for export.
• In the fourth quarter of fiscal year 2005, we formed a 50%-owned joint venture with DongWon Precision Industrial Co. Ltd.to supply diesel particulate filters to OEMs in Korea.
Research and Development
We have significant research, development, engineering and product design capabilities. We spent $175 million in fiscal year2005, $156 million in fiscal year 2004 and $160 million in fiscal year 2003 on company-sponsored research, development andengineering. At September 30, 2005, we employed approximately 1,630 professional engineers and scientists.
Patents and Trademarks
We own or license many United States and foreign patents and patent applications in our manufacturing operations and otheractivities. While in the aggregate these patents and licenses are considered important to the operation of our businesses, managementdoes not consider them of such importance that the loss or termination of any one of them would materially affect a business segmentor ArvinMeritor as a whole.
10

Our registered trademarks ArvinMeritorT, ArvinT and MeritorT are important to our business. Other significant trademarksowned by us include PurolatorT (filters) with respect to LVA; FumagalliTM (wheels), Zeuna StarkerT (emissions systems) and GoldeT
(sunroofs) with respect to LVS; and RORTM (trailer axles) with respect to CVS. In connection with the 1997 spin-off of Meritor’s commonstock to the shareowners of Rockwell International Corporation (now Rockwell Automation, Inc., and referred to in this Annual Reporton Form 10-K as “Rockwell”) and the transfer of Rockwell’s automotive businesses to Meritor, Meritor entered into an agreement thatallows us to continue to apply the “Rockwell” brand name to our products until September 30, 2007.
Employees
At September 30, 2005, we had approximately 29,000 full-time employees. At that date, approximately 4,300 employees inthe United States and Canada were covered by collective bargaining agreements and most of our facilities outside of the United Statesand Canada were unionized. We believe our relationship with unionized employees is satisfactory. No significant work stoppages haveoccurred in the past five years.
Environmental Matters
Federal, state and local requirements relating to the discharge of substances into the environment, the disposal of hazardous wastesandotheractivitiesaffecting theenvironmenthave,andwill continue tohave,an impactonourmanufacturingoperations.Werecord liabilitiesfor environmental issues in the accounting period in which our responsibility and remediation plan are established and the cost can bereasonably estimated. At environmental sites in which more than one potentially responsible party has been identified, we record a liabilityfor our allocable share of costs related to our involvement with the site, as well as an allocable share of costs related to insolvent parties orunidentified shares. At environmental sites in which we are the only potentially responsible party, we record a liability for the total estimatedcosts of remediation before consideration of recovery from insurers or other third parties.
We have been designated as a potentially responsible party at seven Superfund sites, excluding sites as to which our recordsdisclose no involvement or as to which our potential liability has been finally determined. Management estimates the total reasonablypossible costs we could incur for the remediation of Superfund sites as of September 30, 2005, to be approximately $28 million, ofwhich $11 million is recorded as a liability. During fiscal year 2005, we recorded environmental remediation costs of $6 millionresulting from a revised estimate to remediate a former Rockwell facility that was sold in 1990.
In addition to Superfund sites, various other lawsuits, claims and proceedings have been asserted against us, alleging violationsof federal, state and local environmental protection requirements or seeking remediation of alleged environmental impairments,principally at previously disposed-of properties. For these matters, management has estimated the total reasonably possible costswe could incur as of September 30, 2005, to be approximately $52 million, of which $13 million is recorded as a liability.
See Note 22 of the Notes to Consolidated Financial Statements under Item 8. Financial Statements and Supplementary Databelow for information on the changes in environmental accruals during fiscal year 2005.
Theprocessof estimatingenvironmental liabilities is complexanddependent onphysical andscientific dataat thesite, uncertaintiesas to remedies and technologies to be used, and the outcome of discussions with regulatory agencies. The actual amount of costs ordamages for which we may be held responsible could materially exceed the foregoing estimates because of uncertainties, including thefinancial condition of other potentially responsible parties, the success of the remediation and other factors that make it difficult to predictactual costs accurately. However, based on management’s assessment, after consulting with Vernon G. Baker, II, Esq., General Counselof ArvinMeritor, and with outside advisors who specialize in environmental matters, and subject to the difficulties inherent in estimatingthese future costs, we believe that our expenditures for environmental capital investment and remediation necessary to comply withpresent regulations governing environmental protection and other expenditures for the resolution of environmental claims will not havea material adverse effect on our business, financial condition or results of operations. In addition, in future periods, new laws andregulations, changes in remediation plans, advances in technology and additional information about the ultimate clean-up remedy couldsignificantly change our estimates. Management cannot assess the possible effect of compliance with future requirements.
International Operations
Approximately 49% of our total assets related to continuing operations as of September 30, 2005 and 49% of fiscal year 2005sales from continuing operations were outside North America. See Note 23 of the Notes to Consolidated Financial Statements underItem 8. Financial Statements and Supplementary Data below for financial information by geographic area for the three fiscal yearsended September 30, 2005.
11

Our international operations are subject to a number of risks inherent in operating abroad, including, but not limited to:
• risks with respect to currency exchange rate fluctuations;
• local economic and political conditions;
• disruptions of capital and trading markets;
• possible terrorist attacks or acts of aggression that could affect vehicle production or the availability of raw materialsor supplies;
• restrictive governmental actions (such as restrictions on transfer of funds and trade protection measures, including exportduties and quotas and customs duties and tariffs);
• changes in legal or regulatory requirements;
• import or export licensing requirements;
• limitations on the repatriation of funds;
• difficulty in obtaining distribution and support;
• nationalization;
• the laws and policies of the United States affecting trade, foreign investment and loans;
• tax laws; and
• labor disruptions.
There can be no assurance that these risks will not have a material adverse impact on our ability to increase or maintain ourforeign sales or on our financial condition or results of operations.
Our operations are exposed to global market risks, including the effect of changes in foreign currency exchange rates. We haveimplemented a foreign currency cash flow hedging program to help reduce the company’s exposure to changes in exchange rates. Weuse foreigncurrency forwardcontracts tomanage thecompany’sexposuresarising fromforeigncurrencyexchange risk.Gainsand losseson the underlying foreign currency exposures are partially offset with gains and losses on the foreign currency forward contracts. Thecontracts generally mature within 12 months. It is our policy not to enter into derivative financial instruments for speculative purposesand, therefore, we hold no derivative instruments for trading purposes. See Item 7. Management’s Discussion and Analysis of FinancialCondition and Results of Operations — Quantitative and Qualitative Disclosures About Market Risk and Note 16 of the Notes toConsolidated Financial Statements under Item 8. Financial Statements and Supplementary Data below.
Seasonality; Cyclicality
LVS and CVS may experience seasonal variations in the demand for products to the extent automotive vehicle productionfluctuates. Historically, for both segments, demand has been somewhat lower in the quarters ended September 30 and December31, when OEM plants may close during model changeovers and vacation and holiday periods. LVA also experiences seasonalvariations in the demand for products. Historically, demand has been somewhat lower in the quarters ended December 31 and March31, when activity relating to the servicing of vehicles is less frequent.
In addition, the industry in which LVS and CVS operate has been characterized historically by periodic fluctuations in overalldemand for trucks, passenger cars and other vehicles for which we supply products, resulting in corresponding fluctuations in demandfor our products. The cyclical nature of the automotive industry is outside our control and cannot be predicted with certainty. Cyclesin the major automotive industry markets of North America and Europe are not necessarily concurrent or related. We have soughtand will continue to seek to expand our operations globally to mitigate the effect of periodic fluctuations in demand of the automotiveindustry in one or more particular countries.
Demand for CVS products can also be affected by pre-buy before the effective date of new regulatory requirements, such aschanges in emissions standards. We believe that stronger heavy-duty truck demand in North America in fiscal year 2002 was partiallydue to the pre-buy before new U.S. emission standards went into effect on October 1, 2002. Implementation of new, more stringent,emissions standards is scheduled for 2007 and 2010 in the U.S. and 2008 in Europe, and we believe that heavy-duty truck demandin these markets could increase prior to the effective dates of the new regulations.
12

The following table sets forth vehicle production in principal markets served by LVS and CVS for the last five fiscal years:
Year Ended September 30,
2005 2004 2003 2002 2001
Light Vehicles (in millions):North America . . . . . . . . . . . . . . . . . . . . . . . . . . . . . . . . . . . . . . . . . . . . . . . . . . . . . . . . 15.6 15.9 16.0 16.3 15.6South America . . . . . . . . . . . . . . . . . . . . . . . . . . . . . . . . . . . . . . . . . . . . . . . . . . . . . . . . 2.7 2.3 2.0 1.9 2.2Western Europe (including Czech Republic) . . . . . . . . . . . . . . . . . . . . . . . . . . . . . . . 16.4 16.9 16.7 16.5 16.9Asia/Pacific . . . . . . . . . . . . . . . . . . . . . . . . . . . . . . . . . . . . . . . . . . . . . . . . . . . . . . . . . . . 22.5 20.9 18.9 17.3 16.9
Commercial Vehicles (in thousands):North America, Heavy-Duty Trucks . . . . . . . . . . . . . . . . . . . . . . . . . . . . . . . . . . . . . . 324 235 164 169 150North America, Medium-Duty Trucks . . . . . . . . . . . . . . . . . . . . . . . . . . . . . . . . . . . . 208 172 141 133 144United States and Canada, Trailers . . . . . . . . . . . . . . . . . . . . . . . . . . . . . . . . . . . . . . 327 284 213 145 208Western Europe, Heavy- and Medium-Duty Trucks . . . . . . . . . . . . . . . . . . . . . . . . 421 376 364 363 386Western Europe, Trailers . . . . . . . . . . . . . . . . . . . . . . . . . . . . . . . . . . . . . . . . . . . . . . . 115 109 98 101 110
Source: Automotive industry publications and management estimates.
We anticipate the North American heavy-duty truck market to decrease approximately 6% in fiscal year 2006, with productionat an estimated 305,000 units. In Western Europe, we expect production of heavy- and medium-duty trucks to remain at approximately421,000 units. Our most recent outlook shows North American and Western European light vehicle production to be 15.6 million and16.4 million vehicles, respectively, during fiscal year 2006. See Item 7. Management’s Discussion and Analysis of Financial Conditionand Results of Operations — Overview and — Results of Operations below for information on the effects of recent market cycleson our sales and earnings.
Available Information
We make available free of charge through our web site (www.arvinmeritor.com) our Annual Report on Form 10-K, QuarterlyReports on Form 10-Q, Current Reports on Form 8-K, all amendments to those reports, and other filings with the Securities andExchange Commission (“SEC”), as soon as reasonably practicable after they are filed.
Cautionary Statement
This Annual Report on Form 10-K contains statements relating to future results of the company (including certain projectionsand business trends) that are “forward-looking statements” as defined in the Private Securities Litigation Reform Act of 1995.Forward-looking statements are typically identified by words or phrases such as “believe,” “expect,” “anticipate,” “estimate,”“should,” “are likely to be,” “will” and similar expressions. Actual results may differ materially from those projected as a result of certainrisks and uncertainties, including but not limited to global economic and market conditions; the demand for commercial, specialtyand light vehicles for which the company supplies products; risks inherent in operating abroad (including foreign currency exchangerates and potential disruption of production and supply due to terrorist attacks or acts of aggression); availability and cost of rawmaterials, including steel; OEM program delays; demand for and market acceptance of new and existing products; successfuldevelopment of new products; reliance on major OEM customers; labor relations of the company, its suppliers and customers,including potential disruptions in supply of parts to our facilities or demand for our products due to work stoppages; the financialcondition of the company’s suppliers and customers, including potential bankruptcies; successful integration of acquired or mergedbusinesses; the ability to achieve the expected annual savings and synergies from past and future business combinations; successand timing of potential divestitures; potential impairment of long-lived assets, including goodwill; competitive product and pricingpressures; the amount of the company’s debt; the ability of the company to access capital markets; credit ratings of the company’sdebt; the outcome of existing and any future legal proceedings, including any litigation with respect to environmental or asbestos-related matters; as well as other risks and uncertainties, including but not limited to those detailed herein and from time to time inother filings of the company with the SEC. See also the following portions of this Annual Report on Form 10-K: Item 1. Business,“Certain Risk Factors”; “Customers; Sales and Marketing”; “Competition”; “Raw Materials and Supplies”; “Strategic Initiatives”;“Environmental Matters”; “International Operations”; and “Seasonality; Cyclicality”; Item 3. Legal Proceedings; and Item 7.Management’s Discussion and Analysis of Financial Condition and Results of Operations. These forward-looking statements are madeonly as of the date hereof, and the company undertakes no obligation to update or revise the forward-looking statements, whetheras a result of new information, future events or otherwise, except as otherwise required by law.
13
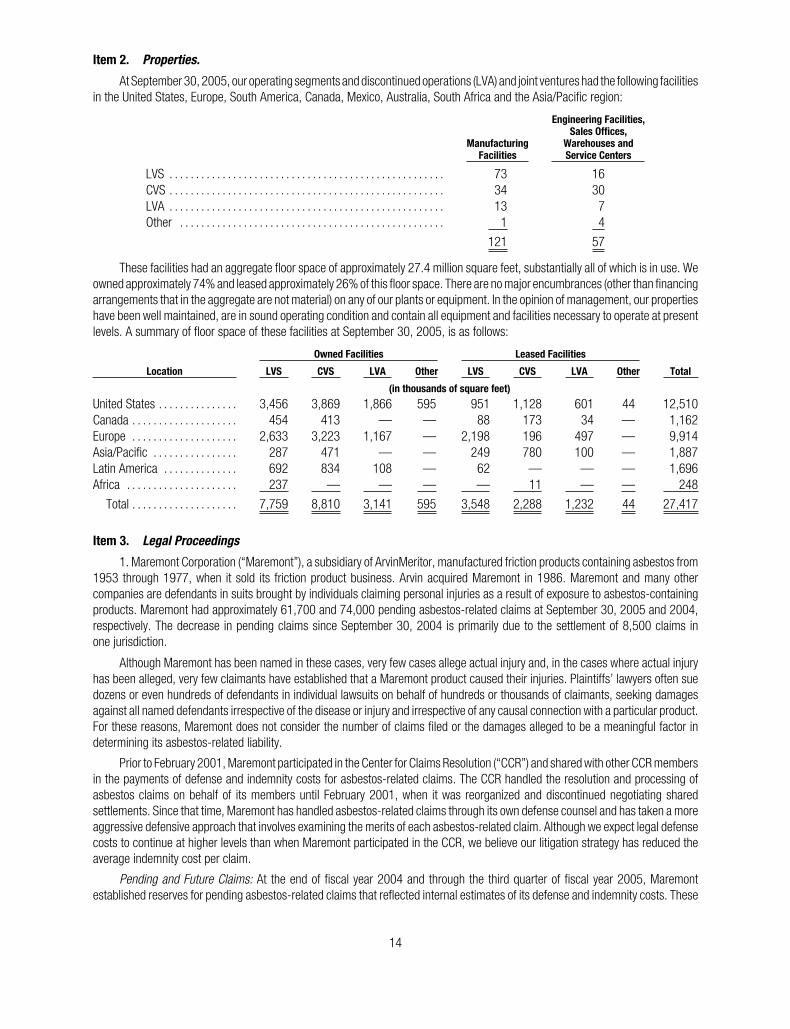
Item 2. Properties.
At September 30, 2005, our operating segments and discontinued operations (LVA) and joint ventures had the following facilitiesin the United States, Europe, South America, Canada, Mexico, Australia, South Africa and the Asia/Pacific region:
ManufacturingFacilities
Engineering Facilities,Sales Offices,
Warehouses andService Centers
LVS . . . . . . . . . . . . . . . . . . . . . . . . . . . . . . . . . . . . . . . . . . . . . . . . . . . . 73 16CVS . . . . . . . . . . . . . . . . . . . . . . . . . . . . . . . . . . . . . . . . . . . . . . . . . . . . 34 30LVA . . . . . . . . . . . . . . . . . . . . . . . . . . . . . . . . . . . . . . . . . . . . . . . . . . . . 13 7Other . . . . . . . . . . . . . . . . . . . . . . . . . . . . . . . . . . . . . . . . . . . . . . . . . . 1 4
121 57
These facilities had an aggregate floor space of approximately 27.4 million square feet, substantially all of which is in use. Weowned approximately 74% and leased approximately 26% of this floor space. There are no major encumbrances (other than financingarrangements that in the aggregate are not material) on any of our plants or equipment. In the opinion of management, our propertieshave been well maintained, are in sound operating condition and contain all equipment and facilities necessary to operate at presentlevels. A summary of floor space of these facilities at September 30, 2005, is as follows:
Owned Facilities Leased Facilities
Location LVS CVS LVA Other LVS CVS LVA Other Total
(in thousands of square feet)
United States . . . . . . . . . . . . . . . 3,456 3,869 1,866 595 951 1,128 601 44 12,510Canada . . . . . . . . . . . . . . . . . . . . 454 413 — — 88 173 34 — 1,162Europe . . . . . . . . . . . . . . . . . . . . 2,633 3,223 1,167 — 2,198 196 497 — 9,914Asia/Pacific . . . . . . . . . . . . . . . . 287 471 — — 249 780 100 — 1,887Latin America . . . . . . . . . . . . . . 692 834 108 — 62 — — — 1,696Africa . . . . . . . . . . . . . . . . . . . . . 237 — — — — 11 — — 248
Total . . . . . . . . . . . . . . . . . . . . 7,759 8,810 3,141 595 3,548 2,288 1,232 44 27,417
Item 3. Legal Proceedings
1. Maremont Corporation (“Maremont”), a subsidiary of ArvinMeritor, manufactured friction products containing asbestos from1953 through 1977, when it sold its friction product business. Arvin acquired Maremont in 1986. Maremont and many othercompanies are defendants in suits brought by individuals claiming personal injuries as a result of exposure to asbestos-containingproducts. Maremont had approximately 61,700 and 74,000 pending asbestos-related claims at September 30, 2005 and 2004,respectively. The decrease in pending claims since September 30, 2004 is primarily due to the settlement of 8,500 claims inone jurisdiction.
Although Maremont has been named in these cases, very few cases allege actual injury and, in the cases where actual injuryhas been alleged, very few claimants have established that a Maremont product caused their injuries. Plaintiffs’ lawyers often suedozens or even hundreds of defendants in individual lawsuits on behalf of hundreds or thousands of claimants, seeking damagesagainst all named defendants irrespective of the disease or injury and irrespective of any causal connection with a particular product.For these reasons, Maremont does not consider the number of claims filed or the damages alleged to be a meaningful factor indetermining its asbestos-related liability.
Prior to February 2001, Maremont participated in the Center for Claims Resolution (“CCR”) and shared with other CCR membersin the payments of defense and indemnity costs for asbestos-related claims. The CCR handled the resolution and processing ofasbestos claims on behalf of its members until February 2001, when it was reorganized and discontinued negotiating sharedsettlements. Since that time, Maremont has handled asbestos-related claims through its own defense counsel and has taken a moreaggressive defensive approach that involves examining the merits of each asbestos-related claim. Although we expect legal defensecosts to continue at higher levels than when Maremont participated in the CCR, we believe our litigation strategy has reduced theaverage indemnity cost per claim.
Pending and Future Claims: At the end of fiscal year 2004 and through the third quarter of fiscal year 2005, Maremontestablished reserves for pending asbestos-related claims that reflected internal estimates of its defense and indemnity costs. These
14

estimates were based on the history and nature of filed claims to date and Maremont’s experience with historical indemnity andlitigation costs, using data from actual CCR settlements, experience in resolving claims since dissolution of the CCR, and Maremont’sassessment of the nature of pending claims. Maremont did not accrue reserves for its potential liability for asbestos-related claimsthat may be asserted against it in the future because it did not have sufficient information to make a reasonable estimate of theseunknown claims.
In the fourth quarter of fiscal year 2005, Maremont engaged Bates White LLC (“Bates White”), a consulting firm with extensiveexperience estimating costs associated with asbestos litigation, to assist with determining whether it would be possible to estimatethe cost of resolving pending and future asbestos-related claims that have been, and could reasonably be expected to be, filed againstMaremont, as well as the cost of Maremont’s share of committed but unpaid settlements entered into by the CCR. Although it is notpossible to estimate the full range of costs because of various uncertainties, Bates White advised Maremont that it would be able todetermine an estimate of a reasonable forecast of the cost of resolving pending and future asbestos-related claims based on historicaldata and certain assumptions with respect to events that occur in the future.
The resulting study by Bates White provided an estimate of the reasonably possible range of Maremont’s obligation for asbestospersonal injury claims over the next three to four years of $36 million to $55 million. After consultation with Bates White, Maremontdetermined the most likely and probable liability for pending and future claims over the next four years is $50 million. The ultimatecost of resolving pending and future claims is estimated based on the history of claims and expenses for plaintiffs represented by lawfirms in jurisdictions with an established history with Maremont (see Note 22 of the Notes to Consolidated Financial Statements underItem 8. Financial Statements and Supplementary Data for a description of the assumptions included in the Bates White study). Thesignificant reduction in the liability since September 30, 2004 is a result of both an overall reduction in pending claims and the resultsof the study by Bates White, which estimates a value for pending and future claims that are expected to be settled. Maremont hadpreviously estimated a settlement value on all pending claims.
Shortfall: Maremont is also subject to claims for payment of a portion of claims against several former members of the CCR thathave filed for bankruptcy protection, and have failed, or may fail, to pay certain financial obligations with respect to settlements thatwere reached on their behalf by the CCR. These defaulted member shares are referred to as “shortfall.” In an effort to resolve theaffected settlements, Maremont has entered into negotiations with plaintiffs’ attorneys, and an estimate of Maremont’s obligationsfor the shortfall is included in the total asbestos-related reserves. In addition, Maremont and its insurers are engaged in legalproceedings to determine whether existing insurance coverage should reimburse any potential liability related to this issue.
Recoveries: Maremont has insurance that reimburses a substantial portion of the costs incurred defending against asbestos-related claims. The coverage also reimburses Maremont for any indemnity paid on those claims. The coverage is provided by severalinsurance carriers based on insurance agreements in place. The recorded asbestos-related insurance receivable incorporateshistorical information with respect to buy-outs and settlements of coverage and excludes any policies in dispute.
At September 30, 2005, Maremont had established reserves of $54 million relating to these potential asbestos-related liabilitiesand corresponding asbestos-related recoveries of $35 million. The difference between the estimated liability and insurance receivableis related to proceeds received from settled insurance policies and liabilities for shortfall and other. Certain insurance policies havebeen settled in cash prior to the ultimate settlement of related asbestos liabilities. Amounts received from insurance settlementsgenerally reduce recorded insurance receivables. Receivables for policies in dispute are not recorded. In fiscal year 2005, the companyreceived $12 million associated with the settlement of certain insurance policies. (See Note 22 of the Notes to Consolidated FinancialStatements under Item 8. Financial Statements and Supplementary Data.)
The amounts recorded for the asbestos-related reserves and recoveries from insurance companies are based upon assumptionsand estimates derived from currently known facts. All such estimates of liabilities for asbestos-related claims are subject to considerableuncertainty because such liabilities are influenced by variables that are difficult to predict. The future litigation environment for Maremontcould change significantly from its past experience, due, for example, to changes in the mix of claims filed against Maremont in termsof plaintiffs’ law firm, jurisdiction and disease; legislative or regulatory developments; Maremont’s approach to defending claims; orpayments to plaintiffs from other defendants. Estimated recoveries are influenced by coverage issues among insurers and the continuingsolvency of various insurance companies. If the assumptions with respect to the nature of pending claims, the cost to resolve claims andthe amount of available insurance prove to be incorrect, the actual amount of Maremont’s liability for asbestos-related claims, and theeffect on ArvinMeritor, could differ materially from current estimates and, therefore, could have a material impact on the company’sfinancial position and results of operations.
2. ArvinMeritor, along with many other companies, has also been named as a defendant in lawsuits alleging personal injury asa result of exposure to asbestos used in certain components of Rockwell products many years ago. Liability for these claims was
15

transferred to the company at the time of the spin-off of the automotive business to Meritor from Rockwell in 1997. Currently thereare thousands of claimants in lawsuits that name us, together with many other companies, as defendants. However, we do not considerthe number of claims filed or the damages alleged to be a meaningful factor in determining asbestos-related liability. A significantportion of the claims do not identify any of Rockwell’s products or specify which of the claimants, if any, were exposed to asbestosattributable to Rockwell’s products, and past experience has shown that the vast majority of the claimants will never identify any ofRockwell’s products. For those claimants who do show that they worked with Rockwell’s products, we nevertheless believe we havemeritorious defenses, in substantial part due to the integrity of the products involved, the encapsulated nature of any asbestos-containing components, and the lack of any impairing medical condition on the part of many claimants. We defend these casesvigorously. Historically, ArvinMeritor has been dismissed from the vast majority of these claims with no payment to claimants.
Rockwell maintained insurance coverage that we believe covers indemnity and defense costs, over and above self-insuranceretentions, for most of these claims. We have initiated claims against these carriers to enforce the insurance policies. Although thestatus of one carrier as a financially viable entity is in question, we expect to recover the majority of defense and indemnity costs wehave incurred to date, over and above self-insured retentions, and a substantial portion of the costs for defending asbestos claimsgoing forward. The uncertainties of asbestos claim litigation and resolution of the litigation with our insurance companies make itdifficult to predict accurately the ultimate resolution of asbestos claims. That uncertainty is increased by the possibility of adverserulings or new legislation affecting asbestos claim litigation or the settlement process. Subject to these uncertainties and based onour experience defending these asbestos claims, we do not believe these lawsuits will have a material adverse effect on ourfinancial condition.
ArvinMeritor has not established reserves for pending claims or for corresponding recoveries for Rockwell-legacy asbestos-related claims, and defense and indemnity costs related to these claims are expensed as incurred. Reserves have not been establishedbecause management cannot reasonably estimate the ultimate liabilities for these costs, primarily because we do not have a sufficienthistory of claims settlement and defense costs from which to develop reliable assumptions.
Rockwell was not a member of the CCR and handled its asbestos-related claims using its own litigation counsel. As a result,we do not have any additional potential liabilities for committed CCR settlements or shortfall (as described above) in connection withthe Rockwell-legacy cases.
3. Three separate class action lawsuits were filed in the United States District Court for the Eastern District of Michigan in 2003and 2004 against the company and Rockwell as a result of modifications made by the company to its retiree medical benefits. (See Item7. Management’s Discussion and Analysis of Financial Condition and Results of Operation — Overview and — Critical AccountingPolicies — Retiree Medical and Note 19 of the Notes to Consolidated Financial Statements under Item 8. Financial Statements andSupplementary Data for information with respect to changes made to the company’s retiree medical benefits and the related accountingand financial impacts.) The lawsuits allege that the changes breach the terms of various collective bargaining agreements entered intowith the United Auto Workers and the United Steel Workers at former facilities that have either been closed or sold and are located inWisconsin, Pennsylvania, Indiana, Ohio, Kentucky, Illinois and Michigan. The complaints also allege a companion claim under theEmployee Retirement Income Security Act of 1974 (ERISA) essentially restating the alleged collective bargaining breach claims andseeking to bring them under ERISA. Plaintiffs seek an injunction requiring the defendants to provide lifetime retiree health care benefitsunder the applicable collective bargaining agreements, plus costs and attorneys’ fees, as well as punitive and unspecified damages formental distress and anguish. The company believes that it has meritorious defenses to these actions and plans to defend these suits vigorously.
4. See Item 1. Business, “Environmental Matters” for information relating to environmental proceedings.
5. Various other lawsuits, claims and proceedings have been or may be instituted or asserted against ArvinMeritor or oursubsidiaries relating to the conduct of our business, including those pertaining to product liability, intellectual property, safety andhealth, and employment matters. Although the outcome of litigation cannot be predicted with certainty and some lawsuits, claims orproceedings may be disposed of unfavorably to ArvinMeritor, management believes, after consulting with Vernon G. Baker, II, Esq.,ArvinMeritor’s General Counsel, that the disposition of matters that are pending will not have a material adverse effect on our business,financial condition or results of operations.
Item 4. Submission of Matters to a Vote of Security Holders.
There were no matters submitted to a vote of security holders during the fourth quarter of fiscal year 2005.
16

Item 4A. Executive Officers of the Registrant
The name, age, positions and offices held with ArvinMeritor and principal occupations and employment during the past five yearsof each of our executive officers as of October 31, 2005, are as follows:
Charles G. McClure, Jr., 52 — Chairman of the Board, Chief Executive Officer and President since August 2004. ChiefExecutive Officer of Federal-Mogul Corporation (automotive supplier) from July 2003 to July 2004; President and Chief OperatingOfficer of Federal-Mogul Corporation from January 2001 to July 2003; President and Chief Executive Officer of Detroit DieselCorporation (automotive supplier) from 1997 to December 2000.
Vernon G. Baker, II, 52 — Senior Vice President and General Counsel since July 2000. Secretary from July 2000 toNovember 2001.
Brian P. Casey, 50 — Vice President and Treasurer since July 2003. Vice President, Global Systems of Lear Corporation(automotive supplier) from September 2002 to July 2003; Assistant Treasurer of Lear Corporation from June 2000 toSeptember 2002.
Linda M. Cummins, 58 — Senior Vice President, Communications since July 2000.
William K. Daniel, 40 — Senior Vice President and President, Light Vehicle Aftermarket since July 2000.
Juan L. De La Riva, 61 — Senior Vice President and President, Light Vehicle Systems since August 2003. Senior VicePresident, Corporate Development & Strategy, Engineering and Procurement from October 2001 to August 2003; Senior VicePresident, Corporate Development and Strategy from July 2000 to October 2001.
James D. Donlon, III, 59 — Senior Vice President and Chief Financial Officer since April 2005. Senior Vice President and ChiefFinancial Officer of Kmart Corporation (retailer) from January 2004 to March 2005; Senior Vice President and Controller of the ChryslerDivision of DaimlerChrysler Corporation (automotive) from 1998 to 2003.
Thomas A. Gosnell, 55 — Senior Vice President and President, Commercial Vehicle Systems since November 2000. SeniorVice President and President, Heavy Vehicle Systems Aftermarket Products from July 2000 to November 2000.
Perry L. Lipe, 59 — Senior Vice President and Chief Information Officer since July 2000.
Rakesh Sachdev, 49 — Senior Vice President, Corporate Strategy, since April 2005. Vice President and Controller fromAugust 2003 to March 2005; Vice President and General Manager, Worldwide Braking Systems from December 2000 to July 2003;Vice President and General Manager, Worldwide Trailer Products from July 2000 to December 2000.
Ernest T. Whitus, 50 — Senior Vice President, Human Resources, since April 2001. Vice President, Human Resources-Commercial Vehicle Systems from July 2000 to April 2001.
Bonnie Wilkinson, 55 — Vice President and Secretary since November 2001. Assistant General Counsel from July 2000 toNovember 2001.
There are no family relationships, as defined in Item 401 of Regulation S-K, between any of the above executive officers andany director, executive officer or person nominated to become a director or executive officer. No officer of ArvinMeritor was selectedpursuant to any arrangement or understanding between him or her and any person other than ArvinMeritor. All executive officers areelected annually.
17
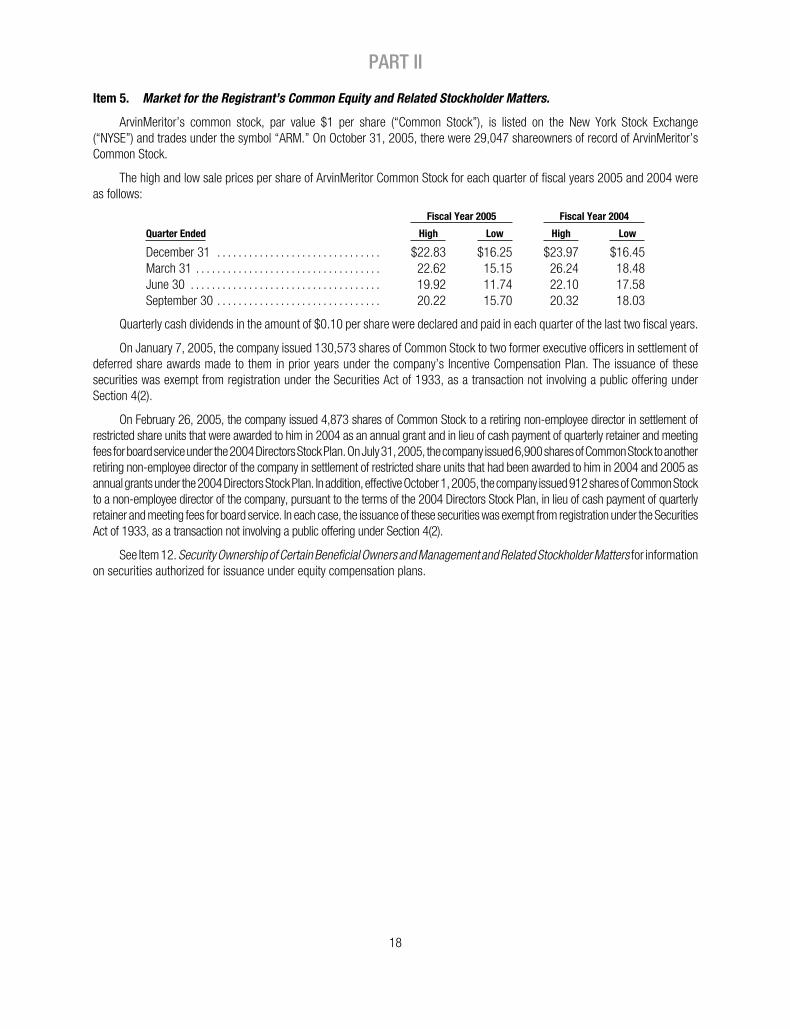
PART II
Item 5. Market for the Registrant’s Common Equity and Related Stockholder Matters.
ArvinMeritor’s common stock, par value $1 per share (“Common Stock”), is listed on the New York Stock Exchange(“NYSE”) and trades under the symbol “ARM.” On October 31, 2005, there were 29,047 shareowners of record of ArvinMeritor’sCommon Stock.
The high and low sale prices per share of ArvinMeritor Common Stock for each quarter of fiscal years 2005 and 2004 wereas follows:
Fiscal Year 2005 Fiscal Year 2004
Quarter Ended High Low High Low
December 31 . . . . . . . . . . . . . . . . . . . . . . . . . . . . . . . $22.83 $16.25 $23.97 $16.45March 31 . . . . . . . . . . . . . . . . . . . . . . . . . . . . . . . . . . . 22.62 15.15 26.24 18.48June 30 . . . . . . . . . . . . . . . . . . . . . . . . . . . . . . . . . . . . 19.92 11.74 22.10 17.58September 30 . . . . . . . . . . . . . . . . . . . . . . . . . . . . . . . 20.22 15.70 20.32 18.03
Quarterly cash dividends in the amount of $0.10 per share were declared and paid in each quarter of the last two fiscal years.
On January 7, 2005, the company issued 130,573 shares of Common Stock to two former executive officers in settlement ofdeferred share awards made to them in prior years under the company’s Incentive Compensation Plan. The issuance of thesesecurities was exempt from registration under the Securities Act of 1933, as a transaction not involving a public offering underSection 4(2).
On February 26, 2005, the company issued 4,873 shares of Common Stock to a retiring non-employee director in settlement ofrestricted share units that were awarded to him in 2004 as an annual grant and in lieu of cash payment of quarterly retainer and meetingfees forboardserviceunder the2004DirectorsStockPlan.OnJuly31,2005, thecompany issued6,900sharesofCommonStock toanotherretiring non-employee director of the company in settlement of restricted share units that had been awarded to him in 2004 and 2005 asannualgrantsunder the2004DirectorsStockPlan. Inaddition,effectiveOctober1,2005, thecompany issued912sharesofCommonStockto a non-employee director of the company, pursuant to the terms of the 2004 Directors Stock Plan, in lieu of cash payment of quarterlyretainer and meeting fees for board service. In each case, the issuance of these securities was exempt from registration under the SecuritiesAct of 1933, as a transaction not involving a public offering under Section 4(2).
See Item 12. Security Ownership of Certain Beneficial Owners and Management and Related Stockholder Matters for informationon securities authorized for issuance under equity compensation plans.
18

Item 6. Selected Financial Data.
The following sets forth selected consolidated financial data. The data should be read in conjunction with the information includedunder Item 7. Management’s Discussion and Analysis of Financial Condition and Results of Operations and Item 8. FinancialStatements and Supplementary Data below.
Year Ended September 30,
SUMMARY OF OPERATIONS 2005 2004 2003 2002 2001
SalesLight Vehicle Systems . . . . . . . . . . . . . . . . . . . . . . . . . . . . . . . . . . . . . . . . . . . $4,849 $4,818 $4,301 $3,541 $3,503Commercial Vehicle Systems . . . . . . . . . . . . . . . . . . . . . . . . . . . . . . . . . . . . . 4,054 3,215 2,422 2,249 2,199
Total . . . . . . . . . . . . . . . . . . . . . . . . . . . . . . . . . . . . . . . . . . . . . . . . . . . . . . . . . . $8,903 $8,033 $6,723 $5,790 $5,702
Income from Continuing Operations (1) . . . . . . . . . . . . . . . . . . . . . . . . . . . . $ 33 $ 127 $ 100 $ 96 $ 5Income (Loss) from Discontinued Operations (2) . . . . . . . . . . . . . . . . . . . . (21) (169) 37 53 30
Income (Loss) Before Cumulative Effect of Accounting Change . . . . . . . . 12 (42) 137 149 35Cumulative Effect of Accounting Change, Net of Tax . . . . . . . . . . . . . . . . . — — (4) (42) —
Net Income (Loss) . . . . . . . . . . . . . . . . . . . . . . . . . . . . . . . . . . . . . . . . . . . . . . $ 12 $ (42) $ 133 $ 107 $ 35
BASIC EARNINGS (LOSS) PER SHAREContinuing Operations (1) . . . . . . . . . . . . . . . . . . . . . . . . . . . . . . . . . . . . . . . . $ 0.48 $ 1.89 $ 1.50 $ 1.44 $ 0.08Discontinued Operations (2) . . . . . . . . . . . . . . . . . . . . . . . . . . . . . . . . . . . . . . (0.31) (2.51) 0.55 0.80 0.45Cumulative Effect of Accounting Change . . . . . . . . . . . . . . . . . . . . . . . . . . . — — (0.06) (0.63) —
Basic earnings (loss) per share . . . . . . . . . . . . . . . . . . . . . . . . . . . . . . . . . . . $ 0.17 $ (0.62) $ 1.99 $ 1.61 $ 0.53
DILUTED EARNINGS (LOSS) PER SHAREContinuing Operations (1) . . . . . . . . . . . . . . . . . . . . . . . . . . . . . . . . . . . . . . . . $ 0.47 $ 1.85 $ 1.48 $ 1.43 $ 0.08Discontinued Operations (2) . . . . . . . . . . . . . . . . . . . . . . . . . . . . . . . . . . . . . . (0.30) (2.46) 0.54 0.79 0.45Cumulative Effect of Accounting Change . . . . . . . . . . . . . . . . . . . . . . . . . . . — — (0.06) (0.63) —
Diluted earnings (loss) per share . . . . . . . . . . . . . . . . . . . . . . . . . . . . . . . . . . $ 0.17 $ (0.61) $ 1.96 $ 1.59 $ 0.53
Cash dividends per share . . . . . . . . . . . . . . . . . . . . . . . . . . . . . . . . . . . . . . . . $ 0.40 $ 0.40 $ 0.40 $ 0.40 $ 0.76
FINANCIAL POSITION AT SEPTEMBER 30Total assets . . . . . . . . . . . . . . . . . . . . . . . . . . . . . . . . . . . . . . . . . . . . . . . . . . . . $5,870 $5,639 $5,448 $4,717 $4,408Short-term debt . . . . . . . . . . . . . . . . . . . . . . . . . . . . . . . . . . . . . . . . . . . . . . . . 131 3 18 15 93Long-term debt . . . . . . . . . . . . . . . . . . . . . . . . . . . . . . . . . . . . . . . . . . . . . . . . . 1,451 1,487 1,541 1,473 1,370
(1) Fiscal year 2005 income from continuing operations and related diluted earnings per share include restructuring charges of$117 million ($72 million after-tax, or $1.03 per share), charges associated with certain customer bankruptcies of $14 million($9 million after-tax, or $0.13 per share), environmental charges of $7 million ($4 million after-tax, or $0.06 per share), and a gainon divestitures of $4 million ($3 million after-tax, or $0.04 per share). Fiscal year 2004 income from continuing operations andrelated diluted earnings per share include restructuring charges of $15 million ($11 million after-tax, or $0.16 per share),environmental remediation charges of $11 million ($8 million after-tax, or $0.12 per share), a withdrawn tender offer net chargeof $9 million ($6 million after-tax, or $0.09 per share), and a gain on sale of a ride control joint venture of $20 million. Fiscal year2003 income from continuing operations and related diluted earnings per share include restructuring charges of $20 million ($14million after-tax, or $0.21 per share) and a gain on divestitures of $15 million ($11 million after-tax, or $0.15 per share). Fiscalyear 2002 income from continuing operations and diluted earnings per share includes restructuring charges of $11 million ($8million after-tax, or $0.13 per share). Fiscal year 2001 income from continuing operations and diluted earnings per share includerestructuring charges of $67 million ($45 million after-tax, or $0.68 per share), an employee separation charge of $12 million ($8million after-tax, or $0.12 per share), and an environmental charge of $5 million ($3 million after-tax, or $0.05 per share).
(2) Fiscal year 2005 includes a non-cash impairment charge of $43 million ($28 million after-tax) to record certain North AmericanLVA businesses at fair value. Fiscal year 2004 includes a non-cash goodwill impairment charge of $190 million ($2.77 perdiluted share) in our LVA business.
19

Item 7. Management’s Discussion and Analysis of Financial Conditions and Results of Operations.
Overview
ArvinMeritor is a global supplier of a broad range of integrated systems, modules and components to the motor vehicle industry.The company serves light vehicle, commercial truck, trailer and specialty original equipment manufacturers and certain aftermarkets.Headquartered in Troy, Michigan, the company employs approximately 29,000 people at more than 120 manufacturing facilities in25 countries. ArvinMeritor common stock is traded on the New York Stock Exchange under the ticker symbol ARM.
Our business continues to address a number of challenging industry-wide issues including:
• Excess capacity;
• High commodity prices, particularly steel and energy, including high oil prices;
• Weakened financial strength of some original equipment manufacturers (OEM) and suppliers;
• Changing production volumes at our OEM customers and changes in product mix in North America;
• OEM pricing pressures; and
• Currency exchange rate volatility.
In response to these issues, we continue to rationalize, restructure and refocus our businesses. During fiscal year 2005, weannounced certain restructuring plans, including the elimination of salaried positions and the consolidation, downsizing, closure orsale of 11 underperforming facilities. These actions, which are primarily targeted at our Light Vehicle Systems (LVS) business segment,are intended to align capacity with industry conditions, utilize assets more efficiently, improve operations and lower costs. We expectthe total estimated cost of these actions to be approximately $135 million, of which approximately $110 million will be cash costs.These estimated costs are comprised of the following:
• Employee severance costs related to the reduction of approximately 400 to 500 salaried employees across the entire company;
• Employee severance and facility shutdown costs associated with the closure, sale or consolidation of a number of LVSfacilities, and the reduction of approximately 250 salaried and 1,350 hourly employees associated with these facilities. Theseheadcount reductions are in addition to the 400 to 500 salaried employees noted above;
• Employee severance and facility shutdown costs associated with the closure or consolidation of several Commercial VehicleSystems (CVS) facilities, and the reduction of approximately 50 salaried and 200 hourly employees associated with thesefacilities. These headcount reductions are in addition to the 400 to 500 salaried employees noted above; and
• Impairment of long-lived assets, primarily machinery and equipment associated with the closure or consolidation ofthese facilities.
We recorded restructuring costs of $101 million related to these actions during fiscal year 2005. These costs included$71 million of employee termination benefits, $26 million of asset impairment charges and $4 million of other costs associated withthe closure of facilities. In accordance with accounting principles generally accepted in the United States, we expect the remainderof the restructuring costs to be recorded in the next 12 months.
In addition to these actions, in the first quarter of fiscal year 2005, we announced the closure of a Sheffield, England, stabilizer barfacility owned by our 57-percent owned consolidated joint venture, Meritor Suspensions Systems Company (MSSC). Total restructuringcosts recorded in fiscal year 2005 related to this action were $9 million and primarily related to severance and asset impairments.
Despite the significant challenges that the entire automotive industry continues to face, our CVS business segment reported recordsales. This was primarily due to higher production volumes at many of our CVS customers. When compared to the prior year, North Americanheavy-duty (commonly referred to as Class 8 trucks) increased approximately 38 percent, while Western European heavy and medium dutytruck production volumes increased approximately 12 percent. Additionally, in the first quarter of fiscal year 2005, CVS formed twoconsolidated joint ventures in France with AB Volvo to manufacture and distribute axles. These joint ventures increased sales $226 million.
A summary of our results for fiscal year 2005 is as follows:
• Sales were $8.9 billion, up 11 percent from fiscal year 2004. The increase in sales is primarily attributable to CVS.
• Operating margins were 1.5 percent, down from 3.2 percent a year ago. Fiscal year 2005 operating income includes $117million of restructuring costs, of which $101 million is associated with our fiscal year 2005 programs announced in May.
20

• Diluted earnings per share from continuing operations were $0.47, compared to $1.85 per share in fiscal year 2004.
• Diluted loss per share from discontinued operations was $0.30, compared to diluted loss per share of $2.46 in fiscal year2004. Fiscal year 2005 included an impairment charge of $0.40 per diluted share and fiscal year 2004 included a goodwillimpairment charge of $2.77 per diluted share.
• Net income was $12 million or $0.17 per diluted share, compared to net loss of $42 million, or $0.61 per diluted share,last year.
During fiscal year 2005, the industries in which we operate continued to experience substantial increases in the cost of steel,a significant raw material we use to make our products. In fiscal year 2005, we experienced steel price increases, net of customerrecoveries, of approximately $90 million compared to fiscal year 2004.
In addition to higher steel costs, intense competition, coupled with global excess capacity most notably in the light vehicleindustry, has created pressure from our customers to reduce our selling prices. We continuously work to address these competitivechallenges and offset price decreases by reducing costs, improving productivity and restructuring operations. Excluding higher netsteel costs, the company’s cost reduction and productivity programs offset the impact of lower selling prices to our customers.
Also impacting our industry is the rising cost of pension and other post-retirement benefits. To partially address this issue, thecompany amended certain retiree medical plans in fiscal year 2004. These plan amendments will phase out the benefit currentlyprovided by the company by fiscal year 2023. We expect these plan changes to reduce retiree medical expenses and benefit paymentsin the coming years. Including the impact of these amendments, retiree medical expenses in fiscal year 2005 were $32 million, downfrom $57 million in fiscal year 2004, and future annual benefit payments are expected to be reduced by $26 million by fiscal 2010.However, we expect pension expense to increase approximately $25 million in fiscal year 2006 as a result of the reduction in thediscount rate used to measure the projected benefit obligation to 5.30 percent from 6.25 percent.
We previously announced our intention to divest our Light Vehicle Aftermarket (LVA) business segment. We believe divestingthis business will enable us to concentrate better on our core competencies while strengthening our balance sheet. For financialaccounting and reporting purposes, LVA is reported as discontinued operations for all periods presented. Due to evolving industrydynamics, the timing to complete the divestiture of LVA has extended into fiscal year 2006. In the fourth quarter of fiscal year 2005,management concluded that it is more likely that LVA’s North American businesses will be sold individually rather than as a whole.Although we do not believe this change in strategy materially impacts the aggregate expected value to be realized on the sale of theentire LVA business, it did require us, for accounting purposes, to evaluate fair value on an individual business basis rather than LVANorth America as a whole. This resulted in a non-cash impairment charge of $43 million ($28 million after-tax, or $0.40 per dilutedshare) to record certain LVA businesses at fair value. Our previous strategy was to sell the LVA North American business as a whole.Accordingly, the company’s previous analysis of impairment was on the total North American business. This analysis indicated thatthe aggregate fair value of the North American LVA business, when taken as a whole, exceeded its carrying value.
In addition to the planned divestiture of LVA, we have completed other divestitures as part of our plan to rationalize operationsand focus on core businesses. These divestitures include:
• Certain assets of our CVS off-highway brake business in October 2005;
• Our LVS Columbus, Indiana automotive stamping and components manufacturing business in December 2004;
• Our coil coating business in November 2004;
• Our commercial vehicle systems trailer beam fabrication facility in the third quarter of fiscal year 2004;
• Our 75-percent shareholdings in AP Amortiguadores, S.A. (APA) in the second quarter of fiscal year 2004;
• Net assets related to the manufacturing and distribution of CVS off-highway planetary axles in fiscal year 2003; and
• Our LVS exhaust tube manufacturing facility in fiscal year 2003;
Cash used for operating activities before the impact of the accounts receivable securitization and factoring programs for fiscalyear 2005 was $13 million, compared to $406 million of cash provided by operating activities before the impact of the accountsreceivable securitization and factoring programs last fiscal year. The decrease in cash flow was largely driven by lower income andhigher uses of cash for working capital, including higher cash restructuring costs. This was partially offset by lower pension and retiree
21

medical contributions. In addition, fiscal year 2004 operating cash flow was favorably impacted by ArvinMeritor’s accounting calendar,which included 53 weeks compared to 52 weeks in fiscal year 2005.
Market Outlook
Historically, the company has experienced periodic fluctuations in demand for light, commercial and specialty vehicles andcertain aftermarkets, most notably in our commercial vehicle markets in North America. Vehicle production in our principal marketsfor the last five fiscal years is shown below:
Year Ended September 30,
2005 2004 2003 2002 2001
Light Vehicles (in millions):North America . . . . . . . . . . . . . . . . . . . . . . . . . . . . . . . . . . . . . . . . . . . . . . . . . . . . . . . . 15.6 15.9 16.0 16.3 15.6South America . . . . . . . . . . . . . . . . . . . . . . . . . . . . . . . . . . . . . . . . . . . . . . . . . . . . . . . . 2.7 2.3 2.0 1.9 2.2Western Europe (including Czech Republic) . . . . . . . . . . . . . . . . . . . . . . . . . . . . . . . 16.4 16.9 16.7 16.5 16.9Asia/Pacific . . . . . . . . . . . . . . . . . . . . . . . . . . . . . . . . . . . . . . . . . . . . . . . . . . . . . . . . . . . 22.5 20.9 18.9 17.3 16.9
Commercial Vehicles (in thousands):North America, Heavy-Duty Trucks . . . . . . . . . . . . . . . . . . . . . . . . . . . . . . . . . . . . . . 324 235 164 169 150North America, Medium-Duty Trucks . . . . . . . . . . . . . . . . . . . . . . . . . . . . . . . . . . . . 208 172 141 133 144United States and Canada, Trailers . . . . . . . . . . . . . . . . . . . . . . . . . . . . . . . . . . . . . . 327 284 213 145 208Western Europe, Heavy- and Medium-Duty Trucks . . . . . . . . . . . . . . . . . . . . . . . . 421 376 364 363 386Western Europe, Trailers . . . . . . . . . . . . . . . . . . . . . . . . . . . . . . . . . . . . . . . . . . . . . . . 115 109 98 101 110
Source: Automotive industry publications and management estimates.
Our fiscal year 2006 outlook for light vehicle production is 15.6 million vehicles in North America and 16.4 million vehicles inWestern Europe. We expect that North American heavy-duty truck production will decrease about 6 percent in fiscal year 2006 toan estimated 305,000 units. In Western Europe, we expect production of heavy- and medium- duty trucks to increase slightly to anestimated 421,000 units.
Company Outlook
We are beginning to see a moderating of steel price increases; however, we believe the price of steel will continue to challengeour industry in fiscal year 2006. We have taken actions to help mitigate this issue including finding new global steel sources, identifyingalternative materials, finding ways to re-engineer our products to be less dependent on steel, consolidating and selling scrap from manyof our facilities and negotiating with our customers to recover some of the increased costs. We continue to further consolidate andrestructure our LVS businesses to address competitive challenges in the automotive supplier industry. In addition to the restructuringactions noted above, we continue to rationalize and refocus our core businesses, additional restructuring actions may be required.
Significant factors that could affect the company’s results in fiscal year 2006 include:
• Our ability to recover steel, plastics and energy price increases from our customers;
• Additional restructuring actions and the timing and recognition of restructuring charges;
• Higher than planned price reductions to our customers;
• The financial strength of our suppliers and customers, including potential bankruptcies;
• Our ability to implement planned productivity and cost reduction initiatives;
• The impact of any acquisitions or divestitures;
• Production disruptions at customer and supplier facilities;
• Significant gains or losses of existing business from our customers;
• The impact of currency fluctuations on sales and operating income.
Non-GAAP Measures
In addition to the results reported in accordance with accounting principles generally accepted in the United States (GAAP), wehave provided information regarding “cash flow from operations before accounts receivable securitization and factoring programs”,a non-GAAP financial measure. This non-GAAP measure is defined as net cash provided by operating activities before the net change
22

in accounts receivable securitized and factored. The company believes it is appropriate to exclude the net change in securitized andfactored accounts receivable since the sale of receivables may be viewed as a substitute for borrowing activity.
Webelieve that thisnon-GAAP financialmeasure isuseful tobothmanagementand investors in theanalysis of our financial position.This non-GAAP measure should not be considered a substitute for cash provided by operating activities or other cash flow statement dataprepared in accordance with GAAP or as a measure of liquidity. In addition, cash provided by operations before receivable securitizationand factoring programs does not reflect funds available for investment or other discretionary uses. See “Cash Flows” below for areconciliation of cash flows from operating activities to cash flow from operations before accounts receivable securitization andfactoring programs.
Results of Operations
The following is a summary of our financial results for the last three fiscal years:
September 30,
2005 2004 2003
(in millions, exceptper share amounts)
Sales:Light Vehicle Systems . . . . . . . . . . . . . . . . . . . . . . . . . . . . . . . . . . . . . . . . . . . . . . . . . . . . . . . . . . $4,849 $4,818 $4,301Commercial Vehicle Systems . . . . . . . . . . . . . . . . . . . . . . . . . . . . . . . . . . . . . . . . . . . . . . . . . . . . 4,054 3,215 2,422
SALES . . . . . . . . . . . . . . . . . . . . . . . . . . . . . . . . . . . . . . . . . . . . . . . . . . . . . . . . . . . . . . . . . . . . . . . . . . $8,903 $8,033 $6,723
Operating Income (Loss):Light Vehicle Systems . . . . . . . . . . . . . . . . . . . . . . . . . . . . . . . . . . . . . . . . . . . . . . . . . . . . . . . . . . $ (53) $ 123 $ 135Commercial Vehicle Systems . . . . . . . . . . . . . . . . . . . . . . . . . . . . . . . . . . . . . . . . . . . . . . . . . . . . 193 164 111
SEGMENT OPERATING INCOME . . . . . . . . . . . . . . . . . . . . . . . . . . . . . . . . . . . . . . . . . . . . . . . . . . . . 140 287 246Environmental remediation costs . . . . . . . . . . . . . . . . . . . . . . . . . . . . . . . . . . . . . . . . . . . . . . . . . (7) (11) —Costs for withdrawn tender offer . . . . . . . . . . . . . . . . . . . . . . . . . . . . . . . . . . . . . . . . . . . . . . . . . — (16) —Unallocated corporate costs . . . . . . . . . . . . . . . . . . . . . . . . . . . . . . . . . . . . . . . . . . . . . . . . . . . . . (3) — —
OPERATING INCOME . . . . . . . . . . . . . . . . . . . . . . . . . . . . . . . . . . . . . . . . . . . . . . . . . . . . . . . . . . . . . . 130 260 246Equity in earnings of affiliates . . . . . . . . . . . . . . . . . . . . . . . . . . . . . . . . . . . . . . . . . . . . . . . . . . . . 28 19 8Gain on sale of marketable securities . . . . . . . . . . . . . . . . . . . . . . . . . . . . . . . . . . . . . . . . . . . . . — 7 —Interest expense, net and other . . . . . . . . . . . . . . . . . . . . . . . . . . . . . . . . . . . . . . . . . . . . . . . . . . (127) (107) (104)
INCOME BEFORE INCOME TAXES . . . . . . . . . . . . . . . . . . . . . . . . . . . . . . . . . . . . . . . . . . . . . . . . . . . 31 179 150Benefit (provision) for income taxes . . . . . . . . . . . . . . . . . . . . . . . . . . . . . . . . . . . . . . . . . . . . . . . 5 (44) (45)Minority interests . . . . . . . . . . . . . . . . . . . . . . . . . . . . . . . . . . . . . . . . . . . . . . . . . . . . . . . . . . . . . . . (3) (8) (5)
INCOME FROM CONTINUING OPERATIONS . . . . . . . . . . . . . . . . . . . . . . . . . . . . . . . . . . . . . . . . . . . 33 127 100INCOME (LOSS) FROM DISCONTINUED OPERATIONS . . . . . . . . . . . . . . . . . . . . . . . . . . . . . . . . . . (21) (169) 37
INCOME (LOSS) BEFORE CUMULATIVE EFFECT OF ACCOUNTING CHANGE . . . . . . . . . . . . . . . 12 (42) 137Cumulative effect of accounting change, net of tax . . . . . . . . . . . . . . . . . . . . . . . . . . . . . . . . . — — (4)
NET INCOME (LOSS) . . . . . . . . . . . . . . . . . . . . . . . . . . . . . . . . . . . . . . . . . . . . . . . . . . . . . . . . . . . . . . $ 12 $ (42) $ 133
DILUTED EARNINGS (LOSS) PER SHAREContinuing operations . . . . . . . . . . . . . . . . . . . . . . . . . . . . . . . . . . . . . . . . . . . . . . . . . . . . . . . . . . . $ 0.47 $ 1.85 $ 1.48Discontinued operations . . . . . . . . . . . . . . . . . . . . . . . . . . . . . . . . . . . . . . . . . . . . . . . . . . . . . . . . . (0.30) (2.46) 0.54Cumulative effect of accounting change . . . . . . . . . . . . . . . . . . . . . . . . . . . . . . . . . . . . . . . . . . . — — (0.06)
Diluted earnings (loss) per share . . . . . . . . . . . . . . . . . . . . . . . . . . . . . . . . . . . . . . . . . . . . . . . . . $ 0.17 $ (0.61) $ 1.96
DILUTED AVERAGE COMMON SHARES OUTSTANDING . . . . . . . . . . . . . . . . . . . . . . . . . . . . . . . . 69.9 68.6 67.9
23

2005 Compared to 2004
Sales
The following table reflects geographical business segment sales for fiscal years 2005 and 2004. The reconciliation is intendedto reflect the trend in business segment sales and to illustrate the impact changes in foreign currency exchange rates and acquisitionsand divestitures had on sales (in millions).
Dollar Change Due to
2005 2004Dollar
Change%
Change CurrencyAcquisitions/Divestitures
Volume/Other
LVS:North America . . . . . . . . . . . . . . . . . $2,071 $2,010 $ 61 3% $ 17 $ (70) $ 114Europe . . . . . . . . . . . . . . . . . . . . . . . . 2,262 2,337 (75) (3)% 153 (99) (129)Asia and Other . . . . . . . . . . . . . . . . . 516 471 45 10% 35 (33) 43
4,849 4,818 31 1% 205 (202) 28
CVS:North America . . . . . . . . . . . . . . . . . 2,475 2,014 461 23% 4 9 448Europe . . . . . . . . . . . . . . . . . . . . . . . . 1,106 827 279 34% 54 226 (1)Asia and Other . . . . . . . . . . . . . . . . . 473 374 99 26% 31 — 68
4,054 3,215 839 26% 89 235 515
SALES . . . . . . . . . . . . . . . . . . . . . . . . . . $8,903 $8,033 $870 11% $294 $ 33 $ 543
Continuing Operations
Sales for fiscal year 2005 were $8,903 million, up $870 million, or 11 percent, from fiscal year 2004. The increase in saleswas attributable to stronger commercial vehicle truck and trailer volumes in our CVS business segment; new business awards,principally associated with suspension modules in our LVS business; and foreign currency translation, primarily due to the strongereuro in relation to the U.S. dollar. These increases were partially offset by lower volumes in certain of our European LVS businesses.Acquisitions, primarily our two new consolidated joint ventures with AB Volvo, added sales of $235 million; divestitures of certain LVSbusinesses in fiscal years 2005 and 2004 reduced sales in fiscal year 2005 by $202 million.
Business Segments
Light Vehicle Systems (LVS) sales increased to $4,849 million in fiscal year 2005, up $31 million, or one percent, from$4,818 million in fiscal year 2004. The effect of foreign currency translation, primarily as a result of the stronger euro when comparedto the US dollar, increased sales by $205 million. Divestitures, primarily the sale of APA in fiscal year 2004, and the sale of anautomotive stamping and components manufacturing operation in the first quarter of fiscal year 2005, reduced sales by $202 million.Excluding the impact of foreign currency translation and divestitures, sales were up slightly. Higher pass-through sales ofapproximately $300 million, principally associated with our new suspension module business, were partially offset by lower OEdemand particularly in certain of our European businesses. Pass-through sales increased to approximately $1,300 million in fiscalyear 2005 from approximately $1,000 million in fiscal year 2004. Pass-through sales are products sold to our customers where weacquire the material and assemble it into the final product. These pass-through sales carry minimal margins as we have littleengineering or manufacturing responsibility.
Commercial Vehicle Systems (CVS) sales were $4,054 million, up $839 million, or 26 percent, from fiscal year 2004. Theincrease in sales was primarily attributable to stronger commercial vehicle truck and trailer volumes. Compared to fiscal year 2004,production volumes in North America for commercial vehicle heavy-duty trucks (Class 8) increased approximately 38 percent, mediumduty trucks increased 21 percent and trailer volumes increased 15 percent. South American truck volumes increased 17 percent.Acquisitions, primarily the formation of two joint ventures with AB Volvo in the first quarter of fiscal 2005, added sales of $235 million.
24

Operating Income and Operating Margins
The following table reflects operating income and operating margins for fiscal years 2005 and 2004 (dollars in millions).Operating Income Operating Margins
2005 2004$
Change%
Change 2005 2004 Change
LVS . . . . . . . . . . . . . . . . . . . . . . . . . . . . . . . . . . . $ (53) $123 $(176) (143)% (1.1)% 2.6% (3.7) ptsCVS . . . . . . . . . . . . . . . . . . . . . . . . . . . . . . . . . . . 193 164 29 18% 4.8% 5.1% (0.3) pts
Total Segment . . . . . . . . . . . . . . . . . . . . . . . . . . 140 287 (147) (51)% 1.6% 3.6% (2.0) ptsEnvironmental remediation costs . . . . . . . . . . (7) (11) 4 36%Costs for withdrawn tender offer . . . . . . . . . . — (16) 16 100%Unallocated corporate costs . . . . . . . . . . . . . . (3) — (3) —
TOTAL . . . . . . . . . . . . . . . . . . . . . . . . . . . . . . . . $130 $260 $(130) (50)% 1.5% 3.2% (1.7) pts
Operating income for fiscal year 2005 was $130 million, a decrease of $130 million, compared to fiscal year 2004. Operatingmargin was 1.5 percent, down from 3.2 percent. We recorded restructuring costs of $117 million during fiscal year 2005 as follows(in millions):
LVS CVS Total
New actions (1)Facility rationalization . . . . . . . . . . . . . . . . . . . . . . . . . . . . . . . . . . . . . . . . . . . . . . . . . . . . . . $56 $19 $ 75Asset impairments . . . . . . . . . . . . . . . . . . . . . . . . . . . . . . . . . . . . . . . . . . . . . . . . . . . . . . . . 26 — 26
Total new actions . . . . . . . . . . . . . . . . . . . . . . . . . . . . . . . . . . . . . . . . . . . . . . . . . . . . . . . . . . . . 82 19 101Previous actions . . . . . . . . . . . . . . . . . . . . . . . . . . . . . . . . . . . . . . . . . . . . . . . . . . . . . . . . . . . . . 16 — 16
Total restructuring costs . . . . . . . . . . . . . . . . . . . . . . . . . . . . . . . . . . . . . . . . . . . . . . . . . . . . . . $98 $19 $117
(1) New actions are programs announced in May 2005
In addition to the new restructuring actions, we recorded additional restructuring charges of $16 million in fiscal year 2005.These costs were primarily for severance and other employee termination costs, related to a reduction of approximately 20 salariedand 355 hourly employees, and asset impairments. These costs relate to the closure of the Sheffield, England, stabilizer bar facility,the consolidation of two facilities in Brazil and a reduction in workforce in our operations in Spain.
We recorded restructuring charges of $15 million in fiscal year 2004. These costs included severance and other employeetermination costs of $10 million related to a reduction of approximately 50 salaried employees and 575 hourly employees in our LVSbusiness, and $5 million associated with certain administrative and managerial employee termination costs.
Despite the higher sales levels, operating income in fiscal year 2005 was negatively impacted by the restructuring costs notedabove and steel costs, which, net of recoveries, were approximately $90 million higher than in fiscal year 2004. Also impactingoperating income in fiscal year 2005 were $14 million of charges associated with certain customer bankruptcies; $7 million ofenvironmental remediation costs, primarily associated with a former Rockwell facility; and a $4 million gain on the sale of an automotivestamping and components manufacturing operation in the first quarter of fiscal year 2005. Retiree medical and pension costs were$16 million lower than fiscal year 2004. This is a result of amending certain retiree medical plans in fiscal year 2004, which reducedretiree medical expense by $22 million compared to fiscal year 2004.
Operating income in fiscal year 2004 includes the costs associated with the withdrawn tender offer for the outstandingshares of Dana Corporation (Dana) of $16 million (before a non-operating gain of $7 million on the sale of Dana stock owned by thecompany), environmental remediation costs of $11 million (associated with a different Rockwell facility), and a gain on the sale of APAof $20 million.
Selling, general and administrative expenses as a percentage of sales decreased to 4.2 percent in fiscal year 2005 from 4.8percent in fiscal year 2004 due to reduced headcount resulting from the restructuring actions and our continued efforts to reduceselling, general and administrative spending.
25

Business Segments
LVS operating loss was $53 million, a decrease of $176 million from operating income of $123 million in fiscal year 2004 andoperating margins decreased to a negative 1.1 percent from 2.6 percent. The decrease in operating income is primarily due to thepreviously mentioned restructuring actions and higher steel costs in fiscal year 2005. LVS continued its restructuring efforts in fiscal year2005 and recorded $98 million of restructuring charges associated with facility closures and consolidations and workforce reductionscompared to $10 million a year ago. These costs include $56 million of employee termination costs and $26 million of asset impairmentsrelated to the restructuring actions announced in May 2005. Additionally, LVS recorded $16 million of restructuring costs associated withthe closure of its Sheffield, England, stabilizer bar facility, the consolidation of two facilities in Brazil and a reduction in workforce in itsoperations in Spain. The $16 million relates to employee termination benefits and other costs of $11 million and asset impairments of$5 million. Total headcount reductions associated with all of these actions were approximately 2,250, of which 500 were salariedemployees and 1,750 were hourly employees.
LVS continued to experience narrowing margins in fiscal year 2005 due primarily to higher steel costs. LVS incurred higher netsteel costs of approximately $40 million in fiscal year 2005. Also impacting operating income in fiscal year 2005, were lower valueadded sales volumes (non pass-through sales), $11 million of charges associated with certain customer bankruptcies and a $4 millionnet charge associated with a product warranty matter. LVS operating income improved by $13 million from fiscal year 2004 due toa reduction in foreign exchange loss from 2005 attributable to the impact of hedging foreign exchange transactions in fiscal year 2005that were not hedged in fiscal year 2004. LVS also recorded a $4 million gain on the sale of an automotive stamping and componentsmanufacturing operation in the first quarter of fiscal year 2005. Operating income in fiscal year 2004 included the $20 million gainon the sale of APA.
CVS operating income was $193 million, an increase of $29 million from fiscal year 2004. Operating margin declined to 4.8percent, down from 5.1 percent in fiscal year 2004. The increase in operating income was largely attributable to higher sales volumes.The benefits of the higher sales volumes were partially offset by higher net steel costs of $50 million, $19 million of restructuring costsprincipally associated with the reduction of approximately 225 salaried employees and 200 hourly employees. Also negativelyimpacting operating income was a $3 million charge associated with the bankruptcy of a European trailer customer. Retiree medicaland pension costs were $18 million lower than the previous year, as a result of the amendment to certain retiree medical plans infiscal year 2004. Fiscal year 2004 operating income included a $4 million charge in the fourth quarter associated with the settlementof a TRW warranty matter.
Other Income Statement Items
Equity in earnings of affiliates was $28 million in fiscal year 2005, compared to $19 million in fiscal year 2004. The increasewas primarily related to improved performance and higher earnings of our commercial vehicle affiliates. The increase was also partiallydriven by the reduction in losses associated with the dissolution of our CVS transmission joint venture with ZF Friedrichshafen in thesecond quarter of fiscal year 2004. We recorded equity losses of $4 million in fiscal year 2004 related to this joint venture.
Interest expense, net and other was $127 million in fiscal year 2005 compared to $107 million in fiscal year 2004. Theincrease in interest expense was primarily attributable to higher interest rates on our variable rate debt compared with fiscal year2004. Also included in interest expense, net and other in fiscal year 2005 was a $4 million loss on debt extinguishment associatedwith the debt exchange completed in the fourth quarter of fiscal year 2005. The loss on debt extinguishment primarily consisted ofthe premium paid to note holders to exchange their notes. See “Liquidity and Contractual Obligations” for further details concerningthe debt extinguishment.
Benefit for income taxes was $5 million in fiscal year 2005, resulting in an effective rate of negative 16 percent. The effectivetax rate was 25 percent in fiscal year 2004. The decline in the tax rate is principally associated with lower income levels relative toour structural tax position.
Minority interest expense was $3 million in fiscal year 2005 compared to $8 million in fiscal year 2004. Minority interestsrepresent our minority partners’ share of income or loss associated with our less than 100-percent owned consolidated joint ventures.The decrease in minority interest expense in fiscal year 2005 is primarily related to our minority partners’ share of $9 million ofrestructuring costs associated with the closure of the Sheffield, England, stabilizer bar facility in our MSSC joint venture.
Income from continuing operations for fiscal year 2005 was $33 million, or $0.47 per diluted share, compared to $127million, or $1.85 per diluted share in fiscal 2004. The decrease was primarily attributable to the $117 million of restructuring costsand higher net steel costs of approximately $90 million, offset partially by the higher CVS sales volumes.
26

Loss from discontinued operations was $21 million in fiscal 2005 compared to a loss from discontinued operations of $169million in fiscal 2004. As previously described, in the fourth quarter of fiscal 2005, management concluded that it is more likely thatLVA’s North American businesses will be sold individually. As a result, the company evaluated fair value on an individual businessbasis rather than LVA North America as a whole. This resulted in a non-cash impairment charge of $43 million ($28 million after-tax)to record certain LVA North American businesses at fair value. Also impacting fiscal year 2005, were $6 million of after-tax changeovercosts in LVA, associated with a new supply agreement with a significant customer, which were more than offset by lower depreciationexpense. In accordance with accounting principles generally accepted in the United States, our LVA business segment discontinueddepreciating fixed assets as of September 30, 2004. Depreciation expense in fiscal year 2004 was approximately $14 million after-tax. In an effort to lower fixed costs and improve profitability resulting from weakening demand in the aftermarket business, LVArecorded restructuring costs totaling $2 million and $3 million during fiscal years 2005 and 2004, respectively.
Also impacting loss from discontinued operations in fiscal year 2005 was the loss of approximately $6 million of Roll Coaterincome as a result of the sale of this business in November 2004. This loss of net income was offset partially by a $2 million gainon the sale of Roll Coater. The effective tax rate for discontinued operations was 7 percent in fiscal year 2005, down from 41 percentin fiscal year 2004. The decrease in the effective tax rate was primarily due to lower income levels.
The fiscal year 2004 results included a non-cash goodwill impairment charge of $190 million ($2.77 per diluted share) in ourLVA business. For more information on this impairment charge see Note 3 of the Notes to Consolidated Financial Statements.
2004 Compared to 2003
Sales
The following table reflects geographical business segment sales for fiscal years 2004 and 2003. The reconciliation is intendedto reflect the trend in business segment sales and to illustrate the impact changes in foreign currency exchange rates and acquisitionsand divestitures had on sales (in millions).
Dollar Change Due to
2004 2003Dollar
Change%
Change CurrencyAcquisitions/Divestitures
Volume/Other
LVS:North America . . . . . . . . . . . . . . . . . $2,010 $1,923 $ 87 5% $ 8 $ (15) $ 94Europe . . . . . . . . . . . . . . . . . . . . . . . . 2,337 1,941 396 20% 246 106 44Asia and Other . . . . . . . . . . . . . . . . . 471 437 34 8% 36 (26) 24
4,818 4,301 517 12% 290 65 162
CVS:North America . . . . . . . . . . . . . . . . . 2,014 1,492 522 35% — 10 512Europe . . . . . . . . . . . . . . . . . . . . . . . . 827 652 175 27% 90 — 85Asia and Other . . . . . . . . . . . . . . . . . 374 278 96 35% 15 — 81
3,215 2,422 793 33% 105 10 678
SALES . . . . . . . . . . . . . . . . . . . . . . . . . . $8,033 $6,723 $1,310 19% $395 $ 75 $840
Continuing Operations
Sales for fiscal year 2004 were $8,033 million, up $1,310 million, or 19 percent, over fiscal year 2003. The increase in saleswas primarily attributable to stronger North American commercial vehicle truck and trailer volumes in our CVS business segment.Acquisitions, primarily Zeuna Starker in the second quarter of fiscal year 2003, added sales of $240 million. Divestitures, primarilythe sale of APA in the second quarter of fiscal 2004, reduced sales in fiscal year 2004 by $165 million. Favorable foreign currencytranslation, primarily due to the stronger euro, increased sales by $395 million.
Business Segments
LVS sales increased to $4,818 million in fiscal year 2004, up $517 million, or 12 percent, from $4,301 million in fiscal year2003. Foreign currency translation, primarily as a result of the stronger euro, favorably impacted sales by $290 million. The acquisitionof Zeuna Starker in the second quarter of fiscal year 2003 added incremental sales of $203 million in fiscal year 2004. Divestitures,
27

primarily the sale of our 75-percent shareholdings in APA, reduced sales in fiscal year 2004 by $138 million. Net new businessincreased sales in fiscal year 2004 by approximately $270 million, primarily in our Door Systems and Emissions Technologiesbusinesses. Included in LVS sales in fiscal years 2004 and 2003 are approximately $1,000 million and $775 million, respectively,of pass-through sales.
CVS sales were $3,215 million, up $793 million, or 33 percent, from fiscal year 2003. The increase in sales was primarilyattributable to stronger North American commercial vehicle truck and trailer production volumes, which increased approximately30 percent from fiscal 2003. Foreign currency translation increased sales by $105 million, as compared to fiscal year 2003.
Operating Income and Operating Margins
The following table reflects operating income and operating margins for fiscal years 2004 and 2003 (dollars in millions).
Operating Income Operating Margins
2004 2003$
Change%
Change 2004 2003 Change
LVS . . . . . . . . . . . . . . . . . . . . . . . . . . . . . . . . . . . $123 $135 $(12) (9)% 2.6% 3.1% (0.5) ptsCVS . . . . . . . . . . . . . . . . . . . . . . . . . . . . . . . . . . . 164 111 53 48% 5.1% 4.6% 0.5 pts
Total Segment . . . . . . . . . . . . . . . . . . . . . . . . . . 287 246 41 17% 3.6% 3.7% (0.1) ptsEnvironmental remediation costs . . . . . . . . . . (11) — (11)Costs for withdrawn tender offer . . . . . . . . . . (16) — (16)
TOTAL . . . . . . . . . . . . . . . . . . . . . . . . . . . . . . . . $260 $246 $ 14 6% 3.2% 3.7% (0.5) pts
Operating income in fiscal year 2004 was $260 million, an increase of $14 million, compared to fiscal year 2003, reflecting anoperating margin of 3.2 percent, down from 3.7 percent. Operating income in fiscal year 2004 included the costs associated with thewithdrawn tender offer forDanaof$16million (beforeanon-operatinggainof$7millionon thesaleofDanastockownedby thecompany).Also included in operating income in fiscal year 2004 was the gain on the sale of APA of $20 million and environmental remediation costsof $11 million. Operating income for fiscal year 2003 included a gain on the sale of the exhaust tube manufacturing facility of $20 millionand $11 million of costs related to account reconciliations and information system implementation issues in a facility in Mexico.
The lack of availability and the price of raw materials, primarily steel, negatively impacted operating income in fiscal year 2004.Steel costs, net of recoveries, were approximately $32 million higher compared to fiscal year 2003. Also negatively impactingoperating income in fiscal year 2004 were higher retiree medical and pension costs of $22 million, higher premium product launchcosts of approximately $10 million and additional investments in commercial vehicle exhaust technology. Reductions in our sellingprices, as a result of contractual or other commitments, primarily in our LVS segment, were largely offset by cost reductions.
We recorded restructuring charges of $15 million in fiscal year 2004 and $20 million in fiscal year 2003. These costs includedseverance and other employee termination costs related to a reduction of approximately 300 salaried employees and 975 hourlyemployees. Fiscal year 2003 restructuring charges included $8 million of asset impairment charges from the rationalization of operations.Thepurposeof theseactionswasprimarily to reducecosts inourLVSbusinessso that it canbebetterpositioned toaddress thecompetitivechallenges in the automotive supply industry.
Selling, general and administrative expenses as a percentage of sales decreased to 4.8 percent in fiscal year 2004 from 5.1 percentin fiscal year 2003 due to our continued efforts to reduce selling, general and administrative spending.
Business Segments
LVS operating income was $123 million in fiscal year 2004, a decrease of $12 million from fiscal year 2003. LVS continuedto experience narrowing margins due primarily to higher steel costs. LVS incurred higher net steel costs of $21 million in fiscal year2004. As a result, operating margins decreased to 2.6 percent from 3.1 percent. Included in operating income for fiscal year 2004was the $20 million gain on the sale of APA. Also impacting fiscal year 2004 operating income were higher premium product launchcosts of approximately $10 million and higher retiree medical and pension costs. Fiscal year 2003 operating income included a $20million gain on the sale of the exhaust tube manufacturing facility partially offset by the $11 million charge in Mexico.
As part of an ongoing strategy to implement actions to improve profitability and to better align LVS’ capacity with marketconditions, LVS continued its restructuring efforts and recorded $10 million and $19 million of restructuring charges in fiscalyears 2004 and 2003, respectively. These charges included costs associated with facility closures and consolidations andworkforce reductions.
28
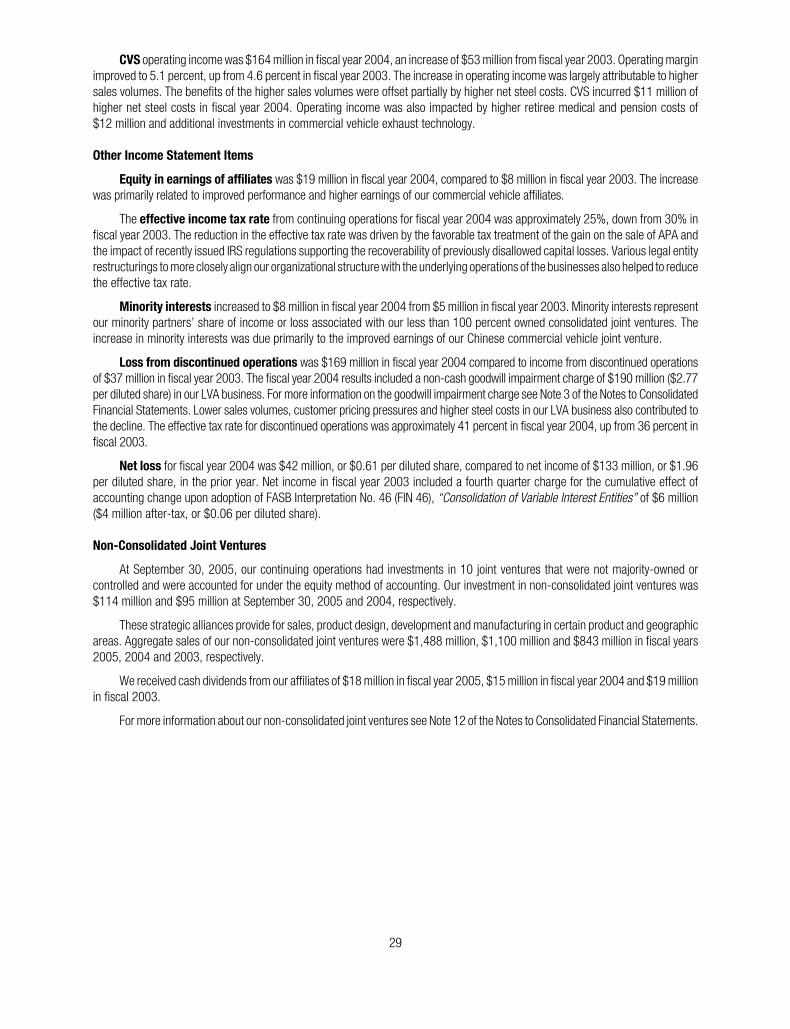
CVS operating income was $164 million in fiscal year 2004, an increase of $53 million from fiscal year 2003. Operating marginimproved to 5.1 percent, up from 4.6 percent in fiscal year 2003. The increase in operating income was largely attributable to highersales volumes. The benefits of the higher sales volumes were offset partially by higher net steel costs. CVS incurred $11 million ofhigher net steel costs in fiscal year 2004. Operating income was also impacted by higher retiree medical and pension costs of$12 million and additional investments in commercial vehicle exhaust technology.
Other Income Statement Items
Equity in earnings of affiliates was $19 million in fiscal year 2004, compared to $8 million in fiscal year 2003. The increasewas primarily related to improved performance and higher earnings of our commercial vehicle affiliates.
The effective income tax rate from continuing operations for fiscal year 2004 was approximately 25%, down from 30% infiscal year 2003. The reduction in the effective tax rate was driven by the favorable tax treatment of the gain on the sale of APA andthe impact of recently issued IRS regulations supporting the recoverability of previously disallowed capital losses. Various legal entityrestructurings to more closely align our organizational structure with the underlying operations of the businesses also helped to reducethe effective tax rate.
Minority interests increased to $8 million in fiscal year 2004 from $5 million in fiscal year 2003. Minority interests representour minority partners’ share of income or loss associated with our less than 100 percent owned consolidated joint ventures. Theincrease in minority interests was due primarily to the improved earnings of our Chinese commercial vehicle joint venture.
Loss from discontinued operations was $169 million in fiscal year 2004 compared to income from discontinued operationsof $37 million in fiscal year 2003. The fiscal year 2004 results included a non-cash goodwill impairment charge of $190 million ($2.77per diluted share) in our LVA business. For more information on the goodwill impairment charge see Note 3 of the Notes to ConsolidatedFinancial Statements. Lower sales volumes, customer pricing pressures and higher steel costs in our LVA business also contributed tothe decline. The effective tax rate for discontinued operations was approximately 41 percent in fiscal year 2004, up from 36 percent infiscal 2003.
Net loss for fiscal year 2004 was $42 million, or $0.61 per diluted share, compared to net income of $133 million, or $1.96per diluted share, in the prior year. Net income in fiscal year 2003 included a fourth quarter charge for the cumulative effect ofaccounting change upon adoption of FASB Interpretation No. 46 (FIN 46), “Consolidation of Variable Interest Entities” of $6 million($4 million after-tax, or $0.06 per diluted share).
Non-Consolidated Joint Ventures
At September 30, 2005, our continuing operations had investments in 10 joint ventures that were not majority-owned orcontrolled and were accounted for under the equity method of accounting. Our investment in non-consolidated joint ventures was$114 million and $95 million at September 30, 2005 and 2004, respectively.
These strategic alliances provide for sales, product design, development and manufacturing in certain product and geographicareas. Aggregate sales of our non-consolidated joint ventures were $1,488 million, $1,100 million and $843 million in fiscal years2005, 2004 and 2003, respectively.
We received cash dividends from our affiliates of $18 million in fiscal year 2005, $15 million in fiscal year 2004 and $19 millionin fiscal 2003.
For more information about our non-consolidated joint ventures see Note 12 of the Notes to Consolidated Financial Statements.
29

Financial Condition
CapitalizationSeptember 30,
2005 2004
Short-term debt and current maturities . . . . . . . . . . . . . . . . . . . . . . . . . . . . . . . . . . . . $ 131 $ 3Long-term debt . . . . . . . . . . . . . . . . . . . . . . . . . . . . . . . . . . . . . . . . . . . . . . . . . . . . . . . . . 1,451 1,487
Total debt . . . . . . . . . . . . . . . . . . . . . . . . . . . . . . . . . . . . . . . . . . . . . . . . . . . . . . . . . . . . . . 1,582 1,490Minority interests . . . . . . . . . . . . . . . . . . . . . . . . . . . . . . . . . . . . . . . . . . . . . . . . . . . . . . . 58 61Shareowners’ equity . . . . . . . . . . . . . . . . . . . . . . . . . . . . . . . . . . . . . . . . . . . . . . . . . . . . 875 988
Total capitalization . . . . . . . . . . . . . . . . . . . . . . . . . . . . . . . . . . . . . . . . . . . . . . . . . . . . . . $2,515 $2,539
Ratio of debt to capitalization . . . . . . . . . . . . . . . . . . . . . . . . . . . . . . . . . . . . . . . . . . . . . 63% 59%
Weremaincommittedtostrongcashflowgeneration, thereductionofdebtandregainingan investmentgradecredit rating.Ourprimarysource of liquidity in fiscal year 2005 was cash proceeds from the divestitures of certain businesses, supplemented by our accountsreceivables securitization and factoring programs and, as required, borrowings on our revolving credit facility. Our total debt to capitalizationratio was 63 percent at September 30, 2005 compared to 59 percent at September 30, 2004. In September 2005, our U.S. accountsreceivable securitization facility expiredandweentered intoanewsecuritizationarrangement.Amountsoutstandingunder thisnewprogramare reported in short-term debt and amounted to $112 million at September 30, 2005. Under the previous program, amounts outstandingwere reported as a reduction in accounts receivable because they were accounted for as a sale of receivables.
Cash FlowsFiscal Year September 30,
2005 2004 2003
OPERATING CASH FLOWSIncome from continuing operations . . . . . . . . . . . . . . . . . . . . . . . . . . . . . . . . . . . . . . . . . . . . . . . $ 33 $ 127 $ 100Depreciation and amortization . . . . . . . . . . . . . . . . . . . . . . . . . . . . . . . . . . . . . . . . . . . . . . . . . . . 182 183 185Deferred income taxes . . . . . . . . . . . . . . . . . . . . . . . . . . . . . . . . . . . . . . . . . . . . . . . . . . . . . . . . . . (119) 19 (36)Pension and retiree medical expense . . . . . . . . . . . . . . . . . . . . . . . . . . . . . . . . . . . . . . . . . . . . . 110 130 99Pension and retiree medical contributions . . . . . . . . . . . . . . . . . . . . . . . . . . . . . . . . . . . . . . . . . (164) (212) (163)Restructuring costs, net of payments . . . . . . . . . . . . . . . . . . . . . . . . . . . . . . . . . . . . . . . . . . . . . 75 (3) 6Proceeds from termination of interest rate swaps . . . . . . . . . . . . . . . . . . . . . . . . . . . . . . . . . . . 22 — —Decrease (increase) in working capital . . . . . . . . . . . . . . . . . . . . . . . . . . . . . . . . . . . . . . . . . . . . (33) 130 (88)Other . . . . . . . . . . . . . . . . . . . . . . . . . . . . . . . . . . . . . . . . . . . . . . . . . . . . . . . . . . . . . . . . . . . . . . . . . 12 (12) 39
Net cash provided by continuing operations before receivable securitization and factoring 118 362 142Net cash provided by (used for) discontinued operations . . . . . . . . . . . . . . . . . . . . . . . . . . . . . (131) 44 42
Operating cash flow before receivable securitization and factoring . . . . . . . . . . . . . . . . . . . . . . . (13) 406 184Receivable securitization and factoring . . . . . . . . . . . . . . . . . . . . . . . . . . . . . . . . . . . . . . . . . . . . (19) (187) 90
CASH FLOWS PROVIDED BY (USED FOR) OPERATING ACTIVITIES . . . . . . . . . . . . . . . . . . . . . . . $ (32) $ 219 $ 274
Operating cash flows provided by continuing operations before the impact of our accounts receivable securitization andfactoring programs was $118 million in fiscal year 2005, down $244 million from fiscal year 2004. This decrease was driven largelyby lower income and higher uses of cash for working capital, including higher cash restructuring costs. We used approximately $110million of cash for working capital requirements at our new joint ventures with AB Volvo and to support the higher CVS volumes. Inaddition, cash flow in fiscal year 2004 was favorably impacted by our fiscal calendar, which included 53 weeks in fiscal year 2004,compared to 52 weeks in fiscal year 2005. The higher uses of cash for working capital were offset partially by lower pension and retireemedical contributions of $48 million. Also, in May 2005, we partially terminated certain interest rate swaps and received proceedsfrom these terminations, including interest received, of $22 million.
Cash used for discontinued operations was $131 million compared to cash provided by discontinued operations of $44 milliona year ago. Higher working capital levels contributed to this decline. LVA ceased participating in our accounts receivable securitizationprogram in fiscal year 2005. This increased LVA’s outstanding receivables by approximately $80 million since September 30, 2004.
30
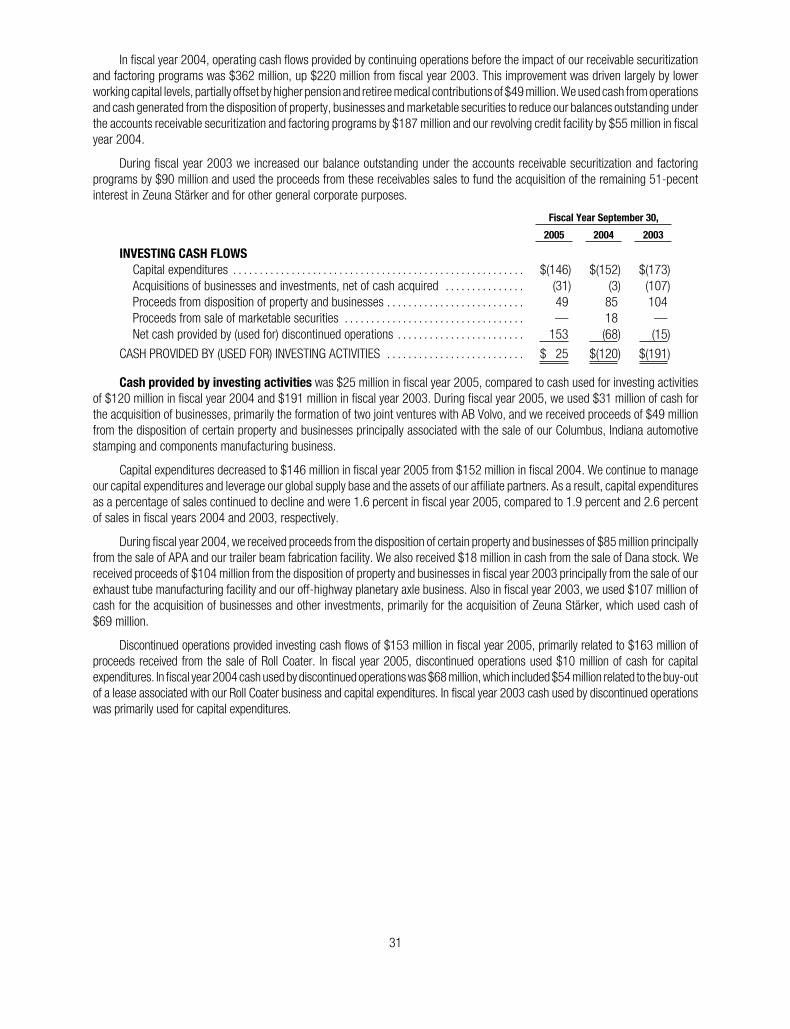
In fiscal year 2004, operating cash flows provided by continuing operations before the impact of our receivable securitizationand factoring programs was $362 million, up $220 million from fiscal year 2003. This improvement was driven largely by lowerworking capital levels, partially offset by higher pension and retiree medical contributions of $49 million. We used cash from operationsand cash generated from the disposition of property, businesses and marketable securities to reduce our balances outstanding underthe accounts receivable securitization and factoring programs by $187 million and our revolving credit facility by $55 million in fiscalyear 2004.
During fiscal year 2003 we increased our balance outstanding under the accounts receivable securitization and factoringprograms by $90 million and used the proceeds from these receivables sales to fund the acquisition of the remaining 51-pecentinterest in Zeuna Starker and for other general corporate purposes.
Fiscal Year September 30,
2005 2004 2003
INVESTING CASH FLOWSCapital expenditures . . . . . . . . . . . . . . . . . . . . . . . . . . . . . . . . . . . . . . . . . . . . . . . . . . . . . . . $(146) $(152) $(173)Acquisitions of businesses and investments, net of cash acquired . . . . . . . . . . . . . . . (31) (3) (107)Proceeds from disposition of property and businesses . . . . . . . . . . . . . . . . . . . . . . . . . . 49 85 104Proceeds from sale of marketable securities . . . . . . . . . . . . . . . . . . . . . . . . . . . . . . . . . . — 18 —Net cash provided by (used for) discontinued operations . . . . . . . . . . . . . . . . . . . . . . . . 153 (68) (15)
CASH PROVIDED BY (USED FOR) INVESTING ACTIVITIES . . . . . . . . . . . . . . . . . . . . . . . . . . $ 25 $(120) $(191)
Cash provided by investing activities was $25 million in fiscal year 2005, compared to cash used for investing activitiesof $120 million in fiscal year 2004 and $191 million in fiscal year 2003. During fiscal year 2005, we used $31 million of cash forthe acquisition of businesses, primarily the formation of two joint ventures with AB Volvo, and we received proceeds of $49 millionfrom the disposition of certain property and businesses principally associated with the sale of our Columbus, Indiana automotivestamping and components manufacturing business.
Capital expenditures decreased to $146 million in fiscal year 2005 from $152 million in fiscal 2004. We continue to manageour capital expenditures and leverage our global supply base and the assets of our affiliate partners. As a result, capital expendituresas a percentage of sales continued to decline and were 1.6 percent in fiscal year 2005, compared to 1.9 percent and 2.6 percentof sales in fiscal years 2004 and 2003, respectively.
During fiscal year 2004, we received proceeds from the disposition of certain property and businesses of $85 million principallyfrom the sale of APA and our trailer beam fabrication facility. We also received $18 million in cash from the sale of Dana stock. Wereceived proceeds of $104 million from the disposition of property and businesses in fiscal year 2003 principally from the sale of ourexhaust tube manufacturing facility and our off-highway planetary axle business. Also in fiscal year 2003, we used $107 million ofcash for the acquisition of businesses and other investments, primarily for the acquisition of Zeuna Starker, which used cash of$69 million.
Discontinued operations provided investing cash flows of $153 million in fiscal year 2005, primarily related to $163 million ofproceeds received from the sale of Roll Coater. In fiscal year 2005, discontinued operations used $10 million of cash for capitalexpenditures. In fiscal year 2004 cash used by discontinued operations was $68 million, which included $54 million related to the buy-outof a lease associated with our Roll Coater business and capital expenditures. In fiscal year 2003 cash used by discontinued operationswas primarily used for capital expenditures.
31
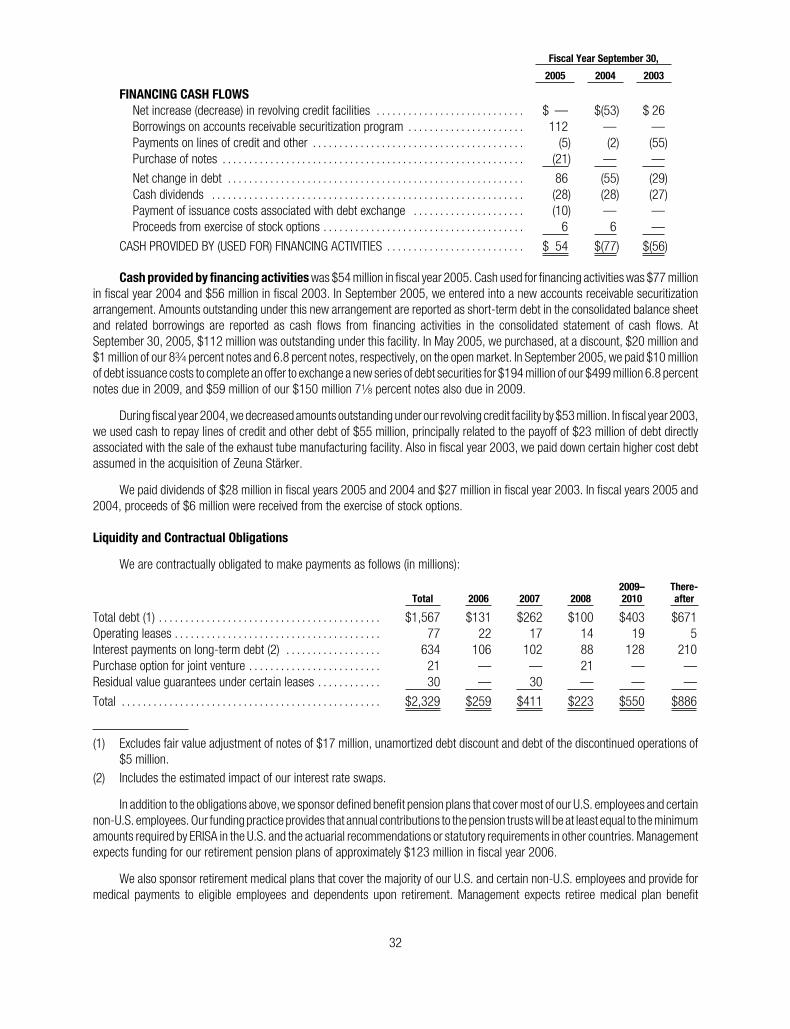
Fiscal Year September 30,
2005 2004 2003
FINANCING CASH FLOWSNet increase (decrease) in revolving credit facilities . . . . . . . . . . . . . . . . . . . . . . . . . . . . $ — $(53) $ 26Borrowings on accounts receivable securitization program . . . . . . . . . . . . . . . . . . . . . . 112 — —Payments on lines of credit and other . . . . . . . . . . . . . . . . . . . . . . . . . . . . . . . . . . . . . . . . (5) (2) (55)Purchase of notes . . . . . . . . . . . . . . . . . . . . . . . . . . . . . . . . . . . . . . . . . . . . . . . . . . . . . . . . . (21) — —
Net change in debt . . . . . . . . . . . . . . . . . . . . . . . . . . . . . . . . . . . . . . . . . . . . . . . . . . . . . . . . 86 (55) (29)Cash dividends . . . . . . . . . . . . . . . . . . . . . . . . . . . . . . . . . . . . . . . . . . . . . . . . . . . . . . . . . . . (28) (28) (27)Payment of issuance costs associated with debt exchange . . . . . . . . . . . . . . . . . . . . . (10) — —Proceeds from exercise of stock options . . . . . . . . . . . . . . . . . . . . . . . . . . . . . . . . . . . . . . 6 6 —
CASH PROVIDED BY (USED FOR) FINANCING ACTIVITIES . . . . . . . . . . . . . . . . . . . . . . . . . . $ 54 $(77) $(56)
Cash provided by financing activities was $54 million in fiscal year 2005. Cash used for financing activities was $77 millionin fiscal year 2004 and $56 million in fiscal 2003. In September 2005, we entered into a new accounts receivable securitizationarrangement. Amounts outstanding under this new arrangement are reported as short-term debt in the consolidated balance sheetand related borrowings are reported as cash flows from financing activities in the consolidated statement of cash flows. AtSeptember 30, 2005, $112 million was outstanding under this facility. In May 2005, we purchased, at a discount, $20 million and$1 million of our 83⁄4 percent notes and 6.8 percent notes, respectively, on the open market. In September 2005, we paid $10 millionof debt issuance costs to complete an offer to exchange a new series of debt securities for $194 million of our $499 million 6.8 percentnotes due in 2009, and $59 million of our $150 million 71⁄8 percent notes also due in 2009.
During fiscal year 2004, we decreased amounts outstanding under our revolving credit facility by $53 million. In fiscal year 2003,we used cash to repay lines of credit and other debt of $55 million, principally related to the payoff of $23 million of debt directlyassociated with the sale of the exhaust tube manufacturing facility. Also in fiscal year 2003, we paid down certain higher cost debtassumed in the acquisition of Zeuna Starker.
We paid dividends of $28 million in fiscal years 2005 and 2004 and $27 million in fiscal year 2003. In fiscal years 2005 and2004, proceeds of $6 million were received from the exercise of stock options.
Liquidity and Contractual Obligations
We are contractually obligated to make payments as follows (in millions):
Total 2006 2007 20082009–2010
There-after
Total debt (1) . . . . . . . . . . . . . . . . . . . . . . . . . . . . . . . . . . . . . . . . . . $1,567 $131 $262 $100 $403 $671Operating leases . . . . . . . . . . . . . . . . . . . . . . . . . . . . . . . . . . . . . . . 77 22 17 14 19 5Interest payments on long-term debt (2) . . . . . . . . . . . . . . . . . . 634 106 102 88 128 210Purchase option for joint venture . . . . . . . . . . . . . . . . . . . . . . . . . 21 — — 21 — —Residual value guarantees under certain leases . . . . . . . . . . . . 30 — 30 — — —
Total . . . . . . . . . . . . . . . . . . . . . . . . . . . . . . . . . . . . . . . . . . . . . . . . . $2,329 $259 $411 $223 $550 $886
(1) Excludes fair value adjustment of notes of $17 million, unamortized debt discount and debt of the discontinued operations of$5 million.
(2) Includes the estimated impact of our interest rate swaps.
In addition to the obligations above, we sponsor defined benefit pension plans that cover most of our U.S. employees and certainnon-U.S. employees. Our funding practice provides that annual contributions to the pension trusts will be at least equal to the minimumamounts required by ERISA in the U.S. and the actuarial recommendations or statutory requirements in other countries. Managementexpects funding for our retirement pension plans of approximately $123 million in fiscal year 2006.
We also sponsor retirement medical plans that cover the majority of our U.S. and certain non-U.S. employees and provide formedical payments to eligible employees and dependents upon retirement. Management expects retiree medical plan benefit
32

payments of approximately $50 million in fiscal year 2006; $40 million in fiscal year 2007; $39 million in fiscal year 2008; $38 millionin fiscal year 2009 and $36 million in fiscal year 2010.
Revolving and Other Debt — In September 2005, we completed an offer to exchange a new series of debt securities for$194 million of our $499 million 6.8 percent notes due in 2009, and $59 million of our $150 million 71⁄8 percent notes also due in2009 for $253 million of new 81⁄8 percent notes due in 2015.
Also in fiscal year 2005, we purchased, at a discount, $20 million and $1 million of our 83⁄4 percent notes and 6.8 percent notes,respectively, on the open market.
We have a $900 million revolving credit facility that expires in 2008. Under the facility, borrowings are subject to interest basedon quoted LIBOR rates plus a margin, and a facility fee, both of which are based upon the company’s credit rating. At September 30,2005, the margin over the LIBOR rate was 150 basis points, and the facility fee was 37.5 basis points. Certain of our domesticsubsidiaries, as defined in the credit agreement, irrevocably and unconditionally guarantee amounts outstanding under thecredit facility.
The credit facility requires us to maintain a total net debt to earnings before interest, taxes, depreciation and amortization (“EBITDA”)ratio no greater than 3.25x and a minimum fixed charge coverage ratio (EBITDA less capital expenditures to interest expense) no lessthan 1.50x. At September 30, 2005, we were in compliance with all covenants.
On May 10, 2005, Standard & Poor’s lowered the company’s credit rating to BB from BB+ and on June 23, 2005, Moody’slowered the company’s credit rating to Ba2 from Ba1.
We also have an arrangement with a non-consolidated joint venture that allows the company to borrow funds from time to time,at LIBOR plus 50 basis points. No amounts were outstanding under this arrangement at September 30, 2005 and 2004.
We have $150 million of debt securities remaining unissued under the shelf registration filed with the SEC in April 2001 (seeNote 15 of the Notes to Consolidated Financial Statements).
Leases — One of our operating leases requires us to maintain financial ratios that are similar to those required by our revolvingcredit agreement. At September 30, 2005, we were in compliance with all covenants. We have a residual value guarantee of$30 million related to one of our leases.
Accounts Receivable Securitization and Factoring — In September 2005, the company entered into a new $250 millionaccounts receivable securitization arrangement to improve financial flexibility and lower interest costs. Under the new arrangement,the company sells substantially all of the trade receivables of certain U.S. subsidiaries to ArvinMeritor Receivables Corporation (ARC),a wholly owned, consolidated special purpose subsidiary, which funds these purchases with borrowings under a loan agreement witha bank. Amounts outstanding under this agreement are collateralized by eligible receivables of ARC and are reported as short-termdebt in the consolidated balance sheet. As of September 30, 2005, we had utilized $112 million of this accounts receivablesecuritization facility. As of September 30, 2004 we utilized $24 million of the old facility.
If certain receivables performance-based covenants were not met, it would constitute a termination event, which, at the optionof the banks, could result in termination of the accounts receivable securitization arrangement. At September 30, 2005, we were incompliance with all covenants.
We previously participated in a European accounts receivable securitization program that expired in March 2005.
In addition, several our European subsidiaries factor eligible accounts receivable with financial institutions. The amounts offactored receivables were $23 million and $10 million at September 30, 2005 and 2004, respectively. There can be no assurancethat these factoring arrangements will be used or available to us in the future.
Restructuring Actions — As previously mentioned, approximately $110 million of the $135 million of restructuring chargesrelated to actions announced during fiscal year 2005, are expected to be cash costs. Of the $110 million cash costs, approximately$25 million was spent in fiscal year 2005 and we expect the remainder to be spent in fiscal year 2006 and 2007.
Tender Offer
In the first quarter of fiscal year 2004, as a result of the company’s decision to withdraw its all cash tender offer to acquire allof the outstanding shares of Dana Corporation, the company recorded a net charge of $9 million ($6 million after-tax, or $0.09 perdiluted share). The pre-tax charge included $16 million in direct incremental acquisition costs, less a gain on the sale of Dana stockof $7 million.
33

Critical Accounting Policies
Critical accounting policies are those that are most important to the portrayal of the company’s financial condition and results ofoperations. These policies require management’s most difficult, subjective or complex judgments in the preparation of the financialstatements and accompanying notes. Management makes estimates and assumptions about the effect of matters that are inherentlyuncertain, relating to the reporting of assets, liabilities, revenues, expenses and the disclosure of contingent assets and liabilities. Ourmost critical accounting policies are discussed below.
Pensions — Our pension obligations are determined on an actuarial basis annually and are measured as of June 30. The U.S.plans include a qualified and non-qualified pension plan. Significant non-U.S. plans are located in the United Kingdom, Canada andGermany. The following are the significant assumptions used in the measurement of the projected benefit obligation (PBO) and netperiodic pension expense:
2005 2004
U.S. Non-U.S. U.S. Non-U.S.
Assumptions as of June 30Discount rate . . . . . . . . . . . . . . . . . . . . . . . . . . . . 5.30% 4.00%–5.00% 6.25% 5.50%–6.25%Assumed return on plan assets . . . . . . . . . . . . 8.50% 7.75%–8.50% 8.50% 8.00%–8.50%Rate of compensation increase . . . . . . . . . . . . . 3.75% 3.00%–3.50% 3.75% 3.00%–3.75%
The discount rate is used to calculate the present value of the PBO. The rate is determined based on high-quality fixed incomeinvestments that match the duration of expected benefit payments. The company uses a portfolio of long-term corporate AA/Aa bondsthat match the duration of the expected benefit payments to establish the discount rate for this assumption.
The assumed return on plan assets is used to determine net periodic pension expense. The rate of return assumptions arebased on projected long-term market returns for the various asset classes in which the plans are invested, weighted by the targetasset allocations. An incremental amount for active management, where appropriate, is included in the rate of return assumption.The return assumption is reviewed annually.
The rate of compensation increase represents the long-term assumption for expected increases to salaries for pay-related plans.
These assumptions reflect our historical experience and our best judgments regarding future expectations. The effects of theindicated increase and decrease in selected assumptions, assuming no changes in benefit levels and no amortization of gains or lossesfor the plans in 2005, is shown below (in millions):
Effect on All Plans — June 30, 2005
PercentagePoint
Change
Increase(Decrease)
in PBO
Increase(Decrease) inAccumulated
OtherComprehensive
Loss
Increase(Decrease)
in 2005PensionExpense
AssumptionDiscount rate . . . . . . . . . . . . . . . . . . . . . . . . . . . . . . . . . . . . . –0.5 pts $ 150 $ 92 $ 15
+0.5 pts (137) (94) (14)Assumed return on plan assets . . . . . . . . . . . . . . . . . . . . . –1.0 pts NA NA 12
+1.0 pts NA NA (12)
NA — Not Applicable
Accounting guidance applicable to pensions does not require immediate recognition of the effects of a deviation between actualand assumed experience and the revision of an estimate. This approach allows the favorable and unfavorable effects that fall withinan acceptable range to be netted and disclosed as an unrecognized gain or loss in the footnotes. At September 30, 2005 and 2004,we had an unrecognized loss of $866 million and $642 million, respectively. A portion of this loss will be recognized into earningsin fiscal year 2006. The effect on fiscal years after 2006 will depend on the actual experience of the plans.
In recognition of the long-term nature of the liabilities of the pension plans, we have targeted an asset allocation strategy thatintends to promote asset growth while maintaining an acceptable level of risk over the long term. Asset-liability studies are performed
34

periodically to validate the continued appropriateness of these asset allocation targets. The asset allocation for the U.S. plan is targetedat 70–75 percent equity securities, 20–25 percent debt securities, and 0–5 percent alternative assets. The target asset allocationranges for the non-U.S. plans are 65–75 percent equity securities, 20–35 percent debt securities, and 0–5 percent real estate.
The investment strategies for the pension plans are designed to achieve an appropriate diversification of investments as wellas safety and security of the principal invested. Assets invested are allocated to certain global sub-asset categories within prescribedranges in order to promote international diversification across security type, issuer type, investment style, industry group, andeconomic sector. Assets of the plans are both actively and passively managed. Policy limits are placed on the percentage of plan assetsthat can be invested in a security of any single issuer and minimum credit quality standards are established for debt securities.ArvinMeritor securities comprised less than one-half percent of the value of our worldwide pension assets as of September 30, 2005.
The fiscal year 2006 pension expense is estimated to be $104 million. This may vary depending upon the accuracy of our originaland future assumptions.
Retiree Medical — We have retirement medical plans that cover the majority of our U.S. and certain non-U.S. employees andprovide for medical payments to eligible employees and dependents upon retirement. Our retiree medical obligations are measuredas of June 30.
The following are the significant assumptions used in the measurement of the accumulated postertirement benefitobligation (APBO):
2005 2004
Assumptions as of June 30Discount rate . . . . . . . . . . . . . . . . . . . . . . . . . . . . . . . . . . . . . . . . . . . . . . . . . . . . . . . . 5.00% 6.25%Health care cost trend rate (weighted average) . . . . . . . . . . . . . . . . . . . . . . . . . . . 9.00% 9.50%Ultimate health care trend rate . . . . . . . . . . . . . . . . . . . . . . . . . . . . . . . . . . . . . . . . . 5.00% 5.00%Year ultimate rate is reached . . . . . . . . . . . . . . . . . . . . . . . . . . . . . . . . . . . . . . . . . . 2011 2011
The discount rate is the rate used to calculate the present value of the APBO. The rate is determined based on high-qualityfixed income investments that match the duration of expected benefit payments. We have typically used the corporate AA/Aa bondrate for this assumption.
The health care cost trend rate represents the company’s expected annual rates of change in the cost of health care benefits.The trend rate noted above represents a forward projection of health care costs as of the measurement date. Our projection for fiscalyear 2006 is an increase in health care costs of 9.0 percent. For measurement purposes, the annual increase in health care costswas assumed to decrease gradually to 5.0 percent by fiscal year 2011 and remain at that level thereafter.
A one-percentage point change in the assumed health care cost trend rate for all years to, and including, the ultimate rate wouldhave the following effects (in millions):
2005 2004
Effect on total of service and interest cost1% Increase . . . . . . . . . . . . . . . . . . . . . . . . . . . . . . . . . . . . . . . . . . . . . . . . . . . . . . . . . $ 3 $ 41% Decrease . . . . . . . . . . . . . . . . . . . . . . . . . . . . . . . . . . . . . . . . . . . . . . . . . . . . . . . . (2) (4)
Effect on APBO1% Increase . . . . . . . . . . . . . . . . . . . . . . . . . . . . . . . . . . . . . . . . . . . . . . . . . . . . . . . . . 38 371% Decrease . . . . . . . . . . . . . . . . . . . . . . . . . . . . . . . . . . . . . . . . . . . . . . . . . . . . . . . . (35) (34)
As previously discussed, we approved changes to certain retiree medical plans in fiscal year 2004. These plan amendmentsand the related impact is reflected in the APBO as of September 30, 2005 and 2004. Beginning in April 2005, salaried retirees andcertain non-union hourly retirees under age 65 who now pay a portion of the cost for their coverage will contribute an increased shareeach year. The benefit currently provided by the company will be phased out by fiscal 2023. For retirees age 65 and older, we willno longer provide supplemental healthcare benefits to Medicare-eligible retirees beginning in January 2006. These plan amendmentshave been challenged in class action lawsuits brought by members of the United Auto Workers and United Steel Workers. We believethe company has meritorious defenses to these actions and plans to defend these suits vigorously.
The plan changes resulted in a reduction in the APBO of $257 million in fiscal year 2004, which is amortized as a reductionof retiree medical expense over the average remaining service life of approximately 12 years. The fiscal year 2006 retiree
35

medical expense is estimated to be approximately $30 million. This may vary depending upon the accuracy of our original andfuture assumptions.
Product Warranties — Our CVS segment records product warranty costs at the time of shipment of products to customers.Liabilities for product recall campaigns are recorded at the time the company’s obligation is known and can be reasonably estimated.Product warranties, including recall campaigns, not expected to be paid within one year are recorded as a non-current liability.
Our LVS segment records product warranty liabilities based on its individual customer or warranty-sharing agreements. Productwarranties are recorded for known warranty issues when amounts can be reasonably estimated.
Significant factors and information used by management when estimating product warranty liabilities include:
• Past claims experience;
• Sales history;
• Product manufacturing and industry developments; and
• Recoveries from third parties.
Asbestos — Maremont Corporation (“Maremont”) — Maremont, a subsidiary of ArvinMeritor, manufactured frictionproducts containing asbestos from 1953 through 1977, when it sold its friction product business. Arvin acquired Maremont in 1986.Maremont and many other companies are defendants in suits brought by individuals claiming personal injuries as a result of exposureto asbestos-containing products. Although Maremont has been named in these cases, very few cases allege actual injury and, in thecases where actual injury has been alleged, very few claimants have established that a Maremont product caused their injuries.Plaintiffs’ lawyers often sue dozens or even hundreds of defendants in individual lawsuits on behalf of hundreds or thousands ofclaimants, seeking damages against all named defendants irrespective of the disease or injury and irrespective of any causalconnection with a particular product. For these reasons, Maremont does not consider the number of claims filed or the damagesalleged to be a meaningful factor in determining its asbestos-related liability.
Prior to February 2001, Maremont participated in the Center for Claims Resolution (“CCR”) and shared with other CCR membersin the payments of defense and indemnity costs for asbestos-related claims. The CCR handled the resolution and processing ofasbestos claims on behalf of its members until February 2001, when it was reorganized and discontinued negotiating sharedsettlements. Since that time, Maremont has handled asbestos-related claims through its own defense counsel and has taken a moreaggressive defensive approach that involves examining the merits of each asbestos-related claim.
At the end of fiscal year 2004 and through the third quarter of fiscal year 2005, Maremont established reserves for pendingasbestos-related claims that reflected internal estimates of its defense and indemnity costs. These estimates were based on the historyand nature of filed claims to date and Maremont’s experience with historical indemnity and litigation costs, using data from actualCCR settlements, experience in resolving claims since dissolution of the CCR, and Maremont’s assessment of the nature of the claims.Maremont did not accrue reserves for its potential liability for asbestos-related claims that may be asserted against it in the future,because it did not have sufficient information to make a reasonable estimate of these unknown claims.
In the fourth quarter of fiscal year 2005, Maremont worked with Bates White LLC (Bates White), a consulting firm with extensiveexperience estimating costs associated with asbestos litigation, to assist with determining whether it would be possible to estimatethe cost of resolving pending and future asbestos-related claims that have been, and could reasonably be expected to be, filed againstMaremont, as well as the cost of Maremont’s share of committed but unpaid settlements entered into by the CCR. Although it is notpossible to estimate the full range of costs because of various uncertainties, Bates White advised Maremont that it would be possibleto determine an estimate of a reasonable forecast of the cost of resolving pending and future asbestos-related claims, based onhistorical data and certain assumptions with respect to events that occur in the future.
The resulting study by Bates White provided an estimate of the reasonably possible range of Maremont’s obligation for asbestospersonal injury claims over the next three to four years of $36 million to $55 million. After consultation with Bates White, Maremontdetermined that the most likely and probable liability for pending and future claims over the next four years is $50 million. The ultimatecost of resolving pending and future claims is estimated based on the history of claims and expenses for plaintiffs represented by lawfirms in jurisdictions with an established history with Maremont.
36

The following assumptions were made by Maremont after consultation with Bates White and are included in their study:
• Pending and future claims were estimated for a four year period ending in fiscal year 2009. Maremont believes that thelitigation environment will change significantly in several years, and that the reliability of estimates of future probableexpenditures in connection with asbestos-related personal injury claims declines for each year further in the future. As aresult, estimating a probable liability beyond four years is difficult and uncertain;
• The ultimate cost of resolving pending and future claims filed in Madison County, Illinois, a jurisdiction where a substantialamount of Maremont’s claims are filed, will decline to reflect average outcomes throughout the United States. Additionally,defense and processing costs in Madison County, Illinois will be reduced from current levels;
• Defense and processing costs for pending and future claims filed outside of Madison County, Illinois will be at the levelconsistent with Maremont’s prior experience; and
• The ultimate cost of resolving nonmalignant claims with plaintiff’s law firms in jurisdictions without an established history withMaremont cannot be reasonably estimated. Recent changes in tort law and insufficient settlement history make estimating aliability for these nonmalignant claims difficult and uncertain.
The significant reduction in the liability since September 30, 2004 is a result of both an overall reduction in pending claims andresults of the study by Bates White, which estimates a value for pending and future claims that are expected to be settled. Maremontpreviously estimated a settlement value on all pending claims.
Maremont has insurance that reimburses a substantial portion of the costs incurred defending against asbestos-related claims.The coverage also reimburses Maremont for any indemnity paid on those claims. The coverage is provided by several insurancecarriers based on insurance agreements in place. Maremont has recorded asbestos-related insurance receivables as ofSeptember 30, 2005. Certain insurance policies have been settled in cash prior to the ultimate settlement of related asbestos liabilities.Amounts received from insurance settlements generally reduce recorded insurance receivables. Receivables for policies in disputeare not recorded.
The amounts recorded for the asbestos-related reserves and recoveries from insurance companies are based upon assumptionsand estimates derived from currently known facts. All such estimates of liabilities and recoveries for asbestos-related claims aresubject to considerable uncertainty because such liabilities and recoveries are influenced by variables that are difficult to predict. Thefuture litigation environment for Maremont could change significantly from its past experience, due, for example, to changes in themix of claims filed against Maremont in terms of plaintiffs’ law firm, jurisdiction and disease; legislative or regulatory developments;Maremont’s approach to defending claims; or payments to plaintiffs from other defendants. Estimated recoveries are influenced bycoverage issues among insurers, and the continuing solvency of various insurance companies. If the assumptions with respect to thenature of pending claims, the cost to resolve claims and the amount of available insurance prove to be incorrect, the actual amountof liability for Maremont’s liability asbestos-related claims, and the effect on the company, could differ materially from currentestimates and, therefore, could have a material impact on our financial position and results of operations.
Asbestos — Rockwell — ArvinMeritor, along with many other companies, has also been named as a defendant in lawsuitsalleging personal injury as a result of exposure to asbestos used in certain components of Rockwell products many years ago. Liabilityfor these claims was transferred to the company at the time of the spin-off of the automotive business to Meritor from Rockwell in1997. Currently there are thousands of claimants in lawsuits that name us, together with many other companies, as defendants.However, we do not consider the number of claims filed or the damages alleged to be a meaningful factor in determining asbestos-related liabilities. A significant portion of the claims do not identify any of Rockwell’s products or specify which of the claimants, ifany, were exposed to asbestos attributable to Rockwell’s products, and past experience has shown that the vast majority of theclaimants will never identify any of Rockwell’s products. For those claimants who do show that they worked with Rockwell’s products,we nevertheless believe we have meritorious defenses, in substantial part due to the integrity of the products involved, theencapsulated nature of any asbestos-containing components, and the lack of any impairing medical condition on the part of manyclaimants. We defend these cases vigorously. Historically, ArvinMeritor has been dismissed from the vast majority of these claimswith no payment to claimants.
Rockwell maintained insurance coverage that we believe covers indemnity and defense costs, over and above self-insuranceretentions, for most of these claims. We have initiated claims against these carriers to enforce the insurance policies. Although thestatus of one carrier as a financially viable entity is in question, we expect to recover the majority of defense and indemnity costs wehave incurred to date, over and above self-insured retentions, and a substantial portion of the costs for defending asbestos claimsgoing forward.
37
ArvinMeritor has not established reserves for pending or future claims or for corresponding recoveries for Rockwell-legacyasbestos-related claims and defense and indemnity costs related to these claims are expensed as incurred. Reserves have not beenestablished because management cannot reasonably estimate the ultimate liabilities for these costs, primarily because we do not havea sufficient history of claims settlement and defense costs from which to develop reliable assumptions. The uncertainties of asbestosclaim litigation and resolution of the litigation with our insurance companies make it difficult to predict accurately the ultimate resolutionof asbestos claims. That uncertainty is increased by the possibility of adverse rulings or new legislation affecting asbestos claimlitigation or the settlement process. Subject to these uncertainties and based on our experience defending these asbestos claims,we do not believe these lawsuits will have a material adverse effect on our financial condition. Rockwell was not a member of the CCRand handled its asbestos-related claims using its own litigation counsel. As a result, we do not have any additional potential liabilitiesfor committed CCR settlements in connection with the Rockwell-legacy cases.
Environmental — We record liabilities for environmental issues in the accounting period in which our responsibility andremediation plans are established and the cost can be reasonably estimated. At environmental sites in which more than one potentiallyresponsible party has been identified, we record a liability for our allocable share of costs related to our involvement with the site, aswell as an allocable share of costs related to insolvent parties or unidentified shares. At environmental sites in which we are the onlypotentially responsible party, a liability is recorded for the total estimated costs of remediation before consideration of recovery frominsurers or other third parties. The ultimate cost with respect to our environmental obligations could significantly exceed the costswe have recorded as liabilities.
Significant factors considered by management when estimating environmental reserves include:
• Evaluations of current law and existing technologies;
• The outcome of discussions with regulatory agencies;
• Physical and scientific data at the site;
• Government regulations and legal standards; and
• Proposed remedies and technologies.
Goodwill — Goodwill is reviewed for impairment annually or more frequently if certain indicators arise, by using discountedcash flows and market multiples on earnings to determine the fair value of each reporting unit. An impairment loss may be recognizedif the review indicates that the carrying value of a reporting unit exceeds its fair value. If business conditions or other factors causethe profitability and cash flows of the reporting unit to decline, we may be required to record impairment charges for goodwill at thattime. Significant factors considered by management when evaluating goodwill for impairment include:
• Fair value of the reporting unit, including developing estimates of future cash flows and market multiples;
• Discount rate; and
• As required, an allocation of the reporting unit’s fair value to the underlying net assets of the reporting unit.
Impairment of Long-Lived Assets — Long-lived assets, excluding goodwill, to be held and used are reviewed for impairmentwhenever adverse events or changes in circumstances indicate a possible impairment. An impairment loss is recognized when the long-lived assets’ carrying value exceeds the fair value. If business conditions or other factors cause the profitability and cash flows to decline,we may be required to record impairment charges at that time. Long-lived assets held for sale are recorded at the lower of their carryingamount or fair value less cost to sell. Significant judgments and estimates used by management when evaluating long-lived assets forimpairment include:
• An assessment as to whether an adverse event or circumstance has triggered the need for an impairment review; and
• Undiscounted future cash flows generated by the asset.
Income Taxes — Deferred income tax assets and liabilities are recognized for the future tax consequences attributable todifferences between financial statement carrying amounts of existing assets and liabilities and their respective tax bases and operatingloss and tax credit carryforwards. Deferred tax assets and liabilities are measured using enacted tax rates expected to apply to taxableincome in the years in which those temporary differences are expected to be recovered or settled. If it is more likely than not that thedeferred tax asset will be realized, no valuation allowance is recorded. Management judgment is required in determining thecompany’s provision for income taxes, deferred tax assets and liabilities and the valuation allowance recorded against the company’s
38

net deferred tax assets. The valuation allowance would need to be adjusted in the event future taxable income is materially differentthan amounts estimated. Significant judgments, estimates and factors considered by management in its determination of theprobability of the realization of deferred tax assets include:
• Historical operating results;
• Expectations of future earnings;
• Tax planning strategies; and
• The extended period of time over which the retirement medical and pension liabilities will be paid.
New Accounting Pronouncements
In December 2004, the Financial Accounting Standards Board (FASB) issued Statement of Financial Accounting Standards(SFAS) No. 123(R), “Share-Based Payment,” which will require compensation costs related to share-based payment transactions tobe recognized in the financial statements. This statement also establishes fair value for share based payment transactions withemployees. The company began expensing the fair value of stock options in fiscal year 2003. In addition, the company expenses stockcompensation granted to retirement eligible employees ratably over the respective vesting period. Upon adoption of FAS 123(R), thecompany will recognize compensation expense associated with grants to retirement eligible employees in the period granted. Thisstatement is effective for the company in the first quarter of fiscal year 2006 and is not expected to have a material effect on its financialcondition or results of operations.
In December 2004, the FASB issued Staff Position (FSP) FAS 109-1, “Application of FASB Statement No. 109, Accounting forIncome Taxes, to the Tax Deduction on Qualified Production Activities Provided by the American Jobs Creation Act of 2004.” TheAmerican Jobs Creation Act of 2004 (the 2004 Act) provides tax relief to U.S. domestic manufacturers under certain circumstances. TheFSP states that the manufacturers’ deduction under the 2004 Act should be accounted for as a special deduction in accordance withSFAS No. 109 and not as a tax rate deduction. The adoption of FSP FAS 109-1 did not have an impact on the company’s results ofoperations or financial position.
In December 2004, the FASB issued FSP FAS 109-2, “Accounting and Disclosure Guidance for the Foreign RepatriationProvision within the American Jobs Creation Act of 2004.” The 2004 Act introduced a special limited-time dividends receiveddeduction on the repatriation of certain foreign earnings to a U.S. taxpayer. The FSP addresses whether a company should be allowedadditional time beyond the financial reporting period in which the 2004 Act was enacted, to evaluate the effects of the 2004 Act onthe company’s plan for reinvestment or repatriation of foreign earnings for purposes of applying SFAS No. 109. We are still evaluatingthe repatriation provisions of the 2004 Act for purposes of applying SFAS No. 109. This evaluation is expected to be completed infiscal year 2006. The range of income tax effects of such repatriation cannot be reasonably estimated at this time.
In November 2004, the FASB issued SFAS No. 151, “Inventory Costs.” This statement clarifies the accounting for abnormalamounts of idle facility expense, freight, handling costs and wasted material (spoilage), and requires that these items be recognizedas current-period charges. In addition, SFAS No. 151 requires that the allocation of fixed production overhead to inventory be basedon the normal capacity of the company’s manufacturing facilities. SFAS No. 151 is effective for the company in the first quarter offiscal year 2006. The company is evaluating the impact of adopting this standard.
Accounting Changes
Prior to the fourth quarter of fiscal year 2004, certain CVS inventories in the U.S. were valued using the last-in, first-out (LIFO)method. During the fourth quarter of fiscal year 2004, the company changed its method of costing these inventories to the first-in,first-out (FIFO) method from LIFO. As a result, all U.S. inventories are now stated at the lower of cost, determined on a FIFO basis,or market. We believe this change is preferable as it results in inventories being valued in a manner which more closely approximatescurrent costs and better matches revenues with costs of goods sold. In accordance with accounting principles generally acceptedin the U.S., all prior periods have been restated to give retroactive effect to this change. The effect of this change decreased net incomein 2003 by $3 million ($0.04 per diluted share).
International Operations
Approximately 49 percent of the company’s total assets, excluding assets of discontinued operations, as of September 30,2005, and 49 percent of fiscal 2005 sales from continuing operations were outside North America. Management believes thatinternational operations have significantly benefited the financial performance of the company. However, our international operations
39
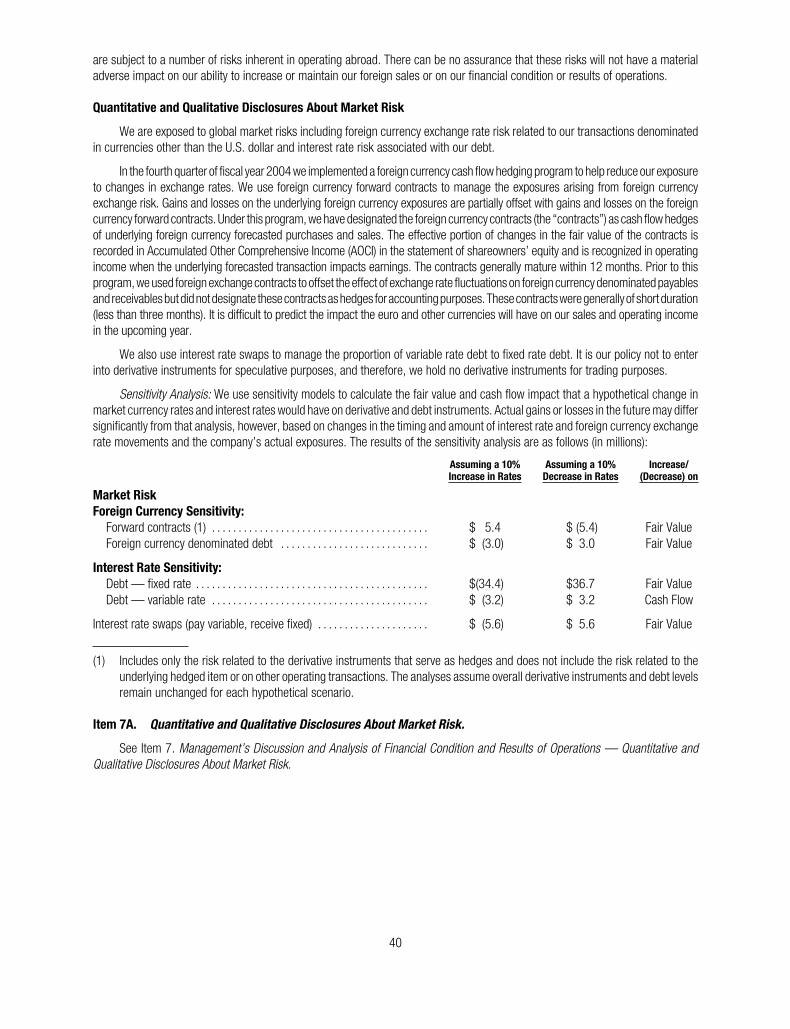
are subject to a number of risks inherent in operating abroad. There can be no assurance that these risks will not have a materialadverse impact on our ability to increase or maintain our foreign sales or on our financial condition or results of operations.
Quantitative and Qualitative Disclosures About Market Risk
We are exposed to global market risks including foreign currency exchange rate risk related to our transactions denominatedin currencies other than the U.S. dollar and interest rate risk associated with our debt.
In the fourth quarter of fiscal year 2004 we implemented a foreign currency cash flow hedging program to help reduce our exposureto changes in exchange rates. We use foreign currency forward contracts to manage the exposures arising from foreign currencyexchange risk. Gains and losses on the underlying foreign currency exposures are partially offset with gains and losses on the foreigncurrency forward contracts. Under this program, we have designated the foreign currency contracts (the “contracts”) as cash flow hedgesof underlying foreign currency forecasted purchases and sales. The effective portion of changes in the fair value of the contracts isrecorded in Accumulated Other Comprehensive Income (AOCI) in the statement of shareowners’ equity and is recognized in operatingincome when the underlying forecasted transaction impacts earnings. The contracts generally mature within 12 months. Prior to thisprogram, we used foreign exchange contracts to offset the effect of exchange rate fluctuations on foreign currency denominated payablesand receivablesbutdidnotdesignate thesecontractsashedges foraccountingpurposes.Thesecontractsweregenerallyof shortduration(less than three months). It is difficult to predict the impact the euro and other currencies will have on our sales and operating incomein the upcoming year.
We also use interest rate swaps to manage the proportion of variable rate debt to fixed rate debt. It is our policy not to enterinto derivative instruments for speculative purposes, and therefore, we hold no derivative instruments for trading purposes.
Sensitivity Analysis: We use sensitivity models to calculate the fair value and cash flow impact that a hypothetical change inmarket currency rates and interest rates would have on derivative and debt instruments. Actual gains or losses in the future may differsignificantly from that analysis, however, based on changes in the timing and amount of interest rate and foreign currency exchangerate movements and the company’s actual exposures. The results of the sensitivity analysis are as follows (in millions):
Assuming a 10%Increase in Rates
Assuming a 10%Decrease in Rates
Increase/(Decrease) on
Market RiskForeign Currency Sensitivity:
Forward contracts (1) . . . . . . . . . . . . . . . . . . . . . . . . . . . . . . . . . . . . . . . . . $ 5.4 $ (5.4) Fair ValueForeign currency denominated debt . . . . . . . . . . . . . . . . . . . . . . . . . . . . $ (3.0) $ 3.0 Fair Value
Interest Rate Sensitivity:Debt — fixed rate . . . . . . . . . . . . . . . . . . . . . . . . . . . . . . . . . . . . . . . . . . . . $(34.4) $36.7 Fair ValueDebt — variable rate . . . . . . . . . . . . . . . . . . . . . . . . . . . . . . . . . . . . . . . . . $ (3.2) $ 3.2 Cash Flow
Interest rate swaps (pay variable, receive fixed) . . . . . . . . . . . . . . . . . . . . . $ (5.6) $ 5.6 Fair Value
(1) Includes only the risk related to the derivative instruments that serve as hedges and does not include the risk related to theunderlying hedged item or on other operating transactions. The analyses assume overall derivative instruments and debt levelsremain unchanged for each hypothetical scenario.
Item 7A. Quantitative and Qualitative Disclosures About Market Risk.
See Item 7. Management’s Discussion and Analysis of Financial Condition and Results of Operations — Quantitative andQualitative Disclosures About Market Risk.
40

Item 8. Financial Statements and Supplementary Data.
Report of Independent Registered Public Accounting Firm
To the Board of Directors and Shareowners of ArvinMeritor, Inc.Troy, Michigan
We have audited the accompanying consolidated balance sheets of ArvinMeritor, Inc. (the “company”) as of September 30, 2005and 2004, and the related consolidated statements of operations, cash flows and shareowners’ equity for each of the three yearsin the period ended September 30, 2005. Our audits also included the financial statement schedule listed in the Index at Item 15 (a)(2). These financial statements and financial statement schedule are the responsibility of the company’s management. Ourresponsibility is to express an opinion on these financial statements based on our audits.
We conducted our audits in accordance with the standards of the Public Company Accounting Oversight Board (United States). Thosestandards require that we plan and perform the audit to obtain reasonable assurance about whether the financial statements are freeof material misstatement. An audit includes examining, on a test basis, evidence supporting the amounts and disclosures in thefinancial statements. An audit also includes assessing the accounting principles used and significant estimates made by management,as well as evaluating the overall financial statement presentation. We believe that our audits provide a reasonable basis for our opinion.
In our opinion, such consolidated financial statements present fairly, in all material respects, the financial position of ArvinMeritor,Inc. as of September 30, 2005 and 2004, and the results of its operations and its cash flows for each of the three years in the periodended September 30, 2005, in conformity with accounting principles generally accepted in the United States of America. Also, in ouropinion, such financial statement schedule, when considered in relation to the basic consolidated financial statements taken as awhole, presents fairly, in all material respects, the information set forth therein.
As discussed in Note 2 to the consolidated financial statements, in 2004 the company changed its method of determining the costof certain inventories from the last-in, first-out method to the first-in, first-out method and retroactively restated the 2003 consolidatedfinancial statements for the change.
As also discussed in Note 2 to the consolidated financial statements, effective July 1, 2003, the company changed its method ofaccounting for its interests in variable interest entities.
We have also audited, in accordance with the standards of the Public Company Accounting Oversight Board (United States), theeffectiveness of the company’s internal control over financial reporting as of September 30, 2005, based on the criteria establishedin Internal Control — Integrated Framework issued by the Committee of Sponsoring Organizations of the Treadway Commissionand our report dated November 15, 2005 expressed an unqualified opinion on management’s assessment of the effectiveness of thecompany’s internal control over financial reporting and an unqualified opinion on the effectiveness of the company’s internal control overfinancial reporting.
DELOITTE & TOUCHE LLP
Detroit, MichiganNovember 15, 2005
41

ARVINMERITOR, INC.
CONSOLIDATED STATEMENT OF OPERATIONS(In millions, except per share amounts)
Year Ended September 30,
2005 2004 2003
Sales . . . . . . . . . . . . . . . . . . . . . . . . . . . . . . . . . . . . . . . . . . . . . . . . . . . . . . . . . . . . . $ 8,903 $ 8,033 $ 6,723Cost of sales . . . . . . . . . . . . . . . . . . . . . . . . . . . . . . . . . . . . . . . . . . . . . . . . . . . . . . (8,267) (7,366) (6,132)
GROSS MARGIN . . . . . . . . . . . . . . . . . . . . . . . . . . . . . . . . . . . . . . . . . . . . . . . . . . . 636 667 591Selling, general and administrative . . . . . . . . . . . . . . . . . . . . . . . . . . . . . . . . (376) (385) (340)Restructuring costs . . . . . . . . . . . . . . . . . . . . . . . . . . . . . . . . . . . . . . . . . . . . . . (117) (15) (20)Gain on divestitures, net . . . . . . . . . . . . . . . . . . . . . . . . . . . . . . . . . . . . . . . . . 4 20 15Customer bankruptcies . . . . . . . . . . . . . . . . . . . . . . . . . . . . . . . . . . . . . . . . . . (10) — —Environmental remediation costs . . . . . . . . . . . . . . . . . . . . . . . . . . . . . . . . . . (7) (11) —Costs for withdrawn tender offer . . . . . . . . . . . . . . . . . . . . . . . . . . . . . . . . . . — (16) —
OPERATING INCOME . . . . . . . . . . . . . . . . . . . . . . . . . . . . . . . . . . . . . . . . . . . . . . . 130 260 246Equity in earnings of affiliates . . . . . . . . . . . . . . . . . . . . . . . . . . . . . . . . . . . . . 28 19 8Gain on sale of marketable securities . . . . . . . . . . . . . . . . . . . . . . . . . . . . . . — 7 —Interest expense, net and other . . . . . . . . . . . . . . . . . . . . . . . . . . . . . . . . . . . (127) (107) (104)
INCOME BEFORE INCOME TAXES . . . . . . . . . . . . . . . . . . . . . . . . . . . . . . . . . . . . 31 179 150Benefit (provision) for income taxes . . . . . . . . . . . . . . . . . . . . . . . . . . . . . . . . 5 (44) (45)Minority interests . . . . . . . . . . . . . . . . . . . . . . . . . . . . . . . . . . . . . . . . . . . . . . . . (3) (8) (5)
INCOME FROM CONTINUING OPERATIONS . . . . . . . . . . . . . . . . . . . . . . . . . . . . 33 127 100INCOME (LOSS) FROM DISCONTINUED OPERATIONS, NET OF TAX . . . . . . . (21) (169) 37
INCOME (LOSS) BEFORE CUMULATIVE EFFECT OFACCOUNTING CHANGE . . . . . . . . . . . . . . . . . . . . . . . . . . . . . . . . . . . . . . . . . . 12 (42) 137Cumulative effect of accounting change, net of tax . . . . . . . . . . . . . . . . . . — — (4)
NET INCOME (LOSS) . . . . . . . . . . . . . . . . . . . . . . . . . . . . . . . . . . . . . . . . . . . . . . . $ 12 $ (42) $ 133
BASIC EARNINGS (LOSS) PER SHAREContinuing operations . . . . . . . . . . . . . . . . . . . . . . . . . . . . . . . . . . . . . . . . . . . . $ 0.48 $ 1.89 $ 1.50Discontinued operations . . . . . . . . . . . . . . . . . . . . . . . . . . . . . . . . . . . . . . . . . . (0.31) (2.51) 0.55Cumulative effect of accounting change . . . . . . . . . . . . . . . . . . . . . . . . . . . . — — (0.06)
Basic earnings (loss) per share . . . . . . . . . . . . . . . . . . . . . . . . . . . . . . . . . . . . . . $ 0.17 $ (0.62) $ 1.99
DILUTED EARNINGS (LOSS) PER SHAREContinuing operations . . . . . . . . . . . . . . . . . . . . . . . . . . . . . . . . . . . . . . . . . . . . $ 0.47 $ 1.85 $ 1.48Discontinued operations . . . . . . . . . . . . . . . . . . . . . . . . . . . . . . . . . . . . . . . . . . (0.30) (2.46) 0.54Cumulative effect of accounting change . . . . . . . . . . . . . . . . . . . . . . . . . . . . — — (0.06)
Diluted earnings (loss) per share . . . . . . . . . . . . . . . . . . . . . . . . . . . . . . . . . . $ 0.17 $ (0.61) $ 1.96
Basic average common shares outstanding . . . . . . . . . . . . . . . . . . . . . . . . . . . 68.5 67.4 66.9
Diluted average common shares outstanding . . . . . . . . . . . . . . . . . . . . . . . . . . 69.9 68.6 67.9
See Notes to Consolidated Financial Statements.
42

ARVINMERITOR, INC.
CONSOLIDATED BALANCE SHEET(In millions)
September 30,
2005 2004
ASSETSCURRENT ASSETS:
Cash and cash equivalents . . . . . . . . . . . . . . . . . . . . . . . . . . . . . . . . . . . . . . . . . . . . . . . . . . . . . . . . . $ 187 $ 132Receivables, net . . . . . . . . . . . . . . . . . . . . . . . . . . . . . . . . . . . . . . . . . . . . . . . . . . . . . . . . . . . . . . . . . . 1,655 1,478Inventories . . . . . . . . . . . . . . . . . . . . . . . . . . . . . . . . . . . . . . . . . . . . . . . . . . . . . . . . . . . . . . . . . . . . . . . 541 523Other current assets . . . . . . . . . . . . . . . . . . . . . . . . . . . . . . . . . . . . . . . . . . . . . . . . . . . . . . . . . . . . . . . 256 238Assets of discontinued operations . . . . . . . . . . . . . . . . . . . . . . . . . . . . . . . . . . . . . . . . . . . . . . . . . . . 531 615
TOTAL CURRENT ASSETS . . . . . . . . . . . . . . . . . . . . . . . . . . . . . . . . . . . . . . . . . . . . . . . . . . . . . . . 3,170 2,986
NET PROPERTY . . . . . . . . . . . . . . . . . . . . . . . . . . . . . . . . . . . . . . . . . . . . . . . . . . . . . . . . . . . . . . . . . . . . . . 1,013 1,032GOODWILL . . . . . . . . . . . . . . . . . . . . . . . . . . . . . . . . . . . . . . . . . . . . . . . . . . . . . . . . . . . . . . . . . . . . . . . . . 801 808OTHER ASSETS . . . . . . . . . . . . . . . . . . . . . . . . . . . . . . . . . . . . . . . . . . . . . . . . . . . . . . . . . . . . . . . . . . . . . 886 813
TOTAL ASSETS . . . . . . . . . . . . . . . . . . . . . . . . . . . . . . . . . . . . . . . . . . . . . . . . . . . . . . . . . . . . . . . . . $5,870 $5,639
LIABILITIES AND SHAREOWNERS’ EQUITYCURRENT LIABILITIES:
Short-term debt . . . . . . . . . . . . . . . . . . . . . . . . . . . . . . . . . . . . . . . . . . . . . . . . . . . . . . . . . . . . . . . . . . . $ 131 $ 3Accounts payable . . . . . . . . . . . . . . . . . . . . . . . . . . . . . . . . . . . . . . . . . . . . . . . . . . . . . . . . . . . . . . . . . 1,483 1,366Other current liabilities . . . . . . . . . . . . . . . . . . . . . . . . . . . . . . . . . . . . . . . . . . . . . . . . . . . . . . . . . . . . . 667 622Liabilities of discontinued operations . . . . . . . . . . . . . . . . . . . . . . . . . . . . . . . . . . . . . . . . . . . . . . . . . 242 282
TOTAL CURRENT LIABILITIES . . . . . . . . . . . . . . . . . . . . . . . . . . . . . . . . . . . . . . . . . . . . . . . . . . . . . 2,523 2,273
LONG-TERM DEBT . . . . . . . . . . . . . . . . . . . . . . . . . . . . . . . . . . . . . . . . . . . . . . . . . . . . . . . . . . . . . . . . . . . 1,451 1,487RETIREMENT BENEFITS . . . . . . . . . . . . . . . . . . . . . . . . . . . . . . . . . . . . . . . . . . . . . . . . . . . . . . . . . . . . . . 754 583OTHER LIABILITIES . . . . . . . . . . . . . . . . . . . . . . . . . . . . . . . . . . . . . . . . . . . . . . . . . . . . . . . . . . . . . . . . . . . 209 247MINORITY INTERESTS . . . . . . . . . . . . . . . . . . . . . . . . . . . . . . . . . . . . . . . . . . . . . . . . . . . . . . . . . . . . . . . . 58 61SHAREOWNERS’ EQUITY:
Common stock (2005, 71.0 shares issued and 70.3 outstanding; 2004,71.0 shares issued and 69.5 outstanding) . . . . . . . . . . . . . . . . . . . . . . . . . . . . . . . . . . . . . . . . . 71 71
Additional paid-in capital . . . . . . . . . . . . . . . . . . . . . . . . . . . . . . . . . . . . . . . . . . . . . . . . . . . . . . . . . . . 580 569Retained earnings . . . . . . . . . . . . . . . . . . . . . . . . . . . . . . . . . . . . . . . . . . . . . . . . . . . . . . . . . . . . . . . . . 579 595Treasury stock (2005, 0.7 shares; 2004, 1.5 shares) . . . . . . . . . . . . . . . . . . . . . . . . . . . . . . . . . . (10) (22)Unearned compensation . . . . . . . . . . . . . . . . . . . . . . . . . . . . . . . . . . . . . . . . . . . . . . . . . . . . . . . . . . . (13) (15)Accumulated other comprehensive loss . . . . . . . . . . . . . . . . . . . . . . . . . . . . . . . . . . . . . . . . . . . . . . (332) (210)
TOTAL SHAREOWNERS’ EQUITY . . . . . . . . . . . . . . . . . . . . . . . . . . . . . . . . . . . . . . . . . . . . . . . . . . 875 988
TOTAL LIABILITIES AND SHAREOWNERS’ EQUITY . . . . . . . . . . . . . . . . . . . . . . . . . . . . . . . . . . . $5,870 $5,639
See Notes to Consolidated Financial Statements.
43

ARVINMERITOR, INC.
CONSOLIDATED STATEMENT OF CASH FLOWS(In millions)
Year Ended September 30,
2005 2004 2003
OPERATING ACTIVITIESIncome from continuing operations . . . . . . . . . . . . . . . . . . . . . . . . . . . . . . . . . . . . . . . . . . . . . . . $ 33 $ 127 $ 100Adjustments to income from continuing operations to arrive at cash provided by (used for)
operating activities:Depreciation and amortization . . . . . . . . . . . . . . . . . . . . . . . . . . . . . . . . . . . . . . . . . . . . . . . . 182 183 185Gain on divestitures and marketable securities, net . . . . . . . . . . . . . . . . . . . . . . . . . . . . . . . . (4) (27) (15)Restructuring costs, net of payments . . . . . . . . . . . . . . . . . . . . . . . . . . . . . . . . . . . . . . . . . . . 75 (3) 6Deferred income tax . . . . . . . . . . . . . . . . . . . . . . . . . . . . . . . . . . . . . . . . . . . . . . . . . . . . . . . . (119) 19 (36)Equity in earnings of affiliates, net of dividends . . . . . . . . . . . . . . . . . . . . . . . . . . . . . . . . . . . (10) (4) 11Stock compensation expense . . . . . . . . . . . . . . . . . . . . . . . . . . . . . . . . . . . . . . . . . . . . . . . . . 24 16 16Provision for doubtful accounts . . . . . . . . . . . . . . . . . . . . . . . . . . . . . . . . . . . . . . . . . . . . . . . . 19 19 8Pension and retiree medical expense . . . . . . . . . . . . . . . . . . . . . . . . . . . . . . . . . . . . . . . . . . . 110 130 99
Pension and retiree medical contributions . . . . . . . . . . . . . . . . . . . . . . . . . . . . . . . . . . . . . . . . . . (164) (212) (163)Proceeds from terminations of interest rate swaps . . . . . . . . . . . . . . . . . . . . . . . . . . . . . . . . . . . 22 — —Changes in receivable securitization and factoring . . . . . . . . . . . . . . . . . . . . . . . . . . . . . . . . . . . (19) (187) 90Changes in assets and liabilities, excluding effects of acquisitions, divestitures, foreign
currency adjustments, and discontinued operations:Receivables . . . . . . . . . . . . . . . . . . . . . . . . . . . . . . . . . . . . . . . . . . . . . . . . . . . . . . . . . . . . . (196) (89) (30)Inventories . . . . . . . . . . . . . . . . . . . . . . . . . . . . . . . . . . . . . . . . . . . . . . . . . . . . . . . . . . . . . (21) (59) (12)Accounts payable . . . . . . . . . . . . . . . . . . . . . . . . . . . . . . . . . . . . . . . . . . . . . . . . . . . . . . . . 150 218 15Other current assets and liabilities . . . . . . . . . . . . . . . . . . . . . . . . . . . . . . . . . . . . . . . . . . . 15 41 (69)Other assets and liabilities . . . . . . . . . . . . . . . . . . . . . . . . . . . . . . . . . . . . . . . . . . . . . . . . . 2 3 27
Operating cash flows provided by continuing operations . . . . . . . . . . . . . . . . . . . . . . . . . . . . . . 99 175 232Operating cash flows provided by (used for) discontinued operations . . . . . . . . . . . . . . . . . . . . . (131) 44 42
CASH PROVIDED BY (USED FOR) OPERATING ACTIVITIES . . . . . . . . . . . . . . . . . . . . . . . . . . . . . (32) 219 274
INVESTING ACTIVITIESCapital expenditures . . . . . . . . . . . . . . . . . . . . . . . . . . . . . . . . . . . . . . . . . . . . . . . . . . . . . . . . (146) (152) (173)Acquisitions of businesses and investments, net of cash acquired . . . . . . . . . . . . . . . . . . . . (31) (3) (107)Proceeds from disposition of property and businesses . . . . . . . . . . . . . . . . . . . . . . . . . . . . . . 49 85 104Proceeds from sale of marketable securities . . . . . . . . . . . . . . . . . . . . . . . . . . . . . . . . . . . . . — 18 —Net investing cash flows provided by (used for) discontinued operations . . . . . . . . . . . . . . . . 153 (68) (15)
CASH PROVIDED BY (USED FOR) INVESTING ACTIVITIES . . . . . . . . . . . . . . . . . . . . . . . . . . . . . . 25 (120) (191)
FINANCING ACTIVITIESNet increase (decrease) in revolving credit facilities . . . . . . . . . . . . . . . . . . . . . . . . . . . . . . . . — (53) 26Borrowings on accounts receivable securitization program . . . . . . . . . . . . . . . . . . . . . . . . . . 112 — —Purchase of notes . . . . . . . . . . . . . . . . . . . . . . . . . . . . . . . . . . . . . . . . . . . . . . . . . . . . . . . . . . (21) — —Payments on lines of credit and other . . . . . . . . . . . . . . . . . . . . . . . . . . . . . . . . . . . . . . . . . . . (5) (2) (55)
Net change in debt . . . . . . . . . . . . . . . . . . . . . . . . . . . . . . . . . . . . . . . . . . . . . . . . . . . . . . . 86 (55) (29)Payment of issuance costs associated with debt exchange . . . . . . . . . . . . . . . . . . . . . . . . . . (10) — —Cash dividends . . . . . . . . . . . . . . . . . . . . . . . . . . . . . . . . . . . . . . . . . . . . . . . . . . . . . . . . . . . . (28) (28) (27)Proceeds from exercise of stock options . . . . . . . . . . . . . . . . . . . . . . . . . . . . . . . . . . . . . . . . 6 6 —
CASH PROVIDED BY (USED FOR) FINANCING ACTIVITIES . . . . . . . . . . . . . . . . . . . . . . . . . . . . . . 54 (77) (56)
EFFECT OF CHANGES IN FOREIGN CURRENCY EXCHANGE RATES ON CASH . . . . . . . . . . . . . . 8 7 20
CHANGE IN CASH AND CASH EQUIVALENTS . . . . . . . . . . . . . . . . . . . . . . . . . . . . . . . . . . . . . . . 55 29 47CASH AND CASH EQUIVALENTS AT BEGINNING OF YEAR . . . . . . . . . . . . . . . . . . . . . . . . . . . . . 132 103 56
CASH AND CASH EQUIVALENTS AT END OF YEAR . . . . . . . . . . . . . . . . . . . . . . . . . . . . . . . . . . . $ 187 $ 132 $ 103
See Notes to Consolidated Financial Statements.
44

ARVINMERITOR, INC.
CONSOLIDATED STATEMENT OF SHAREOWNERS’ EQUITY(In millions, except per share amounts)
Year Ended September 30,
2005 2004 2003
COMMON STOCK . . . . . . . . . . . . . . . . . . . . . . . . . . . . . . . . . . . . . . . . . . . . . . . . . . . . . . . . . . . $ 71 $ 71 $ 71ADDITIONAL PAID-IN CAPITAL
Beginning balance . . . . . . . . . . . . . . . . . . . . . . . . . . . . . . . . . . . . . . . . . . . . . . . . . . . . . . . . 569 561 554Stock option expense . . . . . . . . . . . . . . . . . . . . . . . . . . . . . . . . . . . . . . . . . . . . . . . . . . . . . 5 7 7Exercise of stock options . . . . . . . . . . . . . . . . . . . . . . . . . . . . . . . . . . . . . . . . . . . . . . . . . . 1 — —Issuance of restricted stock and other . . . . . . . . . . . . . . . . . . . . . . . . . . . . . . . . . . . . . . . 5 1 —
Ending balance . . . . . . . . . . . . . . . . . . . . . . . . . . . . . . . . . . . . . . . . . . . . . . . . . . . . . . . . . . 580 569 561
RETAINED EARNINGSBeginning balance . . . . . . . . . . . . . . . . . . . . . . . . . . . . . . . . . . . . . . . . . . . . . . . . . . . . . . . . 595 665 559Net income (loss) . . . . . . . . . . . . . . . . . . . . . . . . . . . . . . . . . . . . . . . . . . . . . . . . . . . . . . . . . 12 (42) 133Cash dividends (per share $0.40: 2005, 2004 and 2003) . . . . . . . . . . . . . . . . . . . . . (28) (28) (27)
Ending balance . . . . . . . . . . . . . . . . . . . . . . . . . . . . . . . . . . . . . . . . . . . . . . . . . . . . . . . . . . 579 595 665
TREASURY STOCKBeginning balance . . . . . . . . . . . . . . . . . . . . . . . . . . . . . . . . . . . . . . . . . . . . . . . . . . . . . . . . (22) (37) (46)Exercise of stock options . . . . . . . . . . . . . . . . . . . . . . . . . . . . . . . . . . . . . . . . . . . . . . . . . . 5 6 —Issuance of restricted stock . . . . . . . . . . . . . . . . . . . . . . . . . . . . . . . . . . . . . . . . . . . . . . . . 5 11 9Other . . . . . . . . . . . . . . . . . . . . . . . . . . . . . . . . . . . . . . . . . . . . . . . . . . . . . . . . . . . . . . . . . . . 2 (2) —
Ending balance . . . . . . . . . . . . . . . . . . . . . . . . . . . . . . . . . . . . . . . . . . . . . . . . . . . . . . . . . . (10) (22) (37)
UNEARNED COMPENSATIONBeginning balance . . . . . . . . . . . . . . . . . . . . . . . . . . . . . . . . . . . . . . . . . . . . . . . . . . . . . . . . (15) (12) (12)Issuance of restricted stock . . . . . . . . . . . . . . . . . . . . . . . . . . . . . . . . . . . . . . . . . . . . . . . . (7) (16) (9)Compensation expense . . . . . . . . . . . . . . . . . . . . . . . . . . . . . . . . . . . . . . . . . . . . . . . . . . . 10 11 9Other . . . . . . . . . . . . . . . . . . . . . . . . . . . . . . . . . . . . . . . . . . . . . . . . . . . . . . . . . . . . . . . . . . . (1) 2 —
Ending balance . . . . . . . . . . . . . . . . . . . . . . . . . . . . . . . . . . . . . . . . . . . . . . . . . . . . . . . . . . (13) (15) (12)
ACCUMULATED OTHER COMPREHENSIVE LOSSBeginning balance . . . . . . . . . . . . . . . . . . . . . . . . . . . . . . . . . . . . . . . . . . . . . . . . . . . . . . . . (210) (323) (356)Foreign currency translation adjustments . . . . . . . . . . . . . . . . . . . . . . . . . . . . . . . . . . . . 22 112 212Minimum pension liability, net of tax . . . . . . . . . . . . . . . . . . . . . . . . . . . . . . . . . . . . . . . . (143) 1 (182)Unrealized gains, net of tax . . . . . . . . . . . . . . . . . . . . . . . . . . . . . . . . . . . . . . . . . . . . . . . . (1) — 3
Ending balance . . . . . . . . . . . . . . . . . . . . . . . . . . . . . . . . . . . . . . . . . . . . . . . . . . . . . . . . . . (332) (210) (323)
TOTAL SHAREOWNERS’ EQUITY . . . . . . . . . . . . . . . . . . . . . . . . . . . . . . . . . . . . . . . . . $ 875 $ 988 $ 925
COMPREHENSIVE INCOMENet income (loss) . . . . . . . . . . . . . . . . . . . . . . . . . . . . . . . . . . . . . . . . . . . . . . . . . . . . . . . . . 12 (42) 133Foreign currency translation adjustments . . . . . . . . . . . . . . . . . . . . . . . . . . . . . . . . . . . . 22 112 212Minimum pension liability, net of tax . . . . . . . . . . . . . . . . . . . . . . . . . . . . . . . . . . . . . . . . (143) 1 (182)Unrealized gains, net of tax . . . . . . . . . . . . . . . . . . . . . . . . . . . . . . . . . . . . . . . . . . . . . . . . (1) — 3
TOTAL COMPREHENSIVE INCOME (LOSS) . . . . . . . . . . . . . . . . . . . . . . . . . . . . . . . . . $(110) $ 71 $ 166
See Notes to Consolidated Financial Statements.
45

1. BASIS OF PRESENTATION
ArvinMeritor, Inc. (the company or ArvinMeritor) is a global supplier of a broad range of integrated systems, modulesand components serving light vehicle, commercial truck, trailer and specialty original equipment manufacturers (OEM) andcertain aftermarkets.
The company’s Light Vehicle Aftermarket (LVA) business is classified as held for sale and presented as discontinued operationsin the financial statements and related notes (see Note 3). The company sold its coil coating business in the first quarter of fiscal year2005. The coil coating business is classified as held for sale and presented in discontinued operations for periods prior to the sale.
The company’s fiscal quarters end on the Sundays nearest December 31, March 31, and June 30 and its fiscal year ends onthe Sunday nearest September 30. The 2005, 2004 and 2003 fiscal years ended on October 2, 2005, October 3, 2004 andSeptember 28, 2003, respectively. All year and quarter references relate to the company’s fiscal year and fiscal quarters unlessotherwise stated. Fiscal years 2005 and 2003 include 52 weeks compared to 53 weeks in fiscal year 2004.
2. SIGNIFICANT ACCOUNTING POLICIES
Use of Estimates
The preparation of financial statements in accordance with accounting principles generally accepted in the United States ofAmerica (U.S.) (GAAP) requires the use of estimates and assumptions related to the reporting of assets, liabilities, revenues, expensesand related disclosures. Actual results could differ from these estimates. Significant estimates and assumptions were used to valuegoodwill and other long-lived assets (see Note 3 and 4), product warranty liabilities (see Note 13), retiree medical and pensionobligations (see Notes 19 and 20), income taxes (see Note 21), and contingencies including asbestos and environmental matters(see Note 22).
Consolidation and Joint Ventures
The consolidated financial statements include the accounts of the company and those majority-owned subsidiaries in which thecompany has control. All significant intercompany balances and transactions are eliminated in consolidation. The balance sheet andresults of operations of controlled subsidiaries where ownership is greater than 50 percent, but less than 100 percent, are includedin the consolidated financial statements and are offset by a related minority interest expense and liability recorded for the minorityinterest ownership. Investments in affiliates that are not controlled or majority-owned are reported using the equity method ofaccounting (see Note 12). The company’s consolidated financial statements also include those variable interest entities in which thecompany holds a variable interest and is the primary beneficiary.
Foreign Currency
Local currencies are generally considered the functional currencies for operations outside the U.S. For operations reporting in localcurrencies, assets and liabilities are translated at year-end exchange rates with cumulative currency translation adjustments includedas a component of Accumulated Other Comprehensive Loss in the consolidated balance sheet. Income and expense items are translatedat average rates of exchange during the year.
Impairment of Long-Lived Assets
Long-lived assets, excluding goodwill, to be held and used are reviewed for impairment whenever adverse events or changesin circumstances indicate a possible impairment. An impairment loss is recognized when a long-lived asset’s carrying value exceedsthe fair value. If business conditions or other factors cause the profitability and cash flows to decline, the company may be requiredto record impairment charges at that time. During fiscal year 2005, the company recorded $31 million of asset impairment chargesassociated with various restructuring actions (see Note 4). Long-lived assets held for sale are recorded at the lower of their carryingamount or fair value less cost to sell. In the fourth quarter of fiscal year 2005, the company recognized a non-cash impairment chargeof $43 million ($0.40 per diluted share) to record certain LVA businesses at fair value, less cost to sell (see Note 3).
ARVINMERITOR, INC.
NOTES TO CONSOLIDATED FINANCIAL STATEMENTS
46

Discontinued Operations
A business component that either has been disposed of or is classified as held for sale is reported as discontinued operationsif the cash flows of the component have been or will be eliminated from the ongoing operations of the company and the companywill no longer have any significant continuing involvement in the business component. The results of operations of discontinuedoperations are aggregated and presented separately in the consolidated statement of operations and consolidated statement of cashflows. Assets and liabilities of the discontinued operations are aggregated and reported separately as assets and liabilities ofdiscontinued operations in the consolidated balance sheet (see Note 3).
Goodwill
Goodwill is reviewed for impairment annually or more frequently if certain indicators arise, by using discounted cash flows andmarket multiples on earnings to determine the fair value of each reporting unit. An impairment loss may be recognized if the reviewindicates that the carrying value of a reporting unit exceeds its fair value. If business conditions or other factors cause the profitabilityand cash flows of the reporting unit to decline, the company may be required to record impairment charges for goodwill at that time.In the fourth quarter of fiscal 2004, the company recognized a non-cash impairment loss of $190 million ($2.77 per diluted share)on goodwill of the LVA reporting unit (see Note 3).
Revenue Recognition
Revenues are recognized upon shipment of product and transfer of ownership to the customer. Provisions for customer salesallowances and incentives are recorded as a reduction of sales at the time of product shipment. The company recognizs “pass-through” sales for certain of its OEM customers. These pass-through sales occur when, at the direction of the OEM customers, thecompany purchases components from suppliers, use them in the company’s manufacturing process, and sells them as part of acompleted system.
Allowance for Doubtful Accounts
An allowance for uncollectible trade receivables is recorded based on consideration of write-off history, aging analysis, and anyspecific, known troubled accounts.
Earnings per Share
Basic earnings per share is calculated using the weighted average number of shares outstanding during each year. The dilutedearnings per share calculation includes the impact of dilutive common stock options, restricted stock and performance share awards.
A reconciliation of basic average common shares outstanding to diluted average common shares outstanding is as follows(in millions): September 30,
2005 2004 2003
Basic average common shares outstanding . . . . . . . . . . . . . . . . . . . . . . 68.5 67.4 66.9Impact of restricted stock . . . . . . . . . . . . . . . . . . . . . . . . . . . . . . . . . . . . . . 1.1 0.9 0.9Impact of stock options . . . . . . . . . . . . . . . . . . . . . . . . . . . . . . . . . . . . . . . . 0.3 0.3 0.1
Diluted average common shares outstanding . . . . . . . . . . . . . . . . . . . . . 69.9 68.6 67.9
At September 30, 2005, 2004 and 2003, options to purchase 3.8 million, 1.7 million and 3.7 million shares of common stock,respectively, were not included in the computation of diluted earnings per share because their inclusion would be anti-dilutive.
ARVINMERITOR, INC.
NOTES TO CONSOLIDATED FINANCIAL STATEMENTS — (Continued)
47

Other
Other significant accounting policies are included in the related notes, specifically, inventories (Note 8), customer reimbursabletooling and engineering (Note 9), property and depreciation (Note 10), capitalized software (Note 11), product warranties (Note 13),financial instruments (Note 16), stock based compensation (Notes 17 and 18), retirement medical plans (Note 19), retirement pensionplans (Note 20), income taxes (Note 21) and environmental and asbestos-related liabilities (Note 22).
New Accounting Standards
In December 2004, the Financial Accounting Standards Board (FASB) issued Statement of Financial Accounting Standards(SFAS) No. 123(R), “Share-Based Payment,” which requires compensation costs related to share-based payment transactions to berecognized in the financial statements. This statement also establishes fair value for share-based payment transactions withemployees. The company began expensing the fair value of stock options in fiscal year 2003. In addition, the company has expensedstock compensation granted to retirement eligible employees ratably over the respective vesting period. Upon adoption of SFAS No.123(R), the company will recognize compensation expense associated with grants to retirement eligible employees in the periodgranted. This statement is effective for the company in the first quarter of fiscal year 2006 and is not expected to have a material effecton its financial condition or results of operations.
In December 2004, the FASB issued Staff Position (FSP) FAS 109-1, “Application of FASB Statement No. 109, Accounting forIncome Taxes, to the Tax Deduction on Qualified Production Activities Provided by the American Jobs Creation Act of 2004.” TheAmerican Jobs Creation Act of 2004 (the 2004 Act) provides tax relief to U.S. domestic manufacturers under certain circumstances. TheFSP states that the manufacturers’ deduction under the 2004 Act should be accounted for as a special deduction in accordance withSFAS No. 109 and not as a tax rate deduction. The adoption of FSP FAS 109-1 did not have an impact on the company’s results ofoperations or financial position.
In December 2004, the FASB issued FSP FAS 109-2, “Accounting and Disclosure Guidance for the Foreign RepatriationProvision within the American Jobs Creation Act of 2004.” The 2004 Act introduced a special limited-time dividends receiveddeduction on the repatriation of certain foreign earnings to a U.S. taxpayer. The FSP addresses whether a company should be allowedadditional time beyond the financial reporting period in which the 2004 Act was enacted, to evaluate the effects of the 2004 Act onthe company’s plan for reinvestment or repatriation of foreign earnings for purposes of applying SFAS No. 109. The company is stillevaluating the repatriation provisions of the 2004 Act for purposes of applying SFAS No. 109. This evaluation is expected to becompleted in fiscal year 2006. The range of income tax effects of such repatriation cannot be reasonably estimated at this time.
In November 2004, the FASB issued SFAS No. 151, “Inventory Costs.” This statement clarifies the accounting for abnormalamounts of idle facility expense, freight, handling costs and wasted material (spoilage), and requires that these items be recognizedas current-period charges. In addition, SFAS No. 151 requires that the allocation of fixed production overhead to inventory be basedon the normal capacity of the company’s manufacturing facilities. SFAS No. 151 is effective for the company in the first quarter offiscal year 2006. The company is evaluating the impact of adopting this standard.
Accounting Changes
Prior to the fourth quarter of fiscal 2004, certain inventories in the U.S. were valued using the last-in, first-out (LIFO) method.During the fourth quarter of fiscal 2004, the company changed its method of costing these inventories to the first-in, first-out (FIFO)method from LIFO. As a result, all U.S. inventories are now stated at the lower of cost, determined on a FIFO basis, or market. Thecompany believes this change is preferable as it results in inventories being valued in a manner that more closely approximates currentcosts and better matches revenues with costs of goods sold. In accordance with accounting principles generally accepted in the U.S.,all prior periods were restated to give retroactive effect to this change. The effect of this change decreased net income in fiscal year2003 by $3 million ($0.04 per diluted share).
Effective July 1, 2003 the company adopted FASB Interpretation No. (FIN) 46. The company determined that an entity relatedto one of its lease agreements is a variable interest entity in which the company had a variable interest. The variable interest entity’spurpose is to hold certain manufacturing and administrative assets and lease such assets to the company. As the primary beneficiary,the company consolidated the variable interest entity. Management concluded that the company held a variable interest in the form
ARVINMERITOR, INC.
NOTES TO CONSOLIDATED FINANCIAL STATEMENTS — (Continued)
48
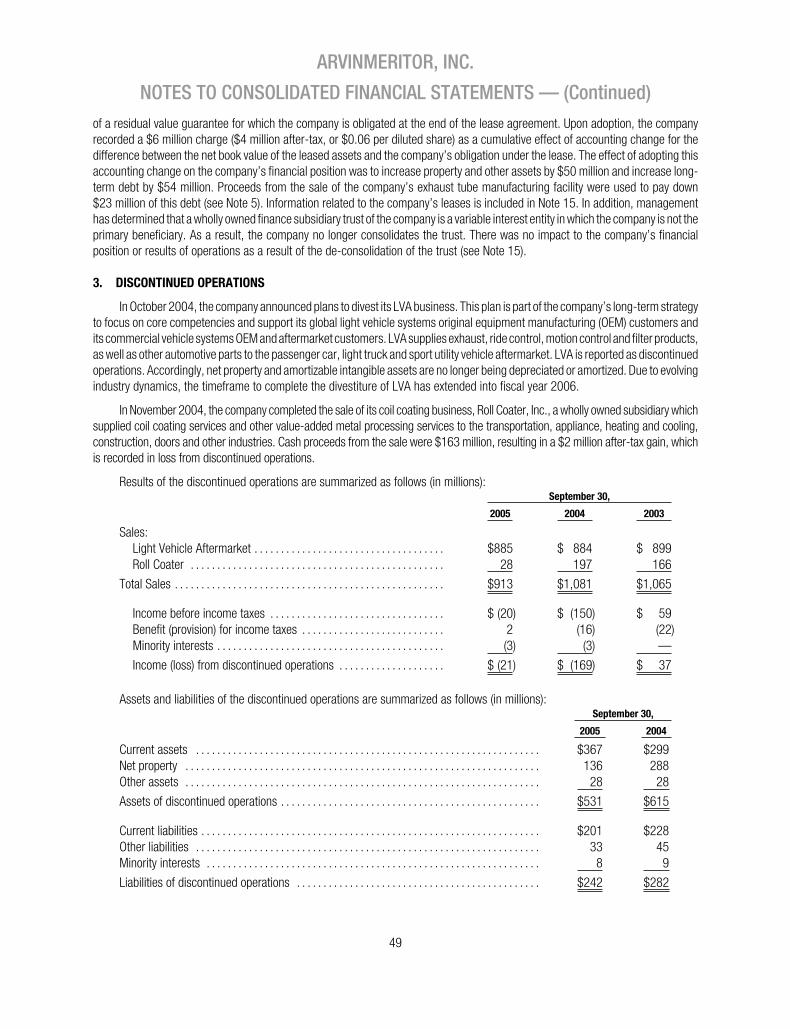
of a residual value guarantee for which the company is obligated at the end of the lease agreement. Upon adoption, the companyrecorded a $6 million charge ($4 million after-tax, or $0.06 per diluted share) as a cumulative effect of accounting change for thedifference between the net book value of the leased assets and the company’s obligation under the lease. The effect of adopting thisaccounting change on the company’s financial position was to increase property and other assets by $50 million and increase long-term debt by $54 million. Proceeds from the sale of the company’s exhaust tube manufacturing facility were used to pay down$23 million of this debt (see Note 5). Information related to the company’s leases is included in Note 15. In addition, managementhas determined that a wholly owned finance subsidiary trust of the company is a variable interest entity in which the company is not theprimary beneficiary. As a result, the company no longer consolidates the trust. There was no impact to the company’s financialposition or results of operations as a result of the de-consolidation of the trust (see Note 15).
3. DISCONTINUED OPERATIONS
In October 2004, the company announced plans to divest its LVA business. This plan is part of the company’s long-term strategyto focus on core competencies and support its global light vehicle systems original equipment manufacturing (OEM) customers andits commercial vehicle systems OEM and aftermarket customers. LVA supplies exhaust, ride control, motion control and filter products,as well as other automotive parts to the passenger car, light truck and sport utility vehicle aftermarket. LVA is reported as discontinuedoperations. Accordingly, net property and amortizable intangible assets are no longer being depreciated or amortized. Due to evolvingindustry dynamics, the timeframe to complete the divestiture of LVA has extended into fiscal year 2006.
In November 2004, the company completed the sale of its coil coating business, Roll Coater, Inc., a wholly owned subsidiary whichsupplied coil coating services and other value-added metal processing services to the transportation, appliance, heating and cooling,construction, doors and other industries. Cash proceeds from the sale were $163 million, resulting in a $2 million after-tax gain, whichis recorded in loss from discontinued operations.
Results of the discontinued operations are summarized as follows (in millions):September 30,
2005 2004 2003
Sales:Light Vehicle Aftermarket . . . . . . . . . . . . . . . . . . . . . . . . . . . . . . . . . . . . $885 $ 884 $ 899Roll Coater . . . . . . . . . . . . . . . . . . . . . . . . . . . . . . . . . . . . . . . . . . . . . . . . 28 197 166
Total Sales . . . . . . . . . . . . . . . . . . . . . . . . . . . . . . . . . . . . . . . . . . . . . . . . . . . $913 $1,081 $1,065
Income before income taxes . . . . . . . . . . . . . . . . . . . . . . . . . . . . . . . . . $ (20) $ (150) $ 59Benefit (provision) for income taxes . . . . . . . . . . . . . . . . . . . . . . . . . . . 2 (16) (22)Minority interests . . . . . . . . . . . . . . . . . . . . . . . . . . . . . . . . . . . . . . . . . . . (3) (3) —
Income (loss) from discontinued operations . . . . . . . . . . . . . . . . . . . . $ (21) $ (169) $ 37
Assets and liabilities of the discontinued operations are summarized as follows (in millions):September 30,
2005 2004
Current assets . . . . . . . . . . . . . . . . . . . . . . . . . . . . . . . . . . . . . . . . . . . . . . . . . . . . . . . . . . . . . . . . . $367 $299Net property . . . . . . . . . . . . . . . . . . . . . . . . . . . . . . . . . . . . . . . . . . . . . . . . . . . . . . . . . . . . . . . . . . . 136 288Other assets . . . . . . . . . . . . . . . . . . . . . . . . . . . . . . . . . . . . . . . . . . . . . . . . . . . . . . . . . . . . . . . . . . . 28 28
Assets of discontinued operations . . . . . . . . . . . . . . . . . . . . . . . . . . . . . . . . . . . . . . . . . . . . . . . . . $531 $615
Current liabilities . . . . . . . . . . . . . . . . . . . . . . . . . . . . . . . . . . . . . . . . . . . . . . . . . . . . . . . . . . . . . . . . $201 $228Other liabilities . . . . . . . . . . . . . . . . . . . . . . . . . . . . . . . . . . . . . . . . . . . . . . . . . . . . . . . . . . . . . . . . . 33 45Minority interests . . . . . . . . . . . . . . . . . . . . . . . . . . . . . . . . . . . . . . . . . . . . . . . . . . . . . . . . . . . . . . . 8 9
Liabilities of discontinued operations . . . . . . . . . . . . . . . . . . . . . . . . . . . . . . . . . . . . . . . . . . . . . . $242 $282
ARVINMERITOR, INC.
NOTES TO CONSOLIDATED FINANCIAL STATEMENTS — (Continued)
49

In the fourth quarter of fiscal year 2005, management concluded that it is more likely that LVA’s North American businesseswill be sold individually rather than as a whole. Although management believes that this strategy will not have a material impact onthe aggregate value expected to be realized from the divestiture of LVA, it did require the company, for accounting purposes, to evaluatefair value on an individual business basis rather than LVA North America as a whole. This resulted in a non-cash impairment chargeof $43 million ($28 million after-tax, or $0.40 per diluted share) to record certain LVA North American businesses at fair value. Thecompany’s previous strategy was to sell the North American LVA business as a whole. Accordingly, the company’s previous analysisof impairment was on the total North American business. This analysis indicated that the aggregate fair value of the North LVAAmerican business, when taken as a whole, exceeded its carrying value.
In fiscal year 2005, LVA entered into a five-year exclusive supply agreement with a significant customer to supply certain exhaustand ride control products. As part of the supply agreement, LVA incurred certain costs to changeover the customer to LVA products.LVA recognizes these costs, known as changeover costs, as selling expenses in the period the changeover occurs. LVA recognizedapproximately $6 million of after-tax changeover costs as expense in fiscal year 2005.
The company’s fiscal 2004 annual goodwill impairment review indicated the carrying value of the LVA reporting unit exceededits fair value. Increased competition, difficult market conditions, particularly in the exhaust market, and higher raw material costsresulted in a decline in fair value in fiscal 2004. As a result, in the fourth quarter of fiscal 2004, the company recognized a goodwillimpairment charge of $190 million ($190 million after-tax or $2.77 per diluted share) in its LVA reporting unit. The fair value of LVAwas estimated using earnings multiples based on precedent transactions of comparable companies and the expected present valueof future cash flows.
In order to reduce costs and improve profitability resulting from weakening demand in the aftermarket business, LVArecorded restructuring costs totaling $2 million, $3 million and $2 million during fiscal years 2005, 2004 and 2003, respectively.These restructuring costs are included in the results of discontinued operations for each respective period. At September 30, 2005and 2004, there were $2 million of restructuring reserves related to unpaid employee termination benefits included in liabilities ofdiscontinued operations.
4. RESTRUCTURING COSTS
The company recorded restructuring charges of $117 million, $15 million and $20 million during the fiscal years endedSeptember 30, 2005, 2004 and 2003, respectively. At September 30, 2005 and 2004, there was $56 million and $10 million,respectively, of restructuring reserves related to unpaid employee termination benefits in the consolidated balance sheet.
Fiscal year 2005 actions: During fiscal year 2005, the company announced the elimination of approximately 400 to 500 salariedpositions and approved plans to consolidate, downsize, close or sell certain underperforming businesses or facilities. These actions areintended to align capacity with industry conditions, utilize assets more efficiently, and improve operations. In addition to the eliminationof 400 to 500 salaried employees across the entire company, these actions will result in the reduction of an additional 300 salaried and1,550 hourly employees at 11 global facilities that have been or will be closed, primarily in the Light Vehicle Systems (LVS) businesssegment. The total estimated cost of these actions is approximately $135 million, of which approximately $110 million will be cash costs.Estimated costs include employee severance and other exit costs, as well as asset impairments. The company recorded restructuringcosts of $101 million related to these actions during fiscal year 2005. These costs included $71 million of employee termination benefits,$26 million of asset impairment charges and $4 million of other closure costs. Asset impairment charges relate to manufacturing facilitiesthat will be closed or sold and machinery and equipment that have become idle and obsolete as a result of the facility closures. Thecompany expects to complete the majority of these restructuring actions and record the remaining costs by December 2006. AtSeptember 30, 2005, approximately 200 salaried and 650 hourly employees have yet to be notified and terminated.
During the first quarter of fiscal year 2005, Meritor Suspensions Systems Company (MSSC), a 57-percent owned consolidatedjoint venture of the company, announced the decision to close its Sheffield, England, stabilizer bar facility. The LVS business segmenthas recorded restructuring and other exit costs of approximately $9 million related to this action during fiscal year 2005. This includedemployee termination and other exit costs of approximately $4 million and asset impairment charges of $5 million. The employeetermination costs related to a reduction of approximately 10 salaried and 125 hourly employees.
ARVINMERITOR, INC.
NOTES TO CONSOLIDATED FINANCIAL STATEMENTS — (Continued)
50

The LVS business segment also recorded during fiscal year 2005 restructuring costs for previously approved employeeterminations and other expenses of $7 million. These costs related to a reduction in workforce in the company’s operations in Spainand the consolidation of two facilities in Brazil. These actions resulted in the reduction of 10 salaried and 230 hourly employees.
Also in fiscal year 2005, the company recorded restructuring costs of $4 million that were incurred as a result of the integrationof the two consolidated joint ventures with AB Volvo into the Commercial Vehicle Systems (CVS) business. These costs relate toseverance and other termination benefits, associated with approximately 20 employees, and other restructuring costs of the jointventures. The formation of the joint ventures were accounted for using the purchase method of accounting and these restructuringcosts were reflected in the purchase price allocation (see Note 5).
Fiscal year 2004 actions: The company recorded restructuring costs of $10 million during fiscal year 2004 related to workforcereductions and facility consolidations in its LVS business segment. These actions follow the management realignment of thecompany’s LVS business and were also intended to address the competitive challenges in the automotive supplier industry. Thesecosts included severance and other employee termination costs related to a reduction of approximately 50 salaried and 575 hourlyemployees. In addition, the company recorded $1 million of restructuring costs relating to the integration of Zeuna Starker GmbH &Co. KG (Zeuna Starker) in fiscal year 2004 as part of the final purchase price allocation (see Note 5).
During fiscal year 2004, the company also recorded restructuring charges totaling $5 million associated with certainadministrative and managerial employee termination costs.
Fiscal year 2003 actions: In fiscal year 2003, the company approved workforce reductions and facility consolidations in its LVSbusiness segment. These measures followed the management realignment of the company’s LVS business and were also intendedto address the competitive challenges in the automotive supplier industry. LVS recorded restructuring costs related to these programsof $19 million. These costs included severance and other employee termination costs related to a reduction of approximately 250salaried and 400 hourly employees and asset impairment charges of $8 million.
Also in fiscal year 2003, the company recorded restructuring costs of $5 million that were incurred as a result of the integrationof Zeuna Starker into the LVS business. These costs relate to severance and other termination benefits associated with approximately300 employees of Zeuna Starker. The acquisition was accounted for using the purchase method of accounting and these restructuringcosts were reflected in the purchase price allocation.
During fiscal year 2003, the company also recorded additional restructuring costs totaling $1 million associated with certaincorporate administrative and managerial employee termination costs.
ARVINMERITOR, INC.
NOTES TO CONSOLIDATED FINANCIAL STATEMENTS — (Continued)
51

A summary of the changes in the restructuring reserves is as follows (in millions):
EmployeeTermination
BenefitsAsset
ImpairmentPlant Shutdown
& Other Total
Balance at September 30, 2002 . . . . . . . . . . . . . . . . . . . . . . . . . . . . . . . $ 9 $ — $— $ 9Activity during the period:
Charges to expense . . . . . . . . . . . . . . . . . . . . . . . . . . . . . . . . . . . . . . . 12 8 — 20Purchase accounting . . . . . . . . . . . . . . . . . . . . . . . . . . . . . . . . . . . . . . 5 — — 5Asset write-offs . . . . . . . . . . . . . . . . . . . . . . . . . . . . . . . . . . . . . . . . . . . — (8) — (8)Cash payments . . . . . . . . . . . . . . . . . . . . . . . . . . . . . . . . . . . . . . . . . . . (14) — — (14)
Balance at September 30, 2003 . . . . . . . . . . . . . . . . . . . . . . . . . . . . . . . 12 — — 12Activity during the period:
Charges to expense . . . . . . . . . . . . . . . . . . . . . . . . . . . . . . . . . . . . . . . 15 — — 15Purchase accounting . . . . . . . . . . . . . . . . . . . . . . . . . . . . . . . . . . . . . . 1 — — 1Cash payments and other . . . . . . . . . . . . . . . . . . . . . . . . . . . . . . . . . . (18) — — (18)
Balance at September 30, 2004 . . . . . . . . . . . . . . . . . . . . . . . . . . . . . . . 10 — — 10Activity during the period:
Charges to expense . . . . . . . . . . . . . . . . . . . . . . . . . . . . . . . . . . . . . . . 80 31 6 117Purchase accounting . . . . . . . . . . . . . . . . . . . . . . . . . . . . . . . . . . . . . . 4 — — 4Asset write-offs . . . . . . . . . . . . . . . . . . . . . . . . . . . . . . . . . . . . . . . . . . . — (31) — (31)Cash payments and other . . . . . . . . . . . . . . . . . . . . . . . . . . . . . . . . . . (38) — (6) (44)
Balance at September 30, 2005 . . . . . . . . . . . . . . . . . . . . . . . . . . . . . . . $ 56 $ — $— $ 56
5. ACQUISITIONS AND DIVESTITURES
On October 4, 2004, the company formed two joint ventures in France with AB Volvo to manufacture and distribute axles. Thecompany acquired its 51-percent interest for a purchase price of e19.3 million ($25 million). Accordingly, beginning in the first quarterof fiscal year 2005, the results of operations and financial position of these joint ventures are consolidated by the company. Thecompany has an option to purchase the remaining 49-percent interest in one of the joint ventures beginning in the first quarter of fiscalyear 2008 for e15.7 million ($19 million) plus interest at EURIBOR rates, plus a margin. This option to purchase the minority interestis essentially a financing arrangement as the minority shareholder does not participate in any profits or losses of the joint venture.Therefore, this is recorded as a long-term obligation of the company which is included in other liabilities (see Note 14). Accordingly,no minority interest is recognized for the 49-percent interest in this joint venture. The company recorded $4 million of goodwillassociated with the purchase price allocation. In September 2005, as part of the purchase agreement, the company purchasedapproximately $5 million of additional machinery and equipment from AB Volvo.
In December 2004, the company completed the divestiture of its LVS Columbus, Indiana automotive stamping and componentsmanufacturing business and recognized a pre-tax gain on the sale of $4 million. This divestiture is part of the company’s plan torationalize its operations and focus on its core automotive businesses. This manufacturing operation had sales of $83 million in fiscalyear 2004.
As part of the company’s continuing strategy to divest non-core businesses, in the third quarter of fiscal 2004, the companycompleted the sale of its CVS trailer beam fabrication facility in Kenton, OH. The divestiture of this facility is in line with the company’sstrategy to be less vertically integrated and more focused on its core processes for the design and assembly of complete systems.This divestiture did not have a material impact on sales or net income. Net proceeds from this divestiture were approximately$14 million.
In the second quarter of fiscal year 2004, the company completed the sale of its 75-percent shareholdings in AP Amortiguadores,S.A. (APA), a LVS joint venture that manufactured ride control products. Net proceeds from the sale were $48 million, resulting in apre-tax gain of $20 million.
ARVINMERITOR, INC.
NOTES TO CONSOLIDATED FINANCIAL STATEMENTS — (Continued)
52
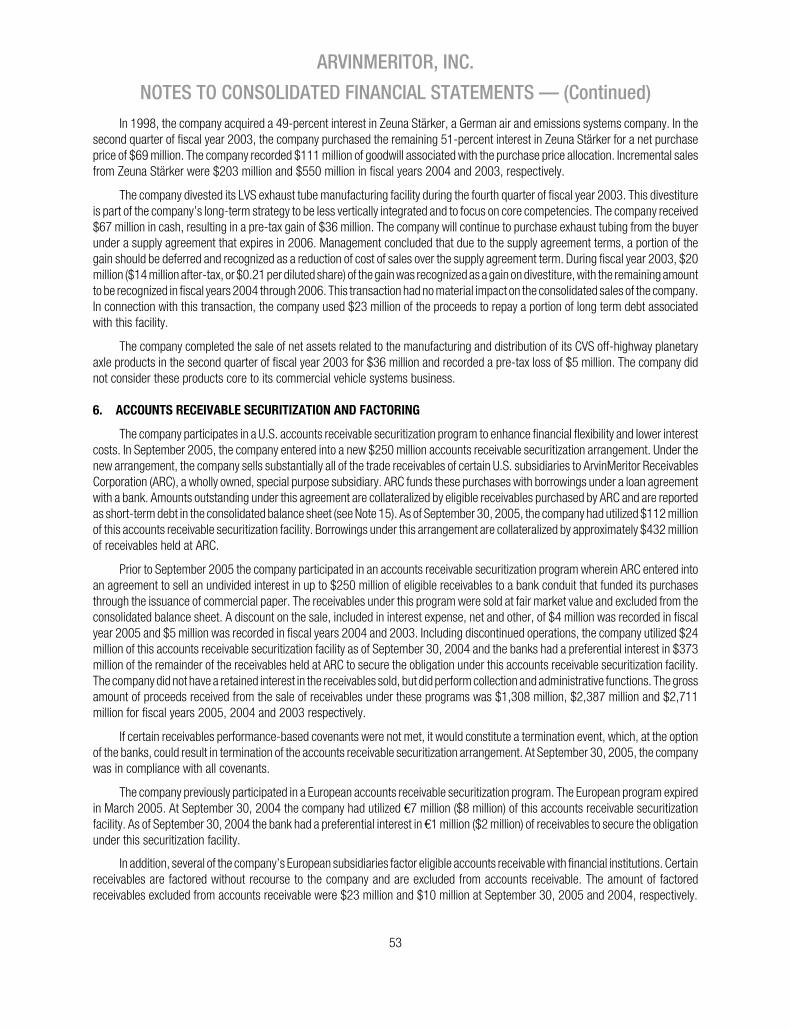
In 1998, the company acquired a 49-percent interest in Zeuna Starker, a German air and emissions systems company. In thesecond quarter of fiscal year 2003, the company purchased the remaining 51-percent interest in Zeuna Starker for a net purchaseprice of $69 million. The company recorded $111 million of goodwill associated with the purchase price allocation. Incremental salesfrom Zeuna Starker were $203 million and $550 million in fiscal years 2004 and 2003, respectively.
The company divested its LVS exhaust tube manufacturing facility during the fourth quarter of fiscal year 2003. This divestitureis part of the company’s long-term strategy to be less vertically integrated and to focus on core competencies. The company received$67 million in cash, resulting in a pre-tax gain of $36 million. The company will continue to purchase exhaust tubing from the buyerunder a supply agreement that expires in 2006. Management concluded that due to the supply agreement terms, a portion of thegain should be deferred and recognized as a reduction of cost of sales over the supply agreement term. During fiscal year 2003, $20million ($14 million after-tax, or $0.21 per diluted share) of the gain was recognized as a gain on divestiture, with the remaining amountto be recognized in fiscal years 2004 through 2006. This transaction had no material impact on the consolidated sales of the company.In connection with this transaction, the company used $23 million of the proceeds to repay a portion of long term debt associatedwith this facility.
The company completed the sale of net assets related to the manufacturing and distribution of its CVS off-highway planetaryaxle products in the second quarter of fiscal year 2003 for $36 million and recorded a pre-tax loss of $5 million. The company didnot consider these products core to its commercial vehicle systems business.
6. ACCOUNTS RECEIVABLE SECURITIZATION AND FACTORING
The company participates in a U.S. accounts receivable securitization program to enhance financial flexibility and lower interestcosts. In September 2005, the company entered into a new $250 million accounts receivable securitization arrangement. Under thenew arrangement, the company sells substantially all of the trade receivables of certain U.S. subsidiaries to ArvinMeritor ReceivablesCorporation (ARC), a wholly owned, special purpose subsidiary. ARC funds these purchases with borrowings under a loan agreementwith a bank. Amounts outstanding under this agreement are collateralized by eligible receivables purchased by ARC and are reportedas short-term debt in the consolidated balance sheet (see Note 15). As of September 30, 2005, the company had utilized $112 millionof this accounts receivable securitization facility. Borrowings under this arrangement are collateralized by approximately $432 millionof receivables held at ARC.
Prior to September 2005 the company participated in an accounts receivable securitization program wherein ARC entered intoan agreement to sell an undivided interest in up to $250 million of eligible receivables to a bank conduit that funded its purchasesthrough the issuance of commercial paper. The receivables under this program were sold at fair market value and excluded from theconsolidated balance sheet. A discount on the sale, included in interest expense, net and other, of $4 million was recorded in fiscalyear 2005 and $5 million was recorded in fiscal years 2004 and 2003. Including discontinued operations, the company utilized $24million of this accounts receivable securitization facility as of September 30, 2004 and the banks had a preferential interest in $373million of the remainder of the receivables held at ARC to secure the obligation under this accounts receivable securitization facility.The company did not have a retained interest in the receivables sold, but did perform collection and administrative functions. The grossamount of proceeds received from the sale of receivables under these programs was $1,308 million, $2,387 million and $2,711million for fiscal years 2005, 2004 and 2003 respectively.
If certain receivables performance-based covenants were not met, it would constitute a termination event, which, at the optionof the banks, could result in termination of the accounts receivable securitization arrangement. At September 30, 2005, the companywas in compliance with all covenants.
The company previously participated in a European accounts receivable securitization program. The European program expiredin March 2005. At September 30, 2004 the company had utilized e7 million ($8 million) of this accounts receivable securitizationfacility. As of September 30, 2004 the bank had a preferential interest in e1 million ($2 million) of receivables to secure the obligationunder this securitization facility.
In addition, several of the company’s European subsidiaries factor eligible accounts receivable with financial institutions. Certainreceivables are factored without recourse to the company and are excluded from accounts receivable. The amount of factoredreceivables excluded from accounts receivable were $23 million and $10 million at September 30, 2005 and 2004, respectively.
ARVINMERITOR, INC.
NOTES TO CONSOLIDATED FINANCIAL STATEMENTS — (Continued)
53
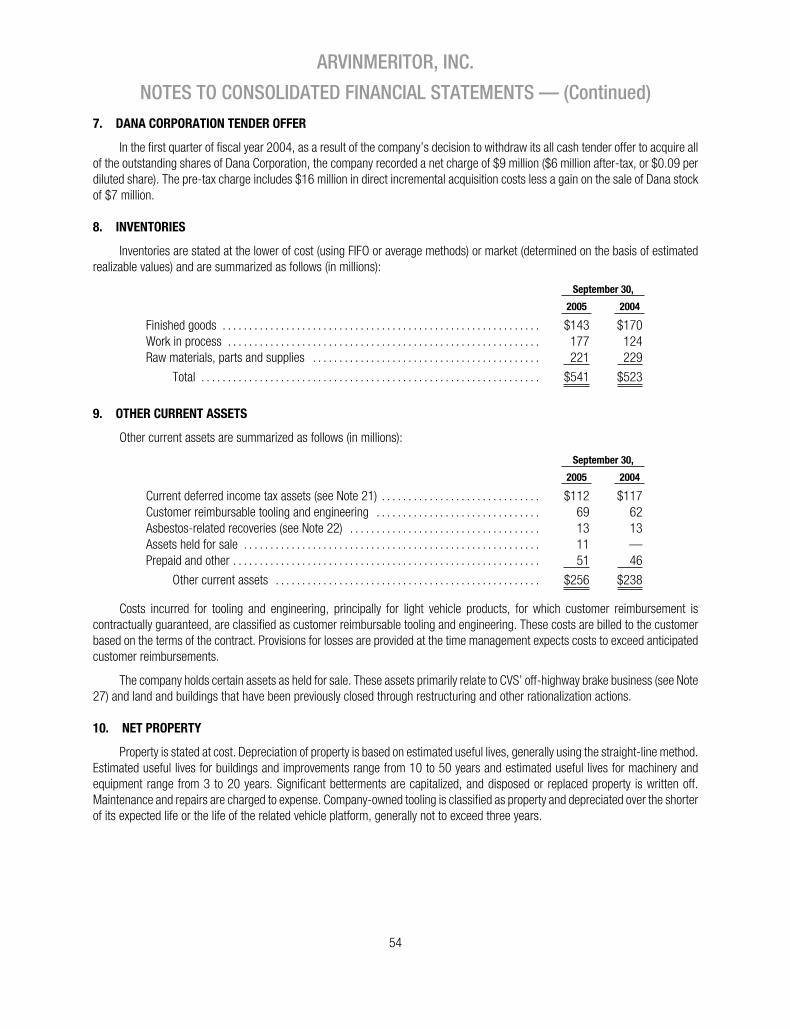
7. DANA CORPORATION TENDER OFFER
In the first quarter of fiscal year 2004, as a result of the company’s decision to withdraw its all cash tender offer to acquire allof the outstanding shares of Dana Corporation, the company recorded a net charge of $9 million ($6 million after-tax, or $0.09 perdiluted share). The pre-tax charge includes $16 million in direct incremental acquisition costs less a gain on the sale of Dana stockof $7 million.
8. INVENTORIES
Inventories are stated at the lower of cost (using FIFO or average methods) or market (determined on the basis of estimatedrealizable values) and are summarized as follows (in millions):
September 30,
2005 2004
Finished goods . . . . . . . . . . . . . . . . . . . . . . . . . . . . . . . . . . . . . . . . . . . . . . . . . . . . . . . . . . . . $143 $170Work in process . . . . . . . . . . . . . . . . . . . . . . . . . . . . . . . . . . . . . . . . . . . . . . . . . . . . . . . . . . . 177 124Raw materials, parts and supplies . . . . . . . . . . . . . . . . . . . . . . . . . . . . . . . . . . . . . . . . . . . 221 229
Total . . . . . . . . . . . . . . . . . . . . . . . . . . . . . . . . . . . . . . . . . . . . . . . . . . . . . . . . . . . . . . . . $541 $523
9. OTHER CURRENT ASSETS
Other current assets are summarized as follows (in millions):
September 30,
2005 2004
Current deferred income tax assets (see Note 21) . . . . . . . . . . . . . . . . . . . . . . . . . . . . . . $112 $117Customer reimbursable tooling and engineering . . . . . . . . . . . . . . . . . . . . . . . . . . . . . . . 69 62Asbestos-related recoveries (see Note 22) . . . . . . . . . . . . . . . . . . . . . . . . . . . . . . . . . . . . 13 13Assets held for sale . . . . . . . . . . . . . . . . . . . . . . . . . . . . . . . . . . . . . . . . . . . . . . . . . . . . . . . . 11 —Prepaid and other . . . . . . . . . . . . . . . . . . . . . . . . . . . . . . . . . . . . . . . . . . . . . . . . . . . . . . . . . . 51 46
Other current assets . . . . . . . . . . . . . . . . . . . . . . . . . . . . . . . . . . . . . . . . . . . . . . . . . . $256 $238
Costs incurred for tooling and engineering, principally for light vehicle products, for which customer reimbursement iscontractually guaranteed, are classified as customer reimbursable tooling and engineering. These costs are billed to the customerbased on the terms of the contract. Provisions for losses are provided at the time management expects costs to exceed anticipatedcustomer reimbursements.
The company holds certain assets as held for sale. These assets primarily relate to CVS’ off-highway brake business (see Note27) and land and buildings that have been previously closed through restructuring and other rationalization actions.
10. NET PROPERTY
Property is stated at cost. Depreciation of property is based on estimated useful lives, generally using the straight-line method.Estimated useful lives for buildings and improvements range from 10 to 50 years and estimated useful lives for machinery andequipment range from 3 to 20 years. Significant betterments are capitalized, and disposed or replaced property is written off.Maintenance and repairs are charged to expense. Company-owned tooling is classified as property and depreciated over the shorterof its expected life or the life of the related vehicle platform, generally not to exceed three years.
ARVINMERITOR, INC.
NOTES TO CONSOLIDATED FINANCIAL STATEMENTS — (Continued)
54

Net Property is summarized as follows (in millions):
September 30,
2005 2004
Property at cost:Land and land improvements . . . . . . . . . . . . . . . . . . . . . . . . . . . . . . . . . . . . . . . . . . . . . . . . . . $ 72 $ 72Buildings . . . . . . . . . . . . . . . . . . . . . . . . . . . . . . . . . . . . . . . . . . . . . . . . . . . . . . . . . . . . . . . . . . . . 437 447Machinery and equipment . . . . . . . . . . . . . . . . . . . . . . . . . . . . . . . . . . . . . . . . . . . . . . . . . . . . . 1,727 1,688Company-owned tooling . . . . . . . . . . . . . . . . . . . . . . . . . . . . . . . . . . . . . . . . . . . . . . . . . . . . . . 227 211Construction in progress . . . . . . . . . . . . . . . . . . . . . . . . . . . . . . . . . . . . . . . . . . . . . . . . . . . . . . 70 79
Total . . . . . . . . . . . . . . . . . . . . . . . . . . . . . . . . . . . . . . . . . . . . . . . . . . . . . . . . . . . . . . . . . . . . . . . . . . 2,533 2,497Less accumulated depreciation . . . . . . . . . . . . . . . . . . . . . . . . . . . . . . . . . . . . . . . . . . . . . . . . . . . (1,520) (1,465)
Net Property . . . . . . . . . . . . . . . . . . . . . . . . . . . . . . . . . . . . . . . . . . . . . . . . . . . . . . . . . . . . . . $ 1,013 $ 1,032
11. OTHER ASSETS
Other assets are summarized as follows (in millions):
September 30,
2005 2004
Non-current deferred income tax assets (see Note 21) . . . . . . . . . . . . . . . . . . . . . . . . . . . . . . . $575 $428Investments in non-consolidated joint ventures (see Note 12) . . . . . . . . . . . . . . . . . . . . . . . . . 114 95Long-term receivables . . . . . . . . . . . . . . . . . . . . . . . . . . . . . . . . . . . . . . . . . . . . . . . . . . . . . . . . . . . 36 41Prepaid pension costs (see Note 20) . . . . . . . . . . . . . . . . . . . . . . . . . . . . . . . . . . . . . . . . . . . . . . 26 23Fair value of interest rate swaps (see Note 16) . . . . . . . . . . . . . . . . . . . . . . . . . . . . . . . . . . . . . . — 36Asbestos-related recoveries (see Note 22) . . . . . . . . . . . . . . . . . . . . . . . . . . . . . . . . . . . . . . . . . 22 59Capitalized software costs, net . . . . . . . . . . . . . . . . . . . . . . . . . . . . . . . . . . . . . . . . . . . . . . . . . . . 30 36Patents, licenses and other intangible assets (less accumulated amortization of $5 and
$4 at September 30, 2005 and 2004, respectively) . . . . . . . . . . . . . . . . . . . . . . . . . . . . . . . 23 33Other . . . . . . . . . . . . . . . . . . . . . . . . . . . . . . . . . . . . . . . . . . . . . . . . . . . . . . . . . . . . . . . . . . . . . . . . . 60 62
Other Assets . . . . . . . . . . . . . . . . . . . . . . . . . . . . . . . . . . . . . . . . . . . . . . . . . . . . . . . . . . . . . . $886 $813
In accordance with Statement of Position (SOP) 98-1, “Accounting for the Costs of Computer Software Developed or Obtainedfor Internal Use,” costs relating to internally developed or purchased software in the preliminary project stage and the post-implementation stage are expensed as incurred. Costs in the application development stage that meet the criteria for capitalizationare capitalized and amortized using the straight-line basis over the economic useful life of the software.
The company’s trademarks, which were determined to have an indefinite life, are not amortized. Patents, licenses and otherintangible assets are amortized over their contractual or estimated useful lives, as appropriate. The company anticipates amortizationexpense for patents, licenses and other intangible assets of approximately $2 million for fiscal year 2006, $1 million in fiscal year2007 and $1 million total for fiscal years 2008 through 2010.
ARVINMERITOR, INC.
NOTES TO CONSOLIDATED FINANCIAL STATEMENTS — (Continued)
55

12. INVESTMENTS IN NON-CONSOLIDATED JOINT VENTURES
The company’s significant non-consolidated joint ventures and related ownership interest at September 30, 2005 areas follows:
Meritor WABCO Vehicle Control Systems . . . . . . . . . . . . . . . . . . . . . . . . . . . . . . . . . . . . . . . . . . . . . . . . . . 50%Master Sistemas Automotrices Limitada . . . . . . . . . . . . . . . . . . . . . . . . . . . . . . . . . . . . . . . . . . . . . . . . . . 49%Suspensys Sistemas Automotivos Ltda. . . . . . . . . . . . . . . . . . . . . . . . . . . . . . . . . . . . . . . . . . . . . . . . . . . . 24%Sistemas Automotrices de Mexico S.A. de C.V. . . . . . . . . . . . . . . . . . . . . . . . . . . . . . . . . . . . . . . . . . . . . 50%Ege Fren Sanayii ve Ticaret A.S. . . . . . . . . . . . . . . . . . . . . . . . . . . . . . . . . . . . . . . . . . . . . . . . . . . . . . . . . . 49%Automotive Axles Limited . . . . . . . . . . . . . . . . . . . . . . . . . . . . . . . . . . . . . . . . . . . . . . . . . . . . . . . . . . . . . . . 36%Arvin Sango, Inc. . . . . . . . . . . . . . . . . . . . . . . . . . . . . . . . . . . . . . . . . . . . . . . . . . . . . . . . . . . . . . . . . . . . . . . 50%ArvinMeritor Sejong, LLC . . . . . . . . . . . . . . . . . . . . . . . . . . . . . . . . . . . . . . . . . . . . . . . . . . . . . . . . . . . . . . . 50%Shanghai ArvinMeritor Automotive Parts Co. Ltd. . . . . . . . . . . . . . . . . . . . . . . . . . . . . . . . . . . . . . . . . . . . 50%
In fiscal year 2004, the company dissolved its transmission joint venture with ZF Freidrichshafen in favor of a marketingarrangement that allows the company to provide the Freedomline™ transmission family to its customers. As discussed in Note 5,in fiscal year 2003, the company purchased the remaining 51% interest in Zeuna Starker. Prior to this transaction, the company’sinvestment in Zeuna Starker was accounted for using the equity method of accounting. Also in fiscal year 2003, the company increasedits ownership interest in Sistemas Automotrices de Mexico S.A. de C.V. to 50% from 40%.
The company’s investment in non-consolidated joint ventures was as follows (in millions):September 30,
2005 2004
Light Vehicle Systems . . . . . . . . . . . . . . . . . . . . . . . . . . . . . . . . . . . . . . . . . . . . . . . . . . . . . . $ 35 $31Commercial Vehicle Systems . . . . . . . . . . . . . . . . . . . . . . . . . . . . . . . . . . . . . . . . . . . . . . . . 79 64
Total investment in non-consolidated joint ventures . . . . . . . . . . . . . . . . . . . . . . . . . . . . $114 $95
The company’s equity in earnings of affiliates were as follows (in millions):2005 2004 2003
Light Vehicle Systems . . . . . . . . . . . . . . . . . . . . . . . . . . . . . . . . . . . . $ 2 $ 2 $3Commercial Vehicle Systems . . . . . . . . . . . . . . . . . . . . . . . . . . . . . . 26 17 5
Total equity in earnings of affiliates . . . . . . . . . . . . . . . . . . . . . . . . . $28 $19 $8
The summarized financial information presented below represents the combined accounts of the company’s non-consolidatedjoint ventures (in millions):
September 30,
2005 2004
Current assets . . . . . . . . . . . . . . . . . . . . . . . . . . . . . . . . . . . . . . . . . . . . . . . . . . . . . . . . . . . . $366 $292Non-current assets . . . . . . . . . . . . . . . . . . . . . . . . . . . . . . . . . . . . . . . . . . . . . . . . . . . . . . . . 199 162
Total assets . . . . . . . . . . . . . . . . . . . . . . . . . . . . . . . . . . . . . . . . . . . . . . . . . . . . . . . . . . $565 $454
Current liabilities . . . . . . . . . . . . . . . . . . . . . . . . . . . . . . . . . . . . . . . . . . . . . . . . . . . . . . . . . . . $263 $211Non-current liabilities . . . . . . . . . . . . . . . . . . . . . . . . . . . . . . . . . . . . . . . . . . . . . . . . . . . . . . 56 44
Total liabilities . . . . . . . . . . . . . . . . . . . . . . . . . . . . . . . . . . . . . . . . . . . . . . . . . . . . . . . . $319 $255
2005 2004 2003
Sales . . . . . . . . . . . . . . . . . . . . . . . . . . . . . . . . . . . . . . . . . . . . . . . . . . . $1,488 $1,100 $843Gross profit . . . . . . . . . . . . . . . . . . . . . . . . . . . . . . . . . . . . . . . . . . . . . 159 121 62Net income . . . . . . . . . . . . . . . . . . . . . . . . . . . . . . . . . . . . . . . . . . . . . 69 56 4
ARVINMERITOR, INC.
NOTES TO CONSOLIDATED FINANCIAL STATEMENTS — (Continued)
56
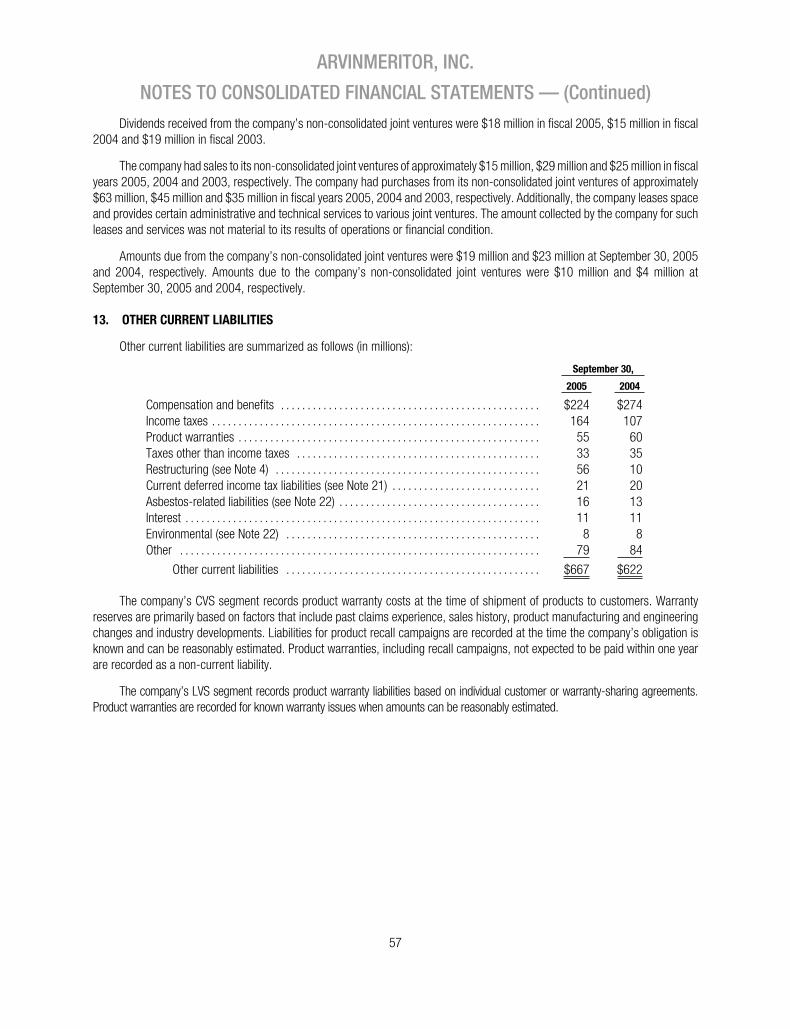
Dividends received from the company’s non-consolidated joint ventures were $18 million in fiscal 2005, $15 million in fiscal2004 and $19 million in fiscal 2003.
The company had sales to its non-consolidated joint ventures of approximately $15 million, $29 million and $25 million in fiscalyears 2005, 2004 and 2003, respectively. The company had purchases from its non-consolidated joint ventures of approximately$63 million, $45 million and $35 million in fiscal years 2005, 2004 and 2003, respectively. Additionally, the company leases spaceand provides certain administrative and technical services to various joint ventures. The amount collected by the company for suchleases and services was not material to its results of operations or financial condition.
Amounts due from the company’s non-consolidated joint ventures were $19 million and $23 million at September 30, 2005and 2004, respectively. Amounts due to the company’s non-consolidated joint ventures were $10 million and $4 million atSeptember 30, 2005 and 2004, respectively.
13. OTHER CURRENT LIABILITIES
Other current liabilities are summarized as follows (in millions):
September 30,
2005 2004
Compensation and benefits . . . . . . . . . . . . . . . . . . . . . . . . . . . . . . . . . . . . . . . . . . . . . . . . . $224 $274Income taxes . . . . . . . . . . . . . . . . . . . . . . . . . . . . . . . . . . . . . . . . . . . . . . . . . . . . . . . . . . . . . . 164 107Product warranties . . . . . . . . . . . . . . . . . . . . . . . . . . . . . . . . . . . . . . . . . . . . . . . . . . . . . . . . . 55 60Taxes other than income taxes . . . . . . . . . . . . . . . . . . . . . . . . . . . . . . . . . . . . . . . . . . . . . . 33 35Restructuring (see Note 4) . . . . . . . . . . . . . . . . . . . . . . . . . . . . . . . . . . . . . . . . . . . . . . . . . . 56 10Current deferred income tax liabilities (see Note 21) . . . . . . . . . . . . . . . . . . . . . . . . . . . . 21 20Asbestos-related liabilities (see Note 22) . . . . . . . . . . . . . . . . . . . . . . . . . . . . . . . . . . . . . . 16 13Interest . . . . . . . . . . . . . . . . . . . . . . . . . . . . . . . . . . . . . . . . . . . . . . . . . . . . . . . . . . . . . . . . . . . 11 11Environmental (see Note 22) . . . . . . . . . . . . . . . . . . . . . . . . . . . . . . . . . . . . . . . . . . . . . . . . 8 8Other . . . . . . . . . . . . . . . . . . . . . . . . . . . . . . . . . . . . . . . . . . . . . . . . . . . . . . . . . . . . . . . . . . . . 79 84
Other current liabilities . . . . . . . . . . . . . . . . . . . . . . . . . . . . . . . . . . . . . . . . . . . . . . . . $667 $622
The company’s CVS segment records product warranty costs at the time of shipment of products to customers. Warrantyreserves are primarily based on factors that include past claims experience, sales history, product manufacturing and engineeringchanges and industry developments. Liabilities for product recall campaigns are recorded at the time the company’s obligation isknown and can be reasonably estimated. Product warranties, including recall campaigns, not expected to be paid within one yearare recorded as a non-current liability.
The company’s LVS segment records product warranty liabilities based on individual customer or warranty-sharing agreements.Product warranties are recorded for known warranty issues when amounts can be reasonably estimated.
ARVINMERITOR, INC.
NOTES TO CONSOLIDATED FINANCIAL STATEMENTS — (Continued)
57

A summary of the changes in product warranties is as follows (in millions):
2005 2004 2003
Total product warranties — beginning of year . . . . . . . . . . . . . . . $ 90 $ 83 $ 83Accruals for product warranties . . . . . . . . . . . . . . . . . . . . . . . . . . . . 55 51 43Accruals for product recall campaigns . . . . . . . . . . . . . . . . . . . . . . — — 1Increase in product warranties due to acquisitions . . . . . . . . . . . — 20 7Payments . . . . . . . . . . . . . . . . . . . . . . . . . . . . . . . . . . . . . . . . . . . . . . . (54) (61) (55)Change in estimates and other . . . . . . . . . . . . . . . . . . . . . . . . . . . . 2 (3) 4
Total product warranties — end of year . . . . . . . . . . . . . . . . . . . . 93 90 83Less: Non-current product warranties (see Note 14) . . . . . . . . . . (38) (30) (30)
Product warranties — current . . . . . . . . . . . . . . . . . . . . . . . . $ 55 $ 60 $ 53
In fiscal year 2004, the company, as a result of receiving the wrong grade of steel from one of its steel suppliers, manufacturedand shipped certain products that were out of specification with various customers’ orders. The company was notified by a customerin fiscal year 2005 that it was initiating a field service campaign covering approximately 35,000 vehicles that were manufactured bythe customer during the relevant time frame, prior to the aforementioned steel issue being identified and would expect the companyto reimburse it for the cost of the campaign. Additionally, another customer has notified the company that it has initiated a field servicecampaign to replace an affected part in approximately 8,300 vehicles. Although this field service campaign is associated with thesame steel issue and the same supplier, it relates to a different part on the vehicle. Associated with these matters, in fiscal year 2005,the company recorded a warranty charge of $4 million, net of probable recoveries from the supplier, which are recorded in receivables.The company is vigorously pursuing full recovery from the steel supplier associated with these matters. Based on the currently availablefacts and circumstances, the company does not believe the ultimate outcome of this matter, net of probable recoveries from thesupplier, will have a material adverse effect on its financial position or results of operations.
As discussed in Note 12, the company dissolved its transmission joint venture with ZF Freidrichshafen in fiscal year 2004. Asa result, the company reclassified $20 million of product warranties that were previously included in other long-term liabilities in theconsolidated balance sheet.
14. OTHER LIABILITIES
Other liabilities are summarized as follows (in millions):
September 30,
2005 2004
Asbestos (see Note 22) . . . . . . . . . . . . . . . . . . . . . . . . . . . . . . . . . . . . . . . . . . . . . . . . . . . . . $ 38 $ 61Non-current deferred income tax liabilities (see Note 21) . . . . . . . . . . . . . . . . . . . . . . . . 23 59Product warranties (see Note 13) . . . . . . . . . . . . . . . . . . . . . . . . . . . . . . . . . . . . . . . . . . . . 38 30Environmental (see Note 22) . . . . . . . . . . . . . . . . . . . . . . . . . . . . . . . . . . . . . . . . . . . . . . . . 16 26Long-term payable . . . . . . . . . . . . . . . . . . . . . . . . . . . . . . . . . . . . . . . . . . . . . . . . . . . . . . . . . 57 33Other . . . . . . . . . . . . . . . . . . . . . . . . . . . . . . . . . . . . . . . . . . . . . . . . . . . . . . . . . . . . . . . . . . . . 37 38
Other liabilities . . . . . . . . . . . . . . . . . . . . . . . . . . . . . . . . . . . . . . . . . . . . . . . . . . . . . . . $209 $247
As discussed in Note 5, the company recorded a long-term payable of e15.7 million ($19 million) plus interest to purchase theremaining 49-percent interest in one of the joint ventures formed with AB Volvo.
ARVINMERITOR, INC.
NOTES TO CONSOLIDATED FINANCIAL STATEMENTS — (Continued)
58
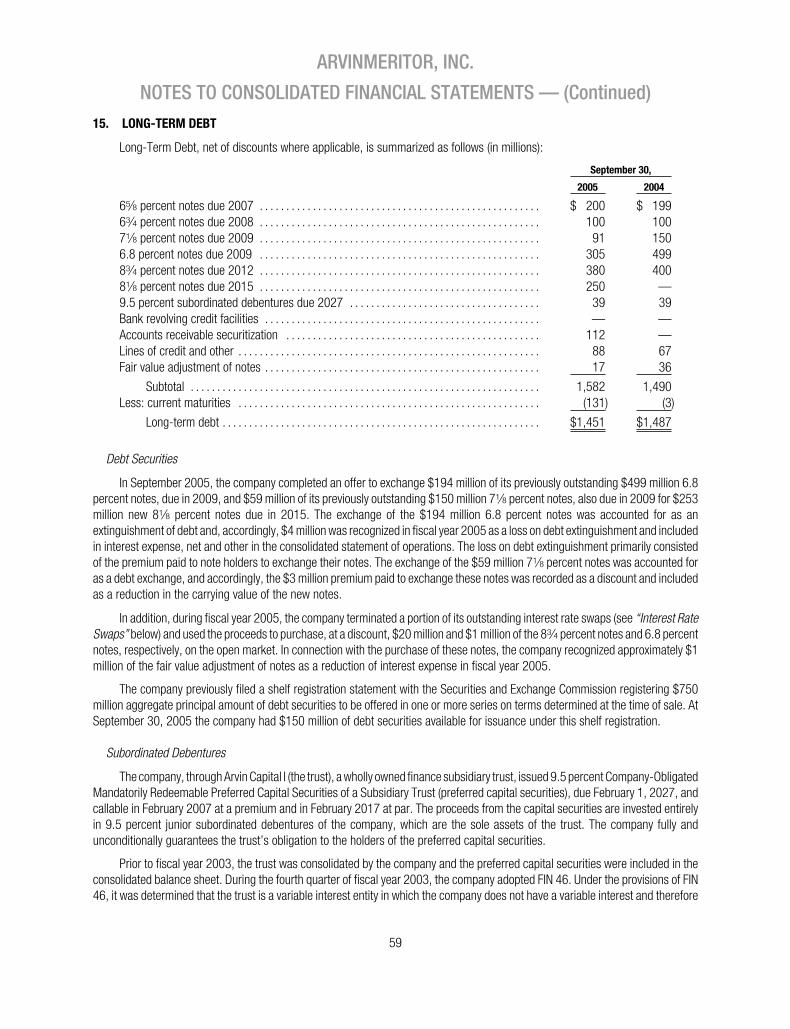
15. LONG-TERM DEBT
Long-Term Debt, net of discounts where applicable, is summarized as follows (in millions):
September 30,
2005 2004
65⁄8 percent notes due 2007 . . . . . . . . . . . . . . . . . . . . . . . . . . . . . . . . . . . . . . . . . . . . . . . . . . . . . $ 200 $ 19963⁄4 percent notes due 2008 . . . . . . . . . . . . . . . . . . . . . . . . . . . . . . . . . . . . . . . . . . . . . . . . . . . . . 100 10071⁄8 percent notes due 2009 . . . . . . . . . . . . . . . . . . . . . . . . . . . . . . . . . . . . . . . . . . . . . . . . . . . . . 91 1506.8 percent notes due 2009 . . . . . . . . . . . . . . . . . . . . . . . . . . . . . . . . . . . . . . . . . . . . . . . . . . . . . 305 49983⁄4 percent notes due 2012 . . . . . . . . . . . . . . . . . . . . . . . . . . . . . . . . . . . . . . . . . . . . . . . . . . . . . 380 40081⁄8 percent notes due 2015 . . . . . . . . . . . . . . . . . . . . . . . . . . . . . . . . . . . . . . . . . . . . . . . . . . . . . 250 —9.5 percent subordinated debentures due 2027 . . . . . . . . . . . . . . . . . . . . . . . . . . . . . . . . . . . . 39 39Bank revolving credit facilities . . . . . . . . . . . . . . . . . . . . . . . . . . . . . . . . . . . . . . . . . . . . . . . . . . . . — —Accounts receivable securitization . . . . . . . . . . . . . . . . . . . . . . . . . . . . . . . . . . . . . . . . . . . . . . . . 112 —Lines of credit and other . . . . . . . . . . . . . . . . . . . . . . . . . . . . . . . . . . . . . . . . . . . . . . . . . . . . . . . . . 88 67Fair value adjustment of notes . . . . . . . . . . . . . . . . . . . . . . . . . . . . . . . . . . . . . . . . . . . . . . . . . . . . 17 36
Subtotal . . . . . . . . . . . . . . . . . . . . . . . . . . . . . . . . . . . . . . . . . . . . . . . . . . . . . . . . . . . . . . . . . . 1,582 1,490Less: current maturities . . . . . . . . . . . . . . . . . . . . . . . . . . . . . . . . . . . . . . . . . . . . . . . . . . . . . . . . . (131) (3)
Long-term debt . . . . . . . . . . . . . . . . . . . . . . . . . . . . . . . . . . . . . . . . . . . . . . . . . . . . . . . . . . . . $1,451 $1,487
Debt Securities
In September 2005, the company completed an offer to exchange $194 million of its previously outstanding $499 million 6.8percent notes, due in 2009, and $59 million of its previously outstanding $150 million 71⁄8 percent notes, also due in 2009 for $253million new 81⁄8 percent notes due in 2015. The exchange of the $194 million 6.8 percent notes was accounted for as anextinguishment of debt and, accordingly, $4 million was recognized in fiscal year 2005 as a loss on debt extinguishment and includedin interest expense, net and other in the consolidated statement of operations. The loss on debt extinguishment primarily consistedof the premium paid to note holders to exchange their notes. The exchange of the $59 million 71⁄8 percent notes was accounted foras a debt exchange, and accordingly, the $3 million premium paid to exchange these notes was recorded as a discount and includedas a reduction in the carrying value of the new notes.
In addition, during fiscal year 2005, the company terminated a portion of its outstanding interest rate swaps (see “Interest RateSwaps” below) and used the proceeds to purchase, at a discount, $20 million and $1 million of the 83⁄4 percent notes and 6.8 percentnotes, respectively, on the open market. In connection with the purchase of these notes, the company recognized approximately $1million of the fair value adjustment of notes as a reduction of interest expense in fiscal year 2005.
The company previously filed a shelf registration statement with the Securities and Exchange Commission registering $750million aggregate principal amount of debt securities to be offered in one or more series on terms determined at the time of sale. AtSeptember 30, 2005 the company had $150 million of debt securities available for issuance under this shelf registration.
Subordinated Debentures
The company, through Arvin Capital I (the trust), a wholly owned finance subsidiary trust, issued 9.5 percent Company-ObligatedMandatorily Redeemable Preferred Capital Securities of a Subsidiary Trust (preferred capital securities), due February 1, 2027, andcallable in February 2007 at a premium and in February 2017 at par. The proceeds from the capital securities are invested entirelyin 9.5 percent junior subordinated debentures of the company, which are the sole assets of the trust. The company fully andunconditionally guarantees the trust’s obligation to the holders of the preferred capital securities.
Prior to fiscal year 2003, the trust was consolidated by the company and the preferred capital securities were included in theconsolidated balance sheet. During the fourth quarter of fiscal year 2003, the company adopted FIN 46. Under the provisions of FIN46, it was determined that the trust is a variable interest entity in which the company does not have a variable interest and therefore
ARVINMERITOR, INC.
NOTES TO CONSOLIDATED FINANCIAL STATEMENTS — (Continued)
59

is not the primary beneficiary. Upon adoption of FIN 46, the company no longer consolidates the trust that issued the $39 million ofoutstanding preferred capital securities, and has included in long-term debt $39 million of junior subordinated debentures due to thetrust. There was no impact from the de-consolidation of the trust to the company’s financial position or results of operations.
Bank Revolving Credit Facilities
The company has a $900 million revolving credit facility that expires in 2008. Under the facility, borrowings are subject to interestbased on quoted LIBOR rates plus a margin, and a facility fee, both of which are based upon the company’s credit rating. AtSeptember 30, 2005, the margin over the LIBOR rate was 150 basis points, and the facility fee was 37.5 basis points. Certain of thecompany’s domestic subsidiaries, as defined in the credit agreement, irrevocably and unconditionally guarantee amounts outstandingunder the credit facility. The revolving credit facility includes a $150 million limit on the issuance of letters of credit. At September 30,2005 and 2004, approximately $23 million and $24 million letters of credit, respectively, were issued.
The company, under the terms of an existing lease agreement, provided similar subsidiary guarantees for the benefit of the lessor,lenders and agent thereunder and voluntarily agreed to provide similar subsidiary guarantees for the benefit of the holders of the publicly-held notes outstanding under the company’s two indentures (see Note 26).
Accounts Receivable Securitization
In September 2005, the company entered into a new $250 million accounts receivable securitization arrangement. As discussedin Note 6, the company’s previous accounts receivable securitization facility expired in September 2005. Under the new arrangement,the company sells substantially all of the trade receivables of certain U.S. subsidiaries to ARC. ARC funds these purchases withborrowings under a loan agreement with a bank. The interest rate on borrowings under this arrangement was approximately 3.85percent at September 30, 2005. Amounts outstanding under this agreement are reported as short-term debt in the consolidatedbalance sheet and are collateralized by $432 million of eligible receivables purchased and held by ARC.
Related Parties
A 57-percent owned consolidated joint venture of the company has a $7 million, 6.5-percent loan with its minority partner. Thematurity date of this loan was extended in November 2005 to fiscal year 2009. This loan is included in long-term debt in theconsolidated balance sheet.
The company also has an arrangement with a non-consolidated joint venture that allows the company to borrow funds from timeto time, at LIBOR plus 50 basis points. No amounts were outstanding under this arrangement at September 30, 2005 and 2004.
Interest Rate Swap Agreements
In May 2005, the company terminated $262 million of its $300 million notional amount 8.75 percent interest rate swap and$22 million of its $100 million notional amount 6.8 percent interest rate swap. Proceeds from these terminations, including interestreceived, were $22 million. The fair value adjustment to the notes associated with these partially terminated swaps was $20 million,and is amortized to earnings as a reduction of interest expense over the remaining life of the debt. The fair value adjustment of thenotes is classified in Long-Term Debt in the consolidated balance sheet. Simultaneously, the company executed new swapagreements that effectively convert $183 million notional amount of 83⁄4 percent notes and $15 million notional amount of 6.8 percentnotes to variable interest rates. The new swap agreements had the same terms as the original agreements, and the fixed spread isapproximately 140 basis points higher than in the original swap agreements.
As of September 30, 2005, the company had interest rate swap agreements that effectively convert $221 million of thecompany’s 83⁄4 percent notes and $93 million of the 6.8 percent notes to variable interest rates. The fair value of the swaps was notmaterial as of September 30, 2005 and $36 million as of September 30, 2004, and is recorded in Other Assets. The swaps havebeen designated as fair value hedges and the impact of the changes in their fair values is offset by an equal and opposite changein the carrying value of the related notes. Under the terms of the swap agreements, the company receives a fixed rate of interest of8.75 percent and 6.8 percent on notional amounts of $221 million and $93 million, respectively, and pays variable rates based onthree-month LIBOR plus a weighted-average spread of 3.30 percent. The payments under the agreements coincide with the interest
ARVINMERITOR, INC.
NOTES TO CONSOLIDATED FINANCIAL STATEMENTS — (Continued)
60

payment dates on the hedged debt instruments, and the difference between the amounts paid and received is included in interestexpense, net and other.
The company classifies the cash flows associated with its interest rate swaps in cash flows from operating activities in itsconsolidated statement of cash flows. This is consistent with the classification of the cash flows associated with the underlyinghedged item.
Leases
The company has entered into an agreement to lease certain manufacturing and administrative assets. Under the agreement,the assets are held by a variable interest entity. The variable interest entity’s purpose is to hold the manufatucring and administrativeassets and lease such assets to the company. The company has determined that it has a variable interest in the variable interest entity,in the form of a $30 million residual value guarantee that obligates the company to absorb a majority of the variable interest entity’slosses. The assets and liabilities of this variable interest entity are included in the company’s consolidated balance sheet atSeptember 30, 2005 and 2004 (see Note 2). Amounts outstanding under this agreement are collateralized by the $35 million ofproperty and equipment being leased. The company also has various other operating leasing arrangements that are not with variableinterest entities.
Future minimum lease payments under this lease and other operating leases are $22 million in 2006, $17 million in 2007, $14million in 2008, $11 million in 2009, $8 million in 2010 and $5 million thereafter.
Covenants
The bank revolving credit facilities require the company to maintain a total net debt to earnings before interest, taxes,depreciation and amortization (EBITDA) ratio no greater than 3.25x and a minimum fixed charge coverage ratio (EBITDA less capitalexpenditures to interest expense) no less than 1.50x. In addition, an operating lease requires the company to maintain financial ratiosthat are similar to those required under the company’s credit facilities. At September 30, 2005, the company was in compliance withall covenants.
16. FINANCIAL INSTRUMENTS
The company’s financial instruments include cash and cash equivalents, short-term debt, long-term debt, interest rate swaps,and foreign exchange forward contracts. The company uses derivatives for hedging and non-trading purposes in order to manageits interest rate and foreign exchange rate exposures. The company’s interest rate swap agreements are discussed in Note 15.
Foreign Exchange Contracts
The Company’s operations are exposed to global market risks, including the effect of changes in foreign currency exchangerates. In the fourth quarter of fiscal 2004 the company implemented a foreign currency cash flow hedging program to reduce thecompany’s exposure to changes in exchange rates. The company uses foreign currency forward contracts to manage the company’sexposures arising from foreign currency exchange risk. Gains and losses on the underlying foreign currency exposures are partiallyoffset with gains and losses on the foreign currency forward contracts.
Under this program, the company has designated the foreign exchange contracts (the “contracts”) as cash flow hedges ofunderlying forecasted foreign currency purchases and sales. The effective portion of changes in the fair value of the contracts isrecorded in Accumulated Other Comprehensive Income (AOCI) in the consolidated statement of shareowners’ equity and is recognizedin operating income when the underlying forecasted transaction impacts earnings. The contracts generally mature within 12 months.The company recognized gains on the contracts of approximately $14 million in the fiscal year ended September 30, 2005. Thecontracts were not significant to results of operations in fiscal year 2004. The impact to operating income associated with hedgeineffectiveness was not significant in fiscal years 2005 and 2004.
At September 30, 2005 and 2004, $2 million and $3 million of gains were recorded in AOCI, respectively. The company expectsto reclassify this amount from AOCI to operating income during the next twelve months as the forecasted hedged transactions arerecognized in earnings.
ARVINMERITOR, INC.
NOTES TO CONSOLIDATED FINANCIAL STATEMENTS — (Continued)
61

The company classifies the cash flows associated with the contracts in cash flows from operating activities in its consolidatedstatement of cash flows. This is consistent with the classification of the cash flows associated with the underlying hedged item.
Prior to the inception of this program, the company elected not to designate the contracts as hedges, therefore, changes in thefair value of the contracts were recognized in operating income. The net income impact of recording these contracts at fair value infiscal years 2004 and 2003 did not have a significant effect on the company’s results of operations.
Fair Value
Fair values of financial instruments are summarized as follows (in millions):
September 30,
2005 2004
CarryingValue
FairValue
CarryingValue
FairValue
Cash and cash equivalents . . . . . . . . . . . . . . . . . . . . . . . . . . . . . . . . . . . . $ 187 $ 187 $ 132 $ 132Interest rate swaps — asset . . . . . . . . . . . . . . . . . . . . . . . . . . . . . . . . . . — — 36 36Foreign exchange contracts — asset . . . . . . . . . . . . . . . . . . . . . . . . . . . 4 4 5 5Foreign exchange contracts — liability . . . . . . . . . . . . . . . . . . . . . . . . . 2 2 3 3Short-term debt . . . . . . . . . . . . . . . . . . . . . . . . . . . . . . . . . . . . . . . . . . . . . 131 131 3 3Long-term debt . . . . . . . . . . . . . . . . . . . . . . . . . . . . . . . . . . . . . . . . . . . . . . 1,451 1,416 1,487 1,521
Cash and cash equivalents — All highly liquid investments purchased with maturity of three months or less are considered tobe cash equivalents. The carrying value approximates fair value because of the short maturity of these instruments.
Interest rate swaps and foreign exchange forward contracts — Fair values are estimated by obtaining quotes fromexternal sources.
Short-term debt — The carrying value of short-term debt approximates fair value because of the short maturity ofthese borrowings.
Long-term debt — Fair values are based on interest rates that would be currently available to the company for issuance of similartypes of debt instruments with similar terms and remaining maturities.
17. SHAREOWNERS’ EQUITY
Common Stock
The company is authorized to issue 500 million shares of Common Stock, with a par value of $1 per share, and 30 million sharesof Preferred Stock, without par value, of which two million shares are designated as Series A Junior Participating Preferred Stock(Junior Preferred Stock). Under the Company Rights Plan, a Preferred Share Purchase Right (Right) is attached to each share ofCommon Stock pursuant to which the holder may, in certain takeover-related circumstances, become entitled to purchase from thecompany 1/100th of a share of Junior Preferred Stock at a price of $100, subject to adjustment. Also, in certain takeover-relatedcircumstances, each Right (other than those held by an acquiring person) will be exercisable for shares of Common Stock or stockof the acquiring person having a market value of twice the exercise price. In certain events, the company may exchange each Rightfor one share of Common Stock or 1/100th of a share of Junior Preferred Stock. The Rights will expire on July 7, 2010, unless earlierexchanged or redeemed at a redemption price of $0.01 per Right. Until a Right is exercised, the holder, as such, will have no voting,dividend or other rights as a shareowner of the company.
The company has reserved approximately 15.6 million shares of Common Stock in connection with its Long-Term IncentivesPlan (LTIP), Directors Stock Plan, Incentive Compensation Plan, 1998 and 1988 Stock Benefit Plans, and Employee Stock Benefit Planfor grants of non-qualified stock options, incentive stock options, stock appreciation rights, restricted stock, performance shares,restricted share units and stock awards to key employees and directors. At September 30, 2005, there were 2.2 million sharesavailable for future grants under these plans.
ARVINMERITOR, INC.
NOTES TO CONSOLIDATED FINANCIAL STATEMENTS — (Continued)
62

Total compensation expense recognized for stock based compensation, excluding stock options, was $18 million in fiscal year2005 and $9 million in fiscal years 2004 and 2003.
Restricted Stock
The company granted shares of restricted stock to certain employees in accordance with the LTIP and the Employee StockBenefit Plan. The restricted stock is subject to continued employment by the employee and typically vests after three years. Restrictedstock grants to officers and other employees are summarized as follows:
Grant Date
GrantDatePrice
Number ofShares
YearVested
TotalCompensation
RecognitionPeriod
July 2005 (1) . . . . . . . . . . . . . . . . . . . . . . . . . . . . . . . . . . . $18.81 37,500 2010 $ 1 million 5 yearsApril 2005 (2) . . . . . . . . . . . . . . . . . . . . . . . . . . . . . . . . . . . $15.36 55,000 2009 $ 1 million 4 yearsDecember 2004 (3) . . . . . . . . . . . . . . . . . . . . . . . . . . . . . . $21.49 266,000 2007 $ 6 million 3 yearsAugust 2004 (4) . . . . . . . . . . . . . . . . . . . . . . . . . . . . . . . . . $18.48 150,000 2007 $ 3 million 3 yearsJanuary 2004 (5) . . . . . . . . . . . . . . . . . . . . . . . . . . . . . . . . $23.80 561,700 2007 $13 million 3 yearsNovember 2002 (5) . . . . . . . . . . . . . . . . . . . . . . . . . . . . . . $15.32 572,300 2005 $ 9 million 3 years
(1) Includes shares of restricted stock awarded to an officer of the company that vest over five years with 9,375 shares vesting ineach of July 2008 and 2009, and 18,750 shares vesting in July 2010.
(2) Includes shares of restricted stock awarded to another officer of the company that vest over four years with 7,500 shares vestingin each of April 2006, 2007, 2008, and 2009. Vesting of the remaining shares is subject to satisfaction of certain conditionsrelated to the company’s financial performance.
(3) Includes shares of restricted stock awarded to the company’s employees that vest in fiscal year 2007.(4) Includes shares of restricted stock awarded to the company’s chief executive officer with 25,000 shares vesting in each of
August 2005 and 2006 and 50,000 shares vesting in August 2007. Vesting of the remaining shares is subject to satisfactionof conditions related to the company’s financial performance.
(5) Includes shares of restricted stock awarded to the company’s officers. Vesting of these shares is also subject to satisfactionof certain conditions related to the company’s financial performance.
As the grant of restricted stock relates to future service, the total compensation expense is recorded as unearned compensationand is shown as a separate reduction of shareowners’ equity. The unearned compensation is expensed over the vesting period. Thecompany granted the restricted stock from treasury shares, and cash dividends on the restricted stock are reinvested in additionalshares of common stock during the vesting period.
Restricted and Performance Share Units
The company also grants restricted share units to non-employee members of the Board of Directors as annual grants underthe 2004 Directors Stock Plan. In fiscal years 2005 and 2004, the company granted 57,375 and 28,200 restricted share units,respectively, to non-employee members of the Board of Directors. The grant date price of these stock based awards was $17.81 and$22.61, respectively.
In addition, the company grants restricted share units to employees. These share units typically vest over three years. Therestricted share units are subject to continued employment by the employee. Compensation cost associated with share units isrecognized ratably over the vesting period and the related liability is included in Retirement Benefits in the consolidated balance sheet.In fiscal year 2005, the company granted 48,300 restricted share units. The grant date price of these stock based awards was $21.49.
The company grants performance share units to officers. These share units typically vest over three years. The performanceshare units are also subject to satisfaction of certain conditions related to the company’s financial performance. Compensation costassociated with performance share units is recognized ratably over the vesting period and included in Retirement Benefits in the
ARVINMERITOR, INC.
NOTES TO CONSOLIDATED FINANCIAL STATEMENTS — (Continued)
63

consolidated balance sheet. In fiscal year 2005, the company granted 387,800 performance share units. The grant date price of thesestock based awards was $21.06.
Treasury Stock
The company accounts for treasury stock at cost. There were no purchases of treasury stock in fiscal years 2005, 2004 or 2003.During fiscal years 2005 and 2004, approximately 0.9 million and 1.0 million shares of treasury stock were issued in connection withthe exercise of stock options and issuance of restricted stock under the company’s incentive plans.
Accumulated Other Comprehensive Loss
The components of Accumulated Other Comprehensive Loss as reported in the Consolidated Balance Sheet and Statement ofShareowners’ Equity are as follows:
ForeignCurrency
Translation
MinimumPensionLiability
UnrealizedGains Total
Balance at September 30, 2002 . . . . . . . . . . . . . . . . . . . . . . . . . . . . . . . $(244) $(112) $— $(356)2003 adjustment . . . . . . . . . . . . . . . . . . . . . . . . . . . . . . . . . . . . . . . . . . 212 (182) — 30Unrealized gain on marketable securities . . . . . . . . . . . . . . . . . . . . . — — 3 3
Balance at September 30, 2003 . . . . . . . . . . . . . . . . . . . . . . . . . . . . . . . (32) (294) 3 (323)2004 adjustment . . . . . . . . . . . . . . . . . . . . . . . . . . . . . . . . . . . . . . . . . . 112 1 — 113Reclassification of unrealized gain . . . . . . . . . . . . . . . . . . . . . . . . . . . — — (3) (3)Deferred gain on cash flow hedges . . . . . . . . . . . . . . . . . . . . . . . . . . — — 3 3
Balance at September 30, 2004 . . . . . . . . . . . . . . . . . . . . . . . . . . . . . . . 80 (293) 3 (210)2005 adjustment . . . . . . . . . . . . . . . . . . . . . . . . . . . . . . . . . . . . . . . . . . 22 (143) — (121)Deferred gain on cash flow hedges . . . . . . . . . . . . . . . . . . . . . . . . . . — — (1) (1)
Balance at September 30, 2005 . . . . . . . . . . . . . . . . . . . . . . . . . . . . . . . $ 102 $(436) $ 2 $(332)
18. STOCK OPTIONS
Under the company’s incentive plans, stock options are granted at prices equal to the fair value on the date of grant and havea maximum term of 10 years. Stock options vest over a three year period from the date of grant. No stock options were granted duringfiscal year 2005.
Information related to stock options is as follows (shares in thousands, exercise price represents a weighted average):
2005 2004 2003
SharesExercise
Price SharesExercise
Price SharesExercise
Price
Outstanding — beginning of year . . . . . . . . . . . . . . . . . . 5,883 $20.67 5,492 $21.29 4,890 $23.16Granted . . . . . . . . . . . . . . . . . . . . . . . . . . . . . . . . . . . . . . . . — — 1,184 17.99 1,127 15.35Exercised . . . . . . . . . . . . . . . . . . . . . . . . . . . . . . . . . . . . . . . (374) 16.38 (378) 16.05 (57) 16.31Cancelled or expired . . . . . . . . . . . . . . . . . . . . . . . . . . . . . (329) 28.56 (415) 24.41 (468) 27.18
Outstanding — end of year . . . . . . . . . . . . . . . . . . . . . . . 5,180 20.49 5,883 20.67 5,492 21.29
Exercisable — end of year . . . . . . . . . . . . . . . . . . . . . . . . 4,178 21.26 3,610 22.56 3,102 24.48
ARVINMERITOR, INC.
NOTES TO CONSOLIDATED FINANCIAL STATEMENTS — (Continued)
64

The following table provides additional information about outstanding stock options at September 30, 2005 (shares inthousands, exercise price represents a weighted average):
Outstanding Exercisable
Exercise Price Range SharesRemaining
YearsExercise
Price SharesExercise
Price
$14.00 to $22.00 . . . . . . . . . . . . . . . . . . . . . . . . . . . . . . . 3,996 6.7 $17.72 2,994 $17.88$22.01 to $33.00 . . . . . . . . . . . . . . . . . . . . . . . . . . . . . . . 996 2.7 28.22 996 28.22$33.01 to $41.00 . . . . . . . . . . . . . . . . . . . . . . . . . . . . . . . 188 3.3 38.23 188 38.23
5,180 4,178
Effective October 1, 2002, the company voluntarily changed its accounting for stock options granted under its various stock-based compensation plans and began expensing the fair value of stock options. Compensation expense is recognized for the non-vested portion of previously issued stock options, as well as for new grants of stock options. The company recorded compensationexpense in fiscal year 2005 of $6 million and $7 million in fiscal years 2004 and 2003 associated with the expensing of stock options.
The weighted average fair values of options granted were $5.80 and $5.20 per share in fiscal 2004 and 2003, respectively.The fair value of each option was estimated on the date of grant using the Black-Scholes pricing model and the following assumptions:
2005 2004 2003
Average risk-free interest rate . . . . . . . . . . . . . . . . . . . . . . . . . . N/A 3.1% 3.1%Expected dividend yield . . . . . . . . . . . . . . . . . . . . . . . . . . . . . . . . N/A 2.4% 1.7%Expected volatility . . . . . . . . . . . . . . . . . . . . . . . . . . . . . . . . . . . . . N/A 41.0% 40.0%Expected life (years) . . . . . . . . . . . . . . . . . . . . . . . . . . . . . . . . . . . N/A 5 5
19. RETIREMENT MEDICAL PLANS
The company has retirement medical plans that cover the majority of its U.S. and certain non-U.S. employees and provide formedical payments to eligible employees and dependents upon retirement. These plans are unfunded.
In fiscal year 2004, the company approved changes to certain retiree medical plans. These plan amendments and the relatedimpact are reflected in the accumulated postretirement benefit obligation (APBO) as of September 30, 2005 and 2004. Beginningin April 2005, salaried retirees and certain non-union hourly retirees under age 65 who pay a portion of the cost for their coveragewill contribute an increased share each year. The benefit currently provided by the company will be phased out by fiscal year 2023.For retirees age 65 and older, the company will no longer provide supplemental healthcare benefits to Medicare-eligible retireesbeginning in January 2006.
The company’s retiree medical obligations are measured as of June 30. The following are the assumptions used in themeasurement of the APBO and retiree medical expense:
2005 2004 2003
Assumptions as of June 30Discount rate . . . . . . . . . . . . . . . . . . . . . . . . . . . . . . . . . . . . . . . . . . . . 5.00% 6.25% 6.00%Health care cost trend rate (weighted average) . . . . . . . . . . . . . . . 9.00% 9.50% 8.00%Ultimate health care trend rate . . . . . . . . . . . . . . . . . . . . . . . . . . . . 5.00% 5.00% 5.00%Year ultimate rate is reached . . . . . . . . . . . . . . . . . . . . . . . . . . . . . . 2011 2011 2011
Since the company measures its retiree medical obligations at June 30, the assumptions noted above are used to calculate the APBOas of June 30 of the current fiscal year and retiree medical expense for the subsequent fiscal year.
The discount rate is used to calculate the present value of the APBO. This rate is determined based on high-quality fixed incomeinvestments that match the duration of expected retiree medical benefits. The company has typically used the corporate AA/Aa bond ratefor this assumption. The health care cost trend rate represents the company’s expected annual rates of change in the cost of health care
ARVINMERITOR, INC.
NOTES TO CONSOLIDATED FINANCIAL STATEMENTS — (Continued)
65

benefits. The trend rate noted above represents a projection of health care costs as of the measurement date through 2011, at which timethe health care trend rate is projected to be 5.0 percent. The company’s projection for fiscal year 2006 is an increase in health care costsof 9.0 percent.
The APBO as of the June 30 measurement date is summarized as follows (in millions):
2005 2004
Retirees . . . . . . . . . . . . . . . . . . . . . . . . . . . . . . . . . . . . . . . . . . . . . . . . . . . . . . . . . . . . . . . . . . $397 $395Employees eligible to retire . . . . . . . . . . . . . . . . . . . . . . . . . . . . . . . . . . . . . . . . . . . . . . . . . . 11 10Employees not eligible to retire . . . . . . . . . . . . . . . . . . . . . . . . . . . . . . . . . . . . . . . . . . . . . . 47 38
Total . . . . . . . . . . . . . . . . . . . . . . . . . . . . . . . . . . . . . . . . . . . . . . . . . . . . . . . . . . . . . . . . $455 $443
The following reconciles the change in the APBO and the amounts included in the consolidated balance sheet (in millions):
2005 2004
APBO — beginning of year . . . . . . . . . . . . . . . . . . . . . . . . . . . . . . . . . . . . . . . . . . . . . . . . . $ 443 $ 682Service cost . . . . . . . . . . . . . . . . . . . . . . . . . . . . . . . . . . . . . . . . . . . . . . . . . . . . . . . . . . . . 3 4Interest cost . . . . . . . . . . . . . . . . . . . . . . . . . . . . . . . . . . . . . . . . . . . . . . . . . . . . . . . . . . . . 26 39Plan amendments . . . . . . . . . . . . . . . . . . . . . . . . . . . . . . . . . . . . . . . . . . . . . . . . . . . . . . . — (257)Actuarial losses . . . . . . . . . . . . . . . . . . . . . . . . . . . . . . . . . . . . . . . . . . . . . . . . . . . . . . . . . 45 37Benefit payments . . . . . . . . . . . . . . . . . . . . . . . . . . . . . . . . . . . . . . . . . . . . . . . . . . . . . . . (62) (62)
APBO — end of year . . . . . . . . . . . . . . . . . . . . . . . . . . . . . . . . . . . . . . . . . . . . . . . . . . . . . . . 455 443Items not yet recognized in the balance sheet:
Plan amendments . . . . . . . . . . . . . . . . . . . . . . . . . . . . . . . . . . . . . . . . . . . . . . . . . . . . . . . 258 282Actuarial (losses):
Discount rate changes . . . . . . . . . . . . . . . . . . . . . . . . . . . . . . . . . . . . . . . . . . . . . . . . . (149) (116)Health care cost trend rate . . . . . . . . . . . . . . . . . . . . . . . . . . . . . . . . . . . . . . . . . . . . . (117) (109)Demographic and other . . . . . . . . . . . . . . . . . . . . . . . . . . . . . . . . . . . . . . . . . . . . . . . . (184) (207)
Retiree medical liability . . . . . . . . . . . . . . . . . . . . . . . . . . . . . . . . . . . . . . . . . . . . . . . . . . . . . $ 263 $ 293
The previously mentioned plan changes resulted in a reduction in the APBO of $257 million in fiscal year 2004, which is beingamortized as a reduction of retiree medical expense over the average remaining service life of approximately 12 years. The companyrecognized a curtailment gain in fiscal 2004 of $5 million related to these plan changes.
The demographic and other actuarial losses relate to earlier than expected retirements due to certain plant closings andrestructuring actions. In accordance with SFAS No. 106, “Employers’ Accounting for Postretirement Benefits Other than Pensions”,a portion of the actuarial losses is not subject to amortization. The actuarial losses that are subject to amortization are generallyamortized over the average expected remaining service life, which is approximately 12 years. Union plan amendments are generallyamortized over the contract period, or 3 years.
The retiree medical liability is included in the consolidated balance sheet as follows (in millions):
September 30,
2005 2004
Current — included in compensation and benefits . . . . . . . . . . . . . . . . . . . . . . . . . . . . . $ 50 $ 65Long-term — included in retirement benefits . . . . . . . . . . . . . . . . . . . . . . . . . . . . . . . . . 213 228
Retiree medical liability . . . . . . . . . . . . . . . . . . . . . . . . . . . . . . . . . . . . . . . . . . . . . . . . . . . . . $263 $293
ARVINMERITOR, INC.
NOTES TO CONSOLIDATED FINANCIAL STATEMENTS — (Continued)
66

The components of retiree medical expense are as follows (in millions):
2005 2004 2003
Service cost . . . . . . . . . . . . . . . . . . . . . . . . . . . . . . . . . . . . . . . . . . . . . $ 3 $ 4 $ 4Interest cost . . . . . . . . . . . . . . . . . . . . . . . . . . . . . . . . . . . . . . . . . . . . 26 39 40Curtailment gain . . . . . . . . . . . . . . . . . . . . . . . . . . . . . . . . . . . . . . . . . — (5) —Amortization of —
Prior service cost . . . . . . . . . . . . . . . . . . . . . . . . . . . . . . . . . . . . . . (24) (4) (5)Actuarial gains and losses . . . . . . . . . . . . . . . . . . . . . . . . . . . . . . 27 23 17
Retiree medical expense . . . . . . . . . . . . . . . . . . . . . . . . . . . . . . . . . . $ 32 $57 $56
A one-percentage point change in the assumed health care cost trend rate for all years to, and including, the ultimate rate wouldhave the following effects (in millions):
2005 2004
Effect on total service and interest cost1% Increase . . . . . . . . . . . . . . . . . . . . . . . . . . . . . . . . . . . . . . . . . . . . . . . . . . . . . . . . . . . . $ 3 $ 41% Decrease . . . . . . . . . . . . . . . . . . . . . . . . . . . . . . . . . . . . . . . . . . . . . . . . . . . . . . . . . . . (2) (4)
Effect on APBO1% Increase . . . . . . . . . . . . . . . . . . . . . . . . . . . . . . . . . . . . . . . . . . . . . . . . . . . . . . . . . . . . 38 371% Decrease . . . . . . . . . . . . . . . . . . . . . . . . . . . . . . . . . . . . . . . . . . . . . . . . . . . . . . . . . . . (35) (34)
The company expects future benefit payments as follows (in millions):
Fiscal 2006 . . . . . . . . . . . . . . . . . . . . . . . . . . . . . . . . . . . . . . . . . . . . . . . . . . . . . . . . . . . . . . . . . . . . . . . . . . . $ 50Fiscal 2007 . . . . . . . . . . . . . . . . . . . . . . . . . . . . . . . . . . . . . . . . . . . . . . . . . . . . . . . . . . . . . . . . . . . . . . . . . . . 40Fiscal 2008 . . . . . . . . . . . . . . . . . . . . . . . . . . . . . . . . . . . . . . . . . . . . . . . . . . . . . . . . . . . . . . . . . . . . . . . . . . . 39Fiscal 2009 . . . . . . . . . . . . . . . . . . . . . . . . . . . . . . . . . . . . . . . . . . . . . . . . . . . . . . . . . . . . . . . . . . . . . . . . . . . 38Fiscal 2010 . . . . . . . . . . . . . . . . . . . . . . . . . . . . . . . . . . . . . . . . . . . . . . . . . . . . . . . . . . . . . . . . . . . . . . . . . . . 36Fiscal 2011 – 2015 . . . . . . . . . . . . . . . . . . . . . . . . . . . . . . . . . . . . . . . . . . . . . . . . . . . . . . . . . . . . . . . . . . . . 150
20. RETIREMENT PENSION PLANS
The company sponsors defined benefit pension plans that cover most of its U.S. employees and certain non-U.S. employees.Pension benefits for salaried employees are based on years of credited service and compensation. Pension benefits for hourlyemployees are based on years of service and specified benefit amounts. The company’s funding policy provides that annualcontributions to the pension trusts will be at least equal to the minimum amounts required by ERISA in the U.S. and the actuarialrecommendations or statutory requirements in other countries.
Certain of the company’s non-U.S. subsidiaries provide limited non-pension benefits to retirees in addition to government-sponsored programs. The cost of these programs is not significant to the company. Most retirees outside the U.S. are covered bygovernment-sponsored and administered programs.
The company’s pension obligations are measured as of June 30. The U.S. plans include a qualified and non-qualified pensionplan. The non-U.S. plans include plans primarily in the United Kingdom, Canada and Germany.
ARVINMERITOR, INC.
NOTES TO CONSOLIDATED FINANCIAL STATEMENTS — (Continued)
67

The following are the assumptions used in the measurement of the projected benefit obligation (PBO) and net periodicpension expense:
U.S. Plans
2005 2004 2003
Assumptions as of June 30Discount Rate . . . . . . . . . . . . . . . . . . . . . . . . . . . . . . . . . . . . . . . . . 5.30% 6.25% 6.00%Assumed return on plan assets . . . . . . . . . . . . . . . . . . . . . . . . . 8.50% 8.50% 8.50%Rate of compensation increase . . . . . . . . . . . . . . . . . . . . . . . . . . 3.75% 3.75% 3.75%
Non U.S. Plans
2005 2004 2003
Assumptions as of June 30Discount Rate . . . . . . . . . . . . . . . . . . . . . . . . . . . . . . . . . 4.00%–5.00% 5.50%–6.25% 5.50%–6.25%Assumed return on plan assets . . . . . . . . . . . . . . . . . 7.75%–8.50% 8.00%–8.50% 8.00%–8.50%Rate of compensation increase . . . . . . . . . . . . . . . . . . 3.00%–3.50% 3.00%–3.75% 3.00%–3.50%
Since the company measures its pension obligations at June 30, the assumptions noted above are used to calculate the PBOas of June 30 of the current fiscal year and net periodic pension expense for the subsequent fiscal year.
The discount rate is used to calculate the present value of the PBO. The rate used reflects a rate of return on high-quality fixedincome investments that match the duration of expected benefit payments. The company uses a portfolio of long-term corporate AA/Aabonds that match the duration of the expected benefit payments to establish the discount rate for this assumption.
The assumed return on plan assets is used to determine net periodic pension expense. The rate of return assumptions are basedon projected long-term market returns for the various asset classes in which the plans are invested, weighted by the target assetallocations. An incremental amount for active plan asset management, where appropriate, is included in the rate of return assumption.The return assumption is reviewed annually.
The rate of compensation increase represents the long-term assumption for expected increases to salaries for pay-related plans.
ARVINMERITOR, INC.
NOTES TO CONSOLIDATED FINANCIAL STATEMENTS — (Continued)
68

The following table reconciles the change in the PBO and the change in plan assets (in millions):
2005 2004
U.S. Non U.S. Total U.S. Non U.S. Total
June 30 measurement datePBO — beginning of year . . . . . . . . . . . . . . . . . . . . . . . . . $ 873 $ 637 $1,510 $ 818 $ 549 $1,367
Service cost . . . . . . . . . . . . . . . . . . . . . . . . . . . . . . . . . . 23 16 39 26 15 41Interest cost . . . . . . . . . . . . . . . . . . . . . . . . . . . . . . . . . . 55 38 93 49 32 81Participant contributions . . . . . . . . . . . . . . . . . . . . . . . — 3 3 — 3 3Amendments . . . . . . . . . . . . . . . . . . . . . . . . . . . . . . . . . — — — 3 4 7Actuarial loss . . . . . . . . . . . . . . . . . . . . . . . . . . . . . . . . . 170 121 291 17 13 30Divestitures . . . . . . . . . . . . . . . . . . . . . . . . . . . . . . . . . . . (5) — (5) 2 — 2Benefit payments . . . . . . . . . . . . . . . . . . . . . . . . . . . . . (46) (28) (74) (42) (27) (69)Foreign currency rate changes . . . . . . . . . . . . . . . . . . — (9) (9) — 48 48
PBO — end of year . . . . . . . . . . . . . . . . . . . . . . . . . . . . . . 1,070 778 1,848 873 637 1,510
Change in plan assets:Fair value of assets — beginning of year . . . . . . . . . . . 604 437 1,041 452 354 806
Actual return on plan assets . . . . . . . . . . . . . . . . . . . . 52 70 122 71 49 120Employer contributions . . . . . . . . . . . . . . . . . . . . . . . . . 77 25 102 123 27 150Participant contributions . . . . . . . . . . . . . . . . . . . . . . . — 3 3 — 3 3Benefit payments . . . . . . . . . . . . . . . . . . . . . . . . . . . . . (46) (32) (78) (42) (27) (69)Foreign currency rate changes . . . . . . . . . . . . . . . . . . — (1) (1) — 31 31
Fair value of assets — end of year . . . . . . . . . . . . . . . . . 687 502 1,189 604 437 1,041
Unfunded status . . . . . . . . . . . . . . . . . . . . . . . . . . . . . . . . . $ (383) $(276) $ (659) $(269) $(200) $ (469)
In fiscal 2005, the increase to actuarial losses (see table below) relates primarily to the reduction in the discount rateassumptions. In accordance with SFAS No. 87, “Employers’ Accounting for Pensions”, a portion of the actuarial losses is not subjectto amortization. The actuarial losses that are subject to amortization are generally amortized over the expected remaining service life,which ranges from 12 to 18 years, depending on the plan. The decrease in the discount rate was the primary reason for the increasein the unfunded status of the U.S. plans at September 30, 2005. In accordance with SFAS 87, the company utilizes a market-relatedvalue of assets, which recognizes changes in the fair value of assets over a five-year period.
In recognition of the long-term nature of the liabilities of the pension plans, the company has targeted an asset allocation strategythat intends to promote asset growth while maintaining an acceptable level of risk over the long-term. Asset-liability studies areperformed periodically to validate the continued appropriateness of these asset allocation targets. The asset allocation for theU.S. plan is targeted at 70–75 percent equity securities, 20–25 percent debt securities, and 0–5 percent alternative assets. The targetasset allocation ranges for the non-U.S. plans are 65–75 percent equity securities, 20–35 percent debt securities, and 0–5 percentreal estate.
The investment strategies for the pension plans are designed to achieve an appropriate diversification of investments as wellas safety and security of the principal invested. Assets invested are allocated to certain global sub-asset categories within prescribedranges in order to promote international diversification across security type, issuer type, investment style, industry group, andeconomic sector. Assets of the plans are both actively and passively managed. Policy limits are placed on the percentage of planassets that can be invested in a security of any single issuer and minimum credit quality standards are established for debt securities.ArvinMeritor securities comprised less than one half of one percent of the value of our worldwide pension assets during 2005and 2004.
ARVINMERITOR, INC.
NOTES TO CONSOLIDATED FINANCIAL STATEMENTS — (Continued)
69

The weighted average asset allocation for the U.S. and non U.S. pension plans are as follows:
2005 2004
U.S. Non U.S. U.S. Non U.S.
Equity securities . . . . . . . . . . . . . . . . . . . . . . . . . . . . . . . . . . . 74.2% 71.6% 73.9% 73.5%Debt securities . . . . . . . . . . . . . . . . . . . . . . . . . . . . . . . . . . . . 24.6 24.8 24.6 22.9Real estate . . . . . . . . . . . . . . . . . . . . . . . . . . . . . . . . . . . . . . . — 3.2 — 3.4Other . . . . . . . . . . . . . . . . . . . . . . . . . . . . . . . . . . . . . . . . . . . . 1.2 0.4 1.5 0.2
Total . . . . . . . . . . . . . . . . . . . . . . . . . . . . . . . . . . . . . . . . . . . . . 100.0% 100.0% 100.0% 100.0%
The following reconciles the funded status with the amount included in the consolidated balance sheet (in millions):
2005 2004
U.S. Non U.S. Total U.S. Non U.S. Total
June 30 measurement dateUnfunded status . . . . . . . . . . . . . . . . . . . . . . . . . . . . . . . . . $(383) $(276) $(659) $(269) $(200) $(469)Items not yet recognized in balance sheet:
Actuarial losses . . . . . . . . . . . . . . . . . . . . . . . . . . . . . . . 518 348 866 374 268 642Prior service cost . . . . . . . . . . . . . . . . . . . . . . . . . . . . . . 3 8 11 7 13 20Initial net asset . . . . . . . . . . . . . . . . . . . . . . . . . . . . . . . . — (2) (2) — (4) (4)
Net amount recognized . . . . . . . . . . . . . . . . . . . . . . . . . . . $ 138 $ 78 $ 216 $ 112 $ 77 $ 189
SFAS 87 requires a company to record a minimum liability that is at least equal to the unfunded accumulated benefit obligation.The additional minimum pension liability, net of a deferred tax asset, is charged to accumulated other comprehensive loss. AtSeptember 30, 2005 and 2004, the company’s additional minimum pension liability was $436 million and $293 million, respectively.
Amounts included in the consolidated balance sheet at September 30 were comprised of the following (in millions):
2005 2004
U.S. Non U.S. Total U.S. Non U.S. Total
Prepaid pension asset . . . . . . . . . . . . . . . . . . . . . . . . . . . . $ — $ 26 $ 26 $ — $ 23 $ 23Pension liability . . . . . . . . . . . . . . . . . . . . . . . . . . . . . . . . . . (290) (193) (483) (198) (122) (320)Deferred tax asset on minimum pension liability . . . . . 162 58 220 117 49 166Accumulated other comprehensive loss . . . . . . . . . . . . . 263 173 436 187 106 293Intangible asset and other . . . . . . . . . . . . . . . . . . . . . . . . 3 7 10 6 16 22Minority interest liability . . . . . . . . . . . . . . . . . . . . . . . . . . . — 7 7 — 5 5
Net amount recognized . . . . . . . . . . . . . . . . . . . . . . . . . . . $ 138 $ 78 $ 216 $ 112 $ 77 $ 189
The pension liability is included in Retirement Benefits in the consolidated balance sheet as follows (in millions):
September 30,
2005 2004
Pension liability . . . . . . . . . . . . . . . . . . . . . . . . . . . . . . . . . . . . . . . . . . . . . . . . . . . . . . . . . . . . $483 $320Retiree medical liability — long term (see Note 19) . . . . . . . . . . . . . . . . . . . . . . . . . . . . 213 228Other . . . . . . . . . . . . . . . . . . . . . . . . . . . . . . . . . . . . . . . . . . . . . . . . . . . . . . . . . . . . . . . . . . . . 58 35
Retirement Benefits . . . . . . . . . . . . . . . . . . . . . . . . . . . . . . . . . . . . . . . . . . . . . . . . . . . . . . . . $754 $583
ARVINMERITOR, INC.
NOTES TO CONSOLIDATED FINANCIAL STATEMENTS — (Continued)
70

In accordance with SFAS No. 132(R) “Employer’s Disclosures about Pensions and Other Postretirement Benefits”, the PBO,accumulated benefit obligation (ABO) and fair value of plan assets is required to be disclosed for all plans where the ABO is in excessof plan assets. The difference between the PBO and ABO is that the PBO includes projected compensation increases.
Additional information is as follows (in millions):
2005 2004
ABOExceedsAssets
AssetsExceed
ABO Total
ABOExceedsAssets
AssetsExceed
ABO Total
PBO . . . . . . . . . . . . . . . . . . . . . . . . . . . . . . . . . . . . . . $1,830 $18 $1,848 $1,496 $14 $1,510ABO . . . . . . . . . . . . . . . . . . . . . . . . . . . . . . . . . . . . . . 1,641 17 1,658 1,333 13 1,346Plan Assets . . . . . . . . . . . . . . . . . . . . . . . . . . . . . . . . 1,158 31 1,189 1,015 26 1,041
The components of net periodic pension expense are as follows (in millions):
2005 2004 2003
Service cost . . . . . . . . . . . . . . . . . . . . . . . . . . . . . . . . . . . . . . . . . . . . . $ 39 $ 41 $ 35Interest cost . . . . . . . . . . . . . . . . . . . . . . . . . . . . . . . . . . . . . . . . . . . . 93 81 74Assumed rate of return on plan assets . . . . . . . . . . . . . . . . . . . . . . (94) (85) (78)Amortization of prior service cost . . . . . . . . . . . . . . . . . . . . . . . . . . 10 7 5Amortization of transition asset . . . . . . . . . . . . . . . . . . . . . . . . . . . . (2) (1) (2)Curtailment . . . . . . . . . . . . . . . . . . . . . . . . . . . . . . . . . . . . . . . . . . . . . — 4 —Recognized actuarial loss . . . . . . . . . . . . . . . . . . . . . . . . . . . . . . . . . 32 26 9
Net periodic pension expense . . . . . . . . . . . . . . . . . . . . . . . . . . . . . $ 78 $ 73 $ 43
In connection with the company’s sale of the CVS Kenton, OH facility (see Note 5), the company recognized a curtailment lossof $4 million in fiscal year 2004.
Information about the expected cash flows for the U.S. and non-U.S. pension plans is as follows (in millions):
U.S. Non U.S. Total
Employer contributions:Fiscal 2006 . . . . . . . . . . . . . . . . . . . . . . . . . . . . . . . . . . . . . . . . . . . . . $ 77 $ 46 $123Benefit payments:Fiscal 2006 . . . . . . . . . . . . . . . . . . . . . . . . . . . . . . . . . . . . . . . . . . . . . 47 28 75Fiscal 2007 . . . . . . . . . . . . . . . . . . . . . . . . . . . . . . . . . . . . . . . . . . . . . 48 29 77Fiscal 2008 . . . . . . . . . . . . . . . . . . . . . . . . . . . . . . . . . . . . . . . . . . . . . 48 29 77Fiscal 2009 . . . . . . . . . . . . . . . . . . . . . . . . . . . . . . . . . . . . . . . . . . . . . 49 30 79Fiscal 2010 . . . . . . . . . . . . . . . . . . . . . . . . . . . . . . . . . . . . . . . . . . . . . 51 31 82Fiscal 2011–2015 . . . . . . . . . . . . . . . . . . . . . . . . . . . . . . . . . . . . . . . 287 166 453
The company also sponsors certain defined contribution savings plans for eligible employees. Expense related to these planswas $12 million, $11 million and $13 million for fiscal years 2005, 2004 and 2003, respectively.
ARVINMERITOR, INC.
NOTES TO CONSOLIDATED FINANCIAL STATEMENTS — (Continued)
71

21. INCOME TAXES
The components of the (Benefit) provision for Income Taxes are summarized as follows (in millions):
2005 2004 2003
Current tax expense (benefit):U.S. . . . . . . . . . . . . . . . . . . . . . . . . . . . . . . . . . . . . . . . . . . . . . . . . . $ 22 $ 16 $ 25Foreign . . . . . . . . . . . . . . . . . . . . . . . . . . . . . . . . . . . . . . . . . . . . . . 90 8 61State and local . . . . . . . . . . . . . . . . . . . . . . . . . . . . . . . . . . . . . . . . 2 1 (5)
Total current tax expense . . . . . . . . . . . . . . . . . . . . . . . . . . . . 114 25 81
Deferred tax expense (benefit):U.S. . . . . . . . . . . . . . . . . . . . . . . . . . . . . . . . . . . . . . . . . . . . . . . . . . (98) (28) 16Foreign . . . . . . . . . . . . . . . . . . . . . . . . . . . . . . . . . . . . . . . . . . . . . . (15) 38 (53)State and local . . . . . . . . . . . . . . . . . . . . . . . . . . . . . . . . . . . . . . . . (6) 9 1
Total deferred tax expense (benefit) . . . . . . . . . . . . . . . . . . . (119) 19 (36)
(Benefit) provision for income taxes . . . . . . . . . . . . . . . . . . . . . . . . $ (5) $ 44 $ 45
The deferred tax expense or benefit represents tax effects of current year deductions or items of income that will be recognizedin future periods for tax purposes. The deferred tax benefit primarily represents the tax benefit of current year net operating lossesand tax credits carried forward.
Net current and non-current deferred income tax assets included in the consolidated balance sheet consist of the tax effectsof temporary differences related to the following (in millions):
September 30,
2005 2004
Compensation and benefits . . . . . . . . . . . . . . . . . . . . . . . . . . . . . . . . . . . . . . . . . . . . . . . . . $ 61 $ 55Product warranties . . . . . . . . . . . . . . . . . . . . . . . . . . . . . . . . . . . . . . . . . . . . . . . . . . . . . . . . . 7 23Inventory costs . . . . . . . . . . . . . . . . . . . . . . . . . . . . . . . . . . . . . . . . . . . . . . . . . . . . . . . . . . . . 4 (3)Receivables . . . . . . . . . . . . . . . . . . . . . . . . . . . . . . . . . . . . . . . . . . . . . . . . . . . . . . . . . . . . . . . 12 12Other, net . . . . . . . . . . . . . . . . . . . . . . . . . . . . . . . . . . . . . . . . . . . . . . . . . . . . . . . . . . . . . . . . 20 10
Subtotal — current deferred income taxes — asset . . . . . . . . . . . . . . . . . . . . . . . . . 104 97
Loss and credit carryforwards . . . . . . . . . . . . . . . . . . . . . . . . . . . . . . . . . . . . . . . . . . . . . . . 485 388Retiree medical costs . . . . . . . . . . . . . . . . . . . . . . . . . . . . . . . . . . . . . . . . . . . . . . . . . . . . . . 80 87Pensions . . . . . . . . . . . . . . . . . . . . . . . . . . . . . . . . . . . . . . . . . . . . . . . . . . . . . . . . . . . . . . . . . 94 53Taxes on undistributed income . . . . . . . . . . . . . . . . . . . . . . . . . . . . . . . . . . . . . . . . . . . . . . (57) (55)Property . . . . . . . . . . . . . . . . . . . . . . . . . . . . . . . . . . . . . . . . . . . . . . . . . . . . . . . . . . . . . . . . . . (24) (27)Intangible assets . . . . . . . . . . . . . . . . . . . . . . . . . . . . . . . . . . . . . . . . . . . . . . . . . . . . . . . . . . . (8) 3Investment basis difference . . . . . . . . . . . . . . . . . . . . . . . . . . . . . . . . . . . . . . . . . . . . . . . . . 34 —Other . . . . . . . . . . . . . . . . . . . . . . . . . . . . . . . . . . . . . . . . . . . . . . . . . . . . . . . . . . . . . . . . . . . . 83 13
Subtotal — non-current deferred income taxes — asset . . . . . . . . . . . . . . . . . . . . . 687 462
Total current and non-current deferred income taxes — asset . . . . . . . . . . . . . . . . . . . 791 559Less: Valuation allowances . . . . . . . . . . . . . . . . . . . . . . . . . . . . . . . . . . . . . . . . . . . . . . . (148) (93)
Net deferred income taxes — asset . . . . . . . . . . . . . . . . . . . . . . . . . . . . . . . . . . . . . . . . . . $ 643 $466
ARVINMERITOR, INC.
NOTES TO CONSOLIDATED FINANCIAL STATEMENTS — (Continued)
72

Net current and non-current deferred income tax assets are included in the consolidated balance sheet as follows (in millions):
September 30,
2005 2004
Other current assets (see Note 9) . . . . . . . . . . . . . . . . . . . . . . . . . . . . . . . . . . . . . . . . . . . . $112 $117Other current liabilities (see Note 13) . . . . . . . . . . . . . . . . . . . . . . . . . . . . . . . . . . . . . . . . . (21) (20)
Net current deferred income taxes — asset . . . . . . . . . . . . . . . . . . . . . . . . . . . . . . . . 91 97
Other assets (see Note 11) . . . . . . . . . . . . . . . . . . . . . . . . . . . . . . . . . . . . . . . . . . . . . . . . . . 575 428Other liabilities (see Note 14) . . . . . . . . . . . . . . . . . . . . . . . . . . . . . . . . . . . . . . . . . . . . . . . . (23) (59)
Net non-current deferred income taxes — asset . . . . . . . . . . . . . . . . . . . . . . . . . . . . $552 $369
Management believes it is more likely than not that current and non-current deferred tax assets will be realized. Significantfactors considered by management in its determination of the probability of the realization of the deferred tax benefits include: (a)historical operating results, (b) expectations of future earnings, (c) tax planning strategies, and (d) the extended period of time overwhich the retiree medical and pension liabilities will be paid. The valuation allowance represents the amount of tax benefits relatedto net operating loss and tax credit carryforwards, which management believes are not likely to be realized. The carryforward periodsfor $344 million of net operating losses and tax credit carryforwards expire between fiscal years 2006 and 2025. The carryforwardperiod for the remaining net operating losses and tax credits is indefinite.
The company’s (benefit) provision for income taxes was different from the (benefit) provision for income taxes at the U.S. statutoryrate for the reasons set forth below (in millions):
2005 2004 2003
Provision for income taxes at statutory tax rate of 35% . . . . . . . . . . . . . $ 11 $ 63 $ 53State and local income taxes . . . . . . . . . . . . . . . . . . . . . . . . . . . . . . . . . . . . 7 (6) (5)Foreign income taxes . . . . . . . . . . . . . . . . . . . . . . . . . . . . . . . . . . . . . . . . . . (28) (21) (8)Tax audit settlements . . . . . . . . . . . . . . . . . . . . . . . . . . . . . . . . . . . . . . . . . . (8) — (6)Recognition of basis differences . . . . . . . . . . . . . . . . . . . . . . . . . . . . . . . . . (34) (27) (33)Tax on undistributed foreign earnings . . . . . . . . . . . . . . . . . . . . . . . . . . . . 2 3 6Valuation allowance . . . . . . . . . . . . . . . . . . . . . . . . . . . . . . . . . . . . . . . . . . . . 55 35 30Other . . . . . . . . . . . . . . . . . . . . . . . . . . . . . . . . . . . . . . . . . . . . . . . . . . . . . . . . (10) (3) 8
(Benefit) provision for income taxes . . . . . . . . . . . . . . . . . . . . . . . . . $ (5) $ 44 $ 45
For fiscal year 2005, the significant benefit for recognition of basis differences was related to a deferred tax asset recognizedfor the excess of the tax basis over the amount for financial reporting of investments in several of the company’s United Kingdomsubsidiaries. This asset is expected to reverse in the foreseeable future. For fiscal year 2004, the significant benefit for recognitionof basis differences was related to the following items: (a) favorable book and tax basis differences on the sale of APA, (b) favorableimpact of recently issued IRS regulations supporting recoverability of previously disallowed capital losses and (c) utilization ofpreviously unrecognized capital losses associated with our Brazilian restructuring. For fiscal year 2003, the significant benefit wasprimarily due to a restructuring of certain Brazilian operations which increased the long-term deferred tax asset associated withintangible assets.
The income tax provisions were calculated based upon the following components of income (loss) before income taxes(in millions):
2005 2004 2003
U.S. income (loss) . . . . . . . . . . . . . . . . . . . . . . . . . . . . . . . . . . . . . . . $(52) $ 17 $ 31Foreign income . . . . . . . . . . . . . . . . . . . . . . . . . . . . . . . . . . . . . . . . . . 83 162 119
Income before income taxes . . . . . . . . . . . . . . . . . . . . . . . . . $ 31 $179 $150
ARVINMERITOR, INC.
NOTES TO CONSOLIDATED FINANCIAL STATEMENTS — (Continued)
73

For fiscal 2005 and 2004, no provision has been made for U.S., state or additional foreign income taxes related toapproximately $822 million and $665 million, respectively of undistributed earnings of foreign subsidiaries that have been or areintended to be permanently reinvested. Quantification of the deferred tax liability, if any, associated with permanently reinvestedearnings is not practicable.
22. CONTINGENCIES
Environmental
Federal, state and local requirements relating to the discharge of substances into the environment, the disposal of hazardouswastes and other activities affecting the environment have, and will continue to have, an impact on the manufacturing operations ofthe company. The process of estimating environmental liabilities is complex and dependent on physical and scientific data at the site,uncertainties as to remedies and technologies to be used and the outcome of discussions with regulatory agencies. The companyrecords liabilities for environmental issues in the accounting period in which its responsibility and remediation plans are establishedand the cost can be reasonably estimated. At environmental sites in which more than one potentially responsible party has beenidentified, the company records a liability for its allocable share of costs related to its involvement with the site, as well as an allocableshare of costs related to insolvent parties or unidentified shares. At environmental sites in which ArvinMeritor is the only potentiallyresponsible party, the company records a liability for the total estimated costs of remediation before consideration of recovery frominsurers or other third parties.
The company has been designated as a potentially responsible party at seven Superfund sites, excluding sites as to which thecompany’s records disclose no involvement or as to which the company’s potential liability has been finally determined. Managementestimates the total reasonably possible costs the company could incur for the remediation of Superfund sites at September 30, 2005to be approximately $28 million, of which $11 million is recorded as a liability. During fiscal year 2005, the company recordedenvironmental remediation costs of $6 million resulting from a revised estimate to remediate a former Rockwell facility sold in 1990.
In addition to the Superfund sites, various other lawsuits, claims and proceedings have been asserted against the company,alleging violations of federal, state and local environmental protection requirements, or seeking remediation of alleged environmentalimpairments, principally at previously disposed-of properties. For these matters, management has estimated the total reasonablypossible costs the company could incur at September 30, 2005 to be approximately $52 million, of which $13 million is recordedas a liability. During fiscal year 2004, the company recorded environmental remediation costs of $11 million resulting from anagreement with the Environmental Protection Agency to remediate a different former Rockwell facility that was sold in 1985.
Included in the company’s environmental liabilities are costs for on-going operating, maintenance and monitoring atenvironmental sites in which remediation has been put into place. This liability is discounted using a discount rate of 5-percent andis approximately $6 million at September 30, 2005. The undiscounted estimate of these costs is approximately $11 million.
Following are the components of the Superfund and Non-Superfund environmental reserves (in millions):
SuperfundSites
Non-SuperfundSites Total
Balance at September 30, 2004 . . . . . . . . . . . . . . . . . . . . . . . . . . . $ 6 $ 28 $ 34Payments . . . . . . . . . . . . . . . . . . . . . . . . . . . . . . . . . . . . . . . . . . . . . . . (1) (12) (13)Reclass to property, plant and equipment . . . . . . . . . . . . . . . . . . . — (5) (5)Change in cost estimates . . . . . . . . . . . . . . . . . . . . . . . . . . . . . . . . . 6 2 8
Balance at September 30, 2005 . . . . . . . . . . . . . . . . . . . . . . . . . . . $11 $ 13 $ 24
A portion of the environmental reserves is included in Other Current Liabilities (see Note 13), with the majority of the amountsrecorded in Other Liabilities (see Note 14).
The actual amount of costs or damages for which the company may be held responsible could materially exceed the foregoingestimates because of uncertainties, including the financial condition of other potentially responsible parties, the success of theremediation and other factors that make it difficult to predict actual costs accurately. However, based on management’s assessment,
ARVINMERITOR, INC.
NOTES TO CONSOLIDATED FINANCIAL STATEMENTS — (Continued)
74

after consulting with outside advisors that specialize in environmental matters, and subject to the difficulties inherent in estimatingthese future costs, the company believes that its expenditures for environmental capital investment and remediation necessary tocomply with present regulations governing environmental protection and other expenditures for the resolution of environmental claimswill not have a material adverse effect on the company’s business, financial condition or results of operations. In addition, in futureperiods, new laws and regulations, changes in the remediation plan, advances in technology and additional information about theultimate clean-up remedy could significantly change the company’s estimates. Management cannot assess the possible effect ofcompliance with future requirements.
Asbestos
Maremont Corporation (“Maremont”), a subsidiary of ArvinMeritor, manufactured friction products containing asbestos from1953 through 1977, when it sold its friction product business. Arvin acquired Maremont in 1986. Maremont and many othercompanies are defendants in suits brought by individuals claiming personal injuries as a result of exposure to asbestos-containingproducts. Maremont had approximately 61,700 and 74,000 pending asbestos-related claims at September 30, 2005 and 2004,respectively. The decrease in pending claims since September 30, 2004 is primarily due to the settlement of 8,500 claims in onejurisdiction. Although Maremont has been named in these cases, in the cases where actual injury has been alleged very few claimantshave established that a Maremont product caused their injuries. Plaintiffs’ lawyers often sue dozens or even hundreds of defendantsin individual lawsuits on behalf of hundreds or thousands of claimants, seeking damages against all named defendants irrespectiveof the disease or injury and irrespective of any causal connection with a particular product. For these reasons, Maremont does notconsider the number of claims filed or the damages alleged to be a meaningful factor in determining its asbestos-related liability.
Maremont’s asbestos-related reserves and corresponding asbestos-related recoveries are summarized as follows (in millions):
September 30,
2005 2004
Pending and future claims . . . . . . . . . . . . . . . . . . . . . . . . . . . . . . . . . . . . . . . . . . . . . . . . . . $50 $72Shortfall and other . . . . . . . . . . . . . . . . . . . . . . . . . . . . . . . . . . . . . . . . . . . . . . . . . . . . . . . . . 4 2
Total asbestos-related reserves . . . . . . . . . . . . . . . . . . . . . . . . . . . . . . . . . . . . . . . . . $54 $74
Asbestos-related recoveries . . . . . . . . . . . . . . . . . . . . . . . . . . . . . . . . . . . . . . . . . . . . $35 $72
A portion of the asbestos-related recoveries and reserves are included in Other Current Assets and Liabilities, with the majorityof the amounts recorded in Other Noncurrent Assets and Liabilities (see Notes 9, 11, 13 and 14).
Prior to February 2001, Maremont participated in the Center for Claims Resolution (“CCR”) and shared with other CCR membersin the payments of defense and indemnity costs for asbestos-related claims. The CCR handled the resolution and processing ofasbestos claims on behalf of its members until February 2001, when it was reorganized and discontinued negotiating sharedsettlements. Upon dissolution of the CCR in February 2001, Maremont began handling asbestos-related claims through its owndefense counsel and has taken a more aggressive defensive approach that involves examining the merits of each asbestos-relatedclaim. Although the company expects legal defense costs to continue at higher levels than when it participated in the CCR, the companybelieves its litigation strategy has reduced the average indemnity cost per claim. Billings to insurance companies for indemnity anddefense costs of resolved cases were $12 million in fiscal years 2005 and 2004.
Pending and Future Claims: At the end of fiscal year 2004 and through the third quarter of fiscal year 2005, Maremontestablished reserves for pending asbestos-related claims that reflected internal estimates of its defense and indemnity costs. Theseestimates were based on the history and nature of filed claims to date and Maremont’s experience. Maremont developed experiencefactors for estimating indemnity and litigation costs using data on actual experience in resolving claims since dissolution of the CCRand its assessment of the nature of the claims. Maremont did not accrue reserves for its potential liability for asbestos-related claimsthat may be asserted against it in the future, because it did not have sufficient information to make a reasonable estimate of theseunknown claims.
In the fourth quarter of fiscal year 2005, Maremont engaged Bates White LLC (Bates White), a consulting firm with extensiveexperience estimating costs associated with asbestos litigation, to assist with determining whether it would be possible to estimate
ARVINMERITOR, INC.
NOTES TO CONSOLIDATED FINANCIAL STATEMENTS — (Continued)
75

the cost of resolving pending and future asbestos-related claims that have been, and could reasonably be expected to be, filed againstMaremont, as well as the cost of Maremont’s share of committed but unpaid settlements entered into by the CCR. Although it is notpossible to estimate the full range of costs because of various uncertainties, Bates White advised Maremont that it would be able todetermine an estimate of probable costs to resolve pending and future asbestos-related claims, based on historical data and certainassumptions with respect to events that occur in the future.
The resulting study by Bates White provided an estimate of the reasonably possible range of Maremont’s obligation for asbestospersonal injury claims over the next three to four years of $36 million to $55 million. After consultation with Bates White, Maremontdetermined that the most likely and probable liability for pending and future claims over the next four years is $50 million. The ultimatecost of resolving pending and future claims is estimated based on the history of claims and expenses for plaintiffs represented by lawfirms in jurisdictions with an established history with Maremont.
The following assumptions were made by Maremont after consultation with Bates White and are included in their study:
• Pending and future claims were estimated for a four year period ending in fiscal year 2009. Maremont believes that thelitigation environment will change significantly in several years, and that the reliability of estimates of future probableexpenditures in connection with asbestos-related personal injury claims declines for each year further in the future. As aresult, estimating a probable liability beyond four years is difficult and uncertain;
• The ultimate cost of resolving pending and future claims filed in Madison County, Illinois, a jurisdiction where a substantialamount of Maremont’s claims are filed, will decline to reflect average outcomes throughout the United States. Additionally,defense and processing costs in Madison County, Illinois will be reduced from current levels;
• Defense and processing costs for pending and future claims filed outside of Madison County, Illinois will be at the levelconsistent with Maremont’s prior experience; and
• The ultimate cost of resolving nonmalignant claims with plaintiff’s law firms in jurisdictions without an established history withMaremont cannot be reasonably estimated.Recent changes in tort lawand insufficient settlementhistorymakeestimatinga liabilityfor these nonmalignant claims difficult and uncertain.
The significant reduction in the liability since September 30, 2004 is a result of both an overall reduction in pending claims andthe results from the study by Bates White, which estimates a value for pending and future claims that are expected to be settled.Maremont previously estimated a settlement value on all pending claims.
Shortfall and other: Several former members of the CCR have filed for bankruptcy protection, and these members have failed,or may fail, to pay certain financial obligations with respect to settlements that were reached while they were CCR members. Maremontis subject to claims for payment of a portion of these defaulted member shares (shortfall). In an effort to resolve the affectedsettlements, Maremont has entered into negotiations with plaintiffs’ attorneys, and an estimate of Maremont’s obligation for theshortfall is included in the total asbestos-related reserves. In addition, Maremont and its insurers are engaged in legal proceedingsto determine whether existing insurance coverage should reimburse any potential liability related to this issue. Payments by thecompany related to shortfall and other were not significant in fiscal year 2005 and were $4 million in fiscal year 2004.
Recoveries: Maremont has insurance that reimburses a substantial portion of the costs incurred defending against asbestos-related claims. The coverage also reimburses Maremont for any indemnity paid on those claims. The coverage is provided by severalinsurance carriers based on insurance agreements in place. Incorporating historical information with respect to buy-outs andsettlements of coverage, and excluding any policies in dispute, the insurance receivable related to asbestos-related liabilities is $35million. The difference between the estimated liability and insurance receivable is related to proceeds received from settled insurancepolicies and liabilities for shortfall and other. Certain insurance policies have been settled in cash prior to the ultimate settlement ofrelated asbestos liabilities. Amounts received from insurance settlements generally reduce recorded insurance receivables.Receivables for policies in dispute are not recorded. In fiscal year 2005, the company received $12 million associated with thesettlement of certain insurance policies.
The amounts recorded for the asbestos-related reserves and recoveries from insurance companies are based upon assumptionsand estimates derived from currently known facts. All such estimates of liabilities and recoveries for asbestos-related claims are
ARVINMERITOR, INC.
NOTES TO CONSOLIDATED FINANCIAL STATEMENTS — (Continued)
76

subject to considerable uncertainty because such liabilities and recoveries are influenced by variables that are difficult to predict. Thefuture litigation environment for Maremont could change significantly from its past experience, due, for example, to changes in themix of claims filed against Maremont in terms of plaintiffs’ law firm, jurisdiction and disease; legislative or regulatory developments;Maremont’s approach to defending claims; or payments to plaintiffs from other defendants. Estimated recoveries are influenced bycoverage issues among insurers, and the continuing solvency of various insurance companies. If the assumptions with respect to thenature of pending claims, the cost to resolve claims and the amount of available insurance prove to be incorrect, the actual amountof liability for Maremont’s liability asbestos-related claims, and the effect on the company, could differ materially from currentestimates and, therefore, could have a material impact on the company’s financial position and results of operations.
Rockwell — ArvinMeritor, along with many other companies, has also been named as a defendant in lawsuits alleging personalinjury as a result of exposure to asbestos used in certain components of Rockwell products many years ago. Liability for these claimswas transferred to the company at the time of the spin-off of the automotive business to Meritor from Rockwell in 1997. Currentlythere are thousands of claimants in lawsuits that name the company, together with many other companies, as defendants. However,the company does not consider the number of claims filed or the damages alleged to be a meaningful factor in determining asbestos-related liabilities. A significant portion of the claims do not identify any of Rockwell’s products or specify which of the claimants, ifany, were exposed to asbestos attributable to Rockwell’s products, and past experience has shown that the vast majority of theclaimants will never identify any of Rockwell’s products. For those claimants who do show that they worked with Rockwell’s products,management nevertheless believes it has meritorious defenses, in substantial part due to the integrity of the products involved, theencapsulated nature of any asbestos-containing components, and the lack of any impairing medical condition on the part of manyclaimants. The company defends these cases vigorously. Historically, ArvinMeritor has been dismissed from the vast majority of theseclaims with no payment to claimants.
Rockwell maintained insurance coverage that management believes covers indemnity and defense costs, over and above self-insurance retentions, for most of these claims. The company has initiated claims against these carriers to enforce the insurancepolicies. Although the status of one carrier as a financially viable entity is in question, the company expects to recover the majorityof defense and indemnity costs it has incurred to date, over and above self-insured retentions, and a substantial portion of the costsfor defending asbestos claims going forward.
ArvinMeritor has not established reserves for pending or future claims or for corresponding recoveries for Rockwell-legacyasbestos-related claims and defense and indemnity costs related to these claims are expensed as incurred. Reserves have not beenestablished because management cannot reasonably estimate the ultimate liabilities for these costs, primarily because the companydoes not have a sufficient history of claims settlement and defense costs from which to develop reliable assumptions. The uncertaintiesof asbestos claim litigation and resolution of the litigation with the insurance companies make it difficult to predict accurately theultimate resolution of asbestos claims. That uncertainty is increased by the possibility of adverse rulings or new legislation affectingasbestos claim litigation or the settlement process. Subject to these uncertainties and based on the company’s experience defendingthese asbestos claims, the company does not believe these lawsuits will have a material adverse effect on its financial condition.Rockwell was not a member of the CCR and handled its asbestos-related claims using its own litigation counsel. As a result, thecompany does not have any additional potential liabilities for committed CCR settlements or shortfall (as described above) inconnection with the Rockwell-legacy cases.
Product Recall Campaign
Beginning in fiscal year 2002, the company recalled certain of its commercial vehicle axles equipped with TRW model 20-EDLtie rod ends because of potential safety-related defects in those ends. TRW, Inc. (TRW) manufactured the affected tie rod ends fromJune 1999 through June 2000 and supplied them to the company for incorporation into its axle products. The company estimatedthe cost of its recall of TRW model 20-EDL tie rod ends to be approximately $17 million and recorded a liability and offsetting receivablefor the estimated cost. In the fourth quarter of fiscal 2004, in anticipation of a settlement of this matter with TRW, the company recordeda charge of $4 million as a reduction of the receivable due from TRW at September 30, 2004. In December 2004, the company reachedan agreement with TRW settling this matter, resulting in no additional charges to the Company. See Note 13 for additional informationrelated to the company’s product warranties.
ARVINMERITOR, INC.
NOTES TO CONSOLIDATED FINANCIAL STATEMENTS — (Continued)
77

Indemnifications
The company has provided indemnifications in conjunction with certain transactions, primarily divestitures. These indemnitiesaddress a variety of matters, which may include environmental, tax, asbestos, and employment-related matters, and the periods ofindemnification vary in duration. The company’s maximum obligations under such indemnifications cannot be reasonably estimated.The company is not aware of any claims or other information that would give rise to material payments under such indemnifications.
Other
Various other lawsuits, claims and proceedings have been or may be instituted or asserted against the company, relating to theconduct of the company’s business, including those pertaining to product liability, intellectual property, safety and health, andemployment matters. Although the outcome of litigation cannot be predicted with certainty, and some lawsuits, claims or proceedingsmay be disposed of unfavorably to the company, management believes the disposition of matters that are pending will not have amaterial adverse effect on the company’s business, financial condition or results of operations.
23. BUSINESS SEGMENT INFORMATION
The company defines its operating segments as components of its business where separate financial information is available and isevaluatedregularlyby thechiefoperatingdecisionmaker indecidinghowtoallocateresourcesand inassessingperformance.Thecompany’schief operating decision maker (CODM) is the Chief Executive Officer.
The company has two reportable operating segments: Light Vehicle Systems (LVS) and Commercial Vehicle Systems (CVS). LVSis a major supplier of air and emission systems, aperture systems (roof and door systems), and undercarriage systems (suspensionand ride control systems and wheel products) for passenger cars, motorcycles and all-terrain vehicles, light trucks and sport utilityvehicles to original equipment manufacturers (OEMs). CVS supplies drivetrain systems and components, including axles anddrivelines, braking systems, suspension systems and exhaust and ride control products, for medium- and heavy-duty trucks, trailersand specialty vehicles to OEMs and the commercial vehicle aftermarket. The company’s previously reported LVA segment and Otheris reported in discontinued operations.
The company uses operating income as the primary basis for the CODM to evaluate the performance of each of the company’sreportable segments. The accounting policies of the segments are the same as those applied in the Consolidated Financial Statements.The company may allocate certain common costs, primarily corporate functions, between the segments differently than the companywould for stand alone financial information prepared in accordance with GAAP. These allocated costs include expenses for sharedservices such as information technology, finance, communications, legal and human resources. The company does not allocateinterest expense and equity in earnings of affiliates and no longer allocates certain legacy and other corporate costs not directlyassociated with the segments’ operating income. As a result, the company reclassified $11 million of legacy environmentalremediation costs for fiscal year 2004, from LVS’ previously reported operating income to environmental remediation costs.
Segment information is summarized as follows (in millions):
Sales:2005 2004 2003
Light Vehicle Systems . . . . . . . . . . . . . . . . . . . . . . . . . . . . . . . . . . . . . . . . . $4,849 $4,818 $4,301Commercial Vehicle Systems . . . . . . . . . . . . . . . . . . . . . . . . . . . . . . . . . . . 4,054 3,215 2,422
Total . . . . . . . . . . . . . . . . . . . . . . . . . . . . . . . . . . . . . . . . . . . . . . . . . . . . . . . . $8,903 $8,033 $6,723
ARVINMERITOR, INC.
NOTES TO CONSOLIDATED FINANCIAL STATEMENTS — (Continued)
78

Earnings:2005 2004 2003
Operating Income (Loss):Light Vehicle Systems . . . . . . . . . . . . . . . . . . . . . . . . . . . . . . . . . . . . . . $ (53) $ 123 $ 135Commercial Vehicle Systems . . . . . . . . . . . . . . . . . . . . . . . . . . . . . . . . 193 164 111
Segment operating income . . . . . . . . . . . . . . . . . . . . . . . . . . . . . . . . 140 287 246Environmental remediation costs . . . . . . . . . . . . . . . . . . . . . . . . . . . . . (7) (11) —Costs for withdrawn tender offer . . . . . . . . . . . . . . . . . . . . . . . . . . . . . — (16) —Unallocated corporate costs . . . . . . . . . . . . . . . . . . . . . . . . . . . . . . . . . (3) — —
Operating income . . . . . . . . . . . . . . . . . . . . . . . . . . . . . . . . . . . . . . . . 130 260 246Equity in earnings of affiliates . . . . . . . . . . . . . . . . . . . . . . . . . . . . . . . . 28 19 8Gain on sale of marketable securities . . . . . . . . . . . . . . . . . . . . . . . . . — 7 —Interest expense, net and other . . . . . . . . . . . . . . . . . . . . . . . . . . . . . . (127) (107) (104)
Income before income taxes . . . . . . . . . . . . . . . . . . . . . . . . . . . . . . . . . 31 179 150Benefit (provision) for income taxes . . . . . . . . . . . . . . . . . . . . . . . . . . . 5 (44) (45)Minority interests . . . . . . . . . . . . . . . . . . . . . . . . . . . . . . . . . . . . . . . . . . . (3) (8) (5)
Income from continuing operations . . . . . . . . . . . . . . . . . . . . . . . . . . . $ 33 $ 127 $ 100
Depreciation and Amortization: 2005 2004 2003
Light Vehicle Systems . . . . . . . . . . . . . . . . . . . . . . . . . . . . . . . . . . . . . . . . . $106 $112 $117Commercial Vehicle Systems . . . . . . . . . . . . . . . . . . . . . . . . . . . . . . . . . . . 76 71 68
Total . . . . . . . . . . . . . . . . . . . . . . . . . . . . . . . . . . . . . . . . . . . . . . . . . . . . . . . . $182 $183 $185
Capital Expenditures: 2005 2004 2003
Light Vehicle Systems . . . . . . . . . . . . . . . . . . . . . . . . . . . . . . . . . . . . . . . . . $101 $102 $116Commercial Vehicle Systems . . . . . . . . . . . . . . . . . . . . . . . . . . . . . . . . . . . 56 50 57
Total . . . . . . . . . . . . . . . . . . . . . . . . . . . . . . . . . . . . . . . . . . . . . . . . . . . . . . . . $157 $152 $173
Segment Assets: 2005 2004
Light Vehicle Systems . . . . . . . . . . . . . . . . . . . . . . . . . . . . . . . . . . . . . . . . . . . . . . . . . . . . . . . . . . . $2,317 $2,288Commercial Vehicle Systems . . . . . . . . . . . . . . . . . . . . . . . . . . . . . . . . . . . . . . . . . . . . . . . . . . . . . 2,121 1,938
Segment total assets . . . . . . . . . . . . . . . . . . . . . . . . . . . . . . . . . . . . . . . . . . . . . . . . . . . . . . . . . 4,438 4,226Corporate (1) . . . . . . . . . . . . . . . . . . . . . . . . . . . . . . . . . . . . . . . . . . . . . . . . . . . . . . . . . . . . . . . . . . . 901 798Discontinued operations . . . . . . . . . . . . . . . . . . . . . . . . . . . . . . . . . . . . . . . . . . . . . . . . . . . . . . . . . 531 615
Total . . . . . . . . . . . . . . . . . . . . . . . . . . . . . . . . . . . . . . . . . . . . . . . . . . . . . . . . . . . . . . . . . . . . . . . . . . $5,870 $5,639
(1) Corporate assets consist primarily of cash, taxes and prepaid pension costs. For fiscal years 2005 and 2004, segment assetsinclude $432 million and $365 million, respectively, of receivables sold to ARC under the accounts receivable securitization andfactoring agreements (see Note 6).
ARVINMERITOR, INC.
NOTES TO CONSOLIDATED FINANCIAL STATEMENTS — (Continued)
79

A summary of the changes in the carrying value of goodwill is as follows (in millions):
LVS CVS Total
Balance at September 30, 2004 . . . . . . . . . . . . . . . . . . . . . . . . . . . . . . . . $374 $434 $808Goodwill from AB Volvo acquisition . . . . . . . . . . . . . . . . . . . . . . . . . . . . . . — 4 4Foreign currency translation . . . . . . . . . . . . . . . . . . . . . . . . . . . . . . . . . . . . (6) (5) (11)
Balance at September 30, 2005 . . . . . . . . . . . . . . . . . . . . . . . . . . . . . . . . $368 $433 $801
Sales by geographic area are based on the location of the selling unit. Information on the company’s geographic areas issummarized as follows (in millions):
Sales by Geographic Area: 2005 2004 2003
U.S. . . . . . . . . . . . . . . . . . . . . . . . . . . . . . . . . . . . . . . . . . . . . . . . . . . . . . . . . . $3,497 $3,030 $2,608Canada . . . . . . . . . . . . . . . . . . . . . . . . . . . . . . . . . . . . . . . . . . . . . . . . . . . . . . 595 543 482Mexico . . . . . . . . . . . . . . . . . . . . . . . . . . . . . . . . . . . . . . . . . . . . . . . . . . . . . . 454 451 325
Total North America . . . . . . . . . . . . . . . . . . . . . . . . . . . . . . . . . . . . . . . . 4,546 4,024 3,415
Germany . . . . . . . . . . . . . . . . . . . . . . . . . . . . . . . . . . . . . . . . . . . . . . . . . . . . 823 738 619U.K. . . . . . . . . . . . . . . . . . . . . . . . . . . . . . . . . . . . . . . . . . . . . . . . . . . . . . . . . . 450 523 513France . . . . . . . . . . . . . . . . . . . . . . . . . . . . . . . . . . . . . . . . . . . . . . . . . . . . . . 701 494 376Other Europe . . . . . . . . . . . . . . . . . . . . . . . . . . . . . . . . . . . . . . . . . . . . . . . . . 1,394 1,409 1,085
Total Europe . . . . . . . . . . . . . . . . . . . . . . . . . . . . . . . . . . . . . . . . . . . . . . . 3,368 3,164 2,593
Asia/Pacific . . . . . . . . . . . . . . . . . . . . . . . . . . . . . . . . . . . . . . . . . . . . . . . . . . 408 397 347Other . . . . . . . . . . . . . . . . . . . . . . . . . . . . . . . . . . . . . . . . . . . . . . . . . . . . . . . 581 448 368
Total sales . . . . . . . . . . . . . . . . . . . . . . . . . . . . . . . . . . . . . . . . . . . . . . . . . . . $8,903 $8,033 $6,723
Assets by Geographic Area (excludes assets of discontinued operations):
2005 2004
U.S. . . . . . . . . . . . . . . . . . . . . . . . . . . . . . . . . . . . . . . . . . . . . . . . . . . . . . . . . . . . . . . . . . . . . . . . . . . . $2,263 $2,198Canada . . . . . . . . . . . . . . . . . . . . . . . . . . . . . . . . . . . . . . . . . . . . . . . . . . . . . . . . . . . . . . . . . . . . . . . . 294 268Mexico . . . . . . . . . . . . . . . . . . . . . . . . . . . . . . . . . . . . . . . . . . . . . . . . . . . . . . . . . . . . . . . . . . . . . . . . 157 155
Total North America . . . . . . . . . . . . . . . . . . . . . . . . . . . . . . . . . . . . . . . . . . . . . . . . . . . . . . . . . . 2,714 2,621
U.K. . . . . . . . . . . . . . . . . . . . . . . . . . . . . . . . . . . . . . . . . . . . . . . . . . . . . . . . . . . . . . . . . . . . . . . . . . . . 414 471Germany . . . . . . . . . . . . . . . . . . . . . . . . . . . . . . . . . . . . . . . . . . . . . . . . . . . . . . . . . . . . . . . . . . . . . . 501 493France . . . . . . . . . . . . . . . . . . . . . . . . . . . . . . . . . . . . . . . . . . . . . . . . . . . . . . . . . . . . . . . . . . . . . . . . 347 221Other Europe . . . . . . . . . . . . . . . . . . . . . . . . . . . . . . . . . . . . . . . . . . . . . . . . . . . . . . . . . . . . . . . . . . . 760 732
Total Europe . . . . . . . . . . . . . . . . . . . . . . . . . . . . . . . . . . . . . . . . . . . . . . . . . . . . . . . . . . . . . . . . . 2,022 1,917
Asia/Pacific . . . . . . . . . . . . . . . . . . . . . . . . . . . . . . . . . . . . . . . . . . . . . . . . . . . . . . . . . . . . . . . . . . . . 232 211Other . . . . . . . . . . . . . . . . . . . . . . . . . . . . . . . . . . . . . . . . . . . . . . . . . . . . . . . . . . . . . . . . . . . . . . . . . 371 275
Total assets . . . . . . . . . . . . . . . . . . . . . . . . . . . . . . . . . . . . . . . . . . . . . . . . . . . . . . . . . . . . . . . . . . . . $5,339 $5,024
Sales to DaimlerChrysler AG (which owns Chrysler, Mercedes-Benz AG and Freightliner Corporation) represented 21 percent,19 percent and 18 percent of the company’s sales in fiscal years 2005, 2004 and 2003, respectively. Sales to General MotorsCorporation comprised 10 percent, 13 percent and 14 percent of the company’s sales in fiscal 2005, 2004 and 2003, respectively.Sales to Ford Motor Company were below 10 percent in fiscal year 2005 and comprised 10 percent of the company’s sales in fiscalyears 2004 and 2003. Sales to Volkswagen comprised 10 percent of the company’s sales in fiscal years 2005, 2004 and 2003. Thesignificant financial deterioration, including bankruptcy, of any one of these customers could have a material adverse effect on the
ARVINMERITOR, INC.
NOTES TO CONSOLIDATED FINANCIAL STATEMENTS — (Continued)
80

company’s financial position and results of operation. No other customer comprised 10 percent or more of the company’s sales ineach of the three fiscal years ended September 30, 2005.
24. QUARTERLY FINANCIAL INFORMATION (UNAUDITED)
The following is a condensed summary of the company’s unaudited quarterly results of continuing operations for fiscal 2005and 2004. Per share amounts are based on the weighted average shares outstanding for that quarter. Earnings per share for the yearmay not equal the sum of the four fiscal quarters’ earnings per share due to changes in basic and diluted shares outstanding.
2005 Fiscal Quarters (Unaudited)
First Second Third Fourth 2005
(In millions, except share-related data)
Sales . . . . . . . . . . . . . . . . . . . . . . . . . . . . . . . . . . . . . . . . . . . $2,090 $2,276 $2,411 $2,126 $8,903Cost of sales . . . . . . . . . . . . . . . . . . . . . . . . . . . . . . . . . . . . 1,959 2,124 2,210 1,974 8,267Provision (benefit) for income taxes . . . . . . . . . . . . . . . . 4 (13) 18 (14) (5)Income (loss) from continuing operations . . . . . . . . . . . 12 (35) 44 12 33Net income (loss) . . . . . . . . . . . . . . . . . . . . . . . . . . . . . . . . 18 (33) 46 (19) 12Basic earnings (loss) per share from continuing
operations . . . . . . . . . . . . . . . . . . . . . . . . . . . . . . . . . . . . 0.18 (0.51) 0.64 0.17 0.48Diluted earnings (loss) per share from continuing
operations . . . . . . . . . . . . . . . . . . . . . . . . . . . . . . . . . . . . 0.17 (0.51) 0.64 0.17 0.47
Fourth quarter income from continuing operations included pre-tax restructuring costs of $36 million, and a pre-tax loss fromdebt extinguishment of $4 million. Fourth quarter net loss included an impairment charge of $28 million after-tax, or $0.40 per dilutedshare in LVA. Third quarter income from continuing operations included pre-tax restructuring costs of $7 million. Second quarter lossfrom continuing operations included pre-tax restructuring costs of $64 million; a pre-tax charge of $9 million resulting from the MGRover bankruptcy, and pre-tax environmental remediation costs of $6 million associated with a former Rockwell facility. First quarterincome from continuing operations included pre-tax restructuring costs of $10 million; a $4 million pre-tax gain on the divestitureof the Columbus, Indiana automotive stamping and components manufacturing business and a $5 million pre-tax charge associatedwith the bankruptcy of certain customers.
2004 Fiscal Quarters (Unaudited)
First Second Third Fourth 2004
(In millions, except share-related data)
Sales . . . . . . . . . . . . . . . . . . . . . . . . . . . . . . . . . . . . . . . . . . . $1,924 $1,996 $2,099 $2,014 $8,033Cost of sales . . . . . . . . . . . . . . . . . . . . . . . . . . . . . . . . . . . . 1,775 1,825 1,913 1,853 7,366Provision for income taxes . . . . . . . . . . . . . . . . . . . . . . . . 8 15 16 5 44Income from continuing operations . . . . . . . . . . . . . . . . . 15 40 42 30 127Net income . . . . . . . . . . . . . . . . . . . . . . . . . . . . . . . . . . . . . 19 41 51 (153) (42)Basic earnings per share from continuing operations . 0.22 0.59 0.62 0.45 1.89Diluted earnings per share from continuing operations 0.22 0.58 0.61 0.44 1.85
Fourth quarter income from continuing operations included a pre-tax restructuring charge of $4 million, and pre-taxenvironmental remediation costs of $3 million. Fourth quarter net loss included a goodwill impairment charge of $190 million after-tax,or $2.77 per, diluted share in LVA. Second quarter income from continuing operations included a pre-tax gain on the sale of thecompany’s 75-percent shareholdings in APA of $20 million and pre-tax environmental remediation costs of $8 million. First quarter2004 income from continuing operations included a net pre-tax charge of $9 million, as a result of the company’s decision to withdrawits tender offer for the outstanding shares of Dana Corporation.
ARVINMERITOR, INC.
NOTES TO CONSOLIDATED FINANCIAL STATEMENTS — (Continued)
81

25. SUPPLEMENTAL FINANCIAL INFORMATION2005 2004 2003
(In millions)
Balance sheet data:Allowance for doubtful accounts . . . . . . . . . . . . . . . . . . . . . . . . . . . . . . $ 34 $ 26 $ 16
Statement of operations data:Maintenance and repairs expense . . . . . . . . . . . . . . . . . . . . . . . . . . . . $ 99 $103 $ 92Research, development and engineering expense . . . . . . . . . . . . . . 175 156 160Depreciation expense . . . . . . . . . . . . . . . . . . . . . . . . . . . . . . . . . . . . . . . 174 173 177Provision for doubtful accounts . . . . . . . . . . . . . . . . . . . . . . . . . . . . . . . 19 19 8Rental expense . . . . . . . . . . . . . . . . . . . . . . . . . . . . . . . . . . . . . . . . . . . . 34 33 30
Statement of cash flows data:Interest payments . . . . . . . . . . . . . . . . . . . . . . . . . . . . . . . . . . . . . . . . . . $118 $103 $102Income tax payments . . . . . . . . . . . . . . . . . . . . . . . . . . . . . . . . . . . . . . . 69 71 113Non-cash investing activities — capital expenditures . . . . . . . . . . . 27 16
26. SUPPLEMENTAL GUARANTOR CONDENSED CONSOLIDATING FINANCIAL STATEMENTS
Under the company’s $900 million revolving credit facility, certain domestic subsidiaries, as defined in the credit agreement,irrevocably and unconditionally guarantee amounts outstanding under the facility. Similar subsidiary guarantees were provided forthe benefit of the holders of the publicly-held notes outstanding under the company’s two indentures (see Note 15).
In lieu of providing separate audited financial statements for the Guarantor subsidiaries, the company has included theaccompanying condensed consolidating financial statements. These condensed consolidating financial statements are presented onthe equity method. Under this method, the investments in subsidiaries are recorded at cost and adjusted for the parent’s share ofthe subsidiary’s cumulative results of operations, capital contributions and distributions and other equity changes. The Guarantorsubsidiaries are combined in the condensed consolidating financial statements.
ARVINMERITOR, INC.
NOTES TO CONSOLIDATED FINANCIAL STATEMENTS — (Continued)
82

CONDENSED CONSOLIDATING STATEMENT OF OPERATIONS(In millions)
Fiscal Year Ended September 30, 2005
Parent Guarantors Non-Guarantors Elims Consolidated
SalesExternal . . . . . . . . . . . . . . . . . . . . . . . . . . . . . . . . . . . . . . $ — $ 3,556 $ 5,347 $ — $ 8,903Subsidiaries . . . . . . . . . . . . . . . . . . . . . . . . . . . . . . . . . . — 150 393 (543) —
Total sales . . . . . . . . . . . . . . . . . . . . . . . . . . . . . . . . . . . . . . — 3,706 5,740 (543) 8,903Cost of sales . . . . . . . . . . . . . . . . . . . . . . . . . . . . . . . . . . . . (28) (3,434) (5,348) 543 (8,267)
GROSS MARGIN . . . . . . . . . . . . . . . . . . . . . . . . . . . . . . . . . (28) 272 392 — 636Selling, general and administrative . . . . . . . . . . . . . . (75) (173) (128) — (376)Restructuring costs . . . . . . . . . . . . . . . . . . . . . . . . . . . . (1) (13) (103) — (117)Gain on divestitures . . . . . . . . . . . . . . . . . . . . . . . . . . . — 4 — — 4Environmental remediation costs . . . . . . . . . . . . . . . . — (7) — — (7)Customer bankruptcies . . . . . . . . . . . . . . . . . . . . . . . . — — (10) — (10)
OPERATING INCOME (LOSS) . . . . . . . . . . . . . . . . . . . . . . (104) 83 151 — 130Equity in earnings of affiliates . . . . . . . . . . . . . . . . . . . 5 16 7 — 28Other income (expense), net . . . . . . . . . . . . . . . . . . . . 3 500 (503) — —Interest expense, net and other . . . . . . . . . . . . . . . . . (110) 28 (45) — (127)
INCOME (LOSS) BEFORE INCOME TAXES . . . . . . . . . . . . (206) 627 (390) — 31Benefit (provision) for income taxes . . . . . . . . . . . . . . 80 7 (82) — 5Minority interests . . . . . . . . . . . . . . . . . . . . . . . . . . . . . . — — (3) — (3)
INCOME (LOSS) FROM CONTINUING OPERATIONS . . . (126) 634 (475) — 33INCOME (LOSS) FROM DISCONTINUED OPERATIONS . — 7 (28) — (21)
Equity in net income of subsidiaries . . . . . . . . . . . . . . 138 (469) — 331 —
NET INCOME (LOSS) . . . . . . . . . . . . . . . . . . . . . . . . . . . . . $ 12 $ 172 $ (503) $ 331 $ 12
ARVINMERITOR, INC.
NOTES TO CONSOLIDATED FINANCIAL STATEMENTS — (Continued)
83
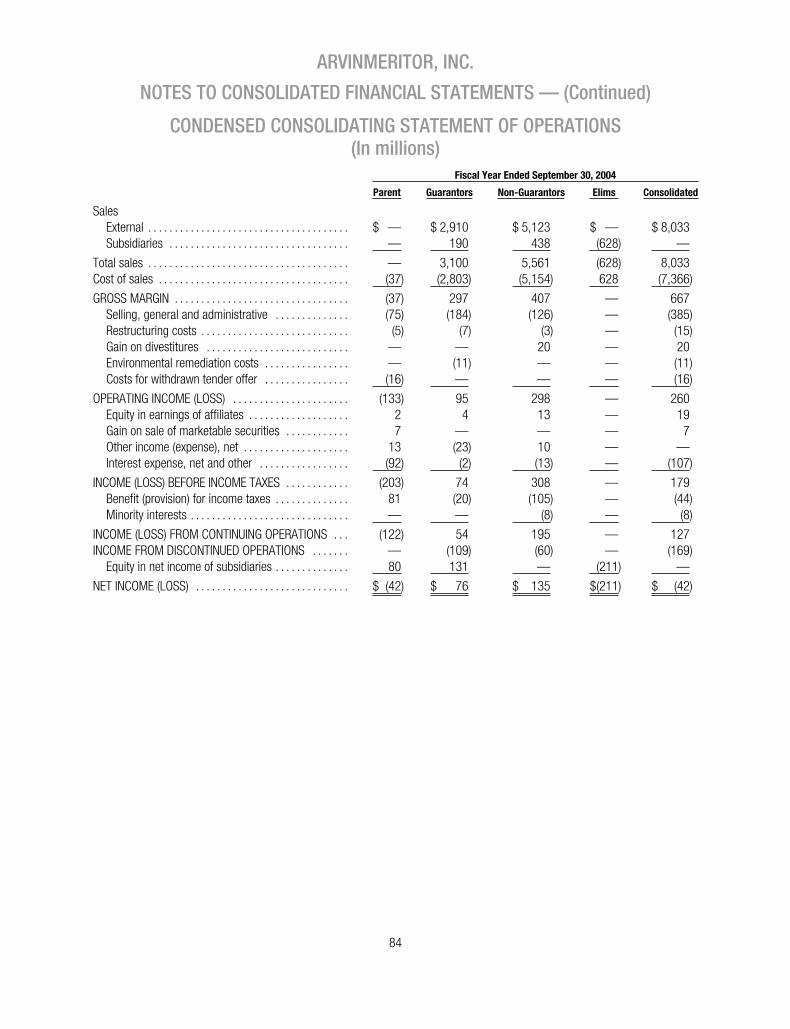
CONDENSED CONSOLIDATING STATEMENT OF OPERATIONS(In millions)
Fiscal Year Ended September 30, 2004
Parent Guarantors Non-Guarantors Elims Consolidated
SalesExternal . . . . . . . . . . . . . . . . . . . . . . . . . . . . . . . . . . . . . . $ — $ 2,910 $ 5,123 $ — $ 8,033Subsidiaries . . . . . . . . . . . . . . . . . . . . . . . . . . . . . . . . . . — 190 438 (628) —
Total sales . . . . . . . . . . . . . . . . . . . . . . . . . . . . . . . . . . . . . . — 3,100 5,561 (628) 8,033Cost of sales . . . . . . . . . . . . . . . . . . . . . . . . . . . . . . . . . . . . (37) (2,803) (5,154) 628 (7,366)
GROSS MARGIN . . . . . . . . . . . . . . . . . . . . . . . . . . . . . . . . . (37) 297 407 — 667Selling, general and administrative . . . . . . . . . . . . . . (75) (184) (126) — (385)Restructuring costs . . . . . . . . . . . . . . . . . . . . . . . . . . . . (5) (7) (3) — (15)Gain on divestitures . . . . . . . . . . . . . . . . . . . . . . . . . . . — — 20 — 20Environmental remediation costs . . . . . . . . . . . . . . . . — (11) — — (11)Costs for withdrawn tender offer . . . . . . . . . . . . . . . . (16) — — — (16)
OPERATING INCOME (LOSS) . . . . . . . . . . . . . . . . . . . . . . (133) 95 298 — 260Equity in earnings of affiliates . . . . . . . . . . . . . . . . . . . 2 4 13 — 19Gain on sale of marketable securities . . . . . . . . . . . . 7 — — — 7Other income (expense), net . . . . . . . . . . . . . . . . . . . . 13 (23) 10 — —Interest expense, net and other . . . . . . . . . . . . . . . . . (92) (2) (13) — (107)
INCOME (LOSS) BEFORE INCOME TAXES . . . . . . . . . . . . (203) 74 308 — 179Benefit (provision) for income taxes . . . . . . . . . . . . . . 81 (20) (105) — (44)Minority interests . . . . . . . . . . . . . . . . . . . . . . . . . . . . . . — — (8) — (8)
INCOME (LOSS) FROM CONTINUING OPERATIONS . . . (122) 54 195 — 127INCOME FROM DISCONTINUED OPERATIONS . . . . . . . — (109) (60) — (169)
Equity in net income of subsidiaries . . . . . . . . . . . . . . 80 131 — (211) —
NET INCOME (LOSS) . . . . . . . . . . . . . . . . . . . . . . . . . . . . . $ (42) $ 76 $ 135 $(211) $ (42)
ARVINMERITOR, INC.
NOTES TO CONSOLIDATED FINANCIAL STATEMENTS — (Continued)
84

CONDENSED CONSOLIDATING STATEMENT OF OPERATIONS(In millions)
Fiscal Year Ended September 30, 2003
Parent Guarantors Non-Guarantors Elims Consolidated
SalesExternal . . . . . . . . . . . . . . . . . . . . . . . . . . . . . . . . . . . . . . $ — $ 2,572 $ 4,151 $ — $ 6,723Subsidiaries . . . . . . . . . . . . . . . . . . . . . . . . . . . . . . . . . . — 135 386 (521) —
Total sales . . . . . . . . . . . . . . . . . . . . . . . . . . . . . . . . . . . . . . — 2,707 4,537 (521) 6,723Cost of sales . . . . . . . . . . . . . . . . . . . . . . . . . . . . . . . . . . . . (40) (2,431) (4,182) 521 (6,132)
GROSS MARGIN . . . . . . . . . . . . . . . . . . . . . . . . . . . . . . . . . (40) 276 355 — 591Selling, general and administrative . . . . . . . . . . . . . . (63) (147) (130) — (340)Restructuring costs . . . . . . . . . . . . . . . . . . . . . . . . . . . . (1) (12) (7) — (20)Gain on divestitures, net . . . . . . . . . . . . . . . . . . . . . . . — 15 — — 15
OPERATING INCOME (LOSS) . . . . . . . . . . . . . . . . . . . . . . (104) 132 218 — 246Equity in earnings of affiliates . . . . . . . . . . . . . . . . . . . — 2 6 — 8Other income (expense), net . . . . . . . . . . . . . . . . . . . . 15 3 (18) — —Interest expense, net and other . . . . . . . . . . . . . . . . . (94) 4 (14) — (104)
INCOME (LOSS) BEFORE INCOME TAXES . . . . . . . . . . . . (183) 141 192 — 150Benefit (provision) for income taxes . . . . . . . . . . . . . . 56 (54) (47) — (45)Minority interests . . . . . . . . . . . . . . . . . . . . . . . . . . . . . . — — (5) — (5)
INCOME (LOSS) FROM CONTINUING OPERATIONS . . . (127) 87 140 — 100INCOME FROM DISCONTINUED OPERATIONS . . . . . . . — 19 18 — 37
INCOME (LOSS) BEFORE CUMULATIVE EFFECT OFACCOUNTING CHANGE . . . . . . . . . . . . . . . . . . . . . . . . (127) 106 158 — 137Cumulative effect of accounting change . . . . . . . . . . (4) — — — (4)Equity in net income of subsidiaries . . . . . . . . . . . . . . 264 139 — (403) —
NET INCOME (LOSS) . . . . . . . . . . . . . . . . . . . . . . . . . . . . . $ 133 $ 245 $ 158 $(403) $ 133
ARVINMERITOR, INC.
NOTES TO CONSOLIDATED FINANCIAL STATEMENTS — (Continued)
85
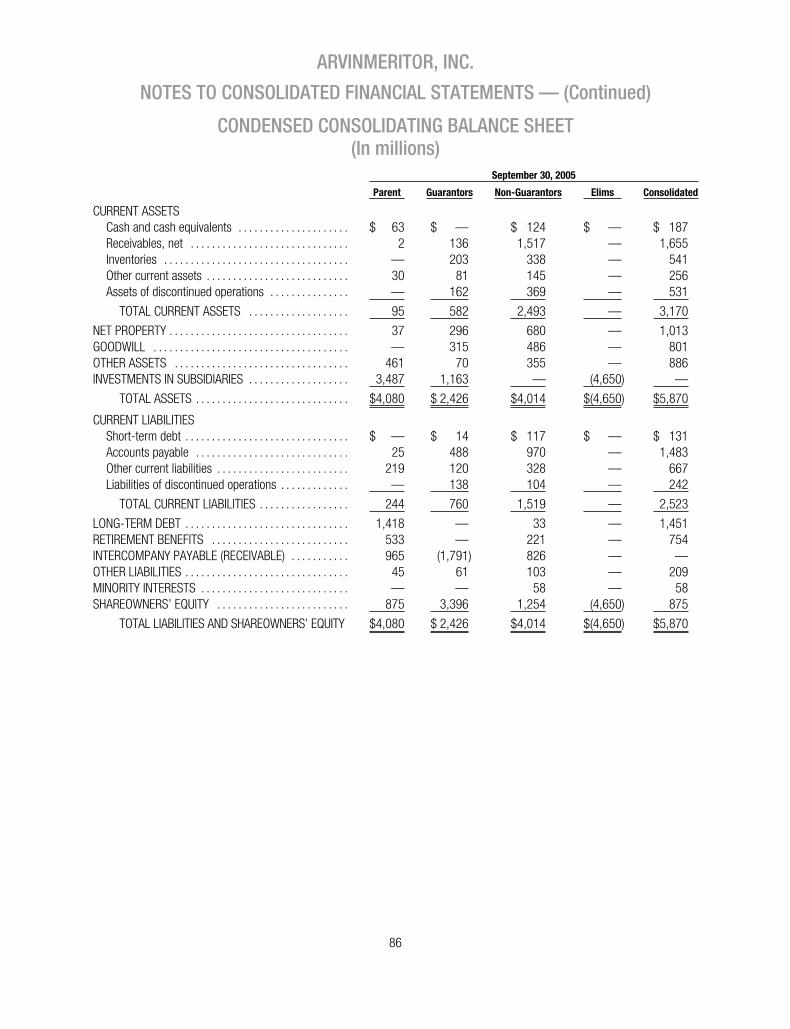
CONDENSED CONSOLIDATING BALANCE SHEET(In millions)
September 30, 2005
Parent Guarantors Non-Guarantors Elims Consolidated
CURRENT ASSETSCash and cash equivalents . . . . . . . . . . . . . . . . . . . . . $ 63 $ — $ 124 $ — $ 187Receivables, net . . . . . . . . . . . . . . . . . . . . . . . . . . . . . . 2 136 1,517 — 1,655Inventories . . . . . . . . . . . . . . . . . . . . . . . . . . . . . . . . . . . — 203 338 — 541Other current assets . . . . . . . . . . . . . . . . . . . . . . . . . . . 30 81 145 — 256Assets of discontinued operations . . . . . . . . . . . . . . . — 162 369 — 531
TOTAL CURRENT ASSETS . . . . . . . . . . . . . . . . . . . 95 582 2,493 — 3,170
NET PROPERTY . . . . . . . . . . . . . . . . . . . . . . . . . . . . . . . . . . 37 296 680 — 1,013GOODWILL . . . . . . . . . . . . . . . . . . . . . . . . . . . . . . . . . . . . . — 315 486 — 801OTHER ASSETS . . . . . . . . . . . . . . . . . . . . . . . . . . . . . . . . . 461 70 355 — 886INVESTMENTS IN SUBSIDIARIES . . . . . . . . . . . . . . . . . . . 3,487 1,163 — (4,650) —
TOTAL ASSETS . . . . . . . . . . . . . . . . . . . . . . . . . . . . . $4,080 $ 2,426 $4,014 $(4,650) $5,870
CURRENT LIABILITIESShort-term debt . . . . . . . . . . . . . . . . . . . . . . . . . . . . . . . $ — $ 14 $ 117 $ — $ 131Accounts payable . . . . . . . . . . . . . . . . . . . . . . . . . . . . . 25 488 970 — 1,483Other current liabilities . . . . . . . . . . . . . . . . . . . . . . . . . 219 120 328 — 667Liabilities of discontinued operations . . . . . . . . . . . . . — 138 104 — 242
TOTAL CURRENT LIABILITIES . . . . . . . . . . . . . . . . . 244 760 1,519 — 2,523
LONG-TERM DEBT . . . . . . . . . . . . . . . . . . . . . . . . . . . . . . . 1,418 — 33 — 1,451RETIREMENT BENEFITS . . . . . . . . . . . . . . . . . . . . . . . . . . 533 — 221 — 754INTERCOMPANY PAYABLE (RECEIVABLE) . . . . . . . . . . . 965 (1,791) 826 — —OTHER LIABILITIES . . . . . . . . . . . . . . . . . . . . . . . . . . . . . . . 45 61 103 — 209MINORITY INTERESTS . . . . . . . . . . . . . . . . . . . . . . . . . . . . — — 58 — 58SHAREOWNERS’ EQUITY . . . . . . . . . . . . . . . . . . . . . . . . . 875 3,396 1,254 (4,650) 875
TOTAL LIABILITIES AND SHAREOWNERS’ EQUITY $4,080 $ 2,426 $4,014 $(4,650) $5,870
ARVINMERITOR, INC.
NOTES TO CONSOLIDATED FINANCIAL STATEMENTS — (Continued)
86

CONDENSED CONSOLIDATING BALANCE SHEET(In millions)
September 30, 2004
Parent Guarantors Non-Guarantors Elims Consolidated
CURRENT ASSETSCash and cash equivalents . . . . . . . . . . . . . . . . . . . . . $ 2 $ 1 $ 129 $ — $ 132Receivables, net . . . . . . . . . . . . . . . . . . . . . . . . . . . . . . — 148 1,330 — 1,478Inventories . . . . . . . . . . . . . . . . . . . . . . . . . . . . . . . . . . . — 182 341 — 523Other current assets . . . . . . . . . . . . . . . . . . . . . . . . . . . 20 82 136 — 238Assets of discontinued operations . . . . . . . . . . . . . . . — 128 487 — 615
TOTAL CURRENT ASSETS . . . . . . . . . . . . . . . . . . . 22 541 2,423 — 2,986
NET PROPERTY . . . . . . . . . . . . . . . . . . . . . . . . . . . . . . . . . . 39 281 712 — 1,032GOODWILL . . . . . . . . . . . . . . . . . . . . . . . . . . . . . . . . . . . . . — 156 652 — 808OTHER ASSETS . . . . . . . . . . . . . . . . . . . . . . . . . . . . . . . . . 422 39 352 — 813INVESTMENTS IN SUBSIDIARIES . . . . . . . . . . . . . . . . . . . 3,219 2,190 — (5,409) —
TOTAL ASSETS . . . . . . . . . . . . . . . . . . . . . . . . . . . . . $3,702 $3,207 $4,139 $(5,409) $5,639
CURRENT LIABILITIESShort-term debt . . . . . . . . . . . . . . . . . . . . . . . . . . . . . . . $ — $ — $ 3 $ — $ 3Accounts payable . . . . . . . . . . . . . . . . . . . . . . . . . . . . . 16 438 912 — 1,366Other current liabilities . . . . . . . . . . . . . . . . . . . . . . . . . 196 179 247 — 622Liabilities of discontinued operations . . . . . . . . . . . . . — 111 171 — 282
TOTAL CURRENT LIABILITIES . . . . . . . . . . . . . . . . . 212 728 1,333 — 2,273
LONG-TERM DEBT . . . . . . . . . . . . . . . . . . . . . . . . . . . . . . . 1,459 — 28 — 1,487RETIREMENT BENEFITS . . . . . . . . . . . . . . . . . . . . . . . . . . 447 — 136 — 583INTERCOMPANY PAYABLE (RECEIVABLE) . . . . . . . . . . . 531 (493) (38) — —OTHER LIABILITIES . . . . . . . . . . . . . . . . . . . . . . . . . . . . . . . 65 38 144 — 247MINORITY INTERESTS . . . . . . . . . . . . . . . . . . . . . . . . . . . . — — 61 — 61SHAREOWNERS’ EQUITY . . . . . . . . . . . . . . . . . . . . . . . . . 988 2,934 2,475 (5,409) 988
TOTAL LIABILITIES AND SHAREOWNERS’ EQUITY $3,702 $3,207 $4,139 $(5,409) $5,639
ARVINMERITOR, INC.
NOTES TO CONSOLIDATED FINANCIAL STATEMENTS — (Continued)
87

CONDENSED CONSOLIDATING STATEMENT OF CASH FLOWS(In millions)
Fiscal Year Ended September 30, 2005
Parent Guarantors Non-Guarantors Elims Consolidated
OPERATING ACTIVITIESCASH FLOWS PROVIDED BY (USED FOR)
OPERATING ACTIVITIES . . . . . . . . . . . . . . . . . . . . . . . . $ 171 $ 34 $(237) $— $ (32)
INVESTING ACTIVITIESCapital expenditures . . . . . . . . . . . . . . . . . . . . . . . . . . . (5) (51) (90) — (146)Acquisitions of businesses and investments,
net of cash . . . . . . . . . . . . . . . . . . . . . . . . . . . . . . . . — (5) (26) — (31)Proceeds from disposition of property
and businesses . . . . . . . . . . . . . . . . . . . . . . . . . . . . . — 36 13 — 49Net cash provided by (used for)
discontinued operations . . . . . . . . . . . . . . . . . . . . . — (2) 155 — 153
CASH PROVIDED BY (USED FOR)INVESTING ACTIVITIES . . . . . . . . . . . . . . . . . . . . . . . . . (5) (22) 52 — 25
FINANCING ACTIVITIES . . . . . . . . . . . . . . . . . . . . . . . . . . .Borrowings on accounts receivable
securitization program . . . . . . . . . . . . . . . . . . . . . . . — — 112 — 112Purchase of notes . . . . . . . . . . . . . . . . . . . . . . . . . . . . . (21) — — — (21)Borrowings (Payments) on lines of credit and other . . — (12) 7 — (5)Payment of issuance costs associated with
debt exchange . . . . . . . . . . . . . . . . . . . . . . . . . . . . . (10) — — — (10)Proceeds from exercise of stock options . . . . . . . . . . 6 — — — 6Intercompany advances . . . . . . . . . . . . . . . . . . . . . . . . (53) — 53 — —Cash dividends . . . . . . . . . . . . . . . . . . . . . . . . . . . . . . . (28) — — — (28)
CASH PROVIDED BY (USED FOR)FINANCING ACTIVITIES . . . . . . . . . . . . . . . . . . . . . . . . . (106) (12) 172 — 54
EFFECT OF CHANGES IN FOREIGN CURRENCYEXCHANGE RATES ON CASH . . . . . . . . . . . . . . . . . . . — — 8 — 8
CHANGE IN CASH AND CASH EQUIVALENTS . . . . . . . . 60 — (5) — 55CASH AND CASH EQUIVALENTS AT BEGINNING
OF PERIOD . . . . . . . . . . . . . . . . . . . . . . . . . . . . . . . . . . . 3 — 129 — 132
CASH AND CASH EQUIVALENTS AT ENDOF PERIOD . . . . . . . . . . . . . . . . . . . . . . . . . . . . . . . . . . . $ 63 $ — $ 124 $— $ 187
ARVINMERITOR, INC.
NOTES TO CONSOLIDATED FINANCIAL STATEMENTS — (Continued)
88

CONDENSED CONSOLIDATING STATEMENT OF CASH FLOWS(In millions)
Fiscal Year Ended September 30, 2004
Parent Guarantors Non-Guarantors Elims Consolidated
OPERATING ACTIVITIESCASH FLOWS PROVIDED BY (USED FOR)
OPERATING ACTIVITIES . . . . . . . . . . . . . . . . . . . . . . . . $(131) $ 37 $ 313 $— $ 219
INVESTING ACTIVITIESCapital expenditures . . . . . . . . . . . . . . . . . . . . . . . . . . . . . (6) (59) (87) — (152)Acquisitions of businesses and investments,
net of cash . . . . . . . . . . . . . . . . . . . . . . . . . . . . . . . . . . . — — (3) — (3)Proceeds from disposition of property, businesses,
and marketable securities . . . . . . . . . . . . . . . . . . . . . . 18 15 70 — 103Cash used by discontinued operations . . . . . . . . . . . . . . — (4) (64) — (68)
CASH PROVIDED BY (USED FOR)INVESTING ACTIVITIES . . . . . . . . . . . . . . . . . . . . . . . . . 12 (48) (84) — (120)
FINANCING ACTIVITIESNet payments on debt . . . . . . . . . . . . . . . . . . . . . . . . . . . . (53) — (2) — (55)Proceeds from exercise of stock options . . . . . . . . . . . . 6 — — — 6Intercompany advances . . . . . . . . . . . . . . . . . . . . . . . . . . 195 — (195) — —Cash dividends . . . . . . . . . . . . . . . . . . . . . . . . . . . . . . . . . . (28) — — — (28)
CASH PROVIDED BY (USED FOR)FINANCING ACTIVITIES . . . . . . . . . . . . . . . . . . . . . . . . . 120 — (197) — (77)
EFFECT OF CHANGES IN FOREIGN CURRENCYEXCHANGE RATES ON CASH . . . . . . . . . . . . . . . . . . . — — 7 — 7
CHANGE IN CASH AND CASH EQUIVALENTS . . . . . . . . 1 (11) 39 — 29CASH AND CASH EQUIVALENTS AT BEGINNING
OF YEAR . . . . . . . . . . . . . . . . . . . . . . . . . . . . . . . . . . . . . 2 11 90 — 103
CASH AND CASH EQUIVALENTS AT END OF YEAR . . . $ 3 $ — $ 129 $— $ 132
ARVINMERITOR, INC.
NOTES TO CONSOLIDATED FINANCIAL STATEMENTS — (Continued)
89

CONDENSED CONSOLIDATING STATEMENT OF CASH FLOWS(In millions)
Fiscal Year Ended September 30, 2003
Parent Guarantors Non-Guarantors Elims Consolidated
OPERATING ACTIVITIESCASH FLOWS PROVIDED BY
OPERATING ACTIVITIES . . . . . . . . . . . . . . . . . . . . . . . . $ 49 $ 67 $ 158 $— $ 274
INVESTING ACTIVITIESCapital expenditures . . . . . . . . . . . . . . . . . . . . . . . . . . . . . (18) (54) (101) — (173)Acquisitions of businesses and investments,
net of cash . . . . . . . . . . . . . . . . . . . . . . . . . . . . . . . . . . . (11) (13) (83) — (107)Proceeds from disposition of property
and businesses . . . . . . . . . . . . . . . . . . . . . . . . . . . . . . . — — 104 — 104Net cash provided by discontinued operations . . . . . . . — — (15) — (15)
CASH USED FOR INVESTING ACTIVITIES . . . . . . . . . . . . (29) (67) (95) — (191)
FINANCING ACTIVITIESNet change in debt . . . . . . . . . . . . . . . . . . . . . . . . . . . . . . . 1 — (30) — (29)Intercompany advances . . . . . . . . . . . . . . . . . . . . . . . . . . 16 — (16) — —Cash dividends . . . . . . . . . . . . . . . . . . . . . . . . . . . . . . . . . . (27) — — — (27)
CASH USED FOR FINANCING ACTIVITIES . . . . . . . . . . . . (10) — (46) — (56)
EFFECT OF CHANGES IN FOREIGN CURRENCYEXCHANGE RATES ON CASH . . . . . . . . . . . . . . . . . . . — — 20 — 20
CHANGE IN CASH AND CASH EQUIVALENTS . . . . . . . . 10 — 37 — 47CASH AND CASH EQUIVALENTS AT BEGINNING
OF YEAR . . . . . . . . . . . . . . . . . . . . . . . . . . . . . . . . . . . . . (8) 11 53 — 56
CASH AND CASH EQUIVALENTS AT END OF YEAR . . . $ 2 $ 11 $ 90 $— $ 103
27. SUBSEQUENT EVENT
On October 6, 2005, the company completed the sale of certain assets of CVS’ off-highway brake business for cash proceedsof approximately $39 million. This sale is part of the company’s continued focus on its core products.
Item 9. Changes in and Disagreements with Accountants on Accounting and Financial Disclosure.
None.
Item 9A. Controls and Procedures.
Disclosure Controls and Procedures
As required by Rule 13a-15 under the Securities Exchange Act of 1934 (“Exchange Act”), under the supervision and with theparticipation of the management of ArvinMeritor, Inc., including the chief executive officer and chief financial officer, we have evaluatedthe effectiveness of the design and operation of our disclosure controls and procedures as of September 30, 2005. Based upon thatevaluation, the chief executive officer and the chief financial officer have concluded that, as of September 30, 2005, our disclosurecontrols and procedures were effective in providing reasonable assurance that information required to be disclosed in the reports wefile or submit under the Exchange Act is recorded, processed, summarized and reported, within the time periods specified in the SEC’srules and forms.
ARVINMERITOR, INC.
NOTES TO CONSOLIDATED FINANCIAL STATEMENTS — (Continued)
90

Management Report on Internal Control over Financial Reporting
ArvinMeritor’s management is responsible for establishing and maintaining adequate internal control over financial reportingfor the company, as defined in Rules 13a-15(f) and 15d-15(f) under the Exchange Act. ArvinMeritor’s internal control system isdesigned to provide reasonable assurance regarding the reliability of financial reporting and the preparation of financial statementsfor external purposes, in accordance with accounting principles generally accepted in the United States of America.
All internal control systems, no matter how well designed, have inherent limitations and may not prevent or detectmisstatements. Also, projections of any evaluation of effectiveness to future periods are subject to the risk that controls may becomeinadequate because of changes in conditions, or that the degree of compliance with the policies or procedures may deteriorate.
ArvinMeritor’s management, including the chief executive officer and chief financial officer, assessed the effectiveness of itsinternal control over financial reporting as of September 30, 2005. In making this assessment, management used the criteria setforth in Internal Control — Integrated Framework issued by the Committee of Sponsoring Organizations of the TreadwayCommission (COSO).
Management excluded from this assessment the internal control over financial reporting at locations operated by two majority-owned joint ventures (ArvinMeritor CVS Axles France SAS and Fonderie Venissieux SAS), interests in which were acquired by thecompany in the first quarter of fiscal year 2005 (see Item 1. Business, “Joint Ventures” above). The financial statements of these jointventures reflect total assets and revenues constituting 3% and 3%, respectively, of the related consolidated financial statementamounts as of and for the fiscal year ended September 30, 2005.
Based on management’s assessment and the criteria set forth by COSO, ArvinMeritor’s management concluded that the internalcontrol over financial reporting maintained by the company, as of September 30, 2005, was effective.
Deloitte & Touche LLP, ArvinMeritor’s independent auditor, has issued an attestation report on management’s assessment ofits internal control over financial reporting, which follows.
November 15, 2005
Report of Independent Registered Public Accounting Firm
To the Board of Directors and Shareowners of ArvinMeritor, Inc.Troy, Michigan
We have audited management’s assessment, included in the accompanying Management Report on Internal Control over FinancialReporting, that ArvinMeritor, Inc. (the “company”) maintained effective internal control over financial reporting as of September 30, 2005,based on criteria established in Internal Control — Integrated Framework issued by the Committee of Sponsoring Organizations of theTreadwayCommission.Asdescribed in theManagementReport on InternalControl over FinancialReporting,managementexcluded fromtheir assessment the internal control over financial reporting at ArvinMeritor CVS Axles France SAS and Fonderie Venissieux SAS, whichwere acquired on October 4, 2004 and whose financial statements reflect total assets and revenues constituting 3 percent and 3 percent,respectively, of the related consolidated financial statement amounts as of and for the year ended September 30, 2005. Accordingly,our audit did not include the internal control over financial reporting at ArvinMeritor CVS Axles France SAS and Fonderie Venissieux SAS.The company’s management is responsible for maintaining effective internal control over financial reporting and for its assessment ofthe effectiveness of internal control over financial reporting. Our responsibility is to express an opinion on management’s assessmentand an opinion on the effectiveness of the company’s internal control over financial reporting based on our audit.
We conducted our audit in accordance with the standards of the Public Company Accounting Oversight Board (United States). Thosestandards require that we plan and perform the audit to obtain reasonable assurance about whether effective internal control overfinancial reporting was maintained in all material respects. Our audit included obtaining an understanding of internal control overfinancial reporting, evaluating management’s assessment, testing and evaluating the design and operating effectiveness of internalcontrol, and performing such other procedures as we considered necessary in the circumstances. We believe that our audit providesa reasonable basis for our opinions.
A company’s internal control over financial reporting is a process designed by, or under the supervision of, the company’s principalexecutive and principal financial officers, or persons performing similar functions, and effected by the company’s board of directors,management, and other personnel to provide reasonable assurance regarding the reliability of financial reporting and the preparationof financial statements for external purposes in accordance with generally accepted accounting principles. A company’s internal
91

control over financial reporting includes those policies and procedures that (1) pertain to the maintenance of records that, in reasonabledetail, accurately and fairly reflect the transactions and dispositions of the assets of the company; (2) provide reasonable assurancethat transactions are recorded as necessary to permit preparation of financial statements in accordance with generally acceptedaccounting principles, and that receipts and expenditures of the company are being made only in accordance with authorizations ofmanagement and directors of the company; and (3) provide reasonable assurance regarding prevention or timely detection ofunauthorized acquisition, use, or disposition of the company’s assets that could have a material effect on the financial statements.
Because of the inherent limitations of internal control over financial reporting, including the possibility of collusion or impropermanagement override of controls, material misstatements due to error or fraud may not be prevented or detected on a timely basis.Also, projections of any evaluation of the effectiveness of the internal control over financial reporting to future periods are subject tothe risk that the controls may become inadequate because of changes in conditions, or that the degree of compliance with the policiesor procedures may deteriorate.
In our opinion, management’s assessment that the company maintained effective internal control over financial reporting as ofSeptember30,2005, is fairly stated, in allmaterial respects, basedon thecriteria established in InternalControl—IntegratedFrameworkissued by the Committee of Sponsoring Organizations of the Treadway Commission. Also in our opinion, the company maintained, in allmaterial respects, effective internal control over financial reporting as of September 30, 2005, based on the criteria established in InternalControl — Integrated Framework issued by the Committee of Sponsoring Organizations of the Treadway Commission.
We have also audited, in accordance with the standards of the Public Company Accounting Oversight Board (United States), theconsolidatedbalancesheet and the relatedconsolidated statements of operations, cash flowsandshareowners’ equity of thecompanyand financial statement schedule listed in the Index at Item 15 (a) (2) as of and for the year ended September 30, 2005. Our reportdated November 15, 2005 expressed an unqualified opinion on those financial statements and financial statement schedule.
DELOITTE & TOUCHE LLP
Detroit, MichiganNovember 15, 2005
Changes in Internal Control Over Financial Reporting
Under the supervision and with the participation of our management, including the chief executive officer and chief financialofficer, we have evaluated any change in our internal control over financial reporting (as such term is defined in Rules 13a-15(f) and15d-15(f) under the Exchange Act) during the fiscal quarter ended September 30, 2005, and found no change that has materiallyaffected or is reasonably likely to materially affect our internal control over financial reporting.
Item 9B. Other Information.
None.
92
PART III
Item 10. Directors and Executive Officers of the Registrant.
See the information under the captions Election of Directors, Information as to Nominees for Directors and Continuing Directors,Involvement in Certain Legal Proceedings and Section 16(a) Beneficial Ownership Reporting Compliance in the 2006 Proxy Statement.See also the information with respect to executive officers of ArvinMeritor under Item 4A of Part I. No director or nominee for directorwas selected pursuant to any arrangement or understanding between that individual and any person other than ArvinMeritor pursuantto which such person is or was to be selected as a director or nominee. There are no family relationships, as defined in Item 401 ofRegulation S-K, between any of the directors or nominees for director and any other director, executive officer or person nominatedto become a director or executive officer.
ArvinMeritor has a separately designated standing audit committee established in accordance with Section 3(a)(58)(A) of theExchange Act. The current members of the Audit Committee are William D. George, Jr. (chairman), David W. Devonshire, RichardW. Hanselman, Charles H. Harff and Victoria B. Jackson. The Board of Directors has determined that ArvinMeritor has at least one“audit committee financial expert” (as defined in Item 401(h) of Regulation S-K), David W. Devonshire, serving on the Audit Committee.Mr. Devonshire is “independent,” as defined in the listing standards of the NYSE.
The charters of the Audit Committee, the Compensation and Management Development Committee, the Corporate Governanceand Nominating Committee and the Environmental and Social Responsibility Committee of the Board of Directors are posted on ourwebsite, www.arvinmeritor.com, in the section headed “Investors — Corporate Governance.”
All ArvinMeritor employees, including our chief executive officer, chief financial officer, controller and other executive officers, arerequired to comply with our corporate policies regarding Standards of Business Conduct and Conflicts of Interest. ArvinMeritor’s ethicsmanual, including the text of the policies on Standards of Business Conduct and Conflicts of Interest, is posted on our website(www.arvinmeritor.com), in the section headed “Investors — Corporate Governance.” We will also post on our website any amendmentto, or waiver from, a provision of our policies that applies to our chief executive officer, chief financial officer or controller, and that relatesto any of the following elements of these policies: honest and ethical conduct; disclosure in reports or documents filed by the companywith the SEC and in other public communications; compliance with applicable laws, rules and regulations; prompt internal reporting ofcode violations; and accountability for adherence to the policies.
ArvinMeritor’s chief executive officer and chief financial officer have filed certifications, as required by the Sarbanes-Oxley Actof 2002 and Rule 13a-14(a) and (b) under the Exchange Act, as exhibits to each Quarterly Report on Form 10-Q filed with the SECduring fiscal year 2005 and to this Annual Report on Form 10-K. The company’s chief executive officer also filed with the NYSE inMarch 2005 a certification that he was not aware of any violation by the company of the NYSE listing standards.
Item 11. Executive Compensation.
See the information under the captions Compensation of Directors, Executive Compensation, Agreements with Named ExecutiveOfficers and Retirement Benefits in the 2006 Proxy Statement.
Item 12. Security Ownership of Certain Beneficial Owners and Management and Related Stockholder Matters.
Security Ownership of Certain Beneficial Owners and Management
See the information under the captions Voting Securities and Ownership by Management of Equity Securities in the 2006Proxy Statement.
93
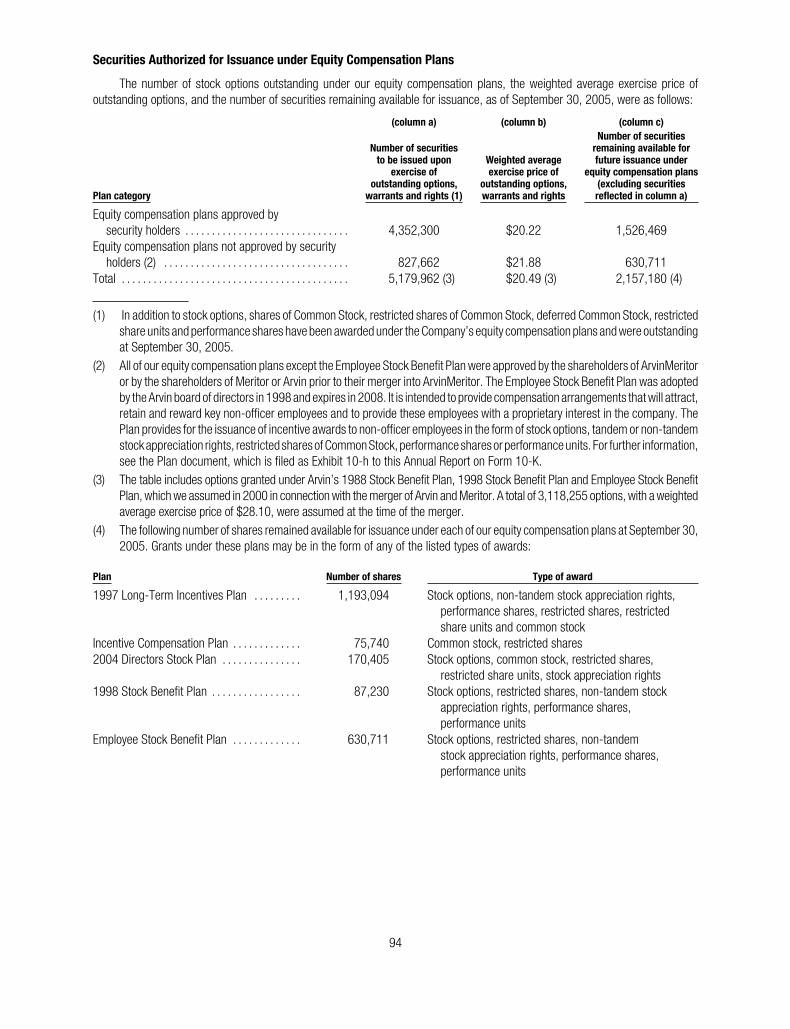
Securities Authorized for Issuance under Equity Compensation Plans
The number of stock options outstanding under our equity compensation plans, the weighted average exercise price ofoutstanding options, and the number of securities remaining available for issuance, as of September 30, 2005, were as follows:
(column a) (column b) (column c)
Plan category
Number of securitiesto be issued upon
exercise ofoutstanding options,
warrants and rights (1)
Weighted averageexercise price of
outstanding options,warrants and rights
Number of securitiesremaining available forfuture issuance under
equity compensation plans(excluding securitiesreflected in column a)
Equity compensation plans approved bysecurity holders . . . . . . . . . . . . . . . . . . . . . . . . . . . . . . . 4,352,300 $20.22 1,526,469
Equity compensation plans not approved by securityholders (2) . . . . . . . . . . . . . . . . . . . . . . . . . . . . . . . . . . . 827,662 $21.88 630,711
Total . . . . . . . . . . . . . . . . . . . . . . . . . . . . . . . . . . . . . . . . . . . 5,179,962 (3) $20.49 (3) 2,157,180 (4)
(1) In addition to stock options, shares of Common Stock, restricted shares of Common Stock, deferred Common Stock, restrictedshare units and performance shares have been awarded under the Company’s equity compensation plans and were outstandingat September 30, 2005.
(2) All of our equity compensation plans except the Employee Stock Benefit Plan were approved by the shareholders of ArvinMeritoror by the shareholders of Meritor or Arvin prior to their merger into ArvinMeritor. The Employee Stock Benefit Plan was adoptedby the Arvin board of directors in 1998 and expires in 2008. It is intended to provide compensation arrangements that will attract,retain and reward key non-officer employees and to provide these employees with a proprietary interest in the company. ThePlan provides for the issuance of incentive awards to non-officer employees in the form of stock options, tandem or non-tandemstock appreciation rights, restricted shares of Common Stock, performance shares or performance units. For further information,see the Plan document, which is filed as Exhibit 10-h to this Annual Report on Form 10-K.
(3) The table includes options granted under Arvin’s 1988 Stock Benefit Plan, 1998 Stock Benefit Plan and Employee Stock BenefitPlan, which we assumed in 2000 in connection with the merger of Arvin and Meritor. A total of 3,118,255 options, with a weightedaverage exercise price of $28.10, were assumed at the time of the merger.
(4) The following number of shares remained available for issuance under each of our equity compensation plans at September 30,2005. Grants under these plans may be in the form of any of the listed types of awards:
Plan Number of shares Type of award
1997 Long-Term Incentives Plan . . . . . . . . . 1,193,094 Stock options, non-tandem stock appreciation rights,performance shares, restricted shares, restrictedshare units and common stock
Incentive Compensation Plan . . . . . . . . . . . . . 75,740 Common stock, restricted shares2004 Directors Stock Plan . . . . . . . . . . . . . . . 170,405 Stock options, common stock, restricted shares,
restricted share units, stock appreciation rights1998 Stock Benefit Plan . . . . . . . . . . . . . . . . . 87,230 Stock options, restricted shares, non-tandem stock
appreciation rights, performance shares,performance units
Employee Stock Benefit Plan . . . . . . . . . . . . . 630,711 Stock options, restricted shares, non-tandemstock appreciation rights, performance shares,performance units
94
Item 13. Certain Relationships and Related Transactions.
If any reportable relationships and related transactions exist, they will be reported in the 2006 Proxy Statement.
Item 14. Principal Accountant Fees and Services.
See the information under the caption Independent Accountants’ Fees in the 2006 Proxy Statement.
PART IV
Item 15. Exhibits and Financial Statement Schedules.
(a) Financial Statements, Financial Statement Schedules and Exhibits.
(1) Financial Statements (all financial statements listed below are those of the company and its consolidated subsidiaries):
Consolidated Statement of Operations, years ended September 30, 2005, 2004 and 2003.
Consolidated Balance Sheet, September 30, 2005 and 2004.
Consolidated Statement of Cash Flows, years ended September 30, 2005, 2004 and 2003.
Consolidated Statement of Shareowners’ Equity, years ended September 30, 2005, 2004 and 2003.
Notes to Consolidated Financial Statements.
Report of Independent Registered Public Accounting Firm.
(2) Financial Statement Schedule for the years ended September 30, 2005, 2004 and 2003.
Page
Schedule II — Valuation and Qualifying Accounts . . . . . . . . . . . . . . . . . . . . . . . . . . . . . . . . . . . . . . . . . . S-1
Schedules not filed with this Annual Report on Form 10-K are omitted because of the absence of conditions under which theyare required or because the information called for is shown in the financial statements or related notes.
(3) Exhibits
3-a Restated Articles of Incorporation of ArvinMeritor, filed as Exhibit 4.01 to ArvinMeritor’s Registration Statement on FormS-4, as amended (Registration Statement No. 333-36448) (“Form S-4”), is incorporated by reference.
3-b By-laws of ArvinMeritor, filed as Exhibit 3 to ArvinMeritor’s Quarterly Report on Form 10-Q for the quarterly period endedJune 29, 2003 (File No. 1-15983), is incorporated by reference.
4-a Rights Agreement, dated as of July 3, 2000, between ArvinMeritor and The Bank of New York (successor toEquiServeTrust Company, N.A.), as rights agent, filed as Exhibit 4.03 to the Form S-4, is incorporated by reference.
4-b Indenture, dated as of April 1, 1998, between ArvinMeritor and BNY Midwest Trust Company (successor to The ChaseManhattan Bank), as trustee, filed as Exhibit 4 to Meritor’s Registration Statement on Form S-3 (Registration No. 333-49777), is incorporated by reference.
4-b-1 First Supplemental Indenture, dated as of July 7, 2000, to the Indenture, dated as of April 1, 1998, between ArvinMeritorand BNY Midwest Trust Company (successor to The Chase Manhattan Bank), as trustee, filed as Exhibit 4-b-1 toArvinMeritor’s Annual Report on Form 10-K for the fiscal year ended September 30, 2000 (File No. 1-15983) (“2000Form 10-K”), is incorporated by reference.
4-b-2 Second Supplemental Indenture, dated as of July 6, 2004, to the Indenture, dated as of April 1, 1998, betweenArvinMeritor and BNY Midwest Trust Company (successor to The Chase Manhattan Bank), as trustee, filed as Exhibit4-a to ArvinMeritor’s Quarterly Report on Form 10-Q for the quarterly period ended June 27, 2004 (File No. 1-15983),is incorporated by reference.
4-c Indenture dated as of July 3, 1990, as supplemented by a First Supplemental Indenture dated as of March 31, 1994,between ArvinMeritor and BNY Midwest Trust Company (successor to Harris Trust and Savings Bank), as trustee, filedas Exhibit 4-4 to Arvin’s Registration Statement on Form S-3 (Registration No. 33-53087), is incorporated by reference.
95
4-c-1 Second Supplemental Indenture, dated as of July 7, 2000, to the Indenture dated as of July 3, 1990, betweenArvinMeritor and BNY Midwest Trust Company (successor to Harris Trust and Savings Bank), as trustee, filed as Exhibit4-c-1 to the 2000 Form 10-K, is incorporated by reference.
4-c-2 Third Supplemental Indenture, dated as of July 6, 2004, to the Indenture, dated as of July 3, 1990, between ArvinMeritorand BNY Midwest Trust Company (successor to Harris Trust and Savings Bank), as trustee, filed as Exhibit 4-b toArvinMeritor’s Quarterly Report on Form 10-Q for the quarterly period ended June 27, 2004 (File No. 1-15983), isincorporated by reference.
4-d Indenture, dated as of January 28, 1997, between ArvinMeritor and Wilmington Trust Company, as trustee, filed asExhibit 4.4 to Arvin’s Registration Statement on Form S-3 (Registration No. 333-18521), is incorporated by reference.
4-d-1 First Supplemental Indenture, dated as of January 28, 1997, to the Indenture dated as of January 28, 1997, betweenArvinMeritor and Wilmington Trust Company, as trustee, filed as Exhibit 4.5 to Arvin’s Current Report on Form 8-K datedFebruary 10, 1997 (File No. 1-302), is incorporated by reference.
4-d-2 Second Supplemental Indenture, dated as of July 7, 2000, to the Indenture dated as of January 28, 1997, betweenArvinMeritor and Wilmington Trust Company, filed as Exhibit 4-d-2 to the 2000 Form 10-K, is incorporated by reference.
10-a Credit Agreement, dated as of July 6, 2004, among ArvinMeritor, the subsidiary borrowers from time to time partiesthereto, the institutions from time to time parties thereto as lenders, JP Morgan Chase Bank (successor by merger toBank One, NA (Main Office Chicago)), as Administrative Agent, JP Morgan Chase Bank and Citicorp North America, Inc.,as Syndication Agents, and ABN AMRO Bank N.V., BNP Paribas and UBS Securities LLC, as Documentation Agents,filed as Exhibit 10 to ArvinMeritor’s Quarterly Report on Form 10-Q for the quarterly period ended June 27, 2004 (FileNo. 1-15983), is incorporated by reference.
*10-b-1 1997 Long-Term Incentives Plan, as amended and restated, filed as Exhibit 10 to ArvinMeritor’s Current Report on Form8-K dated April 20, 2005 (File No. 1-15983), is incorporated by reference.
*10-b-2 Form of Restricted Stock Agreement under the 1997 Long-Term Incentives Plan, filed as Exhibit 10-a-2 to Meritor’sAnnual Report on Form 10-K for the fiscal year ended September 30, 1997 (File No. 1-13093), is incorporatedby reference.
*10-b-3 Form of Option Agreement under the 1997 Long-Term Incentives Plan, filed as Exhibit 10(a) to Meritor’s Quarterly Reporton Form 10-Q for the quarterly period ended March 31, 1998 (File No. 1-13093), is incorporated by reference.
*10-b-4 Form of Performance Share Agreement under the 1997 Long-Term Incentives Plan, filed as Exhibit 10-b toArvinMeritor’s Current Report on Form 8-K dated December 7, 2004 (File No. 1-15983), is incorporated by reference.
*10-b-5 Description of Performance Goals Established in connection with 2005-2007 Cash Performance Plan under the 1997Long- Term Incentives Plan, filed as Exhibit 10-c to ArvinMeritor’s Current Report on Form 8-K dated February 16, 2005(File No. 1-15983), is incorporated by reference.
*10-b-6 Description of Performance Goals Established in connection with 2006-2008 Cash Performance Plan under the 1997Long- Term Incentives Plan.
*10-c-1 Description of Compensation of Non-Employee Directors, filed as Exhibit 10-c-1 to ArvinMeritor’s Annual Report onForm 10-K for the fiscal year ended October 3, 2004 (File No. 1-15983), is incorporated by reference.
*10-c-2 2004 Directors Stock Plan, filed as Exhibit 10-a to ArvinMeritor’s Quarterly Report on Form 10-Q for the quarterly periodended March 28, 2004 (File No. 1-15983), is incorporated by reference.
*10-c-3 Form of Restricted Share Unit Agreement under the 2004 Directors Stock Plan, filed as Exhibit 10-c-3 to ArvinMeritor’sAnnual Report on Form 10-K for the fiscal year ended October 2, 2004 (File No. 1-15983), is incorporated by reference.
*10-c-4 Form of Restricted Stock Agreement under the 2004 Directors Stock Plan.
*10-d-1 Incentive Compensation Plan, as amended and restated, filed as Exhibit 10-b to ArvinMeritor’s Current Report on Form8- K dated February 16, 2005 (File No. 1-15983), is incorporated by reference.
*10-d-2 Form of Deferred Share Award Agreement, filed as Exhibit 10 to ArvinMeritor’s Quarterly Report on Form 10-Q for thequarterly period ended January 2, 2005 (File No. 1-15983), is incorporated by reference.
*10-e Copy of resolution of the Board of Directors of ArvinMeritor, adopted on July 6, 2000, providing for its DeferredCompensation Policy for Non-Employee Directors, filed as Exhibit 10-f to the 2000 Form 10-K, is incorporatedby reference.
96

*10-f Deferred Compensation Plan, filed as Exhibit 10-e-1 to Meritor’s Annual Report on Form 10-K for the fiscal year endedSeptember 30, 1998 (File No. 1-13093), is incorporated by reference.
*10-g 1998 Stock Benefit Plan, as amended, filed as Exhibit (d)(2) to ArvinMeritor’s Schedule TO, Amendment No. 3 (File No. 5-61023), is incorporated by reference.
*10-h Employee Stock Benefit Plan, as amended, filed as Exhibit (d)(3) to ArvinMeritor’s Schedule TO, Amendment No. 3 (FileNo. 5-61023), is incorporated by reference.
*10-i 1988 Stock Benefit Plan, as amended, filed as Exhibit 10 to Arvin’s Quarterly Report on Form 10-Q for the quarterlyperiod ended July 3, 1988, and as Exhibit 10(E) to Arvin’s Quarterly Report on Form 10-Q for the quarterly period endedJuly 4, 1993 (File No. 1-302), is incorporated by reference.
10-j Loan Agreement, dated as of September 19, 2005, among ArvinMeritor, Inc., ArvinMeritor Receivables, Inc., theLenders from time to time party thereto and Suntrust Capital Markets, Inc., filed as Exhibit 10a to ArvinMeritor’s CurrentReport on Form 8-K dated September 16, 2005 (File No. 1-15983), is incorporated by reference.
10-k Second Amended and Restated Purchase and Sale Agreement, dated as of September 19, 2005, among ArvinMeritorOE, LLC and various affiliates, as Originators, and ArvinMeritor Receivables Corporation, filed as Exhibit 10b toArvinMeritor’s Current Report on Form 8-K dated September 16, 2005 (File No. 1-15983), is incorporated by reference.
*10-l Employment agreement between the company and Charles G. McClure, Jr., filed as Exhibit 10-s to ArvinMeritor’s AnnualReport on Form 10-K for the fiscal year ended October 2, 2004 (File No. 1-15983), is incorporated by reference.
*10-m Employment agreement between the company and James D. Donlon, III, filed as Exhibit 10 to ArvinMeritor’s CurrentReport on Form 8-K, dated April 12, 2005 (File No. 1-15983), is incorporated by reference.
*10-n Form of employment letter between ArvinMeritor and its executives, filed as Exhibit 10-a to ArvinMeritor’s Current Reporton Form 8-K, dated October 27, 2004 (File No. 1-15983), is incorporated by reference.
*10-o Supplement to employment letter between ArvinMeritor and Juan L. De La Riva, filed as Exhibit 10-b to ArvinMeritor’sCurrent Report on Form 8-K, dated October 27, 2004 (File No. 1-15983), is incorporated by reference.
*10-p Supplement to employment letter between ArvinMeritor and Thomas A. Gosnell, filed as Exhibit 10-c to ArvinMeritor’sCurrent Report on Form 8-K, dated October 27, 2004 (File No. 1-15983), is incorporated by reference.
12 Computation of ratio of earnings to fixed charges.
21 List of subsidiaries of ArvinMeritor.
23-a Consent of Vernon G. Baker, II, Esq., Senior Vice President and General Counsel of ArvinMeritor.
23-b Consent of Deloitte & Touche LLP, Independent Registered Public Accounting Firm.
23-c Consent of Bates White LLC.
24 Power of Attorney authorizing certain persons to sign this Annual Report on Form 10-K on behalf of certain directorsand officers of ArvinMeritor.
31-a Certification of the Chief Executive Officer pursuant to Rule 13a-14(a) under the Exchange Act.
31-b Certification of the Chief Financial Officer pursuant to Rule 13a-14(a) under the Exchange Act.
32-a Certification of the Chief Executive Officer pursuant to Rule 13a-14(b) under the Exchange Act and 18 U.S.C.Section 1350.
32-b Certification of the Chief Financial Officer pursuant to Rule 13a-14(b) under the Exchange Act and 18 U.S.C.Section 1350.
* Management contract or compensatory plan or arrangement.
97
SIGNATURESPursuant to the requirements of Section 13 or 15(d) of the Securities Exchange Act of 1934, the registrant has duly caused this
report to be signed on its behalf by the undersigned, thereunto duly authorized.
ARVINMERITOR, INC.
By: /s/ Vernon G. Baker, IIVernon G. Baker, IISenior Vice Presidentand General Counsel
Date: November 18, 2005
Pursuant to the requirements of the Securities Exchange Act of 1934, this report has been signed below on the 18th day ofNovember, 2005 by the following persons on behalf of the registrant and in the capacities indicated.
Charles G. McClure, Jr. * Chairman of the Board, Chief Executive Officer andPresident (principal executive officer) and Director
Joseph B. Anderson, Jr., Rhonda L. Brooks,David W. Devonshire, Ivor J. Evans, Joseph P.Flannery, William D. George, Jr., Richard W.Hanselman, Charles H. Harff, Victoria B. Jackson,James E. Marley, William R. Newlin, Steven G.Rothmeier and Andrew J. Schindler*
Directors
James D. Donlon, III* Senior Vice President and Chief Financial Officer(principal financial officer and principal accounting officer)
* By: /s/ Bonnie WilkinsonBonnie WilkinsonAttorney-in-fact**
**By authority of powers of attorney filed herewith.
98

SCHEDULE II
ARVINMERITOR, INC.
VALUATION AND QUALIFIYING ACCOUNTSFor the Year Ended September 30, 2005, 2004, 2003
Description (In millions)
Balance atBeginning
of Year
Chargedto Costs
and ExpensesOther
DeductionsBalance at End
of Year
Year ended September 30, 2005:Allowance for doubtful accounts . . . . . . . . . . . . . . . . . . . . . . . . . . . . . $26 $19 $11 (a) $ 34Deferred tax asset valuation allowance . . . . . . . . . . . . . . . . . . . . . . . 93 55 — 148
Year ended September 30, 2004:Allowance for doubtful accounts . . . . . . . . . . . . . . . . . . . . . . . . . . . . . $16 $19 $ 9 (a) $ 26Deferred tax asset valuation allowance . . . . . . . . . . . . . . . . . . . . . . . 62 39 8 (b) 93
Year ended September 30, 2003:Allowance for doubtful accounts . . . . . . . . . . . . . . . . . . . . . . . . . . . . . $12 $ 8 $ 4 (a) $ 16Deferred tax asset valuation allowance . . . . . . . . . . . . . . . . . . . . . . . 42 24 4 (b) 62
(a) Uncollectible accounts written off.(b) Underlying deferred tax asset written off.
S-1

Executive Officers
Charles G. McClure
Chairman of the Board Chief Executive Officerand President
Vernon G. Baker, II
Senior Vice Presidentand General Counsel
Brian P. Casey
Vice Presidentand Treasurer
Linda M. Cummins
Senior Vice President,Communications
William K. Daniel II
Senior Vice Presidentand President, LightVehicle Aftermarket
Juan L. De La Riva
Senior Vice Presidentand President, LightVehicle Systems
James D. Donlon, III
Senior Vice Presidentand Chief FinancialOfficer
Thomas A. Gosnell
Senior Vice Presidentand President,Commercial VehicleSystems
Perry L. Lipe
Senior Vice Presidentand Chief InformationOfficer
Rakesh Sachdev
Senior Vice President,Strategy and CorporateDevelopment
Ernest T. Whitus
Senior Vice President,Human Resources
Bonnie Wilkinson
Vice Presidentand Secretary

Annual Meeting
The company’s annual meeting of shareowners will be held inTroy, Mich., on Tuesday, Jan. 31, 2006. A notice of meetingand proxy material will be mailed to shareowners on or aboutDec. 16, 2005.
ArvinMeritor Headquarters
2135 West Maple RoadTroy, MI 48084-7186Phone: (248) 435-1000Fax: (248) 435-1393 www.arvinmeritor.com
Board Communications
For questions or concerns with respect to internal controls,auditing and accounting matters, you may contact the AuditCommittee of the Board of Directors at the following address:
ArvinMeritor Audit Committee 330 East Maple RoadPMB 315Birmingham, MI 48009 E-mail: [email protected]
For other questions or concerns, you may contact the Boardof Directors at the following address:
ArvinMeritor Board of Directors330 East Maple RoadPMB 335Birmingham, MI 48009
Corporate Media Relations
Members of the media should contact:Media RelationsPhone: (248) 435-7115
Dividend Reinvestment and AdditionalInvestments in ArvinMeritor Common Stock
The Bank of New York provides the BuyDIRECT Program forArvinMeritor shareowners, under which current shareownersmay elect to reinvest dividends and/or make optional cashinvestments in additional shares of ArvinMeritor commonstock. The program also allows cash investments inArvinMeritor common stock by first-time investors, witha $500 minimum initial investment. Shareowners mayalso sell their shares through the BuyDIRECT Program.
Requests for a brochure about the BuyDIRECT Program,and communications about sale of shares, optional cashinvestments and liquidations should be directed to:
The Bank of New YorkDividend Reinvestment DepartmentP.O. Box 1958Newark, NJ 07101-9774Toll Free: (866) 517-4570
Independent Auditors
Deloitte & Touche LLP600 Renaissance Center Detroit, MI 48243-1704 Phone: (313) 396-3000
Investor Relations
Security analysts and professional investors should contact:Investor Relations 2135 West Maple RoadTroy, MI 48084-7186www.arvinmeritor.com/investor/investor.aspPhone: (866) INFO-ARM or (866) 463-6276Fax: (248) 435-1189E-mail: [email protected]
Copies of annual reports, Forms 10-K and 10-Q, andother ArvinMeritor publications can be obtained atwww.arvinmeritor.com/investor/investor.asp or bycalling (866) INFO-ARM or (866) 463-6276.
New York Stock Exchange
Common Stock (Symbol: ARM)
Shareowner Services
Communications about share ownership, book-entry accounts,dividend payments, transfer requirements, changes of address,lost stock certificates and account status should be directed to:
The Bank of New York Church Street Station P.O. Box 11258 New York, NY 10286-1258 Toll Free: (866) 517-4570 www.stockbny.com
Transfer Agent and Registrar
The Bank of New York Church Street Station P.O. Box 11258 New York, NY 10286-1258 Toll Free: (866) 517-4570 www.stockbny.com
Shareowner Information

ArvinMeritor Inc.2135 West Maple Road Litho in USATroy, MI 48084 USA(248) 435-1000 © Copyright 2005 Issued 12-05www.arvinmeritor.com ArvinMeritor Inc. SP-0627
Headquartered in Troy, Mich., U.S.,
ArvinMeritor is a premier supplier to the global
motor vehicle industry. With approximately
29,000 employees in 25 countries, the
company supplies a broad range of integrated
systems, modules and components to light
vehicle, commercial truck, trailer and specialty
original equipment manufacturers and related
aftermarkets. ArvinMeritor products are part of
virtually every vehicle on the road.
ArvinMeritor is built on a tradition of
responsiveness, quality and service.With more
than 120 manufacturing facilities around the
world, the company has the scale and scope to
provide effective, integrated automotive
solutions to meet its customers’ changing
needs – when and where they are needed.
The company’s common stock is traded on the
New York Stock Exchange under the ticker
symbol ARM. To learn more, visit our Web site
at www.arvinmeritor.com.