Embed Size (px)
Citation preview
2004 Exit Interviews
and
One and Three Year Telephone
Follow-up Interviews
of the 1999 through 2003 Student Cohorts and
Comparison of 1999 – 2001 Cohorts
Prepared by Alison Dollar
M. Bryce Fifield And
Brent Askvig
North Dakota Center for Persons with Disabilities A University Center of Excellence at
Minot State University
Spring, 2005 Available in Alternative Format
Preparation of this report and the conduct of this research were supported by the ND Department of Public Instruction (DPI), Office of Special Education through a contract to the ND Center for Persons with Disabilities. The opinions expressed here are those of the authors and do not necessarily reflect the opinions or policy of DPI.
Table of Contents Appendices, Tables & Figures
Appendices A. Exit Interview Directions .........................................................................................53 B. School Report Forms and Code Key ........................................................................58 C. Telephone Interview Questionnaire..........................................................................61 D. Introduction Script and Frequently Asked Questions Sheet .....................................65 E. Anecdotal Comments................................................................................................67 Tables Table 1 Student Numbers for Participating Special Education Units......................................7 Table 2 Racial Background of 2004 Exiters ...........................................................................8 Table 3 Disability of Participating Students ............................................................................8 Table 4 Degree of IEP Participation by Exiters ......................................................................9 Table 5 Potential Post-school Adult Service Providers .........................................................10 Table 6 Occupational Skills Attained in High School ..........................................................11 Table 7 Satisfaction with Various High School Programs ....................................................12 Table 8 Choices of Additional Courses in High School ........................................................12 Table 9 Cohort Numbers for Six Years Follow-up Study .....................................................13 Table 10 Disability Represented by Year ................................................................................14 Table 11 Race of Exiters by Year ............................................................................................15 Table 12 Possible Adult Services Needed ..............................................................................18 Table 13 Occupational Skills Attained ....................................................................................19 Table 14 Rating Point Averages for High School Program Components Across Cohorts......22 Table 15 Participating students ................................................................................................38 Figures Figure 1 Post-school option choices by students in 2003 cohort ..............................................9 Figure 2 Reasons for exiting school for the 2002 cohort ........................................................10 Figure 3 Gender of school exiters over the five year span......................................................14 Figure 4 Percent of students with at least one career or post-school goal on their last IEP ...16 Figure 5 IEP attendance and participation rates of the cohort students. .................................16 Figure 6 Post-secondary plans of school exiters .....................................................................17 Figure 7 Exit reasons...............................................................................................................19 Figure 8 Overall satisfaction with high school........................................................................20 Figure 9 Satisfaction with vocational/transition programs......................................................21 Figure 10 Satisfaction with special education programs...........................................................21 Figure 11 Take more classes in the following areas .................................................................22 Figure 12 Percent of students attending/attended school after high school ..............................26 Figure 13 Percent of students currently employed....................................................................27 Figure 14 Percent of unemployed students currently looking for a job ....................................27 Figure 15 Percentage of students with other jobs......................................................................28 Figure 16 Average wages, hours and time on job for students .................................................29 Figure 17 Percent of students satisfied with current job ...........................................................29 Figure 18 Percent of students by living arrangements ..............................................................30
Figure 19 Percent of students who are married.........................................................................31 Figure 20 Percent of students who have children......................................................................31 Figure 21 Percent of times per week that students go out with others......................................32 Figure 22 Percent of students who reported doing volunteer work ..........................................33 Figure 23 Percent of students receiving post-high school services for their disability.............34 Figure 24 Percent of students referred to adult services agencies for post-school services......34 Figure 25 Percent of students satisfied with high school ..........................................................36 Figure 26 Percent of parents who thought students were prepared for life after high school...37 Figure 27 Percent of students attending/attended school after high school ..............................39 Figure 28 Percent of students currently employed....................................................................40 Figure 29 Percent of unemployed students currently looking for a job ....................................41 Figure 30 Percentage of students with other jobs......................................................................41 Figure 31 Average wages, hours and time on job for students .................................................42 Figure 32 Percent of students satisfied with current job ...........................................................43 Figure 33 Percent of students by living arrangements ..............................................................44 Figure 34 Percent of students who are married.........................................................................45 Figure 35 Percent of students who have children......................................................................45 Figure 36 Percent of times per week that students go out with others......................................46 Figure 37 Percent of students who reported doing volunteer work ..........................................47 Figure 38 Percent of students receiving post-high school services for their disability.............47 Figure 39 Percent of students referred to adult services agencies for post-school services......48 Figure 40 Percent of students satisfied with high school ..........................................................49 Figure 41 Percent of parents who thought students were prepared for life after high school...51
Introduction
Over the past several years the special education field has paid close attention to the
outcomes of special education services. In fact, the U.S. Department of Public Education has
established outcome standards in accordance with the Government Performance and Results Act
(GPRA). These standards are used to measure the impact of Department of Public Education
(including special education) services to children and youth throughout the country.
One area of study in special education has been the transition period for students with
disabilities as they begin and continue through the process of exiting public schools. The
Department of Education, Office of Special Education (OSEP) GPRA standards require the
measurement of high school graduation rates, dropout rates, and student performance on state
and local assessments (22nd Annual Report to Congress). To that end, this report assists North
Dakota in meeting certain federal reporting requirements.
In 1998, staff from the North Dakota Department of Public Instruction (DPI)
conceptualized a two-phase study to follow students with disabilities as they left the public
education system. The study is a longitudinal project that examines student status at exit from
high school, and then at one and three year intervals after school. Items of interest include
satisfaction with high school, involvement in transition planning, and degree of post-school
involvement in employment, living, and social arrangements. The two phases of the study
include gathering school exit data from students with disabilities, and then gathering follow-up
data from these students and/or their families through telephone interviews. School personnel
complete the exit interviews, and NDCPD students and staff conduct the follow-up telephone
interviews.
Section One is a summary of the data and analyses of the 2004 exit interviews of North
Dakota (ND) students with disabilities. Educators in 25 special education units collected the raw
data across the state. This is the sixth cohort of a longitudinal, cross sectional study of special
education students who have left the school system due to graduation, aging out of services, or
dropping out. First, the 2004 cohort data is presented. Second, the data across all six cohort
groups is compared, 1999 – 2004. In each comparisons are drawn and interesting features are
pointed out of the data in relation to the published national school exiters’ data. For a more in-
depth analysis of ND trends, the reader is encouraged to compare these results to those presented
in a companion report, the Follow-up Interview Data Report, found in Section Two. Section
Three offers a comparison of data gathered three years after completing school. Finally, Section
Four compares data collected one and three years after school exiting. Comparisons are also
made between cohorts one and three years later.
Section One
2004 Exit Interview Data
Data Collection Method
The data for this report were collected through a process established by DPI. Special
education unit staff were supported by DPI in the collection of data on students who were
leaving school due to graduation, aging out of services, or dropping out of school. Written
directions (see Appendix A) were provided to the staff regarding the data collection process.
School staff were instructed to conduct personal interviews with each student who was exiting
the program. Additional information was available in the student’s school file or on the
individual education plan (IEP). Data from all students in a school were collated on school report
forms, one per school (see Appendix B). These school report forms were then sent to DPI. In
some situations special education units had not completed the forms and the North Dakota
Center for Persons with Disabilities (NDCPD) staff contacted those units and obtained the
missing forms.
Once the data forms were obtained, all information was entered into two data files. The
first data file contained the numerical responses to the demographic information and the 10
survey questions. Numerical codes were attached to maintain student confidentiality. The second
file contained the compiled anecdotal responses to questions 3, 4, and 6.
Results
Participating special education units. Twenty-five special education units participated in
the 2004 exit interview process, resulting in 491exit interviews. Numbers of students and
percentages of the total response set are shown in Table 1.
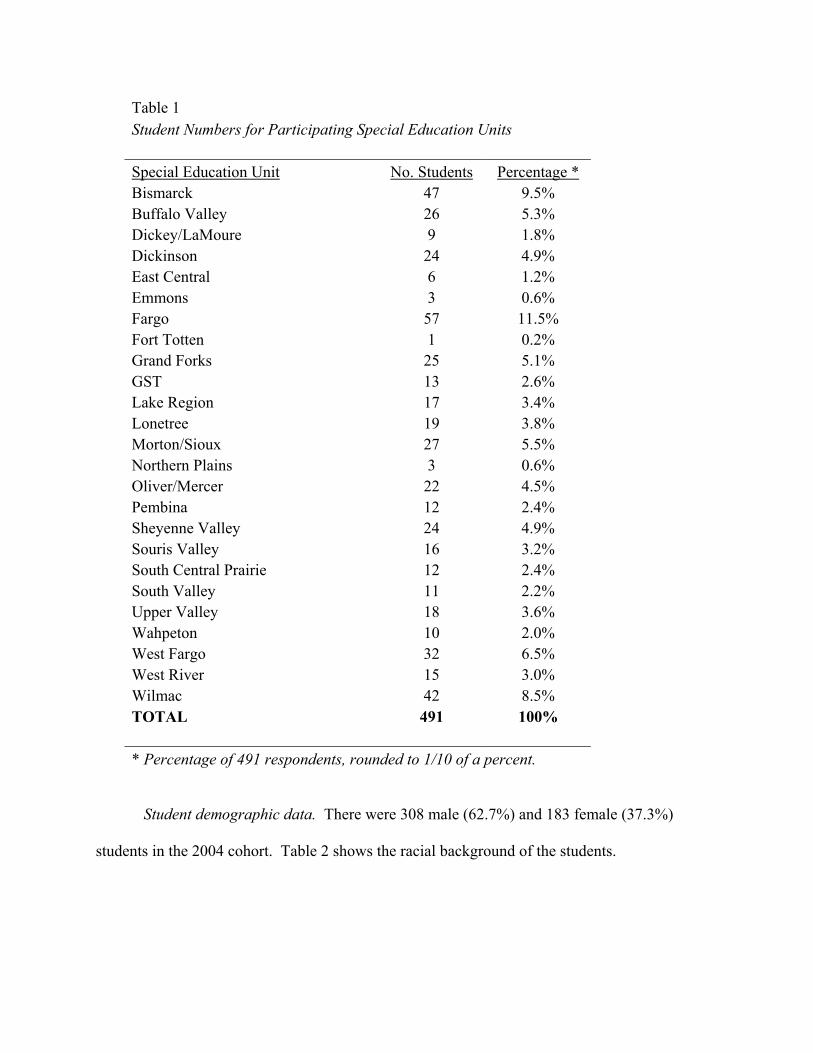
Table 1 Student Numbers for Participating Special Education Units Special Education Unit No. Students Percentage * Bismarck 47 9.5% Buffalo Valley 26 5.3% Dickey/LaMoure 9 1.8% Dickinson 24 4.9% East Central 6 1.2% Emmons 3 0.6% Fargo 57 11.5% Fort Totten 1 0.2% Grand Forks 25 5.1% GST 13 2.6% Lake Region 17 3.4% Lonetree 19 3.8% Morton/Sioux 27 5.5% Northern Plains 3 0.6% Oliver/Mercer 22 4.5% Pembina 12 2.4% Sheyenne Valley 24 4.9% Souris Valley 16 3.2% South Central Prairie 12 2.4% South Valley 11 2.2% Upper Valley 18 3.6% Wahpeton 10 2.0% West Fargo 32 6.5% West River 15 3.0% Wilmac 42 8.5% TOTAL 491 100% * Percentage of 491 respondents, rounded to 1/10 of a percent.
Student demographic data. There were 308 male (62.7%) and 183 female (37.3%)
students in the 2004 cohort. Table 2 shows the racial background of the students.
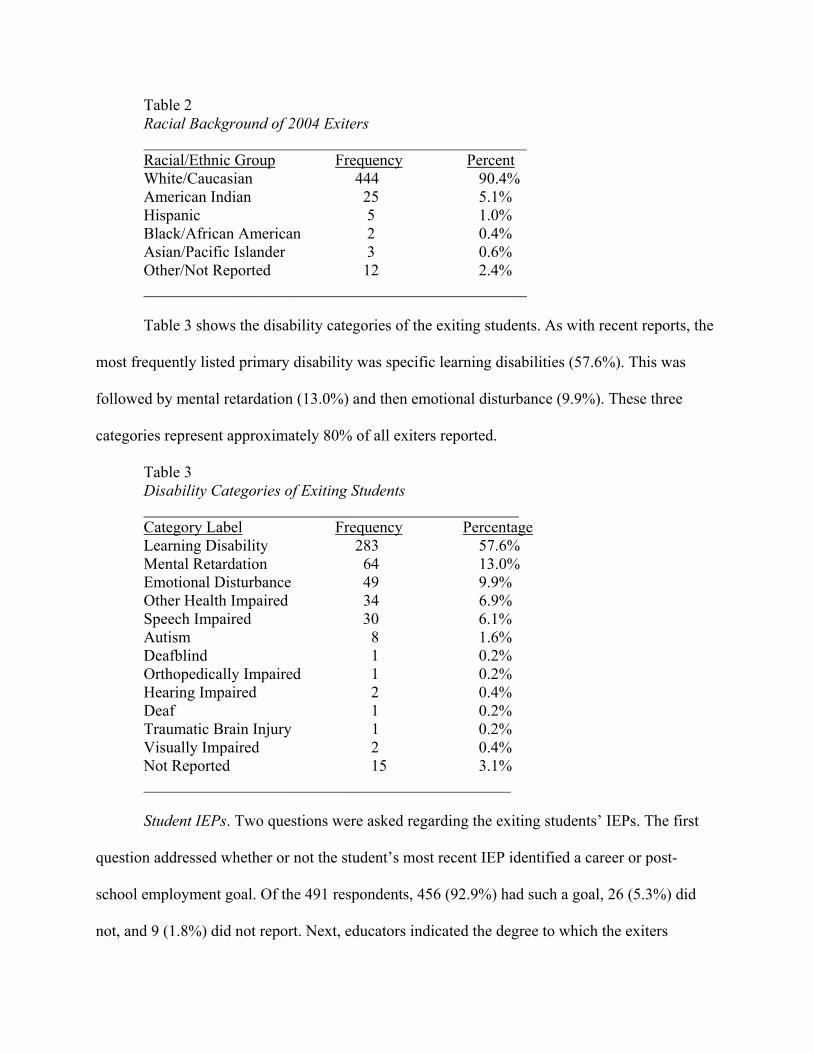
Table 2 Racial Background of 2004 Exiters ________________________________________________
Racial/Ethnic Group Frequency Percent White/Caucasian 444 90.4% American Indian 25 5.1% Hispanic 5 1.0% Black/African American 2 0.4% Asian/Pacific Islander 3 0.6% Other/Not Reported 12 2.4%
________________________________________________
Table 3 shows the disability categories of the exiting students. As with recent reports, the
most frequently listed primary disability was specific learning disabilities (57.6%). This was
followed by mental retardation (13.0%) and then emotional disturbance (9.9%). These three
categories represent approximately 80% of all exiters reported.
Table 3 Disability Categories of Exiting Students _______________________________________________ Category Label Frequency Percentage Learning Disability 283 57.6% Mental Retardation 64 13.0% Emotional Disturbance 49 9.9% Other Health Impaired 34 6.9% Speech Impaired 30 6.1% Autism 8 1.6% Deafblind 1 0.2% Orthopedically Impaired 1 0.2% Hearing Impaired 2 0.4% Deaf 1 0.2% Traumatic Brain Injury 1 0.2% Visually Impaired 2 0.4% Not Reported 15 3.1% ______________________________________________
Student IEPs. Two questions were asked regarding the exiting students’ IEPs. The first
question addressed whether or not the student’s most recent IEP identified a career or post-
school employment goal. Of the 491 respondents, 456 (92.9%) had such a goal, 26 (5.3%) did
not, and 9 (1.8%) did not report. Next, educators indicated the degree to which the exiters
participated in their most recent IEP meetings. These data are shown in Table 4. Based on the
data, most students attended their IEP meetings and participated in them.
Table 4 Degree of IEP Participation by Exiters _____________________________________________________ Participation Level Frequency Percentage
Attended and participated 410 83.5% Attended but didn’t participate 41 8.4% Did not attend 33 6.7% Not reported 7 1.4%
_____________________________________________________ Post-secondary Plans
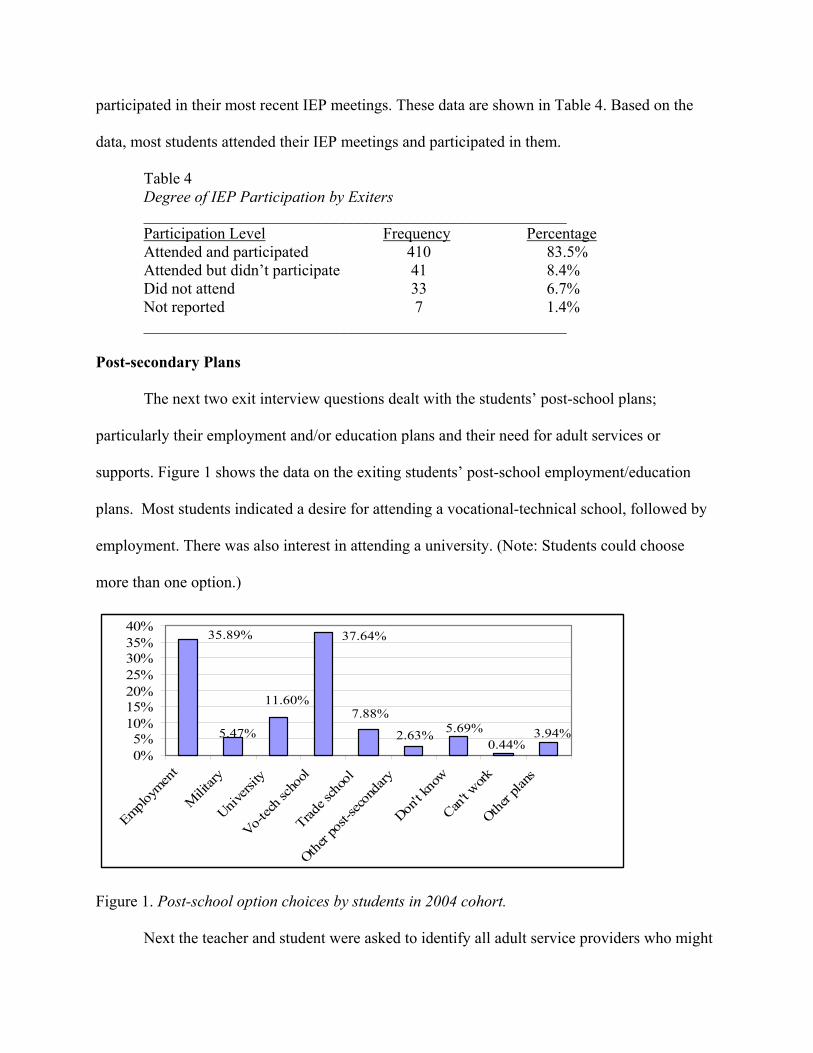
The next two exit interview questions dealt with the students’ post-school plans;
particularly their employment and/or education plans and their need for adult services or
supports. Figure 1 shows the data on the exiting students’ post-school employment/education
plans. Most students indicated a desire for attending a vocational-technical school, followed by
employment. There was also interest in attending a university. (Note: Students could choose
more than one option.)
11.60%
5.47%
35.89% 37.64%
3.94%0.44%
5.69%7.88%
2.63%
0%5%
10%15%20%25%30%35%40%
Employm
ent
Milit
ary
Univers
ity
Vo-tech
scho
ol
Trade s
choo
l
Other p
ost-s
econd
ary
Don't k
now
Can't w
ork
Other p
lans
Figure 1. Post-school option choices by students in 2004 cohort.
Next the teacher and student were asked to identify all adult service providers who might
assist the student after leaving school. These data are shown in Table 5. Over half of the students
indicated a possible future need for services from Vocational Rehabilitation (61.7%), and just
over one third might need supports through a university’s disability services office. Interestingly,
18.5% of these students were not anticipating a need for any services after high school.
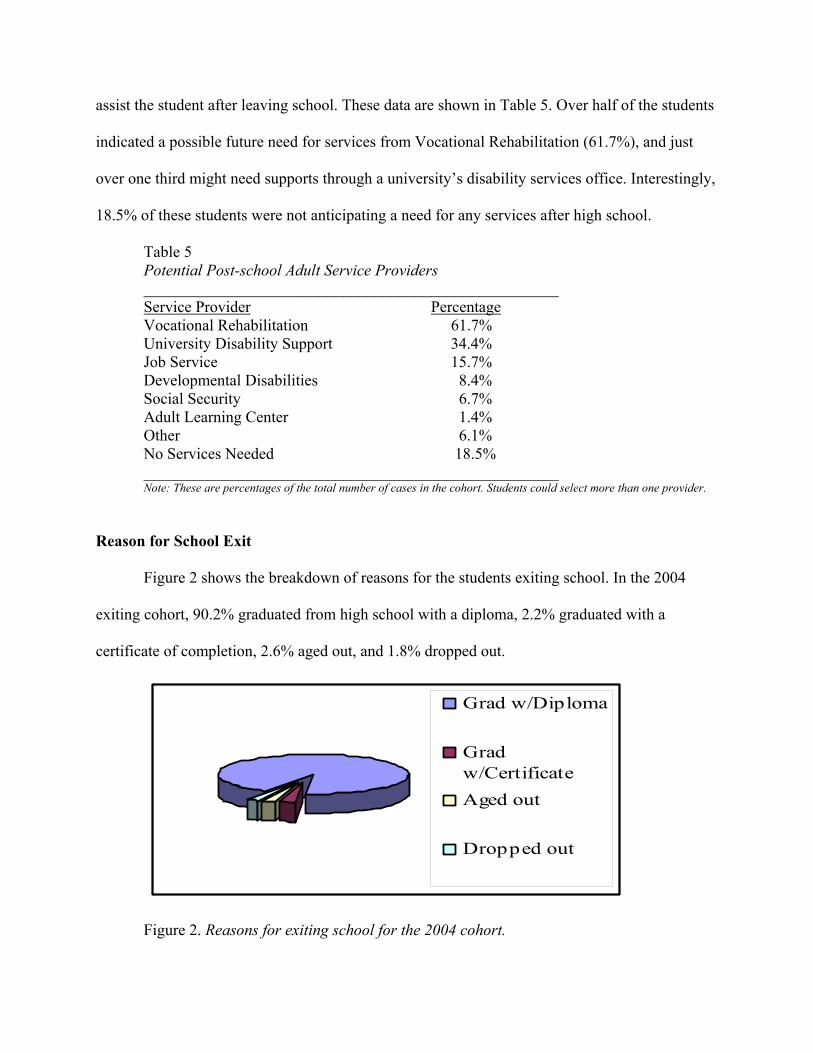
Table 5 Potential Post-school Adult Service Providers ____________________________________________________ Service Provider Percentage Vocational Rehabilitation 61.7% University Disability Support 34.4% Job Service 15.7% Developmental Disabilities 8.4% Social Security 6.7% Adult Learning Center 1.4% Other 6.1% No Services Needed 18.5% ____________________________________________________
Note: These are percentages of the total number of cases in the cohort. Students could select more than one provider.
Reason for School Exit
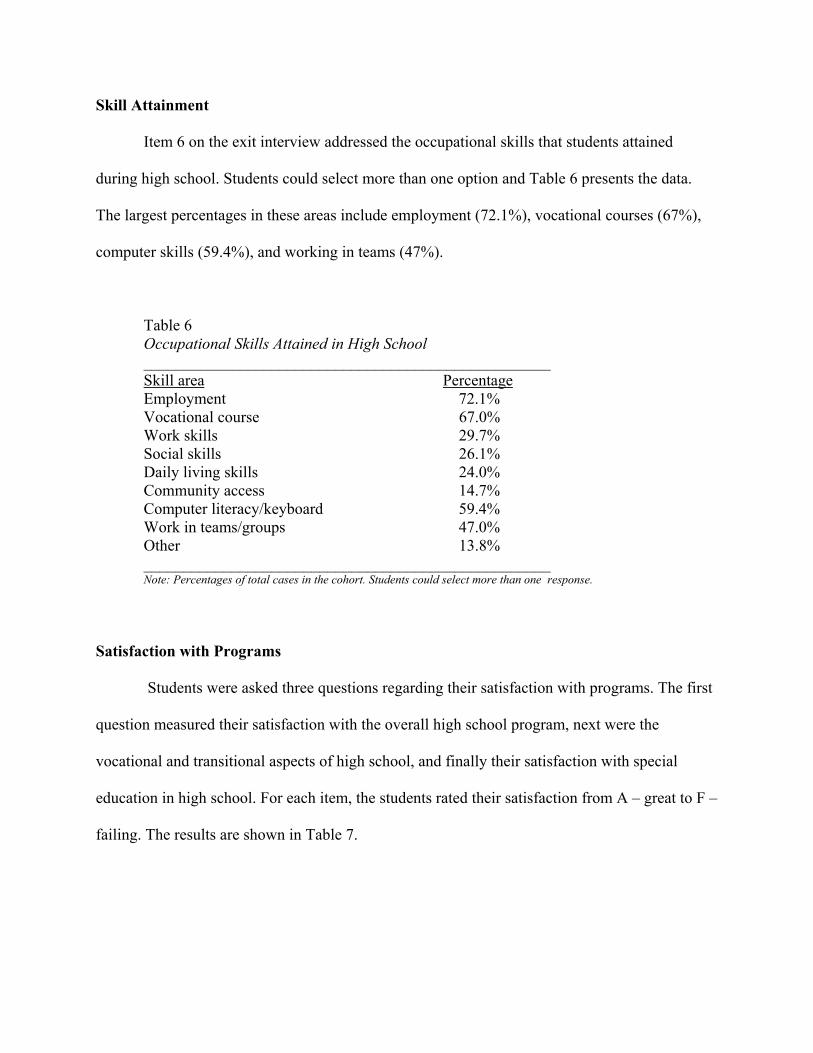
Figure 2 shows the breakdown of reasons for the students exiting school. In the 2004
exiting cohort, 90.2% graduated from high school with a diploma, 2.2% graduated with a
certificate of completion, 2.6% aged out, and 1.8% dropped out.
Grad w/Diploma
Gradw/CertificateAged out
Dropped out
Figure 2. Reasons for exiting school for the 2004 cohort.
Skill Attainment
Item 6 on the exit interview addressed the occupational skills that students attained
during high school. Students could select more than one option and Table 6 presents the data.
The largest percentages in these areas include employment (72.1%), vocational courses (67%),
computer skills (59.4%), and working in teams (47%).
Table 6 Occupational Skills Attained in High School ___________________________________________________ Skill area Percentage Employment 72.1% Vocational course 67.0% Work skills 29.7% Social skills 26.1% Daily living skills 24.0% Community access 14.7% Computer literacy/keyboard 59.4% Work in teams/groups 47.0% Other 13.8% ___________________________________________________
Note: Percentages of total cases in the cohort. Students could select more than one response.
Satisfaction with Programs
Students were asked three questions regarding their satisfaction with programs. The first
question measured their satisfaction with the overall high school program, next were the
vocational and transitional aspects of high school, and finally their satisfaction with special
education in high school. For each item, the students rated their satisfaction from A – great to F –
failing. The results are shown in Table 7.
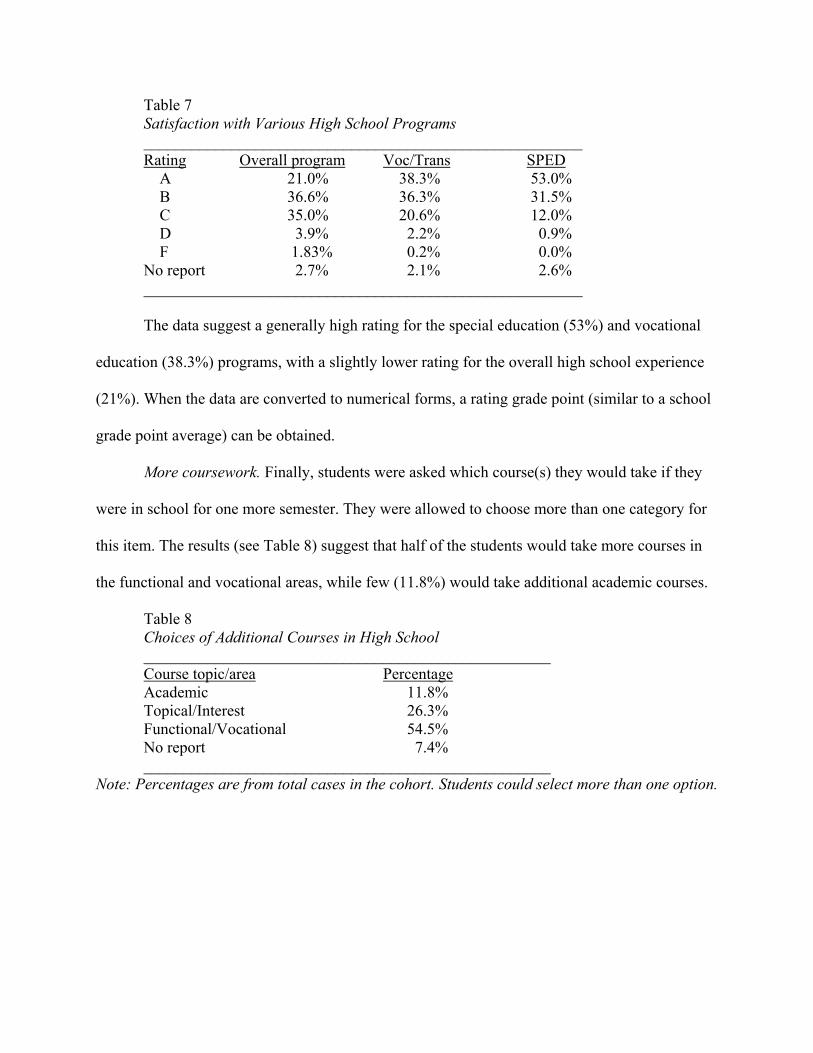
Table 7 Satisfaction with Various High School Programs _______________________________________________________ Rating Overall program Voc/Trans SPED A 21.0% 38.3% 53.0% B 36.6% 36.3% 31.5% C 35.0% 20.6% 12.0% D 3.9% 2.2% 0.9% F 1.83% 0.2% 0.0% No report 2.7% 2.1% 2.6% _______________________________________________________
The data suggest a generally high rating for the special education (53%) and vocational
education (38.3%) programs, with a slightly lower rating for the overall high school experience
(21%). When the data are converted to numerical forms, a rating grade point (similar to a school
grade point average) can be obtained.
More coursework. Finally, students were asked which course(s) they would take if they
were in school for one more semester. They were allowed to choose more than one category for
this item. The results (see Table 8) suggest that half of the students would take more courses in
the functional and vocational areas, while few (11.8%) would take additional academic courses.
Table 8 Choices of Additional Courses in High School
___________________________________________________ Course topic/area Percentage Academic 11.8% Topical/Interest 26.3% Functional/Vocational 54.5% No report 7.4%
___________________________________________________ Note: Percentages are from total cases in the cohort. Students could select more than one option.
Section Two
1999 – 2004 Exit Data Comparison Report
This section presents a comparison of the data from the 1999 through the 2004 exiting
cohorts. Complicated statistical analyses were not used but rather data are presented in side-by-
side graphical comparisons. The purpose is to present the data in ways that possible trends might
be identified. Educators and policy-makers who adjust in the service delivery systems for
students transitioning from special education programs into adult life could use these data to
discuss trends found.
Results
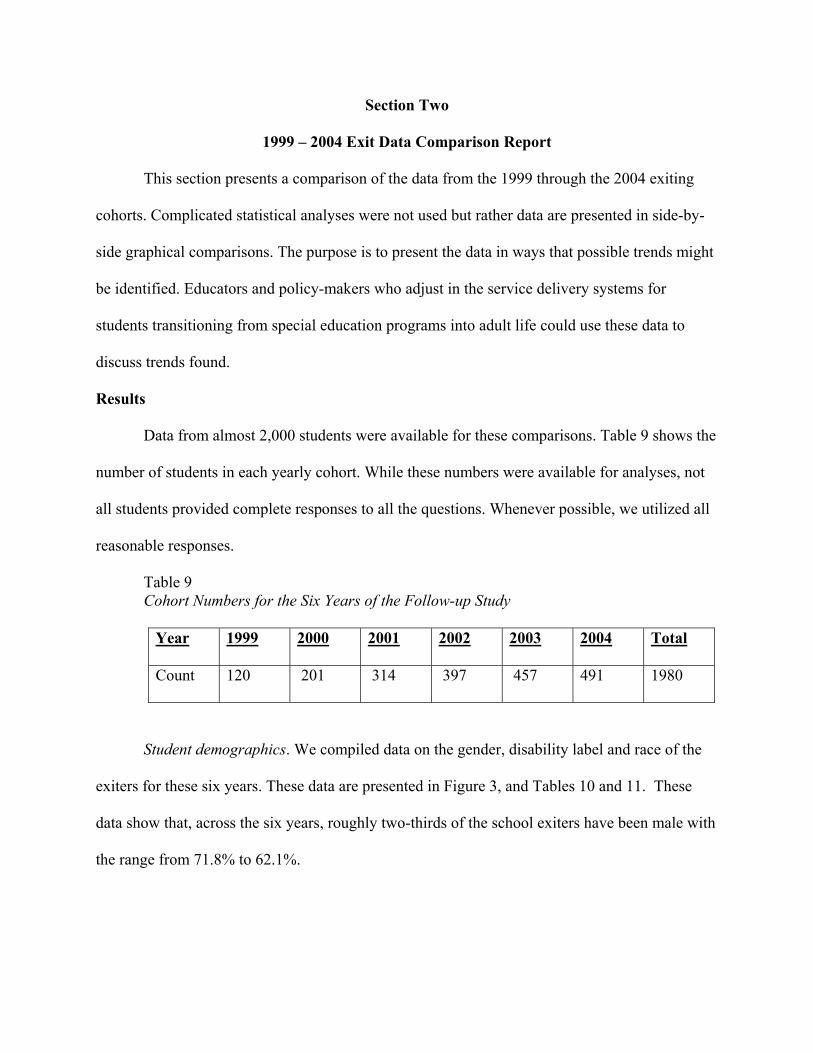
Data from almost 2,000 students were available for these comparisons. Table 9 shows the
number of students in each yearly cohort. While these numbers were available for analyses, not
all students provided complete responses to all the questions. Whenever possible, we utilized all
reasonable responses.
Table 9 Cohort Numbers for the Six Years of the Follow-up Study
Year 1999 2000 2001 2002 2003 2004 Total
Count 120 201 314 397 457 491 1980
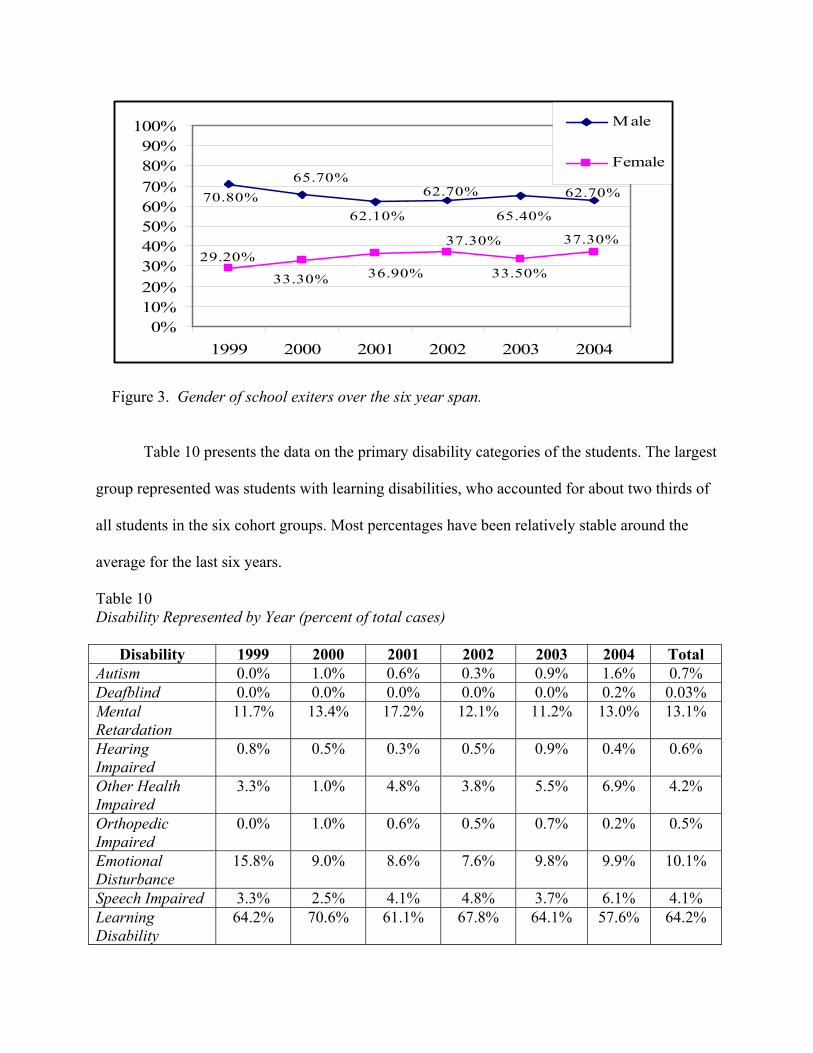
Student demographics. We compiled data on the gender, disability label and race of the
exiters for these six years. These data are presented in Figure 3, and Tables 10 and 11. These
data show that, across the six years, roughly two-thirds of the school exiters have been male with
the range from 71.8% to 62.1%.
62.70%
65.40%
62.70%
62.10%
65.70%70.80%
37.30%
33.50%
37.30%
36.90%33.30%
29.20%
0%10%20%30%40%50%60%70%80%90%
100%
1999 2000 2001 2002 2003 2004
Male
Female
Figure 3. Gender of school exiters over the six year span.
Table 10 presents the data on the primary disability categories of the students. The largest
group represented was students with learning disabilities, who accounted for about two thirds of
all students in the six cohort groups. Most percentages have been relatively stable around the
average for the last six years.
Table 10 Disability Represented by Year (percent of total cases)
Disability 1999 2000 2001 2002 2003 2004 Total Autism 0.0% 1.0% 0.6% 0.3% 0.9% 1.6% 0.7% Deafblind 0.0% 0.0% 0.0% 0.0% 0.0% 0.2% 0.03% Mental Retardation
11.7% 13.4% 17.2% 12.1% 11.2% 13.0% 13.1%
Hearing Impaired
0.8% 0.5% 0.3% 0.5% 0.9% 0.4% 0.6%
Other Health Impaired
3.3% 1.0% 4.8% 3.8% 5.5% 6.9% 4.2%
Orthopedic Impaired
0.0% 1.0% 0.6% 0.5% 0.7% 0.2% 0.5%
Emotional Disturbance
15.8% 9.0% 8.6% 7.6% 9.8% 9.9% 10.1%
Speech Impaired 3.3% 2.5% 4.1% 4.8% 3.7% 6.1% 4.1% Learning Disability
64.2% 70.6% 61.1% 67.8% 64.1% 57.6% 64.2%
Disability 1999 2000 2001 2002 2003 2004 Total Traumatic Brain Injury
0.0% 0.5% 0.3% 0.8% 0.4% 0.2% 0.4%
Vision Impaired 0.0% 0.5% 0.3% 1.0% 0.0% 0.4% 0.4% Deaf 0.0% 0.0% 0.0% 0.3% 0.0% 0.2% 0.1%
Table 11 presents the data on race of the exiters. These students are predominantly
Caucasian, with the category of American Indian/Alaskan Native being the most prevalent
minority category. These data appear to mirror the North Dakota demographics as to race and
minority representation in the schools. It appears that the variations in percentages of American
Indian students might be accounted for by the participation of special education units on or near
reservations. In some years, those units did not report school exiters, thus influencing the results
and data patterns.
Table 11 Race of Exiters by Year (percent of total cases)
Race 1999 2000 2001 2002 2003 2004 Total White 82.5% 87.1% 93.3% 92.7% 89.7% 90.4% 89.3% American Indian/ Alaska Native
10.0% 8.0% 2.9% 4.5% 5.9% 5.1% 6.1%
Hispanic 0.8% 0.5% 1.0% 1.0% 0.4% 1.0% 0.8% Black 0.8% 2.5% 0.0% 0.0% 1.3% 0.4% 0.8% Asian Pacific Islander 0.8% 0.5% 1.3% 0.5% 0.2% 0.6% .65%
Other 0.8% 0.5% 0.0% 0.0% 2.4% 2.4% 1.0%
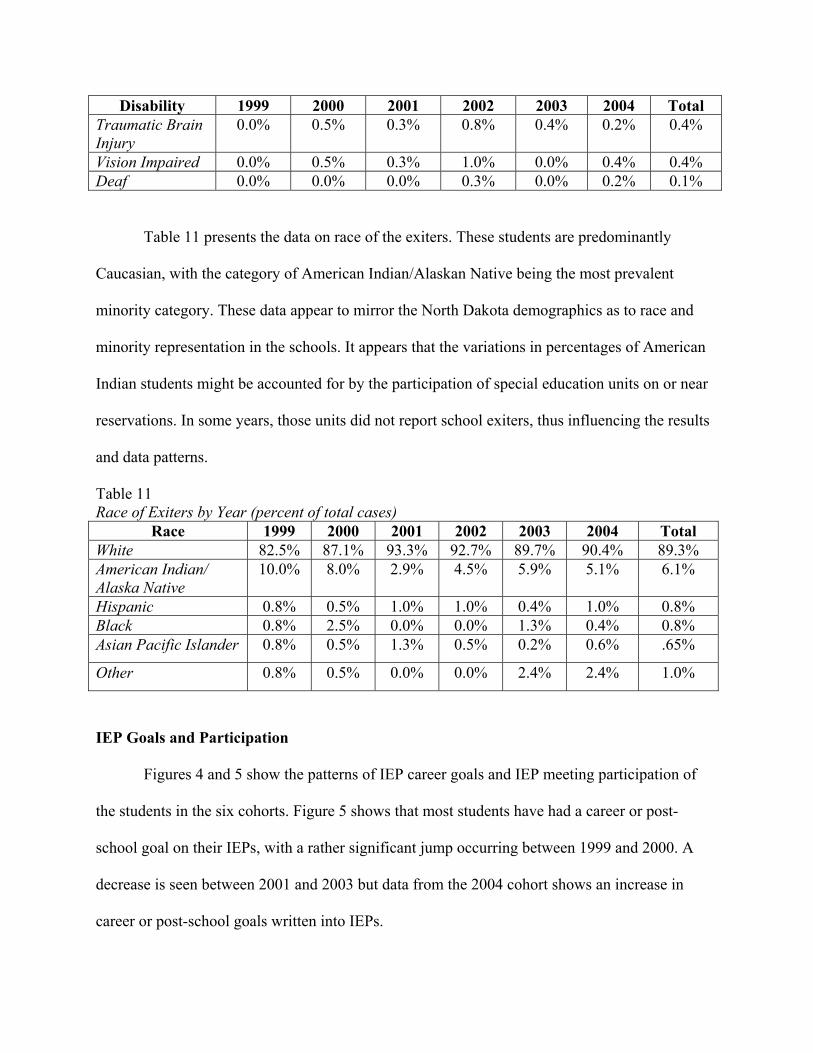
IEP Goals and Participation
Figures 4 and 5 show the patterns of IEP career goals and IEP meeting participation of
the students in the six cohorts. Figure 5 shows that most students have had a career or post-
school goal on their IEPs, with a rather significant jump occurring between 1999 and 2000. A
decrease is seen between 2001 and 2003 but data from the 2004 cohort shows an increase in
career or post-school goals written into IEPs.
75.80%87.20% 86.70% 92.90%93.00%92.00%
0%10%20%30%40%50%60%70%80%90%
100%
1999 2000 2001 2002 2003 2004
Figure 4. Percent of students with at least one career or post-school goal on their last IEP.
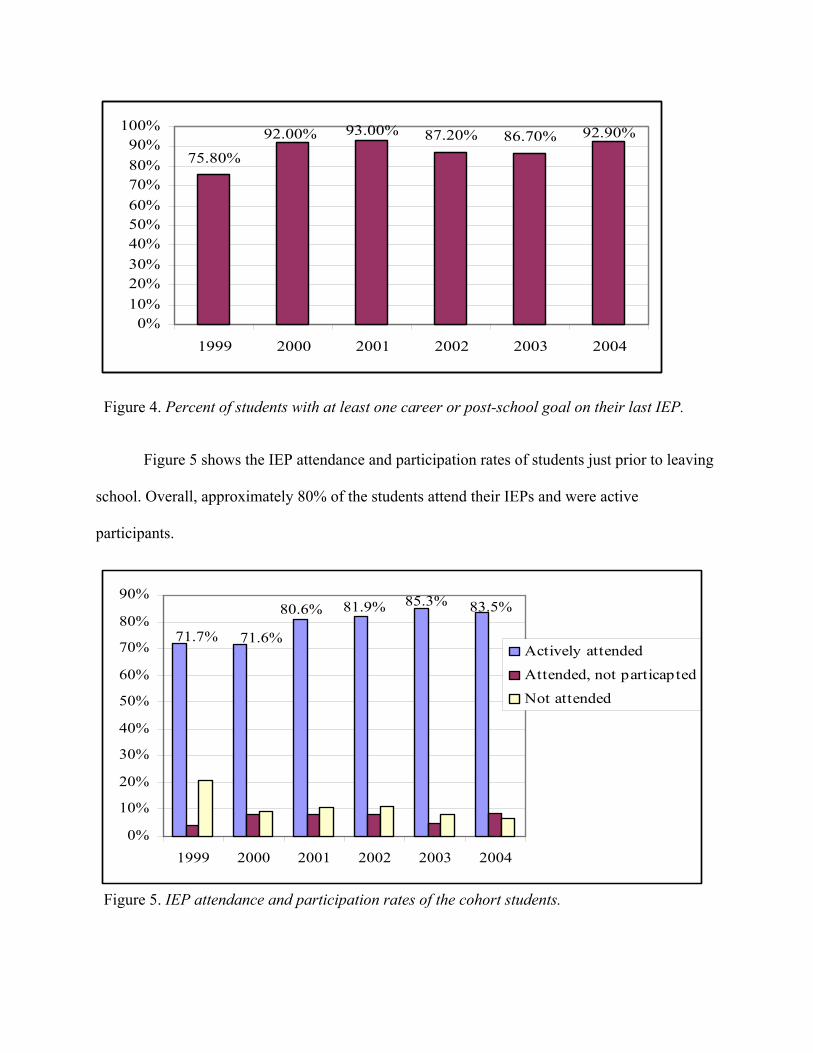
Figure 5 shows the IEP attendance and participation rates of students just prior to leaving
school. Overall, approximately 80% of the students attend their IEPs and were active
participants.
83.5%85.3%81.9%80.6%
71.6%71.7%
0%
10%
20%
30%
40%
50%
60%
70%
80%
90%
1999 2000 2001 2002 2003 2004
Actively attended
Attended, not particapted
Not attended
Figure 5. IEP attendance and participation rates of the cohort students.
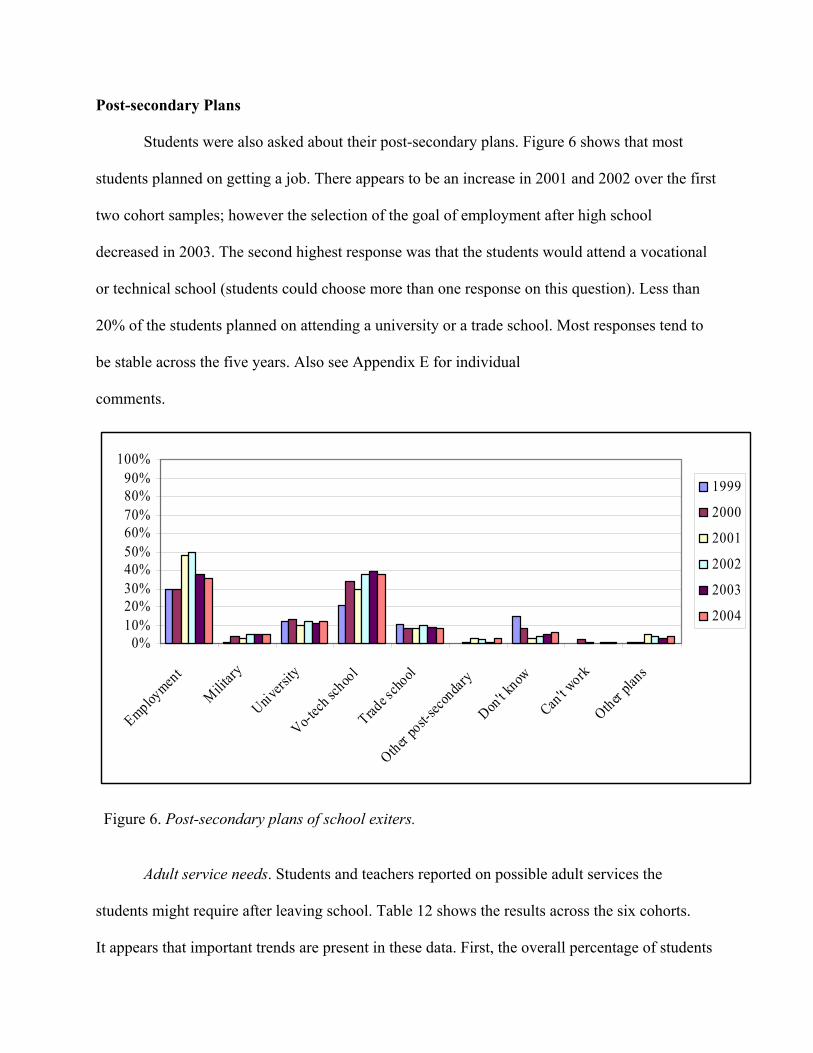
Post-secondary Plans
Students were also asked about their post-secondary plans. Figure 6 shows that most
students planned on getting a job. There appears to be an increase in 2001 and 2002 over the first
two cohort samples; however the selection of the goal of employment after high school
decreased in 2003. The second highest response was that the students would attend a vocational
or technical school (students could choose more than one response on this question). Less than
20% of the students planned on attending a university or a trade school. Most responses tend to
be stable across the five years. Also see Appendix E for individual
comments.
0%10%20%30%40%50%60%70%80%90%
100%
Employmen
t
Military
Univers
ity
Vo-tech
schoo
l
Trade s
chool
Other po
st-sec
ondar
y
Don't k
now
Can't w
ork
Other pla
ns
1999
2000
2001
2002
2003
2004
Figure 6. Post-secondary plans of school exiters.
Adult service needs. Students and teachers reported on possible adult services the
students might require after leaving school. Table 12 shows the results across the six cohorts.
It appears that important trends are present in these data. First, the overall percentage of students
reporting no need for adult services has increased from 15% in 1999 to nearly 22% in 2002. This
decreases in 2004 and falls just slightly below the six-year average (19.1%). Over the first four
years, a larger number of students reported the likelihood of accessing vocational rehabilitation,
job service and college disability supports. Data increased in 2001 of the students who thought
they would access developmental disabilities services but overall results stayed at levels less than
10%. Also, less than 10% of the students say they will access social security services over the six
years.
Table 12 Possible Adult Services Needed
Services 1999 2000 2001 2002 2003 2004 Total No Services Needed
15.0% 16.9% 22.3% 21.7% 20.4% 18.5% 19.1%
Vocational Rehabilitation
45.8% 55.2% 61.1% 61.2% 58.4% 61.7% 57.2%
Developmental Disabilities
4.2% 8.5% 12.1% 9.8% 8.1% 8.4% 8.5%
Job Service 9.2% 15.4% 15.6% 22.7% 19.3% 15.7% 16.3% Social Security 2.5% 9.0% 8.0% 6.0% 6.8% 6.7% 6.5% College Disability Supports
10.0% 24.4% 30.6% 29.7% 27.6% 34.4% 26.1%
Adult Learning Center
0.0% 1.0% 1.6% 2.0% 0.4% 1.4% 1.1%
Other 7.5% 1.5% 4.1% 5.3% 5.0% 6.1% 4.9% Note: percent of total cases; students could choose more than one
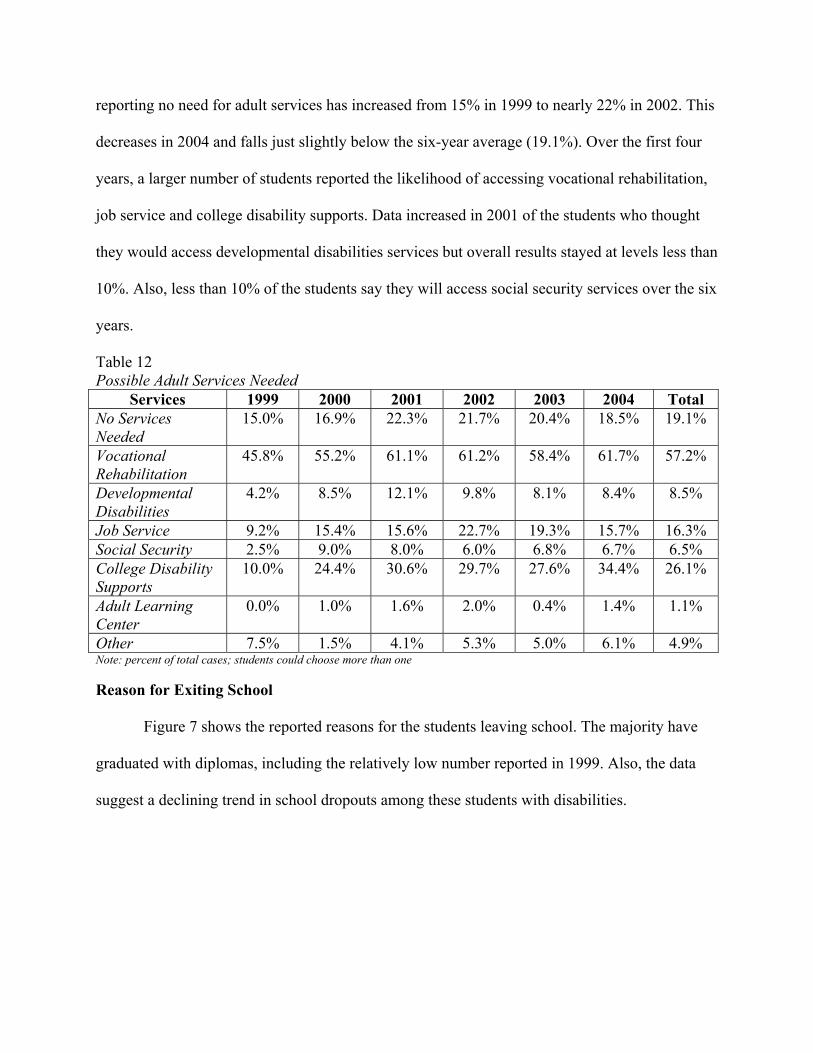
Reason for Exiting School
Figure 7 shows the reported reasons for the students leaving school. The majority have
graduated with diplomas, including the relatively low number reported in 1999. Also, the data
suggest a declining trend in school dropouts among these students with disabilities.
90.20%92.30%91.90%89.50%91.00%
58.30%
0%10%20%30%40%50%60%70%80%90%
100%
1999 2000 2001 2002 2003 2004
Grad w/Diploma
Grad w/Certificate
Aged out
Dropped out
Figure 7. Exit reason (percent of total cases).
Skill Attainment
Students and teachers reported on the skills attained during their high school years. Table
13 presents those data. Except for the 1999 cohort, in which there were relatively low responses
to this question, the data suggest that students learned important employment skills, generally
through vocational courses. There was considerable variability in student responses regarding all
the other skills areas (i.e., work, social skills, daily living skills, community access, computer
literacy, and team work). Additional data over the next several years may clarify patterns in these
areas.
Table 13 Occupational Skills Attained
Skill 1999 2000 2001 2002 2003 2004 Total Employment 40.8% 66.2% 78.3% 75.8% 73.3% 72.1% 67.8% Vocational Courses 32.5% 61.2% 72.3% 71.3% 75.9% 67.0% 63.4% Work Skills 21.7% 29.4% 1.9% 42.6% 36.1% 29.7% 26.9% Social Skills 17.5% 28.9% 1.9% 40.8% 34.8% 26.1% 25.0% Daily Living Skills 19.2% 23.4% 1.9% 37.8% 36.5% 24.0% 23.8% Community Access 6.7% 18.4% 1.6% 30.7% 18.8% 14.7% 15.2%
Skill 1999 2000 2001 2002 2003 2004 Total Computer Literacy/Keyboarding
20.0% 48.8% 2.9% 71.3% 65.9% 59.4% 44.7%
Work in Teams/Groups 12.5% 38.3% 2.2% 56.9% 54.3% 47.0% 35.2% Other Skills 3.3% 3.0% 1.3% 1.1% 12.3% 13.8% 5.8% Note: (percent of total cases; could choose more than one)
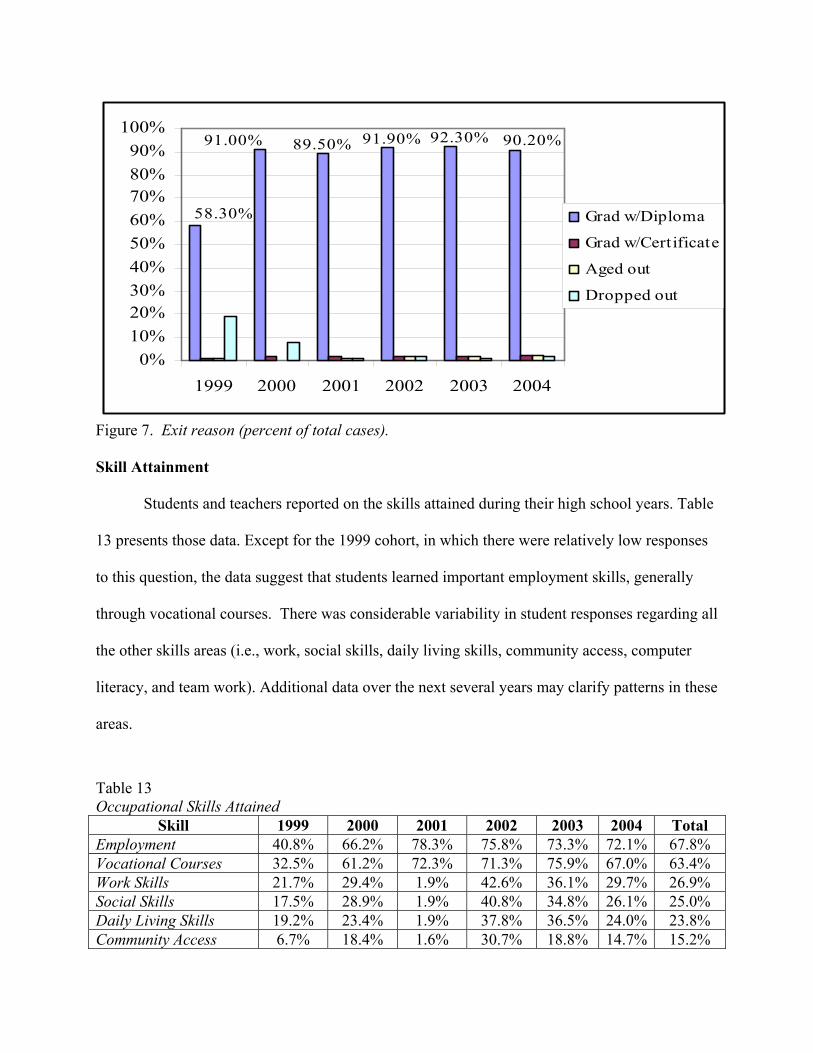
Satisfaction with school programs. Students were asked to rate, from A to F, their
satisfaction with several aspects of their high school experiences. First they rated their overall
satisfaction with high school (see Figure 8). Then they rated their vocational/transition and
special education program components (Figures 9 and 10). Overall, the students were relatively
satisfied with their experiences with the majority of the ratings being As or Bs.
0%10%20%30%40%50%60%70%80%90%
100%
1999 2000 2001 2002 2003 2004
A
B
C
D
F
Figure 8. Overall satisfaction with high school (percent of total cases).
0%10%20%30%40%50%60%70%80%90%
100%
1999 2000 2001 2002 2003 2004
A
B
C
D
F
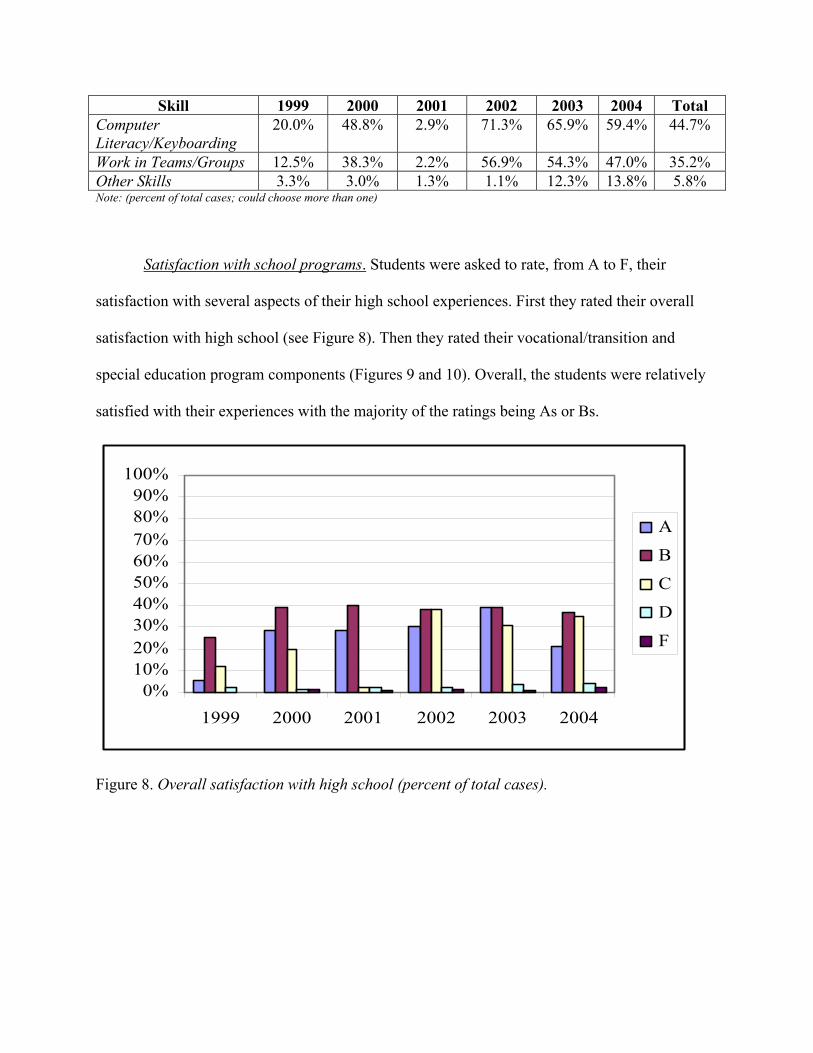
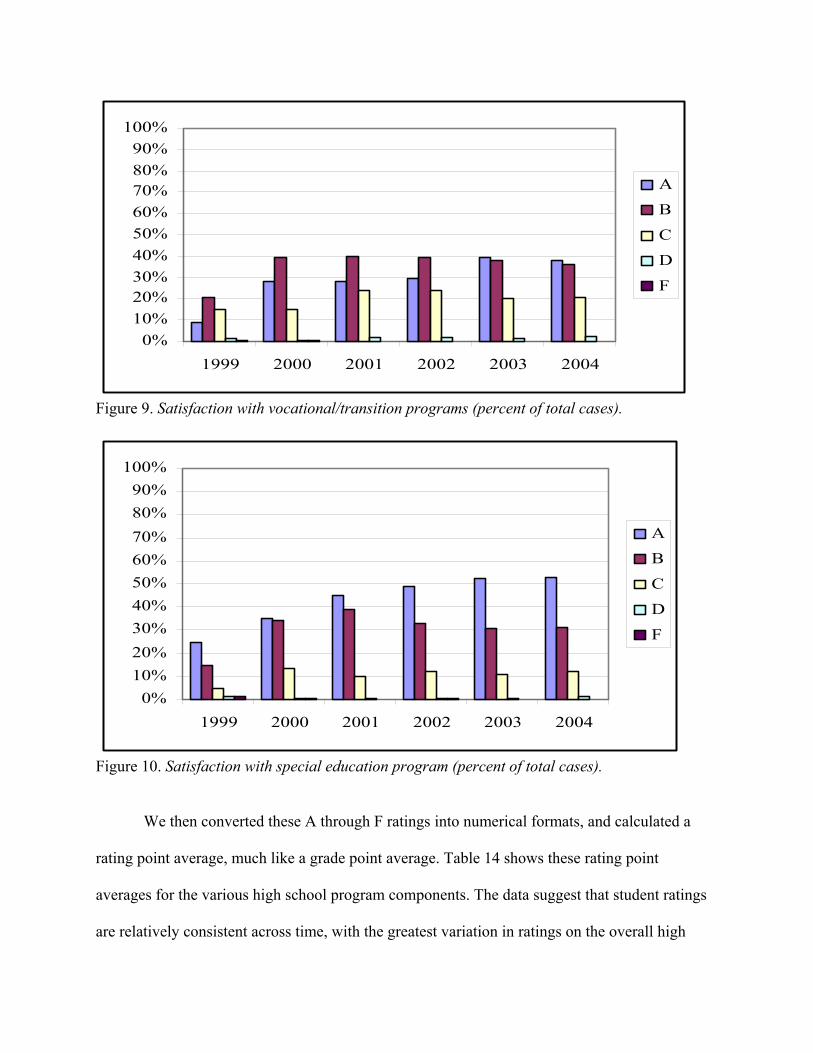
Figure 9. Satisfaction with vocational/transition programs (percent of total cases).
0%10%20%30%40%50%60%70%80%90%
100%
1999 2000 2001 2002 2003 2004
A
B
C
D
F
Figure 10. Satisfaction with special education program (percent of total cases).
We then converted these A through F ratings into numerical formats, and calculated a
rating point average, much like a grade point average. Table 14 shows these rating point
averages for the various high school program components. The data suggest that student ratings
are relatively consistent across time, with the greatest variation in ratings on the overall high
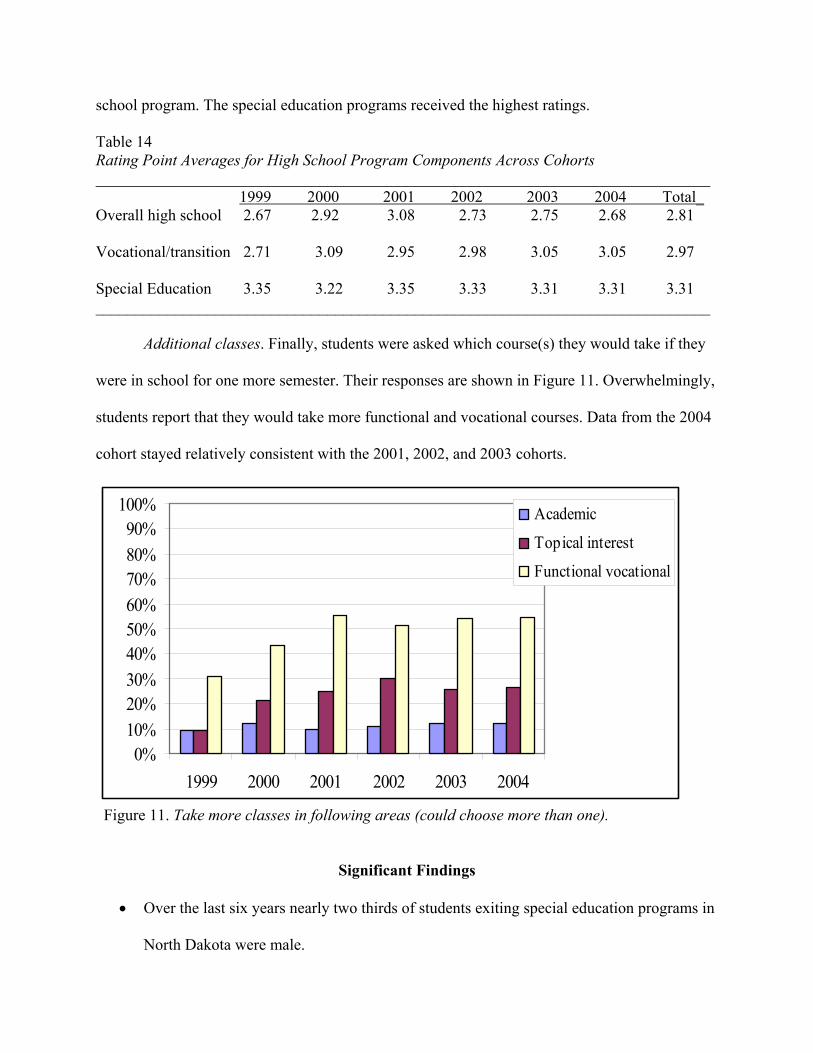
school program. The special education programs received the highest ratings.
Table 14 Rating Point Averages for High School Program Components Across Cohorts _____________________________________________________________________________
1999 2000 2001 2002 2003 2004 Total_ Overall high school 2.67 2.92 3.08 2.73 2.75 2.68 2.81
Vocational/transition 2.71 3.09 2.95 2.98 3.05 3.05 2.97
Special Education 3.35 3.22 3.35 3.33 3.31 3.31 3.31 _____________________________________________________________________________
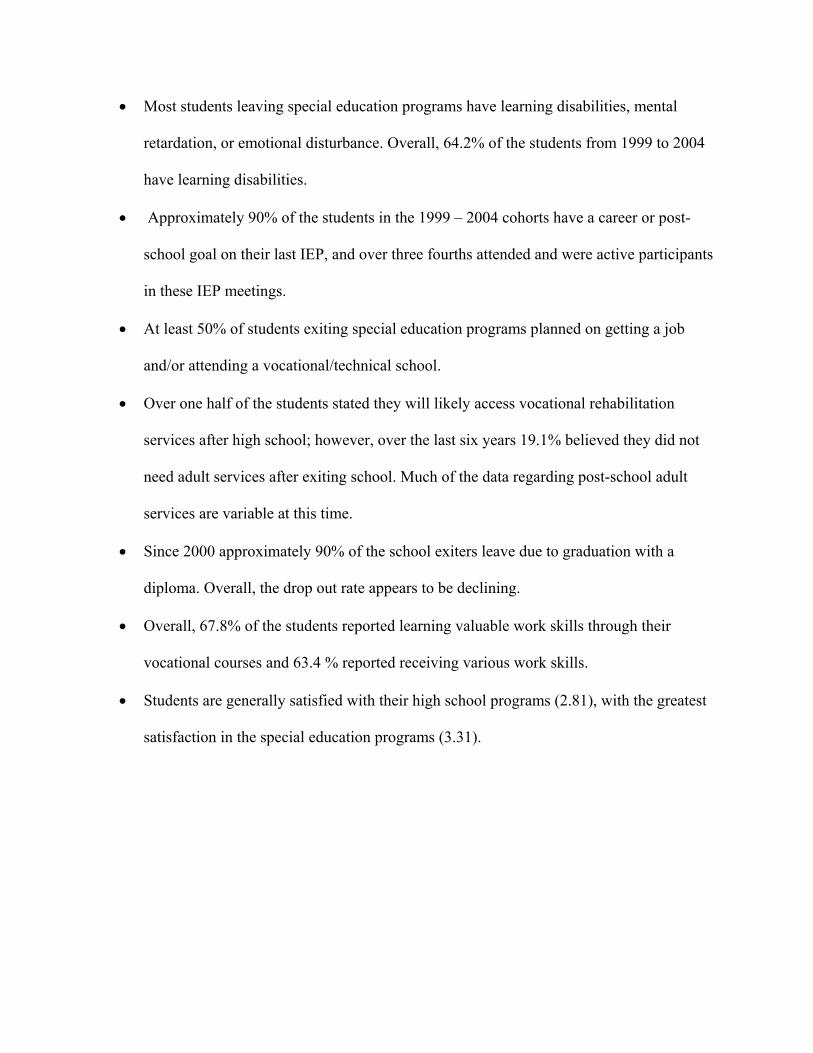
Additional classes. Finally, students were asked which course(s) they would take if they
were in school for one more semester. Their responses are shown in Figure 11. Overwhelmingly,
students report that they would take more functional and vocational courses. Data from the 2004
cohort stayed relatively consistent with the 2001, 2002, and 2003 cohorts.
0%10%20%30%40%50%60%70%80%90%
100%
1999 2000 2001 2002 2003 2004
Academic
Topical interest
Functional vocational
Figure 11. Take more classes in following areas (could choose more than one).
Significant Findings
• Over the last six years nearly two thirds of students exiting special education programs in
North Dakota were male.
• Most students leaving special education programs have learning disabilities, mental
retardation, or emotional disturbance. Overall, 64.2% of the students from 1999 to 2004
have learning disabilities.
• Approximately 90% of the students in the 1999 – 2004 cohorts have a career or post-
school goal on their last IEP, and over three fourths attended and were active participants
in these IEP meetings.
• At least 50% of students exiting special education programs planned on getting a job
and/or attending a vocational/technical school.
• Over one half of the students stated they will likely access vocational rehabilitation
services after high school; however, over the last six years 19.1% believed they did not
need adult services after exiting school. Much of the data regarding post-school adult
services are variable at this time.
• Since 2000 approximately 90% of the school exiters leave due to graduation with a
diploma. Overall, the drop out rate appears to be declining.
• Overall, 67.8% of the students reported learning valuable work skills through their
vocational courses and 63.4 % reported receiving various work skills.
• Students are generally satisfied with their high school programs (2.81), with the greatest
satisfaction in the special education programs (3.31).
Section Three
2003 Cohort One Year after School Exit
This report continues the series of technical reports on the North Dakota (ND) Transition
Follow-up Project, funded by ND Department of Public Instruction (ND DPI), Office of Special
Education. The ND Transition Follow-up Project examines the status of students as they exit
high school and enter society as young adults. This report is a summary of the data and analyses
of the 1999 through 2003 cohorts of students with disabilities one year after they have exited
from ND high schools. These students’ initial school exit data were presented in previous reports
and are available from North Dakota Center for Persons with Disabilities (NDCPD) or from the
ND DPI office in Bismarck as well as from their respective websites.
Methodology
The general procedure for this study was to survey parents of the 1999 through 2003
school year exiters from the participating special education units. Once contacted, the family
members were interviewed using the NDCPD Transition Follow-up Project Interview
Questionnaire (see Appendix C). This instrument and the contact protocol are described below.
Instrument. The interview questionnaire was developed after an extensive review of
materials. DPI staff provided NDCPD staff with an initial outline of some questionnaire items
based on their earlier work on the project. In addition, we obtained several examples of transition
questionnaires from researched literature.
Items from these materials were analyzed and useful structural features were selected.
Initial drafts were then designed and included items on education, employment, living
arrangements, and social activities. These drafts were revised several times with input from DPI
and NDCPD staff. The final version incorporated the most salient items of interest and provided
an efficient instrument for gathering data via telephone interviews.
Contact protocol. The protocol for contacting participants was developed by NDCPD
staff with the assistance of several Minot State University (MSU) graduate student assistants. To
compile the call list, initially, the exit interview reports were used which were provided by the
participating special education units. Unfortunately, not all the reports were sent and several
were not complete. NDCPD staff contacted all special education unit staff who provided updated
copies of information including family names, addresses, and telephone numbers. This
information continues to be kept in locked file cabinets at NDCPD. The MSU student assistants
then constructed computer data files with this information. All student information was
organized by identification codes rather than names to ensure greater confidentiality. These data
files were used to generate call logs for the interviews.
The student assistants were trained in the procedures for conducting the telephone
interviews using the protocol shown on the questionnaire along with an Introduction Script to
help initiate the survey. The students were also given a list of possible frequently asked questions
(FAQs) that might arise during the interview. Both the Introduction Script and the FAQs are
found in Appendix D.
Students practiced interviewing face-to-face and on the telephone with staff and with
each other until they were comfortable with the process and the materials. The students were
coached on how to handle participant questions about the study such as requests for more
information or services as well as on refusals to participate. Students were also instructed to
make minimally three attempts to contact each of the participants. These attempts were to occur
at least two hours apart or on separate days. The following two reports are the results of these
telephone interviews.
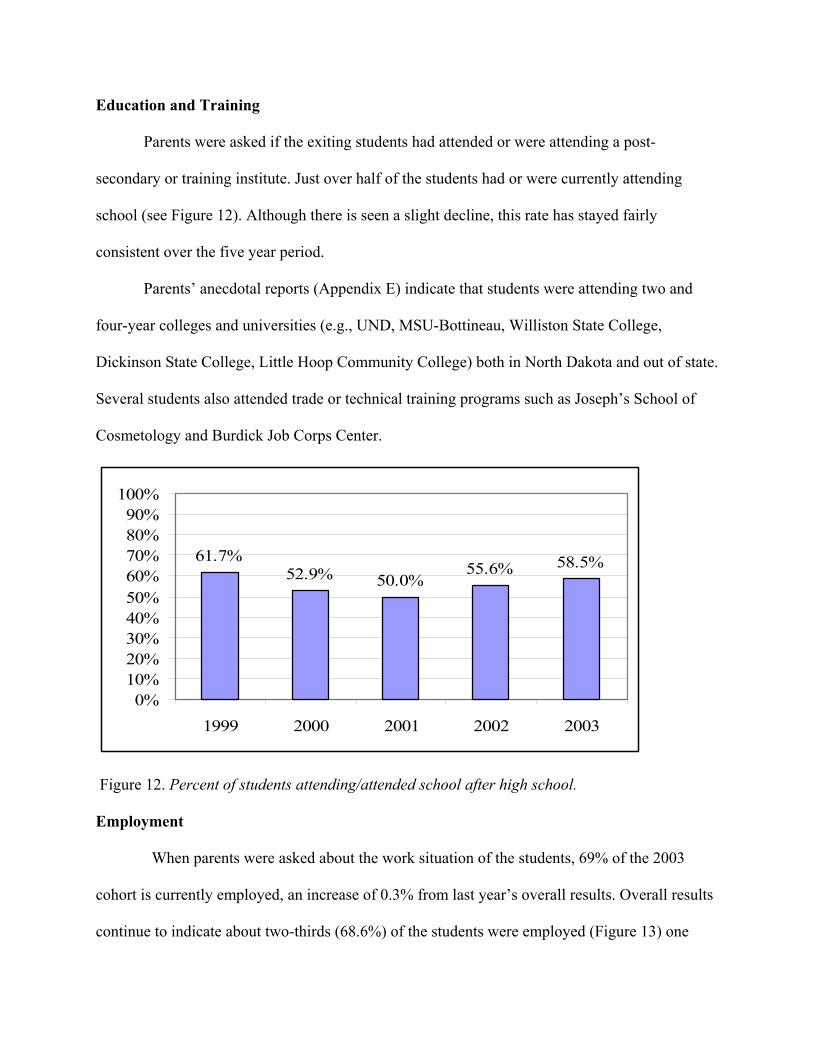
Education and Training
Parents were asked if the exiting students had attended or were attending a post-
secondary or training institute. Just over half of the students had or were currently attending
school (see Figure 12). Although there is seen a slight decline, this rate has stayed fairly
consistent over the five year period.
Parents’ anecdotal reports (Appendix E) indicate that students were attending two and
four-year colleges and universities (e.g., UND, MSU-Bottineau, Williston State College,
Dickinson State College, Little Hoop Community College) both in North Dakota and out of state.
Several students also attended trade or technical training programs such as Joseph’s School of
Cosmetology and Burdick Job Corps Center.
61.7%52.9% 50.0%
55.6% 58.5%
0%10%20%30%40%50%60%70%80%90%
100%
1999 2000 2001 2002 2003
Figure 12. Percent of students attending/attended school after high school.
Employment
When parents were asked about the work situation of the students, 69% of the 2003
cohort is currently employed, an increase of 0.3% from last year’s overall results. Overall results
continue to indicate about two-thirds (68.6%) of the students were employed (Figure 13) one
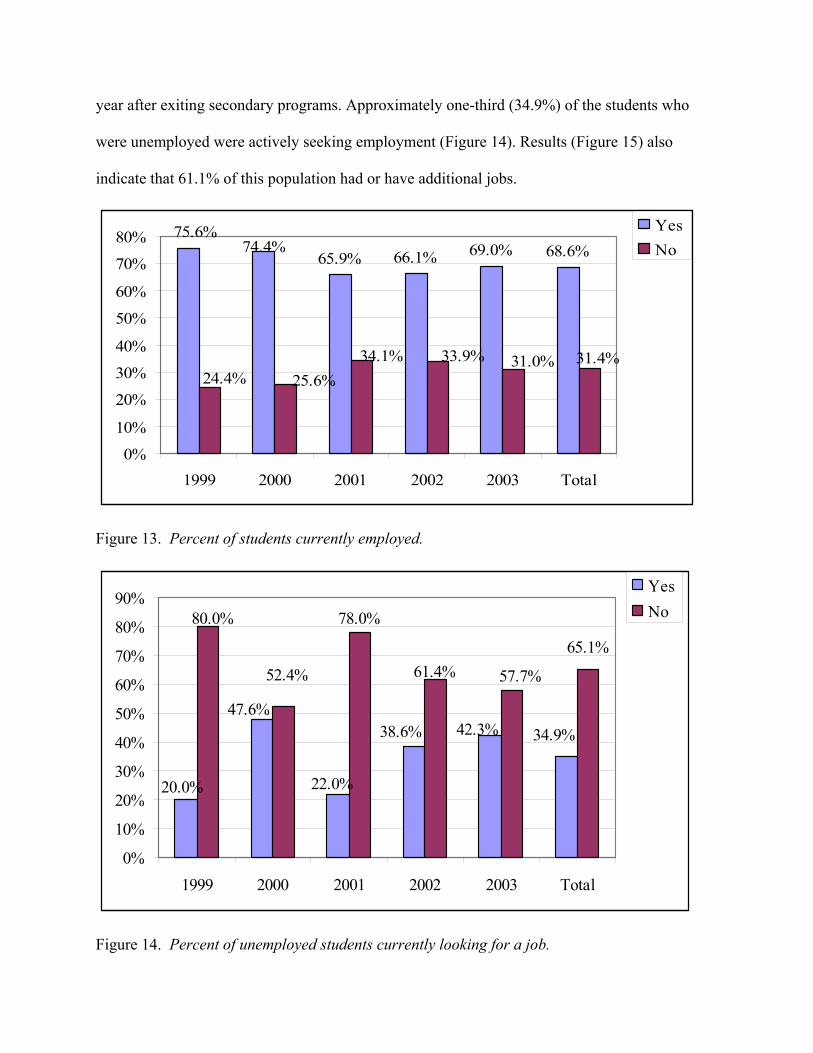
year after exiting secondary programs. Approximately one-third (34.9%) of the students who
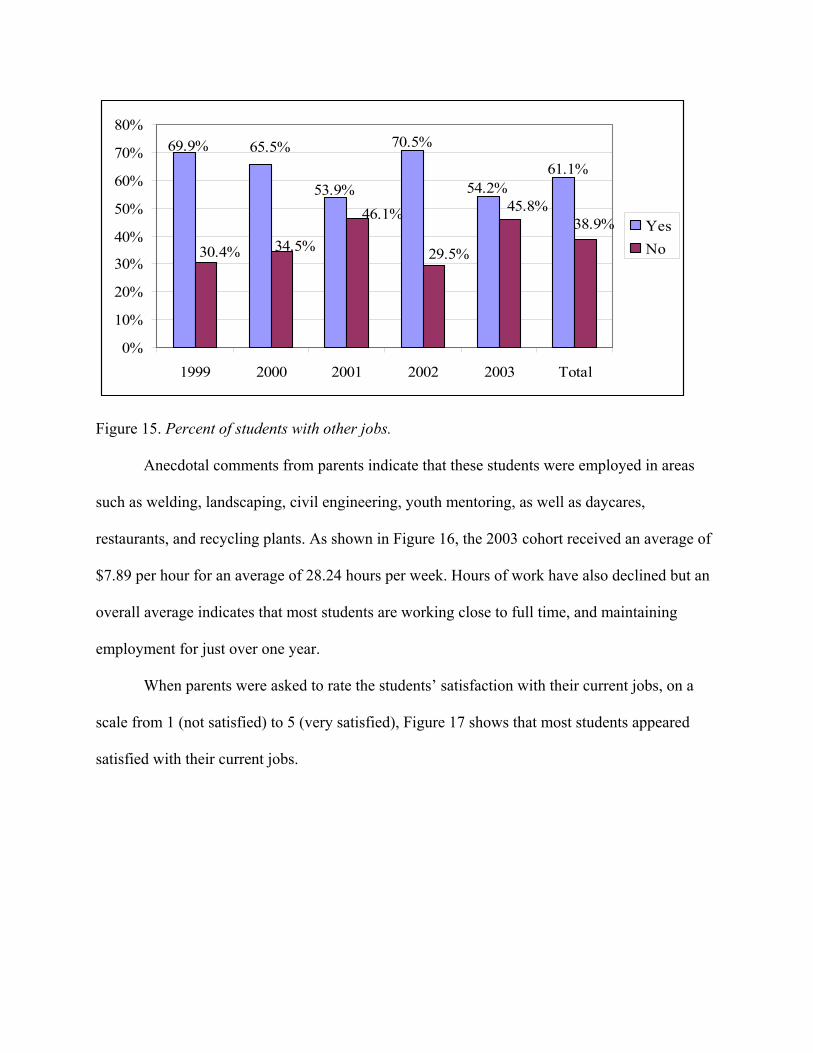
were unemployed were actively seeking employment (Figure 14). Results (Figure 15) also
indicate that 61.1% of this population had or have additional jobs.
65.9% 66.1% 69.0% 68.6%75.6%
74.4%
31.4%31.0%33.9%34.1%25.6%24.4%
0%
10%
20%
30%
40%
50%
60%
70%
80%
1999 2000 2001 2002 2003 Total
Yes No
Figure 13. Percent of students currently employed.
34.9%42.3%38.6%
22.0%20.0%
47.6%
80.0% 78.0%
61.4% 57.7%
65.1%
52.4%
0%
10%
20%
30%
40%
50%
60%
70%
80%
90%
1999 2000 2001 2002 2003 Total
Yes No
Figure 14. Percent of unemployed students currently looking for a job.
69.9% 65.5%
53.9%
70.5%
54.2%61.1%
38.9%45.8%
29.5%
46.1%
34.5%30.4%
0%
10%
20%
30%
40%
50%
60%
70%
80%
1999 2000 2001 2002 2003 Total
Yes No
Figure 15. Percent of students with other jobs.
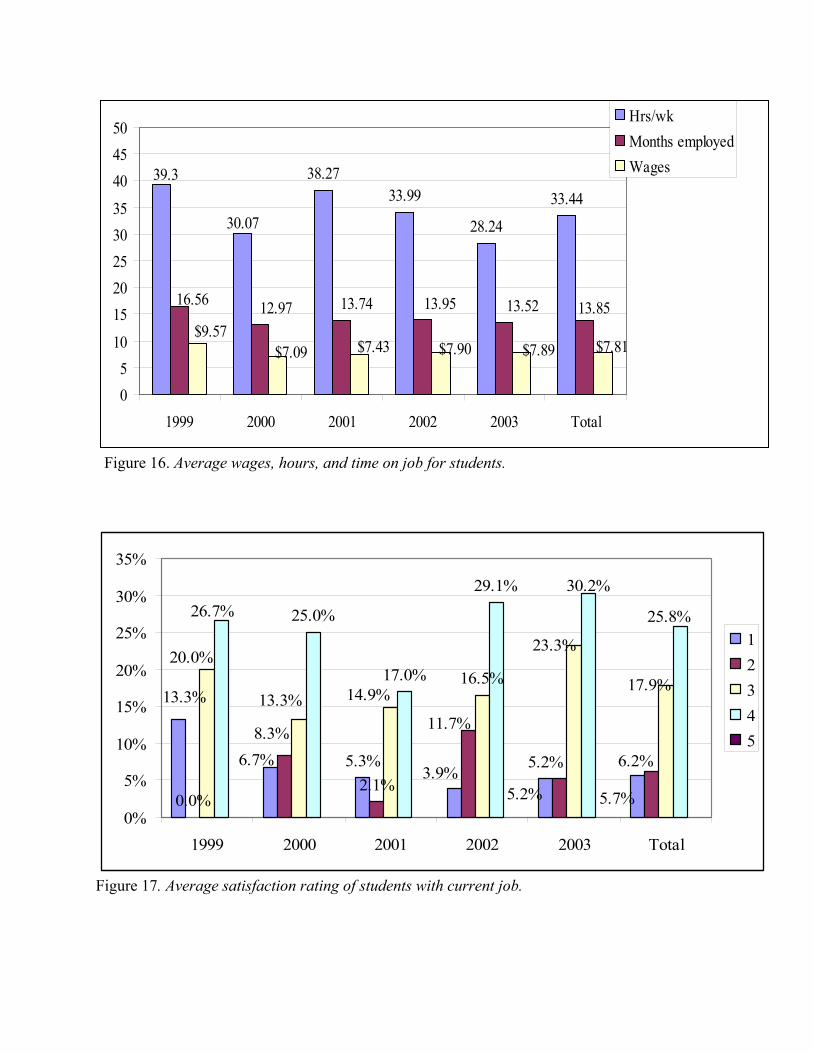
Anecdotal comments from parents indicate that these students were employed in areas
such as welding, landscaping, civil engineering, youth mentoring, as well as daycares,
restaurants, and recycling plants. As shown in Figure 16, the 2003 cohort received an average of
$7.89 per hour for an average of 28.24 hours per week. Hours of work have also declined but an
overall average indicates that most students are working close to full time, and maintaining
employment for just over one year.
When parents were asked to rate the students’ satisfaction with their current jobs, on a
scale from 1 (not satisfied) to 5 (very satisfied), Figure 17 shows that most students appeared
satisfied with their current jobs.
38.2733.99
28.24
33.4430.07
39.3
13.74 13.95 13.52 13.8512.9716.56
$7.81$7.89$7.90$7.43$7.09$9.57
05
10
1520253035
404550
1999 2000 2001 2002 2003 Total
Hrs/wkMonths employedWages
Figure 16. Average wages, hours, and time on job for students.
5.3%
0.0%2.1%
16.5%
25.0%
17.0%
29.1%
5.7%5.2%3.9%
6.7%
13.3%
6.2%5.2%
11.7%8.3%
17.9%
23.3%
14.9%13.3%
20.0%
30.2%
25.8%26.7%
0%
5%
10%
15%
20%
25%
30%
35%
1999 2000 2001 2002 2003 Total
12345
Figure 17. Average satisfaction rating of students with current job.
Living Arrangements
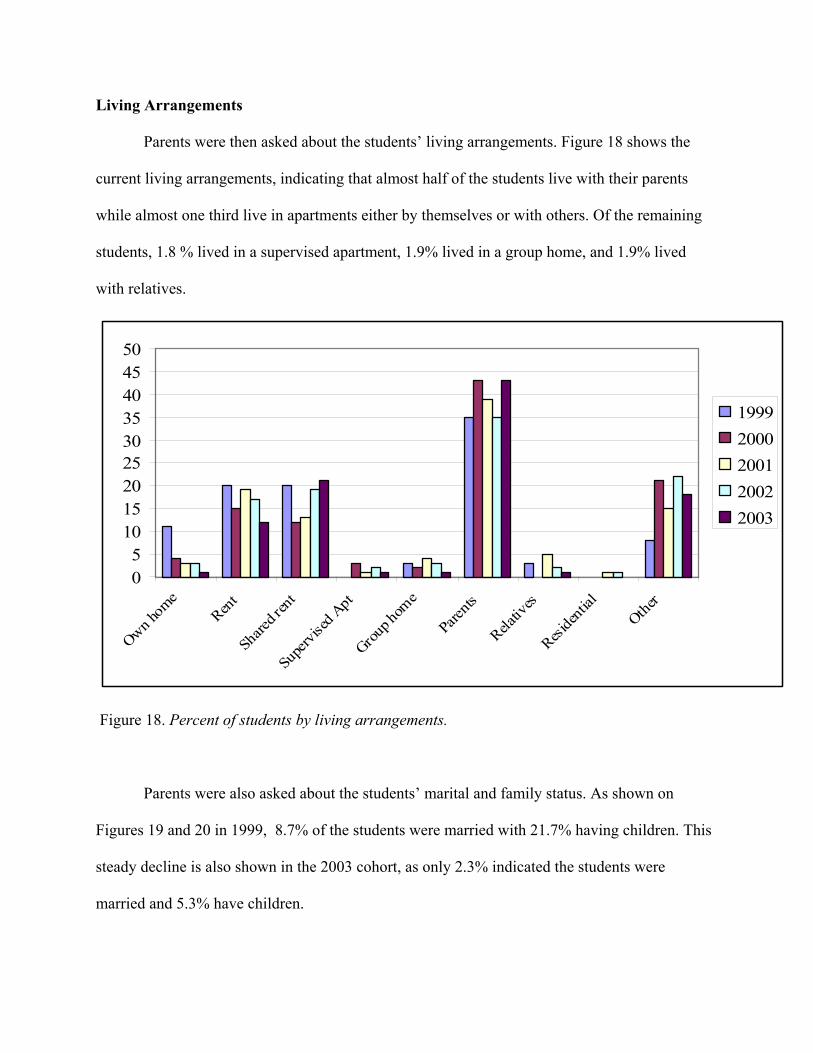
Parents were then asked about the students’ living arrangements. Figure 18 shows the
current living arrangements, indicating that almost half of the students live with their parents
while almost one third live in apartments either by themselves or with others. Of the remaining
students, 1.8 % lived in a supervised apartment, 1.9% lived in a group home, and 1.9% lived
with relatives.
05
101520253035404550
Own hom
eRen
t
Share
d ren
t
Supe
rvised
Apt
Group h
ome
Paren
ts
Relativ
es
Reside
ntial
Other
19992000200120022003
Figure 18. Percent of students by living arrangements.
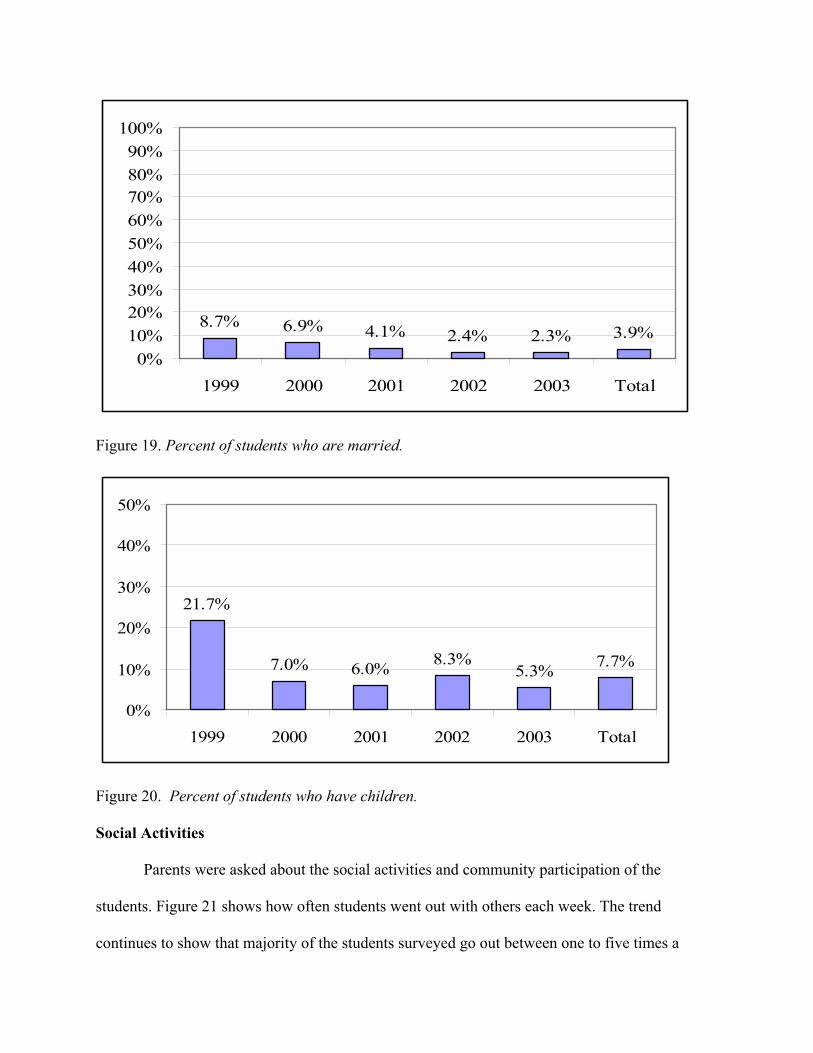
Parents were also asked about the students’ marital and family status. As shown on
Figures 19 and 20 in 1999, 8.7% of the students were married with 21.7% having children. This
steady decline is also shown in the 2003 cohort, as only 2.3% indicated the students were
married and 5.3% have children.
8.7% 6.9% 4.1% 2.4% 2.3% 3.9%0%
10%20%30%40%50%60%70%80%90%
100%
1999 2000 2001 2002 2003 Total
Figure 19. Percent of students who are married.
21.7%
7.0% 6.0% 8.3%5.3% 7.7%
0%
10%
20%
30%
40%
50%
1999 2000 2001 2002 2003 Total
Figure 20. Percent of students who have children.
Social Activities
Parents were asked about the social activities and community participation of the
students. Figure 21 shows how often students went out with others each week. The trend
continues to show that majority of the students surveyed go out between one to five times a
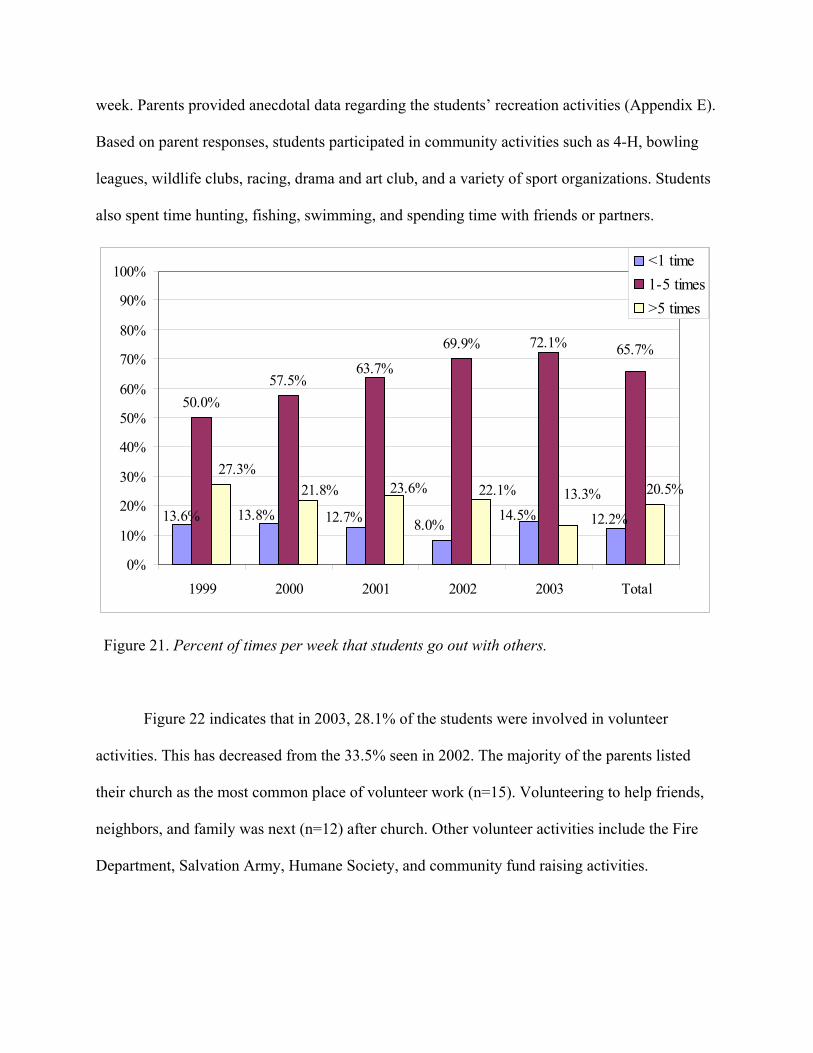
week. Parents provided anecdotal data regarding the students’ recreation activities (Appendix E).
Based on parent responses, students participated in community activities such as 4-H, bowling
leagues, wildlife clubs, racing, drama and art club, and a variety of sport organizations. Students
also spent time hunting, fishing, swimming, and spending time with friends or partners.
50.0%57.5%
69.9%
12.2%14.5%8.0%12.7%13.8%13.6%
65.7%63.7%
72.1%
27.3%21.8% 23.6% 22.1% 20.5%13.3%
0%
10%
20%
30%
40%
50%
60%
70%
80%
90%
100%
1999 2000 2001 2002 2003 Total
<1 time1-5 times>5 times
Figure 21. Percent of times per week that students go out with others.
Figure 22 indicates that in 2003, 28.1% of the students were involved in volunteer
activities. This has decreased from the 33.5% seen in 2002. The majority of the parents listed
their church as the most common place of volunteer work (n=15). Volunteering to help friends,
neighbors, and family was next (n=12) after church. Other volunteer activities include the Fire
Department, Salvation Army, Humane Society, and community fund raising activities.
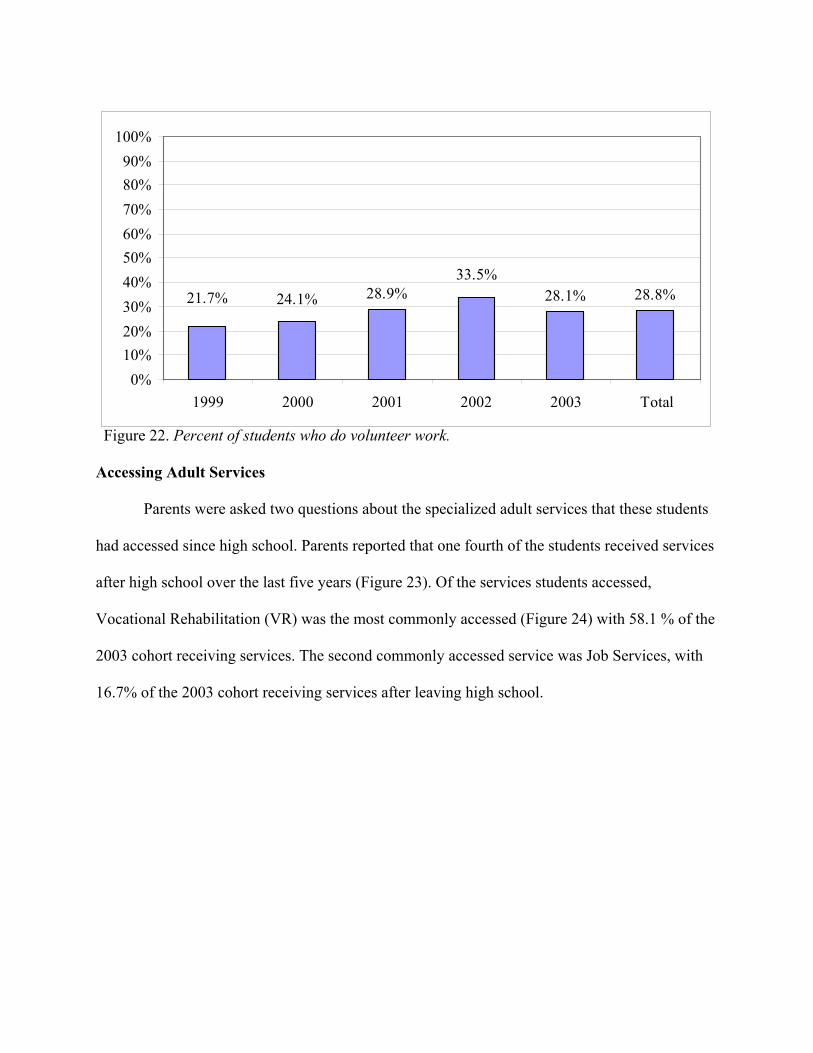
Figure 22. Percent of students who do volunteer work.
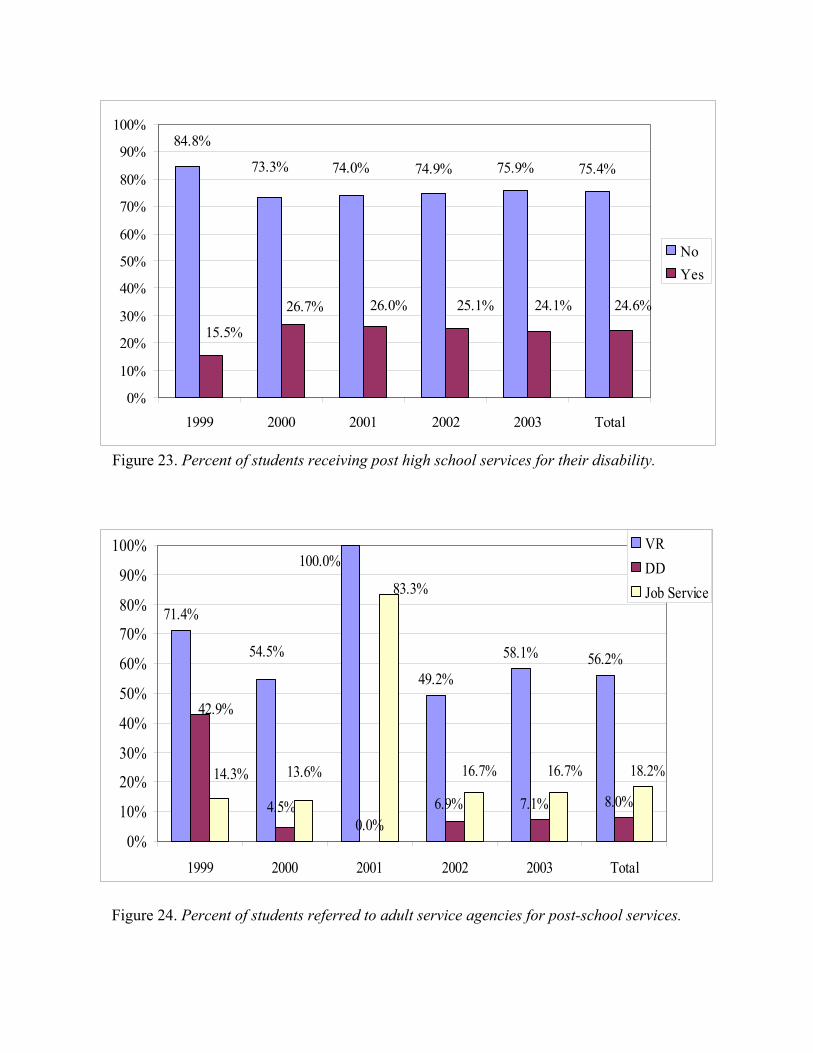
Accessing Adult Services
Parents were asked two questions about the specialized adult services that these students
had accessed since high school. Parents reported that one fourth of the students received services
after high school over the last five years (Figure 23). Of the services students accessed,
Vocational Rehabilitation (VR) was the most commonly accessed (Figure 24) with 58.1 % of the
2003 cohort receiving services. The second commonly accessed service was Job Services, with
16.7% of the 2003 cohort receiving services after leaving high school.
28.1% 28.8%28.9%24.1%21.7%33.5%
0%10%20%30%40%50%60%70%80%90%
100%
1999 2000 2001 2002 2003 Total
84.8%
73.3% 74.0% 74.9% 75.9% 75.4%
24.6%24.1%25.1%26.0%26.7%
15.5%
0%
10%
20%
30%
40%
50%
60%
70%
80%
90%
100%
1999 2000 2001 2002 2003 Total
NoYes
Figure 23. Percent of students receiving post high school services for their disability.
71.4%
49.2%
58.1% 56.2%
100.0%
54.5%
0.0%
42.9%
8.0%7.1%6.9%4.5%
83.3%
18.2%16.7%16.7%13.6%14.3%
0%
10%
20%
30%
40%
50%
60%
70%
80%
90%
100%
1999 2000 2001 2002 2003 Total
VRDDJob Service
Figure 24. Percent of students referred to adult service agencies for post-school services.
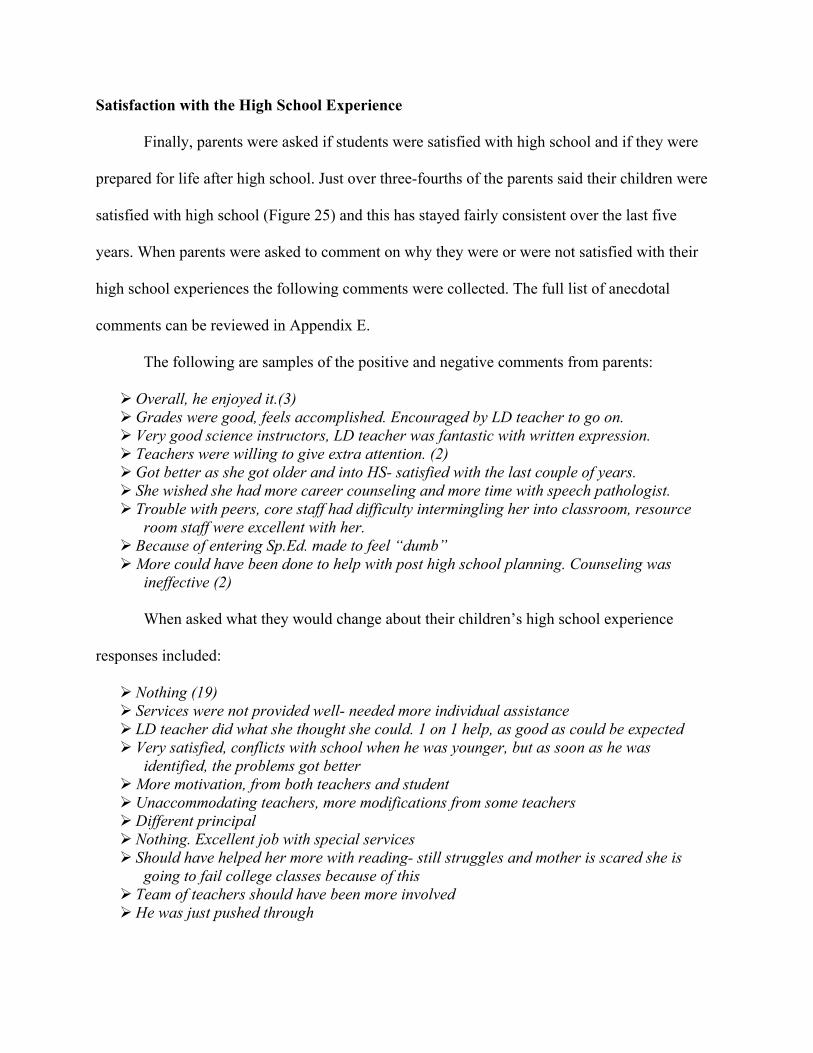
Satisfaction with the High School Experience
Finally, parents were asked if students were satisfied with high school and if they were
prepared for life after high school. Just over three-fourths of the parents said their children were
satisfied with high school (Figure 25) and this has stayed fairly consistent over the last five
years. When parents were asked to comment on why they were or were not satisfied with their
high school experiences the following comments were collected. The full list of anecdotal
comments can be reviewed in Appendix E.
The following are samples of the positive and negative comments from parents:
Overall, he enjoyed it.(3) Grades were good, feels accomplished. Encouraged by LD teacher to go on. Very good science instructors, LD teacher was fantastic with written expression. Teachers were willing to give extra attention. (2) Got better as she got older and into HS- satisfied with the last couple of years. She wished she had more career counseling and more time with speech pathologist. Trouble with peers, core staff had difficulty intermingling her into classroom, resource
room staff were excellent with her. Because of entering Sp.Ed. made to feel “dumb” More could have been done to help with post high school planning. Counseling was
ineffective (2)
When asked what they would change about their children’s high school experience
responses included:
Nothing (19) Services were not provided well- needed more individual assistance LD teacher did what she thought she could. 1 on 1 help, as good as could be expected Very satisfied, conflicts with school when he was younger, but as soon as he was
identified, the problems got better More motivation, from both teachers and student Unaccommodating teachers, more modifications from some teachers Different principal Nothing. Excellent job with special services Should have helped her more with reading- still struggles and mother is scared she is
going to fail college classes because of this Team of teachers should have been more involved He was just pushed through
75.7%77.4%75.4%77.9%73.8% 73.6%
0%
10%
20%30%
40%
50%
60%
70%80%
90%
100%
1999 2000 2001 2002 2003 Total
Figure 25. Percent of students satisfied with high school.
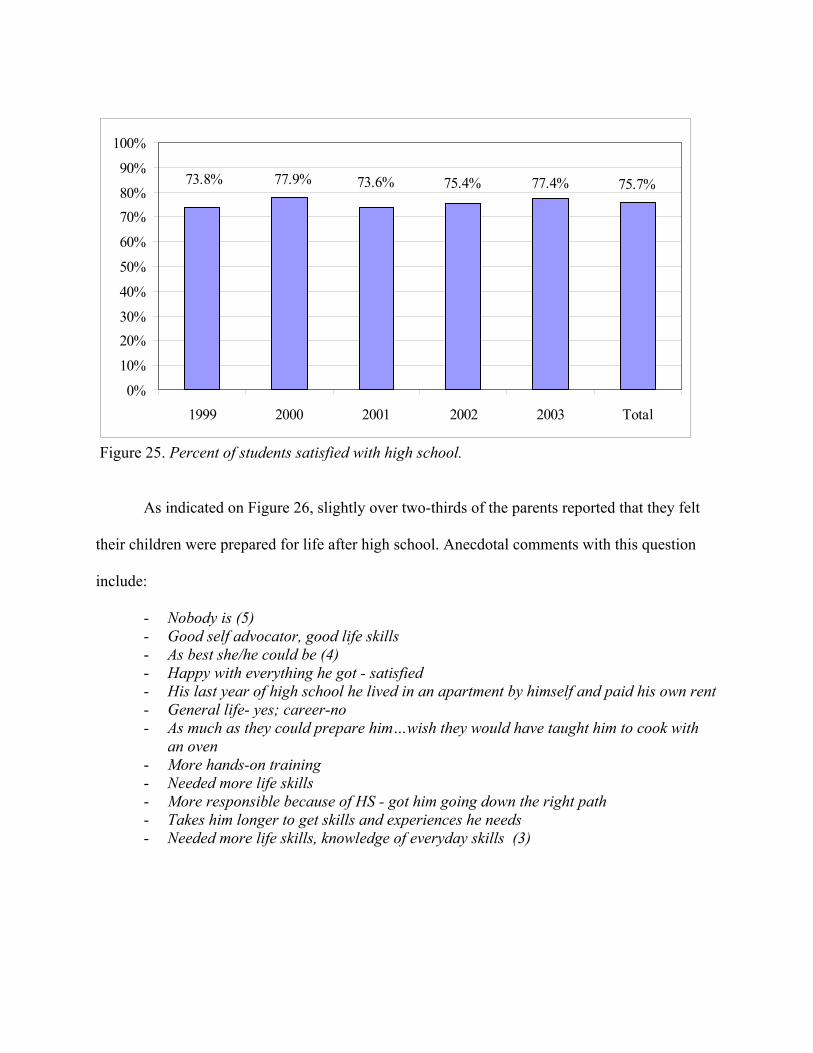
As indicated on Figure 26, slightly over two-thirds of the parents reported that they felt
their children were prepared for life after high school. Anecdotal comments with this question
include:
- Nobody is (5) - Good self advocator, good life skills - As best she/he could be (4) - Happy with everything he got - satisfied - His last year of high school he lived in an apartment by himself and paid his own rent - General life- yes; career-no - As much as they could prepare him…wish they would have taught him to cook with
an oven - More hands-on training - Needed more life skills - More responsible because of HS - got him going down the right path - Takes him longer to get skills and experiences he needs - Needed more life skills, knowledge of everyday skills (3)
65.3%64.5%65.1% 70.2%62.6%60.0%
0%10%20%30%40%50%60%70%80%90%
100%
1999 2000 2001 2002 2003 Total
Figure 26. Percent of parents who thought students were prepared for life after high school.
Section Four
One and Three Year Follow-up Comparisons
In this section the follow-up data of the 1999, 2000, and 2001 cohorts are examined by
comparing the one year after exiting high school and three years after exiting high school data
sets of each cohort. By comparing data received through parent interviews one year after
students exited high school against data gathered three years after, information is gained which
furthers the understanding of transition programs and students’ preparedness for adult life.
Comparison of Student Demographics
There were 122 students participating in the exit interviews in the 1999 cohort, 50 in the
first telephone interview contact and 46 in the third contact phase. In the 2000 cohort, 208
students participated in the exit interviews, 88 in the first telephone contact and 87 participants in
the third contact (Table 1). In the 2001 cohort, 316 participants completed the exit surveys,
however only 169 participants completed the first and third contact interviews. Participation in
the survey and interview components was voluntary as was answering particular questions;
therefore not all questions were answered by all students.
Table 15 Participating Students
Cohort Group
Participants
1999 50 (1st contact)
1999 46 (3rd contact) 2000 88 (1st contact)
2000 87 (3rd contact) 2001 169 (1st contact) 2001 169 (3rd contact)
Telephone Interview Results
Post-secondary School Attendance
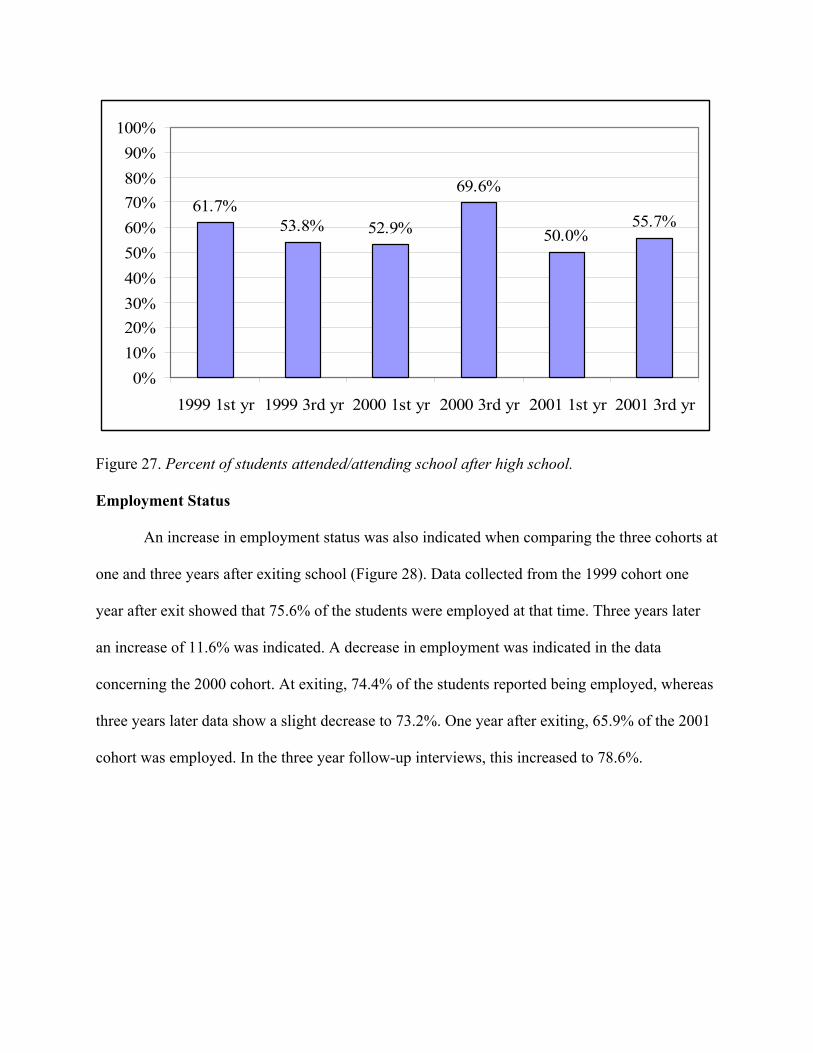
A slight decrease in the 1999 cohort is indicated in the number of students who have
received at least some post secondary education since high school based on the results from the
interviews conducted one year and three years after exiting school (Figure 27). An increase is
indicated in the 2000 cohort, which has increased 16.7% from 52.9% to 69.6%. The percent of
students in the 2001 cohort who were attending or attended post-secondary schools after exiting
increased from 50% to 55.7% three years after exiting high school.
61.7%53.8% 52.9%
69.6%
50.0%55.7%
0%10%20%30%40%50%60%70%80%90%
100%
1999 1st yr 1999 3rd yr 2000 1st yr 2000 3rd yr 2001 1st yr 2001 3rd yr
Figure 27. Percent of students attended/attending school after high school.
Employment Status
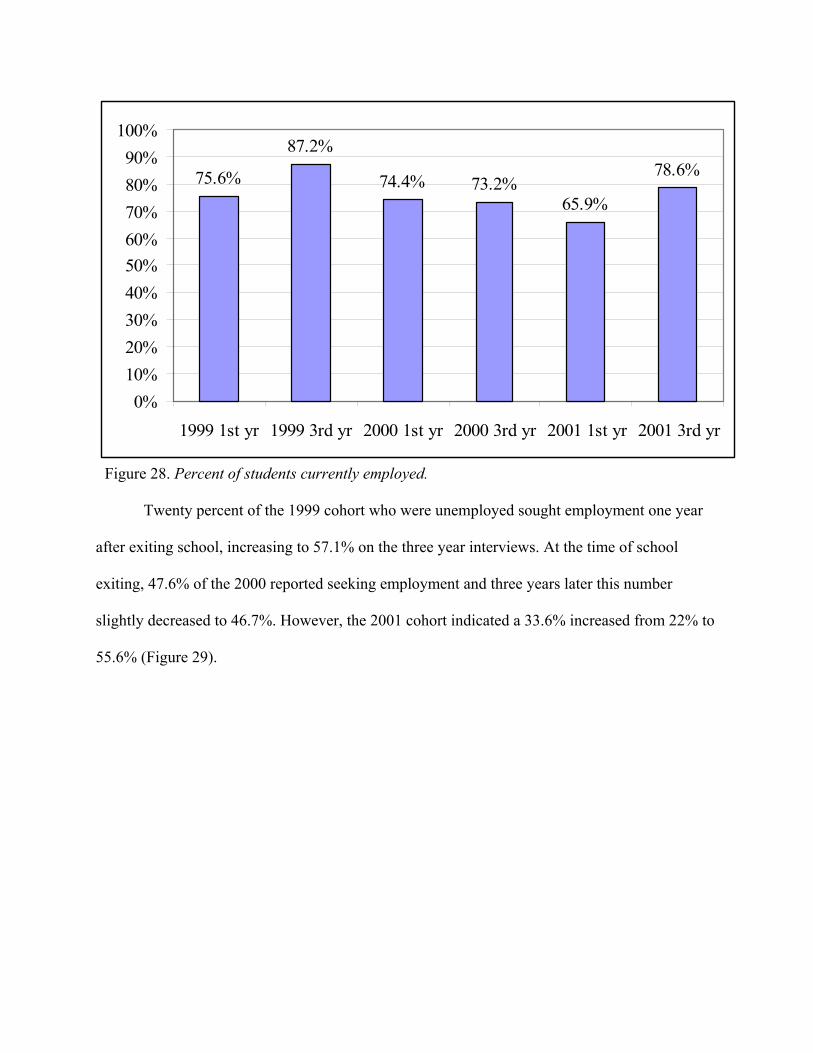
An increase in employment status was also indicated when comparing the three cohorts at
one and three years after exiting school (Figure 28). Data collected from the 1999 cohort one
year after exit showed that 75.6% of the students were employed at that time. Three years later
an increase of 11.6% was indicated. A decrease in employment was indicated in the data
concerning the 2000 cohort. At exiting, 74.4% of the students reported being employed, whereas
three years later data show a slight decrease to 73.2%. One year after exiting, 65.9% of the 2001
cohort was employed. In the three year follow-up interviews, this increased to 78.6%.
75.6%
87.2%
74.4% 73.2%65.9%
78.6%
0%10%20%30%40%50%60%70%80%90%
100%
1999 1st yr 1999 3rd yr 2000 1st yr 2000 3rd yr 2001 1st yr 2001 3rd yr
Figure 28. Percent of students currently employed.
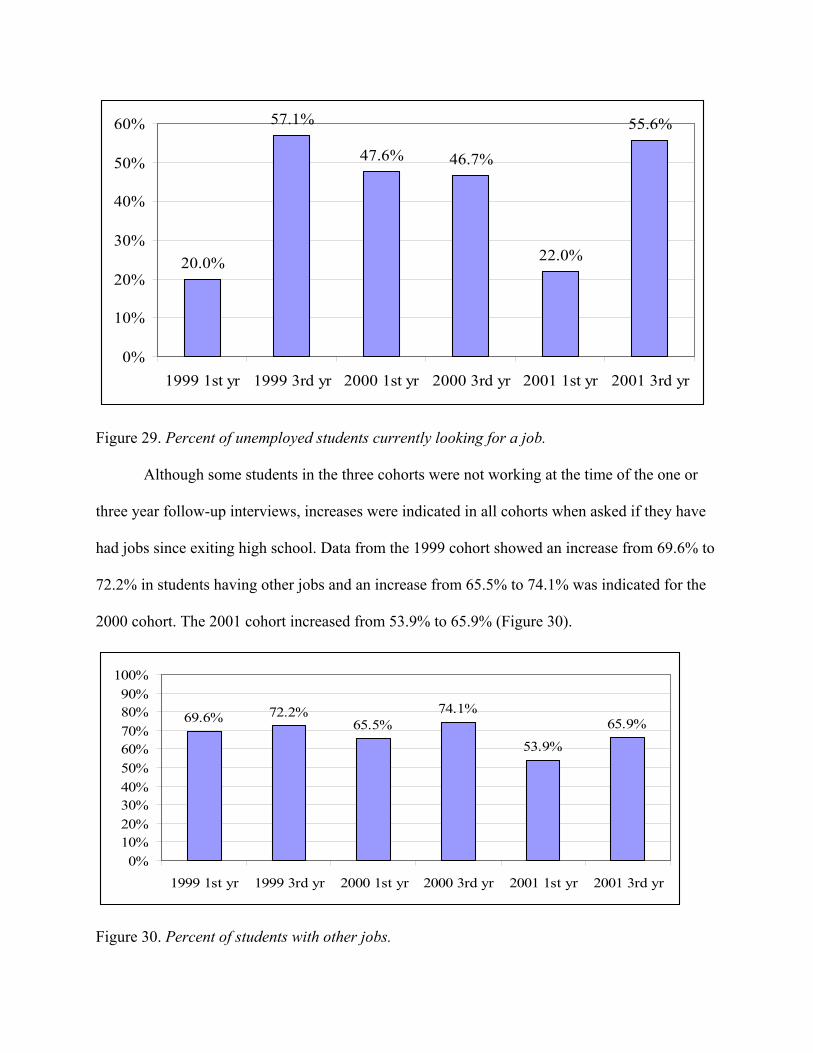
Twenty percent of the 1999 cohort who were unemployed sought employment one year
after exiting school, increasing to 57.1% on the three year interviews. At the time of school
exiting, 47.6% of the 2000 reported seeking employment and three years later this number
slightly decreased to 46.7%. However, the 2001 cohort indicated a 33.6% increased from 22% to
55.6% (Figure 29).
20.0%
57.1%
47.6% 46.7%
22.0%
55.6%
0%
10%
20%
30%
40%
50%
60%
1999 1st yr 1999 3rd yr 2000 1st yr 2000 3rd yr 2001 1st yr 2001 3rd yr
Figure 29. Percent of unemployed students currently looking for a job.
Although some students in the three cohorts were not working at the time of the one or
three year follow-up interviews, increases were indicated in all cohorts when asked if they have
had jobs since exiting high school. Data from the 1999 cohort showed an increase from 69.6% to
72.2% in students having other jobs and an increase from 65.5% to 74.1% was indicated for the
2000 cohort. The 2001 cohort increased from 53.9% to 65.9% (Figure 30).
69.6% 72.2%65.5%
74.1%
53.9%
65.9%
0%10%20%30%40%50%60%70%80%90%
100%
1999 1st yr 1999 3rd yr 2000 1st yr 2000 3rd yr 2001 1st yr 2001 3rd yr
Figure 30. Percent of students with other jobs.
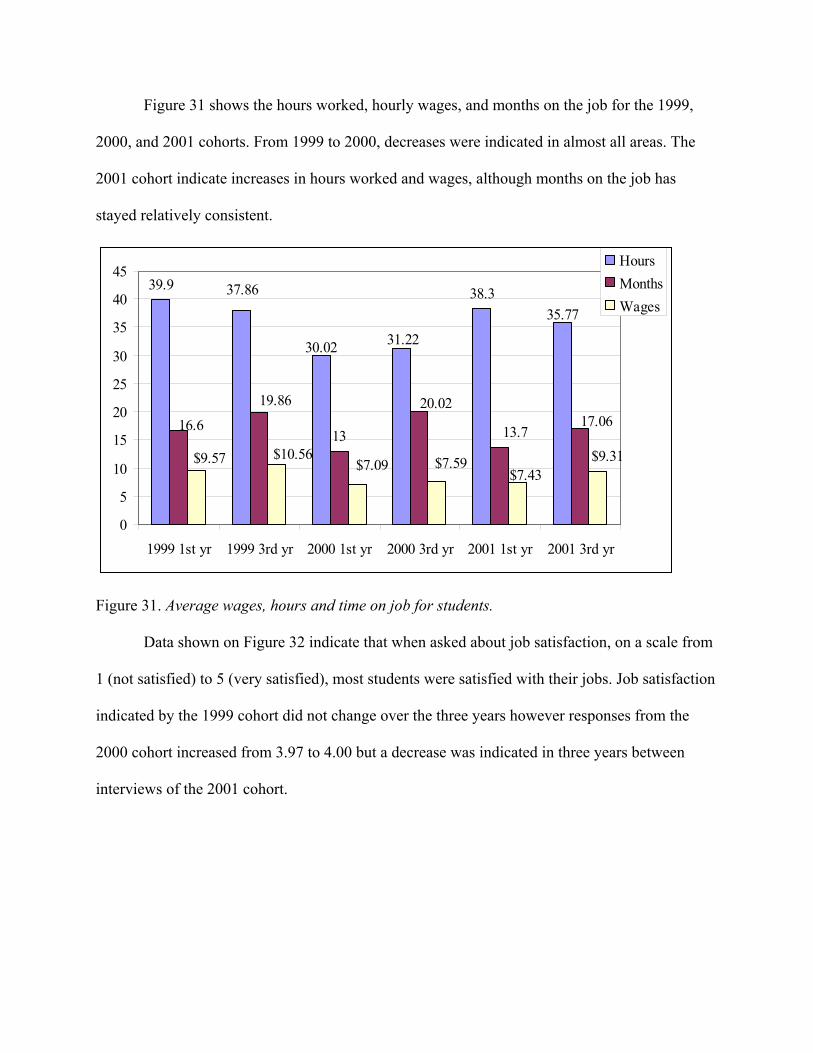
Figure 31 shows the hours worked, hourly wages, and months on the job for the 1999,
2000, and 2001 cohorts. From 1999 to 2000, decreases were indicated in almost all areas. The
2001 cohort indicate increases in hours worked and wages, although months on the job has
stayed relatively consistent.
39.9 38.3
13
37.86
30.02 31.22
35.77
19.86
16.620.02
13.717.06
$9.57 $10.56$7.09 $7.59 $9.31
$7.43
0
5
10
15
20
25
30
35
40
45
1999 1st yr 1999 3rd yr 2000 1st yr 2000 3rd yr 2001 1st yr 2001 3rd yr
HoursMonthsWages
Figure 31. Average wages, hours and time on job for students.
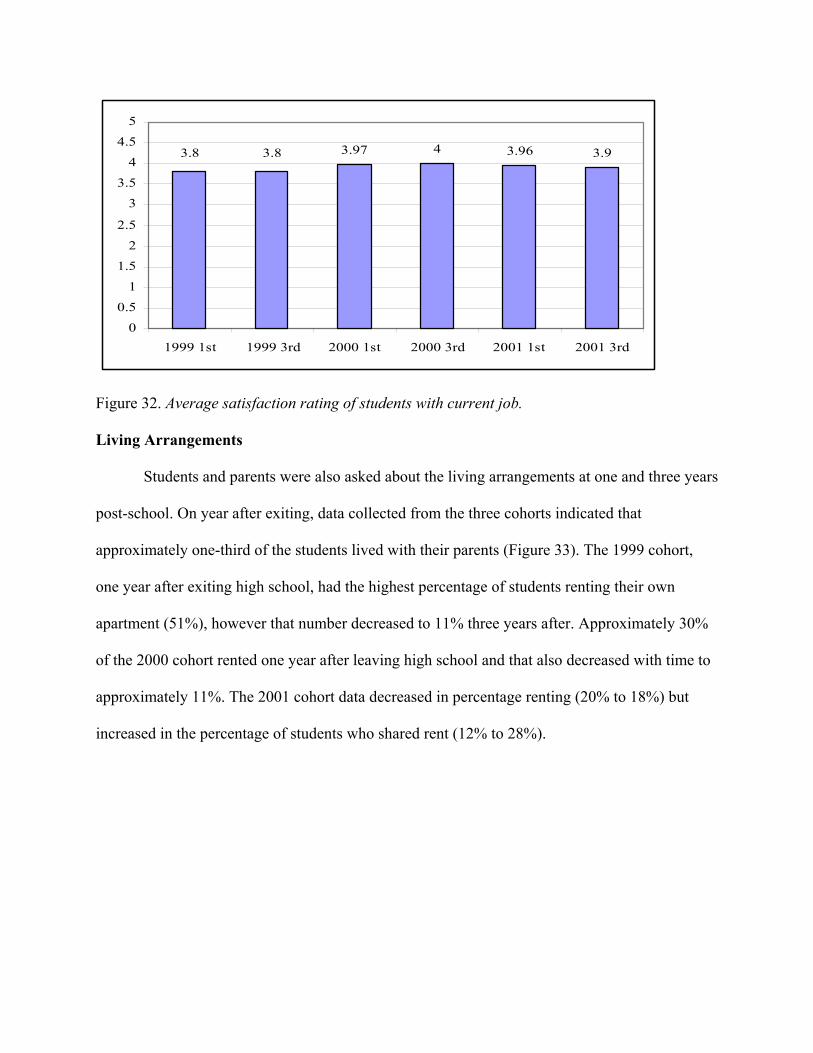
Data shown on Figure 32 indicate that when asked about job satisfaction, on a scale from
1 (not satisfied) to 5 (very satisfied), most students were satisfied with their jobs. Job satisfaction
indicated by the 1999 cohort did not change over the three years however responses from the
2000 cohort increased from 3.97 to 4.00 but a decrease was indicated in three years between
interviews of the 2001 cohort.
3.97 4 3.96 3.93.83.8
0
0.5
1
1.5
2
2.5
3
3.5
4
4.5
5
1999 1st 1999 3rd 2000 1st 2000 3rd 2001 1st 2001 3rd
Figure 32. Average satisfaction rating of students with current job.
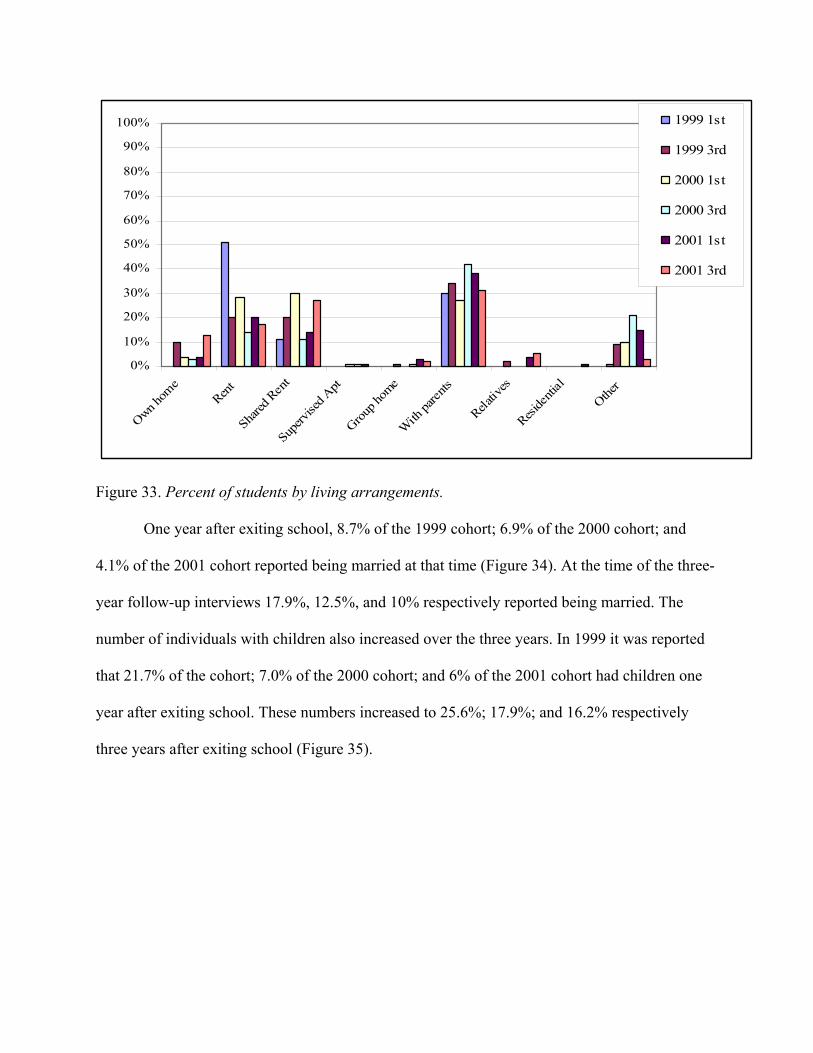
Living Arrangements
Students and parents were also asked about the living arrangements at one and three years
post-school. On year after exiting, data collected from the three cohorts indicated that
approximately one-third of the students lived with their parents (Figure 33). The 1999 cohort,
one year after exiting high school, had the highest percentage of students renting their own
apartment (51%), however that number decreased to 11% three years after. Approximately 30%
of the 2000 cohort rented one year after leaving high school and that also decreased with time to
approximately 11%. The 2001 cohort data decreased in percentage renting (20% to 18%) but
increased in the percentage of students who shared rent (12% to 28%).
0%
10%
20%
30%
40%
50%
60%
70%
80%
90%
100%
Own hom
eRen
t
Shared
Ren
t
Superv
ised A
pt
Group h
ome
With
paren
ts
Relativ
es
Reside
ntial
Other
1999 1st
1999 3rd
2000 1st
2000 3rd
2001 1st
2001 3rd
Figure 33. Percent of students by living arrangements.
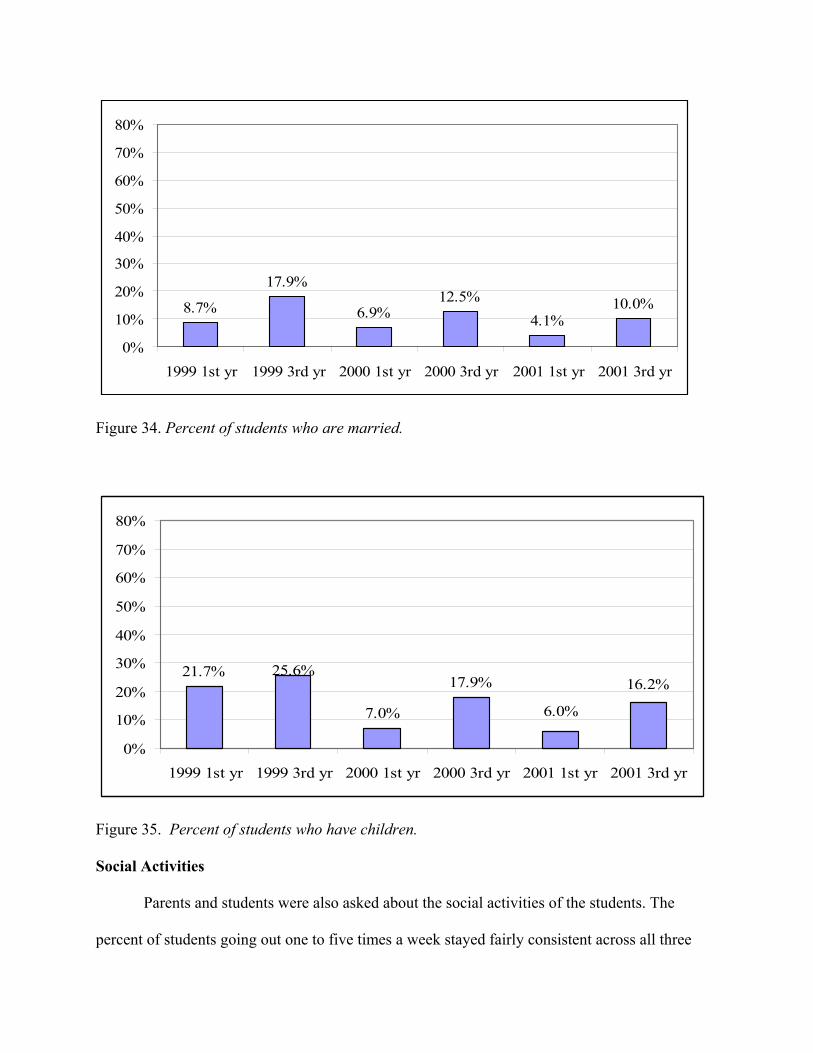
One year after exiting school, 8.7% of the 1999 cohort; 6.9% of the 2000 cohort; and
4.1% of the 2001 cohort reported being married at that time (Figure 34). At the time of the three-
year follow-up interviews 17.9%, 12.5%, and 10% respectively reported being married. The
number of individuals with children also increased over the three years. In 1999 it was reported
that 21.7% of the cohort; 7.0% of the 2000 cohort; and 6% of the 2001 cohort had children one
year after exiting school. These numbers increased to 25.6%; 17.9%; and 16.2% respectively
three years after exiting school (Figure 35).
8.7%
17.9%
6.9%12.5%
4.1%10.0%
0%
10%
20%
30%
40%
50%
60%
70%
80%
1999 1st yr 1999 3rd yr 2000 1st yr 2000 3rd yr 2001 1st yr 2001 3rd yr
Figure 34. Percent of students who are married.
21.7%
7.0%
17.9% 16.2%
6.0%
25.6%
0%
10%
20%
30%
40%
50%
60%
70%
80%
1999 1st yr 1999 3rd yr 2000 1st yr 2000 3rd yr 2001 1st yr 2001 3rd yr
Figure 35. Percent of students who have children.
Social Activities
Parents and students were also asked about the social activities of the students. The
percent of students going out one to five times a week stayed fairly consistent across all three
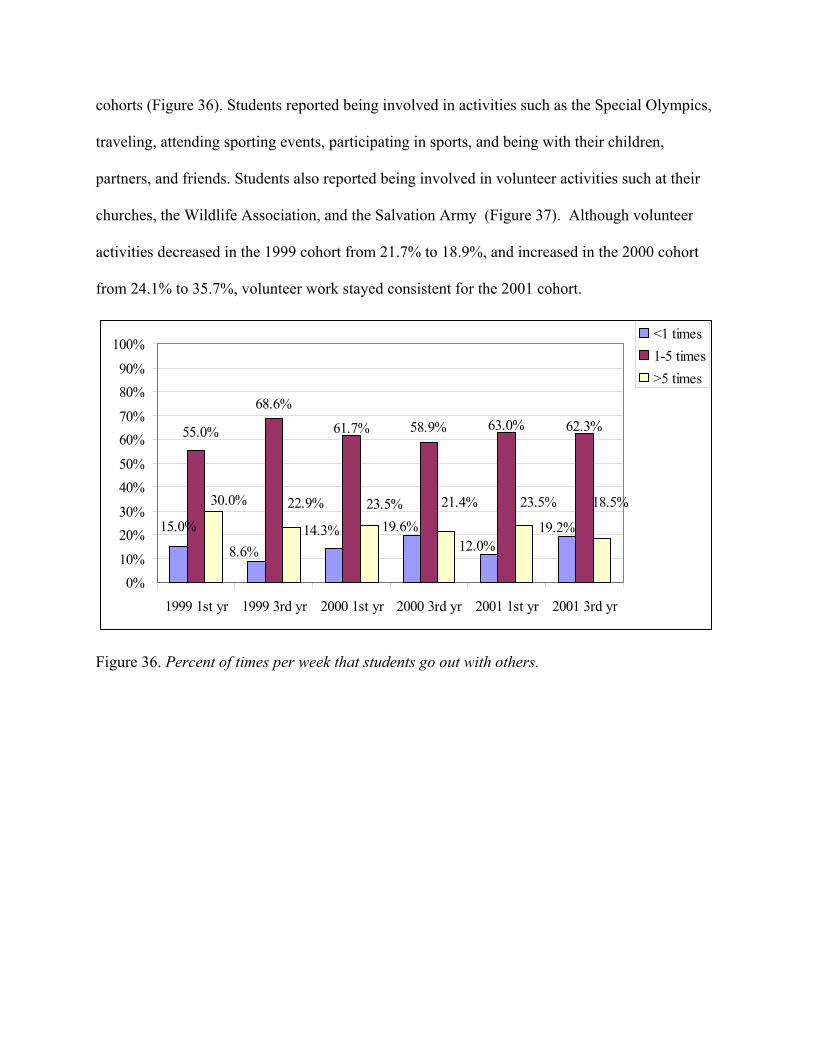
cohorts (Figure 36). Students reported being involved in activities such as the Special Olympics,
traveling, attending sporting events, participating in sports, and being with their children,
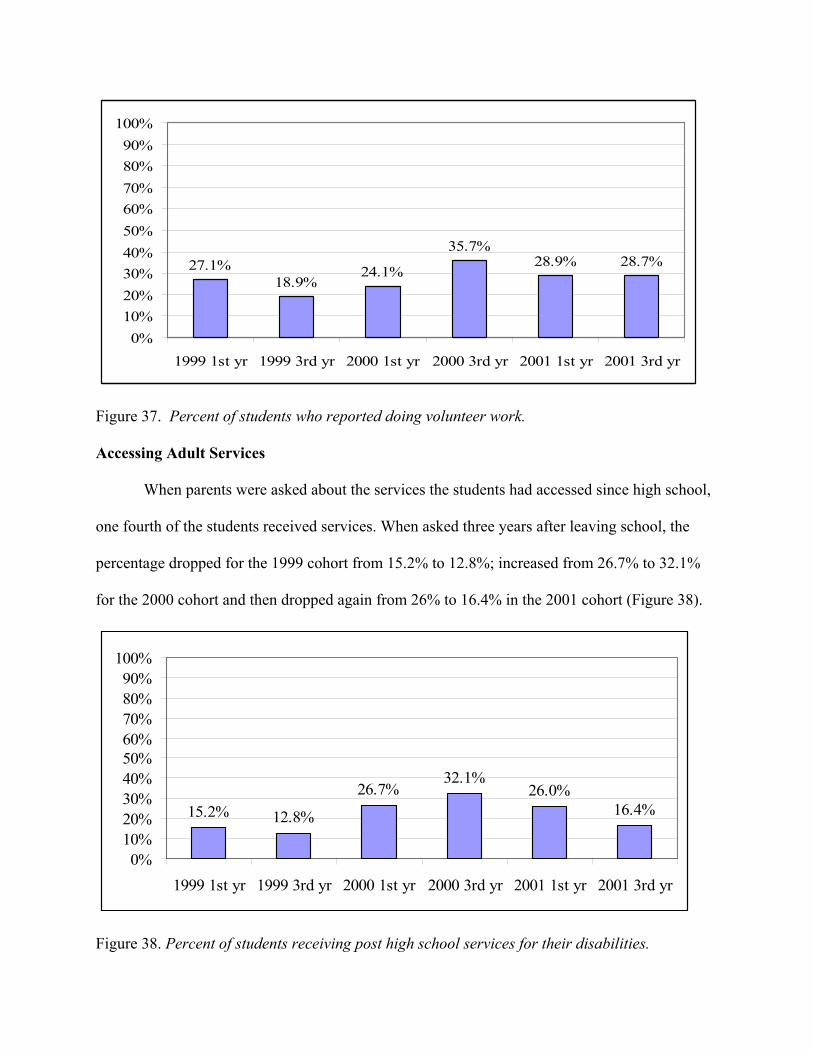
partners, and friends. Students also reported being involved in volunteer activities such at their
churches, the Wildlife Association, and the Salvation Army (Figure 37). Although volunteer
activities decreased in the 1999 cohort from 21.7% to 18.9%, and increased in the 2000 cohort
from 24.1% to 35.7%, volunteer work stayed consistent for the 2001 cohort.
68.6%58.9%
8.6%14.3% 19.6%
12.0%19.2%15.0%
61.7% 62.3%63.0%55.0%
18.5%23.5%21.4%23.5%22.9%30.0%
0%10%
20%30%
40%50%
60%70%
80%90%
100%
1999 1st yr 1999 3rd yr 2000 1st yr 2000 3rd yr 2001 1st yr 2001 3rd yr
<1 times1-5 times>5 times
Figure 36. Percent of times per week that students go out with others.
27.1%18.9%
24.1%
35.7%28.9% 28.7%
0%10%20%30%40%50%60%70%80%90%
100%
1999 1st yr 1999 3rd yr 2000 1st yr 2000 3rd yr 2001 1st yr 2001 3rd yr
Figure 37. Percent of students who reported doing volunteer work.
Accessing Adult Services
When parents were asked about the services the students had accessed since high school,
one fourth of the students received services. When asked three years after leaving school, the
percentage dropped for the 1999 cohort from 15.2% to 12.8%; increased from 26.7% to 32.1%
for the 2000 cohort and then dropped again from 26% to 16.4% in the 2001 cohort (Figure 38).
15.2% 12.8%
26.7%32.1%
26.0%16.4%
0%10%20%30%40%50%60%70%80%90%
100%
1999 1st yr 1999 3rd yr 2000 1st yr 2000 3rd yr 2001 1st yr 2001 3rd yr
Figure 38. Percent of students receiving post high school services for their disabilities.
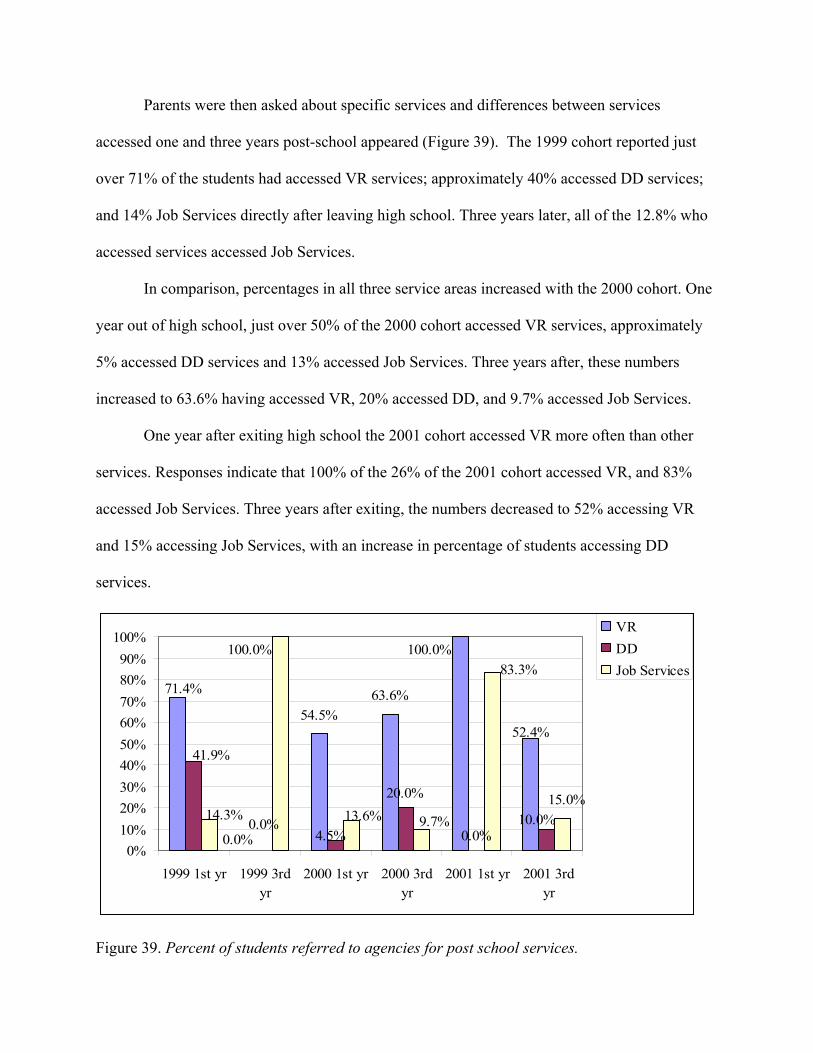
Parents were then asked about specific services and differences between services
accessed one and three years post-school appeared (Figure 39). The 1999 cohort reported just
over 71% of the students had accessed VR services; approximately 40% accessed DD services;
and 14% Job Services directly after leaving high school. Three years later, all of the 12.8% who
accessed services accessed Job Services.
In comparison, percentages in all three service areas increased with the 2000 cohort. One
year out of high school, just over 50% of the 2000 cohort accessed VR services, approximately
5% accessed DD services and 13% accessed Job Services. Three years after, these numbers
increased to 63.6% having accessed VR, 20% accessed DD, and 9.7% accessed Job Services.
One year after exiting high school the 2001 cohort accessed VR more often than other
services. Responses indicate that 100% of the 26% of the 2001 cohort accessed VR, and 83%
accessed Job Services. Three years after exiting, the numbers decreased to 52% accessing VR
and 15% accessing Job Services, with an increase in percentage of students accessing DD
services.
20.0%
0.0%0.0%
52.4%
100.0%
63.6%54.5%
71.4%
41.9%
0.0%4.5%
10.0%13.6%14.3% 9.7%15.0%
83.3%100.0%
0%10%20%30%40%50%60%70%80%90%
100%
1999 1st yr 1999 3rdyr
2000 1st yr 2000 3rdyr
2001 1st yr 2001 3rdyr
VRDDJob Services
Figure 39. Percent of students referred to agencies for post school services.
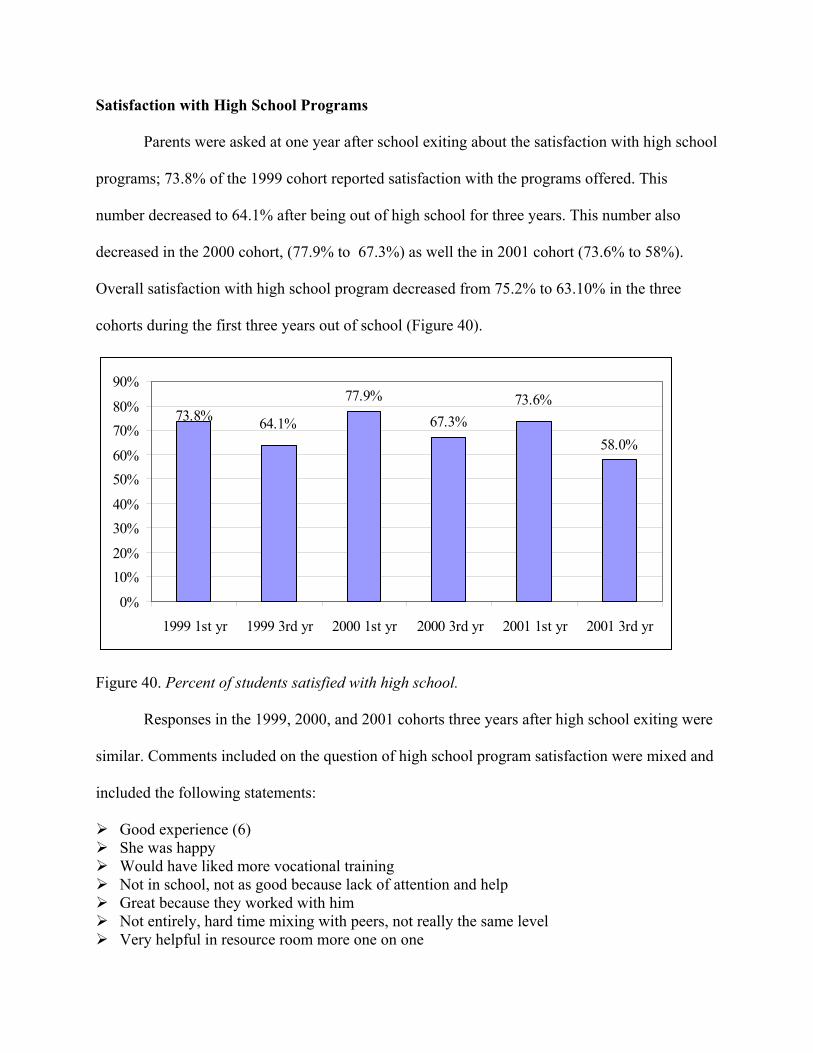
Satisfaction with High School Programs
Parents were asked at one year after school exiting about the satisfaction with high school
programs; 73.8% of the 1999 cohort reported satisfaction with the programs offered. This
number decreased to 64.1% after being out of high school for three years. This number also
decreased in the 2000 cohort, (77.9% to 67.3%) as well the in 2001 cohort (73.6% to 58%).
Overall satisfaction with high school program decreased from 75.2% to 63.10% in the three
cohorts during the first three years out of school (Figure 40).
77.9%
67.3%58.0%
73.6%64.1%73.8%
0%
10%20%
30%40%
50%60%
70%80%
90%
1999 1st yr 1999 3rd yr 2000 1st yr 2000 3rd yr 2001 1st yr 2001 3rd yr
Figure 40. Percent of students satisfied with high school.
Responses in the 1999, 2000, and 2001 cohorts three years after high school exiting were
similar. Comments included on the question of high school program satisfaction were mixed and
included the following statements:
Good experience (6) She was happy Would have liked more vocational training Not in school, not as good because lack of attention and help Great because they worked with him Not entirely, hard time mixing with peers, not really the same level Very helpful in resource room more one on one
Lack of guidance, peer pressure School did not help much with education problems, didn’t work with her enough, mindset
wasn’t there, to help, they categorized her ADD as “lazy” or “retarded” Seemed happy and ready to go to school Friends and stuff, yes although discrepancies between principal and teachers in the last year Case manager didn’t follow I.E.P rules, wasn’t correctly placed, got less help than needed,
not a big support system Worst time of his life, to keep the same teachers and aids they would get burned out with
some kids and start to verbally abuse them, everything was always the kids fault, never took disability into account , only treated normally during test time, not accommodating, just learned people were mean, teachers taunted the students about their physical disabilities, and offered no support for extra curricular activities(2)
Disliked school; teased by other students Struggled, teachers weren’t good Thought school was a waste of time Good student; got along with others Good curriculum that was accommodating
Parents were then asked what they would change if given that opportunity and the following is
examples of feedback on program change:
Started receiving help earlier (3) Bigger community to offer more Nothing, except sometimes the teacher didn’t know what the aids were working on More Socializing (3) Didn’t get a welding certificate and was supposed to They let too much slide with him and let him be too interdependent on others, could’ve
expected a little more from him Didn’t push computer area, would have like to see him try a bit with computers She could have studied more Was teased in high school teacher didn’t make the effort to help him Need better teachers (8) Changed Schools More organizational skills
Parents were asked if they felt the students were prepared for life after high school,
responses remained relatively close over the three years. Responses from parents indicated that
60.0% of the students who graduated in 1999 were prepared for life one year after exiting. This
percentage increased to 64.1% three years after exiting. When parents of students exiting in
2000 were asked 65.1% thought the students were prepared for life. This number slightly
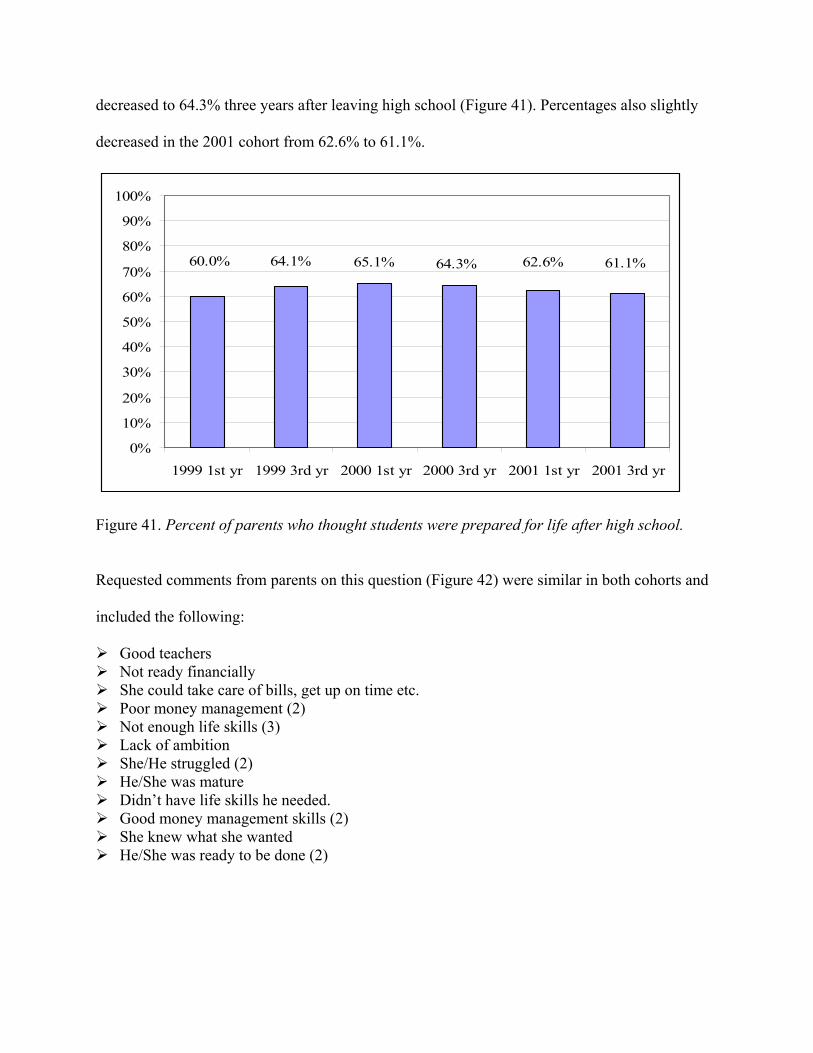
decreased to 64.3% three years after leaving high school (Figure 41). Percentages also slightly
decreased in the 2001 cohort from 62.6% to 61.1%.
65.1% 61.1%62.6%64.3%64.1%60.0%
0%
10%
20%
30%
40%
50%
60%
70%
80%
90%
100%
1999 1st yr 1999 3rd yr 2000 1st yr 2000 3rd yr 2001 1st yr 2001 3rd yr
Figure 41. Percent of parents who thought students were prepared for life after high school.
Requested comments from parents on this question (Figure 42) were similar in both cohorts and
included the following:
Good teachers Not ready financially She could take care of bills, get up on time etc. Poor money management (2) Not enough life skills (3) Lack of ambition She/He struggled (2) He/She was mature Didn’t have life skills he needed. Good money management skills (2) She knew what she wanted He/She was ready to be done (2)
Summary
Comparing the data for three cohorts over three years show that students with disabilities
from 1999, 2000, and 2001 moved on to post secondary training, secured nearly full-time
employment, and earned wages at or slightly above minimum wage. Students found employment
in a variety of areas including welding, landscaping, and youth mentoring.
Parents interviewed felt that students were prepared for adult life. Students lived in a
variety of home and community settings, and spent time going out with friends on a weekly basis
enjoying activities such as hunting, racing, joining clubs and sport organizations. Few students
accessed services after exiting high school; these results have been consistent over the six years
with Vocational Rehabilitation and Job Services being the most commonly accessed agencies.
Bases on responses from the parents, life during these three years after exiting school changed
very little except in the area of marriage and children, both areas indicated an increase; the 2000
cohort having the largest increase in these two areas.
Comparing these data will be critical in examining trends, patterns, and developments;
thus giving indicators of what has been effective in the education system. The data will prove
useful toward the future of a better quality of life for students with special needs in their
academic lives as well as their personal lives.
Appendix A
Exit Interview Directions
Special Education Student Exit Interview – 2004 Directions Complete this interview questionnaire with all 2004 exiters receiving special education services in your unit. This is intended to be a personal interview with each student as not all information is identifiable via the IEP and/or student file review. This interview should take no more than 5-7 minutes per student. Identify Special Education Unit, school students attend and individual completing the survey form. Complete all questions for all students. Complete one sheet per student. IF YOU HAVE QUESTIONS AT ANY TIME DURING THE STUDENT INTERVIEWS, PLEASE CALL GERRY TEEVENS AT SPECIAL EDUCATION AT (701) 328-2277. Release of Information: Have each student sign and complete the release of information as required by FERPA. Explain that this is a voluntary study, which is important for all students receiving special education, and their participation is important. Follow up in one, three and five years is also voluntary and could serve as assistance if they are in need of services and/or referral to other agencies. Please reassure students that this information will remain confidential and no individual identifiable information will be shared. The signed Releases of Information should be clipped to the follow up form. Student Name: List student name; last name first, then first (middle initial optional). Gender: Identify M for male, F for female. Disability: Use the key to identify 1 – 12 according to the primary disability identified for each student. 1 – AUT 5 – OHI 9 - SLD 2 – D/B 6 – OI 10 - TBI 3 – MR 7 – ED 11 – VI 4 – HI 8 – SI 12 - DEAF Social Security Number: List SSN for all students; this information will be useful as we track the same group of exiters one, three and five years after high school, and access additional information through FINDET. This information is generally part of the student’s cum file, if not located on the IEP. Although this information is optional, it will allow the most effective tracking and successful gathering of information in the future. Race: Use the key to identify and record student race.2 1 – White 4 – Black 2 – American Indian/Alaskan Native 5 – Asian / Pacific Islander 3 – Hispanic 6 – Other Questions The following questions are to be asked of each exiting student, discussed/clarified if necessary, then recorded by the Unit designee according to the response code. For questions 3, 4, and 6 there may be an open-ended response; log that response in the appropriate boxes located at the bottom of the form. Use additional paper or the back of the form if necessary. Be certain to identify responses with the corresponding student number (1-10). Q 1: Did the student’s most recent IEP identify an anticipated career or post school employment goal? The Transition IEP includes the section Post School Outcomes, where student goals are identified. This question will provide valuable information regarding the accountability of education and planning for
ones future. Enter 1 for “yes” if the IEP identified the student’s anticipated career or post school goal/outcome for employment. Enter 2 for “no” if the IEP did not contain a career or post school goal/outcome for employment or if student was ‘undecided’ in his/her post school employment goal(s). Q 2: Did the student attend all or part of the most recent and/or exit IEP meeting? This information will allow measures of correlation between student IEP attendance/participation and post school outcomes as well as with best practices regarding student invitation, self-advocacy, etc. Enter 1 if the student attended and actively participated in his/her most recent and/or exit IEP meeting. Enter 2 if the student attended, but did not participate in his/her most recent and/or exit IEP meeting. Enter 3 if the student did not attend his/her most recent and/or exit IEP meeting. Q 3: What is this student’s plan after high school? The intent of this question is to establish a baseline as to the student plan at the time of high school exit, and will be compared with the same question asked at intervals of one, three and five years after high school. If the student plans to be involved in more than one of the choices listed, mark all choices that apply. 1) Employment: enter 1 if the student indicates he/she will seek and secure employment. If the employment is known, please note such in the indicator box for this question (be as specific as possible) at the bottom of the page. If student knows he/she will seek work, but uncertain about what and where, enter 1 and identify ‘uncertain’ in the indicator section at the middle of the page. 2) Military: enter 2 if the student will enter any branch of the armed services or ND National Guard. In many cases, a student may enroll in the Guard along with employment or retraining; in this case, please mark all responses that apply. 3) Postsecondary: (identify a choice) a) university (4 yr.): enter 3a if student will attend a liberal arts program (e.g., UND, NDSU); b) voc-tech (2 yr.): enter 3b if the student will attend a two-year community college (e.g., BSC, NDSC); c) trade (1 yr. or less, includes Job Corp): enter 3c if student will attend a specific trade program or Job Corp. Can include BSC or NDSCS, or other programs if duration is less than 12 months; d) other (id): enter 3d if student will attend a program other than what has been described above. Identify any information you have available regarding duration, occupation, and school, etc in indicator box Q3d. This includes plans for college, but uncertain about where, duration of program, etc. 4) Don’t know: enter 4 if student has no future plans following high school. 5) Unemployment/not able to work: enter 5 if the student reveals he/she chooses not to work or is not able to maintain employment as a result of personal choice or disability. 6) Other: enter 6 if the choice of student is something other than those above and describe his/her response in indicator box Q 3(5) located on the middle of the page. Q 4: Identify Adult Providers who will help student as identified in the IEP: The collaboration and need for seamless services beyond high school is critical for student success. This question could have multiple responses. 1) No services needed: enter 1 if no Adult Providers are necessary for assistance. 2) Vocational Rehabilitation: enter 2 for VR services to include supported employment, funding assistance for postsecondary education, placement assistance. 3) Developmental Disabilities: enter 3 for DD services to include case management, residential or day services, group home living. 4) Job Services: enter 4 for JS services to include JTPA/WIA programs, placement assistance, Job Corp. 5) Social Security: enter 5 for SS services to include PASS, income supplement. 6) College/University Disability Support Services: enter 6 for services to include academic accommodations & supports while pursuing postsecondary education.
7) Adult Learning Center: enter 7 for services to include further study at any ALC. 8) Other: enter 8 for other services provided to student that benefits their post school or career goal and specify what information you can in the box designated in the middle of the page. Q 5: Why did student exit your program? The intent of this question is to identify the exit status of each student. Only one choice may be selected. 1) Graduated with a diploma: enter 1 if student exited the educational program through receipt of a diploma identical to that for which non-disabled students are eligible. 2) Graduated with a certificate: enter 2 if student exited the educational program through receipt of a certificate of completion, modified diploma fulfillment of an IEP. 3) Aged out: enter 3 if student exited the educational setting as a consequence of reaching the maximum age for receipt of special education services. 4) Dropped out: enter 4 if student exited the educational program as a consequence of dropping out of school, withdrawal from school without completing. Q 6: Identify occupational skills attained by student during high school. This information is consistent with that sought by Job Services and the Workforce Investment Act. Occupational skills attained during high school are a predictor of future placement and success and will allow the study to draw some parallels. Identify all skills that apply for each student. This information may come from instruction/coursework, IEP goals, etc. 1) Employment: enter 1 if student held any form of employment during high school regardless of who arranged. 2) Vocational courses: enter 2 if student was enrolled in any specific vocational or work related courses taken. 3) Specific instruction in: a) work skills: enter 3a if student acquired specific instruction to arrive at work on time, dress appropriately, perform tasks under supervision, and work as a team; b) social and/or interpersonal skills: enter 3b if student acquired specific instruction on how to interact appropriately with others, handle conflict, talk socially with coworkers and customers, ask/answer questions, etc; c) daily living skills: enter 3c if student acquired specific instruction in independent living, grooming, hygiene, etc; d) community access skills: enter 3d if student acquired specific instruction in how to access such community facilities as churches, bank, courthouse, recreation centers, etc; 4) Computer literacy/keyboarding: enter 4 if student learned how to use a computer and/or type. 5) Work in teams/groups: enter 5 if student learned how to work with others, participate, delegate, etc. 6) Other relevant skills: enter 6 if student learned other specific skills acquired during high school that will positively impact work skills and specify what information you can in the box designated in the middle of the page. Q 7 (a): Identify student satisfaction with overall high school program. Overall student (consumer) satisfaction with high school considering all factors is significant to post school success. Ask the student: Think about your overall years in high school. If you were to give your high school a grade, what grade would that be? Enter “1” for A (excellent) Enter “2” for B (above average – very good) Enter “3” for C (average - ok) Enter “4” for D (below average – not good at all) Enter “5” for F (terrible)
Q 7 (b): Identify student satisfaction with vocational or transition aspect of high school. Student (consumer) satisfaction with services as they relate specifically to transition/vocational preparation; getting ready for life after high school is the intent of this question. Ask the student: Think now about your overall transition preparation for life after high school. If you were to give your high school a grade, what grade would it be? Enter “1” for A (excellent) Enter “2” for B (above average – very good) Enter “3” for C (average - ok) Enter “4” for D (below average – not good at all) Enter “5” for F (terrible) Q 8 (a): Identify student satisfaction with special education aspect of high school. Student (consumer) satisfaction with services in special education while in high school is important to document accountability as well as future planning. Ask the student: Think about the special education services you received in high school. If you were to give your high school a grade, what grade would it be? Enter “1” for A (excellent) Enter “2” for B (above average – very good) Enter “3” for C (average - ok) Enter “4” for D (below average – not good at all) Enter “5” for F (terrible) Q 8 (b): If you had to stay in school an additional semester and were free to choose classes, what would you take? Seeking suggestions from students (consumers) is important in planning and reviewing past performance. This question is intended to solicit subjective response(s) from students about what they perceive to need. Ask the student: (Hypothetically) If you had to stay in school an additional semester and were free to choose classes, what would you take? 1) Academic classes (math, history, English, sciences) 2) Topical/interest classes (music, band, gym, etc.) 3) Functional or vocational classes (consumer sciences, industrial tech, independent living, etc)
Appendix B
School Report Forms
and Code Key


Appendix C
Telephone Interview Questionnaire
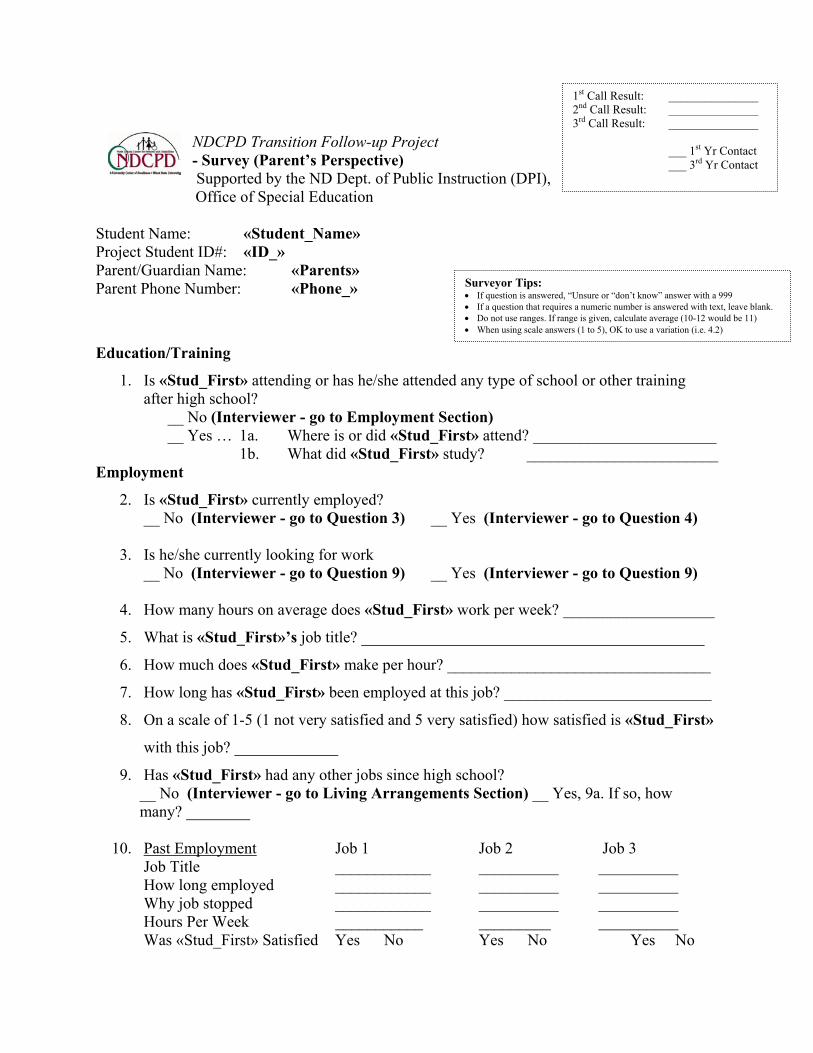
NDCPD Transition Follow-up Project - Survey (Parent’s Perspective) Supported by the ND Dept. of Public Instruction (DPI), Office of Special Education
Student Name: «Student_Name» Project Student ID#: «ID_» Parent/Guardian Name: «Parents» Parent Phone Number: «Phone_»
Education/Training
1. Is «Stud_First» attending or has he/she attended any type of school or other training after high school?
__ No (Interviewer - go to Employment Section) __ Yes … 1a. Where is or did «Stud_First» attend? _______________________ 1b. What did «Stud_First» study? ________________________
Employment
2. Is «Stud_First» currently employed? __ No (Interviewer - go to Question 3) __ Yes (Interviewer - go to Question 4)
3. Is he/she currently looking for work
__ No (Interviewer - go to Question 9) __ Yes (Interviewer - go to Question 9)
4. How many hours on average does «Stud_First» work per week? ___________________
5. What is «Stud_First»’s job title? ___________________________________________
6. How much does «Stud_First» make per hour? _________________________________
7. How long has «Stud_First» been employed at this job? __________________________
8. On a scale of 1-5 (1 not very satisfied and 5 very satisfied) how satisfied is «Stud_First»
with this job? _____________
9. Has «Stud_First» had any other jobs since high school? __ No (Interviewer - go to Living Arrangements Section) __ Yes, 9a. If so, how many? ________
10. Past Employment Job 1 Job 2 Job 3 Job Title ____________ __________ __________ How long employed ____________ __________ __________ Why job stopped ____________ __________ __________ Hours Per Week ___________ _________ __________ Was «Stud_First» Satisfied Yes No Yes No Yes No
1st Call Result: _______________ 2nd Call Result: _______________ 3rd Call Result: _______________
___ 1st Yr Contact ___ 3rd Yr Contact
Surveyor Tips: • If question is answered, “Unsure or “don’t know” answer with a 999 • If a question that requires a numeric number is answered with text, leave blank. • Do not use ranges. If range is given, calculate average (10-12 would be 11) • When using scale answers (1 to 5), OK to use a variation (i.e. 4.2)
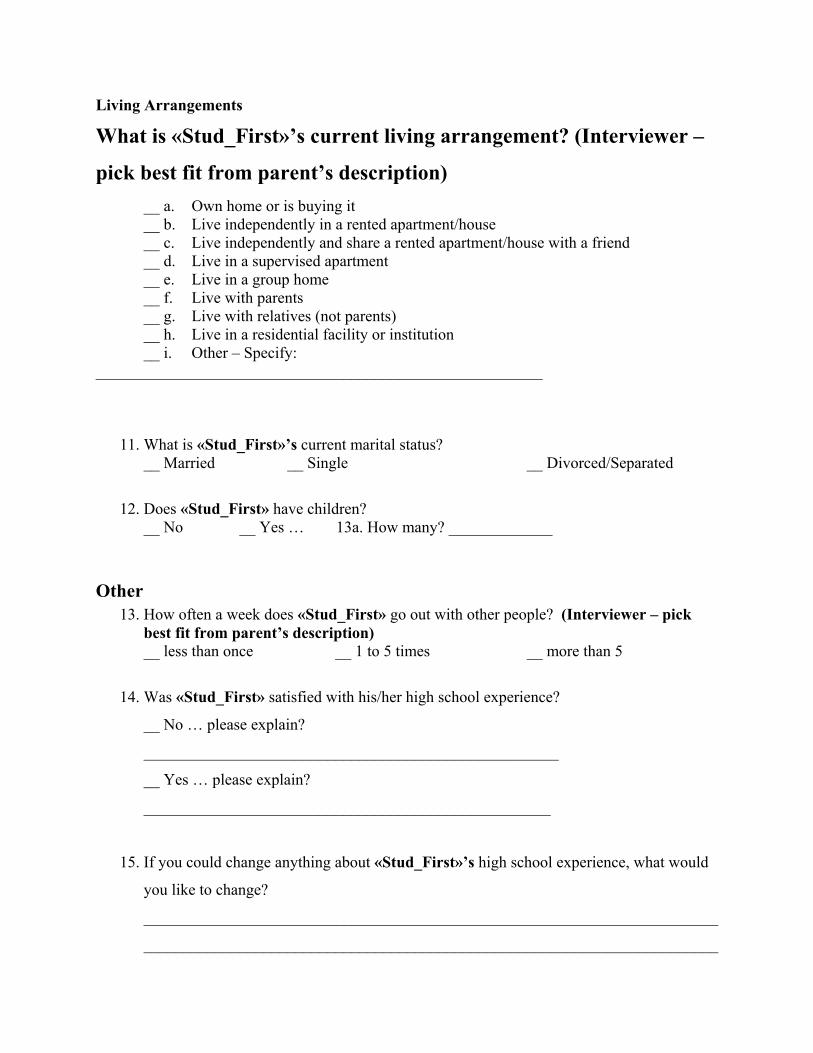
Living Arrangements
What is «Stud_First»’s current living arrangement? (Interviewer –
pick best fit from parent’s description)
__ a. Own home or is buying it __ b. Live independently in a rented apartment/house __ c. Live independently and share a rented apartment/house with a friend
__ d. Live in a supervised apartment __ e. Live in a group home __ f. Live with parents __ g. Live with relatives (not parents) __ h. Live in a residential facility or institution __ i. Other – Specify: ________________________________________________________
11. What is «Stud_First»’s current marital status? __ Married __ Single __ Divorced/Separated
12. Does «Stud_First» have children? __ No __ Yes … 13a. How many? _____________
Other 13. How often a week does «Stud_First» go out with other people? (Interviewer – pick
best fit from parent’s description) __ less than once __ 1 to 5 times __ more than 5
14. Was «Stud_First» satisfied with his/her high school experience?
__ No … please explain?
____________________________________________________
__ Yes … please explain?
___________________________________________________
15. If you could change anything about «Stud_First»’s high school experience, what would
you like to change?
________________________________________________________________________
________________________________________________________________________
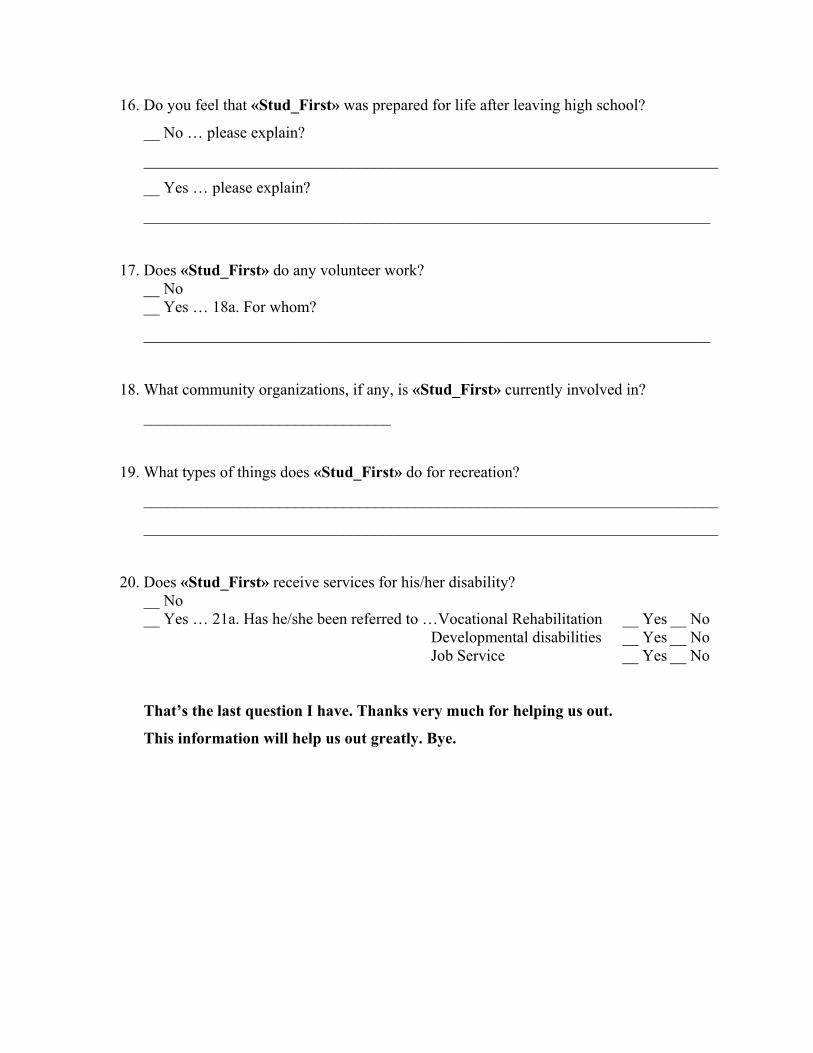
16. Do you feel that «Stud_First» was prepared for life after leaving high school?
__ No … please explain?
________________________________________________________________________
__ Yes … please explain?
_______________________________________________________________________
17. Does «Stud_First» do any volunteer work? __ No __ Yes … 18a. For whom?
_______________________________________________________________________
18. What community organizations, if any, is «Stud_First» currently involved in?
_______________________________
19. What types of things does «Stud_First» do for recreation?
________________________________________________________________________
________________________________________________________________________
20. Does «Stud_First» receive services for his/her disability? __ No __ Yes … 21a. Has he/she been referred to …Vocational Rehabilitation __ Yes __ No Developmental disabilities __ Yes __ No Job Service __ Yes __ No
That’s the last question I have. Thanks very much for helping us out.
This information will help us out greatly. Bye.

Appendix D Frequently Asked Questions

NDCPD Transition Follow-up Project -
Frequently Asked Questions Supported by the ND Dept. of Public Instruction (DPI), Office of Special Education - How do you know or get my name? When your son/daughter was in his/her senior year in high
school, he/she agreed to sign up for a study that the ND DPI’s Office of Special Education organized to follow students in transition from high school and also see what they were doing in the following years.
- How do you know my child? When your child was in his/her senior year in high school he/she agreed to sign up for a study that DPI’s Office of Special Education organized to follow students in transition from high school and also see what they were doing in the following years.
- How did you get my number? Your phone number was recalled from files in your child’s Special Education unit. <2001-2002 Only for Release forms> (You or your child filled out a release form when he/she was in their Senior year of High School to participate in a study about transition after High School in order to allow us to use this information for the study.)
- Where are you calling from? I am calling from the ND Center for Persons with Disabilities at Minot State University. We are involved in the transition study that you were contacted about in a postcard we sent out to you in the last week or two.
- Where did you get my information from? The information we needed to contact you and know about you was released to us by your Special Education Unit from your son/daughter’s High School. When you son/daughter was a senior in High School, he/she volunteered to participate in a study organized by the ND DPI looking at their Transition from High School and after High School as well as their opinions of how helpful the program he/she participated in at school was to prepare them for leaving school.
- What will you do with this information? The information that we will collect for the study will go into a database. We will stay in contact with your son/daughter up to 3 years, depending on how long he/she agreed to participate in the study. After all the data is collected, a final report will be drawn up to look at all the information gathered and how the High School programs can be changed or improved to allow for better transitions from school.
- What is NDCPD? NDCPD is a research and service center focused on individuals who have disabilities in North Dakota. It is the mission of NDCPD to advance the state of the art and promote the adoption of practices that effectively and appropriately increase the independence, productivity, integration, and inclusion of people who have disabilities.
- In case of a ‘referral’ or ‘diagnosis’ call, If a parent asks about their child’s condition or has questions about a referral like how to could they get a job, refer these calls to Brent Askvig.
- My son/daughter doesn’t have a disability ... A certain type of criteria must have been met for your son/daughter to be included in this study. In high school, your son/daughter received some type of special education services. It might have been help with reading, math, resource room, or some other accommodation. Possibly, your son/daughter received services that you may be unaware of. My records don’t indicate any specifics.

Appendix E Anecdotal Comments
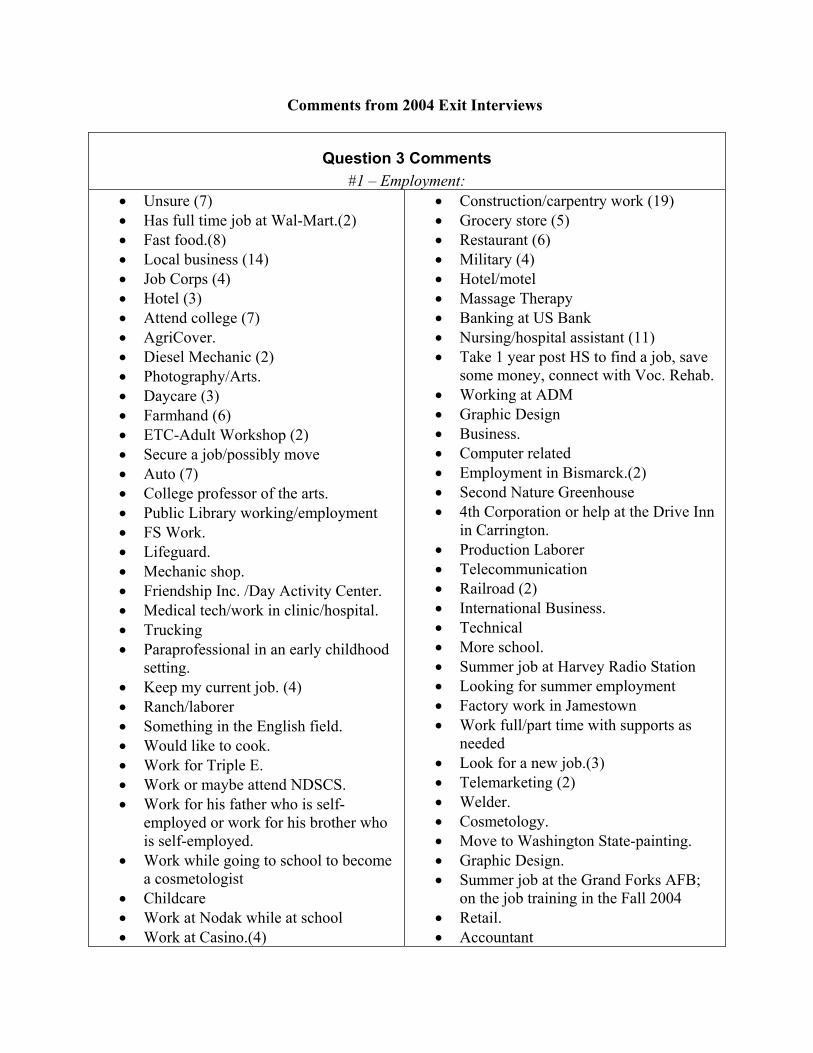
Comments from 2004 Exit Interviews
Question 3 Comments #1 – Employment:
• Unsure (7) • Has full time job at Wal-Mart.(2) • Fast food.(8) • Local business (14) • Job Corps (4) • Hotel (3) • Attend college (7) • AgriCover. • Diesel Mechanic (2) • Photography/Arts. • Daycare (3) • Farmhand (6) • ETC-Adult Workshop (2) • Secure a job/possibly move • Auto (7) • College professor of the arts. • Public Library working/employment • FS Work. • Lifeguard. • Mechanic shop. • Friendship Inc. /Day Activity Center. • Medical tech/work in clinic/hospital. • Trucking • Paraprofessional in an early childhood
setting. • Keep my current job. (4) • Ranch/laborer • Something in the English field. • Would like to cook. • Work for Triple E. • Work or maybe attend NDSCS. • Work for his father who is self-
employed or work for his brother who is self-employed.
• Work while going to school to become a cosmetologist
• Childcare • Work at Nodak while at school • Work at Casino.(4)
• Construction/carpentry work (19) • Grocery store (5) • Restaurant (6) • Military (4) • Hotel/motel • Massage Therapy • Banking at US Bank • Nursing/hospital assistant (11) • Take 1 year post HS to find a job, save
some money, connect with Voc. Rehab. • Working at ADM • Graphic Design • Business. • Computer related • Employment in Bismarck.(2) • Second Nature Greenhouse • 4th Corporation or help at the Drive Inn
in Carrington. • Production Laborer • Telecommunication • Railroad (2) • International Business. • Technical • More school. • Summer job at Harvey Radio Station • Looking for summer employment • Factory work in Jamestown • Work full/part time with supports as
needed • Look for a new job.(3) • Telemarketing (2) • Welder. • Cosmetology. • Move to Washington State-painting. • Graphic Design. • Summer job at the Grand Forks AFB;
on the job training in the Fall 2004 • Retail. • Accountant
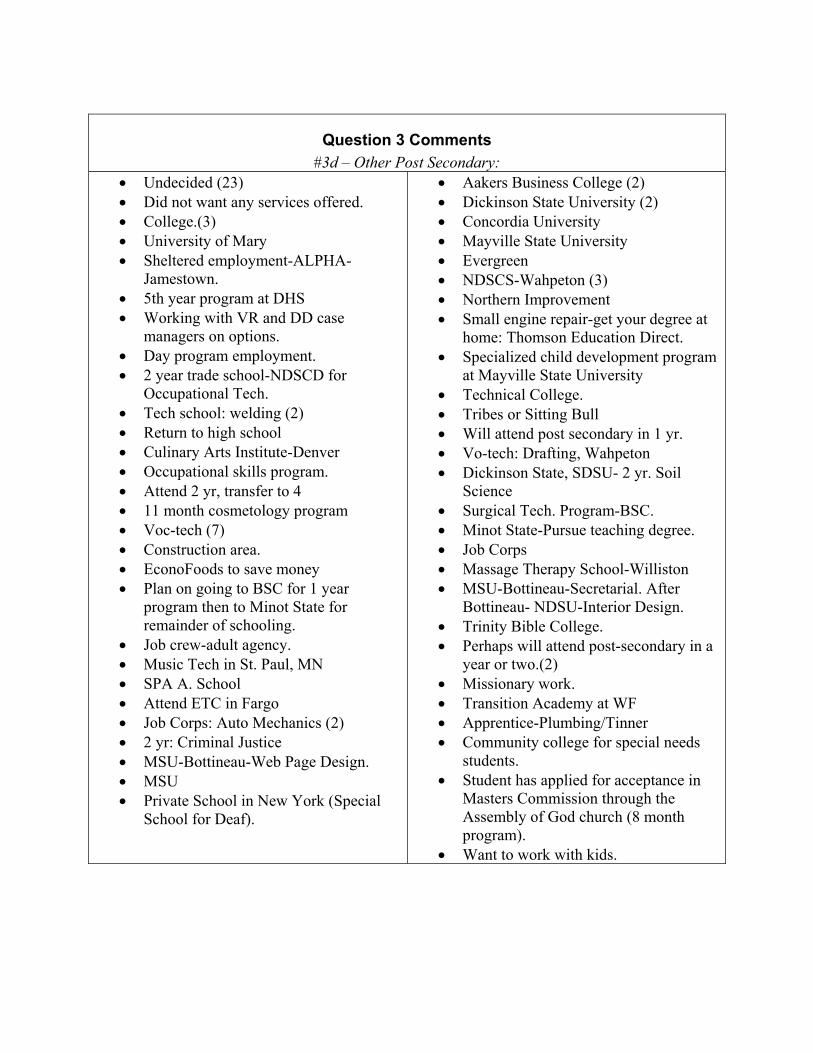
Question 3 Comments #3d – Other Post Secondary:
• Undecided (23) • Did not want any services offered. • College.(3) • University of Mary • Sheltered employment-ALPHA-
Jamestown. • 5th year program at DHS • Working with VR and DD case
managers on options. • Day program employment. • 2 year trade school-NDSCD for
Occupational Tech. • Tech school: welding (2) • Return to high school • Culinary Arts Institute-Denver • Occupational skills program. • Attend 2 yr, transfer to 4 • 11 month cosmetology program • Voc-tech (7) • Construction area. • EconoFoods to save money • Plan on going to BSC for 1 year
program then to Minot State for remainder of schooling.
• Job crew-adult agency. • Music Tech in St. Paul, MN • SPA A. School • Attend ETC in Fargo • Job Corps: Auto Mechanics (2) • 2 yr: Criminal Justice • MSU-Bottineau-Web Page Design. • MSU • Private School in New York (Special
School for Deaf).
• Aakers Business College (2) • Dickinson State University (2) • Concordia University • Mayville State University • Evergreen • NDSCS-Wahpeton (3) • Northern Improvement • Small engine repair-get your degree at
home: Thomson Education Direct. • Specialized child development program
at Mayville State University • Technical College. • Tribes or Sitting Bull • Will attend post secondary in 1 yr. • Vo-tech: Drafting, Wahpeton • Dickinson State, SDSU- 2 yr. Soil
Science • Surgical Tech. Program-BSC. • Minot State-Pursue teaching degree. • Job Corps • Massage Therapy School-Williston • MSU-Bottineau-Secretarial. After
Bottineau- NDSU-Interior Design. • Trinity Bible College. • Perhaps will attend post-secondary in a
year or two.(2) • Missionary work. • Transition Academy at WF • Apprentice-Plumbing/Tinner • Community college for special needs
students. • Student has applied for acceptance in
Masters Commission through the Assembly of God church (8 month program).
• Want to work with kids.
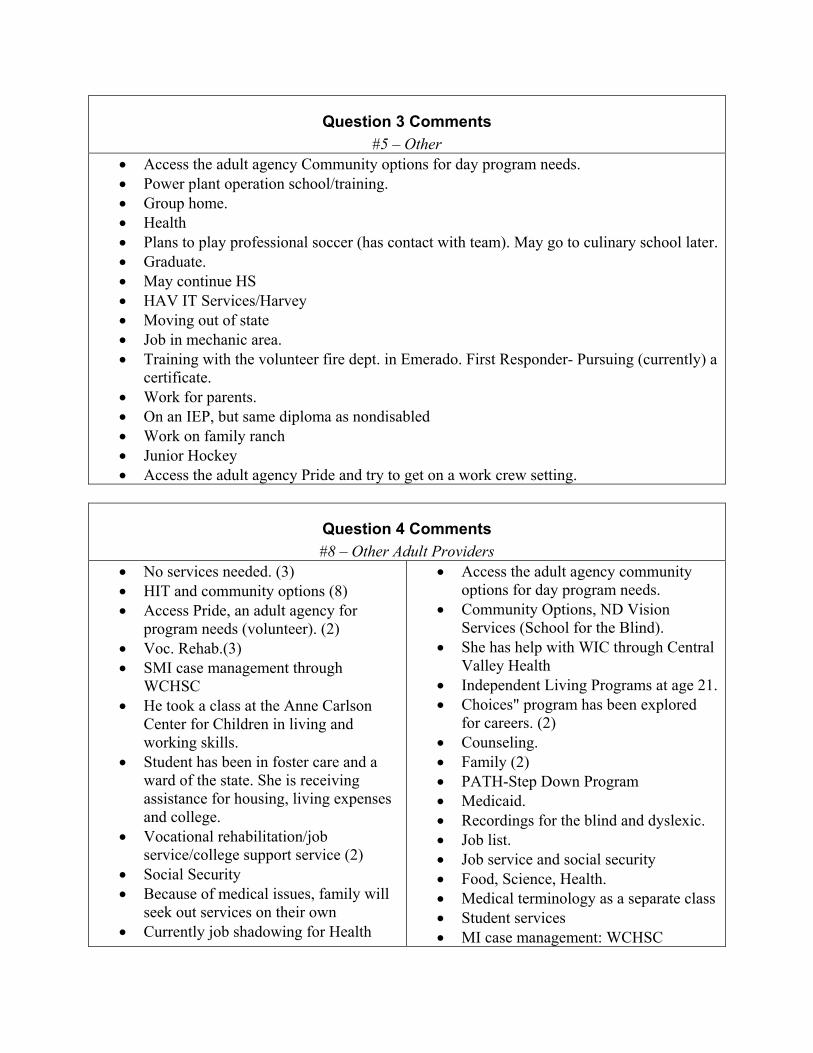
Question 3 Comments #5 – Other
• Access the adult agency Community options for day program needs. • Power plant operation school/training. • Group home. • Health • Plans to play professional soccer (has contact with team). May go to culinary school later.• Graduate. • May continue HS • HAV IT Services/Harvey • Moving out of state • Job in mechanic area. • Training with the volunteer fire dept. in Emerado. First Responder- Pursuing (currently) a
certificate. • Work for parents. • On an IEP, but same diploma as nondisabled • Work on family ranch • Junior Hockey • Access the adult agency Pride and try to get on a work crew setting.
Question 4 Comments #8 – Other Adult Providers
• No services needed. (3) • HIT and community options (8) • Access Pride, an adult agency for
program needs (volunteer). (2) • Voc. Rehab.(3) • SMI case management through
WCHSC • He took a class at the Anne Carlson
Center for Children in living and working skills.
• Student has been in foster care and a ward of the state. She is receiving assistance for housing, living expenses and college.
• Vocational rehabilitation/job service/college support service (2)
• Social Security • Because of medical issues, family will
seek out services on their own • Currently job shadowing for Health
• Access the adult agency community options for day program needs.
• Community Options, ND Vision Services (School for the Blind).
• She has help with WIC through Central Valley Health
• Independent Living Programs at age 21. • Choices" program has been explored
for careers. (2) • Counseling. • Family (2) • PATH-Step Down Program • Medicaid. • Recordings for the blind and dyslexic. • Job list. • Job service and social security • Food, Science, Health. • Medical terminology as a separate class • Student services • MI case management: WCHSC
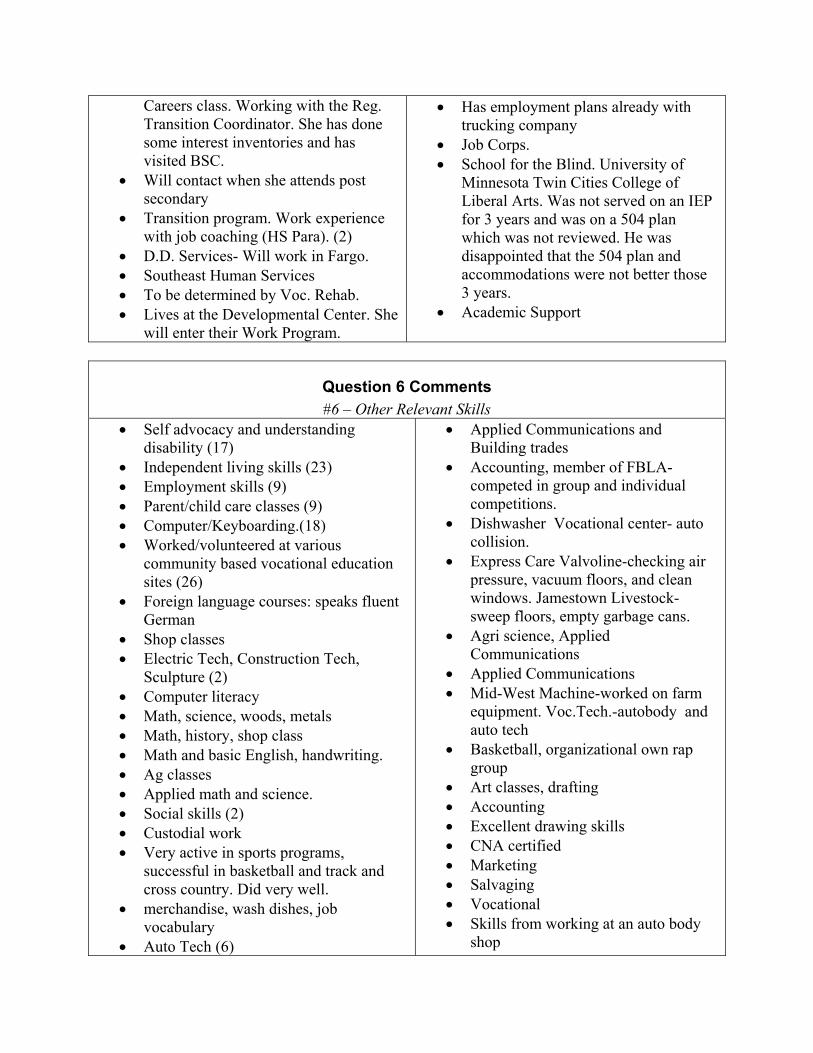
Careers class. Working with the Reg. Transition Coordinator. She has done some interest inventories and has visited BSC.
• Will contact when she attends post secondary
• Transition program. Work experience with job coaching (HS Para). (2)
• D.D. Services- Will work in Fargo. • Southeast Human Services • To be determined by Voc. Rehab. • Lives at the Developmental Center. She
will enter their Work Program.
• Has employment plans already with trucking company
• Job Corps. • School for the Blind. University of
Minnesota Twin Cities College of Liberal Arts. Was not served on an IEP for 3 years and was on a 504 plan which was not reviewed. He was disappointed that the 504 plan and accommodations were not better those 3 years.
• Academic Support
Question 6 Comments #6 – Other Relevant Skills
• Self advocacy and understanding disability (17)
• Independent living skills (23) • Employment skills (9) • Parent/child care classes (9) • Computer/Keyboarding.(18) • Worked/volunteered at various
community based vocational education sites (26)
• Foreign language courses: speaks fluent German
• Shop classes • Electric Tech, Construction Tech,
Sculpture (2) • Computer literacy • Math, science, woods, metals • Math, history, shop class • Math and basic English, handwriting. • Ag classes • Applied math and science. • Social skills (2) • Custodial work • Very active in sports programs,
successful in basketball and track and cross country. Did very well.
• merchandise, wash dishes, job vocabulary
• Auto Tech (6)
• Applied Communications and Building trades
• Accounting, member of FBLA-competed in group and individual competitions.
• Dishwasher Vocational center- auto collision.
• Express Care Valvoline-checking air pressure, vacuum floors, and clean windows. Jamestown Livestock- sweep floors, empty garbage cans.
• Agri science, Applied Communications
• Applied Communications • Mid-West Machine-worked on farm
equipment. Voc.Tech.-autobody and auto tech
• Basketball, organizational own rap group
• Art classes, drafting • Accounting • Excellent drawing skills • CNA certified • Marketing • Salvaging • Vocational • Skills from working at an auto body
shop
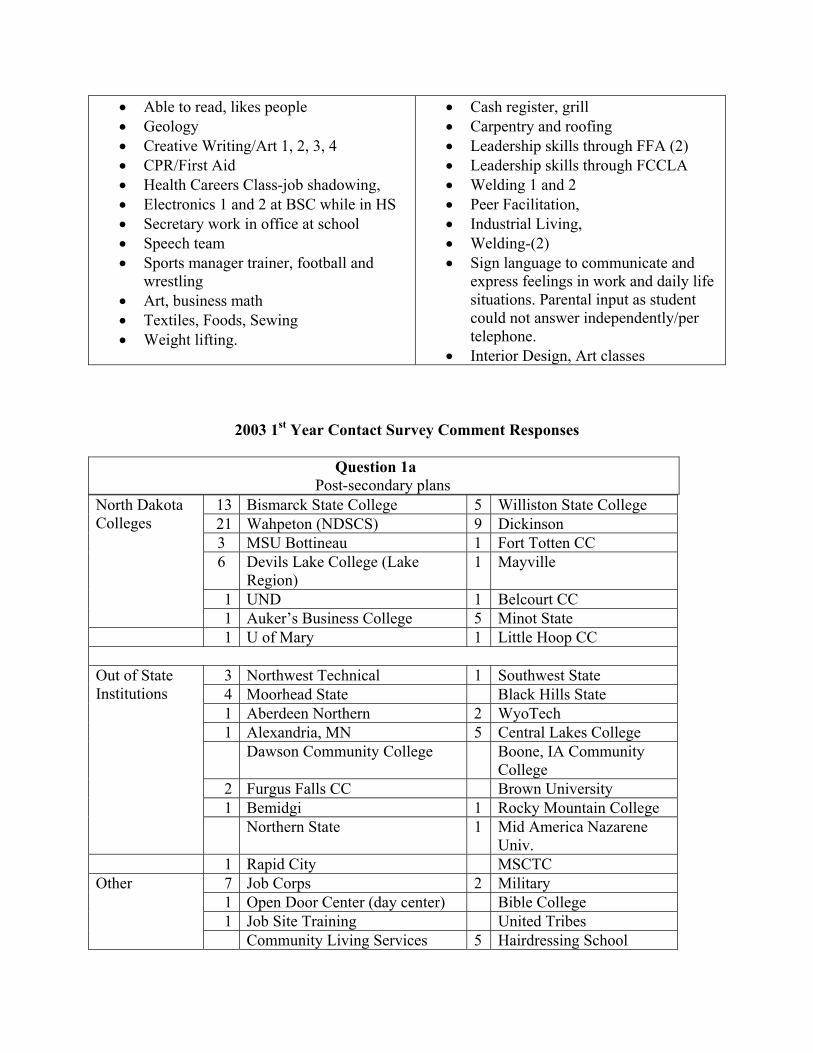
• Able to read, likes people • Geology • Creative Writing/Art 1, 2, 3, 4 • CPR/First Aid • Health Careers Class-job shadowing, • Electronics 1 and 2 at BSC while in HS • Secretary work in office at school • Speech team • Sports manager trainer, football and
wrestling • Art, business math • Textiles, Foods, Sewing • Weight lifting.
• Cash register, grill • Carpentry and roofing • Leadership skills through FFA (2) • Leadership skills through FCCLA • Welding 1 and 2 • Peer Facilitation, • Industrial Living, • Welding-(2) • Sign language to communicate and
express feelings in work and daily life situations. Parental input as student could not answer independently/per telephone.
• Interior Design, Art classes
2003 1st Year Contact Survey Comment Responses
13 Bismarck State College 5 Williston State College 21 Wahpeton (NDSCS) 9 Dickinson 3 MSU Bottineau 1 Fort Totten CC 6 Devils Lake College (Lake
Region) 1 Mayville
1 UND 1 Belcourt CC
North Dakota Colleges
1 Auker’s Business College 5 Minot State 1 U of Mary 1 Little Hoop CC
3 Northwest Technical 1 Southwest State 4 Moorhead State Black Hills State 1 Aberdeen Northern 2 WyoTech 1 Alexandria, MN 5 Central Lakes College Dawson Community College Boone, IA Community
College 2 Furgus Falls CC Brown University 1 Bemidgi 1 Rocky Mountain College
Out of State Institutions
Northern State 1 Mid America Nazarene Univ.
1 Rapid City MSCTC 7 Job Corps 2 Military 1 Open Door Center (day center) Bible College 1 Job Site Training United Tribes
Other
Community Living Services 5 Hairdressing School
Question 1a Post-secondary plans
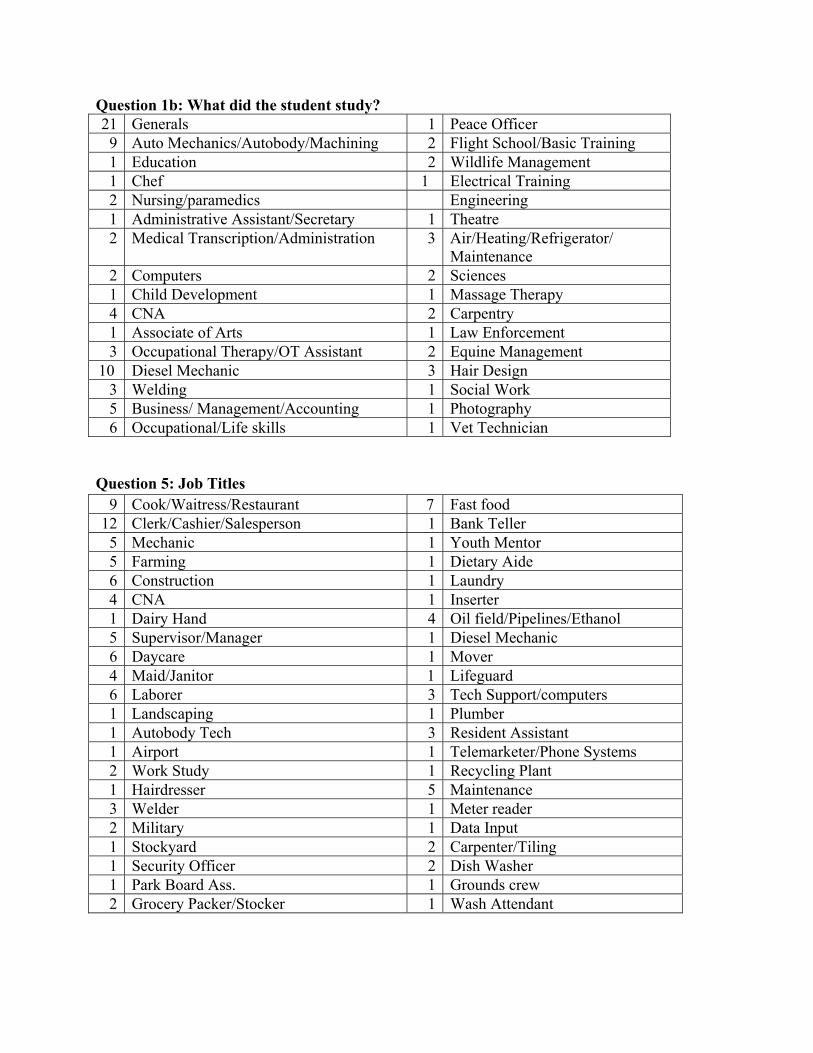
Question 1b: What did the student study? 21 Generals 1 Peace Officer 9 Auto Mechanics/Autobody/Machining 2 Flight School/Basic Training 1 Education 2 Wildlife Management 1 Chef 1 Electrical Training 2 Nursing/paramedics Engineering 1 Administrative Assistant/Secretary 1 Theatre 2 Medical Transcription/Administration 3 Air/Heating/Refrigerator/
Maintenance 2 Computers 2 Sciences 1 Child Development 1 Massage Therapy 4 CNA 2 Carpentry 1 Associate of Arts 1 Law Enforcement 3 Occupational Therapy/OT Assistant 2 Equine Management
10 Diesel Mechanic 3 Hair Design 3 Welding 1 Social Work 5 Business/ Management/Accounting 1 Photography 6 Occupational/Life skills 1 Vet Technician
Question 5: Job Titles
9 Cook/Waitress/Restaurant 7 Fast food 12 Clerk/Cashier/Salesperson 1 Bank Teller 5 Mechanic 1 Youth Mentor 5 Farming 1 Dietary Aide 6 Construction 1 Laundry 4 CNA 1 Inserter 1 Dairy Hand 4 Oil field/Pipelines/Ethanol 5 Supervisor/Manager 1 Diesel Mechanic 6 Daycare 1 Mover 4 Maid/Janitor 1 Lifeguard 6 Laborer 3 Tech Support/computers 1 Landscaping 1 Plumber 1 Autobody Tech 3 Resident Assistant 1 Airport 1 Telemarketer/Phone Systems 2 Work Study 1 Recycling Plant 1 Hairdresser 5 Maintenance 3 Welder 1 Meter reader 2 Military 1 Data Input 1 Stockyard 2 Carpenter/Tiling 1 Security Officer 2 Dish Washer 1 Park Board Ass. 1 Grounds crew 2 Grocery Packer/Stocker 1 Wash Attendant
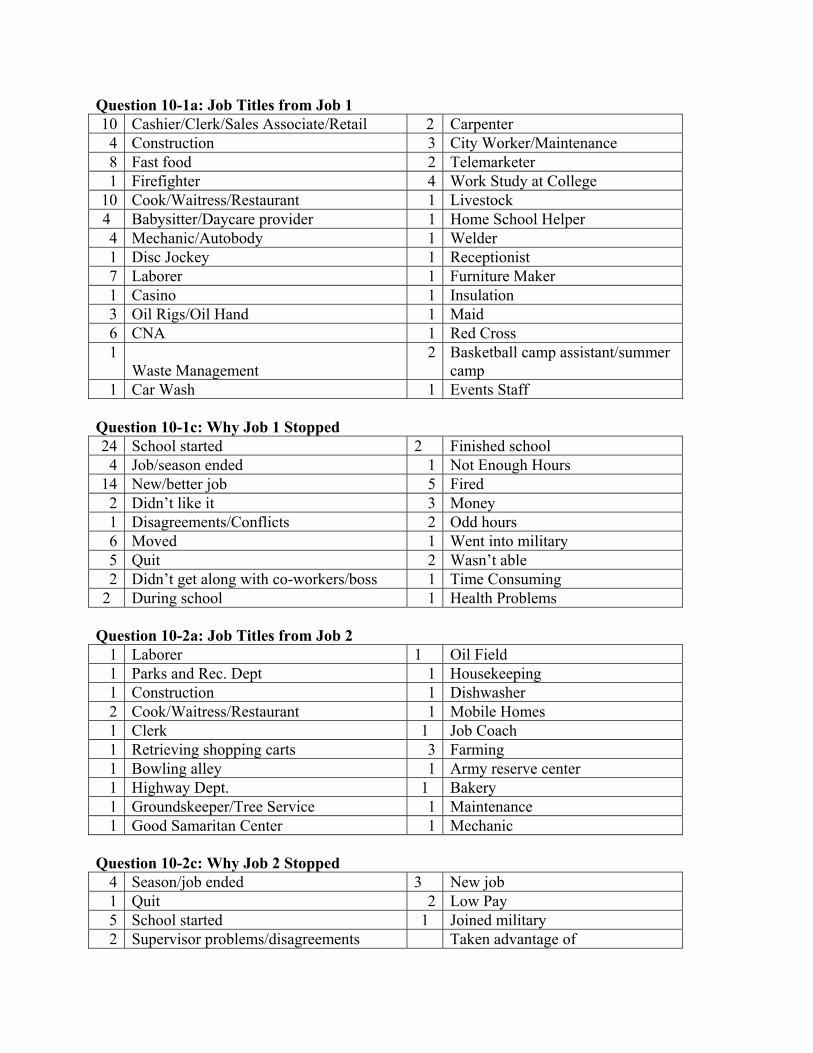
Question 10-1a: Job Titles from Job 1 10 Cashier/Clerk/Sales Associate/Retail 2 Carpenter 4 Construction 3 City Worker/Maintenance 8 Fast food 2 Telemarketer 1 Firefighter 4 Work Study at College
10 Cook/Waitress/Restaurant 1 Livestock 4 Babysitter/Daycare provider 1 Home School Helper 4 Mechanic/Autobody 1 Welder 1 Disc Jockey 1 Receptionist 7 Laborer 1 Furniture Maker 1 Casino 1 Insulation 3 Oil Rigs/Oil Hand 1 Maid 6 CNA 1 Red Cross 1
Waste Management 2 Basketball camp assistant/summer
camp 1 Car Wash 1 Events Staff
Question 10-1c: Why Job 1 Stopped 24 School started 2 Finished school 4 Job/season ended 1 Not Enough Hours
14 New/better job 5 Fired 2 Didn’t like it 3 Money 1 Disagreements/Conflicts 2 Odd hours 6 Moved 1 Went into military 5 Quit 2 Wasn’t able 2 Didn’t get along with co-workers/boss 1 Time Consuming
2 During school 1 Health Problems Question 10-2a: Job Titles from Job 2
1 Laborer 1 Oil Field 1 Parks and Rec. Dept 1 Housekeeping 1 Construction 1 Dishwasher 2 Cook/Waitress/Restaurant 1 Mobile Homes 1 Clerk 1 Job Coach 1 Retrieving shopping carts 3 Farming 1 Bowling alley 1 Army reserve center 1 Highway Dept. 1 Bakery 1 Groundskeeper/Tree Service 1 Maintenance 1 Good Samaritan Center 1 Mechanic
Question 10-2c: Why Job 2 Stopped
4 Season/job ended 3 New job 1 Quit 2 Low Pay 5 School started 1 Joined military 2 Supervisor problems/disagreements Taken advantage of
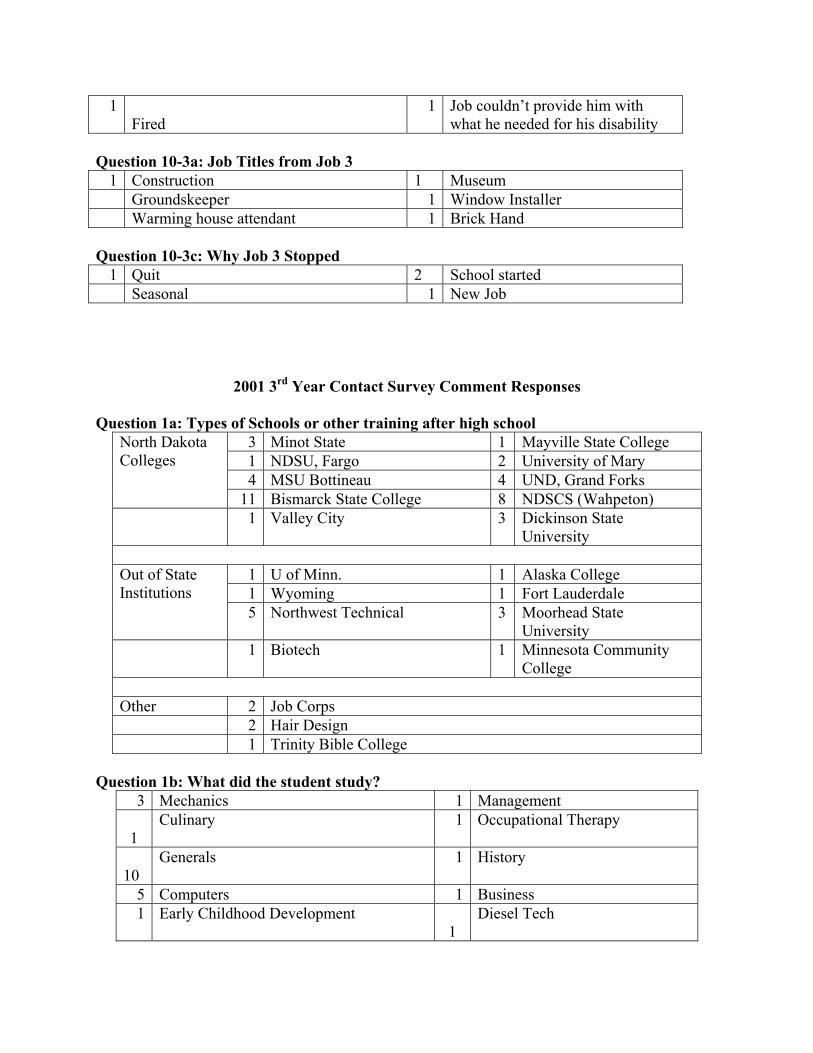
1 Fired
1 Job couldn’t provide him with what he needed for his disability
Question 10-3a: Job Titles from Job 3
1 Construction 1 Museum Groundskeeper 1 Window Installer Warming house attendant 1 Brick Hand
Question 10-3c: Why Job 3 Stopped
1 Quit 2 School started Seasonal 1 New Job
2001 3rd Year Contact Survey Comment Responses Question 1a: Types of Schools or other training after high school
3 Minot State 1 Mayville State College 1 NDSU, Fargo 2 University of Mary 4 MSU Bottineau 4 UND, Grand Forks
North Dakota Colleges
11 Bismarck State College 8 NDSCS (Wahpeton) 1 Valley City 3 Dickinson State
University
1 U of Minn. 1 Alaska College 1 Wyoming 1 Fort Lauderdale
Out of State Institutions
5 Northwest Technical 3 Moorhead State University
1 Biotech 1 Minnesota Community College
Other 2 Job Corps 2 Hair Design 1 Trinity Bible College
Question 1b: What did the student study?
3 Mechanics 1 Management 1
Culinary 1 Occupational Therapy
10
Generals 1 History
5 Computers 1 Business 1 Early Childhood Development
1 Diesel Tech
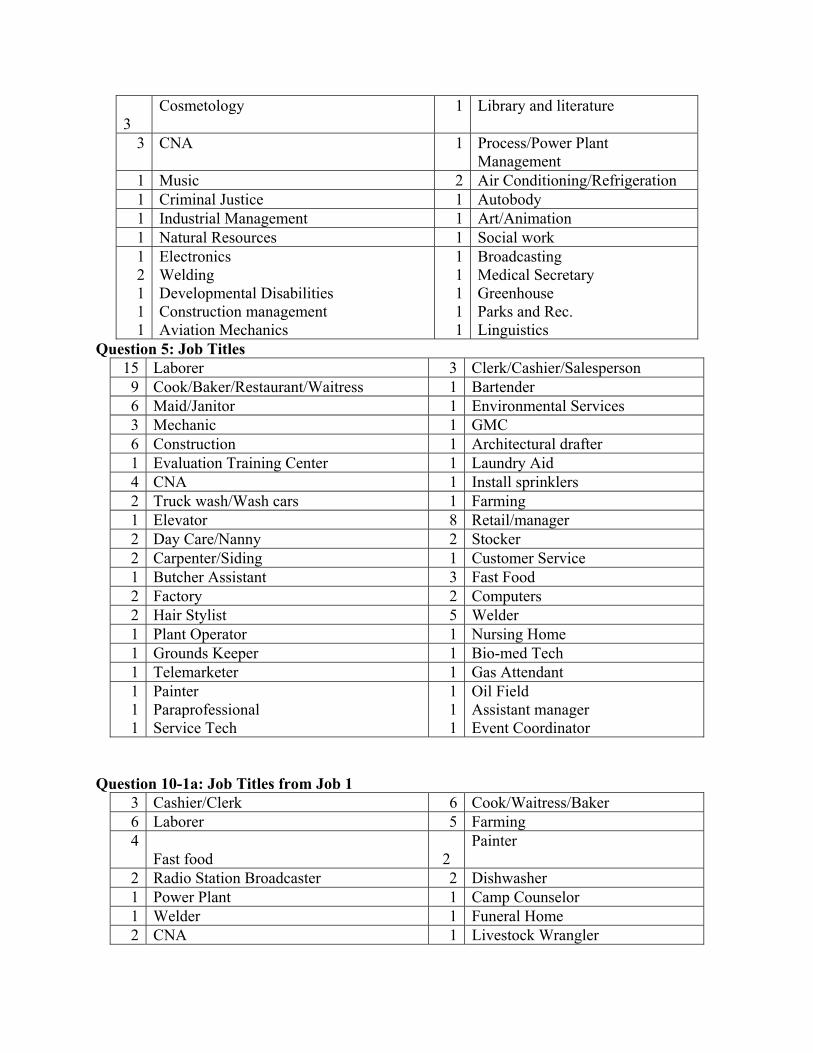
3
Cosmetology 1 Library and literature
3 CNA 1 Process/Power Plant Management
1 Music 2 Air Conditioning/Refrigeration 1 Criminal Justice 1 Autobody 1 Industrial Management 1 Art/Animation 1 Natural Resources 1 Social work 1 2 1 1 1
Electronics Welding Developmental Disabilities Construction management Aviation Mechanics
11111
Broadcasting Medical Secretary Greenhouse Parks and Rec. Linguistics
Question 5: Job Titles 15 Laborer 3 Clerk/Cashier/Salesperson 9 Cook/Baker/Restaurant/Waitress 1 Bartender 6 Maid/Janitor 1 Environmental Services 3 Mechanic 1 GMC 6 Construction 1 Architectural drafter 1 Evaluation Training Center 1 Laundry Aid 4 CNA 1 Install sprinklers 2 Truck wash/Wash cars 1 Farming 1 Elevator 8 Retail/manager 2 Day Care/Nanny 2 Stocker 2 Carpenter/Siding 1 Customer Service 1 Butcher Assistant 3 Fast Food 2 Factory 2 Computers 2 Hair Stylist 5 Welder 1 Plant Operator 1 Nursing Home 1 Grounds Keeper 1 Bio-med Tech 1 Telemarketer 1 Gas Attendant 1 1 1
Painter Paraprofessional Service Tech
111
Oil Field Assistant manager Event Coordinator
Question 10-1a: Job Titles from Job 1
3 Cashier/Clerk 6 Cook/Waitress/Baker 6 Laborer 5 Farming 4
Fast food 2
Painter
2 Radio Station Broadcaster 2 Dishwasher 1 Power Plant 1 Camp Counselor 1 Welder 1 Funeral Home 2 CNA 1 Livestock Wrangler
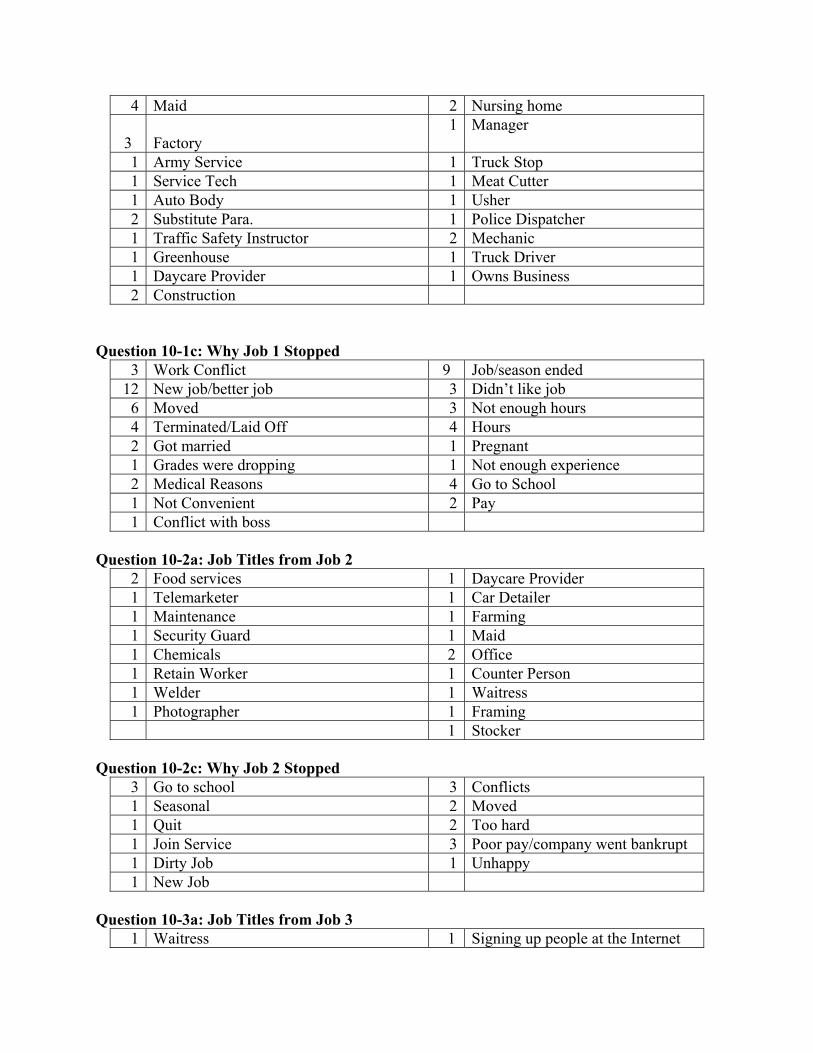
4 Maid 2 Nursing home 3 Factory
1 Manager
1 Army Service 1 Truck Stop 1 Service Tech 1 Meat Cutter 1 Auto Body 1 Usher 2 Substitute Para. 1 Police Dispatcher 1 Traffic Safety Instructor 2 Mechanic 1 Greenhouse 1 Truck Driver 1 Daycare Provider 1 Owns Business 2 Construction
Question 10-1c: Why Job 1 Stopped
3 Work Conflict 9 Job/season ended 12 New job/better job 3 Didn’t like job 6 Moved 3 Not enough hours 4 Terminated/Laid Off 4 Hours 2 Got married 1 Pregnant 1 Grades were dropping 1 Not enough experience 2 Medical Reasons 4 Go to School 1 Not Convenient 2 Pay 1 Conflict with boss
Question 10-2a: Job Titles from Job 2
2 Food services 1 Daycare Provider 1 Telemarketer 1 Car Detailer 1 Maintenance 1 Farming 1 Security Guard 1 Maid 1 Chemicals 2 Office 1 Retain Worker 1 Counter Person 1 Welder 1 Waitress 1 Photographer 1 Framing 1 Stocker
Question 10-2c: Why Job 2 Stopped
3 Go to school 3 Conflicts 1 Seasonal 2 Moved 1 Quit 2 Too hard 1 Join Service 3 Poor pay/company went bankrupt 1 Dirty Job 1 Unhappy 1 New Job
Question 10-3a: Job Titles from Job 3
1 Waitress 1 Signing up people at the Internet
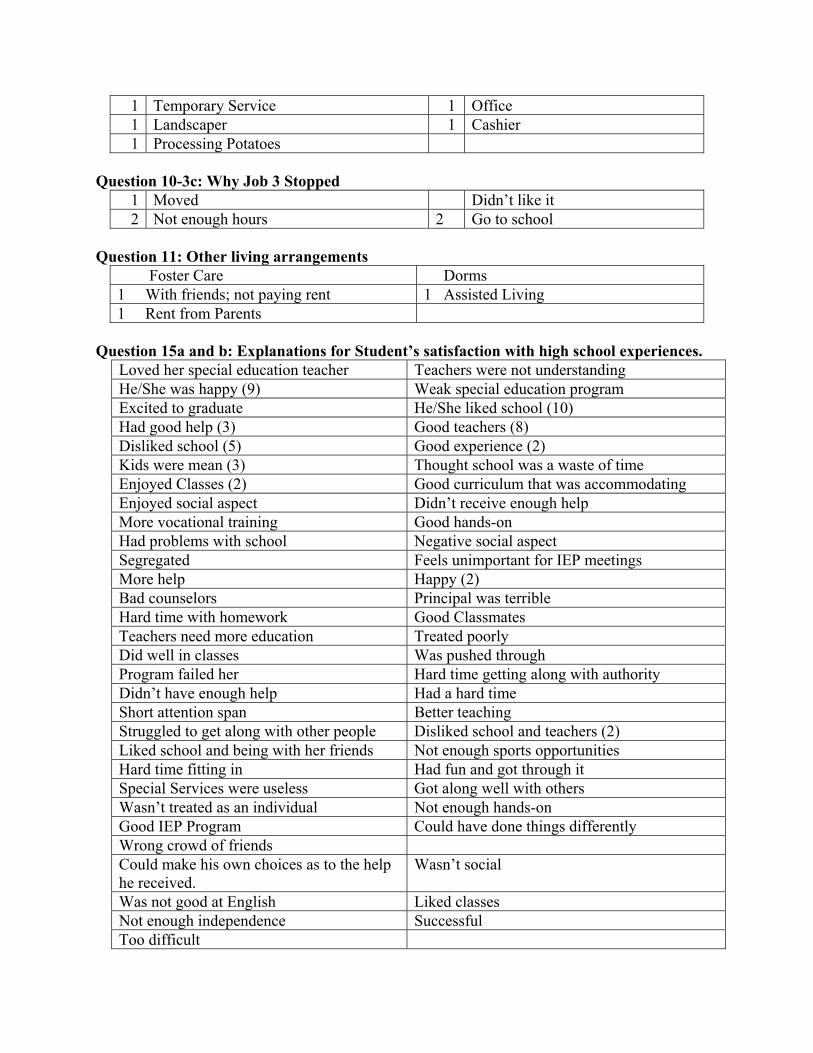
1 Temporary Service 1 Office 1 Landscaper 1 Cashier 1 Processing Potatoes
Question 10-3c: Why Job 3 Stopped
1 Moved Didn’t like it 2 Not enough hours 2 Go to school
Question 11: Other living arrangements
Foster Care Dorms 1 With friends; not paying rent 1 Assisted Living 1 Rent from Parents
Question 15a and b: Explanations for Student’s satisfaction with high school experiences.
Loved her special education teacher Teachers were not understanding He/She was happy (9) Weak special education program Excited to graduate He/She liked school (10) Had good help (3) Good teachers (8) Disliked school (5) Good experience (2) Kids were mean (3) Thought school was a waste of time Enjoyed Classes (2) Good curriculum that was accommodating Enjoyed social aspect Didn’t receive enough help More vocational training Good hands-on Had problems with school Negative social aspect Segregated Feels unimportant for IEP meetings More help Happy (2) Bad counselors Principal was terrible Hard time with homework Good Classmates Teachers need more education Treated poorly Did well in classes Was pushed through Program failed her Hard time getting along with authority Didn’t have enough help Had a hard time Short attention span Better teaching Struggled to get along with other people Disliked school and teachers (2) Liked school and being with her friends Not enough sports opportunities Hard time fitting in Had fun and got through it Special Services were useless Got along well with others Wasn’t treated as an individual Not enough hands-on Good IEP Program Could have done things differently Wrong crowd of friends Could make his own choices as to the help he received.
Wasn’t social
Was not good at English Liked classes Not enough independence Successful Too difficult
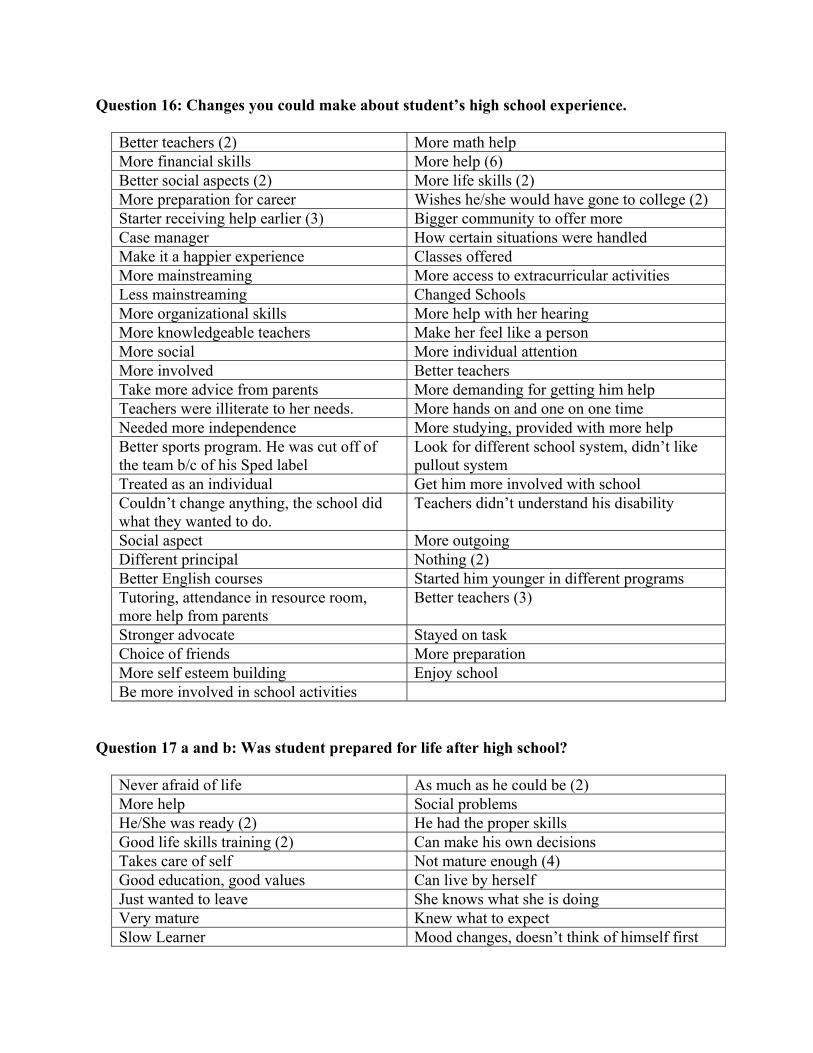
Question 16: Changes you could make about student’s high school experience.
Better teachers (2) More math help More financial skills More help (6) Better social aspects (2) More life skills (2) More preparation for career Wishes he/she would have gone to college (2) Starter receiving help earlier (3) Bigger community to offer more Case manager How certain situations were handled Make it a happier experience Classes offered More mainstreaming More access to extracurricular activities Less mainstreaming Changed Schools More organizational skills More help with her hearing More knowledgeable teachers Make her feel like a person More social More individual attention More involved Better teachers Take more advice from parents More demanding for getting him help Teachers were illiterate to her needs. More hands on and one on one time Needed more independence More studying, provided with more help Better sports program. He was cut off of the team b/c of his Sped label
Look for different school system, didn’t like pullout system
Treated as an individual Get him more involved with school Couldn’t change anything, the school did what they wanted to do.
Teachers didn’t understand his disability
Social aspect More outgoing Different principal Nothing (2) Better English courses Started him younger in different programs Tutoring, attendance in resource room, more help from parents
Better teachers (3)
Stronger advocate Stayed on task Choice of friends More preparation More self esteem building Enjoy school Be more involved in school activities
Question 17 a and b: Was student prepared for life after high school?
Never afraid of life As much as he could be (2) More help Social problems He/She was ready (2) He had the proper skills Good life skills training (2) Can make his own decisions Takes care of self Not mature enough (4) Good education, good values Can live by herself Just wanted to leave She knows what she is doing Very mature Knew what to expect Slow Learner Mood changes, doesn’t think of himself first
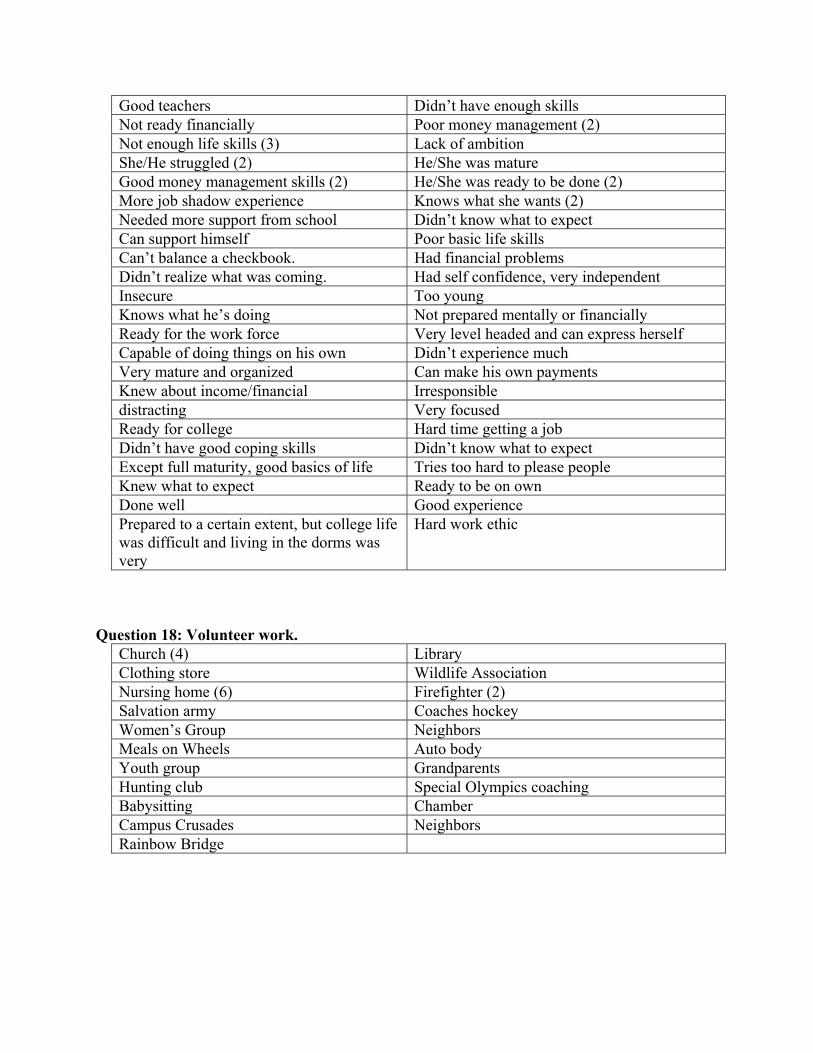
Good teachers Didn’t have enough skills Not ready financially Poor money management (2) Not enough life skills (3) Lack of ambition She/He struggled (2) He/She was mature Good money management skills (2) He/She was ready to be done (2) More job shadow experience Knows what she wants (2) Needed more support from school Didn’t know what to expect Can support himself Poor basic life skills Can’t balance a checkbook. Had financial problems Didn’t realize what was coming. Had self confidence, very independent Insecure Too young Knows what he’s doing Not prepared mentally or financially Ready for the work force Very level headed and can express herself Capable of doing things on his own Didn’t experience much Very mature and organized Can make his own payments Knew about income/financial Irresponsible distracting Very focused Ready for college Hard time getting a job Didn’t have good coping skills Didn’t know what to expect Except full maturity, good basics of life Tries too hard to please people Knew what to expect Ready to be on own Done well Good experience Prepared to a certain extent, but college life was difficult and living in the dorms was very
Hard work ethic
Question 18: Volunteer work.
Church (4) Library Clothing store Wildlife Association Nursing home (6) Firefighter (2) Salvation army Coaches hockey Women’s Group Neighbors Meals on Wheels Auto body Youth group Grandparents Hunting club Special Olympics coaching Babysitting Chamber Campus Crusades Neighbors Rainbow Bridge
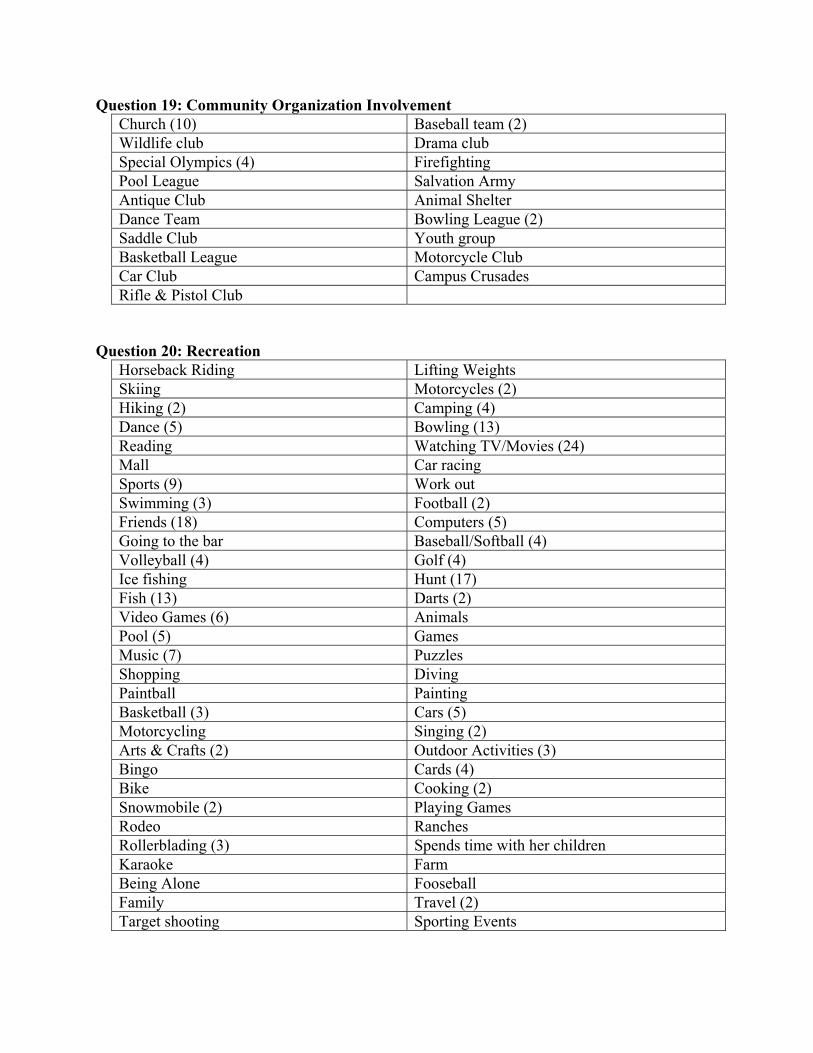
Question 19: Community Organization Involvement Church (10) Baseball team (2) Wildlife club Drama club Special Olympics (4) Firefighting Pool League Salvation Army Antique Club Animal Shelter Dance Team Bowling League (2) Saddle Club Youth group Basketball League Motorcycle Club Car Club Campus Crusades Rifle & Pistol Club
Question 20: Recreation
Horseback Riding Lifting Weights Skiing Motorcycles (2) Hiking (2) Camping (4) Dance (5) Bowling (13) Reading Watching TV/Movies (24) Mall Car racing Sports (9) Work out Swimming (3) Football (2) Friends (18) Computers (5) Going to the bar Baseball/Softball (4) Volleyball (4) Golf (4) Ice fishing Hunt (17) Fish (13) Darts (2) Video Games (6) Animals Pool (5) Games Music (7) Puzzles Shopping Diving Paintball Painting Basketball (3) Cars (5) Motorcycling Singing (2) Arts & Crafts (2) Outdoor Activities (3) Bingo Cards (4) Bike Cooking (2) Snowmobile (2) Playing Games Rodeo Ranches Rollerblading (3) Spends time with her children Karaoke Farm Being Alone Fooseball Family Travel (2) Target shooting Sporting Events
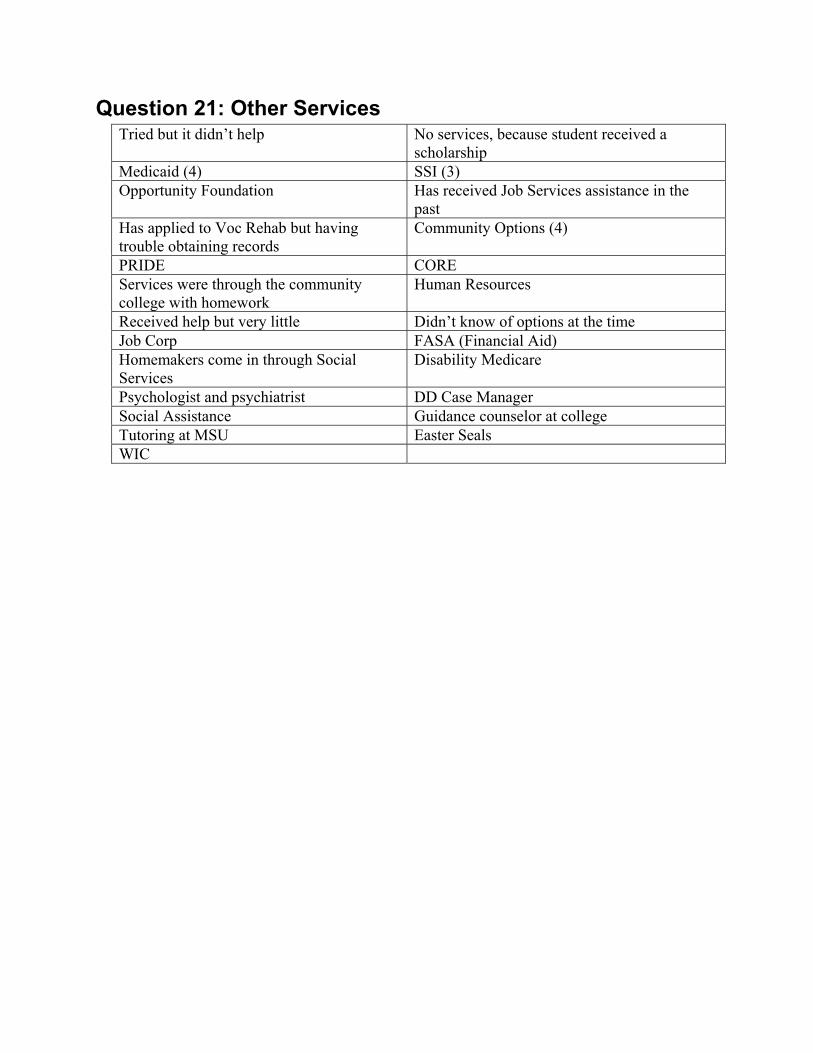
Question 21: Other Services Tried but it didn’t help No services, because student received a
scholarship Medicaid (4) SSI (3) Opportunity Foundation Has received Job Services assistance in the
past Has applied to Voc Rehab but having trouble obtaining records
Community Options (4)
PRIDE CORE Services were through the community college with homework
Human Resources
Received help but very little Didn’t know of options at the time Job Corp FASA (Financial Aid) Homemakers come in through Social Services
Disability Medicare
Psychologist and psychiatrist DD Case Manager Social Assistance Guidance counselor at college Tutoring at MSU Easter Seals WIC