Embed Size (px)
Citation preview

Lans P. Rothfusz
Meteorologist in Charge
W elcome to the 2004 issue of the “Shareholder’s Report” from the
Peachtree City Weather Fore-cast Office (WFO). Each year, we summarize the events, achievements, and advances of our office so you can see how your tax "investment" in the NWS has been put to use. 2004 will be remembered as the year of the tropics. The County Warning Area (CWA) of the Peachtree City WFO was impacted by five tropical systems in the span of six weeks. Two of the storms (Bonnie and Charley) had minor impact on the CWA, but Frances, Ivan and Jeanne were far more significant. As usual, the impact
of such storms was felt far inland, bringing tornadoes, high winds, and major flooding to our area. Our efforts weren’t confined to two months in the fall, however. As you wll see in this report, we have continued to improve several program areas. Our aviation program was refined to make better use of our
collective talents at the Center Weather Service Unit and the WFO. We’ve expanded our ability to coordinate with local media meteorologists through “instant messaging.” Our web page continues to shine. All are indications of our desire to serve you better. Life in the NWS is one of pe rs is te nt change and
continuous improve-ment (we hope). One thing remains constant, h o w e v e r - o u r dedication to giving you the best possible service. It is the most gratifying part of my job to see that dedication exhibited by our staff day in and day out. I am proud of our team and I hope you have had the opportunity to see why. I welcome your comments on how we're doing. My contact information is on the final page. Enjoy the report! ☼
Another Momentous Year in Weather and Water!
Severe Weather 2004 Robert Beasley
Meteorologist
T he year 2004 began with an unusually quiet spring. The period of January
through May brought the least severe weather observed during this period in at least a decade. A relatively normal summer followed with the usual “pulse-
type” convection in June and especially July. September brought three unprecedented, back-to-back, major, land-falling hurr icanes. Hurr icanes Frances, Ivan, and Jeanne occurred within 20 days of each other during September, each bringing widespread wind and flood damage in north and central Georgia. Tornado, wind,
(Continued on page 3)
January 2005
Volume 4, Issue 1
Shareholders’ Report 2004
Inside this issue:
Georgia Weather Overview 4
Forecast Performance 5
Severe Weather Performance 6
Coop Observer Program 7
Forecast Programs 8-9
Hydrology Highlights 9
Web Site Status 11
Outreach Activities 12
Training Activities 13
“In Fiscal Year 2004, the NWS was appropriated $824,892,700.
This equates to an “investment” of $2.82 per U.S.
citizen.”
National Weather Service • Weather Forecast Office • Peachtree City, Georgia
A small sample of the damage done by Hurricane Frances. This damage occurred in Morgan County on Sept. 7th.
Approximate paths of Tropical Storm Bonnie and Hurricanes Char-ley, Frances, Ivan, and Jeanne - all of which impacted the Peachtree City CWA in some way in August & September 2004.
Big News Items of 2004 • Five tropical systems impact
Georgia, three of them in 20 days (page 11).
• Upper Air program sets record for tropical weather support (page 7).
• Revitalized Aviation and Fire Weather programs (page 8).
• Weather Activity Planner intro-duced on our website (page 11).

2004 Most Significant Weather Events
Date Location Cause Damage Cost Deaths, Injuries
Jan 25-27 NE Georgia Ice Storm Glaze ice accumulations of ¼ to ½ inch, mainly on trees and power lines. Hundreds of trees and power lines were downed.
925K 0, 1
Mar 9 Douglas Wildfire Three homes destroyed and twelve were damaged. 1M 0, 0
Mar 20 Fannin Hail Golf ball-sized. 250K 0, 0
Apr 4 Forsyth Wildfire Destroyed seven homes and damaged eighteen others. Seven fire-fighters were injured.
2.2M 0, 7
May 17 Paulding Lightning A 37-year old male struck and killed by lightning while working out-side.
***** 1, 0
May 17 DeKalb Lightning A 34-year old man was struck and killed by lightning while leaning against a truck. Another individual in the same crew had his back singed by the strike.
***** 1, 1
May 22 Gwinnett T-storm Wind Three people injured when a dead tree was blown onto them. ***** 0, 3
June 13 Forsyth Lightning Lightning struck and set a home on fire. 250K 0, 0 June 13 Floyd Lightning Lightning struck a woman through an electrical appliance in her home. ***** 0, 1
June 27 DeKalb Lightning Lightning struck and knocked over a large tree onto nursing center. Four residents trapped and required hospitalization.
25K 0, 4
June 27 Gwinnett Lightning Three individuals killed and six injured at Buford Dam State Park when lightning hit trees under which the individuals were seeking shelter. Four homes struck by lightning and set on fire.
50K 3, 6
July 4 Gwinnett Lightning Lightning struck three homes. 275K 0, 0
July 6 Cherokee Lightning A male was struck and injured by lightning. Lightning also struck three homes.
400K 0, 1
July 9 Gwinnett T-storm Wind Homes destroyed or damaged when trees fell on them. 500K 0, 0
July 14 Fannin Lightning Three teenagers tubing down a river in the Toccoa Valley Camp-ground injured when lightning struck the water nearby.
1K 0, 3
July 25 Polk Lightning An 18-year old male struck and injured by lightning while standing by a tree.
50K 0, 1
Aug 29 Coweta Lightning Lightning struck and set on fire a house. 250K 0, 0
Sept 6-7 North Geor-gia
High Wind High winds associated with Frances caused widespread and exten-sive downing of trees and power lines. Dozens of homes were dam-aged or destroyed by fallen trees.
40.5M 0, 0
Sept 16-18 N. Georgia Flood Rainfall from hurricane Ivan reached 10-12 inches in parts of North Georgia, including record flooding on many creeks and rivers.
5.5M 0, 0
Sept 16 North and Central Georgia
High Wind High winds associated with Ivan caused widespread and extensive downing of trees and power lines.
14.3M 0, 2
Sept 16 Madison Tornado A 7-mile long, 150 yard F1 tornado with near 100 mph winds, spawned by the remnants of Ivan, caused major damage to several large homes in a country club.
1.3M 0, 0
Sept 16 Spalding Tornado An F0 tornado 1/5-mile long and 50-yard wide path near the Griffin-Spalding Airport. Damage to pecan trees and roof damage on several homes.
250K 0, 0
Sept 16 Cherokee Flash Flood Extensive flooding throughout the county as over 10 inches of rain fell. 1M 0, 2
Sept 16 Cherokee Tornado A 1-mile long, 400 yard wide F1 tornado downed dozens of trees. Four people injured when trees fell on their vehicles. Six homes suf-fered extensive damage.
300K 0, 4
Sept 16-17 North-Central Georgia
Flash Flood Significant flooding associated with Hurricane Ivan. A six-year old girl killed in White Co. when she was washed away by flood waters.
33.2M 1, 0
Sept 27 North and Central Georgia
Strong Wind Strong winds associated with the remnants of Jeanne downed a num-ber of trees and power lines. Several homes and vehicles were also damaged.
758.3K 0, 0
Sept 27-28 North Geor-gia
Flood Heavy rains from the remnants of Jeanne caused flooding in many areas. Several creeks were out of their banks, and several roads were underwater or washed away.
4.6M 0, 0
Nov 24 Hall T-storm Wind One person was injured by thunderstorm winds. ***** 0, 1
Nov 24 Fayette T-storm Wind Numerous houses damaged by falling trees. 900K 0, 0
Sept 16 Wilkes Tornado 7-mile long, 500 yard wide F1 tornado damaged 23 structures and downed many trees.
1.5M 0,0
Page 2 Shareholders’ Report 2004
2004 Most Significant Weather Events
Date Location Cause Damage Cost Deaths, Injuries
Jan 25-27 NE Georgia Ice Storm Glaze ice accumulations of ¼ to ½ inch, mainly on trees and power lines. Hundreds of trees and power lines were downed.
925K 0, 1
Mar 9 Douglas Wildfire Three homes destroyed and twelve were damaged. 1M 0, 0
Mar 20 Fannin Hail Golf ball-sized. 250K 0, 0
Apr 4 Forsyth Wildfire Destroyed seven homes and damaged eighteen others. Seven fire-fighters were injured.
2.2M 0, 7
May 17 Paulding Lightning A 37-year old male struck and killed by lightning while working out-side.
***** 1, 0
May 17 DeKalb Lightning A 34-year old man was struck and killed by lightning while leaning against a truck. Another individual in the same crew had his back singed by the strike.
***** 1, 1
May 22 Gwinnett T-storm Wind Three people injured when a dead tree was blown onto them. ***** 0, 3
June 13 Forsyth Lightning Lightning struck and set a home on fire. 250K 0, 0 June 13 Floyd Lightning Lightning struck a woman through an electrical appliance in her home. ***** 0, 1
June 27 DeKalb Lightning Lightning struck and knocked over a large tree onto nursing center. Four residents trapped and required hospitalization.
25K 0, 4
June 27 Gwinnett Lightning Three individuals killed and six injured at Buford Dam State Park when lightning hit trees under which the individuals were seeking shelter. Four homes struck by lightning and set on fire.
50K 3, 6
July 4 Gwinnett Lightning Lightning struck three homes. 275K 0, 0
July 6 Cherokee Lightning A male was struck and injured by lightning. Lightning also struck three homes.
400K 0, 1
July 9 Gwinnett T-storm Wind Homes destroyed or damaged when trees fell on them. 500K 0, 0
July 14 Fannin Lightning Three teenagers tubing down a river in the Toccoa Valley Camp-ground injured when lightning struck the water nearby.
1K 0, 3
July 25 Polk Lightning An 18-year old male struck and injured by lightning while standing by a tree.
50K 0, 1
Aug 29 Coweta Lightning Lightning struck and set on fire a house. 250K 0, 0
Sept 6-7 North Geor-gia
High Wind High winds associated with Frances caused widespread and exten-sive downing of trees and power lines. Dozens of homes were dam-aged or destroyed by fallen trees.
40.5M 0, 0
Sept 16-18 N. Georgia Flood Rainfall from hurricane Ivan reached 10-12 inches in parts of North Georgia, including record flooding on many creeks and rivers.
5.5M 0, 0
Sept 16 North and Central Georgia
High Wind High winds associated with Ivan caused widespread and extensive downing of trees and power lines.
14.3M 0, 2
Sept 16 Madison Tornado A 7-mile long, 150 yard F1 tornado with near 100 mph winds, spawned by the remnants of Ivan, caused major damage to several large homes in a country club.
1.3M 0, 0
Sept 16 Spalding Tornado An F0 tornado 1/5-mile long and 50-yard wide path near the Griffin-Spalding Airport. Damage to pecan trees and roof damage on several homes.
250K 0, 0
Sept 16 Cherokee Flash Flood Extensive flooding throughout the county as over 10 inches of rain fell. 1M 0, 2
Sept 16 Cherokee Tornado A 1-mile long, 400 yard wide F1 tornado downed dozens of trees. Four people injured when trees fell on their vehicles. Six homes suf-fered extensive damage.
300K 0, 4
Sept 16-17 North-Central Georgia
Flash Flood Significant flooding associated with Hurricane Ivan. A six-year old girl killed in White Co. when she was washed away by flood waters.
33.2M 1, 0
Sept 27 North and Central Georgia
Strong Wind Strong winds associated with the remnants of Jeanne downed a num-ber of trees and power lines. Several homes and vehicles were also damaged.
758.3K 0, 0
Sept 27-28 North Geor-gia
Flood Heavy rains from the remnants of Jeanne caused flooding in many areas. Several creeks were out of their banks, and several roads were underwater or washed away.
4.6M 0, 0
Nov 24 Hall T-storm Wind One person was injured by thunderstorm winds. ***** 0, 1
Nov 24 Fayette T-storm Wind Numerous houses damaged by falling trees. 900K 0, 0
Sept 16 Wilkes Tornado 7-mile long, 500 yard wide F1 tornado damaged 23 structures and downed many trees.
1.5M 0,0

and flood damage associated with the three hurricanes in September accounted for 94% of the year's weather-related damages and pushed the annual weather-related property damage to >$113M. Over $55 million in estimated property damage caused by high winds alone exceeded the damage costs of all weather-related incidents from 2001 to 2003. It was also the highest annual damage figure due to high winds in recent history. 57 counties experienced high wind damage during hurricane Frances, 44 during Ivan, and eight during Jeanne. Outside of the devastating impact of hurricanes during September, the remainder of the year was quiet. Only $6M in non-hurricane weather-related damage was recorded during the year. Except for the hurricanes in September, the year would have ended with the lowest recorded property damage in the last ten years. Only 56 severe weather events were recorded during the normally busy spring months of March, April, and May. This was the lowest figure in the past ten years, shattering the previous record of 88 events for these same months in 2001 and remaining well below the ten-year average of 181 events for this period. With respect to severe convective events (tornadoes, thunderstorm wind, and hail), 281 events were observed during the year - well below the ten-year average of 443 events. Significant severe weather events occurred on only a handful of days during the year
(Continued from page 1) outside of September. July 14th and November 24th were the most noteworthy days. On July 14th, an extremely unstable air mass, combined with a strong upper-level disturbance, generated a derecho (a large, long-lived straight-lined wind event) during the morning and a series of supercells during the afternoon. One supercell in Cherokee county resulted in the first of two non-tropical tornadoes for the year. On November 24th, a squall line with damaging straight-lined winds in excess of 65 mph caused extensive damage to parts of west and north central Georgia. Significant winter weather was also scarce during the year. One significant ice storm occurred during a strong wedge event in late January. A couple of other minor freezing ra in/s leet events were observed the first and last weeks of February. No notable snow events were observed during the year. Overall, snowfall across north Georgia fell short of normals. Eight tornadoes were observed within the Peachtree City WFO’s area during 2004. All but two of these were small, short-lived, “spin-up” tornadoes associated with hurricane Ivan on September 16th. The year 2004 marked the sixth consecutive year that no tornado-related deaths were observed within the Peachtree City WFO CWA. Deaths and Injuries The year 2004 brought the
second highest number of weather-related deaths to north and central Georgia since 1998. There were 11 weather events causing deaths and/or injuries. Six weather-related deaths were recorded during 2004. As is often the case in Georgia, lightning led the list of weather-related deaths with five, followed by one flash flood-related death. With respect to injuries, lightning led the list of weather-related injuries at 17, with seven injuries attributed to a wildfire in April, four injuries each attributed to tornadoes and thunderstorm winds, two injuries each to flash floods and high winds, and one to an ice storm. Property Damage Weather-inflicted property damage ($114.87M) during 2004 was the second highest damage figure since 1995. High winds associated with land-falling hurricanes during September easily topped the list of weather-related property damage at $55.05 million. Flash flood-related damage, the next highest category, was not far behind with $39.20 million in damages, of which all but $2K occurred during hurricanes Ivan and Jeanne in September. Flood-related damage at $6.21M was also quite significant. Again, this was almost entirely associated with the September hurricanes. Tornadoes accounted for the next highest weather-related property damage at $3.4M, largely because of three F1 tornadoes occurring during hurricane Ivan. Tornadoes in
(Continued on page 13)
Severe Weather 2004
“Tornado, wind, and flood damage associated with the three hurricanes in September accounted for 94% of the year's weather-related damages...”
Page 3 Volume 4, Issue 1
Event Deaths Injuries
Tornado 0 4
T-storm Wind 0 4
Hail 0 0
Lightning 5 17
Flash Flood 1 2
2004 Deaths & Injuries
High Winds 0 2
Ice Storm 0 1
Wild Fire 0 7
Radio tower toppled by Ivan-spawned tornado in Wilkes County on September 16th. No fatalities or injuries were re-ported with this tornado.

Page 4 Shareholders’ Report 2004
Paul Denault
CWSU Meteorologist
W inter 2004 was highlighted by dry and generally mild conditions.
Early January resulted in near record warmth in Atlanta and Columbus of 71° F, and 72° F in Athens on the 4th. The next day, Macon set a record high at 81° F which also tied the 3rd highest reading ever recorded in January. February was the only month with a colder than average monthly temperature with Atlanta, Athens, and Co-lumbus close to a -3° anomaly. After a dry January and a near normal February, the rainfall deficit spiked in March. Only a half inch fell in Macon and Co-lumbus, while an inch fell in Atlanta and Athens. This was the driest March on record in
Columbus, the 2nd driest in Athens, and the 3rd driest for Atlanta and Macon. Dry conditions continued into spring, as Atlanta, Athens, Co-lumbus, and Macon all posted rainfall deficits in April and May. Athens recorded their 4th driest April with 0.87 inches of rain-fall. This prolonged dry period placed southwest and central Georgia in moderate drought conditions by late April. The situation was compounded by very warm temperatures in May with monthly departures of +4.1° F at Athens and +5.0° F at Macon. By late May, an area from south-central to northeast Georgia was in a severe drought. Some relief came in June, as Atlanta and Columbus received more than a 2" surplus of rainfall, while Macon and Athens were near normal.
The reprieve was short-lived, as Macon received just 0.6" of rain, making it their driest July. Athens, too, was quite dry with only 1.84", their 7th driest July. Temperatures, though, re-mained moderate for the sec-ond consecutive month, with only Columbus and Macon above average. A rare Cana-dian air mass in early August produced numerous record lows. On August 8th, the mer-cury fell to 61° F in Atlanta tying the record set back in 1904. Athens with 58° F and Macon with 56° F also set new record lows. Macon tied the 2nd coolest temperature ever recorded in August. A second cool outbreak broke the record in Atlanta on the 14th with 56° F, and missing the record low for August by just one degree. The precipitation pattern in August and particularly Septem-ber turned very wet. An active tropical storm season brought copious amounts of rain. Rain-fall totals at Athens (11.84"), Columbus (9.47"), and Macon (12.66") were all the wettest on record for September. Atlanta’s 13.65" was enough for 2nd wettest September, and 4th wettest month ever recorded. Atlanta posted its warmest Oc-tober in 20 years, and the 7th warmest on record. Similarly, Columbus and Macon had their 5th and 8th warmest October, respectively. November re-mained well above normal too, while Macon set a record high of 86° F on the 3rd. A wet end of the year provided Atlanta with its 7th wettest November. December 20th ended the year with a low of 16°F in Atlanta, the coldest temperature in two years. ☼
General Weather Review
“Rainfall totals at Athens (11.84"),
Columbus (9.47"), and Macon (12.66") were all the wettest on
record for September.”
After a very dry first half of the year, Georgia rainfall totals rebound with its second wettest September-November period on record.

Page 5 Volume 4, Issue 1
Shirley Lamback
Senior Meteorologist
F orecasters at the Peachtree City WFO continue to show good forecasting skill. Verifi-
cation statistics for the year 2004 showed the office as a whole out-performed computer model guidance in the area of temperatures. However, fore-casters did not fare as well in the area of precipitation. The adjacent charts show tem-perature and precipitation error trends since 1998 at four sites in our forecast area (Atlanta, Athens, Rome and Macon). Forecaster scores are com-pared against guidance from computer models in these charts. For temperature and precipitation scores, lower num-bers are best. For temperature, our forecast-ers bested the models again this year, with 2004 showing the lowest error rate in the past seven years.
In the category of precipitation, computer models did a better job forecasting when our fore-cast area would receive meas-urable rain of one hundredth of an inch or more. Performance against computer models in only part of the pic-ture, however. We also compare our forecast against observed (actual) temperatures. Our goal is to forecast high and low tem-peratures within 3 degrees (F) of the observed temperature. The chart at bottom right shows we achieved that goal 81% of the time for the first period of each forecast for Atlanta in 2004. In summary, forecasters contin-ued to show improvement this year. Training workshops and seminars were held throughout the year to enhance forecasting skills. Awards are given to those forecasters showing the best improvement in tempera-ture forecasting during the warm and cool seasons. ☼
Forecasters Continue to Outperform Models
Mean Temperature Error
2
2.5
3
3.5
4
1997 1998 1999 2000 2001 2002 2003 2004
Deg
rees
Computer Forecasters
Chart showing distribution of first period (first 12 hours) forecast temperature errors for Atlanta Hartsfield-Jackson Airport.
Comparison of WFO Peachtree City forecasters’ precipitation forecasting skill versus that of the computer models they use. Lower scores are better.
Comparison of WFO Peachtree City forecasters’ temperature forecasting skill versus that of the computer models they use. Lower scores are better.
Radar Improvements Made Jeffrey Dobur Meteorologist
T he National Weather Service continues to make great strides toward improved warn-
ings and forecasts, and 2004 was no exception. In June 2004, a new scanning strategy for the Weather Service Radar (WSR-88D) called Volume Cov-erage Pattern 12 or “VCP 12” was implemented. The new VCP 12 allows faster scans and better vertical resolution which gives forecasters a better view
into storms. A secondary scan-ning strategy called VCP 121 was also made operational in the summer of 2004. The VCP 121 allows for better detection of widespread precipitation by reducing range folding, or erro-neous radar data produced at a certain distance from the radar site. This was extra helpful during the past hurricane sea-son where widespread precipi-tation was common. Several advancements have also taken place in our daily forecasts. ☼
Precipitation "Error"
0.08
0.09
0.1
0.11
0.12
0.13
0.14
1997 1998 1999 2000 2001 2002 2003 2004
Skill
Sco
re
Computer Forecasters
First 12 Hour Temperature Error
81%
2%17%
Within 3° 4° to 7° >7°
Page 6 Volume 4, Issue 1
Barry Gooden
Warning Coordination Meteorologist
& Robert Beasley
Meteorologist
D uring 2004, WFO Peachtree City is-sued 477 severe convective warnings,
(i.e., 477 counties were warned), which is a significant decrease from the 774 of the previous year. This is also the second lowest number since the advent of the current office configuration and NEXRAD Dop-pler radar in 1995. Since 1995, the number of warnings issued annually has ranged from a low of 452 (1995) to a high of 1,596 (1998). The first five months of the year were unusually quiet, setting a new record for the lowest number of warnings issued by this office for this period since 1995. Only 70 convective warnings were issued for the period January – May, and March through May is our severe weather season. The ten-year average for this period is 372! On the other
hand, 50 warnings during De-cember represented the highest number observed since the office assumed its current con-figuration. Overall verification scores for 2004 showed a slight decrease from 2003 and overall were the lowest since 1995. The changes from the verification scores observed in 2003 are as follows: The Probability of Detection (POD), which measures our ability to issue warnings before damage was 0.699. The opti-mum is 1.00. The False Alarm rate (FAR), which tells the per-centage of warnings not verified jumped to 0.592. This was primarily due to the difficulty in warning on the small-scale tor-nadoes associated with the tropical systems. The optimum FAR is 0.00. The Critical Suc-cess Index (CSI), a combination
Severe Weather Performance for 2004
Exclusive Verification Method*
Inclusive Verification
Svr Tstm Tornado Flash Floods
Svr Tstm &
Tornado
Warnings Issued 410 66 84 476
Warned Events 179 7 63 194
Unverified Warnings 231 59 21 283
Unwarned events 77 1 5 73
Total Events 256 8 51 265
POD .699 .875 .902 .725
FAR .563 .894 .250 .592
CSI .368 .104 .693 .353
Lead Time (min.) 9.7 14.0 32.5 10.2
*Severe Thunderstorm warnings only verified by large hail or damaging winds. Tornado warnings verified by tornadoes only. Flooding only verified by flash floods.
** Tornado warnings verified with tornadoes, large hail, or damaging winds. Tornadoes also verify severe thunderstorm warnings.
“The first five months of the year
were unusually quiet, setting a new record
for the lowest number of warnings issued by
this office for this period since 1995.”
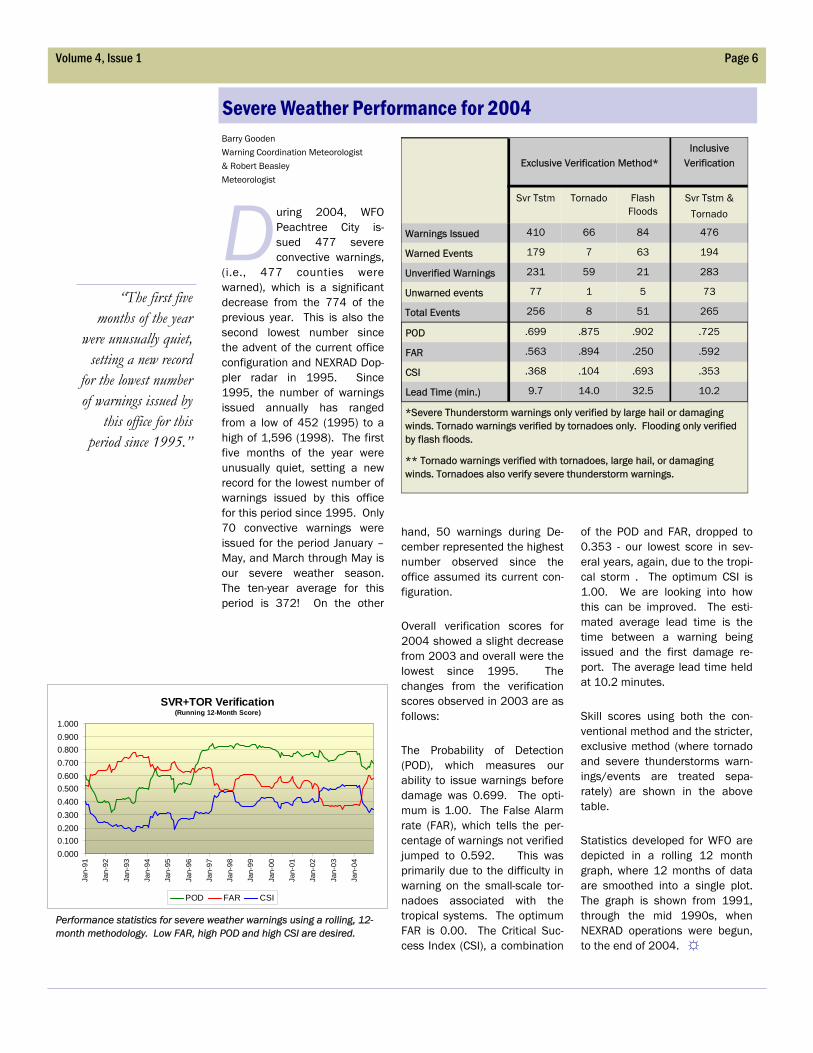
Performance statistics for severe weather warnings using a rolling, 12-month methodology. Low FAR, high POD and high CSI are desired.
of the POD and FAR, dropped to 0.353 - our lowest score in sev-eral years, again, due to the tropi-cal storm . The optimum CSI is 1.00. We are looking into how this can be improved. The esti-mated average lead time is the time between a warning being issued and the first damage re-port. The average lead time held at 10.2 minutes. Skill scores using both the con-ventional method and the stricter, exclusive method (where tornado and severe thunderstorms warn-ings/events are treated sepa-rately) are shown in the above table. Statistics developed for WFO are depicted in a rolling 12 month graph, where 12 months of data are smoothed into a single plot. The graph is shown from 1991, through the mid 1990s, when NEXRAD operations were begun, to the end of 2004. ☼
SVR+TOR Verification(Running 12-Month Score)
0.0000.1000.2000.3000.4000.5000.6000.7000.8000.9001.000
Jan-
91
Jan-
92
Jan-
93
Jan-
94
Jan-
95
Jan-
96
Jan-
97
Jan-
98
Jan-
99
Jan-
00
Jan-
01
Jan-
02
Jan-
03
Jan-
04
POD FAR CSI

Page 7 Volume 4, Issue 1
Nate Mayes Hydrometeorological Technician
T he Cooperative pro-gram at WFO Peach-tree City continues as one of the best in the
nation. This is the result of dedi-cation by the Cooperative Ob-servers that we have in Georgia. One of the most noticeable changes over the past year was the implementation and up-grades of the IV-ROCS com-puter. The NWS Southern Re-gion prototyped the IV-ROCS system for almost a year before it was released to the nation. Although the system became slower when it “went national” with approximately 9,000 sta-tions, we are working to make the system even better!
Length of service awards given in 2004 included:
40 Years Mr. Jack Montgomery (Rome)
35 Years
Mrs. Lois W. Dover (Ellijay)
30 Years Mr. John Maddox (Rome)
25 Years
Mr. James Staub & the Rangers (Chickamauga Park)
20 Years Mr. Ottis G. Stephens
(Louisville) Mr. Edward L. Starling (The
Rock)
Cooperative Observers Pilot National Program
Mr. Cicero W. Swint of Jones-boro, Georgia holding the Dick Hagemeyer award for 45 years of dedicated service as a Coop-erative Observer.
Office Upper Air Program Record Set for Tropical Storm Support Mike Leary Hydrometeorological Technician
O ur goal of sending sensor instruments into the upper atmosphere (carried
by a balloon) had its ups and downs in 2004. 2 0 0 4 w a s t h e b e s t performance year we have ever had. It beat out the previous best year, 2003, by 1.23 points. We're proud to have produced two excellent years back to back, and we are fired up for a possible hat trick in 2005. The highlight of 2004 was our support for the Hurricane season. We launched an additional nine flights in August and a record-setting 24 extra flights in September. The extra flights helped the National Hurricane Center and local offices refine their forecasts.
Coop Program Log for 2004 • 21,720 travel miles.
• 271 station visits.
Upper Air System Rankings
230
240
250
260
270
280
290
300
01/04 02/04 03/04 04/04 05/04 06/04 07/04 08/04 09/04 10/04 11/04 12/04
12 Month Running Average
Scor
es
National
SouthernRegionFFC
Elevationmotorburned upWinter
Windsgot us
OldBalloons
OldBalloons
15 Years Mr. Ferrell E. Morton (Dublin)
Mrs. Tommie N. Strickland (LaFayette)
10 Years
Mr. Edwin Penland (Chatsworth) Mr. Preston L. English (Unicoi
State Park) And finally, on a special note, Mr. Cicero W. Swint of station Jonesboro, Georgia (see pic-ture) received the prestigious Dick Hagemeyer award for 45 years of dedicated service. ☼
Near the end of the year we worked a little too hard trying to wring the last possible value out of some older balloons. We did save money, but paid a dear price in performance with a poor November and an even
worse December. We learned our lesson and have since retired the remaining older balloons. They will be used for demonstration when we do tours of our weather office. ☼
Chart depicting WFO upper air scores versus regional and national scores. Higher numbers are better.
“The highlight of 2004 was our support for the Hurricane season. We launched an additional nine flights in August and a record-setting 24 extra flights in September.”

Page 8 Volume 4, Issue 1
Jim Noffsinger Senior Meteorologist Dr. Chip West CWSU MIC
A viation activities in the Peachtree City WFO were cons idered “under construction”
in 2003. In 2004, the construc-tion was complete and Georgia aviation weather was “in the climb.” Aviation outreach pro-grams were expanded in the general aviation community,
and with the consolidation of the WFO and CWSU aviation forecast teams, commercial aviation outreach was also ex-panded. A quality improvement team, whose charter was to improve NWS customer service to the aviation community, im-plemented several changes with promising results. The team consisted of members from the WFO, CWSU, FAA, and the commercial airline industry. In June 2004, we began issuing terminal forecasts for PDK (DeKalb-Peachtree airport) in response to customer requests. This is the second busiest air-port in the state based on air-craft departures and the elev-enth in the state based on pas-sengers handled. Out of the seven terminal forecasts we issue, we now issue forecasts
Aviation Program Revamped for the four busiest air traffic airports in the state. Our busi-est airport in 2004, Atlanta Hartsfield-Jackson International (ATL), continues to be number one in the world handling more passengers than any other air-port. We were successful in improv-ing our terminal area forecasts over model guidance at our four primary forecast sites in 2004. The following graphs indicate the percentage improvement in the forecasts for ceilings of one thousand feet or less, and for visibilities of one mile or less. In both categories, the WFO forecasters improved upon the models for a more accurate forecast at all four sites. ☼
“With several surrounding offices responsible for fire weather services in
the state, a complete overhaul of the
(Annual Operations) Plan
was undertaken collaboratively.”
Fire Weather Program Has a Plan! Brian Lynn Meteorologist
T he 2004 fire weather seasons in Georgia were more active than in 2003. This was due
in large part to dry periods in March and April. A total of ten Red Flag Warning events occurred during the year which affected 830 counties. This was an average of 83 of our total 96 counties per event. The Fire Weather Program continues to go through a transition. A major revision of the office’s Area Operations Plan (AOP) was started in February. With several surrounding offices responsible for fire weather services in the state, a complete overhaul of the Plan was undertaken collaboratively. A final draft
was completed late in the year and a final version will be put in place at the end of January 2005. Any needed adjustments to the plan can be made any time during the year. Kudos are due to the fire weather counterpart in Jacksonville, Florida WFO. Due to her efforts, the final AOP will be accessible via web pages of NWS offices w i t h f i r e w e a t h e r responsibilities in Georgia. All needed coursework in preparation for Incident M e t e o r o l o g i s t ( I M E T ) c e r t i f i c a t i o n has b e e n completed by our program leader. Once he has worked two training fires, he will have c o m p l e t e d c e r t i f i c a t i o n requirements. This is expected to occur in the next couple fire seasons. ☼
Dr. Chip West MIC, CWSU
T he Center Weather S e r v i c e U n i t ’ s ( C W S U ’ s ) m a i n responsibility is to
provide weather support to the F e d e r a l A v i a t i o n Administration’s Air Route Traffic Control Center located in Hampton, GA. The CWSU is responsible for aviation weather support to two major airports and fourteen regional airports within parts of six states. Because of its traffic volume, Atlanta’s Hartsfield-Jackson International Airport gets quite a bit of attention. Our main services consist of providing weather forecast briefings to FAA management, issuing Center Weather Advisories (CWA’s), issuing Meteorological Impact Statements (MIS’s), collecting and disseminating pilot reports, and coordinating with Weather Forecast Offices
(Continued on page 10)
CWSU News
Improvement on GFS MOSCeilings 1 thousand ft or less
0
10
20
30
40
50
0
10
20
30
40
50
ATL AHN CSG MCN
Pe
rce
nt
Imp
rov
em
en
t
Improvement on GFS MOSVisibility 1 mile or less
0
50
100
150
200
250
0
50
100
150
200
250
ATL AHN CSG MCN
Pe
rce
nt
Imp
rov
em
en
t
“...we now issue forecasts for the four busiest air traffic airports
in the state.”

Page 9 Volume 4, Issue 1
Hydrology in 2004: Feast or Famine! Jim Noel Senior Service Hydrologist
I t was another busy year for hydrology across our area. The first half of 2004 was very dry while the second
half was very wet. The three-month period from March 1 to May 31 was the driest ever period for Athens (3.27”), the third driest at Columbus (4.94”), the fourth driest at Atlanta (6.44”) and the seventh driest at Macon (4.55”). As September arrived, it be-came very wet as three hurri-canes pounded Georgia. The first was Frances and this brought widespread rainfall to Georgia. However, since rivers and lakes were fairly low, only minor flooding occurred. The big one was Ivan. It brought major to record flooding to Georgia. Record floods oc-curred in the Atlanta metro area on Peachtree Creek and Nancy Creek. Major flooding occurred along parts of the Chattahoo-chee River in the Atlanta metro area. Tens of millions of dollars
of damage occurred and there was one flash flood death in White County and one indirect river flood death in Clarke County. Warnings and state-ments were out for these areas when the deaths occurred. Jeanne was the final hurricane to dump heavy rain in the area, especially along the Oconee River and in the Atlanta area. Rainfall totals for the month were generally eight to 20+ inches while normal rainfall is closer to four inches. It was the wettest September on record in 109 years of data. During September, we issued 69 flash flood warnings, 355 county flood warnings, 59 river flood warnings, 175 flood state-ments, 19 flood watches, and 12 flood potential outlooks. Probability of detection (POD) of flash floods for September was 95% with a false alarm rate (FAR) of only 13%! Numerous coordination calls were made before, during and after the hurricanes with GEMA, local
EMAs for evacuations and brief-ings, state, and federal water authorities. For the year, our POD of flash floods was 90% with a FAR of 18%. For river floods, our POD was 100% with a FAR of 10%. These are the best numbers since records were kept in 1986! This is due to continued vigorous training on our Flash Flood Monitoring Program and our Site Specific API river model. Finally, we added 10 new offi-cial forecast points to our Ad-vanced Hydrologic Prediction Service (AHPS) in 2004. They include Dawsonville, Carters-ville, New England, Alpharetta, Suwanee, Lovejoy, Conyers, Arcade, and Atlanta on both Nancy Creek and Proctor Creek. This paid off significantly during the major floods of September as life saving warnings and coordination were sent to the public and media. ☼
Hydro Tally for 2004 46 Flood Watches 95 Flash Flood Warnings 12 Flash Flood Statements 244 River Flood Warnings 1004 Flood Statements 526 Urban/Small Stream
Flood Advisories 41 Hydrologic Outlooks
Radar-derived rainfall accumulation for September 2004
“POD of flash floods was 90% with a FAR of 18%. For river floods, our POD was 100% with a FAR of 10%. These are the best numbers since records were kept in 1986!”
...our website contains a wealth of hydrologic infor-mation? The links to the Advanced Hydrologic Prod-ucts System (AHPS) will supply you with more wa-ter-related data than you knew existed. Check it out at:
www.srh.noaa.gov/cgi-bin/ahps.cgi?ffc
Did You Know...

Page 10 Volume 4, Issue 1
Staffing Overview at Year's End 1 Meteorologist in Charge 1 Administrative Support Assistant 1 Warning Coord. Meteorologist 1 Science and Operations Officer 5 Senior Forecasters 7 General Forecasters 1 Senior Service Hydrologist 1 Information Tech Officer 1 Data Acquisition Program Mgr. 3 Hydrometeorological Technicians 1 Meteorologist Intern (vacant) 1 Electronics Systems Analyst 3 Electronics Technicians 1 Student Intern
Administrative Update Deborah Connell Administrative Assistant
We are using a new software system called Sunflower Assets which was implemented this year by our National Headquar-ters to enhance the property assets inventory tracking sys-tem for NWS field offices. One retirement occurred in 2004. We said farewell to Mr.
Von Woods, Senior Meteorolo-gist, after 33½ years of dedi-cated service to the NWS. Mr. Steven Nelson transferred from the Norman, OK WFO to replace Mr. Woods. Philip Grigsby, Mete-orologist Intern recently trans-ferred to the New Orleans, LA WFO and his replacement is Mr. Eric Avila, a former student in-tern from Corpus Christi, TX. ☼
Tallies of products provided to customers of the Center Weather Service Unit in Hampton, GA.
Ken McMullen Senior Meteorologist The Student Volunteer Program continued in 2004 with stu-dents from high schools, col-leges, and universities across Georgia, as well as one from out of state. In the fall of 2004, we participated in the Gwinnett County QUEST Intern Program in which we received a student from Duluth High School who got credit for volunteering. Some of our college volunteers also received college credit for volunteering, as well. During their stay here, the stu-dents worked on office projects. Some of the projects included entering a database of our storm spotters, creating graph-ics of winter weather criteria for our office and the surrounding offices, helping our Storm Data Program Manager compile data, helping direct people during the Open House this past fall, and answering phones and taking storm reports during severe weather. During the hurricanes of September, the volunteers helped us tremendously by answering phones, and logging and compiling the storm reports received at our office. Up until the end of 2004, the volunteer program was adver-tised only for those interested in meteorology. However, in 2005, plans are to expand the program to include not only those with an interest in mete-orology, but also those with an interest in computer program-ming, and the electronics field. ☼
Students Volunteer!
within our airspace (see chart below). Atlanta Center was ranked second in the nation in 2004, based on aircraft handled. The CWSU provided weather support for the safe handling of over 3.1 million aircraft within its airspace, one-third of which were at Atlanta H a r t s f i e l d - J a c k s o n International. Goals for 2004 included increasing the services provided
(Continued from page 8) to our aviation customers. Atlanta CWSU increased or maintained the same in all services provide. The Atlanta CWSU continues to coordinate with the Peachtree City WFO for continued improvement to the aviation forecasts. Most importantly, we strive to mitigate weather impacts on traffic flow into one of the busiest airports in the world, the Atlanta Hartsfield-Jackson International Airport. ☼
CWSU News (cont.)
Interested in becoming a student volunteer? Contact Mr. Kent McMullen at the Peachtree City WFO (770-
486-1133 or [email protected]).
0
1000
2000
3000
4000
5000
Briefings CWA's MIS's PIREPS Coord Calls
20032004

Page 11 Volume 4, Issue 1
Verona Murrell Senior Meteorologist
C entral and north Georgia felt the effects of three major t ropical systems
during September. Hurricane Frances had weakened to a tropical storm as it moved through western Georgia to near Atlanta on September 7th. The most significant problem with Frances was sustained winds of 35 to 40 mph with gusts in excess of 50 mph. The worst damage took place in an area bounded by Macon, Atlanta, Greensboro, Dublin, Americus, and back to Macon. Estimated total damage with Frances was $14 million to property and $26.5 million to crops. Forty-one of the 96 counties in the Peachtree City CWA received a disaster declaration from the Federal Emergency Management Agency (FEMA). Hurricane Ivan, which had once been a Category 5 hurricane, weakened to a tropical depression by the time it moved through northwest Georgia on
Special Feature: Tropical Triple Play the morning of September 17th. Nevertheless, Ivan brought tornadoes, high winds, and significant flooding to north and central Georgia. Six tornadoes were confirmed, causing an estimated $3.4 million dollars in damages. Record flooding in the CWA was estimated to have caused $40.9 million in damage. Wind gusts of 50 to 60 mph left many counties in north and central Georg ia without power. Damage estimtes from high winds were $14.3 million. Twenty-three counties in the Peachtree City CWA were given a disaster declaration by FEMA. Hurricane Jeanne was the third hurricane to affect Georgia within a three-week period, following only ten days after Ivan. Of the three tropical systems, Jeanne caused the least damage to north and central Georgia counties. Jeanne had weakened to a tropical depression as it moved into southern Georgia on September 27, moving rapidly to northeast Georgia early on the 28th. In the Atlanta area, excessive rainfall of 4 to 8
Terry Murphy
Meteorologist
D uring 2004 there were several notable enhancements to the Peachtree City NWS website.
The very popular “GraphiCast” page was improved in several ways. The background map was improved with, among other things, more distinct state bor-ders and many more city names. Radar images that are
available in handy pop-up win-dows now have looping capabil-ity and stay up-to-date with the very latest image loading auto-matically. There is also a new link to the text version of the “Nowcast” product that corre-sponds to the graphical infor-mation being displayed. A feature called “The Weather Activity Planner” was added. Planning a weather-sensitive activity? Query our high-definition digital database and
(Continued on page 12)
Website Improvements
Radar image of Hurricane Ivan making landfall near Mobile, AL on September 16, 2004.
inches occurred in some of the same areas that had received over ten inches ten days earlier with Ivan. Many homeowners that were cleaning up from Ivan were impacted once again with major flooding. Total damages from flooding and high winds were estimated at $5 million. ☼

Page 12 Volume 4, Issue 1
search for the range of weather parameters applicable to the planned activity. When you input the range of weather pa-rameters important to your ac-tivity, and either click on the location of interest on a map, or enter the latitude and longitude coordinates, the web site soft-ware searches the database and returns a graphic depicting when the requested weather parameters will be met during the next seven days. The on-line searchable climate database was expanded to include 16 additional cities, including Americus, Blairsville, Carrollton and Milledgeville.
(Continued from page 11)
Web Work The database provides past weather observed since the year 2000, along with listings of 30-year normals. Several pages were reorgan-ized, and many new links estab-lished, including one to the annual Shareholders’ Report! The highlight of 2004 may have been the on-line Customer Sat-isfaction Survey that was made available for six weeks during the summer, and again during the month of October. We found that 96% of our customers are either “satisfied” or “extremely satisfied” with the overall layout and content of the website. We also learned that 86% of those responding use the site every
day. Of particular value were specific comments, requests, and suggestions for improve-ment. Some have been re-cently addressed, including:
• Placing the link for submit-ting storm reports in a more obvious location
• Providing a glossary of terms used in our Area Forecast Discussion
• Devising a different color s c h e m e f o r t h e Watch/Warning map on the front page
Other suggested changes are being worked on at year-end and should be in place early in 2005. ☼
“Peachtree City recognized one
additional StormReady county,
bringing the total number of counties within our CWA
to 22.”
Patricia Atwell Meteorologist & Barry Gooden Warning Coord. Meteorologist
T he Peachtree City Forecast office contin-ues to participate in outreach and prepar-
edness opportunities within north and central Georgia.
In 2004, Peachtree City recog-nized one additional Storm-Ready county (DeKalb County), bringing the total number of counties within our CWA to 22. Statewide there are now 45 recognized StormReady coun-ties. In the spotter training program, classes were again conducted from January through mid-March and again from Septem-ber through mid-November. A total of 546 spotters were trained. Our office now has trained spotters in 81% of our County Warning area. During 2004, numerous office tours were hosted at the Peachtree City office, allowing 974 participants to see first-hand forecasting techniques, warning dissemination, and preparation of weather. Addi-tionally, 117 people visited our office in unofficial tours. An
Open House was held in con-junction with the Great Georgia Airshow on October 9th, bring-ing an additional 188 people through our office. During the Open House, visitors also had the opportunity to experience the Carroll County Safe-House which was on display. The office participated in sev-eral school presentations and career fairs, introducing stu-dents of all ages to the world of meteorology. The office staffed booths at the Georgia Boat Show, Great Georgia Air Show, and National Science Teachers Association meeting in Atlanta. Finally, we conducted several courses at the Georgia Public Safety Training Center in For-syth - including Hazardous Weather and Flood Prepared-ness, and the Flood Fight Course. ☼
Education, Outreach and StormReady Making a Difference
StormReady Counties in the Peachtree City County Warning Area.
“We found that 96% of our
customers are either “satisfied” or
“extremely satisfied” with the overall
layout and content of the website.”
Floyd
PauldingCobb
Douglas
Oglethorpe
Rockdale
DeKalbFulton
NewtonClayton
Monroe Jones
Upson
Warren
Jefferson
Muscogee
Marion
ForsythHall
Dawson
Barrow
GreeneMorgan
Jasper
Dodge
Pulaski
Wilcox
Houston
Johnson
Toombs
Mont-gomery
Gwinnett
Whitfield Murray
Walker
Fannin Towns
White
Butts
Carroll
PeachTaylor
Schley
Catoosa
Union
Dade
Gilmer
LumpkinGordonChattooga
Pickens
Banks
Bartow Cherokee
Jackson Madison
PolkClarke
WilkesOconee
WaltonHaralson
Taliaferro
McDuffieHenryFayette
Coweta PutnamHancockHeard Spalding Glascock
Washington
MeriwetherTroupPike Lamar Baldwin
WilkinsonBibb
TwiggsTalbotHarris Crawford
Emanuel
LaurensBleckley
Chattahoochee MaconTreutlen
WheelerDooly
WebsterStewart Sumter
TelfairCrisp

Page 13 Volume 4, Issue 1
Gary Beeley
Science and Operations Officer
T raining remained a high priority at the Peachtree City WFO in 2004. A total of 1,675
hours of training was completed by meteorologists and hydrome-teorological technicians (HMTs). This was an average of about 86 hours per meteorologist and 23 hours per HMT. A large part of the training (75%) was con-ducted on station by means of teletraining, weather simula-tions, and web-based training. The chart at right shows the last three years of training and the various categories. Weather event simulations con-tinued to be one of the most effective methods of training in the forecast office. The Weather Event Simulator (WES) was used for training and preparing forecasters for heavy rain epi-sodes, winter weather, severe
storms, and tropical cyclone induced tornadoes. The tropical cyclone induced tornado simu-lation turned out to be espe-cially pertinent as the remnants of hurricanes Frances, Ivan, and Jeanne tracked across the Peachtree City CWA area. Hurri-cane Ivan was prolific in produc-ing tornadoes in north and cen-tral Georgia and the training provided by the WES was in-valuable. During May it was our privilege to have Dr. Geoffrey DiMego, Chief of the Mesoscale Model-ing Branch of the National Cen-ter for Environmental Prediction attend our office and give a presentation entitled "Where We Are and Where We're Going with Mesocale Modeling". Dr. DiMego also gave a presenta-tion to the local chapter of the AMS while in Atlanta. During the fall of 2004, all me-teorologists at WFO Peachtree
City began taking the Advance Warning Operations Course (AWOC). This course, devel-oped by the Warning Decision and Training Branch in Norman, OK, focuses on the latest re-search in severe weather identi-fication and warning method-ologies. By the end of the year nearly all meteorologist had completed half of the course. ☼
Science & Training Pay Dividends During Storms
“A total of 1,675 hours of training was completed by meteorologists and HMTs. This was an average of about 86 hours per meteorologist and 23 hours per HMT.”
Madison and Wilkes counties caused damage costing $1.5M and $1.3M, respectively. Next in the line of property damage were two wildfires in the Spring. Unusually dry, windy conditions allowed two open fires to spread out of control, destroying several homes and causing significant damage to more than two dozen other homes. Damages were estimated at $3.19M for these events. Lightning was next at $ 2 . 3 7 M , f o l l o w e d b y thunderstorm winds, strong winds, ice storms, heavy rain, and finally hail. ☼
(Continued from page 3)
Date County Location Strength Path
Length (mi)
Path Width (yds)
Deaths Injuries Damage
07/14 Cherokee 3ENE Ball Ground - 3.2E Ball Ground F0 0.2 50 0 0 $1K
07/14 Cherokee 6.5SE Canton – 6.6SE Canton F0 0.1 50 0 0 $1K
09/16 Madison 1NNE Colbert –
0.5WNW Daniels-ville
F1 7 150 0 0 $1.3M
09/16 Madison Paoli – 1NNW Paoli F0 1 50 0 0 $50K
09/16 Upson 5N Yatesville – 5.1N Yatesville F0 0.1 50 0 0 $0.5K
09/16 Spalding 0.5SE Griffin – 0.4SE Griffin F0 0.2 50 0 0 $250K
Tornadoes in Peachtree City NWS Forecast Area in 2004
09/16 Wilkes 0.5S Tignall – 1.5N Norman F1 7 500 0 0 $1.5M
09/16 Cherokee 2WSW Orange – 2WNW Orange F1 1 400 0 4 $300K
Severe Weather
0
500
1000
1500
2000
Hours
Total Training and Categories
Contract 950 140 98
NWS Off-station 432 406 323
On-station 520 1329 1254
FY02 FY03 FY04

4 Falcon Drive Peachtree City, GA 30215
Phone: 770-486-1133 Fax: 770-486-9333 Email: [email protected]
The Weather Forecast Office in Peachtree City is a field office of the National Weather Service, an agency of the National Oceanic and Atmospheric Ad-ministration, which is part of the U.S. Department of Commerce. The office is responsible for weather and water forecast and warning services for 96 counties in north and central Georgia (see map below).
National Weather Service • Weather Forecast Office • Peachtree City, Georgia
We are your Weather Service
weather.gov (and click on Georgia)