Embed Size (px)
Citation preview

Florida Annual Cancer Report: 2003 Incidence and Mortality
Florida Annual
Cancer Report:2003 Incidence and Mortality
Charlie CristGovernor
Ana M. Viamonte Ros, M.D., M.P.H. State Surgeon General
i

Florida Annual Cancer Report: 2003 Incidence and Mortality
Florida Department of Health, Bureau of Epidemiology
Youjie Huang, M.D., M.P.H., Dr.PH.Tara Hylton, M.P.H.Zhaohui Fan, M.P.H.John Middaugh, M.D.
Florida Cancer Data System
Jaclyn Button, M.S.Brad Wohler, M.S.Gary Levin, B.A., C.T.R.Jill MacKinnon, Ph.D., C.T.R. Lora E. Fleming, M.D., Ph.D.Edward J. Trapido, Sc.D.
ACKNOWLEDGMENTS
The Florida Department of Health wishes to recognize cancer registrars throughout the state who provided incidence data for this report. Our sincere thanks to each staff member of every hospital, pathology laboratory, ambulatory surgical center, radiation therapy facility, and physician’s offi ce who submitted cancer abstracts to the Florida Cancer Data System. Without you, this report would not be possible.
Many thanks to the staff of IMS, Inc., Silver Spring, Maryland, for SEER*Stat, the software that makes reporting our cancer rates easier and more consistent. Thanks also to Jennie Hefelfi nger, Lisa Fisher, and Dr. Richard Hopkins for reviewing drafts of the report.
We acknowledge the Centers for Disease Control and Prevention for its support of the staff, and the printing and distribution of the Florida Annual Cancer Report: 2003 Incidence and Mortality under cooperative agreement U55/CCU421918. Its contents are solely the responsibility of the authors and do not represent the views of the Centers for Disease Control and Prevention.
Suggested Citation:Huang Y, et al. Florida Annual Cancer Report: 2003 Incidence and Mortality. Tallahassee: Florida Department of Health, 2007.
ii

Florida Annual Cancer Report: 2003 Incidence and Mortality
FLORIDA ANNUAL CANCER REPORT:2003 INCIDENCE AND MORTALITY
BUREAU OF EPIDEMIOLOGY
FLORIDA DEPARTMENT OF HEALTHAND
FLORIDA CANCER DATA SYSTEM
Florida Department of Health4052 Bald Cypress Way, Bin A-12
Tallahassee, FL 32399-1720
Telephone: (850) 245-4401; Fax: (850) 922-9299 Florida Department of Health: www.doh.state.fl .usFlorida Cancer Data System: fcds.med.miami.edu
iii

Florida Annual Cancer Report: 2003 Incidence and Mortalityiv

Florida Annual Cancer Report: 2003 Incidence and Mortality
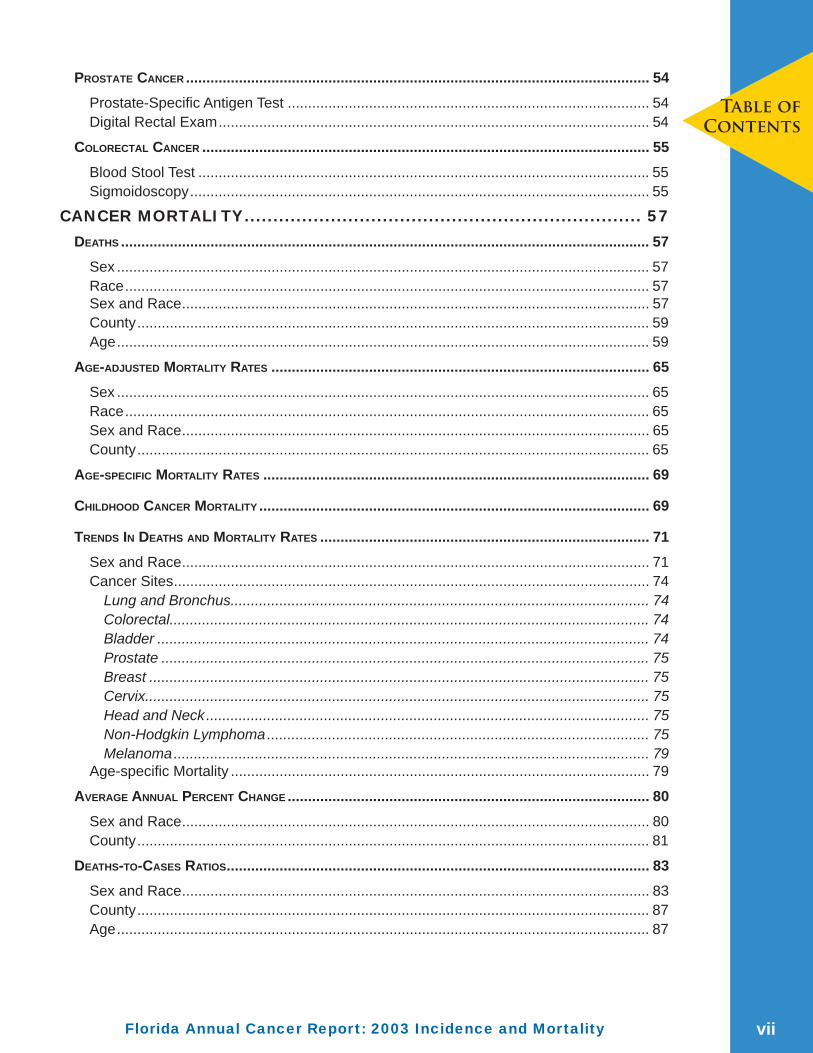
TABLE OF CONTENTS
LIST OF FIGURES .............................................................................x
LIST OF TABLES ............................................................................xiii
EXECUTIVE SUMMARY .................................................................... 1
INTRODUCTION .............................................................................. 3
BACKGROUND AND HISTORY ........................................................................................................ 3PURPOSE .................................................................................................................................. 3INTRODUCTION TO CONTENTS ....................................................................................................... 3ADJUSTMENTS SINCE THE LAST CANCER REPORT ........................................................................... 4
METHODS ....................................................................................... 5
SOURCES OF DATA ..................................................................................................................... 5
Incidence ............................................................................................................................ 5Hospital Discharge ............................................................................................................. 5Mortality .............................................................................................................................. 6Population .......................................................................................................................... 6Cancer Screening and Current Smoking Prevalence ........................................................ 6
DEFINITIONS .............................................................................................................................. 7
Age-adjusted Rates ............................................................................................................ 7Age-specifi c Rates ............................................................................................................. 7Average Annual Percent Change ....................................................................................... 7Childhood Cancers ............................................................................................................. 8Comparison of Rates ......................................................................................................... 8Confi dence Intervals .......................................................................................................... 8County of Residence .......................................................................................................... 8Crude Rates ....................................................................................................................... 8Deaths-to-Cases Ratios ..................................................................................................... 8Incidence ............................................................................................................................ 9Mortality .............................................................................................................................. 9Prevalence ......................................................................................................................... 9Race ................................................................................................................................... 9Smoking-Attributable Cancer Deaths ................................................................................. 9Stage of Cancer ............................................................................................................... 10Suppression Of Data ........................................................................................................ 10Years of Potential Life Lost ............................................................................................... 10
CLASSIFICATION ....................................................................................................................... 10
REPORTED CANCER SITES ..........................................................................................................11
Major Sites ....................................................................................................................... 11Other Sites ....................................................................................................................... 11Tobacco-Related Cancers ................................................................................................ 12
Table of
Contents
v

Florida Annual Cancer Report: 2003 Incidence and Mortality
CANCER INCIDENCE ..................................................................... 13
NEW CASES ............................................................................................................................ 13
Sex and Race ................................................................................................................... 13County .............................................................................................................................. 15Age ................................................................................................................................... 17
AGE-ADJUSTED INCIDENCE RATES ............................................................................................... 21
Sex and Race ................................................................................................................... 21Cancer Sites ..................................................................................................................... 21County .............................................................................................................................. 23
AGE-SPECIFIC INCIDENCE RATES .................................................................................................. 26
CHILDHOOD CANCER INCIDENCE ................................................................................................. 28
TRENDS FOR NEW CASES AND INCIDENCE RATES .......................................................................... 28
Sex and Race ................................................................................................................... 28Cancer Sites ..................................................................................................................... 31
Lung and Bronchus....................................................................................................... 31Colorectal...................................................................................................................... 32Bladder ......................................................................................................................... 32Prostate ........................................................................................................................ 32Breast ........................................................................................................................... 33Cervix ............................................................................................................................ 33Head and Neck ............................................................................................................. 33Non-Hodgkin Lymphoma .............................................................................................. 33Melanoma ..................................................................................................................... 33
Age-specifi c Incidence Rates ........................................................................................... 37
AVERAGE ANNUAL PERCENT CHANGE ......................................................................................... 38
Sex and Race ................................................................................................................... 38Females ........................................................................................................................ 38Males ............................................................................................................................ 38
County .............................................................................................................................. 40
STAGE OF CANCER AT DIAGNOSIS ............................................................................................... 42
Sex and Race ................................................................................................................... 42County .............................................................................................................................. 42Age ................................................................................................................................... 43Trends .............................................................................................................................. 46
CANCER SCREENING ..................................................................... 50BREAST CANCER ..................................................................................................................... 50
Mammogram .................................................................................................................... 50Clinical Breast Exam ........................................................................................................ 50
CERVICAL CANCER ................................................................................................................... 52
Pap Smear ....................................................................................................................... 52
Table of
Contents
vi
Florida Annual Cancer Report: 2003 Incidence and Mortality
PROSTATE CANCER .................................................................................................................. 54
Prostate-Specifi c Antigen Test ......................................................................................... 54Digital Rectal Exam .......................................................................................................... 54
COLORECTAL CANCER .............................................................................................................. 55
Blood Stool Test ............................................................................................................... 55Sigmoidoscopy ................................................................................................................. 55
CANCER MORTALITY ..................................................................... 57
DEATHS .................................................................................................................................. 57
Sex ................................................................................................................................... 57Race ................................................................................................................................. 57Sex and Race ................................................................................................................... 57County .............................................................................................................................. 59Age ................................................................................................................................... 59
AGE-ADJUSTED MORTALITY RATES ............................................................................................. 65
Sex ................................................................................................................................... 65Race ................................................................................................................................. 65Sex and Race ................................................................................................................... 65County .............................................................................................................................. 65
AGE-SPECIFIC MORTALITY RATES ............................................................................................... 69
CHILDHOOD CANCER MORTALITY ................................................................................................ 69
TRENDS IN DEATHS AND MORTALITY RATES ................................................................................. 71
Sex and Race ................................................................................................................... 71Cancer Sites ..................................................................................................................... 74
Lung and Bronchus....................................................................................................... 74Colorectal...................................................................................................................... 74Bladder ......................................................................................................................... 74Prostate ........................................................................................................................ 75Breast ........................................................................................................................... 75Cervix ............................................................................................................................ 75Head and Neck ............................................................................................................. 75Non-Hodgkin Lymphoma .............................................................................................. 75Melanoma ..................................................................................................................... 79
Age-specifi c Mortality ....................................................................................................... 79
AVERAGE ANNUAL PERCENT CHANGE ......................................................................................... 80
Sex and Race ................................................................................................................... 80County .............................................................................................................................. 81
DEATHS-TO-CASES RATIOS ........................................................................................................ 83
Sex and Race ................................................................................................................... 83County .............................................................................................................................. 87Age ................................................................................................................................... 87
Table of
Contents
vii

Florida Annual Cancer Report: 2003 Incidence and Mortality
YEARS OF POTENTIAL LIFE LOST ................................................................................................ 87
Sex ................................................................................................................................... 88Race ................................................................................................................................. 88Sex and Race ................................................................................................................... 88Childhood Cancer ............................................................................................................ 88
TOBACCO-RELATED CANCERS ....................................................... 92
INCIDENCE ............................................................................................................................... 92
MORTALITY ......….. .................................................................................................................. 92
PREVALENCE OF CURRENT CIGARETTE USE ................................................................................. 95
HOSPITALIZATIONS FOR CANCER ................................................ 97
HOSPITALIZATIONS .................................................................................................................... 97
LENGTH OF HOSPITAL STAY ....................................................................................................... 99
HOSPITAL CHARGES ............................................................................................................... 101
CANCER PROGRAMS IN FLORIDA ................................................ 106
COMPREHENSIVE CANCER CONTROL PROGRAM .......................................................................... 106
BREAST AND CERVICAL CANCER EARLY DETECTION PROGRAM ..................................................... 106
CANCER CONTROL AND RESEARCH ADVISORY COUNCIL ............................................................... 107
FLORIDA CANCER COUNCIL ..................................................................................................... 107
BANKHEAD-COLEY CANCER GRANT PROGRAM ............................................................................ 107
FLORIDA TOBACCO PREVENTION PROGRAM ................................................................................ 108
OFFICE OF MINORITY HEALTH .................................................................................................. 109
FLORIDA DIALOGUE ON CANCER ............................................................................................... 109
FLORIDA CANCER CLINICAL TRIAL MATCHING SERVICE ................................................................ 109
AMERICAN CANCER SOCIETY ....................................................................................................110
THE AMERICAN COLLEGE OF SURGEONS, THE COMMISSION ON CANCER .........................................110
CANCER INFORMATION SERVICE .................................................................................................110
FLORIDA ASSOCIATION OF PEDIATRIC TUMOR PROGRAMS, INC. ......................................................111
APPENDICES .............................................................................. 112APPENDIX A.1 POPULATION BY SEX, RACE, AND AGE GROUP, FLORIDA, 2003 ..................................112
APPENDIX A.2 POPULATION BY COUNTY, FLORIDA, 2003 ................................................................113
APPENDIX A.3 2000 UNITED STATES STANDARD MILLION POPULATION BY AGE GROUP .......................114
viii
Table of
Contents

Florida Annual Cancer Report: 2003 Incidence and Mortality
Table of
Contents
APPENDIX B POPULATION BY SEX AND RACE, FLORIDA, 1981-2003 ............................................115
APPENDIX C PERCENTAGE OF TOTAL POPULATION BY RACE AND AGE GROUP, FLORIDA, 2003 ........116
APPENDIX D INCIDENCE AND MORTALITY CODES FOR CANCER SITES .............................................117
REFERENCES............................................................................... 122
ix

Florida Annual Cancer Report: 2003 Incidence and Mortality
LIST OF FIGURES
1 Percentage of New Cancers by Sex, Race, and Site, Florida, 2003 ........................... 14
2.1 Percentage of New Cancers by Sex, Race, and Site, Age 15-64, Florida, 2003 ........ 18
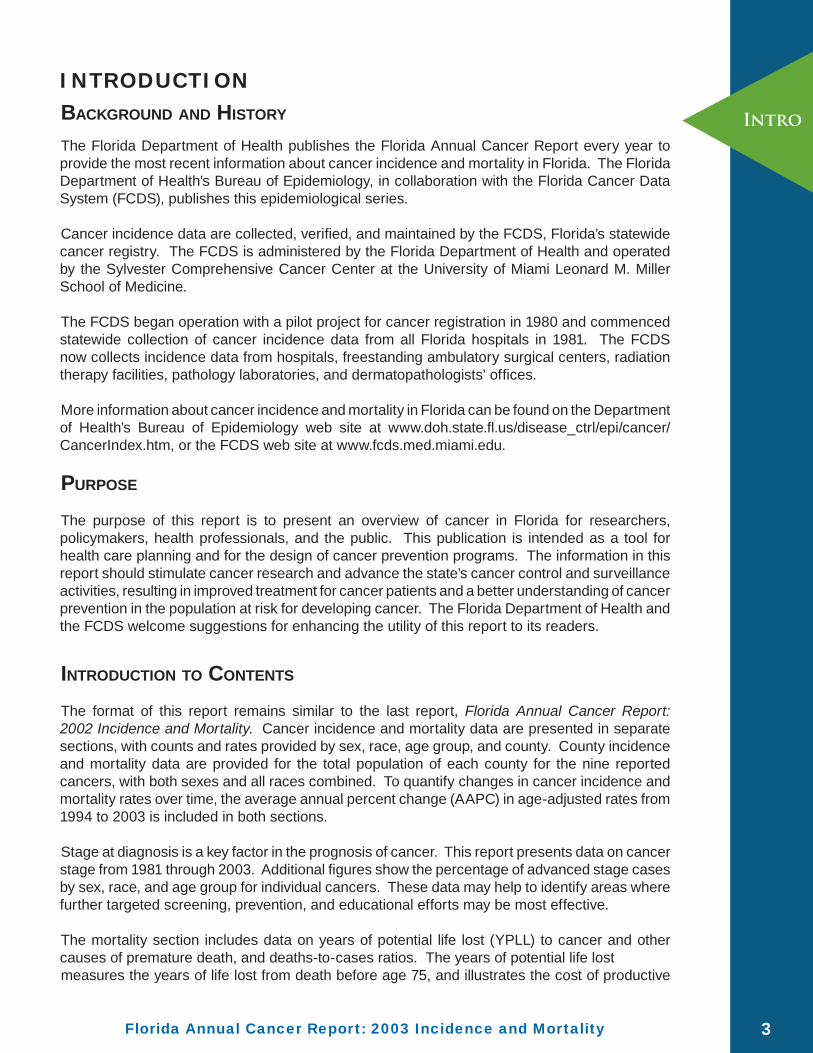
2.2 Percentage of New Cancers by Sex, Race, and Site, Age 65+, Florida, 2003 ........... 19
3 New Cases and Age-adjusted Incidence Rates for All Cancers by Sex and by Race, Florida, 1981-2003 ............................................................................. 29
4 New Cases and Age-adjusted Incidence Rates for All Cancers by Sex and Race, Florida, 1981-2003 .................................................................................. 30
5 Age-adjusted Incidence Rates for All Cancers by Sex and Race, Florida, 1981-2003 .................................................................................................... 31
6.1 Age-adjusted Incidence Rates by Sex and Race, Florida, 1981-2003 ........................ 34
6.2 Age-adjusted Incidence Rates by Sex and Race, Florida, 1981-2003 ........................ 35
6.3 Age-adjusted Incidence Rates by Sex and Race, Florida, 1981-2003 ........................ 36
7 Age-specifi c Incidence Rates for All Cancers by Sex, Race, and Age Group, Florida, 1981-2003 .................................................................................................... 37
8 Average Annual Percent Change in Age-adjusted Incidence Rates by Sex and Race, Florida, 1994-2003 ...................................................................... 39
9 All Cancers by Stage, Florida, 1981-2003 .................................................................. 42
10.1 Percentage of Advanced Stage Cancer at Diagnosis by Sex and Race, Lung and Bronchus, Colorectal, Bladder, Florida, 1981-2003 ................................... 47
10.2 Percentage of Advanced Stage Cancer at Diagnosis by Sex and Race, Prostate, Breast, Cervix, Florida, 1981-2003 ............................................................ 48
10.3 Percentage of Advanced Stage Cancer at Diagnosis by Sex and Race, Head and Neck, Non-Hodgkin, Melanoma, Florida, 1981-2003 ............................... 49
11 Prevalence of Receiving a Mammogram in Two Years among Females age 40 and Older, Florida, 1987-2004……………… ..………………………… 52
12 Prevalence of Ever Having a Pap Smear among Females age 18 and Older, Florida, 1991-2004………………………………… ....……………………………………….. 53
13.1. Prevalence of Having a PSA Test in Two Years among Males Age 40 and Older, Florida, 2000-2004.…………………………… ......………………….. 55
13.2 Prevalence of Having a Digital Rectal Exam in Two Years among Males age 40 and Older, Florida, 2000-2004.………………………… ... ……………… 55
List Of
Figures
xx

Florida Annual Cancer Report: 2003 Incidence and Mortality
List Of
Figures
ix
14.1 Prevalence of Having a Blood Stool Test in Two Years among Adults 50 Years and Older, Florida, 1999-2005.……………………………...………… 56
14.2. Prevalence of Having Had a Sigmoidoscopy Exam among Adults 50 Years and Older, Florida, 1999-2005.. ..………………………………………. 56
15 Percentage of Cancer Deaths by Sex, Race, and Site, Florida, 2003 ........................ 58
16.1 Percentage of Cancer Deaths by Sex, Race, and Site, Age 15-64, Florida, 2003 ...... 63
16.2 Percentage of Cancer Deaths by Sex, Race, and Site, Age 65+, Florida, 2003 ......... 64
17 Deaths and Age-adjusted Mortality Rates for All Cancers by Sex and by Race, Florida, 1981-2003 .................................................................................................... 72
18 Deaths and Age-adjusted Mortality Rates for All Cancers by Sex and Race, Florida, 1981-2003 .................................................................................................... 73
19 Age-adjusted Mortality Rates for All Cancers by Sex and Race, Florida, 1981-2003 .................................................................................................... 74
20.1 Age-adjusted Mortality Rates by Sex and Race, Lung and Bronchus, Colorectal, Bladder, Florida, 1981-2003 ................................... 76
20.2 Age-adjusted Mortality Rates by Sex and Race, Prostate, Breast, Cervix, Florida, 1981-2003 ............................................................ 77
20.3 Age-adjusted Mortality Rates by Sex and Race, Head and Neck, Non-Hodgkin, Melanoma, Florida, 1981-2003 ............................... 78
21 Age-specifi c Mortality Rates for All Cancers by Sex, Race, and Age Group, Florida, 1981-2003 .....................................................................................................79
22 Average Annual Percent Change in Age-adjusted Mortality Rates by Sex and Race, Florida, 1994-2003 ....................................................................... 81
23 Years of Potential Life Lost to Age 75 by Sex and by Race, Florida, 2003 ................. 89
24 Years of Potential Life Lost, Children Age 0-14, by Sex and by Race, Florida, 2003 .. 89
25 Average Years of Potential Life Lost per Death by Race, Florida, 1981-2003 ............. 91
26 Average Years of Potential Life Lost by Race, Florida, 2003 ...................................... 91
27 Age-adjusted Incidence and Mortality Rates for Tobacco-Related Cancers by Sex and Race, Florida, 1981-2003 ....................................................................... 93
28 Prevalence of Current Cigarette Use by Sex and Race, Florida, 1986-2005 .............. 96
29. Prevalence of Current Cigarette Use by Age Group, Florida, 1986-2005 ................... 96
xi

Florida Annual Cancer Report: 2003 Incidence and Mortality
30. Prevalence of Current Cigarette Use among Adults by Health Coverage, 1991-2005 ...................................................................................96
Appendix B Population by Sex and Race, Florida, 1981-2003 ........................................... 115
Appendix C Percentage of Total Population by Race and Age Group, Florida, 2003 .......... 116
List Of
Figures
xiixii

Florida Annual Cancer Report: 2003 Incidence and Mortalityxi
LIST OF TABLES
1 Number of New Cancer Cases by Sex and Race, Florida, 2003 ................................ 13
2 Number of New Cancer Cases by County, Florida, 2003 ........................................... 16
3 Number of New Cancer Cases by Sex, Race, and Age Group, Florida, 2003 ............ 20
4 Age-adjusted Incidence Rates by Sex and Race, Florida, 2003 ................................. 22
5 Age-adjusted Incidence Rates by County, Florida, 2003 ............................................ 24
6 Age-specifi c Incidence Rates by Sex, Race, and Age Group, Florida, 2003 .............. 27
7 Number of New Cancer Cases and Age-specifi c Incidence Rates for Children Age 0-14, Florida, 1999-2003 .................................................................................... 28
8 Average Annual Percent Change in Age-adjusted Incidence Rates by Sex and Race, Florida, 1994-2003 ...................................................................... 39
9 Average Annual Percent Change in Age-adjusted Incidence Rates by County, Florida, 1994-2003 .................................................................................. 41
10 Percentage of Advanced Stage Cancer at Diagnosis by Sex and Race, Florida, 2003 .............................................................................................................43
11 Percentage of Advanced Stage Cancer at Diagnosis by County, Florida, 2003 ......... 44
12 Percentage of Advanced Stage Cancer at Diagnosis by Sex, Race, and Age Group, Florida, 2003 ......................................................................................... 45
13 Prevalence of Breast Screening, Florida, 2004 .......................................................... 51
14 Prevalence of Cervical Screening, Florida, 2004 ........................................................ 53
15 Prevalence of Prostate Screening, Florida, 2004 ....................................................... 54
16 Prevalence of Colorectal Screening, Florida, 2005 ..................................................... 56
17 Number of Cancer Deaths by Sex and Race, Florida, 2003 ....................................... 59
18 Number of Cancer Deaths by County, Florida, 2003 .................................................. 61
19 Number of Cancer Deaths by Sex, Race, and Age Group, Florida, 2003 ................... 62
20 Age-adjusted Mortality Rates by Sex and Race, Florida, 2003 .................................. 66
21 Age-adjusted Mortality Rates by County, Florida, 2003 .............................................. 67
22 Age-specifi c Mortality Rates by Sex, Race, and Age Group, Florida, 2003 ................ 70
List Of
Tables
xiii

Florida Annual Cancer Report: 2003 Incidence and Mortality
23 Number of Cancer Deaths and Age-specifi c Mortality Rates for Children Age 0-14, Florida, 1998-2003 .................................................................................................... 71
24 Average Annual Percent Change in Age-adjusted Mortality Rates by Sex and Race, Florida, 1994-2003 ...................................................................... 80
25 Average Annual Percent Change in Age-adjusted Mortality Rates by County, Florida, 1994-2003 .................................................................................. 83
26 Deaths-to-Cases Ratios by Sex and Race, Florida, 2003 ........................................... 84
27 Deaths-to-Cases Ratios by County, Florida, 2003 ...................................................... 85
28 Deaths-to-Cases Ratios by Sex, Race, and Age Group, Florida, 2003 ...................... 86
29 Years of Potential Life Lost Due to All Causes and Selected Cancers by Sex and by Race, Florida, 2003 ............................................................................ 90
30 Years of Potential Life Lost Due to All Causes and Selected Cancers by Sex and Race, Florida, 2003 ................................................................................ 90
31 Smoking-Attributable Deaths by County, Florida, 2003 ................................................94
32 Prevalence of Current Cigarette Use, Florida, 2005 ................................................... 95
33 Number of Hospitalizations for Cancer by Sex and Race, Florida, 2003 .................... 97
34 Number of Hospitalizations for Cancer by County, Florida, 2003 ............................... 98
35 Hospitalization Rates for Cancer by County, Florida, 2003 ...................................... 100
36 Total Length of Stay and Average Length of Stay for Hospitalizations for Cancer by Sex and Race, Florida, 2003 .............................................................................. 101
37 Total Length of Stay for Hospitalization for Cancer by County, Florida, 2003……… . 102
38 Total Charges for Hospitalization for Cancer by Sex and Race, Florida, 2003 ......... 103
39 Average Charge for Hospitalization for Cancer by Sex and Race, Florida, 2003 ..... 103
40 Total Charges for all Cancer Hospitalizations by County, Florida, 2003 ................... 104
41 Average Charge per Hospitalization for Cancer by County, Florida, 2003 ................ 105
Appendix A.1 Population by Sex, Race, and Age Group, Florida, 2003 .............................. 112
Appendix A.2 Population by County, Florida, 2003 .............................................................. 113
Appendix D Incidence and Mortality Codes for Reported Sites .......................................... 117
List Of
Tables
xiv

Executive
Summary
EXECUTIVE SUMMARY
During 2003, physicians diagnosed 94,910 primary cancers among Floridians, an average of 260 cases per day; compared to 96,058 cancers in 2002, a decrease of 1,148 cancers. A total of 38,623 Floridians died of cancer in 2003, an average of 106 deaths per day; compared to 38,369 deaths in 2002.
Cancer of the lung and bronchus was the most frequently reported cancer, with 15,768 cases diagnosed in 2003. Prostate cancer ranked second with 12,817 cases, followed by female breast cancer with 11,933 cases. The fourth and fi fth most common cancers were colorectal cancer and bladder cancer, with 10,620 and 4,836 cases, respectively. Compared to 2002, the number of cases in 2003 decreased for all major cancers, except for cancers of the lung and bronchus, and head and neck, which increases by 64 and 118 cases, respectively.
Sixty-two percent of the newly diagnosed cancers and 72 percent of cancer deaths occurred in persons age 65 and older. This age group accounts for 17.9 percent of Florida’s population.
The age-adjusted incidence rates for all cancers combined among both females (378 cases per 100,000 population) and males (503 cases per 100,000 population) in Florida were lower than the Surveillance Epidemiology End Results (SEER) 17 registries rates, which reported 398 cases per 100,000 population for females and 532 cases per 100,000 population for males in 2003. The SEER Program of the National Cancer Institute (NCI) is an authoritative source of information on cancer incidence and survival in the United States.
Compared with 2002, Florida’s age-adjusted incidence rates decreased in 2003 for all cancers combined for both sexes. For males, the incidence rate decreased from 528 cases per 100,000 in 2002 to 503 cases per 100,000 in 2003. For females, the incidence rate decreased from 397 cases per 100,000 in 2002 to 378 cases per 100,000 in 2003.
White males had a lower age-adjusted incidence rate for all cancers combined (500 cases per 100,000 population) than Black males (526 cases per 100,000 population). White females had a higher rate for all cancers combined (382 cases per 100,000 population) than Black females (342 cases per 100,000 population).
Cancer, with 38,623 deaths, was the second leading cause of death in Florida in 2003, surpassed only by heart disease with 48,129 deaths. Stroke was the third leading cause with 9,873 deaths. Cancer ranked fi rst in terms of years of potential life lost with 277,488 potential years of life lost by age 75, cancer surpassed heart disease (187,976 years lost) and unintentional injuries (216,442 years lost).
Cancer of the lung and bronchus was the leading cause of cancer death with 11,745 deaths. Colorectal cancer was the second with 3,641 deaths, followed by female breast cancer with 2,570 deaths, and prostate cancer with 2,091 deaths.
Florida mortality rates for all cancers combined for males decreased slightly from 213 per 100,000 in 2002 to 206 per 100,000 in 2003. Female mortality rates for all cancers combined decreased from 145 per 100,000 in 2002 to 140 per 100,000 in 2003.
Black males had the highest age-adjusted mortality rate for all cancers combined among the four sex-race groups. Prostate cancer mortality rates accounted for much of this difference. Black males had a mortality rate of 57 per 100,000 from prostate cancer, three times higher than the rate for White males at 19 per 100,000.
1Florida Annual Cancer Report: 2003 Incidence and Mortality

Executive
Summary
Compared to national statistics reported in the United States Cancer Statistics: 2003 Incidence and Mortality, Florida’s 2003 age-adjusted mortality rates for all cancers combined for all race groups stratifi ed by sex were lower than the national mortality rates in 2003.
Compared to the 2003 national mortality statistics from SEER, Florida’s age-adjusted mortality rates for all cancers combined were lower than national mortality rates for both sexes and races, and all sex-race groups. The Florida rates were between 11 percent lower for White males and 18 percent lower for Black males than national mortality rates.
Florida hospitals reported 86,006 hospital discharges with cancer as the primary diagnosis. Cancer patients stayed in hospitals a total of 609,516 days in 2003. Total charges for inpatient cancer hospitalizations were $2.82 billion. Including charges for patients with cancer as a secondary diagnosis more than doubles the total hospital charges for cancer to $5.9 billion.
2 Florida Annual Cancer Report: 2003 Incidence and Mortality
INTRODUCTIONBACKGROUND AND HISTORY
The Florida Department of Health publishes the Florida Annual Cancer Report every year to provide the most recent information about cancer incidence and mortality in Florida. The Florida Department of Health’s Bureau of Epidemiology, in collaboration with the Florida Cancer Data System (FCDS), publishes this epidemiological series.
Cancer incidence data are collected, verifi ed, and maintained by the FCDS, Florida’s statewide cancer registry. The FCDS is administered by the Florida Department of Health and operated by the Sylvester Comprehensive Cancer Center at the University of Miami Leonard M. Miller School of Medicine.
The FCDS began operation with a pilot project for cancer registration in 1980 and commenced statewide collection of cancer incidence data from all Florida hospitals in 1981. The FCDS now collects incidence data from hospitals, freestanding ambulatory surgical centers, radiation therapy facilities, pathology laboratories, and dermatopathologists’ offi ces. More information about cancer incidence and mortality in Florida can be found on the Department of Health’s Bureau of Epidemiology web site at www.doh.state.fl .us/disease_ctrl/epi/cancer/CancerIndex.htm, or the FCDS web site at www.fcds.med.miami.edu.
PURPOSE
The purpose of this report is to present an overview of cancer in Florida for researchers, policymakers, health professionals, and the public. This publication is intended as a tool for health care planning and for the design of cancer prevention programs. The information in this report should stimulate cancer research and advance the state’s cancer control and surveillance activities, resulting in improved treatment for cancer patients and a better understanding of cancer prevention in the population at risk for developing cancer. The Florida Department of Health and the FCDS welcome suggestions for enhancing the utility of this report to its readers.
INTRODUCTION TO CONTENTS
The format of this report remains similar to the last report, Florida Annual Cancer Report: 2002 Incidence and Mortality. Cancer incidence and mortality data are presented in separate sections, with counts and rates provided by sex, race, age group, and county. County incidence and mortality data are provided for the total population of each county for the nine reported cancers, with both sexes and all races combined. To quantify changes in cancer incidence and mortality rates over time, the average annual percent change (AAPC) in age-adjusted rates from 1994 to 2003 is included in both sections.
Stage at diagnosis is a key factor in the prognosis of cancer. This report presents data on cancer stage from 1981 through 2003. Additional fi gures show the percentage of advanced stage cases by sex, race, and age group for individual cancers. These data may help to identify areas where further targeted screening, prevention, and educational efforts may be most effective.
The mortality section includes data on years of potential life lost (YPLL) to cancer and other causes of premature death, and deaths-to-cases ratios. The years of potential life lost measures the years of life lost from death before age 75, and illustrates the cost of productive
Intro
3Florida Annual Cancer Report: 2003 Incidence and Mortality

years lost to premature death (before age 75) and the need to reduce those costs. Deaths-to-cases ratios are indicators of the prognosis for various cancers.
The cancer screening section presents data from the Florida Behavioral Risk Factor Surveillance System (BRFSS). Data on the prevalence of screening for breast, cervical, colorectal, and prostate cancers provide a means of assessing the effectiveness of efforts to promote cancer screening for early detection.
The section on tobacco-related cancers is presented to track the progress in eradicating a well-known preventable risk behavior. This section contains fi gures showing prevalence of current smoking, and incidence and mortality rates for the cancers associated with tobacco smoking. A table showing smoking-attributable cancer deaths and smoking-attributable potential life lost by county has been added to this section.
Data on the number of hospitalizations, length of hospital stay, and hospital charges for inpatients with cancer are included in an effort to describe one component of the burden of cancer in Florida. The data are derived from Agency for Health Care Administration (AHCA) discharge records and tabulated only when cancer is coded as the principal diagnosis. Although hospitalizations only account for a fraction of the overall burden of cancer, these data provide a measurement of one substantial component of that burden, the burden of cancer on hospitals.
ADJUSTMENTS SINCE THE LAST CANCER REPORT
The cancer screening section has been expanded to include trend data on the prevalence of cancer screening tests for breast, cervical, colorectal, and prostate cancers.
In previous reports, the term “Estimated Annual Percent Change (EAPC)” was used to quantify changes in cancer incidence and mortality rates over time. In this report, the term “Average Annual Percent Change (AAPC)” will be used rather than the EAPC to be consistent with that in the Surveillance Epidemiology End Results (SEER). The SEER Program of the National Cancer Institute (NCI) is an authoritative source of information on cancer incidence and survival in the United States.
Non-melanoma skin cancers, ICD-O-3 codes C44._ are included in the Florida total incidence counts and rates for the fi rst time in this report. The majority of these cancers are basal and squamous cell carcinomas of the non-genital skin, which are common, curable, and not reportable to the FCDS based on federal and state statutes. However, basal and squamous cell carcinomas occurring on the genital skin are reportable to the FCDS, as are other non-melanoma skin cancers such as Merkel cell carcinoma, mycosis fungoides, and sebaceous and sweat gland carcinomas. The inclusion of these cancers adds 281 cases to the total new cases for 2003, and increases the age-adjusted incidence rate for all cancers combined in Florida by 1.3 cases per 100,000 population. This addition allows Florida rates to be in accordance with rates published by other states and the SEER. For mortality, the non-melanoma skin cancers are not included in analyses due to the unavailability of morphology codes to distinguish between non-genital skin and genital skin cancers. Cancer mortality data are obtained from the Florida Department of Health, Offi ce of Vital Statistics in which ICD-9 code 173 and ICD-10 codes C44._ include basal and squamous cell carcinomas of genital and non-genital origins.
New to the section on tobacco-related cancers are fi gures of prevalence of current smoking from 1986 to 2005 and a table of smoking attributable cancer deaths and years of potential life lost in 2003 for measuring the burden of cigarette smoking at county the level.
Intro
4 Florida Annual Cancer Report: 2003 Incidence and Mortality

METHODS
SOURCES OF DATA
Incidence
The FCDS provided data on cancer incidence and stage at diagnosis for this report. Hospitals, pathology laboratories, ambulatory surgical centers, radiation therapy facilities, and physicians’ offi ces report new cancer cases to the FCDS.
The incidence rates are based on cancers diagnosed in Florida residents during 2003. The data do not include cancers diagnosed before a person became a Florida resident. The majority of cancer cases among Florida residents diagnosed in other states are captured in the FCDS database through sharing of cancer incidence data among states, according to the North American Association of Central Cancer Registries (NAACCR) Procedure Guidelines (page 2, Series I, Data Exchange). Cases are tallied according to the year of initial diagnosis. Persons with multiple primary cancers contribute multiple records to the database.
The FCDS has implemented various case-fi nding strategies to ensure the completeness of the database. New procedures are introduced to adapt to changes in the diagnosis and treatment of cancer in outpatient settings.
A procedure referred to as "mortality follow-back” has been implemented to identify possible unreported cancer cases from death data. Death certifi cates are checked annually to identify cancer-related deaths and possible missed reportable cases. If a cancer-related death is found without a matching incidence record, it is investigated to obtain a cancer incidence abstract. An incidence record is created based on information from the death certifi cate only when information regarding a cancer-related death is not available from the hospital or physician. Death-certifi cate-only cases are included in the FCDS database for all years since 1991.
A similar process implemented by the FCDS in 1995 uses hospital discharge data from the Agency for Health Care Administration (AHCA) to identify missed cases. All hospital discharge records for patients in Florida with a diagnosis of cancer are compared to the FCDS database. Cancer cases that are identifi ed in the AHCA data, and that are missing in the FCDS cancer database, are “followed back” to the hospital to obtain complete reports. The “follow-back” procedure has also been employed to ascertain new cancer cases from ambulatory surgical centers since 1997.
The NAACCR has established guidelines to evaluate data from its member registries. Six criteria measure data quality, timeliness, and completeness. The FCDS has achieved the highest standard defi ned by NAACCR and received “Gold Certifi cation” for quality, completeness, and timeliness for the data collected each year from 2000 through 2003.
Hospital Discharge
The AHCA provided hospital inpatient discharge data that include length of hospital stay and charges for inpatient cancer treatment. All acute care hospitals and short-term psychiatric hospitals licensed under Chapter 395, Florida Statutes are required to report inpatient discharge data to the AHCA. Cancer discharges are defi ned as those for which the principal diagnosis is cancer. These data are presented by patients' county of residence at diagnosis as well as by sex and race.
Methods
5Florida Annual Cancer Report: 2003 Incidence and Mortality

Mortality
The Offi ce of Vital Statistics of the Florida Department of Health provided information on cancer deaths in Florida from death certifi cates. Cancer deaths are defi ned as those for which the underlying cause of death on the death certifi cate is cancer. The underlying cause of death is coded according to the International Classifi cation of Diseases, Tenth Edition (ICD-10). All deaths with an underlying cause in the ICD-10 code range from C00 through C97.
Population
The Florida Consensus Estimating Conference provided population estimates for 2003 as well as adjusted population estimates for 1981 to 2002. Population fi gures for 2003 are presented in Appendix A.1 for the state and for each sex, race, and age group, and in Appendix A.2 for Florida counties. Appendix B shows population by race and sex from 1981 to 2003.
The 2000 United States standard million population was fi rst used for the 1998 Florida Annual Cancer Report to calculate age-adjusted incidence and mortality rates, following national reporting guidelines. Incidence and mortality rates standardized to the 2000 U.S. standard million population cannot be compared to rates standardized to another population; for example, the 1970 U.S. standard population. Therefore, the age-adjusted rates reported here cannot be meaningfully compared to those displayed in Florida Annual Cancer Reports prior to 1998. For trend analyses, all rates in this report have been age-adjusted to the 2000 standard. For more information about the differences in rates due to age-adjustment with these standard populations, see “Age-adjusting to the Year 2000 Standard” under the heading “Education and Training, Training Modules Online” at the NAACCR web site at www.naaccr.org.
Cancer Screening and Current Smoking Prevalence
Since 1986, the Florida Behavioral Risk Factor Surveillance System (BRFSS) survey has collected data on the prevalence of cancer screening among Floridians. The Florida BRFSS is an anonymous telephone survey of adults age 18 years and older in households with telephones. It is part of a larger, ongoing surveillance sponsored by the Centers for Disease Control and Prevention (CDC) to survey and monitor major behavioral risks for premature morbidity and mortality among adults. Respondents are randomly selected to insure that survey data are representative of all adults. More information about the Florida BRFSS can be found on the DOH website at: www.doh.state.fl .us/disease_ctrl/epi/brfss/index.htm.
Survey respondents were asked if they ever had certain cancer screening tests, and when their last screening examinations occurred. For breast cancer, females age 40 and older were asked if they received a mammogram test or a clinical breast examination. Females age 18 and older were surveyed regarding PAP smear testing for cervical cancer. For colorectal cancer, residents age 50 and older were asked about sigmoidoscopy and colonoscopy examination, and fecal occult blood tests (FOBT). For prostate cancer, males age 40 and older were asked about PSA (prostate-specifi c antigen) testing and digital rectal examination.
The prevalence of current smoking was estimated based on the BRFSS survey. Adults who had smoked at least 100 cigarettes in their life and were smoking on some days or all days in the past 30 days when the surveys were conducted were considered current smokers.
Methods
6 Florida Annual Cancer Report: 2003 Incidence and Mortality

DEFINITIONS
Age-adjusted Rates Age is an important factor in cancer incidence and mortality. Since cancer occurs more often in the elderly, populations with a high proportion of older people will have more cancer cases and deaths than populations with a high proportion of younger people. Because age distributions differ greatly among Florida counties and races, the impact of age is normalized in order to make valid comparisons of incidence and mortality. Age adjustment is a process to correct for the differences in cancer cases and death counts caused by differing age composition among different populations and counties. The direct method of age adjustment is used to calculate age-adjusted incidence and mortality rates in this report. The standard population used in this report is the 2000 U.S. standard population, in accordance with the 1998 U.S. Department of Health and Human Services recommendation. The age-adjusted rate ( ) is defi ned as:
= ( iwi)
where i is the age group, i is the age-specifi c rate for an age group, and w
i is the proportion of
individuals in the 2000 U.S. standard population in that age group.
Age-specifi c Rates
The age-specifi c rate is the number of new cancer cases or deaths occurring in persons in a given age group divided by the population in that age group in a given period expressed per 100,000 persons. For the rate calculations in this report, age groups are defi ned by each fi ve-year interval of age: 0 to 4, 5 to 9, 10 to 14, etc. The age specifi c rate ( i) is calculated as:
i=ni/p
i x 100,000
where i is the age group, ni is the number of new cancer cases (or deaths) in the age group in a
given period, and pi is the population at risk in the age group in the same period.
Average Annual Percent Change
The Average Annual Percent Change (AAPC) is the average change in incidence or mortality rates over a period. The assumption of the AAPC calculation is that the change in rates over time is either increasing or decreasing with only small variations. The AAPC values are calculated for each site using regression procedures to fi t a linear weighted least squares model to the log of the age-adjusted rates in the period. The AAPC is calculated as:
AAPC=100*eb -1
where b is the slope of the model ln(rate)= a+b*(year)+e, a is a constant, and e is the error term.
The data in the most recent 10-year period are analyzed to give a reliable and current estimate for the AAPC. The statistical signifi cance of the AAPC is tested at a 5 percent level.
Methods
7Florida Annual Cancer Report: 2003 Incidence and Mortality

Childhood Cancers
Childhood cancers are defi ned as those that occur in children from birth to age 14. Some childhood cancers, such as Wilms tumors, can be identifi ed for incidence, but not for mortality. This report includes only the broader categories of childhood cancers permitted by the ICD-10 classifi cation. Incidence and mortality rates for childhood cancer are computed per 1,000,000 children age 14 or younger.
Comparison of Rates
Age-adjusted incidence and mortality rates are compared for differences between subpopulations. In this report, the difference between two rates is considered to be statistically signifi cant when the 95 percent confi dence intervals of two rates do not overlap.
Confi dence Intervals
Confi dence intervals provide a measure of accuracy of a calculated rate or prevalence. In this report, 95 percent confi dence intervals were calculated for cancer incidence and mortality rates, and for prevalence of cancer screening and cigarette smoking. A 95 percent confi dence interval is the range within which the true rate will be found 95 percent of the time. A narrower confi dence interval indicates greater accuracy of the rate. Calculation of the 95-percent confi dence interval follows the methods published in Technical Appendix from Vital Statistics of United States: Mortality, National Center for Health Statistics, 1995.
County of Residence
In this report, the geographical area of analysis was the county of residence at the time each cancer was diagnosed. For the purpose of brevity and clarity in section and table titles, the county of residence at diagnosis is referred to as “County” throughout this report.
Crude Rates
The crude rate is the total number of new cancer cases diagnosed, or cancer deaths, in Florida residents in a given period divided by the total population at risk in that period. Crude rates are expressed per 100,000 persons per year. The calculation of the crude rate (m) can be written as:
m=N/P x 100,000
where N is the total number of new cases or deaths in a period, and P is the population at risk in the same period.
Deaths-to-Cases Ratios
The deaths-to-cases ratios in the mortality section of this report are calculated by dividing the number of deaths in a given year by the number of new cancers diagnosed in the same year. The deaths-to-cases ratio provides a simplifi ed indication of the prognosis for patients with different types of cancer. A lower ratio indicates fewer deaths relative to the number of cases and suggests a better prognosis. A ratio approaching 1.0 indicates a poor prognosis. Ratios greater than 1.0 are possible when deaths due to cancers diagnosed in previous years cause the number of deaths to exceed the number of new cancers diagnosed in a particular year.
Methods
8 Florida Annual Cancer Report: 2003 Incidence and Mortality

Incidence
Incidence is defi ned as the number of new cancers diagnosed in the population at risk in 2003. The population considered at risk for cancer in this report is the entire resident population of Florida in 2003. Specifying other population characteristics, such as sex, race, age, or county of residence further subdivides the population at risk of developing cancer.
Mortality
Mortality is defi ned as the number of deaths from cancer in the population at risk in 2003. A cancer death is defi ned as a death for which cancer is listed as the underlying cause of death on the death certifi cate. The population considered at risk in this report is the average entire resident population of Florida in 2003. Mortality is further examined based on sex, race, age, and county of residence.
Prevalence
In this report, cancer screening and current cigarette use prevalence data were analyzed from the Florida BRFSS. Prevalence is defi ned as the proportion of people who have received cancer screening or who currently smoke cigarettes in Florida's population at the time of survey. The prevalence data were weighted to represent the entire adult population of the state. Data weighting is a statistical procedure that incorporates factors such as: (1) the probability of the interviewee being selected for the survey; and (2) the sex, race, and age distribution of the population. Since the Florida BRFSS survey is a random survey, sampling errors are inherent and a 95-percent confi dence interval (CI) was calculated for each prevalence estimate.
Race
The FCDS collects information on the racial and ethnic background of each person diagnosed with cancer in Florida. In this report, comparisons are made between two race groups, Black and White. Both Black and White races include persons of various ethnic origins. The remaining race groups account for 2.5 percent of the population and less than 1 percent of cancer cases diagnosed in Florida in 2003. Cancers in persons of “Other” races are included in Florida total rates and counts, as well as in the totals by sex.
Smoking–Attributable Cancer Deaths
Smoking-attributable deaths were calculated using the methodology developed by the CDC. The methods involve calculation of smoking attributable fractions (SAFs) of deaths for smoking-related cancers using sex-specifi c smoking prevalence and relative risk (RR) of death data for current and former smokers aged 35 and older. SAFs for each disease and sex are derived from the following formula:
SAF = [(p0 + p
1(RR
1) + p
2(RR
2)) - 1] / [p
0 + p
1(RR
1) + p
2(RR
2)]
Where p0 is the percentage of adult never smokers, p
1 is the percentage of adult current smokers,
p2 is the percentage of adult former smokers, RR
1 is the relative risk of death for adult current
smokers relative to adult never smokers, and RR2 is the relative risk of death for adult former
smokers relative to adult never smokers.
The smoking attributable deaths (SAD) are then calculated by multiplying the age- and sex-specifi c SAFs and the number of deaths for each smoking-related cancer:
SAD = Number of deaths X SAF
Methods
9Florida Annual Cancer Report: 2003 Incidence and Mortality

Summing across age categories provides the sex-specifi c estimate of SAD for each disease. Total SAD is the sum of the sex-specifi c SAD estimates.
The SAD estimates for each age category, stratifi ed by sex and grouped by underlying disease category, are multiplied by the remaining life expectancy of people at the midpoint of each age range. The resulting numbers for all age categories are summed to obtain years of potential life lost attributable to smoking (YPLL). The total YPLL is the sum of the male and female YPLL within each disease category.
The details of the methodology, including the relative risks by sex and age group, can be found at CDC web site: http://apps.nccd.cdc.gov/sammec/methodology.asp
Stage of Cancer
Advanced-stage cancer is defi ned in this report as regional stage cancer and distant stage cancer. Regional stage cancer is cancer that has grown beyond the primary (original) site to nearby lymph nodes, organs, or tissues. Distant stage cancer refers to cancer that has spread from the primary (original) site to distant organs or distant lymph nodes. Hematopoetic diseases, such as leukemia and multiple myeloma, are considered distant stage.
In situ cancers are tumors that fulfi ll all the microscopic criteria for malignancy except invasion through the basement membrane. In situ cancers are considered early cancers that have not spread to neighboring tissue. Classifi cation of these tumors is not uniform across pathologists (Schottenfeld and Fraumeni, 1996, page 159), yielding less reliable reporting of in situ cancers than of later-stage cancers. Therefore, cancer incidence fi gures reported here exclude in situ cancers except for bladder cancer. For all other cancer sites, local, regional, distant, and cancers of unknown stage are included in the counts and the incidence rates.
Suppression Of Data
In this report, cells in the tables with fewer than 10 cases or deaths, and rates calculated from fewer than 10 cases or deaths, are suppressed. When the number of cases or deaths is very small, the rates calculated are not stable. In addition, suppressing small numbers prevents possible identifi cation of individuals, ensuring patient confi dentiality.
Years of Potential Life Lost
Counts or rates of incidence and mortality represent part of the burden of cancer. There are indirect costs to society due to cancer, such as diminished quality of life and years of potential life lost (YPLL). The YPLL is a measurement of life lost due to premature death from cancer. Department of Health publications such as Vital Statistics and Data Analysis use age 75 as the average life expectancy in the YPLL calculations. For consistency, the same standard is used in this report. For a Florida resident who died at age 74 or younger, the YPLL is calculated by subtracting age at death from 75. The individual YPLL numbers are then summed to generate the total YPLL.
CLASSIFICATION
The cancer sites for which incidence data are presented are classifi ed according to the International Classifi cation of Diseases for Oncology, Third Edition (ICD-O-3). The International
Methods
10 Florida Annual Cancer Report: 2003 Incidence and Mortality

Classifi cation of Diseases, Tenth Revision (ICD-10), is used to code cancer deaths, and the International Classifi cation of Diseases, Ninth Revision, Clinical Modifi cation (ICD-9-CM) is used for classifi cation of diagnoses in hospitals.
Rules for coding multiple tumors in one individual as a single cancer or as multiple primary cancers are specifi ed in the Surveillance, Epidemiology and End Results (SEER) Program Code Manual, National Institutes of Health, 1998. The site of origin, diagnosis dates, histology, and laterality are the major factors employed to determine if a group of tumors should be coded as single or multiple. Special rules are used to defi ne multiple primaries of the lymphatic and hematopoetic systems.
REPORTED CANCER SITES
Major Sites
In this report, analysis is limited to the eight cancer sites and groups with the highest number of incident cases, plus cervical cancer. The top eight sites – lung and bronchus, prostate, female breast, colorectal, bladder, head and neck, non-Hodgkin lymphoma, and melanoma – account for 70 percent of the incident cancers in Florida in 2003. Cervical cancer is included as the ninth site because of the availability of a screening test and the potential to reduce late stage occurrences and early deaths from this cancer. Cancer of the cervix has the highest average years of potential life lost of the nine cancers reported in 2003.
Cancer of the pancreas is one of the top eight cancers in terms of mortality, but not incidence. To maintain consistency, pancreatic cancer is not presented individually in this report, except in Figures 1-2 and 15-16, where a comprehensive set of 22 cancers is displayed by percentage of new cases and deaths.
Data on melanoma among Blacks are included only in Figures 1-2 and 15-16, and as part of total counts and rates for Florida. There are only 25 new cases and 10 deaths from melanoma reported among Blacks; these numbers are too small to perform any reliable analysis. For similar reasons, 235 new cases and 26 deaths from breast cancer in males are omitted from analyses, except as part of total counts and rates.
Other Sites
The “All Other” cancer site category used in Figures 1-2 and 15-16 includes the following types of cancer: small intestine, anus, intrahepatic bile duct, gallbladder, other biliary, retroperitoneum, peritoneum, omentum, mesentery, other digestive organs, bones and joints, soft tissue and heart, nasal cavity, accessory sinuses, pleura, trachea, mediastinum and other respiratory organs, uterus NOS, vagina, vulva, other female genital organs, testis, penis, and other male genital organs, ureter and other urinary organs, eye and orbit, thymus and other endocrine glands, Hodgkin disease, mesothelioma, Kaposi sarcoma, and ill-defi ned and unspecifi ed sites. The ICD-O-3 codes and ICD-10 codes for these and other sites used in the report are shown in Appendix D.
Methods
11Florida Annual Cancer Report: 2003 Incidence and Mortality

Tobacco-Related Cancers
The 2004 Surgeon General Report, Health Consequences of Smoking: A Report of the Surgeon General (http://www.cdc.gov/Tobacco/sgr/sgr_2004/index.htm), presents strong scientifi c evidence that many cancers are associated with tobacco use. These cancers are acute myeloid leukemia, and cancers of lip, oral cavity and pharynx, pancreas, trachea, lung and bronchus, larynx, esophagus, cervix, bladder, kidney, and stomach.
Methods
12 Florida Annual Cancer Report: 2003 Incidence and Mortality

CANCER INCIDENCE
NEW CASES
• In 2003, a total of 94,910 new primary cancers were diagnosed in Florida residents Compared to 2002, the number of new cases decreased by 1,148 cases, or 1.2 percent.
This is the second consecutive year that total new cancer cases have declined in Florida.
Sex and Race
• Of the new cancer cases in 2003, 8.6 percent were diagnosed in Blacks, and 90 percent in Whites. The remaining 1.4 percent were diagnosed in persons of other races or reported without race information.
• Fifty-three percent of new cancers were diagnosed in males and 47 percent diagnosed in females. There were 39 cases with unknown sex.
AllCancers
Lung & Bronchus Prostate Breast Colorectal Bladder
Head & Neck
Non-Hodgkin (1) Melanoma Cervix
Florida (2) 94,910 15,768 12,817 11,933 10,620 4,836 3,667 3,590 3,181 840
Female 44,440 7,079 11,933 5,178 1,233 1,009 1,639 1,217 840Male 50,431 8,678 12,817 5,438 3,601 2,657 1,949 1,963
Black 8,171 1,120 1,550 1,077 936 157 316 260 131White 85,045 14,479 11,063 10,607 9,480 4,607 3,283 3,254 3,115 686
Black Female 3,854 395 1,077 503 57 73 127 131White Female 39,737 6,612 10,607 4,578 1,152 914 1,478 1,188 686Black Male 4,315 725 1,550 432 100 242 133 White Male 45,276 7,858 11,063 4,899 3,453 2,369 1,775 1,926 Source of data: Florida Cancer Data System(1) Non-Hodgkin refers to Non-Hodgkin lymphoma throughout this report.(2) Florida totals throughout this report include 710 new cancers in persons of "Other" races, 984 cases with unknown race, 39 cases with unknown sex, and 3 cases with unknown age. Totals by sex include unknown age, race and Other races; totals by race include unknown sex and age.
Table 1. Number of New Cancer Cases by Sex and Race, Florida, 2003
• The four most common cancers in Floridians were lung and bronchus, prostate, breast, and colorectal cancers, which accounted for 57 percent of all new cases in Blacks, and 54 percent in Whites.
• Breast, colorectal, lung and bronchus and uterine cancers were the most common cancers among Black females, accounting for 56 percent of total cancer cases.
• The most common cancers among White females were the same cancer sites for Black females, but in a different sequential order of cancer occurrence: breast cancer, cancer of the lung and bronchus, colorectal cancer, and uterine cancer. These cancers accounted for 60 percent of total cancer cases among White females.
• Prostate, lung and bronchus, colorectal, and head and neck cancers were the most common cancers among Black males. These cancers accounted for 68 percent of total cancer cases in Black males.
Methods
13Florida Annual Cancer Report: 2003 Incidence and Mortality

Incidence
• The four most common cancers among White males were prostate, lung and bronchus, colorectal, head and neck and bladder cancers. These cancers accounted for 60 percent of total cancer cases among White males.
Source of data: Florida Cancer Data System
Figure 1. Percentage of New Cancers by Sex, Race, and Site, Florida, 2003
Female
3.0
0.6
9.1
0.5
1.2
2.9
2.3
2.3
2.4
1.0
2.4
1.1
3.4
3.7
2.7
1.7
4.7
16.7
11.6
26.8
1.0
1.2
1.5
1.9
2.0
2.3
2.6
2.7
3.1
3.1
3.3
3.4
3.4
4.7
10.3
13.1
28.0
11.5
0.6
0.6
Breast
Colorectal
Lung & Bronchus
Uterus
Cervix
Pancreas
Non-Hodgkin
Ovary
Stomach
Thyroid
Multiple Myeloma
Kidney
Leukemia
Head & Neck
Bladder
Brain & Nervous
Esophagus
Liver
Melanoma
All Other Cancers
Male
36.1
16.9
10.1
5.6
3.1
2.8
2.7
2.4
1.3
1.6
0.4
0.1
8.8
2.3
2.0
1.8
1.7
9.3
4.3
0.8
1.4
1.5
2.6
1.4
1.1
7.7
2.5
1.6
3.5
3.9
5.3
10.9
17.4
24.5 Prostate
Lung & Bronchus
Colorectal
Head & Neck
Non-Hodgkin
Kidney
Stomach
Pancreas
Bladder
Multiple Myeloma
Liver
Leukemia
Esophagus
Brain & Nervous
Thyroid
Melanoma
All Other Cancers
Black White
14 Florida Annual Cancer Report: 2003 Incidence and Mortality

Incidence
County
• The number of new cancer cases in Florida’s fi ve most populous counties (Broward, Miami-Dade, Hillsborough, Pinellas and Palm Beach) which had 43 percent of Florida's population accounted for 40 percent of the new cancer cases in Florida in 2003.
MAP OF FLORIDA, 2003
Note: County populations are listed in Appendix A.2
15Florida Annual Cancer Report: 2003 Incidence and Mortality

Incidence
AllCancers
Lung & Bronchus Prostate Breast Colorectal Bladder
Head & Neck
Non-Hodgkin Melanoma Cervix
Florida 94,910 15,768 12,817 11,933 10,620 4,836 3,667 3,590 3,181 840
Alachua 897 160 109 133 102 24 33 32 26 ^
Baker 93 19 13 12 11 ^ ^ ^ ^ ^
Bay 729 144 94 100 86 39 33 25 24 ^
Bradford 99 17 10 15 15 ^ ^ ^ ^ ^
Brevard 3,301 570 449 415 335 219 109 112 122 25
Broward 8,635 1,391 950 1,110 1,031 454 293 356 264 76
Calhoun 51 20 ^ ^ ^ ^ ^ ^ ^ ^
Charlotte 1,219 217 191 138 128 72 59 47 20 ^
Citrus 1,044 225 170 131 110 38 41 33 27 ^
Clay 689 139 84 92 90 24 26 17 28 ^
Collier 1,918 269 355 203 175 117 68 79 91 15
Columbia 295 66 23 35 38 12 11 ^ 13 ^
Miami-Dade 10,419 1,184 1,627 1,334 1,313 421 396 429 237 154
DeSoto 155 25 23 20 26 ^ ^ ^ ^ ^
Dixie 97 26 ^ 14 ^ ^ ^ ^ ^ ^
Duval 3,562 602 502 457 381 159 148 121 93 38
Escambia 1,513 265 216 234 133 64 70 62 42 11
Flagler 529 81 95 83 55 26 19 18 11 ^
Franklin 52 14 ^ ^ ^ ^ ^ ^ ^ ^
Gadsden 226 40 34 33 18 11 14 ^ ^ ^
Gilchrist 69 17 ^ ^ 10 ^ ^ ^ ^ ^
Glades 28 ^ ^ ^ ^ ^ ^ ^ ^ ^
Gulf 79 12 ^ 10 12 ^ ^ ^ ^ ^
Hamilton 33 ^ ^ ^ ^ ^ ^ ^ ^ ^
Hardee 128 21 21 18 ^ ^ ^ ^ ^ ^
Hendry 148 34 14 ^ 14 ^ ^ ^ ^ ^
Hernando 1,230 257 181 123 145 78 41 42 36 11
Highlands 793 153 111 88 86 41 39 26 20 ^
Hillsborough 4,913 758 655 638 548 216 174 180 183 55
Holmes 68 10 ^ ^ ^ ^ ^ ^ ^ ^
Indian River 896 167 117 74 125 47 31 28 39 ^
Jackson 156 28 20 10 22 ^ ^ ^ 10 ^
Jefferson 75 ^ 11 12 ^ ^ ^ ^ ^ ^
Lafayette 31 ^ ^ ^ ^ ^ ^ ^ ^ ^
Lake 2,066 342 292 250 218 123 86 89 80 12
Lee 3,199 559 459 392 301 170 135 127 151 22
Leon 807 119 109 119 85 25 31 34 24 ^
Levy 231 48 29 18 30 ^ 16 ^ ^ ^
Liberty 33 ^ ^ ^ ^ ^ ^ ^ ^ ^
Madison 82 17 11 ^ 10 ^ ^ ^ ^ ^
Manatee 1,816 331 241 203 231 102 69 76 33 12
Marion 2,016 408 269 255 251 99 65 68 56 ^
Martin 1,112 202 180 144 120 61 41 30 55 ^
Monroe 422 85 30 49 53 13 28 13 22 ^
Nassau 316 58 45 33 34 10 13 13 11 ^
Okaloosa 883 157 116 112 99 59 30 34 31 ^
Okeechobee 242 51 33 24 19 12 13 10 ^ ^
Orange 4,035 600 588 554 423 167 168 146 126 51
Osceola 848 140 102 123 88 32 27 34 31 11
Palm Beach 8,122 1,204 970 1,025 823 548 317 351 389 56
Pasco 2,924 525 431 311 332 173 113 96 86 21
Pinellas 6,208 1,145 751 786 734 364 267 194 198 53
Polk 3,266 554 419 442 352 156 105 130 136 30
Putnam 458 110 53 55 49 17 22 19 12 ^
Saint Johns 724 133 93 108 76 36 32 31 31 ^
Saint Lucie 1,267 250 185 132 147 57 48 47 42 12
Santa Rosa 659 118 96 102 71 35 46 15 22 ^
Sarasota 2,881 525 384 371 334 180 109 116 98 13
Seminole 1,573 223 249 225 151 84 47 63 60 18
Sumter 475 110 49 47 57 25 15 21 11 ^
Suwannee 206 43 27 31 20 11 ^ 14 ^ ^
Taylor 103 25 13 12 12 ^ ^ ^ ^ ^
Union 147 36 16 ^ ^ ^ 14 ^ ^ ^
Volusia 3,253 617 419 373 386 135 124 118 99 25
Wakulla 103 15 10 16 ^ ^ ^ ^ ^ ^
Walton 187 38 18 23 18 ^ ^ ^ ^ ^Washington 76 19 ^ ^ 12 ^ ^ ^ ^ ^
^ Statistics are not displayed for cells with fewer than 10 cases. Source of data: Florida Cancer Data System
Table 2. Number of New Cancer Cases by County, Florida, 2003
16 Florida Annual Cancer Report: 2003 Incidence and Mortality

Incidence
Age
• Cancer occurs predominantly among older people. Sixty-two percent of new cancer cases in 2003 were diagnosed in persons age 65 and older. This group accounts for 18 percent of Florida’s population.
• Among Blacks, the 45 to 64 age group had more cancers diagnosed than any other age group; for Whites, the 75 and older age group had the highest number of new cases.
• Cervical cancer in both races occurred more frequently in females age 20 to 64 than in older age groups.
• Breast cancer in both races occurred more frequently in females age 45 to 64 than in older age groups.
• Melanoma in White females was more frequently diagnosed in 45 to 64 year olds than in older age groups.
17Florida Annual Cancer Report: 2003 Incidence and Mortality

Incidence
Source of data: Florida Cancer Data System
Figure 2.1 Percentage of New Cancers by Sex, Race, and Site, Age 15-64, Florida, 2003
Female
4.10.4
7.5
0.3
1.6
1.3
0.8
1.8
1.4
2.6
2.2
0.7
3.9
3.1
5.8
4.8
3.5
12.4
7.334.4
0.6
0.91.2
1.8
1.9
2.0
2.1
2.2
2.5
3.2
3.83.9
4.3
4.6
8.4
11.4
34.5
10.0
0.4
0.5
Breast
Colorectal
Lung & Bronchus
Cervix
Uterus
Non-Hodgkin
Thyroid
Ovary
Head & Neck
Kidney
Multiple Myeloma
Stomach
Leukemia
Pancreas
Esophagus
Bladder
Brain & Nervous
Liver
Melanoma
All Other Cancers
Male32.8
15.6
9.7
7.2
4.7
3.0
2.7
2.4
1.2
1.7
0.5
0.1
10.7
2.0
1.8
1.8
1.7
11.1
5.3
1.5
2.0
2.5
4.8
1.7
1.0
1.4
2.0
2.2
4.1
4.6
8.0
9.7
15.4
22.3 Prostate
Lung & Bronchus
Colorectal
Head & Neck
Non-Hodgkin
Kidney
Pancreas
Liver
Stomach
Multiple Myeloma
Esophagus
Bladder
Leukemia
Brain & Nervous
Thyroid
Melanoma
All Other Cancers
Black White
18 Florida Annual Cancer Report: 2003 Incidence and Mortality
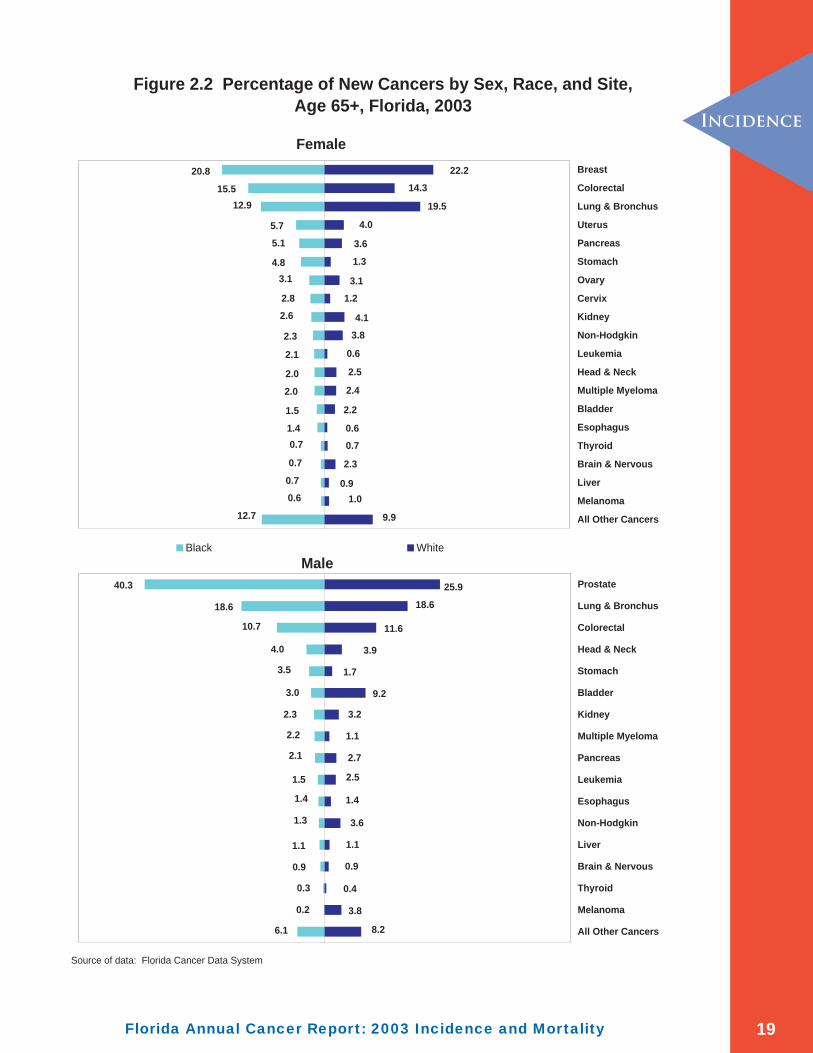
Incidence
Source of data: Florida Cancer Data System
Figure 2.2 Percentage of New Cancers by Sex, Race, and Site,Age 65+, Florida, 2003
Female
1.00.9
9.9
2.3
0.7
0.6
2.2
2.4
2.5
0.6
3.8
4.1
1.2
3.1
1.3
3.6
4.0
19.5
14.3
22.2
0.7
0.71.4
1.5
2.0
2.0
2.1
2.3
2.6
2.8
3.14.8
5.1
5.7
12.915.5
20.8
12.7
0.6
0.7
Breast
Colorectal
Lung & Bronchus
Uterus
Pancreas
Stomach
Ovary
Cervix
Kidney
Non-Hodgkin
Leukemia
Head & Neck
Multiple Myeloma
Bladder
Esophagus
Thyroid
Brain & Nervous
Liver
Melanoma
All Other Cancers
Male40.3
18.6
10.7
4.0
3.5
3.0
2.3
2.2
0.9
1.1
0.3
0.2
6.1
2.1
1.5
1.4
1.3
8.2
3.8
0.4
0.9
1.1
3.6
1.4
2.5
2.7
1.1
3.2
9.2
1.7
3.9
11.6
18.6
25.9 Prostate
Lung & Bronchus
Colorectal
Head & Neck
Stomach
Bladder
Kidney
Multiple Myeloma
Pancreas
Leukemia
Esophagus
Non-Hodgkin
Liver
Brain & Nervous
Thyroid
Melanoma
All Other Cancers
Black White
19Florida Annual Cancer Report: 2003 Incidence and Mortality

Incidence
AllCancers
Lung & Bronchus Prostate Breast Colorectal Bladder
Head & Neck
Non-Hodgkin Melanoma Cervix
Florida 94,910 15,768 12,817 11,933 10,620 4,836 3,667 3,590 3,181 840
0-19 718 ^ ^ ^ ^ ^ 16 55 26 ^ 20-44 6,320 328 69 1,212 402 101 235 361 486 335 45-64 29,169 4,476 4,122 4,890 2,708 945 1,604 1,011 961 317 65-74 26,577 5,094 5,202 2,784 2,883 1,405 942 907 741 107 75+ 32,123 5,868 3,421 3,046 4,625 2,384 869 1,256 967 81
Female 0-19 348 ^ ^ ^ ^ ^ 21 14 ^ 20-44 3,863 160 1,212 188 36 74 124 270 335 45-64 13,869 1,924 4,890 1,202 234 366 439 372 317 65-74 10,927 2,226 2,784 1,314 318 269 427 244 107 75+ 15,433 2,767 3,046 2,474 644 291 628 317 81Male 0-19 370 ^ ^ ^ ^ ^ 34 12 20-44 2,455 168 69 214 65 161 237 216 45-64 15,290 2,547 4,122 1,505 711 1,238 572 589 65-74 15,633 2,863 5,202 1,568 1,086 672 478 497 75+ 16,680 3,100 3,421 2,149 1,739 578 628 649
Black 0-19 124 ^ ^ ^ ^ ^ ^ 10 ^ 20-44 886 56 24 193 72 ^ 30 75 48 45-64 3,399 461 699 528 381 51 168 104 48 65-74 2,179 364 568 208 252 50 76 43 26 75+ 1,583 238 259 147 231 51 34 28 ^White 0-19 575 ^ ^ ^ ^ ^ ^ 43 26 ^ 20-44 5,228 267 44 984 320 92 200 276 473 279 45-64 25,143 3,956 3,337 4,253 2,258 877 1,399 883 941 257 65-74 23,921 4,673 4,552 2,518 2,562 1,332 849 843 720 78 75+ 30,176 5,582 3,127 2,852 4,338 2,305 827 1,209 955 72
Black Female 0-19 62 ^ ^ ^ ^ ^ ^ ^ 20-44 543 26 193 37 ^ 11 28 48 45-64 1,542 148 528 202 16 32 49 48 65-74 889 129 208 122 21 16 28 26 75+ 818 91 147 142 18 10 17 ^White Female 0-19 277 ^ ^ ^ ^ ^ 16 14 ^ 20-44 3,189 131 984 149 32 63 93 264 279 45-64 12,015 1,754 4,253 966 211 323 377 360 257 65-74 9,829 2,073 2,518 1,164 292 248 389 238 78 75+ 14,427 2,653 2,852 2,299 616 275 603 312 72Black Male 0-19 62 ^ ^ ^ ^ ^ ^ 20-44 343 30 24 35 ^ 19 47 45-64 1,856 313 699 178 35 136 55 65-74 1,289 235 568 130 29 59 15 75+ 765 147 259 89 33 24 11White Male 0-19 298 ^ ^ ^ ^ ^ 27 12 20-44 2,037 136 44 171 60 137 183 209 45-64 13,120 2,197 3,337 1,292 666 1,076 506 581 65-74 14,079 2,597 4,552 1,397 1,039 601 453 482 75+ 15,740 2,928 3,127 2,037 1,688 552 606 642 Source of data: Florida Cancer Data System
Table 3. Number of New Cancer Cases by Sex, Race, and Age Group, Florida, 2003
20 Florida Annual Cancer Report: 2003 Incidence and Mortality
^Statistics are not displayed for cells with fewer than 10 cases.

Incidence
AGE-ADJUSTED INCIDENCE RATES
• The age-adjusted incidence rate for all cancers combined in Florida decreased 5 percent, from 453.1 per 100,000 in 2002 to 431.6 per 100,000 in 2003.
• The Florida incidence rates were lower than the Surveillance Epidemiology End Results (SEER) rates, which reported 412 per 100,000 for females and 558 per 100,000 for males in 2000-2003.
Sex and Race
• Males had a higher age-adjusted incidence rate (503.4 per 100,000) than females (377.6 per 100,000) for all cancers combined, and for the major cancer sites in this report except the female-specifi c sites.
• Whites had higher age-adjusted incidence rates than Blacks for all cancers combined, cancers of the lung and bronchus, breast, and bladder, and non-Hodgkin lymphoma.
• Age-adjusted incidence rates in Whites were 18 percent higher than in Blacks for cancer of the lung and bronchus, and 140 percent higher for bladder cancer. Compared to 2002, the racial disparity in the incidence rate decreased by 6 percent for cancer of the lung and bronchus and by 14 percent for bladder cancer.
• Age-adjusted incidence rates were higher in White females than in Black females for all cancers combined, cancers of lung and bronchus, breast, bladder, head and neck, and non-Hodgkin lymphoma. Black females had a higher age-adjusted colorectal cancer incidence rate than did White females.
• The age-adjusted prostate cancer incidence rate was 64 percent higher in Black males than in Whites.
• Age-adjusted incidence rates for bladder cancer and non-Hodgkin lymphoma were higher among White males than among Black males.
Cancer Sites
• Prostate, breast, lung and bronchus, and colorectal cancers had the highest age-adjusted incidence rates among the major cancer sites in 2003.
• Among males, the major cancers with the highest age-adjusted incidence rates were prostate, lung and bronchus, colorectal, and bladder cancers.
• Among females, the major cancers with the highest age-adjusted incidence rate were breast, lung and bronchus, colorectal, and non-Hodgkin lymphoma.
21Florida Annual Cancer Report: 2003 Incidence and Mortality

Incidence
22 Florida Annual Cancer Report: 2003 Incidence and Mortality
Rate Rate Rate Rate RateFlorida (2) 431.6 428.8 434.4 69.1 68.0 70.2 124.4 122.2 126.6 105.8 103.9 107.8 46.6 45.7 47.5
Female 377.6 374.0 381.2 56.3 55.0 57.7 105.8 103.9 107.8 40.5 39.4 41.7
Male 503.4 499.0 507.9 85.1 83.3 86.9 124.4 122.2 126.6 54.1 52.7 55.6
Black 418.0 408.7 427.5 59.3 55.8 63.0 193.1 183.1 203.6 91.7 86.2 97.5 49.8 46.5 53.2
White 432.4 429.4 435.4 70.1 68.9 71.2 117.8 115.6 120.0 107.3 105.2 109.4 45.8 44.8 46.7
Black Female 342.1 331.2 353.3 36.4 32.8 40.3 91.7 86.2 97.5 46.4 42.4 50.8
White Female 381.9 378.0 385.9 58.5 57.0 59.9 107.3 105.2 109.4 39.5 38.3 40.7
Black Male 525.7 509.1 542.8 91.6 84.6 99.1 193.1 183.1 203.6 54.4 49.0 60.3White Male 499.8 495.2 504.5 84.5 82.7 86.5 117.8 115.6 120.0 53.6 52.1 55.1
Rate Rate Rate Rate RateFlorida (2) 20.6 20.0 21.2 17.2 16.6 17.8 16.7 16.1 17.2 17.1 16.5 17.7 9.0 8.3 9.6
Female 9.4 8.9 10.0 8.7 8.2 9.3 13.7 13.0 14.4 13.2 12.4 13.9 9.0 8.3 9.6
Male 35.3 34.2 36.5 27.1 26.1 28.2 20.1 19.2 21.0 22.3 21.3 23.3
Black 9.0 7.6 10.5 15.1 13.4 16.9 11.9 10.4 13.5 10.7 8.9 12.8
White 21.6 21.0 22.2 17.4 16.8 18.0 16.9 16.3 17.5 17.1 16.5 17.7 8.9 8.2 9.6
Black Female 5.5 4.1 7.2 6.2 4.9 7.9 10.7 8.9 12.9 10.7 8.9 12.8
White Female 9.7 9.1 10.3 8.9 8.3 9.6 13.8 13.1 14.6 13.2 12.4 14.0 8.9 8.2 9.6
Black Male 14.2 11.4 17.6 26.5 23.1 30.4 13.2 10.9 16.0White Male 36.9 35.6 38.1 27.1 26.1 28.3 20.4 19.4 21.4 22.3 21.3 23.3
(1) Rates are expressed as number of cases per 100,000 population per year, adjusted to the 2000 U.S. standard population.(2) Florida total rates throughout this report include 710 new cancers in persons of "Other" races, 984 cases with unknownrace, 39 cases with unknown sex, and 3 cases with unknown age. Total rates by sex include unknown age, race and Other races; rates by race include unknown sex and age.
Source of data: Florida Cancer Data System
Cervix
CI CI CI CI CI
CI CI CI
Colorectal
Bladder Head & Neck Non-HodgkinCI CI
Melanoma
Table 4. Age-Adjusted Incidence Rates (1) by Sex and Race, Florida, 2003
All CancersLung &
Bronchus Prostate Breast

Incidence
23Florida Annual Cancer Report: 2003 Incidence and Mortality
County
• The age-adjusted incidence rates for all cancers combined in 14 counties (Union, Lake, Polk, Santa Rosa, Duval, Hernando, Okaloosa, Okeechobee, Brevard, Volusia, Escambia, Pasco, Orange, and Alachua) were greater than the overall Florida rate (431.6 per 100,000). Union County had the highest age-adjusted incidence rate, 1098 per 100,000.
• Sixteen counties (Glades, Jackson, Walton, Washington, Hamilton, Holmes, Manatee, Bradford, Lee, Desoto, Collier, Charlotte, St. Lucie, Dade, Osceola, and Seminole) had rates below the Florida average. Glades County had the lowest rate for all cancers combined.
• For cancer of the lung and bronchus, 19 counties had age-adjusted incidence rates higher than the state rate. Union, Calhoun, and Dixie counties had the highest incidence rates.
• Miami-Dade, Palm Beach, and Collier counties had age-adjusted incidence rates for cancer of the lung and bronchus lower than the Florida rate.
• The age-adjusted prostate cancer incidence rates in eight counties (Walton, Monroe, Sumter, Broward, Columbia, Lee, Manatee, and Osceola) were below the Florida rate. Walton and Monroe counties had the lowest rates. Seven counties had rates above the Florida rate. These counties were Miami-Dade, Collier, Duval, Escambia, Martin, Orange, and Union.
• Five counties had age-adjusted female breast cancer rates lower than the Florida rate. These were Collier, Miami-Dade, Indian River, Jackson, and Manatee counties. Escambia, Flagler, Martin, Polk, and Santa Rosa counties had breast cancer incidence rates above the state rate.
• Clay and Miami-Dade counties had age-adjusted colorectal cancer incidence rates greater than the state rate. Collier, Lee, and Palm Beach counties had colorectal cancer rates below the Florida rate.

Incidence
24 Florida Annual Cancer Report: 2003 Incidence and Mortality
Rate Rate Rate Rate RateFlorida 431.6 428.8 434.4 69.1 68.0 70.2 124.4 122.2 126.6 105.8 103.9 107.8 46.6 45.7 47.5
Alachua 466.6 436.3 498.5 84.6 71.9 98.9 132.2 108.2 160.4 126.8 106.1 150.7 54.4 44.3 66.1Baker 443.9 356.3 549.1 86.6 51.5 140.5 119.3 62.4 240.9 113.5 58.4 202.0 59.8 29.3 111.0Bay 422.3 392.0 454.5 82.8 69.7 97.8 117.4 94.3 145.7 109.4 88.9 133.8 50.8 40.6 63.1Bradford 334.7 271.9 409.4 56.9 33.1 93.6 76.9 35.6 151.3 107.3 58.6 186.8 49.0 27.4 83.5Brevard 461.3 445.3 477.8 75.8 69.6 82.5 129.3 117.5 142.2 116.8 105.4 129.3 45.3 40.5 50.7Broward 422.6 413.6 431.7 66.6 63.1 70.3 106.3 99.6 113.3 102.5 96.4 108.9 48.3 45.3 51.4Calhoun 333.4 248.0 443.3 130.3 79.5 206.8 ^ ^ ^ ^ ^ ^ ^ ^ ^Charlotte 388.5 364.2 415.2 65.2 56.0 76.9 118.4 101.2 140.6 92.5 75.4 115.1 37.4 30.5 46.8Citrus 414.6 386.4 445.7 83.1 71.7 97.6 124.5 105.7 149.1 116.5 94.0 145.6 38.1 30.9 48.3Clay 456.0 422.1 492.2 92.5 77.5 109.6 121.6 96.2 153.0 109.3 87.9 134.7 62.7 50.2 77.4Collier 395.2 376.6 414.7 51.2 45.0 58.4 141.9 127.1 158.6 87.6 75.0 102.4 33.5 28.6 39.5Columbia 453.3 402.8 508.9 97.9 75.6 125.3 75.9 47.5 118.3 107.3 74.5 151.3 58.1 41.0 80.5Miami-Dade 412.4 404.5 420.4 46.4 43.8 49.2 145.4 138.4 152.7 97.4 92.3 102.9 51.6 48.8 54.5DeSoto 349.0 294.1 412.8 55.2 35.0 85.1 93.5 58.9 146.2 98.0 57.9 162.2 59.2 37.9 90.0Dixie 517.0 416.2 639.2 116.4 75.8 178.4 ^ ^ ^ 166.9 87.5 302.1 ^ ^ ^Duval 467.7 452.4 483.5 80.7 74.3 87.5 156.9 143.2 171.7 105.3 95.8 115.5 50.7 45.7 56.1Escambia 466.1 442.8 490.3 80.7 71.3 91.2 149.7 130.3 171.6 133.3 116.6 151.9 41.0 34.3 48.7Flagler 454.8 412.7 502.7 61.5 48.3 81.0 148.2 119.0 189.7 153.0 117.8 201.4 45.2 33.4 63.4Franklin 328.3 242.3 446.1 91.5 48.3 171.1 ^ ^ ^ ^ ^ ^ ^ ^ ^Gadsden 470.7 411.1 536.9 83.4 59.5 114.2 162.8 112.1 230.6 122.1 83.8 173.2 37.9 22.4 60.5Gilchrist 393.5 305.5 503.7 93.5 54.2 156.6 ^ ^ ^ ^ ^ ^ 56.6 27.0 111.2Glades 200.9 131.0 304.7 ^ ^ ^ ^ ^ ^ ^ ^ ^ ^ ^ ^Gulf 414.2 327.4 523.0 62.3 32.1 117.9 ^ ^ ^ 119.0 55.1 239.4 64.0 32.9 120.7Hamilton 255.4 175.0 361.8 ^ ^ ^ ^ ^ ^ ^ ^ ^ ^ ^ ^Hardee 441.8 367.9 527.5 72.3 44.5 112.6 146.9 90.5 231.1 127.9 74.9 209.9 ^ ^ ^Hendry 459.1 387.7 540.8 104.0 71.9 146.8 91.4 48.5 163.7 ^ ^ ^ 44.2 24.1 75.6Hernando 477.7 448.0 509.8 92.3 80.4 106.6 133.9 114.2 158.4 96.5 78.1 120.1 51.5 42.7 62.8Highlands 440.6 405.5 479.4 81.4 67.4 99.3 114.0 92.9 142.4 107.0 81.4 141.4 42.2 33.0 55.2Hillsborough 442.7 430.4 455.3 68.4 63.7 73.5 131.7 121.8 142.4 106.8 98.7 115.5 49.4 45.3 53.7Holmes 296.1 229.4 380.1 44.6 21.3 87.7 ^ ^ ^ ^ ^ ^ ^ ^ ^Indian River 406.2 377.5 437.4 68.9 58.3 82.0 104.2 85.8 127.5 71.6 54.7 94.2 52.0 42.5 64.0Jackson 284.6 241.4 334.3 51.2 34.0 75.3 84.6 51.3 133.0 36.8 17.5 71.3 40.2 25.1 62.2Jefferson 459.9 361.1 581.8 ^ ^ ^ 146.9 71.5 277.1 155.3 77.6 288.1 ^ ^ ^Lafayette 409.1 277.2 588.4 ^ ^ ^ ^ ^ ^ ^ ^ ^ ^ ^ ^Lake 494.0 471.3 518.0 76.8 68.4 86.4 139.0 123.0 157.4 123.0 106.9 141.9 46.8 40.5 54.4Lee 396.2 381.6 411.3 63.1 57.8 69.0 107.8 98.0 118.7 104.2 93.4 116.4 34.5 30.5 39.0Leon 403.8 375.9 433.4 63.4 52.4 76.2 129.4 105.4 158.2 105.1 86.9 126.4 44.3 35.3 55.1Levy 438.5 382.6 502.5 87.0 63.9 118.7 105.8 70.3 159.9 68.7 39.8 116.6 55.6 37.1 83.2Liberty 484.1 329.5 703.3 ^ ^ ^ ^ ^ ^ ^ ^ ^ ^ ^ ^Madison 397.4 315.6 495.5 78.6 45.7 128.4 116.0 57.6 212.8 ^ ^ ^ 48.8 23.3 92.1Manatee 384.9 366.3 404.4 68.1 60.6 76.5 105.9 92.7 121.0 87.4 74.9 102.0 46.8 40.6 54.0Marion 433.3 413.4 454.2 82.0 73.9 91.1 116.1 102.3 132.1 109.7 95.6 126.0 52.3 45.7 59.9Martin 459.5 430.7 490.7 76.3 65.7 89.2 148.8 127.2 174.9 136.5 112.6 166.0 45.6 37.4 56.1Monroe 425.7 385.3 470.3 84.4 67.2 106.1 60.9 40.1 91.1 98.0 72.3 133.0 53.6 39.9 71.9Nassau 447.8 398.9 501.7 78.9 59.6 103.4 132.2 95.0 185.0 90.5 62.0 129.4 47.2 32.6 67.3Okaloosa 478.6 447.3 511.7 84.9 72.0 99.6 133.7 109.9 162.7 112.5 92.5 135.7 53.3 43.3 65.3Okeechobee 511.0 447.2 582.5 102.1 75.6 136.5 130.4 89.4 187.3 109.2 68.5 170.3 38.0 22.7 61.8Orange 453.6 439.6 467.9 69.8 64.3 75.7 150.2 138.1 163.2 112.4 103.2 122.2 49.1 44.5 54.1Osceola 394.1 367.9 421.7 65.0 54.7 76.8 99.7 81.1 122.1 106.4 88.4 127.2 41.9 33.6 51.8Palm Beach 436.0 426.1 446.1 60.8 57.3 64.5 115.5 108.3 123.3 110.5 103.4 118.1 41.8 38.8 44.9Pasco 460.0 442.0 478.8 79.1 72.1 87.0 135.8 123.0 150.3 99.6 87.7 113.1 46.7 41.5 52.7Pinellas 435.4 424.2 446.9 77.2 72.7 82.0 115.5 107.3 124.3 109.2 101.3 117.7 47.2 43.7 50.9Polk 476.4 459.8 493.5 76.2 69.9 83.0 125.5 113.7 138.5 123.6 112.0 136.4 50.3 45.0 56.0Putnam 459.4 417.1 505.7 104.6 85.7 127.7 108.7 80.9 145.5 112.7 83.9 150.6 48.3 35.5 65.6Saint Johns 398.9 370.1 429.8 71.3 59.7 85.1 109.6 88.2 135.7 114.1 93.3 139.5 41.6 32.7 52.7Saint Lucie 396.3 373.9 420.1 73.7 64.6 84.1 116.1 99.7 135.3 87.6 72.5 105.6 42.5 35.7 50.6Santa Rosa 495.2 457.5 535.7 87.1 71.9 105.1 153.3 123.1 191.5 141.0 114.8 172.0 55.1 42.8 70.5Sarasota 428.6 411.1 447.0 71.7 65.2 79.0 116.3 104.5 129.9 113.0 100.1 128.0 45.4 40.2 51.6Seminole 407.7 387.6 428.7 60.6 52.8 69.2 144.1 126.2 164.2 102.2 89.2 116.8 39.8 33.6 46.8Sumter 388.9 351.6 431.4 84.7 68.6 106.2 76.9 55.4 110.1 83.1 58.3 120.9 44.5 33.0 61.8Suwannee 418.7 362.5 483.0 84.5 60.9 116.6 113.8 74.7 170.8 118.2 79.6 174.7 39.0 23.8 63.4Taylor 441.5 359.8 538.0 101.7 65.7 153.0 106.7 56.6 198.6 97.5 49.8 182.5 49.5 25.5 89.6Union 1098.3 920.8 1309.2 275.4 190.7 395.9 231.6 127.1 446.3 ^ ^ ^ ^ ^ ^Volusia 460.4 444.1 477.3 82.8 76.2 90.0 123.3 111.7 136.2 102.5 91.8 114.5 52.1 46.9 58.0Wakulla 419.6 340.7 513.9 57.0 31.6 98.8 76.5 35.6 161.9 121.5 69.1 203.0 ^ ^ ^Walton 292.0 250.9 339.6 57.7 40.7 81.7 53.5 31.6 89.7 70.6 44.3 111.9 27.6 16.3 46.1Washington 274.9 216.0 348.2 65.7 39.5 107.2 ^ ^ ^ ^ ^ ^ 44.6 22.8 82.7
(1) Rates are expressed as number of cases per 100,000 population per year, adjusted to the 2000 U.S. standard population.^ Statistics are not displayed for cells with fewer than 10 cases. Source of data: Florida Cancer Data System
Table 5. Age-adjusted Incidence Rates (1) by County, Florida, 2003
All Cancers Lung & Bronchus Prostate Breast ColorectalCICI CI CI CI
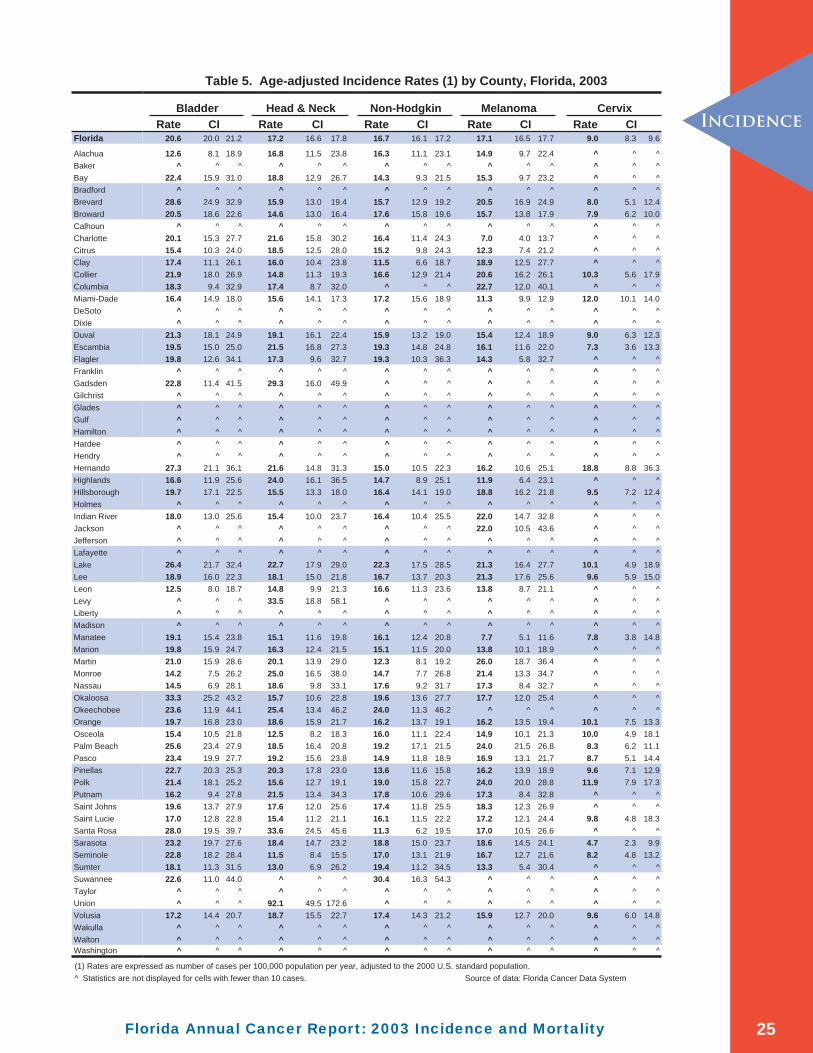
Incidence
25Florida Annual Cancer Report: 2003 Incidence and Mortality
FloridaAlachuaBakerBayBradfordBrevardBrowardCalhounCharlotteCitrusClayCollierColumbiaMiami-DadeDeSotoDixieDuvalEscambiaFlaglerFranklinGadsdenGilchristGladesGulfHamiltonHardeeHendryHernandoHighlandsHillsboroughHolmesIndian RiverJacksonJeffersonLafayetteLakeLeeLeonLevyLibertyMadisonManateeMarionMartinMonroeNassauOkaloosaOkeechobeeOrangeOsceolaPalm BeachPascoPinellasPolkPutnamSaint JohnsSaint LucieSanta RosaSarasotaSeminoleSumterSuwanneeTaylorUnionVolusiaWakullaWaltonWashington
Rate Rate Rate Rate Rate20.6 20.0 21.2 17.2 16.6 17.8 16.7 16.1 17.2 17.1 16.5 17.7 9.0 8.3 9.6
12.6 8.1 18.9 16.8 11.5 23.8 16.3 11.1 23.1 14.9 9.7 22.4 ^ ^ ^^ ^ ^ ^ ^ ^ ^ ^ ^ ^ ^ ^ ^ ^ ^
22.4 15.9 31.0 18.8 12.9 26.7 14.3 9.3 21.5 15.3 9.7 23.2 ^ ^ ^^ ^ ^ ^ ^ ^ ^ ^ ^ ^ ^ ^ ^ ^ ^
28.6 24.9 32.9 15.9 13.0 19.4 15.7 12.9 19.2 20.5 16.9 24.9 8.0 5.1 12.420.5 18.6 22.6 14.6 13.0 16.4 17.6 15.8 19.6 15.7 13.8 17.9 7.9 6.2 10.0
^ ^ ^ ^ ^ ^ ^ ^ ^ ^ ^ ^ ^ ^ ^20.1 15.3 27.7 21.6 15.8 30.2 16.4 11.4 24.3 7.0 4.0 13.7 ^ ^ ^15.4 10.3 24.0 18.5 12.5 28.0 15.2 9.8 24.3 12.3 7.4 21.2 ^ ^ ^17.4 11.1 26.1 16.0 10.4 23.8 11.5 6.6 18.7 18.9 12.5 27.7 ^ ^ ^21.9 18.0 26.9 14.8 11.3 19.3 16.6 12.9 21.4 20.6 16.2 26.1 10.3 5.6 17.918.3 9.4 32.9 17.4 8.7 32.0 ^ ^ ^ 22.7 12.0 40.1 ^ ^ ^16.4 14.9 18.0 15.6 14.1 17.3 17.2 15.6 18.9 11.3 9.9 12.9 12.0 10.1 14.0
^ ^ ^ ^ ^ ^ ^ ^ ^ ^ ^ ^ ^ ^ ^^ ^ ^ ^ ^ ^ ^ ^ ^ ^ ^ ^ ^ ^ ^
21.3 18.1 24.9 19.1 16.1 22.4 15.9 13.2 19.0 15.4 12.4 18.9 9.0 6.3 12.319.5 15.0 25.0 21.5 16.8 27.3 19.3 14.8 24.8 16.1 11.6 22.0 7.3 3.6 13.319.8 12.6 34.1 17.3 9.6 32.7 19.3 10.3 36.3 14.3 5.8 32.7 ^ ^ ^
^ ^ ^ ^ ^ ^ ^ ^ ^ ^ ^ ^ ^ ^ ^22.8 11.4 41.5 29.3 16.0 49.9 ^ ^ ^ ^ ^ ^ ^ ^ ^
^ ^ ^ ^ ^ ^ ^ ^ ^ ^ ^ ^ ^ ^ ^^ ^ ^ ^ ^ ^ ^ ^ ^ ^ ^ ^ ^ ^ ^^ ^ ^ ^ ^ ^ ^ ^ ^ ^ ^ ^ ^ ^ ^^ ^ ^ ^ ^ ^ ^ ^ ^ ^ ^ ^ ^ ^ ^^ ^ ^ ^ ^ ^ ^ ^ ^ ^ ^ ^ ^ ^ ^^ ^ ^ ^ ^ ^ ^ ^ ^ ^ ^ ^ ^ ^ ^
27.3 21.1 36.1 21.6 14.8 31.3 15.0 10.5 22.3 16.2 10.6 25.1 18.8 8.8 36.316.6 11.9 25.6 24.0 16.1 36.5 14.7 8.9 25.1 11.9 6.4 23.1 ^ ^ ^19.7 17.1 22.5 15.5 13.3 18.0 16.4 14.1 19.0 18.8 16.2 21.8 9.5 7.2 12.4
^ ^ ^ ^ ^ ^ ^ ^ ^ ^ ^ ^ ^ ^ ^18.0 13.0 25.6 15.4 10.0 23.7 16.4 10.4 25.5 22.0 14.7 32.8 ^ ^ ^
^ ^ ^ ^ ^ ^ ^ ^ ^ 22.0 10.5 43.6 ^ ^ ^^ ^ ^ ^ ^ ^ ^ ^ ^ ^ ^ ^ ^ ^ ^^ ^ ^ ^ ^ ^ ^ ^ ^ ^ ^ ^ ^ ^ ^
26.4 21.7 32.4 22.7 17.9 29.0 22.3 17.5 28.5 21.3 16.4 27.7 10.1 4.9 18.918.9 16.0 22.3 18.1 15.0 21.8 16.7 13.7 20.3 21.3 17.6 25.6 9.6 5.9 15.012.5 8.0 18.7 14.8 9.9 21.3 16.6 11.3 23.6 13.8 8.7 21.1 ^ ^ ^
^ ^ ^ 33.5 18.8 58.1 ^ ^ ^ ^ ^ ^ ^ ^ ^^ ^ ^ ^ ^ ^ ^ ^ ^ ^ ^ ^ ^ ^ ^^ ^ ^ ^ ^ ^ ^ ^ ^ ^ ^ ^ ^ ^ ^
19.1 15.4 23.8 15.1 11.6 19.8 16.1 12.4 20.8 7.7 5.1 11.6 7.8 3.8 14.819.8 15.9 24.7 16.3 12.4 21.5 15.1 11.5 20.0 13.8 10.1 18.9 ^ ^ ^21.0 15.9 28.6 20.1 13.9 29.0 12.3 8.1 19.2 26.0 18.7 36.4 ^ ^ ^14.2 7.5 26.2 25.0 16.5 38.0 14.7 7.7 26.8 21.4 13.3 34.7 ^ ^ ^14.5 6.9 28.1 18.6 9.8 33.1 17.6 9.2 31.7 17.3 8.4 32.7 ^ ^ ^33.3 25.2 43.2 15.7 10.6 22.8 19.6 13.6 27.7 17.7 12.0 25.4 ^ ^ ^23.6 11.9 44.1 25.4 13.4 46.2 24.0 11.3 46.2 ^ ^ ^ ^ ^ ^19.7 16.8 23.0 18.6 15.9 21.7 16.2 13.7 19.1 16.2 13.5 19.4 10.1 7.5 13.315.4 10.5 21.8 12.5 8.2 18.3 16.0 11.1 22.4 14.9 10.1 21.3 10.0 4.9 18.125.6 23.4 27.9 18.5 16.4 20.8 19.2 17.1 21.5 24.0 21.5 26.8 8.3 6.2 11.123.4 19.9 27.7 19.2 15.6 23.8 14.9 11.8 18.9 16.9 13.1 21.7 8.7 5.1 14.422.7 20.3 25.3 20.3 17.8 23.0 13.6 11.6 15.8 16.2 13.9 18.9 9.6 7.1 12.921.4 18.1 25.2 15.6 12.7 19.1 19.0 15.8 22.7 24.0 20.0 28.8 11.9 7.9 17.316.2 9.4 27.8 21.5 13.4 34.3 17.8 10.6 29.6 17.3 8.4 32.8 ^ ^ ^19.6 13.7 27.9 17.6 12.0 25.6 17.4 11.8 25.5 18.3 12.3 26.9 ^ ^ ^17.0 12.8 22.8 15.4 11.2 21.1 16.1 11.5 22.2 17.2 12.1 24.4 9.8 4.8 18.328.0 19.5 39.7 33.6 24.5 45.6 11.3 6.2 19.5 17.0 10.5 26.6 ^ ^ ^23.2 19.7 27.6 18.4 14.7 23.2 18.8 15.0 23.7 18.6 14.5 24.1 4.7 2.3 9.922.8 18.2 28.4 11.5 8.4 15.5 17.0 13.1 21.9 16.7 12.7 21.6 8.2 4.8 13.218.1 11.3 31.5 13.0 6.9 26.2 19.4 11.2 34.5 13.3 5.4 30.4 ^ ^ ^22.6 11.0 44.0 ^ ^ ^ 30.4 16.3 54.3 ^ ^ ^ ^ ^ ^
^ ^ ^ ^ ^ ^ ^ ^ ^ ^ ^ ^ ^ ^ ^^ ^ ^ 92.1 49.5 172.6 ^ ^ ^ ^ ^ ^ ^ ^ ^
17.2 14.4 20.7 18.7 15.5 22.7 17.4 14.3 21.2 15.9 12.7 20.0 9.6 6.0 14.8^ ^ ^ ^ ^ ^ ^ ^ ^ ^ ^ ^ ^ ^ ^^ ^ ^ ^ ^ ^ ^ ^ ^ ^ ^ ^ ^ ^ ^^ ^ ^ ^ ^ ^ ^ ^ ^ ^ ^ ^ ^ ^ ^
(1) Rates are expressed as number of cases per 100,000 population per year, adjusted to the 2000 U.S. standard population.^ Statistics are not displayed for cells with fewer than 10 cases. Source of data: Florida Cancer Data System
Table 5. Age-adjusted Incidence Rates (1) by County, Florida, 2003
CI CI CIBladder Head & Neck Non-Hodgkin
CI CIMelanoma Cervix

Incidence
AGE-SPECIFIC INCIDENCE RATES
• Age-specifi c cancer incidence rates normally increase with age. The 75 and older age group had the highest age-specifi c rate for most cancers. However, there were several exceptions. The cervical cancer age-specifi c rate was the highest in females age 45 to 64. The incidence of prostate, breast, and head and neck cancer rates was the highest in the 65 to 74 age group.
• Males had higher age-specifi c rates than females in most age groups and for all the major cancer sites except in the 20 to 44 age group for all cancers combined, and in the groups under age 45 for melanoma.
• Among females, Whites had higher age-specifi c rates than Blacks for all cancers combined, cancers of the lung and bronchus, breast, bladder, and head and neck in all age groups. However, some of these differences were not statistically signifi cant. Blacks had a higher age-specifi c cervical cancer incidence rate than Whites in the 65 to 74 age group.
• Among males, Blacks had higher age-specifi c rates than Whites for all cancer combined in the 65 to 74 age group, and for prostate cancer in all age groups. Blacks, however, had lower age-specifi c incidence rates than Whites for all cancer combined in the 20 to 44 age group, for bladder cancer among people age 45 and older, and for non-Hodgkin lymphoma among people age 65 and older.
26 Florida Annual Cancer Report: 2003 Incidence and Mortality

Incidence
27Florida Annual Cancer Report: 2003 Incidence and Mortality
Rat
eR
ate
Rat
eR
ate
Rat
eR
ate
Rat
eR
ate
Rat
eR
ate
Flo
rid
a43
1.6
428.
843
4.4
69.1
68.0
70.2
124.
412
2.2
126.
610
5.8
103.
910
7.8
46.6
45.7
47.5
20.6
20.0
21.2
17.2
16.6
17.8
16.7
16.1
17.2
17.1
16.5
17.7
9.0
8.3
9.6
0-19
17.2
15.9
18.5
^^
^^
^^
^^
^^
^^
^^
^0.
40.
20.
61.
31.
01.
70.
80.
51.
2^
^^
2
0-44
11
2.6
109.
811
5.4
5.8
5.2
6.5
2.4
1.9
3.1
43.6
41.2
46.1
7.2
6.5
7.9
1.8
1.5
2.2
4.2
3.7
4.8
6.4
5.8
7.1
10.6
9.7
11.6
12.0
10.8
13.4
4
5-64
684.
367
6.5
692.
210
5.0
102.
010
8.1
201.
019
4.9
207.
222
1.1
215.
022
7.4
63.5
61.2
66.0
22.2
20.8
23.6
37.6
35.8
39.5
23.7
22.3
25.2
25.9
24.3
27.6
14.3
12.8
16.0
6
5-74
1,73
0.5
1,70
9.8
1,75
1.4
331.
732
2.6
340.
973
7.1
717.
275
7.4
335.
432
3.1
348.
118
7.7
180.
919
4.7
91.5
86.8
96.4
61.3
57.5
65.4
59.1
55.3
63.0
52.3
48.6
56.2
12.9
10.6
15.6
7
5+2,
086.
02,
063.
32,
109.
038
1.1
371.
439
0.9
550.
053
1.8
568.
833
1.8
320.
134
3.8
300.
329
1.7
309.
115
4.8
148.
716
1.2
56.4
52.7
60.3
81.6
77.1
86.2
66.3
62.2
70.6
8.8
7.0
11.0
Fem
ale
0-19
17.1
15.3
18.9
^^
^^
^^
^^
^^
^^
^^
^1.
00.
61.
60.
90.
51.
5^
^^
2
0-44
13
8.9
134.
514
3.3
5.8
4.9
6.7
43.6
41.2
46.1
6.8
5.8
7.8
1.3
0.9
1.8
2.7
2.1
3.3
4.5
3.7
5.3
12.0
10.6
13.5
12.0
10.8
13.4
4
5-64
627.
161
6.7
637.
687
.083
.291
.022
1.1
215.
022
7.4
54.4
51.3
57.5
10.6
9.3
12.0
16.5
14.9
18.3
19.9
18.0
21.8
19.4
17.5
21.5
14.3
12.8
16.0
6
5-74
1,31
6.4
1,29
1.9
1,34
1.3
268.
225
7.1
279.
633
5.4
323.
134
8.1
158.
314
9.9
167.
138
.334
.242
.832
.428
.736
.551
.446
.756
.632
.028
.136
.312
.910
.615
.6
7
5+1,
681.
21,
654.
81,
708.
030
1.4
290.
331
2.9
331.
832
0.1
343.
826
9.5
259.
028
0.3
70.2
64.8
75.8
31.7
28.2
35.6
68.4
63.2
74.0
36.6
32.7
40.9
8.8
7.0
11.0
Mal
e
0-
1917
.315
.619
.1^
^^
^^
^^
^^
^^
^^
^^
1.6
1.1
2.2
0.7
0.4
1.3
2
0-44
86
.683
.290
.15.
95.
16.
92.
41.
93.
17.
66.
68.
62.
31.
82.
95.
74.
86.
68.
47.
39.
59.
28.
110
.6
4
5-64
745.
573
3.8
757.
412
4.2
119.
412
9.1
201.
019
4.9
207.
273
.469
.777
.234
.732
.237
.360
.457
.063
.827
.925
.730
.332
.730
.135
.5
6
5-74
2,21
5.1
2,18
0.6
2,25
0.1
405.
739
1.0
420.
873
7.1
717.
275
7.4
222.
221
1.3
233.
515
3.9
144.
916
3.3
95.2
88.2
102.
767
.761
.874
.176
.069
.583
.0
7
5+2,
681.
92,
641.
32,
722.
949
8.4
481.
051
6.3
550.
053
1.8
568.
834
5.5
331.
136
0.4
279.
626
6.6
293.
192
.985
.510
0.8
101.
093
.210
9.2
109.
510
1.2
118.
2
Bla
ck
0-
1913
.511
.216
.1^
^^
^^
^^
^^
^^
^^
^^
^^
^1.
10.
52.
0^
^^
2
0-44
86
.480
.892
.35.
54.
17.
14.
83.
17.
236
.631
.642
.17.
05.
58.
8^
^^
2.9
2.0
4.2
7.3
5.8
9.2
9.1
6.7
12.1
4
5-64
621.
860
1.1
643.
184
.376
.892
.427
8.0
257.
829
9.4
178.
816
3.9
194.
869
.762
.977
.19.
36.
912
.330
.726
.335
.719
.015
.523
.116
.312
.021
.6
6
5-74
1,81
9.4
1,74
3.8
1,89
7.4
303.
927
3.5
336.
81,
097.
71,
009.
31,
191.
830
5.8
265.
635
0.3
210.
418
5.2
238.
141
.731
.055
.063
.550
.079
.435
.926
.048
.438
.225
.056
.0
7
5+1,
931.
21,
837.
32,
028.
829
0.4
254.
632
9.7
887.
478
2.6
1,00
2.4
278.
523
5.3
327.
328
1.8
246.
632
0.6
62.2
46.3
81.8
41.5
28.7
58.0
34.2
22.7
49.4
^^
^
Wh
ite
0-19
18.4
17.0
20.0
^^
^^
^^
^^
^^
^^
^^
^^
^^
1.4
1.0
1.9
0.8
0.5
1.2
^^
^
2
0-44
11
8.1
114.
912
1.4
6.0
5.3
6.8
1.9
1.4
2.6
45.4
42.6
48.3
7.2
6.5
8.1
2.1
1.7
2.5
4.5
3.9
5.2
6.2
5.5
7.0
10.7
9.7
11.7
12.9
11.4
14.5
4
5-64
693.
268
4.6
701.
810
9.1
105.
711
2.5
189.
718
3.3
196.
322
7.6
220.
823
4.6
62.2
59.7
64.9
24.2
22.6
25.8
38.6
36.6
40.6
24.3
22.8
26.0
25.9
24.3
27.7
13.8
12.1
15.5
6
5-74
1,71
2.8
1,69
1.2
1,73
4.7
334.
632
5.1
344.
370
5.1
684.
772
5.9
335.
332
2.3
348.
618
3.4
176.
419
0.7
95.4
90.3
100.
660
.856
.865
.060
.456
.464
.651
.647
.955
.510
.48.
213
.0
7
5+2,
088.
52,
065.
02,
112.
238
6.3
376.
339
6.6
531.
851
3.3
550.
733
2.9
320.
834
5.3
300.
229
1.4
309.
315
9.5
153.
116
6.2
57.2
53.4
61.3
83.7
79.0
88.5
66.1
62.0
70.4
8.4
6.6
10.6
Bla
ck F
emal
e
0-
1913
.710
.517
.6^
^^
^^
^^
^^
^^
^^
^^
^^
^^
^^
2
0-44
10
2.9
94.4
111.
94.
93.
27.
236
.631
.642
.17.
04.
99.
7^
^^
2.1
1.0
3.7
5.3
3.5
7.7
9.1
6.7
12.1
4
5-64
522.
349
6.5
549.
050
.142
.458
.917
8.8
163.
919
4.8
68.4
59.3
78.5
5.4
3.1
8.8
10.8
7.4
15.3
16.6
12.3
21.9
16.3
12.0
21.6
6
5-74
1,30
6.9
1,22
2.4
1,39
5.8
189.
615
8.3
225.
330
5.8
265.
635
0.3
179.
414
8.9
214.
230
.919
.147
.223
.513
.438
.241
.227
.459
.538
.225
.056
.0
7
5+1,
549.
71,
445.
31,
659.
717
2.4
138.
821
1.7
278.
523
5.3
327.
326
9.0
226.
631
7.1
34.1
20.2
53.9
18.9
9.1
34.8
32.2
18.8
51.6
^^
^
Wh
ite
Fem
ale
0-19
18.3
16.2
20.5
^^
^^
^^
^^
^^
^^
^^
^1.
10.
61.
70.
90.
51.
5^
^^
2
0-44
14
7.0
142.
015
2.2
6.0
5.0
7.2
45.4
42.6
48.3
6.9
5.8
8.1
1.5
1.0
2.1
2.9
2.2
3.7
4.3
3.5
5.3
12.2
10.7
13.7
12.9
11.4
14.5
4
5-64
643.
163
1.6
654.
793
.989
.598
.422
7.6
220.
823
4.6
51.7
48.5
55.1
11.3
9.8
12.9
17.3
15.5
19.3
20.2
18.2
22.3
19.3
17.3
21.4
13.8
12.1
15.5
6
5-74
1,30
8.8
1,28
3.1
1,33
4.9
276.
026
4.3
288.
233
5.3
322.
334
8.6
155.
014
6.2
164.
238
.934
.543
.633
.029
.037
.451
.846
.857
.231
.727
.836
.010
.48.
213
.0
7
5+1,
683.
81,
656.
51,
711.
530
9.6
298.
032
1.7
332.
932
0.8
345.
326
8.3
257.
527
9.5
71.9
66.3
77.8
32.1
28.4
36.1
70.4
64.9
76.2
36.4
32.5
40.7
8.4
6.6
10.6
Bla
ck M
ale
0-19
13.3
10.2
17.1
^^
^^
^^
^^
^^
^^
^^
^^
^^
2
0-44
68
.961
.876
.66.
04.
18.
64.
83.
17.
27.
04.
99.
8^
^^
3.8
2.3
6.0
9.4
6.9
12.6
4
5-64
738.
370
5.0
772.
612
4.5
111.
113
9.1
278.
025
7.8
299.
470
.860
.882
.013
.99.
719
.454
.145
.464
.021
.916
.528
.5
6
5-74
2,49
1.1
2,35
6.9
2,63
0.9
454.
239
7.9
516.
11,
097.
71,
009.
31,
191.
825
1.2
209.
929
8.3
56.0
37.5
80.5
114.
086
.814
7.1
29.0
16.2
47.8
7
5+2,
621.
22,
438.
72,
813.
750
3.7
425.
659
2.0
887.
478
2.6
1,00
2.4
305.
024
4.9
375.
311
3.1
77.8
158.
882
.252
.712
2.4
37.7
18.8
67.4
Wh
ite
Mal
e
0-
1918
.616
.620
.9^
^^
^^
^^
^^
^^
^^
^^
1.7
1.1
2.5
0.7
0.4
1.3
2
0-44
90
.386
.494
.36.
05.
17.
11.
91.
42.
67.
66.
58.
82.
72.
03.
46.
15.
17.
28.
17.
09.
49.
38.
010
.6
4
5-64
745.
973
3.2
758.
812
4.9
119.
713
0.2
189.
718
3.3
196.
373
.569
.577
.637
.935
.040
.961
.257
.664
.928
.826
.331
.433
.030
.435
.8
6
5-74
2,18
0.7
2,14
4.9
2,21
7.1
402.
338
6.9
418.
070
5.1
684.
772
5.9
216.
420
5.2
228.
016
0.9
151.
317
1.0
93.1
85.8
100.
870
.263
.976
.974
.768
.181
.6
75+
2,67
6.6
2,63
5.0
2,71
8.8
497.
948
0.0
516.
353
1.8
513.
355
0.7
346.
433
1.5
361.
828
7.0
273.
530
1.1
93.9
86.2
102.
010
3.1
95.0
111.
610
9.2
100.
911
8.0
(1)
Rat
es a
re e
xpre
ssed
as
num
ber
of c
ases
per
100
,000
pop
ulat
ion
per
year
. S
ourc
e of
dat
a: F
lorid
a C
ance
r D
ata
Sys
tem
^ S
tatis
tics
are
not d
ispl
ayed
for
cells
with
few
er th
an 1
0 ca
ses.
All
Can
cers
Lu
ng
& B
ron
chu
sP
rost
ate
Bre
ast
CI
CI
CI
Co
lore
ctal
Bla
dd
erH
ead
& N
eck
No
n-H
od
gki
n
Tab
le 6
. A
ge-
Sp
ecif
ic In
cid
ence
Rat
es (
1) b
y S
ex, R
ace,
an
d A
ge
Gro
up
, Flo
rid
a, 2
003
CI
CI
Mel
ano
ma
Cer
vix
CI
CI
CI
CI
CI

Incidence
CHILDHOOD CANCER INCIDENCE
From 1999 to 2003, the number of new cancer cases among children ages 0 to 14 totaled 2,414. The age-specifi c cancer incidence rate among children during this period was 157.5 per million. Childhood cancer rates are expressed in cases per million children at risk. Childhood cancer sites are grouped to correspond more closely to the International Classifi cation of Childhood Cancers (ICCC) and are not the same groups used elsewhere in this report.
• On average, 483 new cases were diagnosed among Florida children each year during the last fi ve years.
• The top three childhood cancers were acute lymphocytic leukemia, brain and nervous system cancers, and Hodgkin lymphoma. These cancers accounted for 52 percent of all childhood cancers.
TRENDS FOR NEW CASES AND INCIDENCE RATES
The number of new cancer cases diagnosed in Florida residents has increased 91 percent in the past 23 years, from 49,664 in 1981 to 94,910 in 2003. Over this period, Florida’s population has increased 68 percent. The increase in the age-adjusted incidence rate for all cancers combined was 6 percent since 1981, from 406.5 per 100,000 in 1981 to 431.6 per 100,000 in 2003.
Sex and Race
• The total number of new cancer cases increased 91 percent for both males and females between 1981 and 2003. Age-adjusted incidence rates increased 4.6 percent in males and 6 percent in females since 1981. The rates increased 11 percent among Blacks and 6 percent among Whites.
28 Florida Annual Cancer Report: 2003 Incidence and Mortality
Number RateSite of Cases Percent (per million)All Cancers 2,414 -- 157.5 151.2 163.9
Leukemia 692 28.7 45.1 41.8 48.6 Acute Lymphocytic 543 22.5 35.4 32.5 38.5 Other Leukemia 149 6.2 9.7 8.2 11.4Brain & Nervous 531 22.0 34.6 31.8 37.7Lymphoma 255 10.6 16.6 14.7 18.8 Non-Hodgkin 80 3.3 5.2 4.1 6.5 Hodgkin 175 7.2 11.4 9.8 13.2Kidney 150 6.2 9.8 8.3 11.5Soft Tissue 138 5.7 9.0 7.6 10.6Bones and Joints 118 4.9 7.7 6.4 9.2Endocrine 153 6.3 10.0 8.5 11.7Eye 98 4.1 6.4 5.2 7.8All Other Cancers 279 11.6 18.2 16.1 20.5 Source of data: Florida Cancer Data System
Table 7. Number of New Cancer Cases and Age-Specific IncidenceRates for Children Age 0-14, Florida, 1999-2003
CI

Incidence
29Florida Annual Cancer Report: 2003 Incidence and Mortality
Figu
re 3
. N
ew C
ases
and
Age
-Adj
uste
d In
cide
nce
Rat
es fo
r All
Can
cers
by
Sex
and
by R
ace,
Fl
orid
a, 1
981-
2003
Mal
e
0102030405060
1981
1982
1983
1984
1985
1986
1987
1988
1989
1990
1991
1992
1993
1994
1995
1996
1997
1998
1999
2000
2001
2002
2003
New
Cas
es
(x10
00)
0100
200
300
400
500
600
700
Age
-Adj
uste
d R
ate
(per
100
,000
)
New
Cas
esA
ge-A
djus
ted
Rat
e
Fem
ale
0102030405060
19811982
198319841985
19861987
19881989
19901991
199219931994
19951996
19971998
199920002001
20022003
New
Cas
es
(x 1
,000
)
0100
200
300
400
500
600
700
Age
-Adj
uste
d R
ate
(per
100
,000
)B
lack
0246810
1981
1982
1983
1984
1985
1986
1987
1988
1989
1990
1991
1992
1993
1994
1995
1996
1997
1998
1999
2000
2001
2002
2003N
ew C
ases
(x
1,0
00)
0100
200
300
400
500
600
Age
-Adj
uste
d R
ate
(per
100
,000
)
Whi
te
020406080100
1981
1982
1983
1984
1985
1986
1987
1988
1989
1990
1991
1992
1993
1994
1995
1996
1997
1998
1999
2000
2001
2002
2003
New
Cas
es
(x 1
,000
)
0100
200
300
400
500
600
Age
-Adj
uste
d R
ate
(per
100
,000
)
New
Cas
esA
ge-A
djus
ted
Rat
e
Sou
rce
of d
ata:
Flo
rida
Can
cer D
ata
Sys
tem

Incidence
30 Florida Annual Cancer Report: 2003 Incidence and Mortality
Figu
re 4
. N
ew C
ases
and
Age
-Adj
uste
d In
cide
nce
Rat
es fo
r All
Can
cers
by
Sex
and
Rac
e,Fl
orid
a, 1
981-
2003
Bla
ck F
emal
e
012345
1981
1982
1983
1984
1985
1986
1987
1988
1989
1990
1991
1992
1993
1994
1995
1996
1997
1998
1999
2000
2001
2002
2003
New
Cas
es
(x 1
,000
)
0100
200
300
400
500
600
700
Age
-Adj
uste
d R
ate
(per
100
,000
)
Whi
te F
emal
e
01020304050
19811982198319841985198619871988198919901991199219931994199519961997199819992000200120022003
New
Cas
es
(x 1
,000
)
0100
200
300
400
500
600
700
Age
-Adj
uste
d R
ate
(per
100
,000
)
New
Cas
esA
ge-A
djus
ted
Rat
e
Bla
ck M
ale
012345
1981
1982
1983
1984
1985
1986
1987
1988
1989
1990
1991
1992
1993
1994
1995
1996
1997
1998
1999
2000
2001
2002
2003
New
Cas
es
(x 1
,000
)
0100
200
300
400
500
600
700
Age
-Adj
uste
d R
ate
(per
100
,000
)
Whi
te M
ale
01020304050
1981
1982
1983
1984
1985
1986
1987
1988
1989
1990
1991
1992
1993
1994
1995
1996
1997
1998
1999
2000
2001
2002
2003
New
Cas
es
(x 1
,000
)
0100
200
300
400
500
600
700
Age
-Adj
uste
d R
ate
(per
100
,000
)
New
Cas
esA
ge-A
djus
ted
Rat
eS
ourc
e of
dat
a: F
lorid
a C
ance
r Dat
a S
yste
m

Incidence
• The age-adjusted incidence rates increased from 4 percent among White males to 14 percent among Black females between 1981 and 2003. The rates reached a peak in the 1990s and then started to decrease. The incidence among males has dropped by more than 22 percent since 1992. The dramatic decrease in the incidence among males might be the result of the increased use of the prostate-specifi c antigen (PSA) test and the detection of a greater number of new cases until 1992, followed by a normalization in new cases and a greater number of in situ stage cancers that were detected after the general acceptance and application of the test.
• Males had a higher incidence than females in all 23 years. Among Blacks, the incidence among males was between 54 percent and 100 percent higher than that among females. Among Whites, the incidence among males was between 30 percent and 53 percent higher than that among females.
• White females had higher age-adjusted incidence rates than Black females in all years. The racial disparity varied between 10 percent and 27 percent.
• Black males had higher age-adjusted incidence rates than White males in all years, except in 1987 and 1988. The racial disparity increased from 1989 until 1995, and has declined from 19 percent to 5 percent since 1995.
Source of data: Florida Cancer Data System
Figure 5. Age-Adjusted Incidence Rates for All Cancersby Sex and Race, Florida, 1981-2003
0
100
200
300
400
500
600
700
800
1981
1982
1983
1984
1985
1986
1987
1988
1989
1990
1991
1992
1993
1994
1995
1996
1997
1998
1999
2000
2001
2002
2003
Age-Adjusted Rate (per 100,000)
Black Male
White Male
Black Female
White Female
Cancer Sites
Lung and Bronchus
• Age-adjusted incidence rates have decreased by 23 percent among Black males and 15 percent in White males.
• Black males had higher incidence rates than White males until 2001. The racial disparity decreased from 19 percent higher incidence rate in 1981 to 8 percent higher in 2003 among Blacks than among Whites.
31Florida Annual Cancer Report: 2003 Incidence and Mortality

Incidence
• In females, age-adjusted incidence rates increased by 47 percent in Blacks and by 56 percent in Whites between 1981 and 2003.
• The incidence rates in Black females were between 25 and 45 percent lower than in White females during the 23-year period. In 2003, the rate among Black females was 38 percent lower than the rate among White females.
Colorectal
• White males had the highest age-adjusted rates until 1995, when the rate for Black males surpassed the rate in White males. The rate in Black males increased overall from 1981 until 1999, when it began to decline. The rate in Black males has remained within 10 percent of the rate in White males since 1995.
• Black females had a low incidence rate until 1991. The incidence among Black females began to increase in 1987 and surpassed the rates among White females. On the other hand, the incidence among White females has declined since 1991. In the 23-year period, the incidence increased 32.6 percent among Black females, and decreased 24.5 percent among White females. In 2003, the incidence in Black females was 17 percent higher than the rate in White females.
• The incidence was higher among males than among females. The disparity between male and female incidence rates decreased from 35 percent to 17 percent among Blacks, and varied between 51 percent and 34 percent in Whites.
Bladder
• Age-adjusted incidence rates decreased by 18 percent among Black females and White males, and 10 percent among White females during the 23-year period. The incidence in Black males increased by 3 percent during 1981 to 2003.
• Whites had higher incidence rates than did Blacks. The incidence in White males was more than 2 times the rate among Black males in all years. Among females, the rate in Whites was between 1.2 and 2.3 times the rate in Blacks.
• Males had a higher incidence than did females. Since 1981, the incidence rates in White males were between 3.6 and 4.6 times the rates in White females. Black males had incidence rates between 1.7 and 3.3 times the rates in Black females.
Prostate
• Age-adjusted incidence rates rose 39 percent in Black males and 29 percent in White males during the 23-year period. A peak in rates occurred for both races in 1992 as the PSA test came into general use. Rates have declined 35 percent for Blacks and 43 percent for Whites since that time.
• In 1981, Blacks had an age-adjusted incidence rate 52 percent higher than Whites. In 2003, the rate among Blacks was 64 percent higher than that among Whites.
32 Florida Annual Cancer Report: 2003 Incidence and Mortality

Incidence
Breast
• Age-adjusted incidence rates increased 16 percent among Black females and 2 percent among White females between 1981 and 2003.
• The age-adjusted incidence rates have declined 13 percent since their peak in 1995 among Black females, and 20 percent among Whites since 1998.
Cervix
• Black females had higher incidence rates than White females in all years. The rates declined by 65 percent in Black women. The rate for White females decreased 30 percent over the 23 years. Therefore, the disparity has decreased steadily since 1990. In 1981, the rate among Blacks was 2.4 times the rate among Whites. By 2003, it was 1.2 times the rate among Whites.
Head and Neck
• Males had higher age-adjusted incidence rates than did females in all years. The rates among Black males ranged from 2.7 times to 5.9 times the rates among Black females. Rates among White males ranged from 2.6 times to 3.1 times the rates among White females between 1981 and 2003.
• The incidence in all four sex-race groups has decreased since 1981. The incidence has declined by 51 percent among Black females, and decreased 26 percent among White females. The incidence among Black males has decreased 29 percent, while the decrease in White males was 18 percent.
Non-Hodgkin Lymphoma
• Age-adjusted incidence rates increased for all sex-race groups over the 23-year period. The greatest increase was 138 percent among Black females. The rate increased by 55 percent among Black males, 35 percent among White females, and 50 percent among White males.
• The incidence rates were higher among males than among females. In 2003, White males had an incidence 48 percent higher than that among White females. The rate among Black males was 23 percent higher than among Black females.
Melanoma
• Age-adjusted incidence rates have increased by 64 percent among White males and by 22 percent among White females since 1981.
• The incidence was higher among White males than among White females. The disparity between males and females increased from 25 percent in 1981 to 68 percent in 2003.
33Florida Annual Cancer Report: 2003 Incidence and Mortality
Incidence
Source of data: Florida Cancer Data System
Figure 6.1 Age-Adjusted Incidence Rates by Sex and Race,Florida, 1981-2003
Lung and Bronchus
0
40
80
120
160
1981
1982
1983
1984
1985
1986
1987
1988
1989
1990
1991
1992
1993
1994
1995
1996
1997
1998
1999
2000
2001
2002
2003
Age-Adjusted Rate (per 100,000)
Black Male
White Male
Black Female
White Female
Colorectal
0
30
60
90
1981
1982
1983
1984
1985
1986
1987
1988
1989
1990
1991
1992
1993
1994
1995
1996
1997
1998
1999
2000
2001
2002
2003
Black Male
White Male
Black Female
White Female
Bladder
0
10
20
30
40
50
1981
1982
1983
1984
1985
1986
1987
1988
1989
1990
1991
1992
1993
1994
1995
1996
1997
1998
1999
2000
2001
2002
2003
Black Male
White Male
Black Female
White Female
34 Florida Annual Cancer Report: 2003 Incidence and Mortality

Incidence
Source of data: Florida Cancer Data System
Figure 6.2 Age-Adjusted Incidence Rates by Sex and Race,Florida, 1981-2003
Prostate
0
80
160
240
320
1981
1982
1983
1984
1985
1986
1987
1988
1989
1990
1991
1992
1993
1994
1995
1996
1997
1998
1999
2000
2001
2002
2003
Age-Adjusted Rate (per 100,000)
Black Male
White Male
Breast
0
50
100
150
1981
1982
1983
1984
1985
1986
1987
1988
1989
1990
1991
1992
1993
1994
1995
1996
1997
1998
1999
2000
2001
2002
2003
White Female
Black Female
Cervix
0
10
20
30
40
1981
1982
1983
1984
1985
1986
1987
1988
1989
1990
1991
1992
1993
1994
1995
1996
1997
1998
1999
2000
2001
2002
2003
Black Female
White Female
35Florida Annual Cancer Report: 2003 Incidence and Mortality

Incidence
Source of data: Florida Cancer Data System
Figure 6.3 Age-Adjusted Incidence Rates by Sex and Race,Florida, 1981-2003
Head and Neck
0
10
20
30
40
50
1981
1982
1983
1984
1985
1986
1987
1988
1989
1990
1991
1992
1993
1994
1995
1996
1997
1998
1999
2000
2001
2002
2003
Age-Adjusted Rate (per 100,000)
Black Male
White Male
Black Female
White Female
Non-Hodgkin
0
10
20
30
1981
1982
1983
1984
1985
1986
1987
1988
1989
1990
1991
1992
1993
1994
1995
1996
1997
1998
1999
2000
2001
2002
2003
Black Male
White Male
Black Female
White Female
Melanoma
0
5
10
15
20
25
1981
1982
1983
1984
1985
1986
1987
1988
1989
1990
1991
1992
1993
1994
1995
1996
1997
1998
1999
2000
2001
2002
2003
White Male
White Female
36 Florida Annual Cancer Report: 2003 Incidence and Mortality

Incidence
Age-specifi c Incidence Rates
• Age-specifi c incidence rates for all cancers combined have decreased only in females age 45 to 64 and males age 75 and older since 1981. Age-specifi c incidence rates for all other groups have increased. The largest increase was 47 percent in White males age 20 to 44.
• Age-specifi c incidence rates were lower among Black females than among White females in most years. Among males, the rates were lower among Blacks than among Whites in groups under age 45 years.
• From 2002 to 2003, the rates decreased among Black females except in the 65 to 74 age group, and in every age group among White females, except under age 20. The rates in Black males decreased in groups age 45 and older, while rates for White males decreased in all groups except the 20 to 44 age group.
Source of data: Florida Cancer Data System
Figure 7. Age-Specific Incidence Rates for All Cancersby Sex, Race, and Age Group, Florida, 1981-2003
Black Female
1
10
100
1000
10000
19
81
19
82
19
83
19
84
19
85
19
86
19
87
19
88
19
89
19
90
19
91
19
92
19
93
19
94
19
95
19
96
19
97
19
98
19
99
20
00
20
01
20
02
20
03
Log of Age-Specific Rate (per 100,000)
75+
65-74
45-64
20-44
0-19
White Female
1
10
100
1000
10000
19
81
19
82
19
83
19
84
19
85
19
86
19
87
19
88
19
89
19
90
19
91
19
92
19
93
19
94
19
95
19
96
19
97
19
98
19
99
20
00
20
01
20
02
20
03
Log of Age-Specific Rate (per 100,000)
Black Male
1
10
100
1000
10000
19
81
19
82
19
83
19
84
19
85
19
86
19
87
19
88
19
89
19
90
19
91
19
92
19
93
19
94
19
95
19
96
19
97
19
98
19
99
20
00
20
01
20
02
20
03
Log of Age-Specific Rate (per 100,000)
75+
65-74
45-64
20-44
0-19
White Male
1
10
100
1000
10000
19
81
19
82
19
83
19
84
19
85
19
86
19
87
19
88
19
89
19
90
19
91
19
92
19
93
19
94
19
95
19
96
19
97
19
98
19
99
20
00
20
01
20
02
20
03
Log of Age-Specific Rate (per 100,000)
37Florida Annual Cancer Report: 2003 Incidence and Mortality

Incidence
AVERAGE ANNUAL PERCENT CHANGE
Age-adjusted incidence rates for most cancers fl uctuate over time. Average annual percent change (AAPC) is calculated to quantify the trends in rate. The choice of a baseline year and the number of years included in the calculation infl uence the magnitude and direction of the AAPC. For this report, the beginning year for the AAPC calculation was 1994, the ending year was 2003.
The AAPC calculation is based on the assumption that rates change in a constant manner, either increasing or decreasing over time with only small variations. The AAPC may not be an appropriate measure of change if this assumption is violated. Therefore, caution should be exercised in interpreting the AAPC. A negative value of the AAPC indicates that rates are decreasing, while a positive value of the AAPC means that rates are increasing. In the tables presented, statistically signifi cant fi ndings are denoted with an asterisk (*) to the right of the AAPC value. A detailed description of this calculation appears in the “Methods” section of this report.
Sex and Race
• The AAPC showed signifi cant decreases for all cancers combined, and for all sex and race groups except White females. The only signifi cant increases in AAPC were for melanoma in both White males and females.
Females
• The only increase in AAPC among the major sites was for non-Hodgkin lymphoma in Black females. This increase was not statistically signifi cant.
• Black females had a decreased AAPC for breast, bladder, head and neck, and cervical cancers. Among White females, decreases in AAPC occurred for colorectal, head and neck, and cervical cancers.
Males
• The AAPC decreased signifi cantly for all cancers combined, and for all major sites except bladder cancer in both Black and White males. The AAPC of melanoma increased signifi cantly in White males.
• All major sites for Black males showed signifi cant decreases except colorectal and bladder cancers, for which the decreases were not statistically signifi cant.
• In White males, the AAPC decreased signifi cantly for all cancers combined, lung and bronchus, prostate, colorectal, head and neck cancers, and non-Hodgkin lymphoma. The AAPC for melanoma increased signifi cantly by 1.6 percent per year between 1994 and 2003.
38 Florida Annual Cancer Report: 2003 Incidence and Mortality
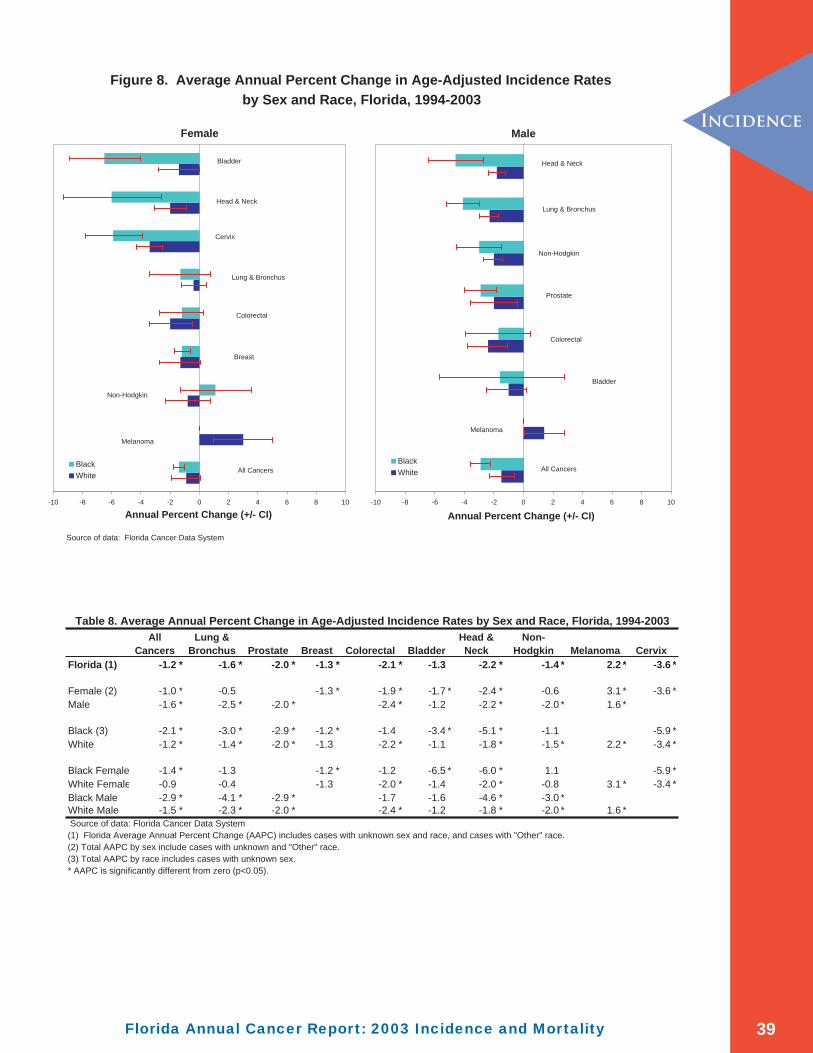
Incidence
AllCancers
Lung & Bronchus Prostate Breast Colorectal Bladder
Head & Neck
Non-Hodgkin Melanoma Cervix
Florida (1) -1.2 * -1.6 * -2.0 * -1.3 * -2.1 * -1.3 -2.2 * -1.4 * 2.2 * -3.6 *
Female (2) -1.0 * -0.5 -1.3 * -1.9 * -1.7 * -2.4 * -0.6 3.1 * -3.6 *Male -1.6 * -2.5 * -2.0 * -2.4 * -1.2 -2.2 * -2.0 * 1.6 *
Black (3) -2.1 * -3.0 * -2.9 * -1.2 * -1.4 -3.4 * -5.1 * -1.1 -5.9 *White -1.2 * -1.4 * -2.0 * -1.3 -2.2 * -1.1 -1.8 * -1.5 * 2.2 * -3.4 *
Black Female -1.4 * -1.3 -1.2 * -1.2 -6.5 * -6.0 * 1.1 -5.9 *White Female -0.9 -0.4 -1.3 -2.0 * -1.4 -2.0 * -0.8 3.1 * -3.4 *Black Male -2.9 * -4.1 * -2.9 * -1.7 -1.6 -4.6 * -3.0 *White Male -1.5 * -2.3 * -2.0 * -2.4 * -1.2 -1.8 * -2.0 * 1.6 * Source of data: Florida Cancer Data System(1) Florida Average Annual Percent Change (AAPC) includes cases with unknown sex and race, and cases with "Other" race.(2) Total AAPC by sex include cases with unknown and "Other" race.(3) Total AAPC by race includes cases with unknown sex.* AAPC is significantly different from zero (p<0.05).
Table 8. Average Annual Percent Change in Age-Adjusted Incidence Rates by Sex and Race, Florida, 1994-2003
39Florida Annual Cancer Report: 2003 Incidence and Mortality
Source of data: Florida Cancer Data System
Figure 8. Average Annual Percent Change in Age-Adjusted Incidence Rates
by Sex and Race, Florida, 1994-2003
Female
All Cancers
Melanoma
Non-Hodgkin
Breast
Colorectal
Lung & Bronchus
Cervix
Head & Neck
Bladder
-10 -8 -6 -4 -2 0 2 4 6 8 10
Annual Percent Change (+/- CI)
Black
White
Male
All Cancers
Melanoma
Bladder
Colorectal
Prostate
Non-Hodgkin
Lung & Bronchus
Head & Neck
-10 -8 -6 -4 -2 0 2 4 6 8 10
Annual Percent Change (+/- CI)
Black
White

Incidence
County
• For all cancers combined, 19 counties had signifi cant decreases in AAPC. Jefferson and Union counties had signifi cant increases in AAPC for all cancers combined.
• The AAPC for cancer of the lung and bronchus decreased signifi cantly in 18 counties. No county had a signifi cant increase in AAPC over this time.
• Seventeen counties had signifi cant decreases in AAPC for prostate cancer, with no county showing a signifi cant increase.
• The AAPC for breast cancer decreased signifi cantly in six counties, with no county showing a signifi cant increase.
• The AAPC for colorectal cancer decreased signifi cantly in 12 counties. No county had a signifi cant increase in the AAPC.
• Six counties had signifi cant decreases in AAPC for bladder cancer. Okaloosa County was the only county with a signifi cant increase at 6.8 percent per year.
• Nine counties had signifi cant decreases in AAPC for head and neck cancer. No county had signifi cant increases in the AAPC.
• The AAPC for non-Hodgkin lymphoma decreased signifi cantly in four counties. No county
had a signifi cant increase in the AAPC.
• The AAPC for melanoma increased signifi cantly in six counties. Okaloosa County had the greatest increase at 7.1 percent per year. No county had a signifi cant decrease.
• The AAPC for cervical cancer decreased signifi cantly in seven counties. The largest decrease was 7.3 percent per year in Volusia County. There were no counties with a signifi cant increase.
40 Florida Annual Cancer Report: 2003 Incidence and Mortality

Incidence
41Florida Annual Cancer Report: 2003 Incidence and Mortality
Florida -1.2 * -1.6 * -2.0 * -1.3 * -2.1 * -1.3 -2.2 * -1.4 * 2.2 * -3.6 *
Alachua -1.9 * -1.9 -4.7 * 0.1 -0.5 -5.2 * -5.4 * 1.8 0.8 ^Baker -0.6 -0.7 ^ ^ ^ ^ ^ ^ ^ ^Bay -1.2 -1.9 * -3.4 0.0 0.2 0.4 -3.6 -0.3 2.8 ^Bradford -4.8 * -4.9 -10.0 * ^ ^ ^ ^ ^ ^ ^Brevard -0.8 * -1.1 -2.7 * 0.2 -2.4 * 0.0 -2.5 -0.9 1.7 -2.3Broward -1.1 -2.0 * -0.6 -1.3 -1.6 -1.3 -2.2 * -1.4 0.9 -3.6 Calhoun -2.4 ^ ^ ^ ^ ^ ^ ^ ^ ^Charlotte -0.9 -1.7 1.0 -1.3 -1.2 -2.6 -1.6 0.1 -2.9 ^Citrus -0.6 -1.0 3.2 0.8 -4.1 -3.0 -0.9 -1.4 -3.2 ^Clay -0.4 -0.5 -2.0 -1.9 -0.8 -0.8 -0.6 0.0 7.4 ^Collier -1.2 -2.1 * 1.1 -2.4 * -4.2 * -1.4 -6.9 * -3.1 * 2.1 ^Columbia -0.6 1.7 -4.4 * -1.2 0.7 ^ ^ ^ ^ ^ Miami-Dade -1.4 * -2.8 * -2.0 * -1.2 * -1.2 -1.6 * -3.6 * -2.2 * 2.4 * -2.5 *DeSoto -1.5 -1.8 0.1 1.6 -4.0 ^ ^ ^ ^ ^Dixie -0.6 ^ ^ ^ ^ ^ ^ ^ ^ ^Duval -1.5 * -2.2 * -2.6 * -1.3 -2.2 * -0.1 -2.5 * -1.4 3.2 -2.9Escambia -0.9 -1.7 -1.8 0.4 -2.7 -0.4 -1.2 1.1 -0.5 -4.7 *Flagler -1.7 * -2.9 * -2.2 * 0.3 -5.1 -0.1 -5.7 * -1.7 ^ ^Franklin -2.2 ^ ^ ^ ^ ^ ^ ^ ^ ^Gadsden 1.2 2.9 0.2 0.6 -1.0 ^ ^ ^ ^ ^Gilchrist -2.3 ^ ^ ^ ^ ^ ^ ^ ^ ^Glades -6.0 * ^ ^ ^ ^ ^ ^ ^ ^ ^Gulf -2.0 -6.1 ^ ^ ^ ^ ^ ^ ^ ^Hamilton -4.4 ^ ^ ^ ^ ^ ^ ^ ^ ^Hardee -0.6 -2.6 ^ ^ ^ ^ ^ ^ ^ ^Hendry -0.2 -2.3 3.4 ^ -0.2 ^ ^ ^ ^ ^Hernando -0.9 -0.1 -1.7 -2.7 -0.9 -1.7 0.8 -0.5 -2.4 ^Highlands -1.0 1.3 -0.5 -1.5 -3.0 -5.0 -4.2 -0.6 -2.2 ^Hillsborough -1.5 * -2.5 * -1.9 -2.1 * -2.3 * -1.7 -4.1 * -1.3 2.4 -4.8 *Holmes -1.0 -5.1 ^ ^ ^ ^ ^ ^ ^ ^Indian River -2.4 * -3.4 * -3.8 * -2.8 -2.3 0.1 -0.1 -0.9 3.6 * ^ Jackson -2.5 -5.6 -2.5 -3.8 -2.3 ^ ^ ^ ^ ^Jefferson 2.8 * ^ ^ ^ ^ ^ ^ ^ ^ ^Lafayette 3.2 ^ ^ ^ ^ ^ ^ ^ ^ ^Lake -0.3 -0.6 -2.4 -0.3 -1.2 -0.4 -0.3 1.5 4.1 ^Lee -1.7 * -2.1 * -0.9 -0.9 -4.1 * -4.4 * -2.1 -1.9 1.6 -4.0Leon 0.5 2.6 -3.0 * 0.2 1.1 -4.5 0.7 1.9 6.8 ^ Levy -2.1 * ^ ^ ^ ^ ^ ^ ^ ^ ^Liberty 0.7 ^ ^ ^ ^ ^ ^ ^ ^ ^Madison -0.2 -2.5 ^ ^ ^ ^ ^ ^ ^ ^Manatee -1.7 * -1.0 -2.6 * -2.0 -3.0 * -2.9 * -2.8 -3.1 -2.2 ^Marion -1.4 -1.7 * -1.7 -2.0 -1.0 -3.1 -4.4 * -1.1 3.0 ^Martin -1.0 * -1.8 0.4 -0.8 -3.0 * -3.9 -2.8 -4.1 6.2 * ^Monroe -1.3 * -0.6 -4.4 -1.0 -0.2 -1.9 -1.5 -6.5 * 4.3 ^ Nassau -0.5 -2.3 2.5 -1.6 -0.8 ^ ^ ^ ^ ^Okaloosa 0.8 -2.5 0.5 1.0 2.1 6.8 * -1.9 1.9 7.1 * ^Okeechobee -1.2 -4.4 * 2.4 -0.7 -5.0 ^ ^ ^ ^ ^Orange -1.9 * -2.5 * -4.0 * -2.0 * -3.0 * 0.3 -2.2 * -1.0 0.8 -4.5 *Osceola -2.0 * -2.0 -6.7 * -0.6 -2.4 -3.5 -1.6 -2.4 ^ ^Palm Beach -1.7 * -1.7 * -4.3 * -2.3 * -2.8 * -0.1 -0.9 -2.0 * 5.4 * -5.5 *Pasco -1.0 -1.3 * -1.1 -1.3 -3.4 * -0.4 -1.1 -2.2 3.1 -3.4Pinellas -1.3 * -0.6 -3.6 * -1.1 -1.7 -1.2 -0.8 -2.6 -0.8 -2.5 *Polk 0.1 -1.1 0.1 0.3 0.1 -2.3 -2.4 1.0 5.3 * -3.8Putnam -0.3 0.9 -1.8 0.5 -1.9 1.1 1.5 ^ ^ ^Saint Johns -2.4 * -2.8 * -4.0 * -1.5 -5.0 * -1.4 0.4 -0.8 1.8 ^Saint Lucie -1.6 -2.8 * -0.9 -1.8 -3.8 -2.9 * -1.9 -2.1 1.0 ^Santa Rosa 0.2 -1.0 1.3 -0.8 0.1 4.4 0.9 -0.1 ^ ^Sarasota -1.1 -1.1 -1.5 -1.8 -1.3 -0.8 -0.5 0.4 -0.5 3.2Seminole -0.9 -1.8 * -1.5 -1.3 -2.4 0.9 0.2 0.5 2.2 ^Sumter -3.4 -3.2 -6.8 * -1.4 -3.3 -9.5 * ^ ^ ^ ^Suwannee -1.5 3.1 -5.9 * -2.7 -1.6 ^ ^ ^ ^ ^Taylor -1.1 1.0 ^ ^ ^ ^ ^ ^ ^ ^Union 3.7 * 3.8 ^ ^ ^ ^ ^ ^ ^ ^Volusia -0.8 0.1 -0.5 -2.3 * -2.5 * 1.1 -1.1 -1.2 0.6 -7.3 *Wakulla -0.5 1.5 ^ ^ ^ ^ ^ ^ ^ ^Walton -1.5 -4.1 * -2.1 ^ -0.9 ^ ^ ^ ^ ^Washington -4.0 -4.7 ^ ^ ^ ^ ^ ^ ^ ^
* AAPC is significantly different from zero, p<0.05. Source of data: Florida Cancer Data System
^ Statistics are not displayed for cells with fewer than 10 cases.
Table 9. Average Annual Percent Change in Age-Adjusted Incidence Rates by County, Florida, 1994-2003
AllCancers
Lung & Bronchus
Head & Neck
Non-HodgkinProstate Breast Colorectal Bladder CervixMelanoma

Incidence
STAGE OF CANCER AT DIAGNOSIS
In this report, early stage cancer is defi ned as local stage, with the addition of in situ cancers of the bladder. Advanced stage includes cancer diagnosed at regional and distant stages.
• The percentage of cancer that was not staged decreased from 22 percent in 1981 to 17 percent in 2003.
• The percentage of cancer cases diagnosed at early stage increased from 37 percent in 1981 to 43 percent in 2003, while the percentage of cases presenting at advanced stage decreased from 41 percent to 40 percent.
Source of data: Florida Cancer Data System
Figure 9. All Cancers by Stage, Florida, 1981-2003
0
20
40
60
80
100
1981
1982
1983
1984
1985
1986
1987
1988
1989
1990
1991
1992
1993
1994
1995
1996
1997
1998
1999
2000
2001
2002
2003
Thousands
Early (0-1) Regional (2-5) Distant (7) Unstaged (9)
Sex and Race
• For all cancers combined, females had more cancers diagnosed at advanced stage (44 percent) than males (38 percent) in 2003. Females also had a higher percent of advanced stage bladder cancer.
• Blacks had a higher percent of cancer diagnosed at advanced stage for all cancers combined (46 percent) than did Whites (40 percent). Blacks also had a higher percent of cancer diagnosed in advanced stage for all major cancer sites.
• The largest racial disparity was in bladder cancer, for which the percent of bladder cancer diagnosed in advanced stages among Blacks was 2.4 times the percent among Whites. The percent of prostate cancer and breast cancer diagnosed in advanced stages among Blacks was 80 percent and 43 percent, respectively, higher than that among Whites.
County
• The percentage of all cancers combined diagnosed at advanced stage varied by county, from 56 percent in Union County to 34 percent in Jackson County.
42 Florida Annual Cancer Report: 2003 Incidence and Mortality

Incidence
AllCancers
Lung & Bronchus Prostate Breast Colorectal Bladder
Head & Neck
Non-Hodgkin Melanoma Cervix
Florida 40.3 62.8 8.2 31.5 52.5 8.2 47.5 53.2 14.0 41.9
Female 43.5 61.1 31.5 52.6 9.0 44.8 52.1 11.3 41.9Male 37.5 64.2 8.2 52.4 7.9 48.5 54.1 15.6
Black 45.8 68.3 13.5 43.3 61.8 18.5 57.3 63.5 51.1White 39.8 62.4 7.5 30.3 51.6 7.8 46.6 52.5 14.1 40.2
Black Female 50.5 68.4 43.3 59.2 19.3 56.2 58.3 51.1White Female 42.9 60.7 30.3 51.8 8.4 44.1 52.0 11.6 40.2Black Male 41.6 68.3 13.5 64.8 18.0 57.4 68.4White Male 37.1 63.8 7.5 51.5 7.6 47.6 53.0 15.7 Source of data: Florida Cancer Data System(1) Advanced stage includes all regional and distant disease.
Table 10. Percentage of Advanced Stage(1) Cancer at Diagnosis by Sex and Race, Florida, 2003
• Of the cancers for which screening methods are available, the highest percentages of advanced stage cancer at diagnosis were 16 percent for prostate cancer in Indian River County, 83 percent for breast cancer in Taylor County, 79 percent for colorectal cancer in Hendry County, and 56 percent for cervical cancer in Seminole County.
• The lowest percentages of advanced stage cancer at diagnosis for cancers for which screening is available were 5 percent for prostate cancer in Collier County, 22 percent for breast cancer in Okaloosa County, 38 percent for colorectal cancer in Nassau County, and 36 percent for cervical cancer in Palm Beach County.
Age
• Fifty-six percent of all cancers occurring in Floridians less than age 20 were diagnosed at advanced stage. Persons between 20 and 44 were more often diagnosed at advanced stage than people in other age groups for cancers of the lung and bronchus, breast and colorectal, and non-Hodgkin lymphoma.
• Females had lower percentages of advanced stage melanoma than males in the groups less than age 65, and higher percentages in the 65 and older age groups. Females had lower percentages of advanced stage cancer of the lung and bronchus than males in all age groups.
• Blacks had higher percentages of cancer diagnosed at advanced stage than Whites in most age groups for most cancer sites. The exceptions were all cancers combined in the 0 to 19 age group.
• For the cancers that have screening methods available, Blacks had higher percentages of advanced stage than did Whites in all age groups.
43Florida Annual Cancer Report: 2003 Incidence and Mortality

Incidence
44 Florida Annual Cancer Report: 2003 Incidence and Mortality
AllCancers
Lung & Bronchus Prostate Breast Colorectal Bladder
Head & Neck
Non-Hodgkin Melanoma Cervix
Florida 40.3 62.8 8.2 31.5 52.5 8.2 47.5 53.2 14.0 41.9
Alachua 46.0 65.6 10.1 35.3 56.9 ^ 60.6 68.8 ^ ^Baker 49.5 78.9 ^ ^ ^ ^ ^ ^ ^ ^Bay 41.4 69.4 ^ 36.0 48.8 ^ 54.5 44.0 ^ ^Bradford 43.4 76.5 ^ ^ ^ ^ ^ ^ ^ ^Brevard 42.0 68.2 8.0 35.4 50.7 5.9 47.7 59.8 24.6 44.0Broward 38.7 61.6 7.5 30.1 48.4 4.8 45.1 53.1 10.2 40.8Calhoun 41.2 60.0 ^ ^ ^ ^ ^ ^ ^ ^Charlotte 34.5 47.0 5.8 31.2 56.3 ^ 32.2 38.3 ^ ^Citrus 37.6 61.3 10.0 30.5 55.5 ^ 36.6 36.4 ^ ^Clay 46.0 69.8 11.9 39.1 58.9 ^ 61.5 ^ ^ ^Collier 38.2 64.7 5.4 27.1 56.6 ^ 38.2 57.0 ^ ^Columbia 39.0 60.6 ^ 34.3 44.7 ^ ^ ^ ^ ^Miami-Dade 39.1 58.4 6.8 34.5 55.8 10.0 48.2 52.2 9.7 46.1DeSoto 36.8 56.0 ^ ^ 53.8 ^ ^ ^ ^ ^Dixie 44.3 53.8 ^ ^ ^ ^ ^ ^ ^ ^Duval 45.3 68.3 10.2 36.1 59.1 10.7 57.4 61.2 19.4 50.0Escambia 44.5 73.2 12.0 33.3 52.6 17.2 48.6 61.3 ^ ^Flagler 35.7 65.4 ^ 24.1 52.7 ^ ^ 55.6 ^ ^Franklin 34.6 ^ ^ ^ ^ ^ ^ ^ ^ ^Gadsden 47.3 75.0 ^ 54.5 ^ ^ 78.6 ^ ^ ^Gilchrist 43.5 76.5 ^ ^ ^ ^ ^ ^ ^ ^Glades 42.9 ^ ^ ^ ^ ^ ^ ^ ^ ^Gulf 43.0 ^ ^ ^ ^ ^ ^ ^ ^ ^Hamilton 39.4 ^ ^ ^ ^ ^ ^ ^ ^ ^Hardee 44.5 52.4 ^ ^ ^ ^ ^ ^ ^ ^Hendry 48.0 64.7 ^ ^ 78.6 ^ ^ ^ ^ ^Hernando 40.3 69.3 8.3 26.0 49.7 ^ 43.9 57.1 ^ ^Highlands 45.9 73.2 11.7 23.9 54.7 24.4 53.8 61.5 ^ ^Hillsborough 39.7 60.8 7.9 32.9 47.8 9.7 53.4 52.2 18.6 43.6Holmes 39.7 ^ ^ ^ ^ ^ ^ ^ ^ ^Indian River 45.1 67.7 16.2 28.4 53.6 ^ 51.6 60.7 ^ ^Jackson 34.0 35.7 ^ ^ 45.5 ^ ^ ^ ^ ^Jefferson 40.0 ^ ^ ^ ^ ^ ^ ^ ^ ^Lafayette 48.4 ^ ^ ^ ^ ^ ^ ^ ^ ^Lake 42.4 70.5 8.6 28.4 55.0 8.9 47.7 62.9 ^ ^Lee 38.9 57.8 11.3 30.9 56.8 8.8 43.7 49.6 9.9 ^Leon 43.7 72.3 15.6 32.8 60.0 ^ 54.8 55.9 ^ ^Levy 54.5 62.5 ^ ^ 66.7 ^ 81.3 ^ ^ ^Liberty 42.4 ^ ^ ^ ^ ^ ^ ^ ^ ^Madison 36.6 ^ ^ ^ ^ ^ ^ ^ ^ ^Manatee 43.0 69.5 7.5 27.6 55.4 ^ 40.6 60.5 ^ ^Marion 42.2 65.7 9.7 23.9 52.6 ^ 41.5 63.2 ^ ^Martin 40.6 70.8 9.4 27.1 49.2 ^ 53.7 50.0 18.2 ^Monroe 40.3 55.3 ^ 42.9 52.8 ^ 42.9 ^ ^ ^Nassau 41.1 60.3 ^ 36.4 38.2 ^ ^ ^ ^ ^Okaloosa 34.8 52.9 ^ 22.3 50.5 ^ 36.7 58.8 ^ ^Okeechobee 42.6 56.9 ^ ^ ^ ^ ^ ^ ^ ^Orange 43.2 70.5 7.8 33.8 59.8 13.8 56.5 57.5 10.3 37.3Osceola 41.7 65.0 ^ 35.8 56.8 ^ 37.0 47.1 ^ ^Palm Beach 38.1 62.5 6.0 30.0 51.4 5.3 51.4 51.3 10.5 35.7Pasco 35.4 54.9 5.8 26.7 47.6 7.5 38.1 31.3 22.1 ^Pinellas 39.3 57.6 9.1 30.8 49.7 6.0 41.6 51.5 14.6 41.5Polk 41.3 62.6 10.3 24.2 51.4 10.9 37.1 61.5 15.4 40.0Putnam 42.6 61.8 ^ 47.3 53.1 ^ 45.5 63.2 ^ ^Saint Johns 37.7 53.4 ^ 30.6 56.6 ^ 62.5 35.5 ^ ^Saint Lucie 39.7 60.4 11.9 34.8 50.3 19.3 31.3 55.3 ^ ^Santa Rosa 41.1 61.9 ^ 36.3 52.1 ^ 58.7 ^ ^ ^Sarasota 39.6 62.1 7.0 28.6 50.3 5.6 46.8 50.0 17.3 ^Seminole 41.6 70.4 8.0 36.4 64.9 ^ 51.1 49.2 18.3 55.6Sumter 47.2 66.4 ^ 31.9 59.6 ^ ^ 66.7 ^ ^Suwannee 38.8 55.8 ^ ^ 50.0 ^ ^ ^ ^ ^Taylor 47.6 64.0 ^ 83.3 ^ ^ ^ ^ ^ ^Union 55.8 77.8 ^ ^ ^ ^ ^ ^ ^ ^Volusia 39.7 62.1 7.2 31.4 44.6 10.4 48.4 45.8 16.2 ^Wakulla 40.8 73.3 ^ ^ ^ ^ ^ ^ ^ ^Walton 42.2 57.9 ^ ^ ^ ^ ^ ^ ^ ^Washington 36.8 ^ ^ ^ ^ ^ ^ ^ ^ ^
(1) Advanced stage includes all regional and distant disease. Source of data: Florida Cancer Data System^ Statistics are not displayed for cells with fewer than 10 advanced stage cases.
Table 11. Percentage of Advanced Stage (1) Cancer at Diagnosis by County, Florida, 2003

Incidence
45Florida Annual Cancer Report: 2003 Incidence and Mortality
AllCancers
Lung & Bronchus Prostate Breast Colorectal Bladder
Head & Neck
Non-Hodgkin Melanoma Cervix
Florida 40.3 62.8 8.2 31.5 52.5 8.2 47.5 53.2 14.0 41.9
0-19 55.8 ^ ^ ^ ^ ^ 75.0 67.3 ^ ^20-44 42.6 75.0 21.7 44.5 64.9 ^ 55.7 57.6 13.4 34.045-64 42.1 70.0 10.7 35.3 56.3 10.7 53.4 53.6 15.4 46.465-74 38.3 63.0 6.5 27.0 53.9 8.0 44.1 54.0 12.6 44.975+ 39.5 56.4 7.5 24.4 48.3 7.4 37.5 50.3 14.0 53.1
Female 0-19 54.6 ^ ^ ^ ^ ^ 57.1 ^ ^20-44 41.4 73.1 44.5 68.1 ^ 52.7 52.4 10.4 34.045-64 44.5 69.6 35.3 57.0 12.0 48.6 54.4 10.5 46.465-74 44.3 61.6 27.0 55.4 8.5 42.8 52.2 12.7 44.975+ 42.3 54.1 24.4 47.8 8.1 39.5 50.2 12.3 53.1
Male 0-19 57.0 ^ ^ ^ ^ ^ 73.5 ^20-44 44.3 76.8 21.7 62.1 ^ 57.1 60.3 17.145-64 40.0 70.3 10.7 55.7 10.3 54.8 53.0 18.565-74 34.1 64.2 6.5 52.7 7.8 44.5 55.6 12.575+ 36.9 58.5 7.5 48.9 7.1 36.5 50.5 14.8
Black 0-19 50.8 ^ ^ ^ ^ ^ ^ ^ ^20-44 51.9 78.6 ^ 52.3 68.1 ^ 70.0 66.7 35.445-64 47.2 72.5 14.9 45.5 61.9 29.4 61.3 59.6 56.365-74 43.1 67.9 9.3 33.2 63.9 ^ 55.3 67.4 57.775+ 42.6 58.4 17.0 37.4 57.1 ^ ^ 60.7 ^
White 0-19 57.2 ^ ^ ^ ^ ^ ^ 65.1 ^ ^20-44 41.1 74.2 ^ 43.3 64.1 ^ 53.5 55.4 13.5 34.445-64 41.4 69.7 9.9 34.0 55.3 9.5 52.5 53.0 15.6 44.765-74 38.0 62.8 6.2 26.3 53.4 7.7 43.2 53.5 12.6 38.575+ 39.3 56.3 6.6 23.8 47.8 7.2 38.2 50.3 14.0 48.6
Black Female 0-19 48.4 ^ ^ ^ ^ ^ ^ ^20-44 50.5 80.8 52.3 73.0 ^ ^ 60.7 35.445-64 52.3 73.6 45.5 56.9 ^ 65.6 59.2 56.365-74 51.3 68.2 33.2 60.7 ^ ^ 60.7 57.775+ 46.5 56.0 37.4 57.7 ^ ^ ^ ^
White Female 0-19 56.0 ^ ^ ^ ^ ^ ^ ^ ^20-44 40.4 71.8 43.3 66.4 ^ 50.8 50.5 10.6 34.445-64 43.5 69.4 34.0 56.6 10.4 47.1 54.6 10.8 44.765-74 43.7 61.2 26.3 55.1 7.2 42.7 52.2 13.0 38.575+ 42.1 54.0 23.8 47.2 8.1 40.4 50.2 12.5 48.6
Black Male 0-19 53.2 ^ ^ ^ ^ ^ ^20-44 54.2 76.7 ^ 62.9 ^ 73.7 70.245-64 43.0 71.9 14.9 68.0 28.6 60.3 60.065-74 37.5 67.7 9.3 66.9 ^ 55.9 80.075+ 38.4 59.9 17.0 56.2 ^ ^ ^
White Male 0-19 58.4 ^ ^ ^ ^ ^ 70.4 ^20-44 42.3 76.5 ^ 62.0 ^ 54.7 57.9 17.245-64 39.5 70.0 9.9 54.3 9.2 54.2 51.8 18.665-74 34.0 64.1 6.2 52.0 7.8 43.4 54.7 12.475+ 36.8 58.4 6.6 48.5 6.9 37.1 50.3 14.8
(1) Advanced stage includes all regional and distant disease. Source of data: Florida Cancer Data System
^ Statistics are not displayed for cells with fewer than 10 advanced stage cases.
Table 12. Percentage of Advanced Stage (1) Cancer at Diagnosis by Sex, Race, and Age Group, Florida, 2003

Florida Annual Cancer Report: 2003 Incidence and Mortality
Incidence
Trends
• Cancer of the lung and bronchus diagnosed at advanced stage has increased since 1981 for all sex-race groups except Black females. The percentages increased by 9 percent among White females, 11 percent among Black males, and 12 percent among White males. For Black females, the percentage declined by 1 percent.
• The percentages of colorectal cancer diagnosed at advanced stage showed no appreciable change in all sex-race groups since 1981 except a decrease in Black females from 66 percent in 1981 to 59 percent in 2003.
• Bladder cancer diagnosed at advanced stage decreased in all sex-race groups, with the largest decreases in Blacks: from 31 percent to 19 percent in Black females and from 30 percent to 18 percent in Black males. Declines in Whites were smaller, from 12 to 8 percent for White females, and 10 to 8 percent for White males.
• Prostate cancer diagnosed at advanced stages reduced signifi cantly in the 23 years. The percentage decreased by 64 percent in Black males and by 68 percent in White males.
• The percentages of breast cancer diagnosed at advanced stage declined by 24 percent in Black females and by 14 percent in White females.
• Cervical cancer diagnosed at advanced stage increased signifi cantly during 1981 to 2003. The percentages increased by 24 percent from 41 percent in 1981 to 51 percent in 2003 among Black females and by 57 percent from 26 percent in 1981 to 40 percent in 2003 among White females.
• The percentages of head and neck cancer diagnosed at advanced stage increased in all sex-race groups, with greater increases for Whites (by 19 percent among White females, and 33 percent among White males) than for Blacks (by 3 percent among Black females and 9 percent among Black males).
• Non-Hodgkin lymphoma diagnosed at advanced stage declined from 77 percent to 58 percent in Black females, but increased slightly for all other sex-race groups: from 49 percent to 52 percent in White females, from 48 percent to 53 percent in White males, and from 66 percent to 68 percent in Black males.
• Melanoma diagnosed at advanced stage increased from 10 percent to 12 percent in White
females and decreased from 19 percent to 16 percent in White males.
46

Florida Annual Cancer Report: 2003 Incidence and Mortality
Source of data: Florida Cancer Data System
Figure 10.1 Percentage of Advanced Stage Cancer at Diagnosisby Sex and Race, Florida, 1981-2003
Lung and Bronchus
0
20
40
60
80
1981
1982
1983
1984
1985
1986
1987
1988
1989
1990
1991
1992
1993
1994
1995
1996
1997
1998
1999
2000
2001
2002
2003
Percent
Black Male
White Male
Black Female
White Female
Colorectal
0
25
50
75
1981
1982
1983
1984
1985
1986
1987
1988
1989
1990
1991
1992
1993
1994
1995
1996
1997
1998
1999
2000
2001
2002
2003
Black Male
White Male
Black Female
White Female
Bladder
0
10
20
30
40
1981
1982
1983
1984
1985
1986
1987
1988
1989
1990
1991
1992
1993
1994
1995
1996
1997
1998
1999
2000
2001
2002
2003
Black Male
White Male
Black Female
White Female
47
Incidence

Florida Annual Cancer Report: 2003 Incidence and Mortality
Incidence
Source of data: Florida Cancer Data System
Figure 10.2 Percentage of Advanced Stage Cancer at Diagnosisby Sex and Race, Florida, 1981-2003
Breast
0
20
40
60
1981
1982
1983
1984
1985
1986
1987
1988
1989
1990
1991
1992
1993
1994
1995
1996
1997
1998
1999
2000
2001
2002
2003
Black Female
White Female
Prostate
0
15
30
45
1981
1982
1983
1984
1985
1986
1987
1988
1989
1990
1991
1992
1993
1994
1995
1996
1997
1998
1999
2000
2001
2002
2003
Percent
Black Male
White Male
Cervix
0
20
40
60
1981
1982
1983
1984
1985
1986
1987
1988
1989
1990
1991
1992
1993
1994
1995
1996
1997
1998
1999
2000
2001
2002
2003
Black Female
White Female
48

Florida Annual Cancer Report: 2003 Incidence and Mortality
Source of data: Florida Cancer Data System
Figure 10.3 Percentage of Advanced Stage Cancer at Diagnosisby Sex and Race, Florida, 1981-2003
Head and Neck
0
25
50
75
1981
1982
1983
1984
1985
1986
1987
1988
1989
1990
1991
1992
1993
1994
1995
1996
1997
1998
1999
2000
2001
2002
2003
Percent
Black Male
White Male
Black Female
White Female
Non-Hodgkin
0
30
60
90
1981
1982
1983
1984
1985
1986
1987
1988
1989
1990
1991
1992
1993
1994
1995
1996
1997
1998
1999
2000
2001
2002
2003
Black Male
White Male
Black Female
White Female
Melanoma
0
5
10
15
20
1981
1982
1983
1984
1985
1986
1987
1988
1989
1990
1991
1992
1993
1994
1995
1996
1997
1998
1999
2000
2001
2002
2003
White Male
White Female
49
Incidence

Florida Annual Cancer Report: 2003 Incidence and Mortality
Screening
CANCER SCREENING
The Florida Behavioral Risk Factor Surveillance System (BRFSS) is an anonymous telephone survey of a sample of adults age 18 and older in households with telephones. Survey respondents are randomly selected to ensure that survey data will be representative of all adults in Florida. The Florida BRFSS survey follows a protocol developed by the CDC to ensure the quality of the survey and comparability of the data among states. For this report, cancer screening data for breast, cervical, and prostate cancers from the 2004 Florida BRFSS and colorectal cancer from the 2005 BRFSS were analyzed for current screening utilization patterns. In addition, cancer screening trends were analyzed utilizing available data from the 1987 BRFSS to the 2005 BRFSS.
More detailed data from the Florida BRFSS surveys can be found on the Florida Department of Health web site at www.doh.state.fl .us/disease_ctrl/epi/brfss/index.htm. BRFSS results by state since 1990 are available at apps.nccd.cdc.gov/brfss/TrendData.asp.
BREAST CANCER
Mammogram
• Among females age 40 and older, 77 percent has had a mammogram within the past two years. The national average was 74.7 percent.
• The prevalence of receiving a mammogram within two years among Black females was similar to that among White females.
• Eighty-two percent of females age 65 and older and 79 percent of females age 45 to 64 were screened for breast cancer by mammogram compared to 55 percent of females age 40 to 44. The current FCDS data show that the highest percentage of advanced stage breast cancer occurs among females age 20 to 44.
• Approximately 78 percent of females with a high school education or more has had a mammogram within the past two years compared to 63 percent of females with less than a high school education.
• Nearly twice as many females with health insurance had mammograms as females without health insurance (81 percent versus 44 percent).
• The prevalence of receiving a mammogram among both White and Black females increased by 115 percent and 57 percent, respectively, from 1987 to 2004.
Clinical Breast Exam
• Seventy-nine percent of Florida females had a clinical breast exam within the past two years.
• There was no difference in the prevalence of a clinical breast exam between Black females (81 percent) and White females (79 percent).
50

Florida Annual Cancer Report: 2003 Incidence and Mortality
Screening
• Clinical breast exams were more prevalent than mammograms among females age 40 to 44 (74 percent versus 55 percent). Females age 45 to 64 had the greatest prevalence of clinical breast examination (84 percent).
• The prevalence of clinical breast exams increased with the attainment of higher education. Among females who had more than a high school education, 83 percent had a clinical breast exam within the past two years compared to 65 percent of females who did not complete high school.
• The higher the annual household income, the higher the prevalence of clinical breast exams. Nearly 93 percent of females with an annual household income greater than $75,000 had a clinical breast exam compared to 68 percent of females with an annual household income less than $25,000.
• More than 8 out of 10 females with health insurance had a clinical breast exam compared to 1 out of 2 females with no health insurance coverage.
SampleSize Prevalence
SampleSize Prevalence
Florida 3221 76.5 74.4 78.6 3180 78.7 76.6 80.8
Black 311 81.7 76.2 87.2 313 81.0 75.1 86.8White 2732 76.2 73.9 78.5 2690 78.7 76.5 81.0
Age40-44 382 54.6 47.7 61.4 381 73.7 67.2 80.245-64 1522 79.4 76.6 82.2 1515 83.5 80.9 86.265+ 1317 82.4 79.7 85.1 1284 74.5 71.2 77.8
Education< High School 373 63.3 55.7 70.9 367 64.9 57.3 72.5HS Graduate/GED 1100 76.8 73.4 80.3 1079 75.0 71.3 78.7> High School 1738 78.8 76.0 81.5 1724 83.3 80.8 85.9
Household Income<$25,000 1020 69.5 65.2 73.9 1000 67.7 63.2 72.1$25,000-$49,999 818 78.3 74.4 82.2 806 83.1 79.6 86.5$50,000-$74,999 355 77.1 70.8 83.3 354 85.7 80.5 91.0$75,000+ 425 85.5 81.2 89.9 426 92.6 89.0 96.2
Health InsuranceYes 2838 81.1 79.2 83.1 2801 82.9 81.0 84.8No 373 43.8 36.6 51.0 369 49.6 42.1 57.2
Source of data: Florida BRFSS
Table 13. Prevalence of Females Age 40 and Older Who Received Breast Screening in the Past Two Years, Florida, 2004
Mammogram Clinical Breast Exam
CI CI
51

Florida Annual Cancer Report: 2003 Incidence and Mortality
Screening
Figure 11: Prevalence of Receiving a Mammogram in Two years among Females 40 Years and Older,
Florida, 1987-2004
0
10
20
30
40
50
60
70
80
90
19871988
19891990
19911992
19931994
19951996
19971998
19992000
20012002
20032004
Perc
ent
WhiteBlack
CERVICAL CANCER
Pap Smear
• In 2004, 79 percent of females age 18 and older in Florida had a Papanicolau (Pap) smear test within the past two years.
• There was no difference in the prevalence of Pap smear testing between Black females (81 percent) and White females (79 percent).
• Females age 65 and older had a lower prevalence (68 percent) of Pap smear testing than did females under age 65.
• Females who have continued their education beyond high school had the greatest prevalence of Pap smear testing (83 percent), and females with less than a high school education had the lowest prevalence (65 percent).
• The prevalence of Pap smear testing increased as household income increased. For females with the highest annual household incomes, the prevalence of Pap smear testing was 93 percent. The prevalence went down to 68 percent among females with an annual household income less than $25,000.
• Pap smear testing among females with health insurance (83 percent) was more prevalent than among females with no health insurance coverage (63 percent).
• The prevalence of having ever had a Pap smear test among women was stable between 1991 and 2004. The prevalence was 94 percent or higher among White females, and 89 percent or higher among Black females in the past 14 years.
52

Florida Annual Cancer Report: 2003 Incidence and Mortality
Screening
Sample Size PrevalenceFlorida 3032 78.8 76.7 80.9
Black 365 81.3 75.9 86.8White 2411 79.2 76.7 81.6
Age18-44 1386 80.5 77.4 83.645-64 953 82.6 79.0 86.265+ 656 67.5 62.7 72.3
Education< High School 306 65.0 56.7 73.3HS Graduate/GED 907 76.1 72.3 80.0> High School 1813 82.5 79.9 85.1
Household Income<$25,000 877 67.7 62.7 72.7$25,000-$49,999 792 79.5 75.6 83.4$50,000-$74,999 416 87.2 83.0 91.4$75,000+ 478 92.8 89.6 96.0
Health InsuranceYes 2502 83.0 80.9 85.1No 521 62.7 56.6 68.8
Source of data: Florida BRFSS(1) Women age 18 and older, except those who had hysterectomies;
Pap Smear Test CI
Table 14. Prevalence of Receiving Cervical Screening among Females (1) in the Past Two Years, Florida, 2004
Figure 12. Prevalence of Ever Having a Pap Smear among Females 18 Years and Older
Florida, 1991-2004
0
20
40
60
80
100
19911992
19931994
19951996
19971998
19992000
20012002
20032004
Perc
ent
WhiteBlack
53

Florida Annual Cancer Report: 2003 Incidence and Mortality
Screening
PROSTATE CANCER
Prostate-Specifi c Antigen Test
• Fifty-six percent of males age 40 and older had a prostate-specifi c antigen (PSA) test in the past two years. The Florida prevalence was higher than the national average (52.1 percent). Among males 65 and older, 80 percent had a PSA test within the past two years.
• The prevalence of PSA screening was higher among males with more than a high school education (59 percent) and among those with health insurance (60 percent) than among males without a high school education (41 percent) or who had no medical insurance (29 percent).
• During 2000 to 2004, the prevalence of PSA screening among White males was 60 percent or higher, except in 2004 when the prevalence of ever having a PSA test was 56.9 percent. The prevalence among Black males fl uctuated between 38 percent and 66 percent during the time period 2000 to 2004.
Digital Rectal Exam
• Overall, 58 percent of males age 40 and older had a digital rectal exam in the past two years.
• The prevalence of digital rectal exams was higher among males age 65 and older with more than a high school education, with annual incomes greater than $75,000, and among insured males, than among males under 65 years of age with less than a high school education, with annual household incomes less than $25,000, and the uninsured.
• Over the period from 2000 to 2004, the prevalence of having a digital rectal exam increased among both White and Black males. White males had a higher prevalence than did Black males in all fi ve years.
SampleSize Prevalence
SampleSize Prevalence
Florida 1769 55.7 52.3 59.0 1826 57.9 54.5 61.2
Black 118 60.9 48.5 73.2 120 52.9 40.4 65.3White 1543 56.9 53.3 60.4 1594 60.4 57.0 63.9
Age40-44 229 24.1 16.3 31.9 233 34.0 25.4 42.545-64 882 52.1 47.4 56.9 908 56.0 51.3 60.865+ 658 80.2 75.9 84.5 685 74.8 70.3 79.2
Education< High School 212 41.1 29.4 52.8 218 43.9 32.9 55.0HS Graduate/GED 498 53.2 46.8 59.5 514 51.8 45.1 58.5> High School 1052 59.0 54.9 63.2 1087 62.5 58.5 66.5
Household Income<$25,000 448 51.1 43.6 58.6 469 49.3 42.1 56.5$25,000-$49,999 501 51.6 45.4 57.7 521 54.9 48.5 61.4$50,000-$74,999 259 62.7 54.4 71.0 266 56.7 48.4 65.0$75,000+ 360 54.3 47.5 61.1 364 65.1 58.5 71.6
Health InsuranceYes 1535 59.7 56.1 63.2 1582 61.8 58.2 65.3No 229 29.3 20.3 38.4 238 30.9 22.8 38.9
Source of data: Florida BRFSS
Table 15. Prevalence of Males Age 40 and Older Who Received Prostate Screening in the Past Two Years, Florida, 2004
Prostate Specific Antigen Test
CI
Digital Rectal Exam
CI
54

Florida Annual Cancer Report: 2003 Incidence and Mortality
Screening
Figure 13.2: Prevalence of Having a Digital Rectal Exam in Two Years among Males 40 Years and
Older, Florida, 2000-2004
0
10
20
30
40
50
60
70
2000 2001 2002 2003 2004
Per
cent
WhiteBlack
Figure 13.1: Prevalence of Having a PSA Test in Two Years among Males 40 Years and Older,
Florida 2000-2004
0
10
20
30
40
50
60
70
2000 2001 2002 2003 2004
Per
cent
WhiteBlack
COLORECTAL CANCER
Blood Stool Test
• Nearly one-third of Floridians age 50 and older (31 percent) had a blood stool test in the past two years.
• Only 1 out of 4 adults age 50 to 64 had a blood stool test. Among adults age 65 and older, 37 percent had a blood stool test.
• Thirty-two percent of adults with education beyond high school had a blood stool test compared to 24 percent of adults with less than a high school education.
• Among adults with health insurance, 32 percent had a blood stool test within the past two years compared to 18 percent of adults without health insurance.
• The prevalence increased among all race-sex groups except White females from 1999 to 2005.
Sigmoidoscopy
• More than half (59 percent) of adults age 50 and older, have had a sigmoidoscopy exam in the past fi ve years.
• The prevalence was higher among people age 65 and older (66 percent) than people age 50 to 64 (51 percent).
• The prevalence of sigmoidoscopy exam was higher among persons with more than a high school degree, annual incomes $75,000 or more, or with health coverage than among persons who did not attain a high school diploma, had an annual income below $25,000, or who were uninsured.
• The prevalence increased in all race-sex groups from 1999 to 2005. The increase was more than 40 percent among Whites, and less than 30 percent among Blacks (27 percent for Black females and 14 percent for Black males).
55

Florida Annual Cancer Report: 2003 Incidence and Mortality
Screening Sample Size Prevalence
Sample Size Prevalence
Florida 4437 30.6 28.8 32.4 4432 58.5 56.5 60.5
Female 2773 31.8 29.5 34.1 2777 57.1 54.6 59.6Male 1664 29.2 26.2 32.1 1655 60.2 57.0 63.4
Black 289 31.2 23.9 38.5 285 49.7 41.6 57.8White 3849 32.2 30.1 34.2 3842 59.6 57.5 61.7
Black Female 207 29.6 21.1 38.1 204 50.0 40.0 60.0White Female 2405 33.6 31.1 36.1 2405 58.1 55.5 60.8Black Male 82 34.0 20.4 47.6 81 49.3 35.2 63.4White Male 1444 30.4 27.2 33.6 1437 61.5 58.1 64.8
Age50-64 2200 24.0 21.6 26.4 2197 51.2 48.3 54.165+ 2237 37.3 34.6 40.0 2235 65.8 63.2 68.4
Education< High School 534 23.5 18.1 28.9 534 51.8 45.5 58.1HS Graduate/GED 1416 30.6 27.2 34.0 1413 54.5 50.9 58.2> High School 2473 32.0 29.6 34.4 2472 61.7 59.1 64.2
Household Income<$25,000 1368 28.5 25.1 31.8 1367 53.9 50.1 57.7$25,000-$49,999 1155 31.6 28.0 35.2 1151 57.8 53.9 61.8$50,000-$74,999 524 33.6 28.4 38.8 522 62.7 57.3 68.1$75,000+ 640 29.3 24.7 33.9 637 62.3 57.4 67.2
Health InsuranceYes 4038 32.0 30.0 33.9 4033 61.5 59.5 63.6No 385 17.9 12.3 23.5 385 30.7 24.2 37.3
Source of data: Florida BRFSS
Table 16. Prevalence of Adults Age 50 and Older Who Received Colorectal Screening, Florida, 2005
A Blood Stool Test in 2 Years A Sigmoidoscopy Exam in 5 years
CI CI
Figure 14.1: Prevalence of Having a Blood Stool Test in Two Years among Adults 50 Years and
Older, Florida, 1999-2005
0
10
20
30
40
50
1999 2000 2001 2002 2003 2004 2005
Per
cent
White MenWhite FemaleBlack MenBlack Female
Figure 14.2: Prevalence of Having Had a Sigmoidoscopy Exam among Adults 50 Years and
Older, Florida, 1999-2005
0
10
20
30
40
50
60
70
1999 2000 2001 2002 2003 2004 2005
Per
cent
White MenWhite FemaleBlack MenBlack Female
56
Florida Annual Cancer Report: 2003 Incidence and Mortality
Mortality
CANCER MORTALITY
DEATHS
• In 2003, there were 38,623 deaths due to cancer in Florida, an increase of 254 from the previous year. Of the cancer deaths in 2003, 54 percent were males and 90 percent were Whites.
• Among the major cancer sites, the number of deaths from prostate cancer and colorectal cancer decreased since 2001.
• Cancer of the lung and bronchus accounted for 30 percent of all cancer deaths, followed by colorectal cancer (9 percent), breast cancer (7 percent), and prostate cancer (5 percent).
Sex
• Cancer of the lung and bronchus was responsible for 28 percent of the cancer deaths among females and 32 percent among males.
• Deaths from prostate, colorectal, head and neck, and bladder cancers, and non-Hodgkin lymphoma constituted 30 percent of all male cancer deaths.
• Deaths from breast, colorectal, and cervical cancers, and non-Hodgkin lymphoma accounted for 29 percent of all cancer deaths among females.
Race
• Cancer of lung and bronchus was the number one cause of cancer death for both Whites and Blacks. Deaths from cancer of the lung and bronchus accounted for 31 percent of all cancer deaths among Whites, 37 percent greater than among Blacks (23 percent).
• Deaths from colorectal, breast, cervical, and prostate cancers, sites for which screenings are available, accounted for 30 percent of all cancer deaths among Blacks, greater than that among Whites (21 percent).
Sex and Race
• The percentage of deaths from cancer of the lung and bronchus among all cancer deaths was the lowest for Black females (17 percent) and highest in White males (33 percent) among the four race-sex groups.
• Deaths from prostate cancer accounted for 17 percent of total cancer deaths among Black males, 81 percent greater than that among White males (9 percent).
57
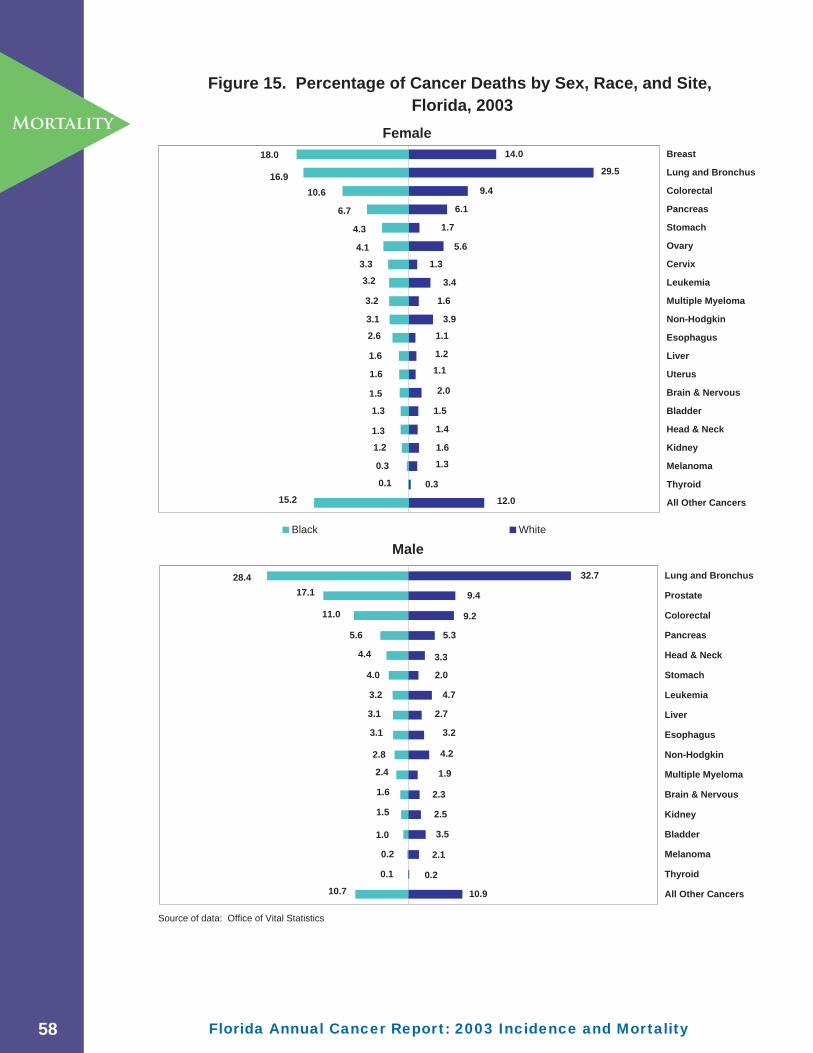
Florida Annual Cancer Report: 2003 Incidence and Mortality
Mortality
Figure 15. Percentage of Cancer Deaths by Sex, Race, and Site, Florida, 2003
Female
2.6
1.6
1.6
1.5
1.3
1.3
1.2
0.3
0.1
15.2
3.1
3.2
3.2
3.3
4.1
4.3
6.7
10.6
16.9
18.0
12.0
0.3
1.3
1.6
1.4
1.5
2.0
1.1
1.2
1.1
3.9
1.6
3.4
1.3
5.6
1.7
6.1
9.4
29.5
14.0 Breast
Lung and Bronchus
Colorectal
Pancreas
Stomach
Ovary
Cervix
Leukemia
Multiple Myeloma
Non-Hodgkin
Esophagus
Liver
Uterus
Brain & Nervous
Bladder
Head & Neck
Kidney
Melanoma
Thyroid
All Other Cancers
Male
1.6
2.4
2.8
3.1
10.7
0.1
0.2
1.5
1.0
3.1
3.2
4.0
4.4
5.6
11.0
17.1
28.4 32.7
9.4
9.2
5.3
3.3
2.0
4.7
2.7
3.2
4.2
1.9
2.3
2.5
3.5
2.1
0.2
10.9
Lung and Bronchus
Prostate
Colorectal
Pancreas
Head & Neck
Stomach
Leukemia
Liver
Esophagus
Non-Hodgkin
Multiple Myeloma
Brain & Nervous
Kidney
Bladder
Melanoma
Thyroid
All Other Cancers
Black White
Source of data: Office of Vital Statistics
58

Florida Annual Cancer Report: 2003 Incidence and Mortality
MortalityAll
CancersLung &
Bronchus Prostate Breast Colorectal BladderHead & Neck
Non-Hodgkin Melanoma Cervix
Florida (1) 38,623 11,745 2,091 2,570 3,641 939 954 1,517 612 274
Female 17,898 5,054 2,570 1,708 265 249 678 215 274Male 20,723 6,690 2,091 1,933 674 705 839 397
Black 3,604 823 318 313 389 42 105 106 58White 34,798 10,866 1,771 2,241 3,229 895 845 1,403 612 212
Black Female 1,742 294 313 185 23 23 54 58White Female 16,042 4,739 2,241 1,512 242 225 620 215 212Black Male 1,862 529 318 204 19 82 52 White Male 18,754 6,126 1,771 1,717 653 620 783 397Source of data: Office of Vital Statistics(1) Florida total counts include 223 deaths of persons of "Other" and unknown race, and 2 deaths with unknown sex. Totals by sex include deaths with unknown and Other races; totals by race include deaths with unknown sex.
Table 17. Number of Cancer Deaths by Sex and Race, Florida, 2003
County
• Almost two-thirds of cancer deaths occurred in the 13 most populous counties in Florida. Those counties contain 70 percent of Florida's residents. Lafayette and Liberty counties, smallest populated Florida counties, had fewer than 20 deaths.
Age
• Deaths from cancer occurred primarily among older people. In 2003, 27,936 (72 percent) cancer deaths in Florida occurred among people age 65 and older. However, cervical cancer deaths occurring in the group under age 65 accounted for 72 percent of all cervical cancer deaths.
• Many Blacks died from cancer at younger ages than Whites. The percentage of deaths in persons under age 65 was greater among Blacks (42 percent) than among Whites (26 percent). Among Blacks, the 45 to 64 age group had the most cancer deaths for lung and bronchus, breast, head and neck, and cervical cancers, and non-Hodgkin lymphoma.
• For the 45 to 64 age group, breast cancer accounted for 46 percent and 31 percent of total breast cancer deaths among Black and White females, respectively. For the groups age 65 and over, breast cancer deaths accounted for 40 percent of all breast cancer deaths among Black females and 63 percent among White females.
• Deaths from breast cancer accounted for 25 percent and 20 percent of total cancer deaths among Black females and White females age 15 to 64, respectively. Among females age 65 years and older, deaths from breast cancer accounted for 18 percent of total cancer deaths among Blacks and 30 percent among Whites.
• The percentage of cancer deaths due to prostate cancer increased dramatically by age. Deaths from prostate cancer accounted for 5 percent of total cancer deaths in Black males under age 65 and 26 percent among Black males age 65 and older. For White males, the percentages of prostate cancer deaths in both age groups were much lower, 2 percent for under age 65 and 12 percent for age 65 and older.
59

Florida Annual Cancer Report: 2003 Incidence and Mortality
Mortality
• Among Blacks, deaths from prostate cancer in males age 45 to 64 accounted for 13 percent of total prostate cancer deaths. For Whites, the prostate cancer deaths among males age 45 to 64 only accounted for 5 percent of total prostate cancer deaths.
60

Florida Annual Cancer Report: 2003 Incidence and Mortality
Mortality
61
AllCancers
Lung & Bronchus Prostate Breast Colorectal Bladder
Head & Neck
Non-Hodgkin Melanoma Cervix
Florida 38,623 11,745 2,091 2,570 3,641 939 954 1,517 612 274
Alachua 358 107 17 27 30 ^ ^ 21 ^ ^Baker 45 11 ^ ^ ^ ^ ^ ^ ^ ^Bay 274 94 11 21 24 ^ ^ ^ ^ ^Bradford 49 12 ^ ^ ^ ^ ^ ^ ^ ^Brevard 1,345 415 73 77 120 34 26 54 24 10Broward 3,400 988 168 262 312 90 74 156 54 26Calhoun 42 20 ^ ^ ^ ^ ^ ^ ^ ^Charlotte 508 162 28 34 47 18 ^ 20 ^ ^Citrus 522 188 33 23 51 14 ^ 23 ^ ^Clay 288 117 15 10 25 ^ ^ ^ ^ ^Collier 641 190 36 31 50 15 16 24 18 ^Columbia 149 55 ^ ^ 18 ^ ^ ^ ^ ^Miami-Dade 3,885 841 253 318 457 89 89 176 48 44DeSoto 70 23 ^ ^ ^ ^ ^ ^ ^ ^Dixie 45 22 ^ ^ ^ ^ ^ ^ ^ ^Duval 1,878 565 112 126 160 30 44 54 23 14Escambia 637 222 28 39 54 12 13 29 ^ ^Flagler 197 60 14 10 16 ^ ^ ^ ^ ^Franklin 28 16 ^ ^ ^ ^ ^ ^ ^ ^Gadsden 112 27 ^ ^ 10 ^ ^ ^ ^ ^Gilchrist 37 14 ^ ^ ^ ^ ^ ^ ^ ^Glades 20 ^ ^ ^ ^ ^ ^ ^ ^ ^Gulf 40 ^ ^ ^ ^ ^ ^ ^ ^ ^Hamilton 35 12 ^ ^ ^ ^ ^ ^ ^ ^Hardee 43 12 ^ ^ ^ ^ ^ ^ ^ ^Hendry 52 16 ^ ^ ^ ^ ^ ^ ^ ^Hernando 553 196 24 29 55 11 17 21 ^ ^Highlands 346 126 13 21 33 ^ 14 ^ ^ ^Hillsborough 1,882 554 104 124 200 39 53 82 25 14Holmes 38 ^ ^ ^ ^ ^ ^ ^ ^ ^Indian River 393 141 20 21 28 ^ ^ 15 ^ ^Jackson 91 27 ^ ^ ^ ^ ^ ^ ^ ^Jefferson 37 13 ^ ^ ^ ^ ^ ^ ^ ^Lafayette 12 ^ ^ ^ ^ ^ ^ ^ ^ ^Lake 787 247 33 47 84 21 25 28 14 ^Lee 1,292 404 62 88 104 38 38 53 26 ^Leon 376 92 18 36 31 ^ 14 12 ^ ^Levy 94 41 ^ ^ ^ ^ ^ ^ ^ ^Liberty 14 ^ ^ ^ ^ ^ ^ ^ ^ ^Madison 41 18 ^ ^ ^ ^ ^ ^ ^ ^Manatee 762 237 35 38 72 14 18 26 16 ^Marion 927 314 62 71 97 28 25 23 14 ^Martin 431 149 30 24 27 12 10 16 ^ ^Monroe 182 50 ^ 10 24 ^ ^ ^ ^ ^Nassau 145 39 ^ 12 11 ^ ^ ^ ^ ^Okaloosa 334 116 13 23 27 ^ 10 11 ^ ^Okeechobee 91 35 ^ ^ 10 ^ ^ ^ ^ ^Orange 1,445 420 69 134 129 33 42 54 22 16Osceola 352 110 14 23 35 ^ ^ 14 ^ ^Palm Beach 3,076 854 172 175 284 86 61 157 52 20Pasco 1,240 425 67 70 132 37 27 40 18 11Pinellas 2,611 871 136 182 235 73 76 102 43 12Polk 1,262 413 63 80 128 35 35 47 20 ^Putnam 217 83 ^ 11 17 ^ ^ ^ ^ ^Saint Johns 275 81 17 18 23 ^ ^ ^ 12 ^Saint Lucie 625 201 39 30 57 13 18 17 13 ^Santa Rosa 246 86 12 14 21 11 ^ ^ ^ ^Sarasota 1,144 327 51 83 102 29 31 55 19 ^Seminole 616 194 29 44 55 17 13 26 13 ^Sumter 203 70 15 11 22 ^ ^ ^ ^ ^Suwannee 100 43 ^ ^ ^ ^ ^ ^ ^ ^Taylor 46 14 ^ ^ ^ ^ ^ ^ ^ ^Union 56 23 ^ ^ ^ ^ ^ ^ ^ ^Volusia 1,362 437 88 77 125 32 36 42 19 ^Wakulla 60 19 ^ ^ ^ ^ ^ ^ ^ ^Walton 103 31 ^ ^ 13 ^ ^ ^ ^ ^Washington 56 24 ^ ^ ^ ^ ^ ^ ^ ^
^ Statistics are not displayed for cells with fewer than 10 deaths. Source of data: Office of Vital Statistics
Table 18. Number of Cancer Deaths by County, Florida, 2003

Florida Annual Cancer Report: 2003 Incidence and Mortality
Mortality
62
AllCancers
Lung & Bronchus Prostate Breast Colorectal Bladder
Head & Neck
Non-Hodgkin Melanoma Cervix
Florida 38,623 11,745 2,091 2,570 3,641 939 954 1,517 612 274 0-19 121 ^ ^ ^ ^ ^ ^ 10 ^ ^ 20-44 1,186 166 ^ 177 81 ^ 38 70 50 62 45-64 9,380 2,954 133 855 766 140 337 299 195 134 65-74 9,993 3,643 413 515 825 216 252 343 119 33 75+ 17,943 4,981 1,544 1,023 1,969 576 325 795 248 45
Female 0-19 54 ^ ^ ^ ^ ^ ^ ^ ^ 20-44 631 78 177 33 ^ ^ 24 20 62 45-64 4,254 1,181 855 302 39 69 107 62 134 65-74 4,280 1,475 515 334 45 62 140 35 33 75+ 8,679 2,320 1,023 1,039 181 112 403 98 45Male 0-19 67 ^ ^ ^ ^ ^ ^ ^ 20-44 555 88 ^ 48 ^ 33 46 30 45-64 5,124 1,772 133 464 101 268 192 133 65-74 5,713 2,168 413 491 171 190 203 84 75+ 9,264 2,661 1,544 930 395 213 392 150
Black 0-19 21 ^ ^ ^ ^ ^ ^ ^ ^ 20-44 224 28 ^ 43 22 ^ ^ 13 15 45-64 1,286 317 40 144 139 ^ 54 40 26 65-74 966 285 85 61 86 ^ 28 26 ^ 75+ 1,107 193 193 65 142 27 20 25 ^White 0-19 99 ^ ^ ^ ^ ^ ^ ^ ^ ^ 20-44 944 134 ^ 130 58 ^ 36 56 50 46 45-64 8,013 2,620 93 704 614 131 282 257 195 107 65-74 8,962 3,336 327 453 734 208 223 313 119 24 75+ 16,780 4,775 1,350 954 1,823 549 303 769 248 35
Black Female 0-19 11 ^ ^ ^ ^ ^ ^ ^ 20-44 139 13 43 14 ^ ^ ^ 15 45-64 609 100 144 57 ^ ^ 23 26 65-74 434 108 61 35 ^ ^ 14 ^ 75+ 549 73 65 79 16 ^ 11 ^White Female 0-19 42 ^ ^ ^ ^ ^ ^ ^ ^ 20-44 483 64 130 19 ^ ^ 20 20 46 45-64 3,608 1,074 704 240 35 61 83 62 107 65-74 3,816 1,361 453 296 42 57 123 35 24 75+ 8,093 2,240 954 957 165 102 392 98 35Black Male 0-19 10 ^ ^ ^ ^ ^ ^ 20-44 85 15 ^ ^ ^ ^ ^ 45-64 677 217 40 82 ^ 46 17 65-74 532 177 85 51 ^ 23 12 75+ 558 120 193 63 11 11 14White Male 0-19 57 ^ ^ ^ ^ ^ ^ ^ 20-44 461 70 ^ 39 ^ 32 36 30 45-64 4,403 1,545 93 374 96 221 174 133 65-74 5,146 1,975 327 438 166 166 190 84 75+ 8,687 2,535 1,350 866 384 201 377 150
Source of data: Office of Vital Statistics
Table 19. Number of Cancer Deaths by Sex, Race, and Age Group, Florida, 2003
^ Statistics are not displayed for cells with fewer than 10 deaths.

Florida Annual Cancer Report: 2003 Incidence and Mortality
Mortality
63
Source of data: Office of Vital Statistics
Figure 16.1 Percentage of Cancer Deaths by Sex, Race, and Site, Age 15-64, Florida, 2003
Female
0.2
2.0
11.3
0.9
0.8
1.5
1.1
1.6
1.0
3.3
2.6
0.8
2.5
1.5
4.0
7.0
3.76.3
27.8
20.3
0.5
0.71.1
1.1
1.2
1.6
1.7
2.7
2.9
3.7
3.94.5
5.2
5.5
9.5
15.1
24.9
13.70.3
0.4
Breast
Lung and Bronchus
Colorectal
Cervix
Ovary
Pancreas
Stomach
Non-Hodgkin
Esophagus
Leukemia
Brain & Nervous
Multiple Myeloma
Head & Neck
Uterus
Kidney
Liver
Bladder
Melanoma
Thyroid
All Other Cancers
Male
30.3
11.8
7.1
6.3
5.2
5.2
4.4
3.4
0.5
1.7
0.4
0.0
11.8
3.4
3.4
3.3
2.0
12.3
0.4
3.3
2.1
3.6
3.0
2.2
1.5
4.5
4.4
4.3
4.0
1.9
5.2
5.9
8.533.1 Lung and Bronchus
Colorectal
Pancreas
Head & Neck
Prostate
Liver
Esophagus
Non-Hodgkin
Leukemia
Multiple Myeloma
Stomach
Kidney
Brain & Nervous
Bladder
Melanoma
Thyroid
All Other Cancers
Black White

Florida Annual Cancer Report: 2003 Incidence and Mortality
Mortality
Source of data: Office of Vital Statistics
Figure 16.2 Percentage of Cancer Deaths by Sex, Race, and Site,Age 65+, Florida, 2003
Male
27.325.5
10.5
4.7
4.5
3.1
2.9
2.4
1.1
1.3
0.1
0.1
9.7
2.1
1.7
1.7
1.4
10.5
0.1
1.7
2.3
1.7
4.0
2.2
2.0
2.8
4.1
4.8
2.7
2.0
5.1
9.4
12.1
32.6 Lung and Bronchus
Prostate
Colorectal
Pancreas
Stomach
Head & Neck
Leukemia
Non-Hodgkin
Esophagus
Multiple Myeloma
Liver
Bladder
Brain & Nervous
Kidney
Melanoma
Thyroid
All Other Cancers
Black White
Female30.2
11.8
10.5
6.9
1.8
1.8
3.6
5.1
4.3
1.2
1.4
1.7
1.1
0.5
1.3
1.6
1.6
12.2
1.1
0.3
0.3
0.016.2
18.4
12.8
11.6
8.4
4.7
4.4
3.3
3.3
2.5
2.4
2.3
1.9
1.9
1.7
1.4
1.2
1.1
Lung and Bronchus
Breast
Colorectal
Pancreas
Stomach
Multiple Myeloma
Leukemia
Ovary
Non-Hodgkin
Esophagus
Liver
Bladder
Uterus
Cervix
Head & Neck
Kidney
Brain & Nervous
Melanoma
Thyroid
All Other Cancers
Male
1.4
1.7
1.7
2.1
9.7
0.1
0.1
1.3
1.1
2.4
2.9
3.1
4.5
4.7
10.5
25.5
27.3 32.6
12.1
9.4
5.1
2.0
2.7
4.8
4.1
2.8
2.0
2.2
4.0
1.7
2.3
1.7
0.1
10.5
Lung and Bronchus
Prostate
Colorectal
Pancreas
Stomach
Head & Neck
Leukemia
Non-Hodgkin
Esophagus
Multiple Myeloma
Liver
Bladder
Brain & Nervous
Kidney
Melanoma
Thyroid
All Other Cancers
Black White
64

Florida Annual Cancer Report: 2003 Incidence and Mortality
Mortality
AGE-ADJUSTED MORTALITY RATES
• Compared to 2002 national mortality statistics (www.cdc.gov/cancer/npcr/uscs/index.htm), Florida’s age-adjusted mortality rates for all cancers combined are lower than the national average for both sexes and races. The difference was between 13 percent among White males and 21 percent among Black males lower in Floridians than the national average.
Sex
• The age-adjusted mortality rate for all cancers combined was 48 percent higher among males than among females. Males also had higher mortality rates than females for all major cancer sites.
• The greatest sex differences in mortality rates occurred for bladder cancer and head and neck cancer. The mortality rates for these cancers among males were more than three times the rates among females.
Race
• The age-adjusted mortality rate for all cancers combined was 19 percent higher among Blacks than among Whites. Blacks also had a higher mortality rate than Whites for the following major cancers: prostate, breast, colorectal, head and neck, and cervix.
• Whites had a mortality rate of cancer of the lung and bronchus 15 percent higher than that among Blacks.
Sex and Race
• The age-adjusted mortality rate for all cancers combined was highest in Black males (256.2 per 100,000) and lowest in White females (138.3 per 100,000) among sex-race groups.
• Among males, Blacks had higher mortality rates for all cancers combined, prostate, and colorectal cancers. The rate for prostate cancer among Blacks was almost three times the rate among Whites.
• Among females, Blacks had higher mortality rates for all cancers combined, and breast, colorectal and cervical cancers.
• Cancer of the lung and bronchus had the highest mortality rate in all cancer sites for all sex-race groups except Black females, for whom breast cancer had a similar mortality as that for cancer of the lung and bronchus.
County
• Age-adjusted mortality rates for all cancers combined ranged from 123.7 per 100,000 in Collier County to 451.8 per 100,000 in Union County. Seventeen counties had mortality rates higher than the Florida rate of 168.0 per 100,000. Broward, Charlotte, Collier, Miami-Dade, Lee, Palm Beach, and Sarasota counties had rates lower than the Florida rate.
• The age-adjusted mortality rate for cancer of the lung and bronchus ranged from 32.8 per 100,000 in Miami-Dade County to 174.0 per 100,000 in Union County. Nineteen counties
65

Florida Annual Cancer Report: 2003 Incidence and Mortality
Mortality
had rates higher than the Florida rate (50.7 per 100,000). Broward, Collier, Miami-Dade, Palm Beach, and Sarasota counties had rates lower than the Florida rate.
• The age-adjusted prostate cancer mortality rate ranged from 11.6 per 100,000 in Highlands County to 42.3 per 100,000 in Duval County. Miami-Dade and Duval counties had a mortality rate statistically greater than the state rate (21.0 per 100,000). Sarasota County had a mortality rate lower than the state rate.
• Collier County had the lowest age-adjusted breast cancer mortality rate at 11.2 per 100,000; Leon County had the highest rate at 31.5 cases per 100,000. The breast cancer mortality rates in Duval, Marion, and Orange counties were statistically higher than the state rate of 21.3 cases per 100,000.
• The age-adjusted colorectal cancer mortality rates in Duval County was statistically higher than the state rate (15.5 per 100,000). The age-adjusted rate in Collier and Lee counties was lower than the state rate.
• The age-adjusted mortality rate for melanoma was the highest in Saint Johns County (7.2 per 100,000), which was higher than the state rate (3.2 per 100,000).
• The age-adjusted mortality rate for bladder cancer in Santa Rosa County was higher than the state rate (3.9 per 100,000).
66
Rate Rate Rate Rate RateFlorida (1) 168.0 166.3 169.7 50.7 49.8 51.7 21.0 20.1 21.9 21.3 20.4 22.1 15.5 15.0 16.1
Female 139.7 137.6 141.8 39.1 38.0 40.2 21.3 20.4 22.1 12.6 12.0 13.2Male 206.2 203.4 209.1 65.6 64.0 67.2 21.0 20.1 21.9 19.3 18.4 20.1
Black 199.0 192.3 205.8 44.7 41.6 47.9 56.7 50.4 63.6 27.4 24.4 30.7 22.1 19.9 24.5White 166.6 164.8 168.4 51.6 50.6 52.6 19.0 18.1 19.9 20.6 19.8 21.6 15.0 14.5 15.5
Black Female 162.6 154.9 170.6 27.9 24.7 31.3 27.4 24.4 30.7 17.8 15.3 20.7White Female 138.3 136.1 140.5 40.5 39.3 41.7 20.6 19.8 21.6 12.1 11.5 12.8Black Male 256.2 243.8 269.0 68.8 62.7 75.5 56.7 50.4 63.6 28.1 24.1 32.6White Male 204.2 201.2 207.2 65.6 64.0 67.3 19.0 18.1 19.9 18.6 17.7 19.5
Rate Rate Rate Rate RateFlorida (1) 3.9 3.7 4.2 4.3 4.0 4.6 6.6 6.3 6.9 3.2 2.9 3.4 2.7 2.4 3.0
Female 1.9 1.6 2.1 2.0 1.7 2.2 5.1 4.7 5.5 2.0 1.8 2.4 2.7 2.4 3.0Male 6.7 6.2 7.2 7.1 6.6 7.7 8.5 7.9 9.1 4.5 4.1 5.0
Black 2.7 2.0 3.7 5.4 4.4 6.6 5.5 4.5 6.7 4.9 3.7 6.4White 4.1 3.8 4.3 4.2 4.0 4.5 6.7 6.3 7.1 3.2 2.9 3.4 2.4 2.1 2.8
Black Female 2.4 1.5 3.6 2.2 1.4 3.3 4.8 3.6 6.3 4.9 3.7 6.4White Female 1.9 1.6 2.1 2.0 1.7 2.3 5.1 4.7 5.5 2.0 1.8 2.4 2.4 2.1 2.8Black Male 3.2 1.9 5.2 9.5 7.5 12.1 6.7 4.9 9.1White Male 7.0 6.5 7.6 6.9 6.4 7.5 8.7 8.1 9.3 4.5 4.1 5.0Source of data: Office of Vital Statistics(1) Florida total mortality rates include 218 deaths of persons of "Other" races, 5 of unknown race, and 2 deaths with unknown sex.Mortality rates by sex include deaths with unknown and Other races; rates by race include deaths with unknown sex.
CIMelanoma Cervix
Colorectal
Bladder Head & Neck
CICI
CI CI CI CINon-Hodgkin
BreastTable 20. Age-Adjusted Mortality Rates (1) by Sex and Race, Florida, 2003
All CancersCI CI CI
Lung & Bronchus Prostate

Florida Annual Cancer Report: 2003 Incidence and Mortality
MortalityRate Rate Rate Rate Rate
Florida 168.0 166.3 169.7 50.7 49.8 51.7 21.0 20.1 21.9 21.3 20.4 22.1 15.5 15.0 16.1Alachua 189.2 170.0 210.0 57.3 46.9 69.4 24.0 13.9 39.0 25.7 16.9 37.9 15.6 10.5 22.4Baker 220.9 159.7 300.5 49.1 24.1 93.4 ^ ^ ^ ^ ^ ^ ^ ^ ^Bay 162.7 143.8 183.4 54.7 44.1 67.2 18.7 9.0 35.1 22.2 13.7 34.8 14.9 9.5 22.4Bradford 165.9 122.7 221.3 40.1 20.7 72.7 ^ ^ ^ ^ ^ ^ ^ ^ ^Brevard 181.3 171.6 191.6 54.5 49.4 60.3 22.8 17.8 29.1 20.7 16.2 26.5 15.7 13.0 19.1Broward 156.1 150.8 161.6 45.8 43.0 48.9 17.5 15.0 20.4 22.4 19.7 25.5 13.5 12.0 15.2Calhoun 269.4 193.9 369.3 129.0 78.8 204.9 ^ ^ ^ ^ ^ ^ ^ ^ ^Charlotte 144.8 131.3 160.5 44.4 37.4 54.0 16.4 10.8 28.2 21.3 14.0 34.9 11.7 8.6 17.8Citrus 189.5 172.2 209.6 66.7 57.0 79.5 25.8 17.7 41.1 19.9 11.8 35.8 16.1 12.0 23.7Clay 195.2 173.0 219.7 79.4 65.4 95.6 30.9 17.2 52.1 11.8 5.6 22.4 17.3 11.1 25.8Collier 123.7 113.9 134.5 35.2 30.2 41.1 15.8 11.0 22.8 11.2 7.5 17.2 9.8 7.2 13.5Columbia 226.8 191.7 267.0 82.0 61.7 107.5 ^ ^ ^ ^ ^ ^ 27.3 16.1 43.9Miami-Dade 151.9 147.2 156.8 32.8 30.7 35.2 25.3 22.3 28.7 22.3 19.9 24.9 17.7 16.1 19.4DeSoto 151.5 117.0 194.9 47.5 29.7 74.8 ^ ^ ^ ^ ^ ^ ^ ^ ^Dixie 222.4 161.1 305.1 103.4 64.6 164.2 ^ ^ ^ ^ ^ ^ ^ ^ ^Duval 253.4 242.0 265.2 76.7 70.5 83.3 42.3 34.7 51.2 29.0 24.1 34.5 21.6 18.4 25.3Escambia 194.6 179.7 210.4 67.8 59.2 77.5 22.3 14.7 32.7 21.1 15.0 29.3 16.5 12.4 21.7Flagler 163.6 139.6 193.6 45.7 34.3 63.7 25.2 13.4 52.8 16.7 7.6 42.7 12.6 6.9 26.1Franklin 177.5 116.9 271.4 98.7 55.8 176.7 ^ ^ ^ ^ ^ ^ ^ ^ ^Gadsden 235.6 193.8 284.0 56.5 37.2 82.8 ^ ^ ^ ^ ^ ^ 22.2 10.6 41.2Gilchrist 205.8 144.4 289.8 76.8 41.8 135.8 ^ ^ ^ ^ ^ ^ ^ ^ ^Glades 128.1 76.9 213.0 ^ ^ ^ ^ ^ ^ ^ ^ ^ ^ ^ ^Gulf 215.4 153.6 300.4 ^ ^ ^ ^ ^ ^ ^ ^ ^ ^ ^ ^Hamilton 269.1 186.6 377.3 94.1 48.2 167.2 ^ ^ ^ ^ ^ ^ ^ ^ ^Hardee 147.3 106.3 200.4 42.0 21.6 75.6 ^ ^ ^ ^ ^ ^ ^ ^ ^Hendry 167.0 124.5 220.3 49.6 28.3 82.1 ^ ^ ^ ^ ^ ^ ^ ^ ^Hernando 190.7 173.9 209.7 67.5 57.6 79.7 17.4 11.1 29.7 20.7 13.1 34.2 16.8 12.6 23.6Highlands 174.1 154.1 197.8 62.9 51.3 78.3 11.6 6.2 26.9 25.4 13.6 47.4 14.6 9.7 23.9Hillsborough 169.8 162.2 177.6 49.9 45.8 54.3 24.4 19.9 29.7 20.2 16.8 24.1 17.9 15.5 20.6Holmes 171.3 120.8 239.9 ^ ^ ^ ^ ^ ^ ^ ^ ^ ^ ^ ^Indian River 161.2 144.6 180.2 56.0 46.8 67.7 15.7 9.5 27.6 15.8 9.3 28.6 11.8 7.7 18.9Jackson 164.6 132.3 203.4 48.8 32.1 72.5 ^ ^ ^ ^ ^ ^ ^ ^ ^Jefferson 227.6 160.0 319.2 77.9 41.4 139.8 ^ ^ ^ ^ ^ ^ ^ ^ ^Lafayette 155.0 79.7 279.7 ^ ^ ^ ^ ^ ^ ^ ^ ^ ^ ^ ^Lake 175.5 162.7 189.4 53.9 47.1 62.0 14.4 9.9 21.8 20.7 14.7 29.5 18.7 14.7 24.0Lee 147.2 138.9 156.0 44.8 40.4 49.8 15.3 11.6 20.1 20.1 15.8 25.6 11.2 9.1 13.9Leon 197.3 177.6 218.8 49.0 39.4 60.5 30.8 18.0 49.7 31.5 22.0 44.2 16.8 11.4 24.1Levy 183.3 147.3 227.8 74.5 53.2 104.6 ^ ^ ^ ^ ^ ^ ^ ^ ^Liberty 250.8 132.3 443.6 ^ ^ ^ ^ ^ ^ ^ ^ ^ ^ ^ ^Madison 190.9 136.8 261.3 83.4 49.3 134.3 ^ ^ ^ ^ ^ ^ ^ ^ ^Manatee 154.9 143.5 167.2 47.3 41.3 54.4 14.3 9.9 20.7 14.5 9.9 21.5 14.2 11.0 18.6Marion 186.4 174.0 199.7 61.4 54.6 69.2 27.3 20.8 36.1 29.5 22.5 38.8 19.7 15.8 24.6Martin 157.2 142.0 174.6 53.9 45.3 64.8 23.6 15.8 36.7 17.9 10.7 31.4 9.8 6.3 16.0Monroe 185.1 158.8 215.8 49.4 36.5 66.8 ^ ^ ^ 20.1 9.6 41.6 25.1 15.9 39.2Nassau 213.8 179.7 253.2 55.8 39.4 77.6 ^ ^ ^ 30.4 15.5 56.0 16.3 8.0 30.6Okaloosa 185.3 165.8 206.7 65.1 53.7 78.5 16.0 8.4 29.7 23.3 14.8 35.4 14.9 9.7 22.0Okeechobee 186.8 149.9 231.5 69.1 47.9 98.4 ^ ^ ^ ^ ^ ^ 19.7 9.4 38.9Orange 168.7 160.1 177.7 49.3 44.7 54.3 22.3 17.2 28.4 27.2 22.8 32.3 15.2 12.7 18.1Osceola 165.9 149.0 184.3 51.6 42.3 62.2 17.1 9.2 29.5 20.3 12.8 30.7 16.5 11.5 23.1Palm Beach 150.3 144.8 156.0 41.7 38.9 44.8 17.6 15.0 20.6 17.0 14.4 20.1 13.5 11.9 15.4Pasco 180.1 169.4 191.5 61.4 55.3 68.2 19.4 15.0 25.5 21.8 16.5 29.0 17.3 14.3 21.1Pinellas 170.0 163.3 177.0 57.2 53.4 61.3 19.0 15.9 22.7 23.1 19.7 27.2 14.5 12.7 16.7Polk 178.1 168.2 188.5 56.4 51.0 62.3 19.7 15.1 25.5 21.7 17.0 27.4 18.2 15.1 21.8Putnam 220.1 191.1 253.2 81.6 64.7 102.8 ^ ^ ^ 22.6 11.0 44.3 18.8 10.6 31.9Saint Johns 150.0 132.8 169.5 43.4 34.4 54.6 24.0 13.8 39.7 19.1 11.3 31.9 12.4 7.8 19.3Saint Lucie 182.9 168.4 198.6 58.4 50.4 67.8 24.7 17.4 35.0 18.7 12.4 28.2 16.1 12.1 21.6Santa Rosa 193.7 169.7 220.6 65.1 51.8 81.2 29.3 14.1 55.5 19.7 10.7 33.9 17.1 10.4 27.0Sarasota 152.9 143.1 163.5 43.1 38.3 48.9 13.9 10.3 19.8 22.8 17.3 30.5 12.2 9.8 15.7Seminole 168.0 154.9 182.0 53.5 46.2 61.7 24.2 16.0 35.1 20.3 14.7 27.5 15.1 11.3 19.8Sumter 169.5 145.4 199.0 51.7 39.8 69.3 30.7 16.3 58.8 18.8 9.2 43.6 19.6 11.9 34.0Suwannee 197.5 160.3 242.8 85.1 61.3 117.5 ^ ^ ^ ^ ^ ^ ^ ^ ^Taylor 197.5 144.2 266.2 59.0 32.1 102.0 ^ ^ ^ ^ ^ ^ ^ ^ ^Union 451.8 336.5 602.9 174.0 108.5 276.7 ^ ^ ^ ^ ^ ^ ^ ^ ^Volusia 179.3 169.7 189.6 56.5 51.3 62.4 25.2 20.1 31.5 20.1 15.6 26.0 15.8 13.1 19.1Wakulla 256.1 194.0 334.2 76.5 45.3 124.2 ^ ^ ^ ^ ^ ^ ^ ^ ^Walton 158.9 129.4 194.9 46.2 31.2 68.0 ^ ^ ^ ^ ^ ^ 20.0 10.6 37.0Washington 197.1 148.6 260.1 85.0 54.3 130.8 ^ ^ ^ ^ ^ ^ ^ ^ ^
^ Statistics are not displayed for cells with fewer than 10 deaths. Source of data: Office of Vital Statistics
Table 21. Age-adjusted Mortality Rates by County, Florida, 2003All Cancers Lung & Bronchus Prostate Breast Colorectal
CICI CI CI CI
67

Florida Annual Cancer Report: 2003 Incidence and Mortality
Mortality FloridaAlachuaBakerBayBradfordBrevardBrowardCalhounCharlotteCitrusClayCollierColumbiaMiami-DadeDeSotoDixieDuvalEscambiaFlaglerFranklinGadsdenGilchristGladesGulfHamiltonHardeeHendryHernandoHighlandsHillsboroughHolmesIndian RiverJacksonJeffersonLafayetteLakeLeeLeonLevyLibertyMadisonManateeMarionMartinMonroeNassauOkaloosaOkeechobeeOrangeOsceolaPalm BeachPascoPinellasPolkPutnamSaint JohnsSaint LucieSanta RosaSarasotaSeminoleSumterSuwanneeTaylorUnionVolusiaWakullaWaltonWashington
Rate Rate Rate Rate Rate3.9 3.7 4.2 4.3 4.0 4.6 6.6 6.3 6.9 3.2 2.9 3.4 2.7 2.4 3.0
^ ^ ^ ^ ^ ^ 11.1 6.9 17.2 ^ ^ ^ ^ ^ ^^ ^ ^ ^ ^ ^ ^ ^ ^ ^ ^ ^ ^ ^ ^^ ^ ^ ^ ^ ^ ^ ^ ^ ^ ^ ^ ^ ^ ^^ ^ ^ ^ ^ ^ ^ ^ ^ ^ ^ ^ ^ ^ ^
4.3 3.0 6.3 3.6 2.4 5.6 7.3 5.4 9.7 4.0 2.5 6.2 3.1 1.4 6.33.9 3.1 4.8 3.7 2.9 4.7 6.9 5.8 8.1 3.1 2.3 4.1 2.6 1.7 3.9
^ ^ ^ ^ ^ ^ ^ ^ ^ ^ ^ ^ ^ ^ ^4.8 2.7 10.2 ^ ^ ^ 5.8 3.3 11.6 ^ ^ ^ ^ ^ ^4.8 2.5 11.3 ^ ^ ^ 8.2 5.0 15.2 ^ ^ ^ ^ ^ ^
^ ^ ^ ^ ^ ^ ^ ^ ^ ^ ^ ^ ^ ^ ^2.8 1.5 5.3 2.9 1.7 5.4 4.4 2.8 7.2 3.2 1.9 5.8 ^ ^ ^
^ ^ ^ ^ ^ ^ ^ ^ ^ ^ ^ ^ ^ ^ ^3.4 2.8 4.2 3.5 2.8 4.3 7.0 6.0 8.1 2.2 1.7 3.0 3.4 2.4 4.5
^ ^ ^ ^ ^ ^ ^ ^ ^ ^ ^ ^ ^ ^ ^^ ^ ^ ^ ^ ^ ^ ^ ^ ^ ^ ^ ^ ^ ^
4.0 2.7 5.8 5.8 4.2 7.8 7.3 5.5 9.6 3.9 2.4 5.9 3.2 1.8 5.53.6 1.8 6.4 4.0 2.1 7.0 8.8 5.9 12.8 ^ ^ ^ ^ ^ ^
^ ^ ^ ^ ^ ^ ^ ^ ^ ^ ^ ^ ^ ^ ^^ ^ ^ ^ ^ ^ ^ ^ ^ ^ ^ ^ ^ ^ ^^ ^ ^ ^ ^ ^ ^ ^ ^ ^ ^ ^ ^ ^ ^^ ^ ^ ^ ^ ^ ^ ^ ^ ^ ^ ^ ^ ^ ^^ ^ ^ ^ ^ ^ ^ ^ ^ ^ ^ ^ ^ ^ ^^ ^ ^ ^ ^ ^ ^ ^ ^ ^ ^ ^ ^ ^ ^^ ^ ^ ^ ^ ^ ^ ^ ^ ^ ^ ^ ^ ^ ^^ ^ ^ ^ ^ ^ ^ ^ ^ ^ ^ ^ ^ ^ ^^ ^ ^ ^ ^ ^ ^ ^ ^ ^ ^ ^ ^ ^ ^
4.0 1.9 9.4 5.1 2.9 10.4 6.7 4.0 12.4 ^ ^ ^ ^ ^ ^^ ^ ^ 8.4 4.3 17.6 ^ ^ ^ ^ ^ ^ ^ ^ ^
3.5 2.5 4.8 4.8 3.6 6.2 7.5 5.9 9.3 2.6 1.7 3.8 2.4 1.3 4.0^ ^ ^ ^ ^ ^ ^ ^ ^ ^ ^ ^ ^ ^ ^^ ^ ^ ^ ^ ^ 6.3 3.3 12.4 ^ ^ ^ ^ ^ ^^ ^ ^ ^ ^ ^ ^ ^ ^ ^ ^ ^ ^ ^ ^^ ^ ^ ^ ^ ^ ^ ^ ^ ^ ^ ^ ^ ^ ^^ ^ ^ ^ ^ ^ ^ ^ ^ ^ ^ ^ ^ ^ ^
4.0 2.5 7.1 5.9 3.7 9.7 6.0 3.9 9.5 4.5 2.2 8.7 ^ ^ ^3.9 2.7 5.7 4.3 3.0 6.3 5.8 4.2 7.9 3.2 2.1 5.2 ^ ^ ^
^ ^ ^ 7.5 4.1 12.8 6.1 3.1 11.0 ^ ^ ^ ^ ^ ^^ ^ ^ ^ ^ ^ ^ ^ ^ ^ ^ ^ ^ ^ ^^ ^ ^ ^ ^ ^ ^ ^ ^ ^ ^ ^ ^ ^ ^^ ^ ^ ^ ^ ^ ^ ^ ^ ^ ^ ^ ^ ^ ^
2.5 1.4 4.9 4.4 2.5 7.5 5.5 3.5 8.7 4.1 2.2 7.6 ^ ^ ^5.4 3.6 8.5 5.0 3.2 8.0 5.0 3.0 8.2 3.3 1.7 6.4 ^ ^ ^3.6 1.9 8.5 3.9 1.8 9.2 5.7 3.1 11.4 ^ ^ ^ ^ ^ ^
^ ^ ^ ^ ^ ^ ^ ^ ^ ^ ^ ^ ^ ^ ^^ ^ ^ ^ ^ ^ ^ ^ ^ ^ ^ ^ ^ ^ ^^ ^ ^ 5.4 2.6 10.3 6.7 3.3 12.4 ^ ^ ^ ^ ^ ^^ ^ ^ ^ ^ ^ ^ ^ ^ ^ ^ ^ ^ ^ ^
4.0 2.8 5.7 4.7 3.4 6.4 6.4 4.8 8.4 3.0 1.9 4.6 3.2 1.8 5.2^ ^ ^ ^ ^ ^ 7.0 3.8 11.8 ^ ^ ^ ^ ^ ^
3.6 2.9 4.6 3.3 2.5 4.4 7.5 6.4 9.0 3.1 2.3 4.3 2.5 1.5 4.24.5 3.2 6.8 4.4 2.8 7.0 6.5 4.5 9.5 3.7 2.0 6.5 4.9 2.3 9.74.5 3.5 5.9 5.2 4.1 6.7 6.6 5.4 8.3 3.4 2.4 4.8 1.6 0.8 3.24.8 3.3 6.8 5.1 3.5 7.3 6.5 4.8 8.8 3.6 2.2 5.9 ^ ^ ^
^ ^ ^ ^ ^ ^ ^ ^ ^ ^ ^ ^ ^ ^ ^^ ^ ^ ^ ^ ^ ^ ^ ^ 7.2 3.7 13.5 ^ ^ ^
4.0 2.1 7.6 5.7 3.3 9.6 5.1 2.9 8.9 4.7 2.4 9.2 ^ ^ ^9.2 4.5 17.3 ^ ^ ^ ^ ^ ^ ^ ^ ^ ^ ^ ^3.2 2.1 5.6 4.6 3.0 7.4 6.7 4.9 9.7 3.4 1.8 6.6 ^ ^ ^4.7 2.7 7.6 3.8 2.0 6.5 7.3 4.8 10.8 3.7 1.9 6.5 ^ ^ ^
^ ^ ^ ^ ^ ^ ^ ^ ^ ^ ^ ^ ^ ^ ^^ ^ ^ ^ ^ ^ ^ ^ ^ ^ ^ ^ ^ ^ ^^ ^ ^ ^ ^ ^ ^ ^ ^ ^ ^ ^ ^ ^ ^^ ^ ^ ^ ^ ^ ^ ^ ^ ^ ^ ^ ^ ^ ^
4.3 2.9 6.5 5.1 3.5 7.4 5.5 3.9 7.7 2.6 1.5 4.6 ^ ^ ^^ ^ ^ ^ ^ ^ ^ ^ ^ ^ ^ ^ ^ ^ ^^ ^ ^ ^ ^ ^ ^ ^ ^ ^ ^ ^ ^ ^ ^^ ^ ^ ^ ^ ^ ^ ^ ^ ^ ^ ^ ^ ^ ^
^ Statistics are not displayed for cells with fewer than 10 deaths. Source of data: Office of Vital Statistics
CI CI CIBladder Head & Neck Non-Hodgkin
Table 21. Age-adjusted Mortality Rates by County, Florida, 2003
CI CIMelanoma Cervix
68

Florida Annual Cancer Report: 2003 Incidence and Mortality
Mortality
AGE-SPECIFIC MORTALITY RATES
• Age-specifi c mortality rates increased considerably with age. The rates were the highest in the 75 and older age group for both sexes and for both races, and for all major sites, except for cervical cancer among White females.
• Among people age 45 years old and older, males had higher age-specifi c mortality rates than females for all cancers combined and for most major sites.
• The Age-specifi c mortality rates among Blacks were higher than among Whites for all cancers combined, prostate, and colorectal cancer in groups age 45 and older. Blacks also had higher mortality rates for breast cancer and head and neck cancer in the 45 to 64 age group. On the other hand, Whites had higher mortality rates for non-Hodgkin lymphoma and cancer of the lung and bronchus than Blacks in the 75 years and older age group.
• Among females, age-specifi c mortality rates were higher among Blacks than among Whites for all cancers combined in the 65 to 74 age group and for breast cancer in 45 to 64 and 65 to 74 age groups. Age-specifi c lung cancer mortality rates were higher among Whites than among Blacks in the 75 years and older group.
• Black males had higher age-specifi c mortality rates than Whites for all cancers combined in groups age 65 and older, for colorectal cancer in groups age 45 to 64 and 75 and older. The age-specifi c mortality rate of prostate cancer among Blacks was more than double the rate among Whites in all age groups.
CHILDHOOD CANCER MORTALITY
Data on cancer deaths in children from 1999 to 2003 were combined, and fi ve-year age-specifi c mortality rates were calculated for children 14 years of age and younger. Mortality rates are expressed as deaths per million children per year.
• Between 1999 and 2003, a total of 380 cancer deaths occurred among children age 0 to 14, an average of 76 deaths per year.
• The two most common causes of cancer deaths among children during the fi ve-year period were cancer of the brain and nervous system (109 deaths) and leukemia (118 deaths). These two cancers accounted for 60 percent of all childhood cancer deaths during this period.
• Acute lymphocytic leukemia accounted for approximately 40 percent of all leukemia deaths.
• The age-specifi c mortality rate for all cancers combined in children was 24.8 per million. The age-specifi c mortality rate for cancer of the brain and nervous system and leukemia were 7.1 per million and 7.7 per million, respectively.
69

Florida Annual Cancer Report: 2003 Incidence and Mortality
Mortality
70
Rat
eR
ate
Rat
eR
ate
Rat
eR
ate
Rat
eR
ate
Rat
eR
ate
Flo
rid
a22
5.4
223.
222
7.7
68.5
67.3
69.8
25.0
24.0
26.1
29.3
28.1
30.4
21.2
20.6
22.0
5.5
5.1
5.8
5.6
5.2
5.9
8.9
8.4
9.3
4.4
4.0
4.7
3.1
2.8
3.5
0-19
2.9
2.4
3.5
^^
^^
^^
^^
^^
^^
^^
^^
^^
0.2
0.1
0.4
^^
^^
^^
2
0-44
21
.119
.922
.43.
02.
53.
4^
^^
6.4
5.5
7.4
1.4
1.1
1.8
^^
^0.
70.
50.
91.
21.
01.
61.
10.
81.
52.
21.
72.
9
4
5-64
220.
121
5.6
224.
669
.366
.871
.86.
55.
47.
738
.736
.141
.318
.016
.719
.33.
32.
83.
97.
97.
18.
87.
06.
27.
95.
44.
66.
26.
15.
17.
2
6
5-74
650.
763
8.0
663.
623
7.2
229.
624
5.0
58.5
53.0
64.4
62.0
56.8
67.6
53.7
50.1
57.5
14.1
12.3
16.1
16.4
14.4
18.6
22.3
20.0
24.8
8.5
7.1
10.2
4.0
2.7
5.6
7
5+1,
165.
21,
148.
21,
182.
432
3.5
314.
533
2.6
248.
323
6.0
260.
911
1.4
104.
711
8.5
127.
912
2.3
133.
637
.434
.440
.621
.118
.923
.551
.648
.155
.317
.215
.119
.44.
93.
66.
6
Fem
ale
0-19
2.6
2.0
3.5
^^
^^
^^
^^
^^
^^
^^
^^
^^
^^
^^
^^
2
0-44
22
.720
.924
.52.
82.
23.
56.
45.
57.
41.
20.
81.
7^
^^
^^
^0.
90.
61.
30.
90.
61.
42.
21.
72.
9
4
5-64
192.
418
6.6
198.
253
.450
.456
.538
.736
.141
.313
.712
.215
.31.
81.
32.
43.
12.
43.
94.
84.
05.
83.
32.
54.
36.
15.
17.
2
6
5-74
515.
650
0.3
531.
317
7.7
168.
718
7.0
62.0
56.8
67.6
40.2
36.0
44.8
5.4
4.0
7.3
7.5
5.7
9.6
16.9
14.2
19.9
4.7
3.2
6.5
4.0
2.7
5.6
7
5+94
5.5
925.
796
5.6
252.
724
2.6
263.
211
1.4
104.
711
8.5
113.
210
6.4
120.
319
.716
.922
.812
.210
.014
.743
.939
.748
.411
.49.
313
.94.
93.
66.
6
Mal
e
0-
193.
12.
44.
0^
^^
^^
^^
^^
^^
^^
^^
^^
^^
^^
2
0-44
19
.618
.021
.33.
12.
53.
8^
^^
1.7
1.2
2.2
^^
^1.
20.
81.
61.
61.
22.
21.
30.
91.
9
4
5-64
249.
824
3.0
256.
886
.482
.490
.56.
55.
47.
722
.620
.624
.84.
94.
06.
013
.111
.514
.79.
48.
110
.87.
66.
39.
0
6
5-74
809.
578
8.7
830.
830
7.2
294.
432
0.4
58.5
53.0
64.4
69.6
63.6
76.0
24.2
20.7
28.1
26.9
23.2
31.0
28.8
24.9
33.0
13.0
10.4
16.1
7
5+1,
489.
51,
459.
31,
520.
142
7.8
411.
744
4.4
248.
323
6.0
260.
914
9.5
140.
115
9.5
63.5
57.4
70.1
34.2
29.8
39.2
63.0
56.9
69.6
25.5
21.6
29.9
Bla
ck
0-
192.
31.
43.
5^
^^
^^
^^
^^
^^
^^
^^
^^
^^
^^
^^
^
2
0-44
21
.919
.124
.92.
71.
83.
9^
^^
8.1
5.9
11.0
2.1
1.3
3.2
^^
^^
^^
1.3
0.7
2.2
2.8
1.6
4.7
4
5-64
235.
322
2.6
248.
558
.051
.864
.715
.911
.421
.748
.841
.157
.425
.421
.430
.0^
^^
9.9
7.4
12.9
7.3
5.2
10.0
8.8
5.8
12.9
6
5-74
806.
675
6.5
859.
123
8.0
211.
126
7.3
164.
313
1.2
203.
189
.768
.611
5.2
71.8
57.4
88.7
^^
^23
.415
.533
.821
.714
.231
.8^
^^
7
5+1,
350.
51,
272.
11,
432.
523
5.5
203.
427
1.1
661.
357
1.3
761.
512
3.1
95.0
157.
017
3.2
145.
920
4.2
32.9
21.7
47.9
24.4
14.9
37.7
30.5
19.7
45.0
^^
^
Wh
ite
0-19
3.2
2.6
3.9
^^
^^
^^
^^
^^
^^
^^
^^
^^
^^
^^
^^
^^
^
2
0-44
21
.320
.022
.73.
02.
53.
6^
^^
6.0
5.0
7.1
1.3
1.0
1.7
^^
^0.
80.
61.
11.
31.
01.
61.
10.
81.
52.
11.
62.
8
4
5-64
220.
921
6.1
225.
872
.269
.575
.05.
34.
36.
537
.734
.940
.616
.915
.618
.33.
63.
04.
37.
86.
98.
77.
16.
28.
05.
44.
66.
25.
74.
76.
9
6
5-74
641.
762
8.5
655.
123
8.9
230.
824
7.1
50.7
45.3
56.4
60.3
54.9
66.1
52.6
48.8
56.5
14.9
12.9
17.1
16.0
13.9
18.2
22.4
20.0
25.0
8.5
7.1
10.2
3.2
2.0
4.8
7
5+1,
161.
41,
143.
91,
179.
133
0.5
321.
234
0.0
229.
621
7.5
242.
211
1.3
104.
411
8.6
126.
212
0.4
132.
138
.034
.941
.321
.018
.723
.553
.249
.557
.117
.215
.119
.44.
12.
85.
7
Bla
ck F
emal
e
0-
192.
41.
24.
4^
^^
^^
^^
^^
^^
^^
^^
^^
^^
^^
2
0-44
26
.322
.131
.12.
51.
34.
28.
15.
911
.02.
71.
54.
5^
^^
^^
^^
^^
2.8
1.6
4.7
4
5-64
206.
319
0.2
223.
333
.927
.641
.248
.841
.157
.419
.314
.625
.0^
^^
^^
^7.
84.
911
.78.
85.
812
.9
6
5-74
638.
057
9.4
701.
015
8.8
130.
219
1.7
89.7
68.6
115.
251
.535
.871
.6^
^^
^^
^20
.611
.334
.5^
^^
7
5+1,
040.
195
4.9
1,13
0.9
138.
310
8.4
173.
912
3.1
95.0
157.
014
9.7
118.
518
6.5
30.3
17.3
49.2
^^
^20
.810
.437
.3^
^^
Wh
ite
Fem
ale
0-19
2.8
2.0
3.7
^^
^^
^^
^^
^^
^^
^^
^^
^^
^^
^^
^^
2
0-44
22
.320
.324
.33.
02.
33.
86.
05.
07.
10.
90.
51.
4^
^^
^^
^0.
90.
61.
40.
90.
61.
42.
11.
62.
8
4
5-64
193.
118
6.9
199.
557
.554
.161
.037
.734
.940
.612
.811
.314
.61.
91.
32.
63.
32.
54.
24.
43.
55.
53.
32.
54.
35.
74.
76.
9
6
5-74
508.
149
2.1
524.
518
1.2
171.
719
1.1
60.3
54.9
66.1
39.4
35.1
44.2
5.6
4.0
7.6
7.6
5.7
9.8
16.4
13.6
19.5
4.7
3.2
6.5
3.2
2.0
4.8
7
5+94
4.6
924.
196
5.4
261.
425
0.7
272.
511
1.3
104.
411
8.6
111.
710
4.7
119.
019
.316
.422
.411
.99.
714
.545
.841
.350
.511
.49.
313
.94.
12.
85.
7
Bla
ck M
ale
0-19
2.1
1.0
3.9
^^
^^
^^
^^
^^
^^
^^
^^
^^
2
0-44
17
.113
.621
.13.
01.
75.
0^
^^
^^
^^
^^
^^
^^
^^
4
5-64
269.
324
9.4
290.
486
.375
.298
.615
.911
.421
.732
.625
.940
.5^
^^
18.3
13.4
24.4
6.8
3.9
10.8
6
5-74
1,02
8.1
942.
61,
119.
334
2.1
293.
539
6.3
164.
313
1.2
203.
198
.673
.412
9.6
^^
^44
.428
.266
.723
.212
.040
.5
7
5+1,
911.
91,
756.
62,
077.
441
1.2
340.
949
1.7
661.
357
1.3
761.
521
5.9
165.
927
6.2
37.7
18.8
67.4
37.7
18.8
67.4
48.0
26.2
80.5
Wh
ite
Mal
e
0-
193.
62.
74.
6^
^^
^^
^^
^^
^^
^^
^^
^^
^^
^^
2
0-44
20
.418
.622
.43.
12.
43.
9^
^^
1.7
1.2
2.4
^^
^1.
41.
02.
01.
61.
12.
21.
30.
91.
9
4
5-64
250.
324
3.0
257.
887
.883
.592
.35.
34.
36.
521
.319
.223
.55.
54.
46.
712
.611
.014
.39.
98.
511
.57.
66.
39.
0
6
5-74
797.
177
5.5
819.
230
5.9
292.
631
9.7
50.7
45.3
56.4
67.8
61.6
74.5
25.7
21.9
29.9
25.7
21.9
29.9
29.4
25.4
33.9
13.0
10.4
16.1
7
5+1,
477.
21,
446.
31,
508.
643
1.1
414.
544
8.2
229.
621
7.5
242.
214
7.3
137.
615
7.4
65.3
58.9
72.2
34.2
29.6
39.2
64.1
57.8
70.9
25.5
21.6
29.9
(1)
Age
-spe
cific
mor
talit
y ra
tes
are
expr
esse
d as
num
ber
of d
eath
s pe
r 10
0,00
0 po
pula
tion.
Sou
rce
of d
ata:
Offi
ce o
f Vita
l Sta
tistic
s
^ S
tatis
tics
are
not d
ispl
ayed
for
cells
with
few
er th
an 1
0 de
aths
.
All
Can
cers
Lu
ng
&
Bro
nch
us
Pro
stat
eB
reas
tC
IC
IC
IC
olo
rect
alB
lad
der
Hea
d &
Nec
kN
on
-Ho
dg
kin
CI
CI
Mel
ano
ma
Cer
vix
CI
CI
CI
CI
CI
Tabl
e 22
. A
ge-S
peci
fic M
orta
lity
Rat
es (1
) by
Sex,
Rac
e, a
nd A
ge G
roup
, Flo
rida,
200
3

Florida Annual Cancer Report: 2003 Incidence and Mortality
MortalityNumber Rate
Site of Deaths Percent (per million)All Cancers 380 -- 24.8 22.4 27.4
Leukemia 118 31.1 7.7 6.4 9.2 Acute Lymphocytic 47 12.4 3.1 2.3 4.1 Other Leukemia 71 18.7 4.6 3.6 5.8Brain & Nervous 109 28.7 7.1 5.8 8.6Lymphoma 14 3.7 0.9 0.5 1.5 Non-Hodgkin 13 3.4 0.8 0.5 1.5 Hodgkin 1 0.3 0.1 0.0 0.4Kidney 16 4.2 1.0 0.6 1.7Soft Tissue 15 3.9 1.0 0.5 1.6Bones and Joints 27 7.1 1.8 1.2 2.6Endocrine 42 11.1 2.7 2.0 3.7Eye 2 0.5 0.1 0.0 0.5All Other Cancers 37 9.7 2.4 1.7 3.3Source of data: Office of Vital Statistics
Table 23. Number of Cancer Deaths and Age-Specific Mortality Ratesfor Children Age 0-14, Florida, 1999-2003
CI
TRENDS IN DEATHS AND MORTALITY RATES
Sex and Race
• Over the 23-year period since 1981, the total number of deaths increased 58 percent from 24,298 in 1981 to 38,623 in 2003. Age-adjusted mortality rates for all cancers combined over this period decreased by 11 percent and 19 percent for females and males, respectively.
• Despite the greater decline in mortality among males in the past 23 years, the difference in mortality rates between the sexes persists: the rate among males was 48 percent greater than among females in 2003.
• The mortality rate for all cancers combined among males has declined steadily since 1990, primarily due to decreasing mortality rates for lung, prostate, and colorectal cancers.
• The number of cancer deaths increased 63 percent and 58 percent among Blacks and Whites over the 23-year period, respectively, due to Florida's increasing and aging population. Age-adjusted mortality rates decreased 20 percent among Blacks and 14 percent among Whites between 1981 and 2003.
• Total cancer mortality rates declined in all race-sex groups between 1981 and 2003. The rate decreased by 27 percent among Black males, 7 percent among Black females, 18 percent among White males, and 11 percent among White females.
• The age-adjusted mortality rate for all cancers combined among Black males was the highest among all race-sex groups in 1981 to 2003, regardless that the rate among Black males has declined by 27 percent since 1981.
• Blacks had a higher morality rate than Whites in both males and females. The racial disparity in age-adjusted mortality decreased by 11 percent among males, but increased by 4 percent among females in the 23-year period.
• Males had a higher mortality rate than females in both Blacks and Whites. The gender disparity decreased by 8 percent among Whites and by 21 percent among Blacks in the 23-year period.
71

Florida Annual Cancer Report: 2003 Incidence and Mortality
Mortality
72
Sou
rce
of d
ata:
Offi
ce o
f Vita
l Sta
tistic
s
Fig
ure
17.
Dea
ths
and
Ag
e-A
dju
sted
Mo
rtal
ity
Rat
es f
or
All
Can
cers
by
Sex
an
d b
y R
ace,
Flo
rid
a, 1
981-
2003
Fem
ale
05
10152025
1981
1982
1983
1984
1985
1986
1987
1988
1989
1990
1991
1992
1993
1994
1995
1996
1997
1998
1999
2000
2001
2002
2003
Age
-Adj
uste
d R
ate
(per
100
,000
) 0100
200
300
Dea
ths
(x 1
,000
)
Mal
e
05
10152025
1981
1982
1983
1984
1985
1986
1987
1988
1989
1990
1991
1992
1993
1994
1995
1996
1997
1998
1999
2000
2001
2002
2003
Age
-Adj
uste
d R
ate
(per
100
,000
) 0100
200
300
Dea
ths
(x 1
000)
Dea
ths
Age
-Adj
uste
d R
ate
Bla
ck
01234
1981
1982
1983
1984
1985
1986
1987
1988
1989
1990
1991
1992
1993
1994
1995
1996
1997
1998
1999
2000
2001
2002
2003
Age
-Adj
uste
d R
ate
(per
100
,000
) 0100
200
300
Dea
ths
(x 1
,000
)
Wh
ite
0
10203040
1981
1982
1983
1984
1985
1986
1987
1988
1989
1990
1991
1992
1993
1994
1995
1996
1997
1998
1999
2000
2001
2002
2003
Age
-Adj
uste
d R
ate
(per
100
,000
) 0100
200
300
Dea
ths
(x 1
000)
Dea
ths
Age
-Adj
uste
d R
ate

Florida Annual Cancer Report: 2003 Incidence and Mortality
Mortality
73
Sou
rce
of d
ata:
Offi
ce o
f Vita
l Sta
tistic
s
Figu
re 1
8. D
eath
s an
d A
ge-A
djus
ted
Mor
talit
y R
ates
for A
ll C
ance
rs b
y Se
x an
d R
ace,
Fl
orid
a, 1
981-
2003
Whi
te F
emal
e
05101520
1981
1982
1983
1984
1985
1986
1987
1988
1989
1990
1991
1992
1993
1994
1995
1996
1997
1998
1999
2000
2001
2002
2003
Dea
ths
(x 1
,000
)
0100
200
300
400
Age
-Adj
uste
d R
ate
(per
100
,000
)
Dea
ths
Age
-Adj
uste
d R
ate
Whi
te M
ale
05101520
1981
1982
1983
1984
1985
1986
1987
1988
1989
1990
1991
1992
1993
1994
1995
1996
1997
1998
1999
2000
2001
2002
2003
Dea
ths
(x 1
,000
)
0100
200
300
400
Age
-Adj
uste
d R
ate
(per
100
,000
)
Dea
ths
Age
-Adj
uste
d R
ate
Bla
ck M
ale
012
1981
1982
1983
1984
1985
1986
1987
1988
1989
1990
1991
1992
1993
1994
1995
1996
1997
1998
1999
2000
2001
2002
2003D
eath
s(x
1,0
00)
0100
200
300
400
Age
-Adj
uste
d R
ate
(per
100
,000
)B
lack
Fem
ale
012
1981
1982
1983
1984
1985
1986
1987
1988
1989
1990
1991
1992
1993
1994
1995
1996
1997
1998
1999
2000
2001
2002
2003
Dea
ths
(x 1
,000
)
0100
200
300
400
Age
-Adj
uste
d R
ate
(per
100
,000
)

Florida Annual Cancer Report: 2003 Incidence and Mortality
Mortality
Source of data: Office of Vital Statistics
Figure 19. Age-Adjusted Mortality Rates for All Cancers by Sex and Race, Florida, 1981-2003
0
50
100
150
200
250
300
350
400
450
1981
1982
1983
1984
1985
1986
1987
1988
1989
1990
1991
1992
1993
1994
1995
1996
1997
1998
1999
2000
2001
2002
2003
Age-Adjusted Rate (per 100,000)
Black Male
White Male
Black Female
White Female
Cancer Sites
Lung and Bronchus
• Black males had higher age-adjusted mortality rates than White males in the 23-year period. The mortality rates among both Black and White males have decreased since 1981, by 35 percent among Black males and by 22 percent in White males. The racial disparity was reduced due to a larger reduction in mortality among Black males than among White males.
• White females have had higher Age-adjusted mortality rates than Black females since 1981.
The mortality rates in both Black and White females increased by 29 percent and 45 percent, respectively, from 1981 to 2003. The racial disparity increased in the 23-year period because the mortality increased faster among White females than among Black females.
Colorectal
• Mortality rates decreased among Whites, by 46 percent among females and by 39 percent among males, during the period from 1981 to 2003. The rates also decreased by 9 percent among Black females, but increased by 8 percent among Black males.
• The racial disparity in mortality reversed from 1981 to 2003. Whites had mortality rates approximately 15 percent higher than that among Blacks in 1981. By 2003, the mortality rates among Black females and Black males were 47 percent and 51 percent, respectively, higher than among their White counterparts.
Bladder
• Mortality rates declined in all sex-race groups. Compared to 1981, rates decreased by 29 percent among Black females, 53 percent among Black males, 27 percent among White females, and 26 percent among White males.
74
Florida Annual Cancer Report: 2003 Incidence and Mortality
Mortality
• Males had higher age-adjusted mortality rates than females. The gender disparity in the mortality rates was unchanged among Whites, but decreased by 33 percent among Blacks between 1981 and 2003.
Prostate
• Mortality rates in both Whites and Blacks decreased. The rate decreased by 24 percent among Black males and 31 percent among White males.
• Blacks had a higher mortality rate than Whites. In 1981, the mortality rate among Black males was 2.7 times the rate among Whites. The racial disparity increased by 11 percent during the 23-year period.
Breast
• Age-adjusted mortality rates decreased by 29 percent in White females since 1981, but only by 12 percent in Black females.
• Blacks had higher mortality rates than Whites. Because of a steeper decline in the mortality rates among Whites than among Blacks, the racial disparity in breast cancer mortality rates has increased. The rate among Blacks was only 7 percent higher than that among Whites in 1986. In 2003, the rate among Blacks became 33 percent higher than among Whites.
Cervix
• Age-adjusted cervical cancer mortality rates decreased by 67 percent among Black females and by 23 percent among White females since 1981.
• The disparity in cervical cancer mortality rates between the races has decreased due to greater decline in the mortality among Blacks. In 1981, the mortality rate among Black females was 4.8 times the rate among White females. In 2003, Black females had a mortality rate only 2 times the rate among their White counterparts.
Head and Neck
• Mortality rates decreased in all sex-race groups. In comparison to 1981, mortality rates in 2003 were lower by 57 percent among Black females, 59 percent among Black males, 43 percent among White females, and 28 percent among White males.
• Males had higher mortality rates than females in all 23 years. The gender disparity in mortality reduced slightly (5 percent) among Blacks, but increased by 26 percent among Whites during 1981 to 2003.
Non-Hodgkin Lymphoma
• Mortality rates increased by 85 percent among Black females, 14 percent among Black males, and 26 percent among White males during the 23-year period. The mortality rate among White females was unchanged between 1981 and 2003.
• Whites had higher mortality rates than Blacks in both sexes. The racial disparity in mortality increased by 11 percent among males, but decreased by 46 percent among females, due to greater increases in the mortality rate among Black females and White males.
75

Florida Annual Cancer Report: 2003 Incidence and Mortality
Mortality
76
Figure 20.1 Age-Adjusted Mortality Rates by Sex and Race,Florida, 1981-2003
Lung and Bronchus
0
50
100
150
1981
1982
1983
1984
1985
1986
1987
1988
1989
1990
1991
1992
1993
1994
1995
1996
1997
1998
1999
2000
2001
2002
2003Age-Adjusted Rate
(per 100,000)
Black Male
White Male
Black Female
White Female
Colorectal
0
10
20
30
40
1981
1982
1983
1984
1985
1986
1987
1988
1989
1990
1991
1992
1993
1994
1995
1996
1997
1998
1999
2000
2001
2002
2003
Black Male
White Male
Black Female
White Female
Bladder
0
4
8
12
1981
1982
1983
1984
1985
1986
1987
1988
1989
1990
1991
1992
1993
1994
1995
1996
1997
1998
1999
2000
2001
2002
2003
Black Male
White Male
Black Female
White Female
Source of data: Office of Vital Statistics

Florida Annual Cancer Report: 2003 Incidence and Mortality
Mortality
77
Figure 20.2 Age-Adjusted Mortality Rates by Sex and Race,Florida, 1981-2003
Source of data: Office of Vital Statistics
Prostate
0
25
50
75
100
1981
1982
1983
1984
1985
1986
1987
1988
1989
1990
1991
1992
1993
1994
1995
1996
1997
1998
1999
2000
2001
2002
2003
Age-Adjusted Rate (per 100,000)
Black Male
White Male
Breast
0
15
30
45
1981
1982
1983
1984
1985
1986
1987
1988
1989
1990
1991
1992
1993
1994
1995
1996
1997
1998
1999
2000
2001
2002
2003
Black Female
White Female
Cervix
0
5
10
15
20
1981
1982
1983
1984
1985
1986
1987
1988
1989
1990
1991
1992
1993
1994
1995
1996
1997
1998
1999
2000
2001
2002
2003
Black Female
White Female
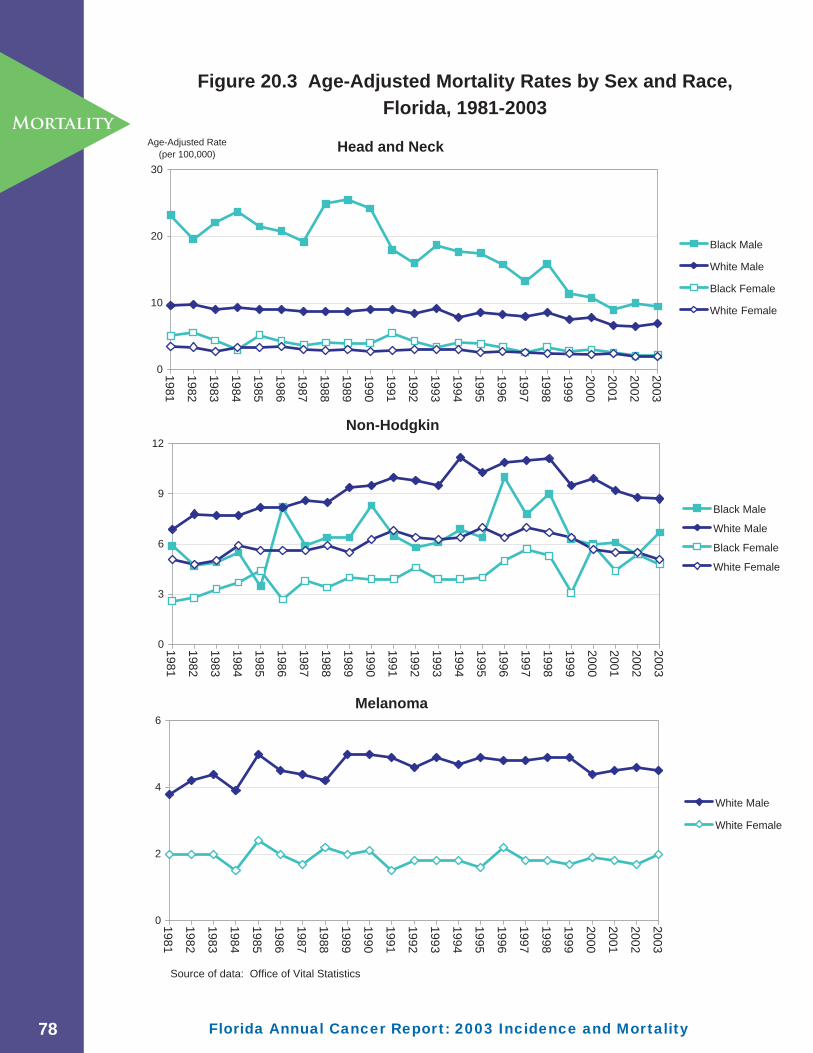
Florida Annual Cancer Report: 2003 Incidence and Mortality
Mortality
78
Source of data: Office of Vital Statistics
Figure 20.3 Age-Adjusted Mortality Rates by Sex and Race,
Florida, 1981-2003
Head and Neck
0
10
20
30
1981
1982
1983
1984
1985
1986
1987
1988
1989
1990
1991
1992
1993
1994
1995
1996
1997
1998
1999
2000
2001
2002
2003Age-Adjusted Rate
(per 100,000)
Black Male
White Male
Black Female
White
Non-Hodgkin
0
3
6
9
12
1981
1982
1983
1984
1985
1986
1987
1988
1989
1990
1991
1992
1993
1994
1995
1996
1997
1998
1999
2000
2001
2002
2003
Black Male
White Male
Black Female
White Female
Melanoma
0
2
4
6
1981
1982
1983
1984
1985
1986
1987
1988
1989
1990
1991
1992
1993
1994
1995
1996
1997
1998
1999
2000
2001
2002
2003
White Male
White Female
Female

Florida Annual Cancer Report: 2003 Incidence and Mortality
Mortality
79
Melanoma
• Mortality rates increased by 18 percent for White males from 1981 to 2003. The rates were unchanged among White females.
• White males had a higher mortality rate than White females in all years. Compared to White females, the rate among White males was 90 percent higher in 1981 and 125 percent higher in 2003.
Age-specifi c Mortality
• Age-specifi c mortality decreased in all race-sex groups, except females age 75 years and older.
Source of data: Office of Vital Statistics
Figure 21. Age-Specific Mortality Rates for All Cancers by Sex, Race, and Age Group, Florida, 1981-2003
Black
1
10
100
1000
10000
1981
1982
1983
1984
1985
1986
1987
1988
1989
1990
1991
1992
1993
1994
1995
1996
1997
1998
1999
2000
2001
200275+
65-74
45-64
20-44
0-19
Rate per 100,000White
1
10
100
1000
10000
1981
1982
1983
1984
1985
1986
1987
1988
1989
1990
1991
1992
1993
1994
1995
1996
1997
1998
1999
2000
2001
2002
Rate per 100,000Black Female
1
10
100
1000
10000
1981
1982
1983
1984
1985
1986
1987
1988
1989
1990
1991
1992
1993
1994
1995
1996
1997
1998
1999
2000
2001
2002
2003
75+
65-74
45-64
20-44
0-19
Log of Age-Specific Rate (per 100,000) White Female
1
10
100
1000
10000
1981
1982
1983
1984
1985
1986
1987
1988
1989
1990
1991
1992
1993
1994
1995
1996
1997
1998
1999
2000
2001
2002
2003
Log of Age-Specific Rate (per 100,000)
Black Male
1
10
100
1000
10000
1981
1982
1983
1984
1985
1986
1987
1988
1989
1990
1991
1992
1993
1994
1995
1996
1997
1998
1999
2000
2001
2002
2003
Log of Age-Specific Rate (per 100,000 )
75+
65-74
45-64
20-44
0-19
White Male
1
10
100
1000
10000
1981
1982
1983
1984
1985
1986
1987
1988
1989
1990
1991
1992
1993
1994
1995
1996
1997
1998
1999
2000
2001
2002
2003
Log of Age-Specific Rate (per 100,000)

Florida Annual Cancer Report: 2003 Incidence and Mortality
Mortality
• Among males, Blacks had a higher mortality rate than Whites in all age groups in 1981. The mortality rate has decreased in both Blacks and Whites since 1981. The decrease in the mortality rate among Blacks was greater than that among Whites in all age groups, except the 75 and older group. Due to a greater decline in the mortality rate among Blacks, the racial disparity in the mortality rate reduced or even reversed among males under age 75.
• Among females, the age-specifi c mortality rates in 1981 were higher among Blacks than among Whites for all age groups, except the 75 and older group. Blacks had greater declines in the mortality rates than Whites in groups under age 64. Among females age 65 and older, Whites had either greater reduction or less increase in the mortality rates than did Blacks.
AVERAGE ANNUAL PERCENT CHANGE
Average Annual Percent Change (AAPC) was calculated for the most recent 10-year period, 1994 to 2003.
• For all cancers combined in Florida, the mortality rate decreased by 1.9 percent per year for the past ten years. The mortality rate decreased signifi cantly in both males and females and in Whites and Blacks.
• Over the 10-year period, the mortality rate decreased signifi cantly for all major cancer sites, except melanoma.
AllCancers
Lung & Bronchus Prostate Breast Colorectal Bladder
Head & Neck
Non-Hodgkin Melanoma Cervix
Florida (1) -1.9 * -1.7 * -5.2 * -3.6 * -3.0 * -1.5 * -3.4 * -2.9 * -0.4 -2.7 *
Female (2) -1.8 * -0.7 * -3.6 * -3.3 * -2.0 * -4.1 * -2.8 * 0.2 -2.7 *Male -2.2 * -2.5 * -5.2 * -2.8 * -1.5 * -3.3 * -3.0 * -0.8
Black (3) -2.9 * -4.1 * -3.7 * -2.3 * -1.8 * -4.6 * -7.3 * -1.3 -3.8 *White -1.8 * -1.5 * -5.5 * -3.8 * -3.1 * -1.2 * -2.8 * -3.0 * -0.4 -2.4 *
Black Female -1.9 * -1.9 -2.3 * -2.6 * -5.0 -6.6 * 1.4 -3.8 *White Female -1.7 * -0.6 * -3.8 * -3.4 * -1.6 -3.8 * -3.1 * 0.2 -2.4 *Black Male -3.9 * -5.3 * -3.7 * -0.9 -4.8 -7.7 * -3.5White Male -2.0 * -2.3 * -5.5 * -3.0 * -1.3 * -2.6 * -2.9 * -0.8Source of data: Office of Vital Statistics(1) Florida Average Annual Percent Change (AAPC) includes cases with unknown sex and race, and deaths in the Other race group.(2) Total AAPC by sex include deaths with unknown and Other race.(3) Total AAPC by race includes deaths with unknown sex.* AAPC is significantly different from zero (p<0.05).
Table 24. Average Annual Percent Change in Age-adjusted Mortality Rates by Sex and Race, Florida, 1994-2003
Sex and Race
• Among males, there was a signifi cant decrease in the mortality rate over the 10-year period for all cancers combined, and for all major cancers except colorectal cancer, non-Hodgkin lymphoma, and bladder cancer in Blacks, and melanoma in Whites.
• The decrease in mortality rate was greater among Black males than among White males for all cancers combined (3.9 percent versus 2.0 percent), cancer of the lung and bronchus (5.3 percent versus 2.3 percent), and head and neck (7.7 percent versus 2.6 percent).
• Among females, the mortality rate for all cancers combined, breast, colorectal, head and neck, and cervical cancers decreased signifi cantly in both Whites and Blacks.
80
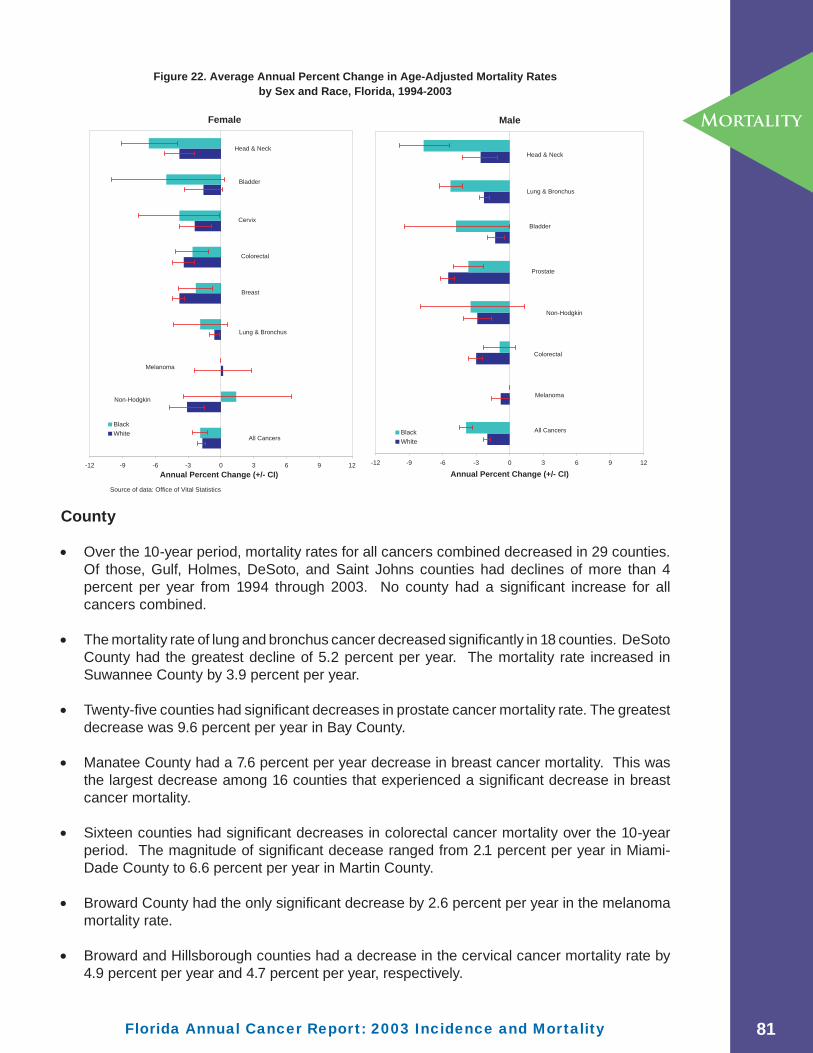
Florida Annual Cancer Report: 2003 Incidence and Mortality
Mortality
Source of data: Office of Vital Statistics
Figure 22. Average Annual Percent Change in Age-Adjusted Mortality Ratesby Sex and Race, Florida, 1994-2003
Female
All Cancers
Non-Hodgkin
Melanoma
Lung & Bronchus
Breast
Colorectal
Cervix
Bladder
Head & Neck
-12 -9 -6 -3 0 3 6 9 12Annual Percent Change (+/- CI)
BlackWhite
Male
All Cancers
Melanoma
Colorectal
Non-Hodgkin
Prostate
Bladder
Lung & Bronchus
Head & Neck
-12 -9 -6 -3 0 3 6 9 12
Annual Percent Change (+/- CI)
BlackWhite
County
• Over the 10-year period, mortality rates for all cancers combined decreased in 29 counties. Of those, Gulf, Holmes, DeSoto, and Saint Johns counties had declines of more than 4 percent per year from 1994 through 2003. No county had a signifi cant increase for all cancers combined.
• The mortality rate of lung and bronchus cancer decreased signifi cantly in 18 counties. DeSoto County had the greatest decline of 5.2 percent per year. The mortality rate increased in Suwannee County by 3.9 percent per year.
• Twenty-fi ve counties had signifi cant decreases in prostate cancer mortality rate. The greatest decrease was 9.6 percent per year in Bay County.
• Manatee County had a 7.6 percent per year decrease in breast cancer mortality. This was the largest decrease among 16 counties that experienced a signifi cant decrease in breast cancer mortality.
• Sixteen counties had signifi cant decreases in colorectal cancer mortality over the 10-year period. The magnitude of signifi cant decease ranged from 2.1 percent per year in Miami-Dade County to 6.6 percent per year in Martin County.
• Broward County had the only signifi cant decrease by 2.6 percent per year in the melanoma mortality rate.
• Broward and Hillsborough counties had a decrease in the cervical cancer mortality rate by 4.9 percent per year and 4.7 percent per year, respectively.
81

Florida Annual Cancer Report: 2003 Incidence and Mortality
Mortality
• During 1994 to 2003, Collier and Hillsborough counties had a decrease in bladder cancer mortality by 6.7 percent per year and 5.3 percent per year, respectively.
• Five counties had a decrease in head and neck cancers mortality during 1994 to 2003. Miami-Dade County had the largest decrease by 6.3 percent per year.
• The mortality rate of non-Hodgkin lymphoma decreased signifi cantly in fi ve counties among which Indian River County had the greatest decline of 6.8 percent per year.
82

Florida Annual Cancer Report: 2003 Incidence and Mortality
Mortality
83
Florida -1.9 * -1.7 * -5.2 * -3.6 * -3.0 * -1.5 * -3.4 * -2.9 * -0.4 -2.7 *Alachua -1.7 * -2.3 -6.7 * 1.1 -2.4 ^ ^ ^ ^ ^Baker -1.9 ^ ^ ^ ^ ^ ^ ^ ^ ^Bay -3.0 * -1.9 -9.6 * -3.4 -6.0 * ^ ^ ^ ^ ^Bradford -3.8 -5.3 ^ ^ ^ ^ ^ ^ ^ ^Brevard -1.1 * -1.5 -3.0 * -3.8 * -3.0 * -2.8 -3.5 -0.4 ^ ^Broward -2.7 * -2.7 * -5.5 * -3.4 * -3.8 * -0.9 -4.7 * -5.0 * -2.6 * -4.9 *Calhoun -2.4 * ^ ^ ^ ^ ^ ^ ^ ^ ^Charlotte -1.7 * -1.3 -4.9 * -1.4 -3.9 * ^ ^ -3.9 ^ ^Citrus -1.2 0.7 -5.4 -3.6 -5.7 * ^ ^ -0.6 ^ ^Clay -0.1 0.2 ^ -3.5 -2.0 ^ ^ ^ ^ ^Collier -3.3 * -3.1 * -7.6 * -5.3 * -6.1 * -6.7 * ^ -5.5 * ^ ^Columbia -0.3 0.9 ^ ^ -2.1 ^ ^ ^ ^ ^Miami-Dade -2.4 * -3.5 * -4.0 * -3.7 * -2.1 * -1.3 -6.3 * -3.4 * -1.9 -2.7DeSoto -4.4 * -5.2 * ^ ^ ^ ^ ^ ^ ^ ^Dixie 2.8 ^ ^ ^ ^ ^ ^ ^ ^ ^Duval -0.5 -0.5 -2.2 -1.6 -1.4 -1.7 -3.7 * -2.7 0.8 ^Escambia -1.7 * -1.5 * -3.5 -3.2 -2.2 ^ -2.1 2.0 ^ ^Flagler -1.9 -2.5 ^ ^ -5.1 ^ ^ ^ ^ ^Franklin -2.0 ^ ^ ^ ^ ^ ^ ^ ^ ^Gadsden 0.3 1.3 ^ ^ ^ ^ ^ ^ ^ ^Gilchrist -4.1 ^ ^ ^ ^ ^ ^ ^ ^ ^Glades -4.4 ^ ^ ^ ^ ^ ^ ^ ^ ^Gulf -5.5 * ^ ^ ^ ^ ^ ^ ^ ^ ^Hamilton -0.5 ^ ^ ^ ^ ^ ^ ^ ^ ^Hardee -2.0 -0.5 ^ ^ ^ ^ ^ ^ ^ ^Hendry 0.2 -1.6 ^ ^ ^ ^ ^ ^ ^ ^Hernando -0.9 0.7 -4.6 * -2.3 -3.0 ^ ^ -1.2 ^ ^Highlands -1.8 0.4 -7.6 * -4.5 -3.7 ^ ^ ^ ^ ^Hillsborough -2.8 * -2.8 * -5.9 * -4.4 * -3.4 * -5.3 * -3.6 -3.5 -1.0 -4.7 *Holmes -4.6 * ^ ^ ^ ^ ^ ^ ^ ^ ^Indian River -2.6 * -0.2 -6.4 * -2.3 -4.6 * ^ ^ -6.8 * ^ ^Jackson -1.9 -1.1 ^ ^ ^ ^ ^ ^ ^ ^Jefferson -1.4 ^ ^ ^ ^ ^ ^ ^ ^ ^Lafayette ^ ^ ^ ^ ^ ^ ^ ^ ^ ^Lake -1.9 * -2.4 * -7.9 * -3.9 -1.4 ^ ^ -3.4 * ^ ^ Lee -1.5 * -1.1 -6.7 * -3.0 * -2.1 3.9 -2.4 -1.6 -1.1 ^Leon -0.2 -0.7 -5.8 -0.6 -0.4 ^ ^ ^ ^ ^Levy -2.5 * -2.5 ^ ^ ^ ^ ^ ^ ^ ^Liberty ^ ^ ^ ^ ^ ^ ^ ^ ^ ^Madison -0.5 ^ ^ ^ ^ ^ ^ ^ ^ ^Manatee -1.8 * -0.6 -6.5 * -7.6 * -5.9 * -3.5 -0.6 -2.7 ^ ^Marion -1.0 -1.1 -5.8 * -0.9 0.7 ~ -0.2 -2.8 ^ ^Martin -2.8 * -3.2 * -8.2 * -6.8 * -6.6 * ^ ^ ^ ^ ^Monroe -2.2 -2.1 ^ ^ 0.8 ^ ^ ^ ^ ^Nassau -2.0 -4.0 * ^ ^ ^ ^ ^ ^ ^ ^Okaloosa -1.8 -2.4 -7.4 * -1.8 -0.6 ^ ^ ^ ^ ^Okeechobee -1.8 -4.4 * ^ ^ ^ ^ ^ ^ ^ ^Orange -2.7 * -3.4 * -3.1 * -4.0 * -4.0 * -2.0 -4.0 * -3.8 -2.1 ^Osceola -2.0 -2.6 * ^ -3.7 * -3.8 ^ ^ -2.7 ^ ^Palm Beach -2.0 * -1.7 * -6.3 * -5.0 * -3.8 * -2.2 -3.8 * -2.2 -0.6 -2.1 Pasco -1.7 * -0.5 -4.9 * -3.7 -3.6 * -2.3 -1.0 -3.4 ^ ^Pinellas -1.7 * -0.8 -5.4 * -4.0 * -2.3 * -1.9 -3.0 -2.2 -0.2 -3.9Polk -1.3 -0.9 -4.7 * -4.0 * -2.1 -0.9 -2.9 -2.2 1.2 ^Putnam 0.1 0.8 ^ ^ -3.0 ^ ^ ^ ^ ^Saint Johns -4.1 * -3.4 * -7.7 -5.7 * -8.3 ^ ^ ^ ^ ^Saint Lucie -1.8 * -2.9 * -5.4 * -1.4 -3.1 ^ ^ -5.3 ^ ^Santa Rosa -0.2 -1.0 ^ ^ 0.3 ^ ^ ^ ^ ^Sarasota -1.7 * -2.5 * -5.1 * -2.8 -3.5 -0.8 0.5 -4.1 3.6 ^Seminole -2.7 * -2.0 * -6.0 -4.4 * -4.2 * ~ -1.8 -4.3 ^ ^Sumter 0.0 -3.0 * ^ ^ ^ ^ ^ ^ ^ ^Suwannee 0.0 3.9 * ^ ^ ^ ^ ^ ^ ^ ^Taylor -2.0 -1.5 ^ ^ ^ ^ ^ ^ ^ ^Union -0.3 -0.5 ^ ^ ^ ^ ^ ^ ^ ^Volusia -1.3 * -0.4 -4.2 * -3.8 * -2.1 -1.3 -2.4 -2.0 2.6 ^Wakulla -1.9 * -3.3 ^ ^ ^ ^ ^ ^ ^ ^Walton -2.1 -3.7 ^ ^ ^ ^ ^ ^ ^ ^Washington -2.5 -0.4 ^ ^ ^ ^ ^ ^ ^ ^
* Estimated Annual Percent Change (EAPC) is significantly different from zero, p<0.05. Source of data: Office of Vital Statistics^ Statistics are not displayed for cells with fewer than 10 deaths in any year.
Cervix
Table 25. Average Annual Percent Change in Age-Adjusted Mortality Rates by County, Florida, 1994-2003
All CancersLung &
Bronchus Prostate Breast Colorectal BladderHead & Neck
Non-Hodgkin Melanoma

Florida Annual Cancer Report: 2003 Incidence and Mortality
Mortality
84
DEATHS-TO-CASES RATIOS
The deaths-to-cases ratio is an approximate indicator of the prognosis of cancer. It is defi ned as the number of cancer deaths divided by the number of new cancer cases for the year. Ratios closer to 1.0 indicate a poorer overall prognosis than ratios closer to zero. The deaths-to-cases ratio may be greater than 1.0 because of deaths occurring in the current year among persons diagnosed in previous years.
• The overall deaths-to-cases ratio in Florida was 0.41 in 2003. Cancer of the lung and bronchus had the highest ratio, 0.74, and prostate cancer had the lowest, 0.16, of the major cancers.
Sex and Race
• Females had lower deaths-to-cases ratios than males for cancer of the lung and bronchus, colorectal, head and neck, non-Hodgkin lymphoma, and melanoma, but a higher ratio for bladder cancer.
• Blacks had higher ratios than Whites for all cancers combined and all major cancer sites
except lung and bronchus cancers and non-Hodgkin lymphoma. The racial disparities in deaths-to-cases ratios ranged from 8 percent higher ratios among Blacks than among Whites for all cancers combined, to 43 percent higher for cervical cancer.
• Among the four sex-race groups, Black females had the highest deaths-to-cases ratio for all cancers combined and all major cancers except cancer of the lung and bronchus, colorectal cancer, head and neck cancer, and non-Hodgkin lymphoma. For colorectal and head and neck cancers, Black males had the highest deaths-to-cases ratios. For cancer of the lung and bronchus and non-Hodgkin lymphoma, White males had the highest death-to case ratios.
AllCancers
Lung & Bronchus Prostate Breast Colorectal Bladder
Head & Neck
Non-Hodgkin Melanoma Cervix
Florida 0.41 0.74 0.16 0.22 0.34 0.19 0.26 0.42 0.19 0.33
Female 0.40 0.71 0.22 0.33 0.21 0.25 0.41 0.18 0.33Male 0.41 0.77 0.16 0.36 0.19 0.27 0.43 0.20
Black 0.44 0.73 0.21 0.29 0.42 0.27 0.33 0.41 0.44White 0.41 0.75 0.16 0.21 0.34 0.19 0.26 0.43 0.20 0.31
Black Female 0.45 0.74 0.29 0.37 0.40 0.32 0.43 0.44White Female 0.40 0.72 0.21 0.33 0.21 0.25 0.42 0.18 0.31Black Male 0.43 0.73 0.21 0.47 0.19 0.34 0.39 White Male 0.41 0.78 0.16 0.35 0.19 0.26 0.44 0.21Source of data: Office of Vital Statistics and Florida Cancer Data System
Table 26. Deaths-to-Cases Ratios by Sex and Race, Florida, 2003

Florida Annual Cancer Report: 2003 Incidence and Mortality
Mortality
AllCancers
Lung & Bronchus Prostate Breast Colorectal Bladder
Head & Neck
Non-Hodgkin Melanoma Cervix
Florida 0.41 0.74 0.16 0.22 0.34 0.19 0.26 0.42 0.19 0.33Alachua 0.40 0.67 0.16 0.20 0.29 ^ ^ 0.66 ^ ^Baker 0.48 0.58 ^ ^ ^ ^ ^ ^ ^ ^Bay 0.38 0.65 0.12 0.21 0.28 ^ ^ ^ ^ ^Bradford 0.49 0.71 ^ ^ ^ ^ ^ ^ ^ ^Brevard 0.41 0.73 0.16 0.19 0.36 0.16 0.24 0.48 0.20 0.40Broward 0.39 0.71 0.18 0.24 0.30 0.20 0.25 0.44 0.20 0.34Calhoun 0.82 1.00 ^ ^ ^ ^ ^ ^ ^ ^Charlotte 0.42 0.75 0.15 0.25 0.37 0.25 ^ 0.43 ^ ^Citrus 0.50 0.84 0.19 0.18 0.46 0.37 ^ 0.70 ^ ^Clay 0.42 0.84 0.18 0.11 0.28 ^ ^ ^ ^ ^Collier 0.33 0.71 0.10 0.15 0.29 0.13 0.24 0.30 0.20 ^Columbia 0.51 0.83 ^ ^ 0.47 ^ ^ ^ ^ ^Miami-Dade 0.37 0.71 0.16 0.24 0.35 0.21 0.22 0.41 0.20 0.29DeSoto 0.45 0.92 ^ ^ ^ ^ ^ ^ ^ ^Dixie 0.46 0.85 ^ ^ ^ ^ ^ ^ ^ ^Duval 0.53 0.94 0.22 0.28 0.42 0.19 0.30 0.45 0.25 0.37Escambia 0.42 0.84 0.13 0.17 0.41 0.19 0.19 0.47 ^ ^Flagler 0.37 0.74 0.15 0.12 0.29 ^ ^ ^ ^ ^Franklin 0.54 1.14 ^ ^ ^ ^ ^ ^ ^ ^Gadsden 0.50 0.68 ^ ^ 0.56 ^ ^ ^ ^ ^Gilchrist 0.54 0.82 ^ ^ ^ ^ ^ ^ ^ ^Glades 0.71 ^ ^ ^ ^ ^ ^ ^ ^ ^Gulf 0.51 ^ ^ ^ ^ ^ ^ ^ ^ ^Hamilton 1.06 1.71 ^ ^ ^ ^ ^ ^ ^ ^Hardee 0.34 0.57 ^ ^ ^ ^ ^ ^ ^ ^Hendry 0.35 0.47 ^ ^ ^ ^ ^ ^ ^ ^Hernando 0.45 0.76 0.13 0.24 0.38 0.14 0.41 0.50 ^ ^Highlands 0.44 0.82 0.12 0.24 0.38 ^ 0.36 ^ ^ ^Hillsborough 0.38 0.73 0.16 0.19 0.36 0.18 0.30 0.46 0.14 0.25Holmes 0.56 ^ ^ ^ ^ ^ ^ ^ ^ ^Indian River 0.44 0.84 0.17 0.28 0.22 ^ ^ 0.54 ^ ^Jackson 0.58 0.96 ^ ^ ^ ^ ^ ^ ^ ^Jefferson 0.49 1.44 ^ ^ ^ ^ ^ ^ ^ ^Lafayette 0.39 ^ ^ ^ ^ ^ ^ ^ ^ ^Lake 0.38 0.72 0.11 0.19 0.39 0.17 0.29 0.31 0.18 ^Lee 0.40 0.72 0.14 0.22 0.35 0.22 0.28 0.42 0.17 ^Leon 0.47 0.77 0.17 0.30 0.36 ^ 0.45 0.35 ^ ^Levy 0.41 0.85 ^ ^ ^ ^ ^ ^ ^ ^Liberty 0.42 ^ ^ ^ ^ ^ ^ ^ ^ ^Madison 0.50 1.06 ^ ^ ^ ^ ^ ^ ^ ^Manatee 0.42 0.72 0.15 0.19 0.31 0.14 0.26 0.34 0.48 ^Marion 0.46 0.77 0.23 0.28 0.39 0.28 0.38 0.34 0.25 ^Martin 0.39 0.74 0.17 0.17 0.23 0.20 0.24 0.53 ^ ^Monroe 0.43 0.59 ^ 0.20 0.45 ^ ^ ^ ^ ^Nassau 0.46 0.67 ^ 0.36 0.32 ^ ^ ^ ^ ^Okaloosa 0.38 0.74 0.11 0.21 0.27 ^ 0.33 0.32 ^ ^Okeechobee 0.38 0.69 ^ ^ 0.53 ^ ^ ^ ^ ^Orange 0.36 0.70 0.12 0.24 0.30 0.20 0.25 0.37 0.17 0.31Osceola 0.42 0.79 0.14 0.19 0.40 ^ ^ 0.41 ^ ^Palm Beach 0.38 0.71 0.18 0.17 0.35 0.16 0.19 0.45 0.13 0.36Pasco 0.42 0.81 0.16 0.23 0.40 0.21 0.24 0.42 0.21 0.52Pinellas 0.42 0.76 0.18 0.23 0.32 0.20 0.28 0.53 0.22 0.23Polk 0.39 0.75 0.15 0.18 0.36 0.22 0.33 0.36 0.15 ^Putnam 0.47 0.75 ^ 0.20 0.35 ^ ^ ^ ^ ^Saint Johns 0.38 0.61 0.18 0.17 0.30 ^ ^ ^ 0.39 ^Saint Lucie 0.49 0.80 0.21 0.23 0.39 0.23 0.38 0.36 0.31 ^Santa Rosa 0.37 0.73 0.13 0.14 0.30 0.31 ^ ^ ^ ^Sarasota 0.40 0.62 0.13 0.22 0.31 0.16 0.28 0.47 0.19 ^Seminole 0.39 0.87 0.12 0.20 0.36 0.20 0.28 0.41 0.22 ^Sumter 0.43 0.64 0.31 0.23 0.39 ^ ^ ^ ^ ^Suwannee 0.49 1.00 ^ ^ ^ ^ ^ ^ ^ ^Taylor 0.45 0.56 ^ ^ ^ ^ ^ ^ ^ ^Union 0.38 0.64 ^ ^ ^ ^ ^ ^ ^ ^Volusia 0.42 0.71 0.21 0.21 0.32 0.24 0.29 0.36 0.19 ^Wakulla 0.58 1.27 ^ ^ ^ ^ ^ ^ ^ ^Walton 0.55 0.82 ^ ^ 0.72 ^ ^ ^ ^ ^Washington 0.74 1.26 ^ ^ ^ ^ ^ ^ ^ ^
^ Statistics are not displayed for cells with fewer than 10 deaths. Source of data: Office of Vital Statistics and Florida Cancer Data System
Table 27. Deaths-to-Cases Ratios by County, Florida, 2003
85

Florida Annual Cancer Report: 2003 Incidence and Mortality
Mortality
AllCancers
Lung & Bronchus Prostate Breast Colorectal Bladder
Head & Neck
Non-Hodgkin Melanoma Cervix
Florida 0.41 0.74 0.16 0.22 0.34 0.19 0.26 0.42 0.19 0.33
0-19 0.17 ^ ^ ^ ^ ^ ^ 0.18 ^ ^ 20-44 0.19 0.51 ^ 0.15 0.20 ^ 0.16 0.19 0.10 0.19 45-64 0.32 0.66 0.03 0.17 0.28 0.15 0.21 0.30 0.20 0.42 65-74 0.38 0.72 0.08 0.18 0.29 0.15 0.27 0.38 0.16 0.31 75+ 0.56 0.85 0.45 0.34 0.43 0.24 0.37 0.63 0.26 0.56Female
0-19 0.16 ^ ^ ^ ^ ^ ^ ^ ^ 20-44 0.16 0.49 0.15 0.18 ^ ^ 0.19 0.07 0.19 45-64 0.31 0.61 0.17 0.25 0.17 0.19 0.24 0.17 0.42 65-74 0.39 0.66 0.18 0.25 0.14 0.23 0.33 0.14 0.31 75+ 0.56 0.84 0.34 0.42 0.28 0.38 0.64 0.31 0.56Male 0-19 0.18 ^ ^ ^ ^ ^ ^ ^ 20-44 0.23 0.52 ^ 0.22 ^ 0.20 0.19 0.14 45-64 0.34 0.70 0.03 0.31 0.14 0.22 0.34 0.23 65-74 0.37 0.76 0.08 0.31 0.16 0.28 0.42 0.17 75+ 0.56 0.86 0.45 0.43 0.23 0.37 0.62 0.23Black
0-19 0.17 ^ ^ ^ ^ ^ ^ ^ ^ 20-44 0.25 0.50 ^ 0.22 0.31 ^ ^ 0.17 0.31 45-64 0.38 0.69 0.06 0.27 0.36 ^ 0.32 0.38 0.54 65-74 0.44 0.78 0.15 0.29 0.34 ^ 0.37 0.60 ^ 75+ 0.70 0.81 0.75 0.44 0.61 0.53 0.59 0.89 ^White 0-19 0.17 ^ ^ ^ ^ ^ ^ ^ ^ ^ 20-44 0.18 0.50 ^ 0.13 0.18 ^ 0.18 0.20 0.11 0.16 45-64 0.32 0.66 0.03 0.17 0.27 0.15 0.20 0.29 0.21 0.42 65-74 0.37 0.71 0.07 0.18 0.29 0.16 0.26 0.37 0.17 0.31 75+ 0.56 0.86 0.43 0.33 0.42 0.24 0.37 0.64 0.26 0.49Black Female
0-19 0.18 ^ ^ ^ ^ ^ ^ ^ 20-44 0.26 0.50 0.22 0.38 ^ ^ ^ 0.31 45-64 0.39 0.68 0.27 0.28 ^ ^ 0.47 0.54 65-74 0.49 0.84 0.29 0.29 ^ ^ 0.50 ^ 75+ 0.67 0.80 0.44 0.56 0.89 ^ 0.65 ^
White Female 0-19 0.15 ^ ^ ^ ^ ^ ^ ^ ^ 20-44 0.15 0.49 0.13 0.13 ^ ^ 0.22 0.08 0.16 45-64 0.30 0.61 0.17 0.25 0.17 0.19 0.22 0.17 0.42 65-74 0.39 0.66 0.18 0.25 0.14 0.23 0.32 0.15 0.31 75+ 0.56 0.84 0.33 0.42 0.27 0.37 0.65 0.31 0.49Black Male 0-19 0.16 ^ ^ ^ ^ ^ ^ 20-44 0.25 0.50 ^ ^ ^ ^ ^ 45-64 0.36 0.69 0.06 0.46 ^ 0.34 0.31 65-74 0.41 0.75 0.15 0.39 ^ 0.39 0.80 75+ 0.73 0.82 0.75 0.71 0.33 0.46 1.27White Male 0-19 0.19 ^ ^ ^ ^ ^ ^ ^ 20-44 0.23 0.51 ^ 0.23 ^ 0.23 0.20 0.14 45-64 0.34 0.70 0.03 0.29 0.14 0.21 0.34 0.23 65-74 0.37 0.76 0.07 0.31 0.16 0.28 0.42 0.17 75+ 0.55 0.87 0.43 0.43 0.23 0.36 0.62 0.23Source of data: Office of Vital Statistics and Florida Cancer Data System ^ Statistics are not displayed for cells with fewer than 10 deaths.
Table 28. Deaths-to-Cases Ratios by Sex, Race, and Age Group, Florida, 2003
86

Florida Annual Cancer Report: 2003 Incidence and Mortality
Mortality
County
• The deaths-to-cases ratio for all cancers combined ranged from 0.33 in Collier County to 1.06 in Hamilton County. Thirteen counties had deaths-to cases ratios over 0.50 in 2003.
• Deaths-to-cases ratios also varied greatly among counties for all major cancers. For cancer of the lung and bronchus, the ratios ranged from 0.47 in Hendry County to 1.71 in Hamilton County. For head and neck cancer, the ratios ranged from 0.19 in Escambia and Palm Beach Counties to 0.45 in Leon County.
Age
• All deaths-to-cases ratios increased with age. The highest ratios were in the 75 and older age group for all cancers combined and for the top cancer sites.
• Blacks had higher deaths-to-cases ratios than Whites for most major cancer sites and almost all age groups. Racial disparity was greater in younger age groups for breast and cervical cancers.
• Among the four sex-race groups, Black males had the highest deaths-to-cases ratios for colorectal cancer in all age groups.
YEARS OF POTENTIAL LIFE LOST
Years of potential life lost (YPLL) quantifi es the burden of premature death before age 75. Years of potential life lost was calculated by subtracting each individual’s age at death from 75, the approximate average life expectancy, and summing the years of life lost for each cause of death. The data used to calculate YPLL were derived from death certifi cate information provided by the Florida Department of Health, Offi ce of Vital Statistics.
• In 2003, all causes of death yielded about 1.28 million years of potential life lost in Florida. Cancer was responsible for 283,107 years lost, or 22 percent of the YPLL from all causes.
• The cancers that contributed most to YPLL in 2003 and have predominated since 1995 are cancer of the lung and bronchus, breast and colorectal cancers, and non-Hodgkin lymphoma. Deaths from these four types of cancer accounted for 49 percent of the YPLL from cancer in Florida.
• The total YPLL due to breast cancer was more than 6 times the YPLL due to prostate cancer. Two factors contributed to this difference. There were 23 percent more deaths from breast cancer than from prostate cancer and the deaths from breast cancer occurred at younger ages more often than deaths from prostate cancer. The average YPLL per death due to breast cancer was 10.1 years, while the average YPLL per death due to prostate cancer was 2.0 years.
• Deaths due to cervical, breast, and head and neck cancers, and melanoma occurred at younger ages than deaths due to other major cancers. The average YPLL per death due to these four cancers was nine years or more. Cervical cancer had the highest average YPLL, 19.3 years lost per death.
87

Florida Annual Cancer Report: 2003 Incidence and Mortality
Mortality
• The average YPLL per death from cancer decreased by 11 percent from 8.2 years in 1981 to 7.3 years in 2003.
Sex
• Among females, deaths due to cancer of the lung and bronchus, and breast and colorectal cancers were responsible for 51 percent of total cancer YPLL in 2003. Although cervical cancer deaths were only 1.5 percent of the total cancer deaths in females, YPLL due to cervical cancer contributed 4.1 percent to the total female cancer YPLL.
• Among males, the YPLL due to cancer of the lung and bronchus and colorectal cancer accounted for 38 percent of total cancer YPLL in 2003.
Race
• Cancer deaths occurred at younger ages among Blacks than among Whites. Deaths among Blacks who make up 16 percent of Florida’s population accounted for only 11 percent of all cancer deaths, yet were responsible for 15 percent of the total YPLL in Florida in 2003.
• Each cancer death among Blacks resulted in an average of 11.8 YPLL, which was signifi cantly higher than the 6.8 average YPLL among Whites. The average YPLL per death was greater among Blacks than among Whites for all major cancers, especially for non-Hodgkin lymphoma and colorectal cancer.
Sex and Race
• The highest average YPLL per cancer death was among Black females (12.1 years) for all cancers combined. In addition, Black females had the highest average YPLL per death for bladder, breast, and cervical cancer. Black males had the highest average YPLL for lung, colorectal, prostate, head and neck and non-Hodgkin lymphoma.
Childhood Cancer
• Although childhood cancers only contribute 2 percent of total YPLL due to cancer, each childhood cancer death contributed an average of 71.5 years of potential life lost.
• Childhood cancers had a greater impact on YPLL among Blacks than among Whites in 2003. Cancer YPLL in Black children contributed 2.2 percent to the total cancer YPLL among Blacks and 20 percent more than among White children (1.9 percent).
• Childhood cancers had a greater impact on YPLL among males than among females. Cancer YPLL in females under age 15 accounted for 2.1 percent of the total cancer YPLL of males, while males under age 15 accounted for 1.8 percent of the total cancer YPLL of females.
88
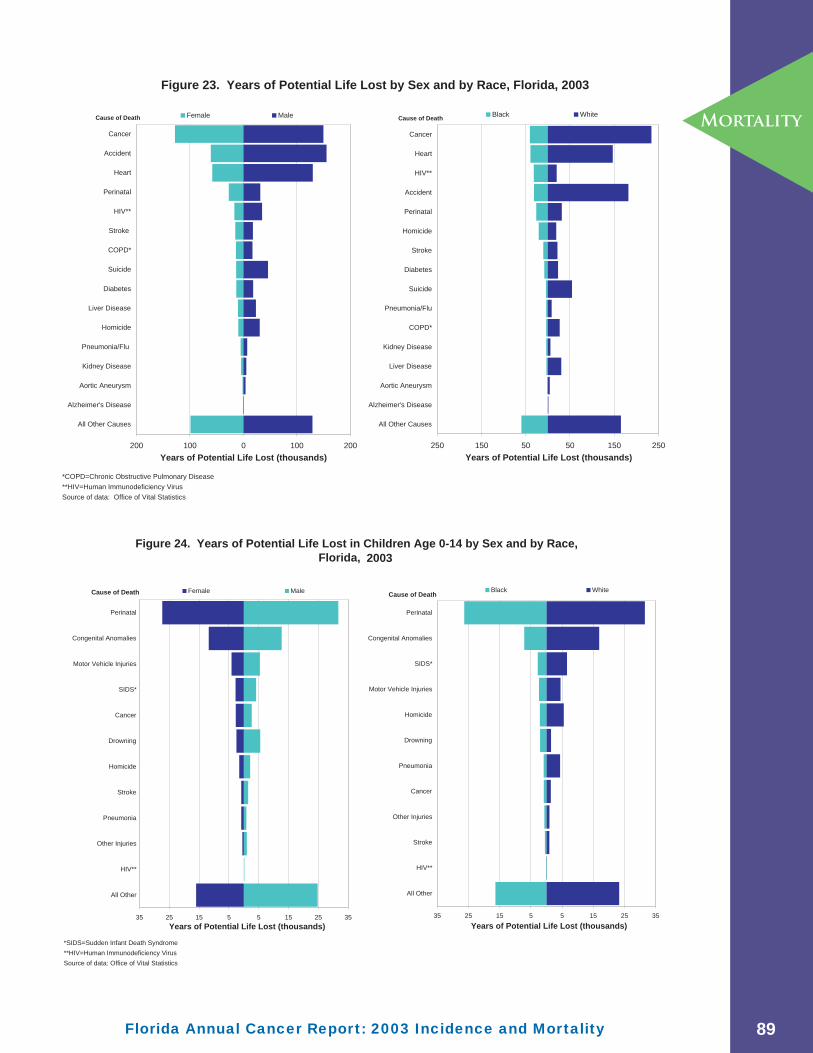
Florida Annual Cancer Report: 2003 Incidence and Mortality
Mortality
*COPD=Chronic Obstructive Pulmonary Disease
**HIV=Human Immunodeficiency Virus
Source of data: Office of Vital Statistics
Figure 23. Years of Potential Life Lost by Sex and by Race, Florida, 2003
2001000100200
All Other Causes
Alzheimer's Disease
Aortic Aneurysm
Kidney Disease
Pneumonia/Flu
Homicide
Liver Disease
Diabetes
Suicide
COPD*
Stroke
HIV**
Perinatal
Heart
Accident
Cancer
Cause of Death
Years of Potential Life Lost (thousands)
Female Male
2501505050150250
All Other Causes
Alzheimer's Disease
Aortic Aneurysm
Liver Disease
Kidney Disease
COPD*
Pneumonia/Flu
Suicide
Diabetes
Stroke
Homicide
Perinatal
Accident
HIV**
Heart
Cancer
Cause of Death
Years of Potential Life Lost (thousands)
Black White
*SIDS=Sudden Infant Death Syndrome
**HIV=Human Immunodeficiency Virus
Source of data: Office of Vital Statistics
Figure 24. Years of Potential Life Lost in Children Age 0-14 by Sex and by Race, Florida, 2003
35251555152535
All Other
HIV**
Stroke
Other Injuries
Cancer
Pneumonia
Drowning
Homicide
Motor Vehicle Injuries
SIDS*
Congenital Anomalies
Perinatal
Cause of Death
Years of Potential Life Lost (thousands)
Black White
35251555152535
All Other
HIV**
Other Injuries
Pneumonia
Stroke
Homicide
Drowning
Cancer
SIDS*
Motor Vehicle Injuries
Congenital Anomalies
Perinatal
Cause of Death
Years of Potential Life Lost (thousands)
Female Male
89

Florida Annual Cancer Report: 2003 Incidence and Mortality
Mortality
Years Percent Years Percent Years Percent Years Percent Years PercentAll Causes of Death 1,279,170 -- 477,363 -- 801,709 -- 288,762 -- 974,678 --
All Cancers (1) 283,107 100.0 129,676 100.0 153,459 100.0 42,459 100.0 238,224 100.0
Childhood Cancers (2) 5,431 1.9 2,713 2.1 2,718 1.8 929 2.2 4,436 1.9
Lung & Bronchus 77,345 27.3 31,222 24.1 46,102 30.0 8,716 20.5 68,041 28.6Prostate 4,094 1.4 4,094 2.7 1,053 2.5 3,031 1.3Breast 25,968 9.2 25,765 19.9 4,948 11.7 20,724 8.7Colorectal 21,238 7.5 8,501 6.6 12,737 8.3 3,911 9.2 17,028 7.1Bladder 3,844 1.4 951 0.7 2,893 1.9 212 0.5 3,597 1.5Head & Neck 9,249 3.3 1,927 1.5 7,322 4.8 1,362 3.2 7,872 3.3Non-Hodgkin 12,761 4.5 4,501 3.5 8,260 5.4 2,286 5.4 10,353 4.3Melanoma 6,586 2.3 2,300 1.8 4,286 2.8 6,427 2.7Cervix 5,286 1.9 5,286 4.1 1,190 2.8 4,032 1.7All Other Cancers 116,736 41.2 49,223 38.0 67,513 44.0 18,631 43.9 97,119 40.8Source of data: Office of Vital Statistics (1) Florida and All Cancer totals include years lost in persons of "Other" and unknown races, unknown age and sex, males with breast cancer, and Blacks with melanoma.(2) Years lost to childhood cancers are included in totals for specific cancer sites.
White
Table 29. Years of Potential Life Lost Due to All Causes and Selected Cancers
MaleFlorida (1) Female Black
by Sex and by Race, Florida 2003
Years Percent Years Percent Years Percent Years PercentAll Causes of Death 119,680 -- 344,214 -- 166,343 -- 602,100 --
All Cancers (1) 21,131 100.0 107,209 100.0 21,058 100.0 130,977 100.0
Childhood Cancers (2) 516 2.4 2,131 2.0 413 2.0 2,305 1.8
Lung & Bronchus 2,982 14.1 28,022 26.1 5,734 27.2 39,998 30.5Prostate 1,053 5.0 3,031 2.3Breast 4,925 23.3 20,544 19.2 Colorectal 1,782 8.4 6,589 6.1 2,129 10.1 10,439 8.0Bladder 121 0.6 830 0.8 91 0.4 2,767 2.1Head & Neck 214 1.0 1,713 1.6 1,148 5.5 6,159 4.7Non-Hodgkin 1,165 5.5 3,292 3.1 1,121 5.3 7,061 5.4Melanoma 2,207 2.1 4,220 3.2Cervix 1,190 5.6 4,032 3.8 All Other Cancers 8,668 41.0 39,980 37.3 9,693 46.0 57,139 43.6Source of data: Office of Vital Statistics (1) All Cancers total includes years lost in males with breast cancer and lacks with mela(2) Years lost to childhood cancers are included in totals for specific cancer sites.
Female Male
Table 30. Years of Potential Life Lost Due to All Causes and Selected Cancers by Sex and Race,
WhiteBlack White Black
Florida, 2003
nomaB
90

Florida Annual Cancer Report: 2003 Incidence and Mortality
Mortality
Source of data: Office of Vital Statistics
Figure 25. Average Years of Potential Life Lost per Death by Race, Florida, 2003
0
5
10
15
20
25
AllCau
ses
AllCan
cer
Prost
ate
Bladder
Colore
ctal
Lung&
Bronch
us
AllOth
erCan
cers
Head
&Nec
k
Mel
anom
a
Breas
t
Non-Hodgki
n
Cervi
x
Years Lost
Black
White
Source of data: Office of Vital Statistics
Figure 26. Average Years of Potential Life Lost by Race,Florida, 1981 - 2003
0
5
10
15
20
25
1981
1982
1983
1984
1985
1986
1987
1988
1989
1990
1991
1992
1993
1994
1995
1996
1997
1998
1999
2000
2001
2002
2003
Years Lost
Black - Cancer
Black - All Other Causes
White - Cancer
White - All Other Causes
91

Florida Annual Cancer Report: 2003 Incidence and Mortality
Tobacco
TOBACCO-RELATED CANCERS
Acute myeloid leukemia, cancers of the trachea, lung and bronchus, lip, oral cavity, pharynx, larynx, esophagus, pancreas, cervix, urinary bladder, kidney and renal pelvis, and stomach are known to be associated with tobacco use.
The risk of dying from these cancers depends on an individual’s smoking status, sex, age, environmental exposure, genetics, and the timing and quality of treatment. According to the Centers for Disease Control and Prevention (CDC), the relative risks of death for current smokers range from 1.13 times higher for acute myeloid leukemia among females, to 23 times higher for cancers of the trachea, lung, and bronchus among males than their counterparts who never smoked. The relative risks reduce signifi cantly among former smokers. Quitting smoking can signifi cantly reduce the risks for these cancers. See the CDC web site at apps.nccd.cdc.gov/sammec/ for more details.
INCIDENCE
In 2003, 34,458 tobacco-related cancers were diagnosed in Florida. The age-adjusted incidence rates for tobacco-related cancers was lower among Whites than Blacks in 1981. Racial disparities were apparent by 1999, with higher rates among Whites.
• Among males, age-adjusted incidence rates decreased by 19 percent in Blacks and decreased by 8 percent in Whites over the 23-year period.
• Among females, the age-adjusted incidence rate decreased by 7 percent among Blacks, but increased by 20 percent in Whites over the 23-year period.
MORTALITY
In 2003, 20,016 deaths occurred from tobacco-related cancers in Florida. Among these cancer deaths, 90.5 percent (18,120) occurred among people age 35 and older, which might be attributable to tobacco use. According to the prevalence of cigarette use in Florida in 2003 and the relative risk of dying from cancers due to cigarette smoking, approximately 64.3 percent (11,659) of 18,120 deaths were attributable to tobacco use. The number of smoking attributable deaths ranged from fi ve in Glades County to 1,009 in Broward County. The proportion of deaths attributable to tobacco use varied from 44 percent in Holmes County to 86 percent in Lafayette County.
• A total of 196,381 years of life potentially lost in 2003 were due to 11,659 smoking attributable deaths. On average, one smoking attributable death accounted for 16.8 years of life lost.
• Over the decade of the 1980s, Blacks had higher mortality rates from tobacco-related cancers than Whites. Mortality rates for tobacco-related cancers have decreased in both Black males and Black females since the 1990s. The previous disparity in mortality between Blacks and Whites is diminishing.
• The mortality rates for tobacco-related cancers decreased by 7 percent in Black females, and by 40 percent among Black males from 1981 through 2003. During the same period, mortality rates increased by 10 percent among White females and decreased by 17 percent among White males.
92

Florida Annual Cancer Report: 2003 Incidence and Mortality
Tobacco
• During the 23-year period, racial gaps in mortality narrowed and sometimes reversed. Black females had a mortality rate 24 percent higher than White females in 1981. By 2003, the rate for Black females was 5 percent lower than for White females.
• At its peak in 1981, the mortality rate for Black males was 67 percent higher than the rate for White males. By 2003, the racial gap had decreased to 7 percent.
Source of data: Florida Cancer Data System and Office of Vital Statistics
(1) Tobacco-related cancers are: lung and bronchus, pancreas, esophagus, stomach, bladder, kidney and renal pelivs, oral cavity, lip, larynx,______________________________________
Figure 27. Age-Adjusted Incidence and Mortality Rates for Tobacco-Related Cancers (1) by Sex and Race for Age > 34, Florida 1981-2003
pharynx, trachea, cervix, and acute myeloid leukemia.
Female
0
100
200
300
1981
1982
1983
1984
1985
1986
1987
1988
1989
1990
1991
1992
1993
1994
1995
1996
1997
1998
1999
2000
2001
2002
2003
Age-Adjusted Rate (per 100,000)
Incidence WhiteIncidence BlackMortality WhiteMortality Black
Male
0
200
400
600
1981
1982
1983
1984
1985
1986
1987
1988
1989
1990
1991
1992
1993
1994
1995
1996
1997
1998
1999
2000
2001
2002
2003
Age-Adjusted Rate (per 100,000)
Incidence WhiteIncidence BlackMortality WhiteMortality Black
93

Florida Annual Cancer Report: 2003 Incidence and Mortality
Tobacco
County
Deaths from Tobacco-
Related Cancers
Smoking-Attributable
Cancer Deaths
Smoking-Attributable
YPLLFlorida 18,120 11,659 196,381
918,1001261auhcalA
0723112rekaB
395,188541yaB
7811191drofdarB
297,6904436draverB
548,51900,1495,1draworB
6138152nuohlaC
045,2171662ettolrahC
238,2771562surtiC
069,1501061yalC
380,3491492reilloC
250,13508aibmuloC
366,51109485,1edaD
3530223otoseD
2738162eixiD
026,8364227lavuD
839,3802923aibmacsE
6785538relgalF
1624112nilknarF
3261315nedsdaG
6426102tsirhcliG
9958sedalG
0022102fluG
0911181notlimaH
2824112eedraH
4725122yrdneH
579,2091672odnanreH
719,1121871sdnalhgiH
265,01775678hguorobslliH
831761semloH
530,2631491reviRnaidnI
6849274noskcaJ
8224171nosreffeJ
4967etteyafaL
709,3342573ekaL
957,6904126eeL
697,179661noeL
3669355yveL
1857ytrebiL
4425112nosidaM
249,3632373eetanaM
988,4603174noiraM
232,2941222nitraM
650,15558eornoM
3774486uassaN
258,1801661asoolakO
1756355eebohceekO
739,7234886egnarO
041,2511271aloecsO
802,31278473,1hcaeBmlaP
818,6014316ocsaP
225,41768192,1salleniP
172,7714716kloP
834,177711mantuP
504,108621asoRatnaS
883,5043925atosaraS
291,3281972elonimeS
144,187721snhoJ.tS
145,3312613eicuL.tS
110,12659retmuS
7373495eennawuS
9522102rolyaT
6163223noinU
406,6704246aisuloV
6830252allukaW
5652394notlaW2144213notgnihsaW
(1) In people age 35 and older.
Source of Data: Florida Behavioral Risk Factor Surveillance System and the Office of Vital Statistics
Table 31. Smoking-Attributable Cancer Deaths and Years of Potential Life Lost(1), Florida, 2003
94
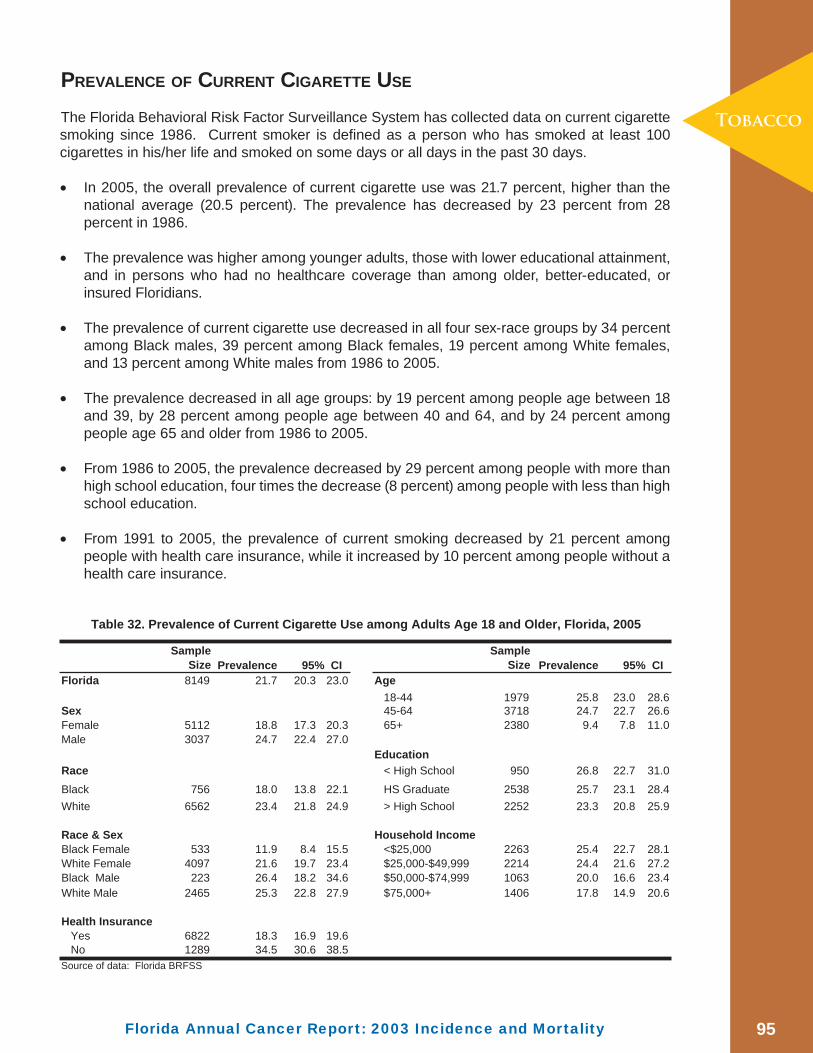
Florida Annual Cancer Report: 2003 Incidence and Mortality
Tobacco
PREVALENCE OF CURRENT CIGARETTE USE
The Florida Behavioral Risk Factor Surveillance System has collected data on current cigarette smoking since 1986. Current smoker is defi ned as a person who has smoked at least 100 cigarettes in his/her life and smoked on some days or all days in the past 30 days.
• In 2005, the overall prevalence of current cigarette use was 21.7 percent, higher than the national average (20.5 percent). The prevalence has decreased by 23 percent from 28 percent in 1986.
• The prevalence was higher among younger adults, those with lower educational attainment, and in persons who had no healthcare coverage than among older, better-educated, or insured Floridians.
• The prevalence of current cigarette use decreased in all four sex-race groups by 34 percent among Black males, 39 percent among Black females, 19 percent among White females, and 13 percent among White males from 1986 to 2005.
• The prevalence decreased in all age groups: by 19 percent among people age between 18 and 39, by 28 percent among people age between 40 and 64, and by 24 percent among people age 65 and older from 1986 to 2005.
• From 1986 to 2005, the prevalence decreased by 29 percent among people with more than high school education, four times the decrease (8 percent) among people with less than high school education.
• From 1991 to 2005, the prevalence of current smoking decreased by 21 percent among people with health care insurance, while it increased by 10 percent among people without a health care insurance.
SampleSize Prevalence
SampleSize Prevalence
Florida 8149 21.7 20.3 23.0 Age18-44 1979 25.8 23.0 28.6
Sex 45-64 3718 24.7 22.7 26.6Female 5112 18.8 17.3 20.3 65+ 2380 9.4 7.8 11.0Male 3037 24.7 22.4 27.0
EducationRace < High School 950 26.8 22.7 31.0Black 756 18.0 13.8 22.1 HS Graduate 2538 25.7 23.1 28.4White 6562 23.4 21.8 24.9 > High School 2252 23.3 20.8 25.9
Race & Sex Household IncomeBlack Female 533 11.9 8.4 15.5 <$25,000 2263 25.4 22.7 28.1White Female 4097 21.6 19.7 23.4 $25,000-$49,999 2214 24.4 21.6 27.2Black Male 223 26.4 18.2 34.6 $50,000-$74,999 1063 20.0 16.6 23.4White Male 2465 25.3 22.8 27.9 $75,000+ 1406 17.8 14.9 20.6
Health InsuranceYes 6822 18.3 16.9 19.6No 1289 34.5 30.6 38.5
Source of data: Florida BRFSS
95% CI 95% CI
Table 32. Prevalence of Current Cigarette Use among Adults Age 18 and Older, Florida, 2005
95

Florida Annual Cancer Report: 2003 Incidence and Mortality
Figure 30: Prevalence of Current Cigarette Use among Adults by Health Coverage
Florida, 1991-2005
0
10
20
30
40
50
1991 1993 1995 1997 1999 2001 2003 2005
Perc
ent
With Health Coverage No Health Coverage
Figure 29: Prevalence of Current Cigarette Use among Adults by Age Group, Florida, 1986-2005
0
10
20
30
40
1986 1988 1990 1992 1994 1996 1998 2000 2002 2004
Perc
ent
18-39 40-64 >=65
Figure 28: Prevalence of Current Cigarette Use among Adults by Sex and Race, Florida, 1986-2005
0
10
20
30
40
1986 1988 1990 1992 1994 1996 1998 2000 2002 2004
Perc
ent
White Men White WomenBlack Men Black Women
96
Tobacco

Florida Annual Cancer Report: 2003 Incidence and Mortality
HOSPITALIZATIONS FOR CANCER
HOSPITALIZATIONS
• A total of 86,006 hospitalizations with cancer coded as the principal diagnosis were reported in 2003. The top nine cancers accounted for 48 percent of all cancer hospitalizations.
• Cancer of the lung and bronchus and colorectal cancer accounted for nearly a quarter of all cancer hospitalizations in Florida; 10,659 hospitalizations (13 percent) for cancer of the lung and bronchus and 9,945 (12 percent) for colorectal cancer.
• Among hospitalizations for cancers, females had more hospitalizations for all cancers combined. However, males had more hospitalizations for each of the major cancer sites discussed in this report.
• Whites had a larger percentage of hospitalizations than Blacks for cancer of the lung and bronchus (13 percent versus 11 percent) and colorectal cancer (12 percent versus 11 percent).
• Among males, Whites had a larger percentage of hospitalizations than did Blacks for bladder cancer (6 percent versus 2 percent), but fewer for prostate cancer (12 percent versus 16 percent) and lung and bronchus cancer (12 percent versus 16 percent).
• Among females, Whites had a larger percentage of hospitalizations than Blacks for cancer of the lung and bronchus (12 percent versus 8 percent), but fewer for cervical cancer (2 percent versus 4 percent).
• Brevard, Broward, Miami-Dade, Duval, Hillsborough, Lee, Orange, Palm Beach, Pinellas, Polk, and Volusia counties each had more than 2,500 cancer hospitalizations in 2003. The total cancer hospitalizations in these most populous counties in the state accounted for 58 percent of total cancer hospitalizations.
All CancersLung &
Bronchus Prostate Breast Colorectal BladderHead & Neck
Non-Hodgkin Melanoma Cervix
Florida 86,006 10,659 5,189 4,807 9,945 2,845 1,937 3,042 263 943
Female 43,725 4,872 4,807 4,909 673 544 1,388 110 943Male 42,281 5,787 5,189 5,036 2,172 1,393 1,654 153
Black 8,967 976 639 582 939 143 219 284 188White 74,295 9,443 4,391 4,075 8,728 2,648 1,628 2,648 263 755
Black female 4,833 365 582 492 47 50 144 188White female 37,433 4,410 4,075 4,278 611 473 1,193 110 755Black male 4,134 611 639 447 96 169 140White male 36,862 5,033 4,391 4,450 2,037 1,155 1,455 153Source of data: Agency for Health Care Administration
Table 33. Number of Hospitalizations for Cancer by Sex and Race, Florida, 2003
Cancer
Burden
97

Florida Annual Cancer Report: 2003 Incidence and Mortality
Cancer
Burden
All Cancers
Lung & Bronchus Prostate Breast Colorectal Bladder
Head & Neck
Non-Hodgkin Melanoma Cervix
Florida 86,006 10,659 5,189 4,807 9,945 2,845 1,937 3,042 263 943Alachua 880 108 69 74 81 24 22 32 ^ ^Baker 79 14 ^ ^ ^ ^ ^ ^ ^ ^Bay 674 95 70 39 76 19 13 18 ^ ^Bradford 99 16 * * 13 ^ ^ ^ ^ ^Brevard 2,910 362 146 156 334 116 61 107 ^ 30Broward 8,702 1,136 383 470 955 329 185 384 20 84Calhoun 52 14 ^ ^ ^ ^ ^ ^ ^ ^Charlotte 1,078 129 88 66 126 40 20 30 ^ ^Citrus 818 129 74 36 120 22 22 26 ^ ^Clay 588 95 25 27 86 ^ 12 12 ^ ^Collier 1,325 132 96 45 142 44 32 52 ^ 18Columbia 306 41 15 20 34 ^ ^ ^ ^ ^Miami-Dade 11,535 1,161 624 753 1,341 349 263 425 33 218DeSoto 184 28 14 ^ 27 ^ ^ ^ ^ ^Dixie 66 ^ ^ ^ ^ ^ ^ ^ ^ ^Duval 3,066 439 172 99 349 73 83 89 * 47Escambia 1,261 177 77 56 124 35 31 48 * *Flagler 483 64 41 49 58 14 ^ 14 ^ *Franklin 55 11 ^ ^ ^ ^ ^ ^ ^ ^Gadsden 197 18 20 17 16 ^ 14 ^ ^ ^Gilchrist 60 12 ^ ^ 11 ^ * ^ ^ ^Glades 25 ^ ^ ^ ^ ^ ^ ^ ^ ^Gulf 72 12 ^ ^ 12 ^ ^ ^ ^ ^Hamilton 47 ^ ^ ^ * ^ ^ ^ ^ ^Hardee 115 ^ 12 ^ ^ ^ ^ ^ ^ ^Hendry 136 29 ^ ^ 16 ^ ^ ^ ^ ^Hernando 920 147 54 40 108 41 18 21 ^ 16Highlands 613 75 51 51 72 31 13 14 ^ 11Hillsborough 4,490 484 209 219 490 129 101 147 11 75Holmes 40 ^ ^ ^ ^ ^ ^ ^ ^ ^Indian River 653 75 46 24 114 17 17 24 ^ ^Jackson 115 16 ^ ^ 22 ^ ^ ^ ^ ^Jefferson 65 ^ ^ ^ ^ ^ ^ ^ ^ ^Lafayette 24 ^ ^ ^ ^ ^ ^ ^ ^ ^Lake 1,859 210 182 113 222 45 59 66 ^ 13Lee 2,573 306 246 111 303 72 57 110 ^ 21Leon 857 79 72 54 89 14 25 33 ^ ^Levy 195 25 13 ^ 25 ^ ^ ^ ^ ^Liberty 35 ^ ^ ^ ^ ^ ^ ^ ^ ^Madison 75 11 ^ ^ ^ ^ ^ ^ ^ ^Manatee 1,757 227 104 129 232 64 39 54 ^ ^Marion 1,749 250 157 145 221 44 26 46 ^ 13Martin 941 124 53 18 114 25 29 38 ^ ^Monroe 412 64 20 25 52 11 14 ^ ^ ^Nassau 258 46 16 ^ 33 ^ ^ 13 ^ ^Okaloosa 637 86 38 37 91 23 14 16 ^ ^Okeechobee 232 29 12 ^ 16 13 ^ ^ ^ ^Orange 4,018 477 272 262 415 82 98 143 26 81Osceola 850 118 54 48 76 19 19 23 ^ ^Palm Beach 7,295 866 316 421 775 342 147 303 23 48Pasco 2,243 292 118 115 274 105 39 60 ^ 33Pinellas 5,204 682 300 309 685 190 118 168 13 59Polk 2,745 356 147 115 312 125 59 105 15 32Putnam 404 73 24 30 45 ^ ^ 14 ^ ^Saint Johns 760 92 38 55 83 22 21 18 ^ ^Saint Lucie 1,133 151 64 34 134 56 27 55 ^ 14Santa Rosa 525 69 34 30 62 18 23 13 ^ ^Sarasota 2,268 286 184 129 277 75 34 71 12 ^Seminole 1,578 188 131 93 138 60 26 71 ^ 25Sumter 228 36 19 16 28 ^ ^ ^ ^ ^Suwannee 193 27 ^ 18 23 ^ ^ 12 ^ ^Taylor 89 ^ 12 ^ 11 ^ ^ ^ ^ ^Union 142 23 ^ ^ 12 11 13 ^ ^ ^Volusia 2,657 354 169 129 352 40 65 81 ^ 15Wakulla 107 ^ ^ 11 11 ^ ^ ^ ^ ^Walton 181 22 14 15 25 ^ ^ ^ ^ ^Washington 73 14 ^ ^ ^ ^ ^ ^ ^ ^
Source of data: Agency for Health Care Administration
^ cells with less than 10 hospitalizations are not displayed
Table 34. Number of Hospitalizations for Cancer by County, Florida, 2003
98
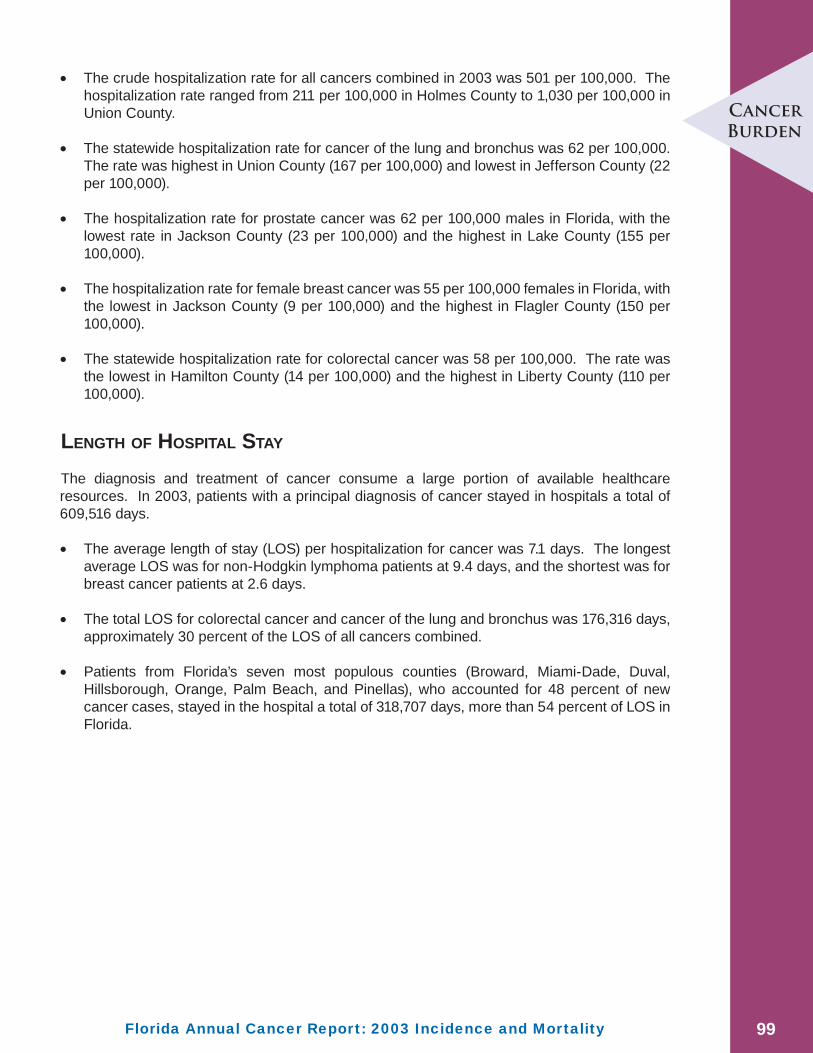
Florida Annual Cancer Report: 2003 Incidence and Mortality
• The crude hospitalization rate for all cancers combined in 2003 was 501 per 100,000. The hospitalization rate ranged from 211 per 100,000 in Holmes County to 1,030 per 100,000 in Union County.
• The statewide hospitalization rate for cancer of the lung and bronchus was 62 per 100,000. The rate was highest in Union County (167 per 100,000) and lowest in Jefferson County (22 per 100,000).
• The hospitalization rate for prostate cancer was 62 per 100,000 males in Florida, with the lowest rate in Jackson County (23 per 100,000) and the highest in Lake County (155 per 100,000).
• The hospitalization rate for female breast cancer was 55 per 100,000 females in Florida, with the lowest in Jackson County (9 per 100,000) and the highest in Flagler County (150 per 100,000).
• The statewide hospitalization rate for colorectal cancer was 58 per 100,000. The rate was the lowest in Hamilton County (14 per 100,000) and the highest in Liberty County (110 per 100,000).
LENGTH OF HOSPITAL STAY
The diagnosis and treatment of cancer consume a large portion of available healthcare resources. In 2003, patients with a principal diagnosis of cancer stayed in hospitals a total of 609,516 days.
• The average length of stay (LOS) per hospitalization for cancer was 7.1 days. The longest average LOS was for non-Hodgkin lymphoma patients at 9.4 days, and the shortest was for breast cancer patients at 2.6 days.
• The total LOS for colorectal cancer and cancer of the lung and bronchus was 176,316 days, approximately 30 percent of the LOS of all cancers combined.
• Patients from Florida’s seven most populous counties (Broward, Miami-Dade, Duval, Hillsborough, Orange, Palm Beach, and Pinellas), who accounted for 48 percent of new cancer cases, stayed in the hospital a total of 318,707 days, more than 54 percent of LOS in Florida.
Cancer
Burden
99

Florida Annual Cancer Report: 2003 Incidence and Mortality
Cancer
Burden
All Cancers
Lung & Bronchus Prostate Breast Colorectal Bladder
Head & Neck
Non-Hodgkin Melanoma Cervix
Florida 501 62 62 55 58 17 11 18 2 11Alachua 379 47 61 62 35 10 9 14 ^ ^Baker 337 60 ^ ^ ^ ^ ^ ^ ^ ^Bay 434 61 91 50 49 12 8 12 ^ ^Bradford 366 59 46 ^ 48 ^ ^ ^ ^ ^Brevard 570 71 58 60 65 23 12 21 ^ 12Broward 510 67 46 53 56 19 11 23 2 10Calhoun 385 104 ^ ^ ^ ^ ^ ^ ^ ^Charlotte 705 84 120 83 82 26 13 20 ^ ^Citrus 647 102 122 55 95 17 17 21 ^ ^Clay 374 60 32 34 55 ^ 8 8 ^ ^Collier 448 45 65 30 48 15 11 18 ^ 12Columbia 517 69 49 69 57 ^ ^ ^ ^ ^Miami-Dade 490 49 55 62 57 15 11 18 2 18DeSoto 543 83 74 ^ 80 ^ ^ ^ ^ ^Dixie 447 ^ ^ ^ ^ ^ ^ ^ ^ ^Duval 369 53 43 23 42 9 10 11 ^ 11Escambia 415 58 51 37 41 12 10 16 ^ ^Flagler 773 102 137 150 93 22 ^ 22 ^ ^Franklin 522 104 ^ ^ ^ ^ ^ ^ ^ ^Gadsden 423 39 90 70 34 ^ ^ ^ ^ ^Gilchrist 384 77 ^ ^ 70 ^ ^ ^ ^ ^Glades 232 ^ ^ ^ ^ ^ ^ ^ ^ ^Gulf 459 76 ^ ^ 76 ^ ^ ^ ^ ^Hamilton 335 ^ ^ ^ ^ ^ ^ ^ ^ ^Hardee 419 ^ 81 ^ ^ ^ ^ ^ ^ ^Hendry 370 79 ^ ^ 44 ^ ^ ^ ^ ^Hernando 650 104 80 54 76 29 13 15 ^ 22Highlands 675 83 116 109 79 34 14 15 ^ 24Hillsborough 414 45 39 40 45 12 9 14 1 14Holmes 211 ^ ^ ^ ^ ^ ^ ^ ^ ^Indian River 536 62 78 38 94 14 14 20 ^ ^Jackson 234 33 ^ ^ 45 ^ ^ ^ ^ ^Jefferson 477 ^ ^ ^ ^ ^ ^ ^ ^ ^Lafayette 325 ^ ^ . ^ ^ ^ ^ ^ ^Lake 765 86 155 90 91 19 24 27 ^ 10Lee 515 61 101 43 61 14 11 22 ^ 8Leon 334 31 59 40 35 5 10 13 ^ ^Levy 529 68 73 ^ 68 ^ ^ ^ ^ ^Liberty 483 ^ ^ ^ ^ ^ ^ ^ ^ ^Madison 391 57 ^ ^ ^ ^ ^ ^ ^ ^Manatee 608 79 75 86 80 22 14 19 ^ ^Marion 615 88 115 98 78 15 9 16 ^ 9Martin 696 92 80 26 84 18 21 28 ^ ^Monroe 512 80 47 66 65 14 17 ^ ^ ^Nassau 406 72 51 ^ 52 ^ ^ 20 ^ ^Okaloosa 350 47 41 41 50 13 8 9 ^ ^Okeechobee 621 78 60 ^ 43 35 ^ ^ ^ ^Orange 406 48 56 52 42 8 10 14 3 16Osceola 398 55 51 44 36 9 9 11 ^ ^Palm Beach 599 71 54 67 64 28 12 25 2 8Pasco 593 77 65 58 72 28 10 16 ^ 17Pinellas 553 72 67 63 73 20 13 18 2 12Polk 534 69 58 44 61 24 11 20 3 12Putnam 560 101 68 82 62 ^ ^ 19 ^ ^Saint Johns 538 65 55 76 59 16 15 13 ^ ^Saint Lucie 530 71 61 31 63 26 13 26 ^ 13Santa Rosa 404 53 52 46 48 14 18 10 ^ ^Sarasota 647 82 111 70 79 21 10 20 4 ^Seminole 398 47 67 46 35 15 7 18 ^ 12Sumter 359 57 57 53 44 ^ ^ ^ ^ 3Suwannee 515 72 ^ 94 61 ^ ^ 32 ^ ^Taylor 428 ^ 111 ^ 53 ^ ^ ^ ^ ^Union 1,030 167 ^ ^ 87 80 94 ^ ^ ^Volusia 562 75 74 53 74 8 14 17 ^ 6Wakulla 426 ^ ^ 91 44 ^ ^ 12 ^ ^Walton 381 46 58 64 53 ^ ^ 8 ^ ^Washington 332 64 ^ ^ ^ ^ ^ ^ ^ ^Source of data: Agency for Health Care Administration (1) Rates are per 100,000 population.
^ cells with less than 10 hospitalizations are not displayed
Table 35. Hospitalization Rates (1) for Cancer by County, Florida, 2003
100
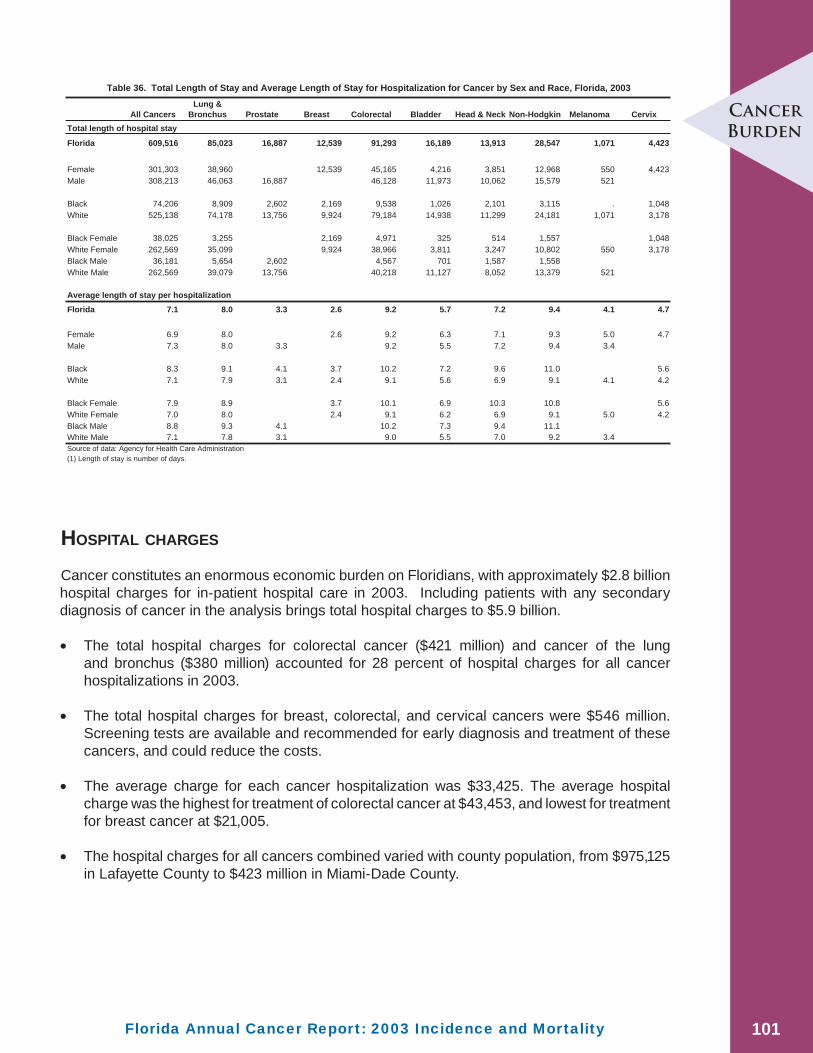
Florida Annual Cancer Report: 2003 Incidence and Mortality
Cancer
Burden
All CancersLung &
Bronchus Prostate Breast Colorectal Bladder Head & Neck Non-Hodgkin Melanoma CervixTotal length of hospital stay
Florida 609,516 85,023 16,887 12,539 91,293 16,189 13,913 28,547 1,071 4,423
Female 301,303 38,960 12,539 45,165 4,216 3,851 12,968 550 4,423Male 308,213 46,063 16,887 46,128 11,973 10,062 15,579 521
Black 74,206 8,909 2,602 2,169 9,538 1,026 2,101 3,115 . 1,048White 525,138 74,178 13,756 9,924 79,184 14,938 11,299 24,181 1,071 3,178
Black Female 38,025 3,255 2,169 4,971 325 514 1,557 1,048White Female 262,569 35,099 9,924 38,966 3,811 3,247 10,802 550 3,178Black Male 36,181 5,654 2,602 4,567 701 1,587 1,558White Male 262,569 39,079 13,756 40,218 11,127 8,052 13,379 521
Average length of stay per hospitalization
Florida 7.1 8.0 3.3 2.6 9.2 5.7 7.2 9.4 4.1 4.7
Female 6.9 8.0 2.6 9.2 6.3 7.1 9.3 5.0 4.7Male 7.3 8.0 3.3 9.2 5.5 7.2 9.4 3.4
Black 8.3 9.1 4.1 3.7 10.2 7.2 9.6 11.0 5.6White 7.1 7.9 3.1 2.4 9.1 5.6 6.9 9.1 4.1 4.2
Black Female 7.9 8.9 3.7 10.1 6.9 10.3 10.8 5.6White Female 7.0 8.0 2.4 9.1 6.2 6.9 9.1 5.0 4.2Black Male 8.8 9.3 4.1 10.2 7.3 9.4 11.1White Male 7.1 7.8 3.1 9.0 5.5 7.0 9.2 3.4Source of data: Agency for Health Care Administration (1) Length of stay is number of days.
Table 36. Total Length of Stay and Average Length of Stay for Hospitalization for Cancer by Sex and Race, Florida, 2003
HOSPITAL CHARGES
Cancer constitutes an enormous economic burden on Floridians, with approximately $2.8 billion hospital charges for in-patient hospital care in 2003. Including patients with any secondary diagnosis of cancer in the analysis brings total hospital charges to $5.9 billion.
• The total hospital charges for colorectal cancer ($421 million) and cancer of the lung and bronchus ($380 million) accounted for 28 percent of hospital charges for all cancer hospitalizations in 2003.
• The total hospital charges for breast, colorectal, and cervical cancers were $546 million. Screening tests are available and recommended for early diagnosis and treatment of these cancers, and could reduce the costs.
• The average charge for each cancer hospitalization was $33,425. The average hospital charge was the highest for treatment of colorectal cancer at $43,453, and lowest for treatment for breast cancer at $21,005.
• The hospital charges for all cancers combined varied with county population, from $975,125 in Lafayette County to $423 million in Miami-Dade County.
101

Florida Annual Cancer Report: 2003 Incidence and Mortality
Cancer
Burden
All Cancers
Lung & Bronchus Prostate Breast Colorectal Bladder
Head & Neck
Non-Hodgkin Melanoma Cervix
Florida 609,516 85,023 16,887 12,539 91,293 16,189 13,913 28,547 1,071 4,423
Alachua 6,291 723 198 188 826 151 170 451 ^ 13Baker 503 79 25 ^ 101 ^ 17 21 ^ ^Bay 3,833 709 166 60 562 123 67 97 ^ 20Bradford 759 150 27 18 115 18 ^ 34 ^ ^Brevard 20,387 2,753 506 390 2,999 651 401 963 13 99Broward 62,955 9,405 1,406 1,537 9,121 1,732 1,461 3,508 103 436Calhoun 290 86 29 15 53 ^ ^ 12 ^ ^Charlotte 7,011 1,098 225 156 1,409 161 124 269 ^ 14Citrus 5,284 795 239 63 1,076 133 175 250 14 20Clay 4,169 716 85 72 813 48 68 63 ^ 14Collier 8,299 960 264 84 1,283 237 192 298 ^ 65Columbia 2,435 337 42 45 363 54 40 56 ^ 17Miami-Dade 89,363 10,188 2,212 2,343 12,618 2,135 2,503 4,426 131 1,101DeSoto 1,183 205 29 17 203 21 24 ^ ^ ^Dixie 514 35 11 19 42 40 ^ ^ ^ ^Duval 23,887 3,730 734 253 3,506 591 630 871 17 179Escambia 9,598 1,509 280 145 1,381 317 179 507 ^ 59Flagler 2,618 389 148 74 403 94 40 126 ^ 22Franklin 313 79 ^ ^ 35 ^ ^ 17 ^ 43Gadsden 1,235 161 55 56 160 42 86 16 ^ 35Gilchrist 413 65 ^ ^ 107 16 ^ ^ ^ ^Glades 178 23 ^ ^ 44 ^ ^ ^ ^ ^Gulf 463 84 14 ^ 109 ^ ^ ^ ^ ^Hamilton 331 67 ^ ^ 35 10 ^ ^ ^ 16Hardee 703 40 49 11 58 34 ^ 42 ^ 11Hendry 849 151 15 ^ 127 22 ^ 21 ^ ^Hernando 5,808 1,036 152 179 976 192 142 135 ^ 42Highlands 4,099 638 177 110 593 216 81 99 ^ 32Hillsborough 35,238 4,530 765 696 4,656 907 833 1,565 62 295Holmes 251 39 ^ 27 42 ^ ^ 29 ^ .Indian River 4,357 530 143 39 1,026 91 81 266 ^ 11Jackson 887 127 28 ^ 169 ^ ^ 40 ^ ^Jefferson 390 23 13 24 43 13 ^ 40 ^ ^Lafayette 208 ^ ^ ^ 67 13 ^ . ^ .Lake 12,738 1,659 551 255 1,881 272 468 659 13 42Lee 15,804 2,317 664 235 2,400 423 346 913 37 91Leon 5,561 465 213 140 812 108 236 284 21 11Levy 1,533 185 48 13 235 49 35 24 ^ ^Liberty 226 ^ 12 ^ 67 ^ ^ 38 ^ ^Madison 433 91 12 ^ 42 34 11 41 10 ^Manatee 11,197 1,639 295 249 2,040 332 293 419 ^ 28Marion 11,740 1,901 454 238 2,001 355 179 450 13 49Martin 6,219 945 246 44 843 114 181 335 16 29Monroe 2,999 597 94 52 457 42 78 49 ^ 15Nassau 1,744 400 52 21 277 29 30 106 ^ ^Okaloosa 4,320 688 101 104 857 137 49 135 12 50Okeechobee 1,563 207 27 23 149 27 14 80 ^ 7Orange 30,636 4,150 859 713 4,201 612 690 1,367 162 444Osceola 6,467 1,138 149 138 787 124 143 247 ^ 23Palm Beach 49,698 6,255 1,073 1,163 6,954 1,522 927 2,661 72 264Pasco 14,802 2,070 376 285 2,374 520 199 597 21 115Pinellas 36,093 5,268 978 692 6,438 1,173 712 1,547 40 263Polk 20,359 2,718 475 230 2,839 507 293 1,345 45 122Putnam 2,715 547 86 50 374 62 48 123 ^ 2Saint Johns 5,071 734 96 114 858 98 153 144 10 10Saint Lucie 7,728 1,181 248 88 1,243 289 217 271 15 41Santa Rosa 3,937 657 129 61 484 98 121 119 ^ 9Sarasota 13,586 1,858 435 260 2,228 315 181 535 50 47Seminole 11,451 1,673 371 234 1,281 434 264 756 56 98Sumter 1,523 226 78 34 236 14 30 ^ ^ 3Suwannee 1,207 224 15 34 166 33 ^ 71 ^ ^Taylor 527 66 38 17 95 ^ 15 . . ^Union 1,150 225 48 ^ 100 18 66 94 41 ^Volusia 19,027 3,115 533 303 3,044 344 471 848 19 59Wakulla 675 60 16 39 74 ^ 10 23 ^ ^Walton 1,207 235 38 39 236 11 ^ 21 ^ ^Washington 478 65 12 ^ 99 ^ 88 ^ ^ 21(1) Length of stay is number of days. Source of data: Agency for Health Care Administration ^ Cells containing data of less than 10 days are not displayed.
Table 37. Total Length of Stay for Hospitalization for Cancer by County, Florida, 2003
102

Florida Annual Cancer Report: 2003 Incidence and Mortality
Cancer
Burden
AllCancers
Lung & Bronchus Prostate Breast Colorectal Bladder
Head & Neck
Non-Hodgkin Melanoma Cervix
Florida 2,819.0 379.9 126.1 97.4 421.2 83.3 70.3 120.3 7.0 23.3
Male 1,432.9 207.7 17.3 214.3 62.4 51.0 65.7 4.3Female 1,386.1 172.2 97.4 206.9 20.9 19.3 54.6 2.7 23.3
White 2,417.3 335.9 108.8 83.9 367.3 77.2 58.3 103.4 7.0 17.6Black 309.7 35.0 17.3 13.6 41.6 4.8 8.9 12.2 4.8
White male 1,237.4 179.1 108.8 188.0 58.1 41.8 57.5 4.3White female 1,179.9 156.8 83.8 179.3 19.1 16.5 46.0 2.7 17.6Black male 149.8 22.5 17.3 19.9 3.5 6.8 6.2Black female 159.9 12.5 13.6 21.7 1.3 2.1 6.0 4.8Source of data: Agency for Health Care Administration (1) Charges are shown in millions of dollars.
Table 38. Total Charges (1) for Hospitalization for Cancer by Sex and Race, Florida, 2003
All CancersLung &
Bronchus Prostate Breast Colorectal BladderHead & Neck
Non-Hodgkin Melanoma Cervix
Florida 33,425 36,270 25,120 21,005 43,453 29,660 36,960 41,267 26,536 23,742
Male 34,668 36,560 25,120 43,788 29,097 37,248 41,768 28,290Female 32,230 35,626 21,005 43,112 31,485 36,222 40,680 24,412 23,742
White 33,139 36,166 24,783 20,588 43,129 29,528 36,396 40,584 26,536 23,361Black 35,532 36,851 27,050 23,550 45,912 34,137 42,177 45,793 26,210
White male 34,298 36,211 24,783 43,445 28,875 36,768 41,289 28,290White female 32,006 36,115 20,588 42,803 31,711 35,484 39,735 24,412 23,361Black male 37,364 37,829 27,050 46,266 37,150 41,659 47,600Black female 33,970 35,209 23,550 45,591 27,915 43,949 44,079 26,210Source of data: Agency for Health Care Administration (1) Charges are expressed in dollars.
Table 39. Average Charge(1) per Cancer Hospitalization by Sex and Race, Florida, 2003
103
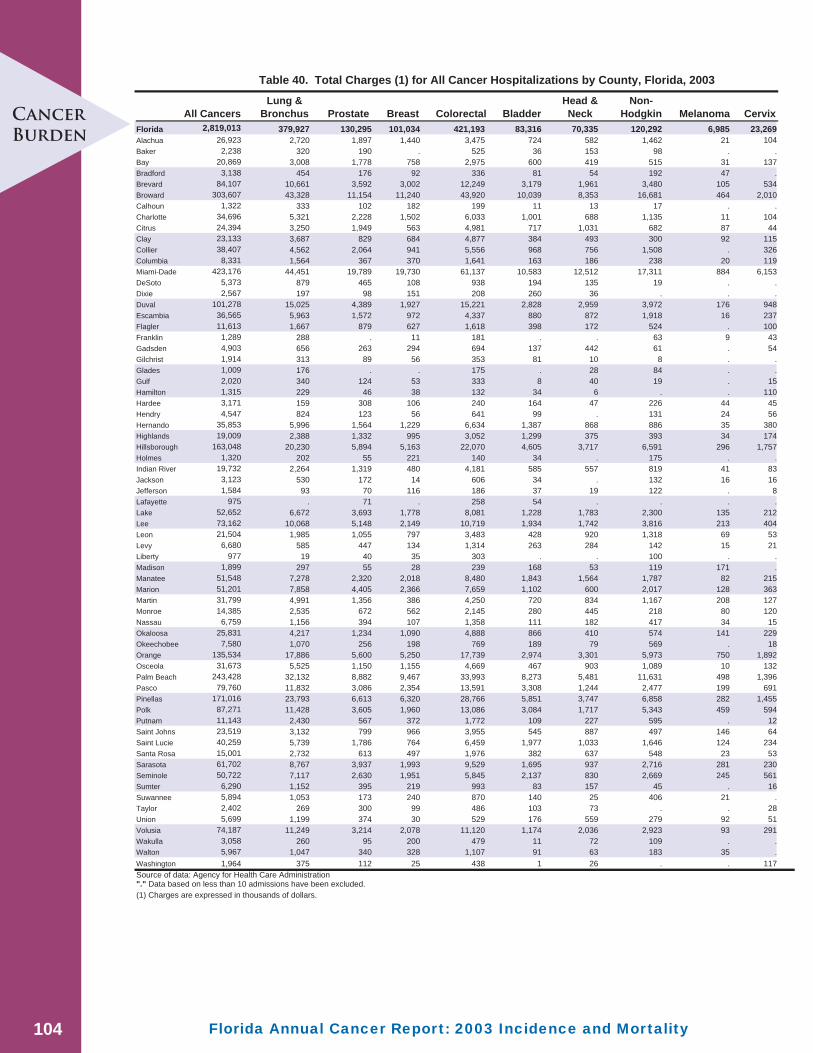
Florida Annual Cancer Report: 2003 Incidence and Mortality
Cancer
Burden
104
All Cancers Lung &
Bronchus Prostate Breast Colorectal BladderHead & Neck
Non-Hodgkin Melanoma Cervix
Florida 2,819,013 379,927 130,295 101,034 421,193 83,316 70,335 120,292 6,985 23,269Alachua 26,923 2,720 1,897 1,440 3,475 724 582 1,462 21 104Baker 2,238 320 190 . 525 36 153 98 . .Bay 20,869 3,008 1,778 758 2,975 600 419 515 31 137Bradford 3,138 454 176 92 336 81 54 192 47 .Brevard 84,107 10,661 3,592 3,002 12,249 3,179 1,961 3,480 105 534Broward 303,607 43,328 11,154 11,240 43,920 10,039 8,353 16,681 464 2,010Calhoun 1,322 333 102 182 199 11 13 17 . .Charlotte 34,696 5,321 2,228 1,502 6,033 1,001 688 1,135 11 104Citrus 24,394 3,250 1,949 563 4,981 717 1,031 682 87 44Clay 23,133 3,687 829 684 4,877 384 493 300 92 115Collier 38,407 4,562 2,064 941 5,556 968 756 1,508 . 326Columbia 8,331 1,564 367 370 1,641 163 186 238 20 119Miami-Dade 423,176 44,451 19,789 19,730 61,137 10,583 12,512 17,311 884 6,153DeSoto 5,373 879 465 108 938 194 135 19 . .Dixie 2,567 197 98 151 208 260 36 . . .Duval 101,278 15,025 4,389 1,927 15,221 2,828 2,959 3,972 176 948Escambia 36,565 5,963 1,572 972 4,337 880 872 1,918 16 237Flagler 11,613 1,667 879 627 1,618 398 172 524 . 100Franklin 1,289 288 . 11 181 . . 63 9 43Gadsden 4,903 656 263 294 694 137 442 61 . 54Gilchrist 1,914 313 89 56 353 81 10 8 . .Glades 1,009 176 . . 175 . 28 84 . .Gulf 2,020 340 124 53 333 8 40 19 . 15Hamilton 1,315 229 46 38 132 34 6 . . 110Hardee 3,171 159 308 106 240 164 47 226 44 45Hendry 4,547 824 123 56 641 99 . 131 24 56Hernando 35,853 5,996 1,564 1,229 6,634 1,387 868 886 35 380Highlands 19,009 2,388 1,332 995 3,052 1,299 375 393 34 174Hillsborough 163,048 20,230 5,894 5,163 22,070 4,605 3,717 6,591 296 1,757Holmes 1,320 202 55 221 140 34 . 175 . .Indian River 19,732 2,264 1,319 480 4,181 585 557 819 41 83Jackson 3,123 530 172 14 606 34 . 132 16 16Jefferson 1,584 93 70 116 186 37 19 122 . 8Lafayette 975 . 71 . 258 54 . . . .Lake 52,652 6,672 3,693 1,778 8,081 1,228 1,783 2,300 135 212Lee 73,162 10,068 5,148 2,149 10,719 1,934 1,742 3,816 213 404Leon 21,504 1,985 1,055 797 3,483 428 920 1,318 69 53Levy 6,680 585 447 134 1,314 263 284 142 15 21Liberty 977 19 40 35 303 . . 100 . .Madison 1,899 297 55 28 239 168 53 119 171 .Manatee 51,548 7,278 2,320 2,018 8,480 1,843 1,564 1,787 82 215Marion 51,201 7,858 4,405 2,366 7,659 1,102 600 2,017 128 363Martin 31,799 4,991 1,356 386 4,250 720 834 1,167 208 127Monroe 14,385 2,535 672 562 2,145 280 445 218 80 120Nassau 6,759 1,156 394 107 1,358 111 182 417 34 15Okaloosa 25,831 4,217 1,234 1,090 4,888 866 410 574 141 229Okeechobee 7,580 1,070 256 198 769 189 79 569 . 18Orange 135,534 17,886 5,600 5,250 17,739 2,974 3,301 5,973 750 1,892Osceola 31,673 5,525 1,150 1,155 4,669 467 903 1,089 10 132Palm Beach 243,428 32,132 8,882 9,467 33,993 8,273 5,481 11,631 498 1,396Pasco 79,760 11,832 3,086 2,354 13,591 3,308 1,244 2,477 199 691Pinellas 171,016 23,793 6,613 6,320 28,766 5,851 3,747 6,858 282 1,455Polk 87,271 11,428 3,605 1,960 13,086 3,084 1,717 5,343 459 594Putnam 11,143 2,430 567 372 1,772 109 227 595 . 12Saint Johns 23,519 3,132 799 966 3,955 545 887 497 146 64Saint Lucie 40,259 5,739 1,786 764 6,459 1,977 1,033 1,646 124 234Santa Rosa 15,001 2,732 613 497 1,976 382 637 548 23 53Sarasota 61,702 8,767 3,937 1,993 9,529 1,695 937 2,716 281 230Seminole 50,722 7,117 2,630 1,951 5,845 2,137 830 2,669 245 561Sumter 6,290 1,152 395 219 993 83 157 45 . 16Suwannee 5,894 1,053 173 240 870 140 25 406 21 .Taylor 2,402 269 300 99 486 103 73 . . 28Union 5,699 1,199 374 30 529 176 559 279 92 51Volusia 74,187 11,249 3,214 2,078 11,120 1,174 2,036 2,923 93 291Wakulla 3,058 260 95 200 479 11 72 109 . .Walton 5,967 1,047 340 328 1,107 91 63 183 35 .Washington 1,964 375 112 25 438 1 26 . . 117Source of data: Agency for Health Care Administration "." Data based on less than 10 admissions have been excluded.(1) Charges are expressed in thousands of dollars.
Table 40. Total Charges (1) for All Cancer Hospitalizations by County, Florida, 2003
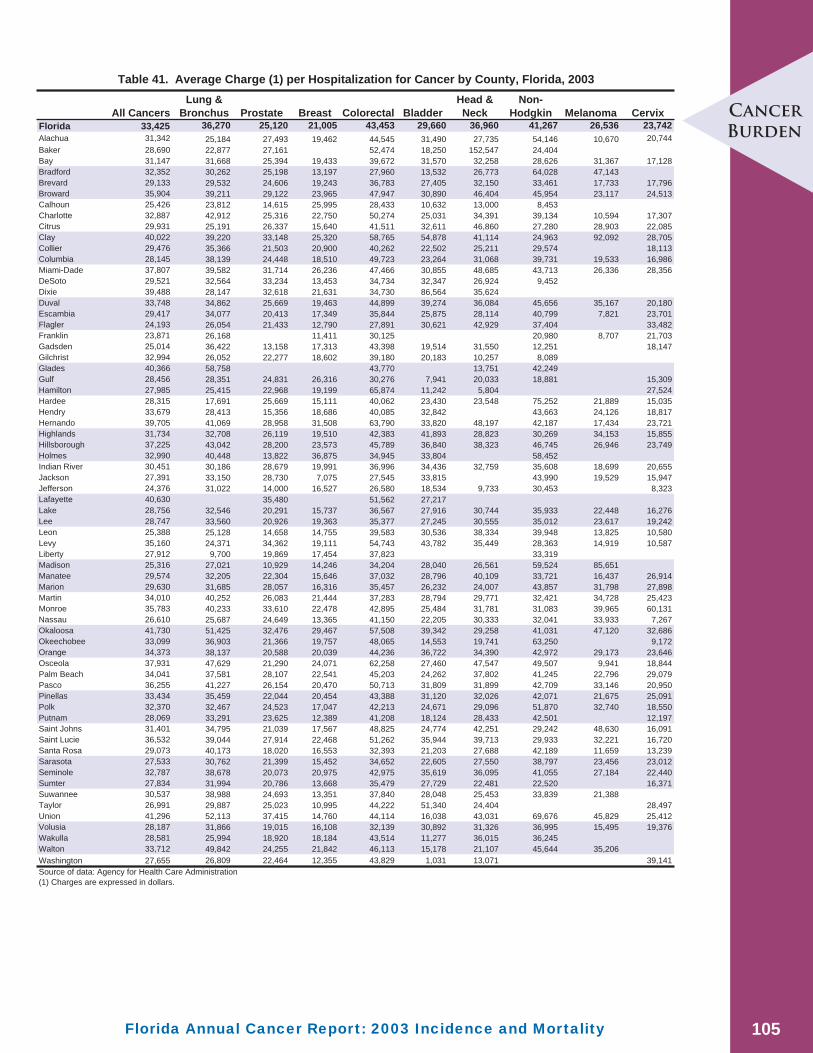
Florida Annual Cancer Report: 2003 Incidence and Mortality
Cancer
Burden
All Cancers Lung &
Bronchus Prostate Breast Colorectal BladderHead & Neck
Non-Hodgkin Melanoma Cervix
Florida 33,425 36,270 25,120 21,005 43,453 29,660 36,960 41,267 26,536 23,742Alachua 31,342 25,184 27,493 19,462 44,545 31,490 27,735 54,146 10,670 20,744Baker 28,690 22,877 27,161 52,474 18,250 152,547 24,404Bay 31,147 31,668 25,394 19,433 39,672 31,570 32,258 28,626 31,367 17,128Bradford 32,352 30,262 25,198 13,197 27,960 13,532 26,773 64,028 47,143Brevard 29,133 29,532 24,606 19,243 36,783 27,405 32,150 33,461 17,733 17,796Broward 35,904 39,211 29,122 23,965 47,947 30,890 46,404 45,954 23,117 24,513Calhoun 25,426 23,812 14,615 25,995 28,433 10,632 13,000 8,453Charlotte 32,887 42,912 25,316 22,750 50,274 25,031 34,391 39,134 10,594 17,307Citrus 29,931 25,191 26,337 15,640 41,511 32,611 46,860 27,280 28,903 22,085Clay 40,022 39,220 33,148 25,320 58,765 54,878 41,114 24,963 92,092 28,705Collier 29,476 35,366 21,503 20,900 40,262 22,502 25,211 29,574 18,113Columbia 28,145 38,139 24,448 18,510 49,723 23,264 31,068 39,731 19,533 16,986Miami-Dade 37,807 39,582 31,714 26,236 47,466 30,855 48,685 43,713 26,336 28,356DeSoto 29,521 32,564 33,234 13,453 34,734 32,347 26,924 9,452Dixie 39,488 28,147 32,618 21,631 34,730 86,564 35,624Duval 33,748 34,862 25,669 19,463 44,899 39,274 36,084 45,656 35,167 20,180Escambia 29,417 34,077 20,413 17,349 35,844 25,875 28,114 40,799 7,821 23,701Flagler 24,193 26,054 21,433 12,790 27,891 30,621 42,929 37,404 33,482Franklin 23,871 26,168 11,411 30,125 20,980 8,707 21,703Gadsden 25,014 36,422 13,158 17,313 43,398 19,514 31,550 12,251 18,147Gilchrist 32,994 26,052 22,277 18,602 39,180 20,183 10,257 8,089Glades 40,366 58,758 43,770 13,751 42,249Gulf 28,456 28,351 24,831 26,316 30,276 7,941 20,033 18,881 15,309Hamilton 27,985 25,415 22,968 19,199 65,874 11,242 5,804 27,524Hardee 28,315 17,691 25,669 15,111 40,062 23,430 23,548 75,252 21,889 15,035Hendry 33,679 28,413 15,356 18,686 40,085 32,842 43,663 24,126 18,817Hernando 39,705 41,069 28,958 31,508 63,790 33,820 48,197 42,187 17,434 23,721Highlands 31,734 32,708 26,119 19,510 42,383 41,893 28,823 30,269 34,153 15,855Hillsborough 37,225 43,042 28,200 23,573 45,789 36,840 38,323 46,745 26,946 23,749Holmes 32,990 40,448 13,822 36,875 34,945 33,804 58,452Indian River 30,451 30,186 28,679 19,991 36,996 34,436 32,759 35,608 18,699 20,655Jackson 27,391 33,150 28,730 7,075 27,545 33,815 43,990 19,529 15,947Jefferson 24,376 31,022 14,000 16,527 26,580 18,534 9,733 30,453 8,323Lafayette 40,630 35,480 51,562 27,217Lake 28,756 32,546 20,291 15,737 36,567 27,916 30,744 35,933 22,448 16,276Lee 28,747 33,560 20,926 19,363 35,377 27,245 30,555 35,012 23,617 19,242Leon 25,388 25,128 14,658 14,755 39,583 30,536 38,334 39,948 13,825 10,580Levy 35,160 24,371 34,362 19,111 54,743 43,782 35,449 28,363 14,919 10,587Liberty 27,912 9,700 19,869 17,454 37,823 33,319Madison 25,316 27,021 10,929 14,246 34,204 28,040 26,561 59,524 85,651Manatee 29,574 32,205 22,304 15,646 37,032 28,796 40,109 33,721 16,437 26,914Marion 29,630 31,685 28,057 16,316 35,457 26,232 24,007 43,857 31,798 27,898Martin 34,010 40,252 26,083 21,444 37,283 28,794 29,771 32,421 34,728 25,423Monroe 35,783 40,233 33,610 22,478 42,895 25,484 31,781 31,083 39,965 60,131Nassau 26,610 25,687 24,649 13,365 41,150 22,205 30,333 32,041 33,933 7,267Okaloosa 41,730 51,425 32,476 29,467 57,508 39,342 29,258 41,031 47,120 32,686Okeechobee 33,099 36,903 21,366 19,757 48,065 14,553 19,741 63,250 9,172Orange 34,373 38,137 20,588 20,039 44,236 36,722 34,390 42,972 29,173 23,646Osceola 37,931 47,629 21,290 24,071 62,258 27,460 47,547 49,507 9,941 18,844Palm Beach 34,041 37,581 28,107 22,541 45,203 24,262 37,802 41,245 22,796 29,079Pasco 36,255 41,227 26,154 20,470 50,713 31,809 31,899 42,709 33,146 20,950Pinellas 33,434 35,459 22,044 20,454 43,388 31,120 32,026 42,071 21,675 25,091Polk 32,370 32,467 24,523 17,047 42,213 24,671 29,096 51,870 32,740 18,550Putnam 28,069 33,291 23,625 12,389 41,208 18,124 28,433 42,501 12,197Saint Johns 31,401 34,795 21,039 17,567 48,825 24,774 42,251 29,242 48,630 16,091Saint Lucie 36,532 39,044 27,914 22,468 51,262 35,944 39,713 29,933 32,221 16,720Santa Rosa 29,073 40,173 18,020 16,553 32,393 21,203 27,688 42,189 11,659 13,239Sarasota 27,533 30,762 21,399 15,452 34,652 22,605 27,550 38,797 23,456 23,012Seminole 32,787 38,678 20,073 20,975 42,975 35,619 36,095 41,055 27,184 22,440Sumter 27,834 31,994 20,786 13,668 35,479 27,729 22,481 22,520 16,371Suwannee 30,537 38,988 24,693 13,351 37,840 28,048 25,453 33,839 21,388Taylor 26,991 29,887 25,023 10,995 44,222 51,340 24,404 28,497Union 41,296 52,113 37,415 14,760 44,114 16,038 43,031 69,676 45,829 25,412Volusia 28,187 31,866 19,015 16,108 32,139 30,892 31,326 36,995 15,495 19,376Wakulla 28,581 25,994 18,920 18,184 43,514 11,277 36,015 36,245Walton 33,712 49,842 24,255 21,842 46,113 15,178 21,107 45,644 35,206Washington 27,655 26,809 22,464 12,355 43,829 1,031 13,071 39,141Source of data: Agency for Health Care Administration (1) Charges are expressed in dollars.
Table 41. Average Charge (1) per Hospitalization for Cancer by County, Florida, 2003
105

Florida Annual Cancer Report: 2003 Incidence and Mortality
CANCER PROGRAMS IN FLORIDA
COMPREHENSIVE CANCER CONTROL PROGRAM
The Florida Comprehensive Cancer Control (CCC) Program, in the Bureau of Chronic Disease Prevention and Health Promotion of the Florida Department of Health, was created in 2001 through a cooperative agreement with the CDC to implement cancer prevention and education programming with a focus on colorectal, lung, ovarian, prostate, and skin cancers. The CCC Program’s mission is to reduce the burden of cancer in Florida on individuals, families, and communities by improving communication, coordination, and collaboration among public and private organizations at local, regional, and state levels. The CCC Program strives to accomplish this mission through on-going cooperative efforts with their partners at the Florida Cancer Data System, American Cancer Society, National Cancer Institute’s Cancer Information Services, Cancer Control and Research Advisory Council, Florida Dialogue on Cancer, Florida Cancer Council, Florida’s cancer centers, cancer survivors, and myriad of cancer stakeholders throughout Florida.
The CCC Program also serves as the convener of the newly established Florida Cancer Plan Council comprised of volunteers throughout Florida, who organized to implement the activities and strategies outlined in the Florida Cancer Plan.
The CCC Program also provides support and technical assistance at the regional level with the four established collaboratives. These collaboratives are comprised of cancer partners who share the similar goal to reduce Florida’s cancer burden through fostering partnerships, bridging resources, and improving communication. The University of Miami’s Sylvester Comprehensive Cancer Center offers support to the Southeast Collaborative. The Pinellas County Health Department offers support for the Southwest Collaborative. The Northeast Collaborative is led by the Duval County Health Department. The Northwest Collaborative is supported by a joint effort between the Cancer Information Service Partnership Program and the Tallahassee Memorial Hospital Cancer Center.
Other CCC program activities include collaborating with the CDC on various media projects promoting healthy lifestyles for cancer reduction, and providing the administration and management of funding for providers through the Closing the Gap - Reducing Racial and Ethnic Health Disparities projects. Other responsibilities include developing guidelines and policies for county health department activities and maintaining a program-specifi c web site. The CCC program networks with other Department of Health programs in coordinating activities for overlapping risk factors concerning tobacco use, poor nutrition, and lack of physical activity.
More information about the Florida Comprehensive Cancer Control Program is available at www.doh.state.fl .us/family/cancer.
BREAST AND CERVICAL CANCER EARLY DETECTION PROGRAM
Established in 1994, the Florida Breast and Cervical Cancer Early Detection Program (BCCEDP) is a breast and cervical cancer screening program that provides reduced-cost or free mammograms, clinical breast exams, and Pap smears to low-income, underinsured or uninsured women between the ages of 50 and 64 who are at or below 200 percent of poverty. Diagnostic exams are provided as necessary and case management is provided to all clients.
Cancer
Programs
106

Florida Annual Cancer Report: 2003 Incidence and Mortality
Treatment for eligible women may be paid by Medicaid.
The program is funded by the Centers for Disease Control and Prevention (CDC). All 67 Florida counties may access the BCCEDP through the 16 lead county health department sites that implement the program: Brevard, Broward, Duval, Escambia, Gadsden, Hillsborough, Jackson Leon, Manatee, Miami-Dade, Orange, Osceola, Pasco, Pinellas, Putnam, and Volusia.More information about the Florida Breast and Cervical Cancer Early Detection Program is available at www.doh.state.fl .us/family/bcc/index.html.
CANCER CONTROL AND RESEARCH ADVISORY COUNCIL
The Florida Cancer Control and Research Act, section 1004.423, Florida Statutes (F.S.) created the Cancer Control and Research Advisory Council (C-CRAB) in 1979. The Cancer Control and Research Advisory Council is housed within the H. Lee Moffi tt Cancer Center and Research Institute, Inc. The Council consists of 35 members appointed by the House, the Senate, and the Governor. The members represent various organizations, agencies, universities, research institutes, legislatures, and the general public.
The council formulates and makes recommendations to the Secretary of the Florida Department of Health and the Florida state legislators. These recommendations include, but are not limited to, cancer control initiatives; a plan for the care and treatment of persons suffering from cancer; conduct of cancer units or departments in hospitals and clinics; and the awarding of grants and contracts to qualifi ed profi t or nonprofi t associations or governmental agencies in order to plan, establish, or conduct programs in cancer control or prevention, cancer education and training, and cancer research.
Committees are formed by the council to review the following areas for action: cancer plan evaluation; cancer prevention; cancer detection; cancer patient management; cancer education; unproven methods of cancer therapy; and investigator-initiated project research.
FLORIDA CANCER COUNCIL
The Florida Cancer Council was created within the Department of Health through Senate Bill 2002 during the 2004 legislative session, and is codifi ed in sections 381.92 and 381.921, Florida Statutes. It was established for the purpose of making the state a center of excellence for cancer research. The eighteen-member council, whose members are designated by statute or politically appointed, is representative of the state's cancer centers, hospitals, and patient groups. The Chair of the Florida Dialogue on Cancer also serves as the Chair of the Florida Cancer Council. The Department of Health staff contact for this program is Chuck Wells, M.S., CHES, Assistant Director for the Offi ce of Public Health Research.
BANKHEAD-COLEY CANCER GRANT PROGRAM
On June 13, 2006, Governor Bush signed House Bill 1027 into law, which provides for a new program to be known as The William B. “Bill” Bankhead, Jr., and David Coley Cancer Research Program. The purpose of the Program is to “advance progress towards cures for cancer through grants awarded through a peer-reviewed, competitive process.” This act also provides for an annual appropriation of $9 million to provide grants to researchers seeking cures for cancer, beginning in fi scal year 2006-2007. The legislative intent of this program is to dramatically reduce
Cancer
Programs
107

Florida Annual Cancer Report: 2003 Incidence and Mortality
the state's inordinately high cancer burden, reducing both cancer incidence and mortality, while advancing scientifi c endeavors in this state, making this state a world-class leader in cancer research and treatment.
By statute, the program has been charged with achieving three long-term goals:
• Signifi cantly expand cancer research capacity in the state;• Improve both research and treatment through greater participation in clinical trials networks;• Reduce the impact of cancer on disparate groups.
The Florida Department of Health administers this program. The staff contact for this program is Chuck Wells, M.S., CHES, Assistant Director for the Offi ce of Public Health Research. The program also solicits recommendations and suggestions on policy alternatives from the Biomedical Research Program Advisory Council consistent with Section 381.922, Florida Statutes. The program web site is www.fl oridabiomed.com.
FLORIDA TOBACCO PREVENTION PROGRAM
Florida has a long-standing history in tobacco prevention efforts. In 1998, tobacco prevention activities increased following Florida's lawsuit settlement with the tobacco industry. The Settlement Agreement created the Tobacco Pilot Program, which gave birth to Students Working Against Tobacco (SWAT). SWAT is a youth led anti-tobacco program that focuses on the marketing practices of the tobacco industry. SWAT provides young people with the opportunity to be advocates and get involved at the state, regional, and local levels. SWAT allows youth to gain “real-life” experiences through planning, executing, and evaluating tobacco prevention activities. Many states have emulated Florida’s youth empowerment model for prevention and the American Legacy Foundation adopted its marketing campaign Truth for national use.
In August 1998, to refl ect the changing landscape of tobacco prevention and control in Florida, the Tobacco Free Florida Coalition was restructured as the Florida Leadership Council for Tobacco Control. The council includes ten voting members and guides Florida's tobacco prevention and control initiatives. While advisory in its capacity, the council includes an impressive group of experts in, and advocates for, tobacco prevention and control in Florida.
The Department of Health has enforcement responsibilities for the Florida Clean Indoor Air Act (FCIAA). Smoking became prohibited in enclosed indoor workplaces on July 1, 2003, with specifi c exceptions. The smoking prohibition was the result of the passage of Amendment 6 in November 2002. The amendment was approved by 71 percent of Florida voters. The purpose of the Florida Clean Indoor Air Act is to protect people from the health hazards of secondhand smoke and to implement Amendment 6, which is the Florida health initiative in section 20, Article X of the State Constitution. The Department of Business and Professional Regulations (DBPR) is the agency responsible for enforcing FCIAA in restaurants, stand-alone bars, bowling centers, billiard halls, and civic/fraternal organizations that hold a beverage license with the DBPR.
To assist residents who are interested in quitting smoking, the Department of Health has a tobacco cessation Quitline. This toll-free telephone-based (1.877.822.6669) service is available to any person living in Florida who wants to quit using tobacco. The Quitline provides counseling, self-help materials, and pharmacotherapy coupons for individuals who call. In addition, the Quitline service is available in all languages and there is TDD for the hearing impaired.
The program conducts two surveys annually. The Florida Youth Tobacco Survey is administered
Cancer
Programs
108
Florida Annual Cancer Report: 2003 Incidence and Mortality
to public middle and high school students. The Florida Adult Tobacco Survey is a random telephone survey that is administered to adults 18 and older. Both surveys measure smoking prevalence and behaviors. Results from these surveys are posted on the program’s web site www.doh.state.fl .us/tobacco.
Florida’s Tobacco Prevention Program continues to collaborate with numerous state agencies, councils, and coalitions to develop effective strategies to reduce and prevent tobacco use among Florida’s residents.
OFFICE OF MINORITY HEALTH
In July 2000, the Patient Protection Act, also known as Reducing Racial and Ethnic Health Disparities: Closing the Gap Act, was signed into law. The act provides funding for community-based projects within Florida counties and Front Porch Florida Communities to eliminate health disparities. The act targets seven priority health areas, including cancer, in which racial and ethnic groups currently experience serious disparities in access to care and health concerns.
The Department of Health’s Offi ce of Minority Health administers many grant programs, including three projects for early detection and referral of individuals with cancer to services. The availability of funds appropriated by the Florida Legislature is publicized through a grant announcement and application process. Any person, entity, or organization within a single county may apply for a “Closing the Gap” grant.
FLORIDA DIALOGUE ON CANCER
The Florida Dialogue on Cancer (FDOC), established in 2002, is a statewide, public/private collaboration among the state’s major health organizations, universities, patient advocate groups, and state and local government entities. The FDOC supports the goals of the state cancer plan. The purpose is to facilitate systemic efforts to reduce cancer incidence and mortality and minimize the impact of cancer for all Floridians. The web site for FDOC is www.fdoc.net/.
FLORIDA CANCER CLINICAL TRIAL MATCHING SERVICE
The Florida Cancer Clinical Trial Matching Service offers patients, caregivers, and their health care providers up-to-date information about clinical trials available in the state of Florida. This unique patient resource was created by the Florida Dialogue on Cancer (FDOC) in 2004 to address Florida’s growing cancer burden, and the need for increased clinical trial participation. The Clinical Trial Matching Service is administered and maintained by the American Cancer Society.
Individuals are able to access the Florida Cancer Clinical Trial Matching Service by telephone and by internet. Information is available in English and Spanish. The process begins by answering a brief series of questions about the patient’s diagnosis and treatment. The matching service will then fi nd appropriate clinical trails in Florida, or throughout the United States. Each patient decides whether to contact a medical center and enroll in a specifi c trial. All information is kept strictly confi dential, and the service is provided free of charge.
There are approximately 1,000 sessions accessing the Trial Matching Service each month. Since its inception, approximately 5,000 patients have been referred for clinical trails. Learn
Cancer
Programs
109
Florida Annual Cancer Report: 2003 Incidence and Mortality
Cancer
Programs
more about the Florida Cancer Clinical Trial Matching Service at 1-800-584-9976, or via the internet at www.fl oridacancertrials.com.
AMERICAN CANCER SOCIETY
The American Cancer Society (ACS) represents the world’s largest voluntary, community-based health agency. Dedicated to eliminating cancer through research, advocacy, education, and service, the American Cancer Society’s mission is closely aligned with the goals of the Florida Cancer Plan. The Florida Division of the American Cancer Society has provided help for the development of the regional cancer plans and works with other organizations and agencies to achieve the goals of the Florida Cancer Plan. The ACS Web site is www.cancer.org.
THE AMERICAN COLLEGE OF SURGEONS, THE COMMISSION ON CANCER
The Commission on Cancer (CoC), of the American College of Surgeons, is a consortium of professional organizations dedicated to improving survival and quality of life for cancer patients. The CoC Approvals Program recognizes hospitals and treatment centers that have cancer programs offering high-quality care through various cancer-related programs. These programs are concerned with cancer prevention, early diagnosis, pretreatment evaluation, staging, optimal treatment, rehabilitation, surveillance for recurrent disease, support services, and end-or-life care.
There are 70 cancer programs located throughout the state of Florida that have received Commission on Cancer approval. To meet the standards necessary for CoC approval, each cancer program must undergo a rigorous evaluation and performance review. In order to maintain approval, facilities must undergo an on-site review every three years. Receiving care at a CoC approved cancer program ensures that patients will receive comprehensive care, with state of the art services and equipment, via a multi-specialty team approach, all close to their home.
An important component of each CoC approved program is their Cancer Liaison Physician. Cancer Liaison Physicians are volunteer physicians responsible for providing the leadership and direction to establish, maintain, and support their facility's cancer program. A close collaborative relationship is maintained between each CoC approved cancer program and the American Cancer Society (ACS). Information on the services available at each CoC approved program is shared with the American Cancer Society, and is available to the public on the American Cancer Society Website - CoC Hospital Locator (www.cancer.org). This unique program allows Floridians to locate hospitals close to their home that have received CoC approval. More information on the Commission on Cancer can be obtained at www.facs.org/cancer.
CANCER INFORMATION SERVICE
The Coastal Cancer Information Service (CIS) is a program of the National Cancer Institute. The CIS is a national program that helps people, particularly those who are medically underserved, become active participants in their own health care by providing the latest information on cancer in understandable language. Serving Florida, Puerto Rico, and the U.S. Virgin Islands, the main Coastal CIS offi ce is located at the Sylvester Comprehensive Cancer Center at the University of Miami. Additional Coastal CIS offi ces are located in Tallahassee and Tampa, Florida, and in San Juan, Puerto Rico. Access to cancer information can be obtained through 1-800-4-CANCER and at www.cancer.gov for instant messaging and email.
110

Florida Annual Cancer Report: 2003 Incidence and Mortality
Cancer
Programs
FLORIDA ASSOCIATION OF PEDIATRIC TUMOR PROGRAMS, INC.
The Florida Association of Pediatric Tumor Program, Inc. (FAPTP) is an integral part of a coordinated network of physicians and other medical personnel who care for children with cancer and blood disorders in the state of Florida. Since 1973, the FAPTP has been established as a Florida not-for-profi t, charitable, scientifi c, and education organization with the mission of ensuring improved care for these children.
In 1981, the Florida Legislature designated the FAPTP to oversee and maintain data for the state of Florida Children’s Medical Services (CMS) Pediatric Hematology/Oncology program. Since then, the FAPTP has:
• developed and continues to maintain the only exclusively pediatric cancer registry in the state of Florida;
• provided a framework for a coordinated network of physicians and other medical personnel who care for children with cancer and blood disorders;
• established a quality-control audit mechanism to ensure that state-of-the-art care is available for Florida’s children.
In keeping its mission, the FAPTP provides many scientifi c and educational opportunities. These educational and research programs help to meet the growing demands for accurate, credible information from the member institutions and the state of Florida.
• Educational OpportunitiesThis year will be the 29th year of the FAPTP’s educational seminar, “Advances in Pediatric Hematology/Oncology” which provides educational opportunities for health care personnel. This is a unique opportunity to further enhance the level of care for children with cancer and blood disorders.
• Reporting SystemThe FAPTP reporting system provides the state and the public with data on cancer incidence, clinical trial participation, and survivorship. This information aids investigators in studies conducted on both the state and national level.
• Quality AssuranceThrough a contract between the FAPTP and the Department of Health, the center directors from around the state provide evaluation and consultation to Florida’s Children’s
Medical Services’ hematology/oncology programs.
111

Florida Annual Cancer Report: 2003 Incidence and Mortality
APPENDICES
APPENDIX A.1 POPULATION BY SEX, RACE, AND AGE GROUP, FLORIDA, 2003
Total Female Male
Florida 17,134,945 8,782,021 8,352,924
0-19 4,181,517 2,040,793 2,140,724
20-44 5,615,250 2,781,635 2,833,615
45-64 4,262,479 2.211,581 2,050,898
65-74 1,535,786 830,052 705,734
75+ 1,539,913 917,960 621,953
Black 2,690,405 1,394,954 1,295,451
0-19 916,902 451,253 465,649
20-44 1,025,127 527,658 497,469
45-64 546,642 295,239 251,403
65-74 119,766 68,021 51,745
75+ 81,968 52,783 29,185
White 14,012,002 7,162,512 6,849,490
0-19 3,117,435 1,517,108 1,600,327
20-44 4,425,786 2,169,244 2,256,542
45-64 3,627,341 1,868,380 1,758,961
65-74 1,396,595 750,991 645,604
75+ 1,444,845 856,789 588,056
Other Races 432,538 224,555 207,983
0-19 147,180 72,432 74,748
20-44 164,337 84,733 79,604
45-64 88,496 47,962 40,534
65-74 19,425 11,040 8,385
75+ 13,100 8,388 4,712
Source of data: Florida Concensus Estimating Conference
Appendices
112

Florida Annual Cancer Report: 2003 Incidence and Mortality
APPENDIX A.2 POPULATION BY COUNTY, FLORIDA, 2003
County Population County Population
Florida 17,134,945 Lafayette 7,391
Alachua 231,923 Lake 241,883
Baker 23,457 Lee 500,500
Bay 155,348 Leon 256,856
Bradford 27,060 Levy 36,829
Brevard 510,162 Liberty 7,250
Broward 1,697,283 Madison 19,180
Calhoun 13,483 Manatee 286,817
Charlotte 152,699 Marion 283,080
Citrus 126,308 Martin 135,197
Clay 156,951 Monroe 80,496
Collier 294,664 Nassau 63,425
Columbia 59,170 Okaloosa 181,851
Miami-Dade 2,353,532 Okeechobee 37,366
DeSoto 33,935 Orange 988,079
Dixie 14,764 Osceola 212,556
Duval 829,230 Palm Beach 1,217,287
Escambia 304,043 Pasco 377,478
Flagler 62,308 Pinellas 941,219
Franklin 10,513 Polk 513,575
Gadsden 46,580 Putnam 72,032
Gilchrist 15,632 Saint Johns 140,984
Glades 10,767 Saint Lucie 213,330
Gulf 15,678 Santa Rosa 129,712
Hamilton 14,041 Sarasota 350,235
Hardee 27,430 Seminole 396,670
Hendry 36,730 Sumter 63,380
Hernando 141,412 Suwannee 36,519
Highlands 90,749 Taylor 20,252
Hillsborough 1,083,211 Union 13,776
Holmes 18,998 Volusia 472,728
Indian River 121,736 Wakulla 25,033
Jackson 49,229 Walton 47,357
Jefferson 13,608 Washington 21,988
Source of data: Florida Concensus Estimating Conference
Appendices
113
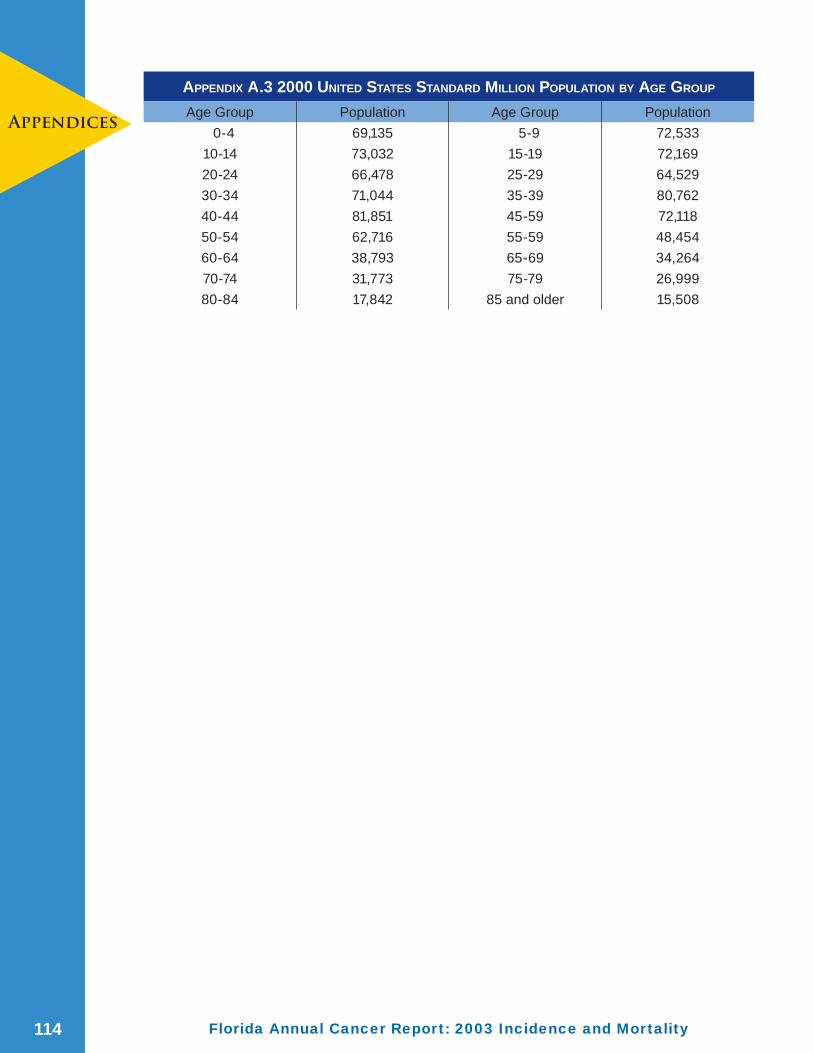
Florida Annual Cancer Report: 2003 Incidence and Mortality
APPENDIX A.3 2000 UNITED STATES STANDARD MILLION POPULATION BY AGE GROUP
Age Group Population Age Group Population
0-4 69,135 5-9 72,533
10-14 73,032 15-19 72,169
20-24 66,478 25-29 64,529
30-34 71,044 35-39 80,762
40-44 81,851 45-59 72,118
50-54 62,716 55-59 48,454
60-64 38,793 65-69 34,264
70-74 31,773 75-79 26,999
80-84 17,842 85 and older 15,508
Appendices
114

Florida Annual Cancer Report: 2003 Incidence and Mortality
APPENDIX B
POPULATION BY SEX AND RACE, FLORIDA, 1981-2003
Source of data: Florida Concensus Estimating Conference
0
2
4
6
8
1981
1982
1983
1984
1985
1986
1987
1988
1989
1990
1991
1992
1993
1994
1995
1996
1997
1998
1999
2000
2001
2002
2003Million
White FemaleWhite MaleBlack FemaleBlack Male
Appendices
115

Florida Annual Cancer Report: 2003 Incidence and Mortality
APPENDIX C
PERCENTAGE OF TOTAL POPULATION BY RACES AND AGE GROUP, FLORIDA, 2003
Source of data: Florida Concensus Estimating Conference
1086420246810
00-04
05-09
10-14
15-19
20-24
25-29
30-34
35-39
40-44
45-49
50-54
55-59
60-64
65-69
70-74
75-79
80-84
85+
Age Group
Percent of Population
Black WhiteAppendices
116

Florida Annual Cancer Report: 2003 Incidence and Mortality
APPENDIX D INCIDENCE AND MORTALITY CODES FOR CANCER SITES
FCDS Site Incidence Mortality
Number Primary Site ICD-O-3 Codes ICD-10 Codes
HEAD AND NECK
1 Lip C00.0 - C00.9 C00.0 - C00.9
2 Tongue C01.9 - C02.9 C01.9 - C02.9
3 Salivary Glands C07.9 - C08.9 C07.9 - C08.9
4 Floor of Mouth C04.0 - C04.9 C04.0 - C04.9
5 Gum and Other Mouth C03.0 - C03.9, C05.0 - C05.9,C06.0 - C06.9
C03.0 - C03.9, C05.0 - C05.9C06.0 - C06.9, C46.4
6 Nasopharynx C11.0 - C11.9 C11.0 - C11.9
7 Tonsil C09.0 - C09.9 C09.0 - C09.9
8 Oropharynx C10.0 - C10.9 C10.0 - C10.9
9 Hypopharynx C12.9, C13.0 - C13.9 C12.9, C13.0 - C13.9
10 Other Buccal Cavity and Pharynx
C14.0, C14.2 - C14.8 C14.0,C14.2, C14.8
34 Nasal Cavities, Middle Ear and Accessory Sinuses
C30.0 - C30.1, C31.0 - C31.9 C30.0 - C30.1, C31.0 - C31.9
35 Larynx C32.0 - C32.9 C32.0 - C32.9
COLORECTAL
14 Cecum C18.0 C18.0
15 Appendix C18.1 C18.1
16 Ascending Colon C18.2 C18.2
17 Hepatic Flexure C18.3 C18.3
18 Transverse Colon C18.4 C18.4
19 Splenic Flexure C18.5 C18.5
20 Descending Colon C18.6 C18.6
21 Sigmoid Colon C18.7 C18.7
22 Large Intestine, NOS C18.8 - C18.9, C26.0 C18.8 - C18.9
23 Rectosigmoid Junction C19.9 C19.9
24 Rectum C20.9 C20.9
LUNG AND BRONCHUS
36 Lung and Bronchus C34.0 - C34.9 C34.0 - C34.9
MELANOMA
41 Melanoma of the Skin C44.0 - C44.9 Histology 8720-8790
C43.0 - C43.9
Appendices
117

Florida Annual Cancer Report: 2003 Incidence and Mortality
BREAST
43 Breast C50.0 - C50.9 C50.0 - C50.9
CERVIX
44 Cervix Uteri C53.0 - C53.9 C53.0 - C53.9
PROSTATE
51 Prostate Gland C61.9 C61.9
BLADDER
55 Urinary Bladder C67.0 - C67.9 C67.0 - C67.9, D09.0
NON-HODGKIN’S LYMPHOMA
66 NHL Nodal Histology 9590-9596, 9670-9671, 9673, 9675,
C82.0 - C85.9, B21.1, B21.2
9678-9680, 9684, 9687,
9689-9691, 9695, 9698-9702,
9705, 9708-9709, 9714-9719,
9727-9729, 9823, 9827
For Sites C02.4, C09.8, C09.9, C11.1, C14.2, C37.9, C42.2, C77.0 - C77.9
NON-HODGKIN’S LYMPHOMA
67 NHL Extra-nodal Histology 9590-9596, Not Available
9670-9671, 9673, 9675,
9678-9680, 9684, 9687,
9689-9691, 9695, 9698-9702,
9705, 9708-9709, 9714-9719,
9727-9729
For Sites C00.0-C02.3,
C02.5-C09.7, C10.0-C11.0,
C11.2-C14.1,C14.3-C38.7,
C38.0-C42.1, C42.3-C76.9,
C78.0-C99.9
APPENDIX D INCIDENCE AND MORTALITY CODES FOR CANCER SITES (CONT.)
FCDS Site Incidence Mortality
Number Primary Site ICD-O-3 Codes ICD-10 CodesAppendices
118

Florida Annual Cancer Report: 2003 Incidence and Mortality
NON-HODGKIN’S LYMPHOMA (CONT.) 67 NHL Extra-nodal (cont.) and
Histology 9823, 9827
For Sites C00.0-C02.3,
C02.5-C09.7, C10.0-C11.0,C11.2-C14.1,C14.3-C38.7,C38.0-C41.1, C42.3,C42.5 - C76.9, C78.0-C99.9
OTHER SITES 11 Esophagus C15.0 - C15.9 C15.0 - C15.9
12 Stomach C16.0 - C16.9 C16.0 - C16.9
26 Liver C22.0 C22.0 - C22.9
30 Pancreas C25.0 - C25.9 C25.0 - C25.9
45 Corpus Uteri C54.0 - C54.9 C54.0 - C54.9
47 Ovary C56.9 C56.9
56 Kidney and Renal Pelvis C64.9, C65.9 C64.9, C65.9
62 Thyroid Gland C73.9 C73.9
68 Multiple Myeloma Histology 9731-9732, 9734 C90.0, C90.2
BRAIN AND NERVOUS SYSTEM
60 Brain C71.0 - C71.9 C71.0 - C71.9
Histology: 8000-9049, 9056-9139, 9141-9529, 9540-9589
61 Other Nervous Sytem a) C71.0 - C71.9 Histology 9530-9539
b) C70.0- C70.9, C72.0-C72.9
C70.0 - C70.9,
Histology 8000-9049, C72.0 - C72.9
9056-9139, 9141-9589
APPENDIX D INCIDENCE AND MORTALITY CODES FOR CANCER SITES (CONT.)
FCDS Site Incidence Mortality
Number Primary Site ICD-O-3 Codes ICD-10 CodesAppendices
119

Florida Annual Cancer Report: 2003 Incidence and Mortality
LEUKEMIA
69 Acute Lymphocytic Histology 9826, 9835-9837 C91.0
70 Chronic Lymphocytic Histology 9823 For Sites C42.0, C42.1, C42.4
C91.1
71 Other Lymphocytic Histology 9820, 9832-9834, 9940
C91.2, C91.3, C91.5, C91.7,C91.9
72 Acute Myeloid Histology 9840, 9861, 9866, 9867, 9871-9874, 9895-9897, 9910, 9920
C92.0, C92.5
73 Chronic Myeloid Histology 9863, 9875, 9876, 9945, 9946
C92.1
74 Other Myeloid/Monocytic
Histology 9860, 9930 C92.2, C92.4, C92.7, C92.9
75 Acute Monocytic Histology 9891 C93.0
76 Other Acute Histology 9801, 9805, 9931 C93.1
77 Aleukemic, Subleukemic and NOS
a) Histology 9733, 9742, 9800, 9831, 9870, 9948, 9963, 9964
C93.2, C93.7, C93.9
b) Histology 9827
For Site C42.0, C42.1, C42.4
ALL OTHER CANCERS 13 Small Intestine C17.0 - C17.9 C17.0 - C17.9
25 Anus, Anal Canal and Anorectum
C21.0 - C21.2, C21.8 C21.0, C21.1, C21.8
27 Intrahepatic Bile Duct C22.1 C22.1
28 Gall Bladder C23.9 C23.9
29 Other Biliary C24.0 - C24.9 C24.0 - C24.9
31 Retroperitoneum C48.0 C48.0
32 Peritoneum, Omentum and Mesentery
C48.1 - C48.2 C48.1 - C48.2
33 Other Digestive Organs C26.8 - C26.9, C48.8 C26.0 - C26.9, C48.8
37 Pleura C38.4 C38.4
38 Trachea, Mediastinum and Other Respiratory Organs
C33.9, C38.1 - C38.3, C38.8, C39.0, C39.8, C39.9
C33.9, C38.1 - C38.3, C38.8, C39.0, C39.9, C45.7, C45.9
39 Bones and Joints C40.0 - C41.9 C40.0 - C41.9
APPENDIX D INCIDENCE AND MORTALITY CODES FOR CANCER SITES (CONT.)
FCDS Site Incidence Mortality
Number Primary Site ICD-O-3 Codes ICD-10 CodesAppendices
120
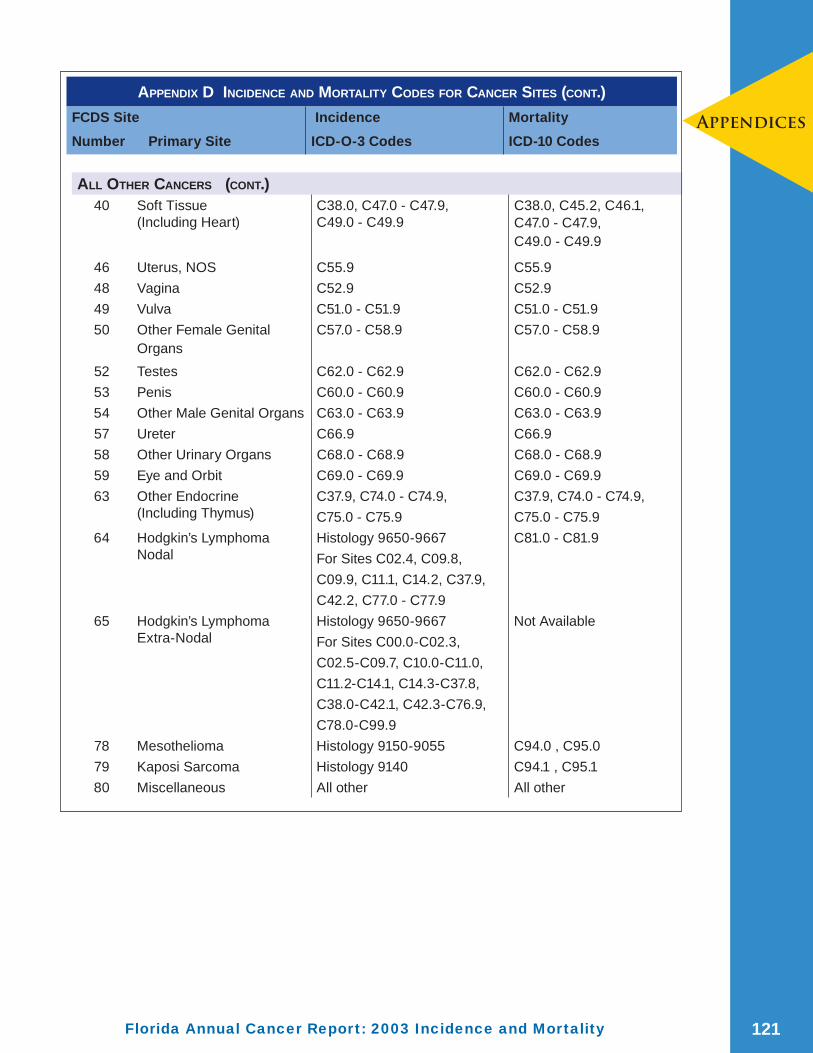
Florida Annual Cancer Report: 2003 Incidence and Mortality
ALL OTHER CANCERS (CONT.)40 Soft Tissue
(Including Heart)C38.0, C47.0 - C47.9,C49.0 - C49.9
C38.0, C45.2, C46.1,C47.0 - C47.9, C49.0 - C49.9
46 Uterus, NOS C55.9 C55.9
48 Vagina C52.9 C52.9
49 Vulva C51.0 - C51.9 C51.0 - C51.9
50 Other Female Genital Organs
C57.0 - C58.9 C57.0 - C58.9
52 Testes C62.0 - C62.9 C62.0 - C62.9
53 Penis C60.0 - C60.9 C60.0 - C60.9
54 Other Male Genital Organs C63.0 - C63.9 C63.0 - C63.9
57 Ureter C66.9 C66.9
58 Other Urinary Organs C68.0 - C68.9 C68.0 - C68.9
59 Eye and Orbit C69.0 - C69.9 C69.0 - C69.9
63 Other Endocrine(Including Thymus)
C37.9, C74.0 - C74.9, C37.9, C74.0 - C74.9,
C75.0 - C75.9 C75.0 - C75.9
64 Hodgkin’s LymphomaNodal
Histology 9650-9667 C81.0 - C81.9
For Sites C02.4, C09.8,
C09.9, C11.1, C14.2, C37.9,
C42.2, C77.0 - C77.9
65 Hodgkin’s LymphomaExtra-Nodal
Histology 9650-9667 Not Available
For Sites C00.0-C02.3,
C02.5-C09.7, C10.0-C11.0,
C11.2-C14.1, C14.3-C37.8,
C38.0-C42.1, C42.3-C76.9,
C78.0-C99.9
78 Mesothelioma Histology 9150-9055 C94.0 , C95.0
79 Kaposi Sarcoma Histology 9140 C94.1 , C95.1
80 Miscellaneous All other All other
APPENDIX D INCIDENCE AND MORTALITY CODES FOR CANCER SITES (CONT.)
FCDS Site Incidence Mortality
Number Primary Site ICD-O-3 Codes ICD-10 CodesAppendices
121
Florida Annual Cancer Report: 2003 Incidence and Mortality
REFERENCES
Anton-Culver H, Lee-Feldstein A, Taylor TH, “Occupation and Bladder Cancer Risk,” AmericanJournal of Epidemiology, Vol. 136,1992; pp. 89-94.
Bryant J, Thompson D, Hopkins R. 1997 and 1998 Smoking-Attributable Mortality Report. Florida Department of Health, Epidemiological Series 99-1124, 2000.
Centers for Disease Control and Prevention (CDC). Behavioral Risk Factor Surveillance System Survey Data. Atlanta, Georgia: U.S. Department of Health and Human Services, Centers for Disease Control and Prevention, 2002.
Coley CM, Barry MJ, Fleming C, Mulley A, “Early Detection of Prostate Cancer: Part I, Probability and Effectiveness of Tests,” Annals of Internal Medicine, Vol. 126, 1997; pp. 394-406.
Collins MM, Barry, MJ, “Controversies in Prostate Cancer Screening: Analogies to the Early Lung Cancer Screening Debate,” Journal of the American Medical Association, Vol. 276, 1996; pp.1976-1978.
Florida Behavioral Risk Factor Surveillance System (BRFSS): apps.nccd.cdc.gov/brfss/Trends/TrendData.asp
Kosary CL, Ries LA, Miller BA, Hankey BF, Harras A, Edwards BK (eds.). SEER Cancer Statistics Review, 1973-1992: Tables and Graphs. NIH: Bethesda, MD, 1995; Publication Number 96-2789:476.
Lamm DL, Torti FM, “Bladder Cancer,” Cancer Journal for Clinicians, Vol. 46, 1996; pp. 93-112.
National Institutes of Health. The SEER Program Code Manual, 3rd Edition. Bethesda: NIH, National Cancer Institute. NIH Publication Number 98-2000, January 1998.
Schottenfeld D, Fraumeni Jr. JF, (eds.), Cancer Epidemiology and Prevention, 2d ed., Oxford University Press, New York, 1996.
Snodgrass J (ed.). Procedure Guidelines for Cancer Registries: Series I, Inter-State Data Exchange. North American Association of Central Cancer Registries, December 2000.
U.S. Cancer Statistics Working Group. United States Cancer Statistics: 2000 Incidence.Department of Health and Human Services, Centers for Disease Control and Prevention, and National Cancer Institute, 2003.
World Health Organization. International Classification of Diseases, Ninth Revision, 1975.
World Health Organization. International Statistical Classification of Diseases and Related Health Problems, Tenth Revision, 1994.
World Health Organization. Fritz A, Percy C, Jack A, et.al. (eds.) International Classification of Diseases for Oncology, Third Edition (ICD-O-3), 2000.
references
122