Embed Size (px)
Citation preview
* SPECIAL REPORT *
THE BELL TOLLS FOR THEE: COST RECOVERY, CUTOFFS AND THE
AFFORDABILITY OF MUNICIPAL SERVICES IN SOUTH AFRICA
March 2002
by David A. McDonald, Co-director, Municipal Services Project
This report is a chapter in a forthcoming book edited by the author and Dr
John Pape and will be published by the Human Sciences Research Council
(HSRC) of South Africa in mid-2002. Tentatively entitled “Service
(Un)delivery in South Africa: The Impacts of Cost Recovery on Basic
Municipal Services” the book includes a chapter on “The Theory and
Practice of Cost Recovery”, six detailed case studies in various parts of the
country, this chapter based in a national survey, and a concluding chapter
on “The Way Forward” which will outline policy alternatives to the cost
recovery practices outlined below.
This chapter is being released early because of its relevance to policy
debates and the significance of the findings.
Introduction
Access to Services
Affordability of Services
Service Arrears
Service Cutoffs
Free Services
Block Tariffs
Conclusion
Acknowledgements

References
Endnotes
TABLES:
Table 1: Access to Water and Electricity
Table 2: Access to Sanitation and Refuse Collection
Table 3: Monthly Costs of Services
Table 4: Perception of Service Prices
Table 5: Perception of Prices of Water by Race and Household Income
Table 6: Ability to Pay for Services
Table 7: Statistics on Service Arrears
Table 8: Experience with Service Cutoffs for Non-payment
Table 9: Coping Strategies for Service Cutoffs
Table 10: Attitudes Towards Free Basic Services
Table 11: Attitudes to Free Services by Income and Race
Table 12: Attitudes Towards Covering the Costs of Free Services
Table 13: Support for Other Possible “Free Services”
Table 14: Attitudes Towards Block Tariffs as a Cross-Subsidization
Mechanism
FIGURE:
Figure 1: Cutoffs by Income Category
Introduction
The case studies presented thus far in this book provide detailed, qualitative

information on people’s experiences with cost recovery and municipal
services. The studies are based on ethnographic research methods with open-
ended questionnaires and a contextual analysis of people’s life histories.
But as rich as they are in detail, case studies are necessarily limited in their
ability to speak to the wider national experience on a given subject matter.
Findings from case studies can be extrapolated out to larger social, political
and economic themes – indeed, good case study research will always attempt
to do this – but these broader theoretical connections are necessarily bounded
by their narrow empirical focus.
To alleviate this problem we have conducted several concurrent case studies
in different parts of the country that allow us to speak more generally to the
national experience with cost recovery. But even this larger number of case
studies limits our ability to generalize about the country as a whole.
This chapter takes these efforts one step further by looking at the results of a
national survey on South African attitudes towards, and experiences with,
cost recovery. This random, stratified sample of 2,530 people conducted in
July 2001 is representative of the entire South African population over the
age of 18 years and offers the first-ever glimpse into the national experience
with cost recovery and service cutoffs.1 Designed and implemented in
collaboration with the Human Sciences Research Council (HSRC) as part of
the their annual public opinion survey,2 the questionnaire covered a wide
range of service delivery issues as they relate to cost recovery: attitudes
towards service costs, free services and block tariffs; access to services;
experiences with service arrears, service cutoffs, evictions and other legal
actions for non-payment; ability to pay for services; and coping strategies if
services are cut.
This national survey allows us to compare the results of the qualitative case
studies in this book with the national experience with cost recovery and to
identify differences and similarities between the two. In doing so, we are
able to enrich the inherently one-dimensional nature of a large national study
(it is infeasible to administer an open-ended questionnaire to 2,530 people)
with detailed case study material while at the same time using the national
data to assess the universality of the case study findings.
As it turns out, the findings from the case studies and the national survey
reinforce one another. Both suggest that aggressive cost recovery on
municipal services is imposing enormous hardships on low-income families,
contributing to a massive crisis in service cutoffs and evictions and
jeopardizing the potential for millions of low-income families to lead healthy
and productive lives. As a result, policies of cost recovery on municipal
services are undermining the otherwise impressive infrastructure record of
the South African government since 1994.

The chapter begins with an overview of the service delivery record by the
post-apartheid South African government and provides figures on the
number of people who have been given access to the four services that are
the focus of this chapter: water; electricity; refuse collection; and sanitation
(i.e. toilets and sewerage). The chapter then looks at how affordable these
services are and whether people are able to pay for the services they have
been given access to. Ability to pay, as we shall see below, is just as critical
as being given physical access to a service.
The chapter then examines the national experience with service cutoffs for
non-payment of bills/arrears. It is estimated that close to 10 million South
Africans have had their water cut off for non-payment of service bills, with
the same number having experienced an electricity cut off. More than two
million people have been evicted from their homes for the same reason. And
although it is low-income African households that bear the brunt of these
service cutoffs, lower middle-income families are also being affected, with
the highest proportion of cutoffs (within an income bracket) taking place in
households that earn between R2001 and R3000 per month.
The chapter concludes with a review of public attitudes towards “free
services” for water and electricity and the use of “block tariffs”. There is
widespread support for the former – as long as services are being provided to
low-income families – but this support comes mainly from low-income (and
black) respondents themselves. Upper-income (and white) respondents are
much less likely to support a free services policy and are much less likely to
be willing to pay extra taxes to subsidize the programme.
The one policy area where there is widespread support is for “block tariffs”
(i.e. charging higher per unit costs for a service for those who consume more
of it in order to subsidize the costs of “lifeline” supplies of services to the
poor). But given the resistance by upper-income families to a policy of “free
services”, it is unclear how much support can be expected for this
redistributional mechanism in the long run, particularly when one considers
that most municipalities in South Africa have only begun to introduce
progressive block tariff systems.
It should be noted, however, that this survey was conducted just as free water
and electricity policies were being introduced in South Africa (July 2001).
Extensive public education campaigns combined with considerable media
attention contributed to widespread public knowledge of these free service
policies, but few respondents would have experienced the impact of free
services at the time of their interview. It is possible, therefore, that attitudes
towards service affordability and cost recovery have changed since that time
and that fewer households are having their water and electricity cut off for
non-payment (due to the free units of service). Only a follow-up national
survey can tell us for sure.

Having said that, there are also some fundamental problems in the way in
which free services have been conceptualized and implemented in the
country and these may be limiting – if not negating – the potential benefits of
free service policies (see discussion below). Moreover, many households are
not receiving free blocks of water and electricity because of their payment
arrears, and there are widespread reports of continuing cutoffs of water and
electricity despite the free services policy.
This data should therefore be seen as a weather vane of service delivery
performance in South Africa; a benchmark of government’s record on
service delivery and cost recovery in their first seven years of office. In this
respect the record is clearly very mixed. There have been impressive
infrastructural gains but there have also been some spectacular failures in
terms of monitoring, regulating and addressing what is clearly a national
crisis in the affordability of basic municipal services.
Access to Services
At the time of the first democratic elections in South Africa in 1994, it is
estimated that 12 million South Africans did not have access to clean
drinking water and 21 million people did not have adequate sanitation (ANC
1994, 28). Ten percent of the population did not have access to a toilet of any
kind, a further one third of South Africans had to rely on pit latrines and 14%
of South Africans had no form of refuse removal (RSA 1995, 10). Over 20
million people did not have access to electricity (DME 1998, 21).
Since this time there have been major expansions of service infrastructure,
particularly in the areas of water and electricity. As of February 2002, the
South African government claims to have provided seven million additional
people with “access to clean, running water” and to have connected 3.5
million additional people to the electricity grid (Mbeki 2002).
Nevertheless, more than six million South Africans are still without access to
piped water (Kasrils 2001) and four million people (or 37% of all
households) still do not have access to electricity (RSA 2002) – figures
which are consistent with our own survey findings (Table 1). Central
government has committed itself to providing access to “basic supplies” of
water and electricity to all of these remaining households by 2008 and 2012
respectively,3 but the bulk of the remaining water and electricity connections
will be in difficult to access rural areas where capital and operating costs per
unit are significantly higher than urban areas due to lower population
densities and longer distances from water and electricity sources. These
service extensions will therefore take longer to complete, will be
significantly more costly to install, and could result in substantially higher
per unit costs for consumers if direct cost recovery principles are applied.

Table 1: Access to Water and Electricity Q: How do you get your drinking water? (%)
Piped — internal with meter 34
Piped — internal with pre-paid meter 4
Piped — yard tap with meter 13
Piped — yard tap with pre-paid meter 2
Piped — yard tap with no meter 9
Piped — free communal tap 12
Piped — paid for communal tap 2
Borehole/well 10
Rainwater tank 2
Flowing river/stream 6
Dam 4
Stagnant pond 2
Other (specify) 2
Q: Do you have access to electricity in your household? (%)
In-house meter 31
In-house pre-paid meter 35
Connected to other source which I pay for (e.g. connected to neighbour’s line and paying neighbour) 1
Connected to other source which I do not pay for (e.g. connected to neighbour’s line and not paying) 1
Illegal connection (e.g. connected to Eskom line) 2
Generator/battery -

Other 1
No access to electricity 28
Uncertain/Don’t know 1
N = 2520, 2515 Note: Figures rounded off to the nearest percent and therefore may not add to 100%. A dash (-) represents a figure greater than zero and less than 0.5%.
It is, however, in the area of sanitation and refuse collection that the service
delivery record is most wanting. Our survey demonstrates that only half of
the country’s population has access to flush toilets (many of which are
outside of the home and/or shared with many other families (for a detailed
discussion of the latter see Ramphele 1993)) while close to a third of South
Africans continue to use ordinary pit latrines and chemical toilets which are
often unsanitary, overcrowded, and always unpleasant (Table 2). A full 10%
of respondents still do not have access to any form of toilet whatsoever while
5% are forced to use that most degrading and unhealthy of all sanitation
systems: the bucket toilet.
With regards to waste management, 42% of respondents in the survey do not
have access to any form of refuse collection (with most of these being in
rural areas) while close to 10% still rely on communal skips. The latter are
frequently overflowing with waste due to the fact that there are often not
enough skips to properly service the number of people in the community
and/or skips are not collected regularly enough.
Access to basic municipal services, therefore, is still a major concern in
South Africa, and will remain so for many years to come. But it is to the
more vexing question of affordability that we now turn. Access to services is
of little consequence if households are unable to afford the costs of using
them.
Table 2: Access to Sanitation and Refuse Collection Q: What type of toilet does this household use? (%)
Flush 50
Improved or VIP pit latrine 2
Ordinary pit latrine 31
Bucket toilet 5
Chemical toilet 1

No toilet access 10
Other (specify) 2
Q: Does your household have refuse collection? (%)
Curbside collection 43
Communal skip (within 100 meters of household) 8
Communal skip (more than 100 meters from household) 1
Other (specify) 1
No refuse collection service 42
Uncertain/Don’t know 5
N = 2517, 2472 Affordability of Services
Service costs vary dramatically across the country, and even within
municipalities, making it impossible to identify a “typical” services bill, but
we can draw some averages from the survey. For those who have service
infrastructure and receive regular bills the median total cost per month for
water, electricity, sewerage and refuse removal ranges from R224 to R400
(Table 3).
Table 3: Monthly Costs of Services Q: Approximately how much does your household pay per month for each of the following services that you have access to? (%)
Service Does
not
pay
R0-
R2
0
R21-
R50 R51 -
R100 R101-
R150 R151-
R200 R200+ Uncertain/ Don’t know
Water 24 11 12 14 11 7 11 10
Electricity 5 11 15 16 14 12 21 6
Water-borne sewerage 14 8 23 13 5 3 3 32
Refuse removal 13 13 24 12 4 2 2 30
N = 2406, 2403, 2330, 2330 These figures are noteworthy for at least two reasons. First, they indicate an
enormous cost burden for low-income households. With 57% of the sample

earning less than R1000 per month in household income, even the lower
figure of R224 per month for services is close to a quarter of household
income and suggests considerable pressure on the household budget. And for
many poor households with larger, extended families the actual service
charges are significantly higher than the national median, forcing difficult
choices between the use of municipal services and essentials like food and
clothing (as we shall see below). For example, 16% of respondents with
household incomes of R751-1000 per month are spending more than R200 a
month on electricity alone.
The second notable feature of these costs is how relatively cheap these
services are for upper-income families — a group composed
overwhelmingly of white urbanites who have long benefited from heavily
subsidized municipal services (Ahmad 1995). For this relatively small but
economically powerful group, the payment of municipal services is simply
not a major budgetary concern (despite complaints about prices being too
high). Nor are these upper-income groups being asked to pay prices that are
out of line with international practice. In fact, according to Eskom, South
Africans enjoy “virtually the lowest cost energy available anywhere in the
world”,4 with average electricity prices having decreased by 15% in real
terms between 1994 and 2001 (Eskom 2001). South Africans also pay
considerably less for water than many countries, less than a third of the
average price per litre in the UK for example.5 Also worth noting are the
high numbers of households that do not know what they pay for sewerage
and refuse removal — likely because the costs of these services tend to be
part of the general rates bill (as opposed to direct tariffs) and are therefore
not easily separated out from municipal taxes. Charging tariffs for these
services could raise these costs considerably as cross-subsidization potentials
from the general rates base are reduced. In the City of Cape Town, for
example, it has been estimated that the price of water and sanitation services
could increase by 30-50% if these two services are combined into a single,
ring-fenced, tariff-based “business unit” separated from other service sectors
in the city (McDonald and Smith 2002, 48).
Respondents were then asked whether they thought the price they pay for the
services they receive is “too high”, “too low” or “about right”. Responses
were largely split between “too high” and “about right”, with very few
saying that prices are “too low”. Water and electricity topped the list of
services in the “too high” category, with 47% and 43% of respondents
indicating these opinions respectively (Table 4).
Table 4: Perception of Service Prices Q: In your opinion, is the price you pay each month for the following services too high, too low, or about right for what you receive? (%)
Too high Too low About right Uncertain/ Don’t know

Water 47 6 36 11
Electricity 43 6 45 6
Water-borne sewerage 30 4 42 24
Refuse removal 28 5 45 22
N =1579, 1758, 1133, 1216
A breakdown of these responses by income, race and location (rural/urban)
provides some interesting insights (Table 5). Only water is shown in the
table for space reasons but it is representative of responses for electricity and
other services as well.
Not surprisingly, it is respondents from low-income households that are most
likely to say that the price for municipal water is too high, but significant
numbers of respondents from middle- and upper-income households felt the
same way, including a third of those respondents with household incomes of
more than R20,000 per month.
Ironically, it is the most marginalized group (African, rural and low-income)
who were the most likely to say that prices for water are too low. Why this
would be so is unclear. These are the respondents that are least able to afford
services while at the same time being the most likely to have to pay higher
per unit costs for the services they do receive due to poor economies of scale,
distances from service sources, and the legacies of apartheid-era pricing
biases. To illustrate with the price of electricity, the average domestic rate in
the country is 24.59 cents per kilowatt hour (kwh) while rural consumers pay
as much as 48 cents/kwh. The same applies to many townships, with people
in Soweto, for example, being charged up to 30% more per kilowatt hour for
electricity than people in the middle- and upper-income suburbs of
Johannesburg (Fiil-Flynn 2001, 6).6
Table 5: Perception of Prices of Water by Race and Household Income Q: In your opinion, is the price you pay each month for water too high, too low, or about right for what you receive? (%)
Household income Too high Too low About right Uncertain/ Don’t know
No income 53 14 27 7
R1 - R500 52 6 30 12
R501 -R750 40 8 38 14

R751 - R1 000 56 5 25 14
R1 001-R1 500 53 4 35 8
R1 501 - R2 000 59 3 32 6
R2 001 - R3 000 51 2 4 6
R3 001 - R5 000 36 2 52 10
R5 001 - R7 500 41 4 47 8
R7 501 - R10 000 48 0 46 5
R10 001 - R15 000 45 6 47 2
R15 001 - R20 000 36 0 41 23
R20 001 - R30 000 33 0 67 0
R30 000 + 32 0 55 13
Race
African 46 9 32 13
Coloured 52 1 42 5
Asian 69 0 29 1
White 42 0 51 8
Rural/Urban
Rural 41 10 36 13
Urban 49 6 32 12
Metropolitan 51 2 39 8
N = 1579
Respondents were also asked how easy or difficult it is for them to pay for
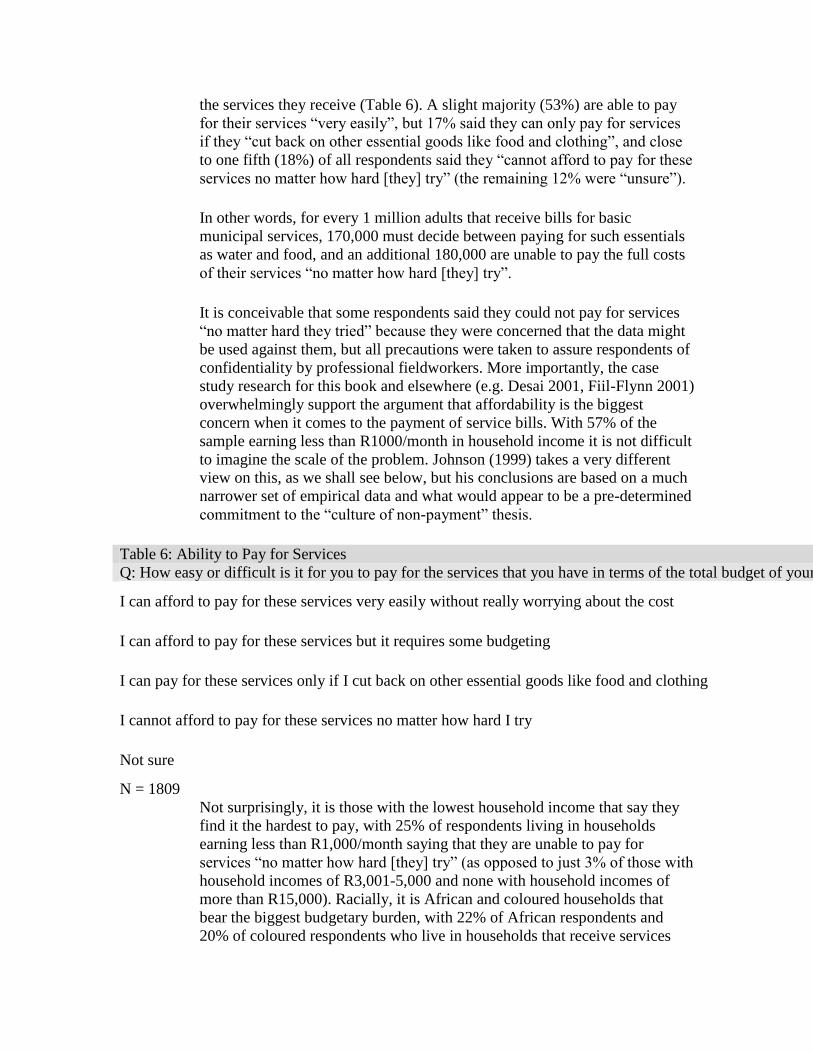
the services they receive (Table 6). A slight majority (53%) are able to pay
for their services “very easily”, but 17% said they can only pay for services
if they “cut back on other essential goods like food and clothing”, and close
to one fifth (18%) of all respondents said they “cannot afford to pay for these
services no matter how hard [they] try” (the remaining 12% were “unsure”).
In other words, for every 1 million adults that receive bills for basic
municipal services, 170,000 must decide between paying for such essentials
as water and food, and an additional 180,000 are unable to pay the full costs
of their services “no matter how hard [they] try”.
It is conceivable that some respondents said they could not pay for services
“no matter hard they tried” because they were concerned that the data might
be used against them, but all precautions were taken to assure respondents of
confidentiality by professional fieldworkers. More importantly, the case
study research for this book and elsewhere (e.g. Desai 2001, Fiil-Flynn 2001)
overwhelmingly support the argument that affordability is the biggest
concern when it comes to the payment of service bills. With 57% of the
sample earning less than R1000/month in household income it is not difficult
to imagine the scale of the problem. Johnson (1999) takes a very different
view on this, as we shall see below, but his conclusions are based on a much
narrower set of empirical data and what would appear to be a pre-determined
commitment to the “culture of non-payment” thesis.
Table 6: Ability to Pay for Services Q: How easy or difficult is it for you to pay for the services that you have in terms of the total budget of your household? (%)
I can afford to pay for these services very easily without really worrying about the cost 16
I can afford to pay for these services but it requires some budgeting 37
I can pay for these services only if I cut back on other essential goods like food and clothing 17
I cannot afford to pay for these services no matter how hard I try 18
Not sure 12
N = 1809 Not surprisingly, it is those with the lowest household income that say they
find it the hardest to pay, with 25% of respondents living in households
earning less than R1,000/month saying that they are unable to pay for
services “no matter how hard [they] try” (as opposed to just 3% of those with
household incomes of R3,001-5,000 and none with household incomes of
more than R15,000). Racially, it is African and coloured households that
bear the biggest budgetary burden, with 22% of African respondents and
20% of coloured respondents who live in households that receive services

indicating that they cannot afford to pay their bills “no matter how hard
[they] try” (as opposed to 7% of Asian respondents and just 1% of white
respondents). These racial dynamics are highly correlated to household
income of course, but do underscore the continuing racialized character of
poverty in the country.
However one looks at it, these figures are startling and reveal a major
affordability crisis. If, for example, 18% of the seven million people who are
reported to have been given access to water since 1994 are unable to pay
their water bills “no matter how hard [they] try”, then 1.26 million of these
new recipients are unable to afford this water and an additional 1.2 million
have to choose between paying for water and buying other essentials like
food. Similar percentages apply to the 3.5 million South Africans who have
been given access to electricity. These figures also challenge the so-called
“culture of non-payment” thesis that is so popular in South Africa. At the
heart of the state’s Masakhane (“let’s work together”) campaign, for
example, is the notion that poor households continue to use the anti-apartheid
boycott rhetoric of the 1980s as an excuse not to pay for services, a line
adopted by many politicians and civil servants who have been quick to blame
the poor for cheating on payments. The only other major academic report to
have been conducted on this topic adopts a similar line. Johnson (1999, 81,
91, 18) describes the service payment issue as a “community-wide culture of
non-payment…which enables widely disparate groups to find different
reasons for the same behaviour”. This stems from a “weak civic culture” and
the “lawless nature” of many townships and informal settlements. He
describes the situation in one area – Germiston – as requiring a “completely
new social and cultural climate”.7
The popular media is also rife with references to the “culture of non-
payment” — invariably aimed at poor, black households despite the fact that
(white-owned) businesses are amongst the worst default offenders8 — to the
point where this perception has entrenched itself in the public imagination,
forming the basis of many an indignant letter-to-the-editor from upper-
income suburban residents who feel that they are carrying an unfair burden
(morally and financially) for the payment of services accounts.9
To be sure, there are some township residents who do not pay for their
services because they feel they can get away with it and because others are
not paying. With non-payment rates in rural and township areas averaging
between 22% and 33% in the mid-1990s (DCD 1998), and as high as 75%
still today,10
it is not surprising that some residents would take advantage of
the situation. But from the data collected in this survey — and from evidence
gathered in more the qualitative, ethnographic work in this book and
elsewhere — it is clear that “ability to pay” is at the root of the payment
crisis, not a “culture of non-payment”.

Research in Soweto, for example, has shown that the overwhelming majority
of respondents keep careful records of their electricity bills and file the bills
away safely for many years (Khunou (this volume); Fiil-Flynn 2001). Some
households have expressed confusion over the introduction of volumetric
charges for electricity (flat rate systems were in place for decades) and have
trouble understanding the structure of their bills (difficult at the best of times
and made worse by the lack of literacy and numeracy skills), but most
residents spoken to for the Soweto research knew exactly what they had to
pay for electricity and expressed a deep concern about how they would
manage to pay these bills. This is not the behaviour of someone steeped in a
“culture of non-payment”.
Service Arrears
To make matters worse, many low-income households find themselves
heavily in arrears for basic services like water and electricity. Close to one-
quarter of all respondents (22%) said they were in arrears for water (with an
average debt of R2274) while 13% of respondents said they were in arrears
for electricity (with an average debt of R2189). Some respondents were in
arrears for as much as R10,000 while other case study data shows arrears of
R30,000 and more. Over a third of the debts in the survey were between 2-5
years old and a further ten percent of debts were more than five years old,
suggesting a long-term debt trap for many (see Table 7).
In terms of ability to pay, more than half (51%) of those respondents with
arrears said they “cannot afford to pay these arrears no matter how hard
[they] try” while an additional 13% said they can only pay if they give up on
other essentials like food and clothes. Once again, it is respondents from
low-income households that are most affected by arrears, with a third of all
respondents from households earning less than R1000/month being in arrears
for water and about 12% being in arrears for electricity.11
In both cases the
arrears average is 2.5 times the respondent’s monthly household income,
indicating the seriousness of these debts relative to household earnings and
the enormous hardships incurred in attempts to pay these debts off.
Table 7: Statistics on Service Arrears Q: Do you have any arrears for payment of water or electricity? (%)
Yes No Uncertain/ Don’t Know
Water 22 69 8
Electricity 13 80 7
N = 1702 Q: If so, what is the approximate value of these arrears? (Rand)
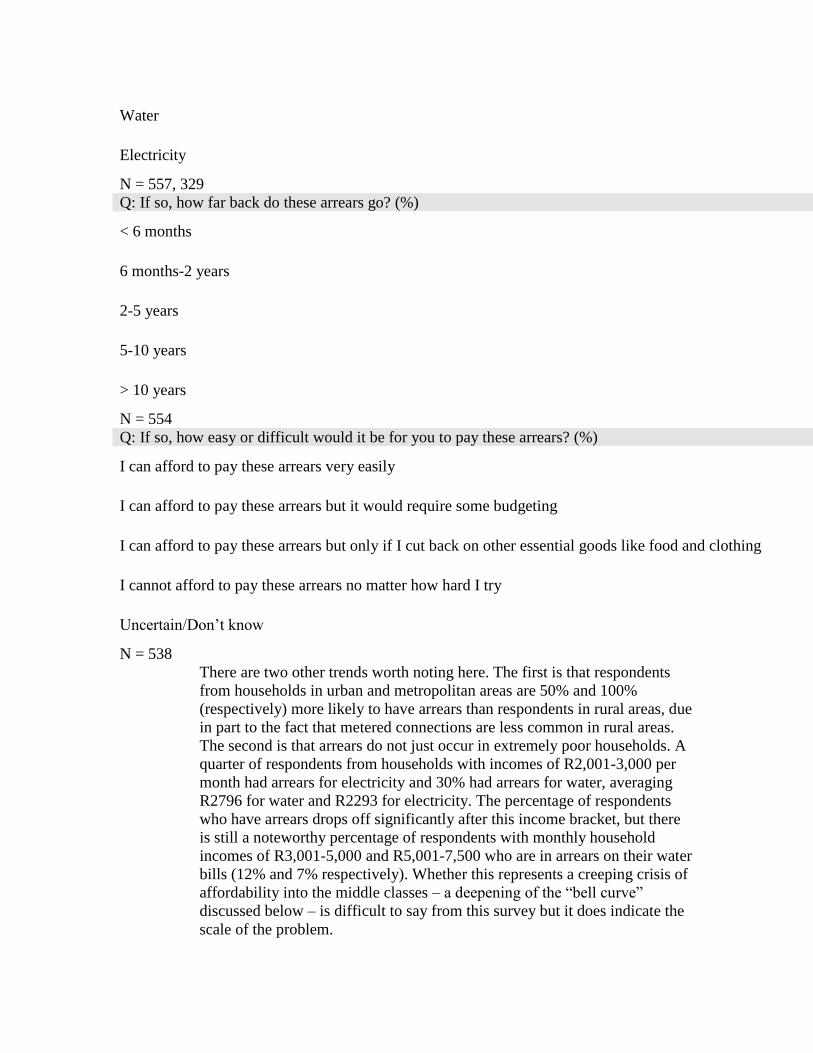
Water Mean = R2274
Electricity Mean = R2189
N = 557, 329 Q: If so, how far back do these arrears go? (%)
< 6 months 28
6 months-2 years 30
2-5 years 34
5-10 years 8
> 10 years 2
N = 554 Q: If so, how easy or difficult would it be for you to pay these arrears? (%)
I can afford to pay these arrears very easily 12
I can afford to pay these arrears but it would require some budgeting 17
I can afford to pay these arrears but only if I cut back on other essential goods like food and clothing 13
I cannot afford to pay these arrears no matter how hard I try 51
Uncertain/Don’t know 7
N = 538 There are two other trends worth noting here. The first is that respondents
from households in urban and metropolitan areas are 50% and 100%
(respectively) more likely to have arrears than respondents in rural areas, due
in part to the fact that metered connections are less common in rural areas.
The second is that arrears do not just occur in extremely poor households. A
quarter of respondents from households with incomes of R2,001-3,000 per
month had arrears for electricity and 30% had arrears for water, averaging
R2796 for water and R2293 for electricity. The percentage of respondents
who have arrears drops off significantly after this income bracket, but there
is still a noteworthy percentage of respondents with monthly household
incomes of R3,001-5,000 and R5,001-7,500 who are in arrears on their water
bills (12% and 7% respectively). Whether this represents a creeping crisis of
affordability into the middle classes – a deepening of the “bell curve”
discussed below – is difficult to say from this survey but it does indicate the
scale of the problem.

Service Cutoffs
In an attempt to force service users to pay their bills and/or arrears for water
and electricity, municipalities and other service providers (e.g. Eskom, the
parastatal electricity provider) have instituted policies of service cutoffs – i.e
having water, electricity and other basic municipal services discontinued to a
household. Seldom used prior to 1994,12
service cutoffs have become a
major mechanism of payment enforcement and have been implemented
throughout the country. In Soweto, for example, up to 20,000 homes a month
were having their electricity cutoff by Eskom in early 2001 (Fiil-Flynn 2001)
while in Cape Town, close to 100,000 households had their water cut off for
non-payment between 1996 and 2001 by the various municipalities that now
make up the Cape Town unicity (McDonald and Smith 2002).13
Ashwin
Desai’s (2001) graphic description of service cutoffs and evictions in
Chatsworth, Durban, is another case in point.
Nor are these merely isolated incidents. Our survey data suggests that service
cutoffs for non-payment have reached crisis proportions in South Africa,
with 13% of respondents indicating that their household has had its water cut
off for non-payment and an additional 13% saying their household has had
its electricity cut off for non-payment (with 39% of these respondents having
experienced both) (Table 8).
In terms of numbers, this means that 3.25 million people have had their
water cut off for non-payment of bills and 3.25 million have had their
electricity cut off.14
But since water and electricity cutoffs affect the whole
household (not just the individual interviewed) the actual number of people
who have experienced a service cutoff is considerably higher. If we take a
conservative estimate of two other household members for every respondent
who said they had experienced a cutoff, then the actual number of people
affected by water cutoffs is just under 10 million, with the same number
being affected by electricity cutoffs (with about 7.5 million people having
experienced both).15
And since most low-income households have more than
three household members these figures may substantially underestimate the
actual number of individuals affected.
Using the same formula, about over two million people have been evicted
from their homes for failure to pay their water and/or electricity bills and a
further 1.5 million people have had property seized.16
In some cases, people
have returned home at the end of the day to find their belongings on the
street and another family living in their house (Deedat, Pape and Qotole
2001).
Table 8: Experience with Service Cutoffs for Non-payment Q: Has your household ever experienced any of the following? (%)

Yes No Uncertain/ Don’t Know
Having your water cut off for non-payment 13 81 6
Having your electricity cut off for non-payment 13 81 7
Eviction from your home for failure to pay for water or electricity 3 89 8
Seizure of property for failure to pay for services 2 90 9
Threats of legal action by the municipality for failure to pay for water or electricity 7 84 9
Actual legal action taken against your household for failure to pay for water or electricity 3 88 9
N = 2327, 2300, 2285, 2290, 2292, 2280 This is tough medicine and perhaps the most damning indictment of all of
how aggressive cost recovery policies have undermined the physical delivery
of infrastructure. And these are only figures for those who have had their
services cut off by an external agent. There are also an untold number of
households that impose their own form of “cut offs” by consuming less water
and electricity than they really need in order to avoid payment defaults and
arrears. Pre-paid meters have the same basic effect, with low-income
households purchasing only as much water or electricity as they can afford,
regardless of the amounts they need to live healthy and productive lives – an
issue that has received considerable attention in the UK and led to the
eventual banning of certain pre-paid meter devices and the passing of
legislation which prohibits the disconnection of the water supply to homes
and a variety of other institutions for reasons of non-payment (DEFRA
1999).17
In terms of demographics, it is the poorest of the poor who make up the
largest absolute number of respondents who have experienced cutoffs, but it
is respondents from households with monthly incomes of R2001-3000 who
have experienced the largest proportion of cutoffs within their income
category (Figure 1). Close to a third (32%) of this group has experienced
electricity cutoffs and 23% have experienced water cutoffs.
This “bell curve” effect — the bulge in the lower middle-income category of
Figure 1 — may be due to the fact that these households have enough money
to purchase or rent a house with metered service delivery but do not have
enough income to pay for all the services they use/need on a monthly basis.
Widespread water cutoffs in lower middle-income neigbourhoods like
Tafelsig in Cape Town epitomize this phenomenon, diminishing many of the
hard-fought gains that these households thought they had made in the “new”
South Africa. Unless one has managed to climb solidly into the post-

apartheid middle-class, the demographic “bell” of cost recovery tolls for
anyone unfortunate enough not to be earning a sufficient income to pay for
their services.
Respondents were also asked how they cope with service cutoffs (Table 9).
Their answers provide a wide range of survival strategies, from accessing the
service from a neighbour, to using alternative energy sources such as
paraffin, to simply “going without the service until it is reconnected by the
municipality”. The percentage of respondents who said that they “ go
without” suggests that many of these cutoffs are for short durations, but other
coping strategies suggest much longer-term cutoff periods. Case study
research has shown that electricity and water cutoffs of up to nine months in
duration are not uncommon (e.g. Fiil-Flynn 2001, Xali (this volume)).
Table 9: Coping Strategies for Service Cutoffs
Q: When you experience water cut offs, how does your household cope with these disconnections? (%)
We go without the service until it is reconnected by the municipality 25
We get water from our neighbours 50
We get water from a community tap 8
We get water from a nearby river 11
We get water from a nearby dam 2
We get water from a nearby stagnant pond 1
We get water from government trucks that provide potable water for free 2
We get water from private traders that sell potable water 2
We reconnect our water illegally (or have someone else do it for us) 1
Other (specify) 10
Q: When you experience electricity cut offs, how does your household cope with these disconnections? (%)
We go without the service until it is reconnected by the municipality 38
We get electricity from our neighbours 3

We use alternative sources of energy like paraffin and coal 45
We re-connect our electricity illegally (or have someone else do it for us) 4
Other (specify) 6
NOTE: Figures based on percentages of those who had experienced a water or electricity cut off. Responses were unprompted and more than one answer could be given. As a result, figures do not add to
100%.
Another concern here is the use of alternative sources of water and energy as
a coping mechanism. Water cutoffs, for example, can lead to the use of
contaminated water supplies such as rivers and stagnant ponds, with dire
health consequences. The most tragic example of this since 1994 has taken
place in KwaZulu Natal where the introduction of cost recovery on water in
mid-2000 forced many people to use unsafe water sources, contributing to
the cholera outbreak in that province and resulting in over 100,000 cases of
illness and at least 250 deaths (Cottle and Deedat (this volume)). The use of
paraffin and coal in place of electricity is also problematic, with shack fires,
respiratory disease and child poisoning from paraffin amongst the leading
causes of illness and death in low-income households (see, for example,
Eberhard and van Horen, 1995).
Finally, it is worth noting that the figures shown in Table 9 for “reconnecting
illegally” are likely understated, perhaps due to respondent’s fears of
reprisals. One study in Cape Town, for example, found an illegal
reconnection rate of 60% after water cutoffs were implemented by the
Tygerberg municipality (McDonald and Smith 2002) with illegal
reconnection of electricity being widespread in Soweto as well under the
community-led Operation Khanyisa (“to light”) (Fiil-Flynn 2001).
Free Services
One response to the issue of affordability and cutoffs has come in the form of
“free services”. Developed initially by the national office of the African
National Congress (ANC) in the lead-up to local government elections in
December 2000, and subsequently adopted by the Democratic Alliance (DA)
as part of their election campaign in the same year, the free services policy is
based on the concept of providing a “lifeline” supply of water and electricity
to every household in the country free of charge.
There are concerns with the manner in which these policies have been
designed and implement, however, and it is useful to review these briefly.
First, there is the problem of the quantity of free services being offered. With
respect to electricity, the 50 free kwh per household per month being offered
by ANC-controlled municipalities (and only 20kwh by DA-controlled
municipalities) will provide some financial relief, but this amounts to less

than 10% of the average electricity consumption of low-income households
in South Africa and will only run a light bulb and a few small appliances for
a month (Eskom 1996).18
And with over 50% of rural families not yet on the
electricity grid there are millions of low-income households that will not
benefit at all.
The promise of six free kilolitres (kl) of water per household per month also
offers little financial respite due to the fact that many low-income
households use much more than six kilolitres due to the relatively high
average number of occupants per household and also because of old and
leaky apartheid-era infrastructure. Rapid tariff increases after this free block
can mean that poor families end up paying more, not less, for water than they
did under old tariff structures while those accustomed to paying a “flat rate”
for services have seen dramatic price increases for both water and electricity
(more than 400% for the cost of electricity in some cases in Soweto, despite
an decrease in the average price of electricity over the past several years
(Fiil-Flynn 2001)).
Another problem is that the 6kl figure is based on an average household of
eight people and works out to 25 litres per person per day. Part of the
concern here is that this 25 litre figure is at the bottom end of the World
Health Organization’s (WHO) recommended daily minimum – with
estimates of 50 litres being more commonly advocated by the WHO – and is
well below the 50-60 litres per day called for in the ANC’s original
Reconstruction and Development Programme (RDP) as a medium-term
service delivery goal. To put this in perspective, the average bathtub takes
200 litres to fill while the average toilet uses 10 to 15 litres per flush — a
situation made worse by the fact that water (and energy) saving devices have
never been a serious part of service delivery strategies in South Africa. The
fact that many low-income households have more than eight people
heightens the problem as well, as does the fact that for many people this
water is only delivered to a communal standpipe within 200 meters of the
recipient’s household. With violence and rape a serious problem in many
low-income areas, these communal standpipes can be both inconvenient and
unsafe, particularly after dark.
There is also a concern with the use of the household as a unit of
measurement for free water due to its intrinsic bias against low-income
families. To illustrate, a young couple with two incomes and no dependents
living in a home in the suburbs receive the same amount of free water as a
single, unemployed mother with seven dependents living in a run-down
council house or shack in the townships. Households are not means-tested to
see if they qualify for the free service (using the rationale that the
administrative cost of these tests would outweigh the savings) with the result
that some middle- and upper-income South African households are
benefiting more from the provision of free lifeline services than poor

households. This is not to suggest that individual means-tests be introduced
for free water – a potentially degrading and divisive procedure separating the
very poor from the even poorer – but it does highlight the inherently
inequitable feature of basing free services on a per-household basis.
Finally, there is the problem of delivery. Although free water and electricity
were to have been implemented across the country on July 1, 2001,
implementation delays have been widespread – particularly in rural areas –
and there have been disputes over what level of government should cover the
costs of free services. In the case of electricity, the roll out has been further
hampered by unresolved negotiations between the parastatal Eskom and
national government over the subsidization of the free 50 kwh, resulting in a
lengthy delay for free electricity in Soweto and other township and rural
areas. Moreover, many households are not receiving free blocks of water and
electricity because of they are in payment arrears and there are widespread
reports of continuing cutoffs of water and electricity despite the free services
policy.
Nevertheless, free lifeline services remain a potentially powerful method of
addressing affordability concerns and respondents were asked their opinion
of the policy in an attempt to gauge public support for this policy tool.
Specifically, respondents were asked who they thought should be entitled to
free water and electricity and if they felt there were any other services that
should be offered on a “lifeline” basis.
The results are mixed. There is strong support for free water and electricity
for households with incomes of less than R500/month (78% in favour) but
this supports drops off rapidly as recipient income increases. Even
households with marginally higher incomes of up to R1000 per month
received only 52% support while a mere 27% of respondents were in favour
of providing free services for households with incomes of up to R2000 per
month (Table 10).
What these figures demonstrate is highly qualified support for “free
services”, with only the poorest of the poor being deemed eligible for this
assistance. The fact that all households in South Africa — regardless of
income — are to be provided with a free block of water and electricity under
current policy plans clearly runs counter to public opinion — even it is
administratively cheaper to run a free services programme in this manner.
Table 10: Attitudes Towards Free Basic Services
Q: In the recent local government elections, various political parties made promises to provide free water and
electricity. Which of the following groups do you think should be entitled to enough free water and electricity to meet
their basic needs? (%)

Yes No
Those who earn less than R500 per month 7
8 22
Those who earn less than R1000 per month 5
2 48
Those who earn less than R2 000 per month 2
7 73
Those who earn less than R3000 per month 1
9 81
All households
3
8 62
No households
1
1 89
N = 1968
There are important differences in attitudes to free services along race and
income lines, however. Respondents from low-income households gave the
strongest levels of support for free services to households with less than
R500 per month in household income (up to 88% support) while those with
higher incomes were less likely to support the policy (with as little as 41%
support) (Table 11). In other words, the bulk of support for free services
comes from households that are themselves in the greatest need of the
lifeline assistance while middle- and upper-income households are much less
likely to be supportive of free service policies. Racially, black respondents
were most likely to support free services to poor households (with Asians
showing 89% support) while white respondents were least likely to support
free services (57% support).
Table 11: Attitudes to Free Services by Income and Race
Percent in each category who believe that households which earn less than R500 per month should be entitled to enough free water and electricity to meet their basic needs (%)
% of support
Total Monthly Household Income
No income 75
R1 – R500 82
R501 – R750 88

R751 – R1 000 86
R1 001– R1 500 87
R1 501 – R2 000 77
R2 001 – R3 000 88
R3 001 – R5 000 66
R5 001 – R7 500 76
R7 501 – R10 000 60
R10 001– R15 000 57
R15 001 – R20 000 41
R20 001 – R30 000 45
R30 000 + 69
Race
African 81
Coloured 78
Asian 89
White 57
When asked who they thought should pay to cover the costs of these free
services, most respondents were in favour of having government pay (76%),
but this support fell off dramatically when asked if they thought this should
be financed by extra taxes on wealthy households and businesses (40% and
49% support respectively). The option of relying on “donations” from the
wealthy and from business also received mixed support (Table 12).
But here again there were significant differences along race/class lines. In
general, white and upper-income respondents were far less likely to support
increased taxes and donations from business as methods of financing free
services to poor households than were black and lower-income respondents.
For example, 48% of respondents from households earning between R501-
750 per month were in support of introducing extra taxes on wealthy

households to pay for free services while only 10% of those in households
earning between R10,000 and R15,000 were in favour of this approach. And
while 43% of African respondents were in favour of increased taxes on
wealthy households only 19% of white respondents were in favour.
Table 12: Attitudes Towards Covering the Costs of Free Services
Q: Where do you think the money to pay for these free services should come from? (%)
Yes No Don’t Know
The government 76 16 8
Extra taxes on wealthy households 40 47 13
Extra taxes on businesses 49 38 14
Rely on donations from the wealthy 40 43 18
Rely on donations from businesses 46 36 19
N = 2472
In sum, white, upper-income South Africans are the least likely to support
free basic services for poor households and are also the least likely to support
financing these free services by increased taxes or donations. In fact,
opposition to free services increases as income rises, with 59% of those with
household incomes of between R15,000 and R20,000 per month being
outright opposed to free services and 69% being opposed to increased taxes
to pay for these services (for a detailed discussion of this kind of opposition
to cross-subsidization from upper-income communities see the chapter by
Pape on Constantia, Cape Town (this volume)). But it is not just white South
Africans who are opposed to this kind of redistribution of household income.
Upper-income blacks are also more likely to oppose these measures,
highlighting the increasingly class-based character of South African politics.
With respect to other services that might be offered for free, the highest
levels of support were for primary health care (79%) but there was a majority
support for most other services as well (Table 13), suggesting considerable
public sympathy for an expansion of free services to other sectors.
Nevertheless, the same race and class dynamics apply in terms of who does
and does not support such policies.
Table 13: Support for Other Possible “Free Services”
Q: How about the following services? Do you think any of these should also be provided for free to certain groups? (%)
Yes No Uncertain/ Don’t Know
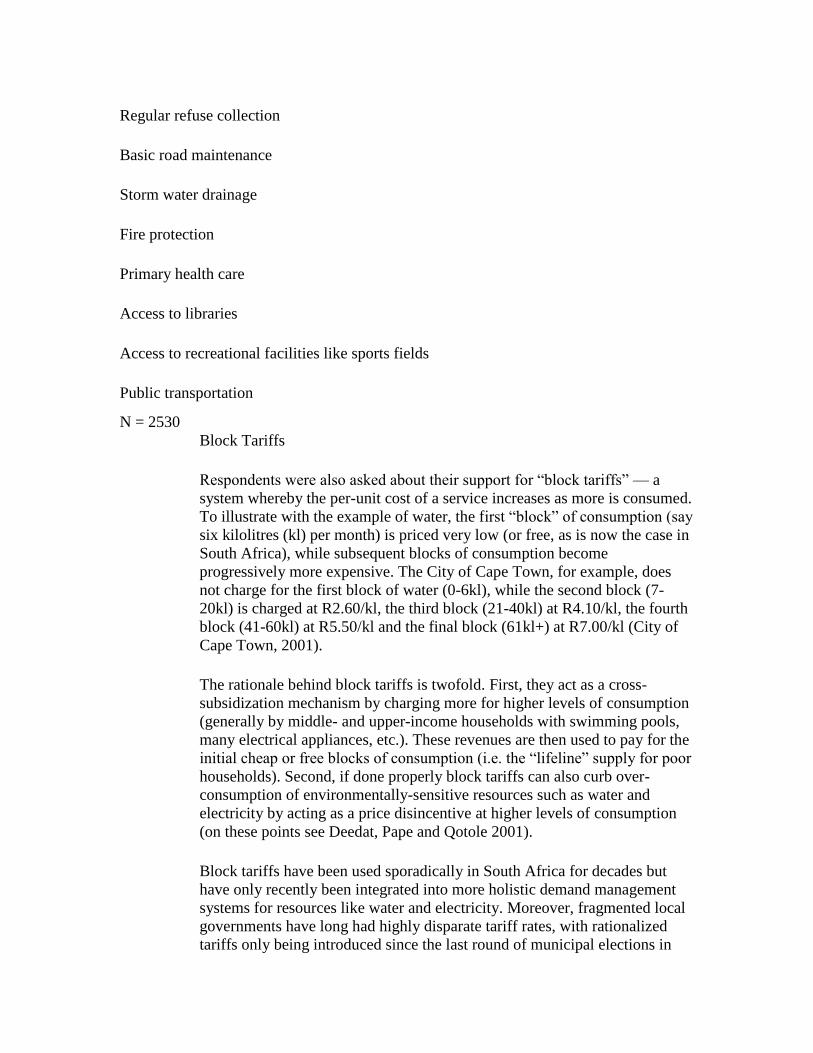
Regular refuse collection 57 31 12
Basic road maintenance 63 27 10
Storm water drainage 53 32 15
Fire protection 61 28 11
Primary health care 79 16 5
Access to libraries 67 23 10
Access to recreational facilities like sports fields 63 27 10
Public transportation 38 52 10
N = 2530
Block Tariffs
Respondents were also asked about their support for “block tariffs” — a
system whereby the per-unit cost of a service increases as more is consumed.
To illustrate with the example of water, the first “block” of consumption (say
six kilolitres (kl) per month) is priced very low (or free, as is now the case in
South Africa), while subsequent blocks of consumption become
progressively more expensive. The City of Cape Town, for example, does
not charge for the first block of water (0-6kl), while the second block (7-
20kl) is charged at R2.60/kl, the third block (21-40kl) at R4.10/kl, the fourth
block (41-60kl) at R5.50/kl and the final block (61kl+) at R7.00/kl (City of
Cape Town, 2001).
The rationale behind block tariffs is twofold. First, they act as a cross-
subsidization mechanism by charging more for higher levels of consumption
(generally by middle- and upper-income households with swimming pools,
many electrical appliances, etc.). These revenues are then used to pay for the
initial cheap or free blocks of consumption (i.e. the “lifeline” supply for poor
households). Second, if done properly block tariffs can also curb over-
consumption of environmentally-sensitive resources such as water and
electricity by acting as a price disincentive at higher levels of consumption
(on these points see Deedat, Pape and Qotole 2001).
Block tariffs have been used sporadically in South Africa for decades but
have only recently been integrated into more holistic demand management
systems for resources like water and electricity. Moreover, fragmented local
governments have long had highly disparate tariff rates, with rationalized
tariffs only being introduced since the last round of municipal elections in
December, 2000.
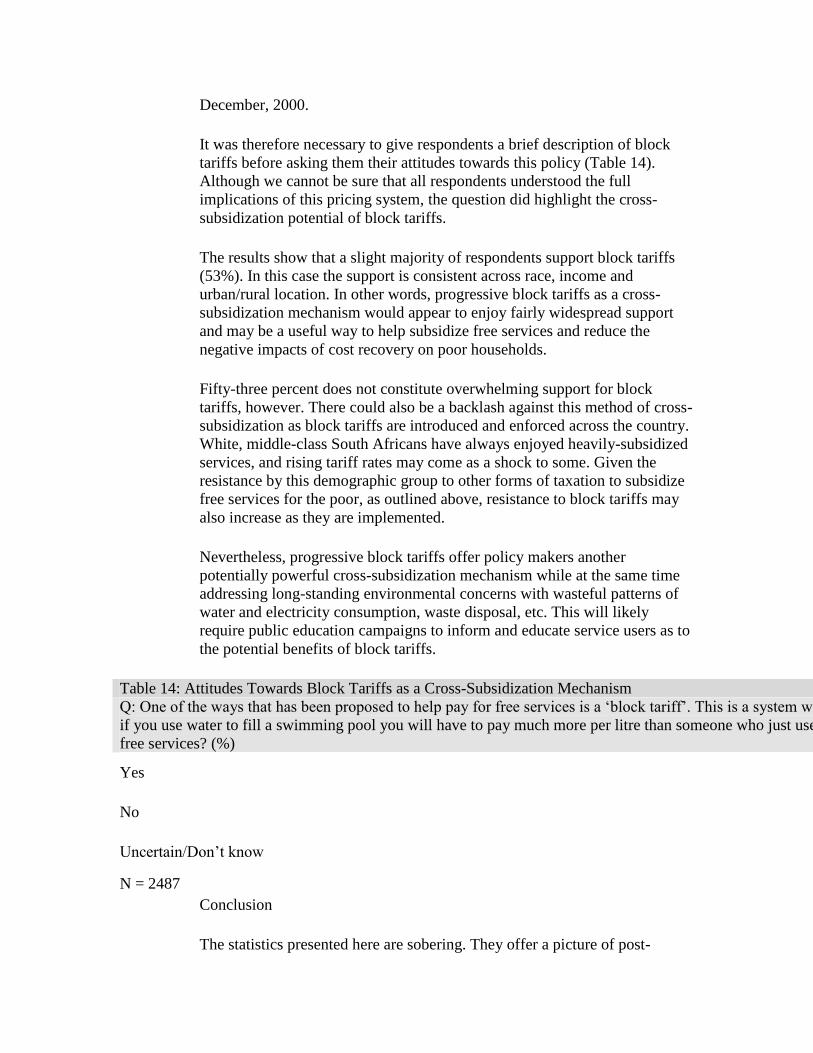
It was therefore necessary to give respondents a brief description of block
tariffs before asking them their attitudes towards this policy (Table 14).
Although we cannot be sure that all respondents understood the full
implications of this pricing system, the question did highlight the cross-
subsidization potential of block tariffs.
The results show that a slight majority of respondents support block tariffs
(53%). In this case the support is consistent across race, income and
urban/rural location. In other words, progressive block tariffs as a cross-
subsidization mechanism would appear to enjoy fairly widespread support
and may be a useful way to help subsidize free services and reduce the
negative impacts of cost recovery on poor households.
Fifty-three percent does not constitute overwhelming support for block
tariffs, however. There could also be a backlash against this method of cross-
subsidization as block tariffs are introduced and enforced across the country.
White, middle-class South Africans have always enjoyed heavily-subsidized
services, and rising tariff rates may come as a shock to some. Given the
resistance by this demographic group to other forms of taxation to subsidize
free services for the poor, as outlined above, resistance to block tariffs may
also increase as they are implemented.
Nevertheless, progressive block tariffs offer policy makers another
potentially powerful cross-subsidization mechanism while at the same time
addressing long-standing environmental concerns with wasteful patterns of
water and electricity consumption, waste disposal, etc. This will likely
require public education campaigns to inform and educate service users as to
the potential benefits of block tariffs.
Table 14: Attitudes Towards Block Tariffs as a Cross-Subsidization Mechanism
Q: One of the ways that has been proposed to help pay for free services is a ‘block tariff’. This is a system where the price of a service like water or electricity increases the more you use of it. For example,
if you use water to fill a swimming pool you will have to pay much more per litre than someone who just uses water for washing dishes or cooking. Do you think this is a good way to help pay for the cost of
free services? (%)
Yes 53
No 29
Uncertain/Don’t know 19
N = 2487
Conclusion
The statistics presented here are sobering. They offer a picture of post-

apartheid service delivery that is at best plagued by affordability problems
and overly aggressive bureaucrats bent on recovering costs, and at worst a
deep failure on the part of government (both local and national) to ensure an
affordable supply of essential services to all. That government has not been
closely monitoring and evaluating the scale and character of service cutoffs
and affordability is itself deeply concerning.
Perhaps the most important conclusion to draw from this survey is that there
is an urgent need to debunk the myth of a “culture of non-payment”. If, as I
have argued here, ability to pay is more important than willingness to pay,
then no amount of moralizing or threatening is going to alleviate the
payments crisis in the country. You cannot squeeze blood from a stone.
From this conclusion flow two others. First, essential services need to be
made more affordable for poor households if the promise of service access
for all is to be met. The introduction of “free services” is a step in the right
direction, as are (steeply) progressive block tariffs. However, the design and
implementation problems with free services outlined earlier remain, and stiff
resistance from middle- and upper-income rate payers to redistributional
mechanisms may make it very difficult to produce the kinds of cross-
subsidization revenue flows required at a local level to improve and expand
service delivery in low-income areas. In this case, it will be up to national
government to provide the funds needed – to make up for the dramatic cuts
that have taken place in inter-governmental transfers over the past ten years
(recent transfer increases to local government notwithstanding) – and to re-
evaluate its own fiscal priorities (e.g. the R40 billion deal for military
hardware and the February 2002 budget announcement of a R15 billion tax
cut for middle- and upper-income households).
The other conclusion that flows from the issue of affordability is the need for
major debt relief for service arrears. This is a sensitive matter, and must not
be seen to penalize those who have struggled to pay for their services in the
past, but the heartless, and perhaps unconstitutional, practices of household
evictions and water and electricity cutoffs are simply unsustainable –
socially, morally and economically.
Without some kind of reform it is likely that the backlash to cost recovery
will continue in South Africa. Numerous anti-eviction and anti-cutoff
organizations have sprung up around the country, and there have been
violent clashes with police and security personnel (e.g. over electricity
cutoffs in Tafelsig, Cape Town; over electricity cutoffs in Soweto; and over
evictions in Chatsworth). In many cases community resistance has been met
with bullets, tear gas, arrests and serious injury.
How these tensions unfold in the future will depend in large part on
government’s approach to cost recovery and service affordability in the
future.
Acknowledgements
Thanks are due to Meshack Khosa for his assistance with the design of the
service delivery questions in the survey and for his support for this project
from within the HSRC. Thanks also to Anneke Jordan of the HSRC for her
assistance with the data set and to Bob Mattes with advice on extrapolating
the data figures to the household level.
References
Ahmad, Junaid. "Funding the Metropolitan Areas of South Africa." Finance
and Development, September, 1995
ANC (African National Congress). The Reconstruction and Development
Programme. Johannesburg: Umyanyano Publications, 1994.
City of Cape Town, Proposed Tariff Reports for the 2001/02 Financial Year:
Addendum W-D, May, 2001.
DCD (Department of Constitutional Development), Project Viability Report
– March 1998, accessed at the DCD website at
www.local.gov.za/DCD/dcdlibrary/pro/pvindex6_98.html
Deedat, Hameda, John Pape and Msokoli Qotole, Block Tariffs or Blocked
Access? The Greater Hermanus Water Conservation Programme, Occasional
Paper Series No. 5, Municipal Services Project: Cape Town, 2001
DEFRA (Department for Environment, Food & Rural Affairs [UK]), Water
Industry Act 1999: Delivering the Government's Objectives. London, 1999.
Desai, Ashwin. The Poors of Chatsworth: Race, Class and Social
Movements in Post-Apartheid South Africa, Durban: Madiba Publishers,
2001.
DME (Department of Minerals and Energy), Draft White Paper on the
Energy Policy of the Republic of South Africa, Pretoria: Government
Printers, 1998.
Eberhard, Anton and Clive van Horen. Poverty and Power: Energy and the
South African State. Johannesburg: Pluto Press, 1995.
Eskom. “An Analysis of the Implications of Supply Capacity Limitations in

Low Income Residential Areas”. Mimeo, 1996.
---. Annual Report 2000: African and Globally Competitive, Kagiso BM
Printing, Johannesburg, 2001.
Fiil-Flynn, Maj. The Electricity Crisis in Soweto, Occasional Paper Series
No. 4, Municipal Services Project: Cape Town, 2001.
Johnson, R.W. “Not so Close to Their Hearts: An Investigation into the Non-
payment of Rates, Rents and Service Charges in South Africa’s Towns and
Cities”, Helen Suzman Foundation Special Reports, Johannesburg, 1999.
McDonald, David A. and Laïla Smith, Privatizing Cape Town: Service
Delivery and Policy Reforms Since 1996, Occasional Paper Series No. 7,
Municipal Services Project: Cape Town, 2002.
IWRA (International Water Resources Association), “Update”, July 2001.
Kasrils, Ronnie. Minister of Water and Affairs and Forestry Budget Speech
to Parliament, May 15, mimeo, 2001.
Mbeki, Thabo. President’s State of the Nation Addres - February 8, 2002, as
reprinted in the Cape Argus, February 9, 2002.
Ramphele, Mamphela. A Bed Called Home: Life in the Migrant Labour
Hostels of Cape Town. Cape Town: David Philip, 1993.
RSA (Republic of South Africa), Municipal Infrastructure Investment
Framework. Pretoria: Government of South Africa, 1995.
---. Briefing by the Parliamentary Portfolio Committee on Minerals and
Energy, March 6, mimeo, 2002.
Endnotes
1. The Department of Constitutional Development (now the Department of
Provincial and Local Government) ran a series of questionnaires with local
authorities from late-1995 to mid-1998 on issues of cost recovery rates,
service cutoffs, and debt levels, but these surveys relied entirely on official
local government statistics. Moreover, these statistics were highly unreliable
due to the fragmented nature of local government at the time and due to the
fact that as few as 47% of municipalities bothered to file their reports, with a
high of only 76% of municipalities reporting in June 1998 (DCD 1998). The
only other national survey of this nature was conducted by the Helen Suzman
Foundation (Johnson 1999), but this survey was focussed primarily on

urban/town areas and was biased in terms of sampling towards the Gauteng
area (where it was deemed non-payment for services was highest). Most
importantly, the survey by the Helen Suzman Foundation did not benefit
from any of the detailed case study research material used to cross-evaluate
our survey results.
2. The following methodology notes accompany the HSRC'S National
Opinion Survey in July 2001, from which the questions used in this chapter
were included: “The Human Sciences Research Council (HSRC) has for
several years been conducting regular national surveys on public opinion.
Topics that have been investigated included satisfaction with service
delivery, perceived national priorities, political preferences and the economy.
The survey instrument comprised a questionnaire containing questions on a
variety of themes. It was divided into different topics and the duration of
interviews of respondents was between 60 and 90 minutes. A sample of 2
704 respondents was selected throughout South Africa in clusters of eight
households situated in 338 Primary Sampling Units (PSU's)/enumerator
areas (EA's) as determined from the 1996 census. In order to ensure adequate
representation in the sample from each province and from each of the four
dominant population groups, the sample was explicitly stratified by province
and urban/rural locations. This added up to 18 strata (see below).
Disproportional samples were drawn from less populated provinces such as
the Northern Cape, Free State, Mpumalanga and North West.
Number of Primary Sampling Units/EA's per province and strata.
EC FS GT KZN MPL NC NP NW WC
URBAN
1
4
2
1
5
6
2
4
1
2
2
1 4
1
1 29
RURAL
2
5 9 2
3
2
1
8 9
2
8
1
9 4
TOTAL
3
9
3
0
5
8
5
6
3
0
3
0
3
2
3
0 33
The realised sample [2530] was only slightly less than the intended 2 704. In
terms of province and population group, the spread was sufficiently wide to
facilitate statistical generalizations about opinions prevailing within each
province and amongst persons of each of the four main population groups.
Each case was then weighted so that the resultant weighted dataset would
approximate the distribution of the population of South Africa in terms of
population group, province, gender and educational qualification.”
3. Basic Water Provision for All by 2008: Kasrils, Sapa press release,

February 12 2002; Electrification Plan ‘Will Need Huge Subsidies’, Business
Day, March 7, 2002.
4. Quote taken from a half-page advertisement by Eskom in the Weekly
Mail&Guardian, March 15-21, 2002.
5.According to the International Water Resources Association (IWRA 2001),
the average water price in South Africa is US$0.34 per kilolitre compared to
US$0.37 in Canada, US$0.52 in the United States, and US$1.11 in the
United Kingdom.
6. It is industrial users who benefit the most from electricity subsidies,
however, with the manufacturing sector paying an average of 12.83c/kwh
and the mining sector 12.32c/kwh. Moreover, special deals are sometimes
negotiated with large consumers (e.g., Alusaf) with prices as low as
3.5c/kwh (subject to special conditions and certain hours of the day) (Fiil-
Flynn 2001, 6).
7. He later goes on to say, however, that the “non-payment crisis is all too
comprehensible” when seen in the context of worsening household incomes
and unemployment (Johnson 1999, 49-50). Moreover, his own data
contradicts his “culture of non-payment” thesis. When respondents were
asked why they think people do not pay for services, unemployment (59%)
and inability to pay (59%) top the list of reasons, with “service boycotts”
(7%) and “No one else is paying why should I” (8%) barely registering
(Johnson 1999, 72). In the end, though, Johnson (1999, 95) simply does not
believe the people that told him that they cannot afford to pay for services:
“The nearer we pressed towards the really hard questions about non-
payment, the greater this evasive smokescreen grew so that by the end it was
quite clear that a very large number of our respondents were not telling the
truth.”
8. For example, approximately one third of the R2.1 billion owed to the Cape
Town City Council for services is from businesses, many of which owe more
than R100,000 (“Council Takes Aggressive Action to Claim Arrears”, Cape
Argus, February 26, 2002).
9. For example, the following letters to the editor were sent to the Cape
Argus on February 26, 2002, in response to an article critiquing the unfair
distribution of municipal resources in the upper-income surburb of
Durbanville as compared to that of the low-income township of Khayeltisha
– both in Cape Town: “What articles like this always fail to point out is that
all the people living in Kenridge Road [in Durbanville] pay all their rates and
taxes, whereas very few of the people in Khayelitsha pay anything at all. In
fact, those of us who live in the Tygerberg are subsidizing Khayelitsha to a
very great extent and our suburbs do not have as high a quality of upkeep as

we are used to.”; “The Cape Argus makes no comparison of the rates paid by
residents in Durbanville and those in Khayelitsha….only about 10% of what
we pay in rates is actually spent on services in our area – the balance of 90%
going to more needy areas. What is going on here?”; What a stupid article
about different suburbs. You thankfully highlight the areas in both arrears.”
10. “Khayelitsha is City’s Top Debt Headache”, Cape Argus, February 20,
2002.
11.Electricity arrears may be lower due to the fact that all new electricity
connections are installed with pre-paid meters which do not allow for a
customer to go into debt.
12. The more common form of service cutoffs during the apartheid era came
in the form of housing evictions which were done largely for political
reasons as opposed to non-payment of municipal services (although non-
payment of rent in council houses constituted grounds for evictions in many
cases (e.g. Desai 2001)). In the 1980s the highly volatile nature of anti-
apartheid protests – particularly in urban townships – made it both dangerous
and politically unwise in an era of neo-apartheid reforms to attempt service
cutoffs. Nevertheless, de facto cutoffs took place due to the high rates of
infrastructure breakdown and the lack of proper maintenance.
13. Data collection by the Department of Constitutional Development from
1996-1998 also showed quite dramatic cutoff rates, with national figures
ranging from 50,000 to 90,000 electricity cutoffs every three months over
that period, with the actual figures likely being much higher due to the fact
that as few as 47% of municipalities filed reports (DCD 1998).
14. This figure based on an adult population over the age of 18 years in
South Africa of approximately 25 million people (i.e. those who were
eligible for selection for this survey). Thirteen percent of this equals 3.25
million.
15. It should also be noted that most low-income households have more than
three household members which means that the figures provided here may
substantially underestimate the actual number of individuals affected.
16.In Cape Town, eviction notices are being sent for as little as R250 in
service arrears (“Rates Issues Clarified”, Cape Argus, March 13, 2002).
17. Section 1.4 of the UK Act states: “The Act removes water companies'
powers to disconnect water supply for non-payment, or to limit the supply
with the intention of enforcing payment, from a list of different premises.
These premises are: private dwelling houses, caravans, houseboats, houses in

multiple occupation and sheltered accommodation (where these are
someone's main home); children's homes, residential care homes; prisons
and detention centres; schools, premises used for children's daycare,
institutions of further and higher education; hospitals, nursing homes, GPs'
and dentists' surgeries (including surgeries se up as primary care pilot
schemes); and premises occupied by the emergency services.” The Act goes
on to state (in Sections 1.6 and 1.7) that “No person should have to face the
prospect of cutting down on essential water use for washing, cooking and
cleaning because they cannot afford their bill….The Government is
therefore using regulations to take forward measures which it considers are
essential to protect vulnerable people from hardship”. I am indebted to Alex
Loftus for this reference.
18. More recently, however, Eskom has begun to show concern about the lower-than-
expected rates of electricity usage in low-income households – in the order of 50-100
kwh/month – no doubt due to the high costs of electricity relative to household income
and a further indication of the kind of self-imposed cutbacks and cutoffs that are taking
place in the country due to issues of affordability (“Cost Cutting Helps Eskom Profit up
37%”, Cape Times, March 7, 2002).