Embed Size (px)
Citation preview
DISCLOSURE APPENDIX AT THE BACK OF THIS REPORT CONTAINS IMPORTANT DISCLOSURES, ANALYST CERTIFICATIONS, AND THE STATUS OF NON-US ANALYSTS. US Disclosure: Credit Suisse does and seeks to do business with companies covered in its research reports. As a result, investors should be aware that the Firm may have a conflict of interest that could affect the objectivity of this report. Investors should consider this report as only a single factor in making their investment decision.
CREDIT SUISSE SECURITIES RESEARCH & ANALYTICS BEYOND INFORMATION®
Client-Driven Solutions, Insights, and Access
04 November 2014
Asia Pacific/India
Equity Research
Auto Parts & Equipment (Automobiles & Components IN (Asia)/Media IN (Asia))
India Auto Components Sector THEME
On the fast track
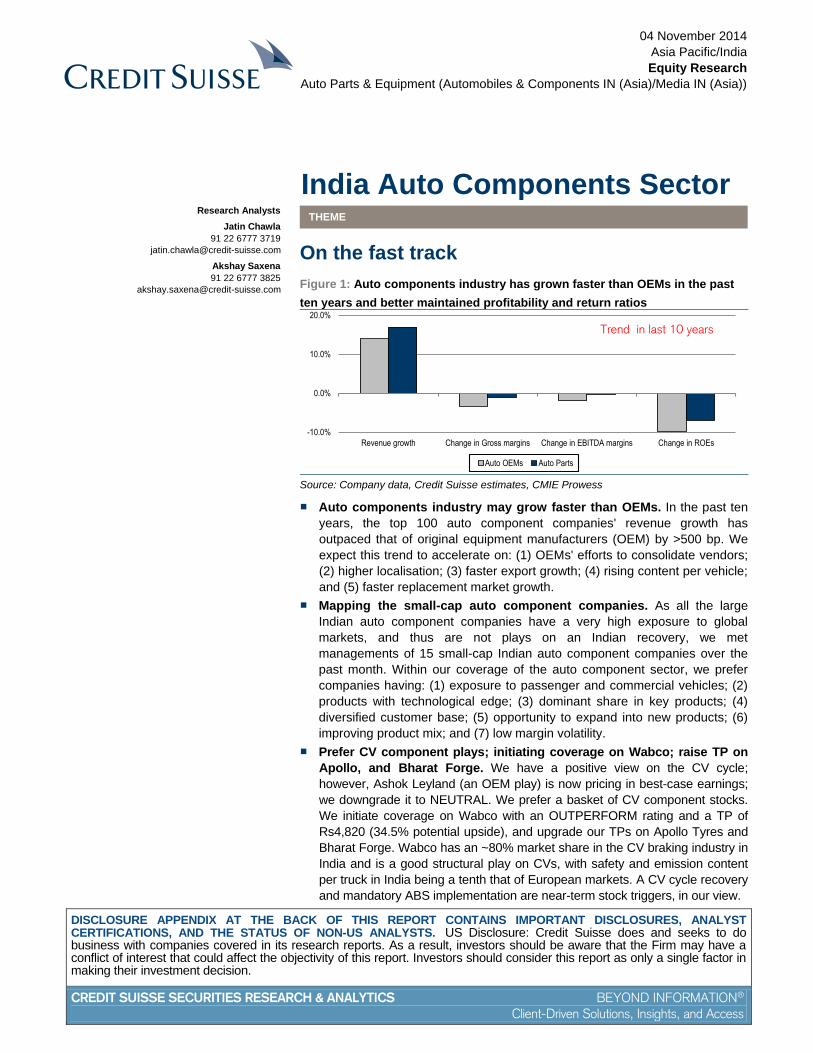
Figure 1: Auto components industry has grown faster than OEMs in the past
ten years and better maintained profitability and return ratios
-10.0%
0.0%
10.0%
20.0%
Revenue growth Change in Gross margins Change in EBITDA margins Change in ROEs
Auto OEMs Auto Parts
Trend in last 10 years
Source: Company data, Credit Suisse estimates, CMIE Prowess
■ Auto components industry may grow faster than OEMs. In the past ten
years, the top 100 auto component companies' revenue growth has
outpaced that of original equipment manufacturers (OEM) by >500 bp. We
expect this trend to accelerate on: (1) OEMs' efforts to consolidate vendors;
(2) higher localisation; (3) faster export growth; (4) rising content per vehicle;
and (5) faster replacement market growth.
■ Mapping the small-cap auto component companies. As all the large
Indian auto component companies have a very high exposure to global
markets, and thus are not plays on an Indian recovery, we met
managements of 15 small-cap Indian auto component companies over the
past month. Within our coverage of the auto component sector, we prefer
companies having: (1) exposure to passenger and commercial vehicles; (2)
products with technological edge; (3) dominant share in key products; (4)
diversified customer base; (5) opportunity to expand into new products; (6)
improving product mix; and (7) low margin volatility.
■ Prefer CV component plays; initiating coverage on Wabco; raise TP on
Apollo, and Bharat Forge. We have a positive view on the CV cycle;
however, Ashok Leyland (an OEM play) is now pricing in best-case earnings;
we downgrade it to NEUTRAL. We prefer a basket of CV component stocks.
We initiate coverage on Wabco with an OUTPERFORM rating and a TP of
Rs4,820 (34.5% potential upside), and upgrade our TPs on Apollo Tyres and
Bharat Forge. Wabco has an ~80% market share in the CV braking industry in
India and is a good structural play on CVs, with safety and emission content
per truck in India being a tenth that of European markets. A CV cycle recovery
and mandatory ABS implementation are near-term stock triggers, in our view.
Research Analysts
Jatin Chawla
91 22 6777 3719
Akshay Saxena
91 22 6777 3825
04 November 2014
India Auto Components Sector 2
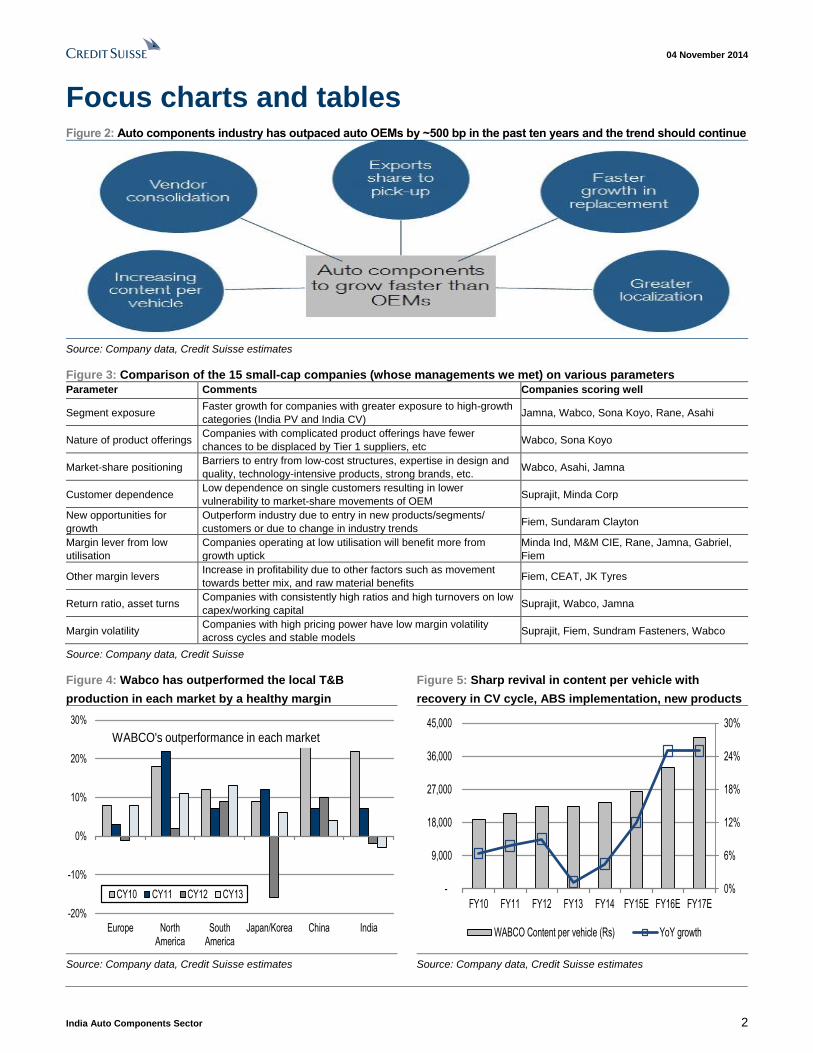
Focus charts and tables Figure 2: Auto components industry has outpaced auto OEMs by ~500 bp in the past ten years and the trend should continue
Source: Company data, Credit Suisse estimates
Figure 3: Comparison of the 15 small-cap companies (whose managements we met) on various parameters
Parameter Comments Companies scoring well
Segment exposure Faster growth for companies with greater exposure to high-growth
categories (India PV and India CV) Jamna, Wabco, Sona Koyo, Rane, Asahi
Nature of product offerings Companies with complicated product offerings have fewer
chances to be displaced by Tier 1 suppliers, etc Wabco, Sona Koyo
Market-share positioning Barriers to entry from low-cost structures, expertise in design and
quality, technology-intensive products, strong brands, etc. Wabco, Asahi, Jamna
Customer dependence Low dependence on single customers resulting in lower
vulnerability to market-share movements of OEM Suprajit, Minda Corp
New opportunities for
growth
Outperform industry due to entry in new products/segments/
customers or due to change in industry trends Fiem, Sundaram Clayton
Margin lever from low
utilisation
Companies operating at low utilisation will benefit more from
growth uptick
Minda Ind, M&M CIE, Rane, Jamna, Gabriel,
Fiem
Other margin levers Increase in profitability due to other factors such as movement
towards better mix, and raw material benefits Fiem, CEAT, JK Tyres
Return ratio, asset turns Companies with consistently high ratios and high turnovers on low
capex/working capital Suprajit, Wabco, Jamna
Margin volatility Companies with high pricing power have low margin volatility
across cycles and stable models Suprajit, Fiem, Sundram Fasteners, Wabco
Source: Company data, Credit Suisse
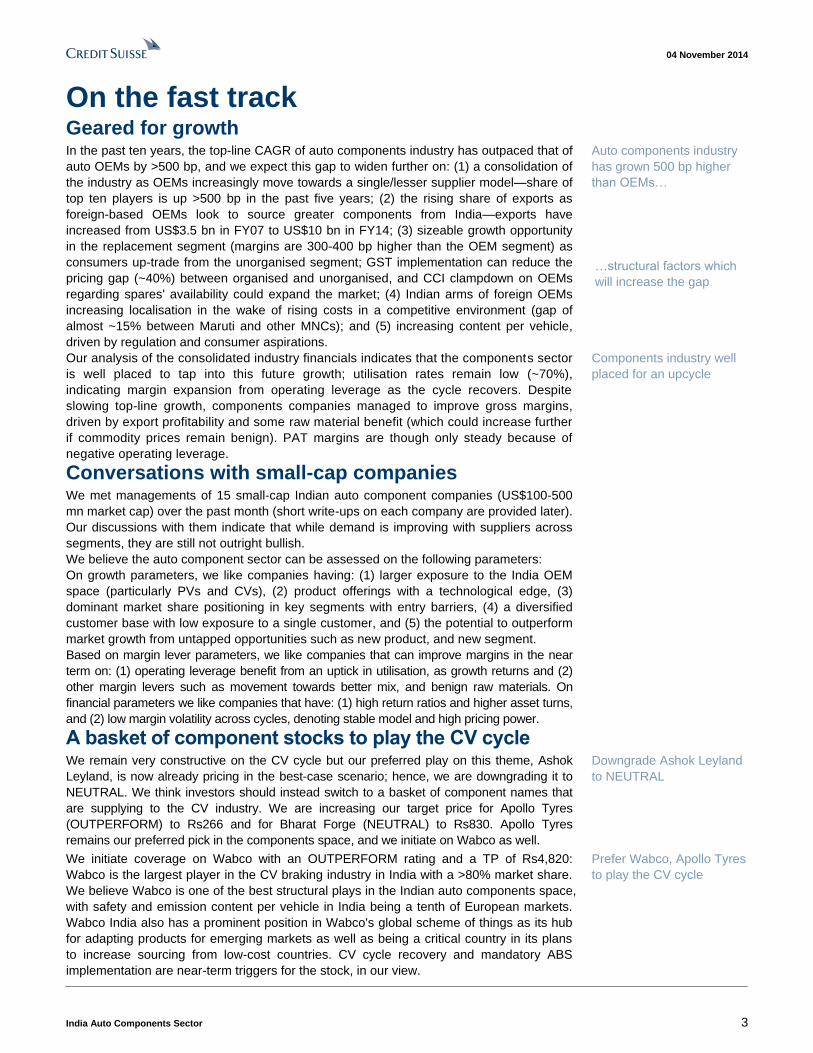
Figure 4: Wabco has outperformed the local T&B
production in each market by a healthy margin
Figure 5: Sharp revival in content per vehicle with
recovery in CV cycle, ABS implementation, new products
-20%
-10%
0%
10%
20%
30%
Europe NorthAmerica
SouthAmerica
Japan/Korea China India
CY10 CY11 CY12 CY13
WABCO's outperformance in each market
0%
6%
12%
18%
24%
30%
-
9,000
18,000
27,000
36,000
45,000
FY10 FY11 FY12 FY13 FY14 FY15E FY16E FY17E
WABCO Content per vehicle (Rs) YoY growth
Source: Company data, Credit Suisse estimates Source: Company data, Credit Suisse estimates
04 November 2014
India Auto Components Sector 3
On the fast track Geared for growth In the past ten years, the top-line CAGR of auto components industry has outpaced that of
auto OEMs by >500 bp, and we expect this gap to widen further on: (1) a consolidation of
the industry as OEMs increasingly move towards a single/lesser supplier model—share of
top ten players is up >500 bp in the past five years; (2) the rising share of exports as
foreign-based OEMs look to source greater components from India—exports have
increased from US$3.5 bn in FY07 to US$10 bn in FY14; (3) sizeable growth opportunity
in the replacement segment (margins are 300-400 bp higher than the OEM segment) as
consumers up-trade from the unorganised segment; GST implementation can reduce the
pricing gap (~40%) between organised and unorganised, and CCI clampdown on OEMs
regarding spares' availability could expand the market; (4) Indian arms of foreign OEMs
increasing localisation in the wake of rising costs in a competitive environment (gap of
almost ~15% between Maruti and other MNCs); and (5) increasing content per vehicle,
driven by regulation and consumer aspirations.
Our analysis of the consolidated industry financials indicates that the components sector
is well placed to tap into this future growth; utilisation rates remain low (~70%),
indicating margin expansion from operating leverage as the cycle recovers. Despite
slowing top-line growth, components companies managed to improve gross margins,
driven by export profitability and some raw material benefit (which could increase further
if commodity prices remain benign). PAT margins are though only steady because of
negative operating leverage.
Conversations with small-cap companies We met managements of 15 small-cap Indian auto component companies (US$100-500
mn market cap) over the past month (short write-ups on each company are provided later).
Our discussions with them indicate that while demand is improving with suppliers across
segments, they are still not outright bullish.
We believe the auto component sector can be assessed on the following parameters:
On growth parameters, we like companies having: (1) larger exposure to the India OEM
space (particularly PVs and CVs), (2) product offerings with a technological edge, (3)
dominant market share positioning in key segments with entry barriers, (4) a diversified
customer base with low exposure to a single customer, and (5) the potential to outperform
market growth from untapped opportunities such as new product, and new segment.
Based on margin lever parameters, we like companies that can improve margins in the near
term on: (1) operating leverage benefit from an uptick in utilisation, as growth returns and (2)
other margin levers such as movement towards better mix, and benign raw materials. On
financial parameters we like companies that have: (1) high return ratios and higher asset turns,
and (2) low margin volatility across cycles, denoting stable model and high pricing power.
A basket of component stocks to play the CV cycle We remain very constructive on the CV cycle but our preferred play on this theme, Ashok
Leyland, is now already pricing in the best-case scenario; hence, we are downgrading it to
NEUTRAL. We think investors should instead switch to a basket of component names that
are supplying to the CV industry. We are increasing our target price for Apollo Tyres
(OUTPERFORM) to Rs266 and for Bharat Forge (NEUTRAL) to Rs830. Apollo Tyres
remains our preferred pick in the components space, and we initiate on Wabco as well.
We initiate coverage on Wabco with an OUTPERFORM rating and a TP of Rs4,820:
Wabco is the largest player in the CV braking industry in India with a >80% market share.
We believe Wabco is one of the best structural plays in the Indian auto components space,
with safety and emission content per vehicle in India being a tenth of European markets.
Wabco India also has a prominent position in Wabco's global scheme of things as its hub
for adapting products for emerging markets as well as being a critical country in its plans
to increase sourcing from low-cost countries. CV cycle recovery and mandatory ABS
implementation are near-term triggers for the stock, in our view.
Auto components industry
has grown 500 bp higher
than OEMs…
…structural factors which
will increase the gap
Components industry well
placed for an upcycle
Downgrade Ashok Leyland
to NEUTRAL
Prefer Wabco, Apollo Tyres
to play the CV cycle
04 November 2014
India Auto Components Sector 4
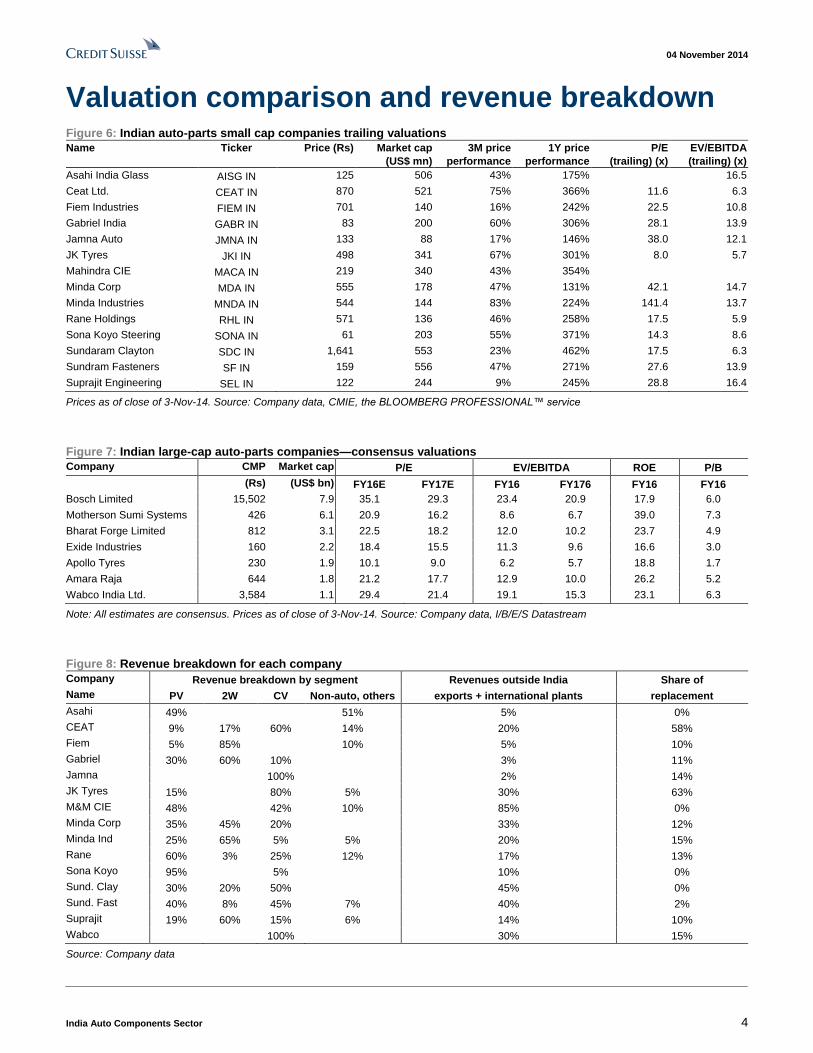
Valuation comparison and revenue breakdown Figure 6: Indian auto-parts small cap companies trailing valuations
Name Ticker Price (Rs) Market cap
(US$ mn)
3M price
performance
1Y price
performance
P/E
(trailing) (x)
EV/EBITDA
(trailing) (x)
Asahi India Glass AISG IN 125 506 43% 175% 16.5
Ceat Ltd. CEAT IN 870 521 75% 366% 11.6 6.3
Fiem Industries FIEM IN 701 140 16% 242% 22.5 10.8
Gabriel India GABR IN 83 200 60% 306% 28.1 13.9
Jamna Auto JMNA IN 133 88 17% 146% 38.0 12.1
JK Tyres JKI IN 498 341 67% 301% 8.0 5.7
Mahindra CIE MACA IN 219 340 43% 354%
Minda Corp MDA IN 555 178 47% 131% 42.1 14.7
Minda Industries MNDA IN 544 144 83% 224% 141.4 13.7
Rane Holdings RHL IN 571 136 46% 258% 17.5 5.9
Sona Koyo Steering SONA IN 61 203 55% 371% 14.3 8.6
Sundaram Clayton SDC IN 1,641 553 23% 462% 17.5 6.3
Sundram Fasteners SF IN 159 556 47% 271% 27.6 13.9
Suprajit Engineering SEL IN 122 244 9% 245% 28.8 16.4
Prices as of close of 3-Nov-14. Source: Company data, CMIE, the BLOOMBERG PROFESSIONAL™ service
Figure 7: Indian large-cap auto-parts companies—consensus valuations
Company CMP Market cap P/E EV/EBITDA ROE P/B
(Rs) (US$ bn) FY16E FY17E FY16 FY176 FY16 FY16
Bosch Limited 15,502 7.9 35.1 29.3 23.4 20.9 17.9 6.0
Motherson Sumi Systems 426 6.1 20.9 16.2 8.6 6.7 39.0 7.3
Bharat Forge Limited 812 3.1 22.5 18.2 12.0 10.2 23.7 4.9
Exide Industries 160 2.2 18.4 15.5 11.3 9.6 16.6 3.0
Apollo Tyres 230 1.9 10.1 9.0 6.2 5.7 18.8 1.7
Amara Raja 644 1.8 21.2 17.7 12.9 10.0 26.2 5.2
Wabco India Ltd. 3,584 1.1 29.4 21.4 19.1 15.3 23.1 6.3
Note: All estimates are consensus. Prices as of close of 3-Nov-14. Source: Company data, I/B/E/S Datastream
Figure 8: Revenue breakdown for each company
Company Revenue breakdown by segment Revenues outside India Share of
Name PV 2W CV Non-auto, others exports + international plants replacement
Asahi 49% 51% 5% 0%
CEAT 9% 17% 60% 14% 20% 58%
Fiem 5% 85% 10% 5% 10%
Gabriel 30% 60% 10% 3% 11%
Jamna 100% 2% 14%
JK Tyres 15% 80% 5% 30% 63%
M&M CIE 48% 42% 10% 85% 0%
Minda Corp 35% 45% 20% 33% 12%
Minda Ind 25% 65% 5% 5% 20% 15%
Rane 60% 3% 25% 12% 17% 13%
Sona Koyo 95% 5% 10% 0%
Sund. Clay 30% 20% 50% 45% 0%
Sund. Fast 40% 8% 45% 7% 40% 2%
Suprajit 19% 60% 15% 6% 14% 10%
Wabco 100% 30% 15%
Source: Company data
04 November 2014
India Auto Components Sector 5
Table of contents Geared for growth 6
Auto-parts to continue growing faster than OEMs 6 Auto OEMs entering an upcycle… 10 …parts companies well positioned to capitalise 11
Conversations with small-cap companies 14 Growth outlook improving but a full-blown recovery still some time away 14 Framework to assess auto-component plays 15 (1) Segment exposure 15 (2) Nature of product offering 16 (3) Market-share positioning 17 (4) Customer dependence 18 (5) Potential to outperform from new opportunities 19 (6) Operating leverage lever from utilisation pick-up 19 (7) Other margin levers such as mix, raw materials 20 (8) Higher return ratios and higher asset turns 20 (9) Lower margin volatility 22
A basket of component stocks to play CV cycle 23 CV cycle is recovering… 23 ..but OEM Valuations already reflect that 25 Prefer basket of CV focused auto-component plays 26
Companies 27 Wabco India Ltd. (WABC.BO / WIL IN) 28
Structural play in a cyclical industry 28 Wabco India Ltd. WABC.BO / WIL IN 29 About the company 30 High entry barriers and strong growth prospects is a unique combination 31 Strong structural story in content per vehicle 32 Initiate with an OUTPERFORM and a TP of Rs4,820 36 Investment risks 37
Apollo Tyres (APLO.BO / APTY IN) 38 Raw material tailwinds to continue 38
Bharat Forge Limited (BFRG.BO / BHFC IN) 39 Strong growth but elevated multiples 39
Ashok Leyland Ltd (ASOK.BO / AL IN) 40 Strong recovery already priced in 40
Company visit notes 41 Suprajit Engineering (Not Rated) 42 JK Tyres (Not Rated) 44 Jamna Auto (Not Rated) 46 Fiem Industries (Not Rated) 48 Gabriel India Ltd. (Not Rated) 50 Sona Koyo Steering Systems (Not Rated) 52 Minda Corporation Ltd. (Not Rated) 54 CEAT Ltd. (Not Rated) 56 Minda Industries Ltd. (Not Rated) 58 Sundram Fasteners (Not Rated) 60 Rane Holdings Ltd. (Not Rated) 62 Sundaram Clayton (Not Rated) 64 Asahi India Glass (Not Rated) 66 Mahindra CIE (Not Rated) 67
04 November 2014
India Auto Components Sector 6
Geared for growth In the past ten years, top-line CAGR of auto components industry outpaced that of auto
OEMs by >500 bp, and we expect this gap to widen further on: (1) a consolidation of the
industry as OEMs increasingly move towards a single/lesser supplier model—the share of
the top ten players is up >500 bp in the past five years; (2) the rising share of exports as
foreign-based OEMs look to source greater components from India—exports have
increased from US$3.5 bn in FY07 to US$10 bn in FY14; (3) sizeable growth opportunity
in the replacement segment (margins are 300-400 bp higher than the OEM segment) as
consumers up-trade from the unorganised segment; GST implementation could reduce
pricing gap (~40%) between organised and unorganised players and CCI clampdown on
OEMs regarding spares' availability can expand the market; (4) Indian arms of foreign
OEMs increasing localisation in the wake of rising costs in a competitive environment (gap
of almost ~15% between Maruti and other MNCs); and (5) the increasing content per
vehicle, driven by regulation and consumer aspirations.
Our analysis of the consolidated industry financials indicates that the components sector is well
placed to tap into this future growth; utilisation rates remain low (~70%), indicating margin
expansion from operating leverage as the cycle recovers. Despite slowing top-line growth,
components companies manage to improve gross margins, driven by export profitability and
some raw material benefits (which could increase further if commodity prices remain benign).
PAT margins are though only steady because of negative operating leverage.
Auto-parts to continue growing faster than OEMs
Over the past ten years, the top 100 auto-components companies have witnessed a
CAGR of 17% compared with a ~12% CAGR for the auto OEM industry, thus
outperforming the industry by ~500 bp. While doing so these companies have managed to
maintain their profitability, with EBITDA margins remaining stable at 13% and PAT
margins at 5%. In our view, the outperformance of the auto parts industry could increase
further in the next few years on account of the following factors
#1 Industry consolidation
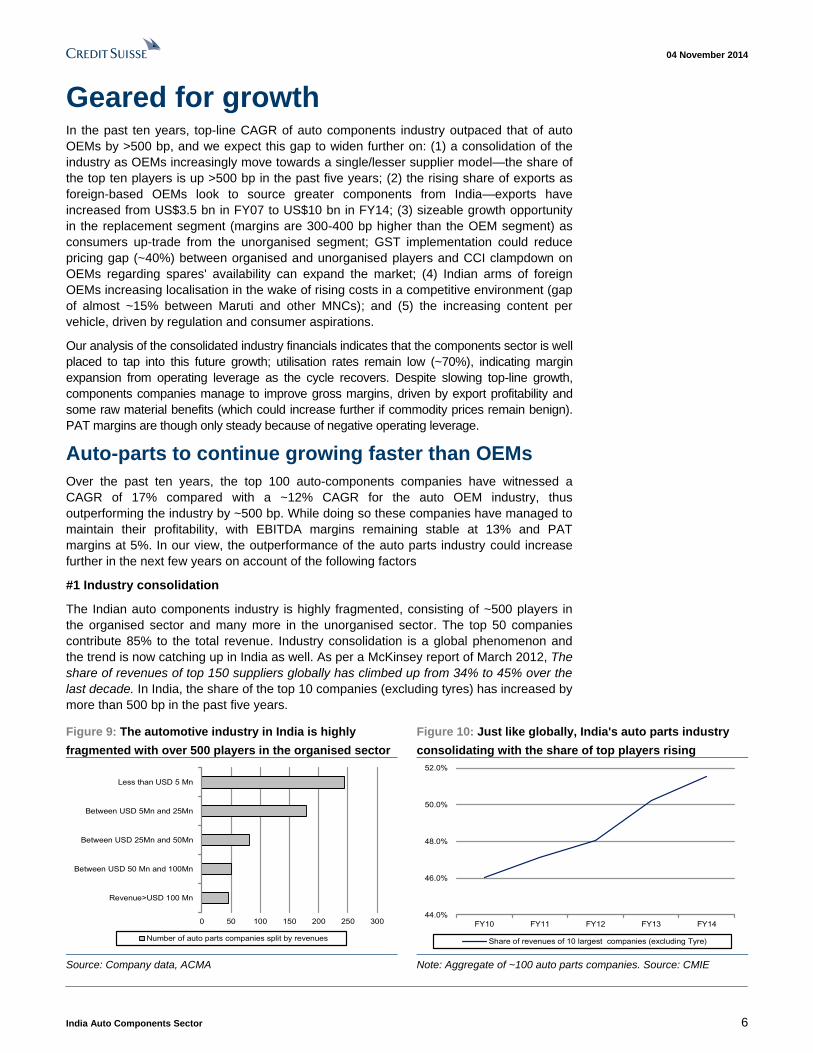
The Indian auto components industry is highly fragmented, consisting of ~500 players in
the organised sector and many more in the unorganised sector. The top 50 companies
contribute 85% to the total revenue. Industry consolidation is a global phenomenon and
the trend is now catching up in India as well. As per a McKinsey report of March 2012, The
share of revenues of top 150 suppliers globally has climbed up from 34% to 45% over the
last decade. In India, the share of the top 10 companies (excluding tyres) has increased by
more than 500 bp in the past five years.
Figure 9: The automotive industry in India is highly
fragmented with over 500 players in the organised sector
Figure 10: Just like globally, India's auto parts industry
consolidating with the share of top players rising
0 50 100 150 200 250 300
Revenue>USD 100 Mn
Between USD 50 Mn and 100Mn
Between USD 25Mn and 50Mn
Between USD 5Mn and 25Mn
Less than USD 5 Mn
Number of auto parts companies split by revenues
44.0%
46.0%
48.0%
50.0%
52.0%
FY10 FY11 FY12 FY13 FY14
Share of revenues of 10 largest companies (excluding Tyre)
Source: Company data, ACMA Note: Aggregate of ~100 auto parts companies. Source: CMIE
04 November 2014
India Auto Components Sector 7
The key reasons for this are:
■ OEMs reducing their supplier base to cut costs: A number of OEMs have
announced plans to cut suppliers. M&M recently announced that it is reducing the total
number of its suppliers from 650 to 450, and reducing its supplier base by 10% each
year. This would enable it to cut the costs of purchasing from component makers, as
the single supplier would now have bigger scale. This also enables the OEM to deal
with just one supplier rather than multiple players for a single component. Similarly,
Tata Motors too has also indicated its intention of bringing down its suppliers from
1,400 to 400. For example, Jamna Auto, which is Tata Motors' supplier of leaf springs,
has been asked to increase its share of business from 55% to 65%.
■ Move towards platform consolidation: One reason that necessitated the need for
larger numbers of suppliers was the wide number of designs required for each
component given the large number of models of each OEM. As each manufacturer had
multiple models, it traditionally required different suppliers to cater to the components for
each of these. So, despite having consolidated players on the auto OEM side, there were
far too many models and with each model having a different design and thus insufficient
economies of scale. But now with car manufacturers moving towards a modular design
and platform consolidation (a number of models sharing the same platform), economies
of scale should become more relevant. Globally, there is a trend towards commonality:
common platforms, common parts. This should also help larger auto component
companies and also result in share swinging from the unorganised to organised.
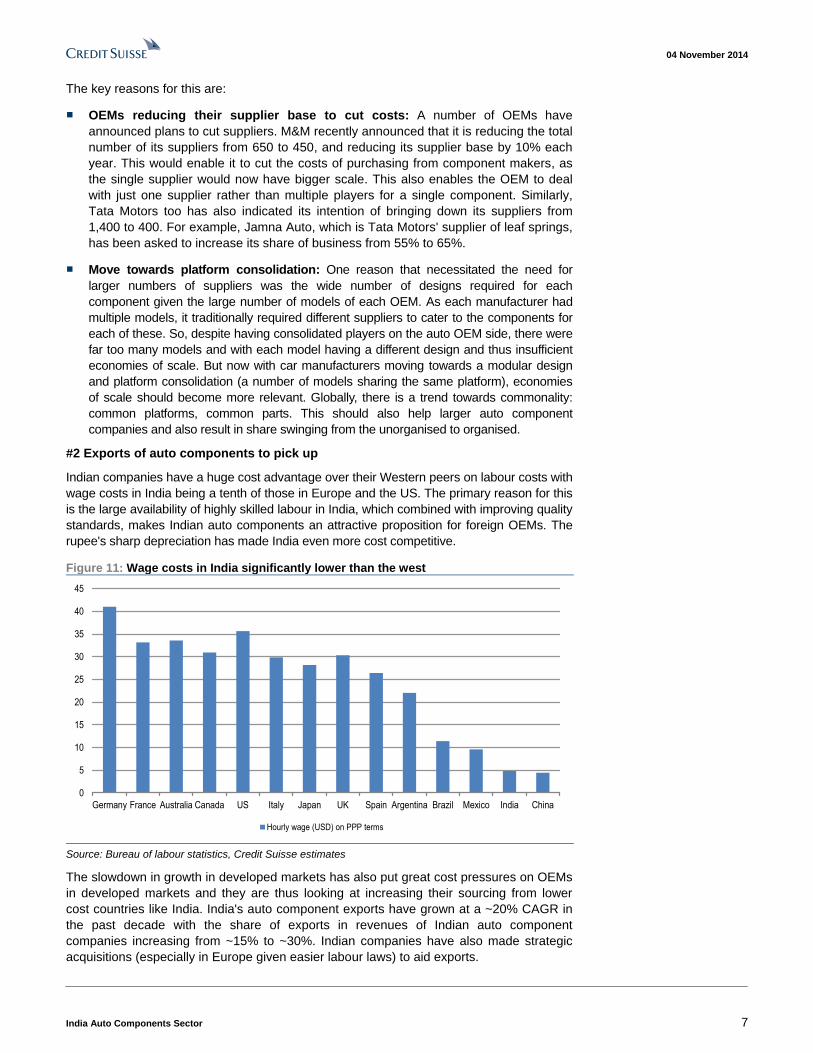
#2 Exports of auto components to pick up
Indian companies have a huge cost advantage over their Western peers on labour costs with
wage costs in India being a tenth of those in Europe and the US. The primary reason for this
is the large availability of highly skilled labour in India, which combined with improving quality
standards, makes Indian auto components an attractive proposition for foreign OEMs. The
rupee's sharp depreciation has made India even more cost competitive.
Figure 11: Wage costs in India significantly lower than the west
0
5
10
15
20
25
30
35
40
45
Germany France Australia Canada US Italy Japan UK Spain Argentina Brazil Mexico India China
Hourly wage (USD) on PPP terms
Source: Bureau of labour statistics, Credit Suisse estimates
The slowdown in growth in developed markets has also put great cost pressures on OEMs
in developed markets and they are thus looking at increasing their sourcing from lower
cost countries like India. India's auto component exports have grown at a ~20% CAGR in
the past decade with the share of exports in revenues of Indian auto component
companies increasing from ~15% to ~30%. Indian companies have also made strategic
acquisitions (especially in Europe given easier labour laws) to aid exports.
04 November 2014
India Auto Components Sector 8
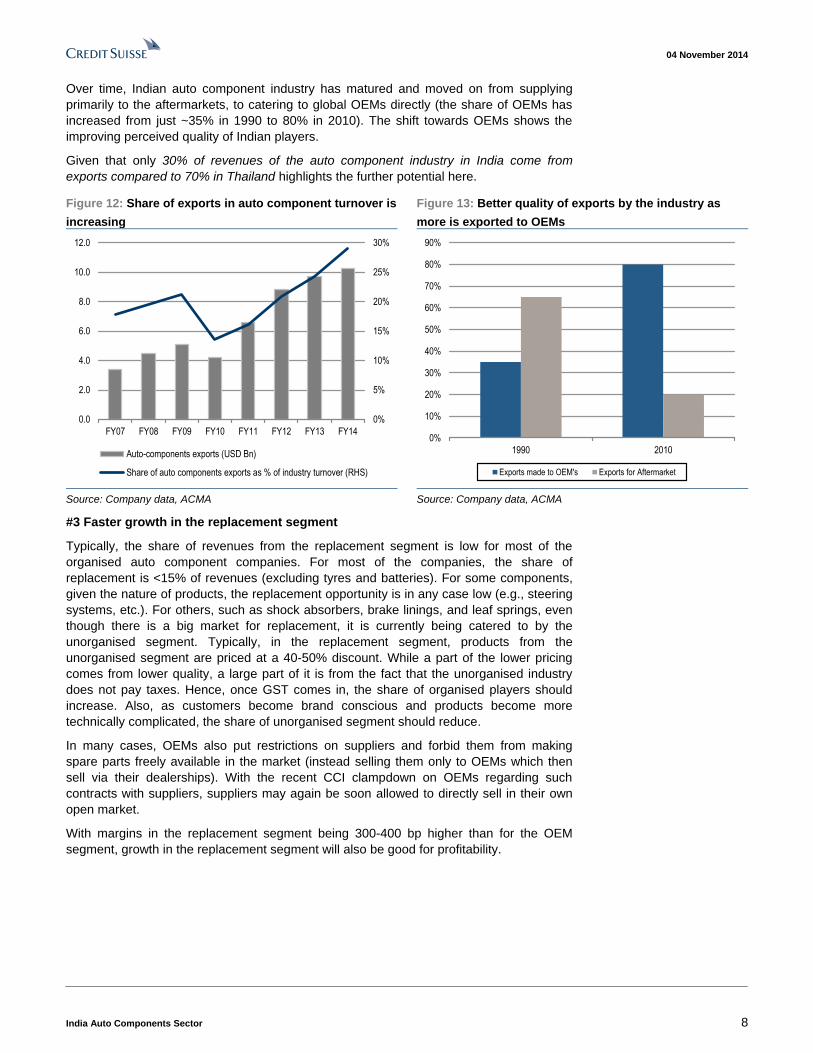
Over time, Indian auto component industry has matured and moved on from supplying
primarily to the aftermarkets, to catering to global OEMs directly (the share of OEMs has
increased from just ~35% in 1990 to 80% in 2010). The shift towards OEMs shows the
improving perceived quality of Indian players.
Given that only 30% of revenues of the auto component industry in India come from
exports compared to 70% in Thailand highlights the further potential here.
Figure 12: Share of exports in auto component turnover is
increasing
Figure 13: Better quality of exports by the industry as
more is exported to OEMs
0%
5%
10%
15%
20%
25%
30%
0.0
2.0
4.0
6.0
8.0
10.0
12.0
FY07 FY08 FY09 FY10 FY11 FY12 FY13 FY14
Auto-components exports (USD Bn)
Share of auto components exports as % of industry turnover (RHS)
0%
10%
20%
30%
40%
50%
60%
70%
80%
90%
1990 2010
Exports made to OEM's Exports for Aftermarket
Source: Company data, ACMA Source: Company data, ACMA
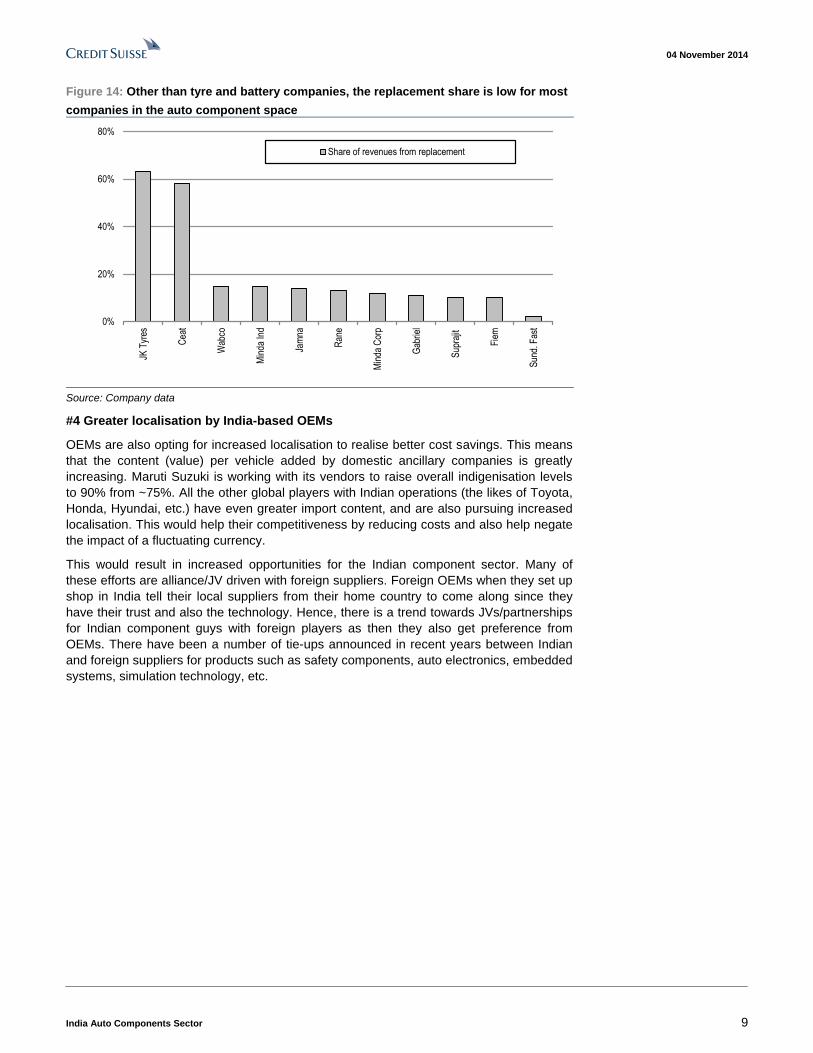
#3 Faster growth in the replacement segment
Typically, the share of revenues from the replacement segment is low for most of the
organised auto component companies. For most of the companies, the share of
replacement is <15% of revenues (excluding tyres and batteries). For some components,
given the nature of products, the replacement opportunity is in any case low (e.g., steering
systems, etc.). For others, such as shock absorbers, brake linings, and leaf springs, even
though there is a big market for replacement, it is currently being catered to by the
unorganised segment. Typically, in the replacement segment, products from the
unorganised segment are priced at a 40-50% discount. While a part of the lower pricing
comes from lower quality, a large part of it is from the fact that the unorganised industry
does not pay taxes. Hence, once GST comes in, the share of organised players should
increase. Also, as customers become brand conscious and products become more
technically complicated, the share of unorganised segment should reduce.
In many cases, OEMs also put restrictions on suppliers and forbid them from making
spare parts freely available in the market (instead selling them only to OEMs which then
sell via their dealerships). With the recent CCI clampdown on OEMs regarding such
contracts with suppliers, suppliers may again be soon allowed to directly sell in their own
open market.
With margins in the replacement segment being 300-400 bp higher than for the OEM
segment, growth in the replacement segment will also be good for profitability.
04 November 2014
India Auto Components Sector 9
Figure 14: Other than tyre and battery companies, the replacement share is low for most
companies in the auto component space
0%
20%
40%
60%
80%JK
Tyr
es
Cea
t
Wab
co
Min
da In
d
Jam
na
Ran
e
Min
da C
orp
Gab
riel
Sup
rajit
Fie
m
Sun
d. F
ast
Share of revenues from replacement
Source: Company data
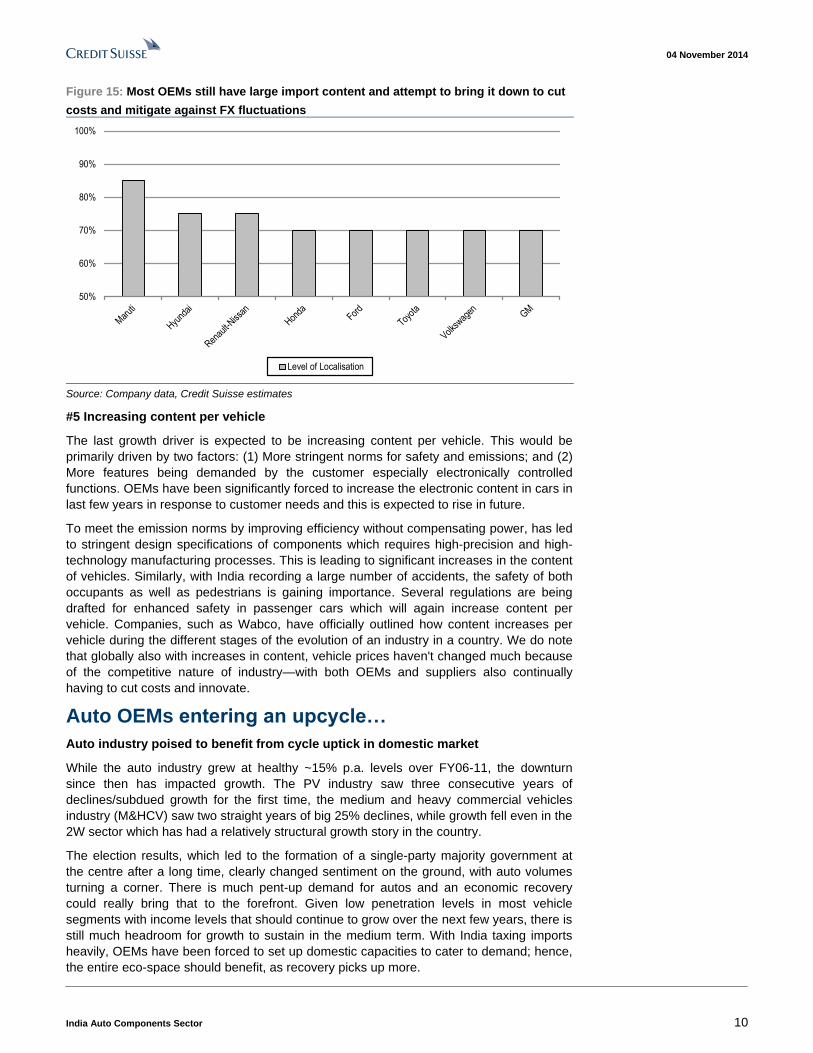
#4 Greater localisation by India-based OEMs
OEMs are also opting for increased localisation to realise better cost savings. This means
that the content (value) per vehicle added by domestic ancillary companies is greatly
increasing. Maruti Suzuki is working with its vendors to raise overall indigenisation levels
to 90% from ~75%. All the other global players with Indian operations (the likes of Toyota,
Honda, Hyundai, etc.) have even greater import content, and are also pursuing increased
localisation. This would help their competitiveness by reducing costs and also help negate
the impact of a fluctuating currency.
This would result in increased opportunities for the Indian component sector. Many of
these efforts are alliance/JV driven with foreign suppliers. Foreign OEMs when they set up
shop in India tell their local suppliers from their home country to come along since they
have their trust and also the technology. Hence, there is a trend towards JVs/partnerships
for Indian component guys with foreign players as then they also get preference from
OEMs. There have been a number of tie-ups announced in recent years between Indian
and foreign suppliers for products such as safety components, auto electronics, embedded
systems, simulation technology, etc.
04 November 2014
India Auto Components Sector 10
Figure 15: Most OEMs still have large import content and attempt to bring it down to cut
costs and mitigate against FX fluctuations
50%
60%
70%
80%
90%
100%
Level of Localisation
Source: Company data, Credit Suisse estimates
#5 Increasing content per vehicle
The last growth driver is expected to be increasing content per vehicle. This would be
primarily driven by two factors: (1) More stringent norms for safety and emissions; and (2)
More features being demanded by the customer especially electronically controlled
functions. OEMs have been significantly forced to increase the electronic content in cars in
last few years in response to customer needs and this is expected to rise in future.
To meet the emission norms by improving efficiency without compensating power, has led
to stringent design specifications of components which requires high-precision and high-
technology manufacturing processes. This is leading to significant increases in the content
of vehicles. Similarly, with India recording a large number of accidents, the safety of both
occupants as well as pedestrians is gaining importance. Several regulations are being
drafted for enhanced safety in passenger cars which will again increase content per
vehicle. Companies, such as Wabco, have officially outlined how content increases per
vehicle during the different stages of the evolution of an industry in a country. We do note
that globally also with increases in content, vehicle prices haven't changed much because
of the competitive nature of industry—with both OEMs and suppliers also continually
having to cut costs and innovate.
Auto OEMs entering an upcycle…
Auto industry poised to benefit from cycle uptick in domestic market
While the auto industry grew at healthy ~15% p.a. levels over FY06-11, the downturn
since then has impacted growth. The PV industry saw three consecutive years of
declines/subdued growth for the first time, the medium and heavy commercial vehicles
industry (M&HCV) saw two straight years of big 25% declines, while growth fell even in the
2W sector which has had a relatively structural growth story in the country.
The election results, which led to the formation of a single-party majority government at
the centre after a long time, clearly changed sentiment on the ground, with auto volumes
turning a corner. There is much pent-up demand for autos and an economic recovery
could really bring that to the forefront. Given low penetration levels in most vehicle
segments with income levels that should continue to grow over the next few years, there is
still much headroom for growth to sustain in the medium term. With India taxing imports
heavily, OEMs have been forced to set up domestic capacities to cater to demand; hence,
the entire eco-space should benefit, as recovery picks up more.

04 November 2014
India Auto Components Sector 11
Figure 16: The PV industry has had three consecutive
slow years for the first time
Figure 17: The M&HCV industry has had two straight
years of big ~25% declines
-10%
0%
10%
20%
30%
40%
FY93 FY95 FY97 FY99 FY01 FY03 FY05 FY07 FY09 FY11 FY13 YTDFY15
Domestic PV's growth
-40%
-20%
0%
20%
40%
2003 2004 2005 2006 2007 2008 2009 2010 2011 2012 2013 2014 2015
LCV's growth M&HCV growth
Source: SIAM, Credit Suisse estimates Source: SIAM
India as a hub for small cars
Globally, there is pressure on OEMs to migrate their manufacturing facilities to low-cost
countries and India fits the bill. India has already emerged as a car manufacturing hub for
global auto majors, particularly small vehicles. Hyundai, Nissan-Renault, Ford etc. have all
set up production facilities in India for global distribution. A significant part of Hyundai’s
and Nissan’s vehicles produced in India is now exported. From about 5% a decade ago,
nearly ~20% of total passenger vehicles produced in India are now exported. Other than
cars, India is also an export hub for other vehicle segments like two wheelers, three-
wheelers and tractors, implying ample growth opportunities for the sector.
Figure 18: From around 5% a decade, nearly ~20% of total
passenger vehicles produced in India is now exported
Figure 19: Significant part of Hyundai, Nissan and Ford's
production in India is exported
0%
5%
10%
15%
20%
25%
PV production from India exported
PV production from India exported
0%
10%
20%
30%
40%
50%
60%
70%
80%
Ford Hyundai Maruti Nisssan Toyota Volkswagen
Production exported
Source: SIAM Source: SIAM
…parts companies well positioned to capitalise
Expanded capacity in previous cycle and sitting on low utilisations
Most of the players had embarked on significant capacity expansion programmes in the
years prior to the downcycle (FY09-12 period) in order to capitalise on both higher
04 November 2014
India Auto Components Sector 12
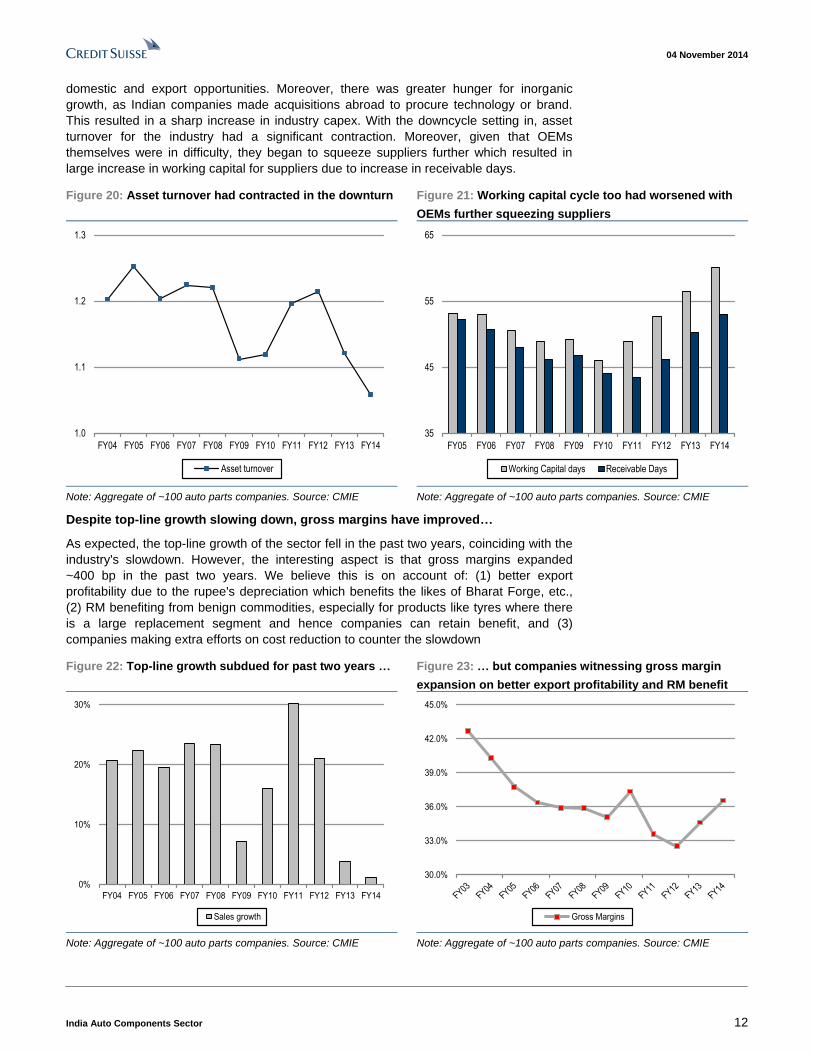
domestic and export opportunities. Moreover, there was greater hunger for inorganic
growth, as Indian companies made acquisitions abroad to procure technology or brand.
This resulted in a sharp increase in industry capex. With the downcycle setting in, asset
turnover for the industry had a significant contraction. Moreover, given that OEMs
themselves were in difficulty, they began to squeeze suppliers further which resulted in
large increase in working capital for suppliers due to increase in receivable days.
Figure 20: Asset turnover had contracted in the downturn Figure 21: Working capital cycle too had worsened with
OEMs further squeezing suppliers
1.0
1.1
1.2
1.3
FY04 FY05 FY06 FY07 FY08 FY09 FY10 FY11 FY12 FY13 FY14
Asset turnover
35
45
55
65
FY05 FY06 FY07 FY08 FY09 FY10 FY11 FY12 FY13 FY14
Working Capital days Receivable Days
Note: Aggregate of ~100 auto parts companies. Source: CMIE Note: Aggregate of ~100 auto parts companies. Source: CMIE
Despite top-line growth slowing down, gross margins have improved…
As expected, the top-line growth of the sector fell in the past two years, coinciding with the
industry's slowdown. However, the interesting aspect is that gross margins expanded
~400 bp in the past two years. We believe this is on account of: (1) better export
profitability due to the rupee's depreciation which benefits the likes of Bharat Forge, etc.,
(2) RM benefiting from benign commodities, especially for products like tyres where there
is a large replacement segment and hence companies can retain benefit, and (3)
companies making extra efforts on cost reduction to counter the slowdown
Figure 22: Top-line growth subdued for past two years … Figure 23: … but companies witnessing gross margin
expansion on better export profitability and RM benefit
0%
10%
20%
30%
FY04 FY05 FY06 FY07 FY08 FY09 FY10 FY11 FY12 FY13 FY14
Sales growth
30.0%
33.0%
36.0%
39.0%
42.0%
45.0%
Gross Margins
Note: Aggregate of ~100 auto parts companies. Source: CMIE Note: Aggregate of ~100 auto parts companies. Source: CMIE
04 November 2014
India Auto Components Sector 13
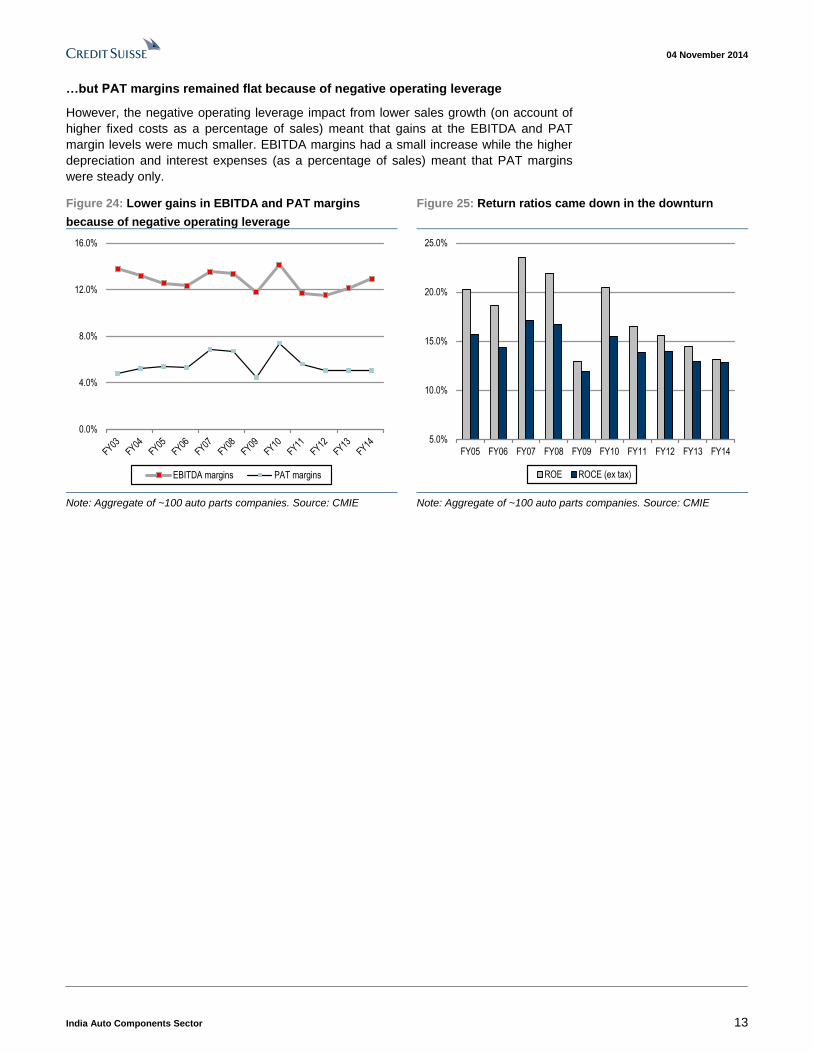
…but PAT margins remained flat because of negative operating leverage
However, the negative operating leverage impact from lower sales growth (on account of
higher fixed costs as a percentage of sales) meant that gains at the EBITDA and PAT
margin levels were much smaller. EBITDA margins had a small increase while the higher
depreciation and interest expenses (as a percentage of sales) meant that PAT margins
were steady only.
Figure 24: Lower gains in EBITDA and PAT margins
because of negative operating leverage
Figure 25: Return ratios came down in the downturn
0.0%
4.0%
8.0%
12.0%
16.0%
EBITDA margins PAT margins
5.0%
10.0%
15.0%
20.0%
25.0%
FY05 FY06 FY07 FY08 FY09 FY10 FY11 FY12 FY13 FY14
ROE ROCE (ex tax)
Note: Aggregate of ~100 auto parts companies. Source: CMIE Note: Aggregate of ~100 auto parts companies. Source: CMIE
04 November 2014
India Auto Components Sector 14
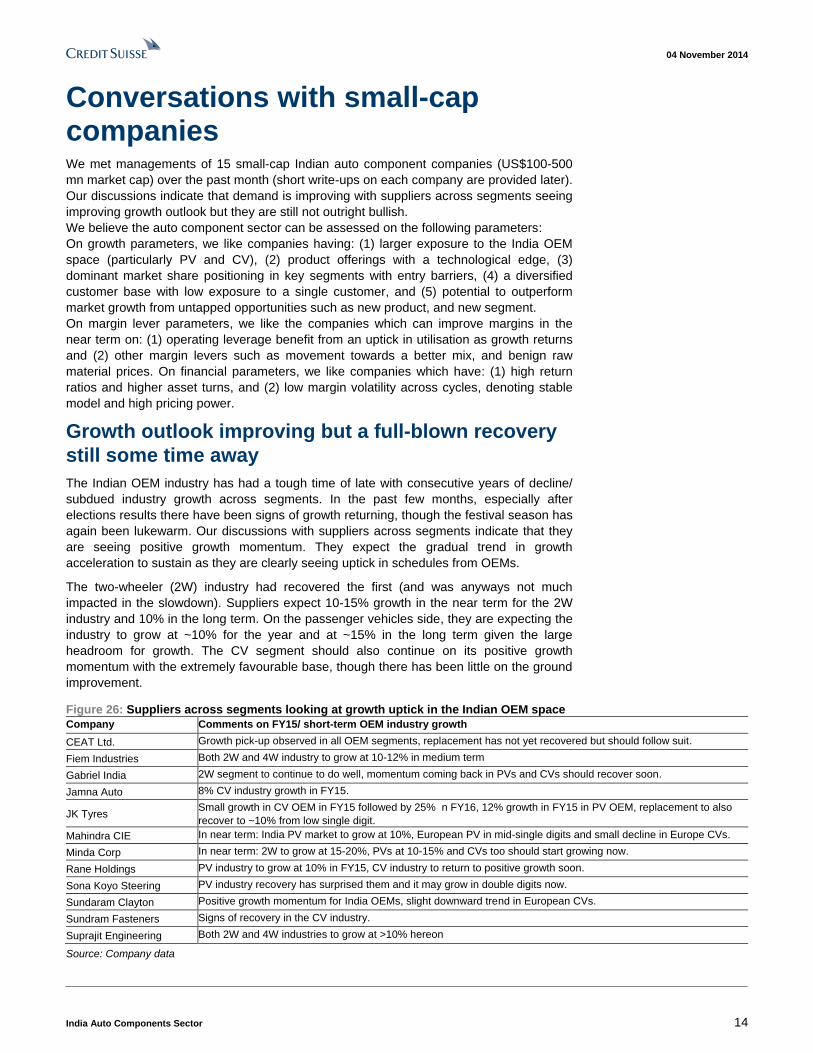
Conversations with small-cap companies We met managements of 15 small-cap Indian auto component companies (US$100-500
mn market cap) over the past month (short write-ups on each company are provided later).
Our discussions indicate that demand is improving with suppliers across segments seeing
improving growth outlook but they are still not outright bullish.
We believe the auto component sector can be assessed on the following parameters:
On growth parameters, we like companies having: (1) larger exposure to the India OEM
space (particularly PV and CV), (2) product offerings with a technological edge, (3)
dominant market share positioning in key segments with entry barriers, (4) a diversified
customer base with low exposure to a single customer, and (5) potential to outperform
market growth from untapped opportunities such as new product, and new segment.
On margin lever parameters, we like the companies which can improve margins in the
near term on: (1) operating leverage benefit from an uptick in utilisation as growth returns
and (2) other margin levers such as movement towards a better mix, and benign raw
material prices. On financial parameters, we like companies which have: (1) high return
ratios and higher asset turns, and (2) low margin volatility across cycles, denoting stable
model and high pricing power.
Growth outlook improving but a full-blown recovery
still some time away
The Indian OEM industry has had a tough time of late with consecutive years of decline/
subdued industry growth across segments. In the past few months, especially after
elections results there have been signs of growth returning, though the festival season has
again been lukewarm. Our discussions with suppliers across segments indicate that they
are seeing positive growth momentum. They expect the gradual trend in growth
acceleration to sustain as they are clearly seeing uptick in schedules from OEMs.
The two-wheeler (2W) industry had recovered the first (and was anyways not much
impacted in the slowdown). Suppliers expect 10-15% growth in the near term for the 2W
industry and 10% in the long term. On the passenger vehicles side, they are expecting the
industry to grow at ~10% for the year and at ~15% in the long term given the large
headroom for growth. The CV segment should also continue on its positive growth
momentum with the extremely favourable base, though there has been little on the ground
improvement.
Figure 26: Suppliers across segments looking at growth uptick in the Indian OEM space
Company Comments on FY15/ short-term OEM industry growth
CEAT Ltd. Growth pick-up observed in all OEM segments, replacement has not yet recovered but should follow suit.
Fiem Industries Both 2W and 4W industry to grow at 10-12% in medium term
Gabriel India 2W segment to continue to do well, momentum coming back in PVs and CVs should recover soon.
Jamna Auto 8% CV industry growth in FY15.
JK Tyres Small growth in CV OEM in FY15 followed by 25% n FY16, 12% growth in FY15 in PV OEM, replacement to also
recover to ~10% from low single digit.
Mahindra CIE In near term: India PV market to grow at 10%, European PV in mid-single digits and small decline in Europe CVs.
Minda Corp In near term: 2W to grow at 15-20%, PVs at 10-15% and CVs too should start growing now.
Rane Holdings PV industry to grow at 10% in FY15, CV industry to return to positive growth soon.
Sona Koyo Steering PV industry recovery has surprised them and it may grow in double digits now.
Sundaram Clayton Positive growth momentum for India OEMs, slight downward trend in European CVs.
Sundram Fasteners Signs of recovery in the CV industry.
Suprajit Engineering Both 2W and 4W industries to grow at >10% hereon
Source: Company data
04 November 2014
India Auto Components Sector 15
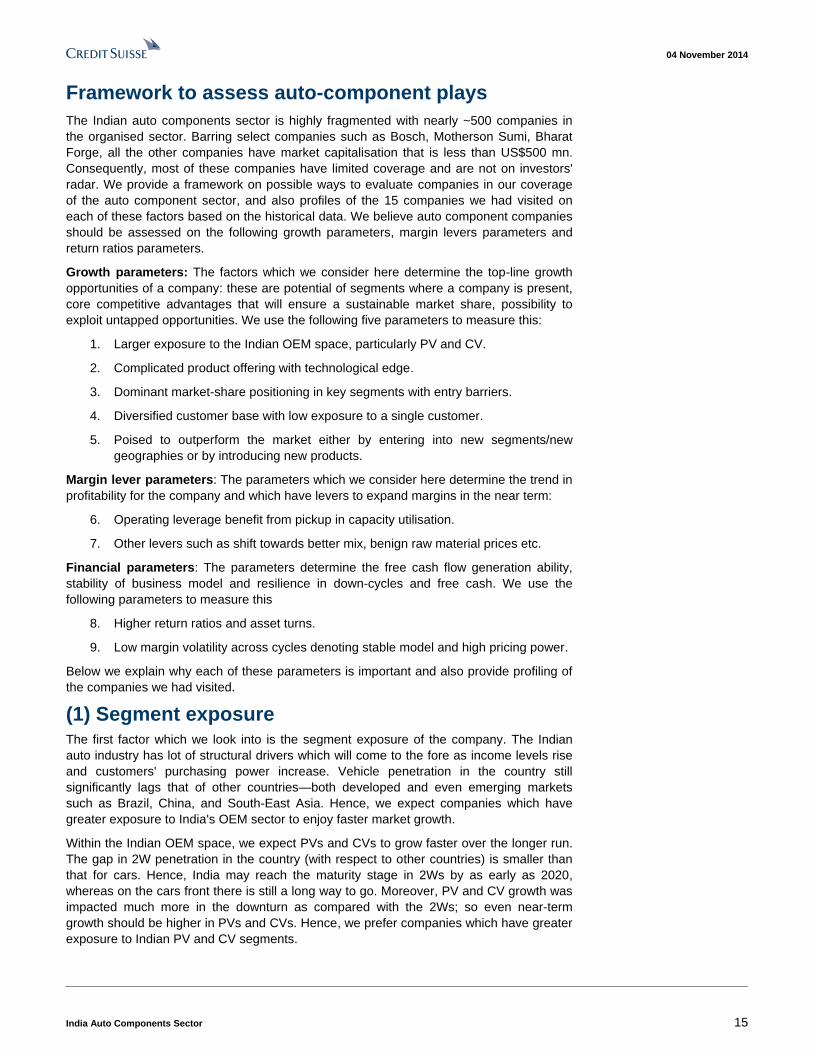
Framework to assess auto-component plays
The Indian auto components sector is highly fragmented with nearly ~500 companies in
the organised sector. Barring select companies such as Bosch, Motherson Sumi, Bharat
Forge, all the other companies have market capitalisation that is less than US$500 mn.
Consequently, most of these companies have limited coverage and are not on investors'
radar. We provide a framework on possible ways to evaluate companies in our coverage
of the auto component sector, and also profiles of the 15 companies we had visited on
each of these factors based on the historical data. We believe auto component companies
should be assessed on the following growth parameters, margin levers parameters and
return ratios parameters.
Growth parameters: The factors which we consider here determine the top-line growth
opportunities of a company: these are potential of segments where a company is present,
core competitive advantages that will ensure a sustainable market share, possibility to
exploit untapped opportunities. We use the following five parameters to measure this:
1. Larger exposure to the Indian OEM space, particularly PV and CV.
2. Complicated product offering with technological edge.
3. Dominant market-share positioning in key segments with entry barriers.
4. Diversified customer base with low exposure to a single customer.
5. Poised to outperform the market either by entering into new segments/new
geographies or by introducing new products.
Margin lever parameters: The parameters which we consider here determine the trend in
profitability for the company and which have levers to expand margins in the near term:
6. Operating leverage benefit from pickup in capacity utilisation.
7. Other levers such as shift towards better mix, benign raw material prices etc.
Financial parameters: The parameters determine the free cash flow generation ability,
stability of business model and resilience in down-cycles and free cash. We use the
following parameters to measure this
8. Higher return ratios and asset turns.
9. Low margin volatility across cycles denoting stable model and high pricing power.
Below we explain why each of these parameters is important and also provide profiling of
the companies we had visited.
(1) Segment exposure The first factor which we look into is the segment exposure of the company. The Indian
auto industry has lot of structural drivers which will come to the fore as income levels rise
and customers' purchasing power increase. Vehicle penetration in the country still
significantly lags that of other countries—both developed and even emerging markets
such as Brazil, China, and South-East Asia. Hence, we expect companies which have
greater exposure to India's OEM sector to enjoy faster market growth.
Within the Indian OEM space, we expect PVs and CVs to grow faster over the longer run.
The gap in 2W penetration in the country (with respect to other countries) is smaller than
that for cars. Hence, India may reach the maturity stage in 2Ws by as early as 2020,
whereas on the cars front there is still a long way to go. Moreover, PV and CV growth was
impacted much more in the downturn as compared with the 2Ws; so even near-term
growth should be higher in PVs and CVs. Hence, we prefer companies which have greater
exposure to Indian PV and CV segments.
04 November 2014
India Auto Components Sector 16
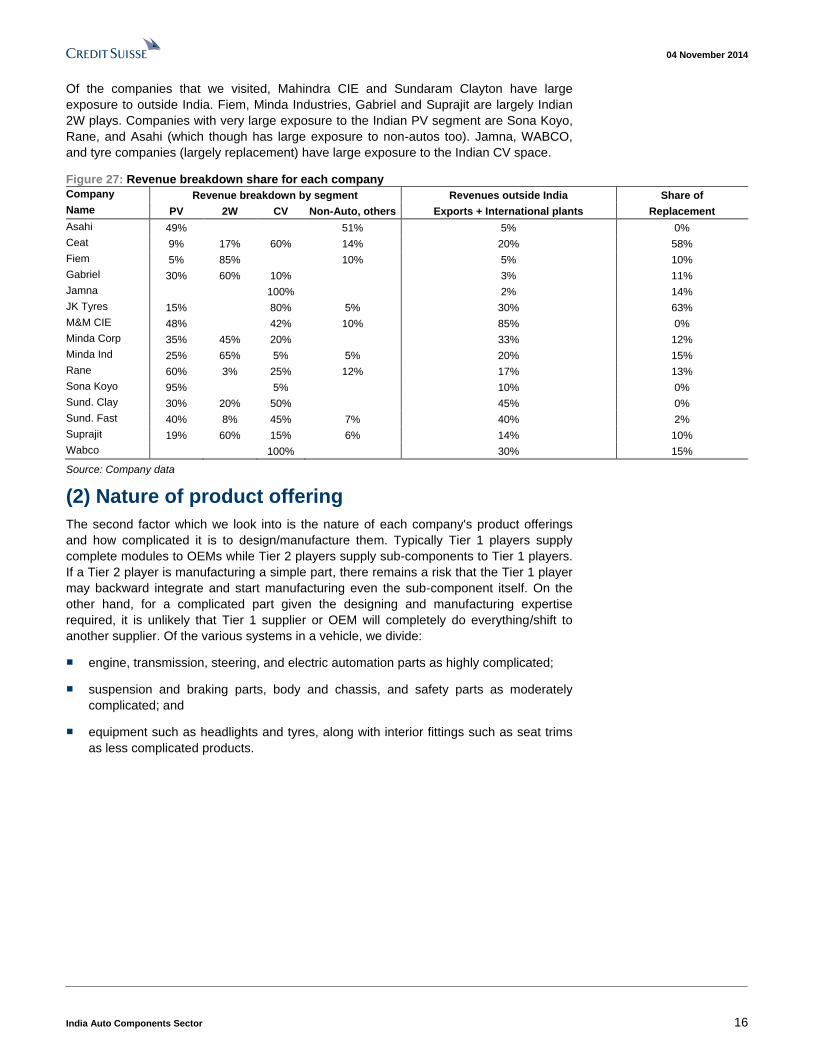
Of the companies that we visited, Mahindra CIE and Sundaram Clayton have large
exposure to outside India. Fiem, Minda Industries, Gabriel and Suprajit are largely Indian
2W plays. Companies with very large exposure to the Indian PV segment are Sona Koyo,
Rane, and Asahi (which though has large exposure to non-autos too). Jamna, WABCO,
and tyre companies (largely replacement) have large exposure to the Indian CV space.
Figure 27: Revenue breakdown share for each company
Company Revenue breakdown by segment Revenues outside India Share of
Name PV 2W CV Non-Auto, others Exports + International plants Replacement
Asahi 49% 51% 5% 0%
Ceat 9% 17% 60% 14% 20% 58%
Fiem 5% 85% 10% 5% 10%
Gabriel 30% 60% 10% 3% 11%
Jamna 100% 2% 14%
JK Tyres 15% 80% 5% 30% 63%
M&M CIE 48% 42% 10% 85% 0%
Minda Corp 35% 45% 20% 33% 12%
Minda Ind 25% 65% 5% 5% 20% 15%
Rane 60% 3% 25% 12% 17% 13%
Sona Koyo 95% 5% 10% 0%
Sund. Clay 30% 20% 50% 45% 0%
Sund. Fast 40% 8% 45% 7% 40% 2%
Suprajit 19% 60% 15% 6% 14% 10%
Wabco 100% 30% 15%
Source: Company data
(2) Nature of product offering
The second factor which we look into is the nature of each company's product offerings
and how complicated it is to design/manufacture them. Typically Tier 1 players supply
complete modules to OEMs while Tier 2 players supply sub-components to Tier 1 players.
If a Tier 2 player is manufacturing a simple part, there remains a risk that the Tier 1 player
may backward integrate and start manufacturing even the sub-component itself. On the
other hand, for a complicated part given the designing and manufacturing expertise
required, it is unlikely that Tier 1 supplier or OEM will completely do everything/shift to
another supplier. Of the various systems in a vehicle, we divide:
■ engine, transmission, steering, and electric automation parts as highly complicated;
■ suspension and braking parts, body and chassis, and safety parts as moderately
complicated; and
■ equipment such as headlights and tyres, along with interior fittings such as seat trims
as less complicated products.
04 November 2014
India Auto Components Sector 17
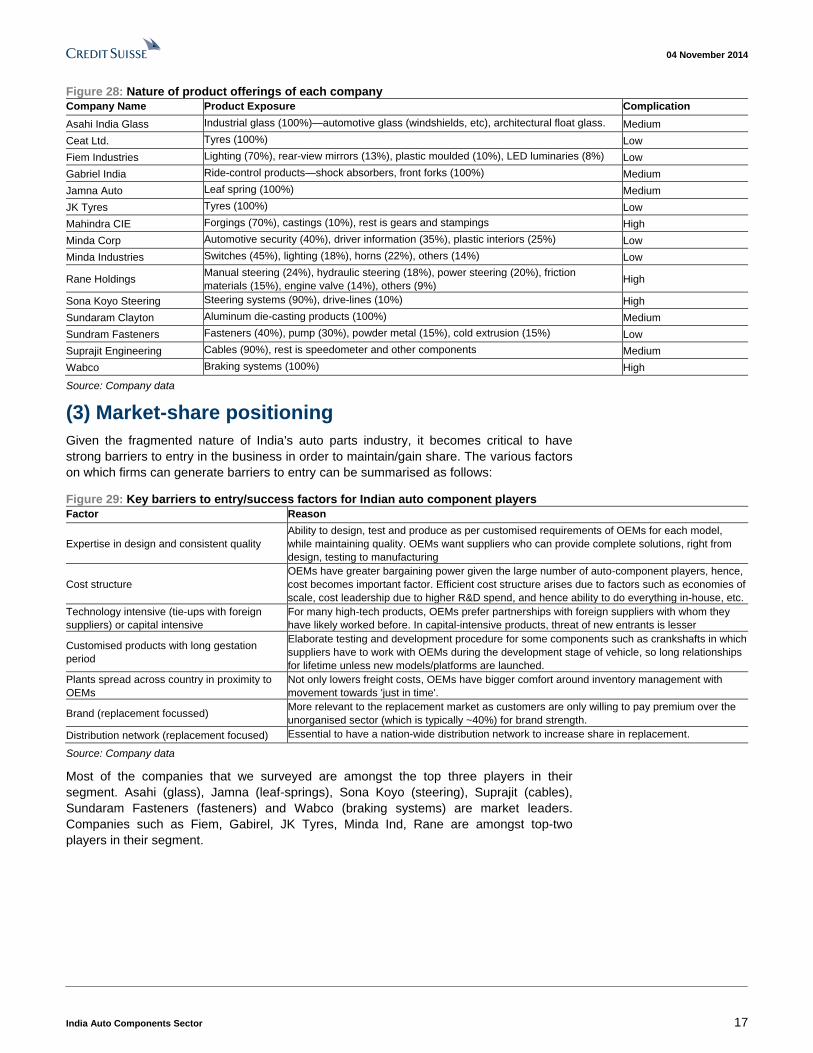
Figure 28: Nature of product offerings of each company
Company Name Product Exposure Complication
Asahi India Glass Industrial glass (100%)—automotive glass (windshields, etc), architectural float glass. Medium
Ceat Ltd. Tyres (100%) Low
Fiem Industries Lighting (70%), rear-view mirrors (13%), plastic moulded (10%), LED luminaries (8%) Low
Gabriel India Ride-control products—shock absorbers, front forks (100%) Medium
Jamna Auto Leaf spring (100%) Medium
JK Tyres Tyres (100%) Low
Mahindra CIE Forgings (70%), castings (10%), rest is gears and stampings High
Minda Corp Automotive security (40%), driver information (35%), plastic interiors (25%) Low
Minda Industries Switches (45%), lighting (18%), horns (22%), others (14%) Low
Rane Holdings Manual steering (24%), hydraulic steering (18%), power steering (20%), friction
materials (15%), engine valve (14%), others (9%) High
Sona Koyo Steering Steering systems (90%), drive-lines (10%) High
Sundaram Clayton Aluminum die-casting products (100%) Medium
Sundram Fasteners Fasteners (40%), pump (30%), powder metal (15%), cold extrusion (15%) Low
Suprajit Engineering Cables (90%), rest is speedometer and other components Medium
Wabco Braking systems (100%) High
Source: Company data
(3) Market-share positioning
Given the fragmented nature of India's auto parts industry, it becomes critical to have
strong barriers to entry in the business in order to maintain/gain share. The various factors
on which firms can generate barriers to entry can be summarised as follows:
Figure 29: Key barriers to entry/success factors for Indian auto component players
Factor Reason
Expertise in design and consistent quality
Ability to design, test and produce as per customised requirements of OEMs for each model,
while maintaining quality. OEMs want suppliers who can provide complete solutions, right from
design, testing to manufacturing
Cost structure
OEMs have greater bargaining power given the large number of auto-component players, hence,
cost becomes important factor. Efficient cost structure arises due to factors such as economies of
scale, cost leadership due to higher R&D spend, and hence ability to do everything in-house, etc.
Technology intensive (tie-ups with foreign
suppliers) or capital intensive
For many high-tech products, OEMs prefer partnerships with foreign suppliers with whom they
have likely worked before. In capital-intensive products, threat of new entrants is lesser
Customised products with long gestation
period
Elaborate testing and development procedure for some components such as crankshafts in which
suppliers have to work with OEMs during the development stage of vehicle, so long relationships
for lifetime unless new models/platforms are launched.
Plants spread across country in proximity to
OEMs
Not only lowers freight costs, OEMs have bigger comfort around inventory management with
movement towards 'just in time'.
Brand (replacement focussed) More relevant to the replacement market as customers are only willing to pay premium over the
unorganised sector (which is typically ~40%) for brand strength.
Distribution network (replacement focused) Essential to have a nation-wide distribution network to increase share in replacement.
Source: Company data
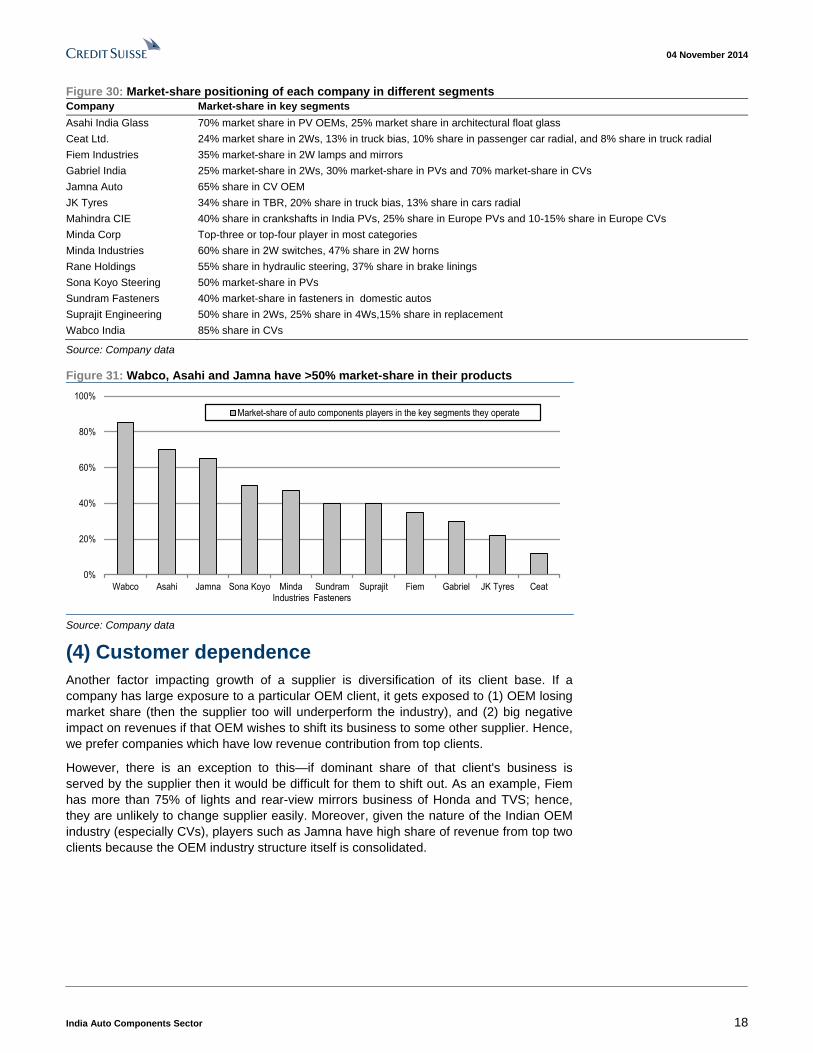
Most of the companies that we surveyed are amongst the top three players in their
segment. Asahi (glass), Jamna (leaf-springs), Sona Koyo (steering), Suprajit (cables),
Sundaram Fasteners (fasteners) and Wabco (braking systems) are market leaders.
Companies such as Fiem, Gabirel, JK Tyres, Minda Ind, Rane are amongst top-two
players in their segment.
04 November 2014
India Auto Components Sector 18
Figure 30: Market-share positioning of each company in different segments
Company Market-share in key segments
Asahi India Glass 70% market share in PV OEMs, 25% market share in architectural float glass
Ceat Ltd. 24% market share in 2Ws, 13% in truck bias, 10% share in passenger car radial, and 8% share in truck radial
Fiem Industries 35% market-share in 2W lamps and mirrors
Gabriel India 25% market-share in 2Ws, 30% market-share in PVs and 70% market-share in CVs
Jamna Auto 65% share in CV OEM
JK Tyres 34% share in TBR, 20% share in truck bias, 13% share in cars radial
Mahindra CIE 40% share in crankshafts in India PVs, 25% share in Europe PVs and 10-15% share in Europe CVs
Minda Corp Top-three or top-four player in most categories
Minda Industries 60% share in 2W switches, 47% share in 2W horns
Rane Holdings 55% share in hydraulic steering, 37% share in brake linings
Sona Koyo Steering 50% market-share in PVs
Sundram Fasteners 40% market-share in fasteners in domestic autos
Suprajit Engineering 50% share in 2Ws, 25% share in 4Ws,15% share in replacement
Wabco India 85% share in CVs
Source: Company data
Figure 31: Wabco, Asahi and Jamna have >50% market-share in their products
0%
20%
40%
60%
80%
100%
Wabco Asahi Jamna Sona Koyo MindaIndustries
SundramFasteners
Suprajit Fiem Gabriel JK Tyres Ceat
Market-share of auto components players in the key segments they operate
Source: Company data
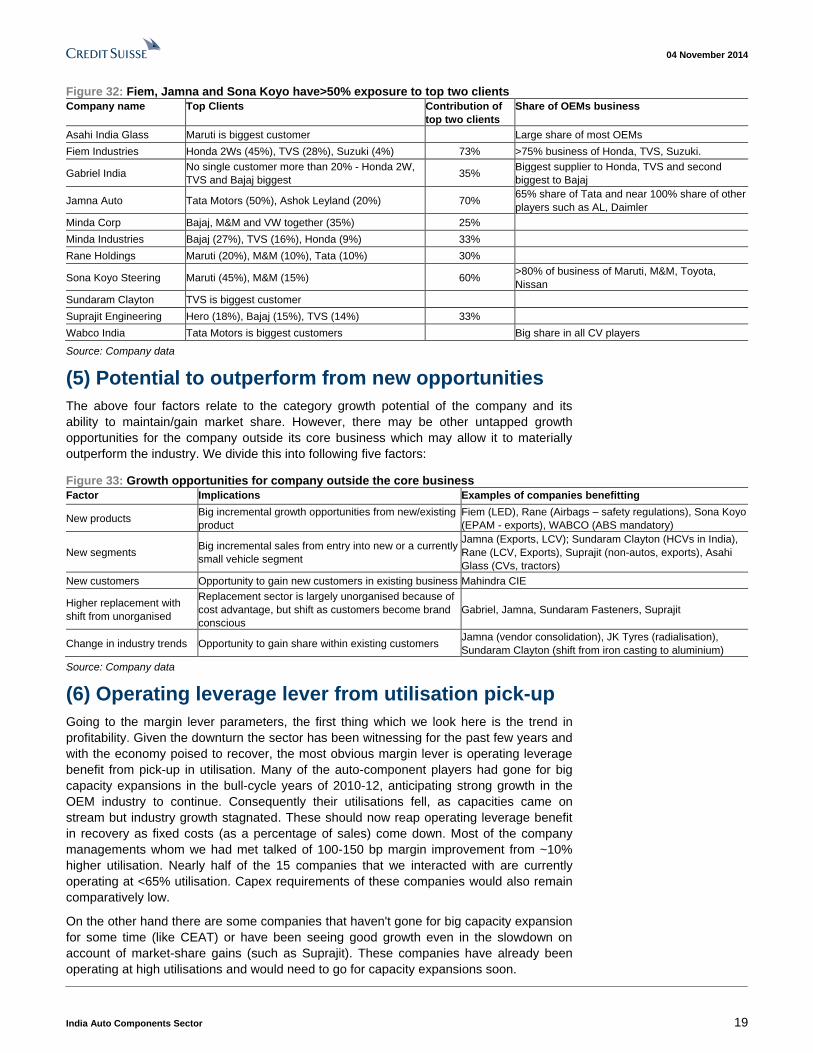
(4) Customer dependence
Another factor impacting growth of a supplier is diversification of its client base. If a
company has large exposure to a particular OEM client, it gets exposed to (1) OEM losing
market share (then the supplier too will underperform the industry), and (2) big negative
impact on revenues if that OEM wishes to shift its business to some other supplier. Hence,
we prefer companies which have low revenue contribution from top clients.
However, there is an exception to this—if dominant share of that client's business is
served by the supplier then it would be difficult for them to shift out. As an example, Fiem
has more than 75% of lights and rear-view mirrors business of Honda and TVS; hence,
they are unlikely to change supplier easily. Moreover, given the nature of the Indian OEM
industry (especially CVs), players such as Jamna have high share of revenue from top two
clients because the OEM industry structure itself is consolidated.
04 November 2014
India Auto Components Sector 19
Figure 32: Fiem, Jamna and Sona Koyo have>50% exposure to top two clients
Company name Top Clients Contribution of
top two clients
Share of OEMs business
Asahi India Glass Maruti is biggest customer Large share of most OEMs
Fiem Industries Honda 2Ws (45%), TVS (28%), Suzuki (4%) 73% >75% business of Honda, TVS, Suzuki.
Gabriel India No single customer more than 20% - Honda 2W,
TVS and Bajaj biggest 35%
Biggest supplier to Honda, TVS and second
biggest to Bajaj
Jamna Auto Tata Motors (50%), Ashok Leyland (20%) 70% 65% share of Tata and near 100% share of other
players such as AL, Daimler
Minda Corp Bajaj, M&M and VW together (35%) 25%
Minda Industries Bajaj (27%), TVS (16%), Honda (9%) 33%
Rane Holdings Maruti (20%), M&M (10%), Tata (10%) 30%
Sona Koyo Steering Maruti (45%), M&M (15%) 60% >80% of business of Maruti, M&M, Toyota,
Nissan
Sundaram Clayton TVS is biggest customer
Suprajit Engineering Hero (18%), Bajaj (15%), TVS (14%) 33%
Wabco India Tata Motors is biggest customers Big share in all CV players
Source: Company data
(5) Potential to outperform from new opportunities
The above four factors relate to the category growth potential of the company and its
ability to maintain/gain market share. However, there may be other untapped growth
opportunities for the company outside its core business which may allow it to materially
outperform the industry. We divide this into following five factors:
Figure 33: Growth opportunities for company outside the core business
Factor Implications Examples of companies benefitting
New products Big incremental growth opportunities from new/existing
product
Fiem (LED), Rane (Airbags – safety regulations), Sona Koyo
(EPAM - exports), WABCO (ABS mandatory)
New segments Big incremental sales from entry into new or a currently
small vehicle segment
Jamna (Exports, LCV); Sundaram Clayton (HCVs in India),
Rane (LCV, Exports), Suprajit (non-autos, exports), Asahi
Glass (CVs, tractors)
New customers Opportunity to gain new customers in existing business Mahindra CIE
Higher replacement with
shift from unorganised
Replacement sector is largely unorganised because of
cost advantage, but shift as customers become brand
conscious
Gabriel, Jamna, Sundaram Fasteners, Suprajit
Change in industry trends Opportunity to gain share within existing customers Jamna (vendor consolidation), JK Tyres (radialisation),
Sundaram Clayton (shift from iron casting to aluminium)
Source: Company data
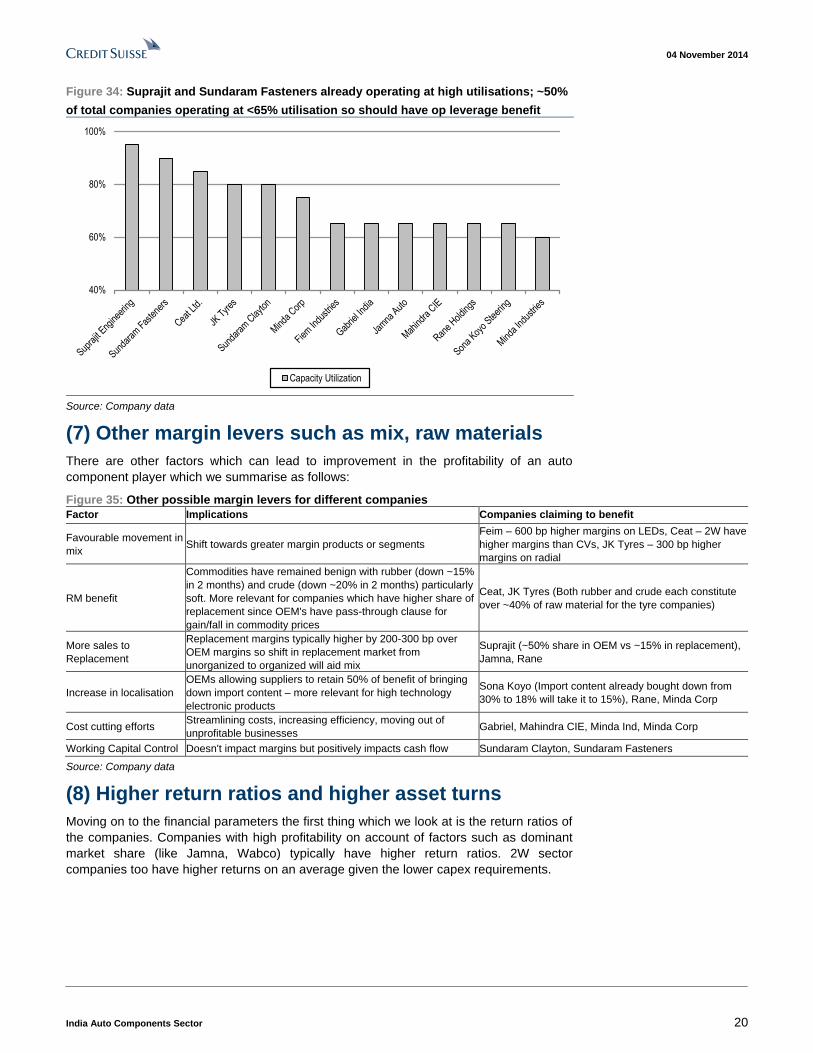
(6) Operating leverage lever from utilisation pick-up
Going to the margin lever parameters, the first thing which we look here is the trend in
profitability. Given the downturn the sector has been witnessing for the past few years and
with the economy poised to recover, the most obvious margin lever is operating leverage
benefit from pick-up in utilisation. Many of the auto-component players had gone for big
capacity expansions in the bull-cycle years of 2010-12, anticipating strong growth in the
OEM industry to continue. Consequently their utilisations fell, as capacities came on
stream but industry growth stagnated. These should now reap operating leverage benefit
in recovery as fixed costs (as a percentage of sales) come down. Most of the company
managements whom we had met talked of 100-150 bp margin improvement from ~10%
higher utilisation. Nearly half of the 15 companies that we interacted with are currently
operating at <65% utilisation. Capex requirements of these companies would also remain
comparatively low.
On the other hand there are some companies that haven't gone for big capacity expansion
for some time (like CEAT) or have been seeing good growth even in the slowdown on
account of market-share gains (such as Suprajit). These companies have already been
operating at high utilisations and would need to go for capacity expansions soon.
04 November 2014
India Auto Components Sector 20
Figure 34: Suprajit and Sundaram Fasteners already operating at high utilisations; ~50%
of total companies operating at <65% utilisation so should have op leverage benefit
40%
60%
80%
100%
Capacity Utilization
Source: Company data
(7) Other margin levers such as mix, raw materials
There are other factors which can lead to improvement in the profitability of an auto
component player which we summarise as follows:
Figure 35: Other possible margin levers for different companies
Factor Implications Companies claiming to benefit
Favourable movement in
mix Shift towards greater margin products or segments
Feim – 600 bp higher margins on LEDs, Ceat – 2W have
higher margins than CVs, JK Tyres – 300 bp higher
margins on radial
RM benefit
Commodities have remained benign with rubber (down ~15%
in 2 months) and crude (down ~20% in 2 months) particularly
soft. More relevant for companies which have higher share of
replacement since OEM's have pass-through clause for
gain/fall in commodity prices
Ceat, JK Tyres (Both rubber and crude each constitute
over ~40% of raw material for the tyre companies)
More sales to
Replacement
Replacement margins typically higher by 200-300 bp over
OEM margins so shift in replacement market from
unorganized to organized will aid mix
Suprajit (~50% share in OEM vs ~15% in replacement),
Jamna, Rane
Increase in localisation
OEMs allowing suppliers to retain 50% of benefit of bringing
down import content – more relevant for high technology
electronic products
Sona Koyo (Import content already bought down from
30% to 18% will take it to 15%), Rane, Minda Corp
Cost cutting efforts Streamlining costs, increasing efficiency, moving out of
unprofitable businesses Gabriel, Mahindra CIE, Minda Ind, Minda Corp
Working Capital Control Doesn't impact margins but positively impacts cash flow Sundaram Clayton, Sundaram Fasteners
Source: Company data
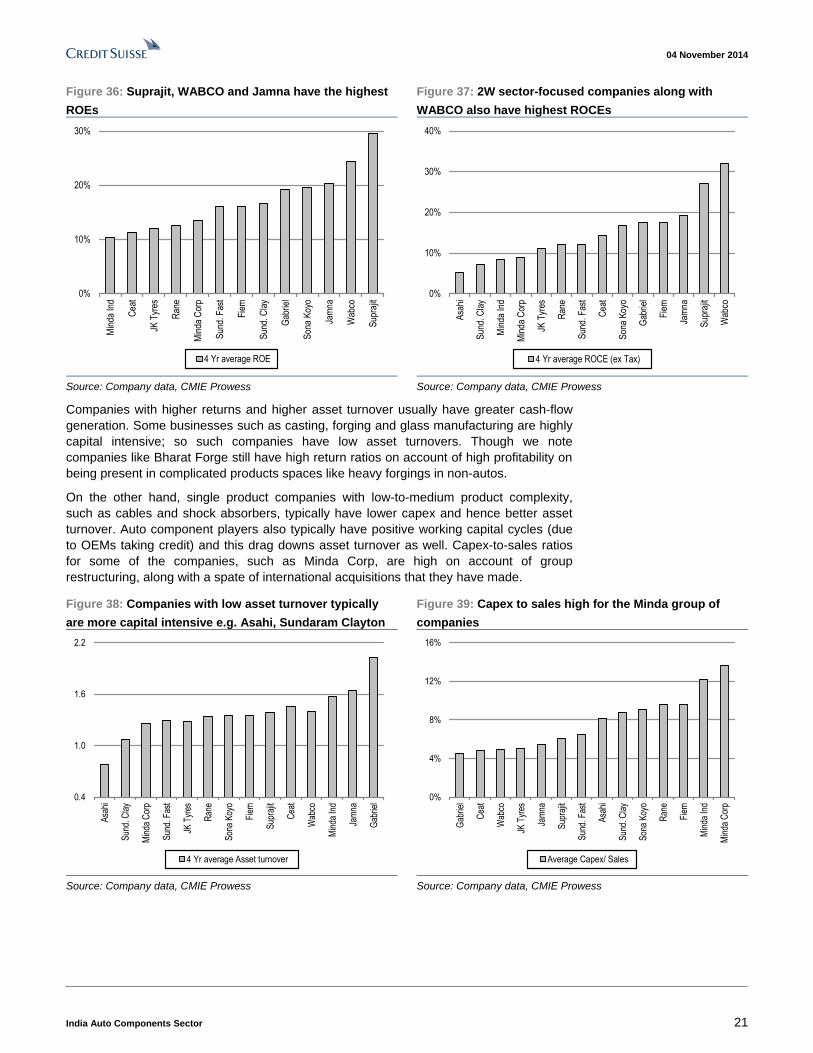
(8) Higher return ratios and higher asset turns
Moving on to the financial parameters the first thing which we look at is the return ratios of
the companies. Companies with high profitability on account of factors such as dominant
market share (like Jamna, Wabco) typically have higher return ratios. 2W sector
companies too have higher returns on an average given the lower capex requirements.
04 November 2014
India Auto Components Sector 21
Figure 36: Suprajit, WABCO and Jamna have the highest
ROEs
Figure 37: 2W sector-focused companies along with
WABCO also have highest ROCEs
0%
10%
20%
30%
Min
da In
d
Cea
t
JK T
yres
Ran
e
Min
da C
orp
Sun
d. F
ast
Fie
m
Sun
d. C
lay
Gab
riel
Son
a K
oyo
Jam
na
Wab
co
Sup
rajit
4 Yr average ROE
0%
10%
20%
30%
40%
Asa
hi
Sun
d. C
lay
Min
da In
d
Min
da C
orp
JK T
yres
Ran
e
Sun
d. F
ast
Cea
t
Son
a K
oyo
Gab
riel
Fie
m
Jam
na
Sup
rajit
Wab
co
4 Yr average ROCE (ex Tax)
Source: Company data, CMIE Prowess Source: Company data, CMIE Prowess
Companies with higher returns and higher asset turnover usually have greater cash-flow
generation. Some businesses such as casting, forging and glass manufacturing are highly
capital intensive; so such companies have low asset turnovers. Though we note
companies like Bharat Forge still have high return ratios on account of high profitability on
being present in complicated products spaces like heavy forgings in non-autos.
On the other hand, single product companies with low-to-medium product complexity,
such as cables and shock absorbers, typically have lower capex and hence better asset
turnover. Auto component players also typically have positive working capital cycles (due
to OEMs taking credit) and this drag downs asset turnover as well. Capex-to-sales ratios
for some of the companies, such as Minda Corp, are high on account of group
restructuring, along with a spate of international acquisitions that they have made.
Figure 38: Companies with low asset turnover typically
are more capital intensive e.g. Asahi, Sundaram Clayton
Figure 39: Capex to sales high for the Minda group of
companies
0.4
1.0
1.6
2.2
Asa
hi
Sun
d. C
lay
Min
da C
orp
Sun
d. F
ast
JK T
yres
Ran
e
Son
a K
oyo
Fiem
Sup
rajit
Cea
t
Wab
co
Min
da In
d
Jam
na
Gab
riel
4 Yr average Asset turnover
0%
4%
8%
12%
16%
Gab
riel
Cea
t
Wab
co
JK T
yres
Jam
na
Sup
rajit
Sun
d. F
ast
Asa
hi
Sun
d. C
lay
Son
a K
oyo
Ran
e
Fiem
Min
da In
d
Min
da C
orp
Average Capex/ Sales
Source: Company data, CMIE Prowess Source: Company data, CMIE Prowess
04 November 2014
India Auto Components Sector 22
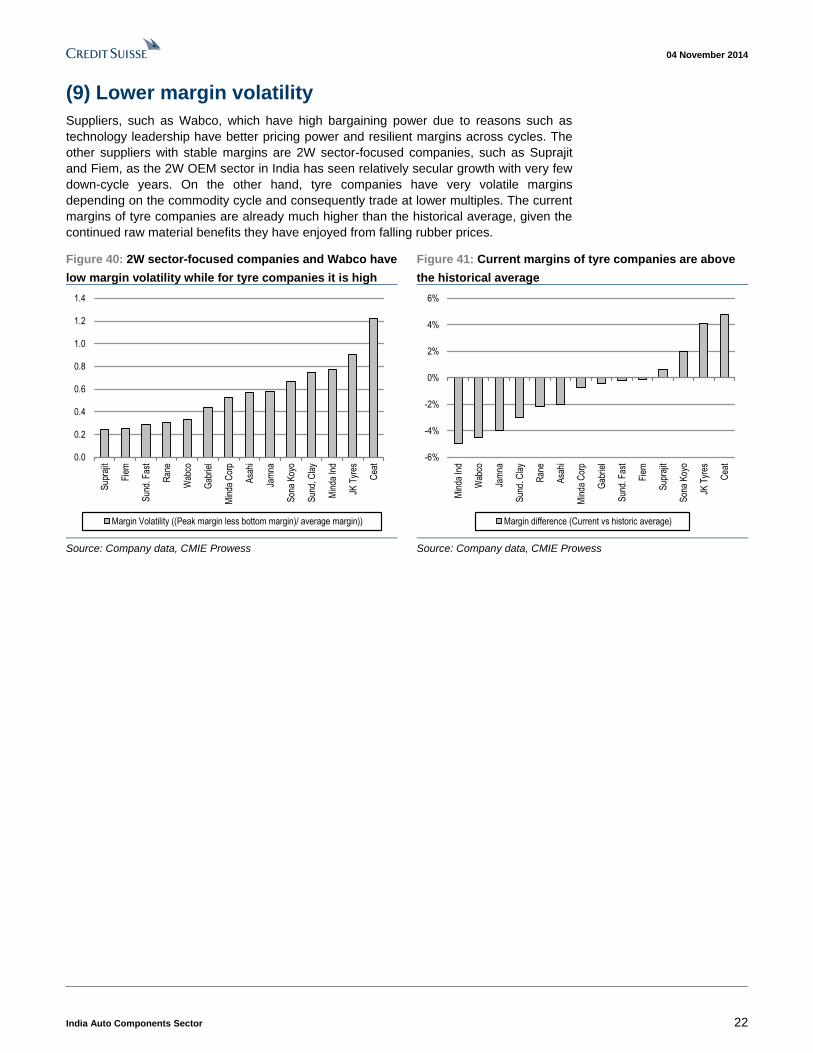
(9) Lower margin volatility
Suppliers, such as Wabco, which have high bargaining power due to reasons such as
technology leadership have better pricing power and resilient margins across cycles. The
other suppliers with stable margins are 2W sector-focused companies, such as Suprajit
and Fiem, as the 2W OEM sector in India has seen relatively secular growth with very few
down-cycle years. On the other hand, tyre companies have very volatile margins
depending on the commodity cycle and consequently trade at lower multiples. The current
margins of tyre companies are already much higher than the historical average, given the
continued raw material benefits they have enjoyed from falling rubber prices.
Figure 40: 2W sector-focused companies and Wabco have
low margin volatility while for tyre companies it is high
Figure 41: Current margins of tyre companies are above
the historical average
0.0
0.2
0.4
0.6
0.8
1.0
1.2
1.4
Sup
rajit
Fie
m
Sun
d. F
ast
Ran
e
Wab
co
Gab
riel
Min
da C
orp
Asa
hi
Jam
na
Son
a K
oyo
Sun
d, C
lay
Min
da In
d
JK T
yres
Cea
t
Margin Volatility ((Peak margin less bottom margin)/ average margin))
-6%
-4%
-2%
0%
2%
4%
6%
Min
da In
d
Wab
co
Jam
na
Sun
d. C
lay
Ran
e
Asa
hi
Min
da C
orp
Gab
riel
Sun
d. F
ast
Fie
m
Sup
rajit
Son
a K
oyo
JK T
yres
Cea
t
Margin difference (Current vs historic average)
Source: Company data, CMIE Prowess Source: Company data, CMIE Prowess
04 November 2014
India Auto Components Sector 23
A basket of component stocks to play CV cycle We remain very constructive on the CV cycle but our preferred play on the same Ashok
Leyland is now already pricing in the best case scenario hence we are downgrading it to a
NEUTRAL. We think investors should instead switch to a basket of component stocks
supplying to the CV industry. We are also increasing our TP on Apollo Tyres (O) to Rs260
and on Bharat Forge (N) to Rs830. Our preferred pick in the component space remains
Apollo Tyres and we are now initiating coverage on WABCO as well.
Initiate on WABCO (OUTPEFROM) with a TP of Rs4,820: WABCO is the largest player in
the CV braking industry in India with a >80% market share. We believe WABCO is one of
the best structural plays in the Indian auto component space with safety and emission
content per vehicle in India being a tenth of European markets. WABCO India also has a
prominent position in WABCO's global scheme of things as its hub for adapting products
for emerging markets as well as being a critical country in its plans to increase sourcing
from low cost countries. CV cycle recovery and mandatory ABS implementation are near-
term triggers for the stock.
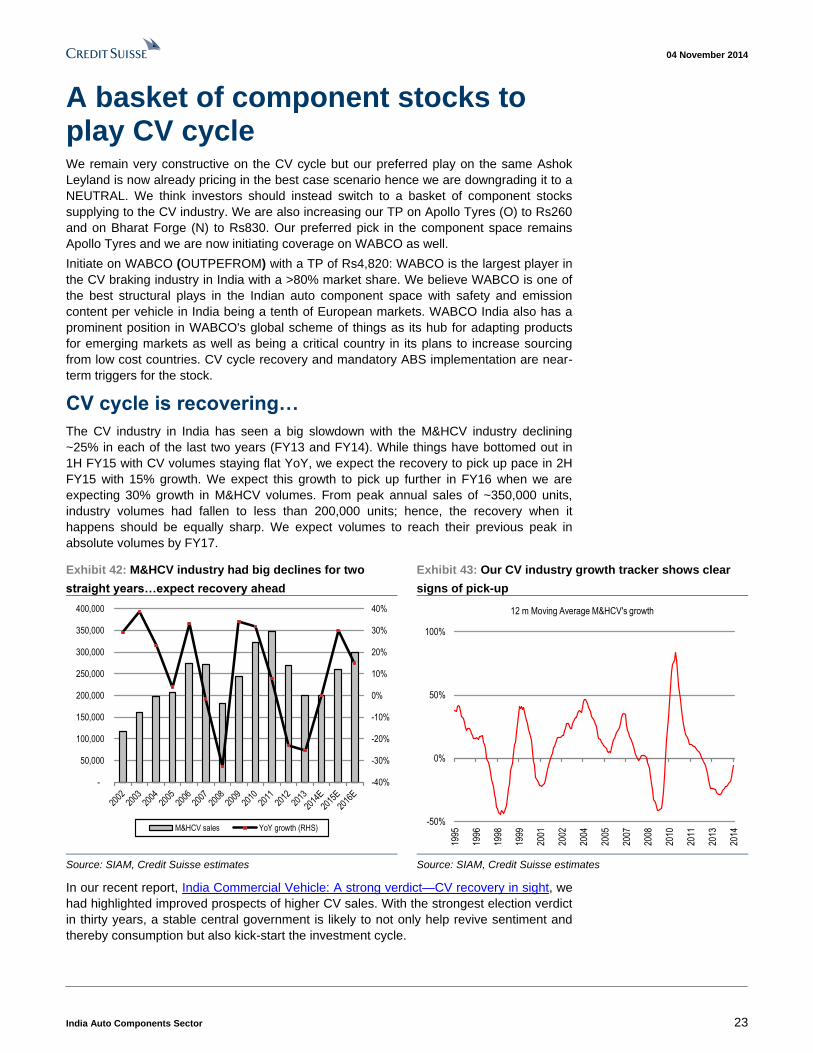
CV cycle is recovering…
The CV industry in India has seen a big slowdown with the M&HCV industry declining
~25% in each of the last two years (FY13 and FY14). While things have bottomed out in
1H FY15 with CV volumes staying flat YoY, we expect the recovery to pick up pace in 2H
FY15 with 15% growth. We expect this growth to pick up further in FY16 when we are
expecting 30% growth in M&HCV volumes. From peak annual sales of ~350,000 units,
industry volumes had fallen to less than 200,000 units; hence, the recovery when it
happens should be equally sharp. We expect volumes to reach their previous peak in
absolute volumes by FY17.
Exhibit 42: M&HCV industry had big declines for two
straight years…expect recovery ahead
Exhibit 43: Our CV industry growth tracker shows clear
signs of pick-up
-40%
-30%
-20%
-10%
0%
10%
20%
30%
40%
-
50,000
100,000
150,000
200,000
250,000
300,000
350,000
400,000
M&HCV sales YoY growth (RHS)
-50%
0%
50%
100%
1995
1996
1998
1999
2001
2002
2004
2005
2007
2008
2010
2011
2013
2014
12 m Moving Average M&HCV's growth
Source: SIAM, Credit Suisse estimates Source: SIAM, Credit Suisse estimates
In our recent report, India Commercial Vehicle: A strong verdict—CV recovery in sight, we
had highlighted improved prospects of higher CV sales. With the strongest election verdict
in thirty years, a stable central government is likely to not only help revive sentiment and
thereby consumption but also kick-start the investment cycle.
04 November 2014
India Auto Components Sector 24
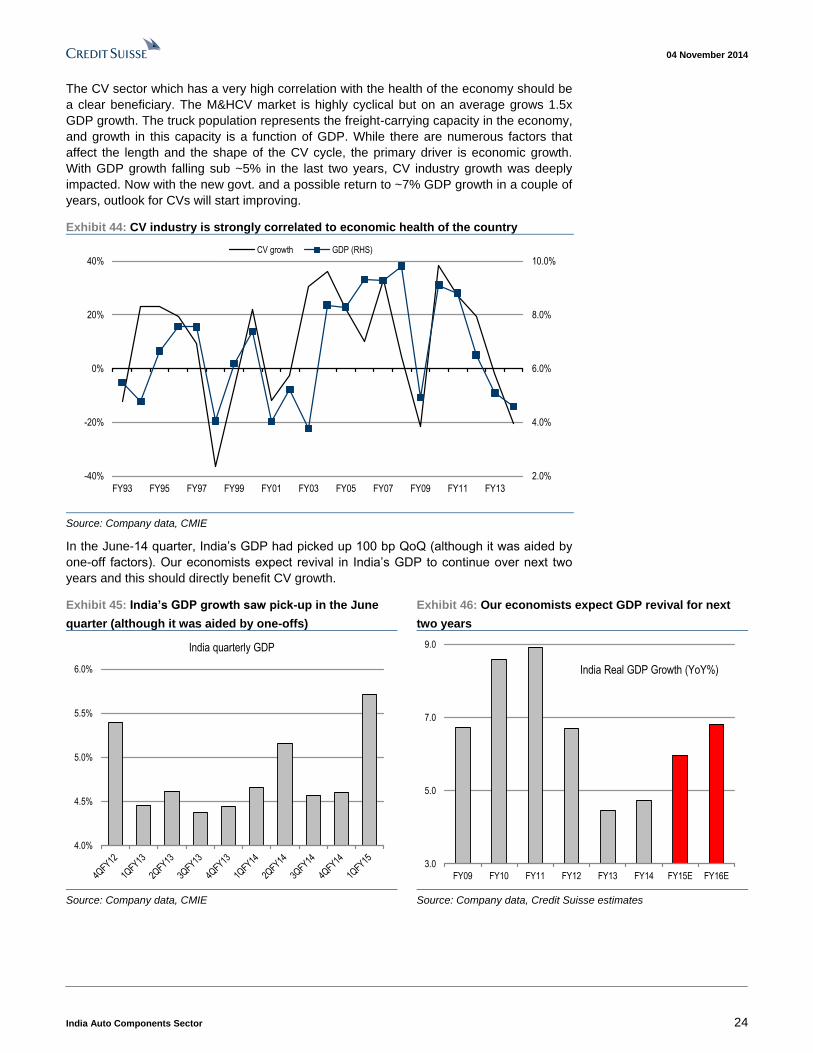
The CV sector which has a very high correlation with the health of the economy should be
a clear beneficiary. The M&HCV market is highly cyclical but on an average grows 1.5x
GDP growth. The truck population represents the freight-carrying capacity in the economy,
and growth in this capacity is a function of GDP. While there are numerous factors that
affect the length and the shape of the CV cycle, the primary driver is economic growth.
With GDP growth falling sub ~5% in the last two years, CV industry growth was deeply
impacted. Now with the new govt. and a possible return to ~7% GDP growth in a couple of
years, outlook for CVs will start improving.
Exhibit 44: CV industry is strongly correlated to economic health of the country
2.0%
4.0%
6.0%
8.0%
10.0%
-40%
-20%
0%
20%
40%
FY93 FY95 FY97 FY99 FY01 FY03 FY05 FY07 FY09 FY11 FY13
CV growth GDP (RHS)
Source: Company data, CMIE
In the June-14 quarter, India’s GDP had picked up 100 bp QoQ (although it was aided by
one-off factors). Our economists expect revival in India’s GDP to continue over next two
years and this should directly benefit CV growth.
Exhibit 45: India’s GDP growth saw pick-up in the June
quarter (although it was aided by one-offs)
Exhibit 46: Our economists expect GDP revival for next
two years
4.0%
4.5%
5.0%
5.5%
6.0%
India quarterly GDP
3.0
5.0
7.0
9.0
FY09 FY10 FY11 FY12 FY13 FY14 FY15E FY16E
India Real GDP Growth (YoY%)
Source: Company data, CMIE Source: Company data, Credit Suisse estimates
04 November 2014
India Auto Components Sector 25
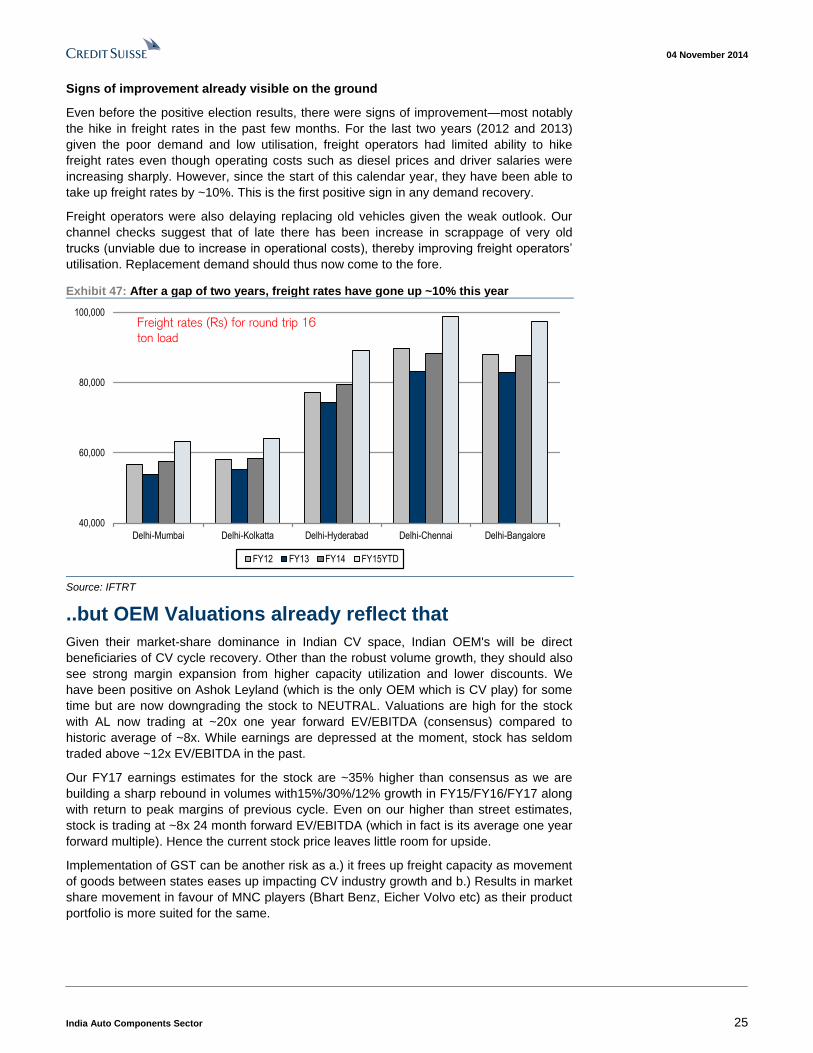
Signs of improvement already visible on the ground
Even before the positive election results, there were signs of improvement—most notably
the hike in freight rates in the past few months. For the last two years (2012 and 2013)
given the poor demand and low utilisation, freight operators had limited ability to hike
freight rates even though operating costs such as diesel prices and driver salaries were
increasing sharply. However, since the start of this calendar year, they have been able to
take up freight rates by ~10%. This is the first positive sign in any demand recovery.
Freight operators were also delaying replacing old vehicles given the weak outlook. Our
channel checks suggest that of late there has been increase in scrappage of very old
trucks (unviable due to increase in operational costs), thereby improving freight operators’
utilisation. Replacement demand should thus now come to the fore.
Exhibit 47: After a gap of two years, freight rates have gone up ~10% this year
40,000
60,000
80,000
100,000
Delhi-Mumbai Delhi-Kolkatta Delhi-Hyderabad Delhi-Chennai Delhi-Bangalore
FY12 FY13 FY14 FY15YTD
Freight rates (Rs) for round trip 16
ton load
Source: IFTRT
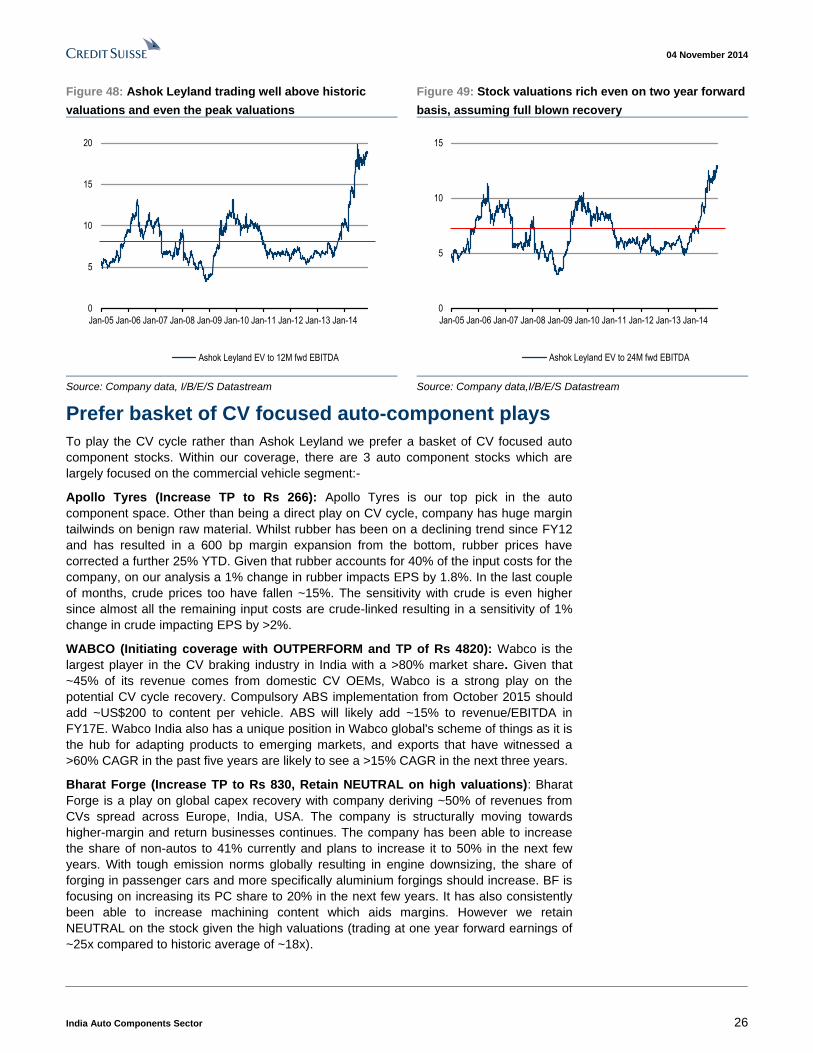
..but OEM Valuations already reflect that
Given their market-share dominance in Indian CV space, Indian OEM's will be direct
beneficiaries of CV cycle recovery. Other than the robust volume growth, they should also
see strong margin expansion from higher capacity utilization and lower discounts. We
have been positive on Ashok Leyland (which is the only OEM which is CV play) for some
time but are now downgrading the stock to NEUTRAL. Valuations are high for the stock
with AL now trading at ~20x one year forward EV/EBITDA (consensus) compared to
historic average of ~8x. While earnings are depressed at the moment, stock has seldom
traded above ~12x EV/EBITDA in the past.
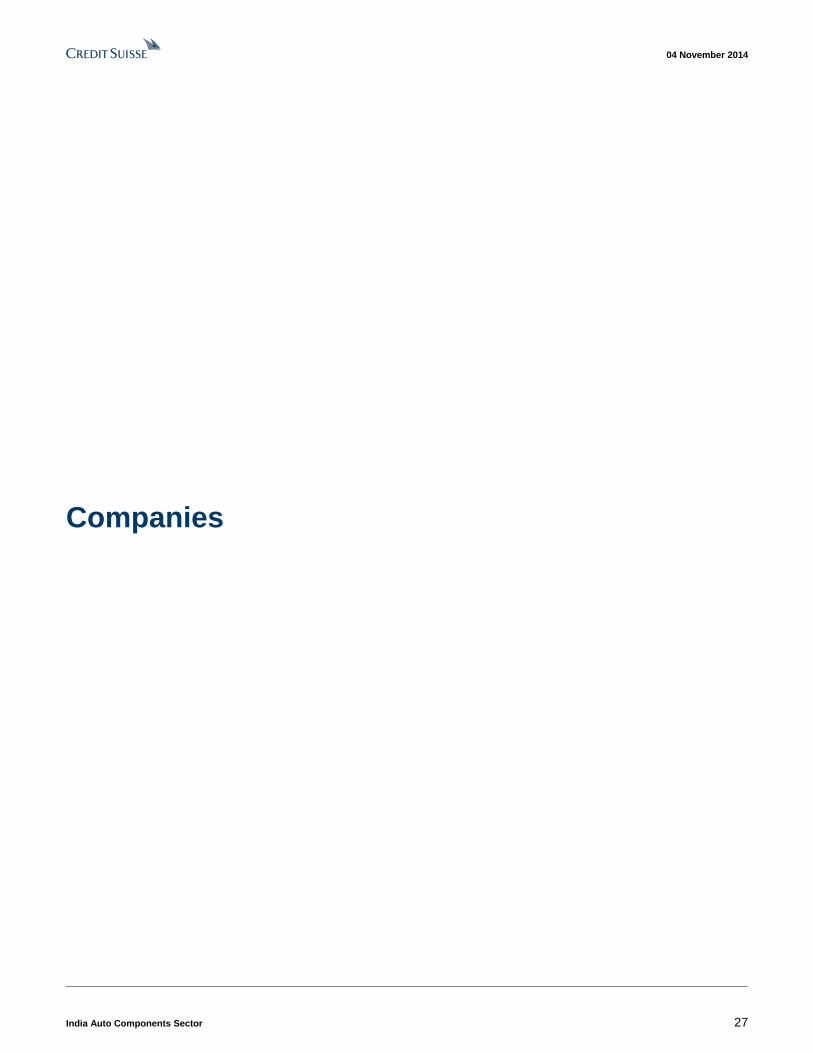
Our FY17 earnings estimates for the stock are ~35% higher than consensus as we are
building a sharp rebound in volumes with15%/30%/12% growth in FY15/FY16/FY17 along
with return to peak margins of previous cycle. Even on our higher than street estimates,
stock is trading at ~8x 24 month forward EV/EBITDA (which in fact is its average one year
forward multiple). Hence the current stock price leaves little room for upside.
Implementation of GST can be another risk as a.) it frees up freight capacity as movement
of goods between states eases up impacting CV industry growth and b.) Results in market
share movement in favour of MNC players (Bhart Benz, Eicher Volvo etc) as their product
portfolio is more suited for the same.
04 November 2014
India Auto Components Sector 26
Figure 48: Ashok Leyland trading well above historic
valuations and even the peak valuations
Figure 49: Stock valuations rich even on two year forward
basis, assuming full blown recovery
0
5
10
15
20
Jan-05 Jan-06 Jan-07 Jan-08 Jan-09 Jan-10 Jan-11 Jan-12 Jan-13 Jan-14
Ashok Leyland EV to 12M fwd EBITDA
0
5
10
15
Jan-05 Jan-06 Jan-07 Jan-08 Jan-09 Jan-10 Jan-11 Jan-12 Jan-13 Jan-14
Ashok Leyland EV to 24M fwd EBITDA
Source: Company data, I/B/E/S Datastream Source: Company data,I/B/E/S Datastream
Prefer basket of CV focused auto-component plays
To play the CV cycle rather than Ashok Leyland we prefer a basket of CV focused auto
component stocks. Within our coverage, there are 3 auto component stocks which are
largely focused on the commercial vehicle segment:-
Apollo Tyres (Increase TP to Rs 266): Apollo Tyres is our top pick in the auto
component space. Other than being a direct play on CV cycle, company has huge margin
tailwinds on benign raw material. Whilst rubber has been on a declining trend since FY12
and has resulted in a 600 bp margin expansion from the bottom, rubber prices have
corrected a further 25% YTD. Given that rubber accounts for 40% of the input costs for the
company, on our analysis a 1% change in rubber impacts EPS by 1.8%. In the last couple
of months, crude prices too have fallen ~15%. The sensitivity with crude is even higher
since almost all the remaining input costs are crude-linked resulting in a sensitivity of 1%
change in crude impacting EPS by >2%.
WABCO (Initiating coverage with OUTPERFORM and TP of Rs 4820): Wabco is the
largest player in the CV braking industry in India with a >80% market share. Given that
~45% of its revenue comes from domestic CV OEMs, Wabco is a strong play on the
potential CV cycle recovery. Compulsory ABS implementation from October 2015 should
add ~US$200 to content per vehicle. ABS will likely add ~15% to revenue/EBITDA in
FY17E. Wabco India also has a unique position in Wabco global's scheme of things as it is
the hub for adapting products to emerging markets, and exports that have witnessed a
>60% CAGR in the past five years are likely to see a >15% CAGR in the next three years.
Bharat Forge (Increase TP to Rs 830, Retain NEUTRAL on high valuations): Bharat
Forge is a play on global capex recovery with company deriving ~50% of revenues from
CVs spread across Europe, India, USA. The company is structurally moving towards
higher-margin and return businesses continues. The company has been able to increase
the share of non-autos to 41% currently and plans to increase it to 50% in the next few
years. With tough emission norms globally resulting in engine downsizing, the share of
forging in passenger cars and more specifically aluminium forgings should increase. BF is
focusing on increasing its PC share to 20% in the next few years. It has also consistently
been able to increase machining content which aids margins. However we retain
NEUTRAL on the stock given the high valuations (trading at one year forward earnings of
~25x compared to historic average of ~18x).
04 November 2014
India Auto Components Sector 27
Companies
04 November 2014
India Auto Components Sector 28
Asia Pacific / India
Wabco India Ltd.
(WABC.BO / WIL IN) INITIATION
Structural play in a cyclical industry
■ Initiate with OUTPERFORM for ~35% potential upside. We initiate
coverage on Wabco India (Wabco), our preferred play on a favourable CV
cycle in India, with an OUTPERFORM rating and a Rs4,820 target price.
Wabco is the largest player in the CV braking industry in India with a >80%
market share. Along with Knorr Brense, it is the largest player in the global
CV braking industry as well.
■ Rising content per vehicle and exports should drive top line. Wabco's
content per vehicle in India is a tenth of the content per vehicle in Europe.
While it will take regulatory changes and some structural changes for the
content per vehicle to reach levels seen in developed markets, content per
vehicle has been steadily growing, and we see increasing acceptance of
Wabco's new products. Wabco India also has a unique position in Wabco
global's scheme of things as it is the hub for adapting products to emerging
markets, and exports that have witnessed a >60% CAGR in the past five
years are likely to see a >15% CAGR in the next three years.
■ CV cycle recovery and ABS implementation are near-term triggers.
Given that ~45% of its revenue comes from domestic CV OEMs, Wabco is a
strong play on the potential CV cycle recovery. In a recovery, multi-axle
vehicles tend to outperform other segments, thus boosting content per
vehicle for Wabco. Compulsory ABS implementation from October 2015 will
add ~US$200 to content per vehicle. ABS will likely add ~15% to
revenue/EBITDA in FY17E. Automated Manual Transmission is another
product which is witnessing strong traction in buses.
■ Valuation. We expect Wabco to deliver a strong ~40% CAGR in EPS in the
next three years. Our DCF-based target price of Rs4,820 implies ~35%
potential upside. Based on our TP, the stock would be valued at 28x FY17E
EPS, which is in line with the current multiple of Bosch India Ltd. Key risks
to our call are (1) increase in competition from Knorr Brense, (2) delay in the
implementation of ABS, and (3) increase in royalty by the parent company. Share price performance
80
130
180
0
1000
2000
3000
4000
Nov-12 Mar-13 Jul-13 Nov-13 Mar-14 Jul-14
Price (LHS) Rebased Rel (RHS)
The price relative chart measures performance against the S&P
BSE SENSEX IDX which closed at 27860.38 on 03/11/14
On 03/11/14 the spot exchange rate was Rs61.41/US$1
Performance over 1M 3M 12M Absolute (%) -7.5 8.7 115.9 — Relative (%) -12.3 1.2 84.9 —
Financial and valuation metrics
Year 3/14A 3/15E 3/16E 3/17E Revenue (Rs mn) 11,107.0 13,206.2 18,072.7 24,266.4 EBITDA (Rs mn) 1,661.5 2,059.2 3,223.1 4,647.0 EBIT (Rs mn) 1,340.0 1,705.6 2,834.1 4,219.0 Net profit (Rs mn) 1,174.8 1,298.9 2,109.9 3,104.5 EPS (CS adj.) (Rs) 61.94 68.48 111.24 163.68 Change from previous EPS (%) n.a. Consensus EPS (Rs) n.a. 72 122 167 EPS growth (%) -10.2 10.6 62.4 47.1 P/E (x) 57.9 52.3 32.2 21.9 Dividend yield (%) 0.14 0.17 0.17 0.17 EV/EBITDA (x) 39.7 31.9 20.2 13.8 P/B (x) 9.0 7.8 6.4 5.0 ROE (%) 16.7 16.0 21.7 25.5 Net debt/equity (%) net cash net cash net cash net cash
Source: Company data, Thomson Reuters, Credit Suisse estimates
Rating OUTPERFORM* Price (03 Nov 14, Rs) 3,584.10 Target price (Rs) 4,820.00¹ Upside/downside (%) 34.5 Mkt cap (Rs mn) 67,982 (US$ 1,107) Enterprise value (Rs mn) 65,644 Number of shares (mn) 18.97 Free float (%) 25.0 52-week price range 3,905.8 - 1,640.0 ADTO - 6M (US$ mn) 0.46
*Stock ratings are relative to the coverage universe in each
analyst's or each team's respective sector.
¹Target price is for 12 months.
Research Analysts
Jatin Chawla
91 22 6777 3719
Akshay Saxena
91 22 6777 3825
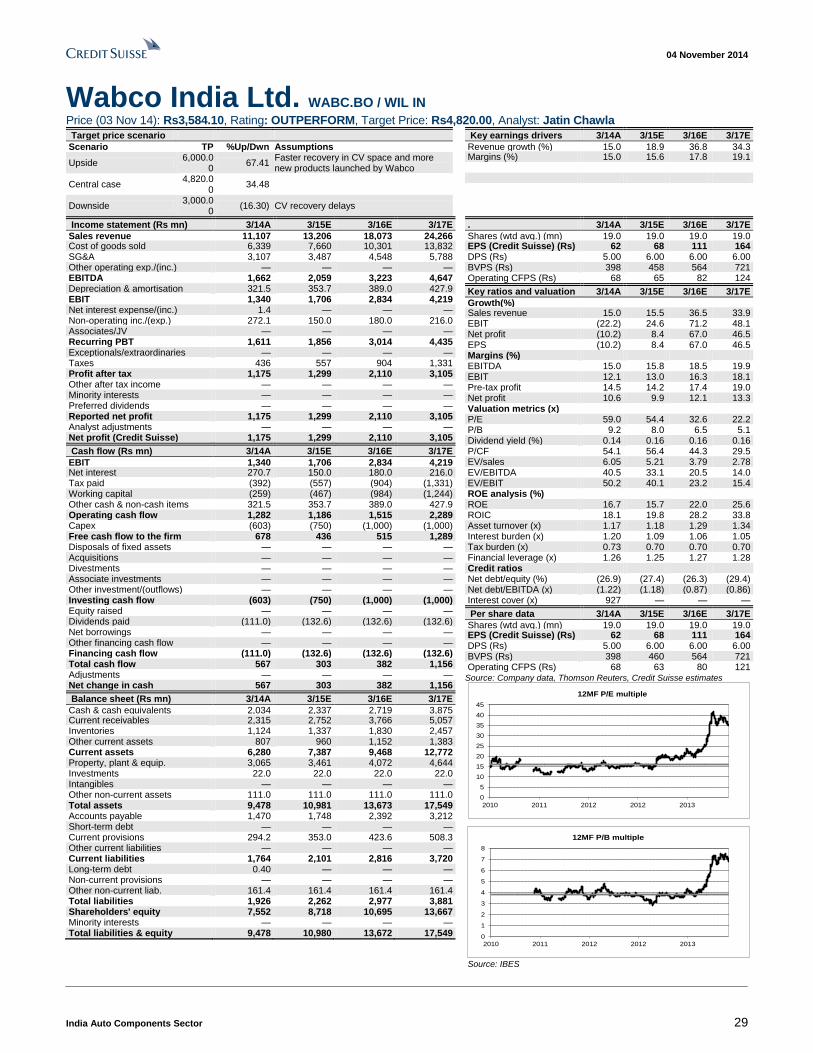
04 November 2014
India Auto Components Sector 29
Wabco India Ltd. WABC.BO / WIL IN Price (03 Nov 14): Rs3,584.10, Rating: OUTPERFORM, Target Price: Rs4,820.00, Analyst: Jatin Chawla
Target price scenario
Scenario TP %Up/Dwn Assumptions
Upside 6,000.0
0 67.41
Faster recovery in CV space and more new products launched by Wabco
Central case 4,820.0
0 34.48
Downside 3,000.0
0 (16.30) CV recovery delays
Key earnings drivers 3/14A 3/15E 3/16E 3/17E
Revenue growth (%) 15.0 18.9 36.8 34.3 Margins (%) 15.0 15.6 17.8 19.1
Income statement (Rs mn) 3/14A 3/15E 3/16E 3/17E
Sales revenue 11,107 13,206 18,073 24,266 Cost of goods sold 6,339 7,660 10,301 13,832 SG&A 3,107 3,487 4,548 5,788 Other operating exp./(inc.) — — — — EBITDA 1,662 2,059 3,223 4,647 Depreciation & amortisation 321.5 353.7 389.0 427.9 EBIT 1,340 1,706 2,834 4,219 Net interest expense/(inc.) 1.4 — — — Non-operating inc./(exp.) 272.1 150.0 180.0 216.0 Associates/JV — — — — Recurring PBT 1,611 1,856 3,014 4,435 Exceptionals/extraordinaries — — — — Taxes 436 557 904 1,331 Profit after tax 1,175 1,299 2,110 3,105 Other after tax income — — — — Minority interests — — — — Preferred dividends — — — — Reported net profit 1,175 1,299 2,110 3,105 Analyst adjustments — — — — Net profit (Credit Suisse) 1,175 1,299 2,110 3,105
Cash flow (Rs mn) 3/14A 3/15E 3/16E 3/17E
EBIT 1,340 1,706 2,834 4,219 Net interest 270.7 150.0 180.0 216.0 Tax paid (392) (557) (904) (1,331) Working capital (259) (467) (984) (1,244) Other cash & non-cash items 321.5 353.7 389.0 427.9 Operating cash flow 1,282 1,186 1,515 2,289 Capex (603) (750) (1,000) (1,000) Free cash flow to the firm 678 436 515 1,289 Disposals of fixed assets — — — — Acquisitions — — — — Divestments — — — — Associate investments — — — — Other investment/(outflows) — — — — Investing cash flow (603) (750) (1,000) (1,000) Equity raised — — — — Dividends paid (111.0) (132.6) (132.6) (132.6) Net borrowings — — — — Other financing cash flow — — — — Financing cash flow (111.0) (132.6) (132.6) (132.6) Total cash flow 567 303 382 1,156 Adjustments — — — — Net change in cash 567 303 382 1,156
Balance sheet (Rs mn) 3/14A 3/15E 3/16E 3/17E
Cash & cash equivalents 2,034 2,337 2,719 3,875 Current receivables 2,315 2,752 3,766 5,057 Inventories 1,124 1,337 1,830 2,457 Other current assets 807 960 1,152 1,383 Current assets 6,280 7,387 9,468 12,772 Property, plant & equip. 3,065 3,461 4,072 4,644 Investments 22.0 22.0 22.0 22.0 Intangibles — — — — Other non-current assets 111.0 111.0 111.0 111.0 Total assets 9,478 10,981 13,673 17,549 Accounts payable 1,470 1,748 2,392 3,212 Short-term debt — — — — Current provisions 294.2 353.0 423.6 508.3 Other current liabilities — — — — Current liabilities 1,764 2,101 2,816 3,720 Long-term debt 0.40 — — — Non-current provisions — — — — Other non-current liab. 161.4 161.4 161.4 161.4 Total liabilities 1,926 2,262 2,977 3,881 Shareholders' equity 7,552 8,718 10,695 13,667 Minority interests — — — — Total liabilities & equity 9,478 10,980 13,672 17,549
. 3/14A 3/15E 3/16E 3/17E
Shares (wtd avg.) (mn) 19.0 19.0 19.0 19.0 EPS (Credit Suisse) (Rs) 62 68 111 164 DPS (Rs) 5.00 6.00 6.00 6.00 BVPS (Rs) 398 458 564 721 Operating CFPS (Rs) 68 65 82 124
Key ratios and valuation 3/14A 3/15E 3/16E 3/17E
Growth(%) Sales revenue 15.0 15.5 36.5 33.9 EBIT (22.2) 24.6 71.2 48.1 Net profit (10.2) 8.4 67.0 46.5 EPS (10.2) 8.4 67.0 46.5 Margins (%) EBITDA 15.0 15.8 18.5 19.9 EBIT 12.1 13.0 16.3 18.1 Pre-tax profit 14.5 14.2 17.4 19.0 Net profit 10.6 9.9 12.1 13.3 Valuation metrics (x) P/E 59.0 54.4 32.6 22.2 P/B 9.2 8.0 6.5 5.1 Dividend yield (%) 0.14 0.16 0.16 0.16 P/CF 54.1 56.4 44.3 29.5 EV/sales 6.05 5.21 3.79 2.78 EV/EBITDA 40.5 33.1 20.5 14.0 EV/EBIT 50.2 40.1 23.2 15.4 ROE analysis (%) ROE 16.7 15.7 22.0 25.6 ROIC 18.1 19.8 28.2 33.8 Asset turnover (x) 1.17 1.18 1.29 1.34 Interest burden (x) 1.20 1.09 1.06 1.05 Tax burden (x) 0.73 0.70 0.70 0.70 Financial leverage (x) 1.26 1.25 1.27 1.28 Credit ratios Net debt/equity (%) (26.9) (27.4) (26.3) (29.4) Net debt/EBITDA (x) (1.22) (1.18) (0.87) (0.86) Interest cover (x) 927 — — —
Per share data 3/14A 3/15E 3/16E 3/17E
Shares (wtd avg.) (mn) 19.0 19.0 19.0 19.0 EPS (Credit Suisse) (Rs) 62 68 111 164 DPS (Rs) 5.00 6.00 6.00 6.00 BVPS (Rs) 398 460 564 721 Operating CFPS (Rs) 68 63 80 121
Source: Company data, Thomson Reuters, Credit Suisse estimates
0
5
10
15
20
25
30
35
40
45
2010 2011 2012 2012 2013
12MF P/E multiple
0
1
2
3
4
5
6
7
8
2010 2011 2012 2012 2013
12MF P/B multiple
Source: IBES
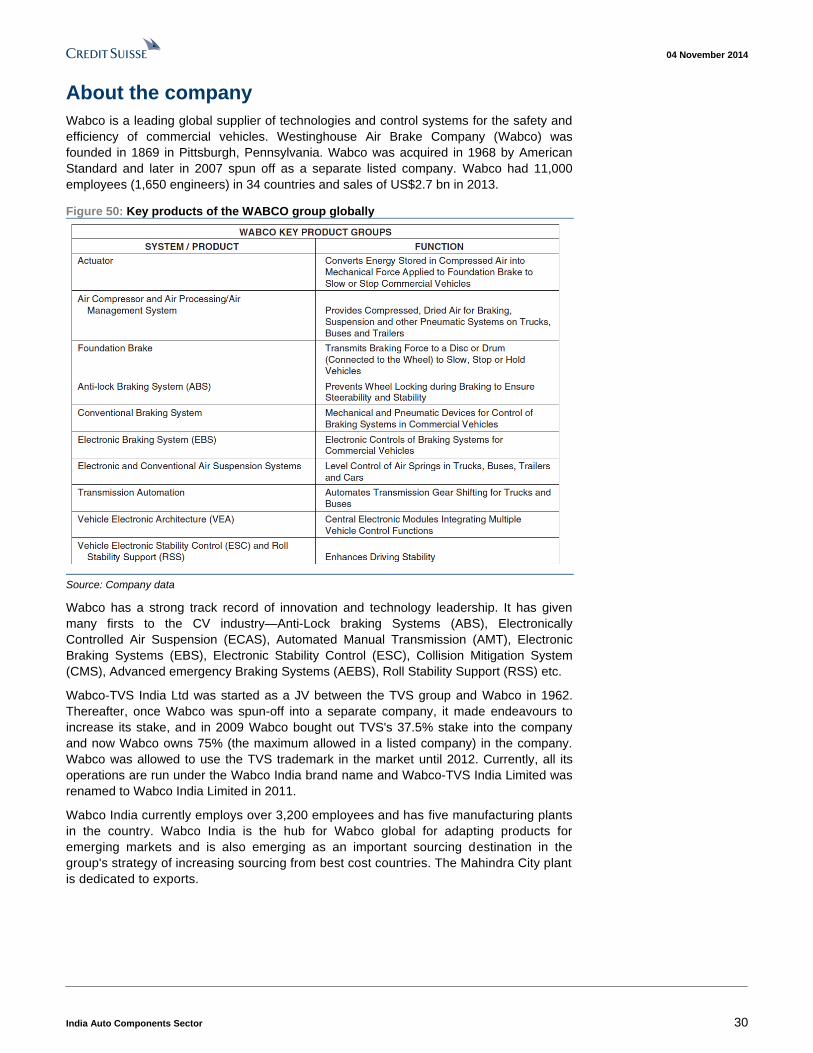
04 November 2014
India Auto Components Sector 30
About the company
Wabco is a leading global supplier of technologies and control systems for the safety and
efficiency of commercial vehicles. Westinghouse Air Brake Company (Wabco) was
founded in 1869 in Pittsburgh, Pennsylvania. Wabco was acquired in 1968 by American
Standard and later in 2007 spun off as a separate listed company. Wabco had 11,000
employees (1,650 engineers) in 34 countries and sales of US$2.7 bn in 2013.
Figure 50: Key products of the WABCO group globally
Source: Company data
Wabco has a strong track record of innovation and technology leadership. It has given
many firsts to the CV industry—Anti-Lock braking Systems (ABS), Electronically
Controlled Air Suspension (ECAS), Automated Manual Transmission (AMT), Electronic
Braking Systems (EBS), Electronic Stability Control (ESC), Collision Mitigation System
(CMS), Advanced emergency Braking Systems (AEBS), Roll Stability Support (RSS) etc.
Wabco-TVS India Ltd was started as a JV between the TVS group and Wabco in 1962.
Thereafter, once Wabco was spun-off into a separate company, it made endeavours to
increase its stake, and in 2009 Wabco bought out TVS's 37.5% stake into the company
and now Wabco owns 75% (the maximum allowed in a listed company) in the company.
Wabco was allowed to use the TVS trademark in the market until 2012. Currently, all its
operations are run under the Wabco India brand name and Wabco-TVS India Limited was
renamed to Wabco India Limited in 2011.
Wabco India currently employs over 3,200 employees and has five manufacturing plants
in the country. Wabco India is the hub for Wabco global for adapting products for
emerging markets and is also emerging as an important sourcing destination in the
group's strategy of increasing sourcing from best cost countries. The Mahindra City plant
is dedicated to exports.
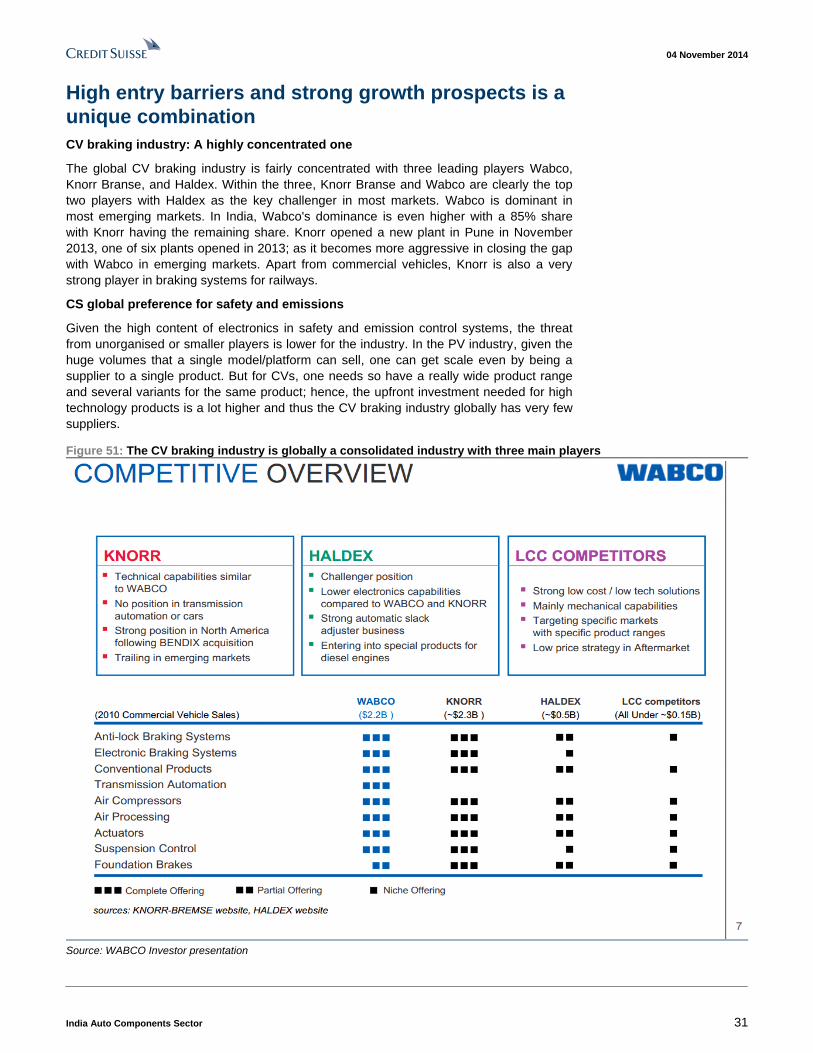
04 November 2014
India Auto Components Sector 31
High entry barriers and strong growth prospects is a
unique combination
CV braking industry: A highly concentrated one
The global CV braking industry is fairly concentrated with three leading players Wabco,
Knorr Branse, and Haldex. Within the three, Knorr Branse and Wabco are clearly the top
two players with Haldex as the key challenger in most markets. Wabco is dominant in
most emerging markets. In India, Wabco's dominance is even higher with a 85% share
with Knorr having the remaining share. Knorr opened a new plant in Pune in November
2013, one of six plants opened in 2013; as it becomes more aggressive in closing the gap
with Wabco in emerging markets. Apart from commercial vehicles, Knorr is also a very
strong player in braking systems for railways.
CS global preference for safety and emissions
Given the high content of electronics in safety and emission control systems, the threat
from unorganised or smaller players is lower for the industry. In the PV industry, given the
huge volumes that a single model/platform can sell, one can get scale even by being a
supplier to a single product. But for CVs, one needs so have a really wide product range
and several variants for the same product; hence, the upfront investment needed for high
technology products is a lot higher and thus the CV braking industry globally has very few
suppliers.
Figure 51: The CV braking industry is globally a consolidated industry with three main players
Source: WABCO Investor presentation
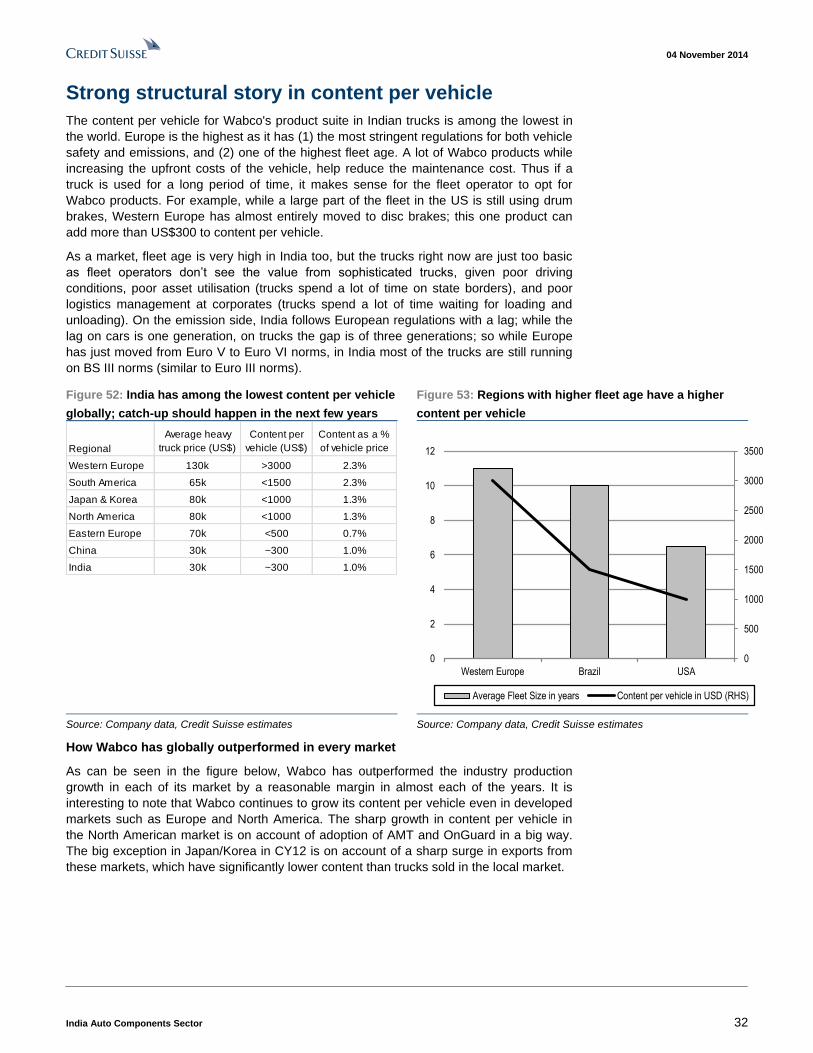
04 November 2014
India Auto Components Sector 32
Strong structural story in content per vehicle
The content per vehicle for Wabco's product suite in Indian trucks is among the lowest in
the world. Europe is the highest as it has (1) the most stringent regulations for both vehicle
safety and emissions, and (2) one of the highest fleet age. A lot of Wabco products while
increasing the upfront costs of the vehicle, help reduce the maintenance cost. Thus if a
truck is used for a long period of time, it makes sense for the fleet operator to opt for
Wabco products. For example, while a large part of the fleet in the US is still using drum
brakes, Western Europe has almost entirely moved to disc brakes; this one product can
add more than US$300 to content per vehicle.
As a market, fleet age is very high in India too, but the trucks right now are just too basic
as fleet operators don’t see the value from sophisticated trucks, given poor driving
conditions, poor asset utilisation (trucks spend a lot of time on state borders), and poor
logistics management at corporates (trucks spend a lot of time waiting for loading and
unloading). On the emission side, India follows European regulations with a lag; while the
lag on cars is one generation, on trucks the gap is of three generations; so while Europe
has just moved from Euro V to Euro VI norms, in India most of the trucks are still running
on BS III norms (similar to Euro III norms).
Figure 52: India has among the lowest content per vehicle
globally; catch-up should happen in the next few years
Figure 53: Regions with higher fleet age have a higher
content per vehicle
Regional
Average heavy
truck price (US$)
Content per
vehicle (US$)
Content as a %
of vehicle price
Western Europe 130k >3000 2.3%
South America 65k <1500 2.3%
Japan & Korea 80k <1000 1.3%
North America 80k <1000 1.3%
Eastern Europe 70k <500 0.7%
China 30k ~300 1.0%
India 30k ~300 1.0%
0
500
1000
1500
2000
2500
3000
3500
0
2
4
6
8
10
12
Western Europe Brazil USA
Average Fleet Size in years Content per vehicle in USD (RHS)
Source: Company data, Credit Suisse estimates Source: Company data, Credit Suisse estimates
How Wabco has globally outperformed in every market
As can be seen in the figure below, Wabco has outperformed the industry production
growth in each of its market by a reasonable margin in almost each of the years. It is
interesting to note that Wabco continues to grow its content per vehicle even in developed
markets such as Europe and North America. The sharp growth in content per vehicle in
the North American market is on account of adoption of AMT and OnGuard in a big way.
The big exception in Japan/Korea in CY12 is on account of a sharp surge in exports from
these markets, which have significantly lower content than trucks sold in the local market.
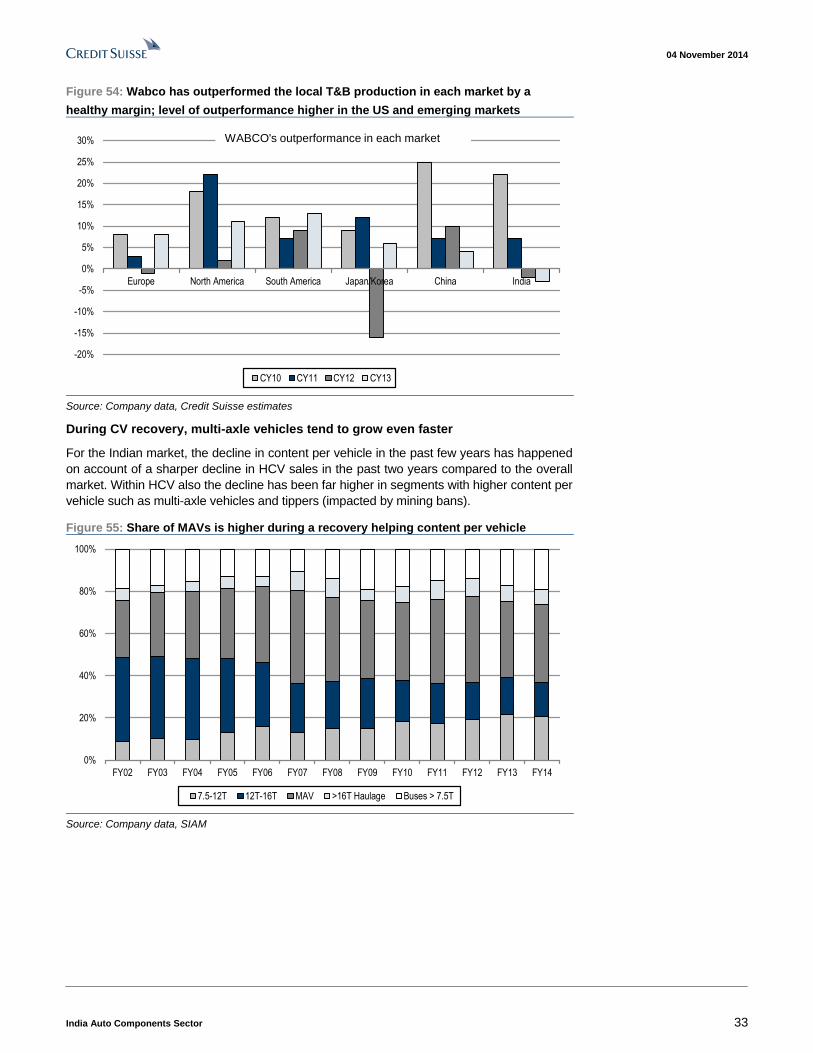
04 November 2014
India Auto Components Sector 33
Figure 54: Wabco has outperformed the local T&B production in each market by a
healthy margin; level of outperformance higher in the US and emerging markets
-20%
-15%
-10%
-5%
0%
5%
10%
15%
20%
25%
30%
Europe North America South America Japan/Korea China India
CY10 CY11 CY12 CY13
WABCO's outperformance in each market
Source: Company data, Credit Suisse estimates
During CV recovery, multi-axle vehicles tend to grow even faster
For the Indian market, the decline in content per vehicle in the past few years has happened
on account of a sharper decline in HCV sales in the past two years compared to the overall
market. Within HCV also the decline has been far higher in segments with higher content per
vehicle such as multi-axle vehicles and tippers (impacted by mining bans).
Figure 55: Share of MAVs is higher during a recovery helping content per vehicle
0%
20%
40%
60%
80%
100%
FY02 FY03 FY04 FY05 FY06 FY07 FY08 FY09 FY10 FY11 FY12 FY13 FY14
7.5-12T 12T-16T MAV >16T Haulage Buses > 7.5T
Source: Company data, SIAM
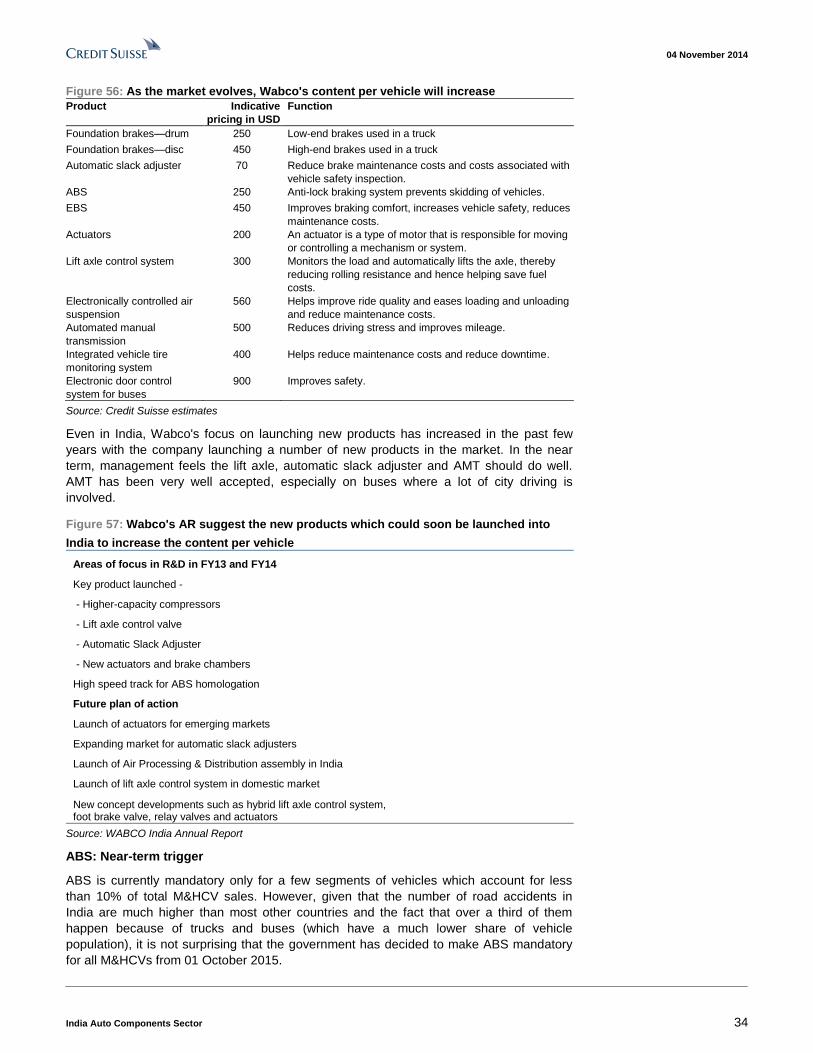
04 November 2014
India Auto Components Sector 34
Figure 56: As the market evolves, Wabco's content per vehicle will increase
Product Indicative
pricing in USD
Function
Foundation brakes—drum 250 Low-end brakes used in a truck
Foundation brakes—disc 450 High-end brakes used in a truck
Automatic slack adjuster 70 Reduce brake maintenance costs and costs associated with
vehicle safety inspection.
ABS 250 Anti-lock braking system prevents skidding of vehicles.
EBS 450 Improves braking comfort, increases vehicle safety, reduces
maintenance costs.
Actuators 200 An actuator is a type of motor that is responsible for moving
or controlling a mechanism or system.
Lift axle control system 300 Monitors the load and automatically lifts the axle, thereby
reducing rolling resistance and hence helping save fuel
costs.
Electronically controlled air
suspension
560 Helps improve ride quality and eases loading and unloading
and reduce maintenance costs.
Automated manual
transmission
500 Reduces driving stress and improves mileage.
Integrated vehicle tire
monitoring system
400 Helps reduce maintenance costs and reduce downtime.
Electronic door control
system for buses
900 Improves safety.
Source: Credit Suisse estimates
Even in India, Wabco's focus on launching new products has increased in the past few
years with the company launching a number of new products in the market. In the near
term, management feels the lift axle, automatic slack adjuster and AMT should do well.
AMT has been very well accepted, especially on buses where a lot of city driving is
involved.
Figure 57: Wabco's AR suggest the new products which could soon be launched into
India to increase the content per vehicle
Areas of focus in R&D in FY13 and FY14
Key product launched -
- Higher-capacity compressors
- Lift axle control valve
- Automatic Slack Adjuster
- New actuators and brake chambers
High speed track for ABS homologation
Future plan of action
Launch of actuators for emerging markets
Expanding market for automatic slack adjusters
Launch of Air Processing & Distribution assembly in India
Launch of lift axle control system in domestic market
New concept developments such as hybrid lift axle control system, foot brake valve, relay valves and actuators
Source: WABCO India Annual Report
ABS: Near-term trigger
ABS is currently mandatory only for a few segments of vehicles which account for less
than 10% of total M&HCV sales. However, given that the number of road accidents in
India are much higher than most other countries and the fact that over a third of them
happen because of trucks and buses (which have a much lower share of vehicle
population), it is not surprising that the government has decided to make ABS mandatory
for all M&HCVs from 01 October 2015.
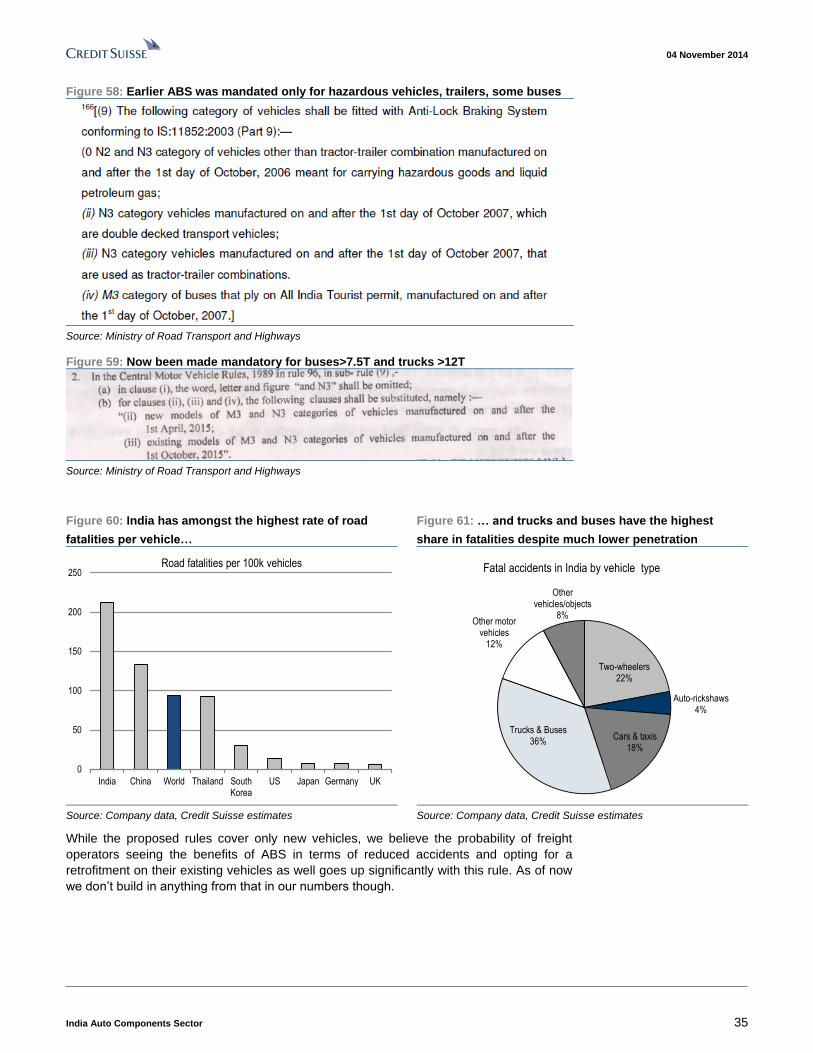
04 November 2014
India Auto Components Sector 35
Figure 58: Earlier ABS was mandated only for hazardous vehicles, trailers, some buses
Source: Ministry of Road Transport and Highways
Figure 59: Now been made mandatory for buses>7.5T and trucks >12T
Source: Ministry of Road Transport and Highways
Figure 60: India has amongst the highest rate of road
fatalities per vehicle…
Figure 61: … and trucks and buses have the highest
share in fatalities despite much lower penetration
0
50
100
150
200
250
India China World Thailand SouthKorea
US Japan Germany UK
Road fatalities per 100k vehicles
Two-wheelers22%
Auto-rickshaws4%
Cars & taxis18%
Trucks & Buses36%
Other motor vehicles
12%
Other vehicles/objects
8%
Fatal accidents in India by vehicle type
Source: Company data, Credit Suisse estimates Source: Company data, Credit Suisse estimates
While the proposed rules cover only new vehicles, we believe the probability of freight
operators seeing the benefits of ABS in terms of reduced accidents and opting for a
retrofitment on their existing vehicles as well goes up significantly with this rule. As of now
we don’t build in anything from that in our numbers though.
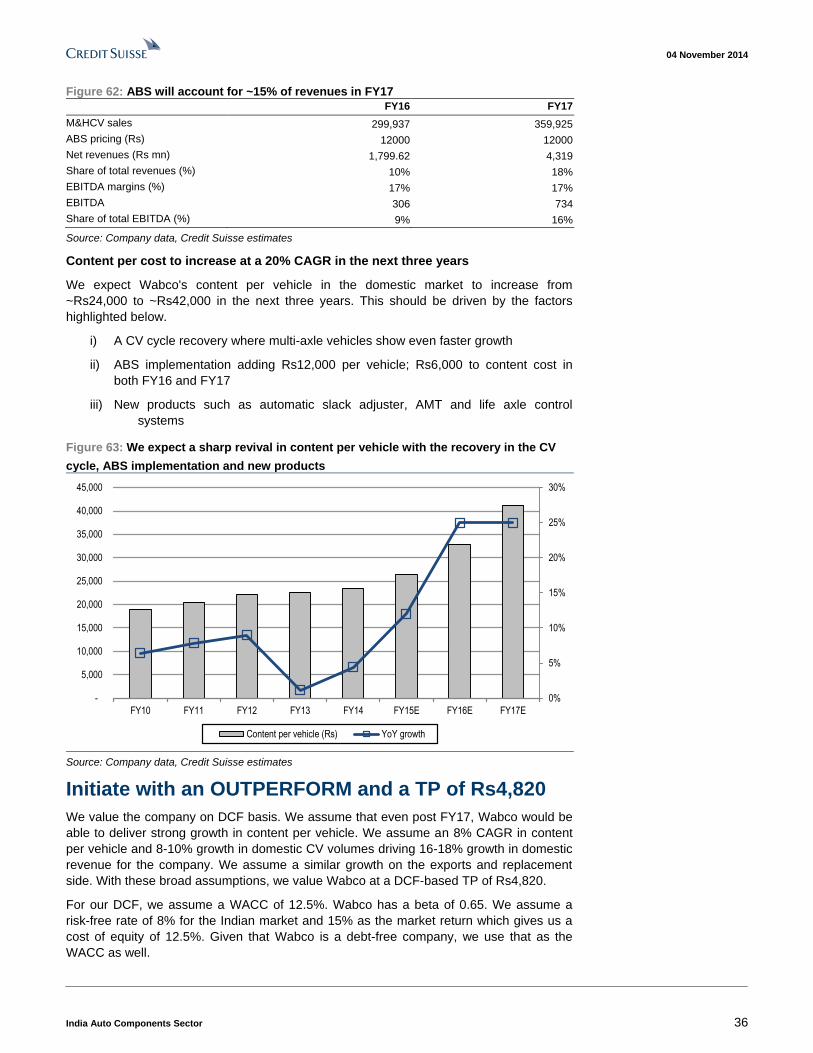
04 November 2014
India Auto Components Sector 36
Figure 62: ABS will account for ~15% of revenues in FY17
FY16 FY17
M&HCV sales 299,937 359,925
ABS pricing (Rs) 12000 12000
Net revenues (Rs mn) 1,799.62 4,319
Share of total revenues (%) 10% 18%
EBITDA margins (%) 17% 17%
EBITDA 306 734
Share of total EBITDA (%) 9% 16%
Source: Company data, Credit Suisse estimates
Content per cost to increase at a 20% CAGR in the next three years
We expect Wabco's content per vehicle in the domestic market to increase from
~Rs24,000 to ~Rs42,000 in the next three years. This should be driven by the factors
highlighted below.
i) A CV cycle recovery where multi-axle vehicles show even faster growth
ii) ABS implementation adding Rs12,000 per vehicle; Rs6,000 to content cost in
both FY16 and FY17
iii) New products such as automatic slack adjuster, AMT and life axle control
systems
Figure 63: We expect a sharp revival in content per vehicle with the recovery in the CV
cycle, ABS implementation and new products
0%
5%
10%
15%
20%
25%
30%
-
5,000
10,000
15,000
20,000
25,000
30,000
35,000
40,000
45,000
FY10 FY11 FY12 FY13 FY14 FY15E FY16E FY17E
Content per vehicle (Rs) YoY growth
Source: Company data, Credit Suisse estimates
Initiate with an OUTPERFORM and a TP of Rs4,820
We value the company on DCF basis. We assume that even post FY17, Wabco would be
able to deliver strong growth in content per vehicle. We assume an 8% CAGR in content
per vehicle and 8-10% growth in domestic CV volumes driving 16-18% growth in domestic
revenue for the company. We assume a similar growth on the exports and replacement
side. With these broad assumptions, we value Wabco at a DCF-based TP of Rs4,820.
For our DCF, we assume a WACC of 12.5%. Wabco has a beta of 0.65. We assume a
risk-free rate of 8% for the Indian market and 15% as the market return which gives us a
cost of equity of 12.5%. Given that Wabco is a debt-free company, we use that as the
WACC as well.
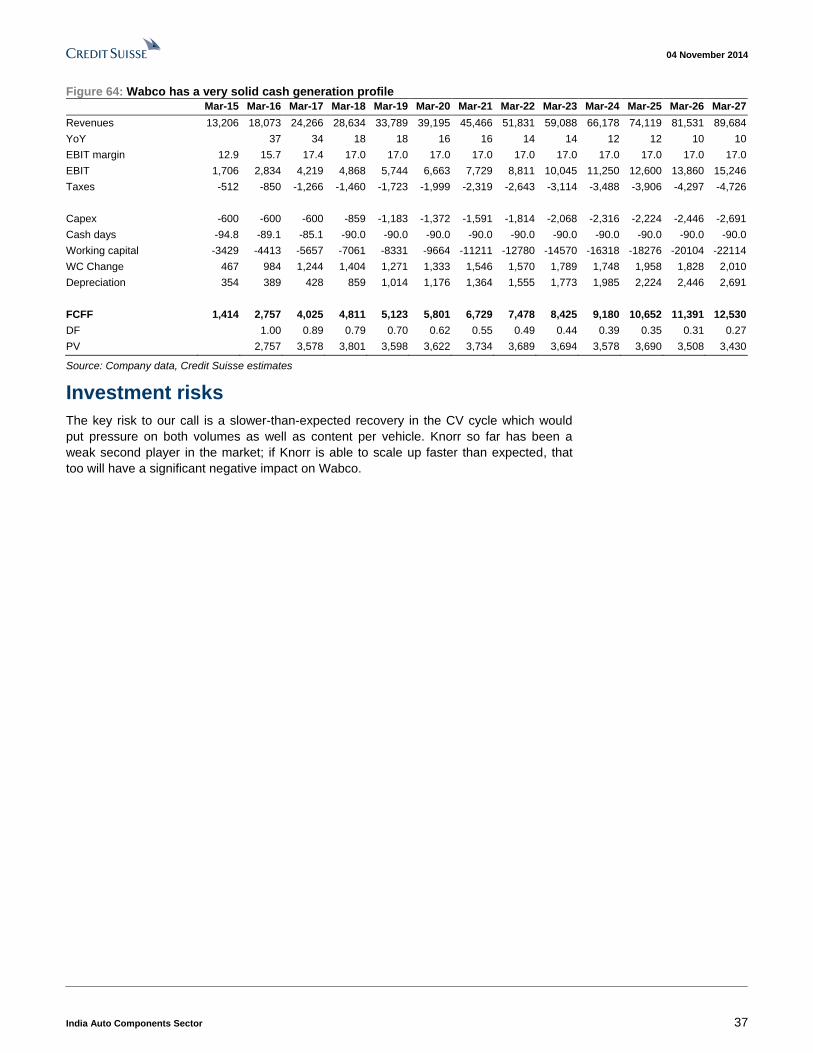
04 November 2014
India Auto Components Sector 37
Figure 64: Wabco has a very solid cash generation profile
Mar-15 Mar-16 Mar-17 Mar-18 Mar-19 Mar-20 Mar-21 Mar-22 Mar-23 Mar-24 Mar-25 Mar-26 Mar-27
Revenues 13,206 18,073 24,266 28,634 33,789 39,195 45,466 51,831 59,088 66,178 74,119 81,531 89,684
YoY 37 34 18 18 16 16 14 14 12 12 10 10
EBIT margin 12.9 15.7 17.4 17.0 17.0 17.0 17.0 17.0 17.0 17.0 17.0 17.0 17.0
EBIT 1,706 2,834 4,219 4,868 5,744 6,663 7,729 8,811 10,045 11,250 12,600 13,860 15,246
Taxes -512 -850 -1,266 -1,460 -1,723 -1,999 -2,319 -2,643 -3,114 -3,488 -3,906 -4,297 -4,726
Capex -600 -600 -600 -859 -1,183 -1,372 -1,591 -1,814 -2,068 -2,316 -2,224 -2,446 -2,691
Cash days -94.8 -89.1 -85.1 -90.0 -90.0 -90.0 -90.0 -90.0 -90.0 -90.0 -90.0 -90.0 -90.0
Working capital -3429 -4413 -5657 -7061 -8331 -9664 -11211 -12780 -14570 -16318 -18276 -20104 -22114
WC Change 467 984 1,244 1,404 1,271 1,333 1,546 1,570 1,789 1,748 1,958 1,828 2,010
Depreciation 354 389 428 859 1,014 1,176 1,364 1,555 1,773 1,985 2,224 2,446 2,691
FCFF 1,414 2,757 4,025 4,811 5,123 5,801 6,729 7,478 8,425 9,180 10,652 11,391 12,530
DF 1.00 0.89 0.79 0.70 0.62 0.55 0.49 0.44 0.39 0.35 0.31 0.27
PV 2,757 3,578 3,801 3,598 3,622 3,734 3,689 3,694 3,578 3,690 3,508 3,430
Source: Company data, Credit Suisse estimates
Investment risks
The key risk to our call is a slower-than-expected recovery in the CV cycle which would
put pressure on both volumes as well as content per vehicle. Knorr so far has been a
weak second player in the market; if Knorr is able to scale up faster than expected, that
too will have a significant negative impact on Wabco.
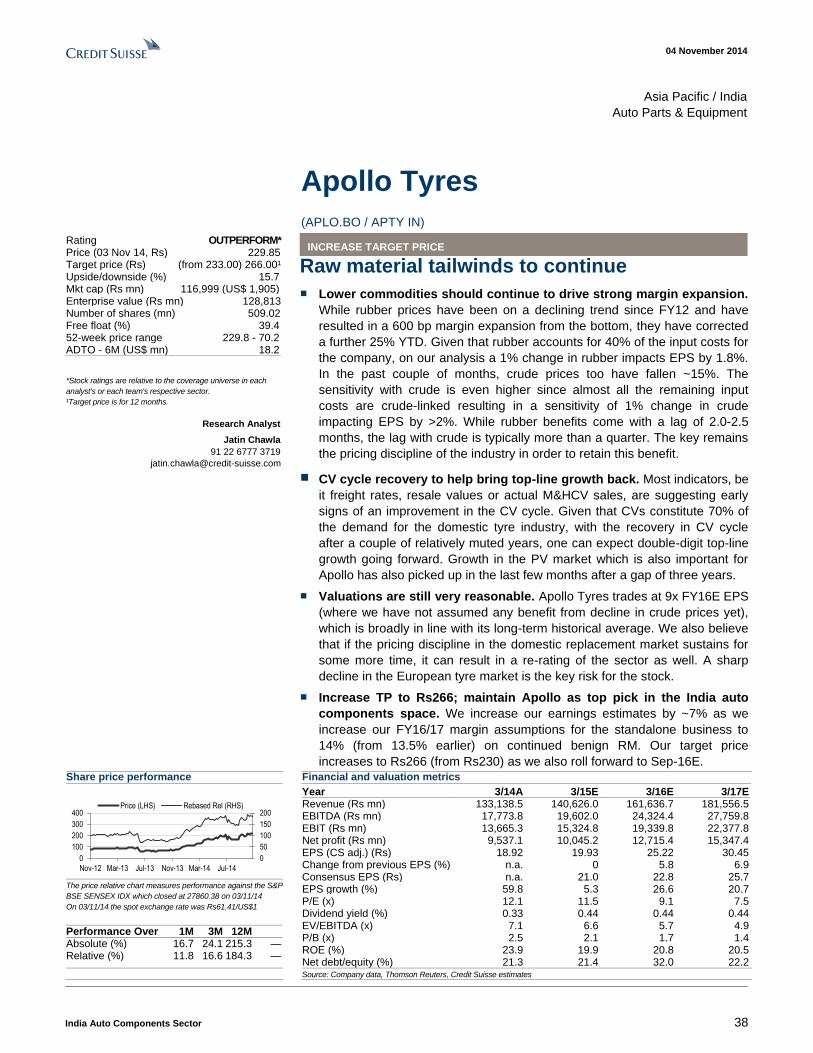
04 November 2014
India Auto Components Sector 38
Asia Pacific / India
Auto Parts & Equipment
Apollo Tyres
(APLO.BO / APTY IN) INCREASE TARGET PRICE
Raw material tailwinds to continue
■ Lower commodities should continue to drive strong margin expansion.
While rubber prices have been on a declining trend since FY12 and have
resulted in a 600 bp margin expansion from the bottom, they have corrected
a further 25% YTD. Given that rubber accounts for 40% of the input costs for
the company, on our analysis a 1% change in rubber impacts EPS by 1.8%.
In the past couple of months, crude prices too have fallen ~15%. The
sensitivity with crude is even higher since almost all the remaining input
costs are crude-linked resulting in a sensitivity of 1% change in crude
impacting EPS by >2%. While rubber benefits come with a lag of 2.0-2.5
months, the lag with crude is typically more than a quarter. The key remains
the pricing discipline of the industry in order to retain this benefit.
■ CV cycle recovery to help bring top-line growth back. Most indicators, be
it freight rates, resale values or actual M&HCV sales, are suggesting early
signs of an improvement in the CV cycle. Given that CVs constitute 70% of
the demand for the domestic tyre industry, with the recovery in CV cycle
after a couple of relatively muted years, one can expect double-digit top-line
growth going forward. Growth in the PV market which is also important for
Apollo has also picked up in the last few months after a gap of three years.
■ Valuations are still very reasonable. Apollo Tyres trades at 9x FY16E EPS
(where we have not assumed any benefit from decline in crude prices yet),
which is broadly in line with its long-term historical average. We also believe
that if the pricing discipline in the domestic replacement market sustains for
some more time, it can result in a re-rating of the sector as well. A sharp
decline in the European tyre market is the key risk for the stock.
■ Increase TP to Rs266; maintain Apollo as top pick in the India auto
components space. We increase our earnings estimates by ~7% as we
increase our FY16/17 margin assumptions for the standalone business to
14% (from 13.5% earlier) on continued benign RM. Our target price
increases to Rs266 (from Rs230) as we also roll forward to Sep-16E. Share price performance
0
50
100
150
200
0
100
200
300
400
Nov-12 Mar-13 Jul-13 Nov-13 Mar-14 Jul-14
Price (LHS) Rebased Rel (RHS)
The price relative chart measures performance against the S&P
BSE SENSEX IDX which closed at 27860.38 on 03/11/14
On 03/11/14 the spot exchange rate was Rs61.41/US$1
Performance Over 1M 3M 12M Absolute (%) 16.7 24.1 215.3 — Relative (%) 11.8 16.6 184.3 —
Financial and valuation metrics
Year 3/14A 3/15E 3/16E 3/17E Revenue (Rs mn) 133,138.5 140,626.0 161,636.7 181,556.5 EBITDA (Rs mn) 17,773.8 19,602.0 24,324.4 27,759.8 EBIT (Rs mn) 13,665.3 15,324.8 19,339.8 22,377.8 Net profit (Rs mn) 9,537.1 10,045.2 12,715.4 15,347.4 EPS (CS adj.) (Rs) 18.92 19.93 25.22 30.45 Change from previous EPS (%) n.a. 0 5.8 6.9 Consensus EPS (Rs) n.a. 21.0 22.8 25.7 EPS growth (%) 59.8 5.3 26.6 20.7 P/E (x) 12.1 11.5 9.1 7.5 Dividend yield (%) 0.33 0.44 0.44 0.44 EV/EBITDA (x) 7.1 6.6 5.7 4.9 P/B (x) 2.5 2.1 1.7 1.4 ROE (%) 23.9 19.9 20.8 20.5 Net debt/equity (%) 21.3 21.4 32.0 22.2
Source: Company data, Thomson Reuters, Credit Suisse estimates
Rating OUTPERFORM* Price (03 Nov 14, Rs) 229.85 Target price (Rs) (from 233.00) 266.00¹ Upside/downside (%) 15.7 Mkt cap (Rs mn) 116,999 (US$ 1,905) Enterprise value (Rs mn) 128,813 Number of shares (mn) 509.02 Free float (%) 39.4 52-week price range 229.8 - 70.2 ADTO - 6M (US$ mn) 18.2
*Stock ratings are relative to the coverage universe in each
analyst's or each team's respective sector.
¹Target price is for 12 months.
Research Analyst
Jatin Chawla
91 22 6777 3719
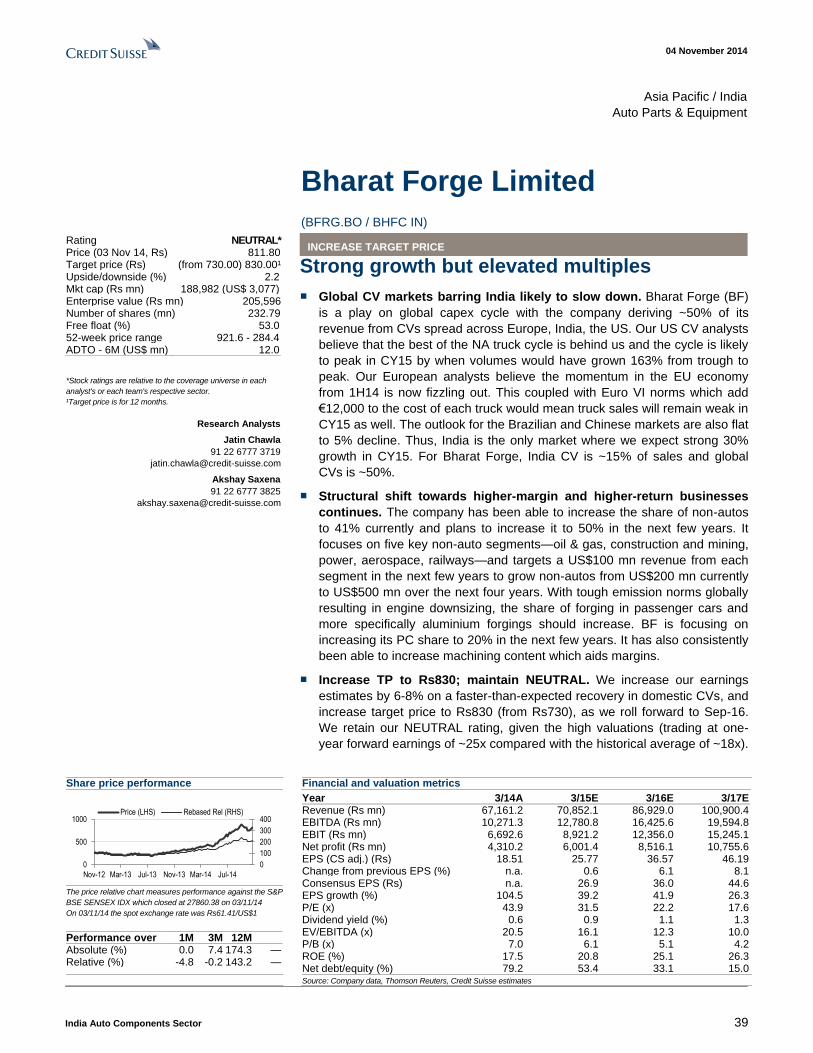
04 November 2014
India Auto Components Sector 39
Asia Pacific / India
Auto Parts & Equipment
Bharat Forge Limited
(BFRG.BO / BHFC IN) INCREASE TARGET PRICE
Strong growth but elevated multiples
■ Global CV markets barring India likely to slow down. Bharat Forge (BF)
is a play on global capex cycle with the company deriving ~50% of its
revenue from CVs spread across Europe, India, the US. Our US CV analysts
believe that the best of the NA truck cycle is behind us and the cycle is likely
to peak in CY15 by when volumes would have grown 163% from trough to
peak. Our European analysts believe the momentum in the EU economy
from 1H14 is now fizzling out. This coupled with Euro VI norms which add
€12,000 to the cost of each truck would mean truck sales will remain weak in
CY15 as well. The outlook for the Brazilian and Chinese markets are also flat
to 5% decline. Thus, India is the only market where we expect strong 30%
growth in CY15. For Bharat Forge, India CV is ~15% of sales and global
CVs is ~50%.
■ Structural shift towards higher-margin and higher-return businesses
continues. The company has been able to increase the share of non-autos
to 41% currently and plans to increase it to 50% in the next few years. It
focuses on five key non-auto segments—oil & gas, construction and mining,
power, aerospace, railways—and targets a US$100 mn revenue from each
segment in the next few years to grow non-autos from US$200 mn currently
to US$500 mn over the next four years. With tough emission norms globally
resulting in engine downsizing, the share of forging in passenger cars and
more specifically aluminium forgings should increase. BF is focusing on
increasing its PC share to 20% in the next few years. It has also consistently
been able to increase machining content which aids margins.
■ Increase TP to Rs830; maintain NEUTRAL. We increase our earnings
estimates by 6-8% on a faster-than-expected recovery in domestic CVs, and
increase target price to Rs830 (from Rs730), as we roll forward to Sep-16.
We retain our NEUTRAL rating, given the high valuations (trading at one-
year forward earnings of ~25x compared with the historical average of ~18x).
Share price performance
0
100
200
300
400
0
500
1000
Nov-12 Mar-13 Jul-13 Nov-13 Mar-14 Jul-14
Price (LHS) Rebased Rel (RHS)
The price relative chart measures performance against the S&P
BSE SENSEX IDX which closed at 27860.38 on 03/11/14
On 03/11/14 the spot exchange rate was Rs61.41/US$1
Performance over 1M 3M 12M Absolute (%) 0.0 7.4 174.3 — Relative (%) -4.8 -0.2 143.2 —
Financial and valuation metrics
Year 3/14A 3/15E 3/16E 3/17E Revenue (Rs mn) 67,161.2 70,852.1 86,929.0 100,900.4 EBITDA (Rs mn) 10,271.3 12,780.8 16,425.6 19,594.8 EBIT (Rs mn) 6,692.6 8,921.2 12,356.0 15,245.1 Net profit (Rs mn) 4,310.2 6,001.4 8,516.1 10,755.6 EPS (CS adj.) (Rs) 18.51 25.77 36.57 46.19 Change from previous EPS (%) n.a. 0.6 6.1 8.1 Consensus EPS (Rs) n.a. 26.9 36.0 44.6 EPS growth (%) 104.5 39.2 41.9 26.3 P/E (x) 43.9 31.5 22.2 17.6 Dividend yield (%) 0.6 0.9 1.1 1.3 EV/EBITDA (x) 20.5 16.1 12.3 10.0 P/B (x) 7.0 6.1 5.1 4.2 ROE (%) 17.5 20.8 25.1 26.3 Net debt/equity (%) 79.2 53.4 33.1 15.0
Source: Company data, Thomson Reuters, Credit Suisse estimates
Rating NEUTRAL* Price (03 Nov 14, Rs) 811.80 Target price (Rs) (from 730.00) 830.00¹ Upside/downside (%) 2.2 Mkt cap (Rs mn) 188,982 (US$ 3,077) Enterprise value (Rs mn) 205,596 Number of shares (mn) 232.79 Free float (%) 53.0 52-week price range 921.6 - 284.4 ADTO - 6M (US$ mn) 12.0
*Stock ratings are relative to the coverage universe in each
analyst's or each team's respective sector.
¹Target price is for 12 months.
Research Analysts
Jatin Chawla
91 22 6777 3719
Akshay Saxena
91 22 6777 3825
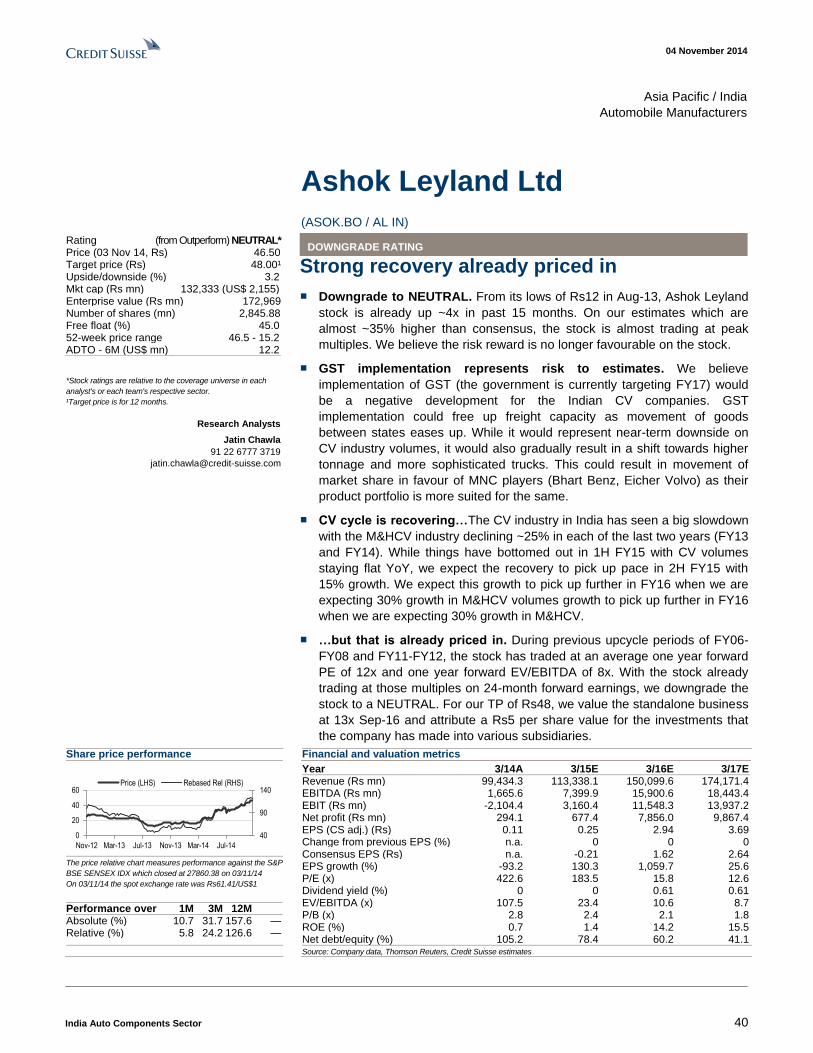
04 November 2014
India Auto Components Sector 40
Asia Pacific / India
Automobile Manufacturers
Ashok Leyland Ltd
(ASOK.BO / AL IN) DOWNGRADE RATING
Strong recovery already priced in
■ Downgrade to NEUTRAL. From its lows of Rs12 in Aug-13, Ashok Leyland
stock is already up ~4x in past 15 months. On our estimates which are
almost ~35% higher than consensus, the stock is almost trading at peak
multiples. We believe the risk reward is no longer favourable on the stock.
■ GST implementation represents risk to estimates. We believe
implementation of GST (the government is currently targeting FY17) would
be a negative development for the Indian CV companies. GST
implementation could free up freight capacity as movement of goods
between states eases up. While it would represent near-term downside on
CV industry volumes, it would also gradually result in a shift towards higher
tonnage and more sophisticated trucks. This could result in movement of
market share in favour of MNC players (Bhart Benz, Eicher Volvo) as their
product portfolio is more suited for the same.
■ CV cycle is recovering…The CV industry in India has seen a big slowdown
with the M&HCV industry declining ~25% in each of the last two years (FY13
and FY14). While things have bottomed out in 1H FY15 with CV volumes
staying flat YoY, we expect the recovery to pick up pace in 2H FY15 with
15% growth. We expect this growth to pick up further in FY16 when we are
expecting 30% growth in M&HCV volumes growth to pick up further in FY16
when we are expecting 30% growth in M&HCV.
■ …but that is already priced in. During previous upcycle periods of FY06-
FY08 and FY11-FY12, the stock has traded at an average one year forward
PE of 12x and one year forward EV/EBITDA of 8x. With the stock already
trading at those multiples on 24-month forward earnings, we downgrade the
stock to a NEUTRAL. For our TP of Rs48, we value the standalone business
at 13x Sep-16 and attribute a Rs5 per share value for the investments that
the company has made into various subsidiaries.
Share price performance
40
90
140
0
20
40
60
Nov-12 Mar-13 Jul-13 Nov-13 Mar-14 Jul-14
Price (LHS) Rebased Rel (RHS)
The price relative chart measures performance against the S&P
BSE SENSEX IDX which closed at 27860.38 on 03/11/14
On 03/11/14 the spot exchange rate was Rs61.41/US$1
Performance over 1M 3M 12M Absolute (%) 10.7 31.7 157.6 — Relative (%) 5.8 24.2 126.6 —
Financial and valuation metrics
Year 3/14A 3/15E 3/16E 3/17E Revenue (Rs mn) 99,434.3 113,338.1 150,099.6 174,171.4 EBITDA (Rs mn) 1,665.6 7,399.9 15,900.6 18,443.4 EBIT (Rs mn) -2,104.4 3,160.4 11,548.3 13,937.2 Net profit (Rs mn) 294.1 677.4 7,856.0 9,867.4 EPS (CS adj.) (Rs) 0.11 0.25 2.94 3.69 Change from previous EPS (%) n.a. 0 0 0 Consensus EPS (Rs) n.a. -0.21 1.62 2.64 EPS growth (%) -93.2 130.3 1,059.7 25.6 P/E (x) 422.6 183.5 15.8 12.6 Dividend yield (%) 0 0 0.61 0.61 EV/EBITDA (x) 107.5 23.4 10.6 8.7 P/B (x) 2.8 2.4 2.1 1.8 ROE (%) 0.7 1.4 14.2 15.5 Net debt/equity (%) 105.2 78.4 60.2 41.1
Source: Company data, Thomson Reuters, Credit Suisse estimates
Rating (from Outperform) NEUTRAL* Price (03 Nov 14, Rs) 46.50 Target price (Rs) 48.00¹ Upside/downside (%) 3.2 Mkt cap (Rs mn) 132,333 (US$ 2,155) Enterprise value (Rs mn) 172,969 Number of shares (mn) 2,845.88 Free float (%) 45.0 52-week price range 46.5 - 15.2 ADTO - 6M (US$ mn) 12.2
*Stock ratings are relative to the coverage universe in each
analyst's or each team's respective sector.
¹Target price is for 12 months.
Research Analysts
Jatin Chawla
91 22 6777 3719
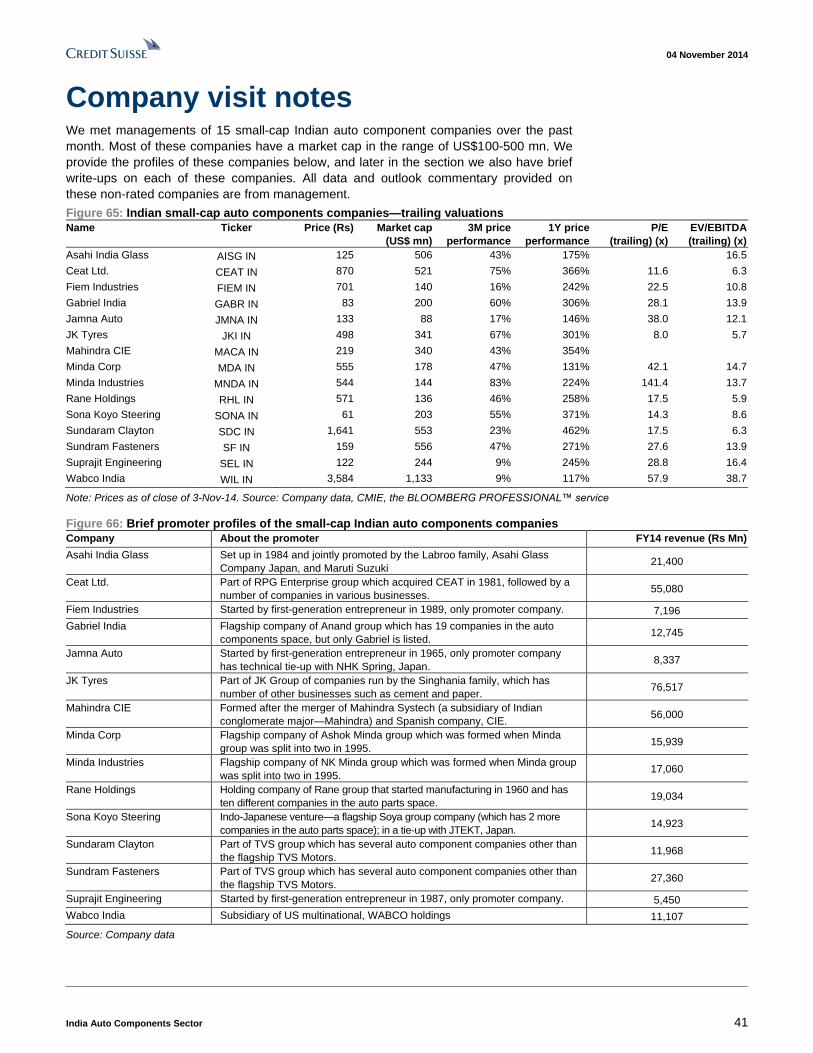
04 November 2014
India Auto Components Sector 41
Company visit notes We met managements of 15 small-cap Indian auto component companies over the past
month. Most of these companies have a market cap in the range of US$100-500 mn. We
provide the profiles of these companies below, and later in the section we also have brief
write-ups on each of these companies. All data and outlook commentary provided on
these non-rated companies are from management.
Figure 65: Indian small-cap auto components companies—trailing valuations
Name Ticker Price (Rs) Market cap
(US$ mn)
3M price
performance
1Y price
performance
P/E
(trailing) (x)
EV/EBITDA
(trailing) (x)
Asahi India Glass AISG IN 125 506 43% 175% 16.5
Ceat Ltd. CEAT IN 870 521 75% 366% 11.6 6.3
Fiem Industries FIEM IN 701 140 16% 242% 22.5 10.8
Gabriel India GABR IN 83 200 60% 306% 28.1 13.9
Jamna Auto JMNA IN 133 88 17% 146% 38.0 12.1
JK Tyres JKI IN 498 341 67% 301% 8.0 5.7
Mahindra CIE MACA IN 219 340 43% 354%
Minda Corp MDA IN 555 178 47% 131% 42.1 14.7
Minda Industries MNDA IN 544 144 83% 224% 141.4 13.7
Rane Holdings RHL IN 571 136 46% 258% 17.5 5.9
Sona Koyo Steering SONA IN 61 203 55% 371% 14.3 8.6
Sundaram Clayton SDC IN 1,641 553 23% 462% 17.5 6.3
Sundram Fasteners SF IN 159 556 47% 271% 27.6 13.9
Suprajit Engineering SEL IN 122 244 9% 245% 28.8 16.4
Wabco India WIL IN 3,584 1,133 9% 117% 57.9 38.7
Note: Prices as of close of 3-Nov-14. Source: Company data, CMIE, the BLOOMBERG PROFESSIONAL™ service
Figure 66: Brief promoter profiles of the small-cap Indian auto components companies
Company About the promoter FY14 revenue (Rs Mn)
Asahi India Glass Set up in 1984 and jointly promoted by the Labroo family, Asahi Glass
Company Japan, and Maruti Suzuki 21,400
Ceat Ltd. Part of RPG Enterprise group which acquired CEAT in 1981, followed by a
number of companies in various businesses. 55,080
Fiem Industries Started by first-generation entrepreneur in 1989, only promoter company. 7,196
Gabriel India Flagship company of Anand group which has 19 companies in the auto
components space, but only Gabriel is listed. 12,745
Jamna Auto Started by first-generation entrepreneur in 1965, only promoter company
has technical tie-up with NHK Spring, Japan. 8,337
JK Tyres Part of JK Group of companies run by the Singhania family, which has
number of other businesses such as cement and paper. 76,517
Mahindra CIE Formed after the merger of Mahindra Systech (a subsidiary of Indian
conglomerate major—Mahindra) and Spanish company, CIE. 56,000
Minda Corp Flagship company of Ashok Minda group which was formed when Minda
group was split into two in 1995. 15,939
Minda Industries Flagship company of NK Minda group which was formed when Minda group
was split into two in 1995. 17,060
Rane Holdings Holding company of Rane group that started manufacturing in 1960 and has
ten different companies in the auto parts space. 19,034
Sona Koyo Steering Indo-Japanese venture—a flagship Soya group company (which has 2 more
companies in the auto parts space); in a tie-up with JTEKT, Japan. 14,923
Sundaram Clayton Part of TVS group which has several auto component companies other than
the flagship TVS Motors. 11,968
Sundram Fasteners Part of TVS group which has several auto component companies other than
the flagship TVS Motors. 27,360
Suprajit Engineering Started by first-generation entrepreneur in 1987, only promoter company. 5,450
Wabco India Subsidiary of US multinational, WABCO holdings 11,107
Source: Company data
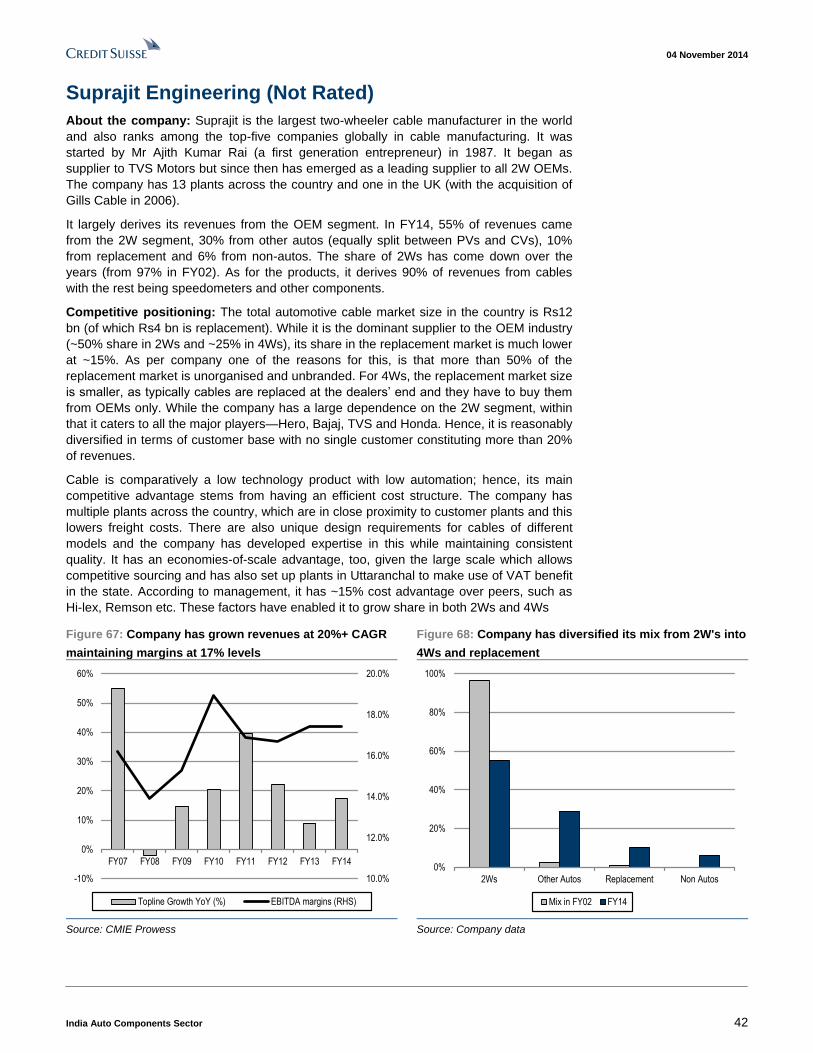
04 November 2014
India Auto Components Sector 42
Suprajit Engineering (Not Rated)
About the company: Suprajit is the largest two-wheeler cable manufacturer in the world
and also ranks among the top-five companies globally in cable manufacturing. It was
started by Mr Ajith Kumar Rai (a first generation entrepreneur) in 1987. It began as
supplier to TVS Motors but since then has emerged as a leading supplier to all 2W OEMs.
The company has 13 plants across the country and one in the UK (with the acquisition of
Gills Cable in 2006).
It largely derives its revenues from the OEM segment. In FY14, 55% of revenues came
from the 2W segment, 30% from other autos (equally split between PVs and CVs), 10%
from replacement and 6% from non-autos. The share of 2Ws has come down over the
years (from 97% in FY02). As for the products, it derives 90% of revenues from cables
with the rest being speedometers and other components.
Competitive positioning: The total automotive cable market size in the country is Rs12
bn (of which Rs4 bn is replacement). While it is the dominant supplier to the OEM industry
(~50% share in 2Ws and ~25% in 4Ws), its share in the replacement market is much lower
at ~15%. As per company one of the reasons for this, is that more than 50% of the
replacement market is unorganised and unbranded. For 4Ws, the replacement market size
is smaller, as typically cables are replaced at the dealers’ end and they have to buy them
from OEMs only. While the company has a large dependence on the 2W segment, within
that it caters to all the major players—Hero, Bajaj, TVS and Honda. Hence, it is reasonably
diversified in terms of customer base with no single customer constituting more than 20%
of revenues.
Cable is comparatively a low technology product with low automation; hence, its main
competitive advantage stems from having an efficient cost structure. The company has
multiple plants across the country, which are in close proximity to customer plants and this
lowers freight costs. There are also unique design requirements for cables of different
models and the company has developed expertise in this while maintaining consistent
quality. It has an economies-of-scale advantage, too, given the large scale which allows
competitive sourcing and has also set up plants in Uttaranchal to make use of VAT benefit
in the state. According to management, it has ~15% cost advantage over peers, such as
Hi-lex, Remson etc. These factors have enabled it to grow share in both 2Ws and 4Ws
Figure 67: Company has grown revenues at 20%+ CAGR
maintaining margins at 17% levels
Figure 68: Company has diversified its mix from 2W's into
4Ws and replacement
10.0%
12.0%
14.0%
16.0%
18.0%
20.0%
-10%
0%
10%
20%
30%
40%
50%
60%
FY07 FY08 FY09 FY10 FY11 FY12 FY13 FY14
Topline Growth YoY (%) EBITDA margins (RHS)
0%
20%
40%
60%
80%
100%
2Ws Other Autos Replacement Non Autos
Mix in FY02 FY14
Source: CMIE Prowess Source: Company data
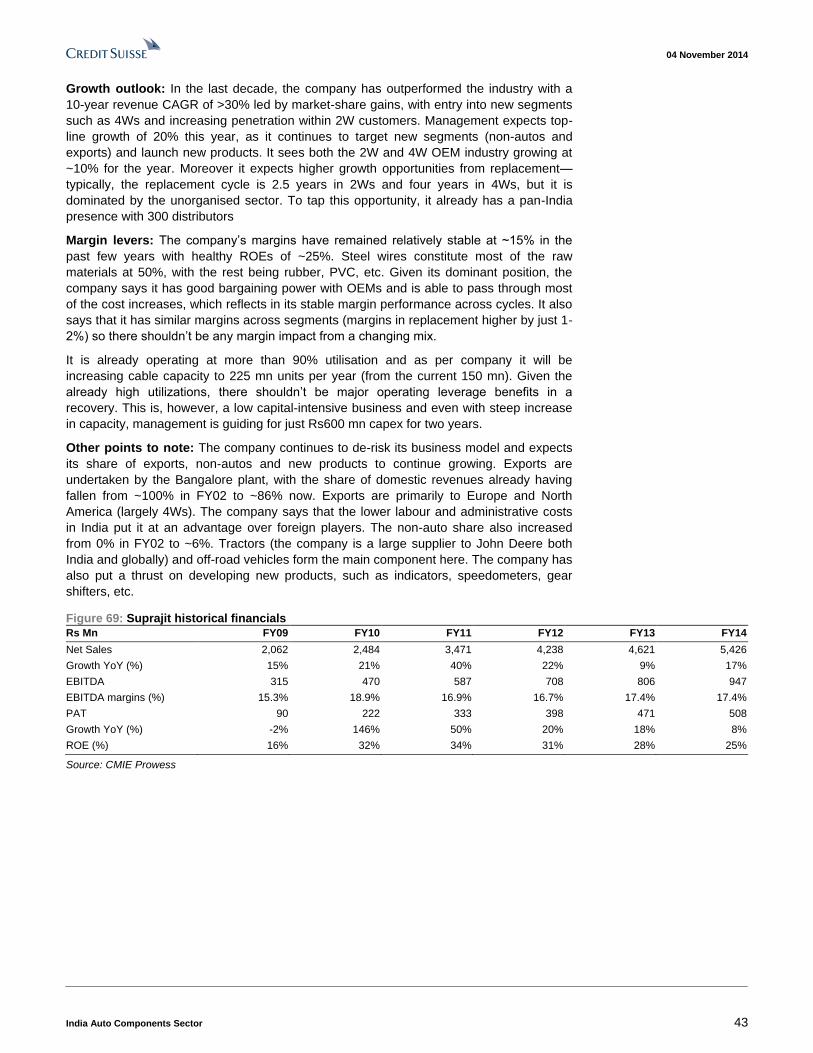
04 November 2014
India Auto Components Sector 43
Growth outlook: In the last decade, the company has outperformed the industry with a
10-year revenue CAGR of >30% led by market-share gains, with entry into new segments
such as 4Ws and increasing penetration within 2W customers. Management expects top-
line growth of 20% this year, as it continues to target new segments (non-autos and
exports) and launch new products. It sees both the 2W and 4W OEM industry growing at
~10% for the year. Moreover it expects higher growth opportunities from replacement—
typically, the replacement cycle is 2.5 years in 2Ws and four years in 4Ws, but it is
dominated by the unorganised sector. To tap this opportunity, it already has a pan-India
presence with 300 distributors
Margin levers: The company’s margins have remained relatively stable at ~15% in the
past few years with healthy ROEs of ~25%. Steel wires constitute most of the raw
materials at 50%, with the rest being rubber, PVC, etc. Given its dominant position, the
company says it has good bargaining power with OEMs and is able to pass through most
of the cost increases, which reflects in its stable margin performance across cycles. It also
says that it has similar margins across segments (margins in replacement higher by just 1-
2%) so there shouldn’t be any margin impact from a changing mix.
It is already operating at more than 90% utilisation and as per company it will be
increasing cable capacity to 225 mn units per year (from the current 150 mn). Given the
already high utilizations, there shouldn’t be major operating leverage benefits in a
recovery. This is, however, a low capital-intensive business and even with steep increase
in capacity, management is guiding for just Rs600 mn capex for two years.
Other points to note: The company continues to de-risk its business model and expects
its share of exports, non-autos and new products to continue growing. Exports are
undertaken by the Bangalore plant, with the share of domestic revenues already having
fallen from ~100% in FY02 to ~86% now. Exports are primarily to Europe and North
America (largely 4Ws). The company says that the lower labour and administrative costs
in India put it at an advantage over foreign players. The non-auto share also increased
from 0% in FY02 to ~6%. Tractors (the company is a large supplier to John Deere both
India and globally) and off-road vehicles form the main component here. The company has
also put a thrust on developing new products, such as indicators, speedometers, gear
shifters, etc.
Figure 69: Suprajit historical financials
Rs Mn FY09 FY10 FY11 FY12 FY13 FY14
Net Sales 2,062 2,484 3,471 4,238 4,621 5,426
Growth YoY (%) 15% 21% 40% 22% 9% 17%
EBITDA 315 470 587 708 806 947
EBITDA margins (%) 15.3% 18.9% 16.9% 16.7% 17.4% 17.4%
PAT 90 222 333 398 471 508
Growth YoY (%) -2% 146% 50% 20% 18% 8%
ROE (%) 16% 32% 34% 31% 28% 25%
Source: CMIE Prowess
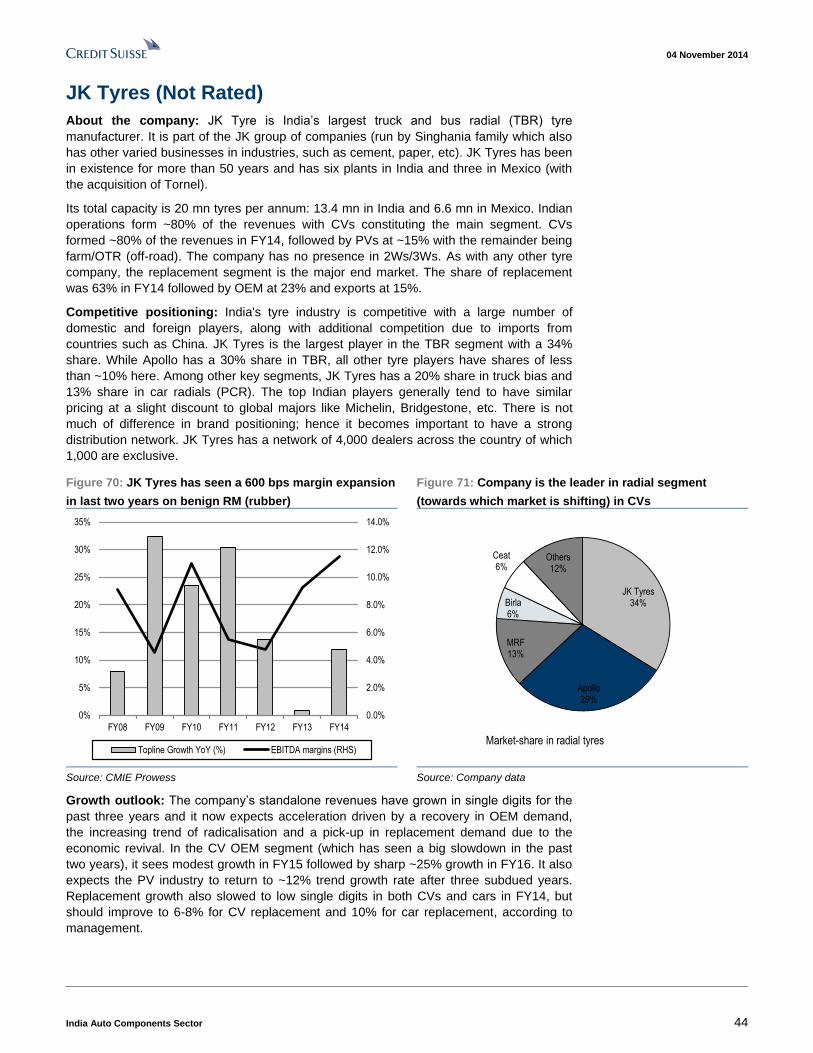
04 November 2014
India Auto Components Sector 44
JK Tyres (Not Rated)
About the company: JK Tyre is India’s largest truck and bus radial (TBR) tyre
manufacturer. It is part of the JK group of companies (run by Singhania family which also
has other varied businesses in industries, such as cement, paper, etc). JK Tyres has been
in existence for more than 50 years and has six plants in India and three in Mexico (with
the acquisition of Tornel).
Its total capacity is 20 mn tyres per annum: 13.4 mn in India and 6.6 mn in Mexico. Indian
operations form ~80% of the revenues with CVs constituting the main segment. CVs
formed ~80% of the revenues in FY14, followed by PVs at ~15% with the remainder being
farm/OTR (off-road). The company has no presence in 2Ws/3Ws. As with any other tyre
company, the replacement segment is the major end market. The share of replacement
was 63% in FY14 followed by OEM at 23% and exports at 15%.
Competitive positioning: India's tyre industry is competitive with a large number of
domestic and foreign players, along with additional competition due to imports from
countries such as China. JK Tyres is the largest player in the TBR segment with a 34%
share. While Apollo has a 30% share in TBR, all other tyre players have shares of less
than ~10% here. Among other key segments, JK Tyres has a 20% share in truck bias and
13% share in car radials (PCR). The top Indian players generally tend to have similar
pricing at a slight discount to global majors like Michelin, Bridgestone, etc. There is not
much of difference in brand positioning; hence it becomes important to have a strong
distribution network. JK Tyres has a network of 4,000 dealers across the country of which
1,000 are exclusive.
Figure 70: JK Tyres has seen a 600 bps margin expansion
in last two years on benign RM (rubber)
Figure 71: Company is the leader in radial segment
(towards which market is shifting) in CVs
0.0%
2.0%
4.0%
6.0%
8.0%
10.0%
12.0%
14.0%
0%
5%
10%
15%
20%
25%
30%
35%
FY08 FY09 FY10 FY11 FY12 FY13 FY14
Topline Growth YoY (%) EBITDA margins (RHS)
JK Tyres34%
Apollo29%
MRF13%
Birla6%
Ceat6%
Others12%
Market-share in radial tyres
Source: CMIE Prowess Source: Company data
Growth outlook: The company’s standalone revenues have grown in single digits for the
past three years and it now expects acceleration driven by a recovery in OEM demand,
the increasing trend of radicalisation and a pick-up in replacement demand due to the
economic revival. In the CV OEM segment (which has seen a big slowdown in the past
two years), it sees modest growth in FY15 followed by sharp ~25% growth in FY16. It also
expects the PV industry to return to ~12% trend growth rate after three subdued years.
Replacement growth also slowed to low single digits in both CVs and cars in FY14, but
should improve to 6-8% for CV replacement and 10% for car replacement, according to
management.
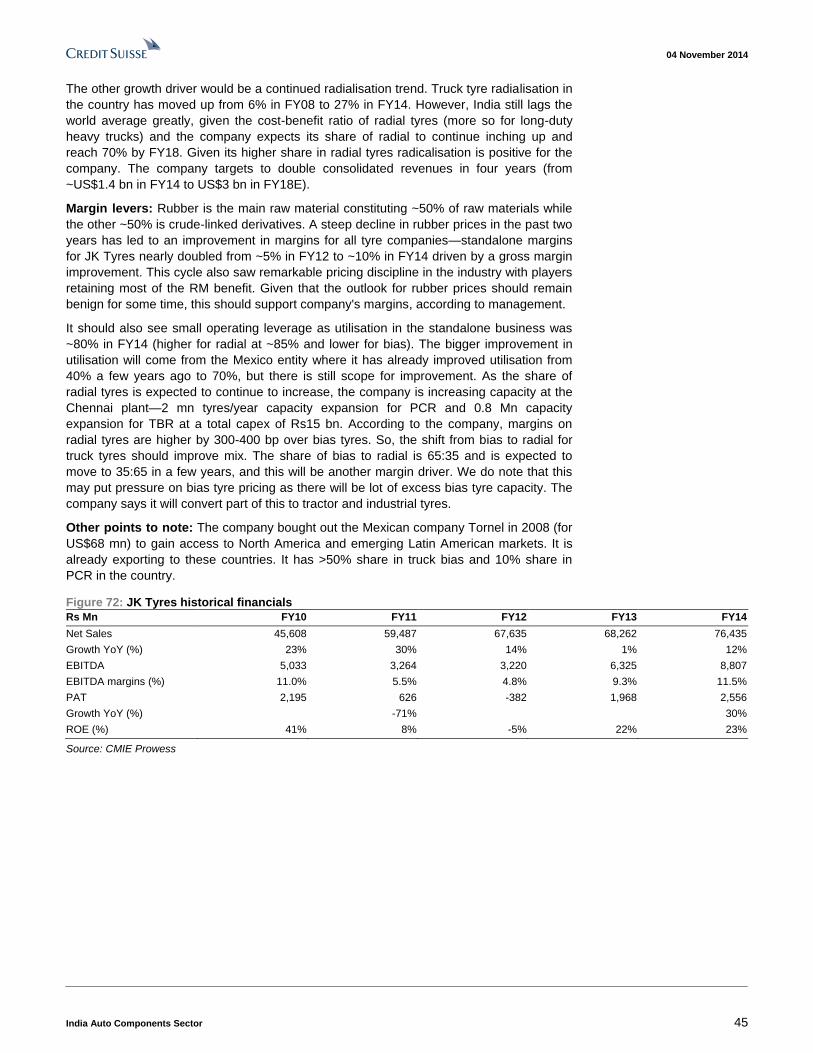
04 November 2014
India Auto Components Sector 45
The other growth driver would be a continued radialisation trend. Truck tyre radialisation in
the country has moved up from 6% in FY08 to 27% in FY14. However, India still lags the
world average greatly, given the cost-benefit ratio of radial tyres (more so for long-duty
heavy trucks) and the company expects its share of radial to continue inching up and
reach 70% by FY18. Given its higher share in radial tyres radicalisation is positive for the
company. The company targets to double consolidated revenues in four years (from
~US$1.4 bn in FY14 to US$3 bn in FY18E).
Margin levers: Rubber is the main raw material constituting ~50% of raw materials while
the other ~50% is crude-linked derivatives. A steep decline in rubber prices in the past two
years has led to an improvement in margins for all tyre companies—standalone margins
for JK Tyres nearly doubled from ~5% in FY12 to ~10% in FY14 driven by a gross margin
improvement. This cycle also saw remarkable pricing discipline in the industry with players
retaining most of the RM benefit. Given that the outlook for rubber prices should remain
benign for some time, this should support company's margins, according to management.
It should also see small operating leverage as utilisation in the standalone business was
~80% in FY14 (higher for radial at ~85% and lower for bias). The bigger improvement in
utilisation will come from the Mexico entity where it has already improved utilisation from
40% a few years ago to 70%, but there is still scope for improvement. As the share of
radial tyres is expected to continue to increase, the company is increasing capacity at the
Chennai plant—2 mn tyres/year capacity expansion for PCR and 0.8 Mn capacity
expansion for TBR at a total capex of Rs15 bn. According to the company, margins on
radial tyres are higher by 300-400 bp over bias tyres. So, the shift from bias to radial for
truck tyres should improve mix. The share of bias to radial is 65:35 and is expected to
move to 35:65 in a few years, and this will be another margin driver. We do note that this
may put pressure on bias tyre pricing as there will be lot of excess bias tyre capacity. The
company says it will convert part of this to tractor and industrial tyres.
Other points to note: The company bought out the Mexican company Tornel in 2008 (for
US$68 mn) to gain access to North America and emerging Latin American markets. It is
already exporting to these countries. It has >50% share in truck bias and 10% share in
PCR in the country.
Figure 72: JK Tyres historical financials
Rs Mn FY10 FY11 FY12 FY13 FY14
Net Sales 45,608 59,487 67,635 68,262 76,435
Growth YoY (%) 23% 30% 14% 1% 12%
EBITDA 5,033 3,264 3,220 6,325 8,807
EBITDA margins (%) 11.0% 5.5% 4.8% 9.3% 11.5%
PAT 2,195 626 -382 1,968 2,556
Growth YoY (%) -71% 30%
ROE (%) 41% 8% -5% 22% 23%
Source: CMIE Prowess
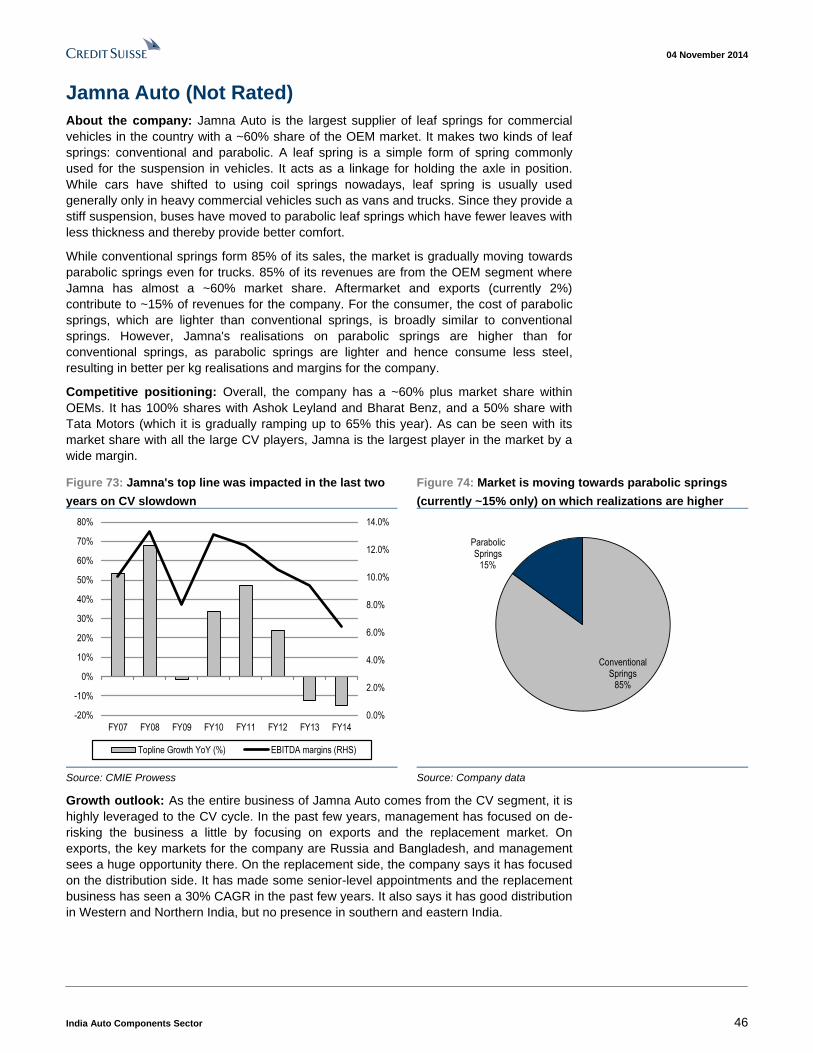
04 November 2014
India Auto Components Sector 46
Jamna Auto (Not Rated)
About the company: Jamna Auto is the largest supplier of leaf springs for commercial
vehicles in the country with a ~60% share of the OEM market. It makes two kinds of leaf
springs: conventional and parabolic. A leaf spring is a simple form of spring commonly
used for the suspension in vehicles. It acts as a linkage for holding the axle in position.
While cars have shifted to using coil springs nowadays, leaf spring is usually used
generally only in heavy commercial vehicles such as vans and trucks. Since they provide a
stiff suspension, buses have moved to parabolic leaf springs which have fewer leaves with
less thickness and thereby provide better comfort.
While conventional springs form 85% of its sales, the market is gradually moving towards
parabolic springs even for trucks. 85% of its revenues are from the OEM segment where
Jamna has almost a ~60% market share. Aftermarket and exports (currently 2%)
contribute to ~15% of revenues for the company. For the consumer, the cost of parabolic
springs, which are lighter than conventional springs, is broadly similar to conventional
springs. However, Jamna's realisations on parabolic springs are higher than for
conventional springs, as parabolic springs are lighter and hence consume less steel,
resulting in better per kg realisations and margins for the company.
Competitive positioning: Overall, the company has a ~60% plus market share within
OEMs. It has 100% shares with Ashok Leyland and Bharat Benz, and a 50% share with
Tata Motors (which it is gradually ramping up to 65% this year). As can be seen with its
market share with all the large CV players, Jamna is the largest player in the market by a
wide margin.
Figure 73: Jamna's top line was impacted in the last two
years on CV slowdown
Figure 74: Market is moving towards parabolic springs
(currently ~15% only) on which realizations are higher
0.0%
2.0%
4.0%
6.0%
8.0%
10.0%
12.0%
14.0%
-20%
-10%
0%
10%
20%
30%
40%
50%
60%
70%
80%
FY07 FY08 FY09 FY10 FY11 FY12 FY13 FY14
Topline Growth YoY (%) EBITDA margins (RHS)
Conventional Springs
85%
Parabolic Springs
15%
Source: CMIE Prowess Source: Company data
Growth outlook: As the entire business of Jamna Auto comes from the CV segment, it is
highly leveraged to the CV cycle. In the past few years, management has focused on de-
risking the business a little by focusing on exports and the replacement market. On
exports, the key markets for the company are Russia and Bangladesh, and management
sees a huge opportunity there. On the replacement side, the company says it has focused
on the distribution side. It has made some senior-level appointments and the replacement
business has seen a 30% CAGR in the past few years. It also says it has good distribution
in Western and Northern India, but no presence in southern and eastern India.
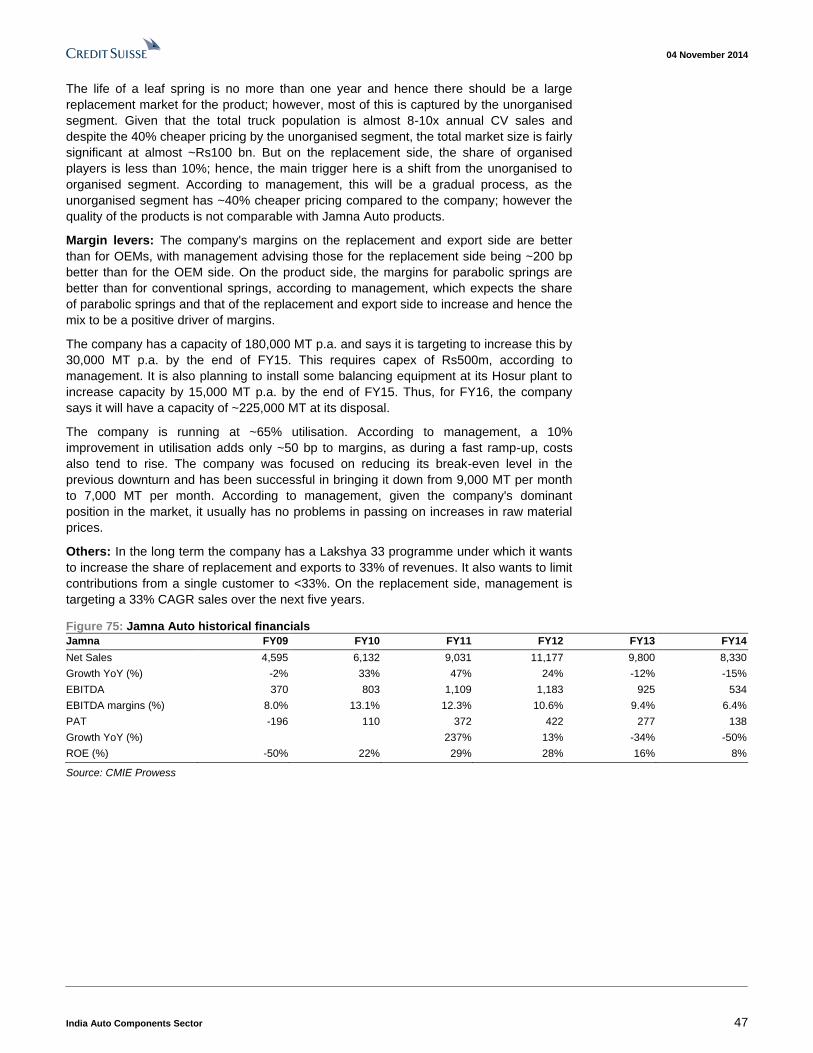
04 November 2014
India Auto Components Sector 47
The life of a leaf spring is no more than one year and hence there should be a large
replacement market for the product; however, most of this is captured by the unorganised
segment. Given that the total truck population is almost 8-10x annual CV sales and
despite the 40% cheaper pricing by the unorganised segment, the total market size is fairly
significant at almost ~Rs100 bn. But on the replacement side, the share of organised
players is less than 10%; hence, the main trigger here is a shift from the unorganised to
organised segment. According to management, this will be a gradual process, as the
unorganised segment has ~40% cheaper pricing compared to the company; however the
quality of the products is not comparable with Jamna Auto products.
Margin levers: The company's margins on the replacement and export side are better
than for OEMs, with management advising those for the replacement side being ~200 bp
better than for the OEM side. On the product side, the margins for parabolic springs are
better than for conventional springs, according to management, which expects the share
of parabolic springs and that of the replacement and export side to increase and hence the
mix to be a positive driver of margins.
The company has a capacity of 180,000 MT p.a. and says it is targeting to increase this by
30,000 MT p.a. by the end of FY15. This requires capex of Rs500m, according to
management. It is also planning to install some balancing equipment at its Hosur plant to
increase capacity by 15,000 MT p.a. by the end of FY15. Thus, for FY16, the company
says it will have a capacity of ~225,000 MT at its disposal.
The company is running at ~65% utilisation. According to management, a 10%
improvement in utilisation adds only ~50 bp to margins, as during a fast ramp-up, costs
also tend to rise. The company was focused on reducing its break-even level in the
previous downturn and has been successful in bringing it down from 9,000 MT per month
to 7,000 MT per month. According to management, given the company's dominant
position in the market, it usually has no problems in passing on increases in raw material
prices.
Others: In the long term the company has a Lakshya 33 programme under which it wants
to increase the share of replacement and exports to 33% of revenues. It also wants to limit
contributions from a single customer to <33%. On the replacement side, management is
targeting a 33% CAGR sales over the next five years.
Figure 75: Jamna Auto historical financials
Jamna FY09 FY10 FY11 FY12 FY13 FY14
Net Sales 4,595 6,132 9,031 11,177 9,800 8,330
Growth YoY (%) -2% 33% 47% 24% -12% -15%
EBITDA 370 803 1,109 1,183 925 534
EBITDA margins (%) 8.0% 13.1% 12.3% 10.6% 9.4% 6.4%
PAT -196 110 372 422 277 138
Growth YoY (%) 237% 13% -34% -50%
ROE (%) -50% 22% 29% 28% 16% 8%
Source: CMIE Prowess
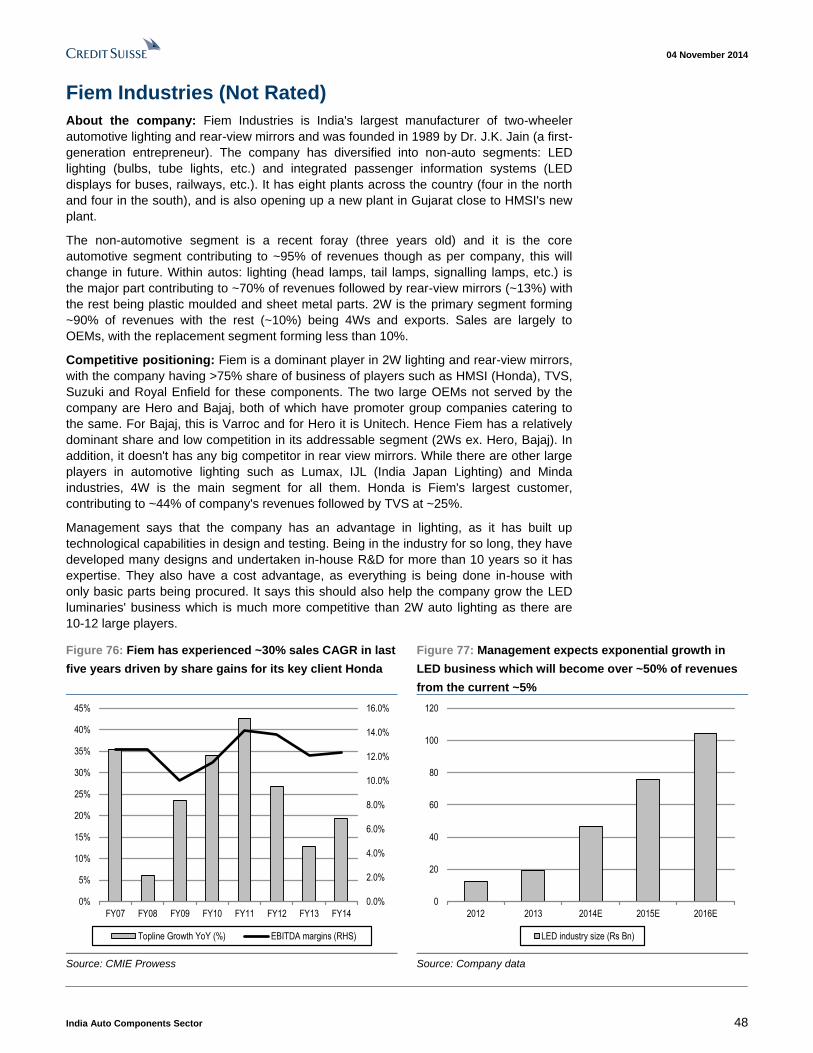
04 November 2014
India Auto Components Sector 48
Fiem Industries (Not Rated)
About the company: Fiem Industries is India's largest manufacturer of two-wheeler
automotive lighting and rear-view mirrors and was founded in 1989 by Dr. J.K. Jain (a first-
generation entrepreneur). The company has diversified into non-auto segments: LED
lighting (bulbs, tube lights, etc.) and integrated passenger information systems (LED
displays for buses, railways, etc.). It has eight plants across the country (four in the north
and four in the south), and is also opening up a new plant in Gujarat close to HMSI's new
plant.
The non-automotive segment is a recent foray (three years old) and it is the core
automotive segment contributing to ~95% of revenues though as per company, this will
change in future. Within autos: lighting (head lamps, tail lamps, signalling lamps, etc.) is
the major part contributing to ~70% of revenues followed by rear-view mirrors (~13%) with
the rest being plastic moulded and sheet metal parts. 2W is the primary segment forming
~90% of revenues with the rest (~10%) being 4Ws and exports. Sales are largely to
OEMs, with the replacement segment forming less than 10%.
Competitive positioning: Fiem is a dominant player in 2W lighting and rear-view mirrors,
with the company having >75% share of business of players such as HMSI (Honda), TVS,
Suzuki and Royal Enfield for these components. The two large OEMs not served by the
company are Hero and Bajaj, both of which have promoter group companies catering to
the same. For Bajaj, this is Varroc and for Hero it is Unitech. Hence Fiem has a relatively
dominant share and low competition in its addressable segment (2Ws ex. Hero, Bajaj). In
addition, it doesn't has any big competitor in rear view mirrors. While there are other large
players in automotive lighting such as Lumax, IJL (India Japan Lighting) and Minda
industries, 4W is the main segment for all them. Honda is Fiem's largest customer,
contributing to ~44% of company's revenues followed by TVS at ~25%.
Management says that the company has an advantage in lighting, as it has built up
technological capabilities in design and testing. Being in the industry for so long, they have
developed many designs and undertaken in-house R&D for more than 10 years so it has
expertise. They also have a cost advantage, as everything is being done in-house with
only basic parts being procured. It says this should also help the company grow the LED
luminaries' business which is much more competitive than 2W auto lighting as there are
10-12 large players.
Figure 76: Fiem has experienced ~30% sales CAGR in last
five years driven by share gains for its key client Honda
Figure 77: Management expects exponential growth in
LED business which will become over ~50% of revenues
from the current ~5%
0.0%
2.0%
4.0%
6.0%
8.0%
10.0%
12.0%
14.0%
16.0%
0%
5%
10%
15%
20%
25%
30%
35%
40%
45%
FY07 FY08 FY09 FY10 FY11 FY12 FY13 FY14
Topline Growth YoY (%) EBITDA margins (RHS)
0
20
40
60
80
100
120
2012 2013 2014E 2015E 2016E
LED industry size (Rs Bn)
Source: CMIE Prowess Source: Company data
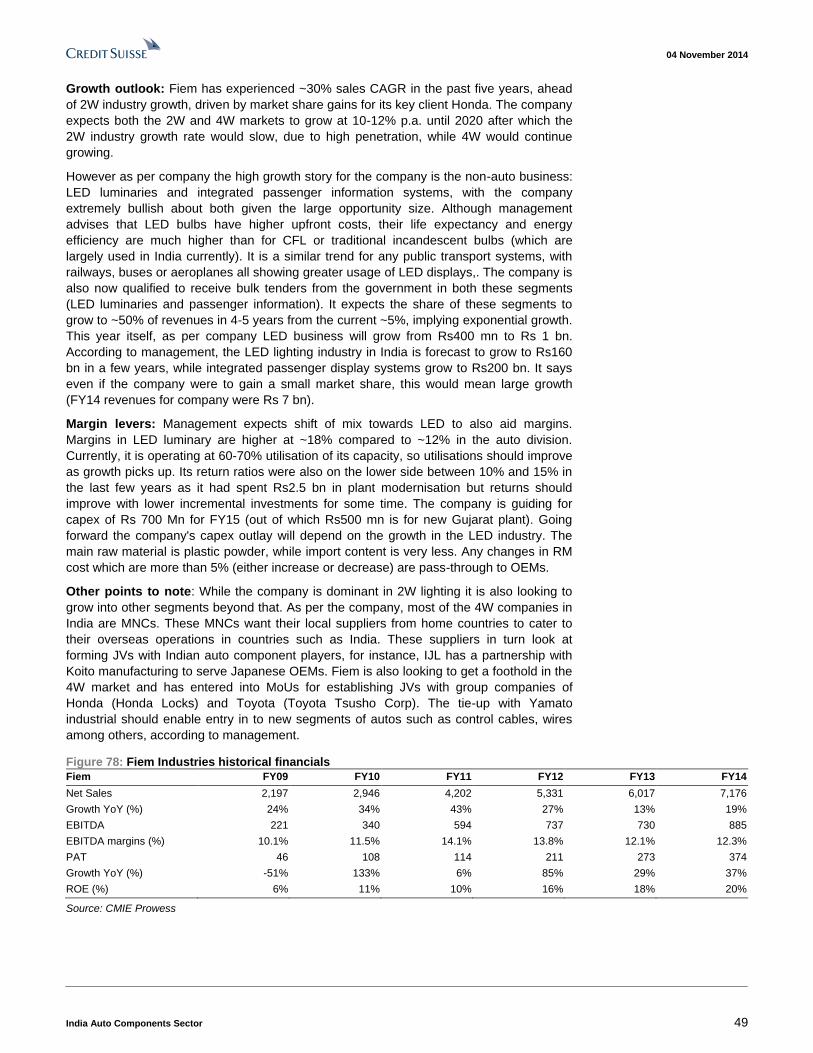
04 November 2014
India Auto Components Sector 49
Growth outlook: Fiem has experienced ~30% sales CAGR in the past five years, ahead
of 2W industry growth, driven by market share gains for its key client Honda. The company
expects both the 2W and 4W markets to grow at 10-12% p.a. until 2020 after which the
2W industry growth rate would slow, due to high penetration, while 4W would continue
growing.
However as per company the high growth story for the company is the non-auto business:
LED luminaries and integrated passenger information systems, with the company
extremely bullish about both given the large opportunity size. Although management
advises that LED bulbs have higher upfront costs, their life expectancy and energy
efficiency are much higher than for CFL or traditional incandescent bulbs (which are
largely used in India currently). It is a similar trend for any public transport systems, with
railways, buses or aeroplanes all showing greater usage of LED displays,. The company is
also now qualified to receive bulk tenders from the government in both these segments
(LED luminaries and passenger information). It expects the share of these segments to
grow to ~50% of revenues in 4-5 years from the current ~5%, implying exponential growth.
This year itself, as per company LED business will grow from Rs400 mn to Rs 1 bn.
According to management, the LED lighting industry in India is forecast to grow to Rs160
bn in a few years, while integrated passenger display systems grow to Rs200 bn. It says
even if the company were to gain a small market share, this would mean large growth
(FY14 revenues for company were Rs 7 bn).
Margin levers: Management expects shift of mix towards LED to also aid margins.
Margins in LED luminary are higher at ~18% compared to ~12% in the auto division.
Currently, it is operating at 60-70% utilisation of its capacity, so utilisations should improve
as growth picks up. Its return ratios were also on the lower side between 10% and 15% in
the last few years as it had spent Rs2.5 bn in plant modernisation but returns should
improve with lower incremental investments for some time. The company is guiding for
capex of Rs 700 Mn for FY15 (out of which Rs500 mn is for new Gujarat plant). Going
forward the company's capex outlay will depend on the growth in the LED industry. The
main raw material is plastic powder, while import content is very less. Any changes in RM
cost which are more than 5% (either increase or decrease) are pass-through to OEMs.
Other points to note: While the company is dominant in 2W lighting it is also looking to
grow into other segments beyond that. As per the company, most of the 4W companies in
India are MNCs. These MNCs want their local suppliers from home countries to cater to
their overseas operations in countries such as India. These suppliers in turn look at
forming JVs with Indian auto component players, for instance, IJL has a partnership with
Koito manufacturing to serve Japanese OEMs. Fiem is also looking to get a foothold in the
4W market and has entered into MoUs for establishing JVs with group companies of
Honda (Honda Locks) and Toyota (Toyota Tsusho Corp). The tie-up with Yamato
industrial should enable entry in to new segments of autos such as control cables, wires
among others, according to management.
Figure 78: Fiem Industries historical financials
Fiem FY09 FY10 FY11 FY12 FY13 FY14
Net Sales 2,197 2,946 4,202 5,331 6,017 7,176
Growth YoY (%) 24% 34% 43% 27% 13% 19%
EBITDA 221 340 594 737 730 885
EBITDA margins (%) 10.1% 11.5% 14.1% 13.8% 12.1% 12.3%
PAT 46 108 114 211 273 374
Growth YoY (%) -51% 133% 6% 85% 29% 37%
ROE (%) 6% 11% 10% 16% 18% 20%
Source: CMIE Prowess
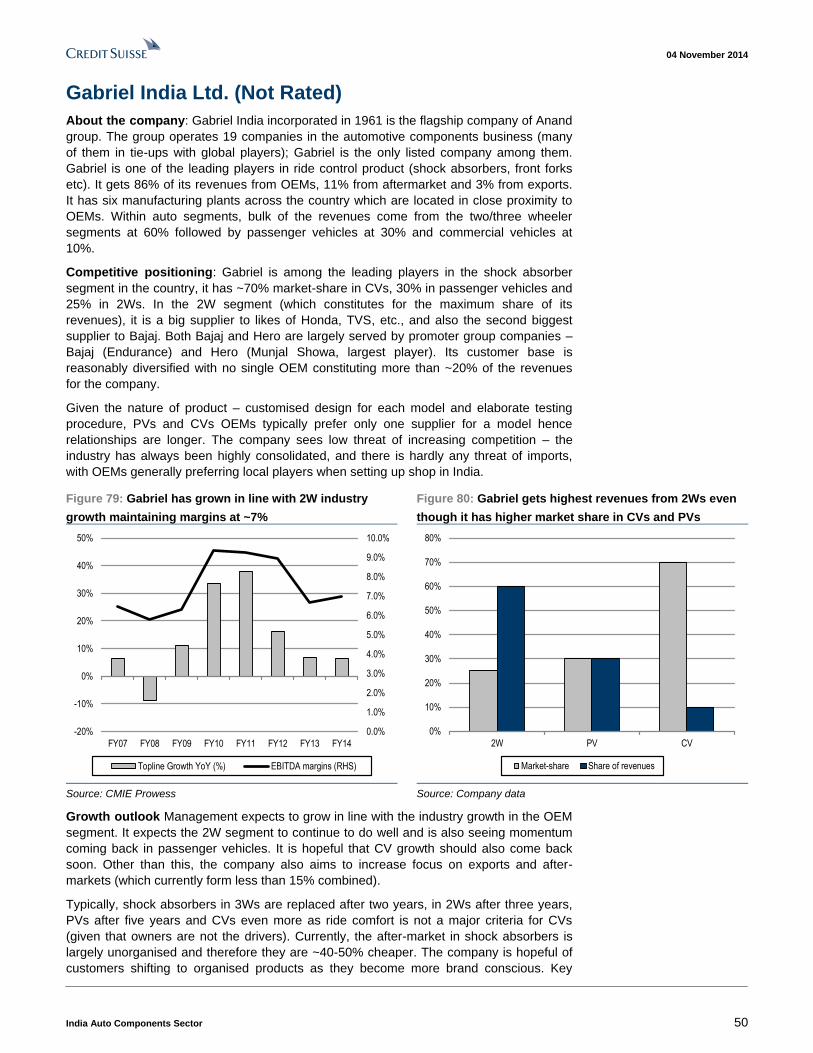
04 November 2014
India Auto Components Sector 50
Gabriel India Ltd. (Not Rated)
About the company: Gabriel India incorporated in 1961 is the flagship company of Anand
group. The group operates 19 companies in the automotive components business (many
of them in tie-ups with global players); Gabriel is the only listed company among them.
Gabriel is one of the leading players in ride control product (shock absorbers, front forks
etc). It gets 86% of its revenues from OEMs, 11% from aftermarket and 3% from exports.
It has six manufacturing plants across the country which are located in close proximity to
OEMs. Within auto segments, bulk of the revenues come from the two/three wheeler
segments at 60% followed by passenger vehicles at 30% and commercial vehicles at
10%.
Competitive positioning: Gabriel is among the leading players in the shock absorber
segment in the country, it has ~70% market-share in CVs, 30% in passenger vehicles and
25% in 2Ws. In the 2W segment (which constitutes for the maximum share of its
revenues), it is a big supplier to likes of Honda, TVS, etc., and also the second biggest
supplier to Bajaj. Both Bajaj and Hero are largely served by promoter group companies –
Bajaj (Endurance) and Hero (Munjal Showa, largest player). Its customer base is
reasonably diversified with no single OEM constituting more than ~20% of the revenues
for the company.
Given the nature of product – customised design for each model and elaborate testing
procedure, PVs and CVs OEMs typically prefer only one supplier for a model hence
relationships are longer. The company sees low threat of increasing competition – the
industry has always been highly consolidated, and there is hardly any threat of imports,
with OEMs generally preferring local players when setting up shop in India.
Figure 79: Gabriel has grown in line with 2W industry
growth maintaining margins at ~7%
Figure 80: Gabriel gets highest revenues from 2Ws even
though it has higher market share in CVs and PVs
0.0%
1.0%
2.0%
3.0%
4.0%
5.0%
6.0%
7.0%
8.0%
9.0%
10.0%
-20%
-10%
0%
10%
20%
30%
40%
50%
FY07 FY08 FY09 FY10 FY11 FY12 FY13 FY14
Topline Growth YoY (%) EBITDA margins (RHS)
0%
10%
20%
30%
40%
50%
60%
70%
80%
2W PV CV
Market-share Share of revenues
Source: CMIE Prowess Source: Company data
Growth outlook Management expects to grow in line with the industry growth in the OEM
segment. It expects the 2W segment to continue to do well and is also seeing momentum
coming back in passenger vehicles. It is hopeful that CV growth should also come back
soon. Other than this, the company also aims to increase focus on exports and after-
markets (which currently form less than 15% combined).
Typically, shock absorbers in 3Ws are replaced after two years, in 2Ws after three years,
PVs after five years and CVs even more as ride comfort is not a major criteria for CVs
(given that owners are not the drivers). Currently, the after-market in shock absorbers is
largely unorganised and therefore they are ~40-50% cheaper. The company is hopeful of
customers shifting to organised products as they become more brand conscious. Key
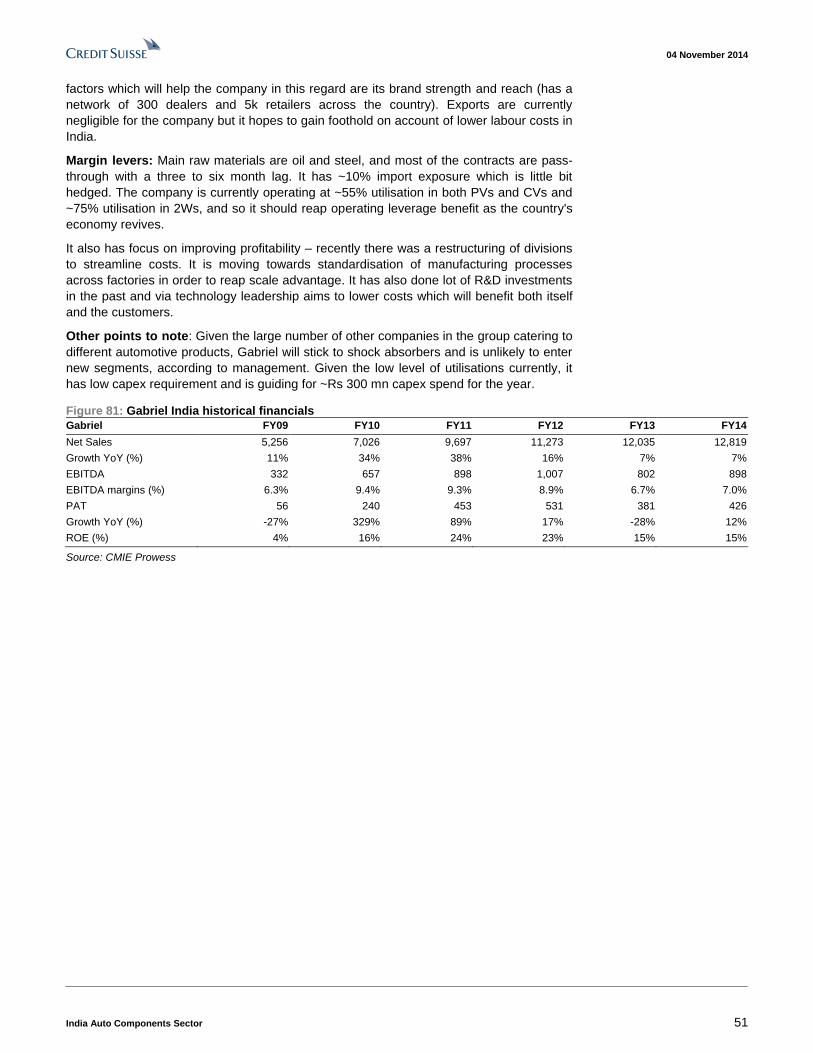
04 November 2014
India Auto Components Sector 51
factors which will help the company in this regard are its brand strength and reach (has a
network of 300 dealers and 5k retailers across the country). Exports are currently
negligible for the company but it hopes to gain foothold on account of lower labour costs in
India.
Margin levers: Main raw materials are oil and steel, and most of the contracts are pass-
through with a three to six month lag. It has ~10% import exposure which is little bit
hedged. The company is currently operating at ~55% utilisation in both PVs and CVs and
~75% utilisation in 2Ws, and so it should reap operating leverage benefit as the country's
economy revives.
It also has focus on improving profitability – recently there was a restructuring of divisions
to streamline costs. It is moving towards standardisation of manufacturing processes
across factories in order to reap scale advantage. It has also done lot of R&D investments
in the past and via technology leadership aims to lower costs which will benefit both itself
and the customers.
Other points to note: Given the large number of other companies in the group catering to
different automotive products, Gabriel will stick to shock absorbers and is unlikely to enter
new segments, according to management. Given the low level of utilisations currently, it
has low capex requirement and is guiding for ~Rs 300 mn capex spend for the year.
Figure 81: Gabriel India historical financials
Gabriel FY09 FY10 FY11 FY12 FY13 FY14
Net Sales 5,256 7,026 9,697 11,273 12,035 12,819
Growth YoY (%) 11% 34% 38% 16% 7% 7%
EBITDA 332 657 898 1,007 802 898
EBITDA margins (%) 6.3% 9.4% 9.3% 8.9% 6.7% 7.0%
PAT 56 240 453 531 381 426
Growth YoY (%) -27% 329% 89% 17% -28% 12%
ROE (%) 4% 16% 24% 23% 15% 15%
Source: CMIE Prowess
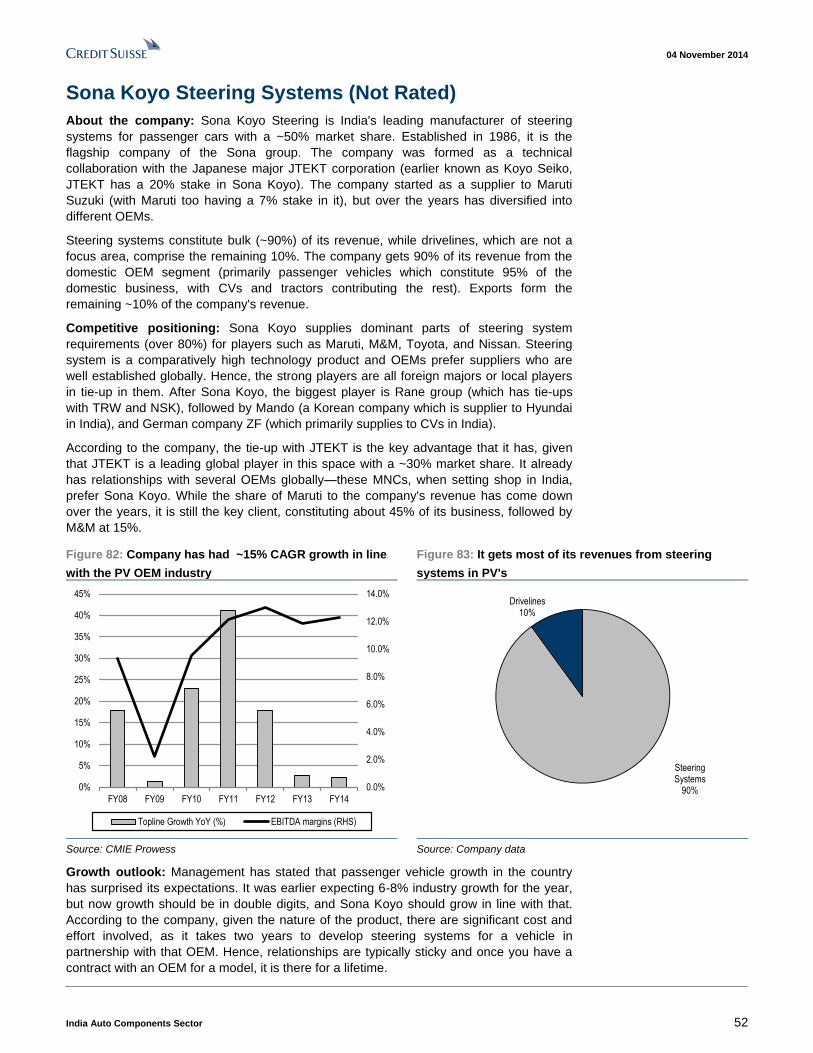
04 November 2014
India Auto Components Sector 52
Sona Koyo Steering Systems (Not Rated)
About the company: Sona Koyo Steering is India's leading manufacturer of steering
systems for passenger cars with a ~50% market share. Established in 1986, it is the
flagship company of the Sona group. The company was formed as a technical
collaboration with the Japanese major JTEKT corporation (earlier known as Koyo Seiko,
JTEKT has a 20% stake in Sona Koyo). The company started as a supplier to Maruti
Suzuki (with Maruti too having a 7% stake in it), but over the years has diversified into
different OEMs.
Steering systems constitute bulk (~90%) of its revenue, while drivelines, which are not a
focus area, comprise the remaining 10%. The company gets 90% of its revenue from the
domestic OEM segment (primarily passenger vehicles which constitute 95% of the
domestic business, with CVs and tractors contributing the rest). Exports form the
remaining ~10% of the company's revenue.
Competitive positioning: Sona Koyo supplies dominant parts of steering system
requirements (over 80%) for players such as Maruti, M&M, Toyota, and Nissan. Steering
system is a comparatively high technology product and OEMs prefer suppliers who are
well established globally. Hence, the strong players are all foreign majors or local players
in tie-up in them. After Sona Koyo, the biggest player is Rane group (which has tie-ups
with TRW and NSK), followed by Mando (a Korean company which is supplier to Hyundai
in India), and German company ZF (which primarily supplies to CVs in India).
According to the company, the tie-up with JTEKT is the key advantage that it has, given
that JTEKT is a leading global player in this space with a ~30% market share. It already
has relationships with several OEMs globally—these MNCs, when setting shop in India,
prefer Sona Koyo. While the share of Maruti to the company's revenue has come down
over the years, it is still the key client, constituting about 45% of its business, followed by
M&M at 15%.
Figure 82: Company has had ~15% CAGR growth in line
with the PV OEM industry
Figure 83: It gets most of its revenues from steering
systems in PV's
0.0%
2.0%
4.0%
6.0%
8.0%
10.0%
12.0%
14.0%
0%
5%
10%
15%
20%
25%
30%
35%
40%
45%
FY08 FY09 FY10 FY11 FY12 FY13 FY14
Topline Growth YoY (%) EBITDA margins (RHS)
Steering Systems
90%
Drivelines10%
Source: CMIE Prowess Source: Company data
Growth outlook: Management has stated that passenger vehicle growth in the country
has surprised its expectations. It was earlier expecting 6-8% industry growth for the year,
but now growth should be in double digits, and Sona Koyo should grow in line with that.
According to the company, given the nature of the product, there are significant cost and
effort involved, as it takes two years to develop steering systems for a vehicle in
partnership with that OEM. Hence, relationships are typically sticky and once you have a
contract with an OEM for a model, it is there for a lifetime.
04 November 2014
India Auto Components Sector 53
The life span of a steering system is same as that of a vehicle (unless it meets with an
accident); so after-market opportunity is low. Even then a company's agreements with
OEMs forbid it to sell these in the open market. Management claims, Sona Koyo has seen
substantial improvement in realisations with a shift from manual steering to power steering
in the country (although profit/unit on both is similar on higher import content in power
steering). So it sees some replacement opportunity here (shift from manual to power);
also, the company could stand to benefit if CCI clamps down on OEMs which are
forbidding suppliers from selling in the open market.
Margin levers: The company is currently operating at ~65% utilisation, so management
believes there should be an operating leverage benefit with a demand recovery. The
nature of product import content is high, particularly in power steering; however, the
company's localisation efforts, as management claims, have brought this down to 18%
(from around 30% a few years back). While it plans to continue on these efforts, it believes
import content can't be brought down below 15%. Management is guiding for a Rs800 mn
capex for the year which is similar to last year's. The key raw materials are steel (40%)
and aluminum.
Other points to note: The company has two subsidiaries, in which JTEKT has a higher
50% stake, to manufacture CEPS (column electric power steering) as it is a high-end
technology in which OEMs want direct warranty from JTEKT (hence carved out as a
subsidiary in which JTEKT had a higher stake), according to management. The company
has developed a patented technology: EPAM (electric power asset module), which is
applicable for off-highway and tractor segments. Electric power steering is a new thing for
tractors; hence, the company wants to exploit that opportunity. Management said that the
company will also target export markets through this and already has contracts from
players such as John Deere. EPAM is the only main diversification area of the company as
of now, and the company aims to grow this to ~Rs2.5 bn in 3-4 years (current top line:
Rs15 bn).
Figure 84: Sona Koyo historical financials
Sona Koyo FY09 FY10 FY11 FY12 FY13 FY14
Net Sales 6,947 8,548 12,060 14,202 14,581 14,912
Growth YoY (%) 1% 23% 41% 18% 3% 2%
EBITDA 154 815 1,460 1,854 1,734 1,837
EBITDA margins (%) 2.2% 9.5% 12.1% 13.1% 11.9% 12.3%
PAT -316 162 491 601 480 863
Growth YoY (%) -227% -151% 204% 22% -20% 80%
ROE (%) -16% 8% 20% 21% 15% 22%
Source: CMIE Prowess
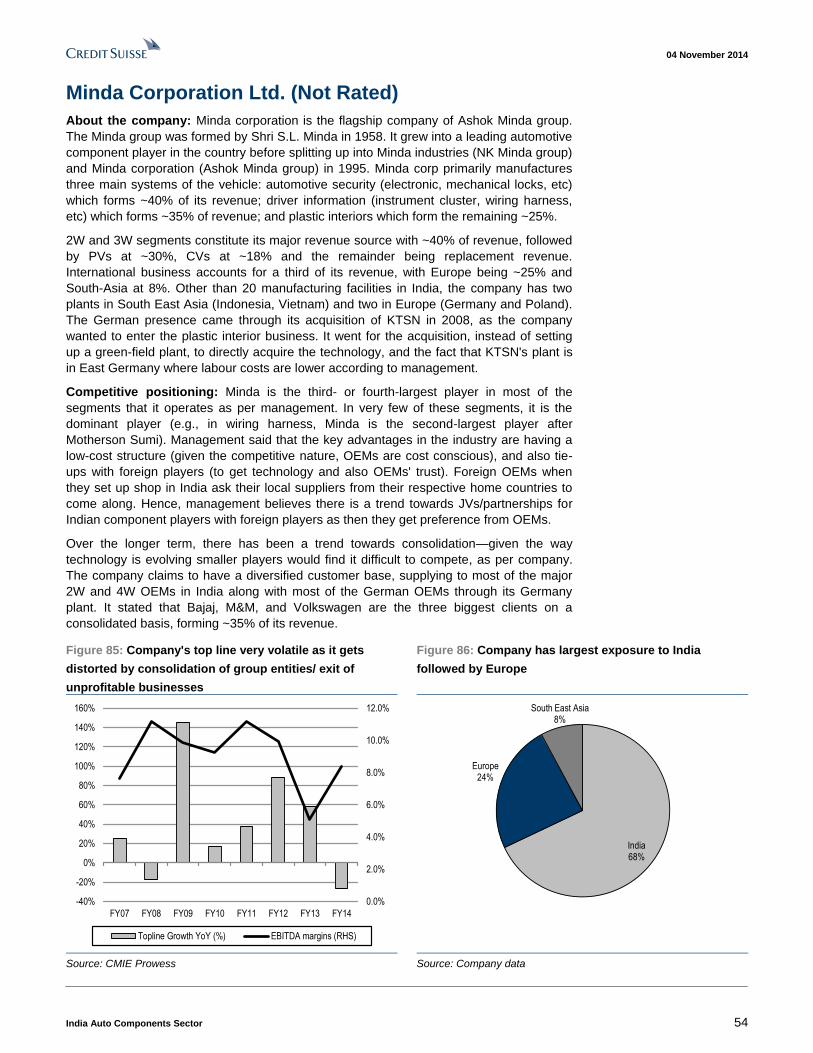
04 November 2014
India Auto Components Sector 54
Minda Corporation Ltd. (Not Rated)
About the company: Minda corporation is the flagship company of Ashok Minda group.
The Minda group was formed by Shri S.L. Minda in 1958. It grew into a leading automotive
component player in the country before splitting up into Minda industries (NK Minda group)
and Minda corporation (Ashok Minda group) in 1995. Minda corp primarily manufactures
three main systems of the vehicle: automotive security (electronic, mechanical locks, etc)
which forms ~40% of its revenue; driver information (instrument cluster, wiring harness,
etc) which forms ~35% of revenue; and plastic interiors which form the remaining ~25%.
2W and 3W segments constitute its major revenue source with ~40% of revenue, followed
by PVs at ~30%, CVs at ~18% and the remainder being replacement revenue.
International business accounts for a third of its revenue, with Europe being ~25% and
South-Asia at 8%. Other than 20 manufacturing facilities in India, the company has two
plants in South East Asia (Indonesia, Vietnam) and two in Europe (Germany and Poland).
The German presence came through its acquisition of KTSN in 2008, as the company
wanted to enter the plastic interior business. It went for the acquisition, instead of setting
up a green-field plant, to directly acquire the technology, and the fact that KTSN's plant is
in East Germany where labour costs are lower according to management.
Competitive positioning: Minda is the third- or fourth-largest player in most of the
segments that it operates as per management. In very few of these segments, it is the
dominant player (e.g., in wiring harness, Minda is the second-largest player after
Motherson Sumi). Management said that the key advantages in the industry are having a
low-cost structure (given the competitive nature, OEMs are cost conscious), and also tie-
ups with foreign players (to get technology and also OEMs' trust). Foreign OEMs when
they set up shop in India ask their local suppliers from their respective home countries to
come along. Hence, management believes there is a trend towards JVs/partnerships for
Indian component players with foreign players as then they get preference from OEMs.
Over the longer term, there has been a trend towards consolidation—given the way
technology is evolving smaller players would find it difficult to compete, as per company.
The company claims to have a diversified customer base, supplying to most of the major
2W and 4W OEMs in India along with most of the German OEMs through its Germany
plant. It stated that Bajaj, M&M, and Volkswagen are the three biggest clients on a
consolidated basis, forming ~35% of its revenue.
Figure 85: Company's top line very volatile as it gets
distorted by consolidation of group entities/ exit of
unprofitable businesses
Figure 86: Company has largest exposure to India
followed by Europe
0.0%
2.0%
4.0%
6.0%
8.0%
10.0%
12.0%
-40%
-20%
0%
20%
40%
60%
80%
100%
120%
140%
160%
FY07 FY08 FY09 FY10 FY11 FY12 FY13 FY14
Topline Growth YoY (%) EBITDA margins (RHS)
India68%
Europe24%
South East Asia8%
Source: CMIE Prowess Source: Company data
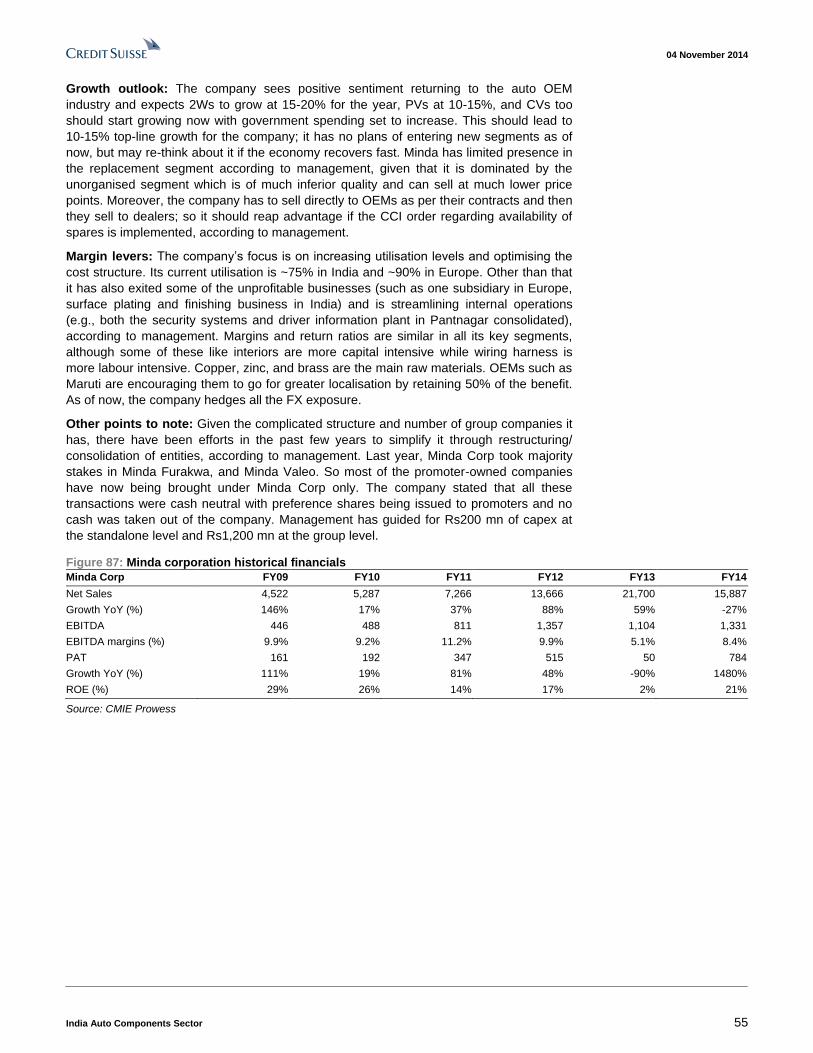
04 November 2014
India Auto Components Sector 55
Growth outlook: The company sees positive sentiment returning to the auto OEM
industry and expects 2Ws to grow at 15-20% for the year, PVs at 10-15%, and CVs too
should start growing now with government spending set to increase. This should lead to
10-15% top-line growth for the company; it has no plans of entering new segments as of
now, but may re-think about it if the economy recovers fast. Minda has limited presence in
the replacement segment according to management, given that it is dominated by the
unorganised segment which is of much inferior quality and can sell at much lower price
points. Moreover, the company has to sell directly to OEMs as per their contracts and then
they sell to dealers; so it should reap advantage if the CCI order regarding availability of
spares is implemented, according to management.
Margin levers: The company’s focus is on increasing utilisation levels and optimising the
cost structure. Its current utilisation is ~75% in India and ~90% in Europe. Other than that
it has also exited some of the unprofitable businesses (such as one subsidiary in Europe,
surface plating and finishing business in India) and is streamlining internal operations
(e.g., both the security systems and driver information plant in Pantnagar consolidated),
according to management. Margins and return ratios are similar in all its key segments,
although some of these like interiors are more capital intensive while wiring harness is
more labour intensive. Copper, zinc, and brass are the main raw materials. OEMs such as
Maruti are encouraging them to go for greater localisation by retaining 50% of the benefit.
As of now, the company hedges all the FX exposure.
Other points to note: Given the complicated structure and number of group companies it
has, there have been efforts in the past few years to simplify it through restructuring/
consolidation of entities, according to management. Last year, Minda Corp took majority
stakes in Minda Furakwa, and Minda Valeo. So most of the promoter-owned companies
have now being brought under Minda Corp only. The company stated that all these
transactions were cash neutral with preference shares being issued to promoters and no
cash was taken out of the company. Management has guided for Rs200 mn of capex at
the standalone level and Rs1,200 mn at the group level.
Figure 87: Minda corporation historical financials
Minda Corp FY09 FY10 FY11 FY12 FY13 FY14
Net Sales 4,522 5,287 7,266 13,666 21,700 15,887
Growth YoY (%) 146% 17% 37% 88% 59% -27%
EBITDA 446 488 811 1,357 1,104 1,331
EBITDA margins (%) 9.9% 9.2% 11.2% 9.9% 5.1% 8.4%
PAT 161 192 347 515 50 784
Growth YoY (%) 111% 19% 81% 48% -90% 1480%
ROE (%) 29% 26% 14% 17% 2% 21%
Source: CMIE Prowess
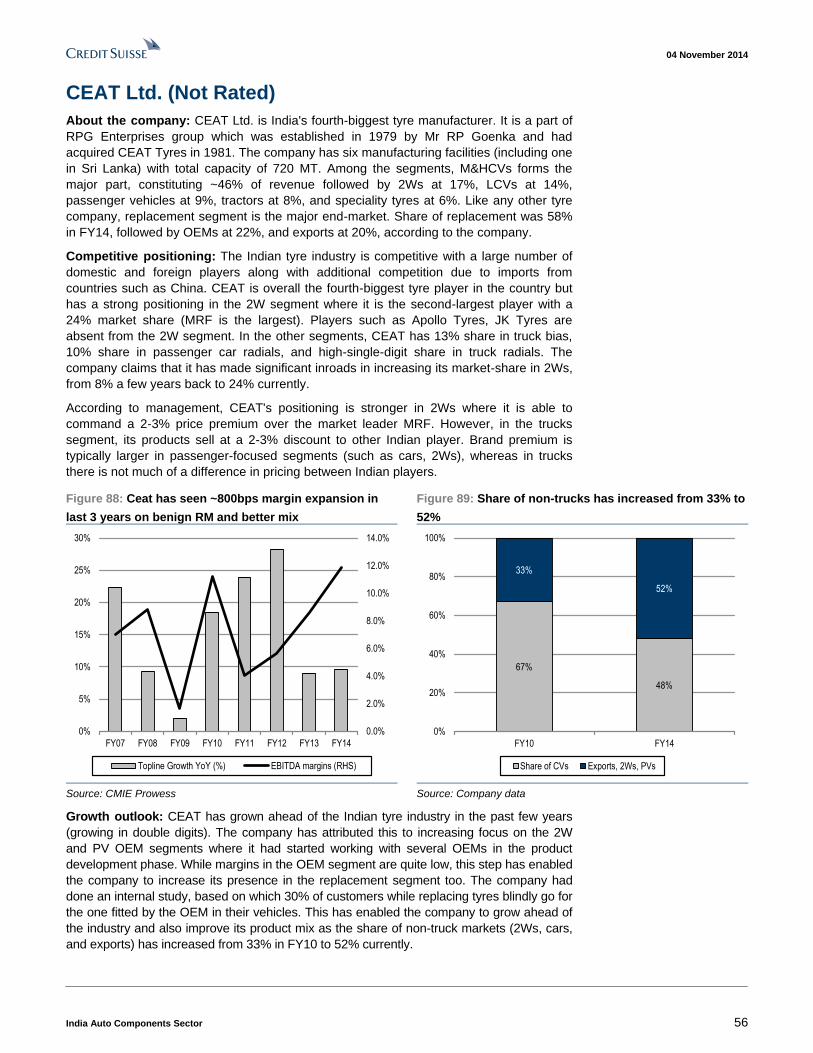
04 November 2014
India Auto Components Sector 56
CEAT Ltd. (Not Rated)
About the company: CEAT Ltd. is India's fourth-biggest tyre manufacturer. It is a part of
RPG Enterprises group which was established in 1979 by Mr RP Goenka and had
acquired CEAT Tyres in 1981. The company has six manufacturing facilities (including one
in Sri Lanka) with total capacity of 720 MT. Among the segments, M&HCVs forms the
major part, constituting ~46% of revenue followed by 2Ws at 17%, LCVs at 14%,
passenger vehicles at 9%, tractors at 8%, and speciality tyres at 6%. Like any other tyre
company, replacement segment is the major end-market. Share of replacement was 58%
in FY14, followed by OEMs at 22%, and exports at 20%, according to the company.
Competitive positioning: The Indian tyre industry is competitive with a large number of
domestic and foreign players along with additional competition due to imports from
countries such as China. CEAT is overall the fourth-biggest tyre player in the country but
has a strong positioning in the 2W segment where it is the second-largest player with a
24% market share (MRF is the largest). Players such as Apollo Tyres, JK Tyres are
absent from the 2W segment. In the other segments, CEAT has 13% share in truck bias,
10% share in passenger car radials, and high-single-digit share in truck radials. The
company claims that it has made significant inroads in increasing its market-share in 2Ws,
from 8% a few years back to 24% currently.
According to management, CEAT's positioning is stronger in 2Ws where it is able to
command a 2-3% price premium over the market leader MRF. However, in the trucks
segment, its products sell at a 2-3% discount to other Indian player. Brand premium is
typically larger in passenger-focused segments (such as cars, 2Ws), whereas in trucks
there is not much of a difference in pricing between Indian players.
Figure 88: Ceat has seen ~800bps margin expansion in
last 3 years on benign RM and better mix
Figure 89: Share of non-trucks has increased from 33% to
52%
0.0%
2.0%
4.0%
6.0%
8.0%
10.0%
12.0%
14.0%
0%
5%
10%
15%
20%
25%
30%
FY07 FY08 FY09 FY10 FY11 FY12 FY13 FY14
Topline Growth YoY (%) EBITDA margins (RHS)
67%
48%
33%
52%
0%
20%
40%
60%
80%
100%
FY10 FY14
Share of CVs Exports, 2Ws, PVs
Source: CMIE Prowess Source: Company data
Growth outlook: CEAT has grown ahead of the Indian tyre industry in the past few years
(growing in double digits). The company has attributed this to increasing focus on the 2W
and PV OEM segments where it had started working with several OEMs in the product
development phase. While margins in the OEM segment are quite low, this step has enabled
the company to increase its presence in the replacement segment too. The company had
done an internal study, based on which 30% of customers while replacing tyres blindly go for
the one fitted by the OEM in their vehicles. This has enabled the company to grow ahead of
the industry and also improve its product mix as the share of non-truck markets (2Ws, cars,
and exports) has increased from 33% in FY10 to 52% currently.
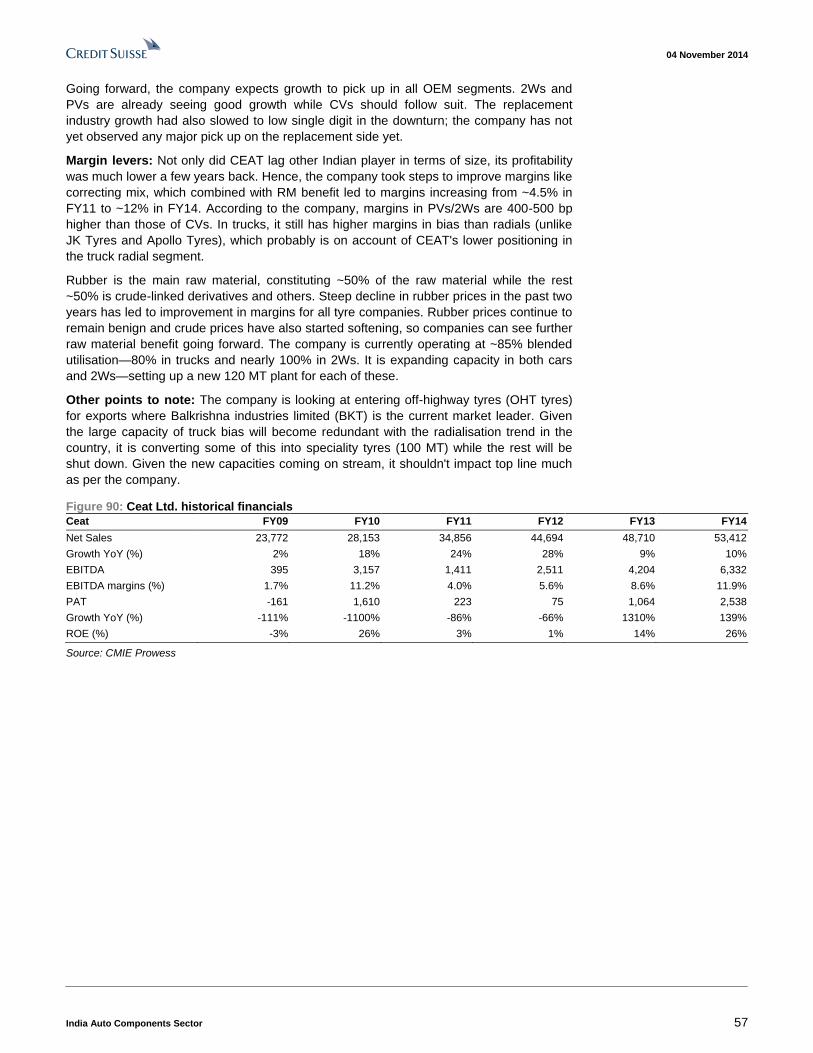
04 November 2014
India Auto Components Sector 57
Going forward, the company expects growth to pick up in all OEM segments. 2Ws and
PVs are already seeing good growth while CVs should follow suit. The replacement
industry growth had also slowed to low single digit in the downturn; the company has not
yet observed any major pick up on the replacement side yet.
Margin levers: Not only did CEAT lag other Indian player in terms of size, its profitability
was much lower a few years back. Hence, the company took steps to improve margins like
correcting mix, which combined with RM benefit led to margins increasing from ~4.5% in
FY11 to ~12% in FY14. According to the company, margins in PVs/2Ws are 400-500 bp
higher than those of CVs. In trucks, it still has higher margins in bias than radials (unlike
JK Tyres and Apollo Tyres), which probably is on account of CEAT's lower positioning in
the truck radial segment.
Rubber is the main raw material, constituting ~50% of the raw material while the rest
~50% is crude-linked derivatives and others. Steep decline in rubber prices in the past two
years has led to improvement in margins for all tyre companies. Rubber prices continue to
remain benign and crude prices have also started softening, so companies can see further
raw material benefit going forward. The company is currently operating at ~85% blended
utilisation—80% in trucks and nearly 100% in 2Ws. It is expanding capacity in both cars
and 2Ws—setting up a new 120 MT plant for each of these.
Other points to note: The company is looking at entering off-highway tyres (OHT tyres)
for exports where Balkrishna industries limited (BKT) is the current market leader. Given
the large capacity of truck bias will become redundant with the radialisation trend in the
country, it is converting some of this into speciality tyres (100 MT) while the rest will be
shut down. Given the new capacities coming on stream, it shouldn't impact top line much
as per the company.
Figure 90: Ceat Ltd. historical financials
Ceat FY09 FY10 FY11 FY12 FY13 FY14
Net Sales 23,772 28,153 34,856 44,694 48,710 53,412
Growth YoY (%) 2% 18% 24% 28% 9% 10%
EBITDA 395 3,157 1,411 2,511 4,204 6,332
EBITDA margins (%) 1.7% 11.2% 4.0% 5.6% 8.6% 11.9%
PAT -161 1,610 223 75 1,064 2,538
Growth YoY (%) -111% -1100% -86% -66% 1310% 139%
ROE (%) -3% 26% 3% 1% 14% 26%
Source: CMIE Prowess
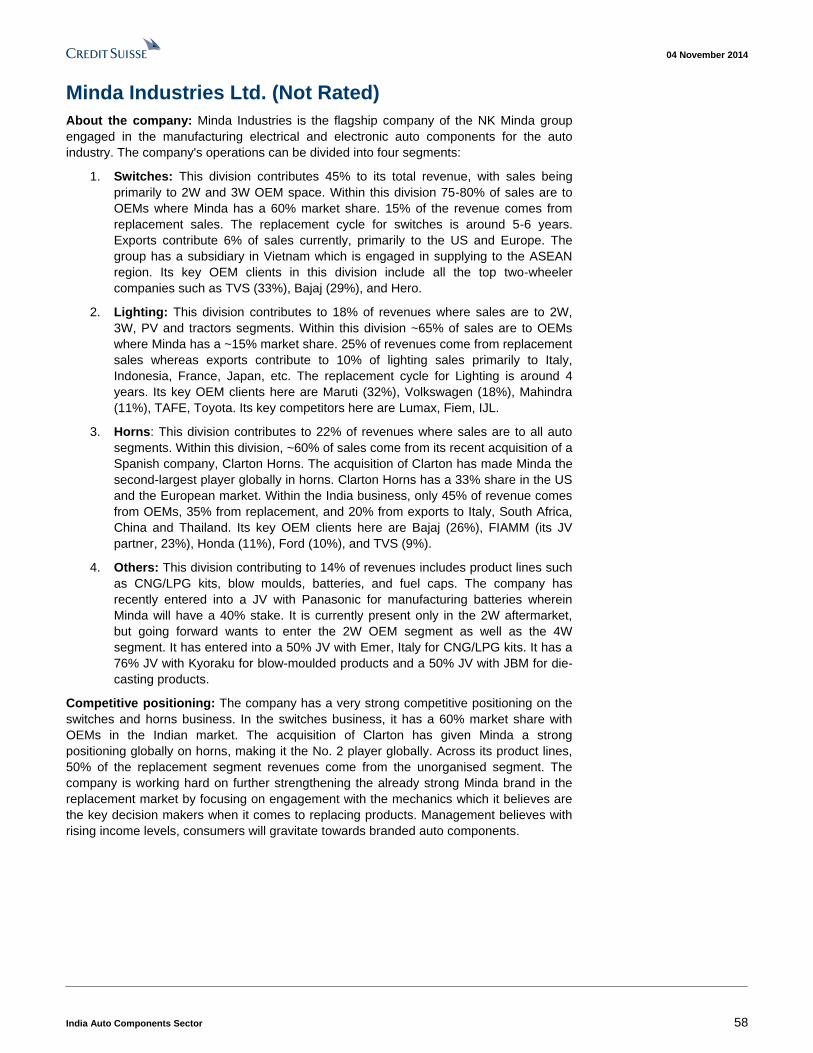
04 November 2014
India Auto Components Sector 58
Minda Industries Ltd. (Not Rated)
About the company: Minda Industries is the flagship company of the NK Minda group
engaged in the manufacturing electrical and electronic auto components for the auto
industry. The company's operations can be divided into four segments:
1. Switches: This division contributes 45% to its total revenue, with sales being
primarily to 2W and 3W OEM space. Within this division 75-80% of sales are to
OEMs where Minda has a 60% market share. 15% of the revenue comes from
replacement sales. The replacement cycle for switches is around 5-6 years.
Exports contribute 6% of sales currently, primarily to the US and Europe. The
group has a subsidiary in Vietnam which is engaged in supplying to the ASEAN
region. Its key OEM clients in this division include all the top two-wheeler
companies such as TVS (33%), Bajaj (29%), and Hero.
2. Lighting: This division contributes to 18% of revenues where sales are to 2W,
3W, PV and tractors segments. Within this division ~65% of sales are to OEMs
where Minda has a ~15% market share. 25% of revenues come from replacement
sales whereas exports contribute to 10% of lighting sales primarily to Italy,
Indonesia, France, Japan, etc. The replacement cycle for Lighting is around 4
years. Its key OEM clients here are Maruti (32%), Volkswagen (18%), Mahindra
(11%), TAFE, Toyota. Its key competitors here are Lumax, Fiem, IJL.
3. Horns: This division contributes to 22% of revenues where sales are to all auto
segments. Within this division, ~60% of sales come from its recent acquisition of a
Spanish company, Clarton Horns. The acquisition of Clarton has made Minda the
second-largest player globally in horns. Clarton Horns has a 33% share in the US
and the European market. Within the India business, only 45% of revenue comes
from OEMs, 35% from replacement, and 20% from exports to Italy, South Africa,
China and Thailand. Its key OEM clients here are Bajaj (26%), FIAMM (its JV
partner, 23%), Honda (11%), Ford (10%), and TVS (9%).
4. Others: This division contributing to 14% of revenues includes product lines such
as CNG/LPG kits, blow moulds, batteries, and fuel caps. The company has
recently entered into a JV with Panasonic for manufacturing batteries wherein
Minda will have a 40% stake. It is currently present only in the 2W aftermarket,
but going forward wants to enter the 2W OEM segment as well as the 4W
segment. It has entered into a 50% JV with Emer, Italy for CNG/LPG kits. It has a
76% JV with Kyoraku for blow-moulded products and a 50% JV with JBM for die-
casting products.
Competitive positioning: The company has a very strong competitive positioning on the
switches and horns business. In the switches business, it has a 60% market share with
OEMs in the Indian market. The acquisition of Clarton has given Minda a strong
positioning globally on horns, making it the No. 2 player globally. Across its product lines,
50% of the replacement segment revenues come from the unorganised segment. The
company is working hard on further strengthening the already strong Minda brand in the
replacement market by focusing on engagement with the mechanics which it believes are
the key decision makers when it comes to replacing products. Management believes with
rising income levels, consumers will gravitate towards branded auto components.
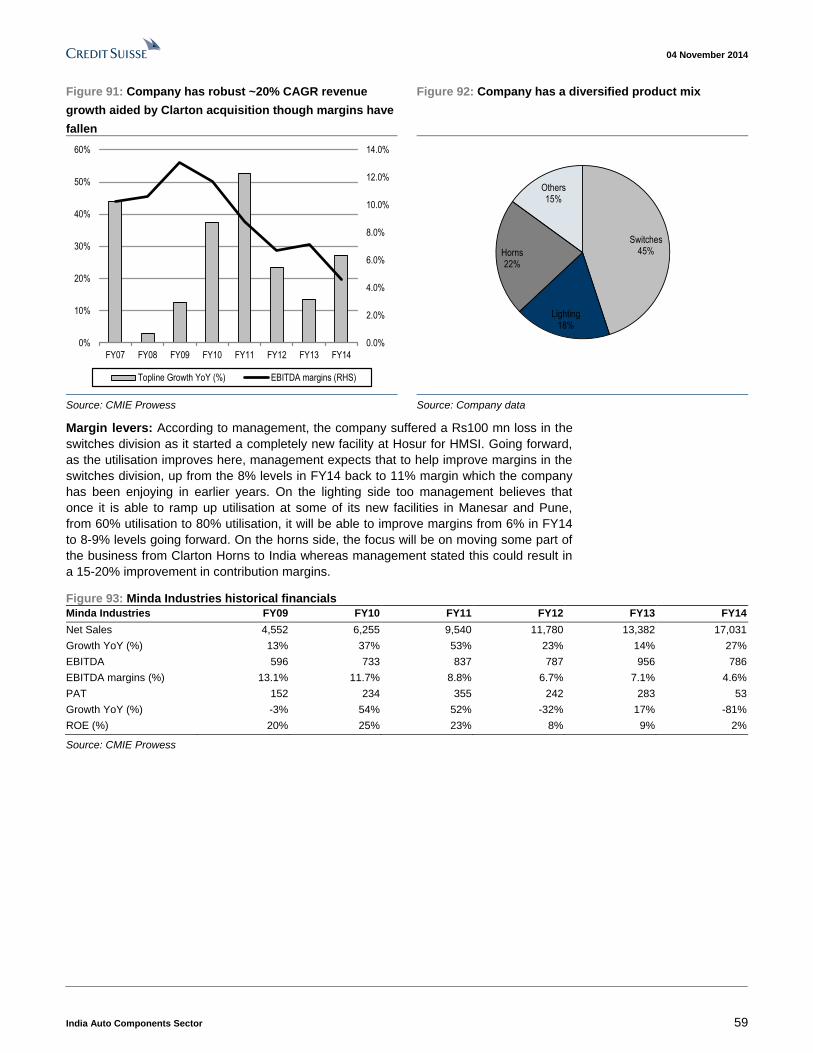
04 November 2014
India Auto Components Sector 59
Figure 91: Company has robust ~20% CAGR revenue
growth aided by Clarton acquisition though margins have
fallen
Figure 92: Company has a diversified product mix
0.0%
2.0%
4.0%
6.0%
8.0%
10.0%
12.0%
14.0%
0%
10%
20%
30%
40%
50%
60%
FY07 FY08 FY09 FY10 FY11 FY12 FY13 FY14
Topline Growth YoY (%) EBITDA margins (RHS)
Switches45%
Lighting18%
Horns22%
Others15%
Source: CMIE Prowess Source: Company data
Margin levers: According to management, the company suffered a Rs100 mn loss in the
switches division as it started a completely new facility at Hosur for HMSI. Going forward,
as the utilisation improves here, management expects that to help improve margins in the
switches division, up from the 8% levels in FY14 back to 11% margin which the company
has been enjoying in earlier years. On the lighting side too management believes that
once it is able to ramp up utilisation at some of its new facilities in Manesar and Pune,
from 60% utilisation to 80% utilisation, it will be able to improve margins from 6% in FY14
to 8-9% levels going forward. On the horns side, the focus will be on moving some part of
the business from Clarton Horns to India whereas management stated this could result in
a 15-20% improvement in contribution margins.
Figure 93: Minda Industries historical financials
Minda Industries FY09 FY10 FY11 FY12 FY13 FY14
Net Sales 4,552 6,255 9,540 11,780 13,382 17,031
Growth YoY (%) 13% 37% 53% 23% 14% 27%
EBITDA 596 733 837 787 956 786
EBITDA margins (%) 13.1% 11.7% 8.8% 6.7% 7.1% 4.6%
PAT 152 234 355 242 283 53
Growth YoY (%) -3% 54% 52% -32% 17% -81%
ROE (%) 20% 25% 23% 8% 9% 2%
Source: CMIE Prowess
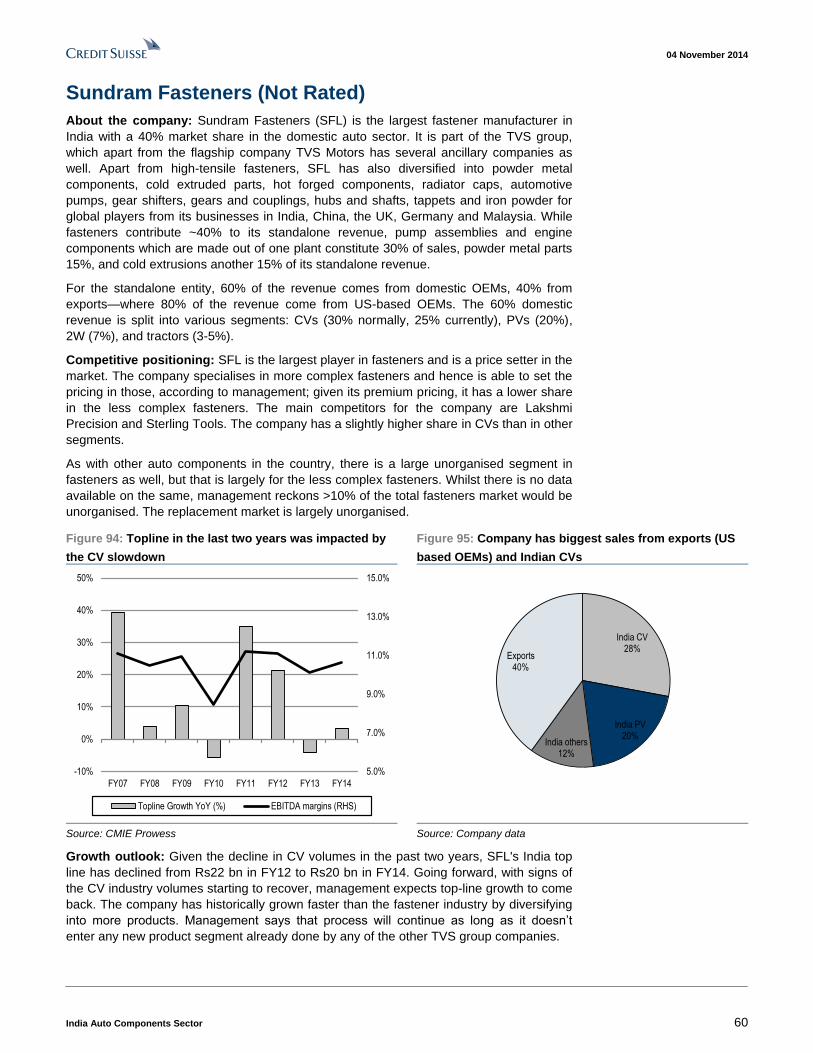
04 November 2014
India Auto Components Sector 60
Sundram Fasteners (Not Rated)
About the company: Sundram Fasteners (SFL) is the largest fastener manufacturer in
India with a 40% market share in the domestic auto sector. It is part of the TVS group,
which apart from the flagship company TVS Motors has several ancillary companies as
well. Apart from high-tensile fasteners, SFL has also diversified into powder metal
components, cold extruded parts, hot forged components, radiator caps, automotive
pumps, gear shifters, gears and couplings, hubs and shafts, tappets and iron powder for
global players from its businesses in India, China, the UK, Germany and Malaysia. While
fasteners contribute ~40% to its standalone revenue, pump assemblies and engine
components which are made out of one plant constitute 30% of sales, powder metal parts
15%, and cold extrusions another 15% of its standalone revenue.
For the standalone entity, 60% of the revenue comes from domestic OEMs, 40% from
exports—where 80% of the revenue come from US-based OEMs. The 60% domestic
revenue is split into various segments: CVs (30% normally, 25% currently), PVs (20%),
2W (7%), and tractors (3-5%).
Competitive positioning: SFL is the largest player in fasteners and is a price setter in the
market. The company specialises in more complex fasteners and hence is able to set the
pricing in those, according to management; given its premium pricing, it has a lower share
in the less complex fasteners. The main competitors for the company are Lakshmi
Precision and Sterling Tools. The company has a slightly higher share in CVs than in other
segments.
As with other auto components in the country, there is a large unorganised segment in
fasteners as well, but that is largely for the less complex fasteners. Whilst there is no data
available on the same, management reckons >10% of the total fasteners market would be
unorganised. The replacement market is largely unorganised.
Figure 94: Topline in the last two years was impacted by
the CV slowdown
Figure 95: Company has biggest sales from exports (US
based OEMs) and Indian CVs
5.0%
7.0%
9.0%
11.0%
13.0%
15.0%
-10%
0%
10%
20%
30%
40%
50%
FY07 FY08 FY09 FY10 FY11 FY12 FY13 FY14
Topline Growth YoY (%) EBITDA margins (RHS)
India CV28%
India PV20%
India others12%
Exports40%
Source: CMIE Prowess Source: Company data
Growth outlook: Given the decline in CV volumes in the past two years, SFL's India top
line has declined from Rs22 bn in FY12 to Rs20 bn in FY14. Going forward, with signs of
the CV industry volumes starting to recover, management expects top-line growth to come
back. The company has historically grown faster than the fastener industry by diversifying
into more products. Management says that process will continue as long as it doesn’t
enter any new product segment already done by any of the other TVS group companies.
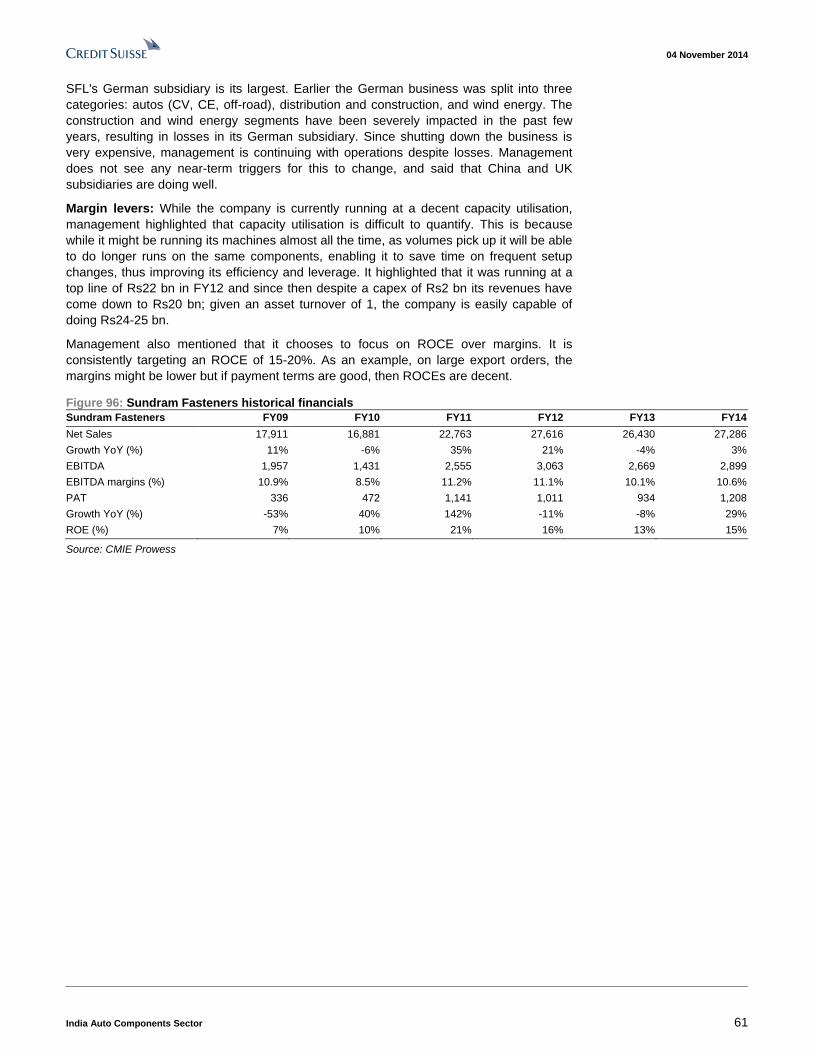
04 November 2014
India Auto Components Sector 61
SFL's German subsidiary is its largest. Earlier the German business was split into three
categories: autos (CV, CE, off-road), distribution and construction, and wind energy. The
construction and wind energy segments have been severely impacted in the past few
years, resulting in losses in its German subsidiary. Since shutting down the business is
very expensive, management is continuing with operations despite losses. Management
does not see any near-term triggers for this to change, and said that China and UK
subsidiaries are doing well.
Margin levers: While the company is currently running at a decent capacity utilisation,
management highlighted that capacity utilisation is difficult to quantify. This is because
while it might be running its machines almost all the time, as volumes pick up it will be able
to do longer runs on the same components, enabling it to save time on frequent setup
changes, thus improving its efficiency and leverage. It highlighted that it was running at a
top line of Rs22 bn in FY12 and since then despite a capex of Rs2 bn its revenues have
come down to Rs20 bn; given an asset turnover of 1, the company is easily capable of
doing Rs24-25 bn.
Management also mentioned that it chooses to focus on ROCE over margins. It is
consistently targeting an ROCE of 15-20%. As an example, on large export orders, the
margins might be lower but if payment terms are good, then ROCEs are decent.
Figure 96: Sundram Fasteners historical financials
Sundram Fasteners FY09 FY10 FY11 FY12 FY13 FY14
Net Sales 17,911 16,881 22,763 27,616 26,430 27,286
Growth YoY (%) 11% -6% 35% 21% -4% 3%
EBITDA 1,957 1,431 2,555 3,063 2,669 2,899
EBITDA margins (%) 10.9% 8.5% 11.2% 11.1% 10.1% 10.6%
PAT 336 472 1,141 1,011 934 1,208
Growth YoY (%) -53% 40% 142% -11% -8% 29%
ROE (%) 7% 10% 21% 16% 13% 15%
Source: CMIE Prowess
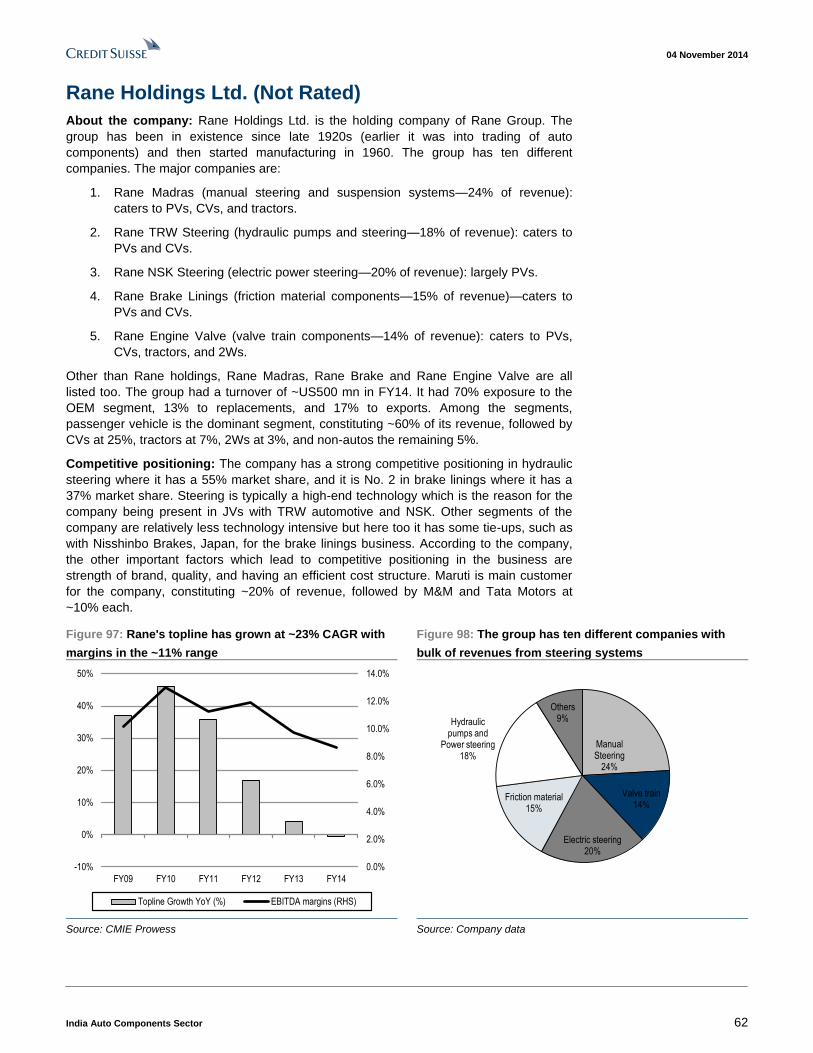
04 November 2014
India Auto Components Sector 62
Rane Holdings Ltd. (Not Rated)
About the company: Rane Holdings Ltd. is the holding company of Rane Group. The
group has been in existence since late 1920s (earlier it was into trading of auto
components) and then started manufacturing in 1960. The group has ten different
companies. The major companies are:
1. Rane Madras (manual steering and suspension systems—24% of revenue):
caters to PVs, CVs, and tractors.
2. Rane TRW Steering (hydraulic pumps and steering—18% of revenue): caters to
PVs and CVs.
3. Rane NSK Steering (electric power steering—20% of revenue): largely PVs.
4. Rane Brake Linings (friction material components—15% of revenue)—caters to
PVs and CVs.
5. Rane Engine Valve (valve train components—14% of revenue): caters to PVs,
CVs, tractors, and 2Ws.
Other than Rane holdings, Rane Madras, Rane Brake and Rane Engine Valve are all
listed too. The group had a turnover of ~US500 mn in FY14. It had 70% exposure to the
OEM segment, 13% to replacements, and 17% to exports. Among the segments,
passenger vehicle is the dominant segment, constituting ~60% of its revenue, followed by
CVs at 25%, tractors at 7%, 2Ws at 3%, and non-autos the remaining 5%.
Competitive positioning: The company has a strong competitive positioning in hydraulic
steering where it has a 55% market share, and it is No. 2 in brake linings where it has a
37% market share. Steering is typically a high-end technology which is the reason for the
company being present in JVs with TRW automotive and NSK. Other segments of the
company are relatively less technology intensive but here too it has some tie-ups, such as
with Nisshinbo Brakes, Japan, for the brake linings business. According to the company,
the other important factors which lead to competitive positioning in the business are
strength of brand, quality, and having an efficient cost structure. Maruti is main customer
for the company, constituting ~20% of revenue, followed by M&M and Tata Motors at
~10% each.
Figure 97: Rane's topline has grown at ~23% CAGR with
margins in the ~11% range
Figure 98: The group has ten different companies with
bulk of revenues from steering systems
0.0%
2.0%
4.0%
6.0%
8.0%
10.0%
12.0%
14.0%
-10%
0%
10%
20%
30%
40%
50%
FY09 FY10 FY11 FY12 FY13 FY14
Topline Growth YoY (%) EBITDA margins (RHS)
Manual Steering
24%
Valve train14%
Electric steering20%
Friction material15%
Hydraulic pumps and
Power steering18%
Others9%
Source: CMIE Prowess Source: Company data
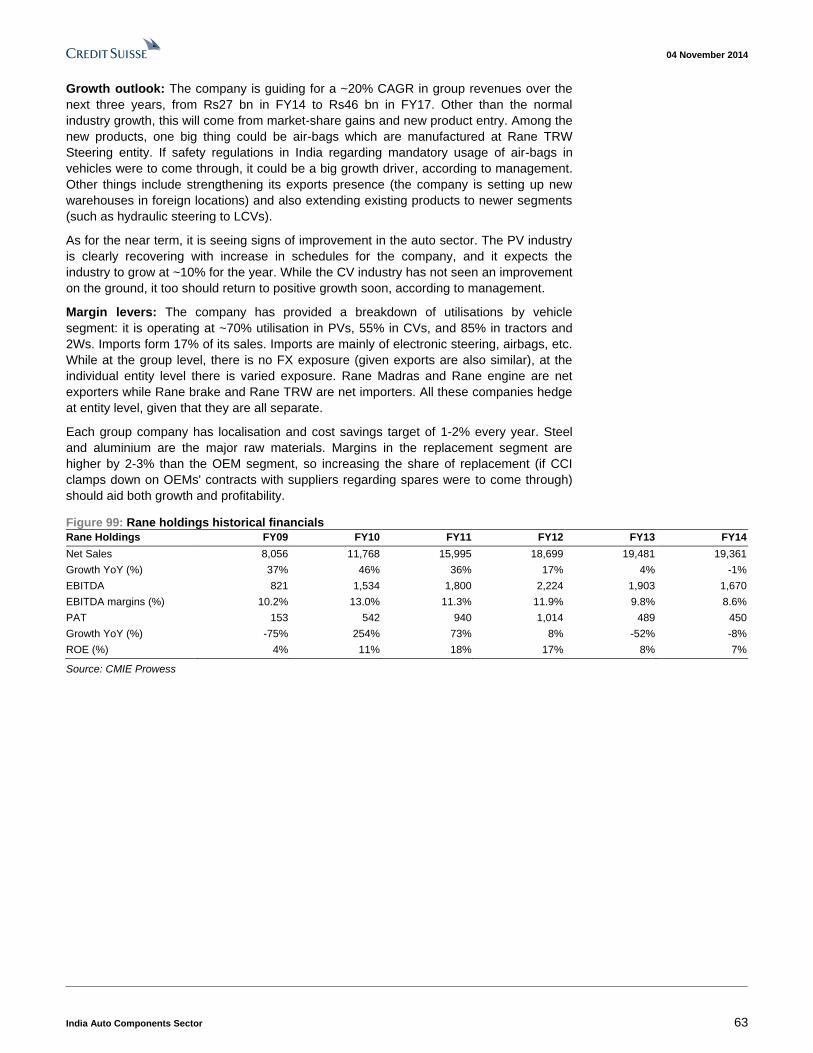
04 November 2014
India Auto Components Sector 63
Growth outlook: The company is guiding for a ~20% CAGR in group revenues over the
next three years, from Rs27 bn in FY14 to Rs46 bn in FY17. Other than the normal
industry growth, this will come from market-share gains and new product entry. Among the
new products, one big thing could be air-bags which are manufactured at Rane TRW
Steering entity. If safety regulations in India regarding mandatory usage of air-bags in
vehicles were to come through, it could be a big growth driver, according to management.
Other things include strengthening its exports presence (the company is setting up new
warehouses in foreign locations) and also extending existing products to newer segments
(such as hydraulic steering to LCVs).
As for the near term, it is seeing signs of improvement in the auto sector. The PV industry
is clearly recovering with increase in schedules for the company, and it expects the
industry to grow at ~10% for the year. While the CV industry has not seen an improvement
on the ground, it too should return to positive growth soon, according to management.
Margin levers: The company has provided a breakdown of utilisations by vehicle
segment: it is operating at ~70% utilisation in PVs, 55% in CVs, and 85% in tractors and
2Ws. Imports form 17% of its sales. Imports are mainly of electronic steering, airbags, etc.
While at the group level, there is no FX exposure (given exports are also similar), at the
individual entity level there is varied exposure. Rane Madras and Rane engine are net
exporters while Rane brake and Rane TRW are net importers. All these companies hedge
at entity level, given that they are all separate.
Each group company has localisation and cost savings target of 1-2% every year. Steel
and aluminium are the major raw materials. Margins in the replacement segment are
higher by 2-3% than the OEM segment, so increasing the share of replacement (if CCI
clamps down on OEMs' contracts with suppliers regarding spares were to come through)
should aid both growth and profitability.
Figure 99: Rane holdings historical financials
Rane Holdings FY09 FY10 FY11 FY12 FY13 FY14
Net Sales 8,056 11,768 15,995 18,699 19,481 19,361
Growth YoY (%) 37% 46% 36% 17% 4% -1%
EBITDA 821 1,534 1,800 2,224 1,903 1,670
EBITDA margins (%) 10.2% 13.0% 11.3% 11.9% 9.8% 8.6%
PAT 153 542 940 1,014 489 450
Growth YoY (%) -75% 254% 73% 8% -52% -8%
ROE (%) 4% 11% 18% 17% 8% 7%
Source: CMIE Prowess
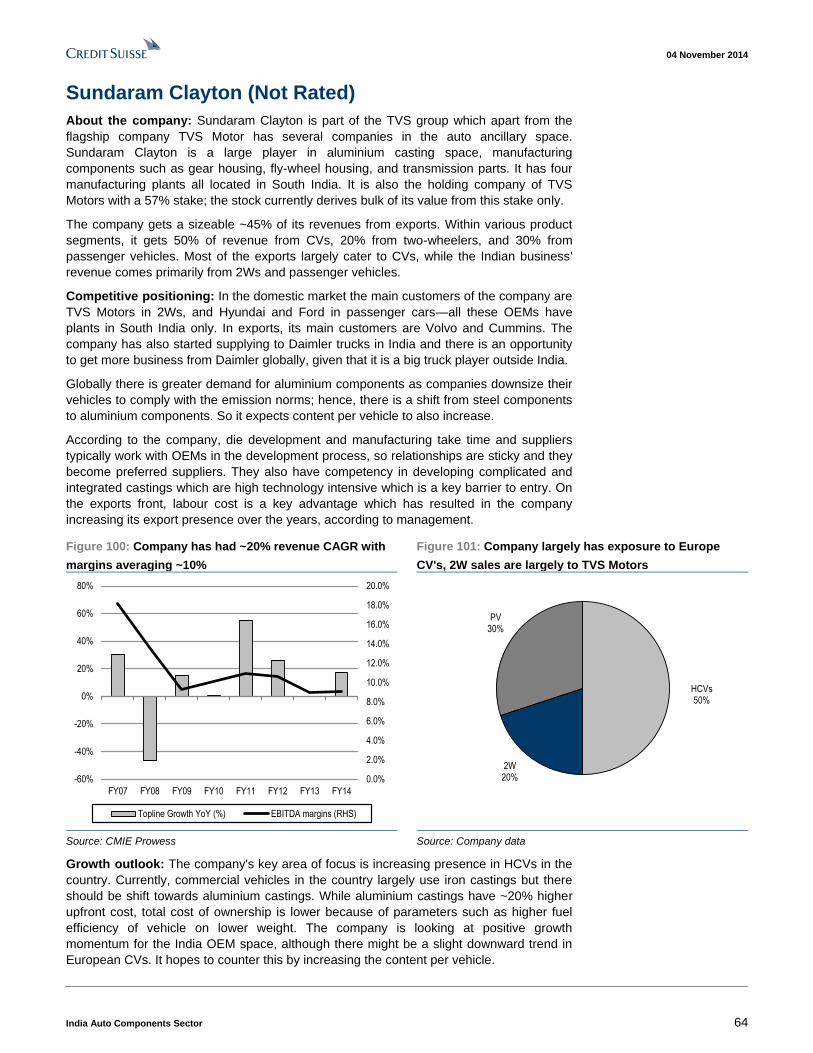
04 November 2014
India Auto Components Sector 64
Sundaram Clayton (Not Rated)
About the company: Sundaram Clayton is part of the TVS group which apart from the
flagship company TVS Motor has several companies in the auto ancillary space.
Sundaram Clayton is a large player in aluminium casting space, manufacturing
components such as gear housing, fly-wheel housing, and transmission parts. It has four
manufacturing plants all located in South India. It is also the holding company of TVS
Motors with a 57% stake; the stock currently derives bulk of its value from this stake only.
The company gets a sizeable ~45% of its revenues from exports. Within various product
segments, it gets 50% of revenue from CVs, 20% from two-wheelers, and 30% from
passenger vehicles. Most of the exports largely cater to CVs, while the Indian business'
revenue comes primarily from 2Ws and passenger vehicles.
Competitive positioning: In the domestic market the main customers of the company are
TVS Motors in 2Ws, and Hyundai and Ford in passenger cars—all these OEMs have
plants in South India only. In exports, its main customers are Volvo and Cummins. The
company has also started supplying to Daimler trucks in India and there is an opportunity
to get more business from Daimler globally, given that it is a big truck player outside India.
Globally there is greater demand for aluminium components as companies downsize their
vehicles to comply with the emission norms; hence, there is a shift from steel components
to aluminium components. So it expects content per vehicle to also increase.
According to the company, die development and manufacturing take time and suppliers
typically work with OEMs in the development process, so relationships are sticky and they
become preferred suppliers. They also have competency in developing complicated and
integrated castings which are high technology intensive which is a key barrier to entry. On
the exports front, labour cost is a key advantage which has resulted in the company
increasing its export presence over the years, according to management.
Figure 100: Company has had ~20% revenue CAGR with
margins averaging ~10%
Figure 101: Company largely has exposure to Europe
CV's, 2W sales are largely to TVS Motors
0.0%
2.0%
4.0%
6.0%
8.0%
10.0%
12.0%
14.0%
16.0%
18.0%
20.0%
-60%
-40%
-20%
0%
20%
40%
60%
80%
FY07 FY08 FY09 FY10 FY11 FY12 FY13 FY14
Topline Growth YoY (%) EBITDA margins (RHS)
HCVs50%
2W20%
PV30%
Source: CMIE Prowess Source: Company data
Growth outlook: The company's key area of focus is increasing presence in HCVs in the
country. Currently, commercial vehicles in the country largely use iron castings but there
should be shift towards aluminium castings. While aluminium castings have ~20% higher
upfront cost, total cost of ownership is lower because of parameters such as higher fuel
efficiency of vehicle on lower weight. The company is looking at positive growth
momentum for the India OEM space, although there might be a slight downward trend in
European CVs. It hopes to counter this by increasing the content per vehicle.
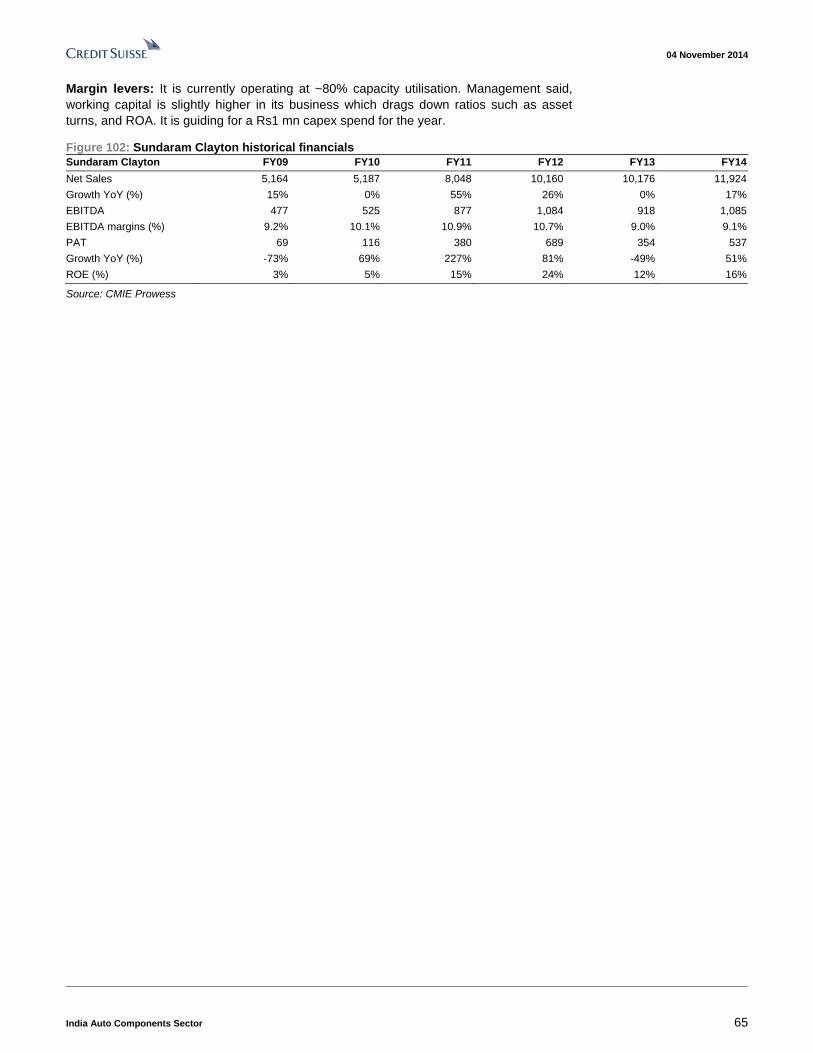
04 November 2014
India Auto Components Sector 65
Margin levers: It is currently operating at ~80% capacity utilisation. Management said,
working capital is slightly higher in its business which drags down ratios such as asset
turns, and ROA. It is guiding for a Rs1 mn capex spend for the year.
Figure 102: Sundaram Clayton historical financials
Sundaram Clayton FY09 FY10 FY11 FY12 FY13 FY14
Net Sales 5,164 5,187 8,048 10,160 10,176 11,924
Growth YoY (%) 15% 0% 55% 26% 0% 17%
EBITDA 477 525 877 1,084 918 1,085
EBITDA margins (%) 9.2% 10.1% 10.9% 10.7% 9.0% 9.1%
PAT 69 116 380 689 354 537
Growth YoY (%) -73% 69% 227% 81% -49% 51%
ROE (%) 3% 5% 15% 24% 12% 16%
Source: CMIE Prowess
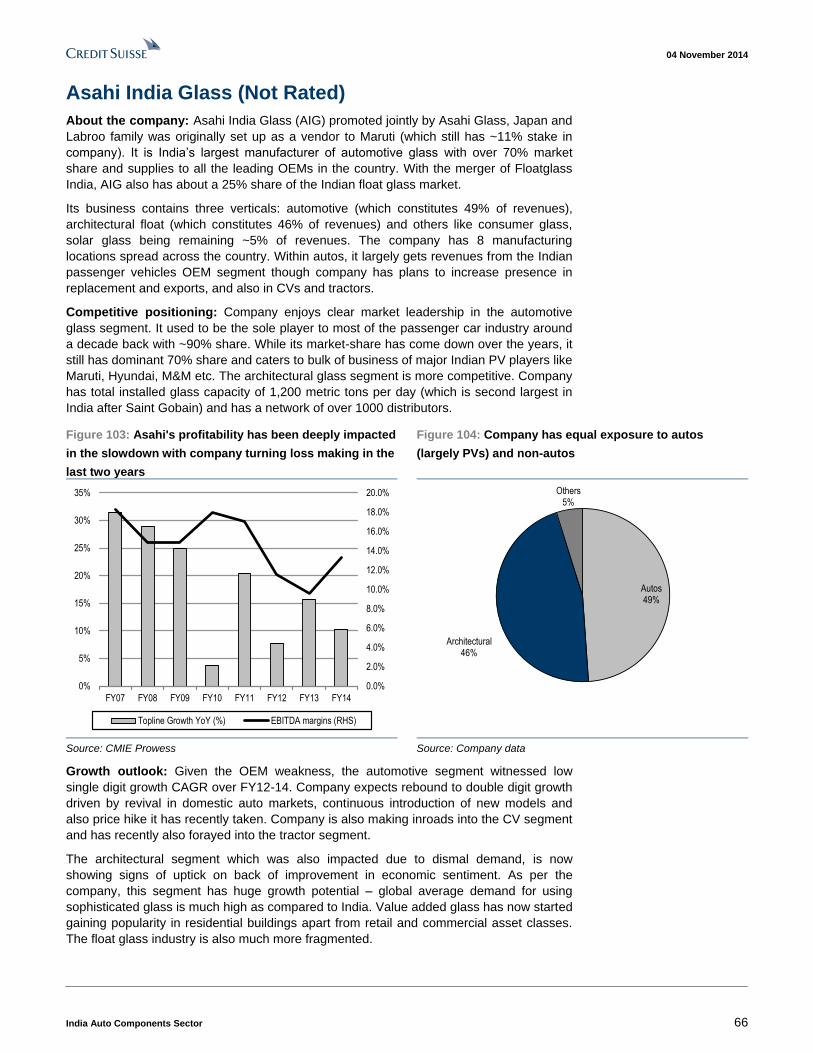
04 November 2014
India Auto Components Sector 66
Asahi India Glass (Not Rated)
About the company: Asahi India Glass (AIG) promoted jointly by Asahi Glass, Japan and
Labroo family was originally set up as a vendor to Maruti (which still has ~11% stake in
company). It is India’s largest manufacturer of automotive glass with over 70% market
share and supplies to all the leading OEMs in the country. With the merger of Floatglass
India, AIG also has about a 25% share of the Indian float glass market.
Its business contains three verticals: automotive (which constitutes 49% of revenues),
architectural float (which constitutes 46% of revenues) and others like consumer glass,
solar glass being remaining ~5% of revenues. The company has 8 manufacturing
locations spread across the country. Within autos, it largely gets revenues from the Indian
passenger vehicles OEM segment though company has plans to increase presence in
replacement and exports, and also in CVs and tractors.
Competitive positioning: Company enjoys clear market leadership in the automotive
glass segment. It used to be the sole player to most of the passenger car industry around
a decade back with ~90% share. While its market-share has come down over the years, it
still has dominant 70% share and caters to bulk of business of major Indian PV players like
Maruti, Hyundai, M&M etc. The architectural glass segment is more competitive. Company
has total installed glass capacity of 1,200 metric tons per day (which is second largest in
India after Saint Gobain) and has a network of over 1000 distributors.
Figure 103: Asahi's profitability has been deeply impacted
in the slowdown with company turning loss making in the
last two years
Figure 104: Company has equal exposure to autos
(largely PVs) and non-autos
0.0%
2.0%
4.0%
6.0%
8.0%
10.0%
12.0%
14.0%
16.0%
18.0%
20.0%
0%
5%
10%
15%
20%
25%
30%
35%
FY07 FY08 FY09 FY10 FY11 FY12 FY13 FY14
Topline Growth YoY (%) EBITDA margins (RHS)
Autos49%
Architectural46%
Others5%
Source: CMIE Prowess Source: Company data
Growth outlook: Given the OEM weakness, the automotive segment witnessed low
single digit growth CAGR over FY12-14. Company expects rebound to double digit growth
driven by revival in domestic auto markets, continuous introduction of new models and
also price hike it has recently taken. Company is also making inroads into the CV segment
and has recently also forayed into the tractor segment.
The architectural segment which was also impacted due to dismal demand, is now
showing signs of uptick on back of improvement in economic sentiment. As per the
company, this segment has huge growth potential – global average demand for using
sophisticated glass is much high as compared to India. Value added glass has now started
gaining popularity in residential buildings apart from retail and commercial asset classes.
The float glass industry is also much more fragmented.
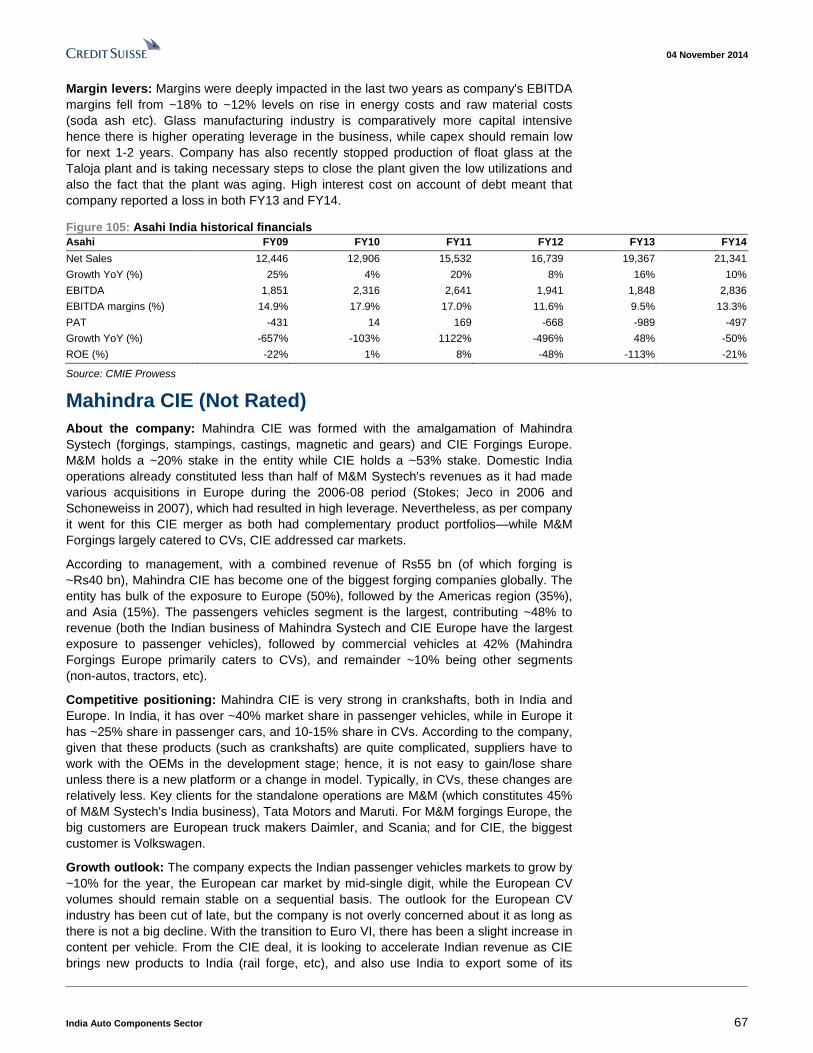
04 November 2014
India Auto Components Sector 67
Margin levers: Margins were deeply impacted in the last two years as company's EBITDA
margins fell from ~18% to ~12% levels on rise in energy costs and raw material costs
(soda ash etc). Glass manufacturing industry is comparatively more capital intensive
hence there is higher operating leverage in the business, while capex should remain low
for next 1-2 years. Company has also recently stopped production of float glass at the
Taloja plant and is taking necessary steps to close the plant given the low utilizations and
also the fact that the plant was aging. High interest cost on account of debt meant that
company reported a loss in both FY13 and FY14.
Figure 105: Asahi India historical financials
Asahi FY09 FY10 FY11 FY12 FY13 FY14
Net Sales 12,446 12,906 15,532 16,739 19,367 21,341
Growth YoY (%) 25% 4% 20% 8% 16% 10%
EBITDA 1,851 2,316 2,641 1,941 1,848 2,836
EBITDA margins (%) 14.9% 17.9% 17.0% 11.6% 9.5% 13.3%
PAT -431 14 169 -668 -989 -497
Growth YoY (%) -657% -103% 1122% -496% 48% -50%
ROE (%) -22% 1% 8% -48% -113% -21%
Source: CMIE Prowess
Mahindra CIE (Not Rated)
About the company: Mahindra CIE was formed with the amalgamation of Mahindra
Systech (forgings, stampings, castings, magnetic and gears) and CIE Forgings Europe.
M&M holds a ~20% stake in the entity while CIE holds a ~53% stake. Domestic India
operations already constituted less than half of M&M Systech's revenues as it had made
various acquisitions in Europe during the 2006-08 period (Stokes; Jeco in 2006 and
Schoneweiss in 2007), which had resulted in high leverage. Nevertheless, as per company
it went for this CIE merger as both had complementary product portfolios—while M&M
Forgings largely catered to CVs, CIE addressed car markets.
According to management, with a combined revenue of Rs55 bn (of which forging is
~Rs40 bn), Mahindra CIE has become one of the biggest forging companies globally. The
entity has bulk of the exposure to Europe (50%), followed by the Americas region (35%),
and Asia (15%). The passengers vehicles segment is the largest, contributing ~48% to
revenue (both the Indian business of Mahindra Systech and CIE Europe have the largest
exposure to passenger vehicles), followed by commercial vehicles at 42% (Mahindra
Forgings Europe primarily caters to CVs), and remainder ~10% being other segments
(non-autos, tractors, etc).
Competitive positioning: Mahindra CIE is very strong in crankshafts, both in India and
Europe. In India, it has over ~40% market share in passenger vehicles, while in Europe it
has ~25% share in passenger cars, and 10-15% share in CVs. According to the company,
given that these products (such as crankshafts) are quite complicated, suppliers have to
work with the OEMs in the development stage; hence, it is not easy to gain/lose share
unless there is a new platform or a change in model. Typically, in CVs, these changes are
relatively less. Key clients for the standalone operations are M&M (which constitutes 45%
of M&M Systech's India business), Tata Motors and Maruti. For M&M forgings Europe, the
big customers are European truck makers Daimler, and Scania; and for CIE, the biggest
customer is Volkswagen.
Growth outlook: The company expects the Indian passenger vehicles markets to grow by
~10% for the year, the European car market by mid-single digit, while the European CV
volumes should remain stable on a sequential basis. The outlook for the European CV
industry has been cut of late, but the company is not overly concerned about it as long as
there is not a big decline. With the transition to Euro VI, there has been a slight increase in
content per vehicle. From the CIE deal, it is looking to accelerate Indian revenue as CIE
brings new products to India (rail forge, etc), and also use India to export some of its
04 November 2014
India Auto Components Sector 68
products. It will also help bring European OEMs' (Volkswagen, Renault, etc) Indian
operations business to M&M Sytech India, since these OEMs already have well developed
relationships with CIE in Europe.
Margin levers: Management believes margin improvement is the key focus area for the
company, particularly in M&M Systech's European business. The company had gone for
all these acquisitions in Europe in order to acquire technology and also an international
customer base. However, it was caught on the wrong side of the cycle as the Global
Financial Crisis set in. Moreover, with the quick recovery post the crisis, it was again
impacted as the company had made deep cuts of skilled workforce (in the downcycle),
which was difficult to bring back with additional pressures from OEMs to develop Euro VI-
compliant products. European business margins had declined to low single digits; so the
company was finding difficult to turn around. This was one of the reasons for the CIE deal,
because, as per management, CIE has greater execution ability. CIE already has the
experience of turning around various companies in Europe, and post this deal, it brought in
its own experts at the top management.
Other than the improvement in capacity utilisation (75% utilisation in India and 65% in
Europe) which is contingent on the demand environment, the company is looking at the
following factors to improve margins: (1) price correction in select markets where margins
are low, (2) a cut in temporary staff, (3) outsourcing of low value-added works such as
finishing, (4) increasing the efficiency of plants by reducing cycle times, and increasing die
life, and (5) €5 mn of annual fuel subsidy to be received from the German government.
Hence, management expects a sizeable improvement in margins in M&M Systech Europe,
a small improvement in M&M Systech India (from improving utilisations), while CIE's
margins should remain constant.
Other points to note: The company has set targets for itself to achieve EBIT of >9%,
debt/EBITDA of <2, FCF/EBITDA of >50% and RONA of >20%. We note that M&M
forgings historical financials are no longer relevant with the merger of CIE and M&M
Systech.
04 November 2014
India Auto Components Sector 69
Companies Mentioned (Price as of 03-Nov-2014)
AIS (AISG.NS, Rs125.0) Amara Raja (AMAR.BO, Rs643.8) Apollo Tyres (APLO.BO, Rs229.85, OUTPERFORM, TP Rs266.0) Ashok Leyland Ltd (ASOK.BO, Rs46.5, NEUTRAL, TP Rs48.0) Bajaj Auto Limited (BAJA.BO, Rs2574.05) Balkrishna Indus (BLKI.NS, Rs803.4) Bharat Forge Limited (BFRG.BO, Rs811.8, NEUTRAL, TP Rs830.0) Bosch Limited (BOSH.BO, Rs15502.15) Bridgestone (5108.T, ¥3,652) Ceat Ltd (CEAT.BO, Rs868.85) Cummins Inc. (CMI.N, $145.89) Daimler (DAIGn.DE, €61.76) Eicher Motors (EICH.BO, Rs12721.2) Exide Industries (EXID.BO, Rs159.9) Fiem Industries (FIIN.NS, Rs700.7) Ford Motor Company (F.N, $13.96) Gabriel India (GABR.NS, Rs83.45) Hero Motocorp Ltd (HROM.BO, Rs3010.75) Honda Motor (7267.T, ¥3,479) Hyundai Motor (005380.KS, W160,000) JAI (JMNA.NS, Rs132.8) JK Tyre & Ind (JKIN.NS, Rs498.2) JTEKT (6473.T, ¥1,731) MRF (MRF.BO, Rs31825.9) Mahindra & Mahindra (MAHM.BO, Rs1268.55) Mahindra CIE (MAHN.NS, Rs218.7) Maruti Suzuki India Ltd (MRTI.BO, Rs3285.6) Michelin (MICP.PA, €68.98) Minda Industries (MNDA.NS, Rs543.5) Motherson Sumi Systems Limited (MOSS.BO, Rs426.45) Nissan Motor (7201.T, ¥998) Rane (RANE.BO, Rs565.5) Renault (RENA.PA, €58.85) SKSSL (SONA.BO, Rs61.45) Sundaram Clayton (SUND.NS, Rs1640.75) Sundram Fasten (SNFS.NS, Rs158.7) Suprajit Engr (SUPE.BO, Rs121.45) TRW Automotive Holdings Corp. (TRW.N, $101.42) TVS Motor (TVSM.BO, Rs261.9) Tata Motors Ltd. (TAMO.BO, Rs531.15) Volkswagen (VOWG_p.F, €170.5) Wabco India Ltd. (WABC.BO, Rs3584.1, OUTPERFORM, TP Rs4820.0)
Disclosure Appendix
Important Global Disclosures
I, Jatin Chawla, certify that (1) the views expressed in this report accurately reflect my personal views about all of the subject companies and securities and (2) no part of my compensation was, is or will be directly or indirectly related to the specific recommendations or views expressed in this report.
3-Year Price and Rating History for Apollo Tyres (APLO.BO)
APLO.BO Closing Price Target Price
Date (Rs) (Rs) Rating
07-Jun-12 83.35 77.00 U *
02-Nov-12 86.45 85.00
13-May-13 90.05 89.00
06-Jan-14 105.95 131.00 O
12-Feb-14 118.40 144.00
15-May-14 177.30 190.00
10-Jun-14 203.10 233.00
* Asterisk signifies initiation or assumption of coverage.
U N D ERPERFO RM
O U T PERFO RM
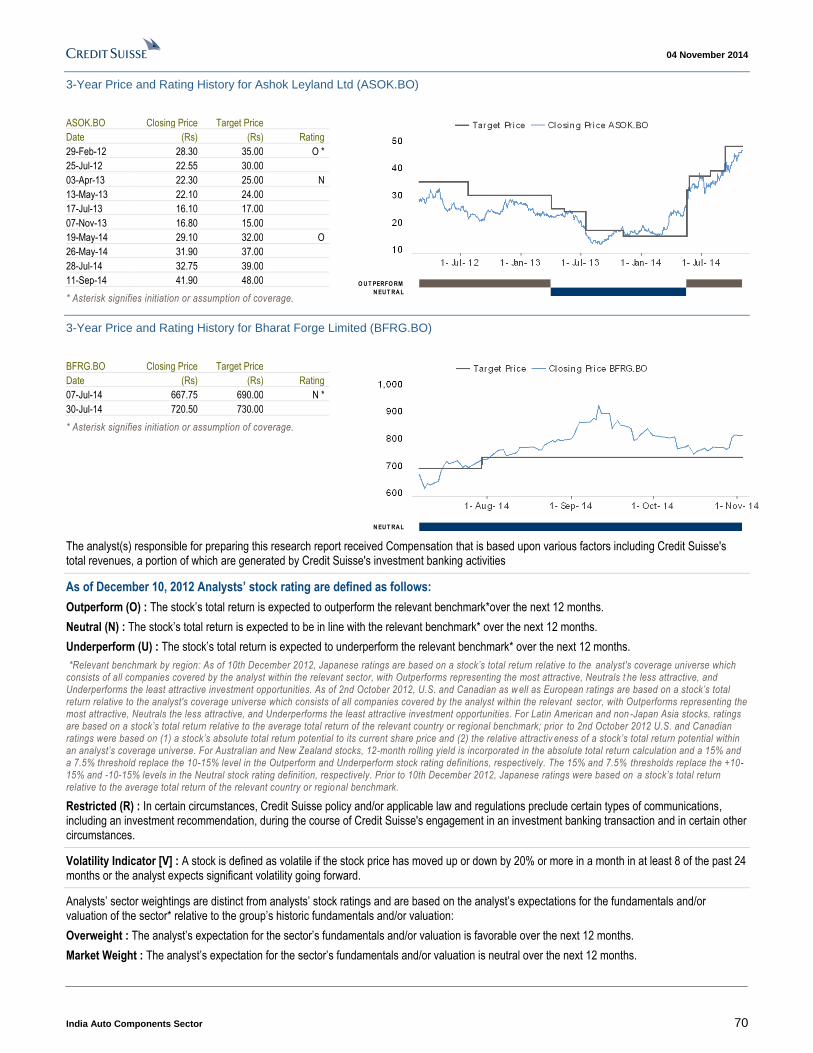
04 November 2014
India Auto Components Sector 70
3-Year Price and Rating History for Ashok Leyland Ltd (ASOK.BO)
ASOK.BO Closing Price Target Price
Date (Rs) (Rs) Rating
29-Feb-12 28.30 35.00 O *
25-Jul-12 22.55 30.00
03-Apr-13 22.30 25.00 N
13-May-13 22.10 24.00
17-Jul-13 16.10 17.00
07-Nov-13 16.80 15.00
19-May-14 29.10 32.00 O
26-May-14 31.90 37.00
28-Jul-14 32.75 39.00
11-Sep-14 41.90 48.00
* Asterisk signifies initiation or assumption of coverage.
O U T PERFO RM
N EU T RA L
3-Year Price and Rating History for Bharat Forge Limited (BFRG.BO)
BFRG.BO Closing Price Target Price
Date (Rs) (Rs) Rating
07-Jul-14 667.75 690.00 N *
30-Jul-14 720.50 730.00
* Asterisk signifies initiation or assumption of coverage.
N EU T RA L
The analyst(s) responsible for preparing this research report received Compensation that is based upon various factors including Credit Suisse's total revenues, a portion of which are generated by Credit Suisse's investment banking activities
As of December 10, 2012 Analysts’ stock rating are defined as follows:
Outperform (O) : The stock’s total return is expected to outperform the relevant benchmark*over the next 12 months.
Neutral (N) : The stock’s total return is expected to be in line with the relevant benchmark* over the next 12 months.
Underperform (U) : The stock’s total return is expected to underperform the relevant benchmark* over the next 12 months.
*Relevant benchmark by region: As of 10th December 2012, Japanese ratings are based on a stock’s total return relative to the analyst's coverage universe which consists of all companies covered by the analyst within the relevant sector, with Outperforms representing the most attractive, Neutrals t he less attractive, and Underperforms the least attractive investment opportunities. As of 2nd October 2012, U.S. and Canadian as w ell as European ratings are based on a stock’s total return relative to the analyst's coverage universe which consists of all companies covered by the analyst within the relevant sector, with Outperforms representing the most attractive, Neutrals the less attractive, and Underperforms the least attractive investment opportunities. For Latin American and non -Japan Asia stocks, ratings are based on a stock’s total return relative to the average total return of the relevant country or regional benchmark; prior to 2nd October 2012 U.S. and Canadian ratings were based on (1) a stock’s absolute total return potential to its current share price and (2) the relative attractiv eness of a stock’s total return potential within an analyst’s coverage universe. For Austral ian and New Zealand stocks, 12-month rolling yield is incorporated in the absolute total return calculation and a 15% and a 7.5% threshold replace the 10-15% level in the Outperform and Underperform stock rating definitions, respectively. The 15% and 7.5% thresholds replace the +10-15% and -10-15% levels in the Neutral stock rating definition, respectively. Prior to 10th December 2012, Japanese ratings were based on a stock’s total return relative to the average total return of the relevant country or regional benchmark.
Restricted (R) : In certain circumstances, Credit Suisse policy and/or applicable law and regulations preclude certain types of communications, including an investment recommendation, during the course of Credit Suisse's engagement in an investment banking transaction and in certain other circumstances.
Volatility Indicator [V] : A stock is defined as volatile if the stock price has moved up or down by 20% or more in a month in at least 8 of the past 24 months or the analyst expects significant volatility going forward.
Analysts’ sector weightings are distinct from analysts’ stock ratings and are based on the analyst’s expectations for the fundamentals and/or valuation of the sector* relative to the group’s historic fundamentals and/or valuation:
Overweight : The analyst’s expectation for the sector’s fundamentals and/or valuation is favorable over the next 12 months.
Market Weight : The analyst’s expectation for the sector’s fundamentals and/or valuation is neutral over the next 12 months.
04 November 2014
India Auto Components Sector 71
Underweight : The analyst’s expectation for the sector’s fundamentals and/or valuation is cautious over the next 12 months.
*An analyst’s coverage sector consists of all companies covered by the analyst within the relevant sector. An analyst may cov er multiple sectors.
Credit Suisse's distribution of stock ratings (and banking clients) is:
Global Ratings Distribution
Rating Versus universe (%) Of which banking clients (%)
Outperform/Buy* 46% (54% banking clients)
Neutral/Hold* 39% (51% banking clients)
Underperform/Sell* 13% (43% banking clients)
Restricted 3%
*For purposes of the NYSE and NASD ratings distribution disclosure requirements, our stock ratings of Outperform, Neutral, an d Underperform most closely correspond to Buy, Hold, and Sell, respectively; however, the meanings are not the same, as our stock ratings are determined on a relative basis. (Please refer to definitions above.) An investor's decision to buy or sell a security should be based on investment objectives, current holdin gs, and other individual factors.
Credit Suisse’s policy is to update research reports as it deems appropriate, based on developments with the subject company, the sector or the market that may have a material impact on the research views or opinions stated herein.
Credit Suisse's policy is only to publish investment research that is impartial, independent, clear, fair and not misleading. For more detail please refer to Credit Suisse's Policies for Managing Conflicts of Interest in connection with Investment Research: http://www.csfb.com/research and analytics/disclaimer/managing_conflicts_disclaimer.html
Credit Suisse does not provide any tax advice. Any statement herein regarding any US federal tax is not intended or written to be used, and cannot be used, by any taxpayer for the purposes of avoiding any penalties.
Price Target: (12 months) for Bharat Forge Limited (BFRG.BO)
Method: We value stock at 20x Sep-16 earnings (~10% premium to historic average given the structural shift in company's model) to arrive at our target price of Rs830 for Bharat Forge Limited.
Risk: The key downside risks to our Rs830 target price for Bharat Forge Limited include a slower-than-expected recovery in global auto volumes and industrial segment; inability to scale-up in the non-autos business as per expectations, increase in steel prices which is the main raw material. Upside risks include much faster than expected growth in non-autos (considering the massive opportunity size)
Price Target: (12 months) for Ashok Leyland Ltd (ASOK.BO)
Method: Our target price of Rs 48 for Ashok Leyland is based on P/E, we value the stock at 13x Jun-16E earnings (inline with 5 year average) and we give a Rs5/share value for the unlisted subs.
Risk: Key downside risks to our target price of Rs 48 for Ashok Leyland is a slower than expected recovery in the economy. We are expecting a strong Central Govt to take steps to revive the economy in the next two years. Ashok Leyland's earnings will be impacted greatly as stock has high financial and operating leverage
Price Target: (12 months) for Wabco India Ltd. (WABC.BO)
Method: We value Wabco India Ltd. at a target price of Rs4,820 using a DCF (discounted cash flow) methodology. We assume a 8% CAGR in content per vehicle and 8-10% growth in domestic CV volumes driving 16-18% growth in domestic revenue for the company. We assume a risk-free rate of 8% for the Indian market and 15% as the market return which gives us a cost of equity of 12.5%.
Risk: Risks that could impede achievement of our Rs4,820 target price for Wabco India Ltd. include: a slower-than-expected recovery in the CV cycle which would put pressure on both volumes as well as content per vehicle. Knorr so far has been a weak second player in the market; if Knorr is able to scale up faster than expected, that too will have a significant negative impact on WABCO
Price Target: (12 months) for Apollo Tyres (APLO.BO)
Method: Our target price of Rs266 for Apollo Tyres is based on an enterprise value (EV) of 5.5x Sep-16E EBITDA (earnings before interest, tax, depreciation and amortisation), in line with global peers.
Risk: Risks that could impede achievement of our target price of Rs266 for Apollo Tyres include: a sharp increase in rubber prices leading to a decline in margins for the company, and a high penalty for pulling out of the Cooper deal.
Please refer to the firm's disclosure website at https://rave.credit-suisse.com/disclosures for the definitions of abbreviations typically used in the target price method and risk sections.
See the Companies Mentioned section for full company names
04 November 2014
India Auto Components Sector 72
The subject company (APLO.BO, TRW.N, MAHM.BO, 7267.T, F.N, TAMO.BO, MOSS.BO, HROM.BO) currently is, or was during the 12-month period preceding the date of distribution of this report, a client of Credit Suisse.
Credit Suisse provided investment banking services to the subject company (7267.T, F.N, TAMO.BO) within the past 12 months.
Credit Suisse provided non-investment banking services to the subject company (F.N) within the past 12 months
Credit Suisse has managed or co-managed a public offering of securities for the subject company (7267.T, F.N, TAMO.BO) within the past 12 months.
Credit Suisse has received investment banking related compensation from the subject company (7267.T, F.N, TAMO.BO) within the past 12 months
Credit Suisse expects to receive or intends to seek investment banking related compensation from the subject company (APLO.BO, TRW.N, MAHM.BO, 7267.T, MRTI.BO, 5108.T, CMI.N, F.N, TAMO.BO, 7201.T, MOSS.BO, HROM.BO) within the next 3 months.
Credit Suisse has received compensation for products and services other than investment banking services from the subject company (F.N) within the past 12 months
As of the date of this report, Credit Suisse makes a market in the following subject companies (TRW.N, 7267.T, CMI.N, F.N, 7201.T).
As of the end of the preceding month, Credit Suisse beneficially own 1% or more of a class of common equity securities of (APLO.BO, MAHM.BO, HROM.BO).
For other important disclosures concerning companies featured in this report, including price charts, please visit the website at https://rave.credit-suisse.com/disclosures or call +1 (877) 291-2683.
Important Regional Disclosures
Singapore recipients should contact Credit Suisse AG, Singapore Branch for any matters arising from this research report.
The analyst(s) involved in the preparation of this report have not visited the material operations of the subject company (BFRG.BO, ASOK.BO, WABC.BO, APLO.BO, TRW.N, MAHM.BO, 7267.T, MRTI.BO, 005380.KS, RENA.PA, 5108.T, CMI.N, EXID.BO, F.N, BAJA.BO, TAMO.BO, EICH.BO, 7201.T, MOSS.BO, DAIGn.DE, 6473.T, MICP.PA, HROM.BO) within the past 12 months
Restrictions on certain Canadian securities are indicated by the following abbreviations: NVS--Non-Voting shares; RVS--Restricted Voting Shares; SVS--Subordinate Voting Shares.
Individuals receiving this report from a Canadian investment dealer that is not affiliated with Credit Suisse should be advised that this report may not contain regulatory disclosures the non-affiliated Canadian investment dealer would be required to make if this were its own report.
For Credit Suisse Securities (Canada), Inc.'s policies and procedures regarding the dissemination of equity research, please visit http://www.csfb.com/legal_terms/canada_research_policy.shtml.
The following disclosed European company/ies have estimates that comply with IFRS: (RENA.PA, F.N, 7201.T, DAIGn.DE, MICP.PA).
Credit Suisse has acted as lead manager or syndicate member in a public offering of securities for the subject company (7267.T, 005380.KS, F.N, TAMO.BO) within the past 3 years.
As of the date of this report, Credit Suisse acts as a market maker or liquidity provider in the equities securities that are the subject of this report.
Principal is not guaranteed in the case of equities because equity prices are variable.
Commission is the commission rate or the amount agreed with a customer when setting up an account or at any time after that.
To the extent this is a report authored in whole or in part by a non-U.S. analyst and is made available in the U.S., the following are important disclosures regarding any non-U.S. analyst contributors: The non-U.S. research analysts listed below (if any) are not registered/qualified as research analysts with FINRA. The non-U.S. research analysts listed below may not be associated persons of CSSU and therefore may not be subject to the NASD Rule 2711 and NYSE Rule 472 restrictions on communications with a subject company, public appearances and trading securities held by a research analyst account.
Credit Suisse Securities (India) Private Limited ...................................................................................................... Jatin Chawla ; Akshay Saxena
For Credit Suisse disclosure information on other companies mentioned in this report, please visit the website at https://rave.credit-suisse.com/disclosures or call +1 (877) 291-2683.
04 November 2014
India Auto Components Sector 73
References in this report to Credit Suisse include all of the subsidiaries and affiliates of Credit Suisse operating under its investment banking division. For more information on our structure, please use the following link: https://www.credit-suisse.com/who_we_are/en/This report may contain material that is not directed to, or intended for distribution to or use by, any person or entity who is a citizen or resident of or located in any locality, state, country or other jurisdiction where such distribution, publication, availability or use would be contrary to law or regulation or which would subject Credit Suisse AG or its affiliates ("CS") to any registration or licensing requirement within such jurisdiction. All material presented in this report, unless specifically indicated otherwise, is under copyright to CS. None of the material, nor its content, nor any copy of it, may be altered in any way, transmitted to, copied or distributed to any other party, without the prior express written permission of CS. All trademarks, service marks and logos used in this report are trademarks or service marks or registered trademarks or service marks of CS or its affiliates. The information, tools and material presented in this report are provided to you for information purposes only and are not to be used or considered as an offer or the solicitation of an offer to sell or to buy or subscribe for securities or other financial instruments. CS may not have taken any steps to ensure that the securities referred to in this report are suitable for any particular investor. CS will not treat recipients of this report as its customers by virtue of their receiving this report. The investments and services contained or referred to in this report may not be suitable for you and it is recommended that you consult an independent investment advisor if you are in doubt about such investments or investment services. Nothing in this report constitutes investment, legal, accounting or tax advice, or a representation that any investment or strategy is suitable or appropriate to your individual circumstances, or otherwise constitutes a personal recommendation to you. CS does not advise on the tax consequences of investments and you are advised to contact an independent tax adviser. Please note in particular that the bases and levels of taxation may change. Information and opinions presented in this report have been obtained or derived from sources believed by CS to be reliable, but CS makes no representation as to their accuracy or completeness. CS accepts no liability for loss arising from the use of the material presented in this report, except that this exclusion of liability does not apply to the extent that such liability arises under specific statutes or regulations applicable to CS. This report is not to be relied upon in substitution for the exercise of independent judgment. CS may have issued, and may in the future issue, other communications that are inconsistent with, and reach different conclusions from, the information presented in this report. Those communications reflect the different assumptions, views and analytical methods of the analysts who prepared them and CS is under no obligation to ensure that such other communications are brought to the attention of any recipient of this report. Some investments referred to in this report will be offered solely by a single entity and in the case of some investments solely by CS, or an associate of CS or CS may be the only market maker in such investments. Past performance should not be taken as an indication or guarantee of future performance, and no representation or warranty, express or implied, is made regarding future performance. Information, opinions and estimates contained in this report reflect a judgment at its original date of publication by CS and are subject to change without notice. The price, value of and income from any of the securities or financial instruments mentioned in this report can fall as well as rise. The value of securities and financial instruments is subject to exchange rate fluctuation that may have a positive or adverse effect on the price or income of such securities or financial instruments. Investors in securities such as ADR's, the values of which are influenced by currency volatility, effectively assume this risk. Structured securities are complex instruments, typically involve a high degree of risk and are intended for sale only to sophisticated investors who are capable of understanding and assuming the risks involved. The market value of any structured security may be affected by changes in economic, financial and political factors (including, but not limited to, spot and forward interest and exchange rates), time to maturity, market conditions and volatility, and the credit quality of any issuer or reference issuer. Any investor interested in purchasing a structured product should conduct their own investigation and analysis of the product and consult with their own professional advisers as to the risks involved in making such a purchase. Some investments discussed in this report may have a high level of volatility. High volatility investments may experience sudden and large falls in their value causing losses when that investment is realised. Those losses may equal your original investment. Indeed, in the case of some investments the potential losses may exceed the amount of initial investment and, in such circumstances, you may be required to pay more money to support those losses. Income yields from investments may fluctuate and, in consequence, initial capital paid to make the investment may be used as part of that income yield. Some investments may not be readily realisable and it may be difficult to sell or realise those investments, similarly it may prove difficult for you to obtain reliable information about the value, or risks, to which such an investment is exposed. This report may provide the addresses of, or contain hyperlinks to, websites. Except to the extent to which the report refers to website material of CS, CS has not reviewed any such site and takes no responsibility for the content contained therein. Such address or hyperlink (including addresses or hyperlinks to CS's own website material) is provided solely for your convenience and information and the content of any such website does not in any way form part of this document. Accessing such website or following such link through this report or CS's website shall be at your own risk. This report is issued and distributed in Europe (except Switzerland) by Credit Suisse Securities (Europe) Limited, One Cabot Square, London E14 4QJ, England, which is authorised by the Prudential Regulation Authority and regulated by the Financial Conduct Authority and the Prudential Regulation Authority. This report is being distributed in Germany by Credit Suisse Securities (Europe) Limited Niederlassung Frankfurt am Main regulated by the Bundesanstalt fuer Finanzdienstleistungsaufsicht ("BaFin"). This report is being distributed in the United States and Canada by Credit Suisse Securities (USA) LLC; in Switzerland by Credit Suisse AG; in Brazil by Banco de Investimentos Credit Suisse (Brasil) S.A or its affiliates; in Mexico by Banco Credit Suisse (México), S.A. (transactions related to the securities mentioned in this report will only be effected in compliance with applicable regulation); in Japan by Credit Suisse Securities (Japan) Limited, Financial Instruments Firm, Director-General of Kanto Local Finance Bureau (Kinsho) No. 66, a member of Japan Securities Dealers Association, The Financial Futures Association of Japan, Japan Investment Advisers Association, Type II Financial Instruments Firms Association; elsewhere in Asia/ Pacific by whichever of the following is the appropriately authorised entity in the relevant jurisdiction: Credit Suisse (Hong Kong) Limited, Credit Suisse Equities (Australia) Limited, Credit Suisse Securities (Thailand) Limited, regulated by the Office of the Securities and Exchange Commission, Thailand, having registered address at 990 Abdulrahim Place, 27th Floor, Unit 2701, Rama IV Road, Silom, Bangrak, Bangkok 10500, Thailand, Tel. +66 2614 6000, Credit Suisse Securities (Malaysia) Sdn Bhd, Credit Suisse AG, Singapore Branch, Credit Suisse Securities (India) Private Limited (CIN no. U67120MH1996PTC104392) regulated by the Securities and Exchange Board of India (registration Nos. INB230970637; INF230970637; INB010970631; INF010970631), having registered address at 9th Floor, Ceejay House, Dr.A.B. Road, Worli, Mumbai - 18, India, T- +91-22 6777 3777, Credit Suisse Securities (Europe) Limited, Seoul Branch, Credit Suisse AG, Taipei Securities Branch, PT Credit Suisse Securities Indonesia, Credit Suisse Securities (Philippines ) Inc., and elsewhere in the world by the relevant authorised affiliate of the above. Research on Taiwanese securities produced by Credit Suisse AG, Taipei Securities Branch has been prepared by a registered Senior Business Person. Research provided to residents of Malaysia is authorised by the Head of Research for Credit Suisse Securities (Malaysia) Sdn Bhd, to whom they should direct any queries on +603 2723 2020. This report has been prepared and issued for distribution in Singapore to institutional investors, accredited investors and expert investors (each as defined under the Financial Advisers Regulations) only, and is also distributed by Credit Suisse AG, Singapore branch to overseas investors (as defined under the Financial Advisers Regulations). By virtue of your status as an institutional investor, accredited investor, expert investor or overseas investor, Credit Suisse AG, Singapore branch is exempted from complying with certain compliance requirements under the Financial Advisers Act, Chapter 110 of Singapore (the "FAA"), the Financial Advisers Regulations and the relevant Notices and Guidelines issued thereunder, in respect of any financial advisory service which Credit Suisse AG, Singapore branch may provide to you. This research may not conform to Canadian disclosure requirements. In jurisdictions where CS is not already registered or licensed to trade in securities, transactions will only be effected in accordance with applicable securities legislation, which will vary from jurisdiction to jurisdiction and may require that the trade be made in accordance with applicable exemptions from registration or licensing requirements. Non-U.S. customers wishing to effect a transaction should contact a CS entity in their local jurisdiction unless governing law permits otherwise. U.S. customers wishing to effect a transaction should do so only by contacting a representative at Credit Suisse Securities (USA) LLC in the U.S. Please note that this research was originally prepared and issued by CS for distribution to their market professional and institutional investor customers. Recipients who are not market professional or institutional investor customers of CS should seek the advice of their independent financial advisor prior to taking any investment decision based on this report or for any necessary explanation of its contents. This research may relate to investments or services of a person outside of the UK or to other matters which are not authorised by the Prudential Regulation Authority and regulated by the Financial Conduct Authority and the Prudential Regulation Authority or in respect of which the protections of the Prudential Regulation Authority and Financial Conduct Authority for private customers and/or the UK compensation scheme may not be available, and further details as to where this may be the case are available upon request in respect of this report. CS may provide various services to US municipal entities or obligated persons ("municipalities"), including suggesting individual transactions or trades and entering into such transactions. Any services CS provides to municipalities are not viewed as "advice" within the meaning of Section 975 of the Dodd-Frank Wall Street Reform and Consumer Protection Act. CS is providing any such services and related information solely on an arm's length basis and not as an advisor or fiduciary to the municipality. In connection with the provision of the any such services, there is no agreement, direct or indirect, between any municipality (including the officials, management, employees or agents thereof) and CS for CS to provide advice to the municipality. Municipalities should consult with their financial, accounting and legal advisors regarding any such services provided by CS. In addition, CS is not acting for direct or indirect compensation to solicit the municipality on behalf of an unaffiliated broker, dealer, municipal securities dealer, municipal advisor, or investment adviser for the purpose of obtaining or retaining an engagement by the municipality for or in connection with Municipal Financial Products, the issuance of municipal securities, or of an investment adviser to provide investment advisory services to or on behalf of the municipality. If this report is being distributed by a financial institution other than Credit Suisse AG, or its affiliates, that financial institution is solely responsible for distribution. Clients of that institution should contact that institution to effect a transaction in the securities mentioned in this report or require further information. This report does not constitute investment advice by Credit Suisse to the clients of the distributing financial institution, and neither Credit Suisse AG, its affiliates, and their respective officers, directors and employees accept any liability whatsoever for any direct or consequential loss arising from their use of this report or its content. Principal is not guaranteed. Commission is the commission rate or the amount agreed with a customer when setting up an account or at any time after that.
Copyright © 2014 CREDIT SUISSE AG and/or its affiliates. All rights reserved.
Investment principal on bonds can be eroded depending on sale price or market price. In addition, there are bonds on which investment principal can be eroded due to changes in redemption amounts. Care is required when investing in such instruments. When you purchase non-listed Japanese fixed income securities (Japanese government bonds, Japanese municipal bonds, Japanese government guaranteed bonds, Japanese corporate bonds) from CS as a seller, you will be requested to pay the purchase price only.
AU0367.doc