Embed Size (px)
Citation preview

8/3/2019 20 Years of Spain
http://slidepdf.com/reader/full/20-years-of-spain 1/161
EUROPEAN COMMISSIONEUROPEAN PARLIAMENT
20 Years of Spain inthe European Union(1986-2006)
8/3/2019 20 Years of Spain
http://slidepdf.com/reader/full/20-years-of-spain 2/161
2 20 Years of Spain in the European Union
Design and layout: Distinctum, S.L.Printed by: Artegraf, S.A.Publisher: Elcano Royal Instituteand European Parliament - Office in SpainLegal number: M. 13967-2006
ISBN 84-689-7384-X
Elcano Royal Institutec./ Príncipe de Vergara, 5128006 MadridTelephone: 91 781 67 70Fax: 91 426 21
E-mail: [email protected]
8/3/2019 20 Years of Spain
http://slidepdf.com/reader/full/20-years-of-spain 3/161
Contents
3www.realinstitutoelcano.org
Letter from Gustavo Suárez Pertierra, Chairman of the Elcano Royal Institute 5
Letter from Josep Borrell, President of the European Parliament 6
Letter from José Manuel Barroso, President of the European Commission 8
Letter from José Luis Rodríguez Zapatero, President of the Government of Spain 9
Introduction 10
Acknowledgements 15
20 Years of Spain in the European Union 16
Economy: 20 facts for 20 years 17
Society: 20 facts for 20 years 59
Politics: 20 facts for 20 years 101
Annex 142
Bibliography 159

8/3/2019 20 Years of Spain
http://slidepdf.com/reader/full/20-years-of-spain 4/161
4 20 Years of Spain in the European Union
8/3/2019 20 Years of Spain
http://slidepdf.com/reader/full/20-years-of-spain 5/161
8/3/2019 20 Years of Spain
http://slidepdf.com/reader/full/20-years-of-spain 6/161
6 20 Years of Spain in the European Union
The impact of Spain’s 20 years of integration in the European Union in economic, political and,most notably, social terms has been extraordinary. Thanks to Community solidarity and thecollective efforts of all its people, Spain has undergone the most extensive transformation andmodernisation of its history.
Twenty years ago Spanish inflation was around 10% per year, unemployment was over 17% andGDP was approximately 71% of the Community average. Today inflation is 3%, unemployment isunder 10% and Spanish GDP is around 90% of the average of the EU 15, and almost 100% of theaverage of the EU-25. In 1985 Spain had 2 117 km of motorways and dual carriageways; today ithas 13 000 km.
Our accession to the EU brought with it the definitive opening-up of our economy and greaterpresence on the international stage.
Moreover, in the course of this period Spanish society has been greatly modernised through thewidespread and rapid integration of women into the workforce, the expansion of third-levelpublic education, universal healthcare, the introduction of progressive tax systems, the laws ongender equality, etc. Since its entry into the EU, Spanish society has broken all the stereotypes,changing the image of it held by the rest of Europe. The European Union has also provided Spainwith an important democratic culture.
Since the beginning, and right throughout the process of European integration, Spain has showngreat enthusiasm for completing the single market, achieving the euro and the Economic andMonetary Union, creating a European area of security and justice, and stepping up cooperation inthe area of external policy, thereby enabling Europe to speak with one voice throughoutthe world.
Spain has also brought to the EU its Mediterranean and Latin American dimension, and the specialcultural, economic and political relations it has with other nations around the world.
8/3/2019 20 Years of Spain
http://slidepdf.com/reader/full/20-years-of-spain 7/161
7www.realinstitutoelcano.org
In the course of these 20 years, Spain has been at the forefront of culture in Europe with itscontributions to our common heritage through its cultural and linguistic diversity, literature,cinema, music, painting, art and gastronomy.
This publication, ‘20 Years of Spain in the European Union (1986-2006)’, published by the Office ofthe European Parliament and the Representation of the European Commission in Spain incollaboration with the Elcano Royal Institute, reveals the data behind this profound economic,social and political transformation and reflects the story of a success: Spain’s integration in theEuropean Union. At this time of reflection on the future of Europe, its objective is not only to takestock and provide an analysis of what has been achieved, but also, and above all, to provide a basisfor the debates that will enable us to consider the future of the European Union from a Spanishperspective.
Josep BorrellPresident of the European Parliament
8/3/2019 20 Years of Spain
http://slidepdf.com/reader/full/20-years-of-spain 8/161
8/3/2019 20 Years of Spain
http://slidepdf.com/reader/full/20-years-of-spain 9/161
9www.realinstitutoelcano.org
1 January 2006 was the 20th anniversary of the accession of Spain and Portugal to the thenEuropean Communities.
Twenty years is a sufficiently long period to enable us to take stock of what has been achieved.
It has undoubtedly been a positive experience both for Spain and for what is now the EuropeanUnion. As far as Spain is concerned, it is difficult to find in our modern history a period of politicalstability, economic growth and social welfare such as the one we have experienced since 1986.There is no question that Spain today is more modern, more prosperous and more united than theSpain that joined the European Communities 20 years ago.
For its part, the European Union has grown from 12 to 25 countries, which will very soon be joinedby Bulgaria and Romania. Enlargement has been accompanied by advances in the process ofEuropean integration. Spain has made a vital contribution to promoting that integration, bothinternally, by encouraging the creation of an area of freedom, security and justice or improvingeconomic and social cohesion, and in terms of relations with third countries, by working resolutelyto strengthen relations with Latin America and the third countries of the Mediterranean.
History does not stop, and we therefore want to remember what these 20 years have meant andkeep alive the debate on the challenges Spain and Europe are facing and the solutions the
European Union can provide.This publication by the Elcano Royal Institute should prove very useful in focusing andpromoting this debate.
José Luis Rodríguez ZapateroPresident of the Government of Spain
8/3/2019 20 Years of Spain
http://slidepdf.com/reader/full/20-years-of-spain 10/161
8/3/2019 20 Years of Spain
http://slidepdf.com/reader/full/20-years-of-spain 11/161
8/3/2019 20 Years of Spain
http://slidepdf.com/reader/full/20-years-of-spain 12/161
8/3/2019 20 Years of Spain
http://slidepdf.com/reader/full/20-years-of-spain 13/161
8/3/2019 20 Years of Spain
http://slidepdf.com/reader/full/20-years-of-spain 14/161
be crucial, together with the structural reformsundertaken, in modernising the country’s econ-omy and helping it on the path towards politi-cal, economic and social convergence. Europeanfunds, which between 1986 and 2004 havetotalled EUR 211 billion (in 2004 prices) haveaccounted for 0.8% of GDP in 20 years, 300 000
jobs and around EUR 5 275 per inhabitant overthat period (approximately EUR 260 per inhabi-
tant per year). They are the Marshall Plan fromwhich Spain never benefited.
In return, Spain has been a loyal and committedpartner. Defying the prejudices of those whoconsidered it a natural member of a ‘Club Med’,incapable of imposing any discipline, Spain
joined the third stage of EMU under the sameconditions as the rest of the countries, bringing
with it others, such as Italy, which had seemedmore convinced that it would be possible to‘stop the clock’ and postpone the entry intoforce of the euro.
Without Spain, it is difficult today to imagineeconomic and social cohesion, European citizen-ship or the importance of the area of freedom,security and justice. Spain has become signifi-cantly more European, but it has also enrichedthe Union, intensifying its Mediterraneandimension and providing it with a LatinAmerican dimension that it was lacking. It is stillappropriate today to highlight the synergy
between the EU and Spain, and the amalgama-tion of its interests in so many areas. It is diffi-cult to imagine the modern Spain withoutEurope, but Europe must recognise itself in thissuccess and look to the future with confidence.The information presented here endorses thisstandpoint.
14 20 Years of Spain in the European Union
8/3/2019 20 Years of Spain
http://slidepdf.com/reader/full/20-years-of-spain 15/161
15www.realinstitutoelcano.org
Acknowledgements
This publication would not have been possiblewithout the collaboration and dedication ofnumerous people and institutions.
Firstly, we would like to thank the workinggroup set up by members of the Elcano RoyalInstitute, the Office of the EuropeanParliament, the Representation of the EuropeanCommission in Spain and the Secretary of State
for the European Union of the Ministry ofForeign Affairs and Cooperation for its invalu-able collaboration. During the course of succes-sive meetings, it helped to shape and developthe project through numerous commentsand observations.
Secondly, although the final responsibility forthe project fell to the Europe section of the
Elcano Royal Institute, the work presented herewould not have been possible without theactive collaboration of the InternationalEconomy section (Paul Isbell), the Cooperationand Development section (Iliana Olivié), theLanguage and Culture section (Jaime Otero)and the Demography & Population section(Rickard Sandell), and, finally and very specially,Alicia Sorroza.
Thirdly, many people and institutions assisted usin compiling the data required for this publica-tion. We would like to thank the following peo-ple in particular for their assistance: ClaraCrespo Ruiz de Elvira, Ministry of Finance andthe Economy; Carlos Asenjo, Álvaro CastilloAguilar, Enrique González, Alexandra
Issacovitch, Jesús Roldán and Javier Salido,Ministry of Foreign Affairs and Cooperation;Félix Moral and Joan Font, Centre forSociological Research; Professors César Colino,Juan Jesús González, Teresa Jurado, EmilioLuque, Salvador Parrado and Antonia Ruiz,Spanish National Distance University (UNED);Ana Charro, Instituto Cervantes; and NarcisoMichavila, Institute of Strategic Studies of the
Ministry of Defence.
Last, but not least, we would like to thankPeter Deutsch (Distinctum) for his excellentwork in editing the text and graphics.
Madrid, March 2006
Sonia Piedrafita is a researcher in the Political Sciences and Administration Department of the UNED.
Federico Steinberg is an Economics Professor inthe Autonomous University of Madrid.
José Ignacio Torreblanca is a Political SciencesProfessor in the UNED and the Senior Analyst for Europe in the Elcano Royal Institute.

8/3/2019 20 Years of Spain
http://slidepdf.com/reader/full/20-years-of-spain 16/161
16 20 Years of Spain in the European Union
8/3/2019 20 Years of Spain
http://slidepdf.com/reader/full/20-years-of-spain 17/161
17www.realinstitutoelcano.org
Economy:20 facts for 20 years
8/3/2019 20 Years of Spain
http://slidepdf.com/reader/full/20-years-of-spain 18/161
20 Years of Spain in the European Union18
1. Growth and wealth
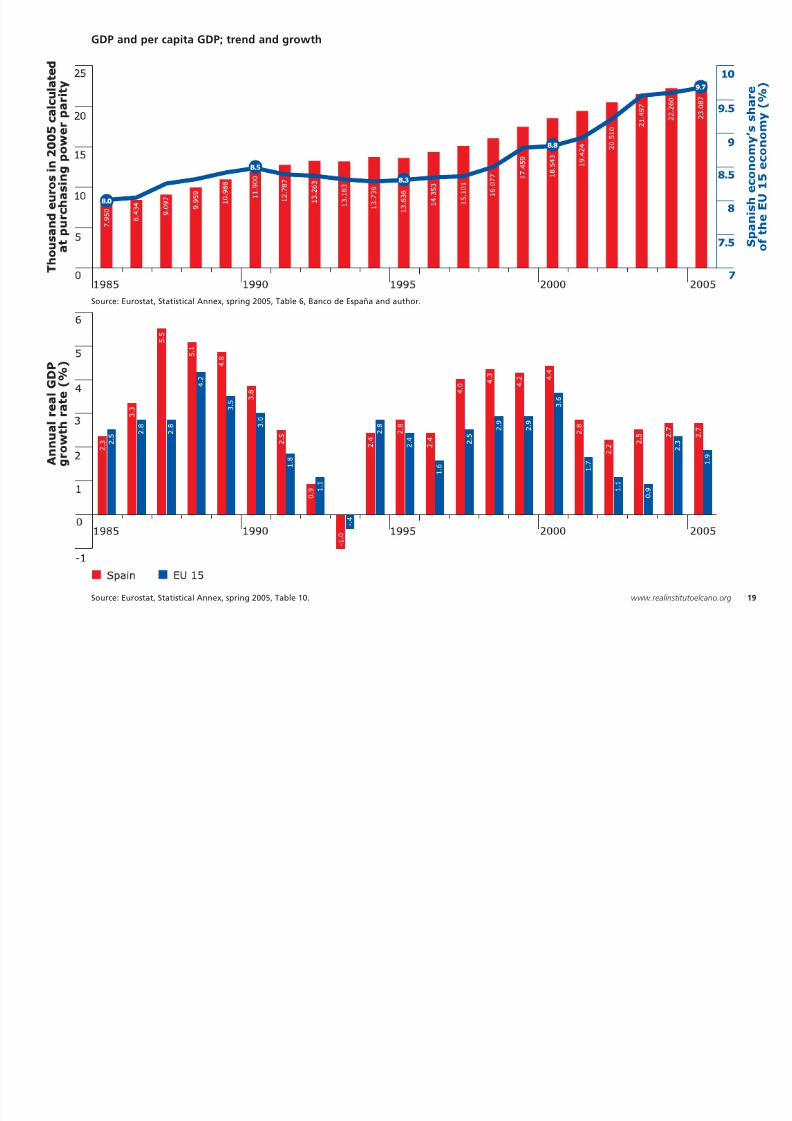
Per capita gross domestic product (GDP)(calculated at purchasing power parity in eurosat 2005 prices) increased substantially between1985 and 2005. From less than EUR 8,000 percapita before accession to the EC, it rose tomore than EUR 23,000 per capita in 2005, whichis equivalent to 99% of the average income ofthe enlarged Union. During its 20 years in theEU, the Spanish economy has experienced a
total GDP growth of 17 percentage points morethan the European average (Spain’s GDP hasgrown by 64.6% in total, while that of the EU15 has grown by 47.9%). In fact, GDP in theEU 15 only increased at a faster pace than
Spain’s during the 1992-1994 recession, whichwas longer and more pronounced in Spain thanin the EU. Moreover, the Spanish economy’sshare of the EU economy as a whole (EU 15)rose from 8% in 1985 to 9.7% in 2005. All in all,with a GDP of more than EUR 930 000 million in2005, Spain has consolidated its position as theeighth largest economy in the world and one ofthe most dynamic economies in Europe.
8/3/2019 20 Years of Spain
http://slidepdf.com/reader/full/20-years-of-spain 19/161
Source: Eurostat, Statistical Annex, spring 2005, Table 10. 19www.realinstitutoelcano.org
GDP and per capita GDP; trend and growth
Source: Eurostat, Statistical Annex, spring 2005, Table 6, Banco de España and author.
8/3/2019 20 Years of Spain
http://slidepdf.com/reader/full/20-years-of-spain 20/161
20
2. Income convergence
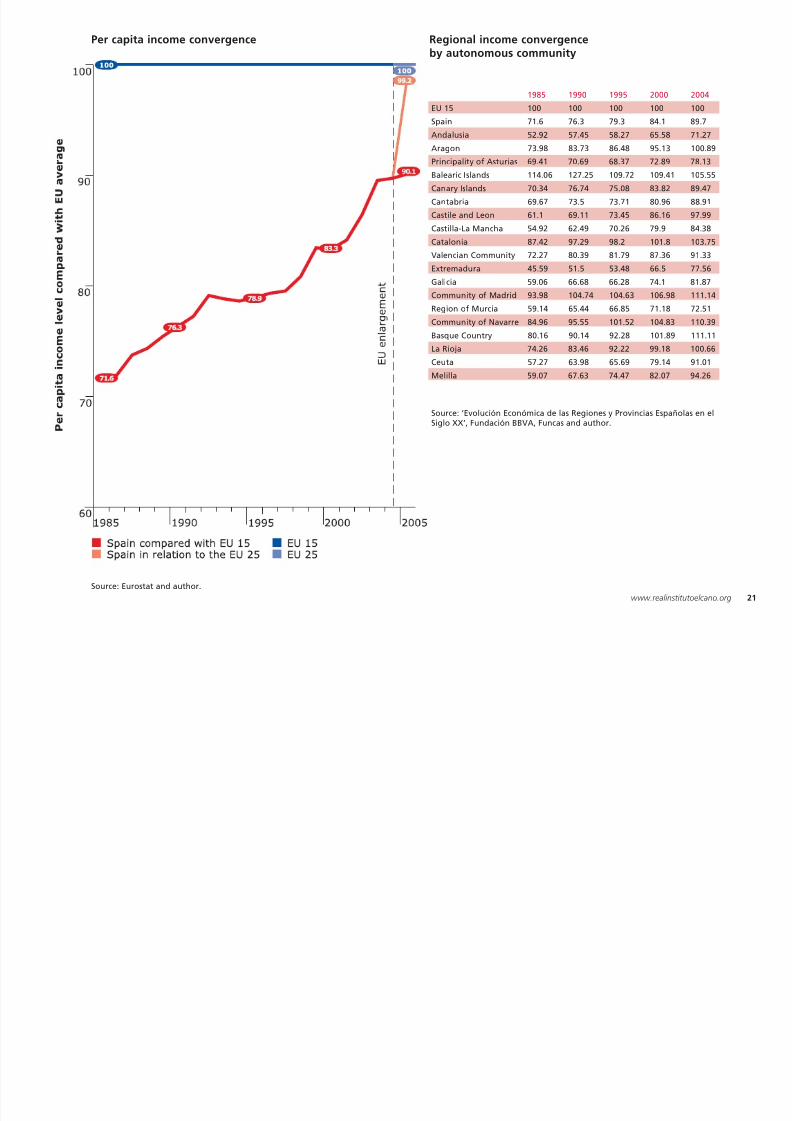
Spain has achieved an extremely important realconvergence of its per capita income with theEU average. It rose from 71% of the averageincome of the EU 15 in 1985 to more than 90%in 2005. Thus, in 20 years the disparity betweenSpain and Europe in terms of income has beenreduced by almost 20 points. The greatest con-vergence took place between 1985 and 1990(the early years of EC membership) and
between 1997 and 2005 (coinciding with Spain’sintegration in the Economic and MonetaryUnion). The accession of 10 new Member Statesto the EU in 2004 (all with incomes lower thanthat of Spain) provided a further boost to
Spain’s convergence with the EU, as Spain’s percapita GDP is now 99.2% of the EU 25 average(known as the ‘statistical effect’ of enlargement).From a regional perspective, too, there hasbeen a strong process of convergence, as aresult of which various autonomous communi-ties have exceeded the average income of theEU 15. Similarly, it should be noted thatbetween 1985 and 2005 there was a significant
reduction in the discrepancy of the per capitaincome of the various autonomous communitiesin relation to the Spanish average, whichimplies that the inequalities between theregions have been reduced1.
1Although all studies show the fast convergence in the per capita income, there is debate about the concrete figures, sincedata from Eurostat, which have been disaggregated by region only since 1990, some times differ from data from other sources.
20 Years of Spain in the European Union
8/3/2019 20 Years of Spain
http://slidepdf.com/reader/full/20-years-of-spain 21/161
Per capita income convergence
Source: Eurostat and author.
21www.realinstitutoelcano.org
1985 1990 1995 2000 2004
EU 15 100 100 100 100 100
Spain 71.6 76.3 79.3 84.1 89.7
Andalusia 52.92 57.45 58.27 65.58 71.27
Aragon 73.98 83.73 86.48 95.13 100.89
Principality of Asturias 69.41 70.69 68.37 72.89 78.13
Balearic Islands 114.06 127.25 109.72 109.41 105.55
Canary Islands 70.34 76.74 75.08 83.82 89.47
Cantabria 69.67 73.5 73.71 80.96 88.91
Castile and Leon 61.1 69.11 73.45 86.16 97.99
Castilla-La Mancha 54.92 62.49 70.26 79.9 84.38
Catalonia 87.42 97.29 98.2 101.8 103.75
Valencian Community 72.27 80.39 81.79 87.36 91.33
Extremadura 45.59 51.5 53.48 66.5 77.56
Galicia 59.06 66.68 66.28 74.1 81.87
Community of Madrid 93.98 104.74 104.63 106.98 111.14
Region of Murcia 59.14 65.44 66.85 71.18 72.51
Community of Navarre 84.96 95.55 101.52 104.83 110.39
Basque Country 80.16 90.14 92.28 101.89 111.11
La Rioja 74.26 83.46 92.22 99.18 100.66
Ceuta 57.27 63.98 65.69 79.14 91.01
Melilla 59.07 67.63 74.47 82.07 94.26
Source: ‘Evolución Económica de las Regiones y Provincias Españolas en elSiglo XX’, Fundación BBVA, Funcas and author.
Regional income convergenceby autonomous community
8/3/2019 20 Years of Spain
http://slidepdf.com/reader/full/20-years-of-spain 22/161
22
3. Financial relations between Spain and the EU
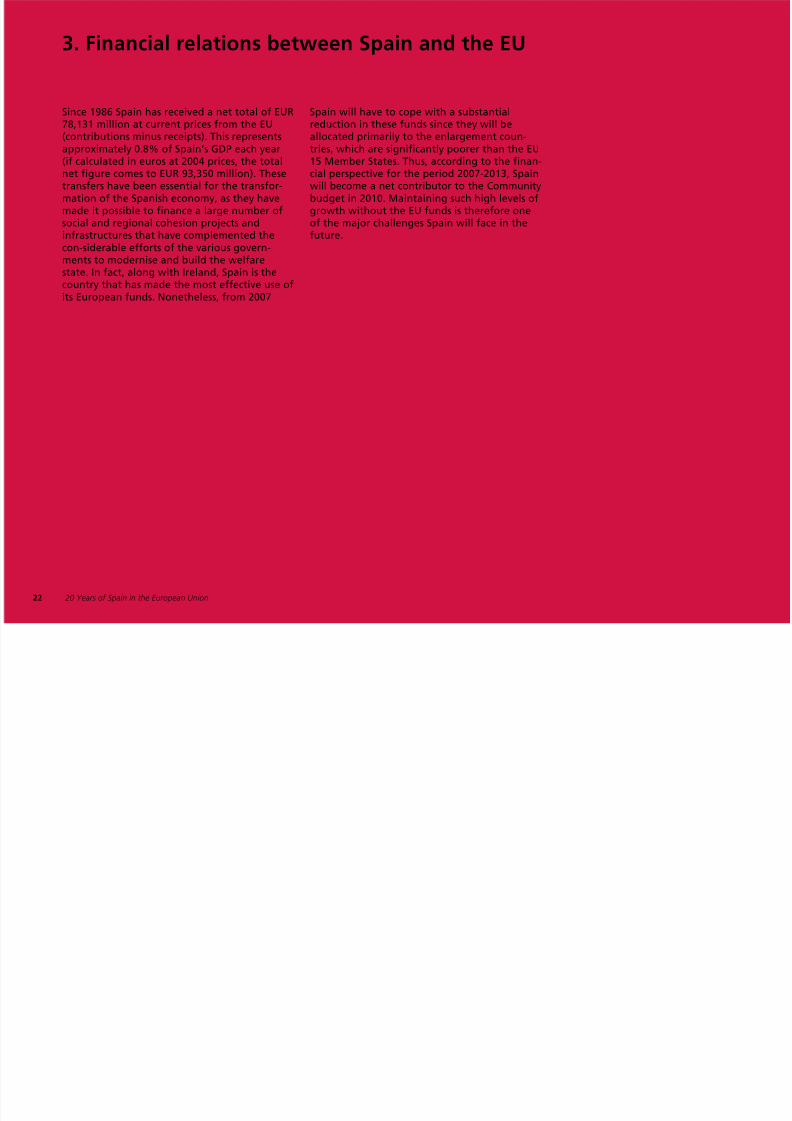
Since 1986 Spain has received a net total of EUR78,131 million at current prices from the EU(contributions minus receipts). This representsapproximately 0.8% of Spain’s GDP each year(if calculated in euros at 2004 prices, the totalnet figure comes to EUR 93,350 million). Thesetransfers have been essential for the transfor-mation of the Spanish economy, as they havemade it possible to finance a large number of
social and regional cohesion projects andinfrastructures that have complemented thecon-siderable efforts of the various govern-ments to modernise and build the welfarestate. In fact, along with Ireland, Spain is thecountry that has made the most effective use ofits European funds. Nonetheless, from 2007
Spain will have to cope with a substantialreduction in these funds since they will beallocated primarily to the enlargement coun-tries, which are significantly poorer than the EU15 Member States. Thus, according to the finan-cial perspective for the period 2007-2013, Spainwill become a net contributor to the Communitybudget in 2010. Maintaining such high levels ofgrowth without the EU funds is therefore one
of the major challenges Spain will face in thefuture.
20 Years of Spain in the European Union
8/3/2019 20 Years of Spain
http://slidepdf.com/reader/full/20-years-of-spain 23/161
Financial relations between Spain and the EU
Source: ‘Construir Europa desde España’, Elcano Royal Institute, pp. 63-65. 23www.realinstitutoelcano.org
8/3/2019 20 Years of Spain
http://slidepdf.com/reader/full/20-years-of-spain 24/161
24
4. Unemployment
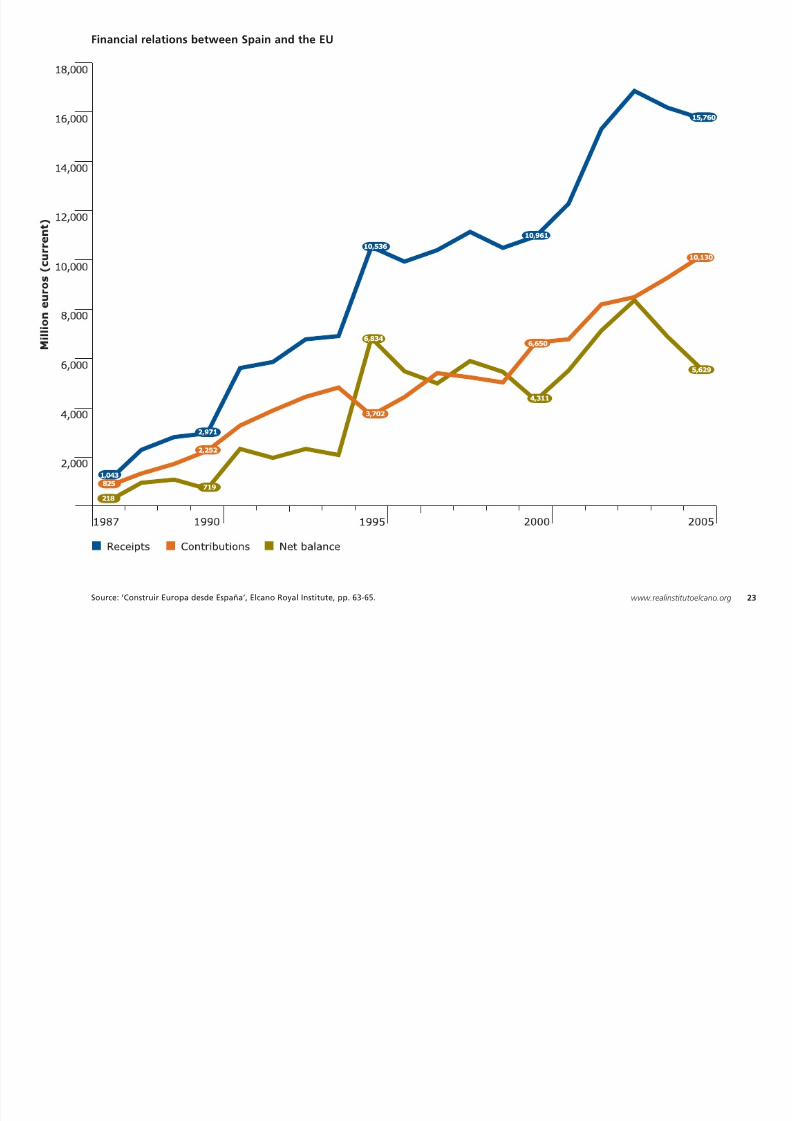
In 1985 Spain’s unemployment rate stood ataround 18%, almost double the European rate.Twenty years later this figure had fallen to10.3% (8.7% according to the data of theEconomically Active Population Survey, whosemethodology differs from that of Eurostat),bringing the Spanish unemployment rate downto a level near that of the EU 15. However, thereduction in unemployment has not been
linear, nor has it followed the same trajectory inall the autonomous communities. After fallingto 13% in 1990-1991, it reached its highestpoint (20%) in 1994 and then fell by almost 10points in 10 years. In fact, since 1997 the rate of
job creation in Spain has averaged 3.6% peryear, three times that of the EU 15. Significantdisparities remain from a regional perspective:
Andalusia and Extremadura have unemploy-ment rates of around 15%, while Aragon,Navarre, La Rioja, the Basque Country,Catalonia and Madrid have almost full employ-ment. These differences cannot be put downsolely to the different levels of economicgrowth; they are to a large extent caused bythe low geographic mobility of Spanish workers.Moreover, although unemployment among
women (11.6%) continues to be more than5 points higher than unemployment amongmen (6.6%), Spain is not far from full employ-ment for men. Indeed, as a result of thedynamism of the economy and the labourmarket reforms, Spain is no longer the EUcountry with the highest unemployment rateand lowest level of labour market participation.
20 Years of Spain in the European Union
A l l t t (%)
8/3/2019 20 Years of Spain
http://slidepdf.com/reader/full/20-years-of-spain 25/161
Annual unemployment rate (%)
Source: Eurostat, Statistical Annex, Spring 2005, Table 3. 25www.realinstitutoelcano.org
5 O t t d
8/3/2019 20 Years of Spain
http://slidepdf.com/reader/full/20-years-of-spain 26/161
26
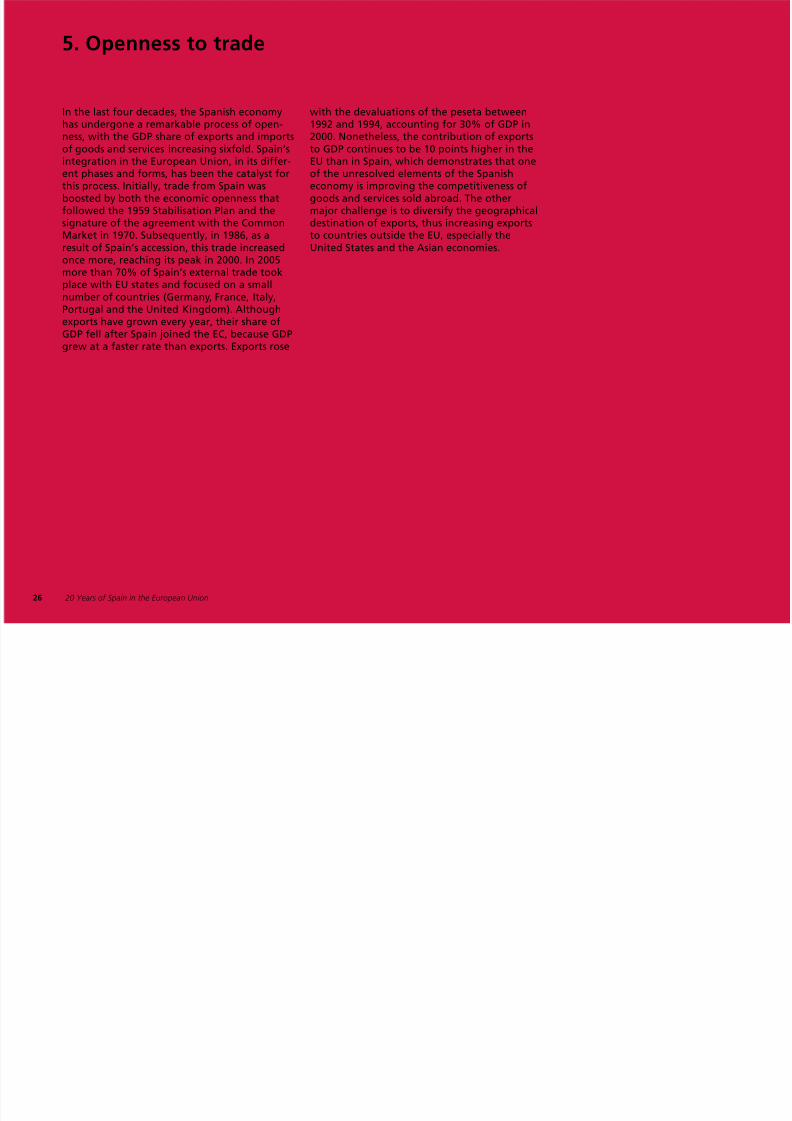
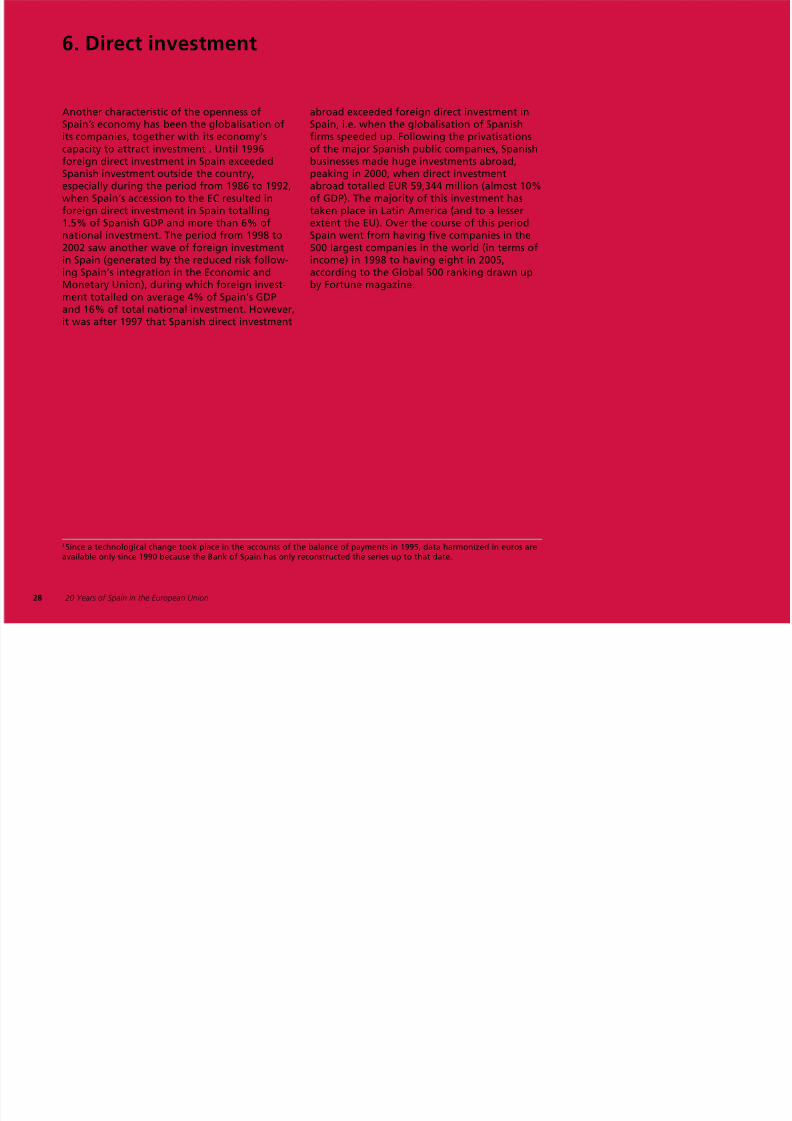
5. Openness to trade
In the last four decades, the Spanish economyhas undergone a remarkable process of open-ness, with the GDP share of exports and importsof goods and services increasing sixfold. Spain’sintegration in the European Union, in its differ-ent phases and forms, has been the catalyst forthis process. Initially, trade from Spain wasboosted by both the economic openness thatfollowed the 1959 Stabilisation Plan and the
signature of the agreement with the CommonMarket in 1970. Subsequently, in 1986, as aresult of Spain’s accession, this trade increasedonce more, reaching its peak in 2000. In 2005more than 70% of Spain’s external trade tookplace with EU states and focused on a smallnumber of countries (Germany, France, Italy,Portugal and the United Kingdom). Althoughexports have grown every year, their share of
GDP fell after Spain joined the EC, because GDPgrew at a faster rate than exports. Exports rose
with the devaluations of the peseta between1992 and 1994, accounting for 30% of GDP in2000. Nonetheless, the contribution of exportsto GDP continues to be 10 points higher in theEU than in Spain, which demonstrates that oneof the unresolved elements of the Spanisheconomy is improving the competitiveness ofgoods and services sold abroad. The othermajor challenge is to diversify the geographical
destination of exports, thus increasing exportsto countries outside the EU, especially theUnited States and the Asian economies.
20 Years of Spain in the European Union
Degree of openness (% exports in relation to GDP)
8/3/2019 20 Years of Spain
http://slidepdf.com/reader/full/20-years-of-spain 27/161
Degree of openness (% exports in relation to GDP)
Source: Eurostat, Statistical Annex, spring 2005, Table 36. 27www.realinstitutoelcano.org
6 Direct investment
8/3/2019 20 Years of Spain
http://slidepdf.com/reader/full/20-years-of-spain 28/161
28
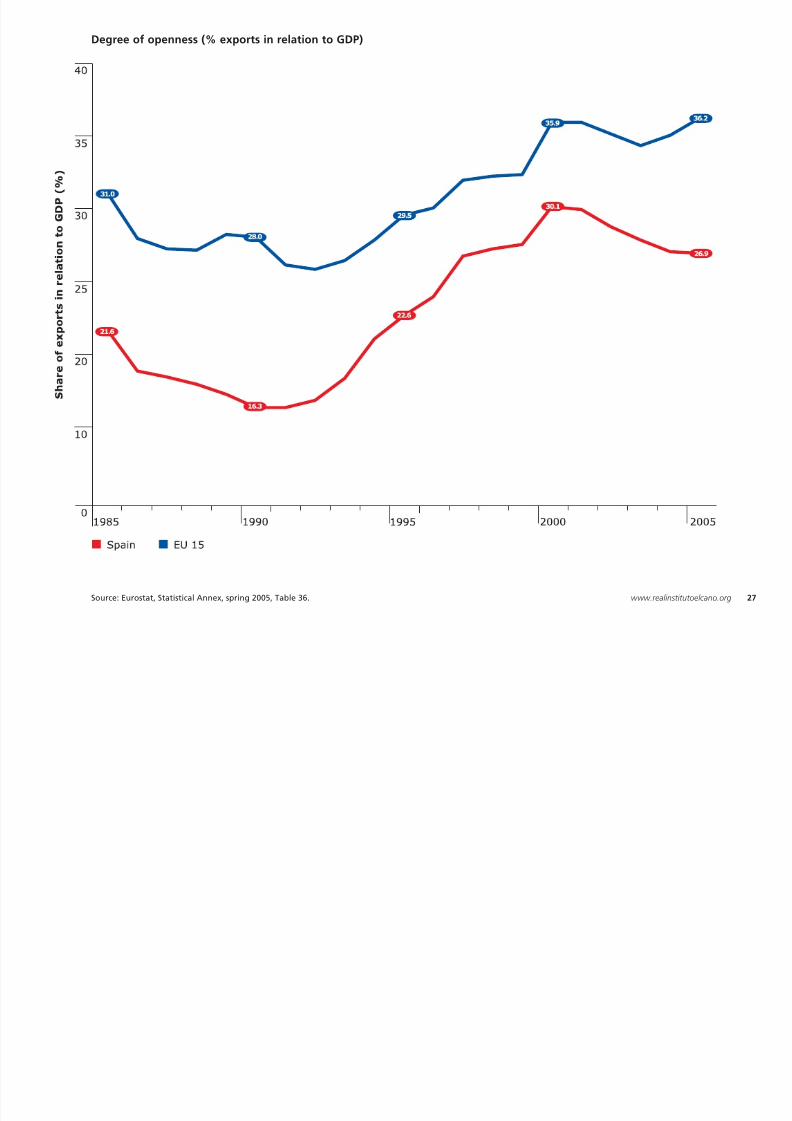
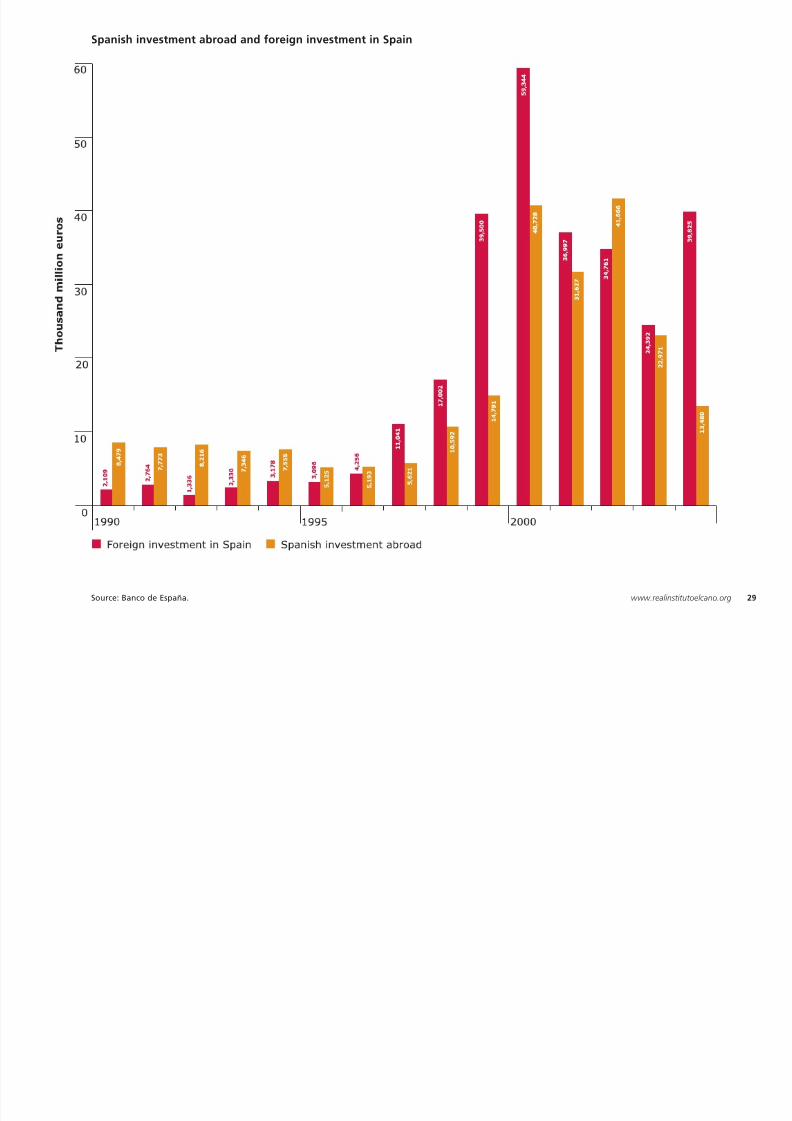
6. Direct investment
Another characteristic of the openness ofSpain’s economy has been the globalisation ofits companies, together with its economy’scapacity to attract investment . Until 1996foreign direct investment in Spain exceededSpanish investment outside the country,especially during the period from 1986 to 1992,when Spain’s accession to the EC resulted inforeign direct investment in Spain totalling
1.5% of Spanish GDP and more than 6% ofnational investment. The period from 1998 to2002 saw another wave of foreign investmentin Spain (generated by the reduced risk follow-ing Spain’s integration in the Economic andMonetary Union), during which foreign invest-ment totalled on average 4% of Spain’s GDPand 16% of total national investment. However,it was after 1997 that Spanish direct investment
abroad exceeded foreign direct investment inSpain, i.e. when the globalisation of Spanishfirms speeded up. Following the privatisationsof the major Spanish public companies, Spanishbusinesses made huge investments abroad,peaking in 2000, when direct investmentabroad totalled EUR 59,344 million (almost 10%of GDP). The majority of this investment hastaken place in Latin America (and to a lesser
extent the EU). Over the course of this periodSpain went from having five companies in the500 largest companies in the world (in terms ofincome) in 1998 to having eight in 2005,according to the Global 500 ranking drawn upby Fortune magazine.
2 Since a technological change took place in the accounts of the balance of payments in 1995, data harmonized in euros are
available only since 1990 because the Bank of Spain has only reconstructed the series up to that date.
20 Years of Spain in the European Union
Spanish investment abroad and foreign investment in Spain
8/3/2019 20 Years of Spain
http://slidepdf.com/reader/full/20-years-of-spain 29/161
Spanish investment abroad and foreign investment in Spain
Source: Banco de España. 29www.realinstitutoelcano.org
7 Inflation
8/3/2019 20 Years of Spain
http://slidepdf.com/reader/full/20-years-of-spain 30/161
30
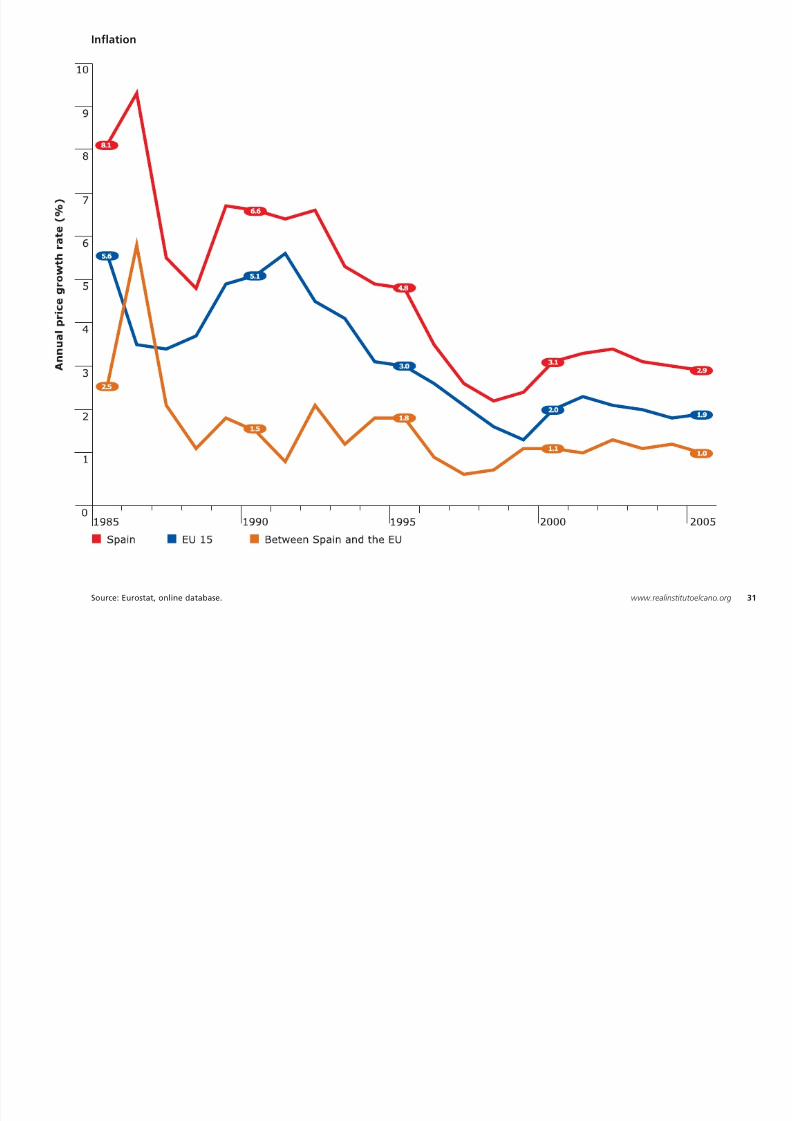
7. Inflation
Although Spanish inflation is still approximatelyone point above that of the euro zone, hugeefforts have been made to reduce this gap,which was almost six points in 1986 . With theexception of the recovery of prices between1989 and 1992, inflation has been falling contin-uously, enabling Spain to achieve the priceconvergence needed to join the euro in 1999.This success in controlling inflation must be
attributed to the credibility of the Banco deEspaña (independent since 1994) and, since thecreation of the euro, that of the European
Central Bank. In addition, the reduction in salarygrowth, the decrease in the cost of capital(lower interest rates) and the reduction of debtand the public deficit have made it easier tolimit the price increase, highlighting the extentto which economic convergence with the EUand access to the Economic and Monetary Unionhave been an objective shared by all of Spanishsociety. In any event, the existence of a perma-
nent price differential between Spain and theEU 15, and the difficulties encountered inreducing it, pose a constant risk of loss ofcompetitiveness.
3 Private consumption deflator is used.
20 Years of Spain in the European Union
Inflation
8/3/2019 20 Years of Spain
http://slidepdf.com/reader/full/20-years-of-spain 31/161
Source: Eurostat, online database. 31www.realinstitutoelcano.org
8 Interest rates
8/3/2019 20 Years of Spain
http://slidepdf.com/reader/full/20-years-of-spain 32/161
32
8. Interest rates
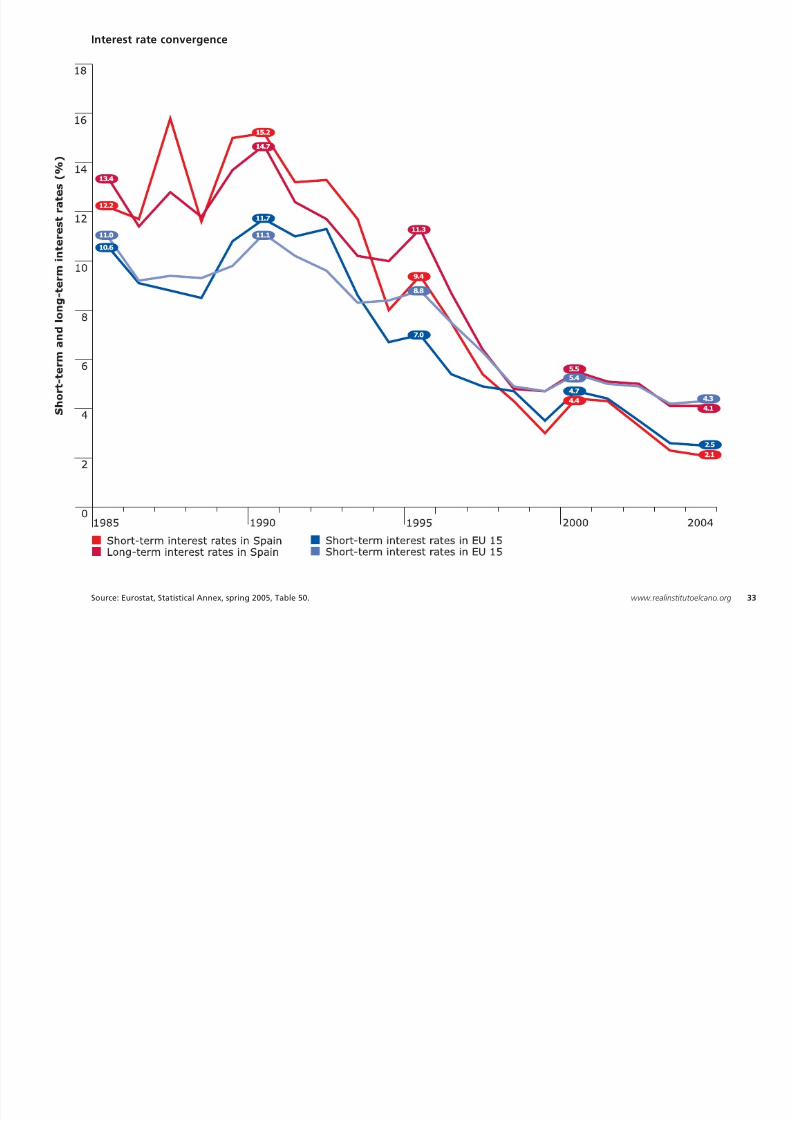
Short-term interest rates (three-month inter-bank interest rate) and long-term interest rates(yield on Spanish 10-year bonds) have bothfollowed a very similar path, enabling theSpanish economy to reduce the cost of capitaland fall into line with European rates. Short-term rates, which were around 20% in 1983,fell to 12% in 1986 and to 8% in 1994, whenthe Banco de España became independent.
After an upturn in 1995, they decreased due tothe prospects of Spain’s integration in the
monetary union, and even fell below those ofthe EU in 1998 and 1999. Long-term rates havefollowed a very similar path, experiencing adramatic fall after 1990 and converging withthose of the euro zone after 1999, at around4-5%. This reduction has made it possible toreduce significantly the financing costs for theSpanish economy. It is perhaps in the area ofmortgage rates that Spaniards have witnessed
most clearly the benefits of Spain’s membershipof the Economic and Monetary Union.
20 Years of Spain in the European Union
Interest rate convergence
8/3/2019 20 Years of Spain
http://slidepdf.com/reader/full/20-years-of-spain 33/161
Source: Eurostat, Statistical Annex, spring 2005, Table 50. 33www.realinstitutoelcano.org
9. Public accounts
8/3/2019 20 Years of Spain
http://slidepdf.com/reader/full/20-years-of-spain 34/161
34
9 ub c accou ts
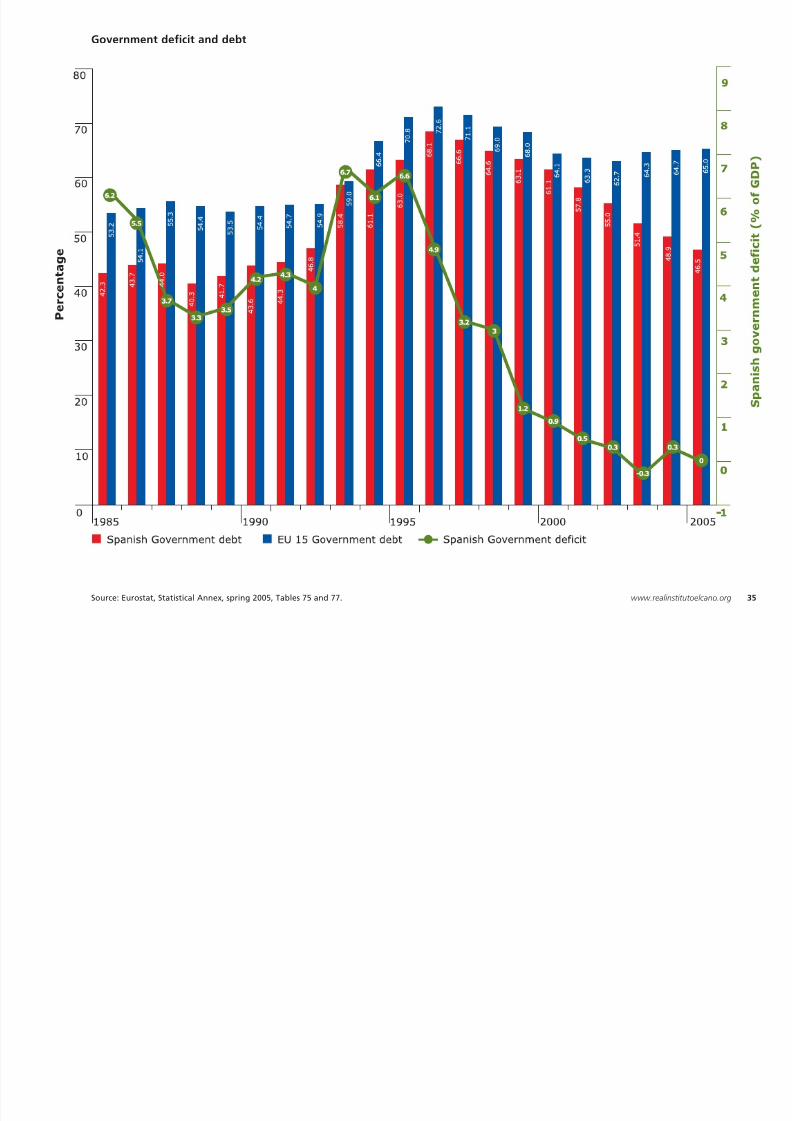
Spain’s time as a member of the EU has partlyoverlapped the period in which the infrastruc-tures have been modernised and the welfarestate has been consolidated in Spain. Provisionof these public goods has required substantialpublic funding. To this end, the level ofconsolidated government gross debt grew by26 points of GDP between 1985 and 1996,reaching 68% of GDP in 1996, very close to the
EU 15 average. In addition, government debt,after falling from 6.2% of GDP in 1985 to 4%of GDP in 1992, rose once again to total 7% ofGDP in the period 1993-1995. Since then, how-ever, the Spanish economy has made consider-able efforts to rebalance the public accounts
with a view to fulfilling the convergencecriteria laid down in the Treaty on EuropeanUnion (Maastricht Treaty) and entering thethird stage of the Economic and MonetaryUnion on the same footing. These efforts werereflected in Spain achieving the goal of a zerodeficit in 2003 (three points below the limitlaid down in the EU’s Stability and GrowthPact) and reducing public debt to 46% of GDP,
almost 20 points below the EU 15 average.This debt reduction has cut both the cost offinancing the Spanish economy and theburden of interest payments on the govern-ment debt, which has enabled public resourcesto be used for other types of investment.
20 Years of Spain in the European Union
Government deficit and debt
8/3/2019 20 Years of Spain
http://slidepdf.com/reader/full/20-years-of-spain 35/161
Source: Eurostat, Statistical Annex, spring 2005, Tables 75 and 77. 35www.realinstitutoelcano.org
10 Public spending
8/3/2019 20 Years of Spain
http://slidepdf.com/reader/full/20-years-of-spain 36/161
36
10. Public spending
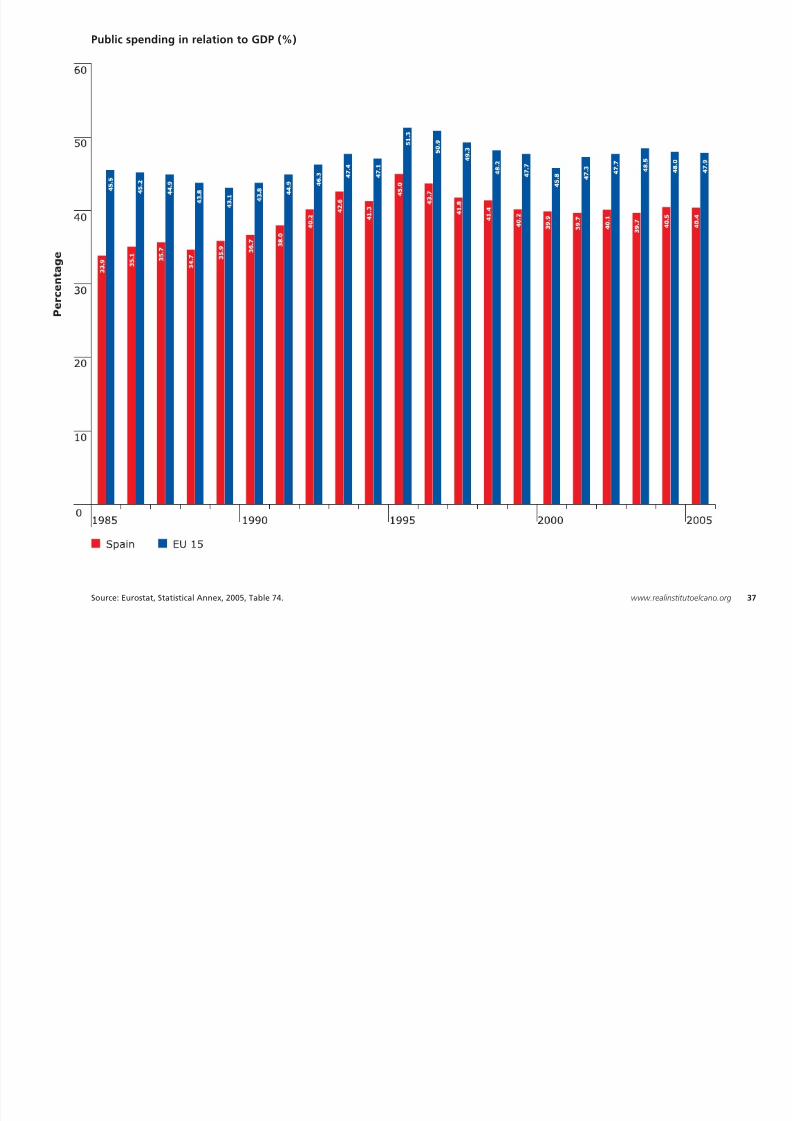
At the beginning of the democratic period in1978, Spain had a paltry welfare state, compar-atively speaking. In order to overcome thissocial deficit, especially visible in terms of fund-ing for education, healthcare and social securitybenefits, Spanish public spending has increasedsignificantly in relation to GDP over the past 20years. Considerable funding has also been madeavailable to modernise the transport and
energy infrastructures. As a consequence, publicspending, which represented 25% of GDP in1978 but had risen to 34% by 1985, increased
to 45% (11 points) only 10 years later. Sincethen, the level of public spending in Spain hasremained stable at around 40% of GDP.Nevertheless, it is still some seven points belowthe EU 15 average, which reflects a welfarestate that, in contrast to the EU’s most prosper-ous countries, is still largely reliant on familiesand the private sector.
20 Years of Spain in the European Union
Public spending in relation to GDP (%)
8/3/2019 20 Years of Spain
http://slidepdf.com/reader/full/20-years-of-spain 37/161
Source: Eurostat, Statistical Annex, 2005, Table 74. 37www.realinstitutoelcano.org
11. Fiscal pressure
8/3/2019 20 Years of Spain
http://slidepdf.com/reader/full/20-years-of-spain 38/161
38
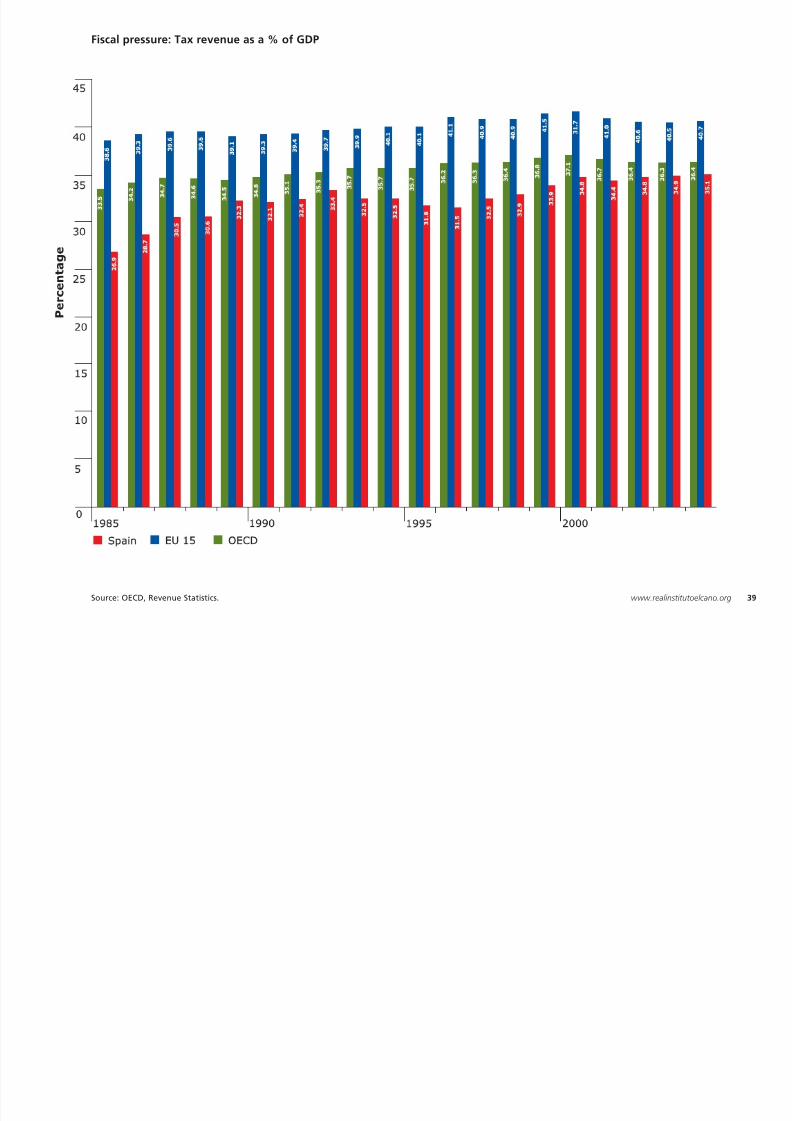
The requirements in terms of funding for publicspending have significantly increased fiscalpressure in Spain, i.e. the percentage of GDPthat citizens pay on average through thevarious types of taxes. At the end of the 1970s,Spain had levels of taxation that were similar tothose of developing countries, but it has todaybecome a modern country in which taxes play afundamental role as a mechanism for theredistribution of income and promotion ofequal opportunities. Consequently, fiscalpressure rose from 27% in 1985 to 35% in 2004.
Nonetheless, it continues to be almost six pointsbelow the EU 15 average and is even lowerthan the average of the OECD countries, whichinclude the United States, Mexico and Australia,which are countries with lower levels of fiscalpressure. In short, Spaniards pay more tax nowthan they paid 20 years ago, but they still payless than the EU average.
20 Years of Spain in the European Union
Fiscal pressure: Tax revenue as a % of GDP
8/3/2019 20 Years of Spain
http://slidepdf.com/reader/full/20-years-of-spain 39/161
Source: OECD, Revenue Statistics. 39www.realinstitutoelcano.org
12. Energy
8/3/2019 20 Years of Spain
http://slidepdf.com/reader/full/20-years-of-spain 40/161
40
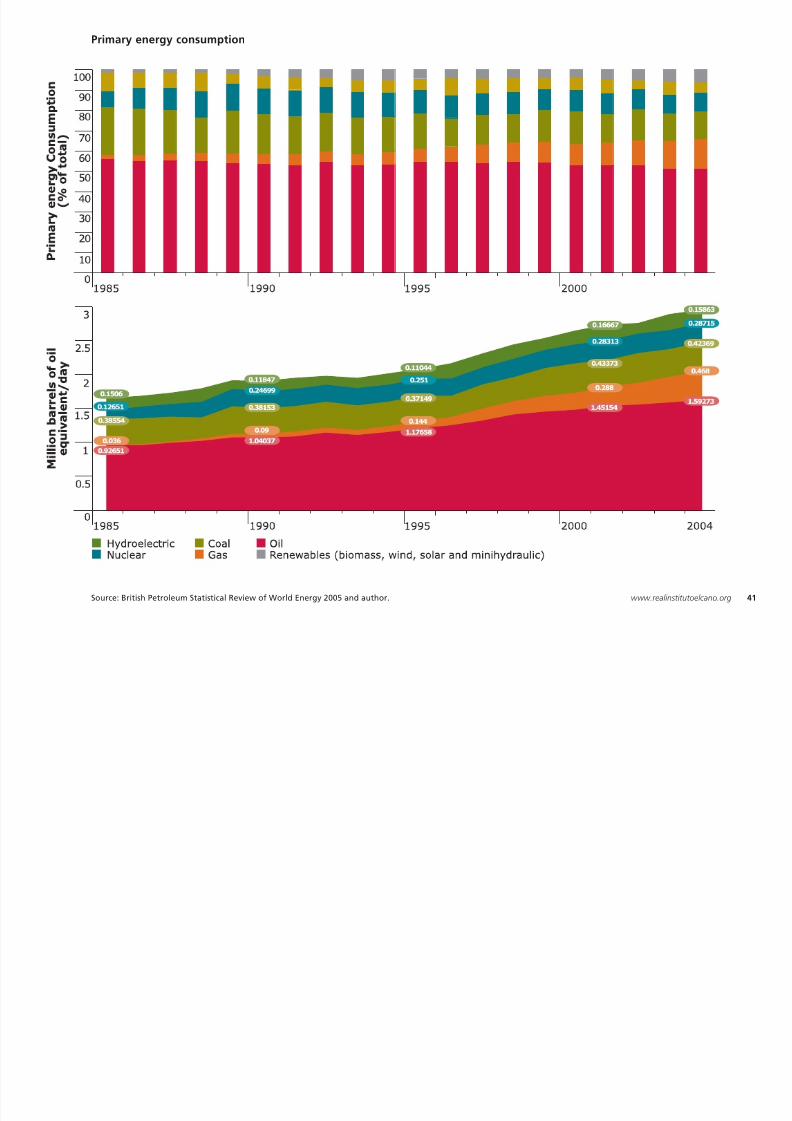
Consumption of primary energy in Spainportrays two characteristics: a continuousincrease in consumption and constant depend-ency on oil. Between 1985 and 2004, consump-tion of primary energy in Spain doubled, risingfrom 1.5 million to almost 3 million barrels ofoil equivalent per day. This increase is due tothe rise in Spanish production and consumptionover the years, requiring increasing levels ofenergy consumables. In addition, Spain has notyet managed to diversify its energy sources.As in 1985, today more than half of the primaryenergy consumed still comes from oil (in the EU
this figure is 40%). The share of nuclear energyhas remained stable (around 10%), while con-sumption of coal and hydroelectric power hasfallen. Renewable energy sources and gas haveincreased their share, accounting at present for6.5% and 13% respectively of the total (in theEU these percentages are 6% and 24%). Thechallenge, therefore, for the Spanish economyis to reduce its dependency on oil, diversify itsenergy sources, making greater use of renew-able energies, and improve consumptionefficiency (which is still 20% lower than theEU average).
20 Years of Spain in the European Union
Primary energy consumption
8/3/2019 20 Years of Spain
http://slidepdf.com/reader/full/20-years-of-spain 41/161
Source: British Petroleum Statistical Review of World Energy 2005 and author. 41www.realinstitutoelcano.org
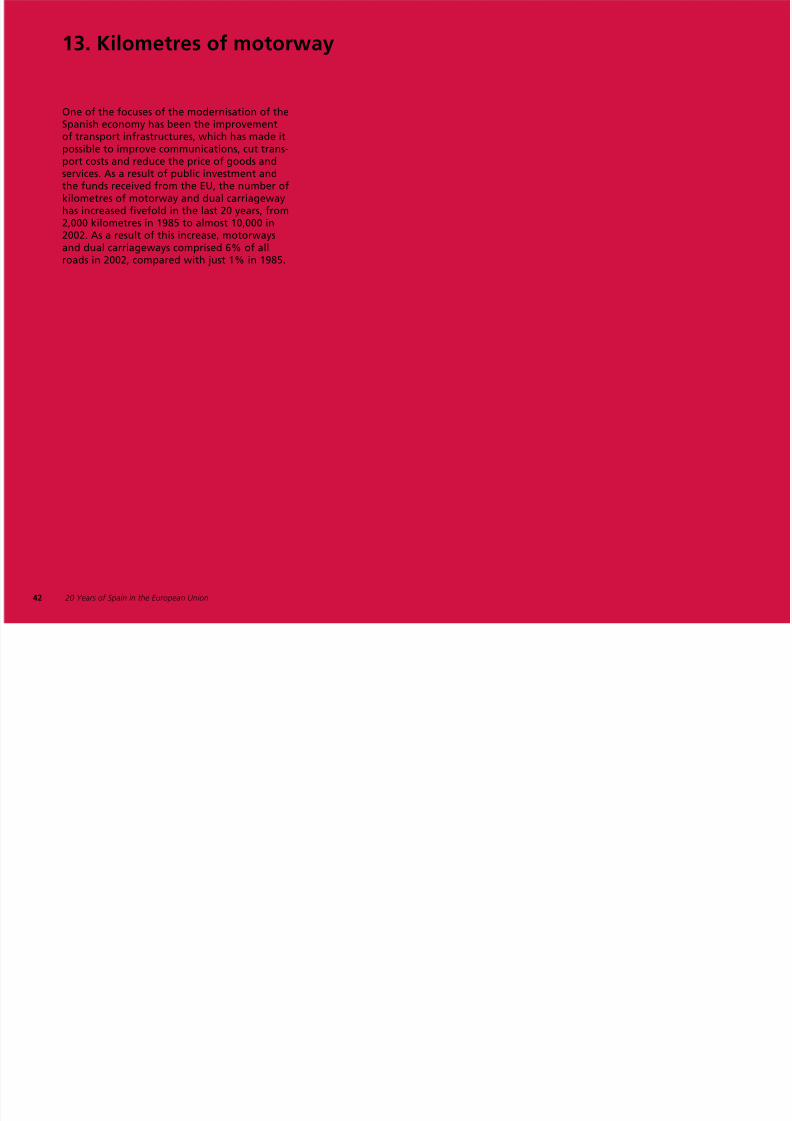
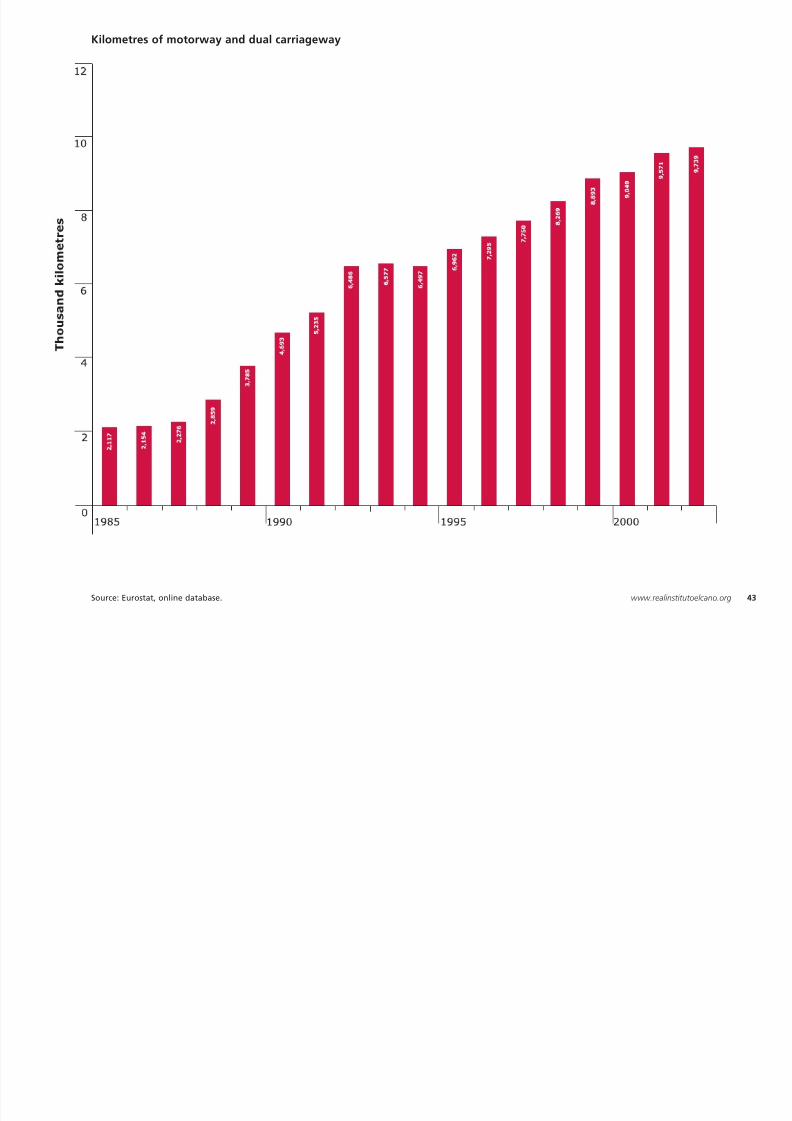
13. Kilometres of motorway
8/3/2019 20 Years of Spain
http://slidepdf.com/reader/full/20-years-of-spain 42/161
42
One of the focuses of the modernisation of the
Spanish economy has been the improvementof transport infrastructures, which has made itpossible to improve communications, cut trans-port costs and reduce the price of goods andservices. As a result of public investment andthe funds received from the EU, the number ofkilometres of motorway and dual carriagewayhas increased fivefold in the last 20 years, from2,000 kilometres in 1985 to almost 10,000 in2002. As a result of this increase, motorwaysand dual carriageways comprised 6% of allroads in 2002, compared with just 1% in 1985.
20 Years of Spain in the European Union
Kilometres of motorway and dual carriageway
8/3/2019 20 Years of Spain
http://slidepdf.com/reader/full/20-years-of-spain 43/161
Source: Eurostat, online database. 43www.realinstitutoelcano.org
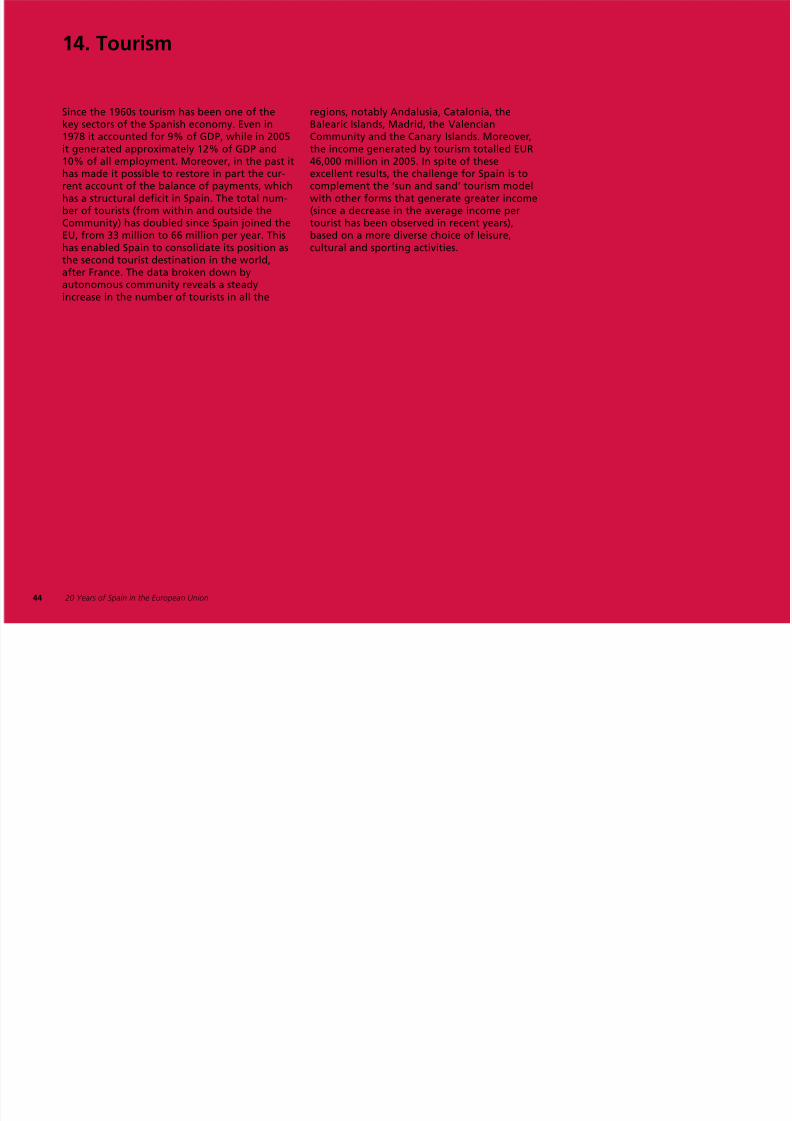
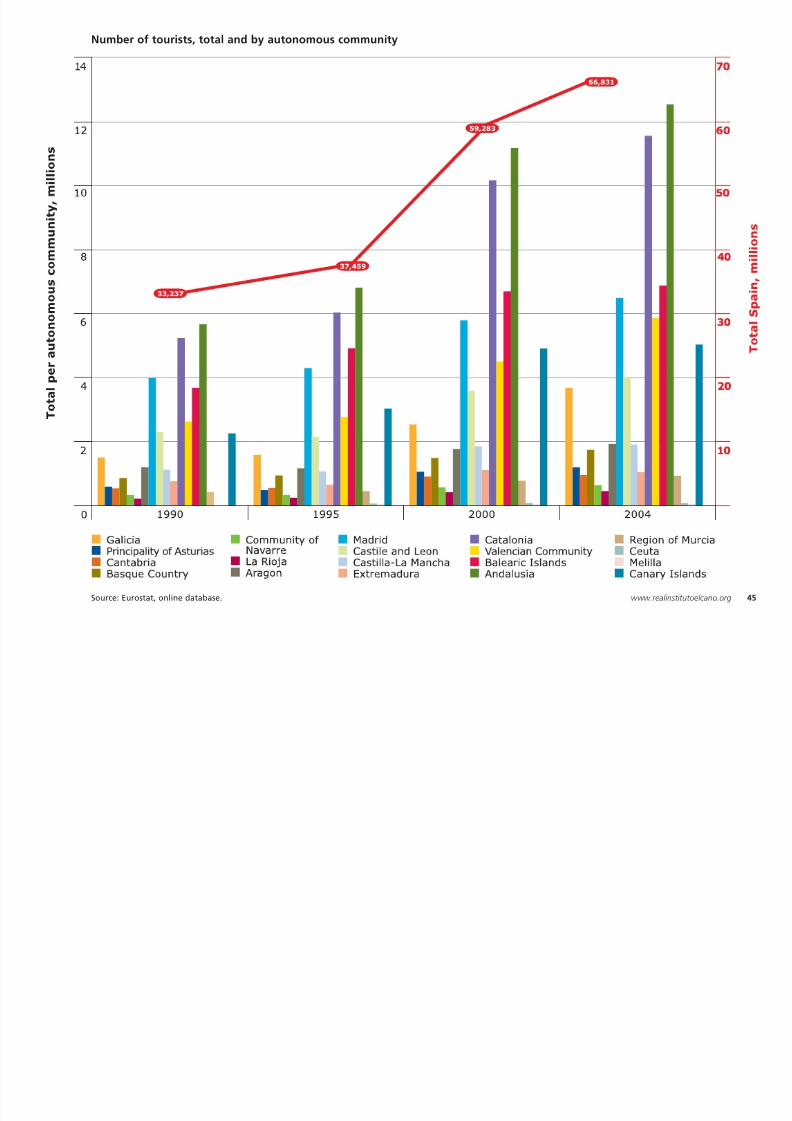
14. Tourism
8/3/2019 20 Years of Spain
http://slidepdf.com/reader/full/20-years-of-spain 44/161
44
Since the 1960s tourism has been one of the
key sectors of the Spanish economy. Even in1978 it accounted for 9% of GDP, while in 2005it generated approximately 12% of GDP and10% of all employment. Moreover, in the past ithas made it possible to restore in part the cur-rent account of the balance of payments, whichhas a structural deficit in Spain. The total num-ber of tourists (from within and outside theCommunity) has doubled since Spain joined theEU, from 33 million to 66 million per year. Thishas enabled Spain to consolidate its position asthe second tourist destination in the world,after France. The data broken down byautonomous community reveals a steadyincrease in the number of tourists in all the
regions, notably Andalusia, Catalonia, the
Balearic Islands, Madrid, the ValencianCommunity and the Canary Islands. Moreover,the income generated by tourism totalled EUR46,000 million in 2005. In spite of theseexcellent results, the challenge for Spain is tocomplement the ‘sun and sand’ tourism modelwith other forms that generate greater income(since a decrease in the average income pertourist has been observed in recent years),based on a more diverse choice of leisure,cultural and sporting activities.
20 Years of Spain in the European Union
Number of tourists, total and by autonomous community
8/3/2019 20 Years of Spain
http://slidepdf.com/reader/full/20-years-of-spain 45/161
Source: Eurostat, online database. 45www.realinstitutoelcano.org
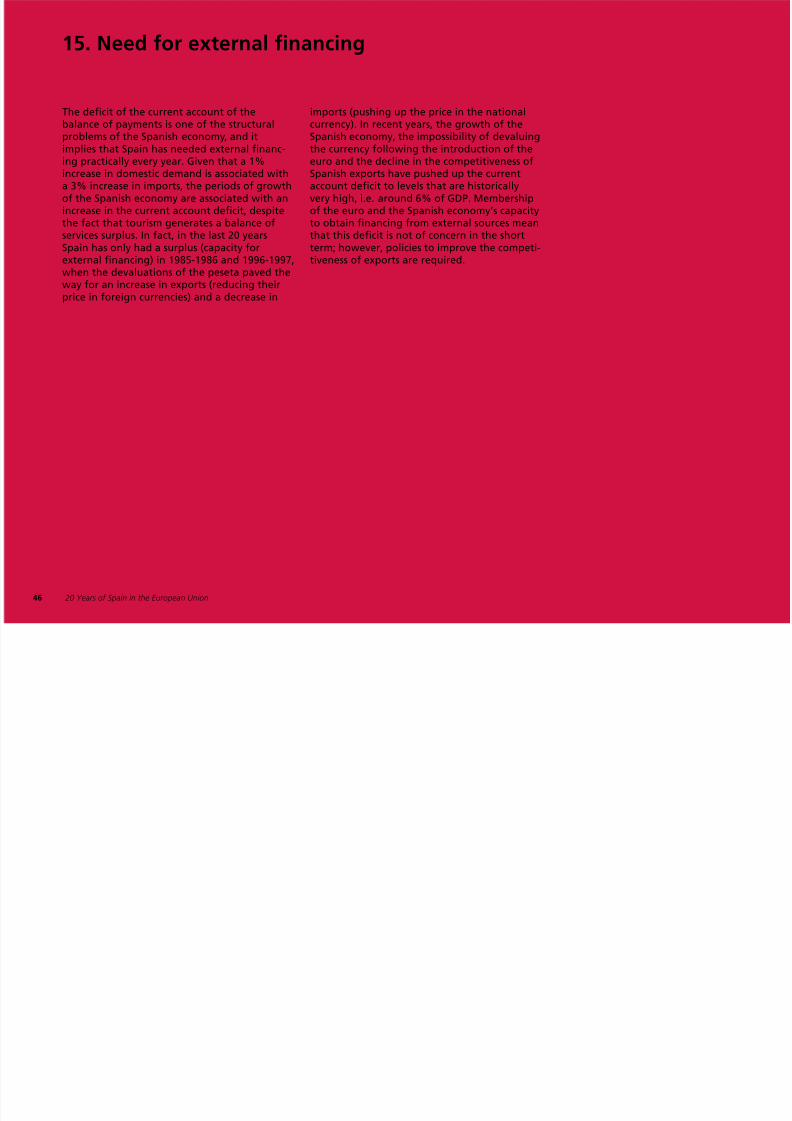
15. Need for external financing
8/3/2019 20 Years of Spain
http://slidepdf.com/reader/full/20-years-of-spain 46/161
46
The deficit of the current account of the
balance of payments is one of the structuralproblems of the Spanish economy, and itimplies that Spain has needed external financ-ing practically every year. Given that a 1%increase in domestic demand is associated witha 3% increase in imports, the periods of growthof the Spanish economy are associated with anincrease in the current account deficit, despitethe fact that tourism generates a balance ofservices surplus. In fact, in the last 20 yearsSpain has only had a surplus (capacity forexternal financing) in 1985-1986 and 1996-1997,when the devaluations of the peseta paved theway for an increase in exports (reducing theirprice in foreign currencies) and a decrease in
imports (pushing up the price in the national
currency). In recent years, the growth of theSpanish economy, the impossibility of devaluingthe currency following the introduction of theeuro and the decline in the competitiveness ofSpanish exports have pushed up the currentaccount deficit to levels that are historicallyvery high, i.e. around 6% of GDP. Membershipof the euro and the Spanish economy’s capacityto obtain financing from external sources meanthat this deficit is not of concern in the shortterm; however, policies to improve the competi-tiveness of exports are required.
20 Years of Spain in the European Union
Balance of payments current account deficit (% of GDP)
8/3/2019 20 Years of Spain
http://slidepdf.com/reader/full/20-years-of-spain 47/161
Source: Eurostat, online database. 47www.realinstitutoelcano.org
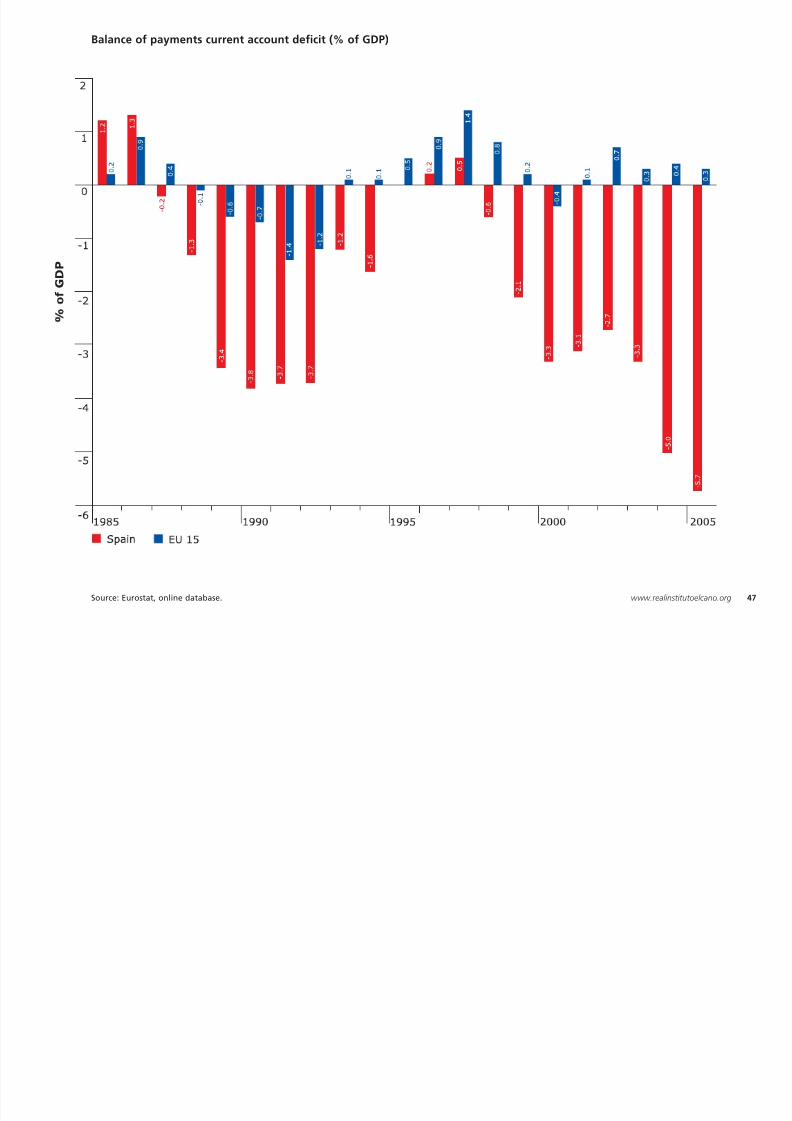
16. High-technology exports
8/3/2019 20 Years of Spain
http://slidepdf.com/reader/full/20-years-of-spain 48/161
48
One of the reasons for the persistence of the
balance of payments deficit in Spain is the smallproportion of Spanish exports that incorporatehigh technology: these account for only 6% ofthe total and their percentage has not increasedsince 1990. These types of exports require highlevels of knowledge, capital and skilled labourand therefore tend to be in high demandabroad, and to command high relative prices.The problem stems from the fact that Spain has
not been able to increase to any great degreethe production of such goods; as a result, norcan it export them. While other EU countrieshave succeeded in increasing the share theseexports occupy of the total (notably Ireland,with a share of 30%), Spain, like Greece andPortugal, falls short of the EU average, whichis around 18%.
20 Years of Spain in the European Union
Percentage of high-tech exports in relation to total exports
8/3/2019 20 Years of Spain
http://slidepdf.com/reader/full/20-years-of-spain 49/161
Source: Eurostat, online database. 49www.realinstitutoelcano.org
17. Productivity

8/3/2019 20 Years of Spain
http://slidepdf.com/reader/full/20-years-of-spain 50/161
50
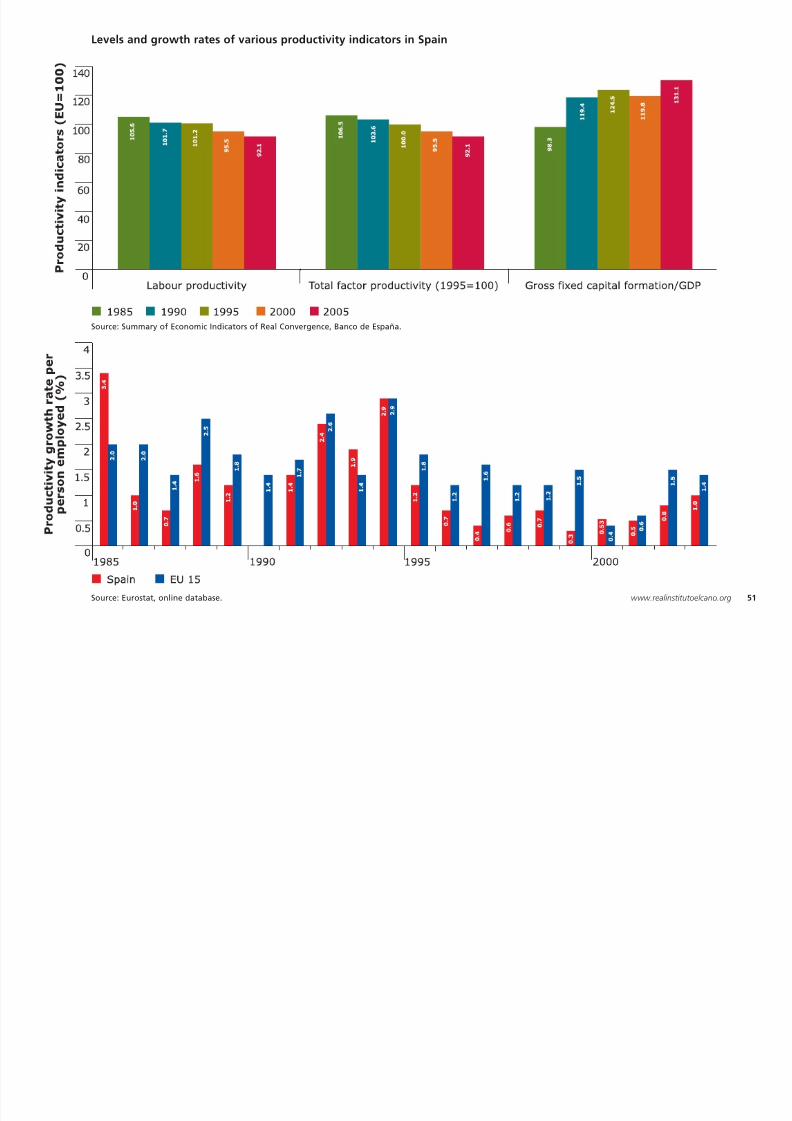
The stagnation of productivity is another aspect
of the Spanish economy that has yet to beresolved. The increase in employment in Spainhas been accompanied by a reduction in thegrowth rate of productivity per personemployed, which only exceeded the EU averagein 1985 and 1993 and has been below 1% peryear since 1996. The same can be said of totalfactor productivity, which measures all theintangible elements that are not covered by the
combined productivity of the use of labour andcapital (capacity for organisation and innova-tion, quality of capital, education and experi-ence of the workforce or entrepreneurship ofthe population). Total factor productivity is
around 92% of the EU average and is displaying
a worrying downward trend, given that itexceeded the EU average in 1985. The lowproductivity is due to the widespread use oftemporary contracts, which in 2005 accountedfor 31% of all contracts of wage earners, morethan double the EU rate (13%). Temporarycontracts generate a high level of rotation ofstaff, which prevents them from undertakingthe necessary training to become more
productive. The low productivity also reflectsthe insufficient use of new technologies.
20 Years of Spain in the European Union
Levels and growth rates of various productivity indicators in Spain
8/3/2019 20 Years of Spain
http://slidepdf.com/reader/full/20-years-of-spain 51/161
Source: Eurostat, online database. 51www.realinstitutoelcano.org
Source: Summary of Economic Indicators of Real Convergence, Banco de España.
18. Technological effort
8/3/2019 20 Years of Spain
http://slidepdf.com/reader/full/20-years-of-spain 52/161
52
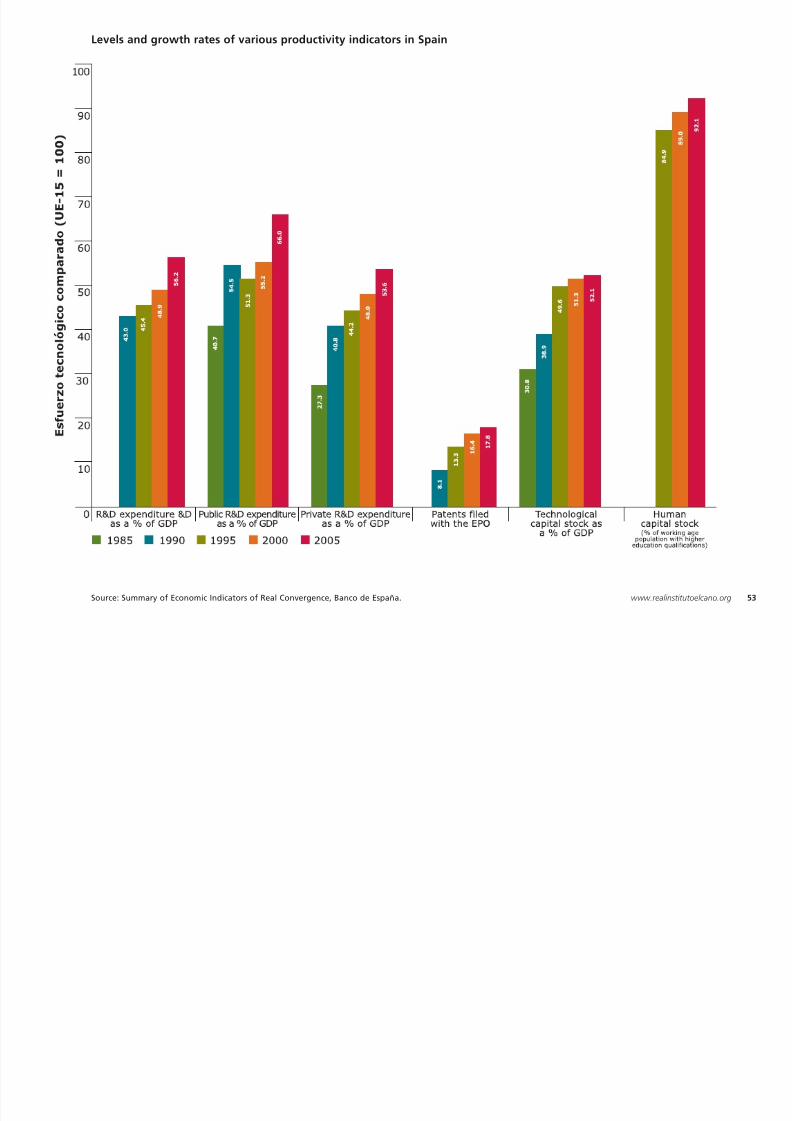
Various indicators of the technological and
modernisation effort demonstrate that theSpanish economy is still lagging behind the EU15 average, which explains its low productivityand the lack of dynamism of its exports.Although progress has been made in the last 20years, public and private investment in research,and the technological capital stock as a percent-age of GDP are scarcely more than 50% of theEuropean average. However, the variable that
reveals the extent to which Spain has fallenbehind in relative terms is the number ofpatents, which is calculated as the number of
patent applications per million inhabitants that
citizens file with the European Patent Office.Although the number of patents filed hasdoubled in the last 20 years, Spain still files lessthan 20% of the EU 15 average, i.e. for every100 patents filed on average in each of the EUcountries, Spain only files 18. The sole indicatorfor which significant progress has beenregistered is that of human capital stock, whichmeasures the percentage of the working age
population with higher education qualifica-tions, a variable in which Spain reaches 92% ofthe EU 15 average.
20 Years of Spain in the European Union
Levels and growth rates of various productivity indicators in Spain
8/3/2019 20 Years of Spain
http://slidepdf.com/reader/full/20-years-of-spain 53/161
Source: Summary of Economic Indicators of Real Convergence, Banco de España. 53www.realinstitutoelcano.org
19. Research and development
8/3/2019 20 Years of Spain
http://slidepdf.com/reader/full/20-years-of-spain 54/161
54
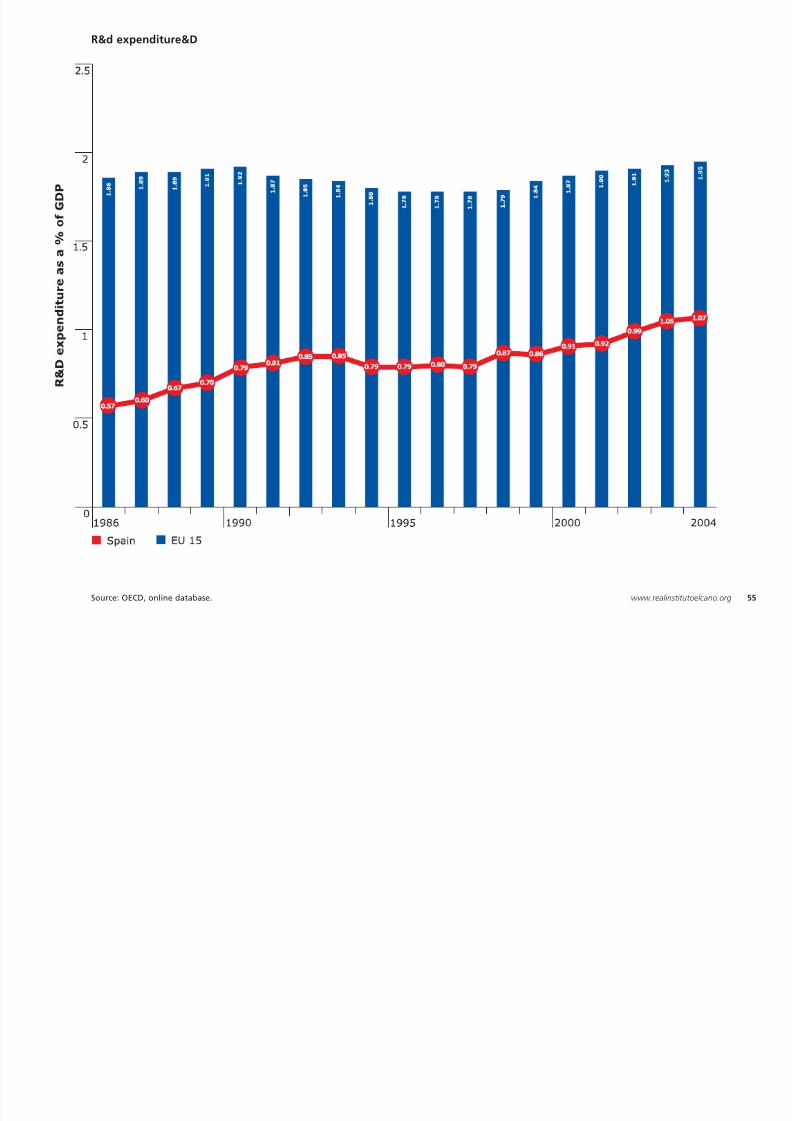
The indicator that best summarises the extent
to which Spain has fallen behind in relativeterms in the area of technology is investment inresearch and development (R&D) as a percent-age of GDP. This type of investment is crucial inpromoting innovation and increasing the valueadded of goods and services, boosting produc-tivity, and improving the citizens’ income andwelfare. In 1985 Spain invested just 0.57% of itsGDP in R&D, while the EU 15 invested 1.86%.
Twenty years on and although Spanish expendi-ture has risen faster than that of Europe, thereis still a considerable gap: Spain invests just
1.07% of GDP while the EU 15 invests 1.95% of
GDP. In addition, it should be noted that otherdeveloped countries have an even greatercommitment to research than the EU. Forexample, the United States invests 2.59% of itsGDP in R&D, South Korea invests 2.91% andJapan invests 3.12%. This situation means thatSpain needs to make additional efforts toensure that it is at least on a level footing withthe other EU countries in terms of investment
in R&D.
20 Years of Spain in the European Union
R&d expenditure&D
8/3/2019 20 Years of Spain
http://slidepdf.com/reader/full/20-years-of-spain 55/161
Source: OECD, online database. 55www.realinstitutoelcano.org
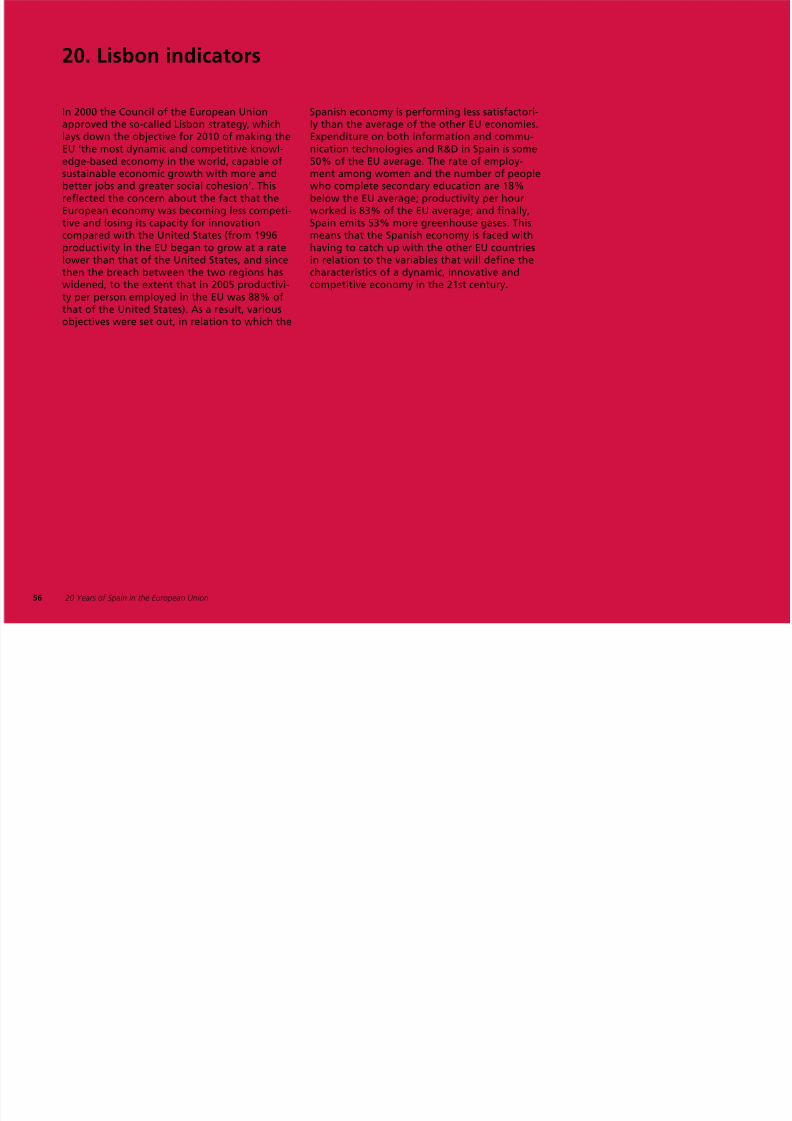
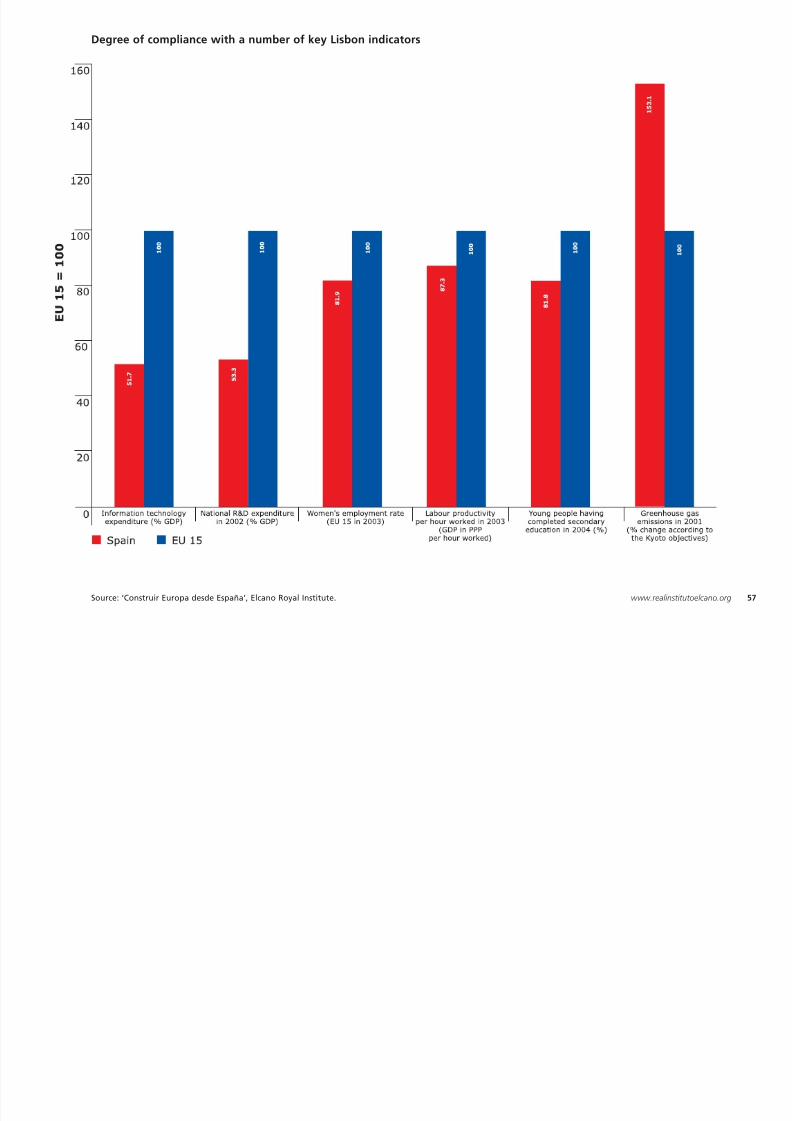
20. Lisbon indicators
8/3/2019 20 Years of Spain
http://slidepdf.com/reader/full/20-years-of-spain 56/161
In 2000 the Council of the European Union
approved the so-called Lisbon strategy, whichlays down the objective for 2010 of making theEU ‘the most dynamic and competitive knowl-edge-based economy in the world, capable ofsustainable economic growth with more andbetter jobs and greater social cohesion’. Thisreflected the concern about the fact that theEuropean economy was becoming less competi-tive and losing its capacity for innovation
compared with the United States (from 1996productivity in the EU began to grow at a ratelower than that of the United States, and sincethen the breach between the two regions haswidened, to the extent that in 2005 productivi-ty per person employed in the EU was 88% ofthat of the United States). As a result, variousobjectives were set out, in relation to which the
Spanish economy is performing less satisfactori-
ly than the average of the other EU economies.Expenditure on both information and commu-nication technologies and R&D in Spain is some50% of the EU average. The rate of employ-ment among women and the number of peoplewho complete secondary education are 18%below the EU average; productivity per hourworked is 83% of the EU average; and finally,Spain emits 53% more greenhouse gases. This
means that the Spanish economy is faced withhaving to catch up with the other EU countriesin relation to the variables that will define thecharacteristics of a dynamic, innovative andcompetitive economy in the 21st century.
56 20 Years of Spain in the European Union
Degree of compliance with a number of key Lisbon indicators
8/3/2019 20 Years of Spain
http://slidepdf.com/reader/full/20-years-of-spain 57/161
Source: ‘Construir Europa desde España’, Elcano Royal Institute. 57www.realinstitutoelcano.org

8/3/2019 20 Years of Spain
http://slidepdf.com/reader/full/20-years-of-spain 58/161
58 20 Years of Spain in the European Union
8/3/2019 20 Years of Spain
http://slidepdf.com/reader/full/20-years-of-spain 59/161
59www.realinstitutoelcano.org
Society:20 facts for 20 years
1. Population change
8/3/2019 20 Years of Spain
http://slidepdf.com/reader/full/20-years-of-spain 60/161
20 Years of Spain in the European Union60
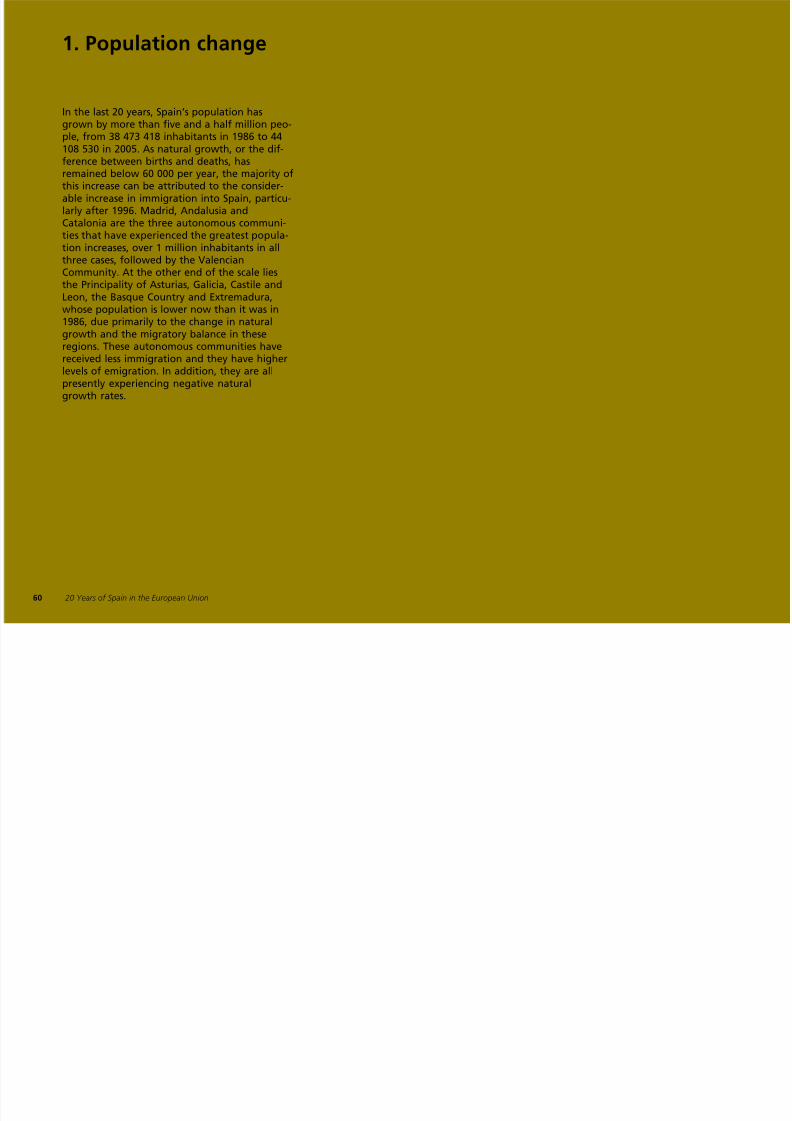
In the last 20 years, Spain’s population has
grown by more than five and a half million peo-ple, from 38 473 418 inhabitants in 1986 to 44108 530 in 2005. As natural growth, or the dif-ference between births and deaths, hasremained below 60 000 per year, the majority ofthis increase can be attributed to the consider-able increase in immigration into Spain, particu-larly after 1996. Madrid, Andalusia andCatalonia are the three autonomous communi-
ties that have experienced the greatest popula-tion increases, over 1 million inhabitants in allthree cases, followed by the ValencianCommunity. At the other end of the scale liesthe Principality of Asturias, Galicia, Castile andLeon, the Basque Country and Extremadura,whose population is lower now than it was in1986, due primarily to the change in naturalgrowth and the migratory balance in these
regions. These autonomous communities havereceived less immigration and they have higherlevels of emigration. In addition, they are allpresently experiencing negative naturalgrowth rates.
Total population and population by autonomous community
8/3/2019 20 Years of Spain
http://slidepdf.com/reader/full/20-years-of-spain 61/161
Source: Compiled from INE data. 61www.realinstitutoelcano.org
Total population of Spain
2. Population structure
8/3/2019 20 Years of Spain
http://slidepdf.com/reader/full/20-years-of-spain 62/161
20 Years of Spain in the European Union62
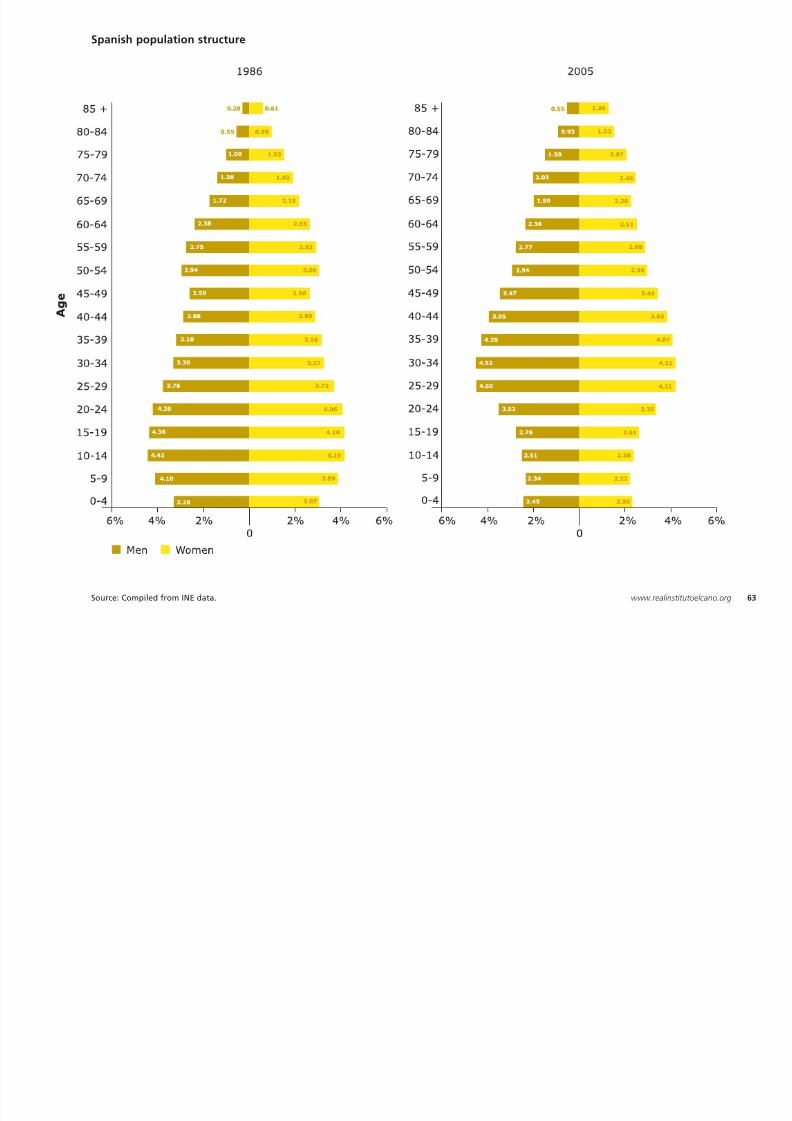
The growth of the Spanish population has been
accompanied by substantial changes to its struc-ture, for the most part due to two processesthat have taken place at the same time. Firstly,there has been an unprecedented decline infertility, which began in the middle of the 1970sbefore peaking and then stabilising in the mid-dle of the 1990s. Secondly, life expectancy hascontinued to climb significantly and continuous-ly, especially among women. As a result, the
base of the pyramid has become much narrow-er, while the apex, which represents the olderpopulation, has become much broader. Therecent growth in immigration has generated aslight increase in Spanish fertility, but this con-tribution has barely any impact on the shape ofSpain’s population pyramid, which, as in otherdeveloped countries, is losing its pyramidalshape and becoming more and more like a tree.
Spanish population structure
8/3/2019 20 Years of Spain
http://slidepdf.com/reader/full/20-years-of-spain 63/161
Source: Compiled from INE data. 63www.realinstitutoelcano.org
3. Ageing and dependency
8/3/2019 20 Years of Spain
http://slidepdf.com/reader/full/20-years-of-spain 64/161
20 Years of Spain in the European Union64
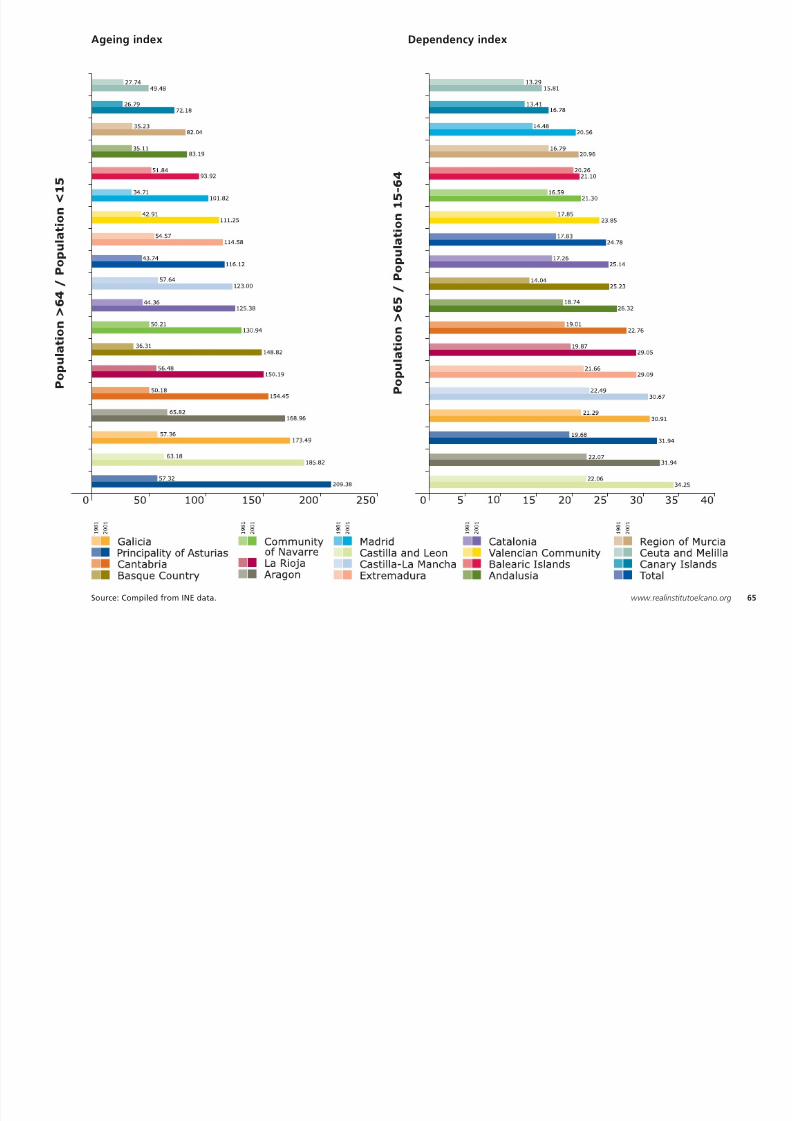
Spain’s population stands out as already being
one of the oldest populations in the EuropeanUnion and in the world. Even so, the ageingprocess has scarcely begun and it is thereforeexpected that the ratio between people overthe age of 65 and people under the age of 15will continue to grow. This ageing process,which is common to almost all the EU MemberStates and the other developed countries of theworld, also implies an increase in the dependent
population. The dependency ratio measures thepopulation aged over 65 as a percentage of theworking-age population (all people agedbetween 15 and 64). High dependency ratiosgenerally mean a considerable economic burdenon the working population, which has to sup-port the State pension system. The rise in theageing rate is due primarily to a decrease in the
fertility rate and an increase in life expectancy.
However, migratory movements can also con-tribute to this trend. For example, the high age-ing and dependency rates in Asturias, Castileand Leon, Galicia and Aragon are to someextent caused by the emigration of young peo-ple from these communities to others withmore dynamic economies. Ceuta, Melilla, theCanary Islands, Murcia and Madrid have thelowest levels of ageing and dependency.
Ageing index Dependency index
8/3/2019 20 Years of Spain
http://slidepdf.com/reader/full/20-years-of-spain 65/161
Source: Compiled from INE data. 65www.realinstitutoelcano.org
4. Migration
8/3/2019 20 Years of Spain
http://slidepdf.com/reader/full/20-years-of-spain 66/161
20 Years of Spain in the European Union66
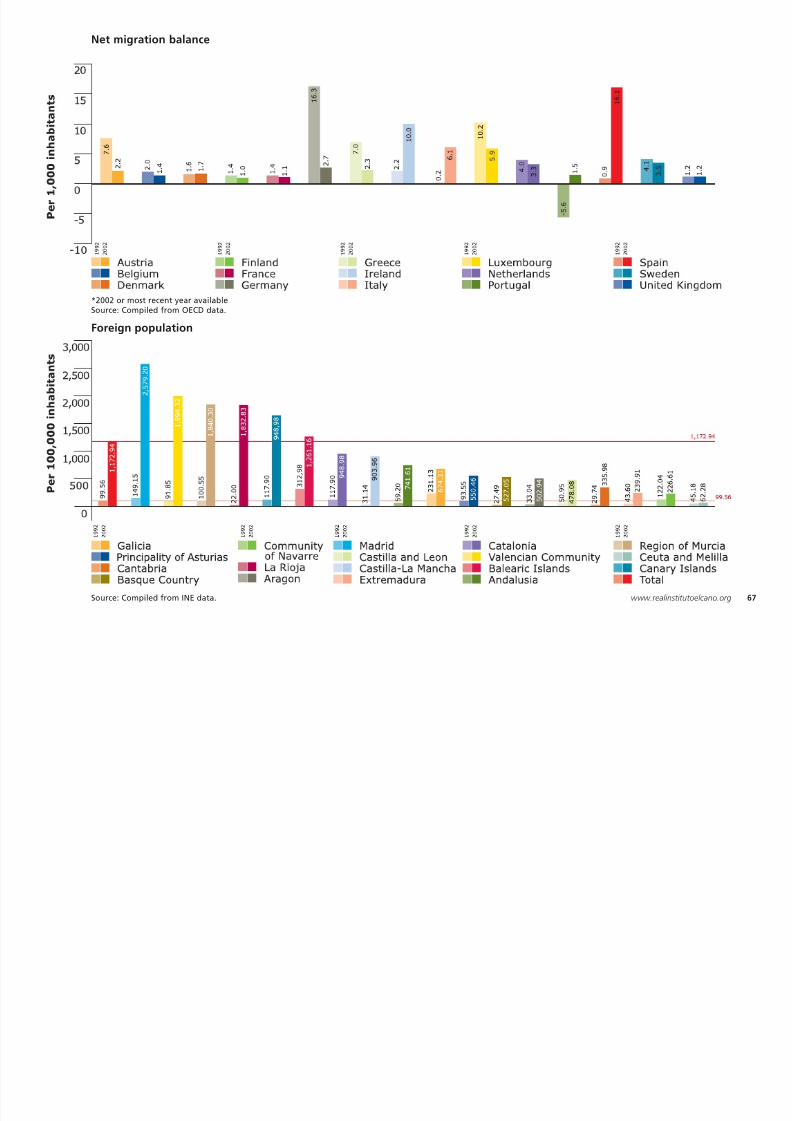
Many of the demographic changes in Spanish
society are closely related to the change inmigratory movements since Spain’s accession tothe EU. The net migration balance representsthe difference between immigrants and emi-grants in a country per 1 000 inhabitants. Atthe beginning of the 1990s, Portugal, Italy andSpain were the OECD countries with lowest netbalances, while Germany was the top countryof destination for immigrants. This trend was
reversed at the beginning of the new century,to the extent that Spain has become the OECD
country with the highest net migration balance.
This can be attributed to two phenomena: thereturn of emigrants and the rise in immigration.In the short space of a decade, the foreign pop-ulation per 100 000 inhabitants has risen fromunder 100 to over 1 000. The autonomous com-munities that have experienced the largestincrease in their foreign population in relationto their total respective populations have beenMadrid, Valencia, Murcia and La Rioja. The low-
est figures are recorded in Ceuta, Melilla,Navarre and Extremadura.
Net migration balance
8/3/2019 20 Years of Spain
http://slidepdf.com/reader/full/20-years-of-spain 67/161
Source: Compiled from INE data. 67www.realinstitutoelcano.org
Foreign population
*2002 or most recent year availableSource: Compiled from OECD data.
5. Immigration characteristics
8/3/2019 20 Years of Spain
http://slidepdf.com/reader/full/20-years-of-spain 68/161
20 Years of Spain in the European Union68
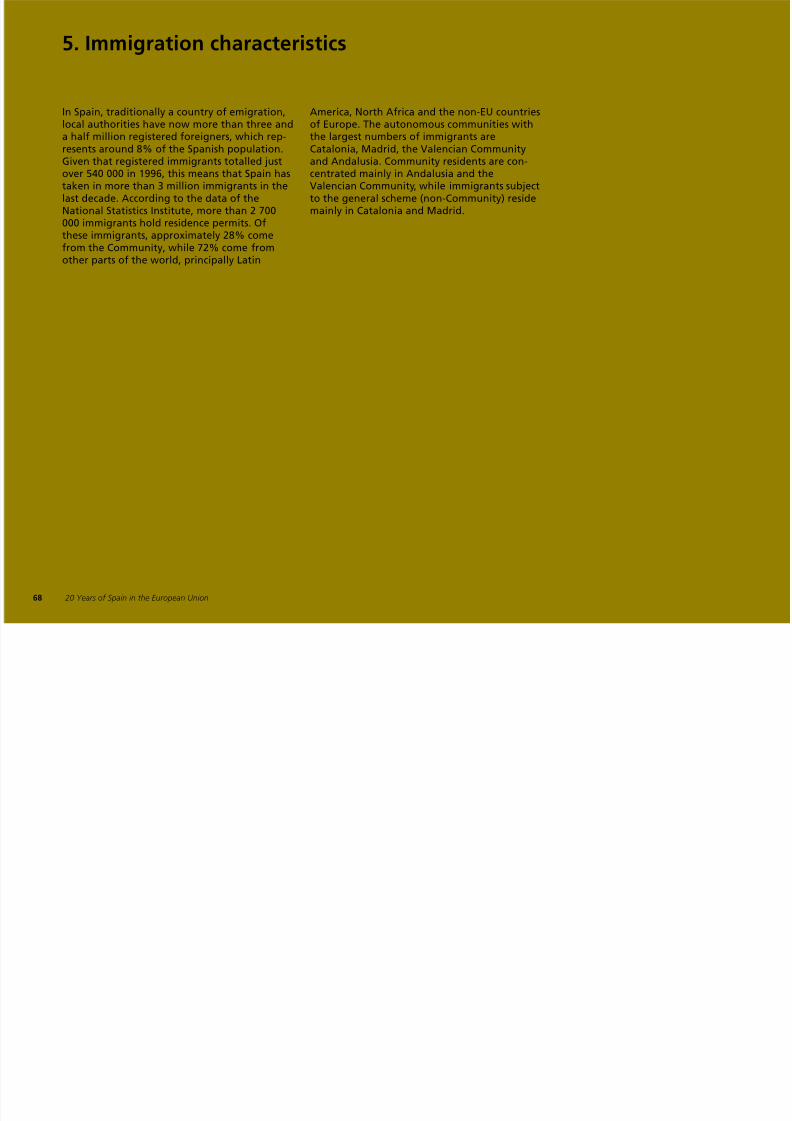
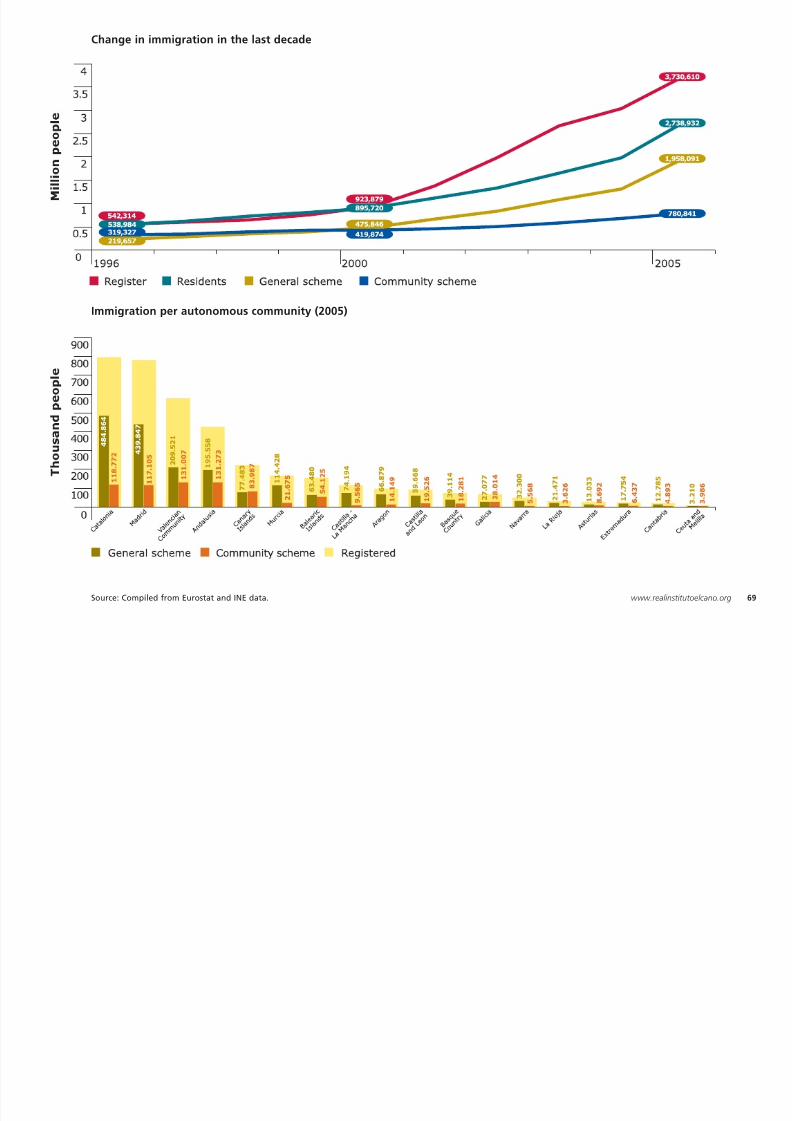
In Spain, traditionally a country of emigration,
local authorities have now more than three anda half million registered foreigners, which rep-resents around 8% of the Spanish population.Given that registered immigrants totalled justover 540 000 in 1996, this means that Spain hastaken in more than 3 million immigrants in thelast decade. According to the data of theNational Statistics Institute, more than 2 700000 immigrants hold residence permits. Of
these immigrants, approximately 28% comefrom the Community, while 72% come fromother parts of the world, principally Latin
America, North Africa and the non-EU countries
of Europe. The autonomous communities withthe largest numbers of immigrants areCatalonia, Madrid, the Valencian Communityand Andalusia. Community residents are con-centrated mainly in Andalusia and theValencian Community, while immigrants subjectto the general scheme (non-Community) residemainly in Catalonia and Madrid.
Change in immigration in the last decade
8/3/2019 20 Years of Spain
http://slidepdf.com/reader/full/20-years-of-spain 69/161
Source: Compiled from Eurostat and INE data. 69www.realinstitutoelcano.org
Immigration per autonomous community (2005)
6. Maternity and fertility
8/3/2019 20 Years of Spain
http://slidepdf.com/reader/full/20-years-of-spain 70/161
20 Years of Spain in the European Union70
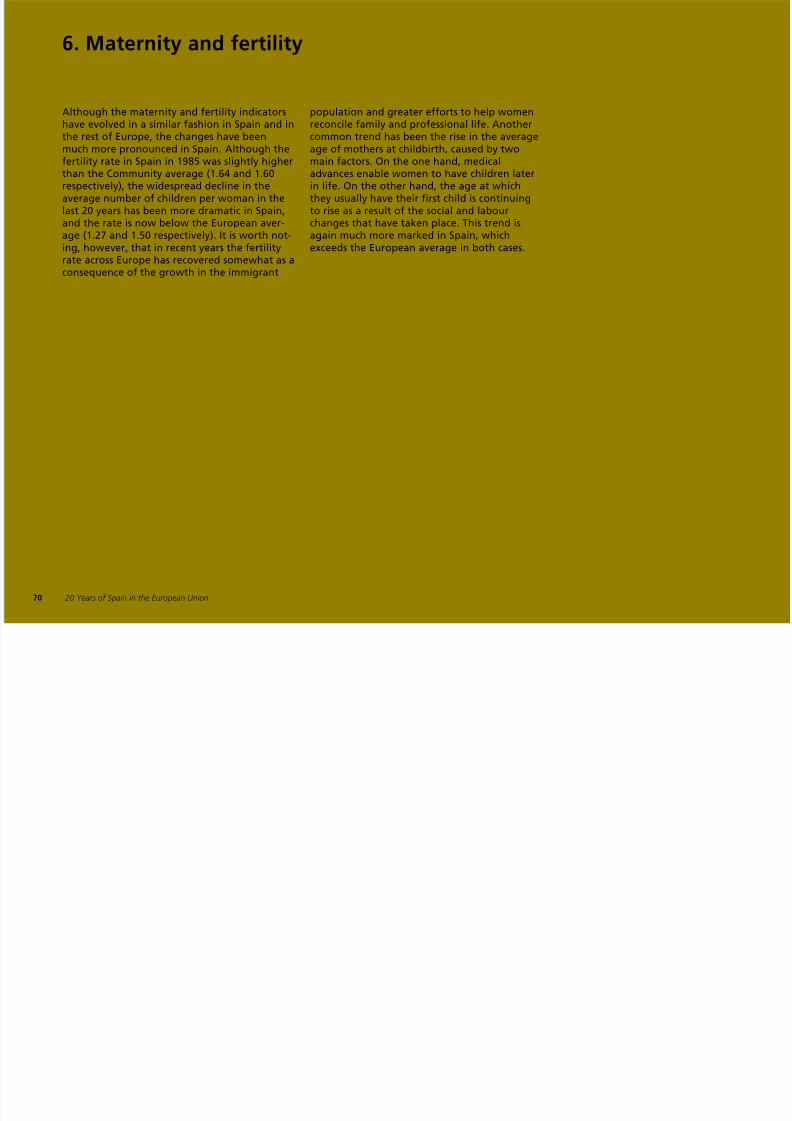
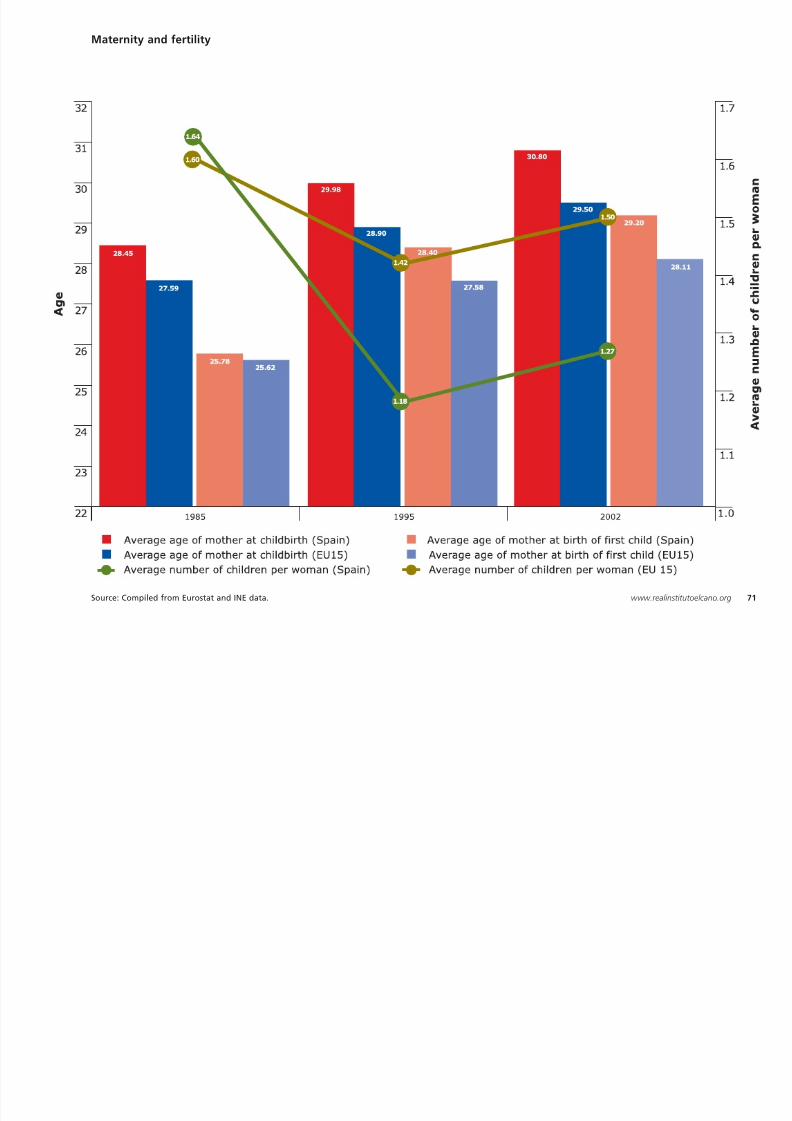
Although the maternity and fertility indicators
have evolved in a similar fashion in Spain and inthe rest of Europe, the changes have beenmuch more pronounced in Spain. Although thefertility rate in Spain in 1985 was slightly higherthan the Community average (1.64 and 1.60respectively), the widespread decline in theaverage number of children per woman in thelast 20 years has been more dramatic in Spain,and the rate is now below the European aver-
age (1.27 and 1.50 respectively). It is worth not-ing, however, that in recent years the fertilityrate across Europe has recovered somewhat as aconsequence of the growth in the immigrant
population and greater efforts to help women
reconcile family and professional life. Anothercommon trend has been the rise in the averageage of mothers at childbirth, caused by twomain factors. On the one hand, medicaladvances enable women to have children laterin life. On the other hand, the age at whichthey usually have their first child is continuingto rise as a result of the social and labourchanges that have taken place. This trend is
again much more marked in Spain, whichexceeds the European average in both cases.
Maternity and fertility
8/3/2019 20 Years of Spain
http://slidepdf.com/reader/full/20-years-of-spain 71/161
71www.realinstitutoelcano.orgSource: Compiled from Eurostat and INE data.
7. Human development and quality of life
The Human Development Index (HDI) is a syn the world ranking having seen its HDI rise con
8/3/2019 20 Years of Spain
http://slidepdf.com/reader/full/20-years-of-spain 72/161
20 Years of Spain in the European Union72
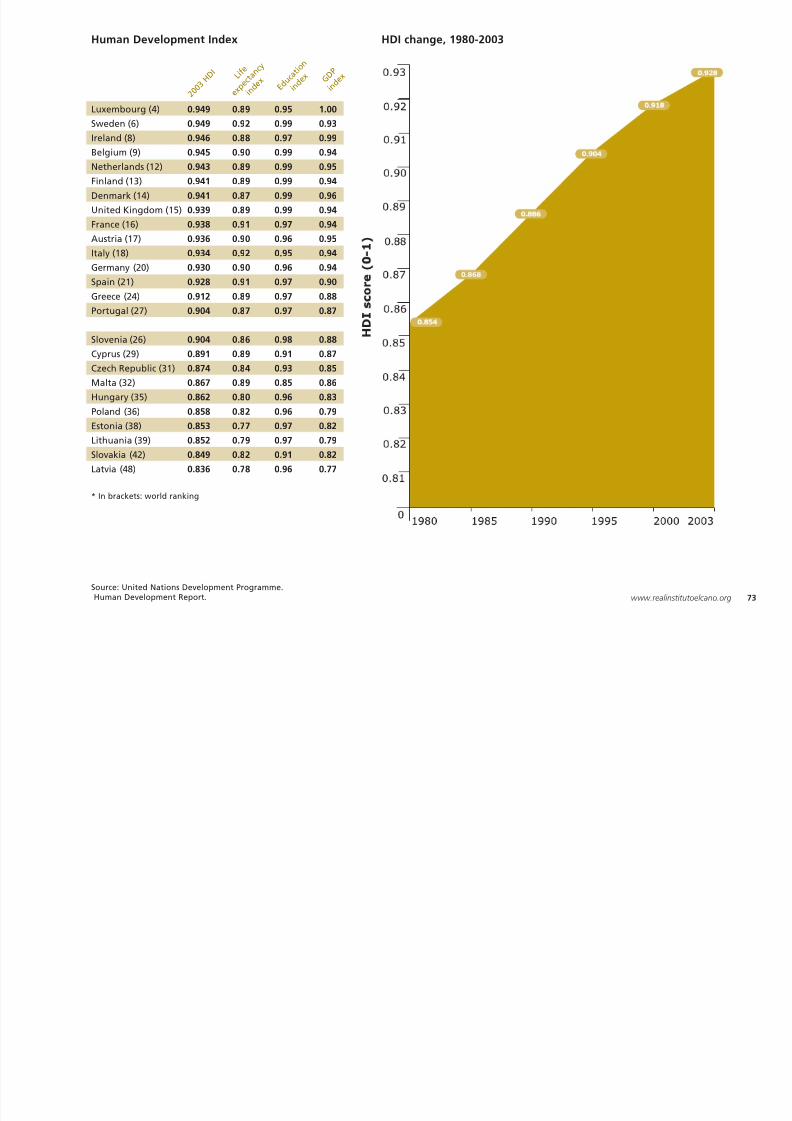
The Human Development Index (HDI) is a syn-
thetic indicator prepared each year by theUnited Nations Development Programme(UNDP) to measure the level of developmentand quality of life of countries worldwide. TheIndex is drawn up on the basis of threesubindices: life expectancy (which takes intoaccount life expectancy at birth in each coun-try), education (which encompasses the literacyrate of the population aged over 15 and the
combined primary, secondary and tertiary grossenrolment ratio), and GDP (calculated on thebasis of per capita income). Of the 177 coun-tries, Spain currently comes in at number 21 in
the world ranking, having seen its HDI rise con-
tinuously since joining the EU. The improve-ment in the literacy and enrolment rate,together with the growth in GDP, have con-tributed significantly to this trend. However, itis the extraordinary performance of the lifeexpectancy subindex that continues to standout. Spanish women have the highest lifeexpectancy in Europe (83.7 years); Spanish menare in second place, after Sweden, with a life
expectancy of 77.2 years.
Human Development Index HDI change, 1980-2003
Luxembourg (4) 0.949 0.89 0.95 1.00
2 0 0 3
H D I L i
f e
e x p e
c t a n
c y
i n d e
x E d
u c a t i o
n
i n d e
x G D P
i n d e
x
8/3/2019 20 Years of Spain
http://slidepdf.com/reader/full/20-years-of-spain 73/161
73www.realinstitutoelcano.org
Luxembourg (4) 0.949 0.89 0.95 1.00
Sweden (6) 0.949 0.92 0.99 0.93
Ireland (8) 0.946 0.88 0.97 0.99
Belgium (9) 0.945 0.90 0.99 0.94
Netherlands (12) 0.943 0.89 0.99 0.95
Finland (13) 0.941 0.89 0.99 0.94
Denmark (14) 0.941 0.87 0.99 0.96
United Kingdom (15) 0.939 0.89 0.99 0.94
France (16) 0.938 0.91 0.97 0.94
Austria (17) 0.936 0.90 0.96 0.95Italy (18) 0.934 0.92 0.95 0.94
Germany (20) 0.930 0.90 0.96 0.94
Spain (21) 0.928 0.91 0.97 0.90
Greece (24) 0.912 0.89 0.97 0.88
Portugal (27) 0.904 0.87 0.97 0.87
Slovenia (26) 0.904 0.86 0.98 0.88
Cyprus (29) 0.891 0.89 0.91 0.87
Czech Republic (31) 0.874 0.84 0.93 0.85
Malta (32) 0.867 0.89 0.85 0.86
Hungary (35) 0.862 0.80 0.96 0.83
Poland (36) 0.858 0.82 0.96 0.79
Estonia (38) 0.853 0.77 0.97 0.82
Lithuania (39) 0.852 0.79 0.97 0.79
Slovakia (42) 0.849 0.82 0.91 0.82Latvia (48) 0.836 0.78 0.96 0.77
* In brackets: world ranking
Source: United Nations Development Programme.Human Development Report.
8. Marriage and family
During the last 20 years family life and the below that of other EU countries is rising
8/3/2019 20 Years of Spain
http://slidepdf.com/reader/full/20-years-of-spain 74/161
20 Years of Spain in the European Union74
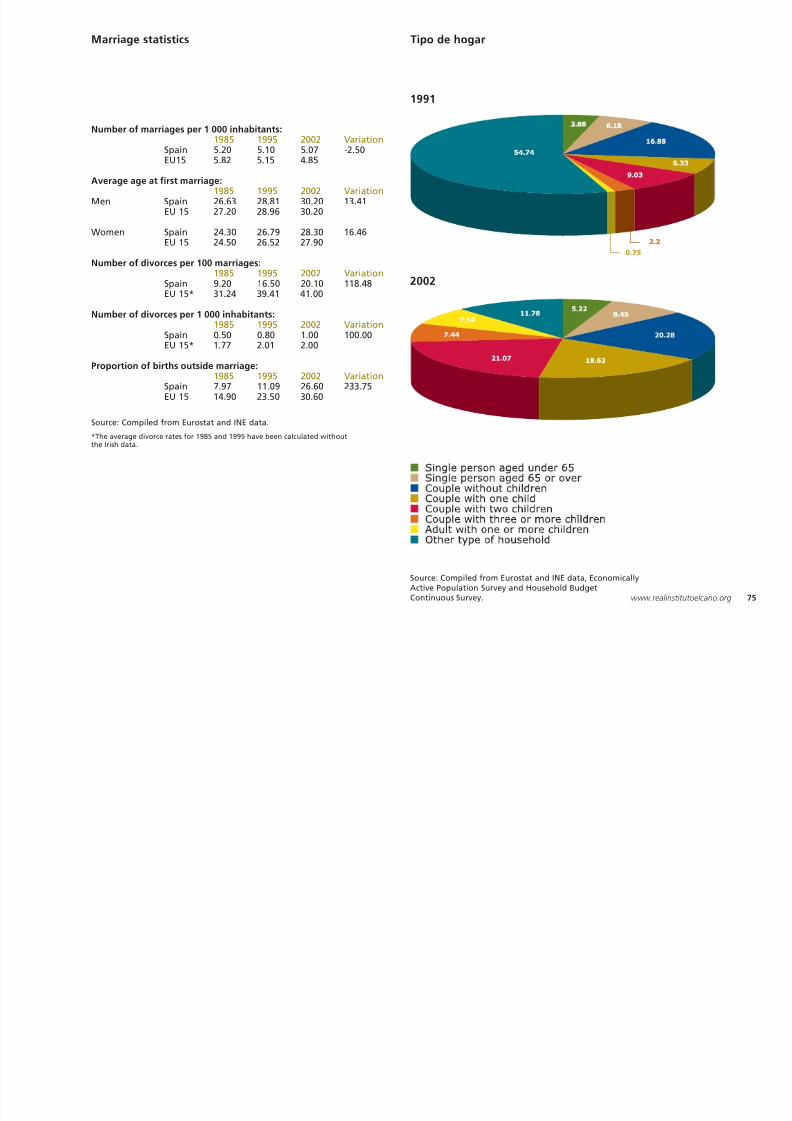
During the last 20 years, family life and the
types of households in Spain have undergonedramatic changes. In line with the Europeantrend, the nuptiality rate is falling, due primari-ly to the proliferation of alternative forms offamily units, such as common-law couples orsingle-parent homes. Similarly, the number ofadults who decide to live alone has also risenconsiderably. Since the 1980s, marriages havechanged too, particularly with regard to two
very relevant aspects. Firstly, men and womennow marry at an older age. Whereas in 1985the average age at which a person first marriedin Spain was lower than the European average,it is now the same for men (30.20 years) andhigher for women (28.30 and 27.90 yearsrespectively). Secondly, marriages are less stableand the number of divorces, although still
below that of other EU countries, is rising
steadily. In 1980 only 9.2% of married couplesgot divorced; that figure is now over 20%. As aresult, many of the children born today (morethan 26%) are not children of married couples.The type of household in Spain has alsochanged significantly and family units consist-ing of a couple without children or with one ortwo children have become the norm. There hasalso been considerable growth in households
comprising one person or one adult with oneor more children as a consequence of the socialchanges mentioned above.
Marriage statistics Tipo de hogar
1991
8/3/2019 20 Years of Spain
http://slidepdf.com/reader/full/20-years-of-spain 75/161
Number of marriages per 1 000 inhabitants:1985 1995 2002 Variation
Spain 5.20 5.10 5.07 -2.50EU15 5.82 5.15 4.85
Average age at first marriage:1985 1995 2002 Variation
Men Spain 26.63 28.81 30.20 13.41EU 15 27.20 28.96 30.20
Women Spain 24.30 26.79 28.30 16.46EU 15 24.50 26.52 27.90
Number of divorces per 100 marriages:1985 1995 2002 Variation
Spain 9.20 16.50 20.10 118.48EU 15* 31.24 39.41 41.00
Number of divorces per 1 000 inhabitants:1985 1995 2002 Variation
Spain 0.50 0.80 1.00 100.00
EU 15* 1.77 2.01 2.00
Proportion of births outside marriage:1985 1995 2002 Variation
Spain 7.97 11.09 26.60 233.75EU 15 14.90 23.50 30.60
*The average divorce rates for 1985 and 1995 have been calculated withoutthe Irish data.
Source: Compiled from Eurostat and INE data, EconomicallyActive Population Survey and Household BudgetContinuous Survey. 75www.realinstitutoelcano.org
Source: Compiled from Eurostat and INE data.
2002
9. Activity and employment rate
Spain’s total activity rate has undergone an than women in the EU as a whole. This demon-
8/3/2019 20 Years of Spain
http://slidepdf.com/reader/full/20-years-of-spain 76/161
20 Years of Spain in the European Union76
p y g
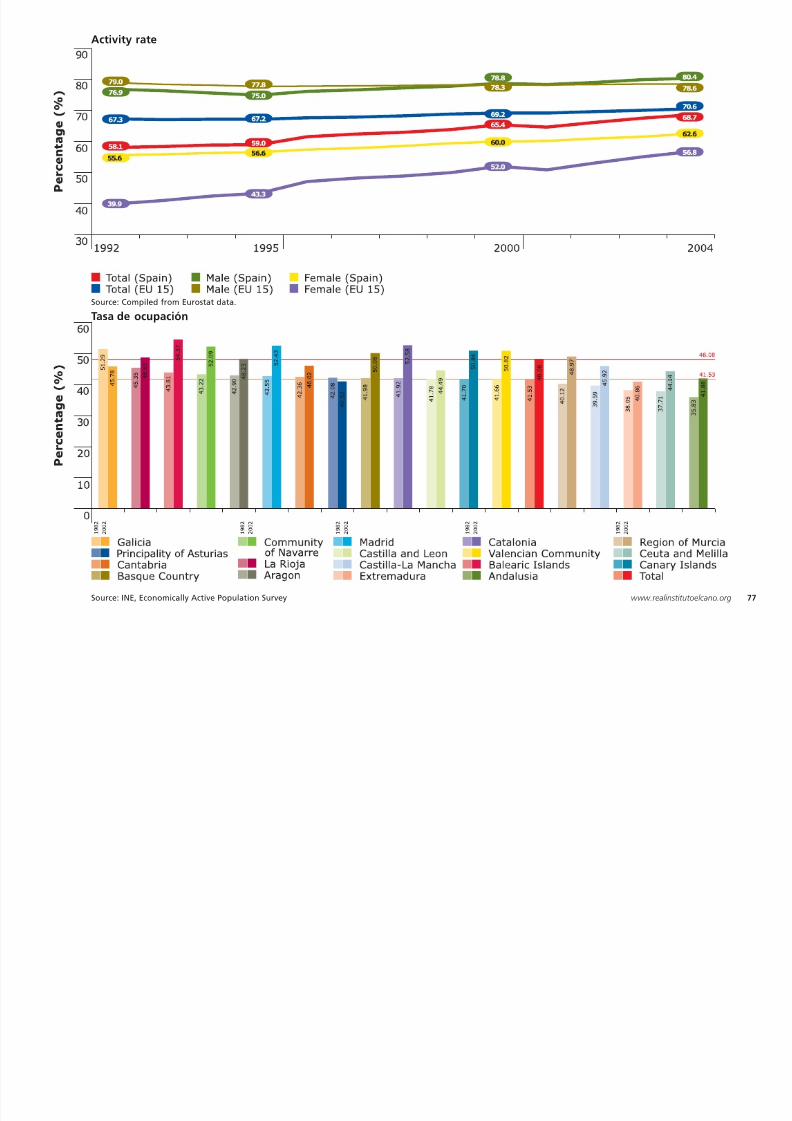
important process of convergence with that ofthe EU 15, rising almost 20 points since 1987and totalling around 69% (two points lowerthan the EU average). The activity rate amongwomen, which was an extremely low 33% in1987, has grown much faster than the total;however, it is still only 57%, almost six pointsbelow the European average. There has been asimilar change in terms of the employment
rate. Many jobs have been created, but in spiteof this, unemployment among women contin-ues to be considerably higher than in the EU asa whole. Furthermore, Spanish women betweenthe ages of 25 and 34 with children under theage of 6 tend to give up work more frequently
strates that although women’s participation inthe labour market has increased dramatically,further efforts are needed to achieve full con-vergence with the EU. As far as theautonomous communities are concerned, thedynamic is similar to the overall trend in Spain,in terms of both activity and employment rates.The highest levels of employment are to befound in the Balearic Islands, Catalonia, Madrid
and Valencia.
Activity rate
8/3/2019 20 Years of Spain
http://slidepdf.com/reader/full/20-years-of-spain 77/161
Source: INE, Economically Active Population Survey 77www.realinstitutoelcano.org
Source: Compiled from Eurostat data.
Tasa de ocupación
10. Labour market
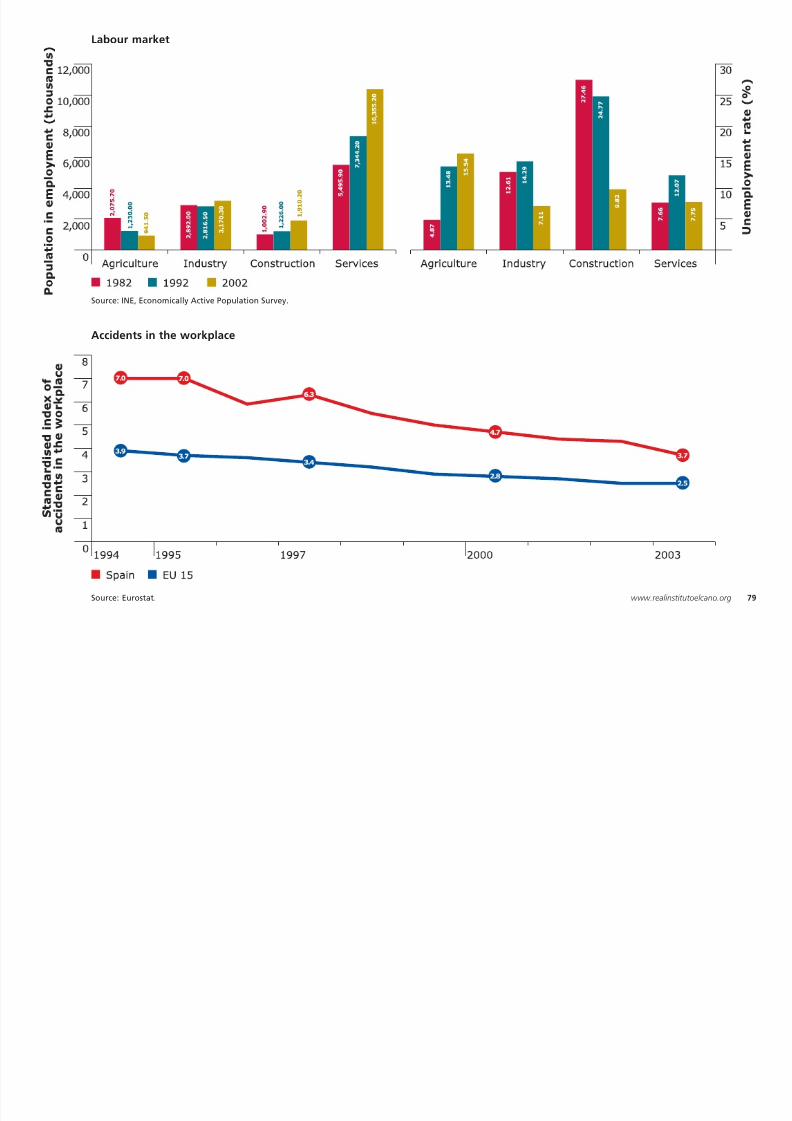
Between 1982 and 2002, the number of people displays two worrying elements from a social
8/3/2019 20 Years of Spain
http://slidepdf.com/reader/full/20-years-of-spain 78/161
20 Years of Spain in the European Union78
employed in the services sector almost doubled.This sector also has the lowest level of unem-ployment, together with the industrial sector. Inaddition, the share of employment in the agri-cultural sector has fallen to less than half, whileunemployment in that sector has increased. Theincrease in the proportion of employment in theservices sector reflects the modernisation ofSpanish society and economy over the last 30
years. Nevertheless, Spain’s labour market still
perspective. Firstly, the level of accidents in theworkplace continues to be 50% higher than inthe EU (although there has been a significantimprovement given that it was 75% higher in1994). Secondly, there is still a large wage gapbetween men and women, which has not fallenin recent decades. According to the most recentdata available, the average annual salary wasEUR 22 169 for men and EUR 15 767 for women,
a difference of 40%.
Labour market
8/3/2019 20 Years of Spain
http://slidepdf.com/reader/full/20-years-of-spain 79/161
Source: Eurostat. 79www.realinstitutoelcano.org
Source: INE, Economically Active Population Survey.
Accidents in the workplace
11. Social expenditure
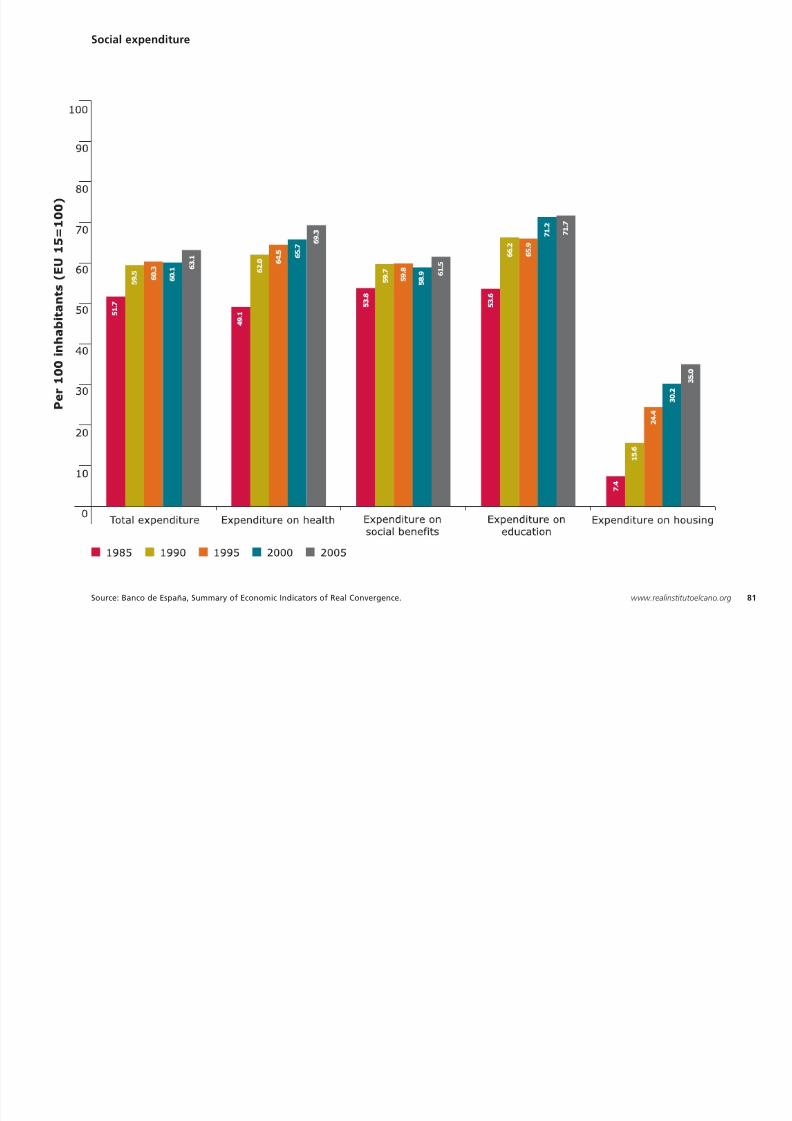
Social expenditure in Spain has risen by morethan 10 points in the last 20 years but it is still
8/3/2019 20 Years of Spain
http://slidepdf.com/reader/full/20-years-of-spain 80/161
20 Years of Spain in the European Union80
than 10 points in the last 20 years, but it is stillless than 70% of the average of the EU 15,which includes the countries with the mostadvanced welfare states in the world. The mostsignificant progress has been made in the areasof health, education and housing, and it shouldbe noted that health quality in Spain is one ofthe highest in Europe. Furthermore, althoughspending on social housing has increased five-
fold from very low levels, it is still less than 40%of the European average. Increases in socialsecurity expenditure have been less dramatic.Indeed, in 2005 it scarcely reached 60% of theEU 15 average. All in all, there has been animportant process of real convergence in thearea of social expenditure. However, from ini-tial levels below the EU average, Spain stillrequires additional efforts to achieve
full convergence.
Social expenditure
8/3/2019 20 Years of Spain
http://slidepdf.com/reader/full/20-years-of-spain 81/161
Source: Banco de España, Summary of Economic Indicators of Real Convergence. 81www.realinstitutoelcano.org
12. Health professionals
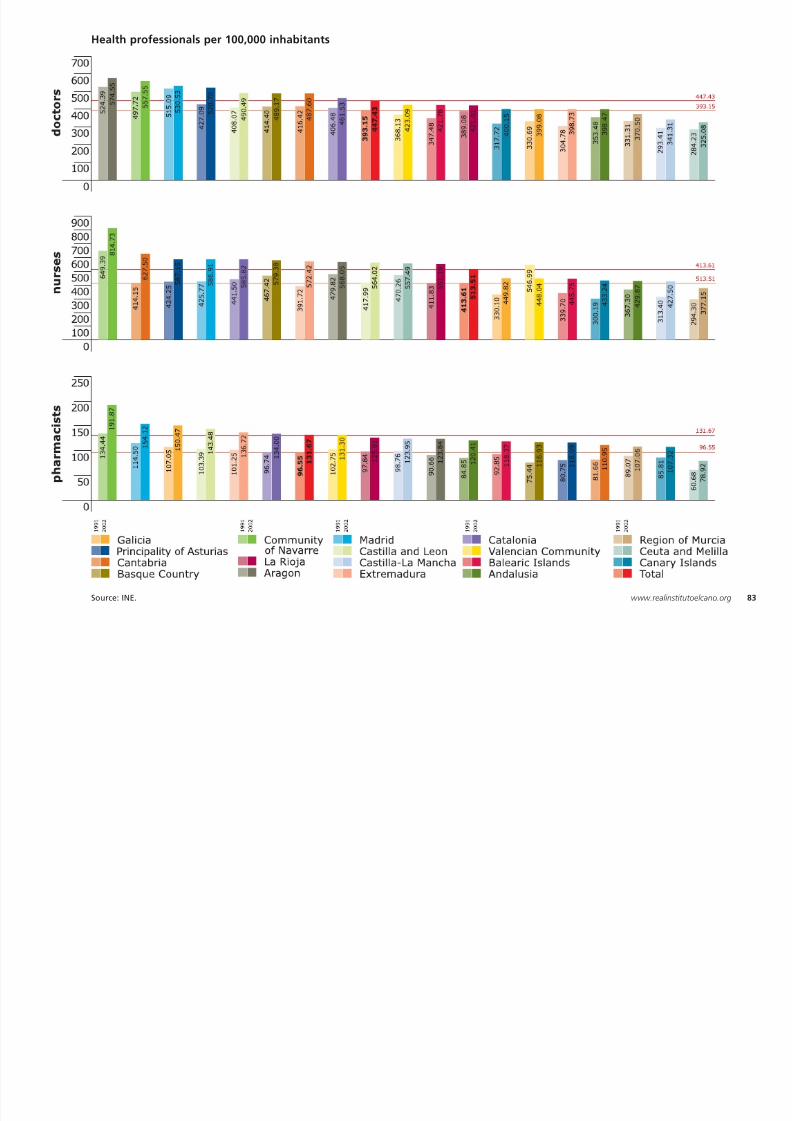
Since joining the EU, Spain has succeeded inconsolidating one of the best public health sys-
8/3/2019 20 Years of Spain
http://slidepdf.com/reader/full/20-years-of-spain 82/161
20 Years of Spain in the European Union82
consolidating one of the best public health systems in the world. Although spending has notyet reached the EU average, the Spanish systemhas some of the highest quality indices in theUnion. The rise in the number of doctors, nursesand pharmacists per 100 000 people in the lastdecade is a good example of this transforma-tion. The number of professionals in all cate-gories has risen in every autonomous communi-
ty. The increase in the number of doctors hasnot been as dramatic because the initial figureswere already high. The spectacular rise in thenumber of dental surgeons should also be high-lighted. Whereas there were only 28 dental sur-geons per 100 000 inhabitants in 1992, thereare now more than 46.
Health professionals per 100,000 inhabitants
8/3/2019 20 Years of Spain
http://slidepdf.com/reader/full/20-years-of-spain 83/161
Source: INE. 83www.realinstitutoelcano.org
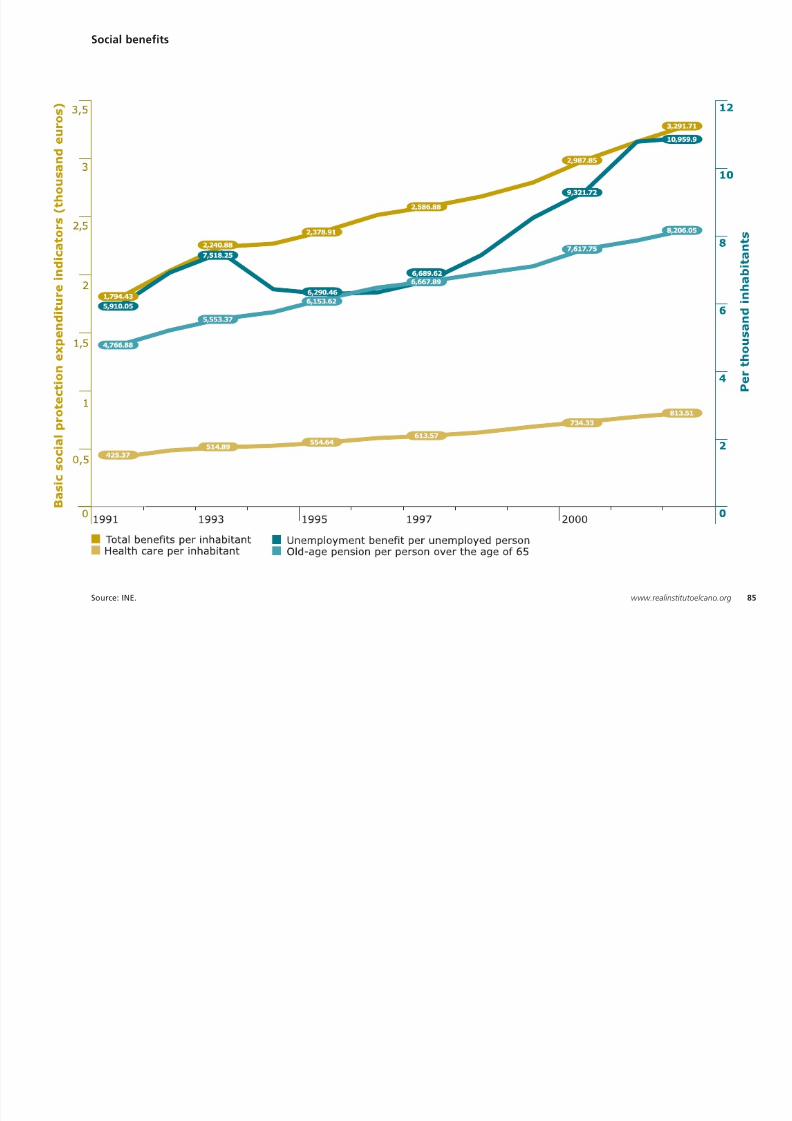
13. Social benefits
The increase in social expenditure and the qual-ity of life has been accompanied by a rise in
8/3/2019 20 Years of Spain
http://slidepdf.com/reader/full/20-years-of-spain 84/161
20 Years of Spain in the European Union84
y p ysocial protection, which has been reflected notonly in the extension of the level of cover butalso in the increase in benefits. Indeed, boththe social benefits and healthcare received perinhabitant have grown continuously and steadi-ly since Spain entered the EU. Whereas everySpanish citizen received on average EUR 1 794per year in social benefits and EUR 425 inhealthcare, these figures have increased to EUR3 291 and EUR 813 respectively. The consolida-tion of the welfare state is also evident in thegrowth in unemployment benefit and pensionsreceived by Spaniards. Social expenditure inthese areas in relation to the total number ofunemployed people and pensioners has alsodoubled in the last decade.
Social benefits
8/3/2019 20 Years of Spain
http://slidepdf.com/reader/full/20-years-of-spain 85/161
Source: INE. 85www.realinstitutoelcano.org
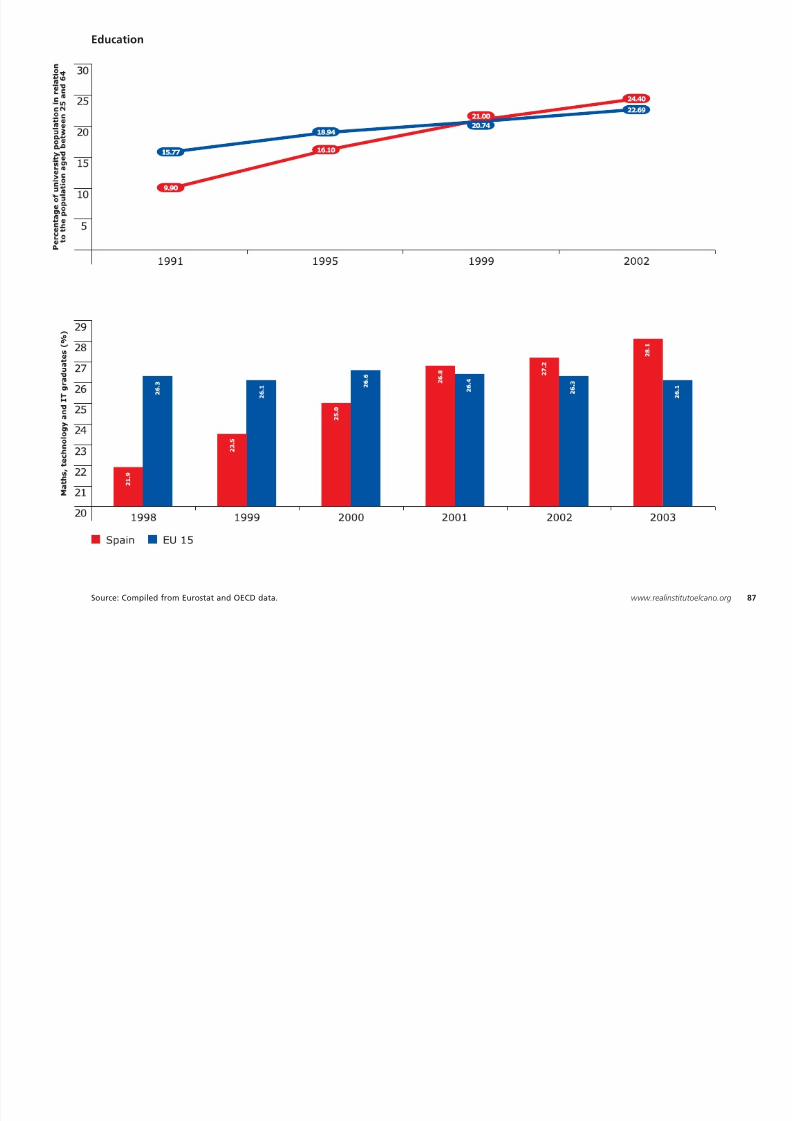
14. Education
Between 1991 and 2002 Spain managed toexceed the EU 15 average in terms of the per-
8/3/2019 20 Years of Spain
http://slidepdf.com/reader/full/20-years-of-spain 86/161
20 Years of Spain in the European Union86
centage of the population with university quali-fications. This figure rose from 10% in 1991 to25% in 2002, one and a half points over theEuropean average. Women have played a keyrole in consolidating this trend. In 2003 therewere 133 women at university for every 100men. Since 1998, the percentage of mathemat-ics, technology and IT graduates, which is oneof the Lisbon objectives, has also risen in Spainand exceeded the European average; it current-ly stands at almost 30% of the university popu-lation. However, social sciences and health con-tinue to be the preferred specialities amongundergraduates, both in Spain and in the restof Europe. In spite of this success with highereducation, in the PISA report produced by theOECD, which assesses scientific, reading and
mathematical literacy of second-level students,Spain’s results are below the European average,surpassing only those of Italy, Greeceand Portugal.
Education
8/3/2019 20 Years of Spain
http://slidepdf.com/reader/full/20-years-of-spain 87/161
Source: Compiled from Eurostat and OECD data. 87www.realinstitutoelcano.org
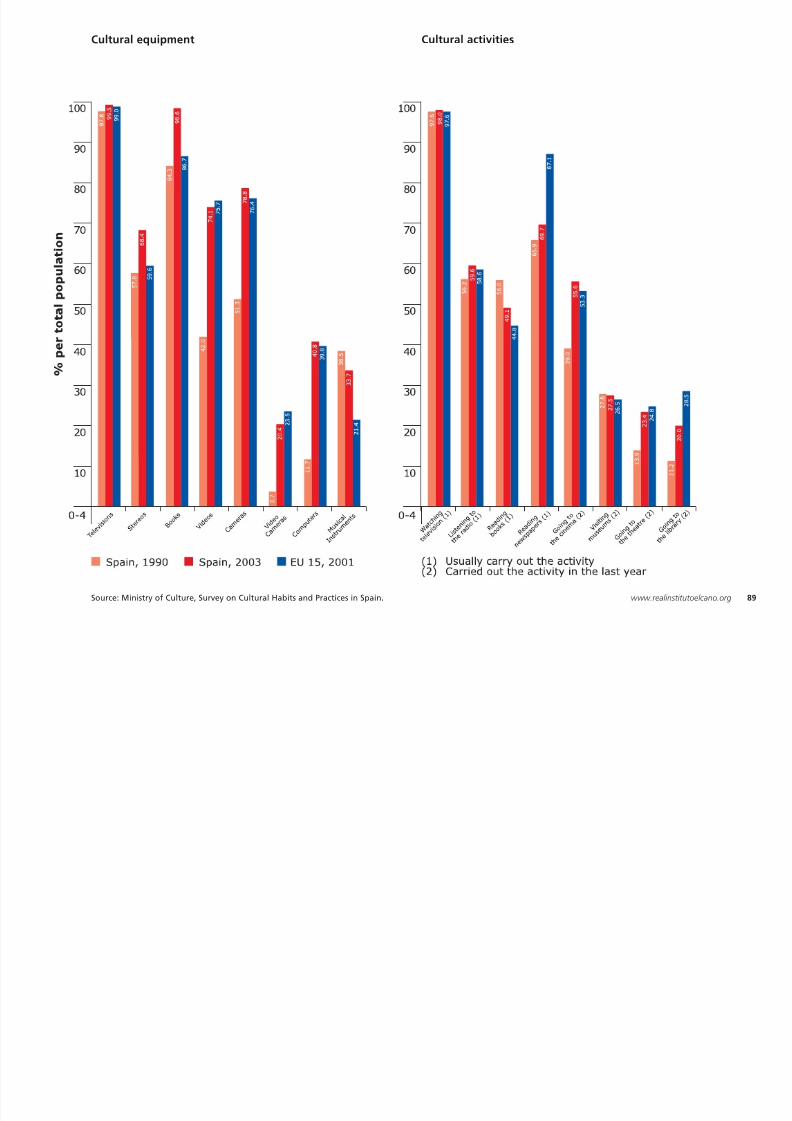
15. Cultural activities
The rise in income and welfare levels experi-enced by Spanish society has generated an
i i th tim d m iti d t

8/3/2019 20 Years of Spain
http://slidepdf.com/reader/full/20-years-of-spain 88/161
20 Years of Spain in the European Union88
increase in the time and money citizens devoteto leisure and cultural activities. For example,the amount of computer equipment, videos,video cameras, cameras and stereos hasincreased to match the EU 15 levels. Spainexceeds the European average as regards thenumber of books and stereos. In addition,Spaniards read more newspapers, listen to moreradio and go to the cinema, theatre andlibraries more often than they did in 1990.However, TV use and museum visits haveremained constant (at levels similar to those ofthe EU 15), while the number of musical instru-ments and books read have fallen in bothSpain and Europe.
Cultural equipment Cultural activities
8/3/2019 20 Years of Spain
http://slidepdf.com/reader/full/20-years-of-spain 89/161
Source: Ministry of Culture, Survey on Cultural Habits and Practices in Spain. 89www.realinstitutoelcano.org
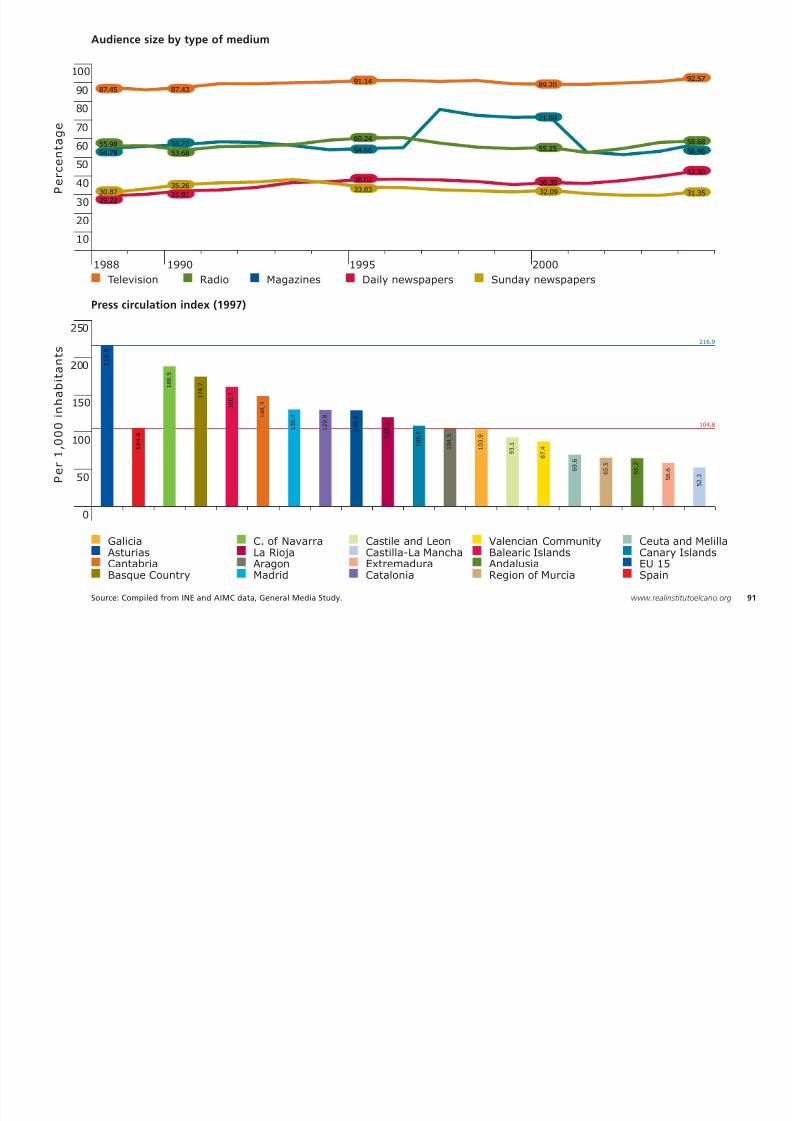
16. Media
The audience of the various media (not includ-ing the Internet) has not changed significantly
since Spain joined the EU which indicates that
8/3/2019 20 Years of Spain
http://slidepdf.com/reader/full/20-years-of-spain 90/161
20 Years of Spain in the European Union90
since Spain joined the EU, which indicates thatthe structural change in the consumption ofinformation took place before 1986. Televisioncontinues to have the largest audience (morethan 90%), followed by radio and magazines(almost 60%) and daily and Sunday newspapers.Although the number of people who read dailynewspapers rose from 29% to 43% between1988 and 2005, Spaniards read less written pressthan the EU average, approximately half in fact.As far as the autonomous communities are con-cerned, the highest indices of press circulationare in Navarre, the Basque Country, Cantabria,Madrid and Catalonia, while the lowest indicesare in Castilla-La Mancha, Extremaduraand Andalusia.
80
70
100
90
ag
e
87.45 87.43
60.24
91.14
71.60
89.20
58 68
92.57
Audience size by type of medium
8/3/2019 20 Years of Spain
http://slidepdf.com/reader/full/20-years-of-spain 91/161
0
1988 1995 2000
40
30
20
10
150
200
250
100
50
60
50
1990
P e r c e n t a
P e r
1 ,
0 0 0
i n h a b i t a n t s
29.22
GaliciaAsturiasCantabriaBasque Country
C. of NavarraLa RiojaAragonMadrid
Castile and LeonCastilla-La ManchaExtremaduraCatalonia
Valencian CommunityBalearic IslandsAndalusiaRegion of Murcia
Ceuta and MelillaCanary IslandsEU 15Spain
30.87
54.79
55.98
31.91
35.26
56.77
53.68
38.02
33.83
54.66
60.24
32.09
36.30
55.25
42.50
31.35
56.96
58.68
Television Radio Magazines Daily newspapers Sunday newspapers
2 1 6 .
9
1 0 4 .
8
1 8 8 .
5
1 7 4 .
7
1 6 0 .
7
1 4 8 .
3
1 3 0 .
4
1 2 9 .
8
1 2 9 .
3
1 2 0 .
1
1 0 8 .
6
1 0 4 .
5
1 0 3 .
9
9 3 .
1
8 7 .
4
6 9 .
6
6 5 .
5
6 5 .
2
5 8 .
6
5 2 .
3
216.9
104.8
Press circulation index (1997)
Source: Compiled from INE and AIMC data, General Media Study. 91www.realinstitutoelcano.org
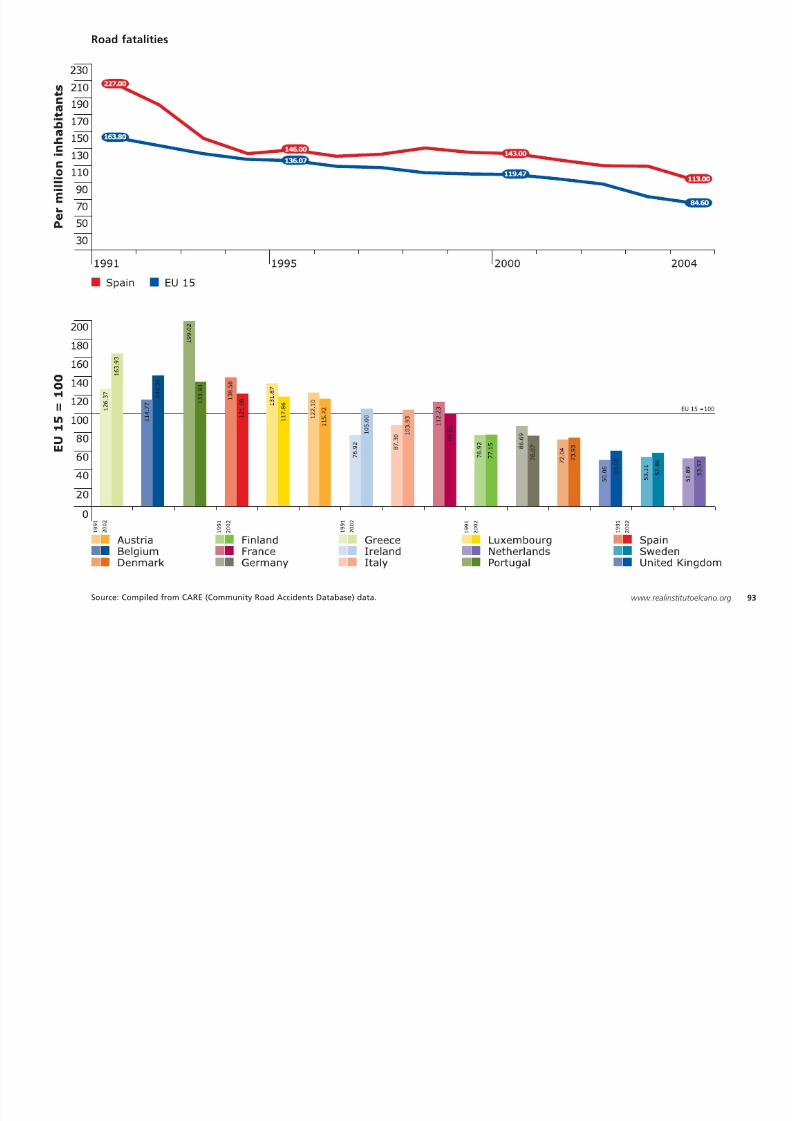
17. Road safety
Substantial efforts have been made in bothSpain and the EU to reduce the number of
deaths caused by road accidents and they
8/3/2019 20 Years of Spain
http://slidepdf.com/reader/full/20-years-of-spain 92/161
20 Years of Spain in the European Union92
deaths caused by road accidents and theyachieved a 50% decrease between 1991 and2004. Although the number of road trafficdeaths at the beginning of the 1990s per mil-lion inhabitants in Spain exceeded theEuropean average by 64, that difference hasbeen reduced to 29. In relation to its total pop-ulation, Spain is in fourth position in the EU 15in terms of the number of traffic fatalities, sur-
passed only by Greece, Belgium and Portugal. Inspite of the significant efforts made to increaseroad safety education, improve infrastructures,modernise vehicles and raise quality and safetystandards since joining the EU, Spain couldmake additional efforts to achieve full conver-gence with Europe.
Road fatalities
8/3/2019 20 Years of Spain
http://slidepdf.com/reader/full/20-years-of-spain 93/161
93www.realinstitutoelcano.orgSource: Compiled from CARE (Community Road Accidents Database) data.
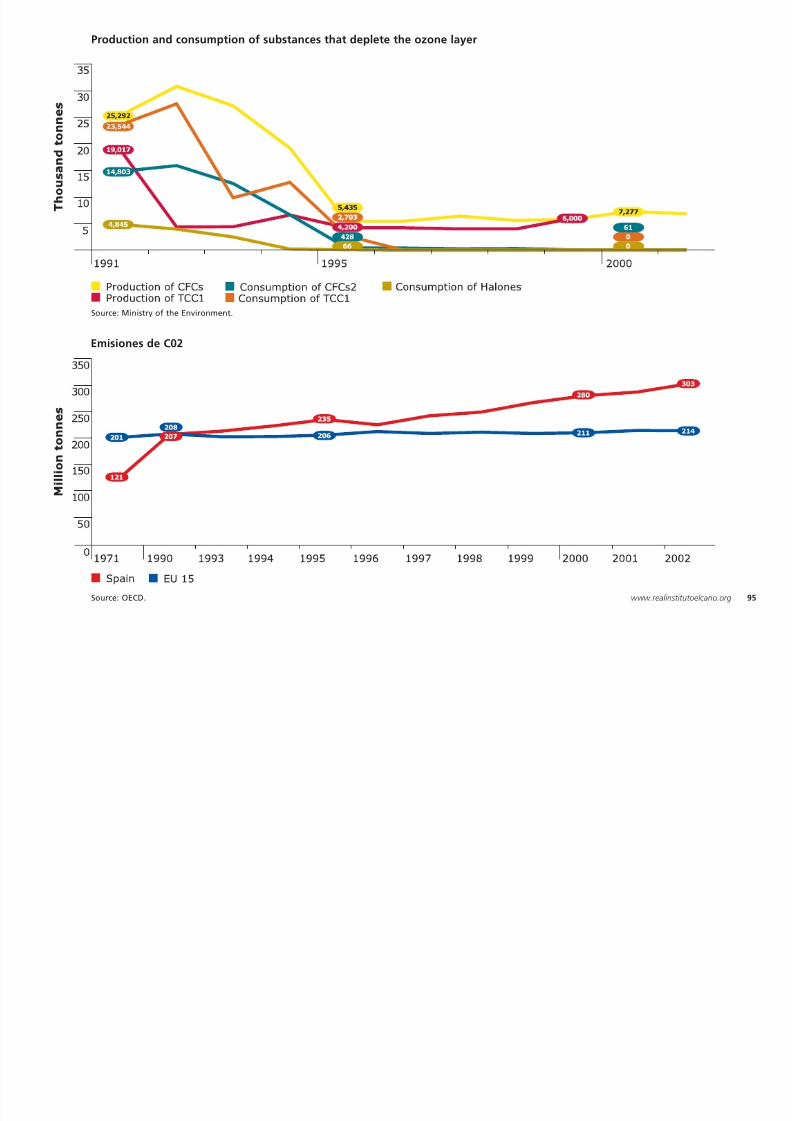
18. Environment
Spain has made considerable efforts to reduceits levels of atmospheric pollution in the last
decade, which reflects its growing commitmenth i d i d
8/3/2019 20 Years of Spain
http://slidepdf.com/reader/full/20-years-of-spain 94/161
20 Years of Spain in the European Union94
to the environment. Production and consump-tion of various substances that deplete theozone layer have fallen, particularly CFCs (chlo-rofluorocarbons), production and use of whichare four and a half times lower than they werein 1992. Spain continues to emit 50% more CO2than the EU 15 average, which means that addi-tional efforts are necessary to comply with the
commitments in the Kyoto Protocol.
Production and consumption of substances that deplete the ozone layer
8/3/2019 20 Years of Spain
http://slidepdf.com/reader/full/20-years-of-spain 95/161
Source: OECD. 95www.realinstitutoelcano.org
Emisiones de C02
Source: Ministry of the Environment.
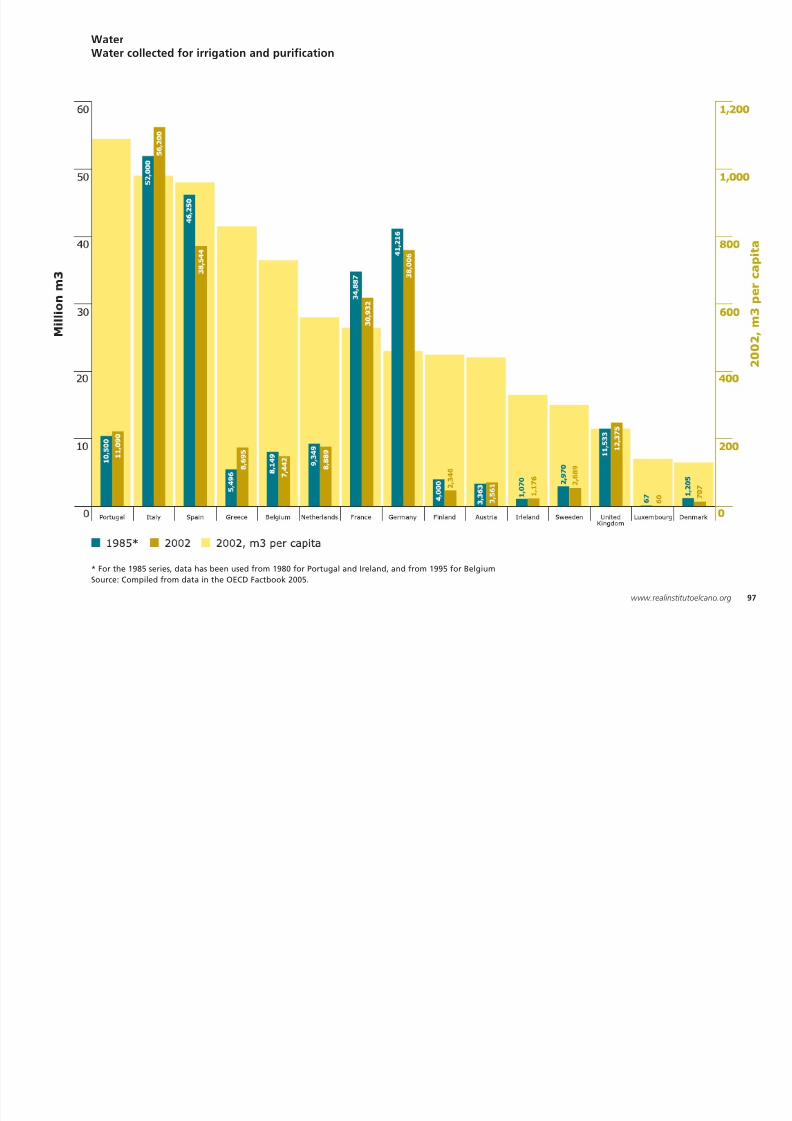
19. Water
Spanish society’s commitment to the environ-ment is also reflected in its use and consump-
tion of water. Spaniards are becoming increas-ingly aware of the need to reduce as far as
tion for domestic use, behind only Portugal andItaly, it is important to remember that the coun-
tries in Southern Europe need much morewater for irrigation than the rest of Europe
8/3/2019 20 Years of Spain
http://slidepdf.com/reader/full/20-years-of-spain 96/161
20 Years of Spain in the European Union96
ingly aware of the need to reduce as far aspossible consumption of this often scarce, andalways necessary, resource. Water use efficiencyhas resulted in a considerable decrease in col-lection for irrigation and purification, fallingfrom 46 250 million cubic metres in 1985 to lessthan 40 000 million today. Although, relativelyspeaking, Spain is in third place in the EU 15 in
terms of the number of cubic meters of waterper capita obtained for irrigation and purifica-
water for irrigation than the rest of Europe.However, there continue to be water losses inthe distribution network, totalling approxi-mately 59 litres per inhabitant per day, whichrepresents 18.7% of the volume of water sup-plied per inhabitant per day (258 litres).
WaterWater collected for irrigation and purification
8/3/2019 20 Years of Spain
http://slidepdf.com/reader/full/20-years-of-spain 97/161
Source: Compiled from data in the OECD Factbook 2005.
97www.realinstitutoelcano.org
* For the 1985 series, data has been used from 1980 for Portugal and Ireland, and from 1995 for Belgium
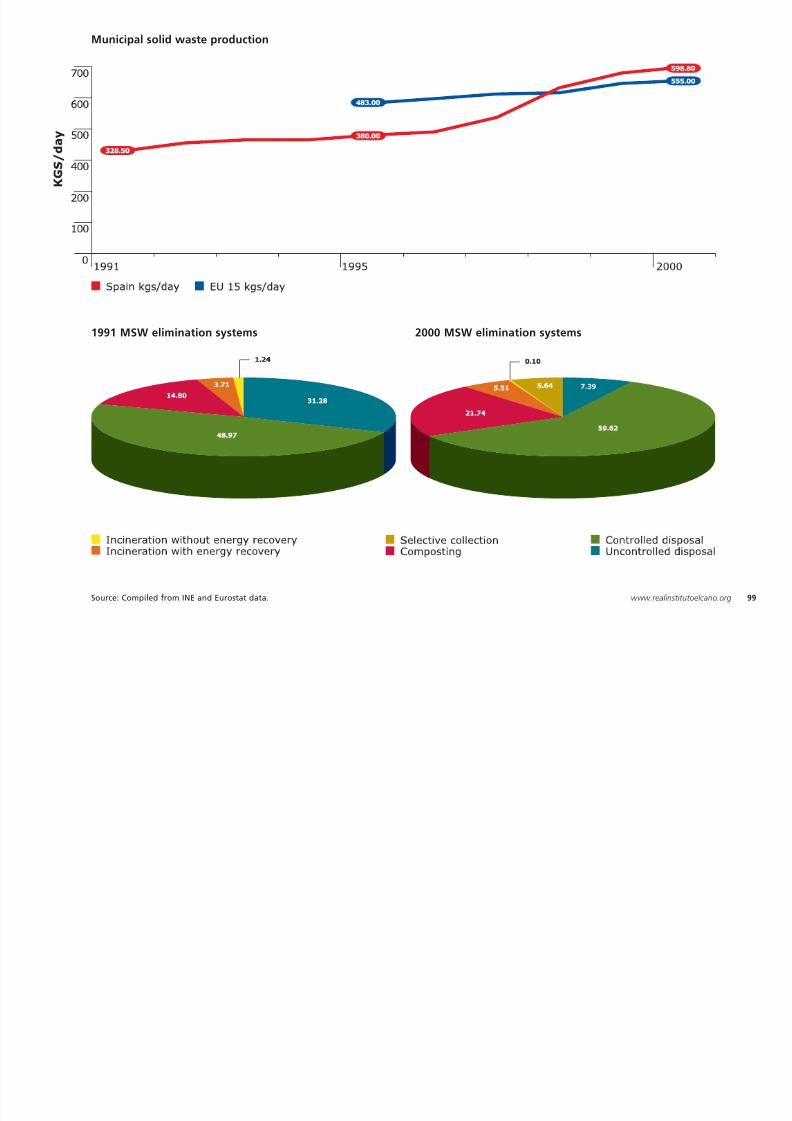
20. Waste
The growth in the Spanish economy has beenaccompanied by a significant rise in the produc-
tion of urban solid waste, which doubledbetween 1991 and 2000 and has exceeded the
8/3/2019 20 Years of Spain
http://slidepdf.com/reader/full/20-years-of-spain 98/161
20 Years of Spain in the European Union98
between 1991 and 2000 and has exceeded theEU 15 average since 1998. Nevertheless, Spainhas also made remarkable efforts to improvethe elimination and recycling of this waste.Between 1991 and 2000, uncontrolled wastedisposal fell from 31% to 7%, while controlledwaste disposal rose from 49% to 60%. This hasbeen facilitated by greater public awareness of
the need to promote sustainable developmentand protect the environment, values that havebeen strongly influenced by membershipof the EU.
Municipal solid waste production
8/3/2019 20 Years of Spain
http://slidepdf.com/reader/full/20-years-of-spain 99/161
Source: Compiled from INE and Eurostat data. 99www.realinstitutoelcano.org
1991 MSW elimination systems 2000 MSW elimination systems
8/3/2019 20 Years of Spain
http://slidepdf.com/reader/full/20-years-of-spain 100/161
20 Years of Spain in the European Union100
Politics:20 facts for 20 years
8/3/2019 20 Years of Spain
http://slidepdf.com/reader/full/20-years-of-spain 101/161
101www.realinstitutoelcano.org
Politics:20 facts for 20 years
1. Support for the process of integration
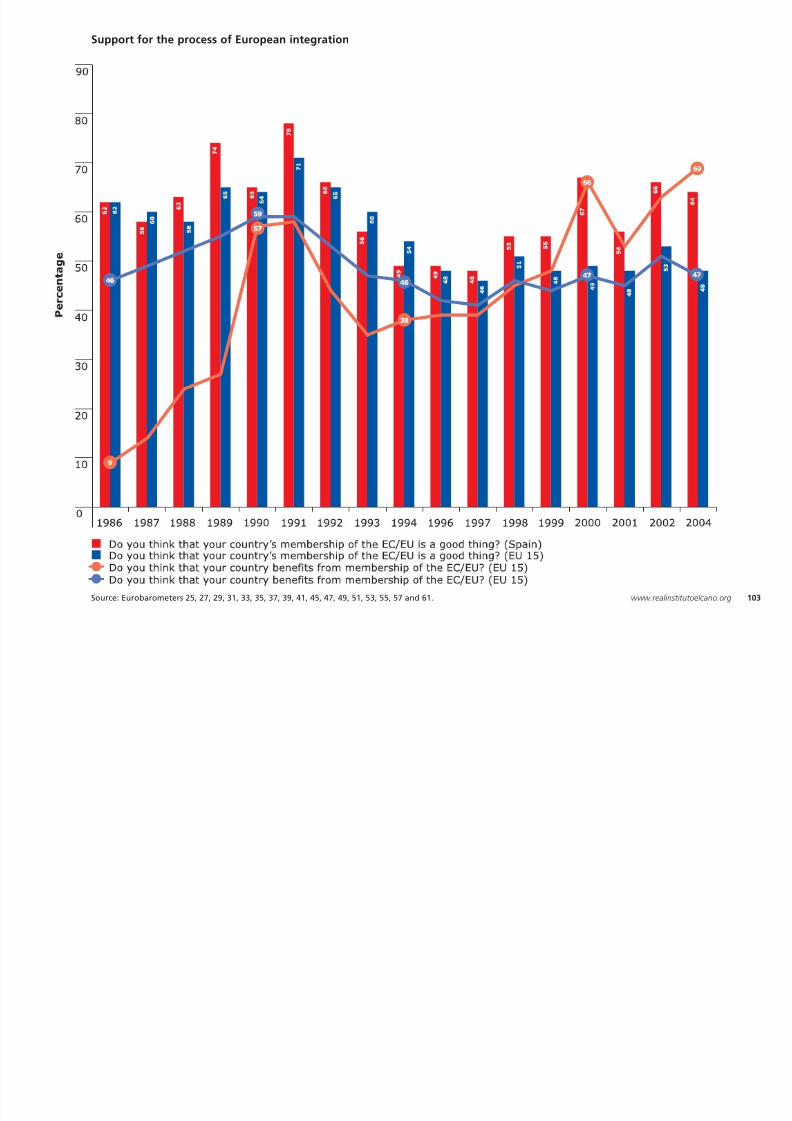
Proof of the extent to which the Europeanproject and the national project have been the
two sides of the same coin is the fact thatSpaniards’ support for the process of Europeani i h l b h hi h
small minority (scarcely 9%) believed that it waseconomically beneficial for Spain. Subsequently,
as time has passed, the people of Spain havebegun to see clearly the benefits of integration,
h h d h l i
8/3/2019 20 Years of Spain
http://slidepdf.com/reader/full/20-years-of-spain 102/161
20 Years of Spain in the European Union102
integration has always been among the highestin the Union. With the exception of the 1993-1994 period, characterised by a difficulteconomic situation in Spain, pro-Europeansentiment in Spain has always been above theEuropean average. This was particularly evidentin the years immediately after accession, but
also, and very importantly, in the period thatbegan in 1998, coinciding with Spain’s integra-tion in the third stage of the Economic andMonetary Union. The solidity of the support forthe integration process is such that during theyears immediately after accession Spaniardssupported the process even when only a very
to the extent that today an overwhelmingmajority (64%) believes that Spain benefitsfrom European integration (which puts Spain22 points over the European average). Similarly,support for the process of integration is now 16points higher than the European average, afigure that is not just the highest achieved in
these last 20 years, but one that puts Spain wayahead of some of its key partners, such asGermany, France, Italy or the United Kingdom.
Support for the process of European integration
8/3/2019 20 Years of Spain
http://slidepdf.com/reader/full/20-years-of-spain 103/161
Source: Eurobarometers 25, 27, 29, 31, 33, 35, 37, 39, 41, 45, 47, 49, 51, 53, 55, 57 and 61. 103www.realinstitutoelcano.org
2. Feeling European
For reasons connected to both our recenthistory and the very visible benefits generated
by the process of European integration,Spaniards’ level of identification with Europe isvery high While in other EU Member States
the above confirms the notion that Europeanidentity, vital in terms of support for the
integration project, is fuelled by both historicalexperiences and values and the tangible bene-fits generated by integration In the last two
8/3/2019 20 Years of Spain
http://slidepdf.com/reader/full/20-years-of-spain 104/161
20 Years of Spain in the European Union104
very high. While in other EU Member StatesEuropean identity is poor or shaky, almost 65%of the Spanish population shows signs of identi-fying with Europe, which puts it 10 pointsabove the European average (EU 15). Spain’ssuccessful integration into the Union hasundoubtedly reinforced this feeling, and the
years of economic prosperity in particular swellthe ranks of pro-Europeans. Specifically, Spain’sparticipation in the euro clearly had aremarkable impact, as it was during the years1999-2000 that the highest level of identifica-tion with Europe (76%) was recorded. All of
fits generated by integration. In the last twoyears, however, coinciding with the crisissurrounding the negotiation and ratification ofthe Treaty establishing a Constitution forEurope, the feelings of identification withEurope have lessened somewhat in Spain, tothe extent that in the EU-25, European identity
among Spaniards is barely 60%, slightly abovethe average.
People who feel European (EU 15)
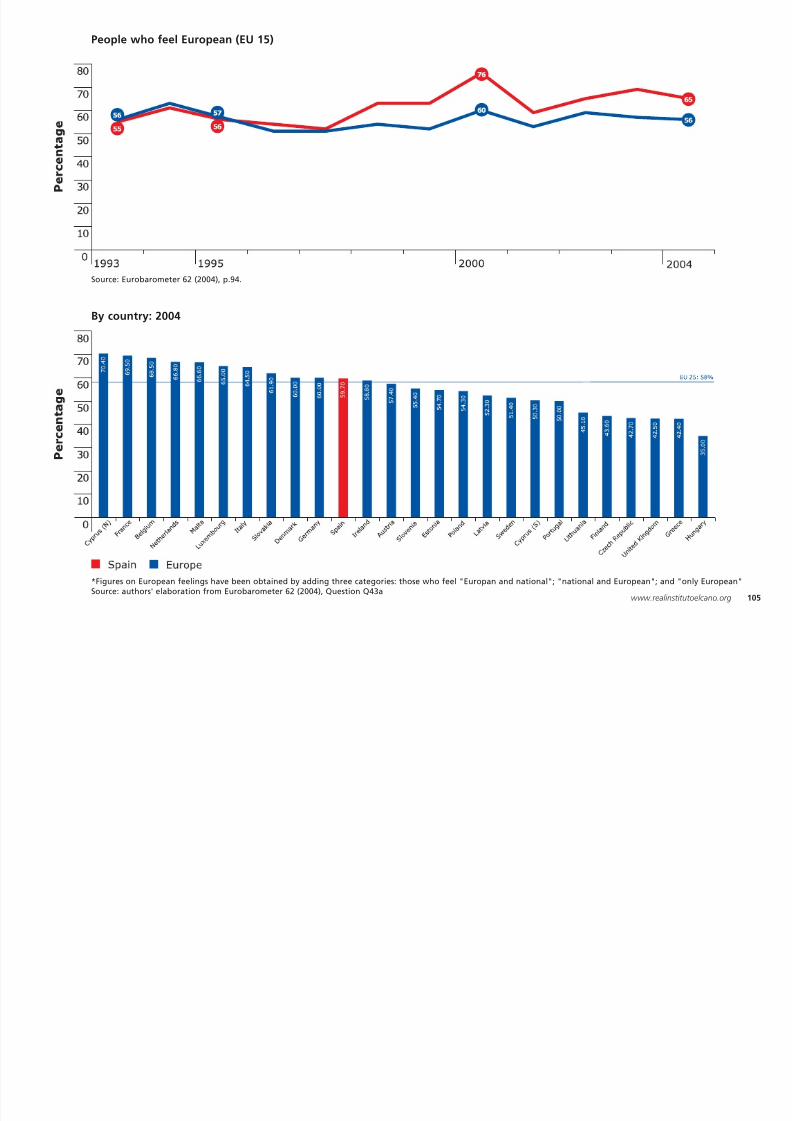
8/3/2019 20 Years of Spain
http://slidepdf.com/reader/full/20-years-of-spain 105/161
*Figures on European feelings have been obtained by adding three categories: those who feel "Europan and national"; "national and European"; and "only European"Source: authors' elaboration from Eurobarometer 62 (2004), Question Q43a
105www.realinstitutoelcano.org
Source: Eurobarometer 62 (2004), p.94.
By country: 2004
3. Confidence in the European institutions
Spaniards’ confidence in the European institu-tions is among the highest in the Union. From
an initial level comparable to that of the otherMember States, confidence in the Europeaninstitutions has grown steadily from the 1990s
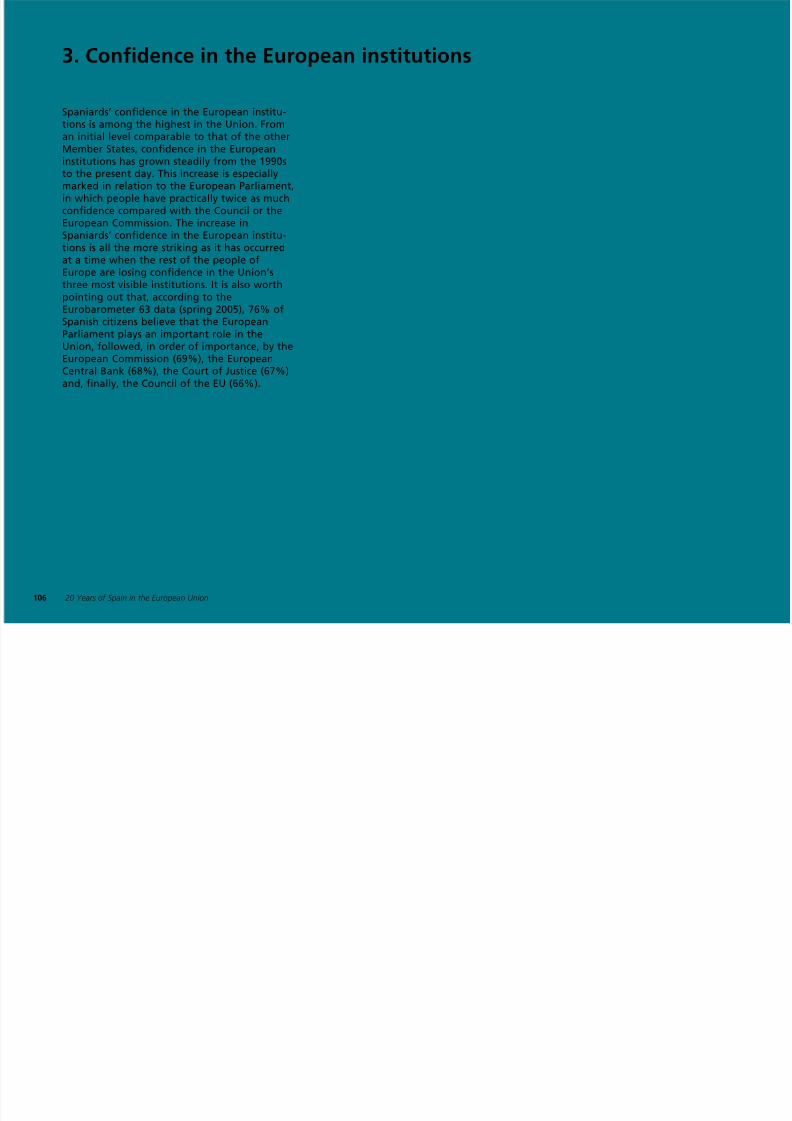
8/3/2019 20 Years of Spain
http://slidepdf.com/reader/full/20-years-of-spain 106/161
20 Years of Spain in the European Union106
institutions has grown steadily from the 1990sto the present day. This increase is especiallymarked in relation to the European Parliament,in which people have practically twice as muchconfidence compared with the Council or theEuropean Commission. The increase inSpaniards’ confidence in the European institu-
tions is all the more striking as it has occurredat a time when the rest of the people ofEurope are losing confidence in the Union’sthree most visible institutions. It is also worthpointing out that, according to theEurobarometer 63 data (spring 2005), 76% ofSpanish citizens believe that the EuropeanParliament plays an important role in theUnion, followed, in order of importance, by the
European Commission (69%), the EuropeanCentral Bank (68%), the Court of Justice (67%)and, finally, the Council of the EU (66%).
Confidence in the European institutions
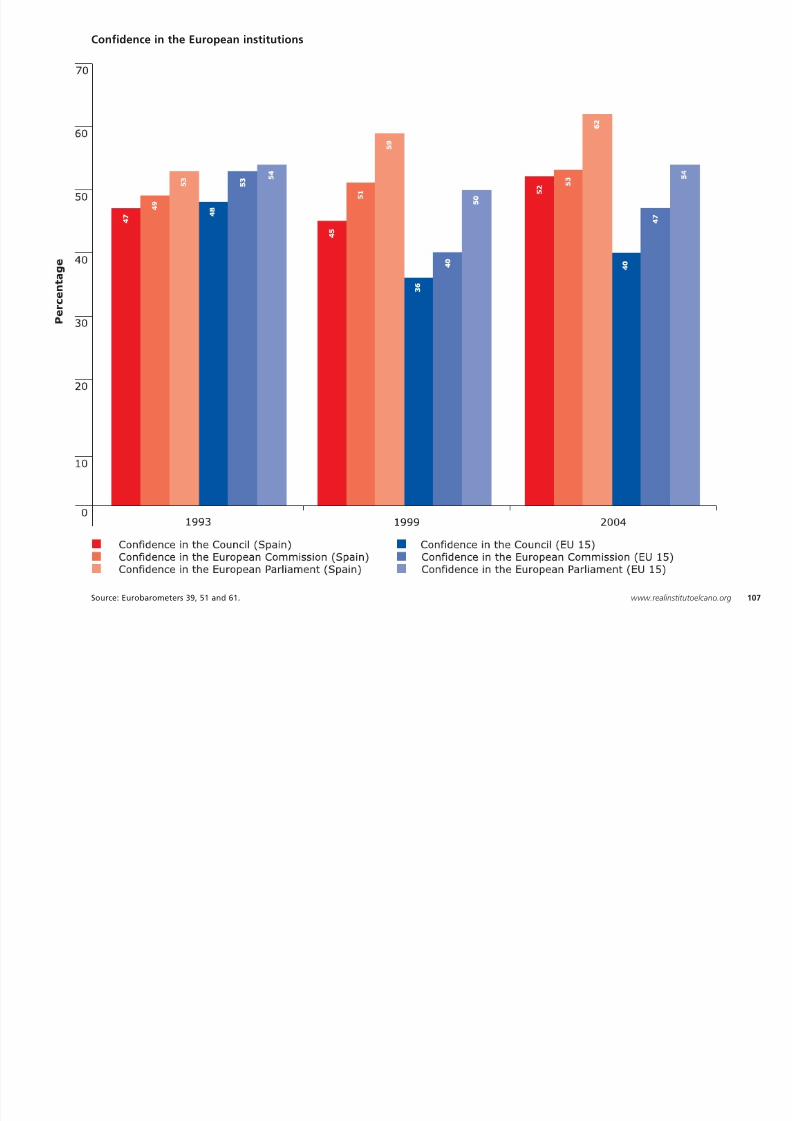
8/3/2019 20 Years of Spain
http://slidepdf.com/reader/full/20-years-of-spain 107/161
Source: Eurobarometers 39, 51 and 61. 107www.realinstitutoelcano.org
4. Deepening / enlarging
It is often said that there is an ambiguous, ifnot contradictory, relationship between enlarg-
ing and deepening. Nonetheless, the generalpublic in Spain does not seem to share thatassessment as it is seems decidedly in favour of
integration, while only one out of every four[sic] is openly opposed to it. In Spain, this figure
is 10 points higher than the average, since 68%of the people are in favour of political integra-tion, this figure having peaked at 74% in 2004
8/3/2019 20 Years of Spain
http://slidepdf.com/reader/full/20-years-of-spain 108/161
20 Years of Spain in the European Union108
both the process of deepening the Europeanproject and its enlargement to include othercountries. Thus, support among Spaniards forthe most recent EU enlargement to include theCentral and Eastern European Countries, inparticular for historical reasons and out of a
sense of solidarity, is the second highest in theUnion. Only Greece demonstrates greateraverage net support for the enlargement, dueprimarily to that country’s particular interest inthe accession of Cyprus. As regards politicalintegration, approximately one out of every sixEuropeans [sic] wants to see political
(Eurobarometer 62). In addition, according tothe Eurobarometer 63 data (spring 2005), thenumber of Eurosceptics in Spain is considerablylower than the European average (13% com-pared with 28%). The pro-European sentimentamong Spaniards was evident once again
during the recent process involving the prepara-tion of the European Constitution, which wassupported by 72% of the population, comparedwith the European average of 68%.
Support for the European Constitution
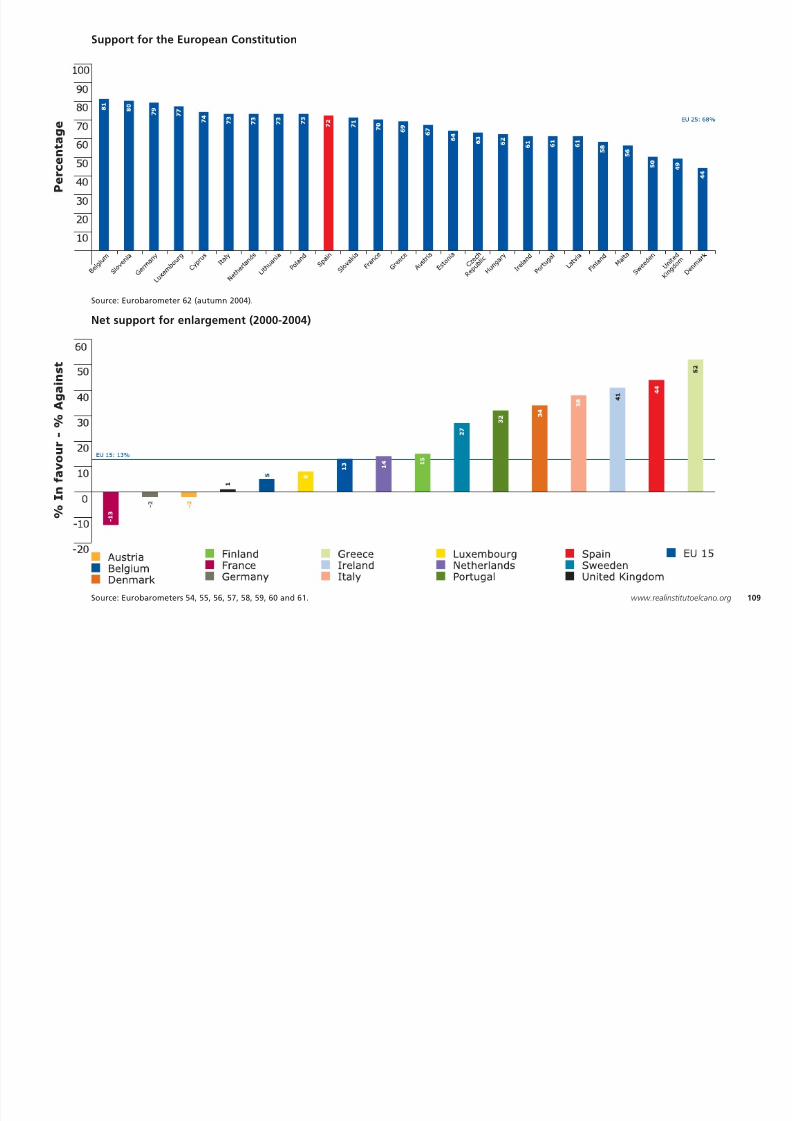
8/3/2019 20 Years of Spain
http://slidepdf.com/reader/full/20-years-of-spain 109/161
Net support for enlargement (2000-2004)
Source: Eurobarometers 54, 55, 56, 57, 58, 59, 60 and 61. 109www.realinstitutoelcano.org
Source: Eurobarometer 62 (autumn 2004).
5. The role of the European Union in the world
Support for the common foreign and securitypolicy (CFSP) in the European Union is very high,
sitting at levels of around 66% for the EU 15and 75% for the 10 new members. Support iseven higher in relation to the security andd f li ith l l t d 75% i th
by autumn 2001 this figure had risen to 77%,6 points above the European average
(Eurobarometers 32 and 56). Similarly, thepercentage of Spaniards who were in favour ofthe defence policy being determined jointly
ith th EC f 38% t 51% i th i d

8/3/2019 20 Years of Spain
http://slidepdf.com/reader/full/20-years-of-spain 110/161
20 Years of Spain in the European Union110
defence policy, with levels at around 75% in theEU 15 and 85% in the 10 new members(Eurobarometer 63, spring 2005). As far as Spainis concerned, a reflection, and at the same timea consequence, of the high levels of satisfactionand identification with Europe held among
Spaniards, is their ever-clearer preference forgranting the European Union substantialcompetences in the area of foreign policy,security and defence. In 1989 only 58% of theSpanish people believed that foreign policyshould be determined jointly with the EC, but
with the EC rose from 38% to 51% in the periodbetween 1994 and 2001 (Eurobarometers 41 and56). The graphs demonstrate how support forboth the common foreign and security policy(CFSP) and the European Security and DefencePolicy (ESDP) has not only increased steadily in
recently years but has also grown faster than inother Member States, which has resulted in69% and 70% support for the CFSP and ESDPrespectively.
Support for the common foreign and security policy
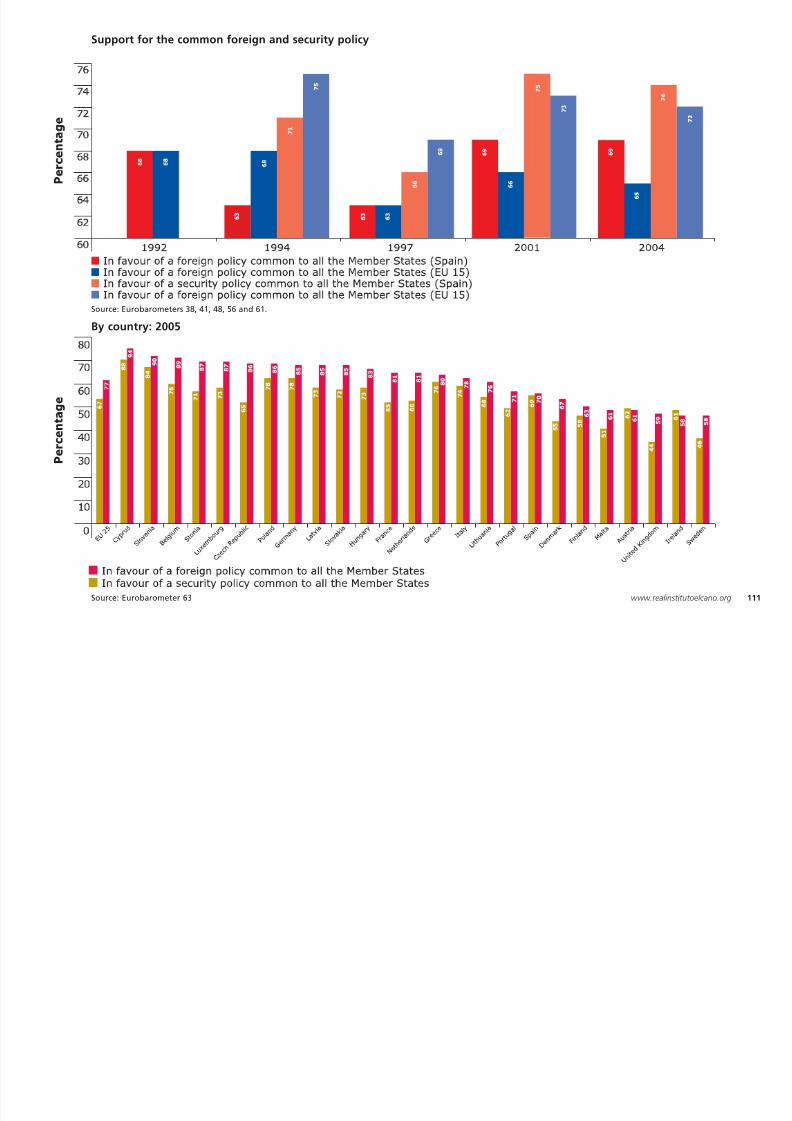
8/3/2019 20 Years of Spain
http://slidepdf.com/reader/full/20-years-of-spain 111/161
Source: Eurobarometer 63 111www.realinstitutoelcano.org
Source: Eurobarometers 38, 41, 48, 56 and 61.
By country: 2005
6. Political culture
Democratisation and European integration havealways been closely linked in Spain. Historically,
Europeanisation was always seen as somethingthat would finally enable Spain to consolidateits democratic institutions and overcome a pastmarked by divisions internal conflicts and
of Spain is today unquestionable. Proof of thiscame in 1994-1995 when the political crisis
marked by the end of the cycle of Socialist PartyGovernments (1982-1996) saw the indicators ofsatisfaction with the functioning of democracyfall below 40%; however the preference for
8/3/2019 20 Years of Spain
http://slidepdf.com/reader/full/20-years-of-spain 112/161
20 Years of Spain in the European Union112
marked by divisions, internal conflicts andauthoritarianism. Looking back, it is evidentthat these hopes were well-founded given thatthe democratic period that began with the 1978Constitution is the longest in Spain’s history.Nevertheless, when Spain applied to join the
(then) European Community in 1977, our part-ners in the Community wondered if a countrylike Spain, with a limited democratic tradition,would be capable of developing and consolidat-ing stable democratic institutions. Nevertheless,the data from the Centre for SociologicalResearch (CIS) demonstrates that in the last 20years democracy has been overwhelminglyestablished as the only feasible option for
Spanish society. The solidity of the political cul-ture and democratic preferences of the people
fall below 40%; however, the preference fordemocracy as the form of government remainedunchanged and maintained particularly strongsupport (around 80%). The Spanish people’ssupport for the democratic system has beenconsolidated by Spain’s membership of the EU:
in 1984 it was the preferred option of 69% ofSpaniards, but this figure had risen to morethan 84% by 2004. Support for decentralisationto the autonomous communities has alsocontinued to grow, rising from 56% to over 74%.
Satisfaction with the political system
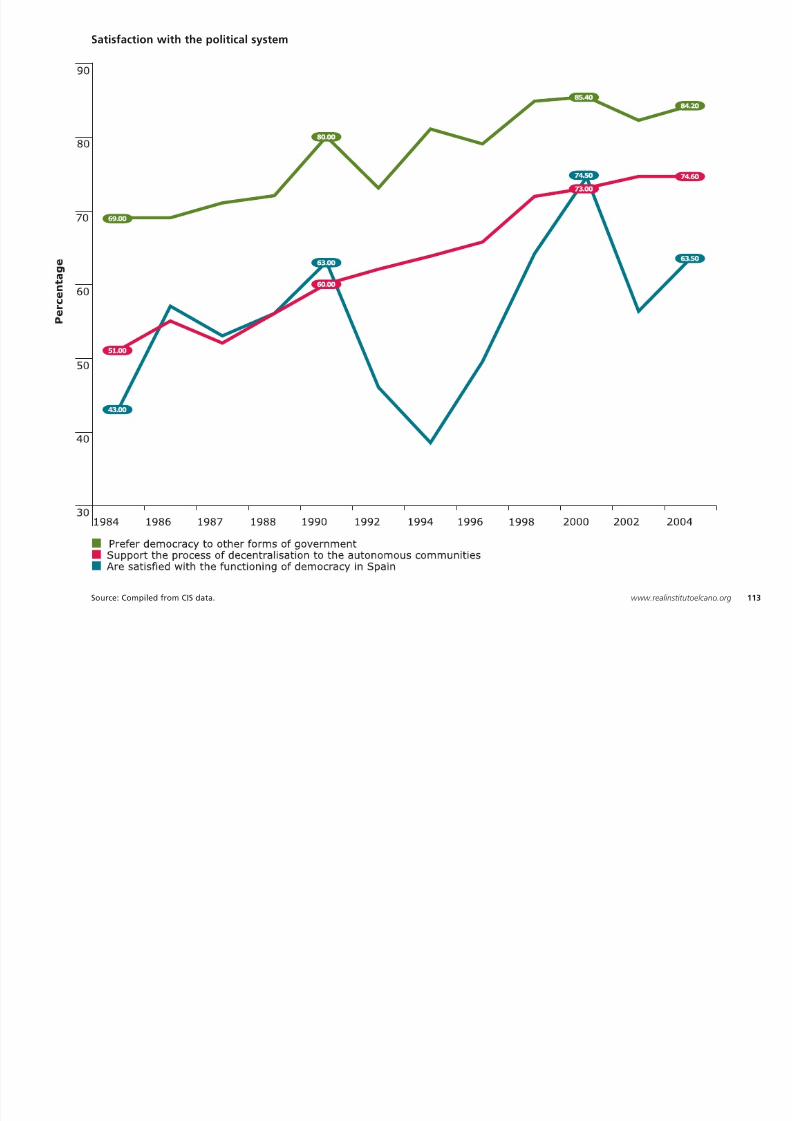
8/3/2019 20 Years of Spain
http://slidepdf.com/reader/full/20-years-of-spain 113/161
Source: Compiled from CIS data. 113www.realinstitutoelcano.org
7. Descentralización
Spain’s recent history is also the history of afar-reaching process of political and adminis-
trative decentralisation in a country tradition-ally characterised by centralism.Decentralisation has posed a challenge ofenormous magnitude, the importance of which
almost 1,200,000 employees, the autonomouscommunities have twice as many civil servants
as the General State Administration. It is there-fore possible to declare without any doubtthat the autonomous system established in the1978 Constitution has made it possible to deal
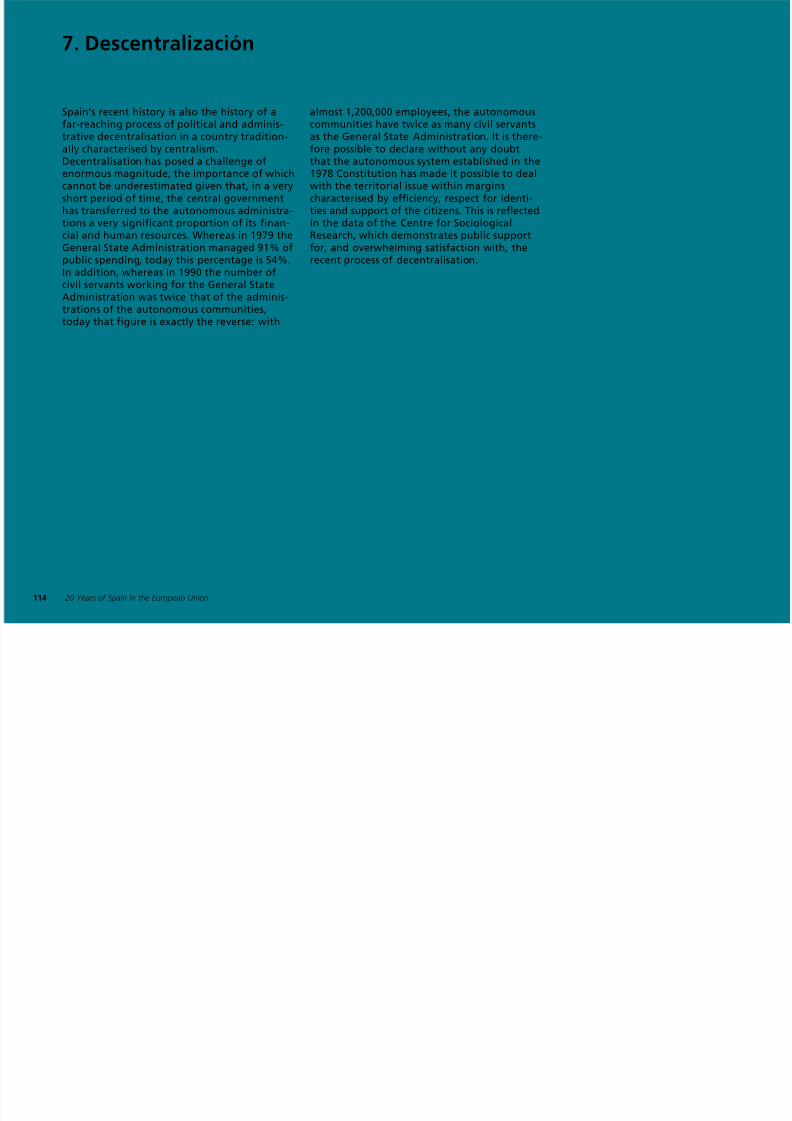
8/3/2019 20 Years of Spain
http://slidepdf.com/reader/full/20-years-of-spain 114/161
20 Years of Spain in the European Union114
enormous magnitude, the importance of whichcannot be underestimated given that, in a veryshort period of time, the central governmenthas transferred to the autonomous administra-tions a very significant proportion of its finan-cial and human resources. Whereas in 1979 the
General State Administration managed 91% ofpublic spending, today this percentage is 54%.In addition, whereas in 1990 the number ofcivil servants working for the General StateAdministration was twice that of the adminis-trations of the autonomous communities,today that figure is exactly the reverse: with
1978 Constitution has made it possible to dealwith the territorial issue within marginscharacterised by efficiency, respect for identi-ties and support of the citizens. This is reflectedin the data of the Centre for SociologicalResearch, which demonstrates public support
for, and overwhelming satisfaction with, therecent process of decentralisation.
Distribution of public spending between the levels of government
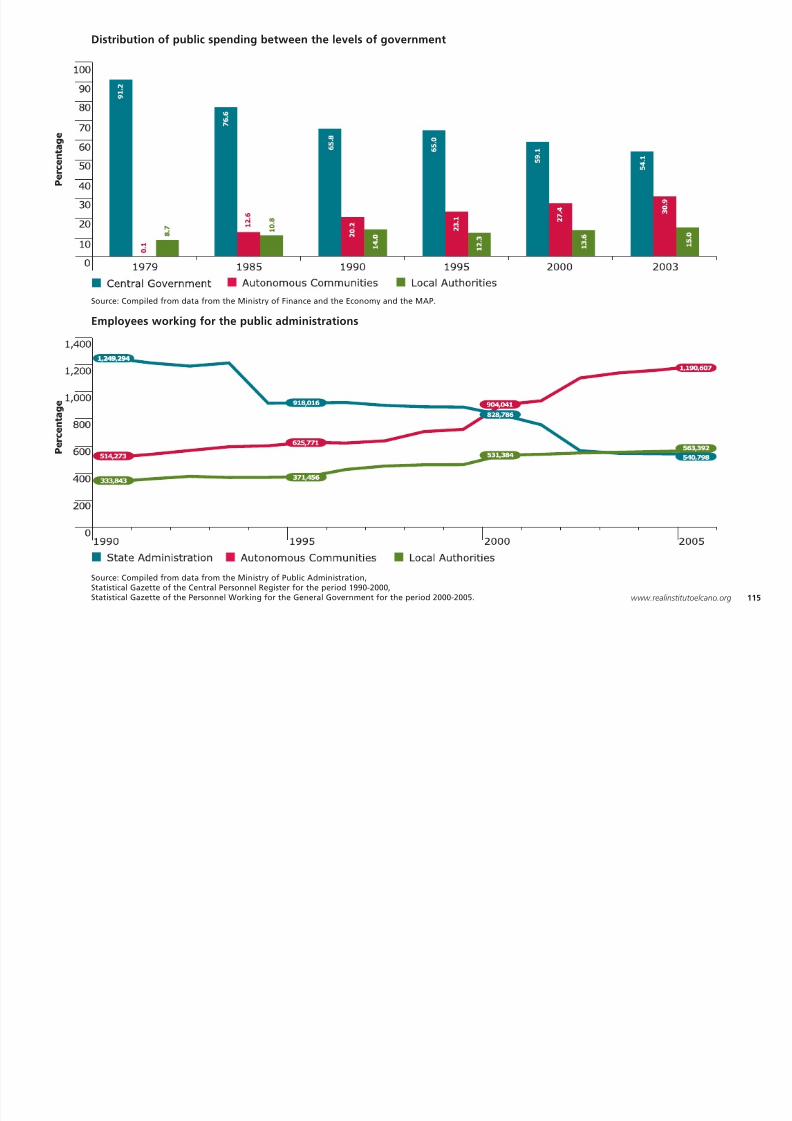
8/3/2019 20 Years of Spain
http://slidepdf.com/reader/full/20-years-of-spain 115/161
Source: Compiled from data from the Ministry of Public Administration,Statistical Gazette of the Central Personnel Register for the period 1990-2000,Statistical Gazette of the Personnel Working for the General Government for the period 2000-2005. 115www.realinstitutoelcano.org
Employees working for the public administrations
Source: Compiled from data from the Ministry of Finance and the Economy and the MAP.
8. Change in values
In societies facing economic or political crises,citizens’ concerns are usually dominated by
so-called ‘survival’ values. In order to obtaincomparable data for various countries, a so-ciety’s level of economic uncertainty in relationto the concern of inflation is usually measured,
societies, one the State is capable of guarantee-ing collective and individual security and stabi-
lising the economy, citizens’ tend to developactivities that give priority to so-called ‘post-materialist’ values that are closely related toaspects such as the enjoyment of freedom, par-
8/3/2019 20 Years of Spain
http://slidepdf.com/reader/full/20-years-of-spain 116/161
20 Years of Spain in the European Union116
since, as we all know, inflation harms in particu-lar the most vulnerable people. In the sameway, citizens’ concerns about order being main-tained, whether these concerns relate to civilmatters or to crime and organised crime, also
clearly reflect the type of values that prevail inthe society. However, in more advanced
ticipation in politics, tolerance towards diversityand international solidarity. In the last 20 years,Spaniards’ concerns have gradually moved awayfrom the area of physical and economic securityand focused increasingly on postmaterialist
values (participating in politics or protecting thefreedom of expression).
Priority National Objective
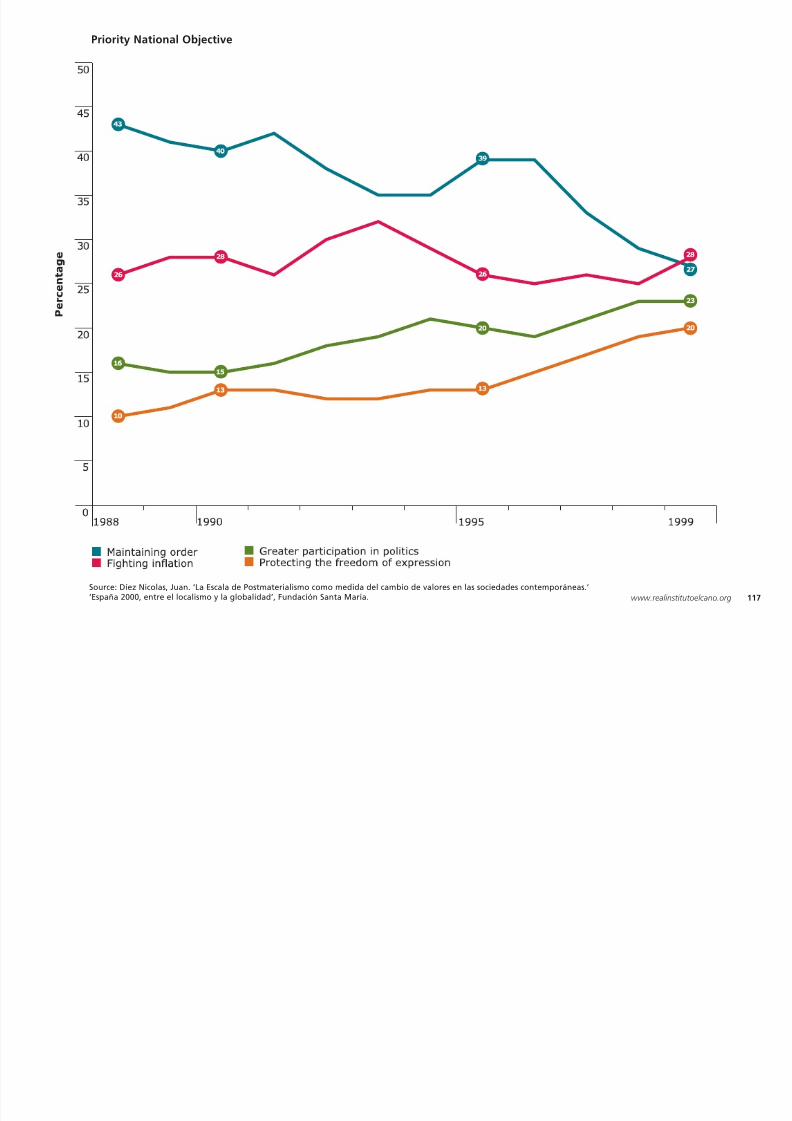
8/3/2019 20 Years of Spain
http://slidepdf.com/reader/full/20-years-of-spain 117/161
Source: Díez Nicolas, Juan. ‘La Escala de Postmaterialismo como medida del cambio de valores en las sociedades contemporáneas.’‘España 2000, entre el localismo y la globalidad’, Fundación Santa María. 117www.realinstitutoelcano.org
9. Women’s access to politics
Women’s participation in, and access to, politicsrepresent an excellent indicator of the extent to
which a society is modernised. According todata from the Inter-Parliamentary Union (IPU),on average women account for only 16.4% ofthe members of national parliaments world-
id (2006 d t ) N t ll th diff
Scandinavian countries and ahead of statesnormally considered to be less traditional than
Spain when it comes to gender, such asGermany and France. Comparatively speaking,this means that Spain has 5% more MEPs thanthe average in the European Parliament.M th d i t f th
8/3/2019 20 Years of Spain
http://slidepdf.com/reader/full/20-years-of-spain 118/161
20 Years of Spain in the European Union118
wide (2006 data). Naturally, the differences arestriking, with this percentage reaching 40% inScandinavia, but falling to just 8.3% in Arabstates. Special attention has obviously beenpaid to improving women’s representation in
the democratic institutions in Spain. As a result,Spain is in an excellent position: womenaccount for 36% of the members of theCongress of Deputies, which puts it in seventhplace in the world, only just behind the
Moreover, the progress made in terms of theimprovement in women’s representation in theparliaments of the autonomous communitieshas been even more dramatic, although thereare still considerable differences between
autonomous communities such as the ValencianCommunity and Castilla-La Mancha that arealmost at the same level, and others that hoveraround the 25% mark, which means that onlyone in four members of parliament is female.
Presence of women in parliament
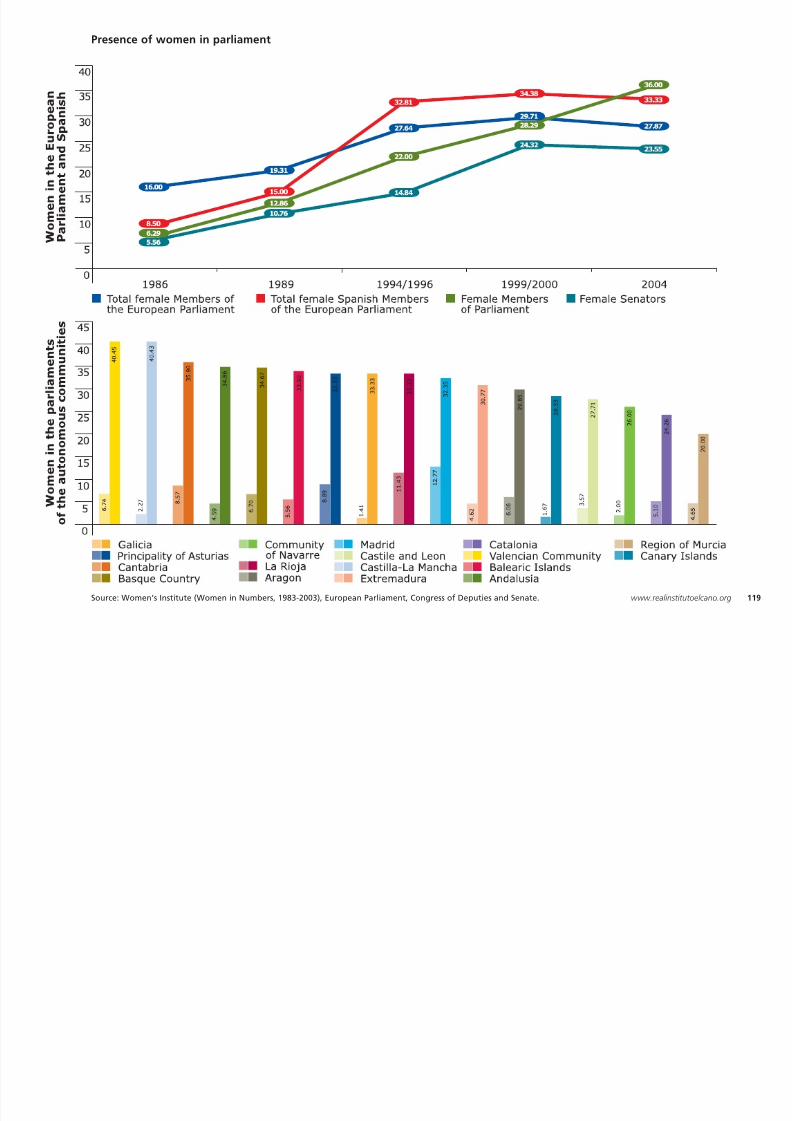
8/3/2019 20 Years of Spain
http://slidepdf.com/reader/full/20-years-of-spain 119/161
Source: Women’s Institute (Women in Numbers, 1983-2003), European Parliament, Congress of Deputies and Senate. 119www.realinstitutoelcano.org
10. Solidarity
The change in values in Spanish society is par-ticularly evident with regard to international
solidarity. In the short period of time that haspassed since 1991, private donations to non-governmental organisations for development(NGOD) have increased fivefold. There has alsobeen notable growth in recent years in the
account the efforts of all the European coun-tries and the Commission itself, the European
Union is today the largest donor of develop-ment assistance in the world, having donated atotal of EUR 35,000 million in 2004 (0.36% ofthe combined GDP of the EU 15), more thandouble what the United States donates (EUR
8/3/2019 20 Years of Spain
http://slidepdf.com/reader/full/20-years-of-spain 120/161
20 Years of Spain in the European Union120
been notable growth in recent years in thephenomenon of voluntary service and a steadyrise in the number of salaried staff employedby NGOs specialising in development issues.Moreover, there has been a very significant
increase of late in the contributions from thepublic administrations, both at State level andat regional and local level, to the funding ofdevelopment-related actions. Taking into
double what the United States donates (EUR16,000 million, or 0.16% of its GDP).
Income of Spanish NGOs
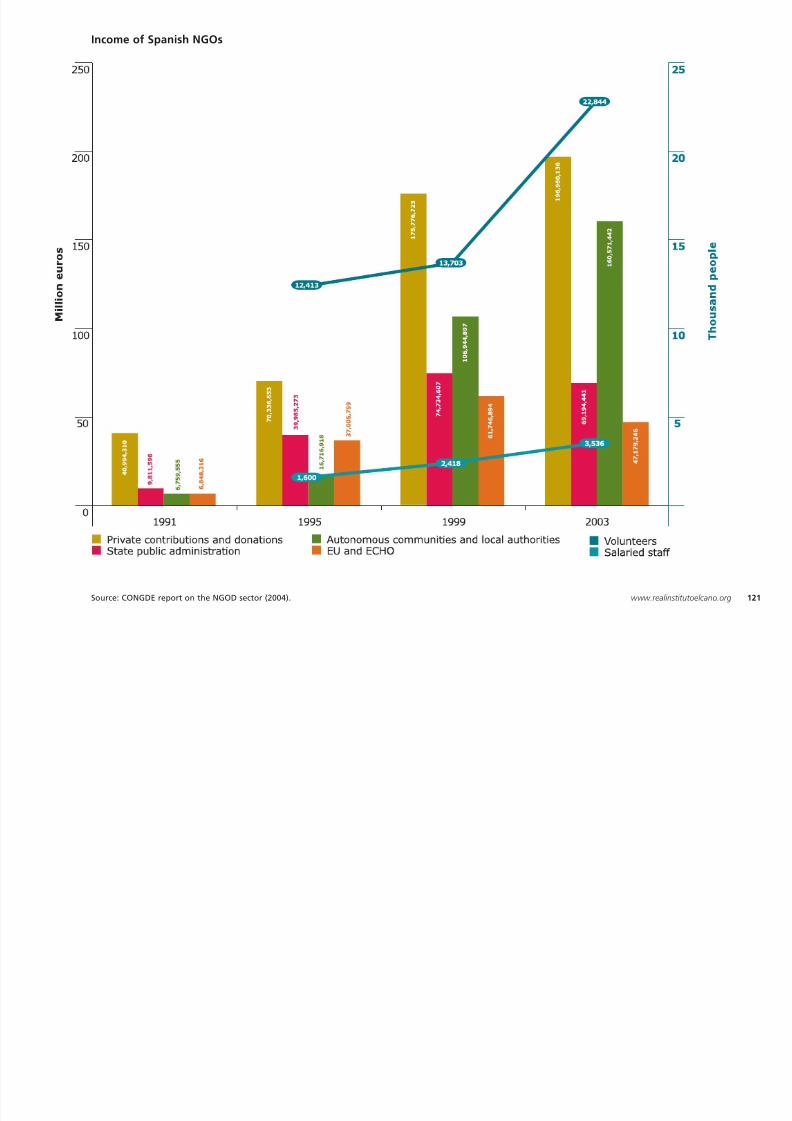
8/3/2019 20 Years of Spain
http://slidepdf.com/reader/full/20-years-of-spain 121/161
Source: CONGDE report on the NGOD sector (2004). 121www.realinstitutoelcano.org
8/3/2019 20 Years of Spain
http://slidepdf.com/reader/full/20-years-of-spain 122/161
Official Development Assistance
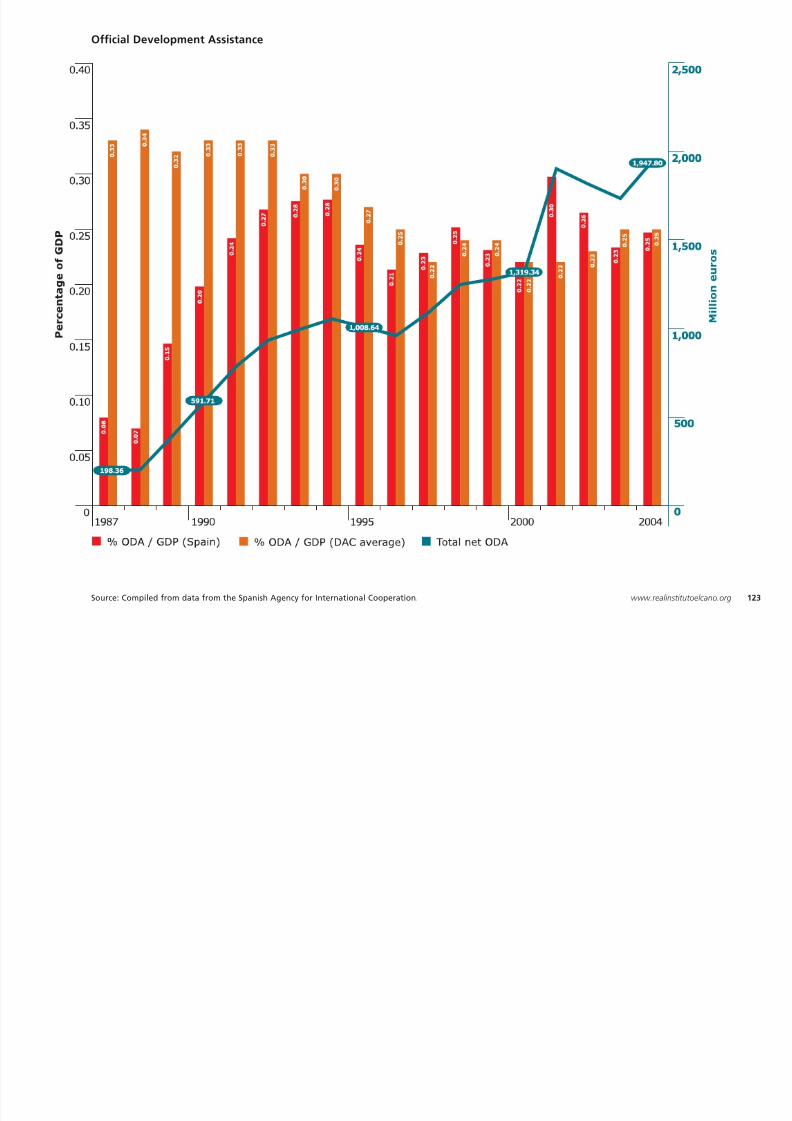
8/3/2019 20 Years of Spain
http://slidepdf.com/reader/full/20-years-of-spain 123/161
Source: Compiled from data from the Spanish Agency for International Cooperation. 123www.realinstitutoelcano.org
12. Commitment to development
Multilateral institutions constantly assessdeveloping countries in terms of their economicpolicies, democratic development, social policiesand much more. From the opposite perspective,in order to asses the commitment to develop-ment of the most advanced countries, theCentre for Global Development (CGD), an in-
the use and transfer of new technologies. Spainoccupies 17th place among the donors in thisIndex. Nevertheless, the most important aspectis that Spain is one of the countries that hasmade most efforts in recent years (taking intoaccount that the efforts made since 2004 havenot yet been incorporated in the latest index).
8/3/2019 20 Years of Spain
http://slidepdf.com/reader/full/20-years-of-spain 124/161
20 Years of Spain in the European Union124
dependent foundation based in the UnitedStates, has created the ‘Commitment toDevelopment Index’), a hugely useful instru-ment that evaluates countries’ development
cooperation policies as a whole using variouscriteria: level of Official Development Assistance(ODA); market access for exports from develop-ing countries; policies on foreign investment;immigration policies; environmental policies;foreign and security policies; and support for
In addition, the CGD highlights various areasin which improvements are still necessary: thelevel of assistance remains low in relation toincome and part of the assistance is still ‘tied’
through trade credits. However, the CGDhighlights Spain’s open markets, its policy ofpromoting foreign investment, its regularisationprocesses for illegal immigrants and its policiesfor the dissemination of information, knowledgeand new technologies.
Commitment to Development Index broken down into sections
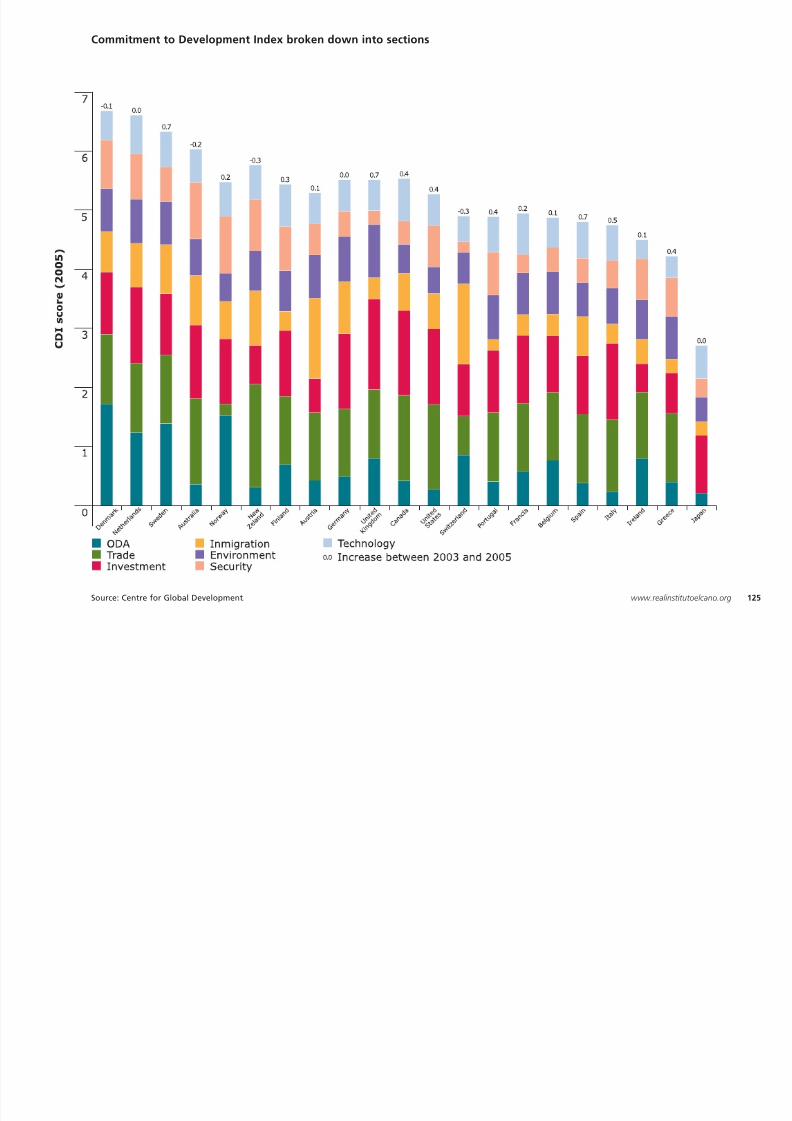
8/3/2019 20 Years of Spain
http://slidepdf.com/reader/full/20-years-of-spain 125/161
Source: Centre for Global Development. 125www.realinstitutoelcano.org
13. Deployment abroad
In the last 20 years, Spain has built up an impor-tant global presence. The number of embassies,consulates, trade offices and representations inmultilateral bodies reflects a global vocationthat contrasts notably with a recent pastcharacterised by isolationism. Between 1985and 1995 Spain opened 13 embassies and
l t t hi h dd d f th 18
other categories of Spanish representativesabroad, from trade advisers to civil servants inthe various international bodies (UN, WorldBank, IMF, NATO, etc.) have experienced asignificant increase, and today there are 3,134Spanish officials working in international bodies(three quarters of whom – 2,365 – work for theE U i ) All i ll S i h t i d t
8/3/2019 20 Years of Spain
http://slidepdf.com/reader/full/20-years-of-spain 126/161
20 Years of Spain in the European Union126
consulates, to which were added a further 18between 1995 and 2005, the majority in thenew EU Member States. Spain’s deploymentabroad now totals 115 embassies, 87 consulates
general and 30 missions in international bodies.In addition, between 1985 and 2005 the totalnumber of diplomats rose by almost 25%, from674 in 1985 to 838 in 2005. Finally, all of the
European Union). All in all, Spain has strived tobroaden and consolidate its foreign deploy-ment in order to adjust it to the level of amiddle power with increasing international
influence at both a political and an economic level.
Deployment abroad
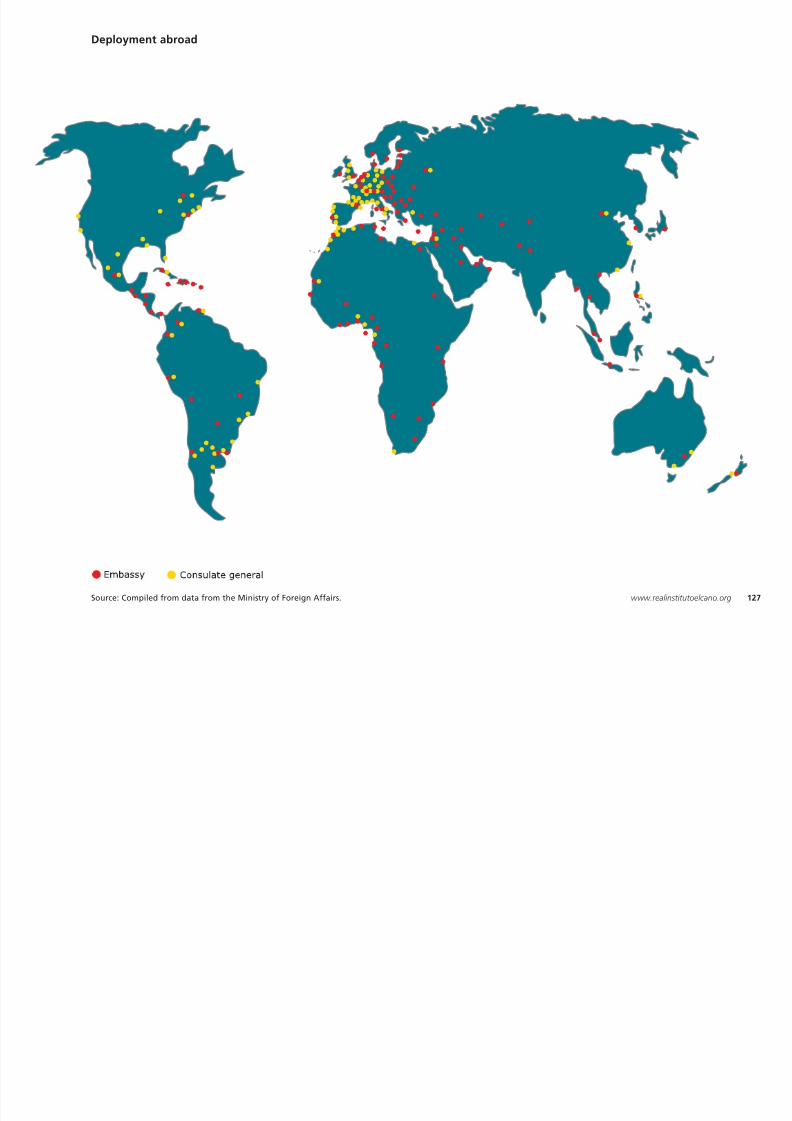
8/3/2019 20 Years of Spain
http://slidepdf.com/reader/full/20-years-of-spain 127/161
Source: Compiled from data from the Ministry of Foreign Affairs. 127www.realinstitutoelcano.org
14. International missions
The participation of Spain’s armed forces in inter-national missions testifies to the fact that thevalues related to peacekeeping, humanitarianaid, aid for reconstruction and, in short, thedetermination to build a safer and moredemocratic world have been central to Spain’sforeign policy over the past 20 years. The com-plete Europeanisation of foreign policy has also
8/3/2019 20 Years of Spain
http://slidepdf.com/reader/full/20-years-of-spain 128/161
20 Years of Spain in the European Union128
plete Europeanisation of foreign policy has alsoimplied the presence of Spanish troops inunprecedented situations in Africa and Asia, aswell as the participation of Spanish troops inmissions under the auspices of both the UnitedNations and NATO. Between 1991 and 2005,almost 60,000 Spanish soldiers were deployedacross a total of 12 countries. In some cases,such as Bosnia and Herzegovina and Kosovo,Spain has been present on the ground withoutinterruption for many years. In addition,between 1989 and 2005, 618 army representa-tives have acted as international observers in
missions in almost 20 countries.
International missions
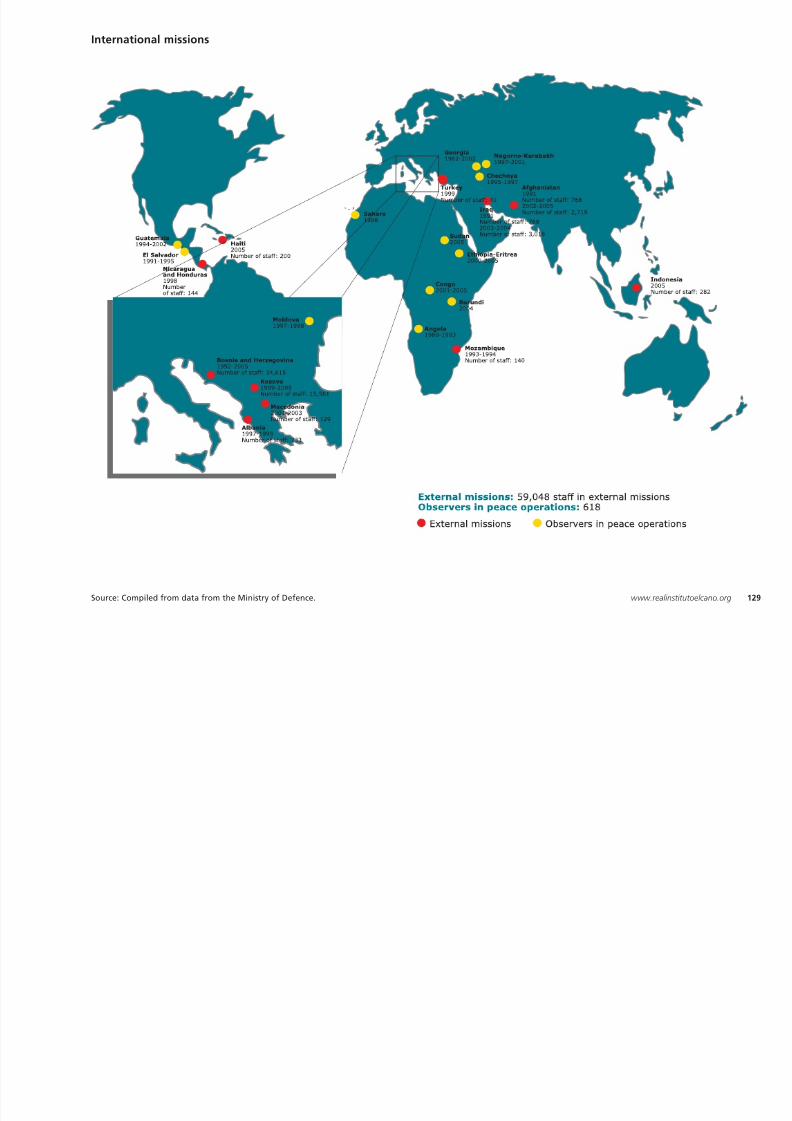
8/3/2019 20 Years of Spain
http://slidepdf.com/reader/full/20-years-of-spain 129/161
Source: Compiled from data from the Ministry of Defence. 129www.realinstitutoelcano.org
15. Modernisation of the armed forces
Spain’s accession to the Atlantic Alliancemarked the beginning of an important processof modernisation of its armed forces.Subsequently, the development of a commonsecurity and defence policy in the EU, whichtook its first steps at the end of the 1990s,established objectives in terms of the militarycapacities to be achieved within the Union,
structure in order to fulfil the establishedmissions and objectives. Similarly, although totaldefence expenditure continues to be low inrelation to other NATO countries (1.2% of GDPcompared with the NATO average of 2.5%), thepercentage of expenditure on equipment andmaterials has grown in order to respond to thisnew challenge. The result is that in the last 10
8/3/2019 20 Years of Spain
http://slidepdf.com/reader/full/20-years-of-spain 130/161
20 Years of Spain in the European Union130
capac t es to be ac e ed t t e U o ,known as the Helsinki Goal 2010, involvingSpain to a greater extent and helping tostrengthen these modernisation efforts. Thisadaptation process has implied importantchanges in terms of organisation and doctrine,command and control systems, and equipmentand training procedures, which now enableSpain’s armed forces to operate in a combinedunit under multinational mandate with thearmed forces of other countries. One of themost relevant aspects has been the changefrom a territorial structure to a functional
e c a e ge e esu t s t at t e ast 0years Spain has gone from having a conscriptarmy that was barely interoperable at interna-tional level to having a totally professionalarmy that is integrated in the multinationalstructures.
Defence expenditure used for modernisation
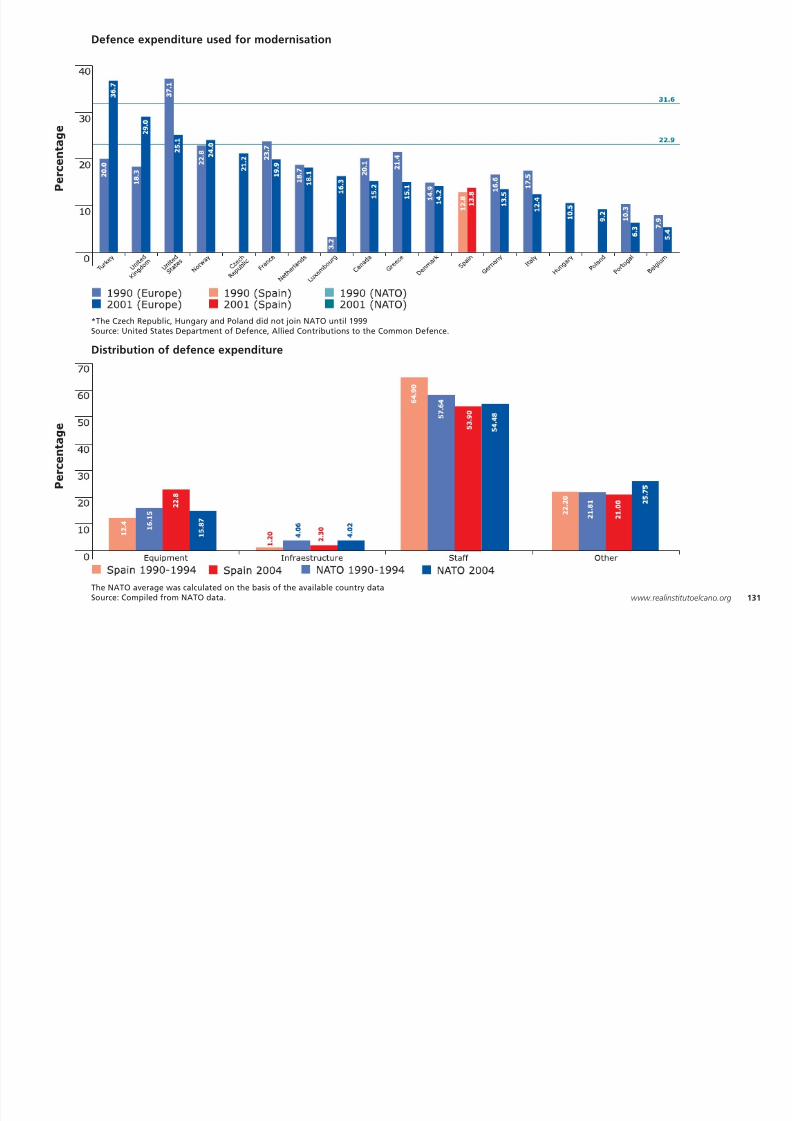
8/3/2019 20 Years of Spain
http://slidepdf.com/reader/full/20-years-of-spain 131/161
The NATO average was calculated on the basis of the available country dataSource: Compiled from NATO data. 131www.realinstitutoelcano.org
*The Czech Republic, Hungary and Poland did not join NATO until 1999Source: United States Department of Defence, Allied Contributions to the Common Defence.
Distribution of defence expenditure
16. Mujeres en las Fuerzas Armadas
Spain is the European country with the largestproportion of women in its armed forces:16,311 out of a total of 121,060 members,
which is equivalent to 13.5%. Women’s presencein the armed forces has increased dramaticallyin the last 15 years, from 0.1% in 1991 to 8.9%in 2000, and rose to 11.5% in 2005 and 13.5%today. Only Canada and the United States sur-
8/3/2019 20 Years of Spain
http://slidepdf.com/reader/full/20-years-of-spain 132/161
20 Years of Spain in the European Union132
pass Spain, with 16.9% and 15.5% respectively,while the European countries closest to Spainare France (12.8%), Holland (9%) and theUnited Kingdom (9%). Almost 70% of thewomen work in the army, 16% in the air force,11% in the navy and the other 3% in the jointbodies. Looking at the categories, 977 are offi-cers (5% of all officers), 200 are non-commis-sioned officers and 15,134 are members of thetroops and seawomen. In short, the Spanisharmed forces, in addition to becoming moreprofessional and more modern, have succeeded
in attracting and integrating a growing numberof women, putting Spain in a very favourableinternational position.
Women in the Spanish armed forces
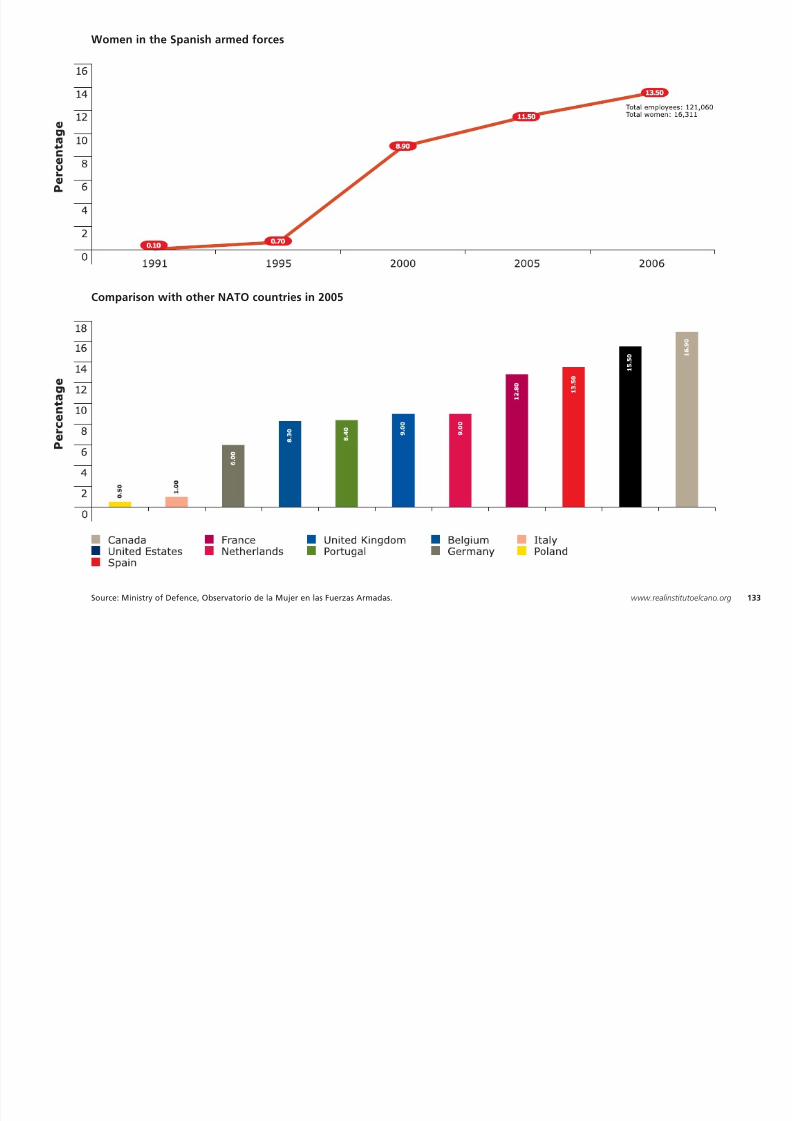
8/3/2019 20 Years of Spain
http://slidepdf.com/reader/full/20-years-of-spain 133/161
Source: Ministry of Defence, Observatorio de la Mujer en las Fuerzas Armadas. 133www.realinstitutoelcano.org
Comparison with other NATO countries in 2005
8/3/2019 20 Years of Spain
http://slidepdf.com/reader/full/20-years-of-spain 134/161
Institutos Cervantes around the world
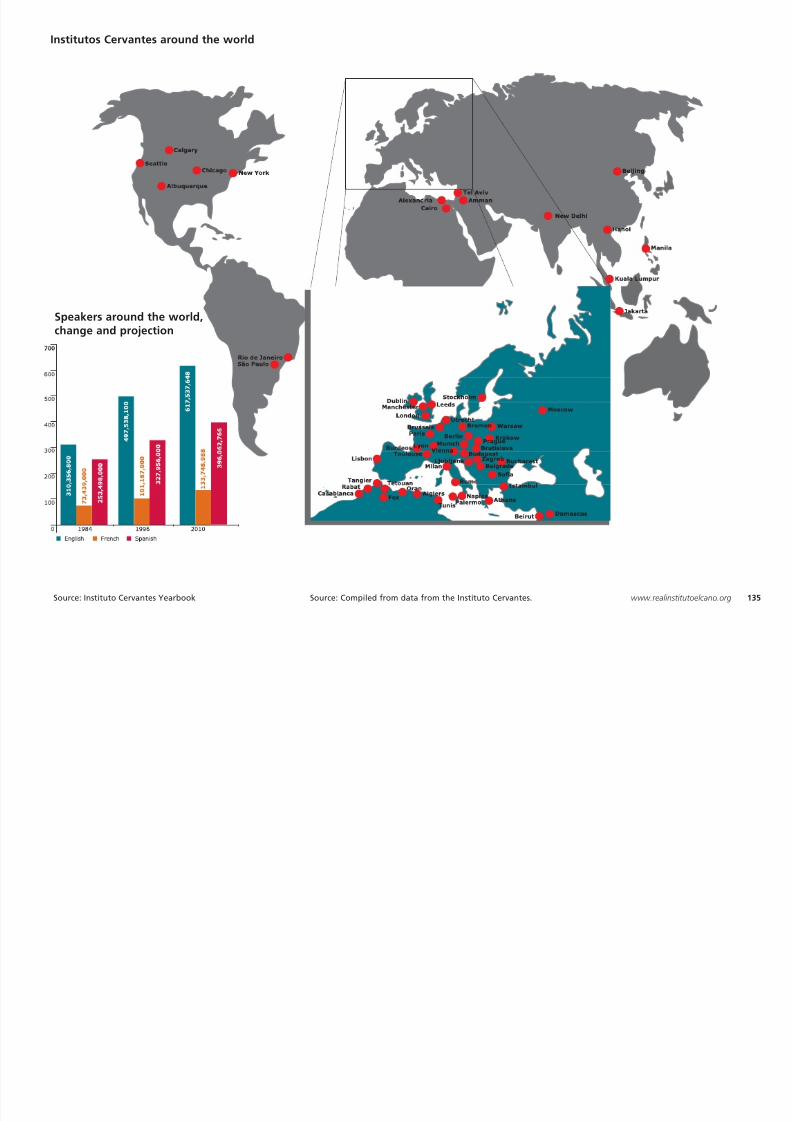
8/3/2019 20 Years of Spain
http://slidepdf.com/reader/full/20-years-of-spain 135/161
Source: Instituto Cervantes Yearbook 135www.realinstitutoelcano.orgSource: Compiled from data from the Instituto Cervantes.
Speakers around the world,change and projection
18. Spanish on the Internet
Although in the last decade the estimated num-ber of English-speaking Internet users has grownfrom 40 million to more than 300 million, the
proportion of Internet users who have English astheir first language has fallen from 51.3% to32% in the last five years, according to GlobalReach data. Although there were scarcely200,000 Spanish-speaking Internet users in 1996,this figure had risen to 80 million by 2005
English, the proportion of users whose firstlanguage is Spanish has risen in the last fiveyears, from 5.8% to 6%. Similarly, the propor-
tion of material in English on the Internet isfalling to the benefit of other languages,Spanish included. According to a recentFUNREDES study, this figure has fallen from 72%to 44%, while the proportion of pages inSpanish has doubled It is important to note
8/3/2019 20 Years of Spain
http://slidepdf.com/reader/full/20-years-of-spain 136/161
20 Years of Spain in the European Union136
this figure had risen to 80 million by 2005,representing one quarter of the linguisticcommunity on the Internet, surpassing evenGerman, French and Italian-speaking Internetusers. Contrary to what is happening with
Spanish has doubled. It is important to note,however, that whereas in 1998 there more than122 million web pages in English, there wereless than 3 million in Spanish.
Internet users by language
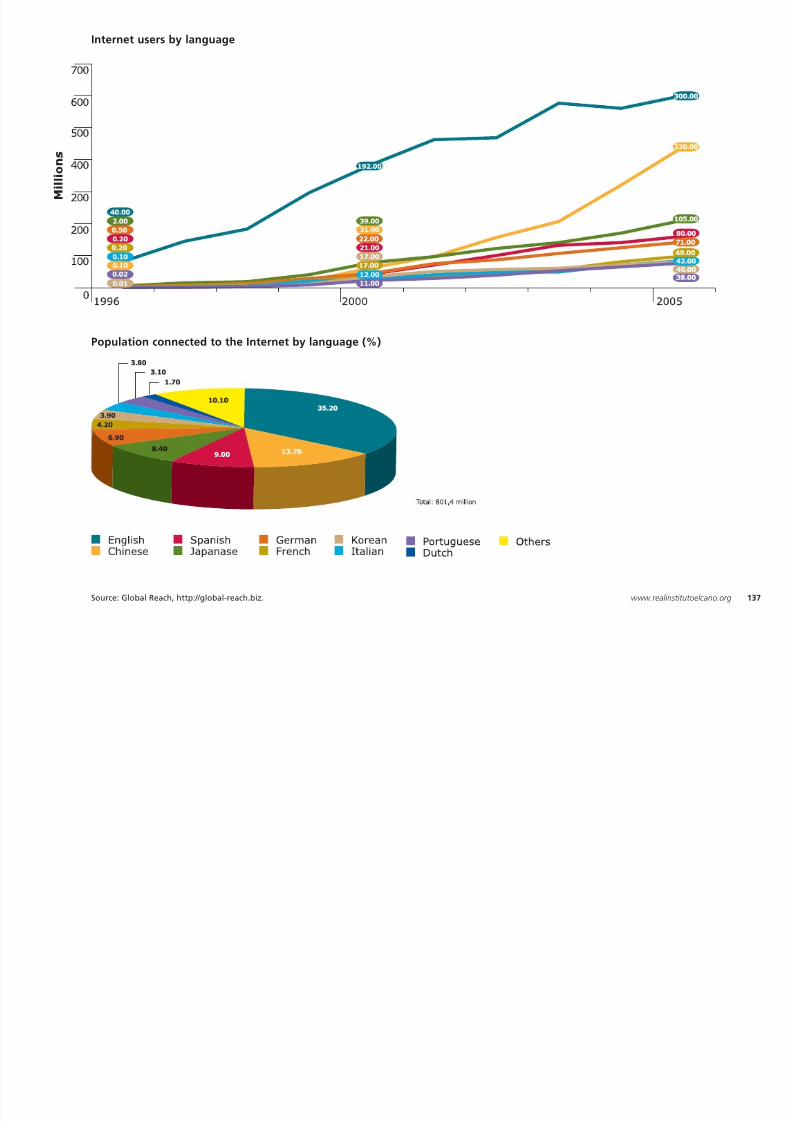
8/3/2019 20 Years of Spain
http://slidepdf.com/reader/full/20-years-of-spain 137/161
Source: Global Reach, http://global-reach.biz. 137www.realinstitutoelcano.org
Population connected to the Internet by language (%)
19. Language teaching
As Spain’s process of opening up to the worldhas unfolded, significant efforts have beenmade by Spanish society to improve its com-
mand of languages. From a society in which themajority of the population scarcely spoke oneforeign language or none at all, Spain hastransformed into a society in which youngpeople learn at least one language from nurs-ery school and, in many cases at least two lan-
8/3/2019 20 Years of Spain
http://slidepdf.com/reader/full/20-years-of-spain 138/161
20 Years of Spain in the European Union138
y , yguages, particularly once they reach secondaryschool. Moreover, English has gradually beengaining on French, and has become the most
popular foreign language in Spain. Accordingto the Special Eurobarometer on languages inthe European Union, 44% of the Spanishpopulation could speak at least one foreignlanguage in 2005, compared with the EU 25average of 56%. Moreover, according to thesame survey, 38% of Europeans speak English,while 8% speak Spanish, now the fourth mostcommonly spoken language after English, thenFrench and German (14% each).
Second language in secondary school Students learning 2 or more foreign languages
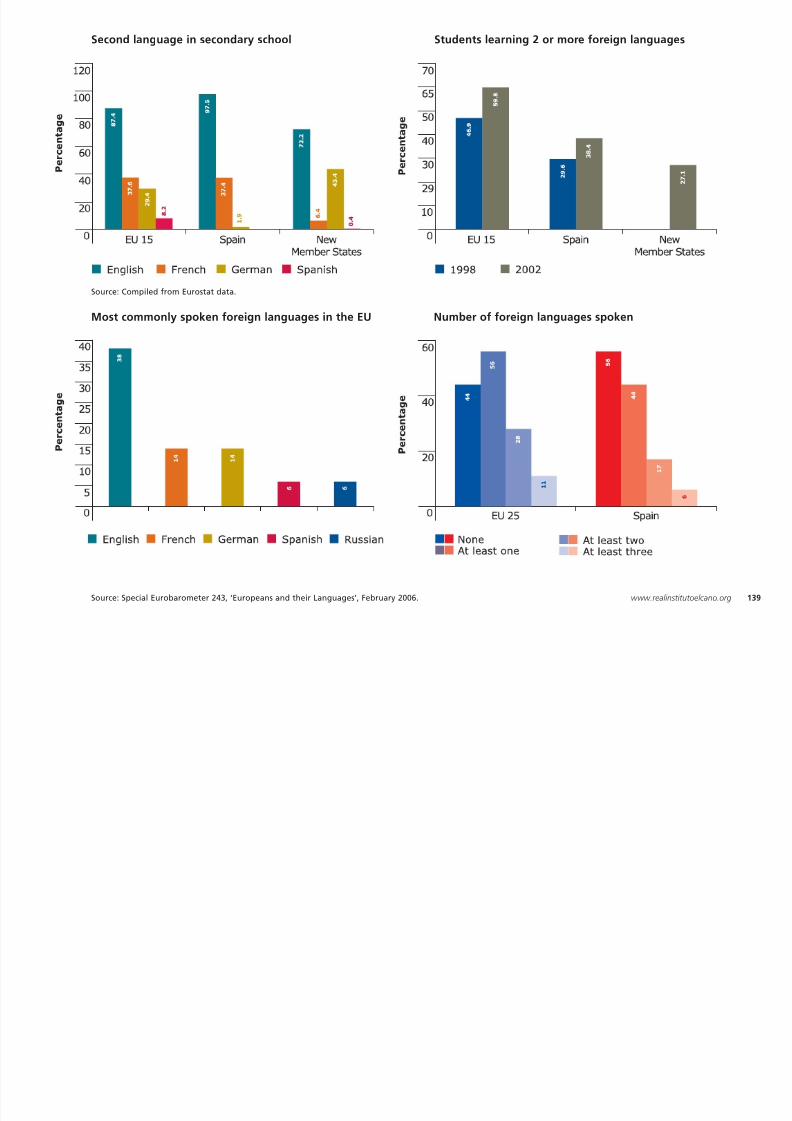
8/3/2019 20 Years of Spain
http://slidepdf.com/reader/full/20-years-of-spain 139/161
139www.realinstitutoelcano.org
Most commonly spoken foreign languages in the EU
Source: Special Eurobarometer 243, ‘Europeans and their Languages’, February 2006.
Number of foreign languages spoken
Source: Compiled from Eurostat data.
20. Erasmus
The efforts to improve language learning, aswell as knowledge of the situation in othercountries, and to improve university training
are clearly reflected in the unparalleled successof the Erasmus programme. Specifically, morethan 20,000 Spanish university students benefit-ed from the Erasmus programme in 2003-2004academic year. The success of the Erasmus pro-gramme among Spanish students is such that
destination for the Erasmus students from otherEU Member States: the 25,000 European studentsin Spain account for more than 20% of all
Erasmus students in Europe. The experience ofliving and studying in the European Union thatthese young university students are gaining willundoubtedly be crucial in terms of their futurecareers, but also in terms of their way of look-ing at the world, understanding Europe and
8/3/2019 20 Years of Spain
http://slidepdf.com/reader/full/20-years-of-spain 140/161
20 Years of Spain in the European Union140
virtually one in five Erasmus students in Europetoday comes from Spain. At the same time,thanks to its language, but also its culture and
lifestyle, Spain has become a hugely attractive
identifying with it. That is, of course, the ‘realsolidarity’ that would provide the foundationsfor the European integration referred to in the
Schuman Declaration more than 50 years ago.
Spanish Erasmus students
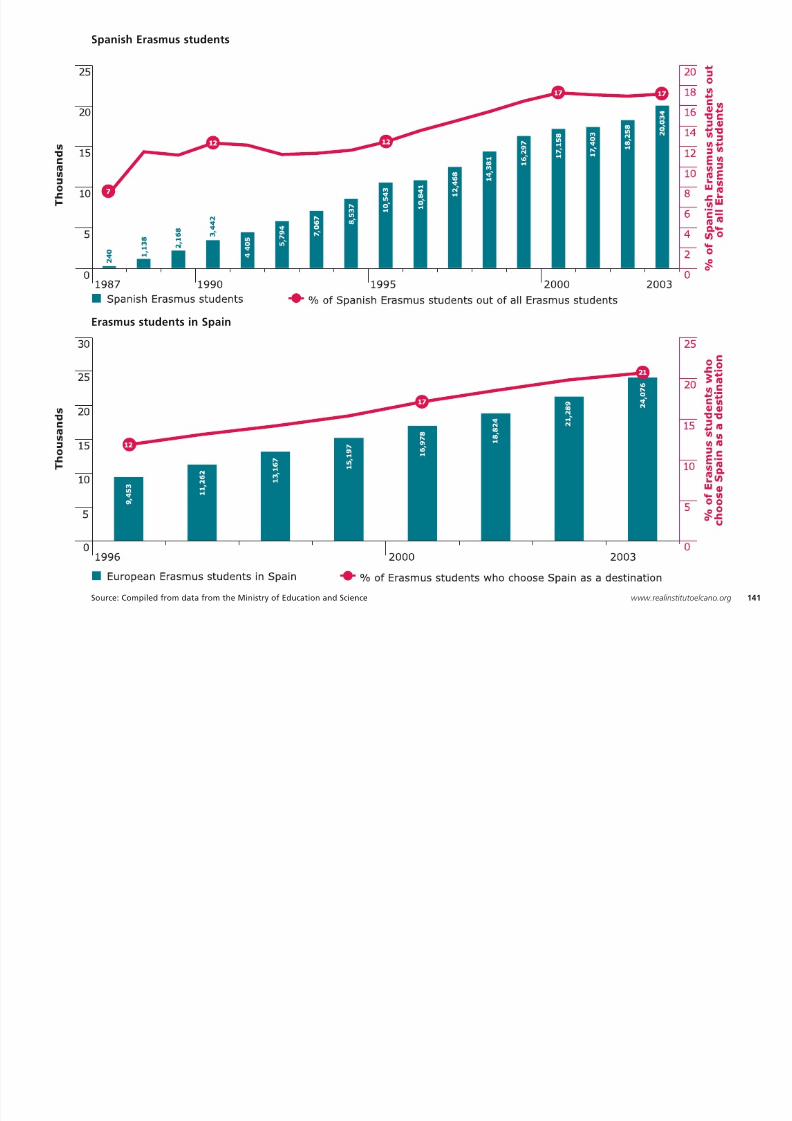
8/3/2019 20 Years of Spain
http://slidepdf.com/reader/full/20-years-of-spain 141/161
141www.realinstitutoelcano.orgSource: Compiled from data from the Ministry of Education and Science
Erasmus students in Spain
Annex
8/3/2019 20 Years of Spain
http://slidepdf.com/reader/full/20-years-of-spain 142/161
20 Years of Spain in the European Union142
1985 297.4 3,712 8.0 7,9501986 316.5 3,933 8.0 8,434
1987 342.2 4,145 8.3 9,097
1988 375.4 4,512 8.3 9,959
1989 414.9 4,928 8.4 10,988
Economy Table 1.Change in GDP and Spanish per capita GDP
1985 297.41986 316.5
1987 342.2
1988 375.4
1989 414.9
GDP at market prices(thousand million euros)
EU 15 S p
a n i s h
G D P
/ E U
1 5 G D P
( % )
S p a n i s h
p e r c
a p i t a
G D P
( 2 0 0 5
e u r o s i n P
P P )
Spain
Economy Table 2.Spanish GDP at market prices(thousand million euros)
Spanish GDP at market prices(thousand million euros)
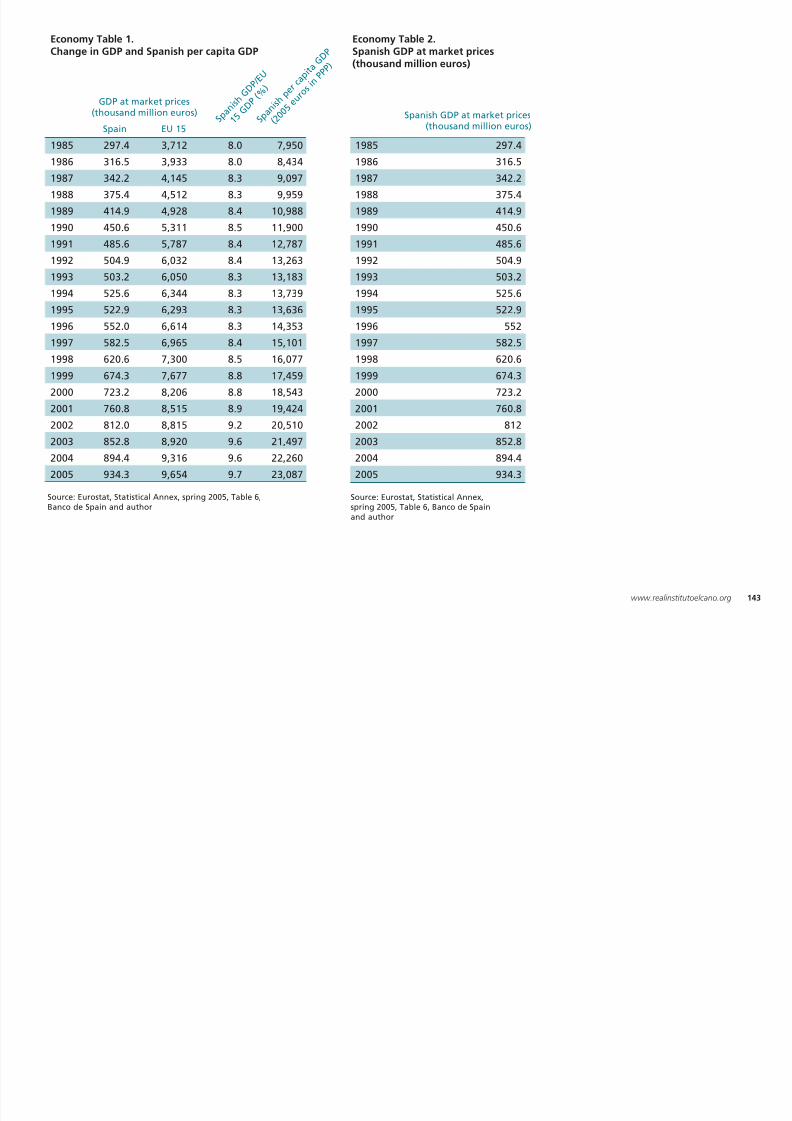
8/3/2019 20 Years of Spain
http://slidepdf.com/reader/full/20-years-of-spain 143/161
143www.realinstitutoelcano.org
1990 450.6 5,311 8.5 11,900
1991 485.6 5,787 8.4 12,787
1992 504.9 6,032 8.4 13,263
1993 503.2 6,050 8.3 13,183
1994 525.6 6,344 8.3 13,739
1995 522.9 6,293 8.3 13,636
1996 552.0 6,614 8.3 14,353
1997 582.5 6,965 8.4 15,101
1998 620.6 7,300 8.5 16,077
1999 674.3 7,677 8.8 17,459
2000 723.2 8,206 8.8 18,543
2001 760.8 8,515 8.9 19,424
2002 812.0 8,815 9.2 20,510
2003 852.8 8,920 9.6 21,497
2004 894.4 9,316 9.6 22,260
2005 934.3 9,654 9.7 23,087
1990 450.6
1991 485.6
1992 504.9
1993 503.2
1994 525.6
1995 522.9
1996 552
1997 582.5
1998 620.6
1999 674.3
2000 723.2
2001 760.8
2002 812
2003 852.8
2004 894.4
2005 934.3
Source: Eurostat, Statistical Annex, spring 2005, Table 6,Banco de Spain and author
Source: Eurostat, Statistical Annex,spring 2005, Table 6, Banco de Spainand author
1990 100 87.41991 100 89.0
1992 100 89.1
1993 100 88.5
1994 100 88.1
1995 100 88 1
Economy Table 3.Real per capita incomeconvergence. GDP atcurrent prices in PPP.EU-25=100
EU 25 Spain
1985 71.6 100 ND1986 71.9 100 ND
1987 73.7 100 ND
1988 74.3 100 ND
1989 75.4 100 ND
1990 76 3 100 ND
Economy Table 4.Real capita income convergenceper GDP at current prices in PPP.EU 15=100
EU 25Spain EU 15
1985 12.2 10.6 13.4 111986 11.7 9.1 11.4 9.2
1987 15.8 8.8 12.8 9.4
1988 11.6 8.5 11.8 9.3
1989 15 10.8 13.7 9.8
1990 15 2 11 7 14 7 11 1
Economy Table 5Interest rates (%)
Long-term interest rates(10-year bond yield)
Short-term interest rates(3-month interbank rate)
EU 15Spain EU 15Spain
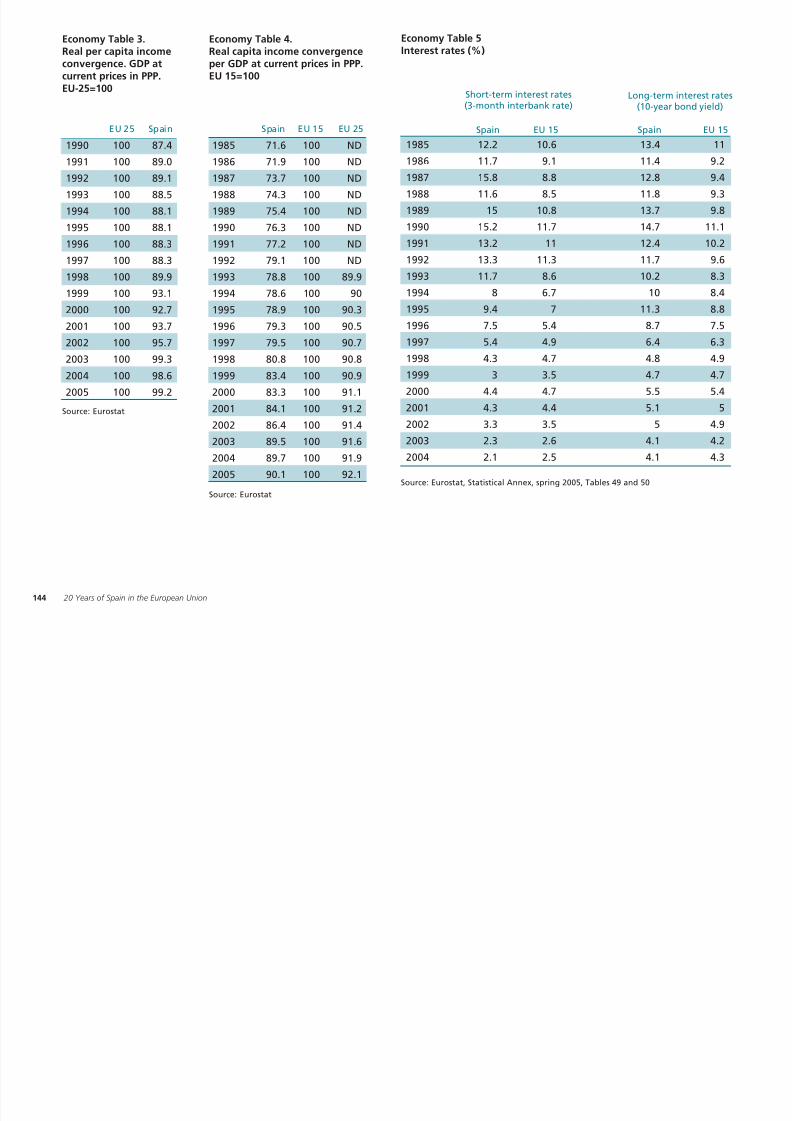
8/3/2019 20 Years of Spain
http://slidepdf.com/reader/full/20-years-of-spain 144/161
1995 100 88.1
1996 100 88.3
1997 100 88.3
1998 100 89.9
1999 100 93.1
2000 100 92.7
2001 100 93.7
2002 100 95.7
2003 100 99.3
2004 100 98.6
2005 100 99.2
144 20 Years of Spain in the European Union
Source: Eurostat
Source: Eurostat
1990 76.3 100 ND
1991 77.2 100 ND
1992 79.1 100 ND
1993 78.8 100 89.9
1994 78.6 100 90
1995 78.9 100 90.3
1996 79.3 100 90.5
1997 79.5 100 90.7
1998 80.8 100 90.8
1999 83.4 100 90.9
2000 83.3 100 91.1
2001 84.1 100 91.2
2002 86.4 100 91.4
2003 89.5 100 91.6
2004 89.7 100 91.9
2005 90.1 100 92.1
1990 15.2 11.7 14.7 11.1
1991 13.2 11 12.4 10.2
1992 13.3 11.3 11.7 9.6
1993 11.7 8.6 10.2 8.3
1994 8 6.7 10 8.4
1995 9.4 7 11.3 8.8
1996 7.5 5.4 8.7 7.5
1997 5.4 4.9 6.4 6.3
1998 4.3 4.7 4.8 4.9
1999 3 3.5 4.7 4.7
2000 4.4 4.7 5.5 5.4
2001 4.3 4.4 5.1 5
2002 3.3 3.5 5 4.9
2003 2.3 2.6 4.1 4.2
2004 2.1 2.5 4.1 4.3
Source: Eurostat, Statistical Annex, spring 2005, Tables 49 and 50
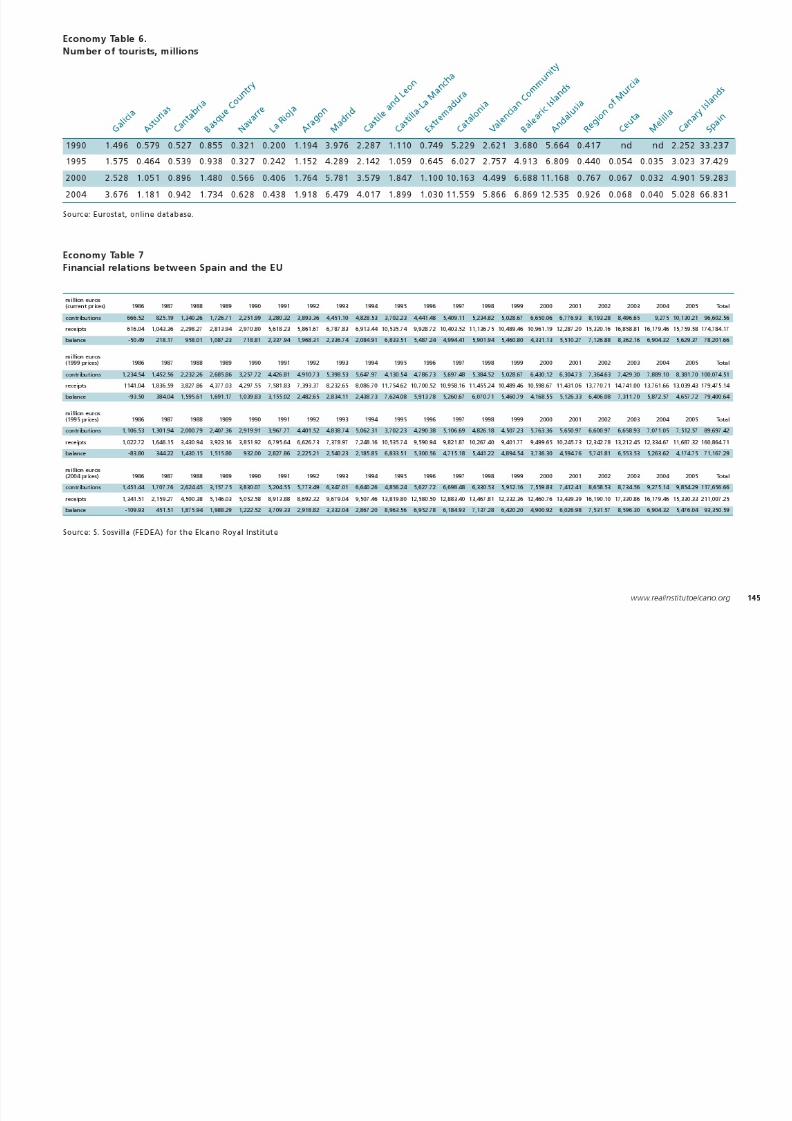
8/3/2019 20 Years of Spain
http://slidepdf.com/reader/full/20-years-of-spain 145/161
EU 15 SpainEU 15 Spain
1985 21.6 311986 18.8 27.9
1987 18.4 27.2
1988 17.9 27.1
1989 17.2 28.2
1990 16 3 28
1985 17.7 9.41986 17.3 9.3
1987 16.8 9.2
1988 15.9 8.6
1989 13.9 7.8
1990 13 1 7 3
Economy Table 9Exports as a % of GDP
Economy Table 8.Annual unemployment rate(Eurostat definition)
1985 8.1 5.6 2.51986 9.3 3.5 5.8
1987 5.5 3.4 2.1
1988 4.8 3.7 1.1
1989 6.7 4.9 1.8
1990 6 6 5 1 1 5
Economy Table 10.Annual inflation rate (%)Final private consumption deflator
Spain EU 15
Differencebetween Spain
and EU 15
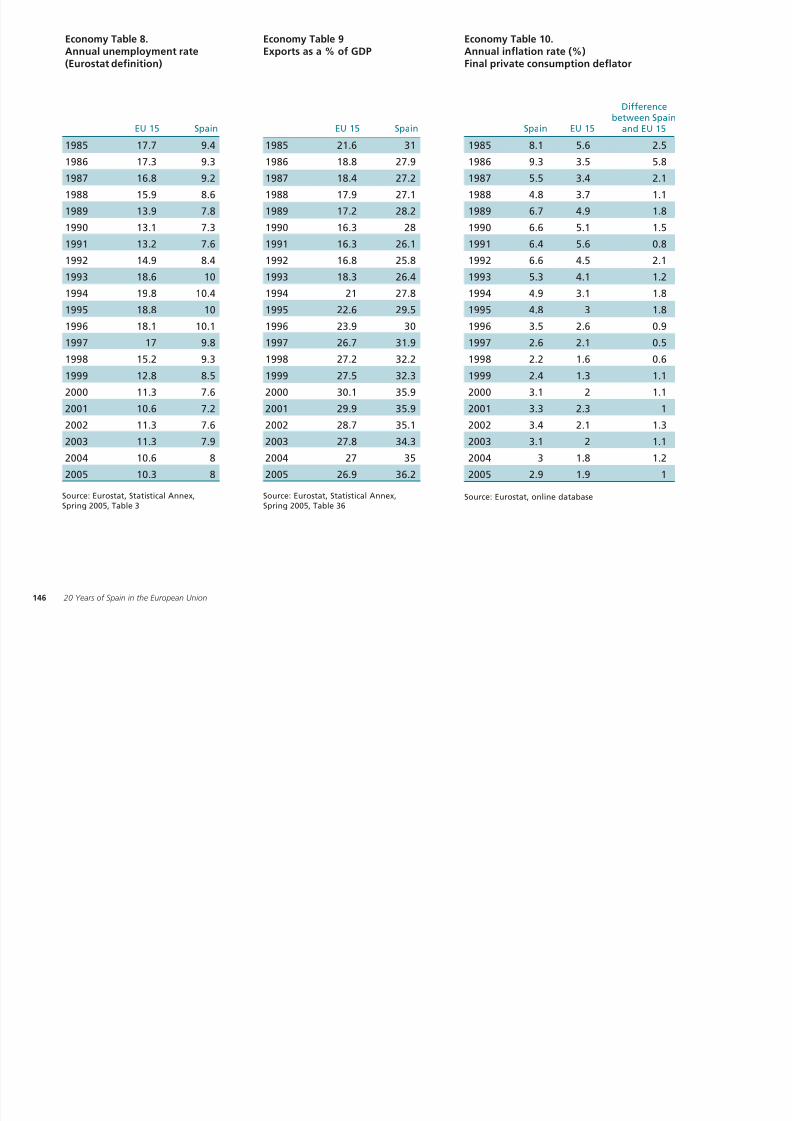
8/3/2019 20 Years of Spain
http://slidepdf.com/reader/full/20-years-of-spain 146/161
146 20 Years of Spain in the European Union
Source: Eurostat, Statistical Annex,Spring 2005, Table 3
1990 16.3 28
1991 16.3 26.1
1992 16.8 25.8
1993 18.3 26.4
1994 21 27.8
1995 22.6 29.5
1996 23.9 30
1997 26.7 31.9
1998 27.2 32.2
1999 27.5 32.3
2000 30.1 35.9
2001 29.9 35.9
2002 28.7 35.1
2003 27.8 34.3
2004 27 35
2005 26.9 36.2
1990 13.1 7.3
1991 13.2 7.6
1992 14.9 8.4
1993 18.6 10
1994 19.8 10.4
1995 18.8 10
1996 18.1 10.1
1997 17 9.8
1998 15.2 9.3
1999 12.8 8.5
2000 11.3 7.6
2001 10.6 7.2
2002 11.3 7.6
2003 11.3 7.9
2004 10.6 8
2005 10.3 8
1990 6.6 5.1 1.5
1991 6.4 5.6 0.8
1992 6.6 4.5 2.1
1993 5.3 4.1 1.2
1994 4.9 3.1 1.8
1995 4.8 3 1.8
1996 3.5 2.6 0.9
1997 2.6 2.1 0.5
1998 2.2 1.6 0.6
1999 2.4 1.3 1.1
2000 3.1 2 1.1
2001 3.3 2.3 1
2002 3.4 2.1 1.3
2003 3.1 2 1.1
2004 3 1.8 1.2
2005 2.9 1.9 1
Source: Eurostat, Statistical Annex,Spring 2005, Table 36
Source: Eurostat, online database
Society Table 1.Change in totalSpanish population
1986 38,473,4181987 38,725,115
1988 39,218,820
1989 39,541,782
1990 39,887,140
1991 38 872 268
Nacional 38,473,418 39,669,394 44,108,530 5,635,112 15%Andalusia 6,789,772 7 ,234,873 7,849,799 1,060,027 16%
Aragon 1,184,295 1,187,546 1,269,027 84,732 7%
Asturias 1,112,186 1,087,885 1,076,635 -35,551 -3%
Balearic Islands 680,933 760,379 983,131 302,198 44%
Canary Islands 1 466 391 1 606 534 1 968 280 501 889 34%
Society Table 2.Population by autonomous community
1 9 8 6
1 9 9 6
2 0 0 5 1 9
8 6 - 2 0
0 5
v a r i a
t i o n
P e r c e
n t a g
e
v a r i a
t i o n
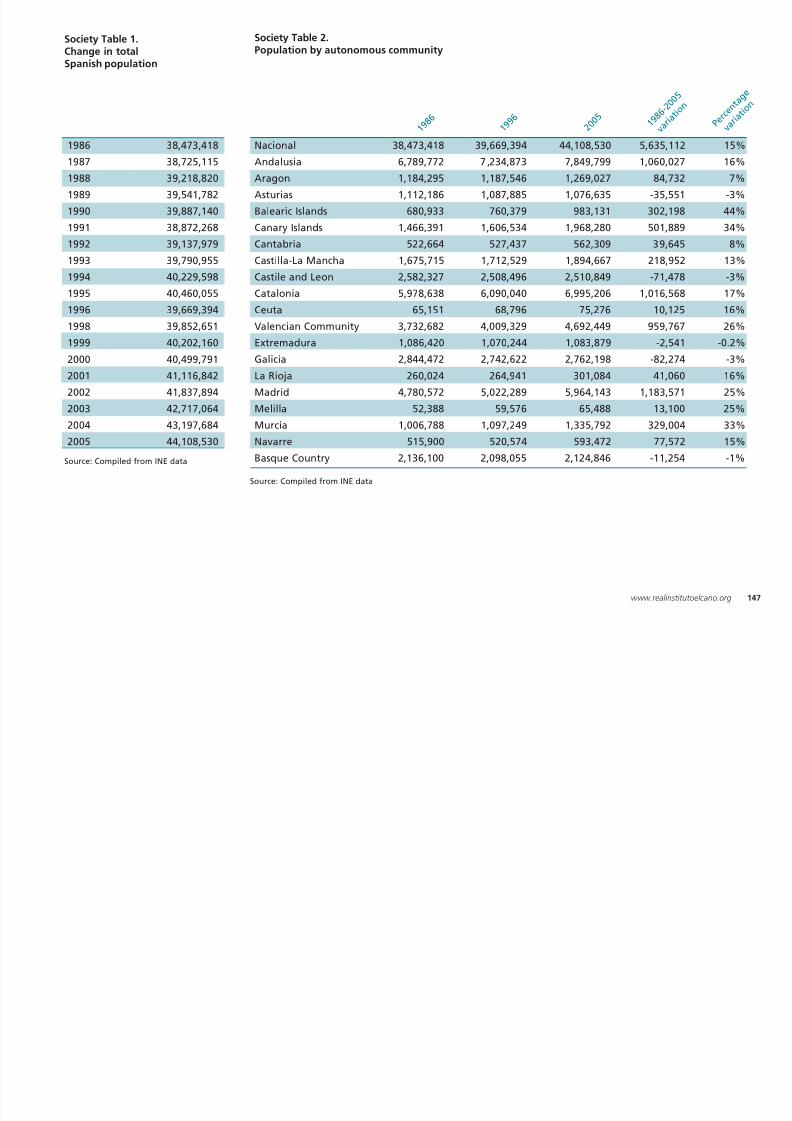
8/3/2019 20 Years of Spain
http://slidepdf.com/reader/full/20-years-of-spain 147/161
147www.realinstitutoelcano.org
1991 38,872,268
1992 39,137,979
1993 39,790,955
1994 40,229,598
1995 40,460,055
1996 39,669,394
1998 39,852,651
1999 40,202,160
2000 40,499,791
2001 41,116,842
2002 41,837,894
2003 42,717,064
2004 43,197,684
2005 44,108,530
Source: Compiled from INE data
Canary Islands 1,466,391 1,606,534 1,968,280 501,889 34%
Cantabria 522,664 527,437 562,309 39,645 8%
Castilla-La Mancha 1,675,715 1,712,529 1,894,667 218,952 13%
Castile and Leon 2,582,327 2,508,496 2,510,849 -71,478 -3%
Catalonia 5,978,638 6,090,040 6,995,206 1,016,568 17%
Ceuta 65,151 68,796 75,276 10,125 16%
Valencian Community 3,732,682 4,009,329 4,692,449 959,767 26%
Extremadura 1,086,420 1,070,244 1,083,879 -2,541 -0.2%
Galicia 2,844,472 2,742,622 2,762,198 -82,274 -3%
La Rioja 260,024 264,941 301,084 41,060 16%
Madrid 4,780,572 5,022,289 5,964,143 1,183,571 25%
Melilla 52,388 59,576 65,488 13,100 25%
Murcia 1,006,788 1,097,249 1,335,792 329,004 33%
Navarre 515,900 520,574 593,472 77,572 15%
Basque Country 2,136,100 2,098,055 2,124,846 -11,254 -1%
Source: Compiled from INE data
0-4 1,261,733 1,179,593 1,079,294 1,015,2885-9 1,579,186 1,496,463 1,033,173 979,914
10-14 1,700,362 1,611,532 1,108,850 1,048,634
15-19 1,676,976 1,599,195 1,218,199 1,153,224
20-24 1,614,517 1,563,526 1,553,976 1,477,657
25-29 1,448,524 1,430,035 1,986,840 1,855,524
Society Table 3.Population by age group (Population structure)
Age Male Female Male Female
1986 2005
1996 542,314 538,984 219,657 319,3271997 600,000 609,813 277,255 332,558
1998 637,085 719,647 338,720 380,927
1999 748,954 801,329 382,955 418,374
2000 923,879 895,720 475,846 419,874
2001 1,370,657 1,109,060 659,179 449,881
Society Table 4.Change in immigration in the last decade
R e g i s
t e r e d
R e s i d
e n t s R e
s i d e n
t s
( g e n e
r a l s c h e
m e )
R e s i d
e n t s
( C o m m
u n i t y
s c h e m
e )
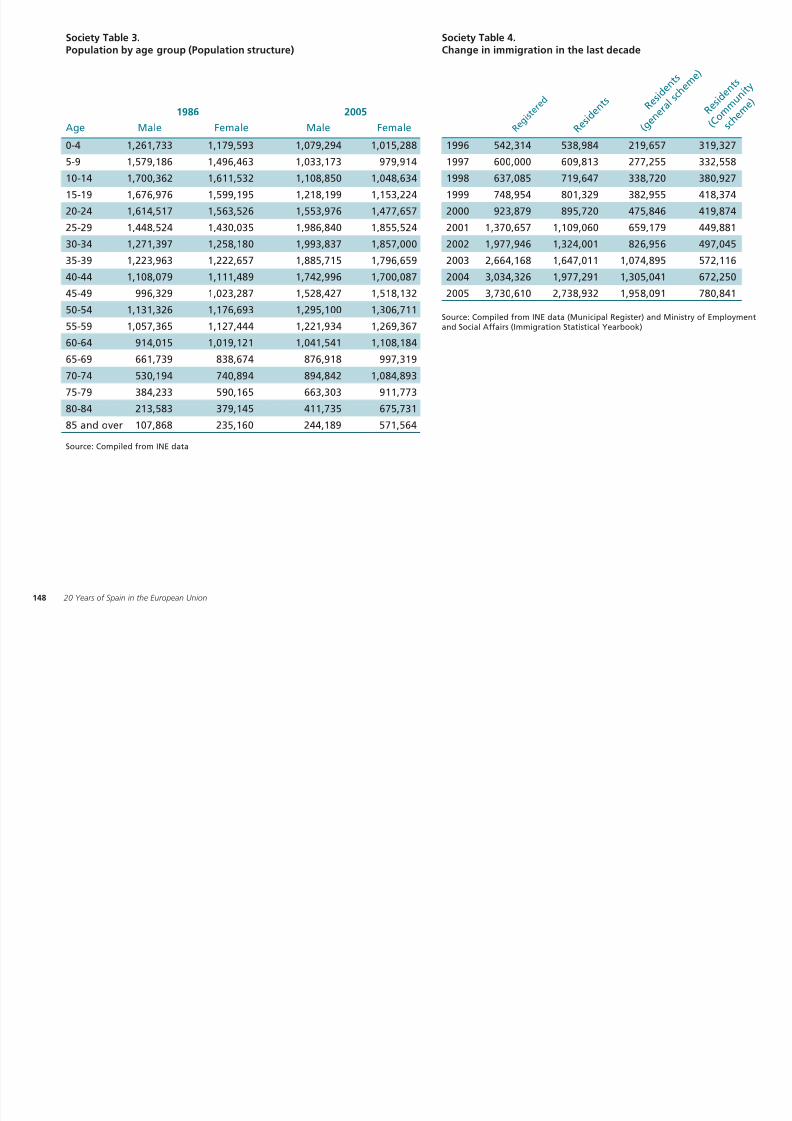
8/3/2019 20 Years of Spain
http://slidepdf.com/reader/full/20-years-of-spain 148/161
148 20 Years of Spain in the European Union
25 29 1,448,524 1,430,035 1,986,840 1,855,524
30-34 1,271,397 1,258,180 1,993,837 1,857,000
35-39 1,223,963 1,222,657 1,885,715 1,796,659
40-44 1,108,079 1,111,489 1,742,996 1,700,087
45-49 996,329 1,023,287 1,528,427 1,518,132
50-54 1,131,326 1,176,693 1,295,100 1,306,711
55-59 1,057,365 1,127,444 1,221,934 1,269,367
60-64 914,015 1,019,121 1,041,541 1,108,184
65-69 661,739 838,674 876,918 997,319
70-74 530,194 740,894 894,842 1,084,893
75-79 384,233 590,165 663,303 911,773
80-84 213,583 379,145 411,735 675,731
85 and over 107,868 235,160 244,189 571,564
Source: Compiled from INE data
2001 1,370,657 1,109,060 659,179 449,881
2002 1,977,946 1,324,001 826,956 497,045
2003 2,664,168 1,647,011 1,074,895 572,116
2004 3,034,326 1,977,291 1,305,041 672,250
2005 3,730,610 2,738,932 1,958,091 780,841
Source: Compiled from INE data (Municipal Register) and Ministry of Employmentand Social Affairs (Immigration Statistical Yearbook)
Society Table 5.Immigration by autonomous community (2005)
Catalonia 484,864 118,772 798,904Community of Madrid 439,847 117,105 780,752
Valencian Community 209,521 131,007 581,985
Andalusia 195,558 131,273 420,207
Canary Islands 77,483 83,987 222,260
Murcia 114,428 21,675 165,016
R e g i s
t e r e d
Society Table 6Activity rate (%)
1992 58.1 67.3 76.9 79.0 39.9 55.61993 58.4 67.1 76.4 78.5 41 55.9
1994 58.9 67.2 75.7 78.2 42.4 56.3
1995 59.0 67.2 75.0 77.8 43.3 56.6
1996 61.6 67.7 76.2 77.9 47.1 57.4
1997 62.4 67.9 76.7 78.0 48.2 57.9
S p a i n
T o t a l
E U T o t a l
S p a i n
m a l e
E U m a l e
S p a i n
f e m a
l e
E U f e m a
l e R e s i d
e n t s
( g e n e
r a l s c h e
m e )
R e s i d
e n t s
( C o m m
u n i t y
s c h e
m e )
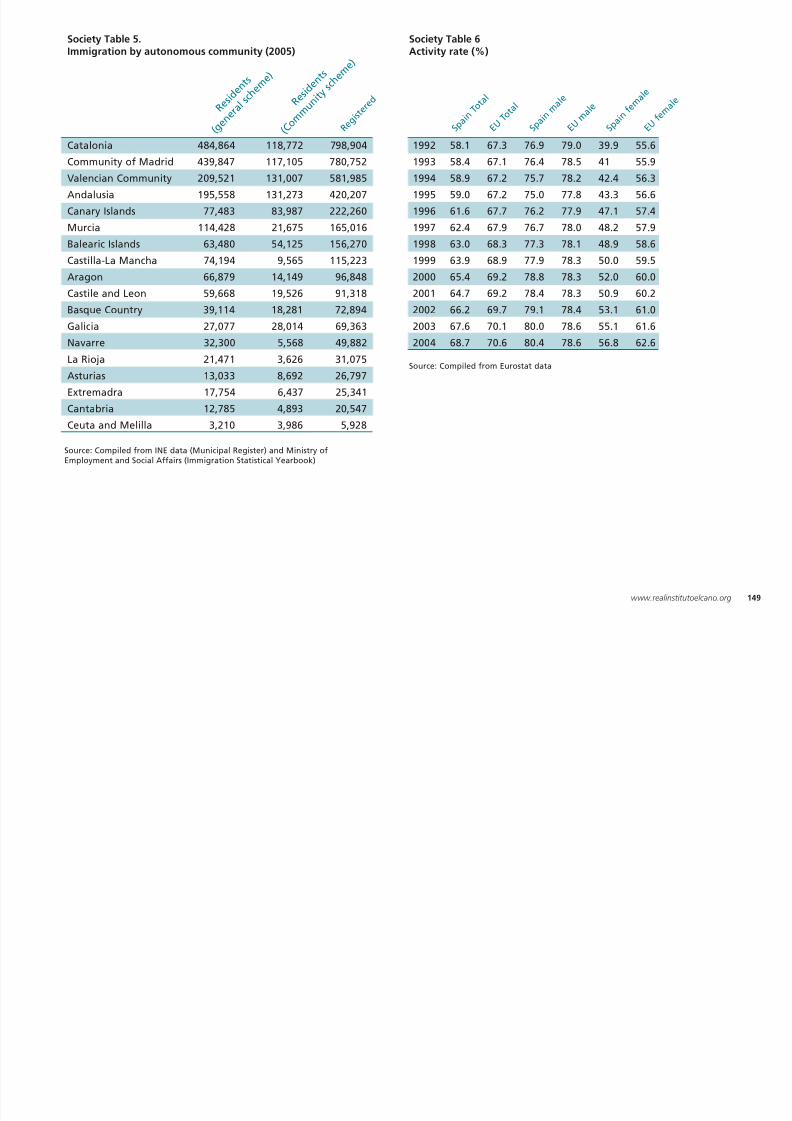
8/3/2019 20 Years of Spain
http://slidepdf.com/reader/full/20-years-of-spain 149/161
149www.realinstitutoelcano.org
, , ,
Balearic Islands 63,480 54,125 156,270
Castilla-La Mancha 74,194 9,565 115,223
Aragon 66,879 14,149 96,848
Castile and Leon 59,668 19,526 91,318
Basque Country 39,114 18,281 72,894
Galicia 27,077 28,014 69,363
Navarre 32,300 5,568 49,882
La Rioja 21,471 3,626 31,075
Asturias 13,033 8,692 26,797
Extremadra 17,754 6,437 25,341
Cantabria 12,785 4,893 20,547
Ceuta and Melilla 3,210 3,986 5,928
Source: Compiled from INE data (Municipal Register) and Ministry ofEmployment and Social Affairs (Immigration Statistical Yearbook)
1998 63.0 68.3 77.3 78.1 48.9 58.6
1999 63.9 68.9 77.9 78.3 50.0 59.5
2000 65.4 69.2 78.8 78.3 52.0 60.0
2001 64.7 69.2 78.4 78.3 50.9 60.2
2002 66.2 69.7 79.1 78.4 53.1 61.0
2003 67.6 70.1 80.0 78.6 55.1 61.6
2004 68.7 70.6 80.4 78.6 56.8 62.6
Source: Compiled from Eurostat data
1994 3.9 71995 3.7 7
1996 3.6 5.9
1997 3.4 6.3
1998 3.2 5.5
1999 2.9 5
EU 15 Spain
Society Table 7.Standardised indexof accidents inthe workplace
1991 1,794.43 425.37 4,766.88 5,910.051992 2,034.78 485.64 5,217.00 6,924.73
1993 2,240.88 514.89 5,553.37 7,518.25
1994 2,269.07 527.06 5,755.87 6,436.38
1995 2,378.91 554.64 6,153.62 6,290.46
1996 2,516.41 592.30 6,483.92 6,338.56
Society Table 8.Basic indicators of social protection indicators (euros)
T o t a l
b e n e
f i t s
p e r i n h
a b i t a
n t
H e a l t h c
a r e b e n e
f i t s
p e r i n h
a b i t a
n t
O l d - a
g e
p e n s i o n
p e r
p e r s o
n > 6 4
U n e m
p l o y m
e n t
b e n e
f i t p e r
p e r s o
n
u n e m
p l o y e d
d a i l y
n e w s
p a p e
r s
1988 29.22 30.87 54.79 55.98 87.451989 30.05 32.91 55.81 56.21 86.21
1990 31.91 35.26 56.77 53.68 87.43
1991 32.36 36.14 58.23 55.58 89.49
1992 33.65 36.59 57.90 55.91 89.47
1993 36.36 37.93 56.18 56.72 90.07
Society Table 9.Audience per type of medium
S u n d
a y s u p -
p l e m e
n t s
m a g a
z i n e s
r a d i o
t e l e v i s i o
n
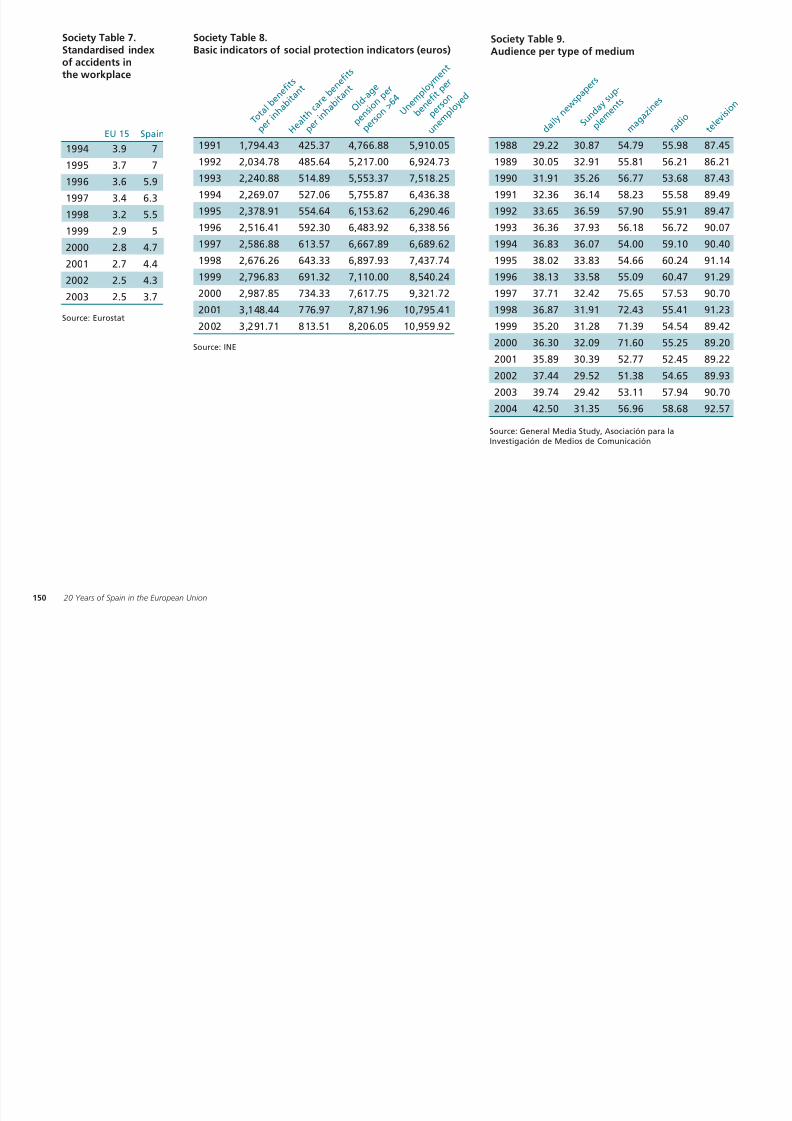
8/3/2019 20 Years of Spain
http://slidepdf.com/reader/full/20-years-of-spain 150/161
1999 2.9 5
2000 2.8 4.7
2001 2.7 4.4
2002 2.5 4.3
2003 2.5 3.7
150 20 Years of Spain in the European Union
Source: Eurostat
1997 2,586.88 613.57 6,667.89 6,689.62
1998 2,676.26 643.33 6,897.93 7,437.74
1999 2,796.83 691.32 7,110.00 8,540.24
2000 2,987.85 734.33 7,617.75 9,321.72
2001 3,148.44 776.97 7,871.96 10,795.41
2002 3,291.71 813.51 8,206.05 10,959.92
Source: INE
1994 36.83 36.07 54.00 59.10 90.40
1995 38.02 33.83 54.66 60.24 91.14
1996 38.13 33.58 55.09 60.47 91.29
1997 37.71 32.42 75.65 57.53 90.70
1998 36.87 31.91 72.43 55.41 91.23
1999 35.20 31.28 71.39 54.54 89.42
2000 36.30 32.09 71.60 55.25 89.20
2001 35.89 30.39 52.77 52.45 89.22
2002 37.44 29.52 51.38 54.65 89.93
2003 39.74 29.42 53.11 57.94 90.70
2004 42.50 31.35 56.96 58.68 92.57
Source: General Media Study, Asociación para laInvestigación de Medios de Comunicación
1991 227.00 163.80
1992 201.00 152.40
1993 163.00 142.27
1994 143.00 135.93
1995 146.00 136.07
1996 139.00 128.27
1991 25,292 19,017 371 14,803 23,544 226 4,845 326
1992 30,816 4,347 400 15,908 27,540 nd 3,943 244
1993 27,172 4,400 412 12,532 9,847 312 2,474 72
1994 19,210 6,600 600 6,664 12,767 nd 210 81
1995 5,435 4,200 741 428 2,703 397 66 46
1996 5,424 4,200 492 399 0 530 0 0
Society Table 11.Consumption and production of substances that deplete the ozone layer
P r o d u
c t i o n
o f C F C s
P r o d u
c t i o n
o f T C C 1
P r o d u
c t i o n
o f H C F
C s
C o n s u m
p t i o n
o f C F C s 2
C o n s u m
p t i o n
o f T C C 1
C o n s u m
p t i o n
o f H C F
C s 3
C o n s u m
p t i o n
o f h a l o n
s C o
n s u m
p t i o n
o f
m e t h y l c h l o r
o f o r m
Society Table 10.Road fatalities
Spain EU 15
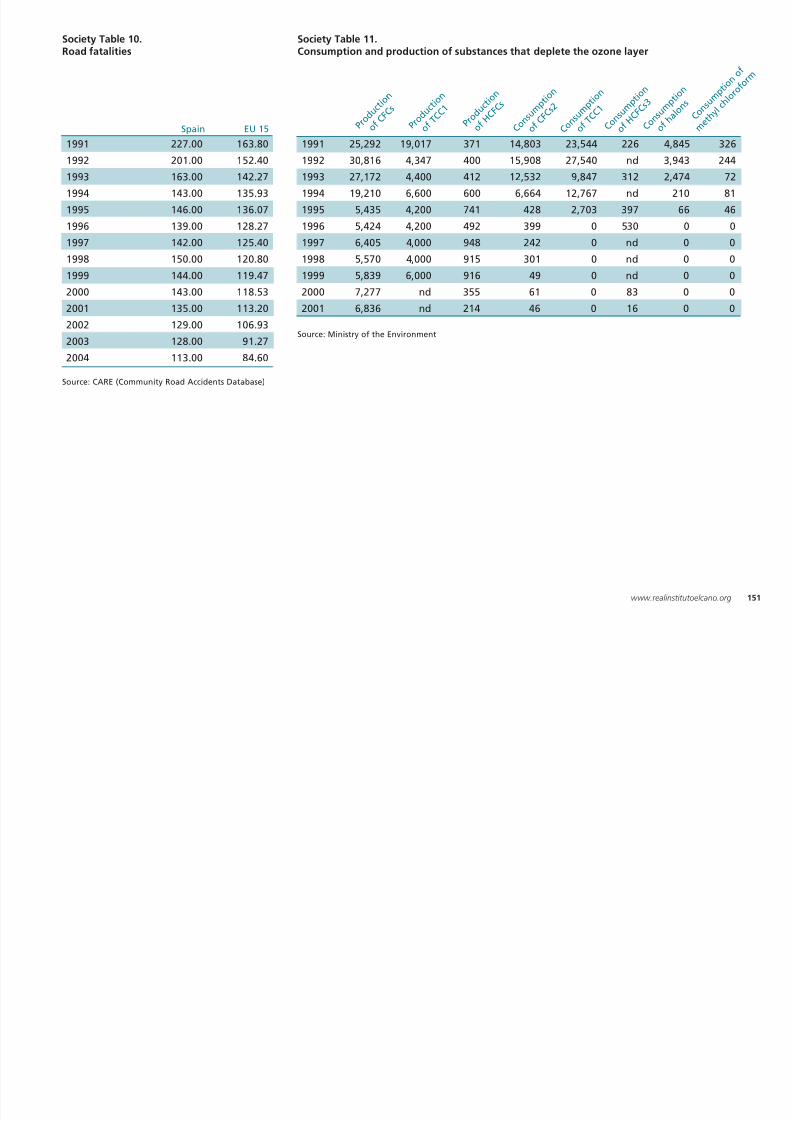
8/3/2019 20 Years of Spain
http://slidepdf.com/reader/full/20-years-of-spain 151/161
1997 142.00 125.40
1998 150.00 120.801999 144.00 119.47
2000 143.00 118.53
2001 135.00 113.20
2002 129.00 106.93
2003 128.00 91.27
2004 113.00 84.60
151www.realinstitutoelcano.org
1997 6,405 4,000 948 242 0 nd 0 0
1998 5,570 4,000 915 301 0 nd 0 01999 5,839 6,000 916 49 0 nd 0 0
2000 7,277 nd 355 61 0 83 0 0
2001 6,836 nd 214 46 0 16 0 0
Source: Ministry of the Environment
Source: CARE (Community Road Accidents Database)
Portugal 10,500 11,090 1,090
Italy 52,000 56,200 980
Spain 46,250 38,544 960
Greece 5,496 8,695 830
Belgium 8,149 7,442 730
Netherlands 9,349 8,889 560
Society Table 12.Water collected for irrigation and purification
Water collected(million m3)
Water collected percapita (m3 per capita)
1985 2002 2002
1991 nd 328.501992 nd 355.02
1993 nd 365.00
1994 nd 365.00
1995 483.00 380.00
1996 497.00 390.00
Society Table 13.Production of MSW(municipal solid waste)
EU 15 kgs/day Spain kgs/day
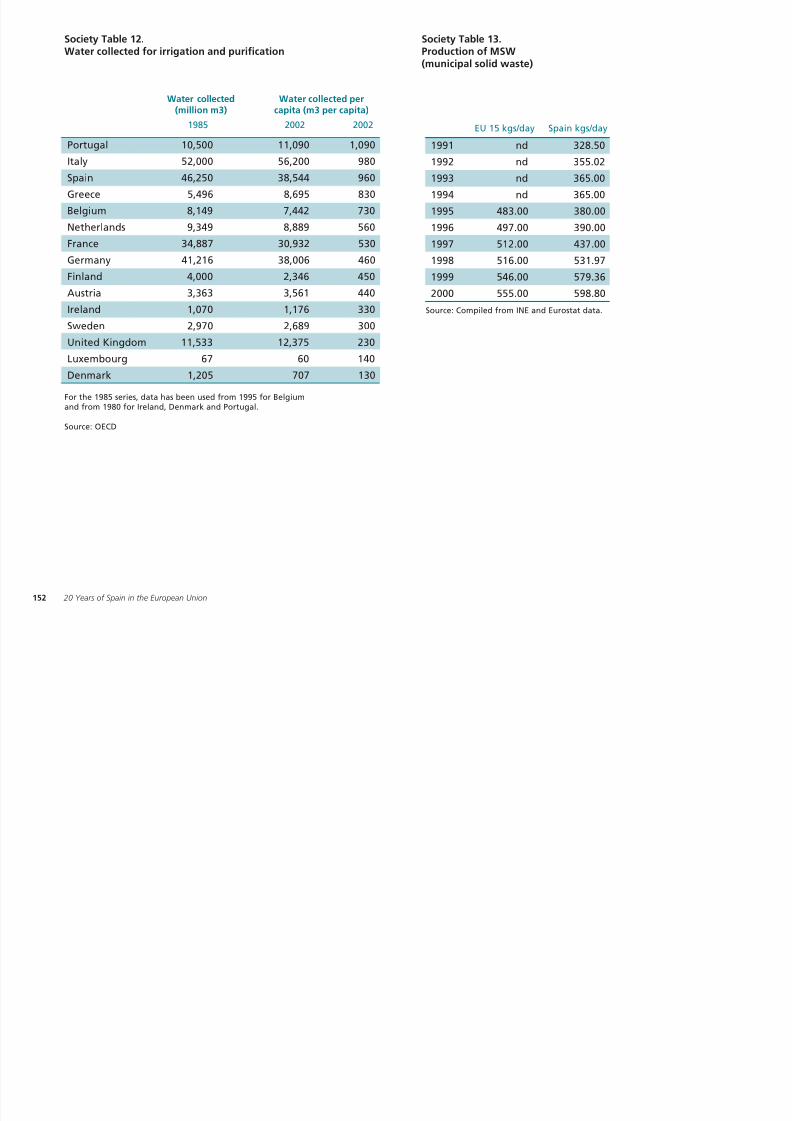
8/3/2019 20 Years of Spain
http://slidepdf.com/reader/full/20-years-of-spain 152/161
152 20 Years of Spain in the European Union
France 34,887 30,932 530
Germany 41,216 38,006 460Finland 4,000 2,346 450
Austria 3,363 3,561 440
Ireland 1,070 1,176 330
Sweden 2,970 2,689 300
United Kingdom 11,533 12,375 230
Luxembourg 67 60 140
Denmark 1,205 707 130
For the 1985 series, data has been used from 1995 for Belgiumand from 1980 for Ireland, Denmark and Portugal.
Source: OECD
1997 512.00 437.00
1998 516.00 531.971999 546.00 579.36
2000 555.00 598.80
Source: Compiled from INE and Eurostat data.
Society Table 14.Use of water byautonomous community
National total 381 270 184 76 10 258 167 91 59 18.7Andalusia 435 244 181 61 2 266 184 82 71 21.2
Aragon 479 235 205 29 1 279 169 110 86 23.5
Principality of Asturias 363 233 195 38 0 244 161 83 53 17.9
Balearic Islands 314 194 49 125 20 224 130 94 63 22.1
Canary Islands 340 185 21 61 103 225 135 90 51 18.3
V o l u m
e o f
w a t e r
a v a i l
a b l e
F r o m w
a t e r
c o l l e
c t e d
G r o u
n d w a
t e r
O t h e
r w a t e
r
r e s o u
r c e s
V o l u m
e o f
w a t e r
s u p p l i e
d
T o h o u s e h
o l d s
O t h e
r u s e s
W a t e
r l o s t i n t h e
d i s t r i b u
t i o n n
e t w o r k
S u r f a
c e w a t e
r
P e r c e
n t a g
e o f
w a t e r
l o s t i n
d i s t r i b u
t i o n (
% )
litres/inhabitant/day
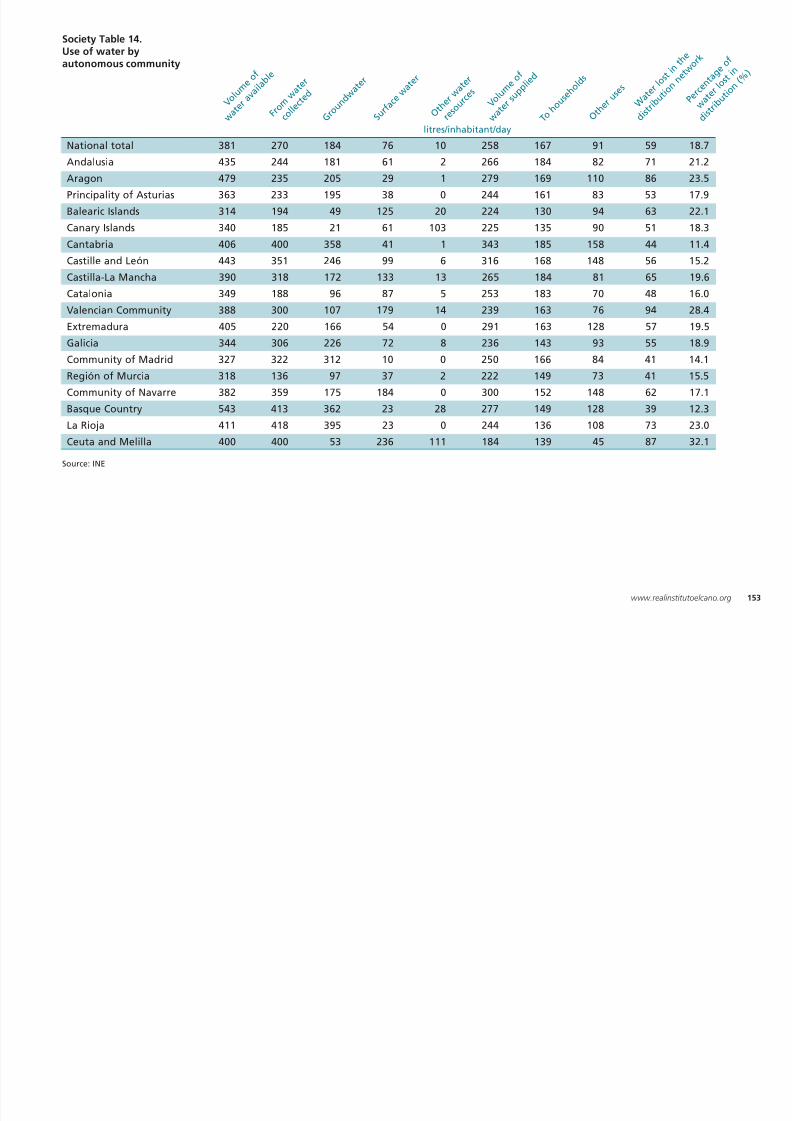
8/3/2019 20 Years of Spain
http://slidepdf.com/reader/full/20-years-of-spain 153/161
153www.realinstitutoelcano.org
Cantabria 406 400 358 41 1 343 185 158 44 11.4
Castille and León 443 351 246 99 6 316 168 148 56 15.2Castilla-La Mancha 390 318 172 133 13 265 184 81 65 19.6
Catalonia 349 188 96 87 5 253 183 70 48 16.0
Valencian Community 388 300 107 179 14 239 163 76 94 28.4
Extremadura 405 220 166 54 0 291 163 128 57 19.5
Galicia 344 306 226 72 8 236 143 93 55 18.9
Community of Madrid 327 322 312 10 0 250 166 84 41 14.1
Región of Murcia 318 136 97 37 2 222 149 73 41 15.5
Community of Navarre 382 359 175 184 0 300 152 148 62 17.1
Basque Country 543 413 362 23 28 277 149 128 39 12.3
La Rioja 411 418 395 23 0 244 136 108 73 23.0
Ceuta and Melilla 400 400 53 236 111 184 139 45 87 32.1
Source: INE
Politics Table 1.Support for the process ofEuropean integration. Do youbelieve that your countrybenefits from membership ofthe EC/EU?
EB-25 1986 9 46
EB-27 1987 14 49
EB-29 1988 24 52
EB-31 1989 27 55
EB-33 1990 57 59
EB-35 1991 58 59
EU (%)Spain(%)
EB-40 1993 55 56
EB-42 1994 61 63
EB-44 1995 56 57
EB-46 1996 54 51
EB-47 1997 52 51
EB-50 1998 63 54
1984 43.00 69.00 51.00
1986 57.00 69.00 55.00
1987 53.00 71.00 52.00
1988 56.00 72.00 56.00
1990 63.00 80.00 60.00
1992 46.00 73.00 62.00
Politics Table 2.Feeling of European identity
EU (%)Spain(%)
Politics Table 3.Satisfaction withthe political system
% S a t i s f i e
d w i t h
t h e f
u n c -
t i o n i n
g o f d
e m o c r a c
y
i n S p
a i n
P r e f e r
d e m o
c r a c y
t o o t h e
r
f o r m
s o f g
o v e r n
m e n t
S u p p
o r t t h e
p r o c e s s
o f d e c e n t r a l i s a
t i o n
t o t h e a
u t o n
o m o u
s
c o m m
u n i t i e
s
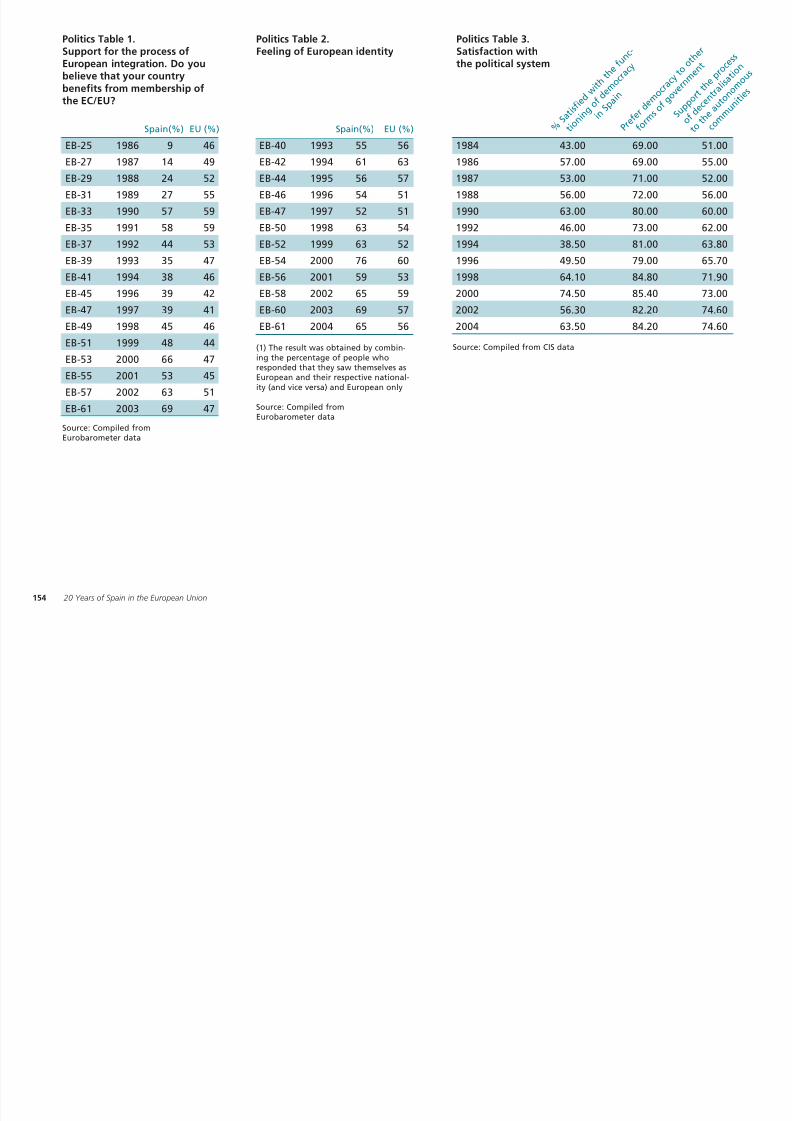
8/3/2019 20 Years of Spain
http://slidepdf.com/reader/full/20-years-of-spain 154/161
154 20 Years of Spain in the European Union
Source: Compiled fromEurobarometer data
EB-37 1992 44 53
EB-39 1993 35 47EB-41 1994 38 46
EB-45 1996 39 42
EB-47 1997 39 41
EB-49 1998 45 46
EB-51 1999 48 44
EB-53 2000 66 47
EB-55 2001 53 45
EB-57 2002 63 51
EB-61 2003 69 47
(1) The result was obtained by combin-ing the percentage of people who
responded that they saw themselves asEuropean and their respective national-ity (and vice versa) and European only
Source: Compiled fromEurobarometer data
EB-52 1999 63 52
EB-54 2000 76 60EB-56 2001 59 53
EB-58 2002 65 59
EB-60 2003 69 57
EB-61 2004 65 56
Source: Compiled from CIS data
1994 38.50 81.00 63.80
1996 49.50 79.00 65.701998 64.10 84.80 71.90
2000 74.50 85.40 73.00
2002 56.30 82.20 74.60
2004 63.50 84.20 74.60
1990 1,249,294 514,273 333,843
1991 1,213,659 536,983 355,548
1992 1,190,283 565,460 374,656
1993 1,213,255 593,453 366,391
1994 915,496 600,961 367,032
1995 918,016 625,771 371,456
1996 921 097 620 474 425 156
Politics Table 4.Employees working for the public administrations
S t a t e
a d m i
n i s t r a
t i o n
A u t o n o
m o u s
C o m m
u n i t i e
s
L o c a l
a u t h o r i t i e
s
Politics Table 5.Priority National Objectives (% scale of 4 items)
1988 43 26 16 10
1989 41 28 15 11
1990 40 28 15 13
1991 42 26 16 13
1992 38 30 18 12
1993 35 32 19 12
1994 35 29 21 13
M a i n t
a i n i n g
o r d e
r F i g
h t i n g
i n f l a t
i o n
G r e a t e r
p a r t i c i p
a t i o n
i n p o l i t i
c s
P r o t e c
t i n g f
r e e d o
m
o f e x p r e s s i o n
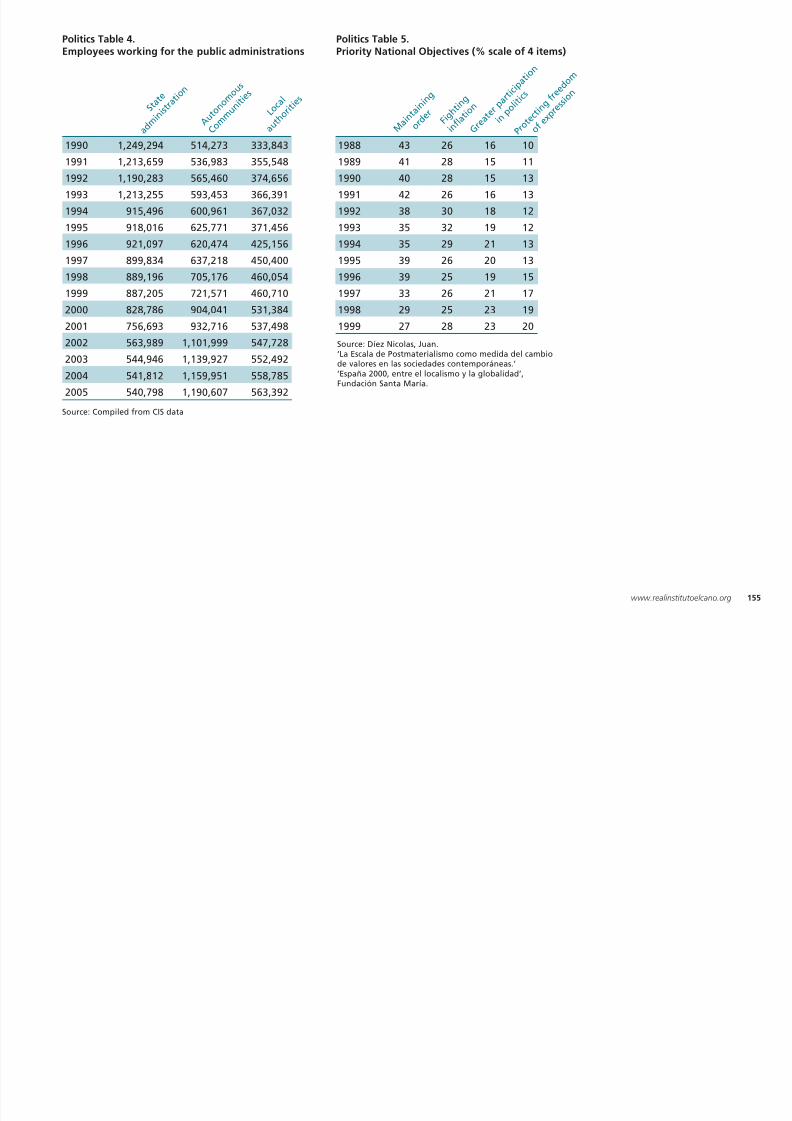
8/3/2019 20 Years of Spain
http://slidepdf.com/reader/full/20-years-of-spain 155/161
155www.realinstitutoelcano.org
1996 921,097 620,474 425,156
1997 899,834 637,218 450,4001998 889,196 705,176 460,054
1999 887,205 721,571 460,710
2000 828,786 904,041 531,384
2001 756,693 932,716 537,498
2002 563,989 1,101,999 547,728
2003 544,946 1,139,927 552,492
2004 541,812 1,159,951 558,785
2005 540,798 1,190,607 563,392
Source: Compiled from CIS data
1994 35 29 21 13
1995 39 26 20 131996 39 25 19 15
1997 33 26 21 17
1998 29 25 23 19
1999 27 28 23 20
Source: Díez Nicolas, Juan.‘La Escala de Postmaterialismo como medida del cambiode valores en las sociedades contemporáneas.’
‘España 2000, entre el localismo y la globalidad’,Fundación Santa María.
Politics Table 6.Spanish Official Development Assistance
1987 0.08% 0.33% 198.36
1988 0.07% 0.34% 205.11
1989 0.15% 0.32% 393.48
1990 0.20% 0.33% 591.71
1991 0.24% 0.33% 788.08
1992 0.27% 0.33% 934.35
1993 0 28% 0 30% 996 80
% A O D
/ P I B
( S p a i n
) %
A O D
/ P I B
( M e d i a
C A D )
T o t a l
A O D
n e t a
( M i l l .
E u r o s )
Denmark 1.72 1.18 1.05 0.69 0.73 0.82 0.50 6.7 -0.1
Netherlands 1.22 1.18 1.29 0.74 0.75 0.77 0.66 6.6 0.0
Swedeen 1.38 1.17 1.04 0.83 0.73 0.59 0.60 6.3 +0.7
Australia 0.35 1.45 1.24 0.84 0.62 0.96 0.56 6.0 -0.2
Norway 1.52 0.20 1.10 0.64 0.47 0.97 0.59 5.5 +0.2
New Zeland 0.30 1.75 0.65 0.93 0.67 0.88 0.58 5.8 -0.3
Finland 0 68 1 16 1 12 0 32 0 69 0 75 0 72 5 4 +0 3
Política Tabla 7.Commitment to Development Index
O D A
T r a d e
I n v e s t
m e n t
I m m i
g r a t i
o n
E n v i r
o n m e
n t
S e c u r i t y
T e c h n o l o g
y
I n d e x
s c o r e V a
r i a t i o
n
2 0 0 3
- 2 0 0 5
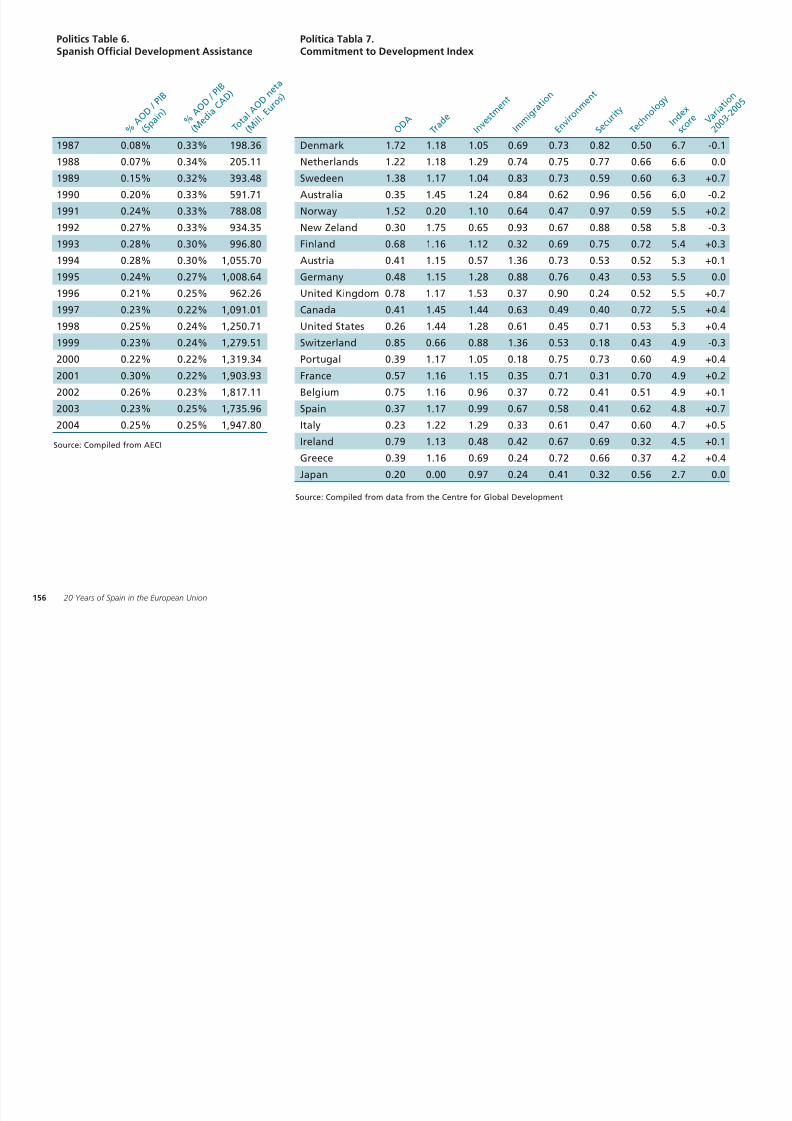
8/3/2019 20 Years of Spain
http://slidepdf.com/reader/full/20-years-of-spain 156/161
156 20 Years of Spain in the European Union
Source: Compiled from AECI
1993 0.28% 0.30% 996.80
1994 0.28% 0.30% 1,055.701995 0.24% 0.27% 1,008.64
1996 0.21% 0.25% 962.26
1997 0.23% 0.22% 1,091.01
1998 0.25% 0.24% 1,250.71
1999 0.23% 0.24% 1,279.51
2000 0.22% 0.22% 1,319.34
2001 0.30% 0.22% 1,903.93
2002 0.26% 0.23% 1,817.11
2003 0.23% 0.25% 1,735.96
2004 0.25% 0.25% 1,947.80
Finland 0.68 1.16 1.12 0.32 0.69 0.75 0.72 5.4 +0.3
Austria 0.41 1.15 0.57 1.36 0.73 0.53 0.52 5.3 +0.1Germany 0.48 1.15 1.28 0.88 0.76 0.43 0.53 5.5 0.0
United Kingdom 0.78 1.17 1.53 0.37 0.90 0.24 0.52 5.5 +0.7
Canada 0.41 1.45 1.44 0.63 0.49 0.40 0.72 5.5 +0.4
United States 0.26 1.44 1.28 0.61 0.45 0.71 0.53 5.3 +0.4
Switzerland 0.85 0.66 0.88 1.36 0.53 0.18 0.43 4.9 -0.3
Portugal 0.39 1.17 1.05 0.18 0.75 0.73 0.60 4.9 +0.4
France 0.57 1.16 1.15 0.35 0.71 0.31 0.70 4.9 +0.2
Belgium 0.75 1.16 0.96 0.37 0.72 0.41 0.51 4.9 +0.1
Spain 0.37 1.17 0.99 0.67 0.58 0.41 0.62 4.8 +0.7
Italy 0.23 1.22 1.29 0.33 0.61 0.47 0.60 4.7 +0.5
Ireland 0.79 1.13 0.48 0.42 0.67 0.69 0.32 4.5 +0.1
Greece 0.39 1.16 0.69 0.24 0.72 0.66 0.37 4.2 +0.4
Japan 0.20 0.00 0.97 0.24 0.41 0.32 0.56 2.7 0.0
Source: Compiled from data from the Centre for Global Development
Politics Table 8.Internet users by language (millions)
English Chinese Japonese Spanish German French Italian Korean Portuguese
1996 40.00 0.10 2.00 0.20 0.50 0.20 0.10 0.01 0.02
1997 72.00 1.20 7.00 0.80 3.50 2.00 0.50 0.05 0.20
1998 91.00 2.00 9.00 1.80 6.30 3.40 1.80 0.80 1.20
1999 148.00 10.00 20.00 13.00 14.00 9.90 9.70 5.00 4.00
2000 192.00 31.00 39.00 21.00 22.00 17.00 12.00 17.00 11.00
2001 231.00 48.00 48.00 35.00 37.00 18.00 20.00 25.00 14.00
2002 233 80 78 00 61 00 50 00 43 00 23 00 24 00 28 00 19 00
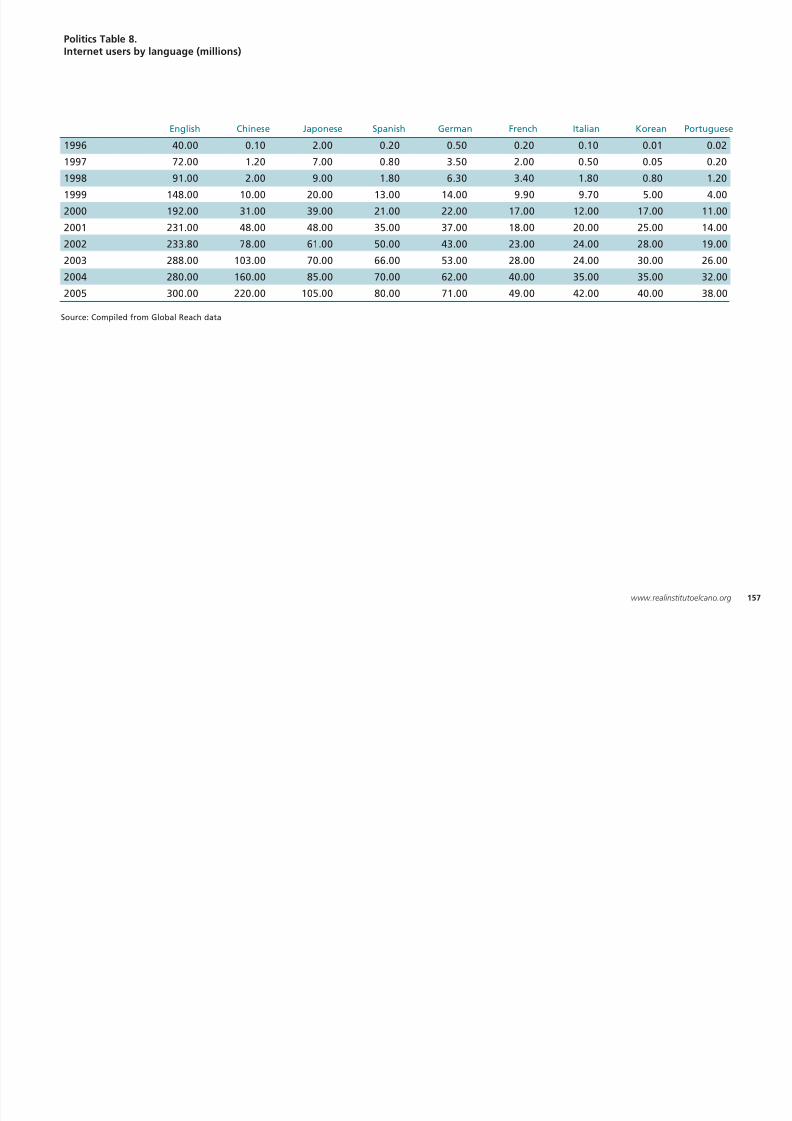
8/3/2019 20 Years of Spain
http://slidepdf.com/reader/full/20-years-of-spain 157/161
157www.realinstitutoelcano.org
2002 233.80 78.00 61.00 50.00 43.00 23.00 24.00 28.00 19.00
2003 288.00 103.00 70.00 66.00 53.00 28.00 24.00 30.00 26.002004 280.00 160.00 85.00 70.00 62.00 40.00 35.00 35.00 32.00
2005 300.00 220.00 105.00 80.00 71.00 49.00 42.00 40.00 38.00
Source: Compiled from Global Reach data
1987-1988 240 7% 3,244
1988-1989 1,138 11% 9,914
1989-1990 2,168 11% 19,456
1990-1991 3,442 12% 27,906
1991-1992 4,405 12% 36,314
1992-1993 5,794 11% 51,694
1993-1994 7 067 11% 62 362
Politics Table 9.Erasmus students
= % o f
S p a n i s h
E r a s m
u s
s t u d e
n t s o
u t o f
t o t a l
T o t a l
E r a s m
u s
s t u d e
n t s
S p a n i s h
E r a s m
u s
s t u d e
n t s
Er a s m
u s s t u d
e n t s
n E r a s
m u s
n S p a i n
ra s m u
s s t u d e
n t s w
h o
a i n a s
a d e
s t i n a
t i o n
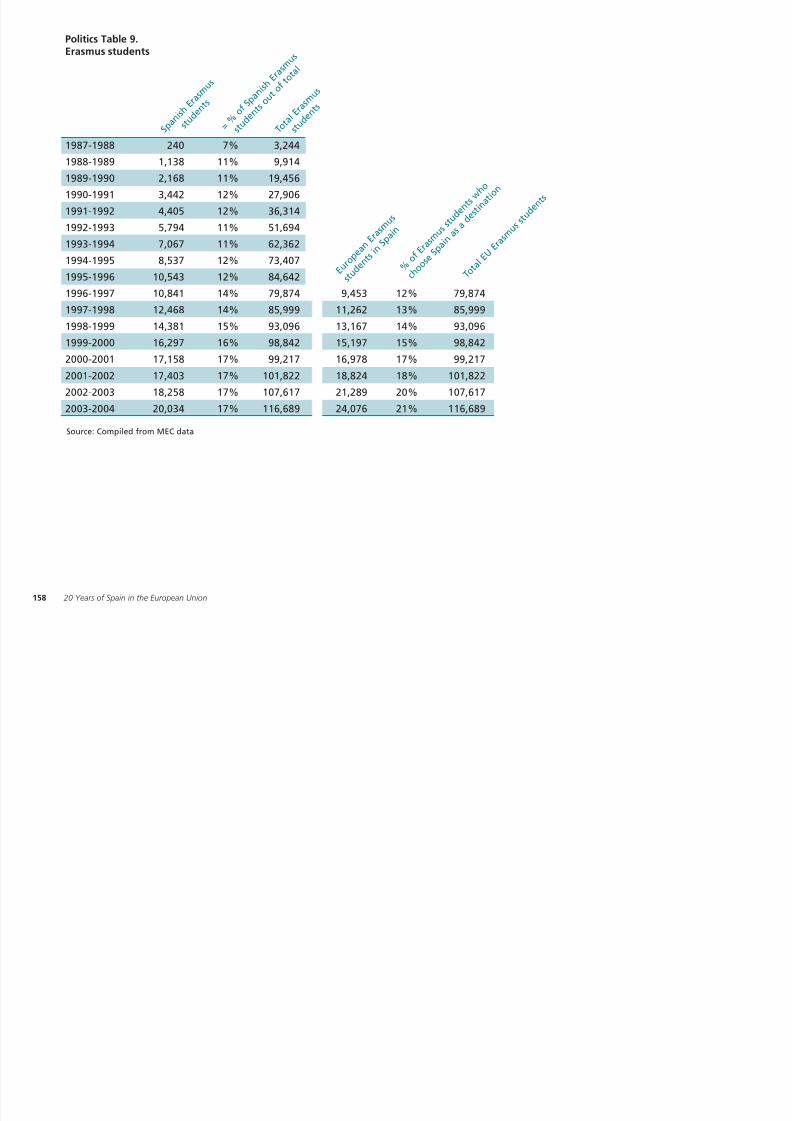
8/3/2019 20 Years of Spain
http://slidepdf.com/reader/full/20-years-of-spain 158/161
158 20 Years of Spain in the European Union
1993 1994 7,067 11% 62,362
1994-1995 8,537 12% 73,4071995-1996 10,543 12% 84,642
1996-1997 10,841 14% 79,874 9,453 12% 79,874
1997-1998 12,468 14% 85,999 11,262 13% 85,999
1998-1999 14,381 15% 93,096 13,167 14% 93,096
1999-2000 16,297 16% 98,842 15,197 15% 98,842
2000-2001 17,158 17% 99,217 16,978 17% 99,217
2001-2002 17,403 17% 101,822 18,824 18% 101,822
2002-2003 18,258 17% 107,617 21,289 20% 107,617
2003-2004 20,034 17% 116,689 24,076 21% 116,689
T o t a l E U E r
Source: Compiled from MEC data
E u r o p e
a n
s t u d e n t
s i n S
% o f E
r a
c h o o s e S p a
8/3/2019 20 Years of Spain
http://slidepdf.com/reader/full/20-years-of-spain 159/161
8/3/2019 20 Years of Spain
http://slidepdf.com/reader/full/20-years-of-spain 160/161
8/3/2019 20 Years of Spain
http://slidepdf.com/reader/full/20-years-of-spain 161/161
EUROPEAN PARLIAMENTOffice in Spain
www.europarl.es
EUROPEAN COMMISSIONOffice in Spain
http://europa.eu.int/spain
www.realinstitutoelcano.org