Embed Size (px)
Citation preview
1
COMPREHENSIVE STRATEGY FOR PESTICIDE RESIDUE ANALYSIS 1
THROUGH THE PRODUCTION CYCLE OF GILTHEAD SEA BREAM AND 2
ATLANTIC SALMON 3
T. Portolés1, M. Ibáñez1, B. Garlito1, J. Nácher-Mestre1,2§, V. Karalazos3, J. Silva4, M. 4
Alm5, R. Serrano1, J. Pérez-Sánchez2*, F. Hernández1*, M.H.G. Berntssen6* 5
1 Research Institute for Pesticides and Water (IUPA). Avda. Sos Baynat, s/n. University 6
Jaume I, 12071 Castellón, Spain. 7
2 Institute of Aquaculture of Torre la Sal (IATS, CSIC), 12595 Ribera de Cabanes, 8
Castellón, Spain. 9
3 BioMar R&D, Grangemouth FK3 8UL, UK. 10
4 BioMar AS, N-7010 Trondheim, Norway. 11
5 European Fat Processors and Renderers Association (EFPRA). Boulevard Baudouin 12
15 18, 4th floor, BE - 1000 Brussels. 13
6 National Institute of Nutrition and Seafood Research, PO Box 2029 Nordnes, N-5817 14
Bergen, Norway. 15
*= equally shared senior authorship. 16
§ Current address: Nutrigenomics and Fish Growth Endocrinology Group, Institute of 17
Aquaculture Torre la Sal, IATS-CSIC, Ribera de Cabanes, Castellón, Spain 18
19
20
21
22

2
ABSTRACT 23
Plant ingredients and processed animal proteins are alternative feedstuffs for fish feeds 24
in aquaculture. However, their use can introduce contaminants like pesticides that are 25
not previously associated with marine Atlantic salmon and gilthead sea bream farming. 26
This study covers the screening of around 800 pesticides by gas chromatography (GC) 27
and liquid chromatography (LC) coupled to high resolution time-of-flight mass 28
spectrometry in matrices throughout the entire marine food production chain. Prior to 29
analysis of real-world samples, the screening methodology was validated for 252 30
pesticides to establish the screening detection limit. This was 0.01 mg Kg-1 for 113 31
pesticides (45%), 0.05 mg Kg-1 for 73 pesticides (29%) and >0.05 mg Kg-1 for 66 32
pesticides (26%). After that, a quantitative methodology based on GC coupled to 33
tandem mass spectrometry with atmospheric pressure chemical ionization source (GC-34
APCI-MS/MS) was optimized for the pesticides found in the screening. Although 35
several polar pesticides, of which pirimiphos methyl and chlorpyriphos-methyl were 36
most dominant, were found in plant material and feeds based on these ingredients, none 37
of them were observed in fillets of Atlantic salmon and gilthead sea bream fed on these 38
feeds. 39
40
KEYWORDS 41
Fish, feed, processed animal products, screening, pesticides, quadrupole time-of-flight. 42
43
3
1. INTRODUCTION 44
The availability of wild fishery-derived raw materials is finite and the rapid and 45
sustained growth rate of global aquaculture have forced the industry to explore 46
alternative and more sustainable feed ingredients (Tacon and Metian, 2013). Much 47
attention has been paid to plant ingredients and experimental evidence supports a 48
successful replacement of marine feedstuffs at relatively high levels in most carnivorous 49
farmed fish, such as Atlantic salmon (Salmo salar) and gilthead seabream (Sparus 50
aurata) (Benedito-Palos et al., 2016; Ytrestøyl et al., 2015). Processed animal proteins 51
(PAPs) from the rendering industry, re-authorised for use in aquafeeds in the European 52
Union (EU) in 2013 (EC, 2013a), are another valuable source of feed ingredients for 53
farmed marine fish (Hatlen et al., 2015). 54
The use of these alternative feed ingredients can introduce contaminants that were 55
previously not associated with marine salmon and gilthead sea bream farming. One 56
example are pesticides that are world-wide pre and post harvest used on crops or as anti-57
parasite agent in farming of terrestrial animals. Well known organochlorine pesticides 58
(OCP) such as DDT and HCB have been mostly banned for agricultural use and are 59
associated with fish oil (Berntssen et al., 2010; Friesen et al., 2008; Nácher-Mestre et 60
al., 2009). These OCP pesticides have been replaced by less persistent and more water 61
soluble pesticides (Seiber, 2002). EU Maximum Residue Level (MRL) legislation for 62
non-OCP pesticides comprises most food commodities (EC, 2005), but for feed 63
ingredients and fish, specific harmonized EU MRLs are not yet established (EC, 64
2013b). This emphasizes the need for data on the occurrence of pesticides in feed 65
ingredients and the edible part of fish farmed on plant-based feeds. Extensive EU 66
surveillance programmes exist on pesticide residues in food (EFSA, 2013). Several 67
surveillance studies report on pesticides in terrestrial animals feed (i.e. (Gómez-Pérez et 68
4
al., 2015) as well as potential transfer of the pesticides to edible part of animals such as 69
meat milk and eggs (Kan and Meijer, 2007; Leeman et al., 2007). For farmed fish, 70
occurrence and feed-to-fillet transfer data on most (non POPs) pesticides, is limited 71
(Lovell et al., 1996; Nácher-Mestre et al., 2014). 72
In addition to the above findings, the different physico-chemical characteristics of 73
pesticides, together with the low concentration levels established by current legislation 74
and the complexity of the matrices make necessary the use of last generation analytical 75
techniques. Multi-residue methods (MRM) are applied with a clear tendency to liquid 76
chromatography-mass spectrometry (LC-MS), although gas chromatography-MS (GC-77
MS) is still required to widen the number of compounds investigated. Thus, the 78
combined use of GC and LC with tandem MS with last generation triple quadrupole 79
(QqQ) instruments is one of the best options to get the sensitivity and selectivity 80
required (Golge and Kabak, 2015; Hernández et al., 2013, Hernández et al., 2012). 81
Additionally, accurate-mass full-spectrum data obtained by high resolution MS opens 82
the possibility to provide a complete overview of pesticide pollution, and not only those 83
compounds initially targeted can be investigated. LC coupled to quadrupole-time of 84
flight (QTOF) MS with electrospray (ESI) source has been widely explored for the 85
screening of polar contaminants, their metabolites and transformation products (TPs) 86
(Hernández et al., 2015a; Hernández et al., 2014; Nácher-Mestre et al., 2013). In 87
relation to GC-MS, the soft ionization obtained from atmospheric pressure chemical 88
ionization (APCI) source in GC-MS instruments has offered attractive features for 89
screening purposes (Portolés et al., 2014; Portolés et al., 2010). All this, thereby, opens 90
fascinating perspectives in the analytical field (Hernández et al., 2015b; Pitarch et al., 91
2016) towards the screening of thousands of contaminants without standards (Castillo et 92
al., 2016; Hernández et al., 2015b; Krauss et al., 2010). 93

5
The present work is based on our previous research on screening of pesticide residues 94
(Nácher-Mestre et al., 2014, Nácher-Mestre et al., 2013) in farmed fish. A 95
comprehensive strategy is presented for screening, identification and quantification of 96
around 800 pesticides in commercially available plant and novel PAP feed ingredients 97
and their transfer to the edible part of farmed Atlantic salmon and gilthead sea bream 98
(two main species of the European aquaculture). The screening considers an initial 99
qualitative validation of 252 pesticides using GC-(APCI)QTOF MS and UHPLC-100
(ESI)QTOF MS, followed by a target quantitative assessment by GC-(APCI)MS/MS 101
QqQ for those pesticides identified in the qualitative validation. 102
2. MATERIALS AND METHODS 103
2.1 Chemicals and Reagents 104
All pesticides and isotopically labelled reference standards were purchased from Dr. 105
Ehrenstorfer (Augsburg, Germany) and Sigma Aldrich (St Louis, MO, USA). 106
Isotopically labelled internal standards (ILIS) Hexachlorobenzene-13C6, Tebuconazole-107
D6 and 4,4’-DDE-D8 were also purchased from Dr. Ehrenstorfer. All standards had 108
purities higher than 95%. Stock standard solutions (around 500 mg L-1) were prepared 109
in acetone and were stored at -20 °C. Twenty-two mixtures of pesticide standards 110
(individual concentration of each pesticide around 50 mg L-1) were prepared by dilution 111
of stock individual solutions in acetone. Working standard solutions containing all 112
pesticides were prepared by dilution of mixtures with acetone (for sample fortification 113
in GC), hexane (GC injection), methanol (for sample fortification in LC) and water 114
(instrument injection in LC). Stock standard solutions were stored at -20 ºC, whereas 115
working solutions were stored at 4 ºC. 116
6
HPLC-grade water was obtained from a MilliQ water purification system (Millipore 117
Ltd., Bedford, MA, USA). HPLC-grade methanol, HPLC-supragradient acetonitrile, 118
acetone (pesticide residue analysis quality) and n-hexane (all ultra-trace quality) were 119
purchased from Scharlab (Barcelona, Spain). Formic acid (HCOOH, content > 98%), 120
sodium hydroxide (NaOH, reagent grade) and ammonium acetate (NH4Ac, reagent 121
grade) were supplied by Scharlab. Anhydrous magnesium sulfate (extra pure) and 122
anhydrous sodium acetate (reagent grade) were purchased from Scharlab. Leucine 123
enkephalin (used as lock mass in LC) and heptacosa (for GC calibration) were 124
purchased from Sigma Aldrich. 125
QuEChERS commercial clean-up kits were purchased from Teknokroma (Barcelona, 126
Spain). Each kit contains 50 mg of primary-secondary amine (PSA), 150 mg of 127
anhydrous magnesium sulfate, and 50 mg of C18, in 2 mL microcentrifuge tubes for d-128
SPE. 129
130
2.2 Samples 131
A total of 76 samples were studied in this work as detailed in Table S1. The list 132
contains ingredients from different origin (plant, terrestrial animals and marine), and 133
also feeds based on these feed ingredients, as well as fillets of Atlantic salmon and 134
gilthead seabream reared on these feeds. Atlantic salmon and gilthead seabream were 135
fed by the produced feeds for 7 and 18 months, respectively, and fillet samples were 136
taken for analysis at the end of the exposure trial. The same feeds were provided 137
throughout the feeding trial. The screening and quantification was performed on feed 138
ingredients, feeds produced from the same feed ingredients, and fish fillets of fish fed 139
on these feeds. The feed samples were analysed at the beginning of the trial and no 140
stability assessment was made by analyzing the feed during storage. 141
7
Commercially available plant and marine feed ingredients were provided by BioMar 142
(Tech Center, Brande, Denmark) feed producer and PAPs from non-ruminants were 143
provided by the European Fat Processors and Renderers Association (EFPRA). All 144
PAPs were produced according the EU regulation for PAP intended for use as feed-145
ingredients in animal feed (EC, 2001, EC, 2009). The ingredients selected represent the 146
novelties in fish feed compositions to reduce the inclusion of fish derivatives. Fish feeds 147
for feeding trials were based on plant feed ingredients, and not PAPs, as higher levels of 148
pesticide residues were found in plant feed ingredients (see section 3).The feeds were 149
produced by BioMar under commercial aquafeed production techniques based on high-150
temperature extrusion processes, which potentially could affect pesticide residue levels. 151
152
2.3 Wide scope screening work-flow 153
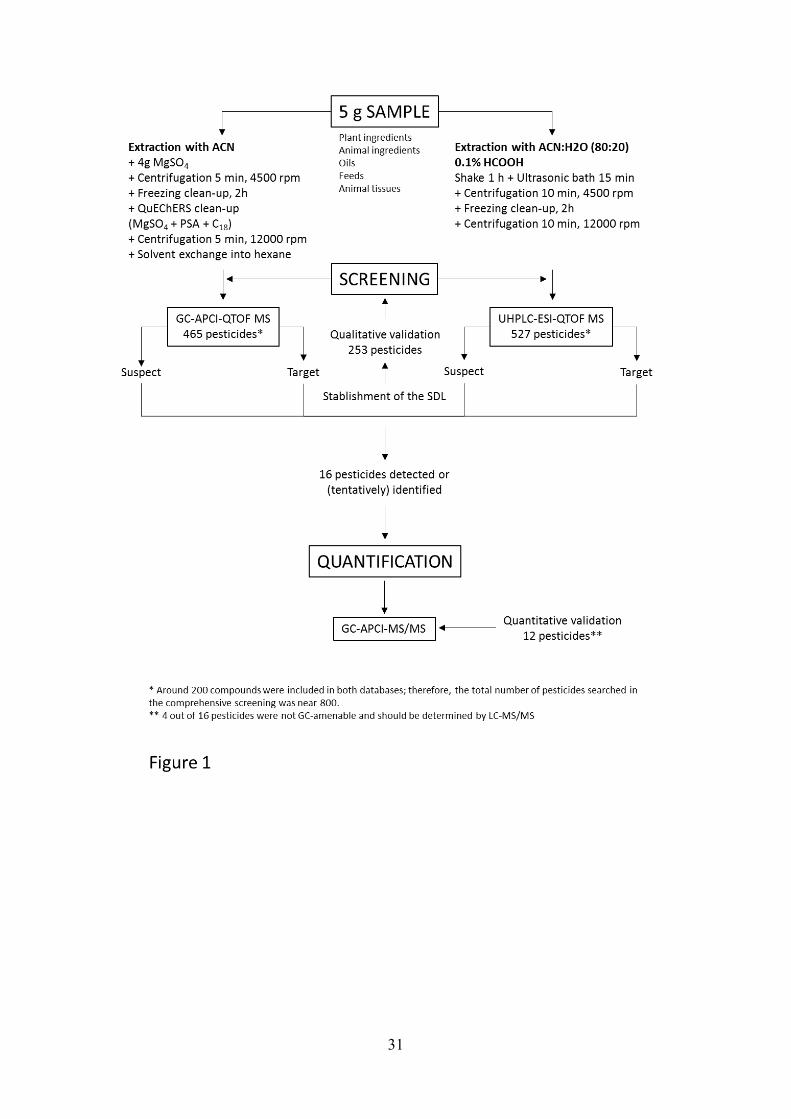
The sample procedure applied for pesticides screening and quantification is illustrated 154
in Fig. 1. Briefly, samples were thawed at room temperature and 5 g were accurately 155
weighed and transferred to centrifuge tubes (50 mL). For GC-analysis, samples were 156
extracted with acetonitrile (10 mL) and the extract was subsequently left in a freezer (at 157
least for two hours to precipitate proteins and fix lipids to the tube walls). Then, a 158
QuEChERS clean-up step was carried out prior injection in the GC-system (Nácher-159
Mestre et al., 2014). In the LC-screening, similar procedure was followed without any 160
purification or preconcentration step (Fig. 1). In this case, extraction of the samples was 161
carried out wih acetonitrile/water 80:20 (0.1% formic acid (Nácher-Mestre et al., 2013). 162
Pesticides found by the GC&LC-QTOF MS screening were subsequently confirmed 163
and quantified by GC-(APCI)MS/MS QqQ. Sample treatment was similar to that 164
applied for GC-screening with two slight variations: i) 1 g (instead of 5 g) of sample 165
was spiked with isotopically labelled internal standards and extracted with 2 ml of 166
8
acetonitrile (instead of 10 mL); ii) just before injection, 50 µL of the final acetonitrile 167
extract was diluted with 300 µL of acetone and 650 µL of hexane in order to make the 168
solution miscible. 169
170
2.4 Screening validation. 171
For qualitative analysis of GC-amenable compounds, an Agilent 7890A GC system 172
(Palo Alto, CA, USA) equipped with an Agilent 7693 autosampler was coupled to the 173
Xevo G2 QTOF (Waters, Manchester, UK), operating in APCI mode. (See more details 174
in supplementary information). For qualitative analysis of LC-amenable compounds, a 175
Waters Acquity UHPLC system (Waters, Milford, MA, USA) was coupled to a XEVO 176
G2 QTOF (Waters, Manchester, UK), with an orthogonal Z-spray-ESI interface 177
operating in both positive and negative ionization modes. (See more details in 178
supplementary information). 179
Validation of the two screening methods applied (GC-QTOF MS for 170 pesticides and 180
UHPLC-QTOF MS for 162 pesticides) was performed for qualitative purposes on the 181
basis of European analytical guidelines (Sanco, 2013). To this aim, at least twenty 182
sample matrices (including different feed ingredients, feed and fish) were spiked with 183
pesticides at two concentrations, 0.01 and 0.05 mg Kg-1 and, analyzed together with 184
their respective non-spiked samples (“blanks”) and method blanks to assure absence of 185
contamination along the procedure. The main parameter evaluated was screening 186
detection limit (SDL), which was the lowest concentration for which each pesticide was 187
detected in 95% of the spiked samples tested (e.g. 19 out of 20 samples) independently 188
of its recovery and precision. The detection of the compound was made by using the 189
most abundant ion measured at its accurate mass (typically the molecular ion or 190
(de)protonated molecule) in the LE function. This implied that at least one m/z ion was 191
9
observed at the expected retention time (Rt) (deviation accepted ± 0.2 min, in 192
comparison with the reference standard) with mass error below 5 ppm. 193
The GC-QTOF MS qualitative screening had been previously validated for 131 194
pesticides in twenty aquaculture samples in a previous work (Nácher-Mestre et al., 195
2014). In this work, validation was widened with 39 pesticides in relation to our 196
previous work and was tested for new sample matrices from the fish growing trials. To 197
this aim, 4 additional matrices (gilthead sea bream fillet, salmon fillet and two 198
additional fish feed) were spiked with the already validated 131 pesticides together with 199
the new 39 pesticides. For those 4 new matrices, a criteria of 4 positives out of 4 200
analyzed was required to accept the SDL. This allowed us to check and confirm the 201
SDLs previously established for the 131 pesticides, as well as establishing provisional 202
SDLs for the additional 39 pesticides studied. Furthermore, 6 PAP matrices were also 203
subjected to the same methodology, and spiked at the concentration levels indicated 204
above. With a requirement of 6 positives out of the 6 samples analyzed, provisional 205
SDLs were also established. 206
Regarding LC-QTOF MS screening, the validation has been performed in two steps as a 207
function of the availability of the samples. Similarly to GC-QTOF MS, in a first step, 208
the LC screening was qualitatively validated in twenty different sample matrices (feed 209
ingredients, feed and fish) spiked with 125 pesticides at two concentrations, 0.01 and 210
0.05 mg Kg-1, and the SDL was established. The detection was made by using the 211
(de)protonated molecule, so at least one m/z ion was found at the expected Rt (deviation 212
accepted ± 0.2 min) with mass error below 5 ppm. The LC qualitative screening was 213
widened, in a second step, with 36 pesticides. Also, 4 additional samples (the same as in 214
GC-QTOF MS) were spiked with the already validated 125 compounds and 36 more 215
pesticides. This allowed us to confirm the SDLs already established in the first step and 216

10
also establish provisional SDLs for the 36 new pesticides. Additionally, 6 PAPs were 217
also spiked at the concentration levels cited above and for those samples a criteria of 6 218
out of 6 was required to establish a provisional SDL. 219
220
2.5 Qualitative screening of aquaculture samples 221
The overall strategy proposed was applied to the screening of aquaculture samples from 222
a multidisciplinary European funded project (EU Seventh Framework Programme 223
ARRAINA Project 288925). Samples analyzed covered the whole production chain of 224
Atlantic salmon and gilthead sea bream. For these purposes, plant and marine 225
ingredients as raw materials for aquafeed compositions from feed producers were all 226
studied (Table S1). Fish tissues from gilthead sea bream and salmon feeding trials were 227
analyzed in parallel. After injection of the sample extracts, full-spectrum acquisition 228
data generated at low and high collision energy (MSE) were processed, using the 229
specialized application manager ChromaLynxXS (within MassLynx) in combination 230
with a home-made database containing 465 pesticides for GC and 527 for LC. Around 231
200 compounds were included in both databases; therefore, the total number of 232
pesticides searched in the comprehensive screening was near 800. The screening was 233
applied for those compounds that were qualitatively validated (thus, reference standards 234
were available) and also for those other pesticides included in the database, for which 235
reference standards were not available (suspect screening). The detection of a potential 236
positive was based on the presence of the (de)protonated molecule/molecular ion 237
(occasionally adducts), measured at its accurate mass, in the LE function (for both GC 238
and LC-QTOF). For this purpose, nw-XICs at the m/z of all compounds included in the 239
database were automatically performed in the LE function (150 ppm mass window) 240
11
(Hernández et al., 2015b). Data from HE function was used to confirm the identity 241
based to the presence of fragment ions. 242
When a sample was analyzed, the presence of chromatographic peak at the expected Rt, 243
together with the evaluation of the accurate-mass fragment ions and characteristic 244
isotopic ions, allowed the unequivocal confirmation of the identity of the compound 245
detected when the reference standard was available. In the case of suspect analysis, the 246
tentative identification was supported by MS/MS product ions reported in the literature 247
for the suspect compound (either in exact or nominal mass) and by the compatibility of 248
the fragment ion with the chemical structure of the candidate. Tentative identification 249
was finally confirmed by subsequent acquisition of the reference standard, which was 250
made at a later step. MassFragment software (Waters) was used to propose compatible 251
structures from accurate mass measurements of the observed fragment ions. 252
All compounds detected (only one ion with accurate mass and Rt agreement) and/or 253
identified (minimum two accurate-mass ions, with Rt and ion ratio agreement) were 254
included in the GC-(APCI)MS/MS quantitative method developed. Those compounds 255
from the suspect list that were just tentatively identified were also included in the target 256
quantitative method. 257
258
2.6 Quantitative analyses of aquacultural samples 259
Quantitative analysis of selected pesticides was performed in a GC system (Agilent 260
7890B, Palo Alto, CA, USA) equipped with an autosampler (Agilent 7693) and coupled 261
to QqQ mass spectrometer (Xevo TQ-S, Waters Corporation, Manchester, UK), 262
operating in APCI mode. (More details in supplementary information). 263
12
A quantitative method was optimized for those pesticides found in the screening of 264
samples. Validation of the GC-(APCI)MS/MS method was performed for 12 out of 16 265
pesticides detected and/or identified in the samples. The remaining four compounds, 266
flufenoxuron, tebufenozide, teflubenzuron and carbofuran-3OH, were not included in 267
the quantification step as they are not GC-amenable compounds. Accuracy (estimated 268
by means of recovery experiments) was evaluated by analyzing quality control (QC) 269
samples spiked at 0.005 and 0.05 mg Kg-1 in 26 “blank” samples (corresponding to 19 270
different matrices). The limit of quantification (LOQ) was established as the lowest 271
concentration for which the method showed satisfactory recovery (between 60 and 272
140%). Isotopically labeled internal standards were used to correct matrix effects and 273
potential errors associated to sample manipulation (Portolés et al., 2017). 274
275
3. RESULTS AND DISCUSSION 276
3.1. Target and suspect screening of feed ingredients, feed and transfer to farmed 277
fish 278
Regarding GC-QTOF screening validation, among the 131 pesticides already studied, 279
121 maintained the already established SDL: 0.01 mg Kg-1 (69 pesticides), 0.05 mg Kg-280
1 (34 pesticides) and > 0.05 mg Kg-1 (18 pesticides), and 4 improved/lowered this value 281
(carbophenothion, chlorfenson, pendimethalin and tau-fluvalinate) (see Table S2). Only 282
six pesticides did not pass the new criteria of 4 out of 4 in the new samples and 283
sacrificed the SDL from 0.01 to >0.05 mg Kg-1 (diphenylamine and leptophos), or from 284
0.05 to >0.05 mg Kg-1 (chlorothalonil, heptachlor epoxide A, heptachlor epoxide B and 285
propoxur). For the 39 additional pesticides studied in four new samples (including two 286
fish feed and two fish fillets), a provisional SDL was established as 0.01 mg Kg-1 for 13 287
pesticides, 0.05 mg Kg-1 for 17 pesticides and >0.05 mg Kg-1 for 9 pesticides based on 288

13
the 4 out of 4 criteria. SDLs obtained for PAPs coincided with those of feed ingredients, 289
feed and fish for the great majority of analytes (82% of cases, corresponding to 141 290
compounds). 291
Regarding LC-QTOF screening validation, for the first 125 pesticides studied, SDLs 292
were established as 0.01 mg Kg-1 (49 pesticides), 0.05 mg Kg-1 (31 pesticides) and > 293
0.05 mg Kg-1 (25 pesticides) and 18 improved/lowered this value (see Table S3). Only 294
two pesticides (chlorpropham and parathion-ethyl) did not pass the new criteria of 4 out 295
of 4 in the new samples and sacrificed the SDL from 0.05 to >0.05 mg Kg-1. For the 296
new 36 pesticides studied in four matrices, a tentative/provisional SDL was established 297
as 0.01 mg Kg-1 for 6 pesticides, 0.05 mg Kg-1 for 24 pesticides and >0.05 mg Kg-1 for 6 298
pesticides. SDL obtained for PAPs coincided with those for feed ingredients, feed and 299
fish in 136 cases (84%) and for the rest showed worst results except for hexaflumuron, 300
butachlor and omethoate. 301
In general, the evaluation of the SDL for ethoxyquin (ETQ) was troublesome due to the 302
presence of the analyte at high concentrations in the samples used for validation. 303
It is worth to mention that in some cases the same pesticide was included in both 304
screening methodologies, LC and GC. In those cases, the most favorable SDL was 305
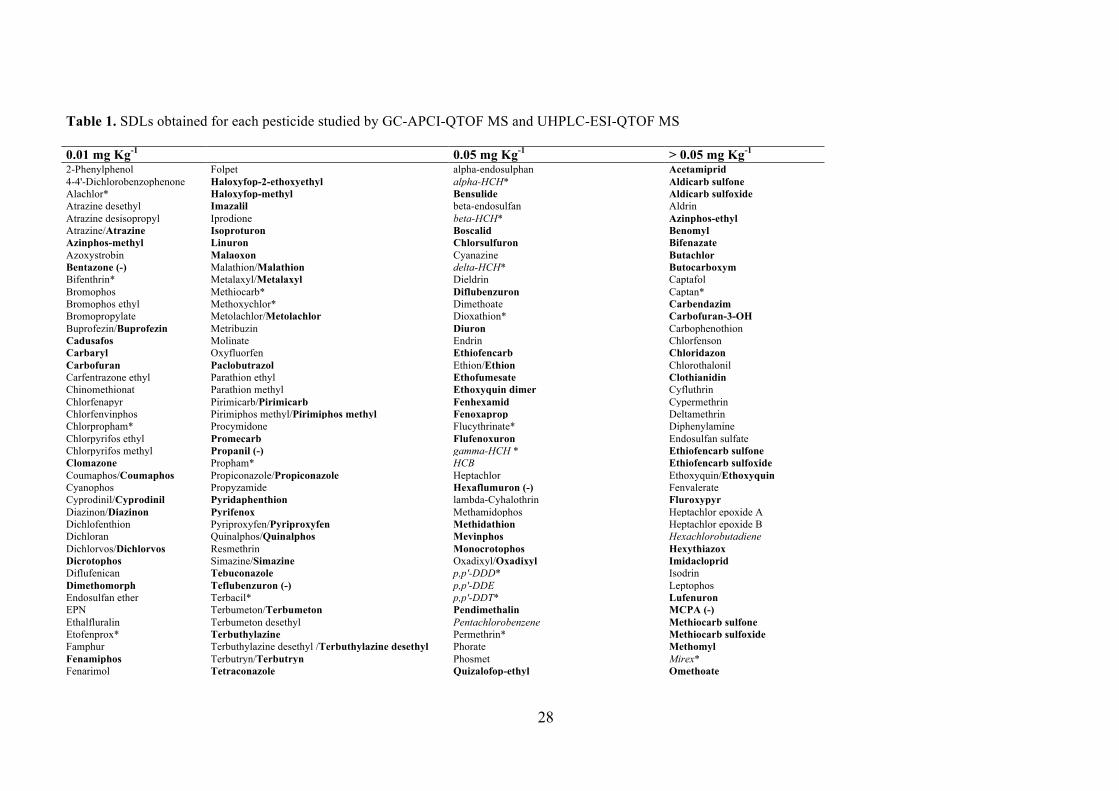
selected. In this way, Table 1 summarizes the final SDLs established for feed 306
ingredient, feed and fish for the 252 pesticides studied (removing duplicities resulting 307
from LC and GC analysis of the same compound). Overall, SDL values were 0.01 mg 308
Kg-1 for 113 pesticides (45%), 0.05 mg Kg-1 for 73 pesticides (29%) and a total of 66 309
pesticides could not be qualitatively validated (26%) at these levels. For most of them, 310
surely the method was not sensitive enough for the analyte/matrix tested, and higher 311
analyte concentrations (>0.05 mg Kg-1) should be tested. In addition, some pesticides 312

14
and sample matrices might require specific sample treatments and/or measurement 313
conditions in order to reach the low concentration levels tested in this work. 314
All the samples described in the experimental section, which contain ingredients from 315
different origin (plant, terrestrial animals and marine), and also different feed 316
compositions and fish tissues, were analyzed following the recommended procedure by 317
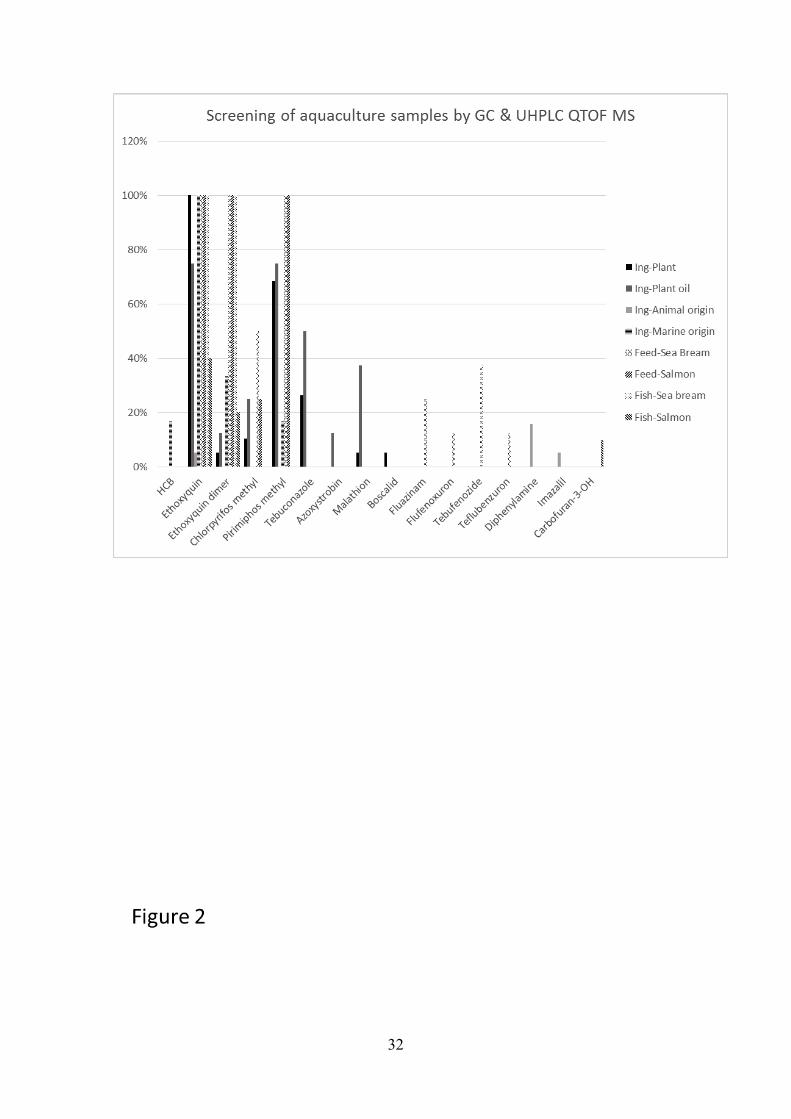
both GC-(APCI)QTOF MS and UHPLC-(ESI)QTOF MS. Fig. 2 illustrates the 318
pesticides detected, identified (confirmed with reference standard) and tentatively 319
identified in the screening of these aquaculture samples. 320
Pirimiphos methyl, was the compound more frequently identified by both techniques in 321
most ingredients (68% of plant protein, 75% plant oil ingredients and 17% of marine 322
ingredients) and in all the feed samples (salmon and sea bream). However, no residues 323
were found in the fish samples suggesting none feed to fish fillet transfer. Similarly, 324
chlorpyriphos methyl was detected, mainly by GC-(APCI)QTOF MS, in plant protein 325
(11%), plant oil ingredients (25%), gilthead sea bream feed (50%) and salmon feed 326
(25%) but not fish fillets. Foodborne chlorpyriphos-methyl is readily metabolized and 327
eliminated by fish, and its relative low biomagnification potential compared to POPs 328
(Varó et al., 2002) could explain the non-detectable fillet levels in fish that were fed on 329
low background levels in the present study. In addition, long term storage at high 330
temperatures could potentially affect the level of chlorpyrifos-methyl, but not 331
pirimiphos-methyl residues in corn products (White et al., 1997). In the present trial, no 332
assessment of the pesticide level during storage was made, which could have 333
contributed to possible absence of detectable pesticides in the fish fillets of fish fed on 334
the feeds. Earlier surveillance studies also identified chlorpyriphos methyl, and to a 335
lesser extend pirimiphos methyl, as some of the most frequent pesticide residues in 336
terrestrial animal feeds (Gómez-Pérez et al., 2015; Lovell et al., 1996). In contrast to the 337
15
present study, chlorpyriphos-methyl was also detected in fish from Taiwan markets and 338
fish feeds were suggested to be the main source of this compound in farmed fish (Sun 339
and Chen, 2008). 340
Other pesticides like the organochlorine pesticide HCB was found by GC-(APCI)QTOF 341
MS in one marine origin ingredient, which is a well-known OCP pesticide that behaves 342
as a POP with elevated levels in fish oil obtained from pelagic fish species (Berntssen et 343
al., 2010). The none-OCP pesticides, tebuconazole, azoxystrobin, malathion and 344
boscalid were found by UHPLC-(ESI)QTOF MS in plant-based ingredients (specially 345
in plant oil ingredients). In contrast to chlorpyriphos-methyl and pirimiphos-methyl, 346
these pesticides were not found in feed samples. The absence of these pesticides in feed 347
while present in the plant-based feed ingredients is likely due to the dilution effect 348
occurred when plant ingredients are mixed with other ingredients such as fish oil and 349
meal to produce fish feeds, causing levels below SDL. Then, flufenoxuron, 350
tebufenozide and teflubenzuron were identified (tebufenozide only detected) by 351
UHPLC-(ESI)QTOF MS in gilthead sea bream feed samples (among 13 and 38% of the 352
analyzed samples), but not in the feed ingredients used in these feeds or fillets of 353
seabream fed on these feeds. Ethoxyquin, which use is currently authorized as a feed 354
ingredient antioxidant supplement, was identified in all samples by both techniques 355
except plant oil ingredients (75%) and animal origin ingredients (only in 5%). 356
All cited compounds had been included in the target screening list, as reference 357
standards were available for them and had been previously included in the qualitative 358
screening validation protocol. Oppositely, the fungicide fluazinam, included in the 359
suspect list, was tentatively identified by UHPLC-(ESI)QTOF MS in two gilthead sea 360
bream feed samples. Fig. 3 illustrates the detection and tentative identification of this 361
compound in a gilthead sea bream feed sample by UHPLC-QTOF MS. The 362
deprotonated molecule of fluazinam was detected in the LE function in ESI negative 363
16
mode, with a mass error of -1.9 ppm. As the reference standard was not available, 364
chemical structures for the most abundant fragment ions were suggested based on their 365
accurate masses, using the MassFragment software (Waters). In the HE function, 2 366
fragments (m/z 415.9433 and 397.9768) were observed with chromatographic peaks at 367
the same Rt, and mass errors lower than 1.2 ppm in relation to the theoretical predicted 368
exact masses. All structures proposed for the fragments were compatible with the 369
chemical structure of fluazinam and were in accordance with the isotopic pattern 370
observed for the chlorine atoms present in the structure, making the identification even 371
more reliable. Moreover, the tentative identification was supported by the MS/MS 372
product ions reported in the literature (Pizzutti et al., 2009). After this careful evaluation 373
process, the reference standard was finally acquired and injected, allowing the ultimate 374
confirmation of this compound in the sample. 375
376
3.2 Quantitative analysis of identified pesticides and feed-to fillet transfer 377
QC recoveries were obtained at 0.005 and 0.05 mg Kg-1 in 19 different matrices, 378
ranging between 60% and 130% for most matrix/analyte combinations. A LOQ of 0.005 379
mg Kg-1 was obtained for azoxystrobin, boscalid, malathion, pirimiphos-methyl, 380
chlorpyriphos-methyl and ethoxyquin-dimer (ETQ-D) while it was 0.05 mg Kg-1 for 381
diphenylamine, tebuconazole and imazalil, this being the lower MRL established in the 382
current legislation for crops that can be used as feed ingredients. Regarding ethoxyquin, 383
the evaluation of its recovery was not feasible due to the presence of the analyte at high 384
concentrations in the samples used for validation. For the remaining two compounds, 385
fluazinam and hexachlorobenzene, the method was not suitable as they did not present 386
satisfactory results in most of the matrices). 387
17
All compounds reported as identified by QTOF screening were confirmed and 388
quantified by GC-(APCI)MS/MS. The only exceptions were fluazinam (2 samples), 389
flufenoxuron (1 sample), teflubenzuron (1 sample) and carbofuran-3OH (1 sample) 390
which were identified by UHPLC-QTOF MS but could not be included in GC-391
(APCI)MS/MS quantitative method due to their physico-chemical characteristics. 392
Additionally, there were another 37 detections in the screening, for which only one ion 393
measured at accurate mass at expected Rt was found and therefore their identity could 394
not be confirmed. 22 out of these 37 suspect positives could be confirmed and 395
quantified by QqQ while for rest seemed to be false detections. The greater sensitivity 396
of GC-MS/MS with QqQ in comparison to QTOF made it possible to report 47 new 397
positive findings that had not been detected previously or identified by QTOF 398
(ethoxyquin, ethoxyquin-dimer, boscalid, azoxystrobin, tebuconazole and imazalil). All 399
of them were quantified by QqQ at levels below 0.05 mg Kg-1 except for ethoxyquin 400
and ethoxyquin-dimer whose concentrations exceeded 0.05 mg Kg-1 in most of the 401
salmon fillets analyzed. As regards identification, all quantified pesticides were 402
identified by the use of three transitions and the compliance of at least one q/Q ratio. 403
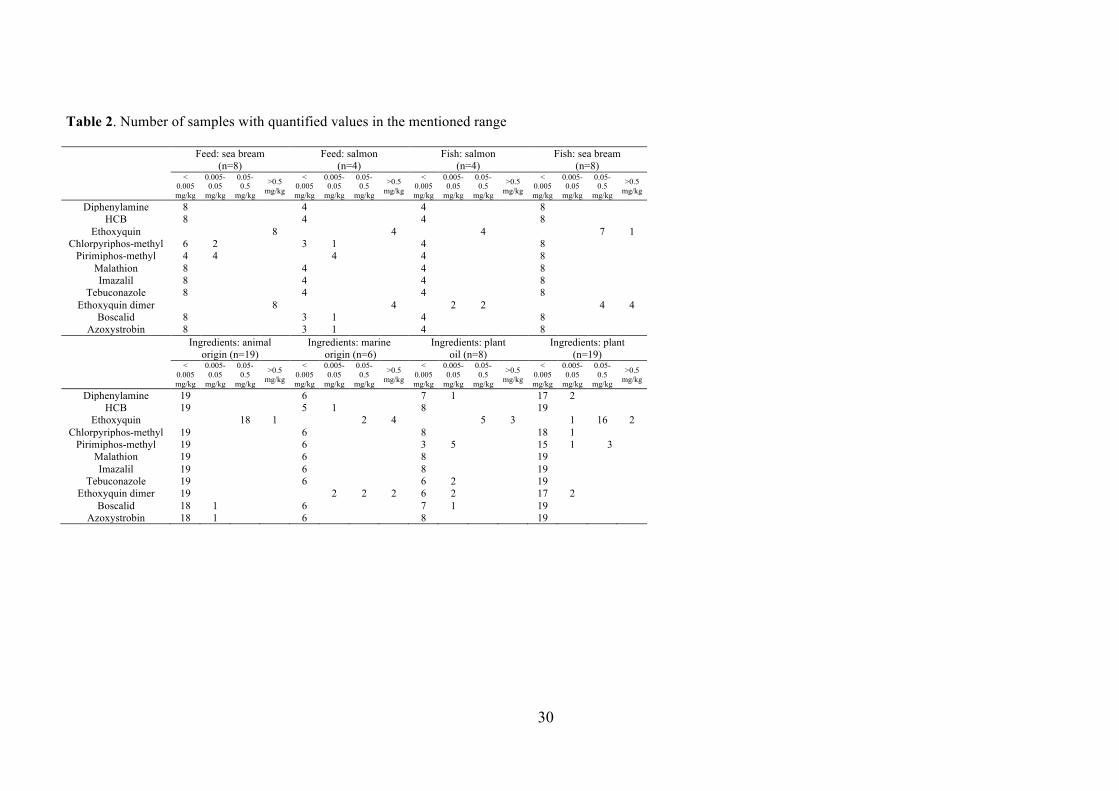
Table 2 summarizes the pesticide concentrations determined in the analyzed samples by 404
GC-(APCI)MS/MS. Ethoxyquin and ethoxyquin-dimer were found in all feed and fish 405
samples. Concentrations were above 0.5 mg Kg-1 in all feeds, in the range of 0.005 to 406
0.5 mg Kg-1 in salmon fillet and above 0.05 mg Kg-1 in gilthead sea bream. ETQ was 407
found at concentration levels above 0.05 mg Kg-1 in all ingredients with the exception of 408
one plant ingredient in the range of 0.005-0.05 mg Kg-1. ETQ-D was found below 409
0.005 mg Kg-1 except four plant ingredients in the range of 0.005 to 0.05 mg Kg-1 and, 410
above 0.005 mg Kg-1 in all marine origin ingredients. Earlier studies also reported the 411
overall presence of synthetic antioxidants such as ETQ in commercial feed and ETQ 412
18
and ETQ-D in farmed fish including Atlantic salmon, halibut, cod, and rainbow trout, 413
with mean (min.-max.) ETQ feed levels of 10 (1.4-32) mg Kg-1 and mean (min.-max.) 414
ETQ and ETQ-D levels of 0.06 (0.013-0.17) and 0.7 (0.29-1.5) mg Kg-1, respectively, 415
analyzed by means of HPLC coupled to fluorescence detection (Lundebye et al., 2010). 416
A concentration level around 0.01 mg Kg-1 of fungicides boscalid and azoxystrobin 417
were found in one feed sample (0.009 mg Kg-1 for both analytes), one PAP (0.007 and 418
0.008 mg Kg-1 respectively) and one plant oil (only boscalid at 0.007 mg Kg-1) although 419
not exceeding its MRL. The organophosphorous insecticides pirimiphos-methyl and 420
chlorpyriphos-methyl were found in 66% and 25% of the feed samples in a range of 421
0.006-0.030 mg Kg-1 and 0.005-0.009 mg Kg-1, respectively. The highest concentration 422
level of these two OP insecticides was found in a wheat gluten sample at 0.037 mg Kg-1 423
for chlorpyriphos-methyl and 0.191 mg Kg-1 for pirimiphos-methyl. Additionally, 424
pirimiphos-methyl was also found in five plant oil and three plant ingredient samples at 425
concentration levels among 0.005-0.5 mg Kg-1. No MRL exists for crop partly or 426
exclusively used for feed ingredients (EC, 2013a). Until specific feed ingredient MRLs 427
have been established, existing EU MRLs for food crop would apply, taking into 428
account an appropriate processing (EFSA, 2015). As no standard factors are known for 429
the processing of whole wheat into animal feed graded wheat gluten, no clear MRL can 430
be set. However the wheat MRLs for chlorpyriphos-methyl and pirimiphos-methyl are 431
respectively 3.0 and 5.0 mg Kg-1 which is respectively 25 and 135-fold higher than 432
levels found in present study. Regarding tebuconazole, it was found in two rapeseed oil 433
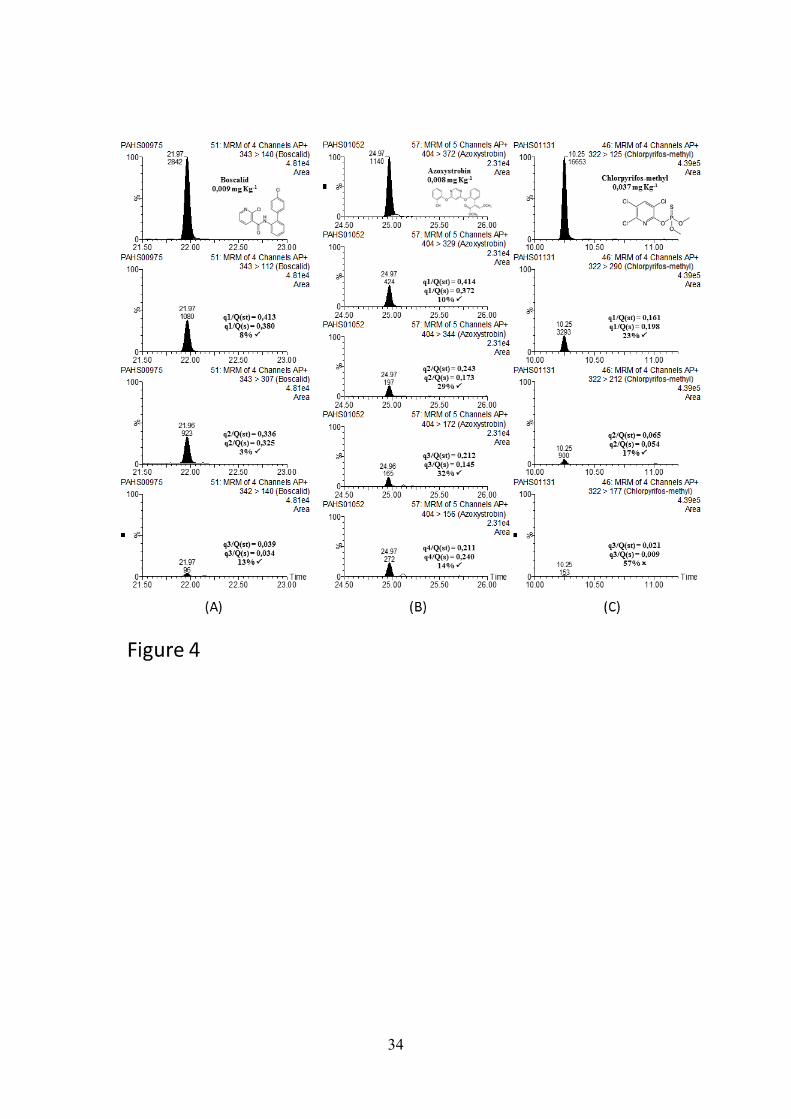
samples at concentration around 0.01 mg Kg-1. As an illustrative example, Fig. 4 shows 434
the GC-(APCI)MS/MS chromatograms obtained for the quantification and confirmation 435
of boscalid in one salmon feed (0.009 mg Kg-1), azoxystrobin in a poultry blood meal 436
(0.008 mg Kg-1) and chlorpyriphos-methyl in wheat gluten (0.037 mg Kg-1). Also, Fig. 437
19
S1 (a) shows the GC-(APCI)MS/MS chromatograms obtained for the quantification and 438
confirmation of pirimiphos-methyl in wheat gluten at concentration level of 0.191 mg 439
Kg-1. This ingredient is used to prepare a gilthead sea bream feed shown at Fig. S1 (b) 440
that contains the pirimiphos-methyl at concentration level of 0.007 mg Kg-1. This feed 441
represents a total replacement of 80% of fish meal by plant meal and 84% of the fish oil 442
by alternative plant oils. The gilthead sea bream fish fillet reared on this feed does not 443
shown any trace of pirimiphos methyl (Fig. S1(c)). 444
445
4. CONCLUSIONS 446
The developed strategy faces the “universal” pesticide analysis in aquaculture field by 447
means of combined use of LC-QTOF MS and GC-QTOF MS for screening, followed 448
by confirmation and quantification by GC-(APCI)MS/MS with QqQ, as most pesticide 449
detected in the screening were GC-amenable. The strategy proposed is among the most 450
comprehensive and informative in the pesticide analysis context as it covers a large list 451
of pesticides from different families. The overall strategy is presented as a risk 452
assessment tool available for the feed industry in order to widen the knowledge of novel 453
and traditional ingredients, feed and edible parts of consumed animals. The most 454
dominant polar pesticides found in plant feed ingredients and feed based on these 455
ingredients were pirimiphos-methyl and chlorpyriphos metyl. These pesticides were not 456
found in the fillets of fish fed on these feeds. 457
458
ACKNOWLEDGMENTS 459
This work has been funded by the EU Seventh Framework Programme ARRAINA 460
Project 288925 (Advanced Research Initiatives for Nutrition and Aquaculture), and the 461

20
Norwegian Research Council SAFETY-PAP project (227387) from the Sustainable 462
Innovation in Food and Bio-based Industries (Bionær) program. Additional funding 463
was obtained from Generalitat Valenciana (research group of excellence 464
PROMETEOII/2014/085; PROMETEOII/2014/023; ISIC 2012/016). This work has 465
been developed within the framework of the Research Unit of Marine Ecotoxicology 466
(IATS (CSIC)-IUPA (UJI)). 467
468
REFERENCES 469
Benedito-Palos, L., Ballester-Lozano, G.F., Simó, P., Karalazos, V., Ortiz, Á., Calduch-470
Giner, J., Pérez-Sánchez, J., 2016. Lasting effects of butyrate and low FM/FO 471
diets on growth performance, blood haematology/biochemistry and molecular 472
growth-related markers in gilthead sea bream (Sparus aurata). Aquaculture 454, 473
8-18. doi:10.1016/j.aquaculture.2015.12.008 474
Berntssen, M.H.G., Julshamn, K., Lundebye, A.-K., 2010. Chemical contaminants in 475
aquafeeds and Atlantic salmon (Salmo salar) following the use of traditional- 476
versus alternative feed ingredients. Chemosphere 78, 637–646. 477
doi:10.1016/j.chemosphere.2009.12.021 478
Castillo, N.I., Ibáñez, M., Beltrán, E., Rivera-Monroy, J., Ochoa, J.C., Páez-Castillo, 479
M., Posada-Buitrago, M.L., Sulyok, M., Hernández, F., 2016. Identification of 480
mycotoxins by UHPLC-QTOF MS in airborne fungi and fungi isolated from 481
industrial paper and antique documents from the Archive of Bogotá. Environ. 482
Res. 144, 130-138. doi:10.1016/j.envres.2015.10.031 483
EC, 2001. Regulation (EC) no 999/2001 of the european parliament and of the council 484
of 22 May 2001 laying down rules for the prevention, control and eradication of 485
21
certain transmissible spongiform encephalopathies. Official Journal of the 486
European Union L147, 1-38. 487
EC, 2005. REGULATION (EC) NO 396/2005 of the European parliament and of the 488
council of 23 February 2005 on maximum residue levels of pesticides in or on 489
food and feed of plant and animal origin and amending Council Directive 490
91/414/EEC. Official Journal of the European Union http://eur-491
lex.europa.eu/LexUriServ/LexUriServ.do?uri=OJ:L:2005:2070:0001:0016:EN:P492
DF (accessed 2002/2016). 493
EC, 2009. Regulation (EC) No 1069/2009 of the european parliament and of the council 494
of of 21 October 2009 laying down health rules as regards animal by-products 495
and derived products not intended for human consumption and repealing 496
Regulation (EC) No 1774 (Animal by-products Regulation). Official Journal of 497
the European Union L300, 1-33. 498
EC, 2013a. Commission regulation (EU) No 56/2013 of 16 January 2013 amending 499
Annexes I and IV to Regulation (EC) No 999/2001 of the European Parliament 500
and of the Council laying down rules for the prevention, control and eradication 501
of certain transmissible spongiform encephalopathies. Official Journal of the 502
European Union 21, 3-16. 503
EC, 2013b. Commission Regulation (EU) No 212/2013 of 11 March 2013 replacing 504
Annex I to Regulation (EC) No 396/2005 of the European Parliament and of the 505
Council as regards additions and modifications with respect to the products 506
covered by that Annex. Official Journal of the European Union, http://eur-507
lex.europa.eu/LexUriServ/LexUriServ.do?uri=OJ:L:2013:2068:0030:0052:EN:P508
DF (accessed 2002/2016). 509

22
EFSA, 2013. Scientific report of EFSA. The 2010 European Union Report on Pesticide 510
Residues in Food. EFSA Journal 11, 3130. 511
http://www.efsa.europa.eu/en/efsajournal/pub/3130 (accessed on 3102/3116) 512
EFSA, 2015. Reporting data on pesticide residues in food and feed according to 513
Regulation (EC) No 396/2005 (2014 data collection) European Food Safety 514
Authority. (accessed February 2016). 515
http://www.efsa.europa.eu/sites/default/files/scientific_output/fil, n.d. 516
Friesen, E.N., Ikonomou, M.G., Higgs, D.A., Keng, P.A., Dubetz, C., 2008. Use of 517
terrestrial based lipids in aquaculture feeds and the effects on flesh 518
organohalogen and fatty acid concentrations in farmed Atlantic salmon. Environ. 519
Sci. Technol. 42, 3519-3523. doi:10.1021/es0714843 520
Golge, O., Kabak, B., 2015. Evaluation of QuEChERS sample preparation and liquid 521
chromatography-triple-quadrupole mass spectrometry method for the 522
determination of 109 pesticide residues in tomatoes. Food Chem. 176, 319-322. 523
doi:10.1016/j.foodchem.2014.12.083 524
Gómez-Pérez, M.L., Romero-González, R., Martínez Vidal, J.L., Garrido Frenich, A., 525
2015. Analysis of veterinary drug and pesticide residues in animal feed by high-526
resolution mass spectrometry: comparison between time-of-flight and Orbitrap. 527
Food Addit. Contam. - Part A Chem. Anal. Control. Expo. Risk Assess. 32. 528
doi:10.1080/19440049.2015.1023742 529
Hatlen, B., Jakobsen, J.-V., Crampton, V., Alm, M., Langmyhr, E., Espe, M., Hevrøy, 530
E.M., Torstensen, B.E., Liland, N., Waagbø, R., 2015. Growth, feed utilization 531
and endocrine responses in Atlantic salmon (Salmo salar) fed diets added 532
poultry by-product meal and blood meal in combination with poultry oil. Aquac. 533
Nutr. 21, 214-725. doi:10.1111/anu.12194 534

23
Hernández, F., Ibañez, M., Portolés, T., 2012. Comprehensive environmental mass 535
spectrometry. Glendale (USA):ILM Publications. 536
Hernández, F., Cervera, M.I., Portolés, T., Beltrán, J., Pitarch, E., 2013. The role of GC-537
MS/MS with triple quadrupole in pesticide residue analysis in food and the 538
environment. Anal. Methods 5, 5875–5894. doi:10.1039/c3ay41104d 539
Hernández, F., Ibáñez, M., Bade, R., Bijlsma, L., Sancho, J.V., 2014. Investigation of 540
pharmaceuticals and illicit drugs in waters by liquid chromatography-high-541
resolution mass spectrometry. TrAC - Trends Anal. Chem. 63, 140-157. 542
doi:10.1016/j.trac.2014.08.003 543
Hernández, F., Ibáñez, M., Botero-Coy, A.-M., Bade, R., Bustos-López, M.C., Rincón, 544
J., Moncayo, A., Bijlsma, L., 2015a. LC-QTOF MS screening of more than 545
1,000 licit and illicit drugs and their metabolites in wastewater and surface 546
waters from the area of Bogotá, Colombia. Anal. Bioanal. Chem. 407, 6405-547
6416. doi:10.1007/s00216-015-8796-x 548
Hernández, F., Ibáñez, M., Portolés, T., Cervera, M.I., Sancho, J. V, López, F.J., 2015b. 549
Advancing towards universal screening for organic pollutants in waters. J. 550
Hazard. Mater. 282, 86–95. doi:10.1016/j.jhazmat.2014.08.006 551
Kan, C.A., Meijer, G.A.L., 2007. The risk of contamination of food with toxic 552
substances present in animal feed. Anim. Feed Sci. Technol. 133, 81-108. 553
doi:10.1016/j.anifeedsci.2006.08.005. 554
Krauss, M., Singer, H., Hollender, J., 2010. LC-high resolution MS in environmental 555
analysis: From target screening to the identification of unknowns. Anal. Bioanal. 556
Chem. 397, 943-951. doi:10.1007/s00216-010-3608-9 557
Leeman, W.R., Van Den Berg, K.J., Houben, G.F., 2007. Transfer of chemicals from 558
feed to animal products: The use of transfer factors in risk assessment, Food 559
Addit. Contam. 24, 1-13. doi:10.1080/02652030600815512. 560

24
Lovell, R.A., Mcchesney, D.G., Price, W.D., 1996. Organohalogen and 561
Organophosphorus Pesticides in Mixed Feed Rations: Findings from FDA’s 562
Domestic Surveillance during Fiscal Years 1989-1994. J. AOAC Int. 79, 544-563
548. 564
Lundebye, A.-K., Hove, H., Mage, A., Bohne, V.J.., Hamre, K., 2010. Levels of 565
synthetic antioxidants (ethoxyquin, butylated hydroxytoluene and butylated 566
hydroxyanisole) in fish feed and commercially farmed fish. Food Addit. 567
Contam. 27, 1652–1657. 568
Nácher-Mestre, J., Serrano, R., Benedito-Palos, L., Navarro, J.C., López, F.J., Pérez-569
Sánchez, J., 2009. Effects of fish oil replacement and re-feeding on the 570
bioaccumulation of organochlorine compounds in gilthead sea bream (Sparus 571
aurata L.) of market size. Chemosphere 76, 811-817. 572
doi:10.1016/j.chemosphere.2009.04.046 573
Nácher-Mestre, J., Ibáñez, M., Serrano, R., Pérez-Sánchez, J., Hernández, F., 2013. 574
Qualitative screening of undesirable compounds from feeds to fish by liquid 575
chromatography coupled to mass spectrometry. J. Agric. Food Chem. 61, 2077-576
2087. doi:10.1021/jf304478n 577
Nácher-Mestre, J., Serrano, R., Portolés, T., Berntssen, M.H.G., Pérez-Sánchez, J., 578
Hernández, F., 2014. Screening of pesticides and polycyclic aromatic 579
hydrocarbons in feeds and fish tissues by gas chromatography coupled to high-580
resolution mass spectrometry using atmospheric pressure chemical ionization. J. 581
Agric. Food Chem. 62, 2165–74. doi:10.1021/jf405366n 582
Pitarch, E., Cervera, M.I., Portolés, T., Ibáñez, M., Barreda, M., Renau-Pruñonosa, A., 583
Morell, I., López, F., Albarrán, F., Hernández, F., 2016. Comprehensive 584
monitoring of organic micro-pollutants in surface and groundwater in the 585

25
surrounding of a solid-waste treatment plant of Castellón, Spain. Sci. Total 586
Environ. 548–549, 211–20. doi:10.1016/j.scitotenv.2015.12.166 587
Pizzutti, I.R., de Kok, A., Hiemstra, M., Wickert, C., Prestes, O.D., 2009. Method 588
validation and comparison of acetonitrile and acetone extraction for the analysis 589
of 169 pesticides in soya grain by liquid chromatography-tandem mass 590
spectrometry. J. Chromatogr. A 1216, 4539-4552. 591
doi:10.1016/j.chroma.2009.03.064 592
Portolés, T., Sancho, J. V, Hernández, F., Newton, A., Hancock, P., 2010. Potential of 593
atmospheric pressure chemical ionization source in GC-QTOF MS for pesticide 594
residue analysis. J. Mass Spectrom. 45, 926–36. doi:10.1002/jms.1784 595
Portolés, T., Mol, J.G.J., Sancho, J. V, Hernández, F., 2014. Use of electron ionization 596
and atmospheric pressure chemical ionization in gas chromatography coupled to 597
time-of-flight mass spectrometry for screening and identification of organic 598
pollutants in waters. J. Chromatogr. A 1339, 145–53. 599
doi:10.1016/j.chroma.2014.03.001 600
Portóles, T., Garlito, B., Nácher-Mestre, J., Berntssen, M.H.G., Pérez-Sánchez, J., 2017. 601
Multi-class determination of undesirables in aquaculture samples by gas 602
chromatography/tandem mass spectrometry with atmospheric pressure chemical 603
ionization: a novel approach for polycyclic aromatic hydrocarbons. Submitted. 604
Sanco, 2013. SANCO/12571/2013. Guidance document on analytical quality control 605
and validation procedures for pesticide residues analysis in food and feed, 2013., 606
n.d. 607
Seiber, J.., 2002. Environmental fate of pesticides in: Wheeler, W.B. (Ed), Pesticides in 608
agriculture and the environment. New York. 609
26
Sun, F., Chen, H.-S., 2008. Monitoring of pesticide chlorpyrifos residue in farmed fish: 610
Investigation of possible sources. Chemosphere 71, 1866-1869. 611
doi:10.1016/j.chemosphere.2008.01.034 612
Tacon, A.G.J., Metian, M., 2013. Fish Matters: Importance of Aquatic Foods in Human 613
Nutrition and Global Food Supply. Rev. Fish. Sci. 21, 22-38. 614
doi:10.1080/10641262.2012.753405 615
Varó, I., Serrano, R., Pitarch, E., Amat, F., López, F.J., Navarro, J.C., 2002. 616
Bioaccumulation of chlorpyrifos through an experimental food chain: Study of 617
protein HSP70 as biomarker of sublethal stress in fish. Arch. Environ. Contam. 618
Toxicol. 42, 229-235. doi:10.1007/s00244-001-0013-6 619
White, N.D.G., Jayas, D.S., Demianyk, C.J., 1997. Degradation and biological impact 620
of chlorpyrifos-methyl on stored wheat and pirimiphos-methyl on stored maize 621
in Western Canada. J. Stored Prod. Res. 33, 125-135. doi:10.1016/S0022-622
474X(96)00049-5 623
Ytrestøyl, T., Aas, T.S., Åsgård, T., 2015. Utilisation of feed resources in production of 624
Atlantic salmon (Salmo salar) in Norway. Aquaculture 448, 365–374. 625
doi:10.1016/j.aquaculture.2015.06.023 626
627
628
FIGURE CAPTIONS 629
Fig. 1. Scheme of the sample procedure for screening and quantification of pesticides in 630
aquaculture field. 631
Fig. 2. Accumulated % of samples positives to pesticides detected or identified in the 632
screening of aquaculture samples by GC&LC QTOF MS 633

27
Fig. 3. Detection and identification of fungicide fluazinam by UHPLC-QTOF MS in a 634
gilthead sea bream feed sample (the reference standard was not available at our 635
laboratory in the time of the detection): (a) LE (bottom) and HE (top) spectra of the 636
compound eluting at 13.96 min. Proposed elemental compositions for fragment ions; (b) 637
extracted-ion chromatograms (150 ppm mass width) for protonated molecule in LE 638
function and different fragment ions in HE function. 639
Fig. 4. GC-(APCI)MS/MS chromatograms obtained for the quantification and 640
confirmation of boscalid in a) feed (0.009 mg Kg-1); b) azoxystrobin in animal origin 641
ingredient (0.008 mg Kg-1) and; c) chlorpyriphos-methyl in plant oil (0.037 mg Kg-1). 642
Q: Quantification transition; qi: qualification transitions. ü q/Q within accepted 643
tolerances.644
28
Table 1. SDLs obtained for each pesticide studied by GC-APCI-QTOF MS and UHPLC-ESI-QTOF MS
0.01 mg Kg-1 0.05 mg Kg-1 > 0.05 mg Kg-1 2-Phenylphenol Folpet alpha-endosulphan Acetamiprid 4-4'-Dichlorobenzophenone Haloxyfop-2-ethoxyethyl alpha-HCH* Aldicarb sulfone Alachlor* Haloxyfop-methyl Bensulide Aldicarb sulfoxide Atrazine desethyl Imazalil beta-endosulfan Aldrin Atrazine desisopropyl Iprodione beta-HCH* Azinphos-ethyl Atrazine/Atrazine Isoproturon Boscalid Benomyl Azinphos-methyl Linuron Chlorsulfuron Bifenazate Azoxystrobin Malaoxon Cyanazine Butachlor Bentazone (-) Malathion/Malathion delta-HCH* Butocarboxym Bifenthrin* Metalaxyl/Metalaxyl Dieldrin Captafol Bromophos Methiocarb* Diflubenzuron Captan* Bromophos ethyl Methoxychlor* Dimethoate Carbendazim Bromopropylate Metolachlor/Metolachlor Dioxathion* Carbofuran-3-OH Buprofezin/Buprofezin Metribuzin Diuron Carbophenothion Cadusafos Molinate Endrin Chlorfenson Carbaryl Oxyfluorfen Ethiofencarb Chloridazon Carbofuran Paclobutrazol Ethion/Ethion Chlorothalonil Carfentrazone ethyl Parathion ethyl Ethofumesate Clothianidin Chinomethionat Parathion methyl Ethoxyquin dimer Cyfluthrin Chlorfenapyr Pirimicarb/Pirimicarb Fenhexamid Cypermethrin Chlorfenvinphos Pirimiphos methyl/Pirimiphos methyl Fenoxaprop Deltamethrin Chlorpropham* Procymidone Flucythrinate* Diphenylamine Chlorpyrifos ethyl Promecarb Flufenoxuron Endosulfan sulfate Chlorpyrifos methyl Propanil (-) gamma-HCH * Ethiofencarb sulfone Clomazone Propham* HCB Ethiofencarb sulfoxide Coumaphos/Coumaphos Propiconazole/Propiconazole Heptachlor Ethoxyquin/Ethoxyquin Cyanophos Propyzamide Hexaflumuron (-) Fenvalerate Cyprodinil/Cyprodinil Pyridaphenthion lambda-Cyhalothrin Fluroxypyr Diazinon/Diazinon Pyrifenox Methamidophos Heptachlor epoxide A Dichlofenthion Pyriproxyfen/Pyriproxyfen Methidathion Heptachlor epoxide B Dichloran Quinalphos/Quinalphos Mevinphos Hexachlorobutadiene Dichlorvos/Dichlorvos Resmethrin Monocrotophos Hexythiazox Dicrotophos Simazine/Simazine Oxadixyl/Oxadixyl Imidacloprid Diflufenican Tebuconazole p,p'-DDD* Isodrin Dimethomorph Teflubenzuron (-) p,p'-DDE Leptophos Endosulfan ether Terbacil* p,p'-DDT* Lufenuron EPN Terbumeton/Terbumeton Pendimethalin MCPA (-) Ethalfluralin Terbumeton desethyl Pentachlorobenzene Methiocarb sulfone Etofenprox* Terbuthylazine Permethrin* Methiocarb sulfoxide Famphur Terbuthylazine desethyl /Terbuthylazine desethyl Phorate Methomyl Fenamiphos Terbutryn/Terbutryn Phosmet Mirex* Fenarimol Tetraconazole Quizalofop-ethyl Omethoate

29
Fenitrothion Tetradifon Spiroxamine Oxamyl Fenoxycarb Thiobencarb Tebufenpyrad Propamocarb Fenthion Tolclofos methyl Tefluthrin Propetamphos Fipronil/Fipronil (-) Triadimefon Terbacil (-) Propoxur Fluazifop-P-butyl Triflumizole Thiabendazole/Thiabendazole Simazine 2-hydroxy Fluazinam (-) Trifluralin Thiacloprid tau-Fluvalinate Fludioxonil* (-) Vinclozolin Thiodicarb Terbufos Flutriafol Thiophanate-methyl Terbuthylazine 2-hydroxy Triadimenol Thiamethoxam Tridemorph Thiram
Tolyfluanid*/Tolyfluanid
trans-Chlordane
Trichlorfon
Triforine
0.01 mg Kg-1 0.05 mg Kg-1 > 0.05 mg Kg-1
Azaconazole/Azaconazole Aldicarb Acequinocyl Bromuconazole Bixafen/Bixafen Benoxacor Clodinafop-propargyl Carbetamide/Carbetamide Bromoxynyl/Bromoxynil (-) Cyproconazole/Cyproconazole Difenoconazole Carbosulfan/Carbosulfan Dimethachlor Indoxacarb/Indoxacarb Chlordecone Epoxyconazol Ioxynil (-) Dalapon (-) Fenpropimorph Ioxynil-Octanoate Flumetrine Fluquinconazole Iprovalicarb/Iprovalicarb Oxydemeton-methyl Isopyrazam Isoxaben/Isoxaben Spiromesifen Mepanipyrim Methabenzthiazuron/Methabenzthiazuron Trinexapac acid (-) Mephosfolan/Mephosfolan Metrafenon/Metrafenone
Metconazole Oxydemeton-methyl Propazine/Propazine Procloraz/Procloraz Prosulfocarb Profenofos/Profenofos Tebuconazole Prothioconazole
Pymetrozine
Pyraclostrobin/Pyraclostrobin
Quintocene
Tebufenozide Tepraloxydim Tepraloxydim italic: GC under charge transfer conditions
bold: LC *: ion frangment (-): ESI neg
30
Table 2. Number of samples with quantified values in the mentioned range
Feed: sea bream
(n=8) Feed: salmon
(n=4) Fish: salmon
(n=4) Fish: sea bream
(n=8)
< 0.005 mg/kg
0.005-0.05
mg/kg
0.05-0.5
mg/kg
>0.5 mg/kg
< 0.005 mg/kg
0.005-0.05
mg/kg
0.05-0.5
mg/kg
>0.5 mg/kg
< 0.005 mg/kg
0.005-0.05
mg/kg
0.05-0.5
mg/kg
>0.5 mg/kg
< 0.005 mg/kg
0.005-0.05
mg/kg
0.05-0.5
mg/kg
>0.5 mg/kg
Diphenylamine 8 4 4 8 HCB 8 4 4 8 Ethoxyquin 8 4 4 7 1 Chlorpyriphos-methyl 6 2 3 1 4 8 Pirimiphos-methyl 4 4 4 4 8 Malathion 8 4 4 8 Imazalil 8 4 4 8 Tebuconazole 8 4 4 8 Ethoxyquin dimer 8 4 2 2 4 4
Boscalid 8 3 1 4 8 Azoxystrobin 8 3 1 4 8
Ingredients: animal origin (n=19)
Ingredients: marine origin (n=6)
Ingredients: plant oil (n=8)
Ingredients: plant (n=19)
< 0.005 mg/kg
0.005-0.05
mg/kg
0.05-0.5
mg/kg
>0.5 mg/kg
< 0.005 mg/kg
0.005-0.05
mg/kg
0.05-0.5
mg/kg
>0.5 mg/kg
< 0.005 mg/kg
0.005-0.05
mg/kg
0.05-0.5
mg/kg
>0.5 mg/kg
< 0.005 mg/kg
0.005-0.05
mg/kg
0.05-0.5
mg/kg
>0.5 mg/kg
Diphenylamine 19 6 7 1 17 2 HCB 19 5 1 8 19 Ethoxyquin 18 1 2 4 5 3 1 16 2 Chlorpyriphos-methyl 19 6 8 18 1 Pirimiphos-methyl 19 6 3 5 15 1 3 Malathion 19 6 8 19 Imazalil 19 6 8 19 Tebuconazole 19 6 6 2 19 Ethoxyquin dimer 19 2 2 2 6 2 17 2 Boscalid 18 1 6 7 1 19 Azoxystrobin 18 1 6 8 19
31
32

33
34