Embed Size (px)
Citation preview
The June 22, 2002, Changureh (Avaj) Earthquake, Iran
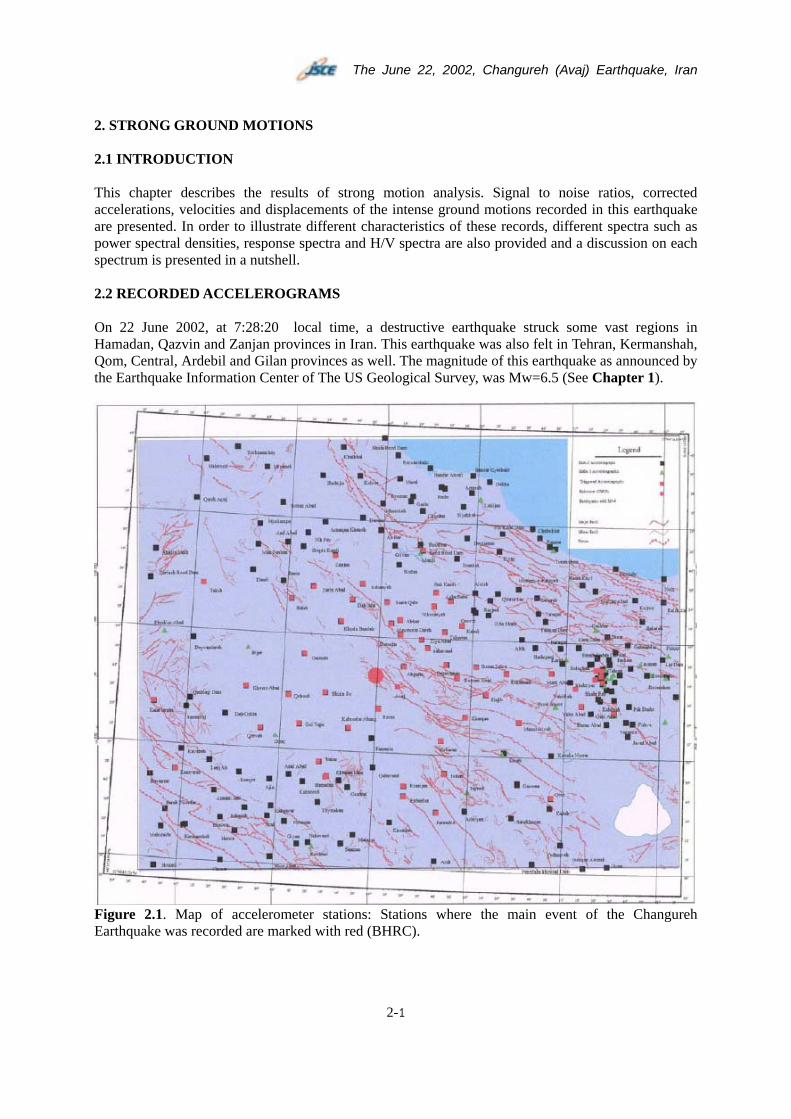
2. STRONG GROUND MOTIONS 2.1 INTRODUCTION This chapter describes the results of strong motion analysis. Signal to noise ratios, corrected accelerations, velocities and displacements of the intense ground motions recorded in this earthquake are presented. In order to illustrate different characteristics of these records, different spectra such as power spectral densities, response spectra and H/V spectra are also provided and a discussion on each spectrum is presented in a nutshell. 2.2 RECORDED ACCELEROGRAMS On 22 June 2002, at 7:28:20 local time, a destructive earthquake struck some vast regions in Hamadan, Qazvin and Zanjan provinces in Iran. This earthquake was also felt in Tehran, Kermanshah, Qom, Central, Ardebil and Gilan provinces as well. The magnitude of this earthquake as announced by the Earthquake Information Center of The US Geological Survey, was Mw=6.5 (See Chapter 1).
Figure 2.1. Map of accelerometer stations: Stations where the main event of the Changureh Earthquake was recorded are marked with red (BHRC).
2-1
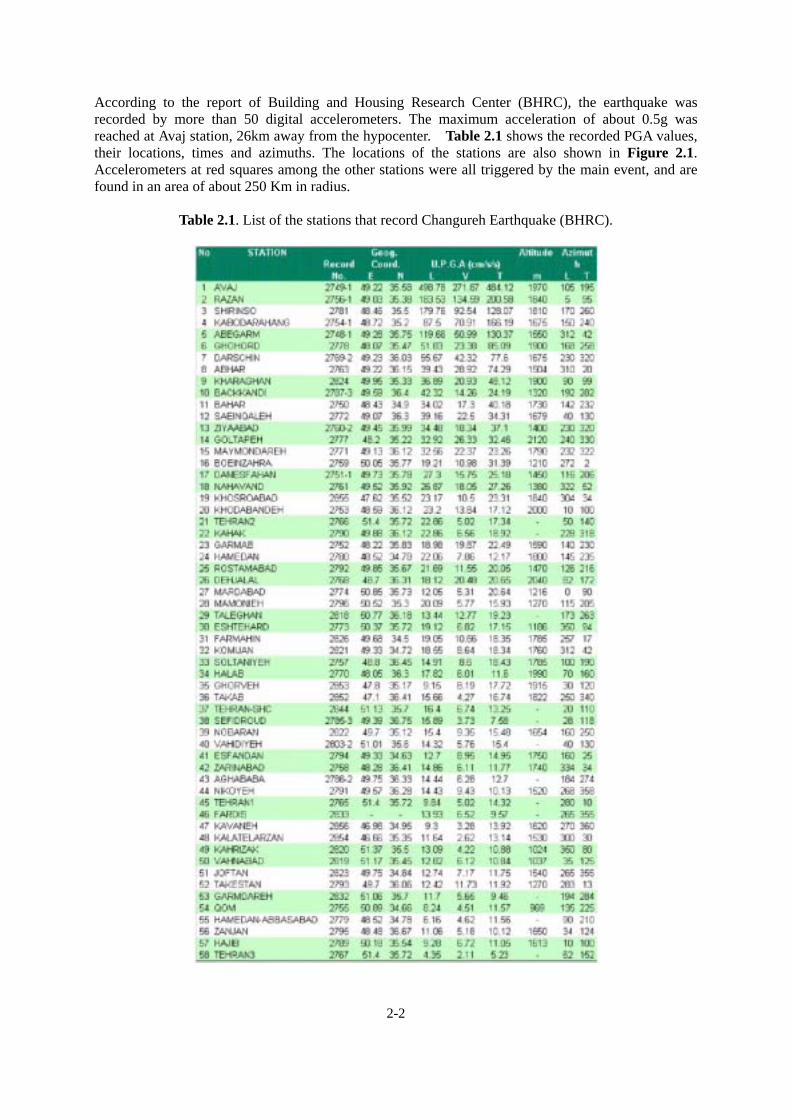
According to the report of Building and Housing Research Center (BHRC), the earthquake was recorded by more than 50 digital accelerometers. The maximum acceleration of about 0.5g was reached at Avaj station, 26km away from the hypocenter. Table 2.1 shows the recorded PGA values, their locations, times and azimuths. The locations of the stations are also shown in Figure 2.1. Accelerometers at red squares among the other stations were all triggered by the main event, and are found in an area of about 250 Km in radius.
Table 2.1. List of the stations that record Changureh Earthquake (BHRC).
2-2
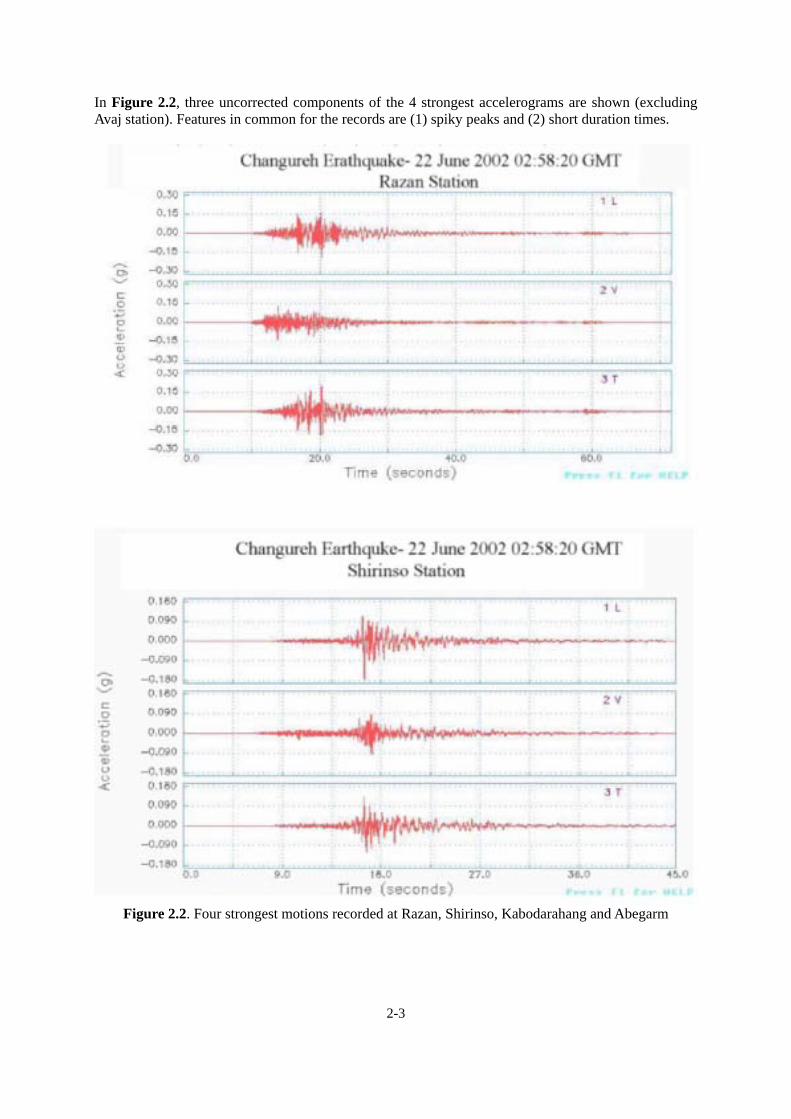
In Figure 2.2, three uncorrected components of the 4 strongest accelerograms are shown (excluding Avaj station). Features in common for the records are (1) spiky peaks and (2) short duration times.
Figure 2.2. Four strongest motions recorded at Razan, Shirinso, Kabodarahang and Abegarm
2-3
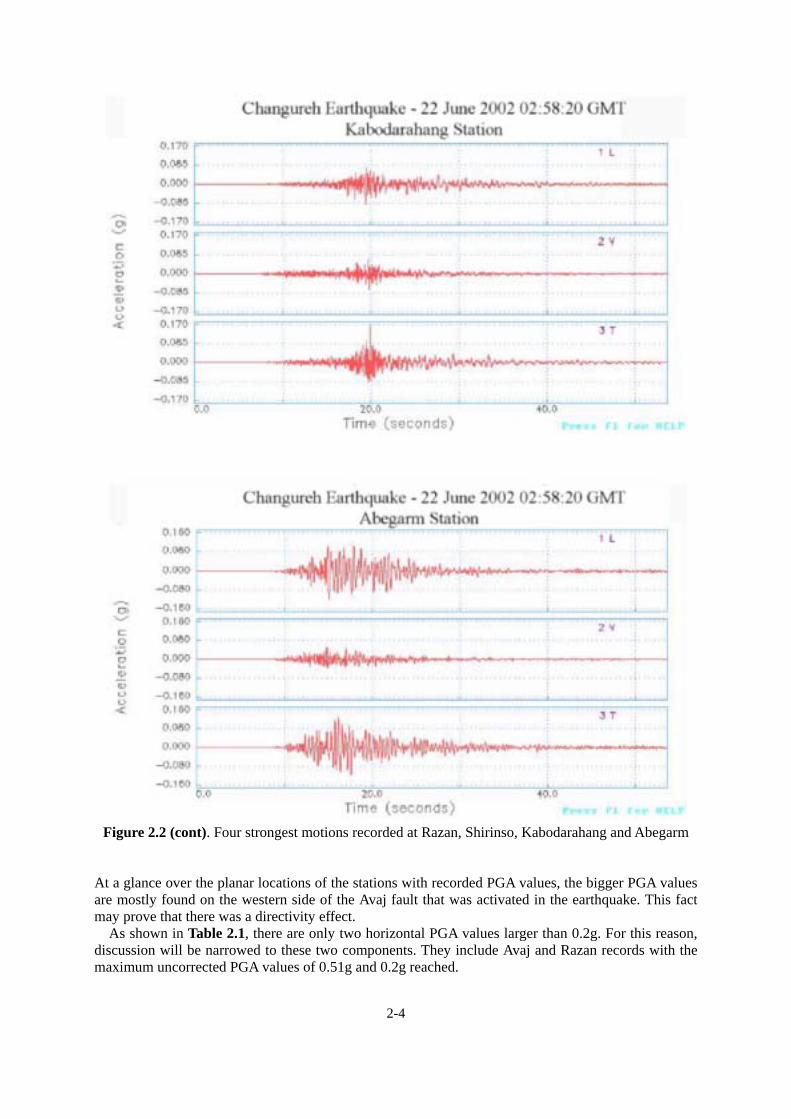
Figure 2.2 (cont). Four strongest motions recorded at Razan, Shirinso, Kabodarahang and Abegarm
At a glance over the planar locations of the stations with recorded PGA values, the bigger PGA values are mostly found on the western side of the Avaj fault that was activated in the earthquake. This fact may prove that there was a directivity effect.
As shown in Table 2.1, there are only two horizontal PGA values larger than 0.2g. For this reason, discussion will be narrowed to these two components. They include Avaj and Razan records with the maximum uncorrected PGA values of 0.51g and 0.2g reached.
2-4
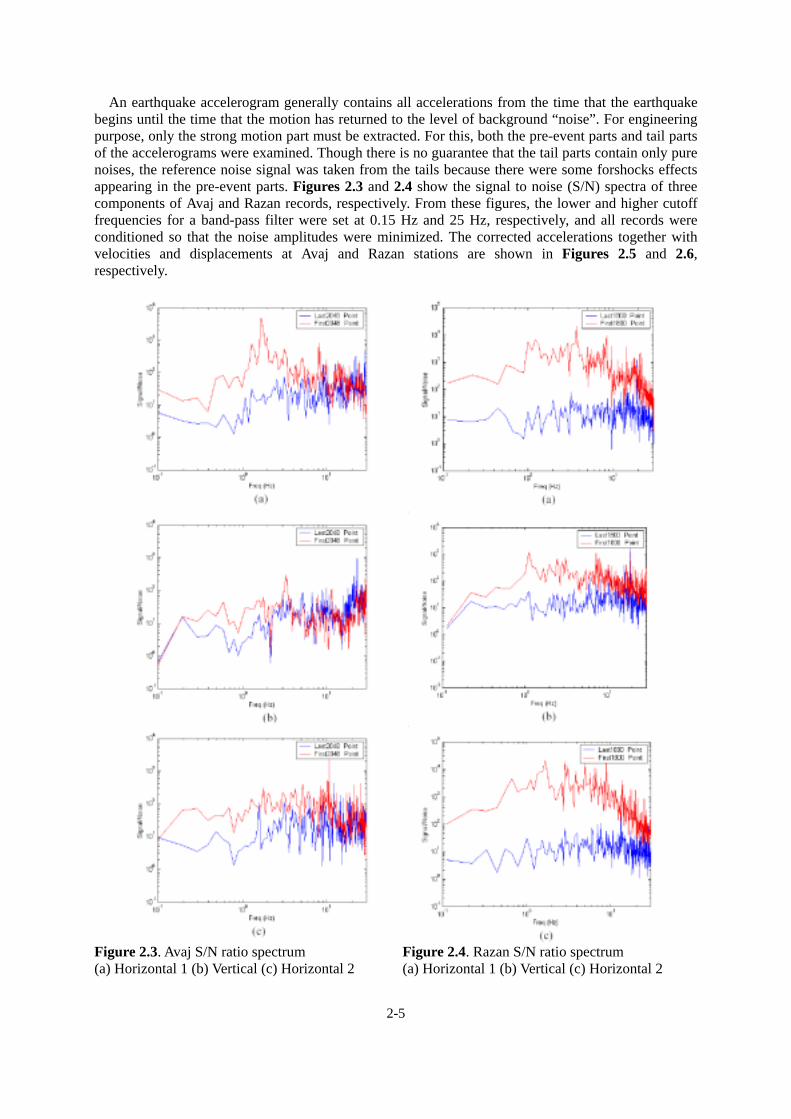
An earthquake accelerogram generally contains all accelerations from the time that the earthquake begins until the time that the motion has returned to the level of background “noise”. For engineering purpose, only the strong motion part must be extracted. For this, both the pre-event parts and tail parts of the accelerograms were examined. Though there is no guarantee that the tail parts contain only pure noises, the reference noise signal was taken from the tails because there were some forshocks effects appearing in the pre-event parts. Figures 2.3 and 2.4 show the signal to noise (S/N) spectra of three components of Avaj and Razan records, respectively. From these figures, the lower and higher cutoff frequencies for a band-pass filter were set at 0.15 Hz and 25 Hz, respectively, and all records were conditioned so that the noise amplitudes were minimized. The corrected accelerations together with velocities and displacements at Avaj and Razan stations are shown in Figures 2.5 and 2.6, respectively.
Figure 2.3. Avaj S/N ratio spectrum (a) Horizontal 1 (b) Vertical (c) Horizontal 2
Figure 2.4. Razan S/N ratio spectrum (a) Horizontal 1 (b) Vertical (c) Horizontal 2
2-5
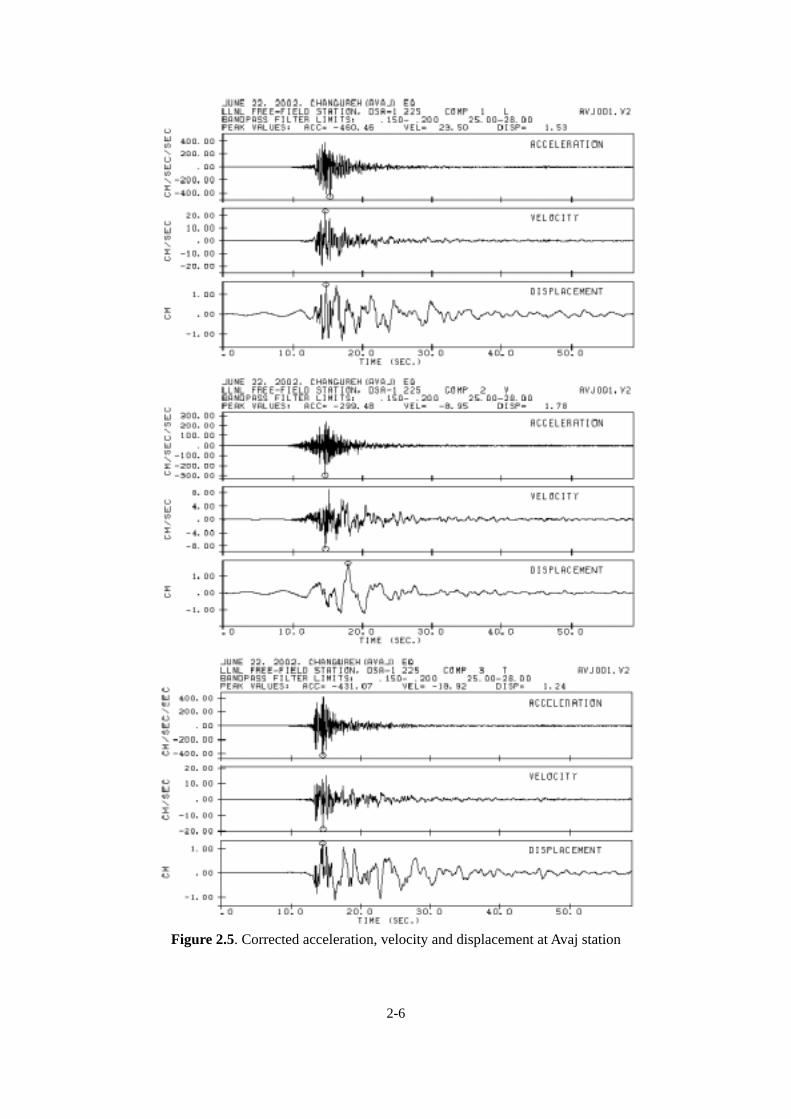
Figure 2.5. Corrected acceleration, velocity and displacement at Avaj station
2-6
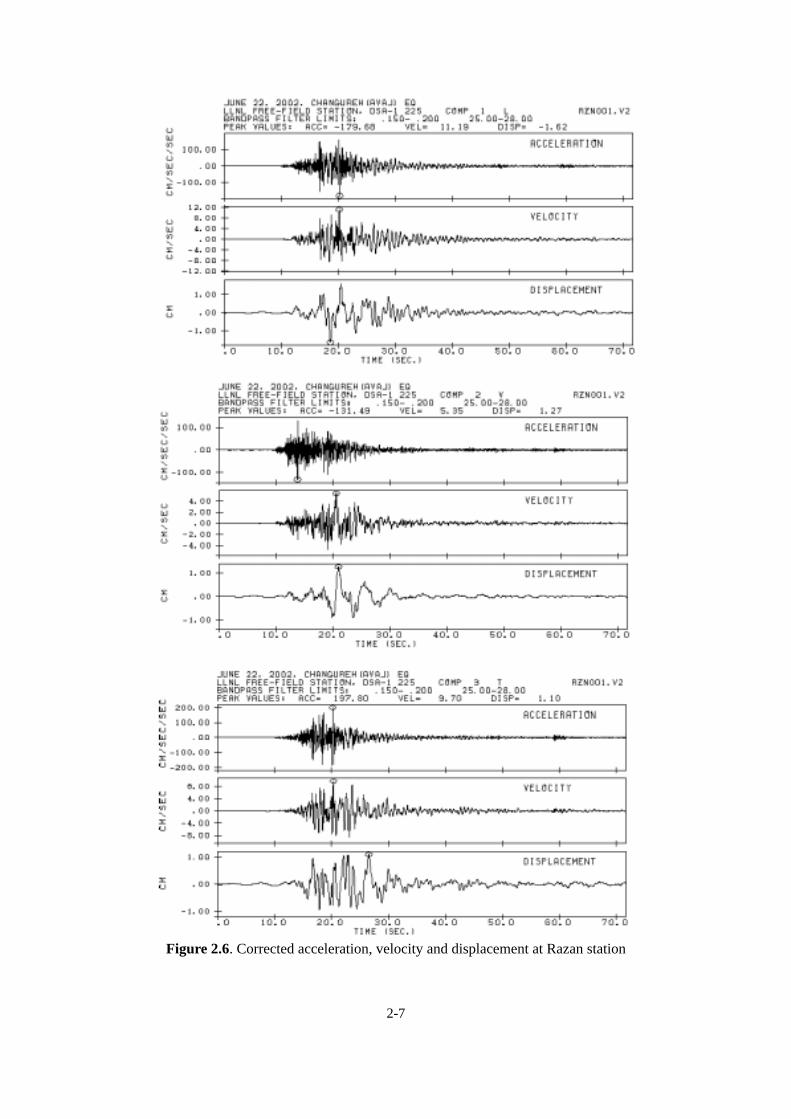
Figure 2.6. Corrected acceleration, velocity and displacement at Razan station
2-7
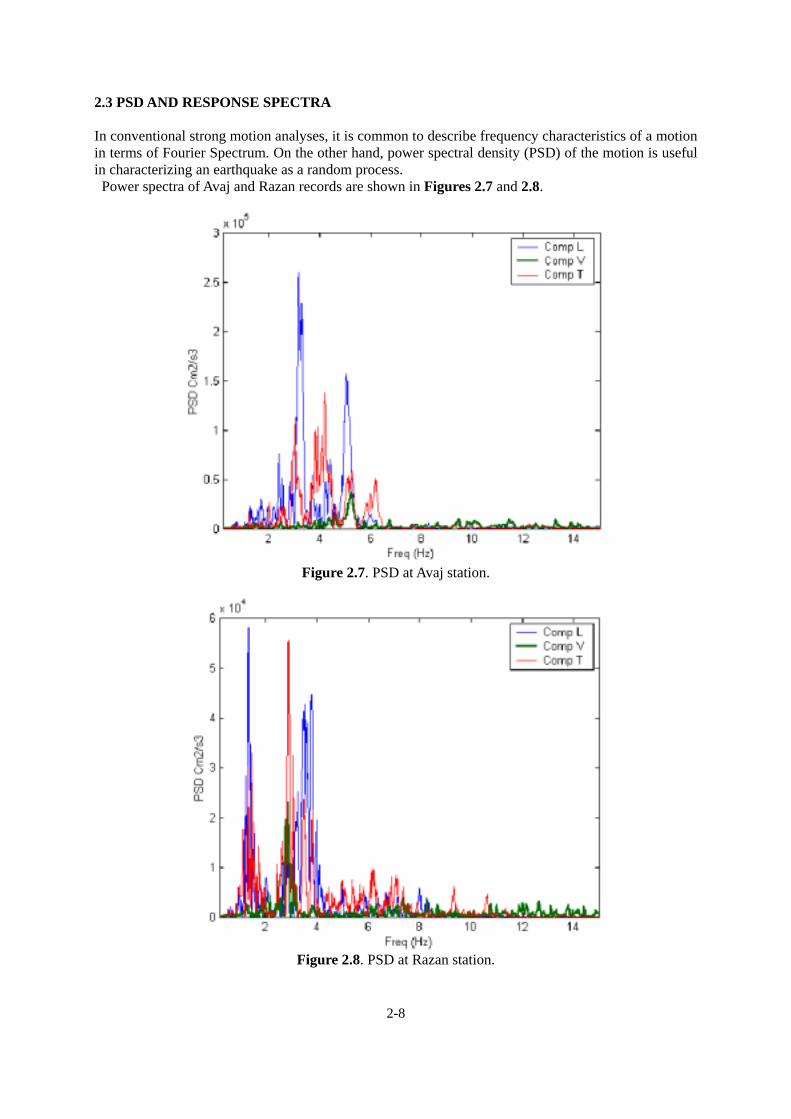
2.3 PSD AND RESPONSE SPECTRA In conventional strong motion analyses, it is common to describe frequency characteristics of a motion in terms of Fourier Spectrum. On the other hand, power spectral density (PSD) of the motion is useful in characterizing an earthquake as a random process. Power spectra of Avaj and Razan records are shown in Figures 2.7 and 2.8.
Figure 2.7. PSD at Avaj station.
Figure 2.8. PSD at Razan station.
2-8
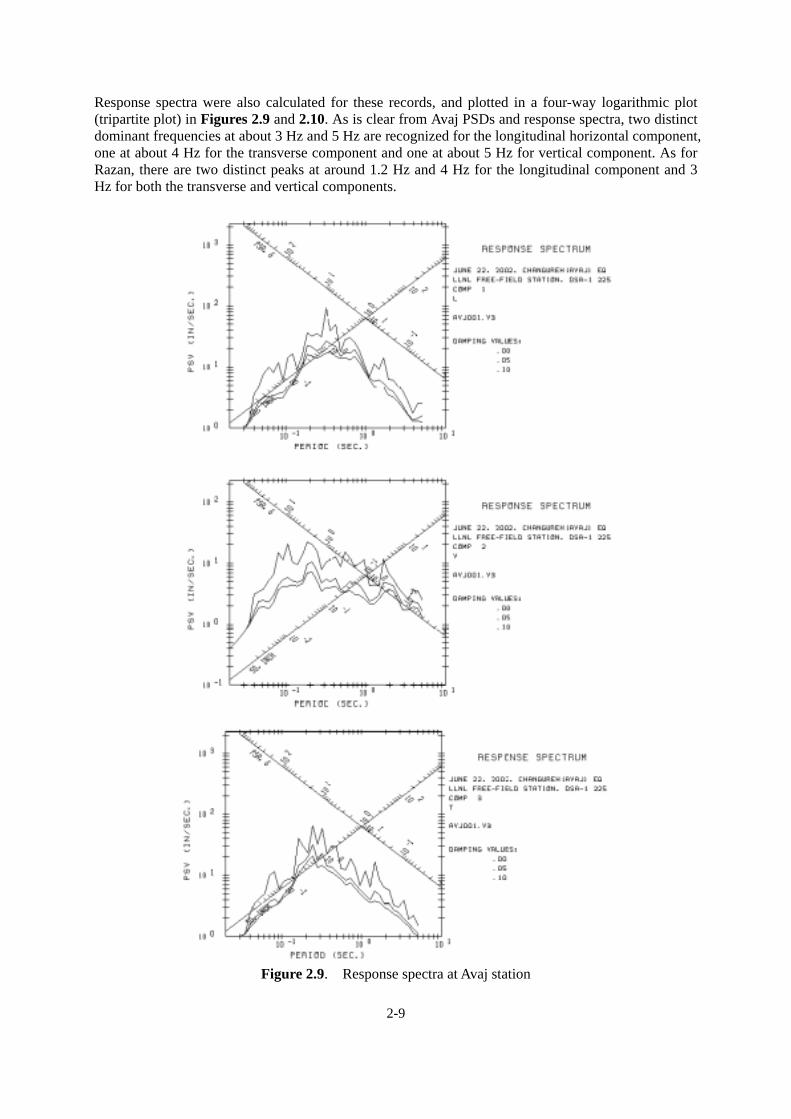
Response spectra were also calculated for these records, and plotted in a four-way logarithmic plot (tripartite plot) in Figures 2.9 and 2.10. As is clear from Avaj PSDs and response spectra, two distinct dominant frequencies at about 3 Hz and 5 Hz are recognized for the longitudinal horizontal component, one at about 4 Hz for the transverse component and one at about 5 Hz for vertical component. As for Razan, there are two distinct peaks at around 1.2 Hz and 4 Hz for the longitudinal component and 3 Hz for both the transverse and vertical components.
Figure 2.9. Response spectra at Avaj station
2-9
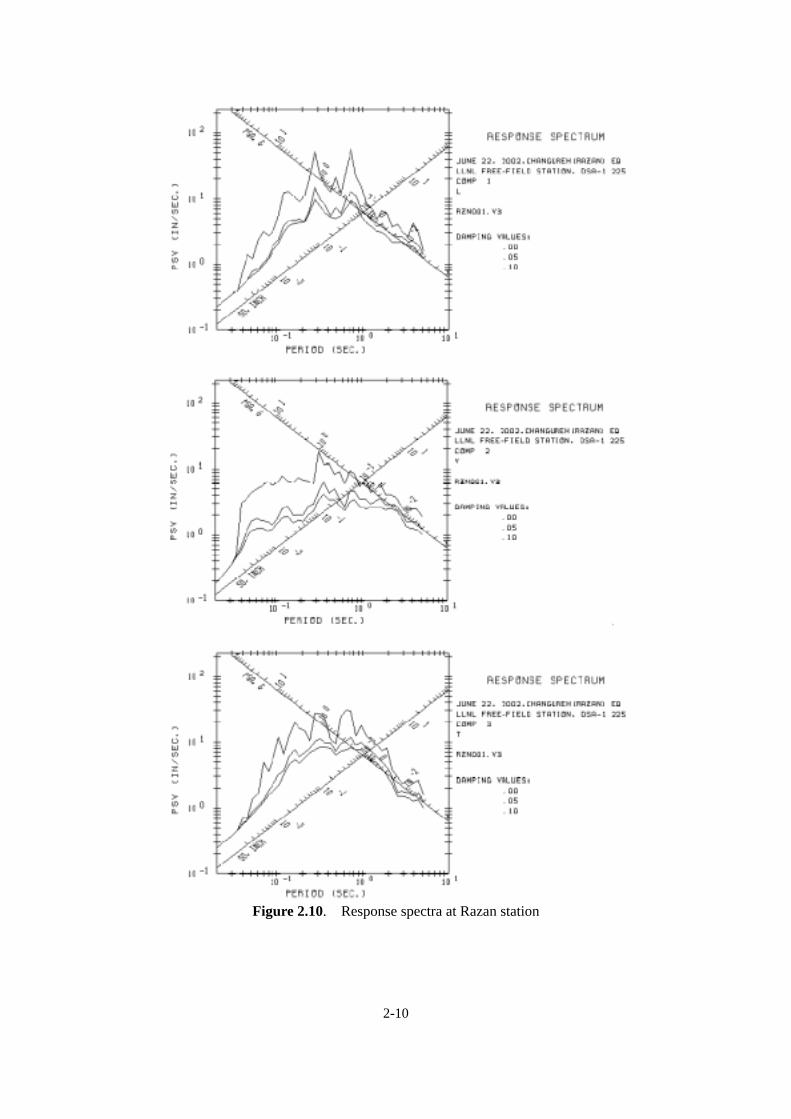
Figure 2.10. Response spectra at Razan station
2-10
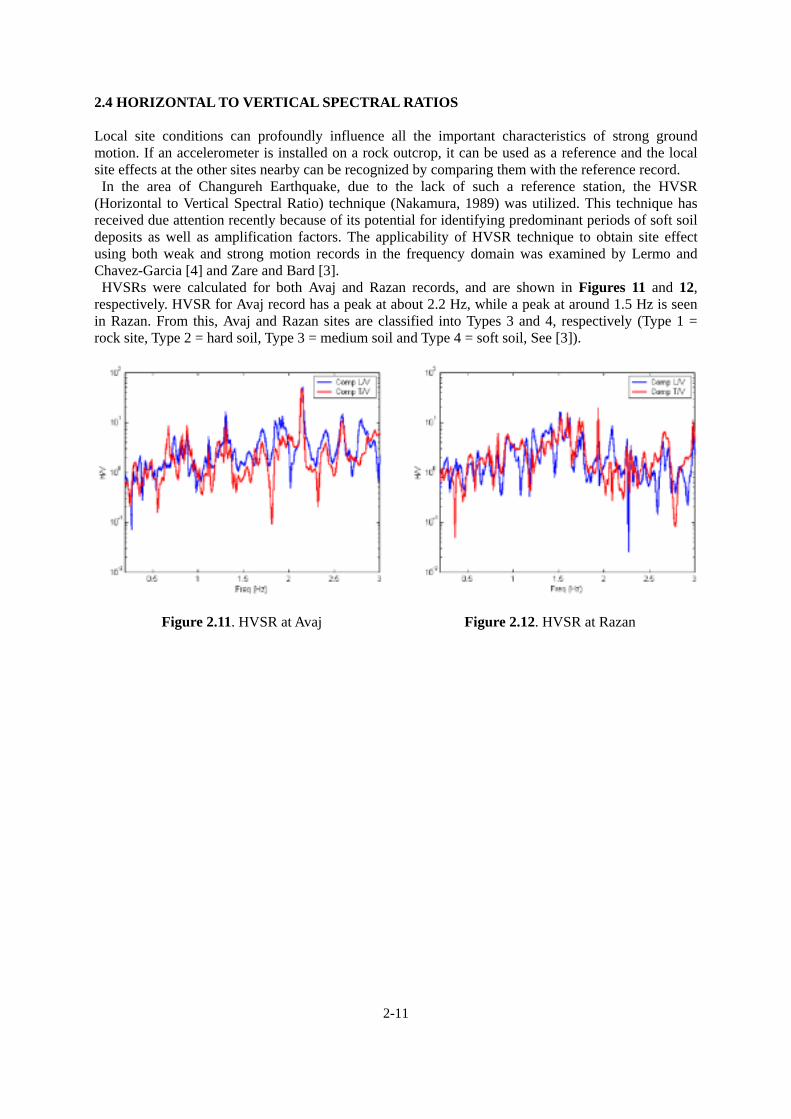
2.4 HORIZONTAL TO VERTICAL SPECTRAL RATIOS Local site conditions can profoundly influence all the important characteristics of strong ground motion. If an accelerometer is installed on a rock outcrop, it can be used as a reference and the local site effects at the other sites nearby can be recognized by comparing them with the reference record. In the area of Changureh Earthquake, due to the lack of such a reference station, the HVSR (Horizontal to Vertical Spectral Ratio) technique (Nakamura, 1989) was utilized. This technique has received due attention recently because of its potential for identifying predominant periods of soft soil deposits as well as amplification factors. The applicability of HVSR technique to obtain site effect using both weak and strong motion records in the frequency domain was examined by Lermo and Chavez-Garcia [4] and Zare and Bard [3]. HVSRs were calculated for both Avaj and Razan records, and are shown in Figures 11 and 12, respectively. HVSR for Avaj record has a peak at about 2.2 Hz, while a peak at around 1.5 Hz is seen in Razan. From this, Avaj and Razan sites are classified into Types 3 and 4, respectively (Type 1 = rock site, Type 2 = hard soil, Type 3 = medium soil and Type 4 = soft soil, See [3]).
Figure 2.11. HVSR at Avaj Figure 2.12. HVSR at Razan
2-11
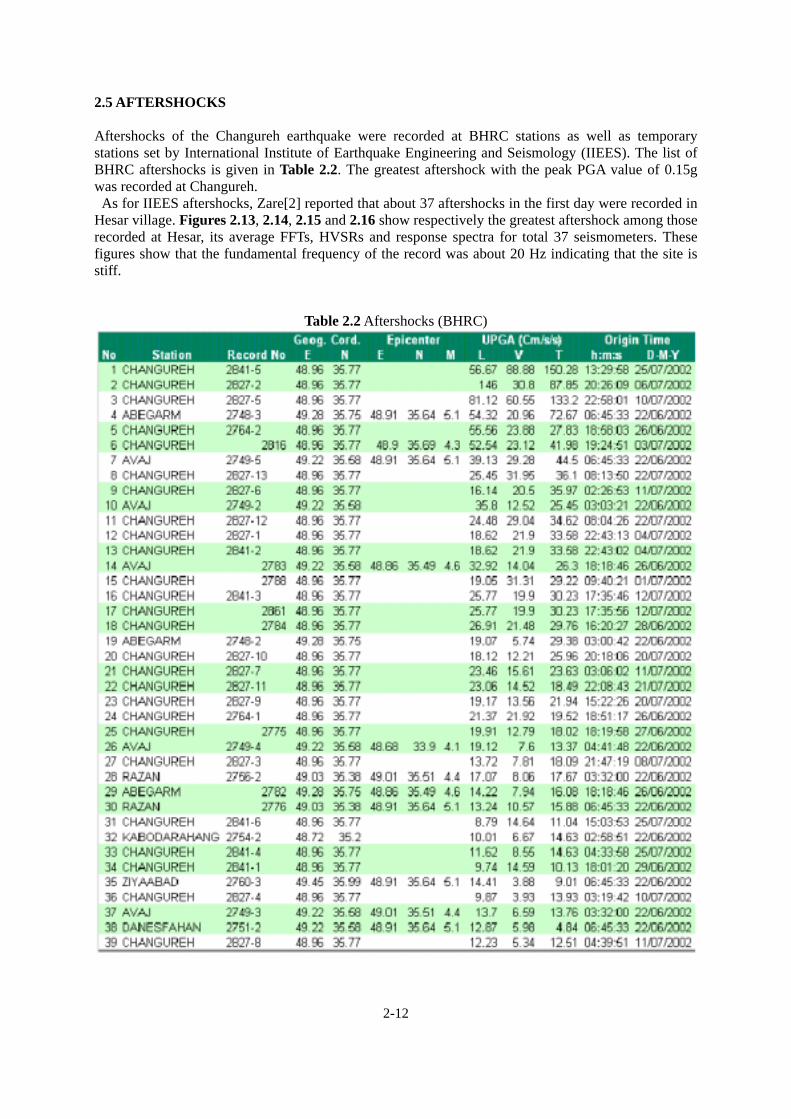
2.5 AFTERSHOCKS Aftershocks of the Changureh earthquake were recorded at BHRC stations as well as temporary stations set by International Institute of Earthquake Engineering and Seismology (IIEES). The list of BHRC aftershocks is given in Table 2.2. The greatest aftershock with the peak PGA value of 0.15g was recorded at Changureh. As for IIEES aftershocks, Zare[2] reported that about 37 aftershocks in the first day were recorded in Hesar village. Figures 2.13, 2.14, 2.15 and 2.16 show respectively the greatest aftershock among those recorded at Hesar, its average FFTs, HVSRs and response spectra for total 37 seismometers. These figures show that the fundamental frequency of the record was about 20 Hz indicating that the site is stiff.
Table 2.2 Aftershocks (BHRC)
2-12
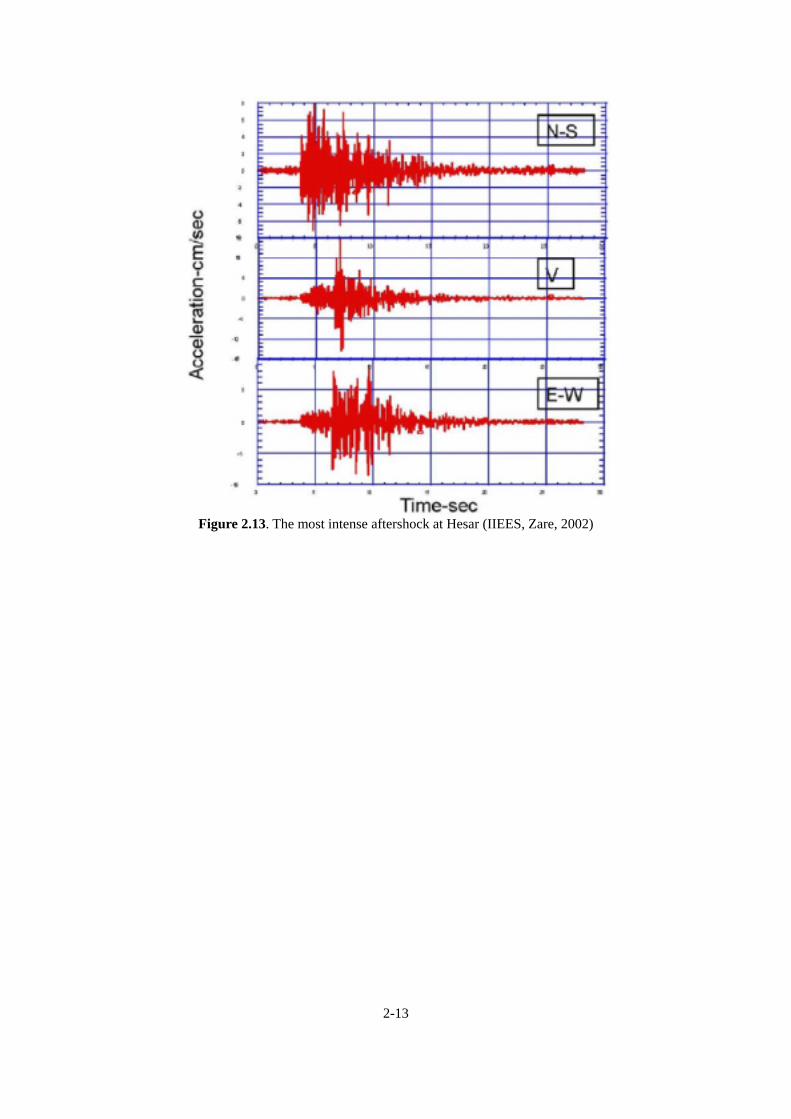
Figure 2.13. The most intense aftershock at Hesar (IIEES, Zare, 2002)
2-13
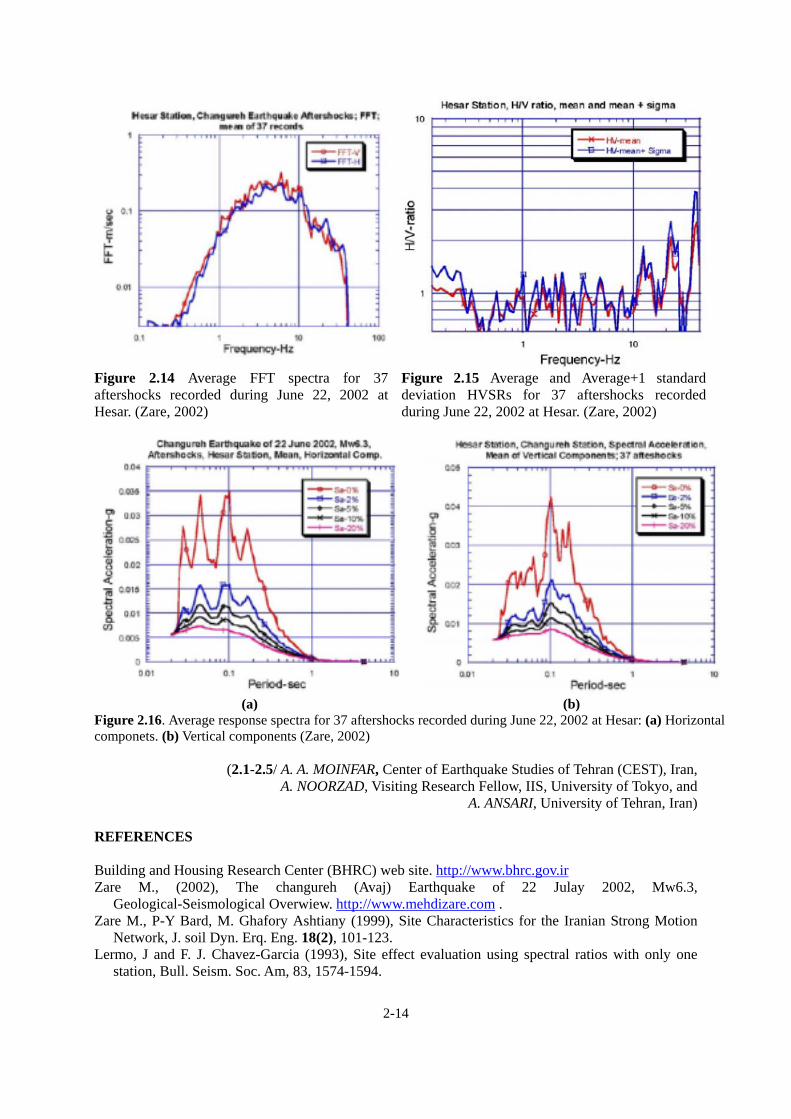
Figure 2.14 Average FFT spectra for 37 aftershocks recorded during June 22, 2002 at Hesar. (Zare, 2002)
Figure 2.15 Average and Average+1 standard deviation HVSRs for 37 aftershocks recorded during June 22, 2002 at Hesar. (Zare, 2002)
(a) (b)
Figure 2.16. Average response spectra for 37 aftershocks recorded during June 22, 2002 at Hesar: (a) Horizontal componets. (b) Vertical components (Zare, 2002)
(2.1-2.5/ A. A. MOINFAR, Center of Earthquake Studies of Tehran (CEST), Iran, A. NOORZAD, Visiting Research Fellow, IIS, University of Tokyo, and
A. ANSARI, University of Tehran, Iran) REFERENCES Building and Housing Research Center (BHRC) web site. http://www.bhrc.gov.ir Zare M., (2002), The changureh (Avaj) Earthquake of 22 Julay 2002, Mw6.3,
Geological-Seismological Overwiew. http://www.mehdizare.com . Zare M., P-Y Bard, M. Ghafory Ashtiany (1999), Site Characteristics for the Iranian Strong Motion
Network, J. soil Dyn. Erq. Eng. 18(2), 101-123. Lermo, J and F. J. Chavez-Garcia (1993), Site effect evaluation using spectral ratios with only one
station, Bull. Seism. Soc. Am, 83, 1574-1594.
2-14