Embed Size (px)
Citation preview

Software Engineering 2.1.
Universiteit Antwerpen Project Management
2. Project Management
Introduction
• When, Why and What?
Planning & Monitoring
• PERT charts• Gantt charts• Timesheets• Slip Lines, Timelines
Organisation, Staffing, Directing
• Team Structures• Directing Teams
Conclusion
• Correctness & Traceability
Software Engineering 2.2.
Universiteit Antwerpen Project Management
Literature
• [Ghez02a] In particular, “Management of Software Engineering”• [Pres01a] In particular, “Software Project Planning” & “Project Scheduling and
Tracking”• [Somm04a] In particular, “Software Cost Estimation” & “Managing People”
Other
• [Broo75a]The Mythical Man-Month, F. Brooks, Addison-Wesley, 1975.
⇒
“adding people to a late project makes it later” + lots of timeless wisdom• [Dema98a] Peopleware - Productive Projects and Teams (2nd ed.), Tom
DeMarco and Timothy Lister, Dorset House Publishing Company, 1998[
⇒
Lots of advice on how the sociology in teams affect productivity• [Hugh99a] Software Project Management, B. Hughes and M. Cotterell, McGraw
Hill, 1999.
⇒
Good practical examples on PERT, Gantt, Time-sheets, ...• [Gold95a] Succeeding with Objects: Decision Frameworks for Project
Management, A. Goldberg and K. Rubin, Addison-Wesley, 1995.
⇒
Explains how to define your own project management strategy
Software Engineering 2.3.
Universiteit Antwerpen Project Management
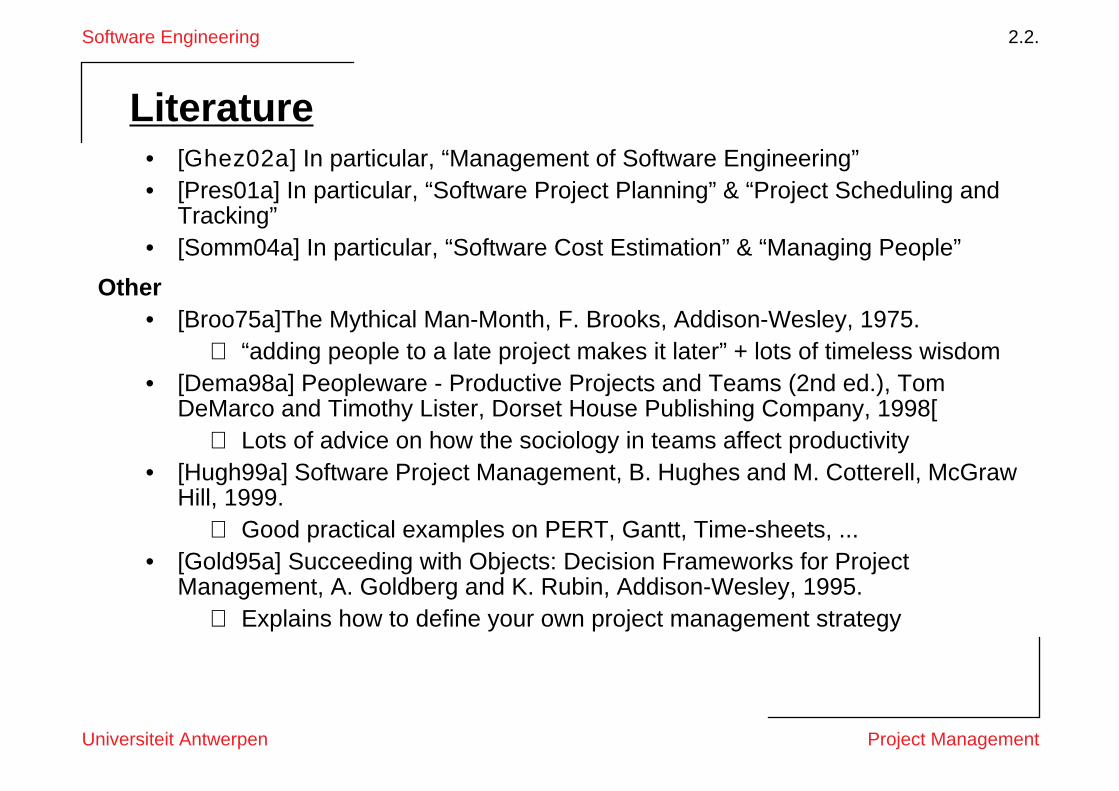
When Project Management?
Ensure
smooth
process.
SystemRequirementsSpecification
Software Engineering 2.4.
Universiteit Antwerpen Project Management
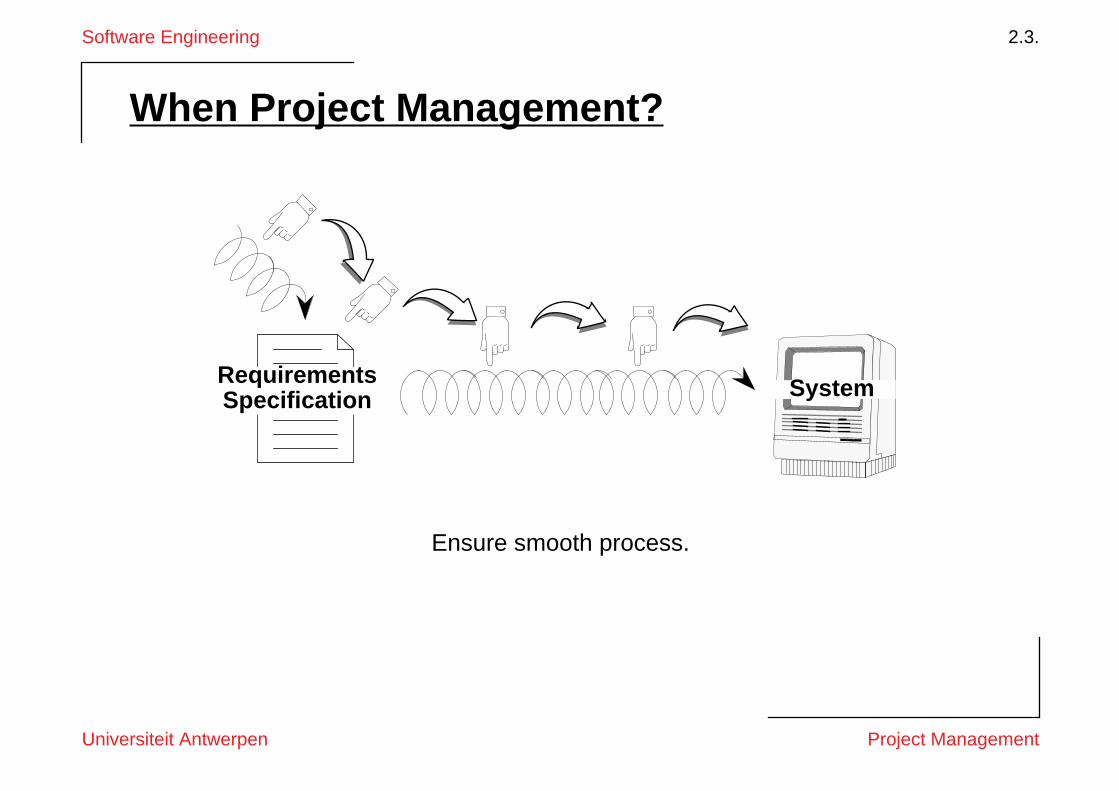
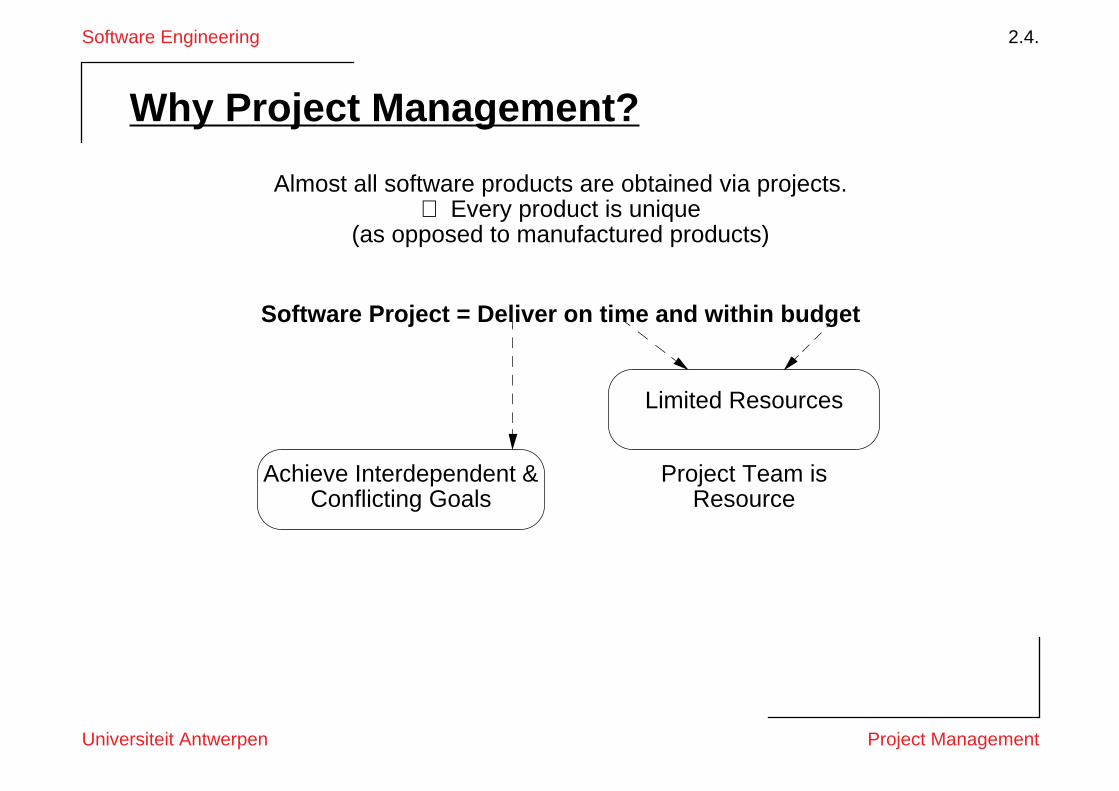
Why Project Management?
Almost all software products are obtained via
projects
.
⇒
Every product is
unique
(as opposed to manufactured products)
Software Project = Deliver on time and within budget
Achieve Interdependent & Conflicting Goals
Limited Resources
Project Team is Resource
Software Engineering 2.5.
Universiteit Antwerpen Project Management
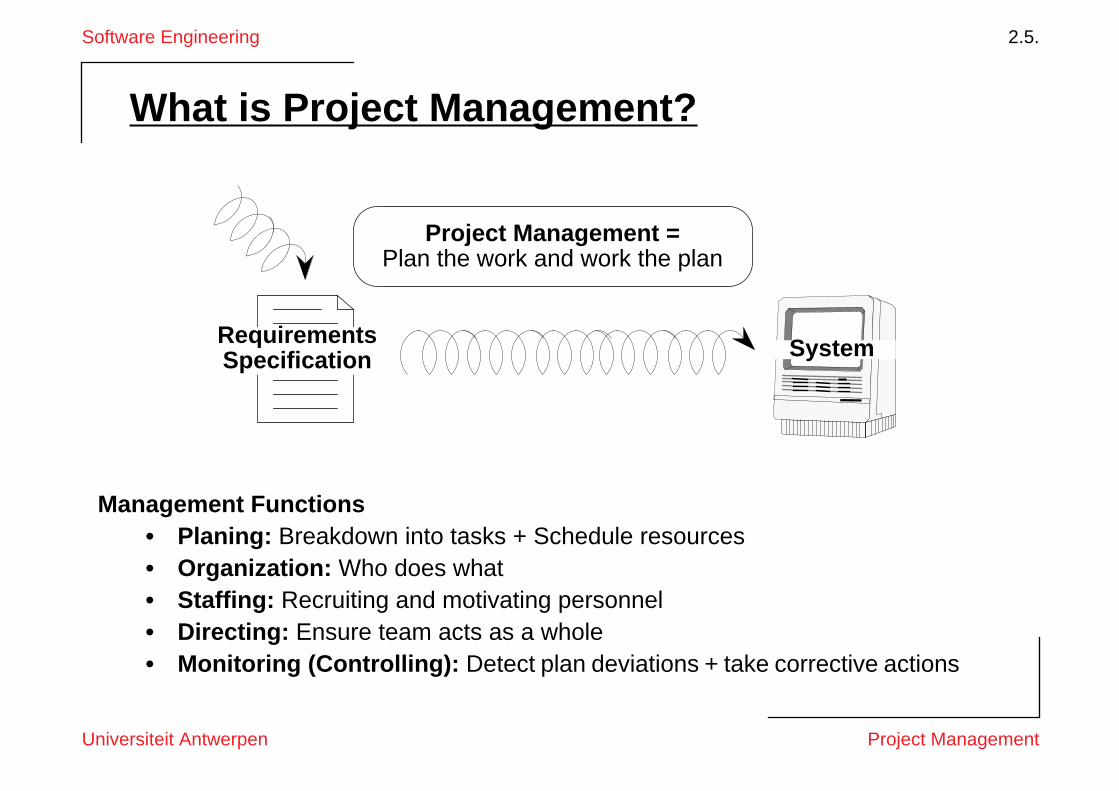
What is Project Management?
Management Functions• Planing:
Breakdown into tasks + Schedule resources
• Organization:
Who does what
• Staffing:
Recruiting and motivating personnel
• Directing:
Ensure team acts as a whole
• Monitoring (Controlling):
Detect plan deviations + take corrective actions
SystemRequirementsSpecification
Project Management =Plan the work and work the plan
Software Engineering 2.6.
Universiteit Antwerpen Project Management
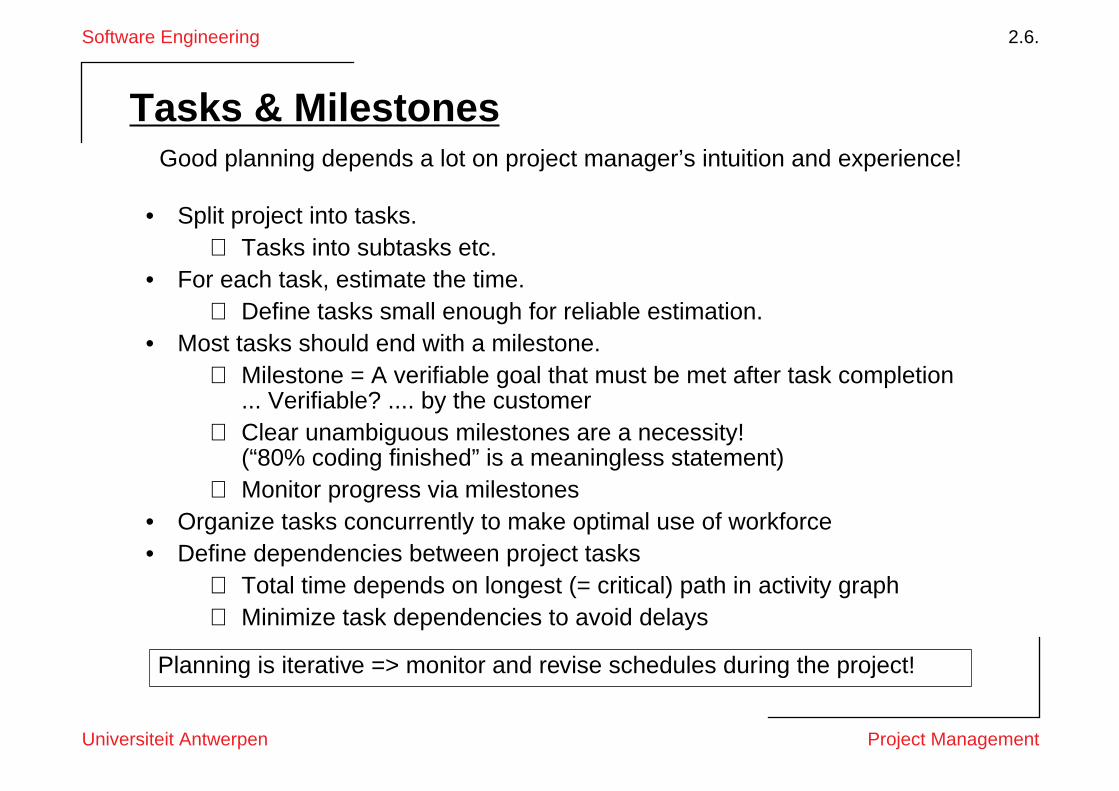
Tasks & Milestones
Good planning depends a lot on project manager’s intuition and experience!
• Split project into
tasks
.
⇒
Tasks into subtasks etc.• For each task, estimate the
time
.
⇒
Define tasks small enough for reliable estimation.• Most tasks should end with a
milestone.
⇒
Milestone = A verifiable goal that must be met after task completion... Verifiable? .... by the customer
⇒
Clear unambiguous milestones are a necessity!(“80% coding finished” is a meaningless statement)
⇒
Monitor progress via milestones• Organize tasks concurrently to make optimal use of workforce• Define dependencies between project tasks
⇒
Total time depends on longest (= critical) path in activity graph
⇒
Minimize task dependencies to avoid delays
Planning is
iterative
=> monitor and revise schedules during the project!
Software Engineering 2.7.
Universiteit Antwerpen Project Management
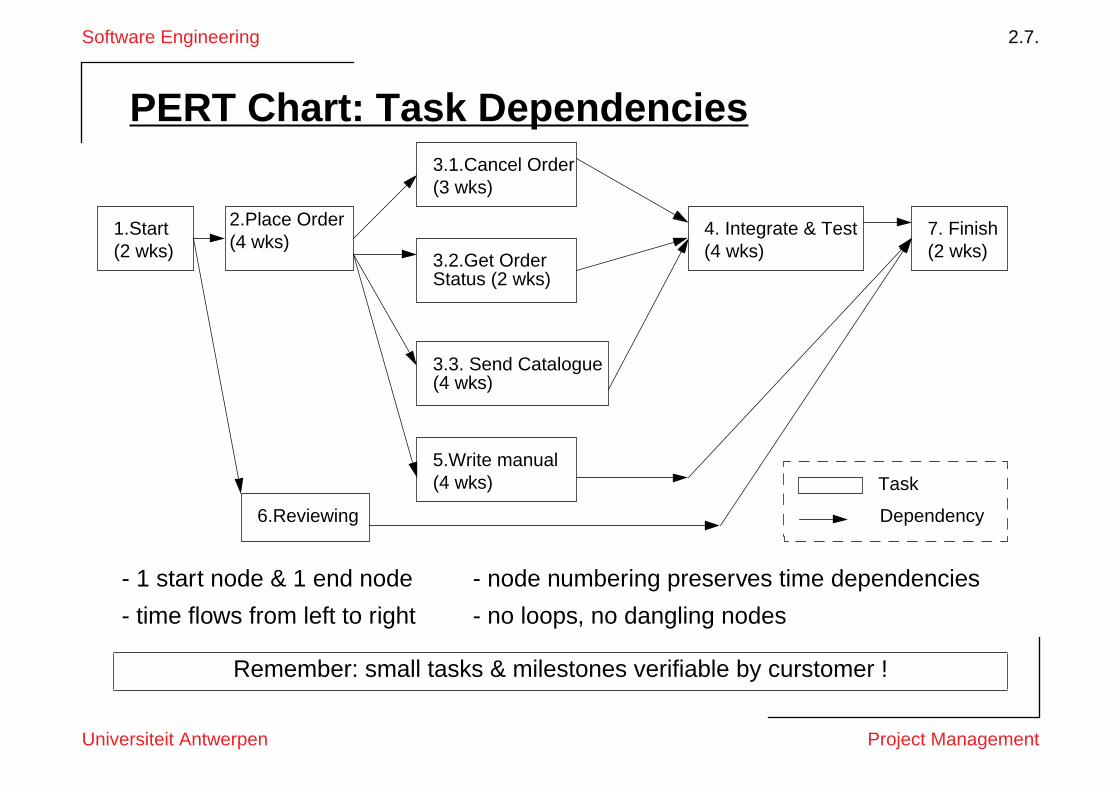
PERT Chart: Task Dependencies
- 1 start node & 1 end node - node numbering preserves time dependencies
- time flows from left to right - no loops, no dangling nodes
Remember: small tasks & milestones verifiable by curstomer !
1.Start(2 wks)
2.Place Order(4 wks)
3.1.Cancel Order(3 wks)
3.2.Get Order Status (2 wks)
3.3. Send Catalogue(4 wks)
5.Write manual(4 wks)
7. Finish(2 wks)
4. Integrate & Test(4 wks)
6.Reviewing
Task
Dependency
Software Engineering 2.8.
Universiteit Antwerpen Project Management
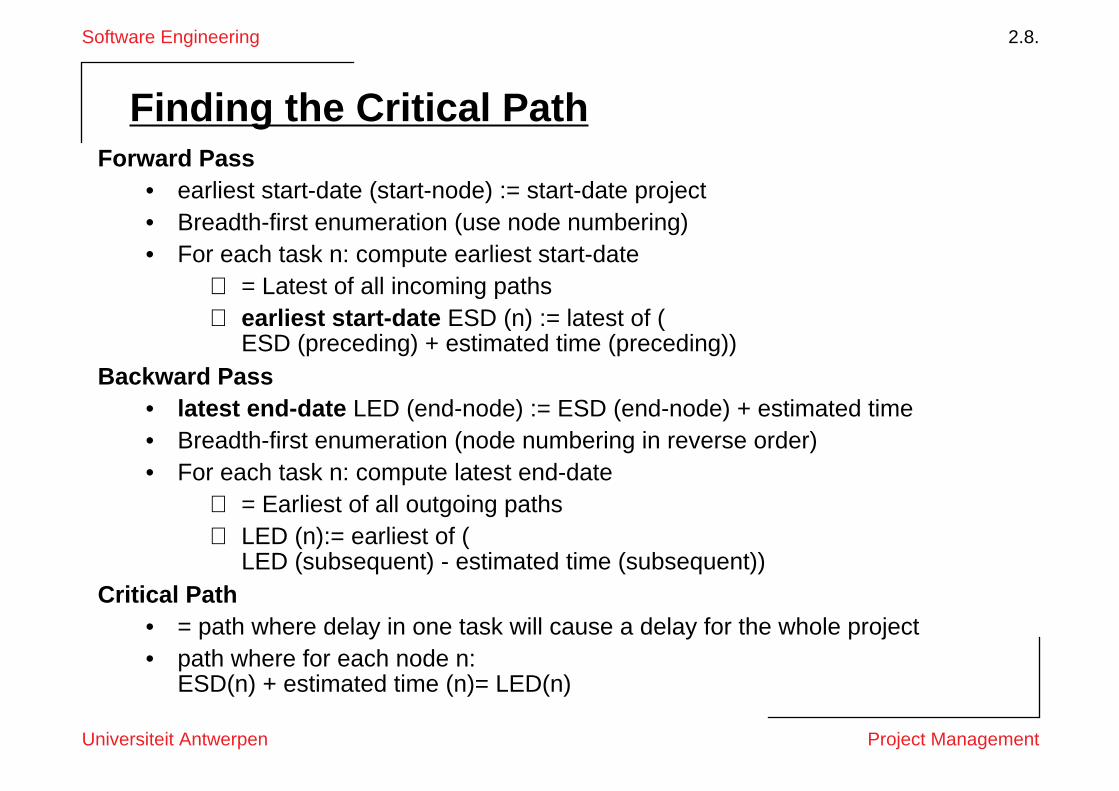
Finding the Critical Path
Forward Pass
• earliest start-date (start-node) := start-date project• Breadth-first enumeration (use node numbering)• For each task n: compute earliest start-date
⇒
= Latest of all incoming paths
⇒
earliest start-date
ESD (n) := latest of (ESD (preceding) + estimated time (preceding))
Backward Pass
•
latest end-date
LED (end-node) := ESD (end-node) + estimated time• Breadth-first enumeration (node numbering in reverse order)• For each task n: compute latest end-date
⇒
= Earliest of all outgoing paths
⇒
LED (n):= earliest of (LED (subsequent) - estimated time (subsequent))
Critical Path
• = path where delay in one task will cause a delay for the whole project• path where for each node n:
ESD(n) + estimated time (n)= LED(n)
Software Engineering 2.9.
Universiteit Antwerpen Project Management
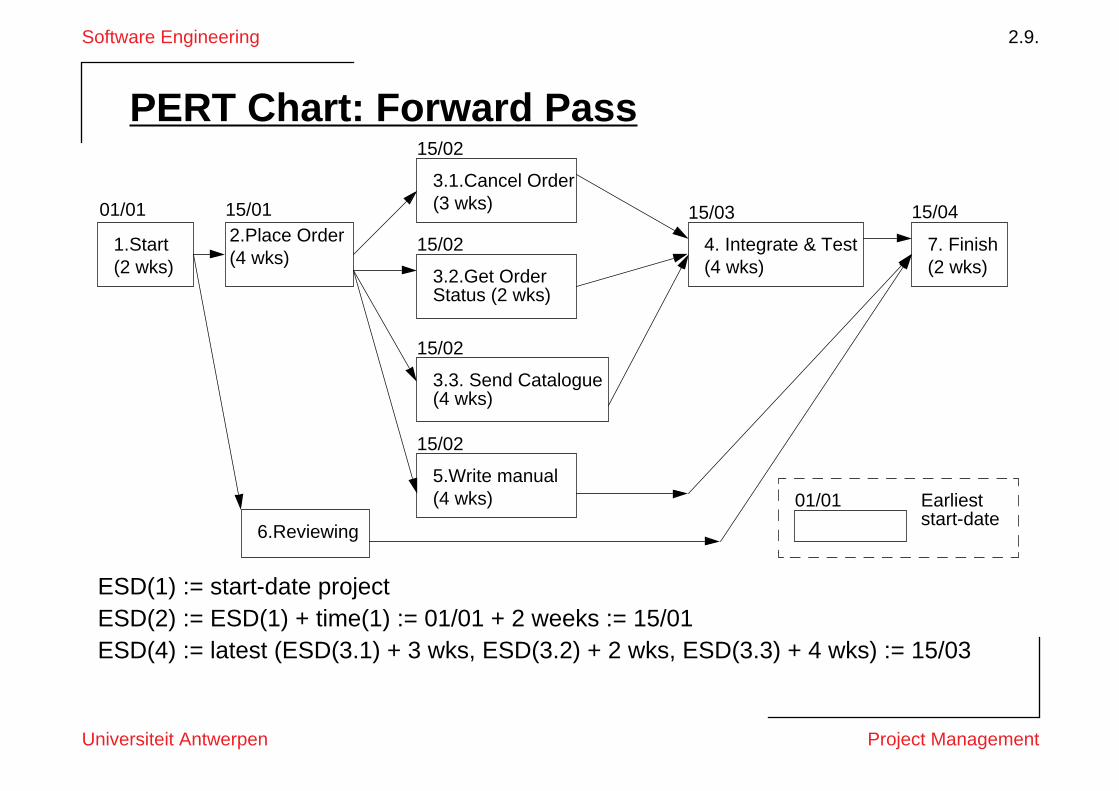
PERT Chart: Forward Pass
ESD(1) := start-date projectESD(2) := ESD(1) + time(1) := 01/01 + 2 weeks := 15/01ESD(4) := latest (ESD(3.1) + 3 wks, ESD(3.2) + 2 wks,
ESD(3.3) + 4 wks
) := 15/03
1.Start(2 wks)
2.Place Order(4 wks)
3.1.Cancel Order(3 wks)
3.2.Get Order Status (2 wks)
3.3. Send Catalogue(4 wks)
5.Write manual(4 wks)
7. Finish(2 wks)
4. Integrate & Test(4 wks)
6.Reviewing
Earliest start-date
01/01
01/01 15/01
15/02
15/02
15/02
15/02
15/03 15/04
Software Engineering 2.10.
Universiteit Antwerpen Project Management
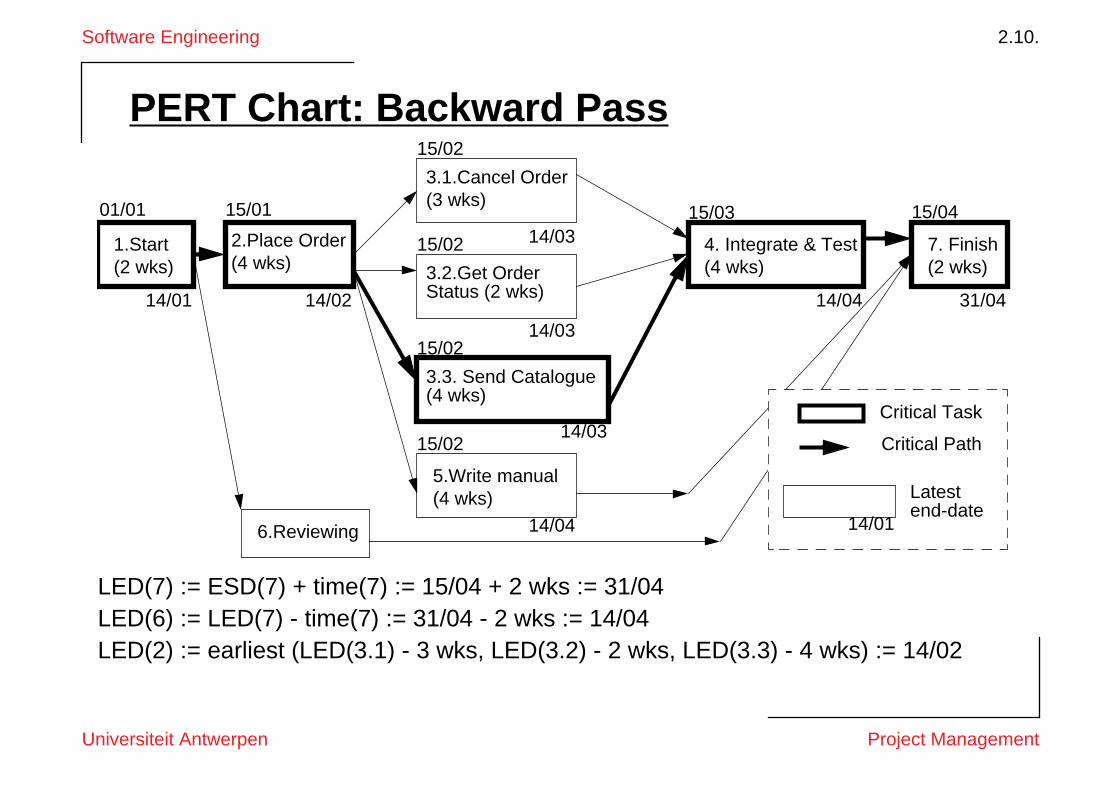
PERT Chart: Backward Pass
LED(7) := ESD(7) + time(7) := 15/04 + 2 wks := 31/04LED(6) := LED(7) - time(7) := 31/04 - 2 wks := 14/04LED(2) := earliest (LED(3.1) - 3 wks, LED(3.2) - 2 wks,
LED(3.3) - 4 wks
) := 14/02
1.Start(2 wks)
2.Place Order(4 wks)
3.1.Cancel Order(3 wks)
3.2.Get Order Status (2 wks)
3.3. Send Catalogue(4 wks)
5.Write manual(4 wks)
7. Finish(2 wks)
4. Integrate & Test(4 wks)
6.Reviewing
01/01 15/01
15/02
15/02
15/02
15/02
15/03 15/04
Latest end-date
14/01
Critical Task
Critical Path
31/0414/04
14/04
14/03
14/03
14/03
14/0214/01
Software Engineering 2.11.
Universiteit Antwerpen Project Management
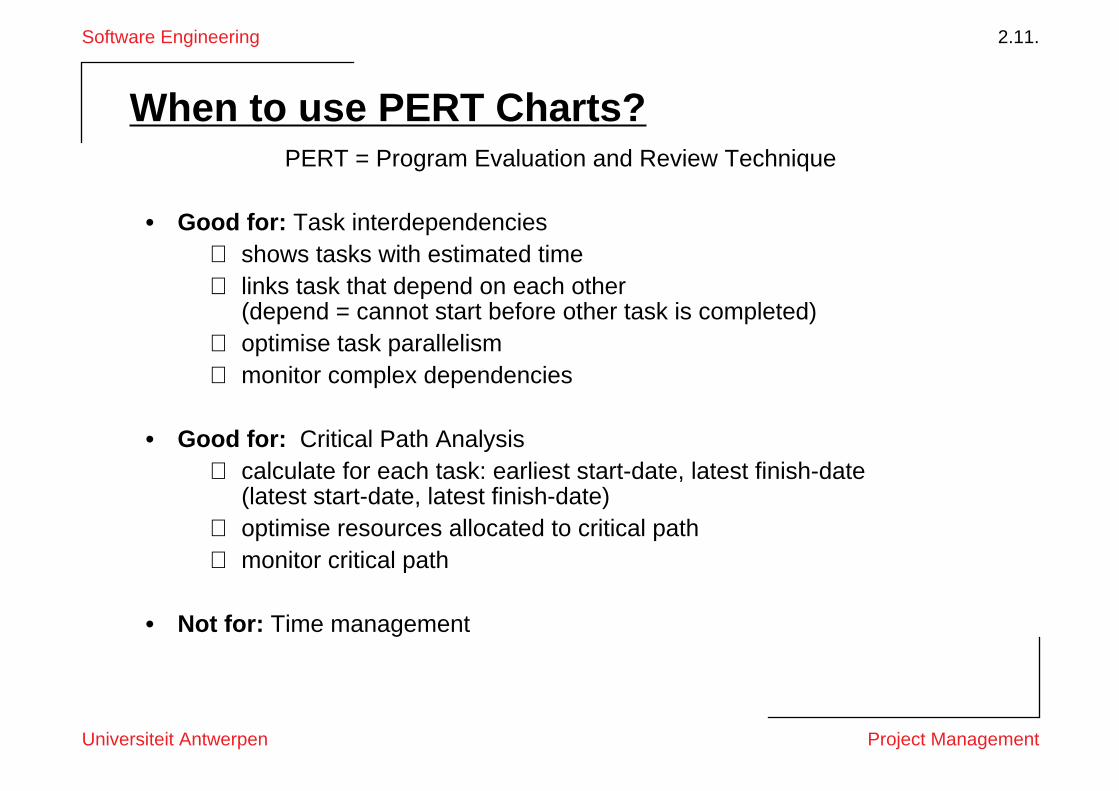
When to use PERT Charts?
PERT = Program Evaluation and Review Technique
• Good for:
Task interdependencies
⇒
shows tasks with estimated time
⇒
links task that depend on each other(depend = cannot start before other task is completed)
⇒
optimise task parallelism
⇒
monitor complex dependencies
• Good for:
Critical Path Analysis
⇒
calculate for each task: earliest start-date, latest finish-date(latest start-date, latest finish-date)
⇒
optimise resources allocated to critical path
⇒
monitor critical path
• Not for:
Time management
Software Engineering 2.12.
Universiteit Antwerpen Project Management
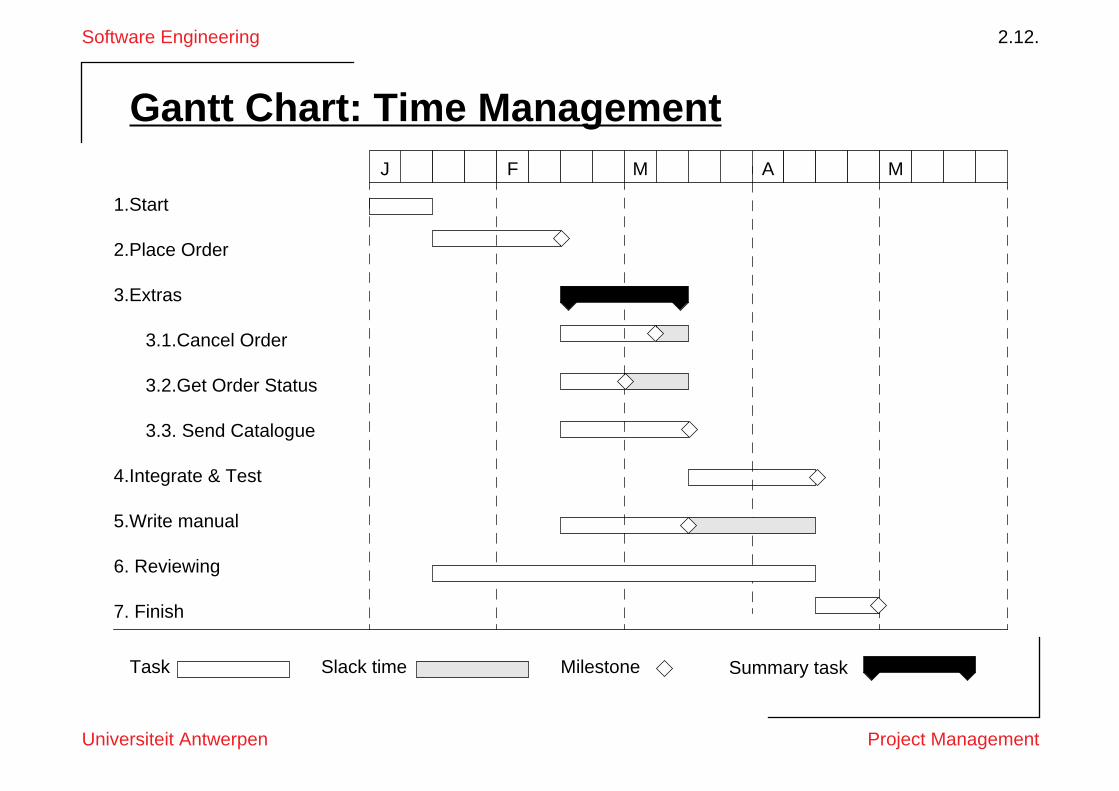
Gantt Chart: Time Management
1.Start
2.Place Order
3.Extras
3.1.Cancel Order
3.2.Get Order Status
3.3. Send Catalogue
4.Integrate & Test
5.Write manual
6. Reviewing
7. Finish
F M A MJ
Slack timeTask Summary taskMilestone
Software Engineering 2.13.
Universiteit Antwerpen Project Management
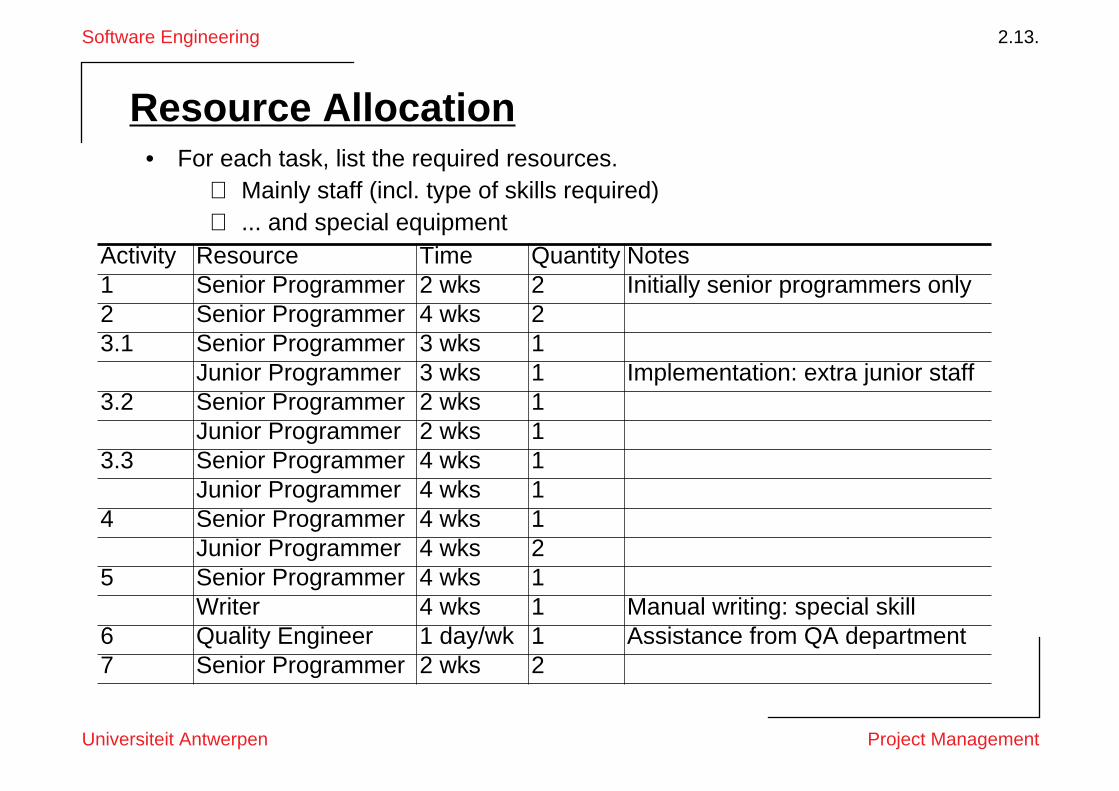
Resource Allocation
• For each task, list the required resources.
⇒
Mainly staff (incl. type of skills required)
⇒
... and special equipmentActivity Resource Time Quantity Notes1 Senior Programmer 2 wks 2 Initially senior programmers only2 Senior Programmer 4 wks 23.1 Senior Programmer 3 wks 1
Junior Programmer 3 wks 1 Implementation: extra junior staff3.2 Senior Programmer 2 wks 1
Junior Programmer 2 wks 13.3 Senior Programmer 4 wks 1
Junior Programmer 4 wks 14 Senior Programmer 4 wks 1
Junior Programmer 4 wks 25 Senior Programmer 4 wks 1
Writer 4 wks 1 Manual writing: special skill6 Quality Engineer 1 day/wk 1 Assistance from QA department7 Senior Programmer 2 wks 2
Software Engineering 2.14.
Universiteit Antwerpen Project Management
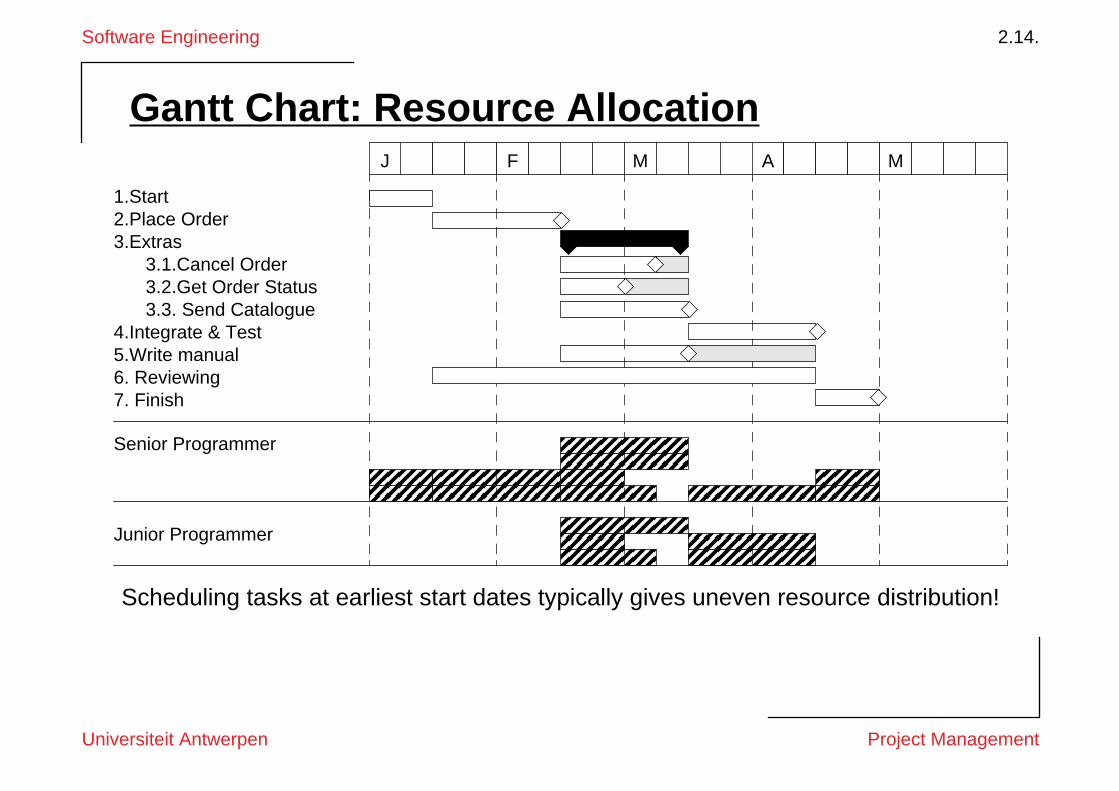
Gantt Chart: Resource Allocation
Scheduling tasks at earliest start dates typically gives uneven resource distribution!
Senior Programmer
Junior Programmer
1.Start2.Place Order3.Extras
3.1.Cancel Order3.2.Get Order Status3.3. Send Catalogue
4.Integrate & Test5.Write manual6. Reviewing7. Finish
F M A MJ
Software Engineering 2.15.
Universiteit Antwerpen Project Management
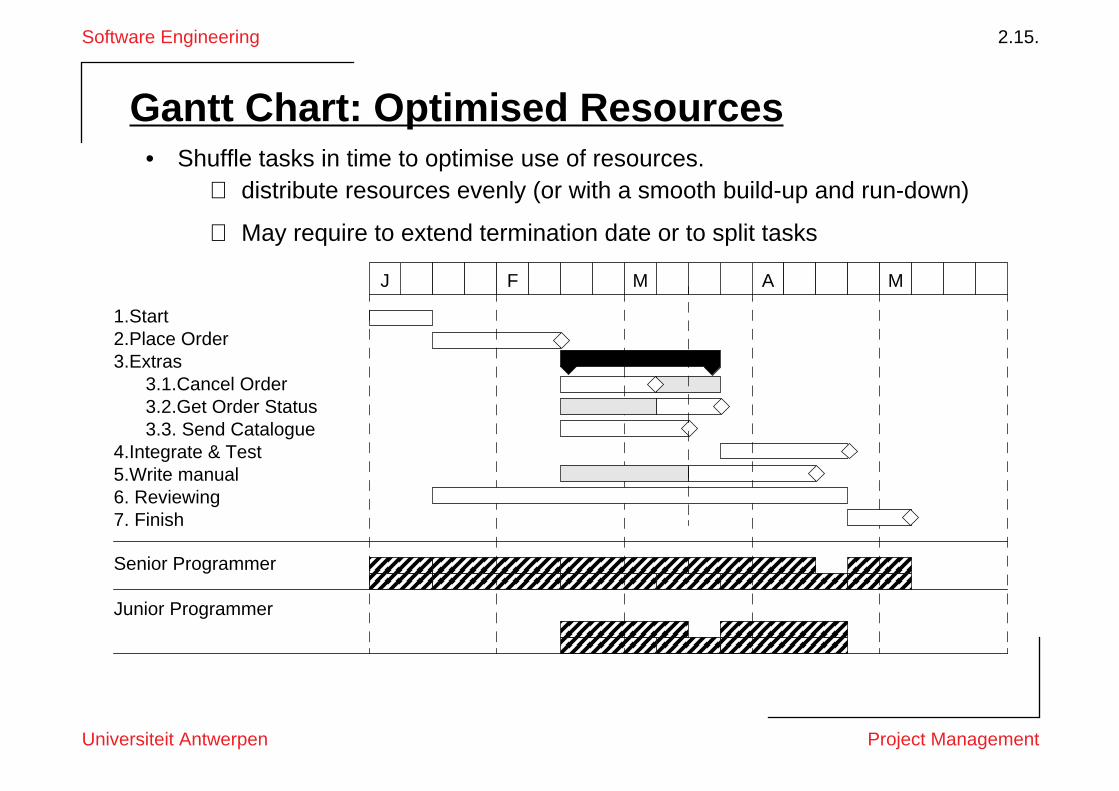
Gantt Chart: Optimised Resources
• Shuffle tasks in time to optimise use of resources
.
⇒
distribute resources evenly (or with a smooth build-up and run-down)
⇒
May require to extend termination date or to split tasks
Senior Programmer
Junior Programmer
1.Start2.Place Order3.Extras
3.1.Cancel Order3.2.Get Order Status3.3. Send Catalogue
4.Integrate & Test5.Write manual6. Reviewing7. Finish
F M A MJ
Software Engineering 2.16.
Universiteit Antwerpen Project Management
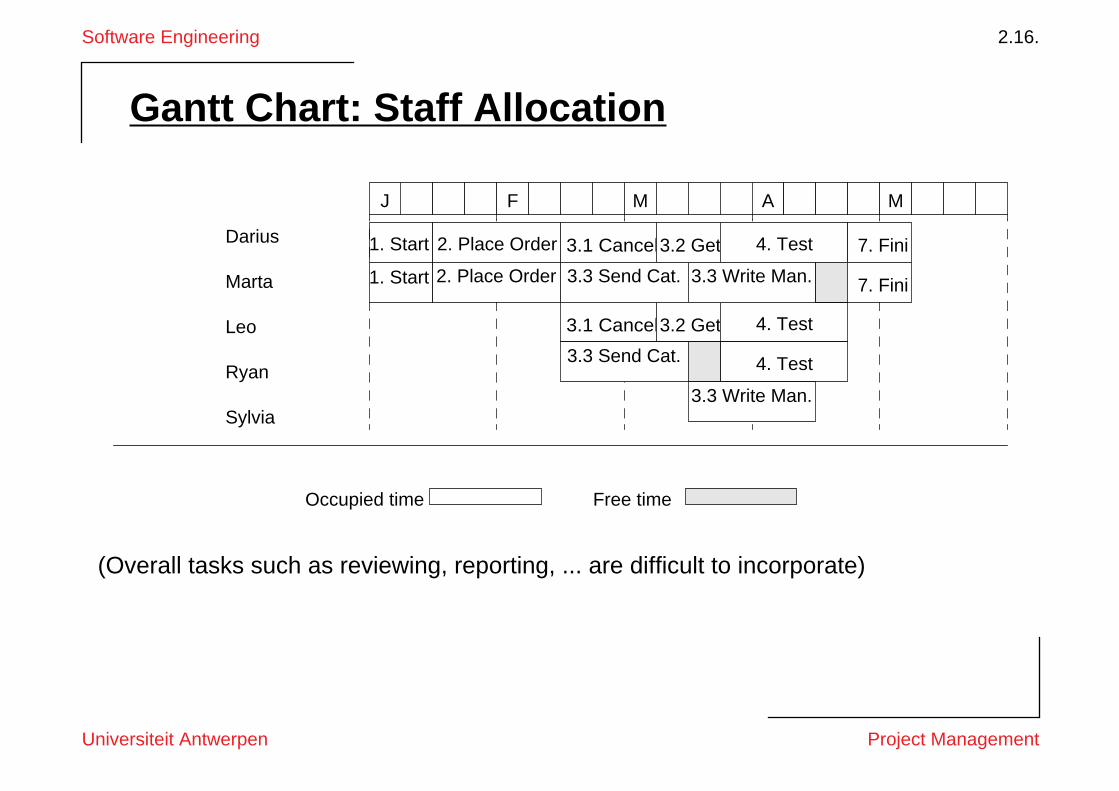
Gantt Chart: Staff Allocation
(Overall tasks such as reviewing, reporting, ... are difficult to incorporate)
Darius
Marta
Leo
Ryan
Sylvia
F M A MJ
1. Start
1. Start
2. Place Order
2. Place Order
3.1 Cancel3.2 Get 4. Test 7. Fini
7. Fini3.3 Send Cat. 3.3 Write Man.
3.1 Cancel3.2 Get 4. Test
3.3 Send Cat. 4. Test
3.3 Write Man.
Free timeOccupied time
Software Engineering 2.17.
Universiteit Antwerpen Project Management
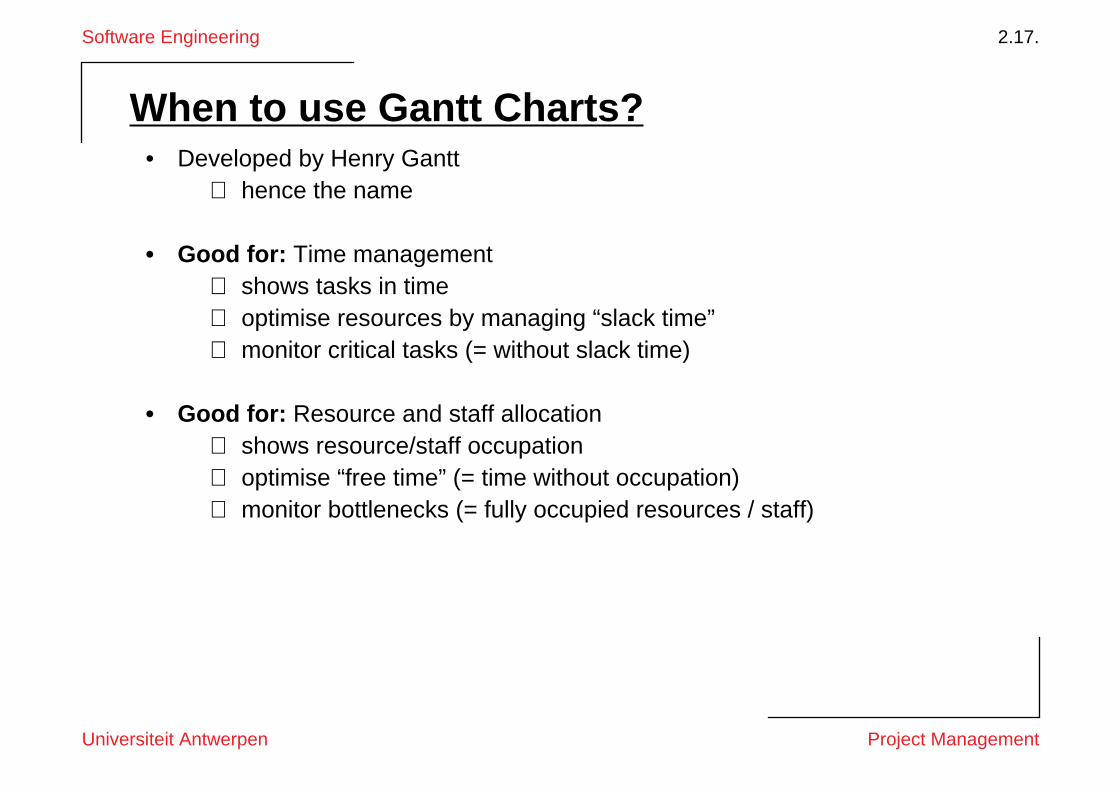
When to use Gantt Charts?• Developed by Henry Gantt
⇒ hence the name
• Good for: Time management⇒ shows tasks in time⇒ optimise resources by managing “slack time”⇒ monitor critical tasks (= without slack time)
• Good for: Resource and staff allocation⇒ shows resource/staff occupation⇒ optimise “free time” (= time without occupation)⇒ monitor bottlenecks (= fully occupied resources / staff)
Software Engineering 2.18.
Universiteit Antwerpen Project Management
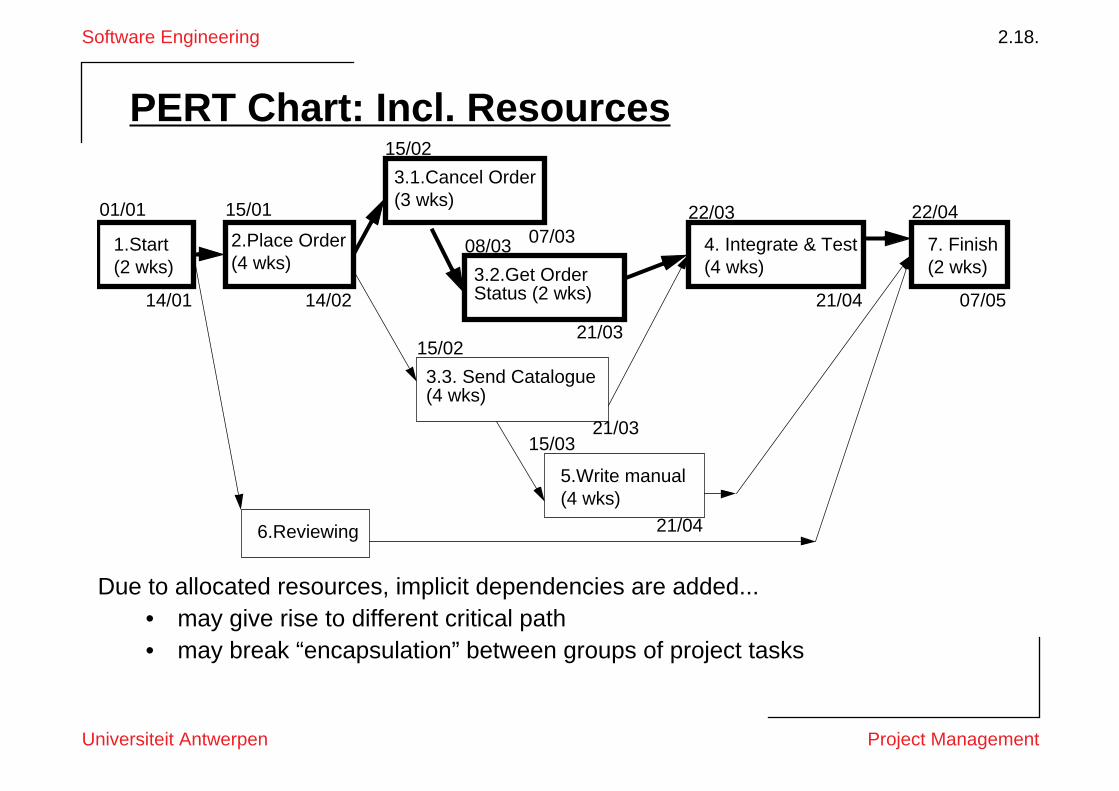
PERT Chart: Incl. Resources
Due to allocated resources, implicit dependencies are added...• may give rise to different critical path• may break “encapsulation” between groups of project tasks
1.Start(2 wks)
2.Place Order(4 wks)
3.1.Cancel Order(3 wks)
3.2.Get Order Status (2 wks)
3.3. Send Catalogue(4 wks)
5.Write manual(4 wks)
7. Finish(2 wks)
4. Integrate & Test(4 wks)
6.Reviewing
01/01 15/01
15/02
08/03
15/02
15/03
22/03 22/04
07/0521/04
21/04
21/03
07/03
14/0214/01
21/03
Software Engineering 2.19.
Universiteit Antwerpen Project Management
Uncertainty(See [Gold95a])
A software project is like skiing down a black piste.The ultimate goal is clear: getting down in one piece.
The way to reach the goal? ... One turn at a time.
Planning under Uncertainty• State clearly what you know and don’t know• State clearly what you will do to eliminate unknowns• Make sure that all early milestones can be met
Get commitment from main parties involved, incl. managementIn a bacon and egg breakfast, the pork is committed ... the chicken involved
Build confidence• within the team• with the customer
⇒ ... replanning will not considered harmful
Software Engineering 2.20.
Universiteit Antwerpen Project Management
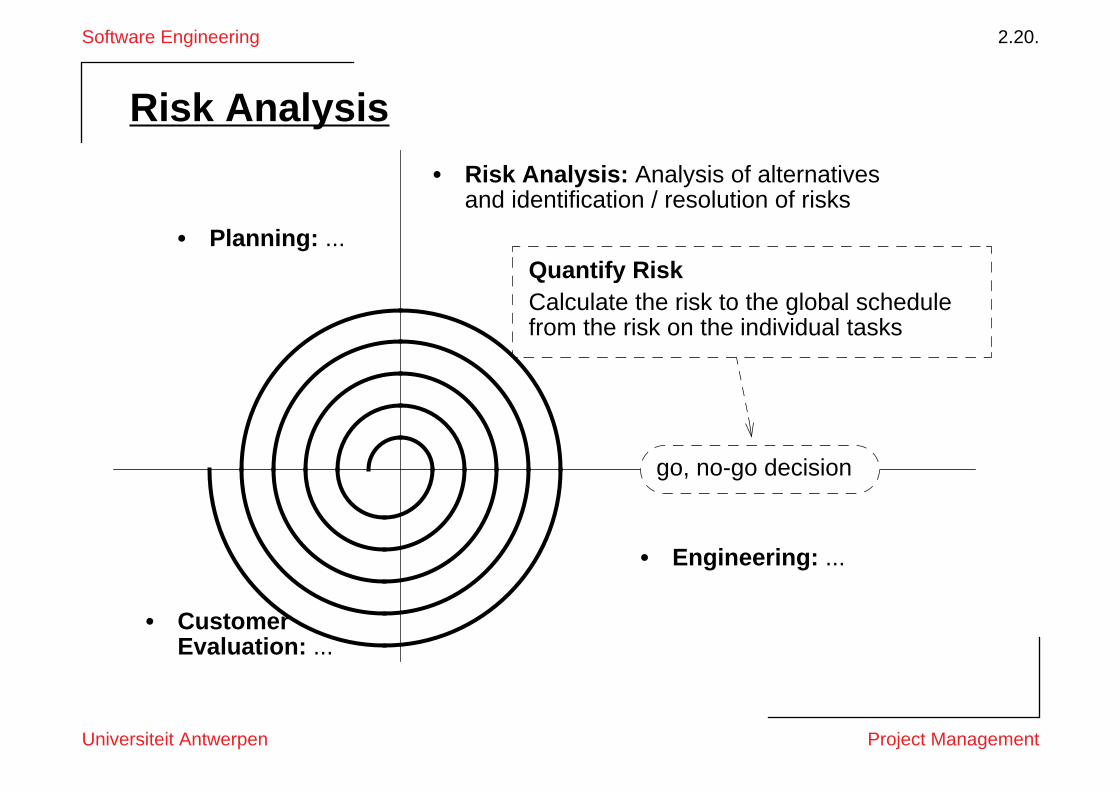
Risk Analysis
Quantify RiskCalculate the risk to the global schedule from the risk on the individual tasks
• Risk Analysis: Analysis of alternatives and identification / resolution of risks
• Engineering: ...
• Planning: ...
• Customer Evaluation: ...
go, no-go decision
Software Engineering 2.21.
Universiteit Antwerpen Project Management
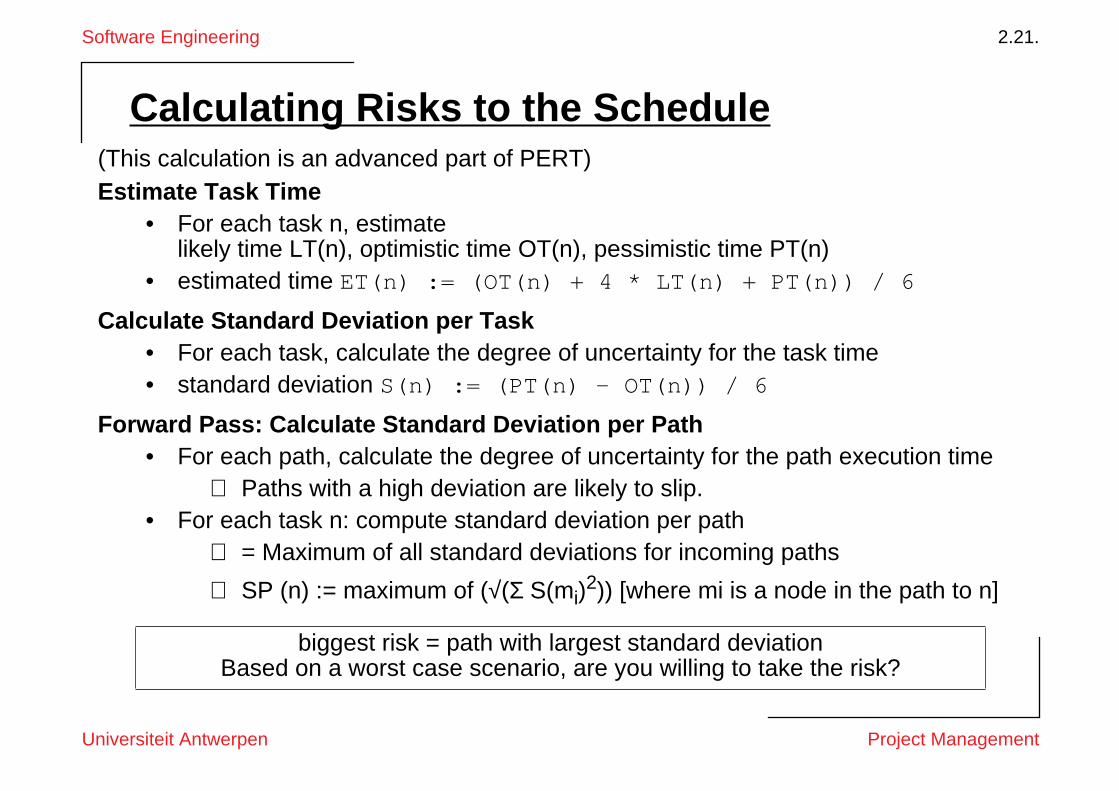
Calculating Risks to the Schedule(This calculation is an advanced part of PERT)Estimate Task Time
• For each task n, estimate likely time LT(n), optimistic time OT(n), pessimistic time PT(n)
• estimated time ET(n) := (OT(n) + 4 * LT(n) + PT(n)) / 6
Calculate Standard Deviation per Task• For each task, calculate the degree of uncertainty for the task time• standard deviation S(n) := (PT(n) - OT(n)) / 6
Forward Pass: Calculate Standard Deviation per Path• For each path, calculate the degree of uncertainty for the path execution time
⇒ Paths with a high deviation are likely to slip.• For each task n: compute standard deviation per path
⇒ = Maximum of all standard deviations for incoming paths
⇒ SP (n) := maximum of (√(Σ S(mi)2)) [where mi is a node in the path to n]
biggest risk = path with largest standard deviationBased on a worst case scenario, are you willing to take the risk?
Software Engineering 2.22.
Universiteit Antwerpen Project Management
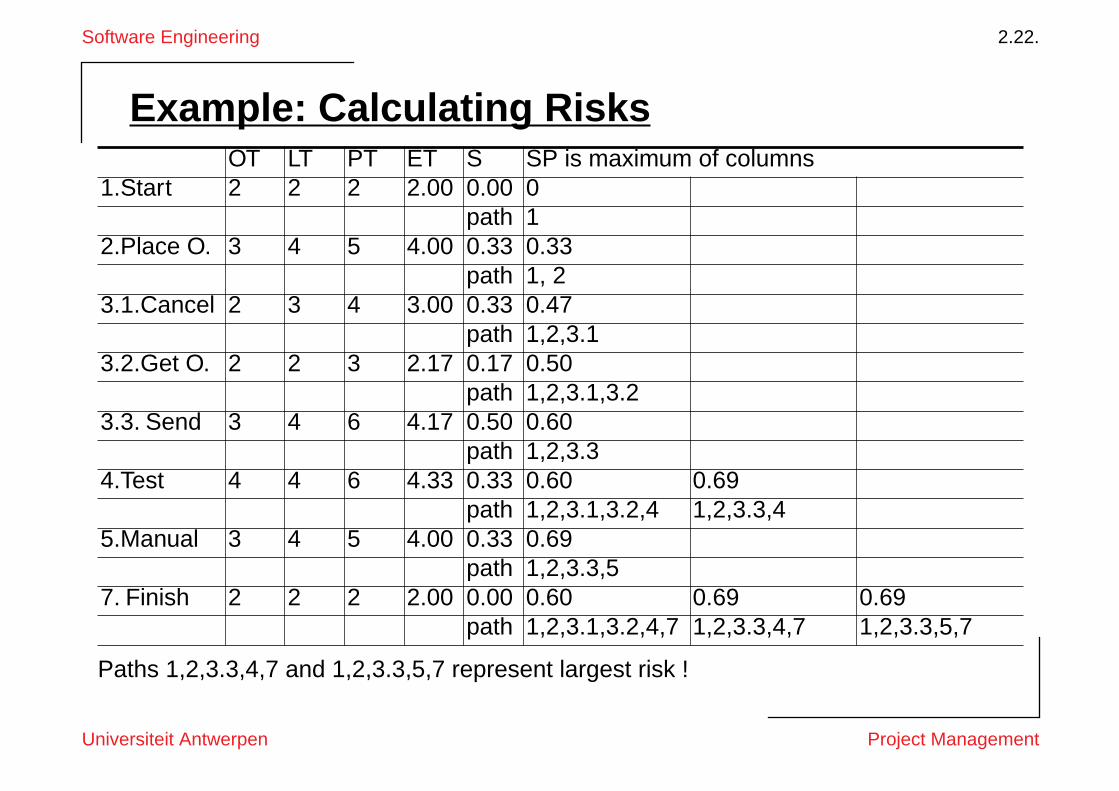
Example: Calculating Risks
Paths 1,2,3.3,4,7 and 1,2,3.3,5,7 represent largest risk !
OT LT PT ET S SP is maximum of columns1.Start 2 2 2 2.00 0.00 0
path 12.Place O. 3 4 5 4.00 0.33 0.33
path 1, 23.1.Cancel 2 3 4 3.00 0.33 0.47
path 1,2,3.13.2.Get O. 2 2 3 2.17 0.17 0.50
path 1,2,3.1,3.23.3. Send 3 4 6 4.17 0.50 0.60
path 1,2,3.34.Test 4 4 6 4.33 0.33 0.60 0.69
path 1,2,3.1,3.2,4 1,2,3.3,45.Manual 3 4 5 4.00 0.33 0.69
path 1,2,3.3,57. Finish 2 2 2 2.00 0.00 0.60 0.69 0.69
path 1,2,3.1,3.2,4,7 1,2,3.3,4,7 1,2,3.3,5,7
Software Engineering 2.23.
Universiteit Antwerpen Project Management
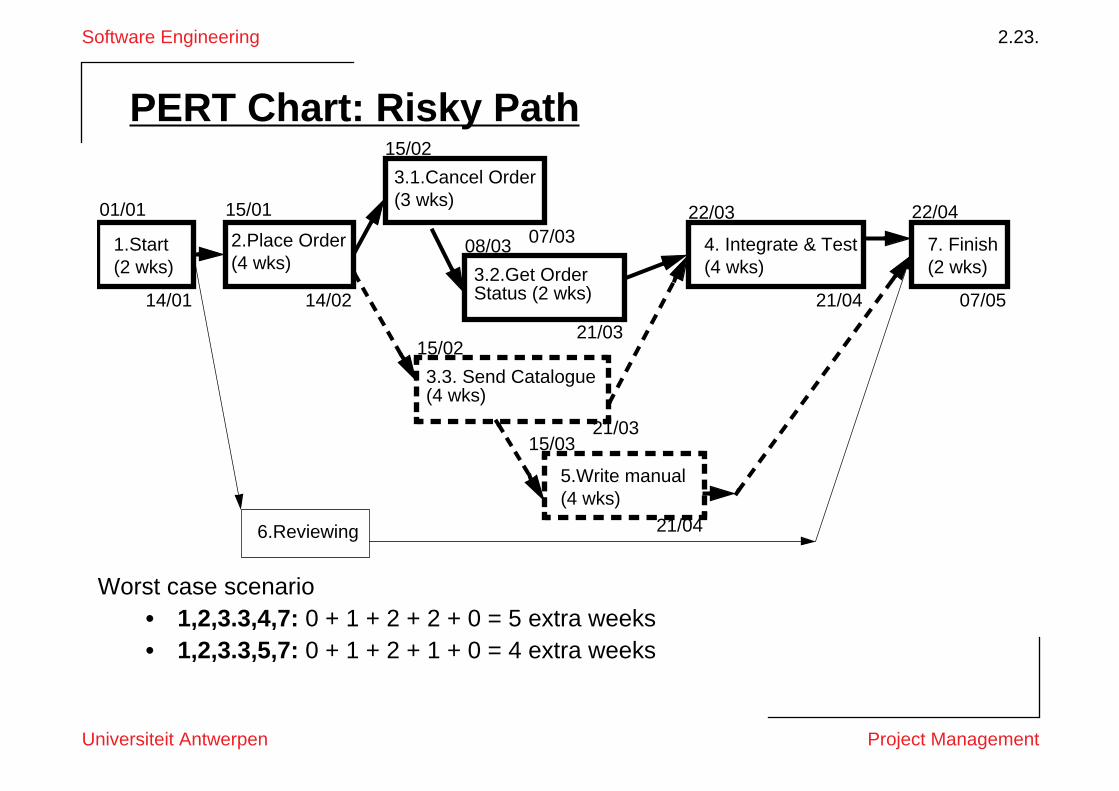
PERT Chart: Risky Path
Worst case scenario• 1,2,3.3,4,7: 0 + 1 + 2 + 2 + 0 = 5 extra weeks• 1,2,3.3,5,7: 0 + 1 + 2 + 1 + 0 = 4 extra weeks
1.Start(2 wks)
2.Place Order(4 wks)
3.1.Cancel Order(3 wks)
3.2.Get Order Status (2 wks)
3.3. Send Catalogue(4 wks)
5.Write manual(4 wks)
7. Finish(2 wks)
4. Integrate & Test(4 wks)
6.Reviewing
01/01 15/01
15/02
08/03
15/02
15/03
22/03 22/04
07/0521/04
21/04
21/03
07/03
14/0214/01
21/03
Software Engineering 2.24.
Universiteit Antwerpen Project Management
Delays
Myth: “If we get behind schedule, we can add more programmers and catch up.”Reality: Adding more people typically slows a project down.
Scheduling Issues• Estimating the difficulty of problems and the cost of developing a solution is hard• The unexpected always happens. Always allow contingency in planning• Productivity is not proportional to the number of people working on a task
⇒ Productivity does not depend on raw man-power but on intellectual power• Adding people to a late project makes it later due to communication overhead.• Cutting back in testing and reviewing is a recipe for disaster• Working overnight? Only short term benefits!
Software Engineering 2.25.
Universiteit Antwerpen Project Management
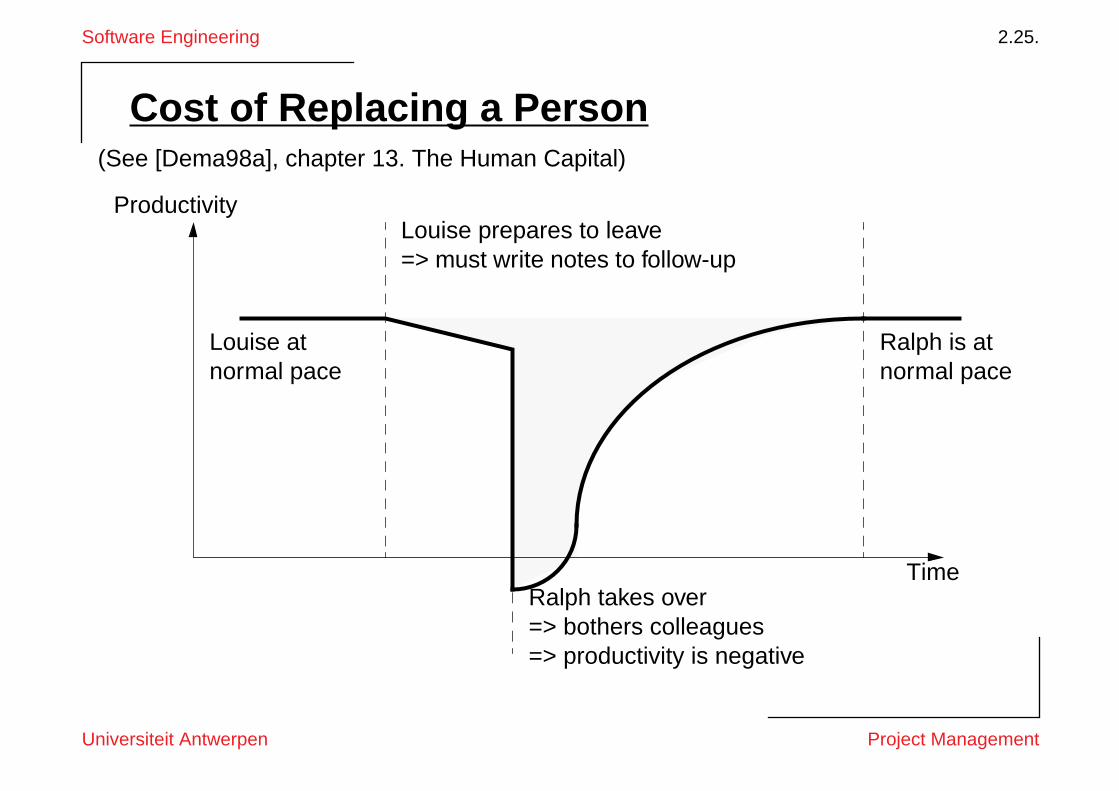
Cost of Replacing a Person(See [Dema98a], chapter 13. The Human Capital)
Productivity
Time
Louise at normal pace
Louise prepares to leave=> must write notes to follow-up
Ralph takes over=> bothers colleagues=> productivity is negative
Ralph is at normal pace

Software Engineering 2.26.
Universiteit Antwerpen Project Management
Dealing with DelaysSpot potential delays as soon as possible
... then you have more time to recover
How to spot?• Earned value analysis
⇒ planned time is the project budget⇒ time of a completed task is credited to the project budget
How to recover?A combination of following 3 actions
• Adding senior staff for well-specified tasks⇒ outside critical path to avoid communication overhead
• Prioritize requirements and deliver incrementally⇒ deliver most important functionality on time⇒ testing remains a priority (even if customer disagrees)
• Extend the deadline
Software Engineering 2.27.
Universiteit Antwerpen Project Management
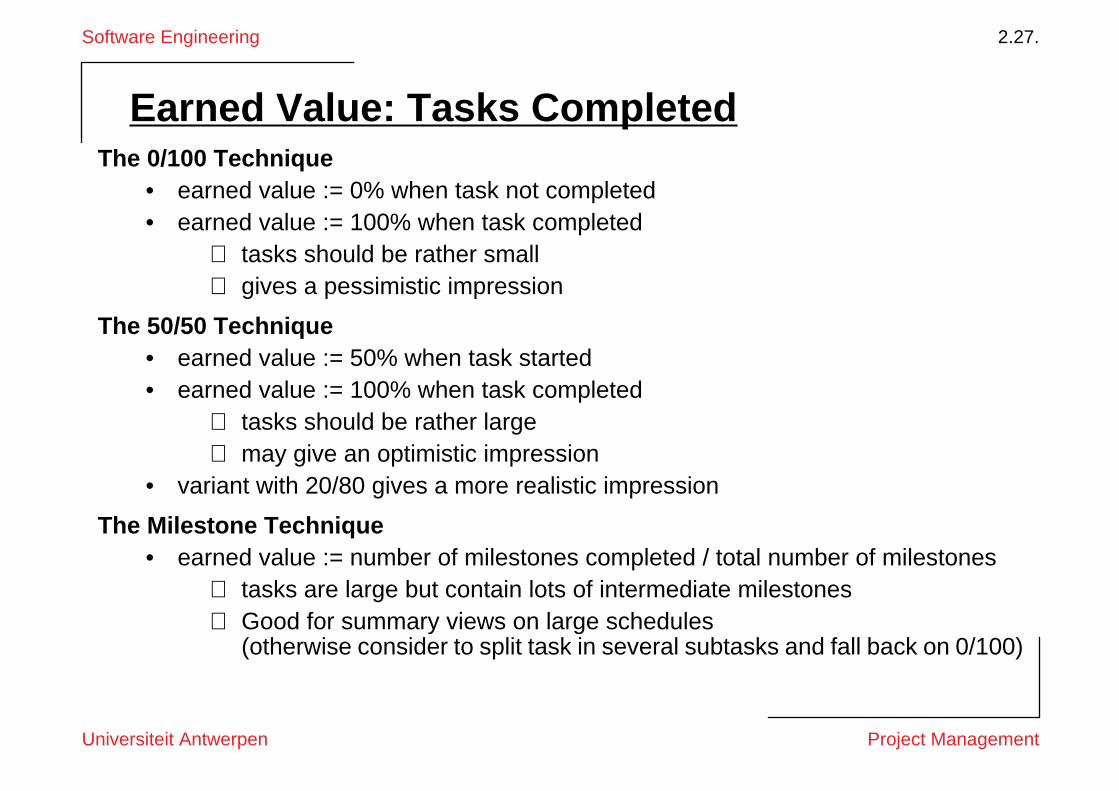
Earned Value: Tasks CompletedThe 0/100 Technique
• earned value := 0% when task not completed• earned value := 100% when task completed
⇒ tasks should be rather small⇒ gives a pessimistic impression
The 50/50 Technique• earned value := 50% when task started• earned value := 100% when task completed
⇒ tasks should be rather large⇒ may give an optimistic impression
• variant with 20/80 gives a more realistic impression
The Milestone Technique• earned value := number of milestones completed / total number of milestones
⇒ tasks are large but contain lots of intermediate milestones⇒ Good for summary views on large schedules
(otherwise consider to split task in several subtasks and fall back on 0/100)
Software Engineering 2.28.
Universiteit Antwerpen Project Management
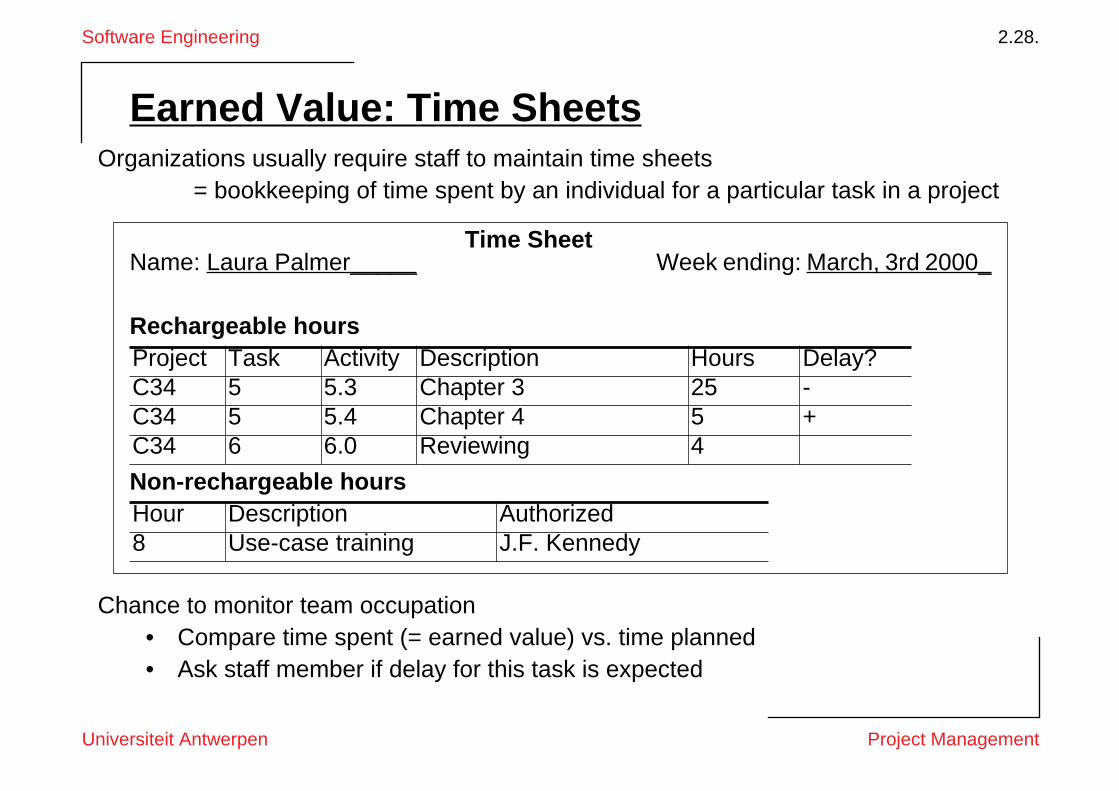
Earned Value: Time SheetsOrganizations usually require staff to maintain time sheets
= bookkeeping of time spent by an individual for a particular task in a project
Chance to monitor team occupation• Compare time spent (= earned value) vs. time planned• Ask staff member if delay for this task is expected
Name: Laura Palmer_____ Week ending: March, 3rd 2000_Time Sheet
Rechargeable hours
Non-rechargeable hours
Project Task Activity Description Hours Delay?C34 5 5.3 Chapter 3 25 -C34 5 5.4 Chapter 4 5 +C34 6 6.0 Reviewing 4
Hour Description Authorized8 Use-case training J.F. Kennedy

Software Engineering 2.29.
Universiteit Antwerpen Project Management
Gantt Chart: Slip Line• Visualise percentage of task completed via shading
⇒ draw a slip line at current date, connecting endpoints of the shaded areas
⇒ bending to the right = ahead of schedule, to the left = behind schedule
InterpretationToday is 1rst of MarchTask 3.1 is finished ahead of schedule and task 3.2 is started ahead of scheduleTasks 3.3 and 6 seem to be behind schedule (i.e., less completed than planned)
1.Start2.Place Order3.Extras
3.1.Cancel Order3.2.Get Order Status3.3. Send Catalogue
4.Integrate & Test5.Write manual6. Reviewing7. Finish
F M A MJ
Software Engineering 2.30.
Universiteit Antwerpen Project Management
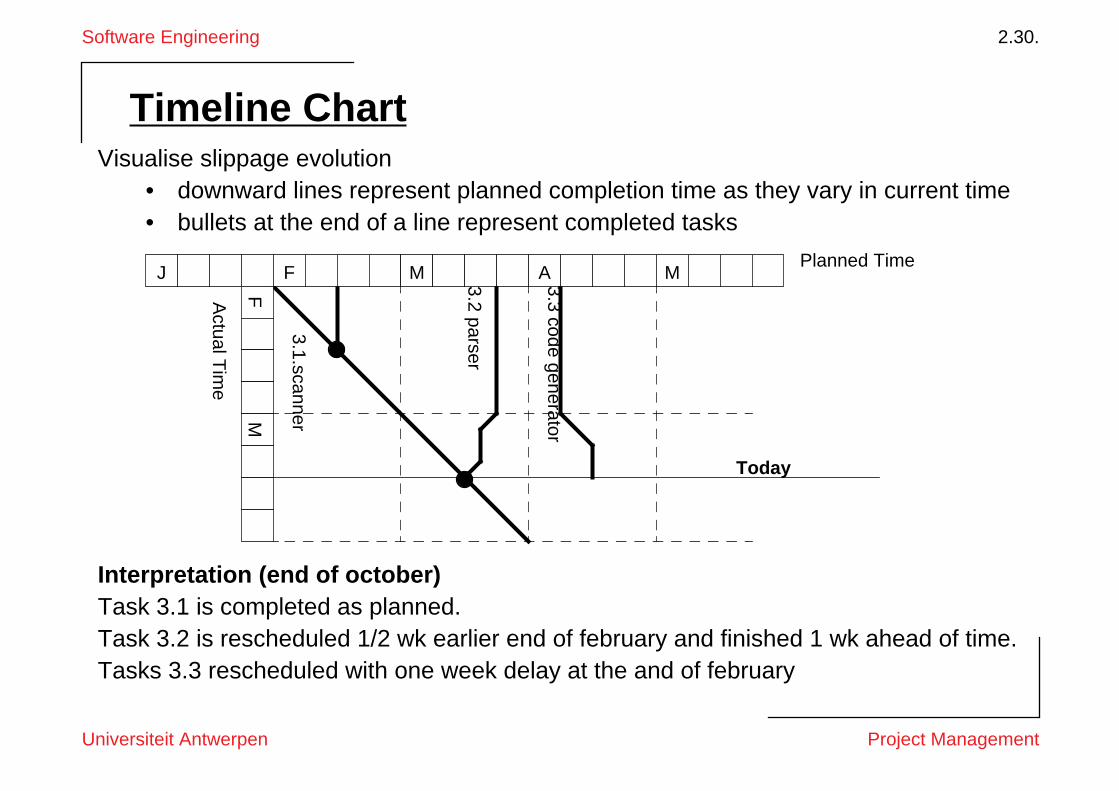
Timeline ChartVisualise slippage evolution
• downward lines represent planned completion time as they vary in current time• bullets at the end of a line represent completed tasks
Interpretation (end of october)Task 3.1 is completed as planned.Task 3.2 is rescheduled 1/2 wk earlier end of february and finished 1 wk ahead of time.Tasks 3.3 rescheduled with one week delay at the and of february
Actual T
ime
3.1.scanner
3.2 parser
3.3 code generator
Today
F M A MJ
FM
Planned Time
Software Engineering 2.31.
Universiteit Antwerpen Project Management
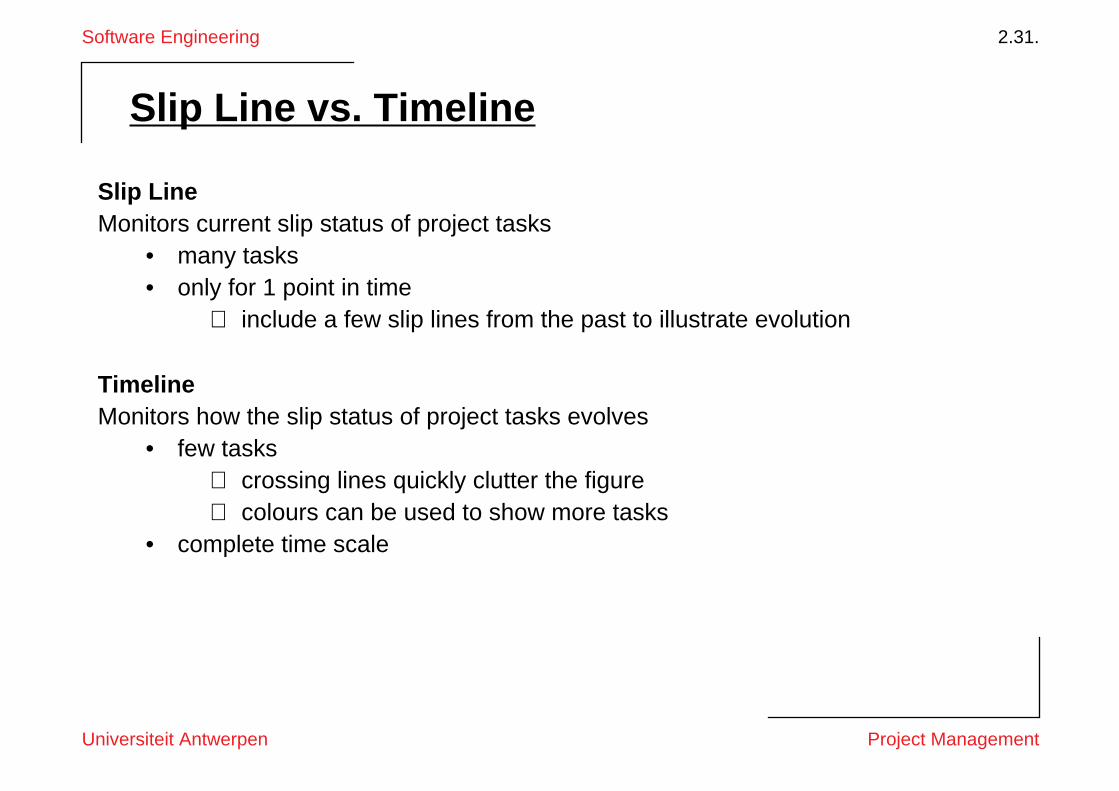
Slip Line vs. Timeline
Slip LineMonitors current slip status of project tasks
• many tasks• only for 1 point in time
⇒ include a few slip lines from the past to illustrate evolution
TimelineMonitors how the slip status of project tasks evolves
• few tasks⇒ crossing lines quickly clutter the figure⇒ colours can be used to show more tasks
• complete time scale

Software Engineering 2.32.
Universiteit Antwerpen Project Management
Individuals work in TeamsDistribution of a software engineer’s time, as logged within IBM [McCu78a]
• You cannot afford too many solo-players in a team• Complementary personalities are as important as technical skills• More women are necessary ...
20% non-productive (travel and training)
30% working alone
50% interaction with other people
Software Engineering 2.33.
Universiteit Antwerpen Project Management
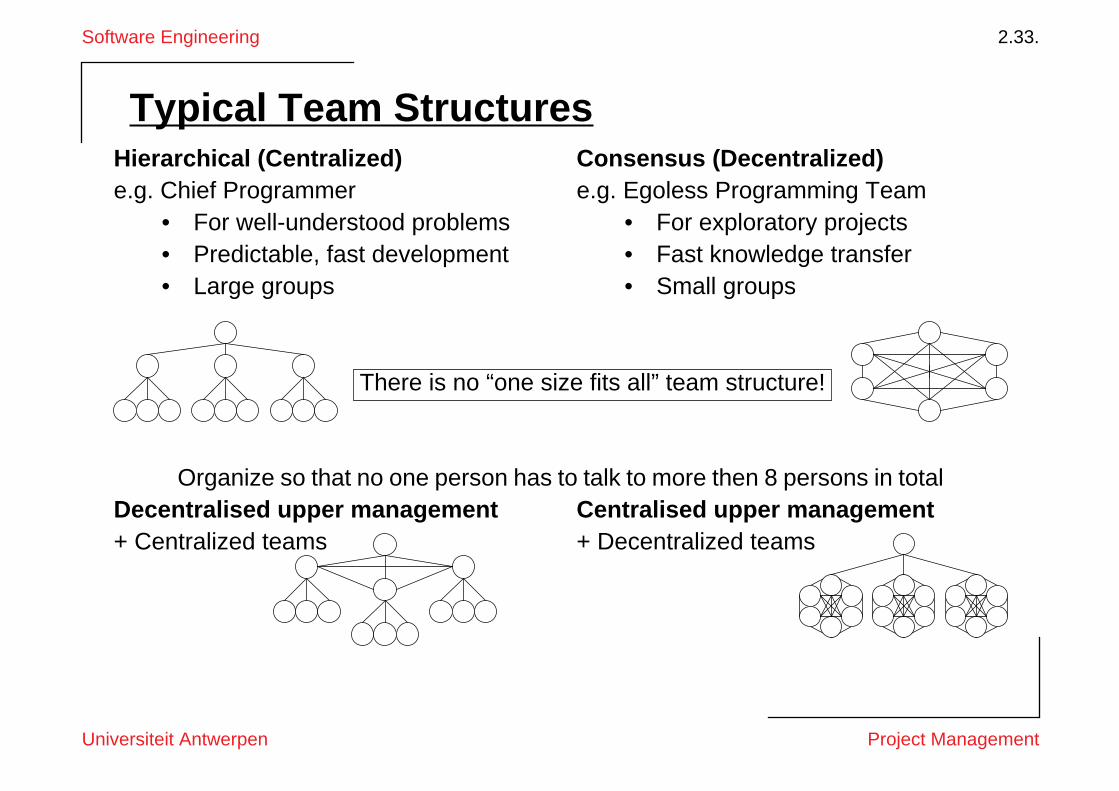
Typical Team StructuresHierarchical (Centralized)e.g. Chief Programmer
• For well-understood problems• Predictable, fast development• Large groups
Consensus (Decentralized)e.g. Egoless Programming Team
• For exploratory projects• Fast knowledge transfer• Small groups
There is no “one size fits all” team structure!
Decentralised upper management+ Centralized teams
Centralised upper management+ Decentralized teams
Organize so that no one person has to talk to more then 8 persons in total

Software Engineering 2.34.
Universiteit Antwerpen Project Management
Directing TeamsDirecting a team = the whole becomes more then the sum of its parts
Managers serve their team• Managers ensure that team has the necessary information and resources
⇒ incl. pizza!
Responsibility demands authority• Managers must delegate
⇒ Trust your own people and they will trust you.
Managers manage• Managers cannot perform tasks on the critical path
⇒ Especially difficult for technical managers
Developers control deadlines• A manager cannot meet a deadline to which the developers have not agreed
Software Engineering 2.35.
Universiteit Antwerpen Project Management
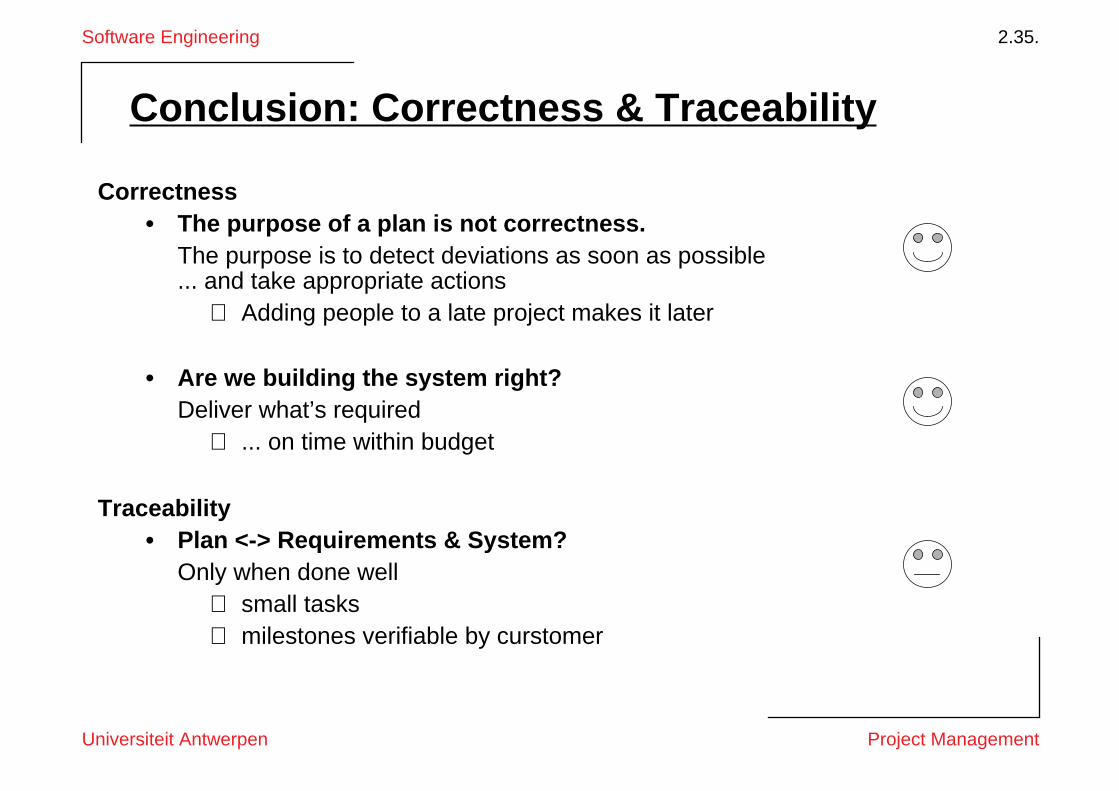
Conclusion: Correctness & Traceability
Correctness• The purpose of a plan is not correctness.
The purpose is to detect deviations as soon as possible... and take appropriate actions
⇒ Adding people to a late project makes it later
• Are we building the system right? Deliver what’s required
⇒ ... on time within budget
Traceability• Plan <-> Requirements & System?
Only when done well⇒ small tasks⇒ milestones verifiable by curstomer

Software Engineering 2.36.
Universiteit Antwerpen Project Management
Summary (i)You should know the answers to these questions
• Why is it necessary to define tasks small?• What is a milestone? What can you use them for?• What is a critical path? Why is it important to know the critical path?• What can you do to recover from delays on the critical path?• How can you optimise the allocation of resources to a project?• How do you use PERT to calculate the risk of delays to a project?• Why is necessary to apply earned value analysis during project management?• Why does replacing a person imply a negative productivity?• What’s the difference between the 0/100; the 50/50 and the milestone technique
for calculating the earned value.• Why shouldn’t managers take on tasks in the critical path?• How can you ensure traceability between the plan and the requirements/system.
You should be able to complete the following tasks• draw a PERT Chart, incl. calculating the critical path and the risk of delays• draw a Gant chart, incl. allocating and optimising of resources• draw a slip line and a timeline

Software Engineering 2.37.
Universiteit Antwerpen Project Management
Summary (ii)
Can you answer the following questions?• Name the various activities covered by project managament. Which ones do you
consider most important? Why?• Compare PERT-charts with Gantt charts for project planning and monitoring.• Describe how earned-value analysis can help you for project monitoring.• Would you consider bending slip lines as a good sign or a bad sign? Why?• You’re a project leader and one of your best teammembers announces that she
is pregnant. You’re going to your boss, asking for a replacement and for an extension of the project deadline. How would you argue the latter request?
• You have to manage a project team of 5 persons for building a C++ compiler. Which team structure and member roles would you choose? Why?