Embed Size (px)
Citation preview
www.danskeresearch.com
Investment Research
28 March 2017
Nordic OutlookEconomic and financial trends
� Denmark: a peculiar upturn - The fairly strong recovery continues but it is not resulting in much top-line growth for businesses.
� Sweden: changing the narrative on inflation - Increasing employment is not resulting in significantly higher inflation.
� Norway: out of the crisis - Growth is normalising as the oil sector is bottoming out.
� Finland: firing on all engines - Consumption and construction drove growth in 2016; investments and exports are next.
I m p o r ta n t d i s c l o s u r e s a n d c e r t i f i c a t i o n s a r e co n ta i n e d f r o m p a g e 3 3 of th i s r e p o r t .
3 | 28 March 2017 www.danskeresearch.com
No
rdic O
utlo
ok
Nordic Outlook
Analysts
Editorial deadline 27 March 2017 Invest ment Research
Editor-in-Chief:
Las Olsen
Chief Economist
+45 45 12 85 36
Macroeconomics:
Bjørn Tangaa Sillemann Denmark +45 45 12 82 29 [email protected]
Louise Aggerstrøm Hansen Denmark +45 45 12 85 31 [email protected]
Christian Alexander Lilholt Toftager Denmark +45 45 12 81 57 [email protected]
Roger Josefsson Sweden +46 8 568 80558 [email protected]
Frank Jullum Norway +47 85 40 65 40 [email protected]
Pasi Petteri Kuoppamäki Finland +358 10 546 7715 [email protected]
Minna Emilia Kuusisto Finland +358 10 546 7955 [email protected]
This publication can be viewed at www.danskebank.com/danskeresearch
Statistical sources: Thomson Reuters Datastream, Macrobond Financial, OECD, IMF, National Institute of Social and Economic
Research, Statistics Denmark and other national statistical institutes as well as proprietary calculations.
Important disclosures and certifications are contained from page 34 of this report.
4 | 28 March 2017 www.danskeresearch.com
No
rdic O
utlo
ok
Nordic Outlook
Contents
Nordic outlook At a glance – Normalising Nordics 4
Denmark A peculiar upturn 5
Forecast at a glance 10
Sweden Changing the narrative on inflation 11
Forecast at a glance 18
Norway Out of the crisis 19
Forecast at a glance 23
Finland Firing on all engines 24
Forecast at a glance 29
Global overview Recovery set to continue 30
Economic forecast 32
Financial forecast 33
The Nordic Outlook is a quarterly publication that presents Danske Bank’s view on the economic outlook for the Nordic
countries. The semi-annual publication The Big Picture sets out our global economic outlook.
5 | 28 March 2017 www.danskeresearch.com
No
rdic O
utlo
ok
Nordic Outlook
At a glance
Normalising Nordics
No longer standing out from the crowd
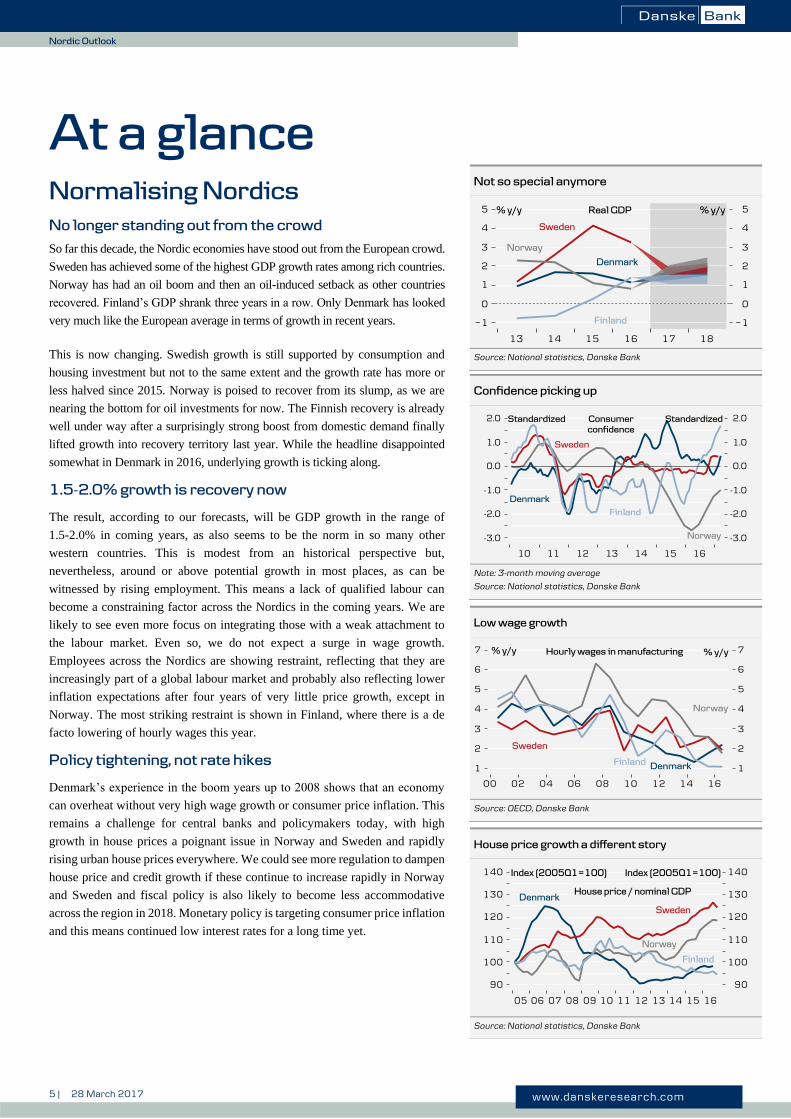
So far this decade, the Nordic economies have stood out from the European crowd.
Sweden has achieved some of the highest GDP growth rates among rich countries.
Norway has had an oil boom and then an oil-induced setback as other countries
recovered. Finland’s GDP shrank three years in a row. Only Denmark has looked
very much like the European average in terms of growth in recent years.
This is now changing. Swedish growth is still supported by consumption and
housing investment but not to the same extent and the growth rate has more or
less halved since 2015. Norway is poised to recover from its slump, as we are
nearing the bottom for oil investments for now. The Finnish recovery is already
well under way after a surprisingly strong boost from domestic demand finally
lifted growth into recovery territory last year. While the headline disappointed
somewhat in Denmark in 2016, underlying growth is ticking along.
1.5-2.0% growth is recovery now
The result, according to our forecasts, will be GDP growth in the range of
1.5-2.0% in coming years, as also seems to be the norm in so many other
western countries. This is modest from an historical perspective but,
nevertheless, around or above potential growth in most places, as can be
witnessed by rising employment. This means a lack of qualified labour can
become a constraining factor across the Nordics in the coming years. We are
likely to see even more focus on integrating those with a weak attachment to
the labour market. Even so, we do not expect a surge in wage growth.
Employees across the Nordics are showing restraint, reflecting that they are
increasingly part of a global labour market and probably also reflecting lower
inflation expectations after four years of very little price growth, except in
Norway. The most striking restraint is shown in Finland, where there is a de
facto lowering of hourly wages this year.
Policy tightening, not rate hikes
Denmark’s experience in the boom years up to 2008 shows that an economy
can overheat without very high wage growth or consumer price inflation. This
remains a challenge for central banks and policymakers today, with high
growth in house prices a poignant issue in Norway and Sweden and rapidly
rising urban house prices everywhere. We could see more regulation to dampen
house price and credit growth if these continue to increase rapidly in Norway
and Sweden and fiscal policy is also likely to become less accommodative
across the region in 2018. Monetary policy is targeting consumer price inflation
and this means continued low interest rates for a long time yet.
Not so special anymore
Source: National statistics, Danske Bank
Confidence picking up
Note: 3-month moving average
Source: National statistics, Danske Bank
Low wage growth
Source: OECD, Danske Bank
House price growth a different story
Source: National statistics, Danske Bank
6 | 28 March 2017 www.danskeresearch.com
No
rdic O
utlo
ok
Nordic Outlook
Denmark
A peculiar upturn
Despite an enduring economic recovery corporate revenue growth
more suggests stagnation.
We expect growth to pick up somewhat, helped by exports, investment
and still decent consumption growth.
Our forecast assumes a larger workforce, which will require greater
labour market participation or immigrant labour.
Inflation is rising but will remain below the norm, so further growth in
real wages will be achievable with modest pay increases.
We expect house prices will continue to appreciate but at a slightly
slower pace.
The Danish economy is clearly far into a recovery. Employment has grown
strongly for four years in a row and we are approaching a situation where there
are no longer any major unused resources in the country. However, corporate
growth in nominal terms is still very limited. Danish corporate revenue liable
to VAT rose 1.9% last year compared to average growth of 3.8% a year over
the past 25 years. Much of corporate Denmark is experiencing the current
situation as a continuing stagnation rather than being close to the peak of an
economic upturn – apart from the greater difficulty in finding qualified labour.
There are several reasons for this apparent paradox. Inflation has fallen from a
norm of around 2% to essentially zero, which is naturally a drag on revenue
growth. Population growth has been high, but very much driven by retirees and
others with weak links to the labour market. Productivity has disappointed both
here in Denmark and abroad. Highly productive industries like oil extraction
have suffered setbacks, while sectors that generate lower revenue per
employee, such as the hotel and restaurant business, have grown.
Economic growth in 2016 was slightly down on our previous forecast, though
that was due to temporary factors connected with government consumption and
inventories, so we have revised our forecast marginally higher for 2017. We
estimate that companies will experience slightly higher revenue growth, mainly
due to increased inflation but also due to slightly better underlying growth.
However, this is during an expansion, so in the longer term we should expect
lower levels of growth to return unless there is a pick-up in productivity or the
size of the labour force.
There are both upside and downside risks to our forecast. A new crisis striking
Denmark’s trading partners would also hit Denmark, as would any measures
from the Trump White House hindering exports to the US. On the other hand,
experience shows that a self-reinforcing expansion can easily become stronger
than expected. Private consumption and investment could potentially grow
significantly – and not just in Denmark.
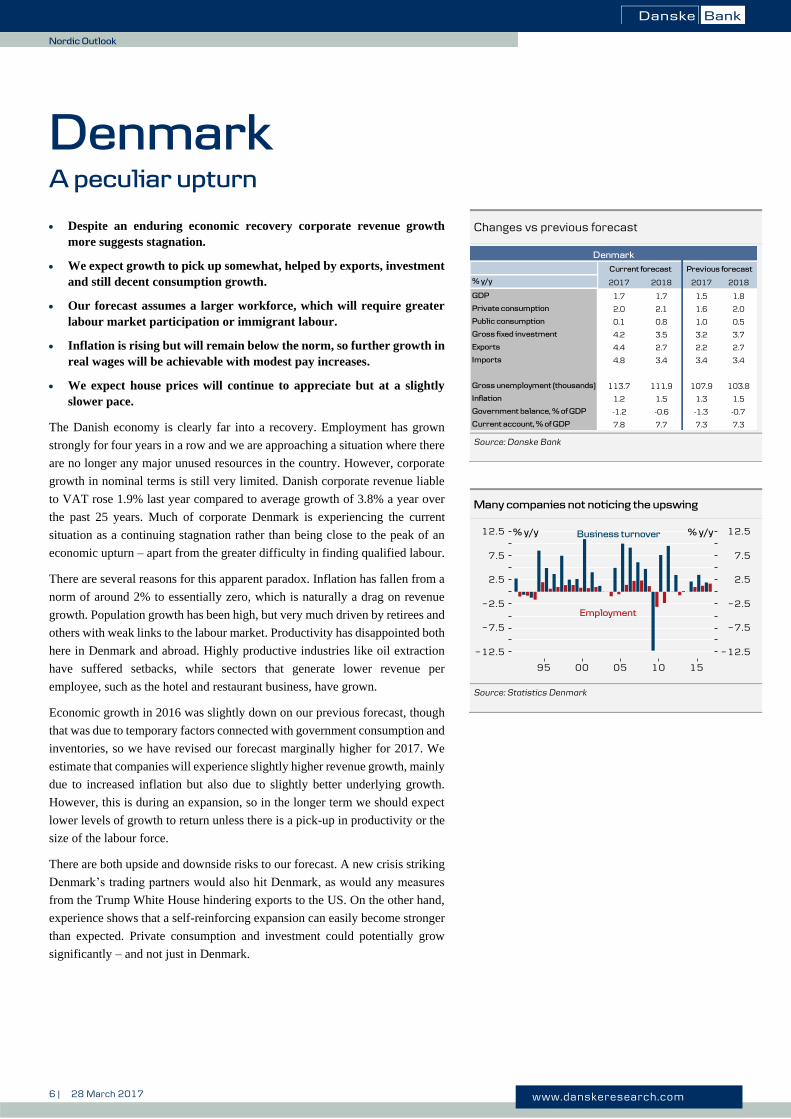
Changes vs previous forecast
Source: Danske Bank
Many companies not noticing the upswing
Source: Statistics Denmark
% y/y 2017 2018 2017 2018
GDP 1.7 1.7 1.5 1.8
Private consumption 2.0 2.1 1.6 2.0
Public consumption 0.1 0.8 1.0 0.5
Gross fixed investment 4.2 3.5 3.2 3.7
Exports 4.4 2.7 2.2 2.7
Imports 4.8 3.4 3.4 3.4
Gross unemployment (thousands) 113.7 111.9 107.9 103.8
Inflation 1.2 1.5 1.3 1.5
Government balance, % of GDP -1.2 -0.6 -1.3 -0.7
Current account, % of GDP 7.8 7.7 7.3 7.3
Previous forecastCurrent forecast
Denmark
7 | 28 March 2017 www.danskeresearch.com
No
rdic O
utlo
ok
Nordic Outlook
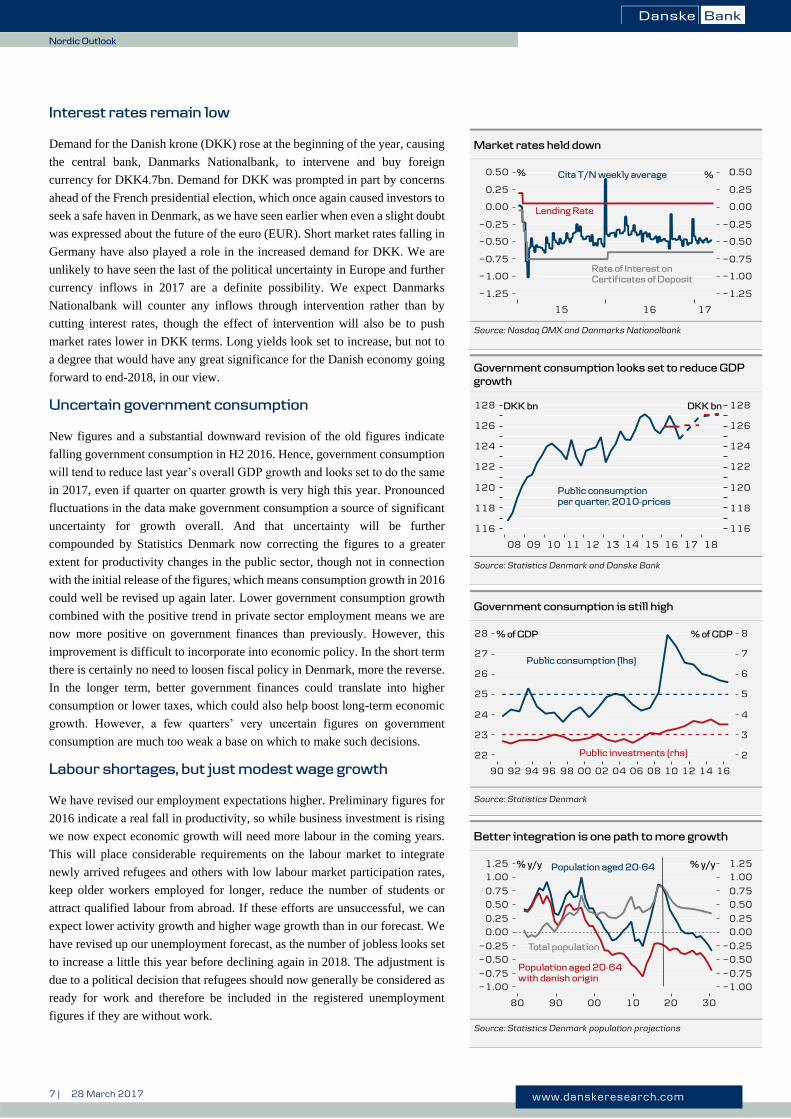
Interest rates remain low
Demand for the Danish krone (DKK) rose at the beginning of the year, causing
the central bank, Danmarks Nationalbank, to intervene and buy foreign
currency for DKK4.7bn. Demand for DKK was prompted in part by concerns
ahead of the French presidential election, which once again caused investors to
seek a safe haven in Denmark, as we have seen earlier when even a slight doubt
was expressed about the future of the euro (EUR). Short market rates falling in
Germany have also played a role in the increased demand for DKK. We are
unlikely to have seen the last of the political uncertainty in Europe and further
currency inflows in 2017 are a definite possibility. We expect Danmarks
Nationalbank will counter any inflows through intervention rather than by
cutting interest rates, though the effect of intervention will also be to push
market rates lower in DKK terms. Long yields look set to increase, but not to
a degree that would have any great significance for the Danish economy going
forward to end-2018, in our view.
Uncertain government consumption
New figures and a substantial downward revision of the old figures indicate
falling government consumption in H2 2016. Hence, government consumption
will tend to reduce last year’s overall GDP growth and looks set to do the same
in 2017, even if quarter on quarter growth is very high this year. Pronounced
fluctuations in the data make government consumption a source of significant
uncertainty for growth overall. And that uncertainty will be further
compounded by Statistics Denmark now correcting the figures to a greater
extent for productivity changes in the public sector, though not in connection
with the initial release of the figures, which means consumption growth in 2016
could well be revised up again later. Lower government consumption growth
combined with the positive trend in private sector employment means we are
now more positive on government finances than previously. However, this
improvement is difficult to incorporate into economic policy. In the short term
there is certainly no need to loosen fiscal policy in Denmark, more the reverse.
In the longer term, better government finances could translate into higher
consumption or lower taxes, which could also help boost long-term economic
growth. However, a few quarters’ very uncertain figures on government
consumption are much too weak a base on which to make such decisions.
Labour shortages, but just modest wage growth
We have revised our employment expectations higher. Preliminary figures for
2016 indicate a real fall in productivity, so while business investment is rising
we now expect economic growth will need more labour in the coming years.
This will place considerable requirements on the labour market to integrate
newly arrived refugees and others with low labour market participation rates,
keep older workers employed for longer, reduce the number of students or
attract qualified labour from abroad. If these efforts are unsuccessful, we can
expect lower activity growth and higher wage growth than in our forecast. We
have revised up our unemployment forecast, as the number of jobless looks set
to increase a little this year before declining again in 2018. The adjustment is
due to a political decision that refugees should now generally be considered as
ready for work and therefore be included in the registered unemployment
figures if they are without work.
Government consumption looks set to reduce GDP
growth
Source: Statistics Denmark and Danske Bank
Market rates held down
Source: Nasdaq OMX and Danmarks Nationalbank
Government consumption is still high
Source: Statistics Denmark
Better integration is one path to more growth
Source: Statistics Denmark population projections
8 | 28 March 2017 www.danskeresearch.com
No
rdic O
utlo
ok
Nordic Outlook
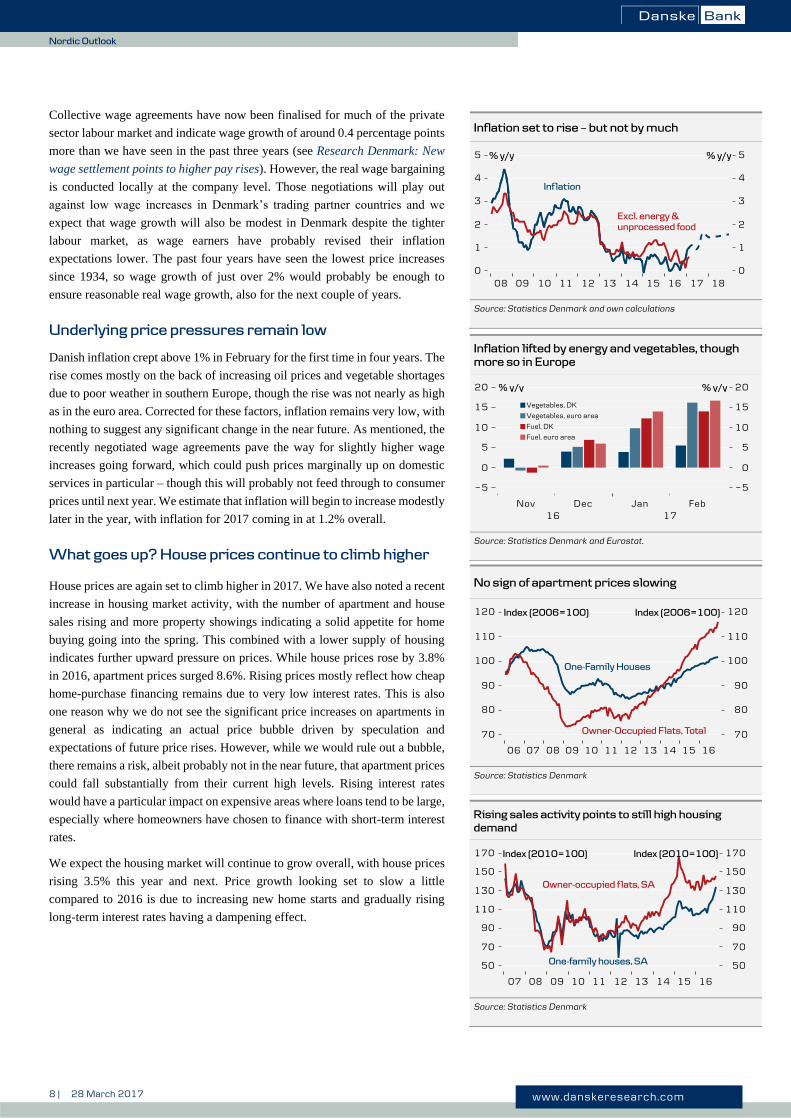
Collective wage agreements have now been finalised for much of the private
sector labour market and indicate wage growth of around 0.4 percentage points
more than we have seen in the past three years (see Research Denmark: New
wage settlement points to higher pay rises). However, the real wage bargaining
is conducted locally at the company level. Those negotiations will play out
against low wage increases in Denmark’s trading partner countries and we
expect that wage growth will also be modest in Denmark despite the tighter
labour market, as wage earners have probably revised their inflation
expectations lower. The past four years have seen the lowest price increases
since 1934, so wage growth of just over 2% would probably be enough to
ensure reasonable real wage growth, also for the next couple of years.
Underlying price pressures remain low
Danish inflation crept above 1% in February for the first time in four years. The
rise comes mostly on the back of increasing oil prices and vegetable shortages
due to poor weather in southern Europe, though the rise was not nearly as high
as in the euro area. Corrected for these factors, inflation remains very low, with
nothing to suggest any significant change in the near future. As mentioned, the
recently negotiated wage agreements pave the way for slightly higher wage
increases going forward, which could push prices marginally up on domestic
services in particular – though this will probably not feed through to consumer
prices until next year. We estimate that inflation will begin to increase modestly
later in the year, with inflation for 2017 coming in at 1.2% overall.
What goes up? House prices continue to climb higher
House prices are again set to climb higher in 2017. We have also noted a recent
increase in housing market activity, with the number of apartment and house
sales rising and more property showings indicating a solid appetite for home
buying going into the spring. This combined with a lower supply of housing
indicates further upward pressure on prices. While house prices rose by 3.8%
in 2016, apartment prices surged 8.6%. Rising prices mostly reflect how cheap
home-purchase financing remains due to very low interest rates. This is also
one reason why we do not see the significant price increases on apartments in
general as indicating an actual price bubble driven by speculation and
expectations of future price rises. However, while we would rule out a bubble,
there remains a risk, albeit probably not in the near future, that apartment prices
could fall substantially from their current high levels. Rising interest rates
would have a particular impact on expensive areas where loans tend to be large,
especially where homeowners have chosen to finance with short-term interest
rates.
We expect the housing market will continue to grow overall, with house prices
rising 3.5% this year and next. Price growth looking set to slow a little
compared to 2016 is due to increasing new home starts and gradually rising
long-term interest rates having a dampening effect.
Inflation set to rise – but not by much
Source: Statistics Denmark and own calculations
Inflation lifted by energy and vegetables, though
more so in Europe
Source: Statistics Denmark and Eurostat.
No sign of apartment prices slowing
Source: Statistics Denmark
Rising sales activity points to still high housing
demand
Source: Statistics Denmark
9 | 28 March 2017 www.danskeresearch.com
No
rdic O
utlo
ok
Nordic Outlook
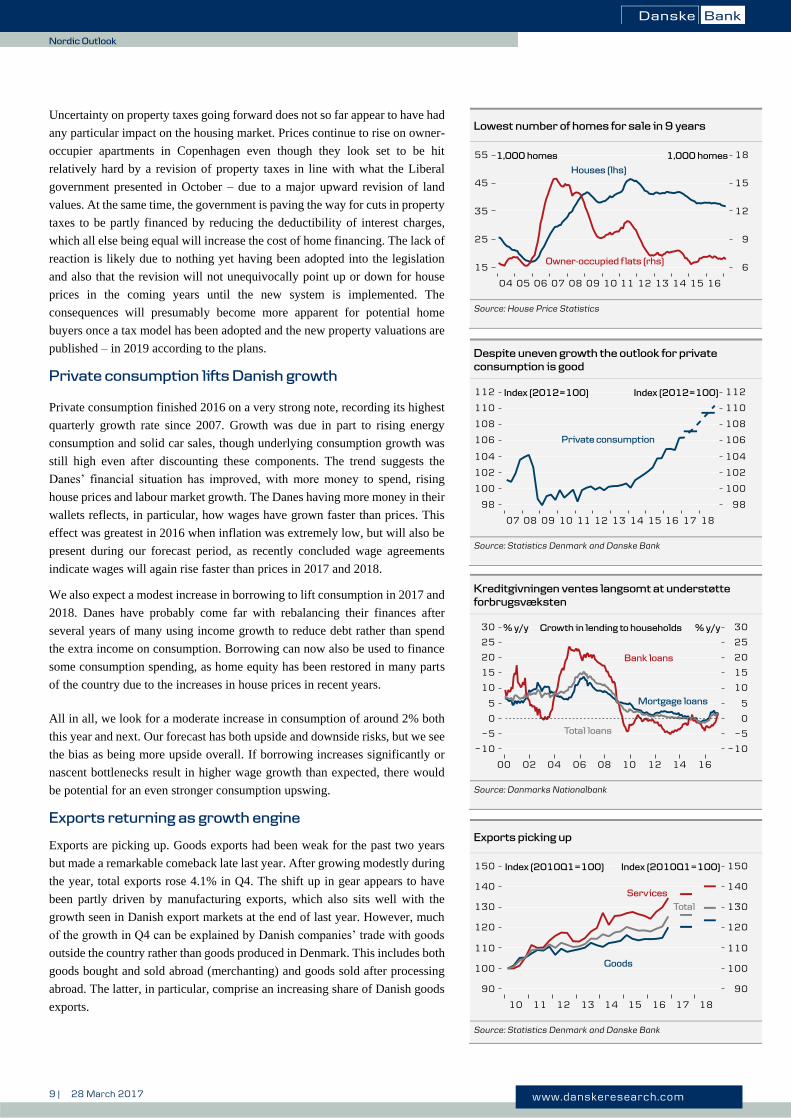
Uncertainty on property taxes going forward does not so far appear to have had
any particular impact on the housing market. Prices continue to rise on owner-
occupier apartments in Copenhagen even though they look set to be hit
relatively hard by a revision of property taxes in line with what the Liberal
government presented in October – due to a major upward revision of land
values. At the same time, the government is paving the way for cuts in property
taxes to be partly financed by reducing the deductibility of interest charges,
which all else being equal will increase the cost of home financing. The lack of
reaction is likely due to nothing yet having been adopted into the legislation
and also that the revision will not unequivocally point up or down for house
prices in the coming years until the new system is implemented. The
consequences will presumably become more apparent for potential home
buyers once a tax model has been adopted and the new property valuations are
published – in 2019 according to the plans.
Private consumption lifts Danish growth
Private consumption finished 2016 on a very strong note, recording its highest
quarterly growth rate since 2007. Growth was due in part to rising energy
consumption and solid car sales, though underlying consumption growth was
still high even after discounting these components. The trend suggests the
Danes’ financial situation has improved, with more money to spend, rising
house prices and labour market growth. The Danes having more money in their
wallets reflects, in particular, how wages have grown faster than prices. This
effect was greatest in 2016 when inflation was extremely low, but will also be
present during our forecast period, as recently concluded wage agreements
indicate wages will again rise faster than prices in 2017 and 2018.
We also expect a modest increase in borrowing to lift consumption in 2017 and
2018. Danes have probably come far with rebalancing their finances after
several years of many using income growth to reduce debt rather than spend
the extra income on consumption. Borrowing can now also be used to finance
some consumption spending, as home equity has been restored in many parts
of the country due to the increases in house prices in recent years.
All in all, we look for a moderate increase in consumption of around 2% both
this year and next. Our forecast has both upside and downside risks, but we see
the bias as being more upside overall. If borrowing increases significantly or
nascent bottlenecks result in higher wage growth than expected, there would
be potential for an even stronger consumption upswing.
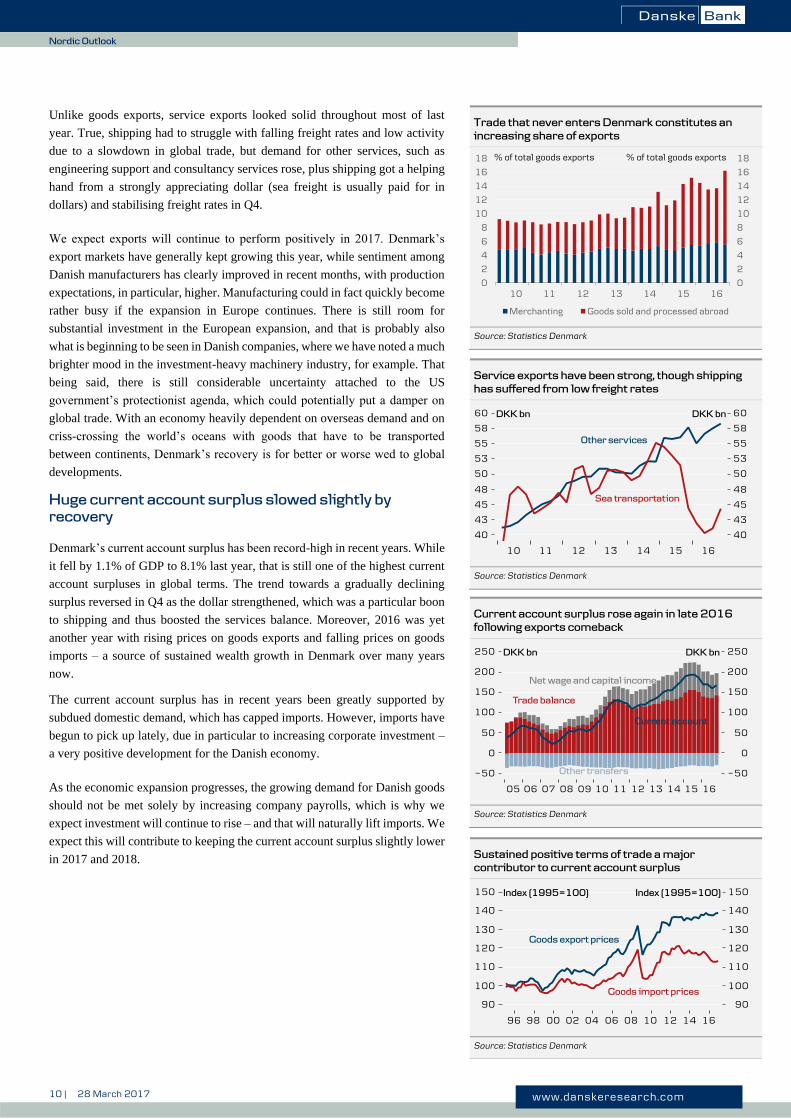
Exports returning as growth engine
Exports are picking up. Goods exports had been weak for the past two years
but made a remarkable comeback late last year. After growing modestly during
the year, total exports rose 4.1% in Q4. The shift up in gear appears to have
been partly driven by manufacturing exports, which also sits well with the
growth seen in Danish export markets at the end of last year. However, much
of the growth in Q4 can be explained by Danish companies’ trade with goods
outside the country rather than goods produced in Denmark. This includes both
goods bought and sold abroad (merchanting) and goods sold after processing
abroad. The latter, in particular, comprise an increasing share of Danish goods
exports.
Lowest number of homes for sale in 9 years
Source: House Price Statistics
Despite uneven growth the outlook for private
consumption is good
Source: Statistics Denmark and Danske Bank
Kreditgivningen ventes langsomt at understøtte
forbrugsvæksten
Source: Danmarks Nationalbank
Exports picking up
Source: Statistics Denmark and Danske Bank
10 | 28 March 2017 www.danskeresearch.com
No
rdic O
utlo
ok
Nordic Outlook
Unlike goods exports, service exports looked solid throughout most of last
year. True, shipping had to struggle with falling freight rates and low activity
due to a slowdown in global trade, but demand for other services, such as
engineering support and consultancy services rose, plus shipping got a helping
hand from a strongly appreciating dollar (sea freight is usually paid for in
dollars) and stabilising freight rates in Q4.
We expect exports will continue to perform positively in 2017. Denmark’s
export markets have generally kept growing this year, while sentiment among
Danish manufacturers has clearly improved in recent months, with production
expectations, in particular, higher. Manufacturing could in fact quickly become
rather busy if the expansion in Europe continues. There is still room for
substantial investment in the European expansion, and that is probably also
what is beginning to be seen in Danish companies, where we have noted a much
brighter mood in the investment-heavy machinery industry, for example. That
being said, there is still considerable uncertainty attached to the US
government’s protectionist agenda, which could potentially put a damper on
global trade. With an economy heavily dependent on overseas demand and on
criss-crossing the world’s oceans with goods that have to be transported
between continents, Denmark’s recovery is for better or worse wed to global
developments.
Huge current account surplus slowed slightly by
recovery
Denmark’s current account surplus has been record-high in recent years. While
it fell by 1.1% of GDP to 8.1% last year, that is still one of the highest current
account surpluses in global terms. The trend towards a gradually declining
surplus reversed in Q4 as the dollar strengthened, which was a particular boon
to shipping and thus boosted the services balance. Moreover, 2016 was yet
another year with rising prices on goods exports and falling prices on goods
imports – a source of sustained wealth growth in Denmark over many years
now.
The current account surplus has in recent years been greatly supported by
subdued domestic demand, which has capped imports. However, imports have
begun to pick up lately, due in particular to increasing corporate investment –
a very positive development for the Danish economy.
As the economic expansion progresses, the growing demand for Danish goods
should not be met solely by increasing company payrolls, which is why we
expect investment will continue to rise – and that will naturally lift imports. We
expect this will contribute to keeping the current account surplus slightly lower
in 2017 and 2018.
Trade that never enters Denmark constitutes an
increasing share of exports
Source: Statistics Denmark
Service exports have been strong, though shipping
has suffered from low freight rates
Source: Statistics Denmark
Current account surplus rose again in late 2016
following exports comeback
Source: Statistics Denmark
Sustained positive terms of trade a major
contributor to current account surplus
Source: Statistics Denmark
0
2
4
6
8
10
12
14
16
18
0
2
4
6
8
10
12
14
16
18
10 11 12 13 14 15 16
Merchanting Goods sold and processed abroad
% of total goods exports% of total goods exports
11 | 28 March 2017 www.danskeresearch.com
No
rdic O
utlo
ok
Nordic Outlook
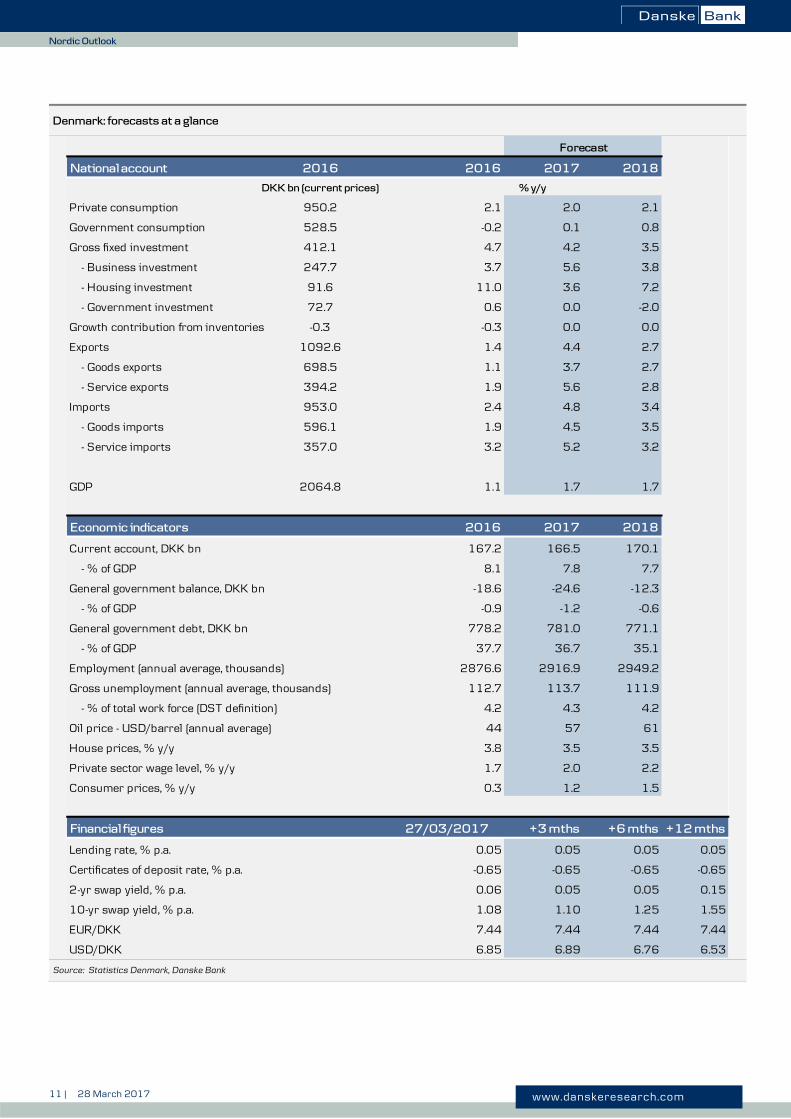
Denmark: forecasts at a glance
Source: Statistics Denmark, Danske Bank
National account 2016 2016 2017 2018
DKK bn (current prices)
Private consumption 950.2 2.1 2.0 2.1
Government consumption 528.5 -0.2 0.1 0.8
Gross fixed investment 412.1 4.7 4.2 3.5
- Business investment 247.7 3.7 5.6 3.8
- Housing investment 91.6 11.0 3.6 7.2
- Government investment 72.7 0.6 0.0 -2.0
Growth contribution from inventories -0.3 -0.3 0.0 0.0
Exports 1092.6 1.4 4.4 2.7
- Goods exports 698.5 1.1 3.7 2.7
- Service exports 394.2 1.9 5.6 2.8
Imports 953.0 2.4 4.8 3.4
- Goods imports 596.1 1.9 4.5 3.5
- Service imports 357.0 3.2 5.2 3.2
GDP 2064.8 1.1 1.7 1.7
Economic indicators 2016 2017 2018
Current account, DKK bn 167.2 166.5 170.1
- % of GDP 8.1 7.8 7.7
General government balance, DKK bn -18.6 -24.6 -12.3
- % of GDP -0.9 -1.2 -0.6
General government debt, DKK bn 778.2 781.0 771.1
- % of GDP 37.7 36.7 35.1
Employment (annual average, thousands) 2876.6 2916.9 2949.2
Gross unemployment (annual average, thousands) 112.7 113.7 111.9
- % of total work force (DST definition) 4.2 4.3 4.2
Oil price - USD/barrel (annual average) 44 57 61
House prices, % y/y 3.8 3.5 3.5
Private sector wage level, % y/y 1.7 2.0 2.2
Consumer prices, % y/y 0.3 1.2 1.5
Financial figures 27/03/2017 +3 mths +6 mths +12 mths
Lending rate, % p.a. 0.05 0.05 0.05 0.05
Certificates of deposit rate, % p.a. -0.65 -0.65 -0.65 -0.65
2-yr swap yield, % p.a. 0.06 0.05 0.05 0.15
10-yr swap yield, % p.a. 1.08 1.10 1.25 1.55
EUR/DKK 7.44 7.44 7.44 7.44
USD/DKK 6.85 6.89 6.76 6.53
Forecast
% y/y
12 | 28 March 2017 www.danskeresearch.com
No
rdic O
utlo
ok
Nordic Outlook
Sweden
Changing the narrative on inflation
In what must be evidence of the accuracy of ‘broken clocks’,
preliminary readings show that GDP growth came in exactly in line
with our long-held expectations of 3% y/y (vol, wda) for 2016. Though
strong from an international standpoint, it was clearly below other
forecasters’ expectations, including the Riksbank’s.
Looking ahead, we expect GDP growth to subside further to 2% y/y
(vol, wda) in both 2017 and 2018. This is in line with our view of a
normalising Swedish economy and as potential GDP growth is
calculated to be around 1½% y/y (vol) it could even be labelled strong.
Labour markets have improved dramatically over the past few years.
That said, even as employment growth has powered on, the
unemployment rate has become stuck at levels which historically
would be considered high. This is explained by an influx of immigrants
and large young aged cohorts entering the labour force.
Given the current high demand for labour, the outlook for companies
accepting inexperienced and unqualified workers has rarely been
better. However, this is only possible to a certain extent, which makes
it hard to assess the employability of the new entrants and thus to
estimate the amount of idle resources.
Wage growth is under any circumstances expected to remain low
throughout the forecast horizon and we foresee no underlying cost
pressures to talk of. This situation is further exacerbated by the
difficulties that companies are having in raising profit margins.
This, nota bene, clashes with the current inflation narrative, where the
Riksbank and market participants have become gradually more
convinced that inflation is sustainably approaching the inflation target.
In our view, the inflation impetus over the past year has mainly been
the result of higher energy costs (mainly oil) and lagged effects from a
previously weak SEK. As these effects pass, we cannot identify any
other apparent drivers of inflation.
We still expect the Riksbank to end its current quantitative easing
programme due to an increasingly strained bond supply situation and
very low market liquidity. This, however, should be balanced by the
Riksbank delaying and lowering the repo rate path, effectively
adhering to the ‘Jansson-rule’ adopted by, inter alia, Mario Draghi and
the ECB.
In short, the Jansson rule implies no contraction of monetary policy
until underlying (wage-driven) inflation measures and expectations are
sustainably at levels consistent with the inflation target. We therefore
expect the first hike to come, at the earliest, in the winter of 2018/19
and consider risks for further unconventional policy measures as very
high.
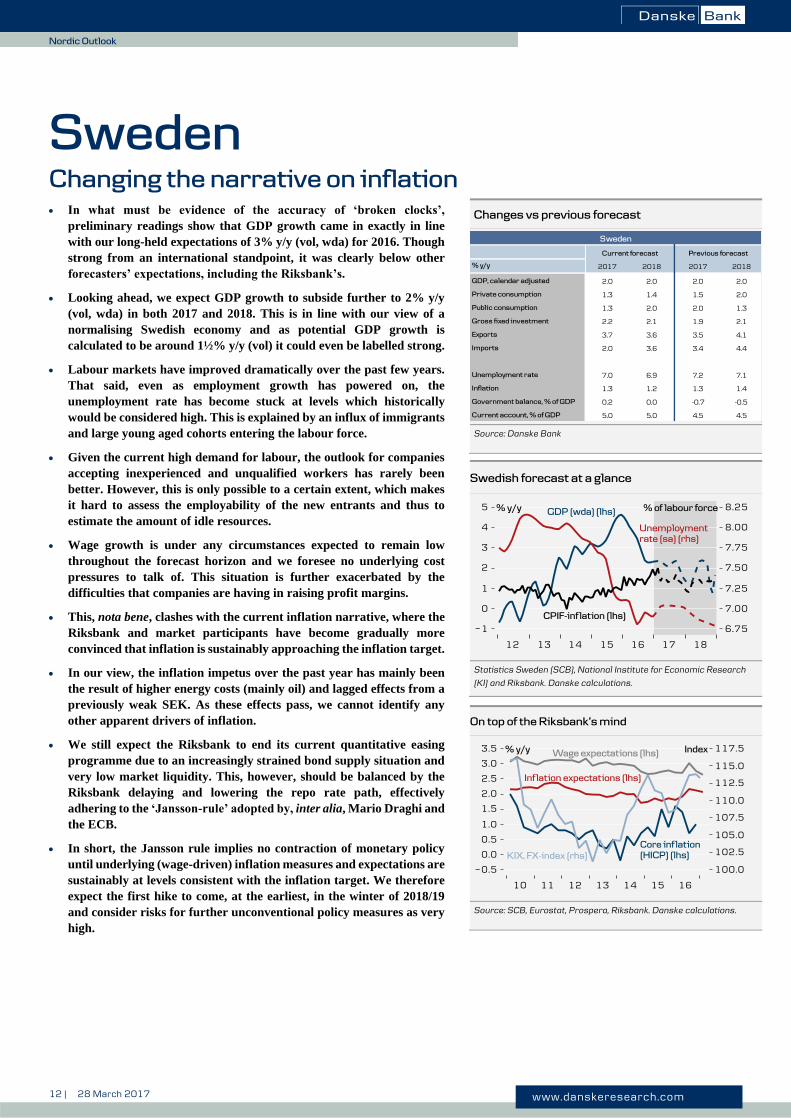
Changes vs previous forecast
Source: Danske Bank
Swedish forecast at a glance
Statistics Sweden (SCB), National Institute for Economic Research
(KI) and Riksbank. Danske calculations.
On top of the Riksbank’s mind
Source: SCB, Eurostat, Prospera, Riksbank. Danske calculations.
% y/y 2017 2018 2017 2018
GDP, calendar adjusted 2.0 2.0 2.0 2.0
Private consumption 1.3 1.4 1.5 2.0
Public consumption 1.3 2.0 2.0 1.3
Gross fixed investment 2.2 2.1 1.9 2.1
Exports 3.7 3.6 3.5 4.1
Imports 2.0 3.6 3.4 4.4
Unemployment rate 7.0 6.9 7.2 7.1
Inflation 1.3 1.2 1.3 1.4
Government balance, % of GDP 0.2 0.0 -0.7 -0.5
Current account, % of GDP 5.0 5.0 4.5 4.5
Sweden
Current forecast Previous forecast
13 | 28 March 2017 www.danskeresearch.com
No
rdic O
utlo
ok
Nordic Outlook
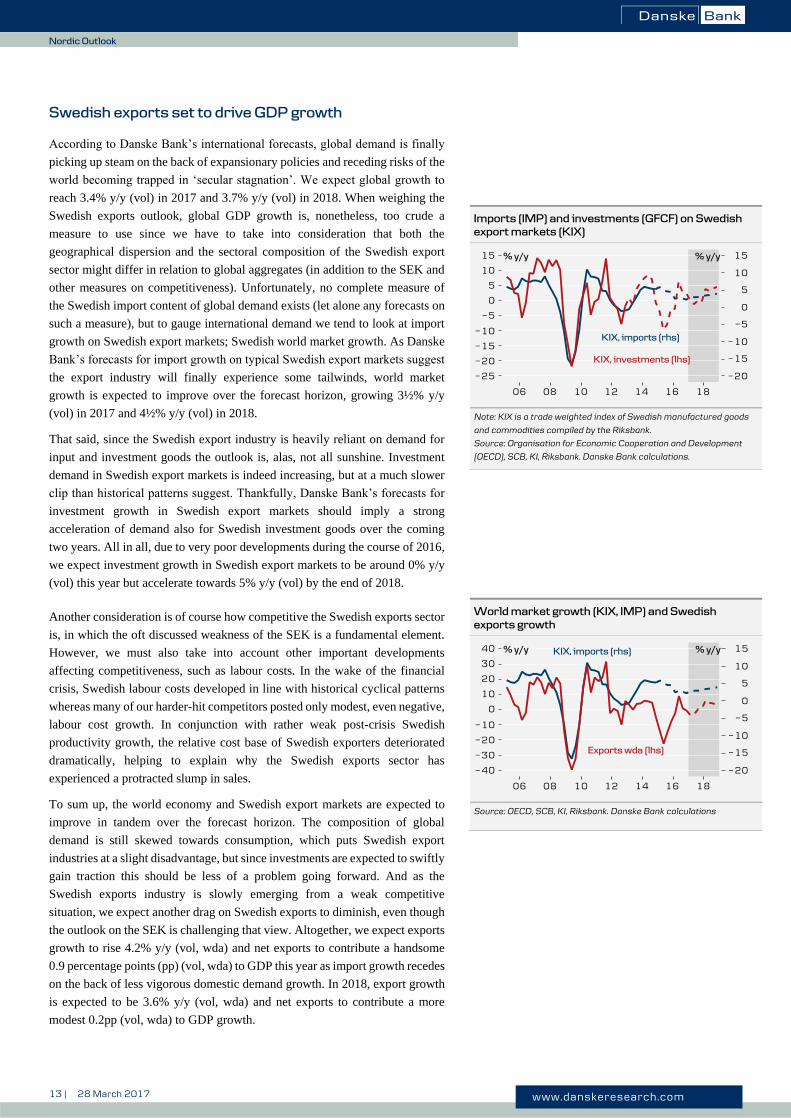
Swedish exports set to drive GDP growth
According to Danske Bank’s international forecasts, global demand is finally
picking up steam on the back of expansionary policies and receding risks of the
world becoming trapped in ‘secular stagnation’. We expect global growth to
reach 3.4% y/y (vol) in 2017 and 3.7% y/y (vol) in 2018. When weighing the
Swedish exports outlook, global GDP growth is, nonetheless, too crude a
measure to use since we have to take into consideration that both the
geographical dispersion and the sectoral composition of the Swedish export
sector might differ in relation to global aggregates (in addition to the SEK and
other measures on competitiveness). Unfortunately, no complete measure of
the Swedish import content of global demand exists (let alone any forecasts on
such a measure), but to gauge international demand we tend to look at import
growth on Swedish export markets; Swedish world market growth. As Danske
Bank’s forecasts for import growth on typical Swedish export markets suggest
the export industry will finally experience some tailwinds, world market
growth is expected to improve over the forecast horizon, growing 3½% y/y
(vol) in 2017 and 4½% y/y (vol) in 2018.
That said, since the Swedish export industry is heavily reliant on demand for
input and investment goods the outlook is, alas, not all sunshine. Investment
demand in Swedish export markets is indeed increasing, but at a much slower
clip than historical patterns suggest. Thankfully, Danske Bank’s forecasts for
investment growth in Swedish export markets should imply a strong
acceleration of demand also for Swedish investment goods over the coming
two years. All in all, due to very poor developments during the course of 2016,
we expect investment growth in Swedish export markets to be around 0% y/y
(vol) this year but accelerate towards 5% y/y (vol) by the end of 2018.
Another consideration is of course how competitive the Swedish exports sector
is, in which the oft discussed weakness of the SEK is a fundamental element.
However, we must also take into account other important developments
affecting competitiveness, such as labour costs. In the wake of the financial
crisis, Swedish labour costs developed in line with historical cyclical patterns
whereas many of our harder-hit competitors posted only modest, even negative,
labour cost growth. In conjunction with rather weak post-crisis Swedish
productivity growth, the relative cost base of Swedish exporters deteriorated
dramatically, helping to explain why the Swedish exports sector has
experienced a protracted slump in sales.
To sum up, the world economy and Swedish export markets are expected to
improve in tandem over the forecast horizon. The composition of global
demand is still skewed towards consumption, which puts Swedish export
industries at a slight disadvantage, but since investments are expected to swiftly
gain traction this should be less of a problem going forward. And as the
Swedish exports industry is slowly emerging from a weak competitive
situation, we expect another drag on Swedish exports to diminish, even though
the outlook on the SEK is challenging that view. Altogether, we expect exports
growth to rise 4.2% y/y (vol, wda) and net exports to contribute a handsome
0.9 percentage points (pp) (vol, wda) to GDP this year as import growth recedes
on the back of less vigorous domestic demand growth. In 2018, export growth
is expected to be 3.6% y/y (vol, wda) and net exports to contribute a more
modest 0.2pp (vol, wda) to GDP growth.
Imports (IMP) and investments (GFCF) on Swedish
export markets (KIX)
Note: KIX is a trade weighted index of Swedish manufactured goods
and commodities compiled by the Riksbank.
Source: Organisation for Economic Cooperation and Development
(OECD), SCB, KI, Riksbank. Danske Bank calculations.
World market growth (KIX, IMP) and Swedish
exports growth
Source: OECD, SCB, KI, Riksbank. Danske Bank calculations
14 | 28 March 2017 www.danskeresearch.com
No
rdic O
utlo
ok
Nordic Outlook
Financial conditions becoming less supportive
When balancing Swedish growth prospects, the external demand situation is of
course vital. Another important area to ponder is the financial outlook. We have
already touched on the outlook for the SEK, which we feel should strengthen
in trend over the coming years, due to strong public finances, external surpluses
and a foreseen cyclical improvement
Low inflation should nonetheless keep short-term interest rates depressed, but
longer-term yields are expected to oscillate in a wide range as the international
and domestic outlooks go through phases. As for equity markets, the Danske
Bank view is that despite impressive rises over the past couple of months,
valuations are still reasonable given that we expect Swedish companies to
capitalise on stronger growth in the surrounding world. However, the room for
further near-term capital gains should be limited as we now need to start to see
some confirmation in hard data and profits before starting another leg upwards
in equity prices.
The Swedish housing market is continuing its ascent, and the tentative signs of
moderation in prices seen in conjunction with the introduction of the forced
amortisation rule are no longer visible. The Danske Bank view continues to be
that Swedish house price valuations are fundamentally strained, but lack of
supply, little speculative demand and strong buffers in both the banking and
household sector pave the way for an orderly correction via decelerating house
price growth and accelerating income growth. As authorities seem sincere in
their quest for reining in the risks attached to increasing household
indebtedness, we expect further measures – such as a debt to disposable income
ceiling – to be introduced, perhaps already early next year.
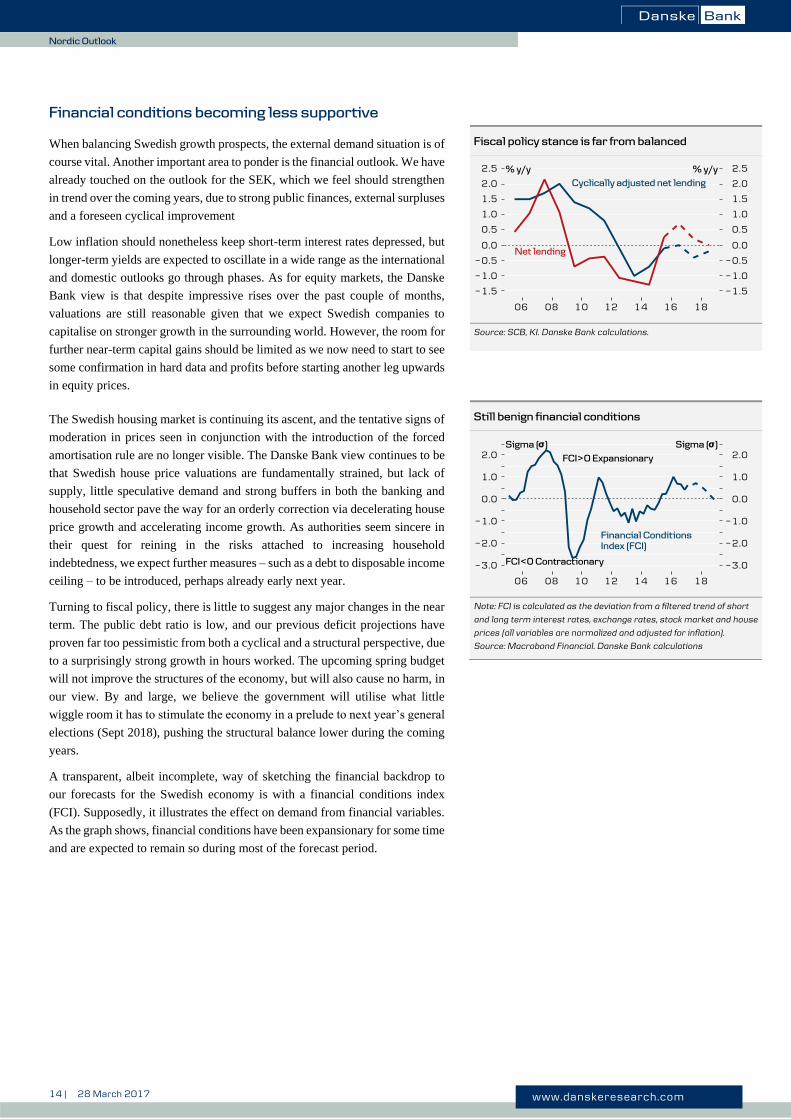
Turning to fiscal policy, there is little to suggest any major changes in the near
term. The public debt ratio is low, and our previous deficit projections have
proven far too pessimistic from both a cyclical and a structural perspective, due
to a surprisingly strong growth in hours worked. The upcoming spring budget
will not improve the structures of the economy, but will also cause no harm, in
our view. By and large, we believe the government will utilise what little
wiggle room it has to stimulate the economy in a prelude to next year’s general
elections (Sept 2018), pushing the structural balance lower during the coming
years.
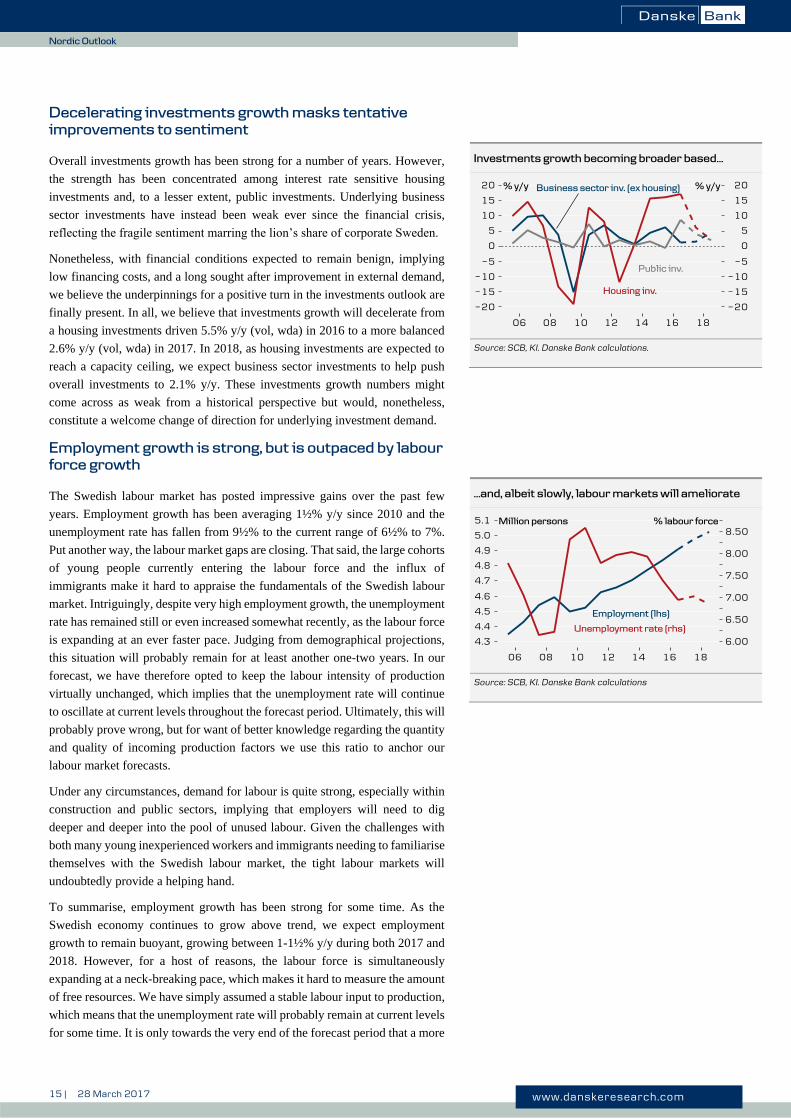
A transparent, albeit incomplete, way of sketching the financial backdrop to
our forecasts for the Swedish economy is with a financial conditions index
(FCI). Supposedly, it illustrates the effect on demand from financial variables.
As the graph shows, financial conditions have been expansionary for some time
and are expected to remain so during most of the forecast period.
Fiscal policy stance is far from balanced
Source: SCB, KI. Danske Bank calculations.
Still benign financial conditions
Note: FCI is calculated as the deviation from a filtered trend of short
and long term interest rates, exchange rates, stock market and house
prices (all variables are normalized and adjusted for inflation).
Source: Macrobond Financial. Danske Bank calculations
15 | 28 March 2017 www.danskeresearch.com
No
rdic O
utlo
ok
Nordic Outlook
Decelerating investments growth masks tentative
improvements to sentiment
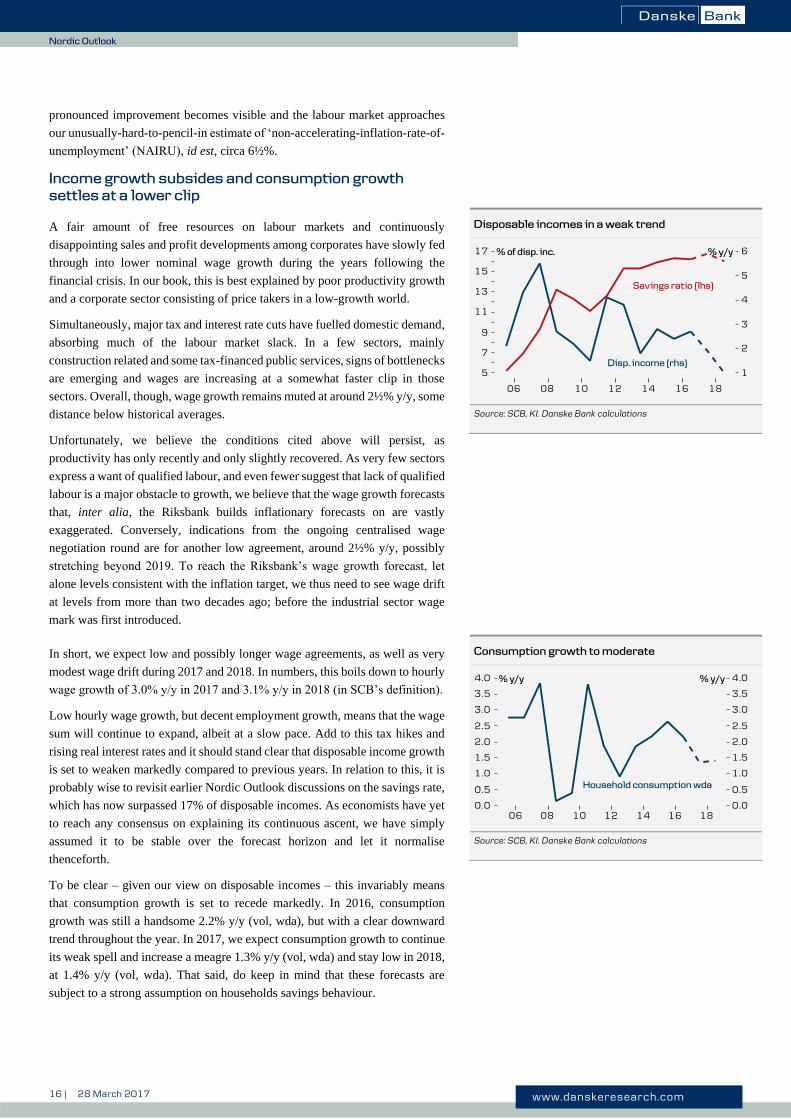
Overall investments growth has been strong for a number of years. However,
the strength has been concentrated among interest rate sensitive housing
investments and, to a lesser extent, public investments. Underlying business
sector investments have instead been weak ever since the financial crisis,
reflecting the fragile sentiment marring the lion’s share of corporate Sweden.
Nonetheless, with financial conditions expected to remain benign, implying
low financing costs, and a long sought after improvement in external demand,
we believe the underpinnings for a positive turn in the investments outlook are
finally present. In all, we believe that investments growth will decelerate from
a housing investments driven 5.5% y/y (vol, wda) in 2016 to a more balanced
2.6% y/y (vol, wda) in 2017. In 2018, as housing investments are expected to
reach a capacity ceiling, we expect business sector investments to help push
overall investments to 2.1% y/y. These investments growth numbers might
come across as weak from a historical perspective but would, nonetheless,
constitute a welcome change of direction for underlying investment demand.
Employment growth is strong, but is outpaced by labour
force growth
The Swedish labour market has posted impressive gains over the past few
years. Employment growth has been averaging 1½% y/y since 2010 and the
unemployment rate has fallen from 9½% to the current range of 6½% to 7%.
Put another way, the labour market gaps are closing. That said, the large cohorts
of young people currently entering the labour force and the influx of
immigrants make it hard to appraise the fundamentals of the Swedish labour
market. Intriguingly, despite very high employment growth, the unemployment
rate has remained still or even increased somewhat recently, as the labour force
is expanding at an ever faster pace. Judging from demographical projections,
this situation will probably remain for at least another one-two years. In our
forecast, we have therefore opted to keep the labour intensity of production
virtually unchanged, which implies that the unemployment rate will continue
to oscillate at current levels throughout the forecast period. Ultimately, this will
probably prove wrong, but for want of better knowledge regarding the quantity
and quality of incoming production factors we use this ratio to anchor our
labour market forecasts.
Under any circumstances, demand for labour is quite strong, especially within
construction and public sectors, implying that employers will need to dig
deeper and deeper into the pool of unused labour. Given the challenges with
both many young inexperienced workers and immigrants needing to familiarise
themselves with the Swedish labour market, the tight labour markets will
undoubtedly provide a helping hand.
To summarise, employment growth has been strong for some time. As the
Swedish economy continues to grow above trend, we expect employment
growth to remain buoyant, growing between 1-1½% y/y during both 2017 and
2018. However, for a host of reasons, the labour force is simultaneously
expanding at a neck-breaking pace, which makes it hard to measure the amount
of free resources. We have simply assumed a stable labour input to production,
which means that the unemployment rate will probably remain at current levels
for some time. It is only towards the very end of the forecast period that a more
Investments growth becoming broader based…
Source: SCB, KI. Danske Bank calculations.
…and, albeit slowly, labour markets will ameliorate
Source: SCB, KI. Danske Bank calculations
16 | 28 March 2017 www.danskeresearch.com
No
rdic O
utlo
ok
Nordic Outlook
pronounced improvement becomes visible and the labour market approaches
our unusually-hard-to-pencil-in estimate of ‘non-accelerating-inflation-rate-of-
unemployment’ (NAIRU), id est, circa 6½%.
Income growth subsides and consumption growth
settles at a lower clip
A fair amount of free resources on labour markets and continuously
disappointing sales and profit developments among corporates have slowly fed
through into lower nominal wage growth during the years following the
financial crisis. In our book, this is best explained by poor productivity growth
and a corporate sector consisting of price takers in a low-growth world.
Simultaneously, major tax and interest rate cuts have fuelled domestic demand,
absorbing much of the labour market slack. In a few sectors, mainly
construction related and some tax-financed public services, signs of bottlenecks
are emerging and wages are increasing at a somewhat faster clip in those
sectors. Overall, though, wage growth remains muted at around 2½% y/y, some
distance below historical averages.
Unfortunately, we believe the conditions cited above will persist, as
productivity has only recently and only slightly recovered. As very few sectors
express a want of qualified labour, and even fewer suggest that lack of qualified
labour is a major obstacle to growth, we believe that the wage growth forecasts
that, inter alia, the Riksbank builds inflationary forecasts on are vastly
exaggerated. Conversely, indications from the ongoing centralised wage
negotiation round are for another low agreement, around 2½% y/y, possibly
stretching beyond 2019. To reach the Riksbank’s wage growth forecast, let
alone levels consistent with the inflation target, we thus need to see wage drift
at levels from more than two decades ago; before the industrial sector wage
mark was first introduced.
In short, we expect low and possibly longer wage agreements, as well as very
modest wage drift during 2017 and 2018. In numbers, this boils down to hourly
wage growth of 3.0% y/y in 2017 and 3.1% y/y in 2018 (in SCB’s definition).
Low hourly wage growth, but decent employment growth, means that the wage
sum will continue to expand, albeit at a slow pace. Add to this tax hikes and
rising real interest rates and it should stand clear that disposable income growth
is set to weaken markedly compared to previous years. In relation to this, it is
probably wise to revisit earlier Nordic Outlook discussions on the savings rate,
which has now surpassed 17% of disposable incomes. As economists have yet
to reach any consensus on explaining its continuous ascent, we have simply
assumed it to be stable over the forecast horizon and let it normalise
thenceforth.
To be clear – given our view on disposable incomes – this invariably means
that consumption growth is set to recede markedly. In 2016, consumption
growth was still a handsome 2.2% y/y (vol, wda), but with a clear downward
trend throughout the year. In 2017, we expect consumption growth to continue
its weak spell and increase a meagre 1.3% y/y (vol, wda) and stay low in 2018,
at 1.4% y/y (vol, wda). That said, do keep in mind that these forecasts are
subject to a strong assumption on households savings behaviour.
Disposable incomes in a weak trend
Source: SCB, KI. Danske Bank calculations
Consumption growth to moderate
Source: SCB, KI. Danske Bank calculations
17 | 28 March 2017 www.danskeresearch.com
No
rdic O
utlo
ok
Nordic Outlook
Changing the narrative on inflation
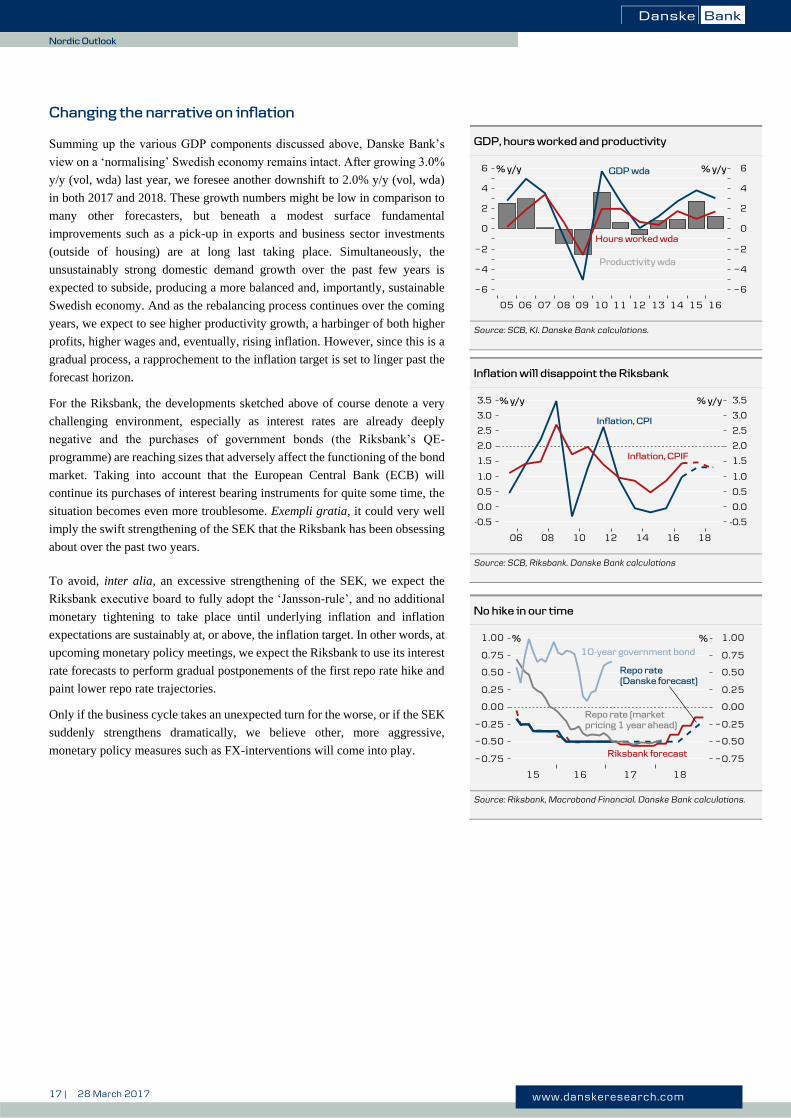
Summing up the various GDP components discussed above, Danske Bank’s
view on a ‘normalising’ Swedish economy remains intact. After growing 3.0%
y/y (vol, wda) last year, we foresee another downshift to 2.0% y/y (vol, wda)
in both 2017 and 2018. These growth numbers might be low in comparison to
many other forecasters, but beneath a modest surface fundamental
improvements such as a pick-up in exports and business sector investments
(outside of housing) are at long last taking place. Simultaneously, the
unsustainably strong domestic demand growth over the past few years is
expected to subside, producing a more balanced and, importantly, sustainable
Swedish economy. And as the rebalancing process continues over the coming
years, we expect to see higher productivity growth, a harbinger of both higher
profits, higher wages and, eventually, rising inflation. However, since this is a
gradual process, a rapprochement to the inflation target is set to linger past the
forecast horizon.
For the Riksbank, the developments sketched above of course denote a very
challenging environment, especially as interest rates are already deeply
negative and the purchases of government bonds (the Riksbank’s QE-
programme) are reaching sizes that adversely affect the functioning of the bond
market. Taking into account that the European Central Bank (ECB) will
continue its purchases of interest bearing instruments for quite some time, the
situation becomes even more troublesome. Exempli gratia, it could very well
imply the swift strengthening of the SEK that the Riksbank has been obsessing
about over the past two years.
To avoid, inter alia, an excessive strengthening of the SEK, we expect the
Riksbank executive board to fully adopt the ‘Jansson-rule’, and no additional
monetary tightening to take place until underlying inflation and inflation
expectations are sustainably at, or above, the inflation target. In other words, at
upcoming monetary policy meetings, we expect the Riksbank to use its interest
rate forecasts to perform gradual postponements of the first repo rate hike and
paint lower repo rate trajectories.
Only if the business cycle takes an unexpected turn for the worse, or if the SEK
suddenly strengthens dramatically, we believe other, more aggressive,
monetary policy measures such as FX-interventions will come into play.
GDP, hours worked and productivity
Source: SCB, KI. Danske Bank calculations.
Inflation will disappoint the Riksbank
Source: SCB, Riksbank. Danske Bank calculations
No hike in our time
Source: Riksbank, Macrobond Financial. Danske Bank calculations.
18 | 28 March 2017 www.danskeresearch.com
No
rdic O
utlo
ok
Nordic Outlook
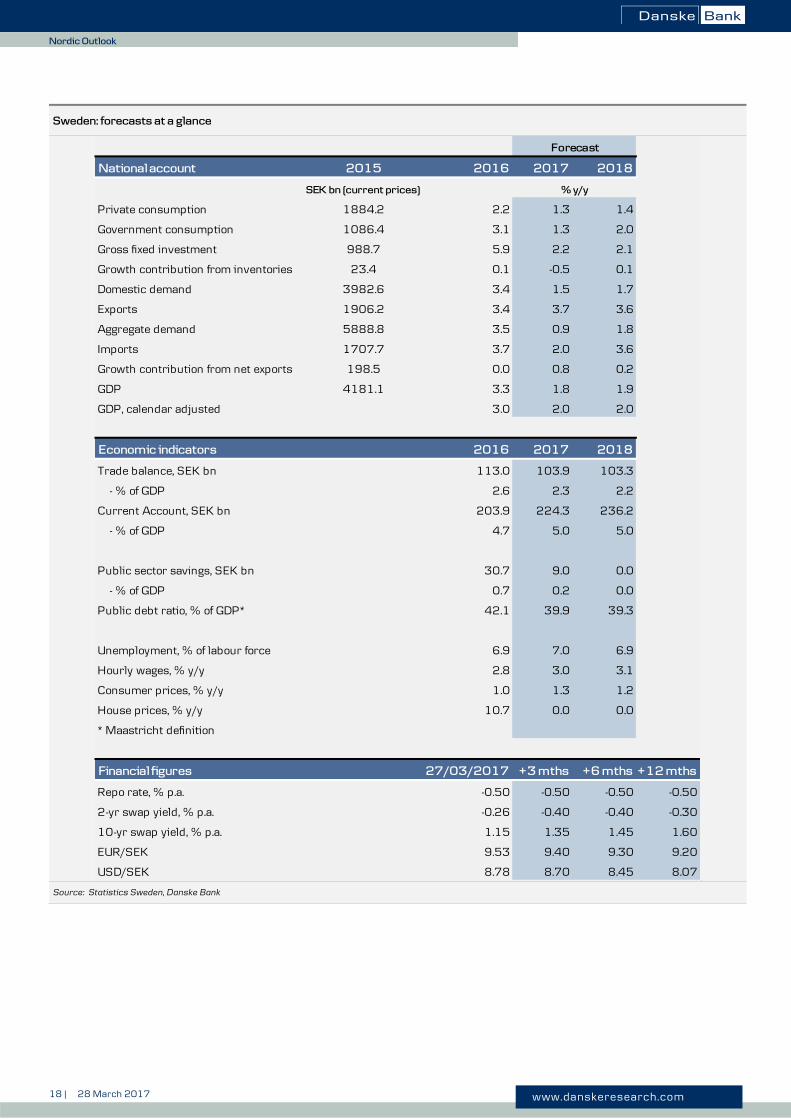
Sweden: forecasts at a glance
Source: Statistics Sweden, Danske Bank
National account 2015 2016 2017 2018
SEK bn (current prices)
Private consumption 1884.2 2.2 1.3 1.4
Government consumption 1086.4 3.1 1.3 2.0
Gross fixed investment 988.7 5.9 2.2 2.1
Growth contribution from inventories 23.4 0.1 -0.5 0.1
Domestic demand 3982.6 3.4 1.5 1.7
Exports 1906.2 3.4 3.7 3.6
Aggregate demand 5888.8 3.5 0.9 1.8
Imports 1707.7 3.7 2.0 3.6
Growth contribution from net exports 198.5 0.0 0.8 0.2
GDP 4181.1 3.3 1.8 1.9
GDP, calendar adjusted 3.0 2.0 2.0
Economic indicators 2016 2017 2018
Trade balance, SEK bn 113.0 103.9 103.3
- % of GDP 2.6 2.3 2.2
Current Account, SEK bn 203.9 224.3 236.2
- % of GDP 4.7 5.0 5.0
Public sector savings, SEK bn 30.7 9.0 0.0
- % of GDP 0.7 0.2 0.0
Public debt ratio, % of GDP* 42.1 39.9 39.3
Unemployment, % of labour force 6.9 7.0 6.9
Hourly wages, % y/y 2.8 3.0 3.1
Consumer prices, % y/y 1.0 1.3 1.2
House prices, % y/y 10.7 0.0 0.0
* Maastricht definition
Financial figures +3 mths +6 mths +12 mths
Repo rate, % p.a. -0.50 -0.50 -0.50 -0.50
2-yr swap yield, % p.a. -0.26 -0.40 -0.40 -0.30
10-yr swap yield, % p.a. 1.15 1.35 1.45 1.60
EUR/SEK 9.53 9.40 9.30 9.20
USD/SEK 8.78 8.70 8.45 8.07
27/03/2017
Forecast
% y/y
19 | 28 March 2017 www.danskeresearch.com
No
rdic O
utlo
ok
Nordic Outlook
Norway
Out of the crisis
Growth in the Norwegian economy is picking up and looks set to
normalise over the next couple of quarters.
The headwinds from the oil downturn are easing and non-oil growth is
accelerating.
Activity in the oil sector is bottoming out. Higher oil prices and lower
costs are reducing the downside risk considerably. Orders are
improving and employment seems to be stabilising.
High homebuilding activity and expansionary fiscal policy continue to
stimulate the rest of the economy and business investment has begun
to climb. High inflation has held back consumer spending but the
situation is now improving as expected.
Next year, oil-related headwinds should reverse into a slight tailwind
but the fiscal policy stimulus will also be weaker. Economic growth
should nevertheless be higher due to stronger growth in private
consumption and investment.
Unemployment has begun to fall and employment is rising. Vacancies
are continuing to climb and leading indicators suggest that
employment will rise further during the course of the year.
Inflation has fallen much more quickly than expected, due partly to a
faster pass-through from the krone’s appreciation. Wage growth, on
the other hand, was far weaker than expected last year, and the central
settlements are likely to come out on the low side again this year. Wages
will therefore put less pressure on prices than we previously assumed.
The housing market has become very tight, but there are signs of the
supply side reacting. Together with new credit restrictions, this will
gradually rein in growth in housing prices.
Norges Bank left its policy rate alone in March and was somewhat less
optimistic than we anticipated. Nevertheless, we believe that interest
rates have bottomed but do not expect any rate increases until well into
next year.
Higher oil prices and better growth have brought a stronger krone. We
expect this trend to continue in 2017 although there is still considerable
uncertainty related to oil prices.
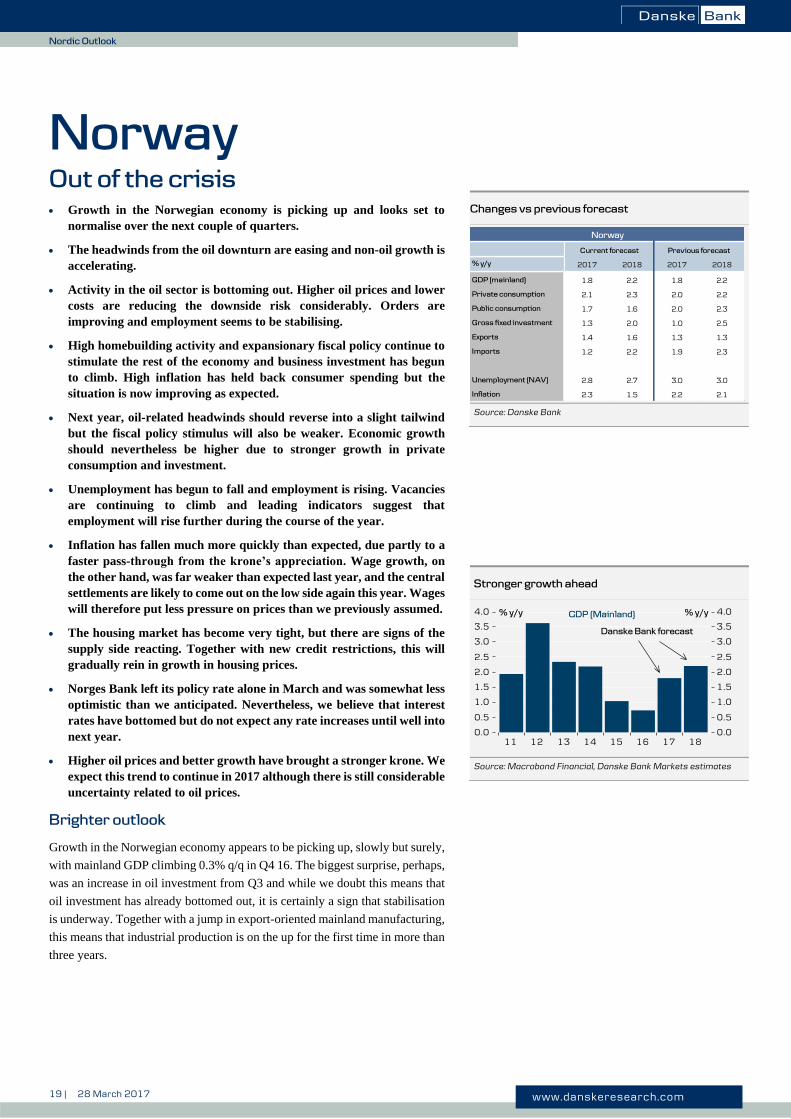
Brighter outlook
Growth in the Norwegian economy appears to be picking up, slowly but surely,
with mainland GDP climbing 0.3% q/q in Q4 16. The biggest surprise, perhaps,
was an increase in oil investment from Q3 and while we doubt this means that
oil investment has already bottomed out, it is certainly a sign that stabilisation
is underway. Together with a jump in export-oriented mainland manufacturing,
this means that industrial production is on the up for the first time in more than
three years.
Changes vs previous forecast
Source: Danske Bank
Stronger growth ahead
Source: Macrobond Financial, Danske Bank Markets estimates
% y/y 2017 2018 2017 2018
GDP (mainland) 1.8 2.2 1.8 2.2
Private consumption 2.1 2.3 2.0 2.2
Public consumption 1.7 1.6 2.0 2.3
Gross fixed investment 1.3 2.0 1.0 2.5
Exports 1.4 1.6 1.3 1.3
Imports 1.2 2.2 1.9 2.3
Unemployment (NAV) 2.8 2.7 3.0 3.0
Inflation 2.3 1.5 2.2 2.1
Current forecast Previous forecast
Norway
20 | 28 March 2017 www.danskeresearch.com
No
rdic O
utlo
ok
Nordic Outlook
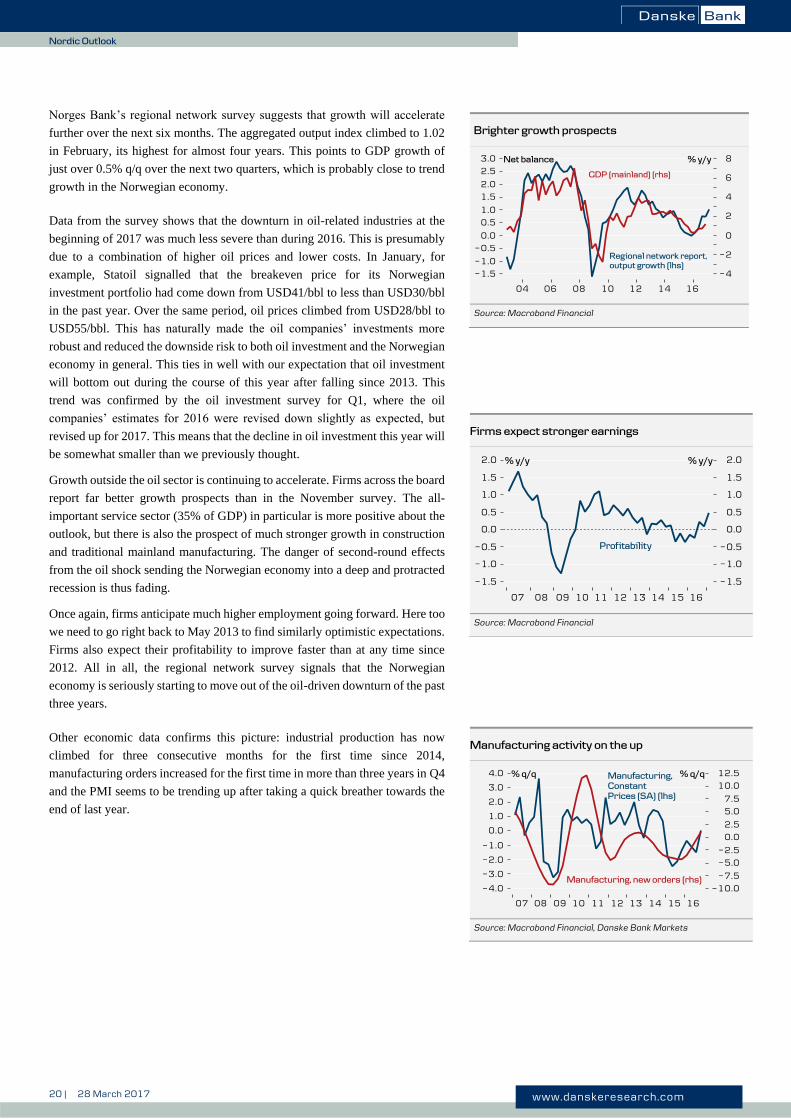
Norges Bank’s regional network survey suggests that growth will accelerate
further over the next six months. The aggregated output index climbed to 1.02
in February, its highest for almost four years. This points to GDP growth of
just over 0.5% q/q over the next two quarters, which is probably close to trend
growth in the Norwegian economy.
Data from the survey shows that the downturn in oil-related industries at the
beginning of 2017 was much less severe than during 2016. This is presumably
due to a combination of higher oil prices and lower costs. In January, for
example, Statoil signalled that the breakeven price for its Norwegian
investment portfolio had come down from USD41/bbl to less than USD30/bbl
in the past year. Over the same period, oil prices climbed from USD28/bbl to
USD55/bbl. This has naturally made the oil companies’ investments more
robust and reduced the downside risk to both oil investment and the Norwegian
economy in general. This ties in well with our expectation that oil investment
will bottom out during the course of this year after falling since 2013. This
trend was confirmed by the oil investment survey for Q1, where the oil
companies’ estimates for 2016 were revised down slightly as expected, but
revised up for 2017. This means that the decline in oil investment this year will
be somewhat smaller than we previously thought.
Growth outside the oil sector is continuing to accelerate. Firms across the board
report far better growth prospects than in the November survey. The all-
important service sector (35% of GDP) in particular is more positive about the
outlook, but there is also the prospect of much stronger growth in construction
and traditional mainland manufacturing. The danger of second-round effects
from the oil shock sending the Norwegian economy into a deep and protracted
recession is thus fading.
Once again, firms anticipate much higher employment going forward. Here too
we need to go right back to May 2013 to find similarly optimistic expectations.
Firms also expect their profitability to improve faster than at any time since
2012. All in all, the regional network survey signals that the Norwegian
economy is seriously starting to move out of the oil-driven downturn of the past
three years.
Other economic data confirms this picture: industrial production has now
climbed for three consecutive months for the first time since 2014,
manufacturing orders increased for the first time in more than three years in Q4
and the PMI seems to be trending up after taking a quick breather towards the
end of last year.
Brighter growth prospects
Source: Macrobond Financial
Firms expect stronger earnings
Source: Macrobond Financial
Manufacturing activity on the up
Source: Macrobond Financial, Danske Bank Markets
21 | 28 March 2017 www.danskeresearch.com
No
rdic O
utlo
ok
Nordic Outlook
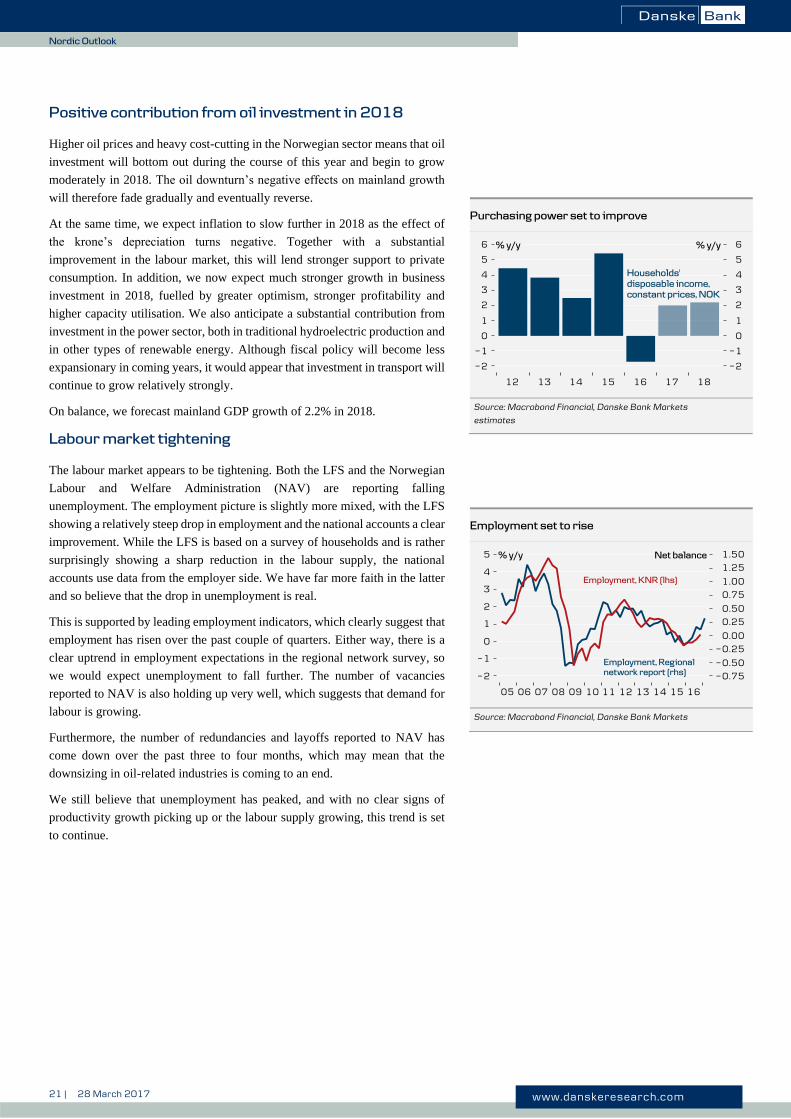
Positive contribution from oil investment in 2018
Higher oil prices and heavy cost-cutting in the Norwegian sector means that oil
investment will bottom out during the course of this year and begin to grow
moderately in 2018. The oil downturn’s negative effects on mainland growth
will therefore fade gradually and eventually reverse.
At the same time, we expect inflation to slow further in 2018 as the effect of
the krone’s depreciation turns negative. Together with a substantial
improvement in the labour market, this will lend stronger support to private
consumption. In addition, we now expect much stronger growth in business
investment in 2018, fuelled by greater optimism, stronger profitability and
higher capacity utilisation. We also anticipate a substantial contribution from
investment in the power sector, both in traditional hydroelectric production and
in other types of renewable energy. Although fiscal policy will become less
expansionary in coming years, it would appear that investment in transport will
continue to grow relatively strongly.
On balance, we forecast mainland GDP growth of 2.2% in 2018.
Labour market tightening
The labour market appears to be tightening. Both the LFS and the Norwegian
Labour and Welfare Administration (NAV) are reporting falling
unemployment. The employment picture is slightly more mixed, with the LFS
showing a relatively steep drop in employment and the national accounts a clear
improvement. While the LFS is based on a survey of households and is rather
surprisingly showing a sharp reduction in the labour supply, the national
accounts use data from the employer side. We have far more faith in the latter
and so believe that the drop in unemployment is real.
This is supported by leading employment indicators, which clearly suggest that
employment has risen over the past couple of quarters. Either way, there is a
clear uptrend in employment expectations in the regional network survey, so
we would expect unemployment to fall further. The number of vacancies
reported to NAV is also holding up very well, which suggests that demand for
labour is growing.
Furthermore, the number of redundancies and layoffs reported to NAV has
come down over the past three to four months, which may mean that the
downsizing in oil-related industries is coming to an end.
We still believe that unemployment has peaked, and with no clear signs of
productivity growth picking up or the labour supply growing, this trend is set
to continue.
Purchasing power set to improve
Source: Macrobond Financial, Danske Bank Markets
estimates
Employment set to rise
Source: Macrobond Financial, Danske Bank Markets
22 | 28 March 2017 www.danskeresearch.com
No
rdic O
utlo
ok
Nordic Outlook
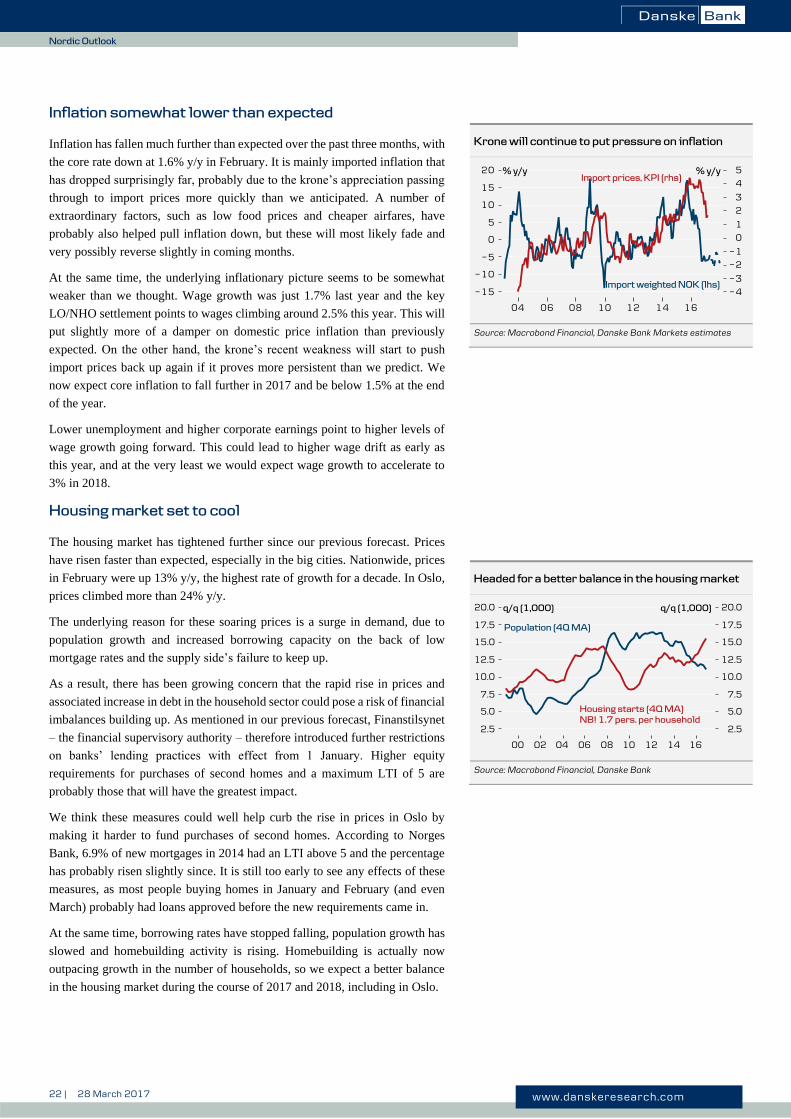
Inflation somewhat lower than expected
Inflation has fallen much further than expected over the past three months, with
the core rate down at 1.6% y/y in February. It is mainly imported inflation that
has dropped surprisingly far, probably due to the krone’s appreciation passing
through to import prices more quickly than we anticipated. A number of
extraordinary factors, such as low food prices and cheaper airfares, have
probably also helped pull inflation down, but these will most likely fade and
very possibly reverse slightly in coming months.
At the same time, the underlying inflationary picture seems to be somewhat
weaker than we thought. Wage growth was just 1.7% last year and the key
LO/NHO settlement points to wages climbing around 2.5% this year. This will
put slightly more of a damper on domestic price inflation than previously
expected. On the other hand, the krone’s recent weakness will start to push
import prices back up again if it proves more persistent than we predict. We
now expect core inflation to fall further in 2017 and be below 1.5% at the end
of the year.
Lower unemployment and higher corporate earnings point to higher levels of
wage growth going forward. This could lead to higher wage drift as early as
this year, and at the very least we would expect wage growth to accelerate to
3% in 2018.
Housing market set to cool
The housing market has tightened further since our previous forecast. Prices
have risen faster than expected, especially in the big cities. Nationwide, prices
in February were up 13% y/y, the highest rate of growth for a decade. In Oslo,
prices climbed more than 24% y/y.
The underlying reason for these soaring prices is a surge in demand, due to
population growth and increased borrowing capacity on the back of low
mortgage rates and the supply side’s failure to keep up.
As a result, there has been growing concern that the rapid rise in prices and
associated increase in debt in the household sector could pose a risk of financial
imbalances building up. As mentioned in our previous forecast, Finanstilsynet
– the financial supervisory authority – therefore introduced further restrictions
on banks’ lending practices with effect from 1 January. Higher equity
requirements for purchases of second homes and a maximum LTI of 5 are
probably those that will have the greatest impact.
We think these measures could well help curb the rise in prices in Oslo by
making it harder to fund purchases of second homes. According to Norges
Bank, 6.9% of new mortgages in 2014 had an LTI above 5 and the percentage
has probably risen slightly since. It is still too early to see any effects of these
measures, as most people buying homes in January and February (and even
March) probably had loans approved before the new requirements came in.
At the same time, borrowing rates have stopped falling, population growth has
slowed and homebuilding activity is rising. Homebuilding is actually now
outpacing growth in the number of households, so we expect a better balance
in the housing market during the course of 2017 and 2018, including in Oslo.
Krone will continue to put pressure on inflation
Source: Macrobond Financial, Danske Bank Markets estimates
Headed for a better balance in the housing market
Source: Macrobond Financial, Danske Bank
23 | 28 March 2017 www.danskeresearch.com
No
rdic O
utlo
ok
Nordic Outlook
We therefore expect housing price inflation to slow during the course of this
year and for the annual rate next year to be in line with or even below our wage
growth forecast of 3%.
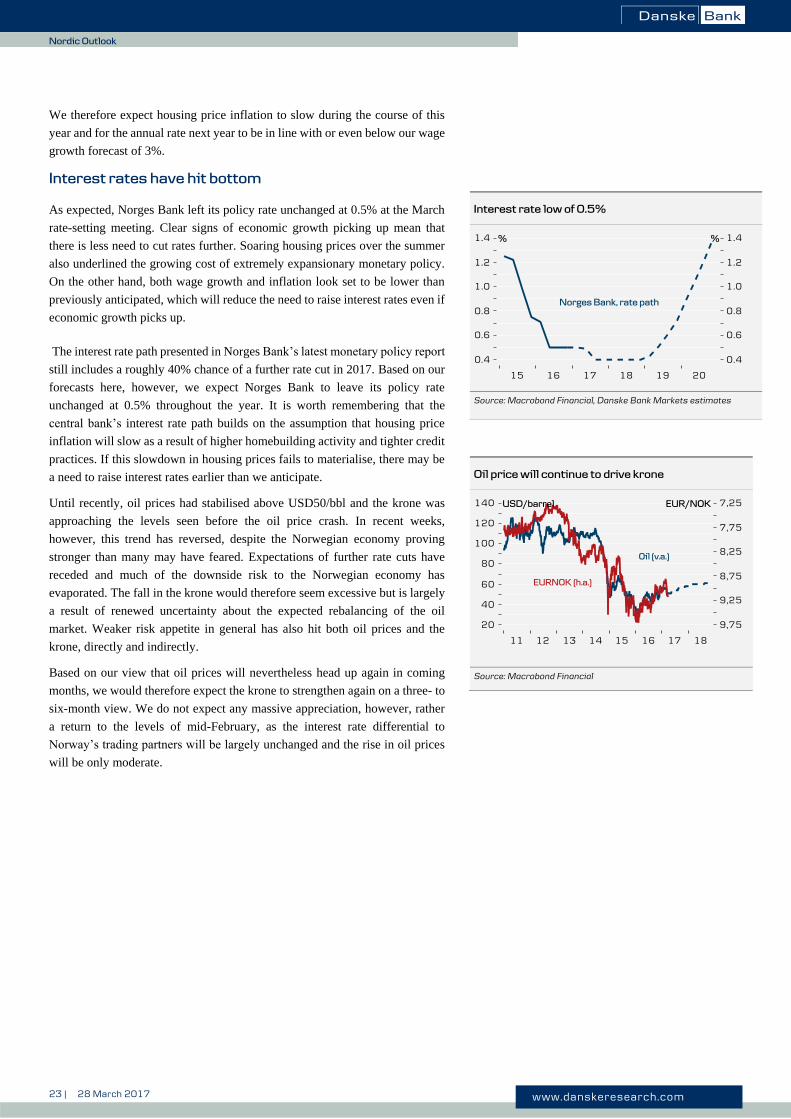
Interest rates have hit bottom
As expected, Norges Bank left its policy rate unchanged at 0.5% at the March
rate-setting meeting. Clear signs of economic growth picking up mean that
there is less need to cut rates further. Soaring housing prices over the summer
also underlined the growing cost of extremely expansionary monetary policy.
On the other hand, both wage growth and inflation look set to be lower than
previously anticipated, which will reduce the need to raise interest rates even if
economic growth picks up.
The interest rate path presented in Norges Bank’s latest monetary policy report
still includes a roughly 40% chance of a further rate cut in 2017. Based on our
forecasts here, however, we expect Norges Bank to leave its policy rate
unchanged at 0.5% throughout the year. It is worth remembering that the
central bank’s interest rate path builds on the assumption that housing price
inflation will slow as a result of higher homebuilding activity and tighter credit
practices. If this slowdown in housing prices fails to materialise, there may be
a need to raise interest rates earlier than we anticipate.
Until recently, oil prices had stabilised above USD50/bbl and the krone was
approaching the levels seen before the oil price crash. In recent weeks,
however, this trend has reversed, despite the Norwegian economy proving
stronger than many may have feared. Expectations of further rate cuts have
receded and much of the downside risk to the Norwegian economy has
evaporated. The fall in the krone would therefore seem excessive but is largely
a result of renewed uncertainty about the expected rebalancing of the oil
market. Weaker risk appetite in general has also hit both oil prices and the
krone, directly and indirectly.
Based on our view that oil prices will nevertheless head up again in coming
months, we would therefore expect the krone to strengthen again on a three- to
six-month view. We do not expect any massive appreciation, however, rather
a return to the levels of mid-February, as the interest rate differential to
Norway’s trading partners will be largely unchanged and the rise in oil prices
will be only moderate.
Interest rate low of 0.5%
Source: Macrobond Financial, Danske Bank Markets estimates
Oil price will continue to drive krone
Source: Macrobond Financial
24 | 28 March 2017 www.danskeresearch.com
No
rdic O
utlo
ok
Nordic Outlook
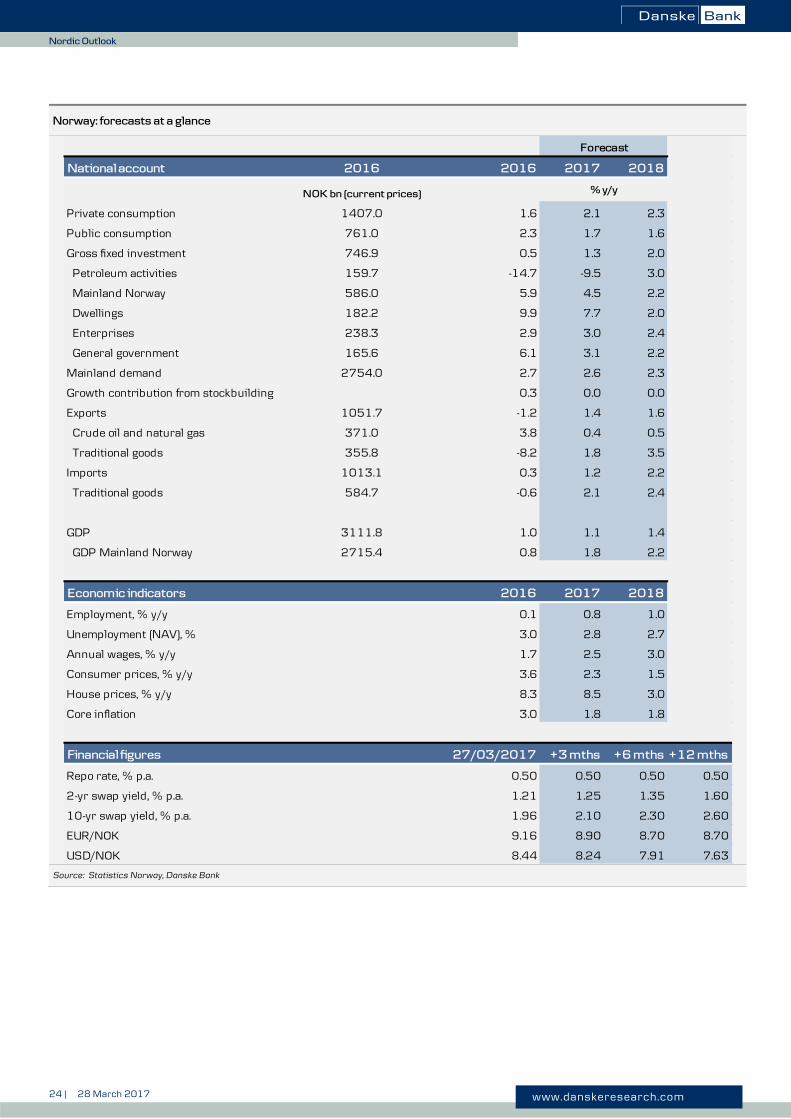
Norway: forecasts at a glance
Source: Statistics Norway, Danske Bank
National account 2016 2016 2017 2018
NOK bn (current prices)
Private consumption 1407.0 1.6 2.1 2.3
Public consumption 761.0 2.3 1.7 1.6
Gross fixed investment 746.9 0.5 1.3 2.0
Petroleum activities 159.7 -14.7 -9.5 3.0
Mainland Norway 586.0 5.9 4.5 2.2
Dwellings 182.2 9.9 7.7 2.0
Enterprises 238.3 2.9 3.0 2.4
General government 165.6 6.1 3.1 2.2
Mainland demand 2754.0 2.7 2.6 2.3
Growth contribution from stockbuilding 0.3 0.0 0.0
Exports 1051.7 -1.2 1.4 1.6
Crude oil and natural gas 371.0 3.8 0.4 0.5
Traditional goods 355.8 -8.2 1.8 3.5
Imports 1013.1 0.3 1.2 2.2
Traditional goods 584.7 -0.6 2.1 2.4
GDP 3111.8 1.0 1.1 1.4
GDP Mainland Norway 2715.4 0.8 1.8 2.2
Economic indicators 2016 2017 2018
Employment, % y/y 0.1 0.8 1.0
Unemployment (NAV), % 3.0 2.8 2.7
Annual wages, % y/y 1.7 2.5 3.0
Consumer prices, % y/y 3.6 2.3 1.5
House prices, % y/y 8.3 8.5 3.0
Core inflation 3.0 1.8 1.8
Financial figures +3 mths +6 mths +12 mths
Repo rate, % p.a. 0.50 0.50 0.50 0.50
2-yr swap yield, % p.a. 1.21 1.25 1.35 1.60
10-yr swap yield, % p.a. 1.96 2.10 2.30 2.60
EUR/NOK 9.16 8.90 8.70 8.70
USD/NOK 8.44 8.24 7.91 7.63
Forecast
% y/y
27/03/2017
25 | 28 March 2017 www.danskeresearch.com
No
rdic O
utlo
ok
Nordic Outlook
Finland
Firing on all engines
The Finnish economy surprised positively in 2016, although GDP
continues to be well below pre-crisis levels. We have slightly revised
our forecast higher and expect Finnish GDP to grow 1.5% annually in
2017-2018. Growth was driven mainly by consumption and
construction in 2016, while improved competitiveness and expectations
should help to boost exports and investments in 2017.
Private consumption is forecast to slow down in 2017. While low
interest rates and falling unemployment support consumers, inflation
will rise above 1% and low wage and pension growth will challenge
purchasing power. Better employment, high confidence and income tax
cuts should keep consumption on a modest growth track.
Exports have performed badly in recent years and rose only 0.5% in
2016, while imports rose 2.5%. The export outlook for 2017 is better
thanks to growth in export markets, especially Russia, improving price
competitiveness, several ship orders and new production facilities in
forest and automotive industries. We expect manufacturing
investment to follow growth in demand in 2017.
Migration to growth centres has created more demand for apartments.
Growth in housing demand has raised prices and caused a construction
boom in Helsinki and a few other towns, while the real estate market
in the rest of the country remains more of less flat.
The government budget for 2017 does not include new significant cuts
in expenditure and lowers income taxation, which implies still rising
debt. Cyclically adjusted, the budget could be characterised as
modestly expansionary. Structural reforms are still necessary to
manage needs of an ageing population and to boost potential growth.
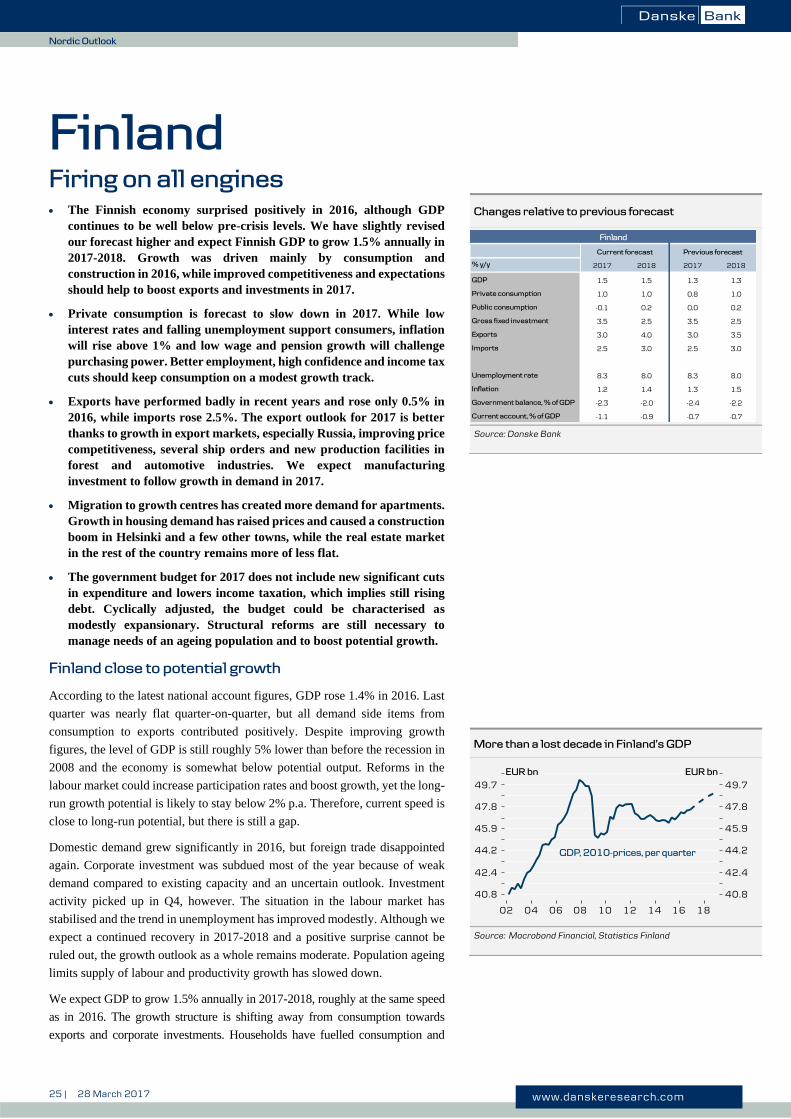
Finland close to potential growth
According to the latest national account figures, GDP rose 1.4% in 2016. Last
quarter was nearly flat quarter-on-quarter, but all demand side items from
consumption to exports contributed positively. Despite improving growth
figures, the level of GDP is still roughly 5% lower than before the recession in
2008 and the economy is somewhat below potential output. Reforms in the
labour market could increase participation rates and boost growth, yet the long-
run growth potential is likely to stay below 2% p.a. Therefore, current speed is
close to long-run potential, but there is still a gap.
Domestic demand grew significantly in 2016, but foreign trade disappointed
again. Corporate investment was subdued most of the year because of weak
demand compared to existing capacity and an uncertain outlook. Investment
activity picked up in Q4, however. The situation in the labour market has
stabilised and the trend in unemployment has improved modestly. Although we
expect a continued recovery in 2017-2018 and a positive surprise cannot be
ruled out, the growth outlook as a whole remains moderate. Population ageing
limits supply of labour and productivity growth has slowed down.
We expect GDP to grow 1.5% annually in 2017-2018, roughly at the same speed
as in 2016. The growth structure is shifting away from consumption towards
exports and corporate investments. Households have fuelled consumption and
Changes relative to previous forecast
Source: Danske Bank
More than a lost decade in Finland’s GDP
Source: Macrobond Financial, Statistics Finland
% y/y 2017 2018 2017 2018
GDP 1.5 1.5 1.3 1.3
Private consumption 1.0 1.0 0.8 1.0
Public consumption -0.1 0.2 0.0 0.2
Gross fixed investment 3.5 2.5 3.5 2.5
Exports 3.0 4.0 3.0 3.5
Imports 2.5 3.0 2.5 3.0
Unemployment rate 8.3 8.0 8.3 8.0
Inflation 1.2 1.4 1.3 1.5
Government balance, % of GDP -2.3 -2.0 -2.4 -2.2
Current account, % of GDP -1.1 -0.9 -0.7 -0.7
Finland
Current forecast Previous forecast
26 | 28 March 2017 www.danskeresearch.com
No
rdic O
utlo
ok
Nordic Outlook
construction, but weak growth in real earnings will significantly slow down private
consumption growth in 2017. At the same time, the competitiveness pact together
with growth in the global economy begin to lift exports. Headwinds will abate as
we expect Russia, an important export market, to recover in 2017. Thanks to an
income tax cut, the government budget for 2017 is modestly supportive to
consumption, while municipalities seek savings. Main risks are external relating
to global demand.
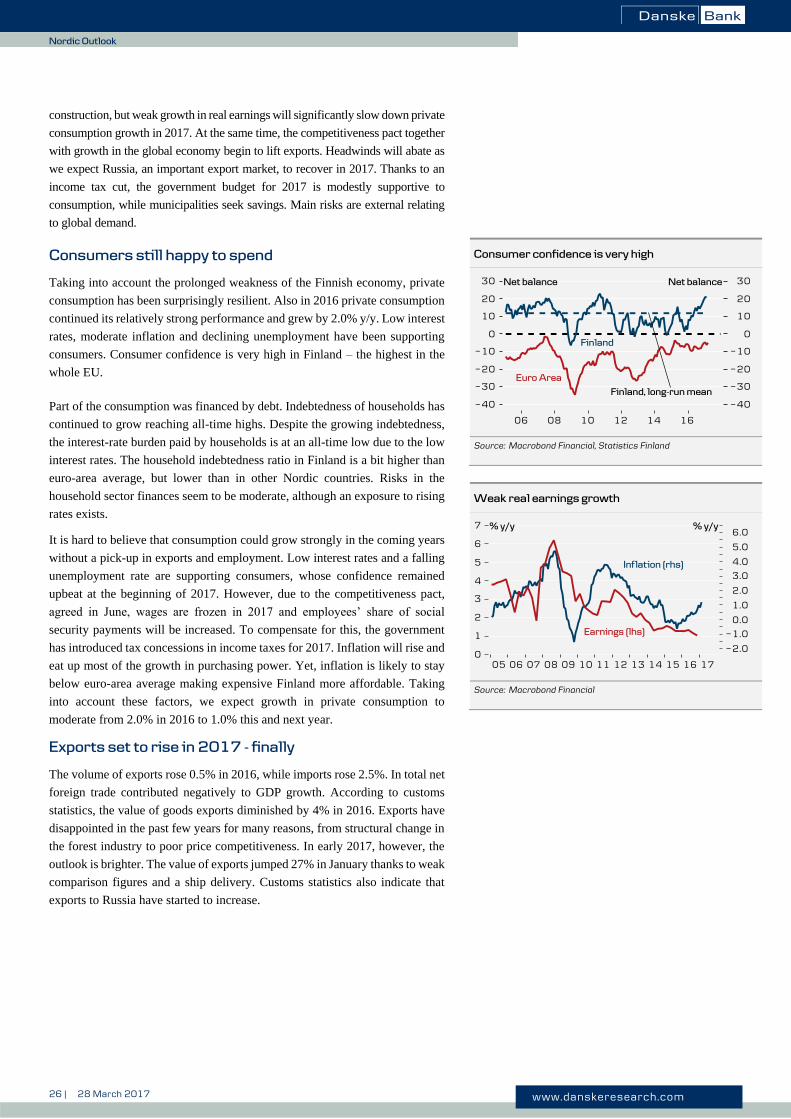
Consumers still happy to spend
Taking into account the prolonged weakness of the Finnish economy, private
consumption has been surprisingly resilient. Also in 2016 private consumption
continued its relatively strong performance and grew by 2.0% y/y. Low interest
rates, moderate inflation and declining unemployment have been supporting
consumers. Consumer confidence is very high in Finland – the highest in the
whole EU.
Part of the consumption was financed by debt. Indebtedness of households has
continued to grow reaching all-time highs. Despite the growing indebtedness,
the interest-rate burden paid by households is at an all-time low due to the low
interest rates. The household indebtedness ratio in Finland is a bit higher than
euro-area average, but lower than in other Nordic countries. Risks in the
household sector finances seem to be moderate, although an exposure to rising
rates exists.
It is hard to believe that consumption could grow strongly in the coming years
without a pick-up in exports and employment. Low interest rates and a falling
unemployment rate are supporting consumers, whose confidence remained
upbeat at the beginning of 2017. However, due to the competitiveness pact,
agreed in June, wages are frozen in 2017 and employees’ share of social
security payments will be increased. To compensate for this, the government
has introduced tax concessions in income taxes for 2017. Inflation will rise and
eat up most of the growth in purchasing power. Yet, inflation is likely to stay
below euro-area average making expensive Finland more affordable. Taking
into account these factors, we expect growth in private consumption to
moderate from 2.0% in 2016 to 1.0% this and next year.
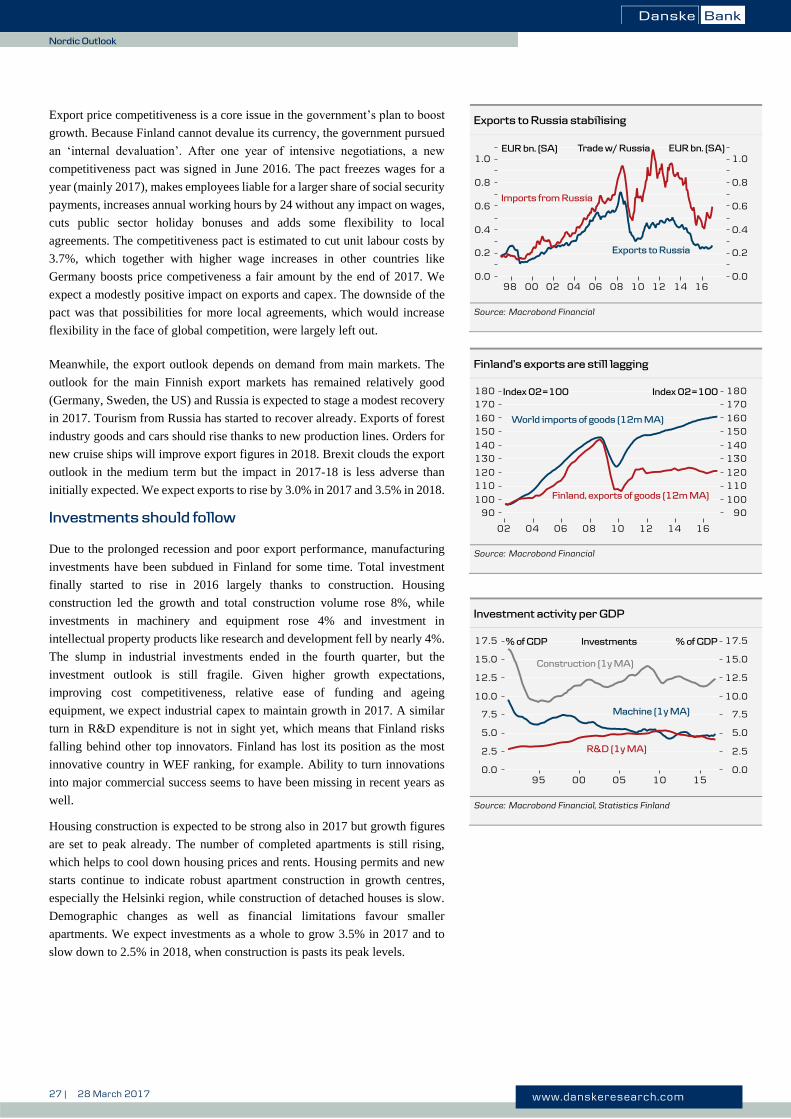
Exports set to rise in 2017 - finally
The volume of exports rose 0.5% in 2016, while imports rose 2.5%. In total net
foreign trade contributed negatively to GDP growth. According to customs
statistics, the value of goods exports diminished by 4% in 2016. Exports have
disappointed in the past few years for many reasons, from structural change in
the forest industry to poor price competitiveness. In early 2017, however, the
outlook is brighter. The value of exports jumped 27% in January thanks to weak
comparison figures and a ship delivery. Customs statistics also indicate that
exports to Russia have started to increase.
Consumer confidence is very high
Source: Macrobond Financial, Statistics Finland
Weak real earnings growth
Source: Macrobond Financial
27 | 28 March 2017 www.danskeresearch.com
No
rdic O
utlo
ok
Nordic Outlook
Export price competitiveness is a core issue in the government’s plan to boost
growth. Because Finland cannot devalue its currency, the government pursued
an ‘internal devaluation’. After one year of intensive negotiations, a new
competitiveness pact was signed in June 2016. The pact freezes wages for a
year (mainly 2017), makes employees liable for a larger share of social security
payments, increases annual working hours by 24 without any impact on wages,
cuts public sector holiday bonuses and adds some flexibility to local
agreements. The competitiveness pact is estimated to cut unit labour costs by
3.7%, which together with higher wage increases in other countries like
Germany boosts price competiveness a fair amount by the end of 2017. We
expect a modestly positive impact on exports and capex. The downside of the
pact was that possibilities for more local agreements, which would increase
flexibility in the face of global competition, were largely left out.
Meanwhile, the export outlook depends on demand from main markets. The
outlook for the main Finnish export markets has remained relatively good
(Germany, Sweden, the US) and Russia is expected to stage a modest recovery
in 2017. Tourism from Russia has started to recover already. Exports of forest
industry goods and cars should rise thanks to new production lines. Orders for
new cruise ships will improve export figures in 2018. Brexit clouds the export
outlook in the medium term but the impact in 2017-18 is less adverse than
initially expected. We expect exports to rise by 3.0% in 2017 and 3.5% in 2018.
Investments should follow
Due to the prolonged recession and poor export performance, manufacturing
investments have been subdued in Finland for some time. Total investment
finally started to rise in 2016 largely thanks to construction. Housing
construction led the growth and total construction volume rose 8%, while
investments in machinery and equipment rose 4% and investment in
intellectual property products like research and development fell by nearly 4%.
The slump in industrial investments ended in the fourth quarter, but the
investment outlook is still fragile. Given higher growth expectations,
improving cost competitiveness, relative ease of funding and ageing
equipment, we expect industrial capex to maintain growth in 2017. A similar
turn in R&D expenditure is not in sight yet, which means that Finland risks
falling behind other top innovators. Finland has lost its position as the most
innovative country in WEF ranking, for example. Ability to turn innovations
into major commercial success seems to have been missing in recent years as
well.
Housing construction is expected to be strong also in 2017 but growth figures
are set to peak already. The number of completed apartments is still rising,
which helps to cool down housing prices and rents. Housing permits and new
starts continue to indicate robust apartment construction in growth centres,
especially the Helsinki region, while construction of detached houses is slow.
Demographic changes as well as financial limitations favour smaller
apartments. We expect investments as a whole to grow 3.5% in 2017 and to
slow down to 2.5% in 2018, when construction is pasts its peak levels.
Exports to Russia stabilising
Source: Macrobond Financial
Finland’s exports are still lagging
Source: Macrobond Financial
Investment activity per GDP
Source: Macrobond Financial, Statistics Finland
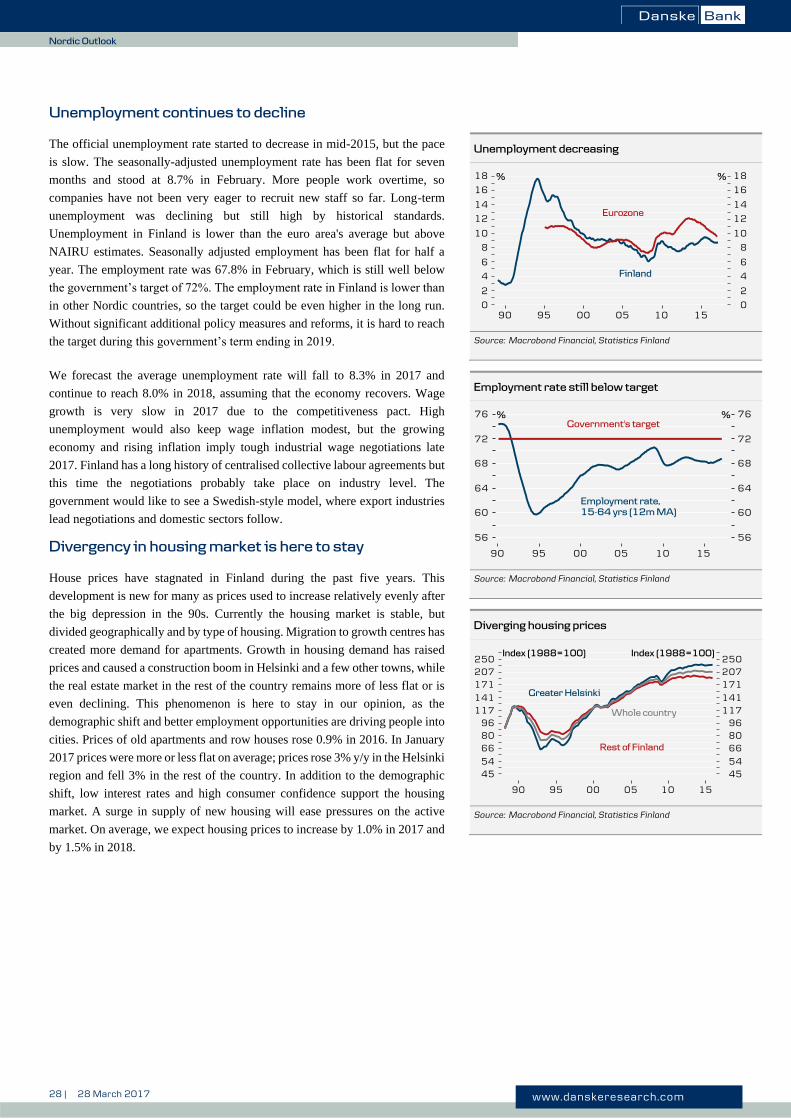
28 | 28 March 2017 www.danskeresearch.com
No
rdic O
utlo
ok
Nordic Outlook
Unemployment continues to decline
The official unemployment rate started to decrease in mid-2015, but the pace
is slow. The seasonally-adjusted unemployment rate has been flat for seven
months and stood at 8.7% in February. More people work overtime, so
companies have not been very eager to recruit new staff so far. Long-term
unemployment was declining but still high by historical standards.
Unemployment in Finland is lower than the euro area's average but above
NAIRU estimates. Seasonally adjusted employment has been flat for half a
year. The employment rate was 67.8% in February, which is still well below
the government’s target of 72%. The employment rate in Finland is lower than
in other Nordic countries, so the target could be even higher in the long run.
Without significant additional policy measures and reforms, it is hard to reach
the target during this government’s term ending in 2019.
We forecast the average unemployment rate will fall to 8.3% in 2017 and
continue to reach 8.0% in 2018, assuming that the economy recovers. Wage
growth is very slow in 2017 due to the competitiveness pact. High
unemployment would also keep wage inflation modest, but the growing
economy and rising inflation imply tough industrial wage negotiations late
2017. Finland has a long history of centralised collective labour agreements but
this time the negotiations probably take place on industry level. The
government would like to see a Swedish-style model, where export industries
lead negotiations and domestic sectors follow.
Divergency in housing market is here to stay
House prices have stagnated in Finland during the past five years. This
development is new for many as prices used to increase relatively evenly after
the big depression in the 90s. Currently the housing market is stable, but
divided geographically and by type of housing. Migration to growth centres has
created more demand for apartments. Growth in housing demand has raised
prices and caused a construction boom in Helsinki and a few other towns, while
the real estate market in the rest of the country remains more of less flat or is
even declining. This phenomenon is here to stay in our opinion, as the
demographic shift and better employment opportunities are driving people into
cities. Prices of old apartments and row houses rose 0.9% in 2016. In January
2017 prices were more or less flat on average; prices rose 3% y/y in the Helsinki
region and fell 3% in the rest of the country. In addition to the demographic
shift, low interest rates and high consumer confidence support the housing
market. A surge in supply of new housing will ease pressures on the active
market. On average, we expect housing prices to increase by 1.0% in 2017 and
by 1.5% in 2018.
Unemployment decreasing
Source: Macrobond Financial, Statistics Finland
Employment rate still below target
Source: Macrobond Financial, Statistics Finland
Diverging housing prices
Source: Macrobond Financial, Statistics Finland
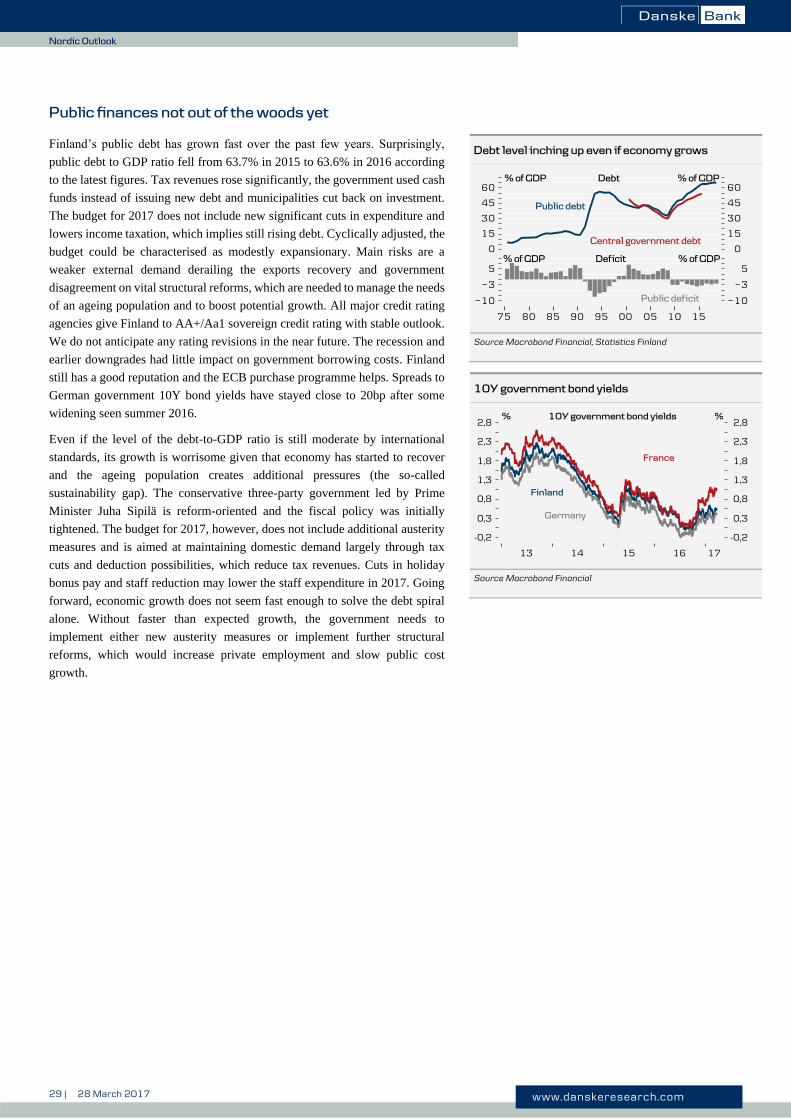
29 | 28 March 2017 www.danskeresearch.com
No
rdic O
utlo
ok
Nordic Outlook
Public finances not out of the woods yet
Finland’s public debt has grown fast over the past few years. Surprisingly,
public debt to GDP ratio fell from 63.7% in 2015 to 63.6% in 2016 according
to the latest figures. Tax revenues rose significantly, the government used cash
funds instead of issuing new debt and municipalities cut back on investment.
The budget for 2017 does not include new significant cuts in expenditure and
lowers income taxation, which implies still rising debt. Cyclically adjusted, the
budget could be characterised as modestly expansionary. Main risks are a
weaker external demand derailing the exports recovery and government
disagreement on vital structural reforms, which are needed to manage the needs
of an ageing population and to boost potential growth. All major credit rating
agencies give Finland to AA+/Aa1 sovereign credit rating with stable outlook.
We do not anticipate any rating revisions in the near future. The recession and
earlier downgrades had little impact on government borrowing costs. Finland
still has a good reputation and the ECB purchase programme helps. Spreads to
German government 10Y bond yields have stayed close to 20bp after some
widening seen summer 2016.
Even if the level of the debt-to-GDP ratio is still moderate by international
standards, its growth is worrisome given that economy has started to recover
and the ageing population creates additional pressures (the so-called
sustainability gap). The conservative three-party government led by Prime
Minister Juha Sipilä is reform-oriented and the fiscal policy was initially
tightened. The budget for 2017, however, does not include additional austerity
measures and is aimed at maintaining domestic demand largely through tax
cuts and deduction possibilities, which reduce tax revenues. Cuts in holiday
bonus pay and staff reduction may lower the staff expenditure in 2017. Going
forward, economic growth does not seem fast enough to solve the debt spiral
alone. Without faster than expected growth, the government needs to
implement either new austerity measures or implement further structural
reforms, which would increase private employment and slow public cost
growth.
10Y government bond yields
Source Macrobond Financial
Debt level inching up even if economy grows
Source Macrobond Financial, Statistics Finland
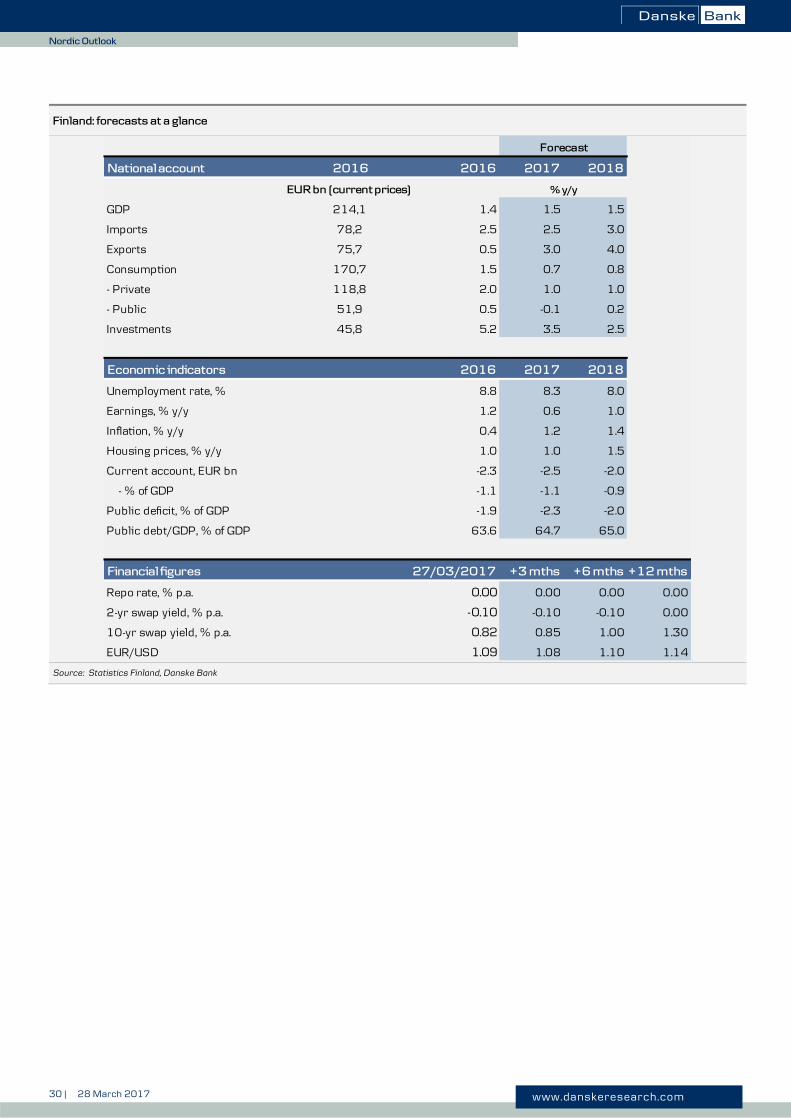
30 | 28 March 2017 www.danskeresearch.com
No
rdic O
utlo
ok
Nordic Outlook
Finland: forecasts at a glance
Source: Statistics Finland, Danske Bank
National account 2016 2016 2017 2018
EUR bn (current prices)
GDP 214,1 1.4 1.5 1.5
Imports 78,2 2.5 2.5 3.0
Exports 75,7 0.5 3.0 4.0
Consumption 170,7 1.5 0.7 0.8
- Private 118,8 2.0 1.0 1.0
- Public 51,9 0.5 -0.1 0.2
Investments 45,8 5.2 3.5 2.5
Economic indicators 2016 2017 2018
Unemployment rate, % 8.8 8.3 8.0
Earnings, % y/y 1.2 0.6 1.0
Inflation, % y/y 0.4 1.2 1.4
Housing prices, % y/y 1.0 1.0 1.5
Current account, EUR bn -2.3 -2.5 -2.0
- % of GDP -1.1 -1.1 -0.9
Public deficit, % of GDP -1.9 -2.3 -2.0
Public debt/GDP, % of GDP 63.6 64.7 65.0
Financial figures +3 mths +6 mths +12 mths
Repo rate, % p.a. 0.00 0.00 0.00 0.00
2-yr swap yield, % p.a. -0.10 -0.10 -0.10 0.00
10-yr swap yield, % p.a. 0.82 0.85 1.00 1.30
EUR/USD 1.09 1.08 1.10 1.14
27/03/2017
Forecast
% y/y
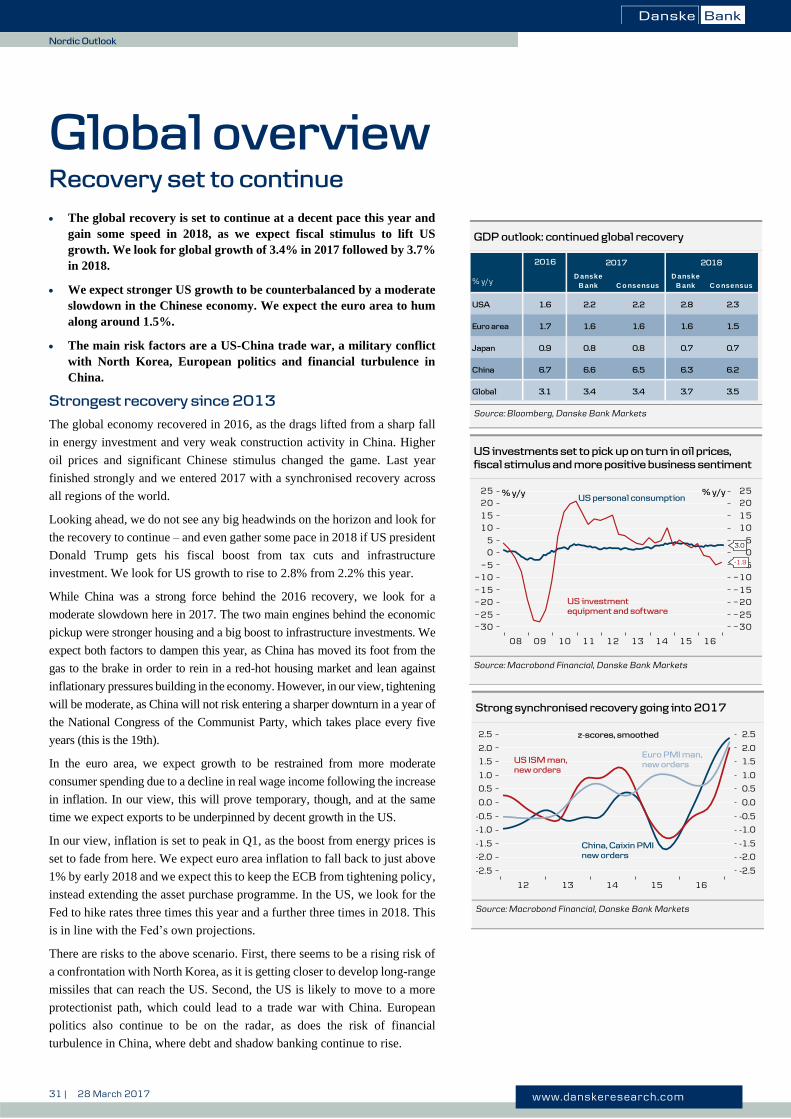
31 | 28 March 2017 www.danskeresearch.com
No
rdic O
utlo
ok
Nordic Outlook
Global overview
Recovery set to continue
The global recovery is set to continue at a decent pace this year and
gain some speed in 2018, as we expect fiscal stimulus to lift US
growth. We look for global growth of 3.4% in 2017 followed by 3.7%
in 2018.
We expect stronger US growth to be counterbalanced by a moderate
slowdown in the Chinese economy. We expect the euro area to hum
along around 1.5%.
The main risk factors are a US-China trade war, a military conflict
with North Korea, European politics and financial turbulence in
China.
Strongest recovery since 2013
The global economy recovered in 2016, as the drags lifted from a sharp fall
in energy investment and very weak construction activity in China. Higher
oil prices and significant Chinese stimulus changed the game. Last year
finished strongly and we entered 2017 with a synchronised recovery across
all regions of the world.
Looking ahead, we do not see any big headwinds on the horizon and look for
the recovery to continue – and even gather some pace in 2018 if US president
Donald Trump gets his fiscal boost from tax cuts and infrastructure
investment. We look for US growth to rise to 2.8% from 2.2% this year.
While China was a strong force behind the 2016 recovery, we look for a
moderate slowdown here in 2017. The two main engines behind the economic
pickup were stronger housing and a big boost to infrastructure investments. We
expect both factors to dampen this year, as China has moved its foot from the
gas to the brake in order to rein in a red-hot housing market and lean against
inflationary pressures building in the economy. However, in our view, tightening
will be moderate, as China will not risk entering a sharper downturn in a year of
the National Congress of the Communist Party, which takes place every five
years (this is the 19th).
In the euro area, we expect growth to be restrained from more moderate
consumer spending due to a decline in real wage income following the increase
in inflation. In our view, this will prove temporary, though, and at the same
time we expect exports to be underpinned by decent growth in the US.
In our view, inflation is set to peak in Q1, as the boost from energy prices is
set to fade from here. We expect euro area inflation to fall back to just above
1% by early 2018 and we expect this to keep the ECB from tightening policy,
instead extending the asset purchase programme. In the US, we look for the
Fed to hike rates three times this year and a further three times in 2018. This
is in line with the Fed’s own projections.
There are risks to the above scenario. First, there seems to be a rising risk of
a confrontation with North Korea, as it is getting closer to develop long-range
missiles that can reach the US. Second, the US is likely to move to a more
protectionist path, which could lead to a trade war with China. European
politics also continue to be on the radar, as does the risk of financial
turbulence in China, where debt and shadow banking continue to rise.
GDP outlook: continued global recovery
Source: Bloomberg, Danske Bank Markets
Strong synchronised recovery going into 2017
Source: Macrobond Financial, Danske Bank Markets
US investments set to pick up on turn in oil prices,
fiscal stimulus and more positive business sentiment
Source: Macrobond Financial, Danske Bank Markets
2016
% y/yD anske
B ank C o nsensus
D anske
B ank C o nsensus
USA 1.6 2.2 2.2 2.8 2.3
Euro area 1.7 1.6 1.6 1.6 1.5
Japan 0.9 0.8 0.8 0.7 0.7
China 6.7 6.6 6.5 6.3 6.2
Global 3.1 3.4 3.4 3.7 3.5
2017 2018
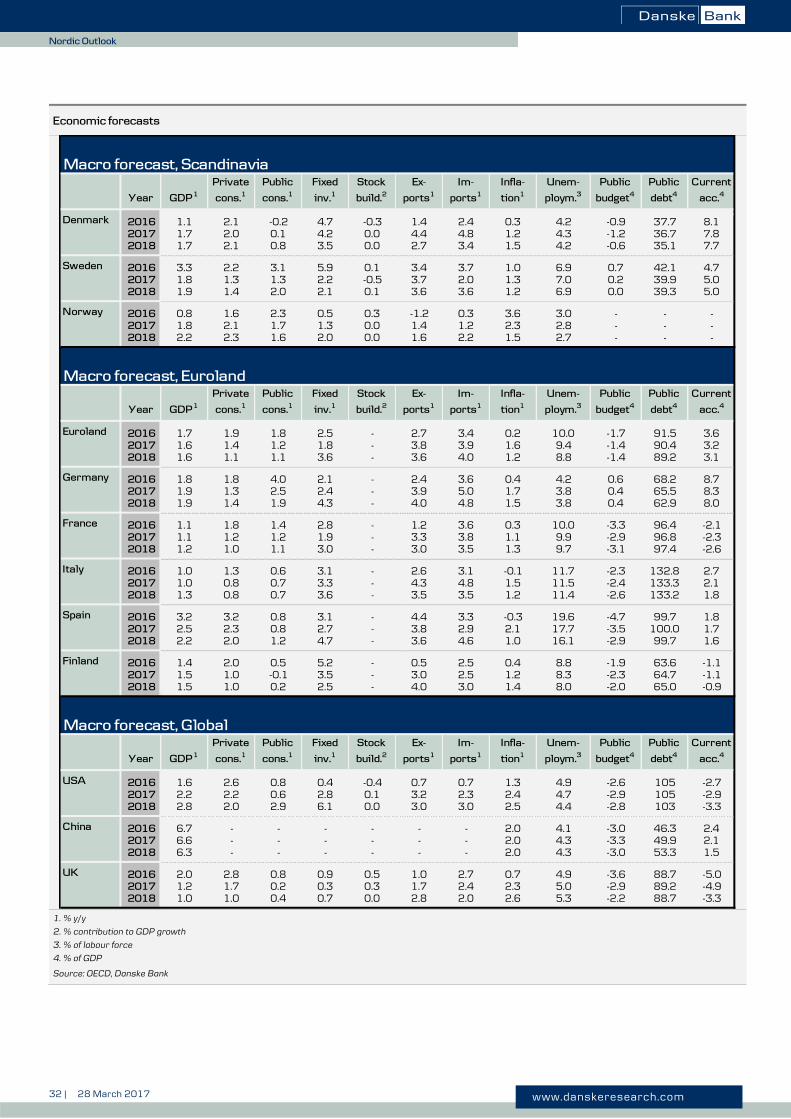
32 | 28 March 2017 www.danskeresearch.com
No
rdic O
utlo
ok
Nordic Outlook
Economic forecasts
1. % y/y
2. % contribution to GDP growth
3. % of labour force
4. % of GDP
Source: OECD, Danske Bank
Macro forecast, Scandinavia
Denmark 2016 1.1 2.1 -0.2 4.7 -0.3 1.4 2.4 0.3 4.2 -0.9 37.7 8.12017 1.7 2.0 0.1 4.2 0.0 4.4 4.8 1.2 4.3 -1.2 36.7 7.82018 1.7 2.1 0.8 3.5 0.0 2.7 3.4 1.5 4.2 -0.6 35.1 7.7
Sweden 2016 3.3 2.2 3.1 5.9 0.1 3.4 3.7 1.0 6.9 0.7 42.1 4.72017 1.8 1.3 1.3 2.2 -0.5 3.7 2.0 1.3 7.0 0.2 39.9 5.02018 1.9 1.4 2.0 2.1 0.1 3.6 3.6 1.2 6.9 0.0 39.3 5.0
Norway 2016 0.8 1.6 2.3 0.5 0.3 -1.2 0.3 3.6 3.0 - - -2017 1.8 2.1 1.7 1.3 0.0 1.4 1.2 2.3 2.8 - - -2018 2.2 2.3 1.6 2.0 0.0 1.6 2.2 1.5 2.7 - - -
Macro forecast, Euroland
Euroland 2016 1.7 1.9 1.8 2.5 - 2.7 3.4 0.2 10.0 -1.7 91.5 3.62017 1.6 1.4 1.2 1.8 - 3.8 3.9 1.6 9.4 -1.4 90.4 3.22018 1.6 1.1 1.1 3.6 - 3.6 4.0 1.2 8.8 -1.4 89.2 3.1
Germany 2016 1.8 1.8 4.0 2.1 - 2.4 3.6 0.4 4.2 0.6 68.2 8.72017 1.9 1.3 2.5 2.4 - 3.9 5.0 1.7 3.8 0.4 65.5 8.32018 1.9 1.4 1.9 4.3 - 4.0 4.8 1.5 3.8 0.4 62.9 8.0
France 2016 1.1 1.8 1.4 2.8 - 1.2 3.6 0.3 10.0 -3.3 96.4 -2.12017 1.1 1.2 1.2 1.9 - 3.3 3.8 1.1 9.9 -2.9 96.8 -2.32018 1.2 1.0 1.1 3.0 - 3.0 3.5 1.3 9.7 -3.1 97.4 -2.6
Italy 2016 1.0 1.3 0.6 3.1 - 2.6 3.1 -0.1 11.7 -2.3 132.8 2.72017 1.0 0.8 0.7 3.3 - 4.3 4.8 1.5 11.5 -2.4 133.3 2.12018 1.3 0.8 0.7 3.6 - 3.5 3.5 1.2 11.4 -2.6 133.2 1.8
Spain 2016 3.2 3.2 0.8 3.1 - 4.4 3.3 -0.3 19.6 -4.7 99.7 1.82017 2.5 2.3 0.8 2.7 - 3.8 2.9 2.1 17.7 -3.5 100.0 1.72018 2.2 2.0 1.2 4.7 - 3.6 4.6 1.0 16.1 -2.9 99.7 1.6
Finland 2016 1.4 2.0 0.5 5.2 - 0.5 2.5 0.4 8.8 -1.9 63.6 -1.12017 1.5 1.0 -0.1 3.5 - 3.0 2.5 1.2 8.3 -2.3 64.7 -1.12018 1.5 1.0 0.2 2.5 - 4.0 3.0 1.4 8.0 -2.0 65.0 -0.9
Macro forecast, Global
USA 2016 1.6 2.6 0.8 0.4 -0.4 0.7 0.7 1.3 4.9 -2.6 105 -2.72017 2.2 2.2 0.6 2.8 0.1 3.2 2.3 2.4 4.7 -2.9 105 -2.92018 2.8 2.0 2.9 6.1 0.0 3.0 3.0 2.5 4.4 -2.8 103 -3.3
China 2016 6.7 - - - - - - 2.0 4.1 -3.0 46.3 2.42017 6.6 - - - - - - 2.0 4.3 -3.3 49.9 2.12018 6.3 - - - - - - 2.0 4.3 -3.0 53.3 1.5
UK 2016 2.0 2.8 0.8 0.9 0.5 1.0 2.7 0.7 4.9 -3.6 88.7 -5.02017 1.2 1.7 0.2 0.3 0.3 1.7 2.4 2.3 5.0 -2.9 89.2 -4.92018 1.0 1.0 0.4 0.7 0.0 2.8 2.0 2.6 5.3 -2.2 88.7 -3.3
Year GDP 1
Private
cons.1
Public
cons.1
Fixed
inv.1
Stock
build.2
Current
acc.4
Im-
ports1
Public
debt4
Public
budget4
Ex-
ports1
Infla-
tion1
Unem-
ploym.3
Ex-
ports1
Im-
ports1
Infla-
tion1
Unem-
ploym.3
Public
budget4
Current
acc.4
Public
debt4
Unem-
ploym.3
Public
budget4
Public
debt4
Year
Year GDP 1
Private
cons.1
Public
cons.1
Fixed
inv.1
Stock
build.2
Current
acc.4
GDP 1
Private
cons.1
Public
cons.1
Fixed
inv.1
Stock
build.2
Ex-
ports1
Im-
ports1
Infla-
tion1
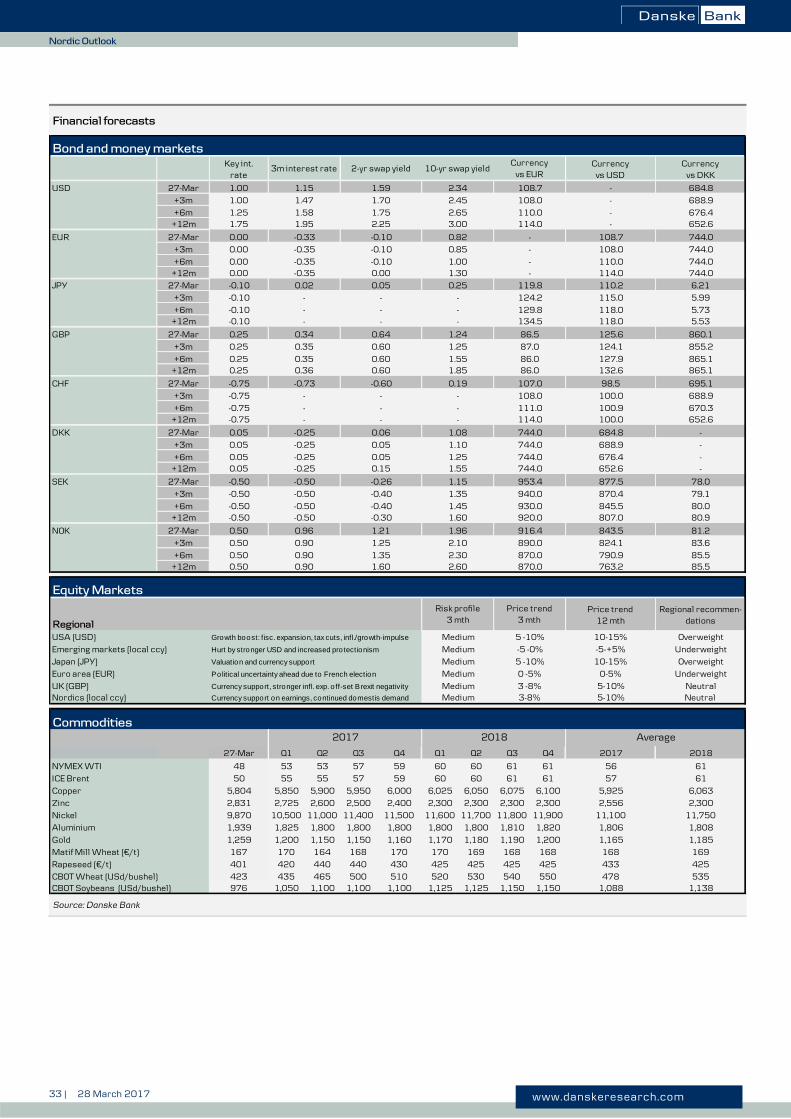
33 | 28 March 2017 www.danskeresearch.com
No
rdic O
utlo
ok
Nordic Outlook
Financial forecasts
Source: Danske Bank
Bond and money markets
Currencyvs USD
Currencyvs DKK
USD 27-Mar - 684.8
+3m - 688.9
+6m - 676.4+12m - 652.6
EUR 27-Mar 108.7 744.0
+3m 108.0 744.0
+6m 110.0 744.0+12m 114.0 744.0
JPY 27-Mar 110.2 6.21
+3m 115.0 5.99
+6m 118.0 5.73+12m 118.0 5.53
GBP 27-Mar 125.6 860.1
+3m 124.1 855.2
+6m 127.9 865.1+12m 132.6 865.1
CHF 27-Mar 98.5 695.1
+3m 100.0 688.9
+6m 100.9 670.3+12m 100.0 652.6
DKK 27-Mar 684.8 -
+3m 688.9 -
+6m 676.4 -+12m 652.6 -
SEK 27-Mar 877.5 78.0
+3m 870.4 79.1
+6m 845.5 80.0+12m 807.0 80.9
NOK 27-Mar 843.5 81.2
+3m 824.1 83.6
+6m 790.9 85.5+12m 763.2 85.5
Equity Markets
Regional
Price trend12 mth
Regional recommen-dations
USA (USD) Growth boost: fisc. expansion, tax cuts, infl./growth-impulse 10-15% Overweight
Emerging markets (local ccy) Hurt by stronger USD and increased protectionism -5-+5% Underweight
Japan (JPY) Valuation and currency support 10-15% Overweight
Euro area (EUR) Political uncertainty ahead due to French election 0-5% Underweight
UK (GBP) Currency support, stronger infl. exp. o ff-set Brexit negativity 5-10% NeutralNordics (local ccy) Currency support on earnings, continued domestis demand 5-10% Neutral
Commodities
Q1 Q2 Q3 Q4 Q1 Q2 Q3 Q4 2017 2018
NYMEX WTI 53 53 57 59 60 60 61 61 56 61
ICE Brent 55 55 57 59 60 60 61 61 57 61
Copper 5,850 5,900 5,950 6,000 6,025 6,050 6,075 6,100 5,925 6,063
Zinc 2,725 2,600 2,500 2,400 2,300 2,300 2,300 2,300 2,556 2,300
Nickel 10,500 11,000 11,400 11,500 11,600 11,700 11,800 11,900 11,100 11,750
Aluminium 1,825 1,800 1,800 1,800 1,800 1,800 1,810 1,820 1,806 1,808
Gold 1,200 1,150 1,150 1,160 1,170 1,180 1,190 1,200 1,165 1,185
Matif Mill Wheat (€/t) 170 164 168 170 170 169 168 168 168 169
Rapeseed (€/t) 420 440 440 430 425 425 425 425 433 425
CBOT Wheat (USd/bushel) 435 465 500 510 520 530 540 550 478 535CBOT Soybeans (USd/bushel) 1,050 1,100 1,100 1,100 1,125 1,125 1,150 1,150 1,088 1,138976
423
0.82
1.451.60
1.96
2.10
2.30
1.551.85
0.19
-
--
2.60
1.251.55
1.10
1.15
1.35
1.08
0.85
1.001.30
-
--
1.24
1.25
0.25
48
9,870
5,804
2,831
2018
Medium
Medium
Medium 5 -10%
Medium 5 -10%
-5 -0%
0 -5%
Medium 3-8%Medium 3 -8%
1,259
167
50
1,939
2017
27-Mar
Currencyvs EUR
2-yr swap yield
Risk profile3 mth
Price trend3 mth
2.45
2.34
2.65
1.59
-0.10
0.05
0.64
-0.60
0.06
-0.10
-0.100.00
1.70
86.5
3.00
86.086.0
108.0
111.0114.0
108.0
110.0114.0
124.2
129.8134.5
108.7
-
-
--
119.8
744.0
744.0744.0
953.4
916.4
870.0
940.0
870.0
930.0920.0
890.0
107.0
744.0
87.0
1.60
-0.30
1.210.96
0.90
-0.50
1.752.25
0.60
0.600.60
-
-
1.35
-0.40
-
1.25
0.05
0.050.15
-
--
-0.26
-0.40
10-yr swap yield
-0.50
0.05
0.050.05
3m interest rate
0.90
0.00
-0.10
0.25
-0.75
0.05
-0.35
0.35
0.350.36
0.50
0.50
0.90
-0.75-0.75
-0.50
-0.10
-0.25
-
Key int.rate
1.00
1.00
1.251.75
0.50
-0.75
0.00
0.00
-0.10-0.10
0.25
0.50
-0.50
0.25
-0.50-0.50
0.00
0.25
-
-0.50
Average
1.15
-0.33
0.02
0.34
401
-0.50
-0.73
-
--
-0.25
-0.25
-0.25
1.47
1.581.95
-0.35
-0.35
-
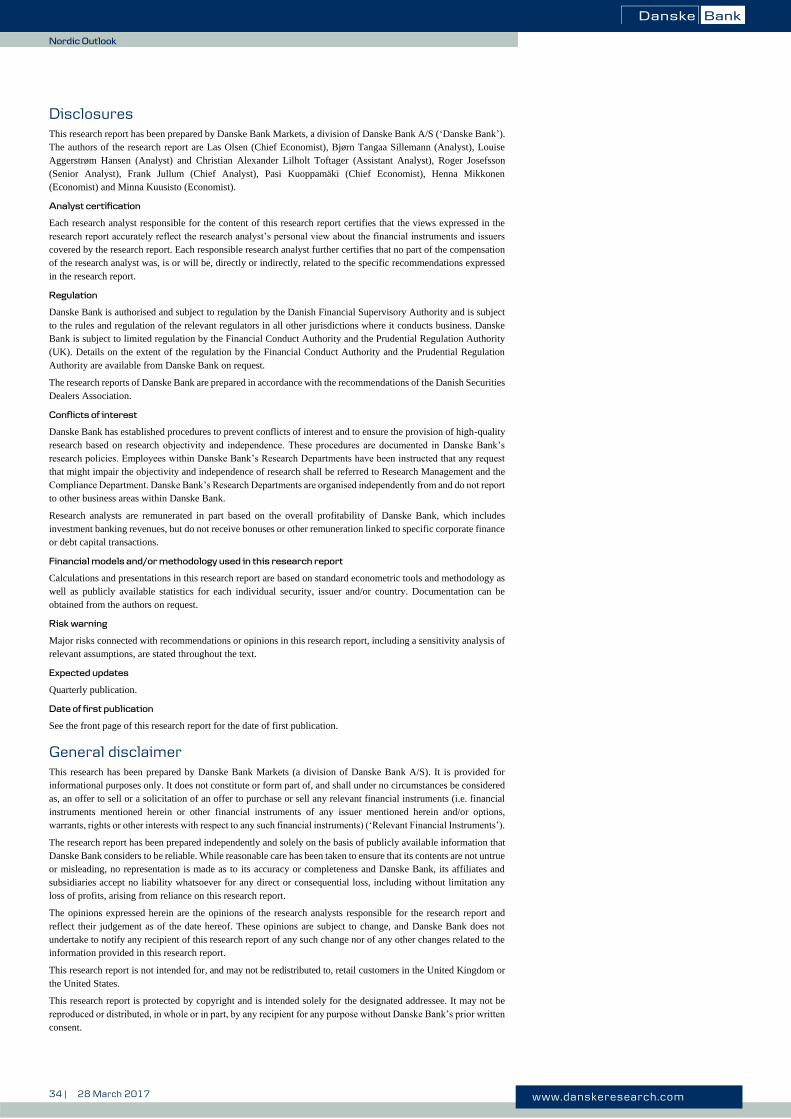
34 | 28 March 2017 www.danskeresearch.com
No
rdic O
utlo
ok
Nordic Outlook
Disclosures This research report has been prepared by Danske Bank Markets, a division of Danske Bank A/S (‘Danske Bank’).
The authors of the research report are Las Olsen (Chief Economist), Bjørn Tangaa Sillemann (Analyst), Louise
Aggerstrøm Hansen (Analyst) and Christian Alexander Lilholt Toftager (Assistant Analyst), Roger Josefsson
(Senior Analyst), Frank Jullum (Chief Analyst), Pasi Kuoppamäki (Chief Economist), Henna Mikkonen
(Economist) and Minna Kuusisto (Economist).
Analyst certification
Each research analyst responsible for the content of this research report certifies that the views expressed in the
research report accurately reflect the research analyst’s personal view about the financial instruments and issuers
covered by the research report. Each responsible research analyst further certifies that no part of the compensation
of the research analyst was, is or will be, directly or indirectly, related to the specific recommendations expressed
in the research report.
Regulation
Danske Bank is authorised and subject to regulation by the Danish Financial Supervisory Authority and is subject
to the rules and regulation of the relevant regulators in all other jurisdictions where it conducts business. Danske
Bank is subject to limited regulation by the Financial Conduct Authority and the Prudential Regulation Authority
(UK). Details on the extent of the regulation by the Financial Conduct Authority and the Prudential Regulation
Authority are available from Danske Bank on request.
The research reports of Danske Bank are prepared in accordance with the recommendations of the Danish Securities
Dealers Association.
Conflicts of interest
Danske Bank has established procedures to prevent conflicts of interest and to ensure the provision of high-quality
research based on research objectivity and independence. These procedures are documented in Danske Bank’s
research policies. Employees within Danske Bank’s Research Departments have been instructed that any request
that might impair the objectivity and independence of research shall be referred to Research Management and the
Compliance Department. Danske Bank’s Research Departments are organised independently from and do not report
to other business areas within Danske Bank.
Research analysts are remunerated in part based on the overall profitability of Danske Bank, which includes
investment banking revenues, but do not receive bonuses or other remuneration linked to specific corporate finance
or debt capital transactions.
Financial models and/or methodology used in this research report
Calculations and presentations in this research report are based on standard econometric tools and methodology as
well as publicly available statistics for each individual security, issuer and/or country. Documentation can be
obtained from the authors on request.
Risk warning
Major risks connected with recommendations or opinions in this research report, including a sensitivity analysis of
relevant assumptions, are stated throughout the text.
Expected updates
Quarterly publication.
Date of first publication
See the front page of this research report for the date of first publication.
General disclaimer This research has been prepared by Danske Bank Markets (a division of Danske Bank A/S). It is provided for
informational purposes only. It does not constitute or form part of, and shall under no circumstances be considered
as, an offer to sell or a solicitation of an offer to purchase or sell any relevant financial instruments (i.e. financial
instruments mentioned herein or other financial instruments of any issuer mentioned herein and/or options,
warrants, rights or other interests with respect to any such financial instruments) (‘Relevant Financial Instruments’).
The research report has been prepared independently and solely on the basis of publicly available information that
Danske Bank considers to be reliable. While reasonable care has been taken to ensure that its contents are not untrue
or misleading, no representation is made as to its accuracy or completeness and Danske Bank, its affiliates and
subsidiaries accept no liability whatsoever for any direct or consequential loss, including without limitation any
loss of profits, arising from reliance on this research report.
The opinions expressed herein are the opinions of the research analysts responsible for the research report and
reflect their judgement as of the date hereof. These opinions are subject to change, and Danske Bank does not
undertake to notify any recipient of this research report of any such change nor of any other changes related to the
information provided in this research report.
This research report is not intended for, and may not be redistributed to, retail customers in the United Kingdom or
the United States.
This research report is protected by copyright and is intended solely for the designated addressee. It may not be
reproduced or distributed, in whole or in part, by any recipient for any purpose without Danske Bank’s prior written
consent.

D a n s k e B a n k , D a n s k e R e s e a r c h , H o l m e n s K a n a l 2 - 1 2 , D K - 1 0 9 2 C o p e n h a g e n K . P h o n e + 4 5 4 5 1 2 0 0 0 0 w w w. d a n s k e r e s e a r c h . co m
N o r way
C h i e f A n a l y s t & H e a d of F r a n k J u l l u m+ 4 7 8 5 4 0 6 5 4 0f j u @ d a n s k e b a n k . c o m
J o s te i n T v e d t+ 4 7 2 3 1 3 9 1 8 4j t v @ d a n s k e b a n k . c o m
F i N l a N d
C h i e f A n a l y s t & H e a d of P a s i P e t te r i K u o p p a m ä k i+ 3 5 8 1 0 5 4 6 7 7 1 5p a k u @ d a n s k e b a n k . c o m
M i n n a E m i l i a K u u s i s to+ 3 5 8 1 0 5 4 6 7 9 5 5m k u u @ d a n s k e b a n k . c o m
i N t e r N at i o N a l M a c r o
C h i e f A n a l y s t & H e a d of A l l a n v o n M e h r e n + 4 5 4 5 1 2 8 0 5 5a l v o @ d a n s k e b a n k . co m
P e r n i l l e B o m h o l d t H e n n e b e r g+ 4 5 4 5 1 3 2 0 2 1p e r n i @ d a n s k e b a n k . co m
M i k a e l O l a i M i l h ø j+ 4 5 4 5 1 2 7 6 0 7m i l h @ d a n s k e b a n k . co m
F i x e d i N c o M e r e s e a r c h
C h i e f A n a l y s t & H e a d of A r n e L o h m a n n R a s m u s s e n + 4 5 4 5 1 2 8 5 3 2a r r @ d a n s k e b a n k . co m
J e n s P e te r S ø r e n s e n+ 4 5 4 5 1 2 8 5 1 7 j e n s s r @ d a n s k e b a n k . co m
C h r i s t i n a E . Fa l c h + 4 5 4 5 1 2 7 1 5 2c h f a @ d a n s k e b a n k . co m
J a n We b e r Ø s te r g a a r d+ 4 5 4 5 1 3 0 7 8 9j a s t @ d a n s k e b a n k . c o m
A n d e r s M ø l l e r L u m h o l t z+ 4 5 4 5 1 2 8 4 9 8a n d j r g @ d a n s k e b a n k . c o m
H a n s R o a g e r J e n s e n+ 4 5 4 5 1 3 0 7 8 9h r o a @ d a n s k e b a n k . c o m
M a th i a s R ø n M o g e n s e n + 4 5 4 5 1 4 7 2 2 6m m o g @ d a n s k e b a n k . c o m
T h o m a s H o p p e R o s e n l u n d+ 4 5 4 5 1 4 3 2 8 5th r o s @ d a n s k e b a n k . c o m
F x & c o M M o d i t i e s s t r at e g y
G l o b a l H e a d of F I C C R e s e a r c hT h o m a s H a r r+ 4 5 4 5 1 3 6 7 3 1th h a r @ d a n s k e b a n k . c o m
C h r i s t i n K y r m e Tu x e n ( o n l e a v e )+ 4 5 4 5 1 3 7 8 6 7tu x @ d a n s k e b a n k . co m
M o r te n T h r a n e H e l t+ 4 5 4 5 1 2 8 5 1 8m o h e l @ d a n s k e b a n k . c o m
J e n s N æ r v i g P e d e r s e n + 4 5 4 5 1 2 8 0 6 1j e n p e @ d a n s k e b a n k . co m
K r i s tof f e r K j æ r L o m h o l t+ 4 5 4 5 1 2 8 5 2 9 k l o m @ d a n s k e b a n k . c o m
A i l a E v c h e n M i h r+ 4 5 4 5 1 3 7 8 6 7a m i h @ d a n s k e b a n k . co m
d c M r e s e a r c h
C h i e f A n a l y s t & H e a d of T h o m a s M a r t i n H o v a r d+ 4 5 4 5 1 2 8 5 0 5 h o v a @ d a n s k e b a n k . co m
L o u i s L a n d e m a n+ 4 6 8 5 6 8 8 0 5 2 4l l a n @ d a n s k e b a n k . s e
J a ko b M a g n u s s e n + 4 5 4 5 1 2 8 5 0 3j a k j a @ d a n s k e b a n k . co m
M a d s R o s e n d a l+ 4 5 4 5 1 4 8 8 7 9m a d r o @ d a n s k e b a n k . co m
G a b r i e l B e r g i n+ 4 6 8 5 6 8 8 0 6 0 2g a b e @ d a n s k e b a n k . co m
B r i a n B ø r s t i n g+ 4 5 4 5 1 2 8 5 1 9b r b r @ d a n s k e b a n k . co m
S v e r r e H o l b e k+ 4 5 4 5 1 4 8 8 8 2h o l b @ d a n s k e b a n k . co m
N i k l a s R i p a+ 4 5 4 5 1 2 8 0 4 7n i r i @ d a n s k e b a n k . co m
H e n r i k R e n è A n d r e s e n + 4 5 4 5 1 3 3 3 2 7h e n a @ d a n s k e b a n k . co m
L u k a s P l a t z e r+ 4 5 4 5 1 2 8 4 3 0l p l a @ d a n s k e b a n k . c o m
K a tr i n e J e n s e n+ 4 5 4 5 1 2 8 0 5 6k a tr i @ d a n s k e b a n k . co m
H a s e e b S y e d+ 4 7 8 5 4 0 5 4 1 9h s y @ d a n s k e b a n k . co m
B e n d i k E n g e b r e ts e n+ 4 7 8 5 4 0 6 9 1 4b e e @ d a n s k e b a n k . co m
J o n a s M e y e r+ 4 7 9 2 8 5 8 5 2 5m e y @ d a n s k e b a n k . co m
d e N M a r k
C h i e f E c o n o m i s t & H e a d of L a s O l s e n + 4 5 4 5 1 2 8 5 3 6l a s o @ d a n s k e b a n k . co m
L o u i s e A g g e r s tr ø m H a n s e n+ 4 5 4 5 1 2 8 5 3 1l o u h a n @ d a n s k e b a n k . co m
B j ø r n Ta n g a a S i l l e m a n n + 4 5 4 5 1 2 8 2 2 9b j s i @ d a n s k e b a n k . co m
s w e d e N
C h i e f A n a l y s t & H e a d of M i c h a e l B o s tr ö m+ 4 6 8 5 6 8 8 0 5 8 7m b o s @ d a n s k e b a n k . co m
R o g e r J o s e f s s o n+ 4 6 8 5 6 8 8 0 5 5 8 r j o s @ d a n s k e b a n k . co m
M i c h a e l G r a h n + 4 6 8 5 6 8 8 0 7 0 0m i k a @ d a n s k e b a n k . co m
C a r l M i l to n+ 4 6 8 5 6 8 8 0 5 9 8c a r m i @ d a n s k e b a n k . co m
M a r c u s S ö d e r b e r g+ 4 6 8 5 6 8 8 0 5 6 4m a r s d @ d a n s k e b a n k . co m
S te f a n M e l l i n+ 4 6 8 5 6 8 8 0 5 9 2m e l l @ d a n s k e b a n k . c o m
S u s a n n e P e r n e b y+ 4 6 8 5 6 8 8 0 5 8 5s u p e @ d a n s k e b a n k . co m
e M e r g i N g M a r k e t s
C h i e f A n a l y s t & H e a d of J a ko b E k h o l d t C h r i s te n s e n+ 4 5 4 5 1 2 8 5 3 0j a k c @ d a n s k e b a n . co m
V l a d i m i r M i k l a s h e v s k y + 3 5 8 ( 0 ) 1 0 5 4 6 7 5 2 2v l m i @ d a n s k e b a n k . co m
R o k a s G r a j a u s k a s+ 3 7 0 5 2 1 5 6 2 3 1r g r a @ d a n s k e b a n k . c o m