Embed Size (px)
Citation preview

2 Malaysia Abdul Malek Mokhtar
I. Introduction
The Federation of Malaysia is formed in 1963, originally consisted of Malaya, Singapore, Sarawak
and Sabah. Due to internal political tensions Singapore was obliged to leave in 1965. Malaya is now known as Peninsular Malaysia, and the two other territories on the island of Borneo as East Malaysia. Prior to 1963 these territories were under British rule for varying periods from the late eighteenth century. Malaya gained independence in 1957, Sarawak and Sabah (the latter known previously as British North Borneo) in 1963, and Singapore full independence in 1965. These territories lie between 2 and 6 degrees north of the equator. The terrain consists of extensive coastal plains backed by mountainous interiors. The soils are not naturally fertile but the humid tropical climate subject to monsoonal weather patterns creates good conditions for plant growth. Historically much of the region was covered in dense rainforest (jungle), though much of this has been removed for commercial purposes over the last century leading to extensive soil erosion and silting of the rivers, which run from the interiors to the coast. The present government is a parliamentary system at the federal level (located in Kuala Lumpur, Peninsular Malaysia) and at the state level, based on periodic general elections. Each Peninsular state (except Penang and Melaka) has a traditional Malay ruler, the Sultan, one of whom is elected as paramount ruler of Malaysia (Yang Di Pertuan Agong) for a five-year term. The population in 2013 approximated 27.4 million and is ethnically diverse, consisting of 18.6 million Malays and Bumiputera (67.9% of total population) including Muslims and non-Muslims, Chinese, 6.6 million (24%), Indians, 2 million (7.2%), while there are 259,000 (0.9%) people of other ethnic groups (0.9%).
Malaysia is generally regarded as one of the most successful non-western countries to have achieved a relatively smooth transition to modern economic growth over the last century or so. Since the late nineteenth century it has been a major supplier of primary products to the industrialized countries; tin, rubber, palm oil, timber, oil, liquefied natural gas, etc. However, since about 1970 the leading sector in development has been a range of export-oriented manufacturing industries such as textiles, electrical and electronic goods, rubber products etc. Government policy has generally accorded a central role to foreign capital, while at the same time working towards more substantial participation for domestic, especially Bumiputera, capital and enterprise. By 1990 the country had largely met the criteria for a Newly-Industrialized Country (NIC) status (30 percent of exports to consist of manufactured goods). While the Asian economic crisis of 1997-98 slowed growth temporarily, the current plan, titled Vision 2020, aims to achieve “a fully developed industrialized economy by that date. The Pre-modern Economy
Malaysia has a long history of internationally valued exports, being known from the early centuries A.D. as a source of gold, tin and exotics such as birds’ feathers, edible birds’ nests, aromatic woods, tree resins etc. The commercial importance of the area was enhanced by its strategic position athwart the seaborne trade routes from the Indian Ocean to East Asia. Merchants from both these regions, Arabs, Indians and Chinese regularly visited. Some became domiciled in ports such as Melaka [formerly Malacca], the location of one of the earliest local sultanates (c.1402 A.D.) and a focal point for both local and international trade.
From the early sixteenth century the area was increasingly penetrated by European trading interests, first the Portuguese (from 1511), then the Dutch East India Company [VOC](1602) in competition with the English East India Company [EIC] (1600) for the trade in pepper and various spices. By the late eighteenth century the VOC was dominant in the Indonesian region while the EIC acquired bases in Malaysia, beginning with Penang (1786), Singapore (1819) and Melaka (1824). These were major staging posts in the growing trade with China and also served as footholds from which to expand British control into the Malay Peninsula (from 1870), and northwest Borneo (Sarawak from 1841 and
37
North Borneo from 1882). Over these centuries there was an increasing inflow of migrants from China attracted by the opportunities in trade and as a wage labor force for the burgeoning production of export commodities such as gold and tin. The indigenous people also engaged in commercial production (rice, tin), but remained basically within a subsistence economy and were reluctant to offer themselves as permanent wage labor. Overall, production in the pre-modern economy was relatively small in volume and technologically undeveloped. The capitalist sector, already foreign dominated, was still in its infancy (Drabble, 2000). The Creation of a Plural Society
By the 1920s the large inflows of migrants had created a multi-ethnic population of the type, which the British scholar, J.S. Furnivall (1948) described as a plural society in which the different racial groups live side by side under a single political administration but apart from economic transactions, do not interact with each other either socially or culturally. Though the original intention of many migrants was to come for only a limited period (say 3-5 years), save money and then return home, a growing number were staying longer, having children and becoming permanently domiciled in Malaysia. The economic developments described in the previous section were unevenly located, for example, in Malaya the bulk of the tin mines and rubber estates were located along the west coast of the Peninsula. In the boom-times, such was the size of the immigrant inflows that in certain areas they far outnumbered the indigenous Malays. In social and cultural terms Indians and Chinese recreated the institutions, hierarchies and linguistic usage of their countries of origin. This was particularly so in the case of the Chinese. Not only did they predominate in major commercial centers such as Penang, Singapore, and Kuching, but they controlled local trade in the smaller towns and villages through a network of small shops (kedai) and dealerships that served as a pipeline along which export goods like rubber went out and in return imported manufactured goods were brought in for sale. In addition Chinese owned considerable mining and agricultural land. This created a distribution of wealth and division of labor in which economic power and function were directly related to race. In this situation lay the seeds of growing discontent among bumiputera that they were losing their ancestral inheritance (land) and becoming economically marginalized. As long as British colonial rule continued the various ethnic groups looked primarily to government to protect their interests and maintain peaceable relations. War Time 1942-45: The Japanese Occupation
During the Japanese occupation years of World War II, the export of primary products was limited to the relatively small amounts required for the Japanese economy. This led to the abandonment of large areas of rubber and the closure of many mines, the latter progressively affected by a shortage of spare parts for machinery. Businesses, especially those Chinese-owned, were taken over and reassigned to Japanese interests. Rice imports fell heavily and thus the population devoted a large part of their efforts to producing enough food to stay alive. Large numbers of laborers (many of whom died) were conscripted to work on military projects such as construction of the Thai-Burma railroad. Overall the war period saw the dislocation of the export economy, widespread destruction of the infrastructure (roads, bridges etc.) and a decline in standards of public health. It also saw a rise in inter-ethnic tensions due to the harsh treatment meted out by the Japanese to some groups, notably the Chinese, compared to a more favorable attitude towards the indigenous peoples among whom (Malays particularly) there was a growing sense of ethnic nationalism (Drabble, 2000). Postwar Reconstruction and Independence
The returning British colonial rulers had two priorities after 1945; to rebuild the export economy as it had been under the OIDL (see above), and to rationalize the fragmented administrative structure (see General Background). The first was accomplished by the late 1940s with estates and mines refurbished, production restarted once the labor force had been brought back and adequate rice imports regained. The second was a complex and delicate political process, which resulted in the formation of the Federation of Malaya (1948) from which Singapore, with its predominantly Chinese population (about 75%), was kept separate. In Borneo in 1946 the state of Sarawak, which had been a private kingdom of the English Brooke family (so-called “White Rajas”) since 1841, and North Borneo, administered by the British North Borneo Company from 1881, were both transferred to direct rule
38
from Britain. However, independence was clearly on the horizon and in Malaya tensions continued with the guerrilla campaign (called the “Emergency”) waged by the Malayan Communist Party (membership largely Chinese) from 1948-60 to force out the British and set up a Malayan Peoples’ Republic. This failed and in 1957 the Malayan Federation gained independence (Merdeka) under a “bargain” by which the Malays would hold political paramountcy while others, notably Chinese and Indians, were given citizenship and the freedom to pursue their economic interests. The bargain was institutionalized as the Alliance, later renamed the National Front (Barisan Nasional) which remains the dominant political grouping. In 1963 the Federation of Malaysia was formed in which the bumiputera population was sufficient in total to offset the high proportion of Chinese arising from the short-lived inclusion of Singapore (Andaya and Andaya, 2001). Towards the Formation of a National Economy
Postwar two long-term problems came to the forefront. These were (a) the political fragmentation (see above) which had long prevented a centralized approach to economic development, coupled with control from Britain which gave primacy to imperial as opposed to local interests and (b) excessive dependence on a small range of primary products (notably rubber and tin) which prewar experience had shown to be an unstable basis for the economy. The first of these was addressed partly through the political rearrangements outlined in the previous section, with the economic aspects buttressed by a report from a mission to Malaya from the International Bank for Reconstruction and Development (IBRD) in 1954. The report argued that Malaya “is now a distinct national economy.” A further mission in 1963 urged “closer economic cooperation between the prospective Malaysia [n] territories” (cited in Drabble, 2000, 161, 176). The rationale for the Federation was that Singapore would serve as the initial center of industrialization, with Malaya, Sabah and Sarawak following at a pace determined by local conditions. The second problem centered on economic diversification. The IBRD reports just noted advocated building up a range of secondary industries to meet a larger portion of the domestic demand for manufactures, i.e. import-substitution industrialization (ISI). In the interim dependence on primary products would perforce continue.
The Adoption of Planning
In the postwar world the development plan (usually a Five-Year Plan) was widely adopted by Less-Developed Countries (LDCs) to set directions, targets and estimated costs. Each of the Malaysian territories had plans during the 1950s. Malaya was the first to get industrialization of the ISI type under way. The Pioneer Industries Ordinance (1958) offered inducements such as five-year tax holidays, guarantees (to foreign investors) of freedom to repatriate profits and capital etc. A modest degree of tariff protection was granted. The main types of goods produced were consumer items such as batteries, paints, tires, and pharmaceuticals. Just over half the capital invested came from abroad, with neighboring Singapore in the lead. When Singapore exited the federation in 1965, Malaysia’s fledgling industrialization plans assumed greater significance although foreign investors complained of stifling bureaucracy retarding their projects.
Primary production, however, was still the major economic activity and here the problem was rejuvenation of the leading industries, rubber in particular. New capital investment in rubber had slowed since the 1920s, and the bulk of the existing trees were nearing the end of their economic life. The best prospect for rejuvenation lay in cutting down the old trees and replanting the land with new varieties capable of raising output per acre/hectare by a factor of three or four. However, the new trees required seven years to mature. Corporately owned estates could replant progressively, but smallholders could not face such a prolonged loss of income without support. To encourage replanting, the government offered grants to owners, financed by a special duty on rubber exports. The process was a lengthy one and it was the 1980s before replanting was substantially complete. Moreover, many estates elected to switch over to a new crop, oil palms (a product used primarily in foodstuffs), which offered quicker returns. Progress was swift and by the 1960s Malaysia was supplying 20 percent of world demand for this commodity.
Another priority at this time consisted of programs to improve the standard of living of the indigenous peoples, most of who lived in the rural areas. The main instrument was land development, with schemes to open up large areas (say 100,000 acres or 40 000 hectares) which were then subdivided into 10 acre/4 hectare blocks for distribution to small farmers from overcrowded regions
39

who were either short of land or had none at all. Financial assistance (repayable) was provided to cover housing and living costs until the holdings became productive. Rubber and oil palms were the main commercial crops planted. Steps were also taken to increase the domestic production of rice to lessen the historical dependence on imports.
In the primary sector Malaysia’s range of products was increased from the 1960s by a rapid increase in the export of hardwood timber, mostly in the form of (unprocessed) saw logs. The markets were mainly in East Asia and Australasia. Here the largely untapped resources of Sabah and Sarawak came to the fore, but the rapid rate of exploitation led by the late twentieth century to damaging effects on both the environment (extensive deforestation, soil-loss, silting, changed weather patterns), and the traditional hunter-gatherer way of life of forest-dwellers (decrease in wild-life, fish, etc.). Other development projects such as the building of dams for hydroelectric power also had adverse consequences in all these respects (Amarjit Kaur, 1998; Drabble, 2000; Hong, 1987). A further major addition to primary exports came from the discovery of large deposits of oil and natural gas in East Malaysia, and off the east coast of the Peninsula from the 1970s. Gas was exported in liquefied form (LNG), and was also used domestically as a substitute for oil. At peak values in 1982, petroleum and LNG provided around 29 percent of Malaysian export earnings but had declined to 18 percent by 1988. Industrialization and the New Economic Policy 1970-90
The program of industrialization aimed primarily at the domestic market (ISI) lost impetus in the late 1960s as foreign investors, particularly from Britain switched attention elsewhere. An important factor here was the outbreak of civil disturbances in May 1969, following a federal election in which political parties in the Peninsula (largely non-bumiputera in membership) opposed to the Alliance did unexpectedly well. This brought to head tensions, which had been rising during the 1960s over issues such as the use of the national language, Malay (Bahasa Malaysia) as the main instructional medium in education. There was also discontent among Peninsular Malays that the economic fruits since independence had gone mostly to non-Malays, notably the Chinese. The outcome was severe inter-ethnic rioting centered in the federal capital, Kuala Lumpur, which led to the suspension of parliamentary government for two years and the implementation of the New Economic Policy (NEP).
The main aim of the NEP was a restructuring of the Malaysian economy over two decades, 1970-90 with the following aims:
• To redistribute corporate equity so that the bumiputera share would rise from around 2 percent to 30 percent. The share of other Malaysians would increase marginally from 35 to 40 percent, while that of foreigners would fall from 63 percent to 30 percent
• To eliminate the close link between race and economic function (a legacy of the colonial era) and restructure employment so that that the bumiputera share in each sector would reflect more accurately their proportion of the total population (roughly 55 percent). In 1970 this group had about two-thirds of jobs in the primary sector where incomes were generally lowest, but only 30 percent in the secondary sector. In high-income middle class occupations (e.g. professions, management) the share was only 13 percent
• To eradicate poverty irrespective of race. In 1970 just under half of all households in Peninsular Malaysia had incomes below the official poverty line. Malays accounted for about 75 percent of these.
The principle underlying these aims was that the redistribution would not result in any one group losing in absolute terms. Rather it would be achieved through the process of economic growth, i.e. the economy would get bigger (more investment, more jobs, etc.). While the primary sector would continue to receive developmental aid under the successive Five Year Plans, the main emphasis was a switch to export-oriented industrialization (EOI) with Malaysia seeking a share in global markets for manufactured goods. Free Trade Zones (FTZs) were set up in places such as Penang where production was carried on with the undertaking that the output would be exported. Firms locating there received concessions such as duty-free imports of raw materials and capital goods, and tax concessions, aimed at primarily at foreign investors who were also attracted by Malaysia’s good facilities, relatively low wages and docile trade unions. A range of industries grew up; textiles, rubber and food products, chemicals, telecommunications equipment, electrical and electronic machinery/appliances, car assembly and some heavy industries, iron and steel. As with ISI, much of the capital and technology was foreign, for example the Japanese firm Mitsubishi was a partner in a venture to set up a plant to
40

assemble a Malaysian national car, the Proton, from mostly imported components (Drabble, 2000). As regards the proportion of households below the poverty line, in broad terms the incidence in Malaysia fell from approximately 49 percent in 1970 to 17 percent in 1990, but with large regional variations between the Peninsula (15%), Sarawak (21 %) and Sabah (34%) (Drabble, 2000, Table 13.5). All ethnic groups registered big falls, but on average the non-bumiputera still enjoyed the lowest incidence of poverty. By 2002 the overall level had fallen to only 4 percent.
Over these three decades Malaysia accomplished a transition from a primary product-dependent economy to one in which manufacturing industry had emerged as the leading growth sector. Rubber and tin, which accounted for 54.3 percent of Malaysian export value in 1970, declined sharply in relative terms to a mere 4.9 percent in 1990 (Crouch, 1996, 222). Factors in the structural shift
The post-independence state played a leading role in the transformation. The transition from British rule was smooth. Apart from the disturbances in 1969 government maintained a firm control over the administrative machinery. Malaysia’s Five Year Development plans were a model for the developing world. Foreign capital was accorded a central role, though subject to the requirements of the NEP. At the same time these requirements discouraged domestic investors, the Chinese especially, to some extent (Jesudason, 1989). Development was helped by major improvements in education and health. Enrolments at the primary school level reached approximately 90 percent by the 1970s, and at the secondary level 59 percent of potential by 1987. Increased female enrolments, up from 39 percent to 58 percent of potential from 1975 to 1991, were a notable feature, as was the participation of women in the workforce which rose to just over 45 percent of total employment by 1986/7. In the tertiary sector the number of universities increased from one to seven between 1969 and 1990 and numerous technical and vocational colleges opened. Bumiputera enrolments soared as a result of the NEP policy of redistribution (which included ethnic quotas and government scholarships). However, tertiary enrolments totaled only 7 percent of the age group by 1987. There was an “educational-occupation mismatch,” with graduates (bumiputera especially) preferring jobs in government, and consequent shortfalls against strong demand for engineers, research scientists, technicians and the like. Better living conditions (more homes with piped water and more rural clinics, for example) led to substantial falls in infant mortality, improved public health and longer life expectancy, especially in Peninsular Malaysia (Drabble, 2000, 248, 284-6).
The quality of national leadership was a crucial factor. This was particularly so during the NEP. The leading figure here was Dr. Mahathir Mohamad, Malaysian Prime Minister from 1981-2003. While supporting the NEP aim through positive discrimination to give bumiputera an economic stake in the country commensurate with their indigenous status and share in the population, he nevertheless emphasized that this should ultimately lead them to a more modern outlook and ability to compete with the other races in the country, the Chinese especially (see Khoo Boo Teik, 1995). There were, however, some paradoxes here. Mahathir was a meritocratic in principle, but in practice this period saw the spread of “money politics” (another expression for patronage) in Malaysia. In common with many other countries Malaysia embarked on a policy of privatization of public assets, notably in transportation (e.g. Malaysian Airlines), utilities (e.g. electricity supply) and communications (e.g. television). This was done not through an open process of competitive tendering but rather by a “nebulous ‘first come, first served’ principle” (Jomo, 1995, 8) which saw ownership pass directly to politically well-connected businessmen, mainly bumiputera, at relatively low valuations. The New Development Policy
Positive action to promote bumiputera interests did not end with the NEP in 1990, this was followed in 1991 by the New Development Policy (NDP), which emphasized assistance only to “Bumiputera with potential, commitment and good track records” (Malaysian Government, 1991, 17) rather than the previous blanket measures to redistribute wealth and employment. In turn the NDP was part of a longer-term program known as Vision 2020. The aim here is to turn Malaysia into a fully industrialized country and to quadruple per capita income by the year 2020. This will require the country to continue ascending the technological “ladder” from low- to high-tech types of industrial production, with a corresponding increase in the intensity of capital investment and greater retention of value-added (i.e. the value added to raw materials in the production process) by Malaysian
41

producers. The Malaysian economy continued to boom at historically unprecedented rates of 8-9 percent a
year for much of the 1990s. There was heavy expenditure on infrastructure, for example extensive building in Kuala Lumpur such as the Twin Towers. The volume of manufactured exports, notably electronic goods and electronic components increased rapidly.
42

II. Overview of Macroeconomics Activities II.1 Macroeconomics Activities
In 2014, its continues to be a challenging year for Malaysia, especially with the El Nino phenomenon, which is expected to not only drive food prices higher, but also result in a lot of economic, health and environmental costs. On the external front, there is a crisis brewing in Ukraine, affecting trade and investment as well as security in Europe, while surging Islamic militancy and continued fighting in Iraq and Syria could potentially push crude oil prices to higher levels, as last seen in 2008. Most worryingly, inflation remained elevated in the first five months of 2014, hovering well above the minimum of official forecast (BNM, 2014: 3 to 4%). "Cost of living" is undeniably on the rise, especially with the planned implementation of goods and services tax (GST) in April 2015 and an impending review of minimum wage policy in January next year. While household purchasing power is clearly shrinking, following mark up in prices by both firms and traders, there are unfortunately other social costs and potential welfare losses that should not be taken for granted by the authorities. These include continued softening in global commodity prices (affecting rubber and oil palm smallholders) and tightening of domestic credit conditions (business owners and borrowers). As for long-term savers, real interest rate is already in a negative territory, while macro-prudential and administrative tightening has to a large extent affected the corporate sector. Business owners are now coping hard with higher operating costs, especially production costs, as seen by elevated producer price index, particularly for local production, continued exchange rate volatility and heightened business uncertainty.
The banking system is now exposed to significant systemic risk, especially with continuing high household debt, tightening of domestic credit conditions and large exposure to property and real estate development. The bulk of the household debt is in the housing loans, of which the majority is exposed to floating mortgage rates. In terms of GDP per capita in USD, Malaysia's household debt at 86.8% of GDP at end-December 2013 is one of the highest in the region, in comparison to Singapore and Korea which recorded substantially high GDP per capita, but each registering household debt of less than 80%. On the external account, international reserves remained more or less stagnant at about USD131.1 billion in the second quarter of 2014, following strong foreign exchange interventions by BNM to support depreciating ringgit (leaning against the wind), while net international investment position continued to be in a negative territory in 2013 at -RM47.2 billion (2012: -RM17.8 billion), affected by net outflows of direct investment abroad (DIA) and portfolio investment, especially for sovereign debt securities. The intensified reversal in the last two years is reminiscence of the situation in the year 2000, in which international reserves were sharply lower. Foreign investors have been retreating from government bond markets, reallocating their global portfolio either to equity market or government bonds in the US and their home countries.
Real GDP growth of the Malaysian economy grew markedly higher by 6.2% in the first quarter of 2013 (Q42013: 5.1%, Q12013: 4.2%), supported by continued robust domestic demand, especially private consumption and investment. There was also a sharp turnaround in the external demand in the first quarter of 2014, registering positive year-on-year growth of almost 15% (Q42013: -6.8%, Q12013: -12.9%). Domestic demand (excluding change in stocks) expanded by 7.4% in the first quarter of 2014 (Q42013: 6.7%, Q12013: 7.5%), with private consumption remained the key driver of growth, growing steadily by 7.1% (Q42013: 7.4%, Q12013: 6.4%) and contributing 3.7 percentage points to real GDP growth (Q42013: 3.7 percentage points, Q12013: 3.2 percentage points). As mentioned in the previous reports, consumption-driven growth for a prolonged period is not sustainable, as it is associated with rising consumer inflation and consequently demand for higher wages. More importantly, there is an accumulation of household debt, which at end-December 2013 stood at 86.8%, and is one of the highest for developing countries. Private investment, however, remained strong registering double-digit growth of 14.1% (Q42013: 16.6%, Q12013: 10.0%), supported by capital outlays in the manufacturing and services sectors. Total investment approvals by MIDA in the manufacturing sector registered RM17.1 billion in the first quarter of 2014, of which the share of foreign investment amounted to 76.7% of the total investment approvals. There is a new wave of foreign investment, especially from Japan and Germany, which augurs well for the Malaysian economy, as external demand is on the uptrend, supported by a recovery in key advanced economies.
43
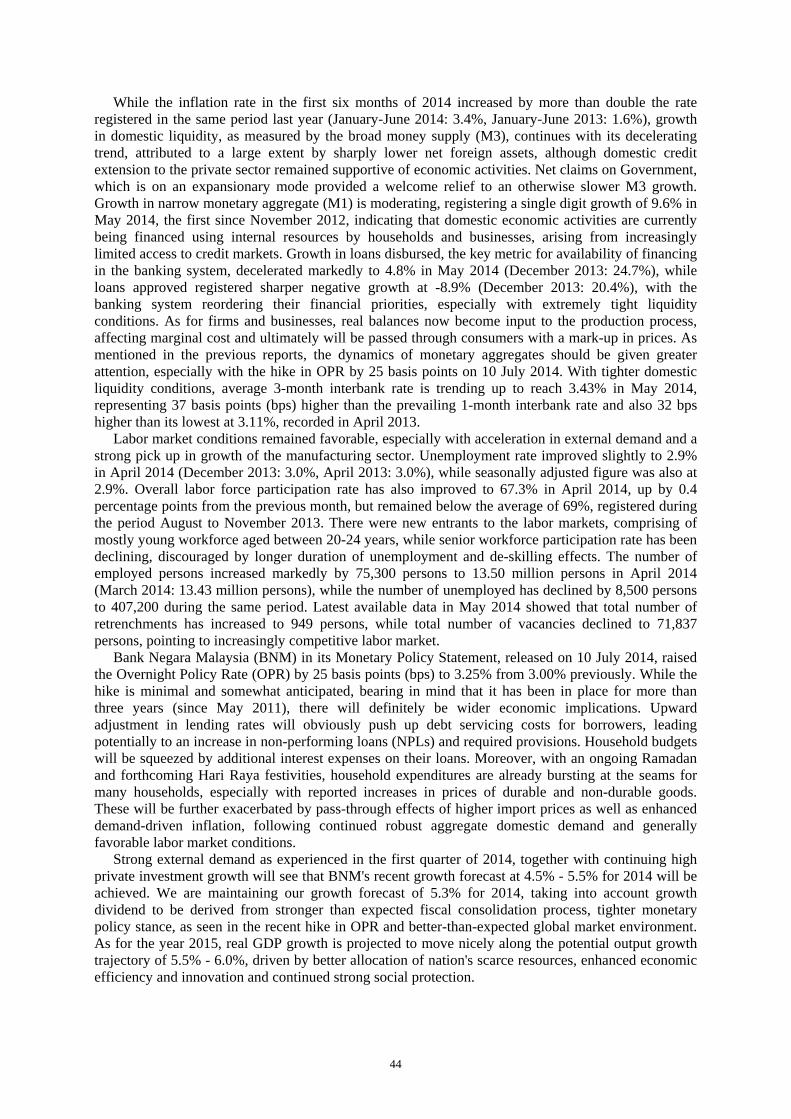
While the inflation rate in the first six months of 2014 increased by more than double the rate registered in the same period last year (January-June 2014: 3.4%, January-June 2013: 1.6%), growth in domestic liquidity, as measured by the broad money supply (M3), continues with its decelerating trend, attributed to a large extent by sharply lower net foreign assets, although domestic credit extension to the private sector remained supportive of economic activities. Net claims on Government, which is on an expansionary mode provided a welcome relief to an otherwise slower M3 growth. Growth in narrow monetary aggregate (M1) is moderating, registering a single digit growth of 9.6% in May 2014, the first since November 2012, indicating that domestic economic activities are currently being financed using internal resources by households and businesses, arising from increasingly limited access to credit markets. Growth in loans disbursed, the key metric for availability of financing in the banking system, decelerated markedly to 4.8% in May 2014 (December 2013: 24.7%), while loans approved registered sharper negative growth at -8.9% (December 2013: 20.4%), with the banking system reordering their financial priorities, especially with extremely tight liquidity conditions. As for firms and businesses, real balances now become input to the production process, affecting marginal cost and ultimately will be passed through consumers with a mark-up in prices. As mentioned in the previous reports, the dynamics of monetary aggregates should be given greater attention, especially with the hike in OPR by 25 basis points on 10 July 2014. With tighter domestic liquidity conditions, average 3-month interbank rate is trending up to reach 3.43% in May 2014, representing 37 basis points (bps) higher than the prevailing 1-month interbank rate and also 32 bps higher than its lowest at 3.11%, recorded in April 2013.
Labor market conditions remained favorable, especially with acceleration in external demand and a strong pick up in growth of the manufacturing sector. Unemployment rate improved slightly to 2.9% in April 2014 (December 2013: 3.0%, April 2013: 3.0%), while seasonally adjusted figure was also at 2.9%. Overall labor force participation rate has also improved to 67.3% in April 2014, up by 0.4 percentage points from the previous month, but remained below the average of 69%, registered during the period August to November 2013. There were new entrants to the labor markets, comprising of mostly young workforce aged between 20-24 years, while senior workforce participation rate has been declining, discouraged by longer duration of unemployment and de-skilling effects. The number of employed persons increased markedly by 75,300 persons to 13.50 million persons in April 2014 (March 2014: 13.43 million persons), while the number of unemployed has declined by 8,500 persons to 407,200 during the same period. Latest available data in May 2014 showed that total number of retrenchments has increased to 949 persons, while total number of vacancies declined to 71,837 persons, pointing to increasingly competitive labor market.
Bank Negara Malaysia (BNM) in its Monetary Policy Statement, released on 10 July 2014, raised the Overnight Policy Rate (OPR) by 25 basis points (bps) to 3.25% from 3.00% previously. While the hike is minimal and somewhat anticipated, bearing in mind that it has been in place for more than three years (since May 2011), there will definitely be wider economic implications. Upward adjustment in lending rates will obviously push up debt servicing costs for borrowers, leading potentially to an increase in non-performing loans (NPLs) and required provisions. Household budgets will be squeezed by additional interest expenses on their loans. Moreover, with an ongoing Ramadan and forthcoming Hari Raya festivities, household expenditures are already bursting at the seams for many households, especially with reported increases in prices of durable and non-durable goods. These will be further exacerbated by pass-through effects of higher import prices as well as enhanced demand-driven inflation, following continued robust aggregate domestic demand and generally favorable labor market conditions.
Strong external demand as experienced in the first quarter of 2014, together with continuing high private investment growth will see that BNM's recent growth forecast at 4.5% - 5.5% for 2014 will be achieved. We are maintaining our growth forecast of 5.3% for 2014, taking into account growth dividend to be derived from stronger than expected fiscal consolidation process, tighter monetary policy stance, as seen in the recent hike in OPR and better-than-expected global market environment. As for the year 2015, real GDP growth is projected to move nicely along the potential output growth trajectory of 5.5% - 6.0%, driven by better allocation of nation's scarce resources, enhanced economic efficiency and innovation and continued strong social protection.
44

II.2 International Environment A. Trade Balance
Malaysia trade for 2013 is increasing comparing to the year 2012. In December 2013, export is RM65.7b (2012:RM57.3b), import is RM56.3b (2012:RM49.0b) and trade balance is remained at RM9.4 billion for the both years. Figure 1 Malaysia Trade Performance in 2013
Jan Feb Mar Apr May Jun Jul Aug Sep Oct Nov Dec
Export 57 52.5 60 55.8 55.4 56.7 60.7 62.9 63.3 67.1 62.2 65.7
Import 53.7 44.3 54.9 54.9 52.9 52.4 57.9 55.8 54.6 58.9 52.5 56.3
40
45
50
55
60
65
70
RM Billion
Source: Department of Statistics, Malaysia, Compiled By: MITI Exports
Malaysia’s export sector has evolved significantly over the five recent decades. In line with the nation’s economic industrialization, the composition of exports had gradually shifted from comprising mainly of agricultural and mining products in the 1960s to manufactured goods in the 1980s. The development and growth of the manufacturing sector was so rapid that by the late 1990s, the sector accounted for more than 80% of total exports. Since 2000, two notable trends have emerged in Malaysia’s export structure. First, the gradual move away from a heavy concentration in electrical and electronics (E&E) exports, towards non-E&E manufactured products and commodities. The second key trend is the diversification of Malaysia’s exports markets.
As compared with December 2012, Malaysia’s export value posted an expansion of 14.4% from RM57.5 billion where the export unit value index rose 1.6% from 135.9 points. The increased was led by manufactured goods (+8.4%), chemicals (+7.4%), mineral fuels (+5.5%) and food (+4.7%). Similarly, the export volume index also recorded an increase of 12.9% from 95.3 points. This was mainly due to mineral fuels (+29.9%), followed by machinery & transport equipment (+20.0%), beverages & tobacco (+11.1%) and manufactured goods (+7.0%). In seasonally adjusted terms, the export volume index posted an increase of 1.7% to 105.2 points. Figure 2 Components of Malaysia's Exports 2013 (RM 719.81 Billion)
Mining Goods RM162.86 (22.60%)
Agricultural Goods
RM68.84 (9.6%)
Others RM5.13 (0.7%)
Manufactured Goods
RM482.98 (67.1%)
Source: Department of Statistics, Malaysia & Compiled by MITI & Matrade
45

Exports Destinations
Another key emerging trend is the greater diversification in the destination of Malaysia’s exports. While the share of Malaysia’s exports to traditional markets such as the US, Japan and the European Union (EU) remains high, demand from the regional economies, particularly East Asia, has risen substantially since 2000. ASEAN1 remains a key export market, accounting for about 25% of Malaysia’s total exports. Of significance is also the deepening of trade linkages with other Asian economies, particularly the PR China and India. The share of Malaysia’s exports to PR China has quadrupled from 3.1% in 2000 to 12.5% in 2010. There has also been an accompanying rise in Malaysia’s imports from PR China, thus resulting in PR China as Malaysia’s largest trading partner. The rise in bilateral trade relations with PR China has made Malaysia the largest trading partner in South East Asia of PR China. Beyond Asia, Malaysia has also experienced growth in trade with Australia and New Zealand, as well as new markets such as those in the Middle East and Latin America.
The changing structure of Malaysia’s exports over the past decade can also be seen in the context of the concurrent rise of the emerging economies. It is projected that the emerging economies will grow twice as fast as the advanced economies and account for more than half of all global growth by 2025 In parallel with this development, a new global middle class is emerging in these countries, resulting in changes in the pattern of global consumption with the growing significance of consumption expenditure in emerging economies. This shift in global consumers is also transforming the patterns of global trade, with trade not only flowing from the advanced economies into emerging economies, but also increasingly among emerging economies. In response to these developments, the product composition and destination of Malaysia’s exports has also been shifting, with a greater focus on the emerging economies. These changes reduce the nation’s vulnerability as exports become less dependent on any specific product or economy. Figure 3 Malaysia's Export Destination 2013 (RM719.8 billion)
Source: MITI
OTHERS 28%
SINGAPORE 14%
PRC14%
JAPAN11%
USA 8%
THAILAND5%
INDONESIA5%
HONG KONG SAR4%
AUSTRALIA4%
ROK4%
INDIA4%
Imports
The structure of Malaysia’s imports has undergone major changes. The ratio of consumption goods to total imports has fallen from 28.5 per cent to 14.6 per cent between 1970 and 1996, while that of investment goods and intermediate goods have increased conversely. The changing structure of imports reflects the industrialization process, which in itself is highly import-dependent with increased demand for machinery and intermediate inputs.
In December 2013, Malaysia’s import value grew 14.8% from RM49.0 billion where the import volume index expanded 15.1% from 105.0 points. This expansion was mainly registered in miscellaneous transactions & commodities (+31.9%), mineral fuels (+18.6%), machinery & transport equipment (+16.8%) and beverages & tobacco (+14.8%). The import unit value index also increased 0.8% from 129.9 points, which was due to food (+4.9%), chemicals (+4.1%), mineral fuels (+4.0%) and miscellaneous manufactured articles (+3.3%).
46

Figure 4 Malaysia's Top 10 Imports 2013 in RM Billion
Other Products RM123.00b 18.9%
Electrical & Electronic Product RM179.62b
27.7%
Refined Petroleum Products RM71.82b
11.1%
Chemicals & Chemical Products RM55.86b
8.6%
Machinery,Appliances & Parts RM54.57b
8.4%
Transport Equipment RM42.40b 6.5%
Manufactures of Metal RM40.69b 6.3%
Iron & Steel Products RM26.08b 4.0%
Crude Petroleum RM21.87b 3.4%
Optical & Scientific Equipment RM17.69b
2.7%
Source: Matrade Nature of Imports
Malaysia imports commodities: electronics, machinery, petroleum products, plastics, vehicles, iron and steel products and chemicals. Its main import partners are: China, Japan, US, Singapore, Thailand, Indonesia, South Korea, Germany and Thailand. Figure 5 Malaysia Import Partners 2013
OTHERS 28%
PRC16%
SINGAPORE 12%
JAPAN9%
USA 8%
THAILAND6%
CHINESE TAIPEI5%
ROK5%
INDONESIA4%
GERMANY5%
VIETNAM3%
Source: MITI B. Balance of Payments
Malaysia’s external sector remained resilient in 2013 amid a challenging global economic and
financial environment. The overall balance of payments remained strong, as the current account surplus more than offset the net outflows in the financial account. In the first half of the year, the current account recorded a smaller surplus of RM11.2 billion, on account of a smaller trade surplus amid lower services and income deficits. The continued economic weakness in the advanced countries, slower-than-expected growth in regional economies and the lower prices of Malaysia’s key commodities resulted in a marked decline in Malaysia’s exports.
The services and income deficits narrowed due mainly to higher net travel receipts following stronger intra-regional tourism, and lower net primary income payments, reflecting higher profits of Malaysian companies investing abroad. In the second half of the year, the current account surplus widened to RM26.1 billion as export growth returned to positive territory, driven by higher demand across both manufactured products and commodities. This was further reinforced by the more
47

favorable prices of CPO and LNG relative to the first half of 2013. Growth in imports remained strong throughout the year, given the robust domestic demand. For the year as a whole, the current account registered a surplus of RM37.3 billion (2012: RM57.3 billion). Table 1Balance of Payments
2012 2013
+ - Net + - Net RM million
Goods1 703,152 577,538 125,614 690,867 588,191 102,677Services 117,007 131,010 -14,003 125,471 140,516 -15,045
Balance on goods and services 820,159 708,548 111,611 816,338 728,706 87,632Primary income 42,323 78,348 -36,024 47,453 82,643 -35,189
Compensation of employees 4,076 7,116 -3,040 4,400 8,259 -3,859Investment income 38,247 71,232 -32,985 43,053 74,384 -31,331
Secondary income 6,848 25,087 -18,239 7,337 22,506 -15,169Balance on current account 869,330 811,982
57,348871,128 833,855
37,273% Of GNI 6.3 3.9
Capital account 159 -48Financial account -23,037 -15,048
Direct investment -21,748 -4,080Assets -51,910 -40,622Liabilities 30,162 36,542
Portfolio investment 58,388 -2 ,766Assets -21,455 -31,901Liabilities 79,843 29,135
Financial derivatives 954 -101Other investment -60,632 -8,101 Official sector -1,702 -3,933
Private sector -58,930 -4,169Balance on capital and financial accounts -22,878 -15,096Errors and omissions -30,597 -7,528Of which: Foreign exchange revaluation gain (+) I loss (-) -7,686 18,611
Overall balance (surplus + I deficit -) 3,873 14,649Bank Negara Malaysia international reserves, net 2
RM million 427,204 441,853US D million 139,715 134,902Reserves as months of retained imports 9.5 9.5
1 Adjusted for valuation and coverage to the balance of payments basis 2 All assets and liabilities in foreign currencies have been revalued into ringgit at rates of exchange ruling on the balance
sheet date and the gain/loss has been reflected accordingly in the Bank’s account p Preliminary f Forecast Note: Numbers may not necessarily add up due to rounding Source: Department of Statistics, Malaysia and Bank Negara Malaysia C. External Debt Development
To further enhance efficiency in the management of corporate finance and access to more
competitive financing, flexibility was accorded for resident corporations to freely borrow in ringgit or foreign currency within a corporate group in Malaysia and from abroad. In tandem with the flexibility accorded for accessing offshore borrowing, resident corporations were also able to undertake effective asset and liability management through the well-developed domestic financial markets. An early detection mechanism of possible risks to monetary and financial stability has been put in place. In line with this, continuous emphasis is placed on having a well-functioning and robust debt monitoring system that covers the overall debt level, structure, maturity and debt-servicing obligations.
Malaysia’s external debt amounted to RM318.1 billion (USD95.8 billion) as at end 2013 (2012 RM252.8 billion), equivalent to 33.5% of GNI (2012: 27.9% of GNI). Higher medium- and long-
48

term external debt during the year mainly reflected the net drawdown of external borrowing by the public enterprises and the non-bank private sector. The Federal Government continued to register net repayment of external debt. The higher short-term external debt in 2013 was largely the outcome of the net drawdown of interbank borrowing, mainly for the management of foreign exchange liquidity positions. The appreciation of some major and regional currencies against the ringgit during the year also contributed to the higher external debt in ringgit terms. Overall, Malaysia’s external debt remained manageable. The debt profile continued to be skewed towards a longer maturity structure, with medium- and long-term debt accounting for 59.7% of total external debt. The international reserves of Bank Negara Malaysia increased by RM14.6 billion to RM441.9 billion at end-2013 (end 2012: RM427.2 billion). As at 28 February 2014, the reserves level amounted to RM427.6 billion (equivalent to USD130.6 billion), which is sufficient to finance 9 months of retained imports and is 3.3 times the short-term external debt. The international reserves held by the Bank remain usable and unencumbered.
Table 2 External Debt and Debt Servicing Items 2012 2013p
RM Million Medium and long-term debt
Gross borrowing 86,071 97,989 Repayment and prepayment 77,694 79,277
Net borrowing 7,859 20,246 Outstanding debt 159,788 189,967
Short-term debt: Outstanding debt 92,964 128,114
Total external debt 252,752 318,081 Total external debt (USD million) 81,715 95,796 %GNI 27.9 33.5 Annual change (%) -1.8 25.8 Currency composition (% share) 100 100
US dollar 68. 1 71.3 Japanese yen 6.1 4.9 Others 25.2 23.8
Total servicing (including short-term interest payment) Of which:
Medium- and long-term debt 82,976 84,061 Debt service ratio (% of exports of goods and services) Total debt 10.1 10.3
Medium and long-term debt 10.1 10.3 1 Excludes currency and deposits held by non-residents with resident banking institutions 2 Includes prepayment p Preliminary Note: Numbers may not necessarily add up due to rounding Source: Department of Statistics, Malaysia and Bank Negara Malaysia D. Foreign Direct Investment (FDI)
The financial account continued to experience sustained two-way flows involving cross-border
financial transactions by both residents and non-residents. The economy’s performance and growth prospects continued to support international investors’ confidence, leading to significantly higher inward direct investment flows. Foreign direct investment (FDI) inflows were fairly broad-based across sectors, with significant inflows into the manufacturing and mining sectors. Outward direct investment, however, moderated in tandem with the moderation in the growth outlook for regional economies. Malaysia’s deep capital markets and relatively favorable growth prospects remained attractive to foreign portfolio investors.
Malaysia attracted RM38.774 billion in Foreign Direct Investments (FDI) in 2013, an increase of 24 per cent compared with the RM31.116 billion recorded for 2012. This was despite the slow recovery and uncertain global economic conditions. The RM38.774 billion also exceeded the country's highest ever-recorded FDI of RM37.325 billion in 2011, by 3.9 per cent. The increase in FDI also compares favorably to the increases in Global FDI of 11 per cent, 6.2 per cent in developing countries, and 2.4 per cent in South East Asia, as reported by the United Nations Conference on Trade and Development (UNCTAD). All sectors of the economy registered increases in FDI inflows in 2013. Investments were mainly in the manufacturing (37.6 per cent) and services (28.8 per cent), as well as
49
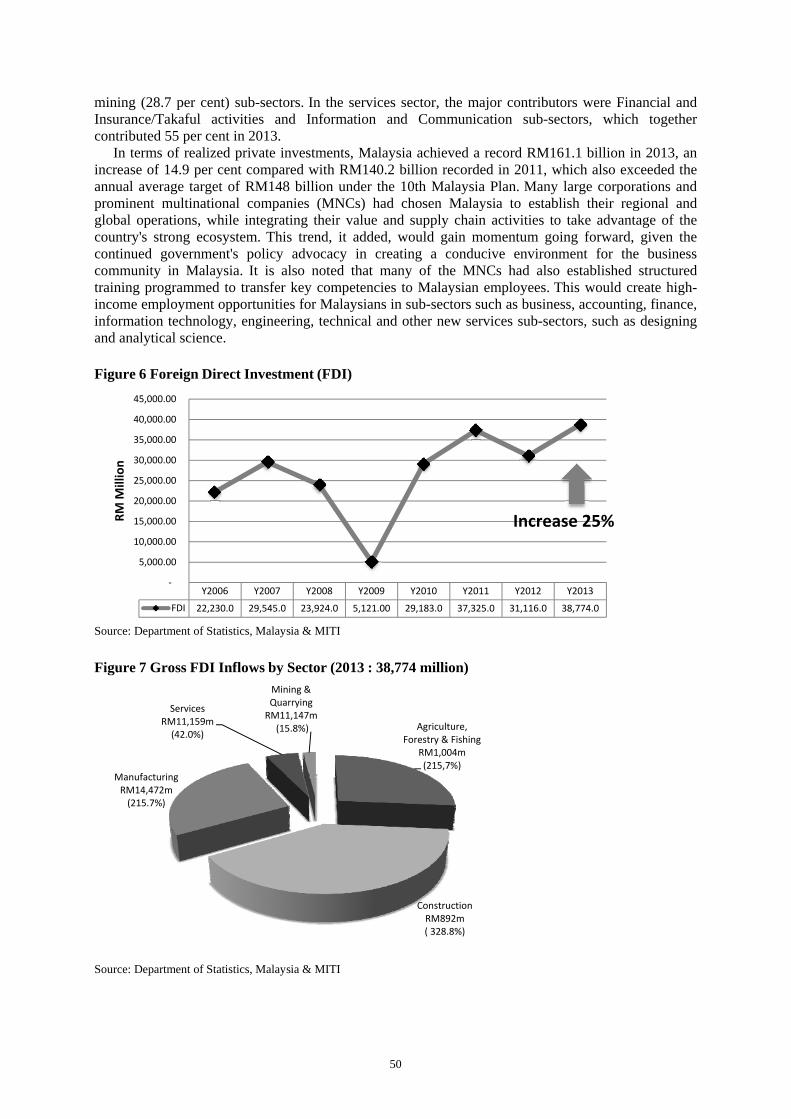
mining (28.7 per cent) sub-sectors. In the services sector, the major contributors were Financial and Insurance/Takaful activities and Information and Communication sub-sectors, which together contributed 55 per cent in 2013.
In terms of realized private investments, Malaysia achieved a record RM161.1 billion in 2013, an increase of 14.9 per cent compared with RM140.2 billion recorded in 2011, which also exceeded the annual average target of RM148 billion under the 10th Malaysia Plan. Many large corporations and prominent multinational companies (MNCs) had chosen Malaysia to establish their regional and global operations, while integrating their value and supply chain activities to take advantage of the country's strong ecosystem. This trend, it added, would gain momentum going forward, given the continued government's policy advocacy in creating a conducive environment for the business community in Malaysia. It is also noted that many of the MNCs had also established structured training programmed to transfer key competencies to Malaysian employees. This would create high-income employment opportunities for Malaysians in sub-sectors such as business, accounting, finance, information technology, engineering, technical and other new services sub-sectors, such as designing and analytical science. Figure 6 Foreign Direct Investment (FDI)
Source: Department of Statistics, Malaysia & MITI
Y2006 Y2007 Y2008 Y2009 Y2010 Y2011 Y2012 Y2013
FDI 22,230.0 29,545.0 23,924.0 5,121.00 29,183.0 37,325.0 31,116.0 38,774.0
‐
5,000.00
10,000.00
15,000.00
20,000.00
25,000.00
30,000.00
35,000.00
40,000.00
45,000.00
RM M
illion
Increase 25%
Figure 7 Gross FDI Inflows by Sector (2013 : 38,774 million)
Agriculture, Forestry & Fishing
RM1,004m (215,7%)
Construction RM892m ( 328.8%)
Manufacturing RM14,472m (215.7%)
Services RM11,159m (42.0%)
Mining & Quarrying RM11,147m
(15.8%)
Source: Department of Statistics, Malaysia & MITI
50
II.3 Domestic Environment A. Economic Growth Rate
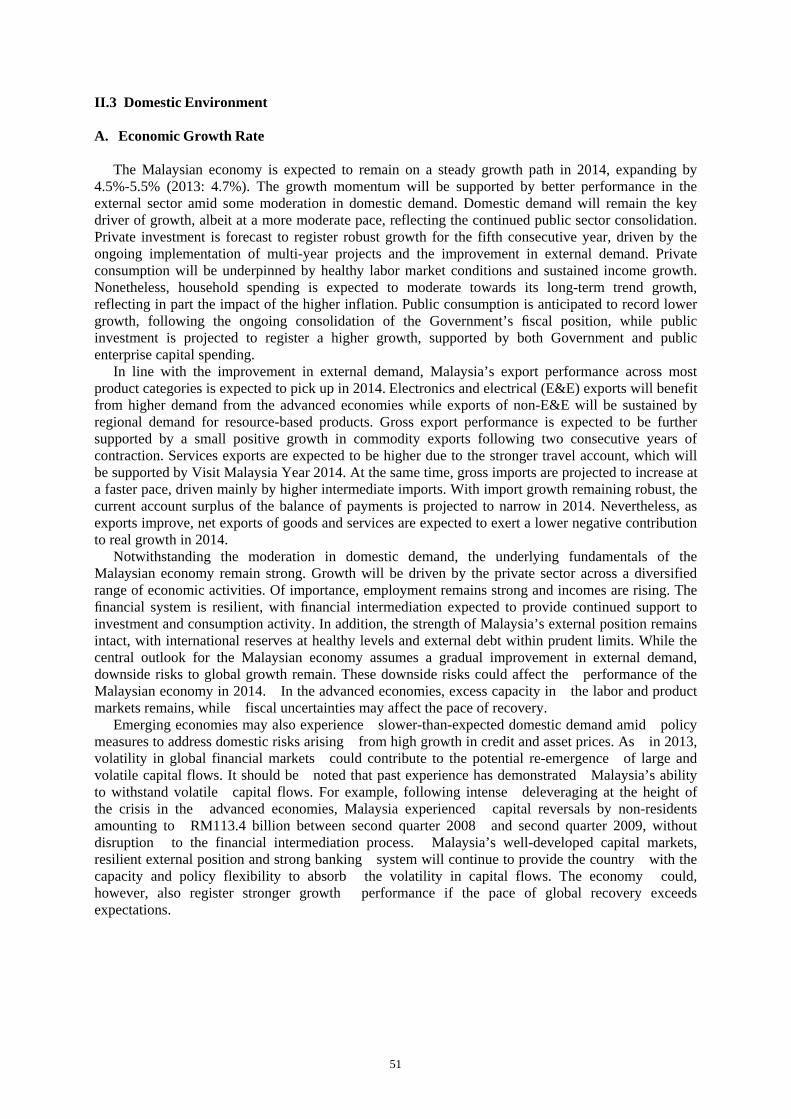
The Malaysian economy is expected to remain on a steady growth path in 2014, expanding by 4.5%-5.5% (2013: 4.7%). The growth momentum will be supported by better performance in the external sector amid some moderation in domestic demand. Domestic demand will remain the key driver of growth, albeit at a more moderate pace, reflecting the continued public sector consolidation. Private investment is forecast to register robust growth for the fifth consecutive year, driven by the ongoing implementation of multi-year projects and the improvement in external demand. Private consumption will be underpinned by healthy labor market conditions and sustained income growth. Nonetheless, household spending is expected to moderate towards its long-term trend growth, reflecting in part the impact of the higher inflation. Public consumption is anticipated to record lower growth, following the ongoing consolidation of the Government’s fiscal position, while public investment is projected to register a higher growth, supported by both Government and public enterprise capital spending.
In line with the improvement in external demand, Malaysia’s export performance across most product categories is expected to pick up in 2014. Electronics and electrical (E&E) exports will benefit from higher demand from the advanced economies while exports of non-E&E will be sustained by regional demand for resource-based products. Gross export performance is expected to be further supported by a small positive growth in commodity exports following two consecutive years of contraction. Services exports are expected to be higher due to the stronger travel account, which will be supported by Visit Malaysia Year 2014. At the same time, gross imports are projected to increase at a faster pace, driven mainly by higher intermediate imports. With import growth remaining robust, the current account surplus of the balance of payments is projected to narrow in 2014. Nevertheless, as exports improve, net exports of goods and services are expected to exert a lower negative contribution to real growth in 2014.
Notwithstanding the moderation in domestic demand, the underlying fundamentals of the Malaysian economy remain strong. Growth will be driven by the private sector across a diversified range of economic activities. Of importance, employment remains strong and incomes are rising. The financial system is resilient, with financial intermediation expected to provide continued support to investment and consumption activity. In addition, the strength of Malaysia’s external position remains intact, with international reserves at healthy levels and external debt within prudent limits. While the central outlook for the Malaysian economy assumes a gradual improvement in external demand, downside risks to global growth remain. These downside risks could affect the performance of the Malaysian economy in 2014. In the advanced economies, excess capacity in the labor and product markets remains, while fiscal uncertainties may affect the pace of recovery.
Emerging economies may also experience slower-than-expected domestic demand amid policy measures to address domestic risks arising from high growth in credit and asset prices. As in 2013, volatility in global financial markets could contribute to the potential re-emergence of large and volatile capital flows. It should be noted that past experience has demonstrated Malaysia’s ability to withstand volatile capital flows. For example, following intense deleveraging at the height of the crisis in the advanced economies, Malaysia experienced capital reversals by non-residents amounting to RM113.4 billion between second quarter 2008 and second quarter 2009, without disruption to the financial intermediation process. Malaysia’s well-developed capital markets, resilient external position and strong banking system will continue to provide the country with the capacity and policy flexibility to absorb the volatility in capital flows. The economy could, however, also register stronger growth performance if the pace of global recovery exceeds expectations.
51
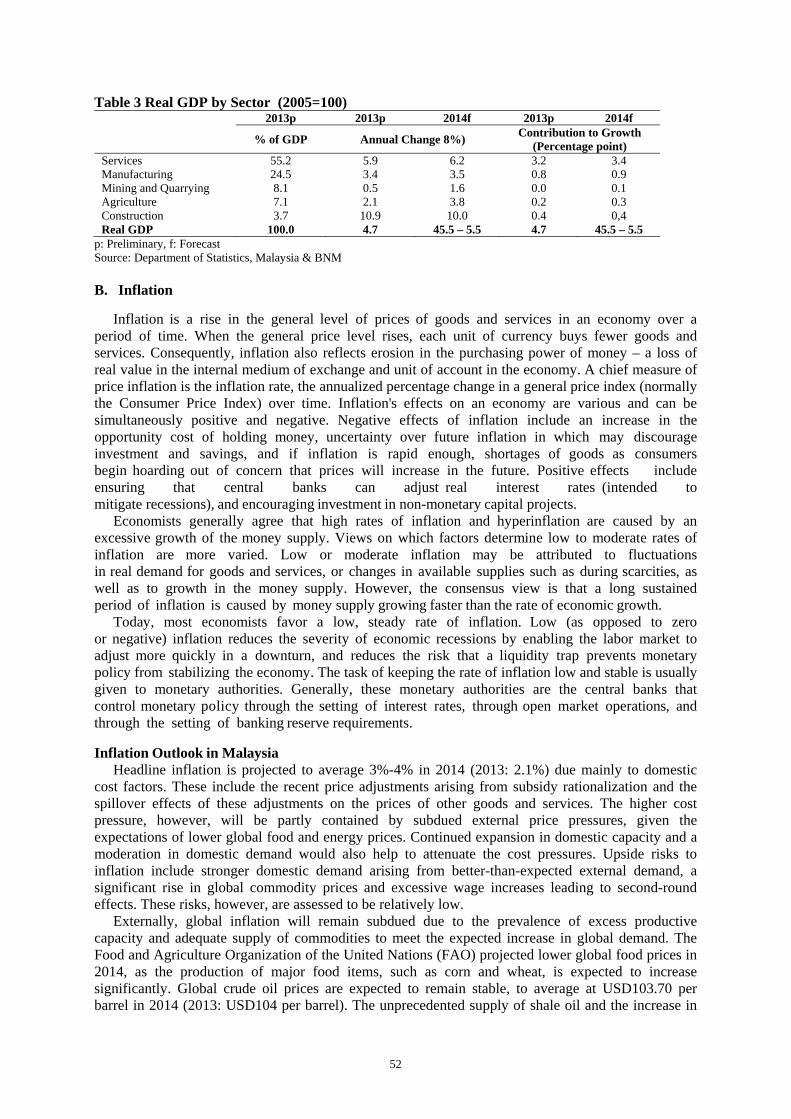
Table 3 Real GDP by Sector (2005=100) 2013p 2013p 2014f 2013p 2014f
% of GDP Annual Change 8%) Contribution to Growth (Percentage point)
Services 55.2 5.9 6.2 3.2 3.4 Manufacturing 24.5 3.4 3.5 0.8 0.9 Mining and Quarrying 8.1 0.5 1.6 0.0 0.1 Agriculture 7.1 2.1 3.8 0.2 0.3 Construction 3.7 10.9 10.0 0.4 0,4 Real GDP 100.0 4.7 45.5 – 5.5 4.7 45.5 – 5.5
p: Preliminary, f: Forecast Source: Department of Statistics, Malaysia & BNM B. Inflation
Inflation is a rise in the general level of prices of goods and services in an economy over a
period of time. When the general price level rises, each unit of currency buys fewer goods and services. Consequently, inflation also reflects erosion in the purchasing power of money – a loss of real value in the internal medium of exchange and unit of account in the economy. A chief measure of price inflation is the inflation rate, the annualized percentage change in a general price index (normally the Consumer Price Index) over time. Inflation's effects on an economy are various and can be simultaneously positive and negative. Negative effects of inflation include an increase in the opportunity cost of holding money, uncertainty over future inflation in which may discourage investment and savings, and if inflation is rapid enough, shortages of goods as consumers begin hoarding out of concern that prices will increase in the future. Positive effects include ensuring that central banks can adjust real interest rates (intended to mitigate recessions), and encouraging investment in non-monetary capital projects.
Economists generally agree that high rates of inflation and hyperinflation are caused by an excessive growth of the money supply. Views on which factors determine low to moderate rates of inflation are more varied. Low or moderate inflation may be attributed to fluctuations in real demand for goods and services, or changes in available supplies such as during scarcities, as well as to growth in the money supply. However, the consensus view is that a long sustained period of inflation is caused by money supply growing faster than the rate of economic growth.
Today, most economists favor a low, steady rate of inflation. Low (as opposed to zero or negative) inflation reduces the severity of economic recessions by enabling the labor market to adjust more quickly in a downturn, and reduces the risk that a liquidity trap prevents monetary policy from stabilizing the economy. The task of keeping the rate of inflation low and stable is usually given to monetary authorities. Generally, these monetary authorities are the central banks that control monetary policy through the setting of interest rates, through open market operations, and through the setting of banking reserve requirements.
Inflation Outlook in Malaysia Headline inflation is projected to average 3%-4% in 2014 (2013: 2.1%) due mainly to domestic
cost factors. These include the recent price adjustments arising from subsidy rationalization and the spillover effects of these adjustments on the prices of other goods and services. The higher cost pressure, however, will be partly contained by subdued external price pressures, given the expectations of lower global food and energy prices. Continued expansion in domestic capacity and a moderation in domestic demand would also help to attenuate the cost pressures. Upside risks to inflation include stronger domestic demand arising from better-than-expected external demand, a significant rise in global commodity prices and excessive wage increases leading to second-round effects. These risks, however, are assessed to be relatively low.
Externally, global inflation will remain subdued due to the prevalence of excess productive capacity and adequate supply of commodities to meet the expected increase in global demand. The Food and Agriculture Organization of the United Nations (FAO) projected lower global food prices in 2014, as the production of major food items, such as corn and wheat, is expected to increase significantly. Global crude oil prices are expected to remain stable, to average at USD103.70 per barrel in 2014 (2013: USD104 per barrel). The unprecedented supply of shale oil and the increase in
52

its production in the US, as well as stable production of crude oil by other major oil producers will be sufficient to accommodate the expansion in demand for oil. In addition, the easing of geopolitical risks in the Middle East will also reduce the risk of crude oil supply disruptions. In line with the subdued global commodity prices, inflationary pressures originating from Malaysia’s key import partners are also expected to be modest.
The more moderate external price pressures would help to alleviate the pressure on domestic production costs. Domestically, the upward adjustments to the prices of petroleum products and sugar, as well as higher excise duties on tobacco products, in the later part of 2013, together with the recent increase in electricity tariffs in January, will contribute to higher inflation in 2014. While these adjustments may also have some spillover effects on the prices of other goods and services, the magnitude of the spillovers is expected to be contains given that these adjustments were implemented during a period of low inflation and moderate demand conditions. The pressure on prices from domestic demand factors is also expected to be modest due to a slower increase in household spending and the slower real wage growth. Thus, while the economy is expected to grow at close to its potential (see box article on `Estimating Malaysia’s Potential Output´), it is not expected to result in significant domestic price pressures.
However, the upside risks to inflation remain. A better-than-expected recovery in the external demand would lead to stronger domestic demand. This could lead to higher demand-driven inflationary pressures that in turn could translate into higher spillovers across the economy. Global food and energy prices could also rise significantly should there be disruptions to the global supply of commodities, contributing to higher input costs and imported inflationary pressures. There is also the risk of second-round effects on inflation should inflation expectations increase disproportionately, accompanied by excessive wage increases that are not reflective of the improvements in productivity. However, based on available information, the current assessment is that the probability of these risks manifesting themselves is relatively low.
Inflation Rate In The Third Quarter 2014 The inflation rate, as measured by the annual change in the Consumer Price Index (CPI), averaged
lower at 3.0% in the third quarter (2Q 2014: 3.3%). The decline was mainly attributed to the lower inflation in the transport category (3.7%, 2Q 2014: 5.4%), reflecting the lapse in the impact of the price adjustment made in September 2013 for RON95 petrol and diesel. Inflation in the food and non-alcoholic beverages category also declined to 3.2% (2Q 2014: 3.5%). This was partly due to the lower cost of production in the poultry industry following the decline in the global price of corn. The Producer Price Index (PPI) recorded a slower growth of 0.9% on an annual basis in the third quarter (2Q 2014: 3.2%). This mainly reflected the decline in prices in the mineral, fuels and lubricants category following the moderation in global oil prices. Correspondingly, prices of commodity-related components increased at a slower pace of 0.9% (2Q 2014: 7.2%). Prices of non-commodity related components increased at a relatively stable rate of 1.0% during the quarter (2Q 2014: 1.2%). Prices of local and imported components grew by 1.0% and 0.8% respectively (2Q 2014: 4.2% and 1.0% respectively). Figure 8 Contribution to Consumer Price Inflation
Source: BNM
0.00% 2.00% 4.00% 6.00% 8.00% 10.00%
Consumer Price Index
Transport Category
Food & non alcoholic beverages
Producer Price Index (PPI)
Commodity‐related components
Non‐commodity related components
Local components
Imported components
3Q (2014)
2Q (2014)
53

C. Money Supply
Money Supply is the entire stock of currency and other liquid instruments in a country's economy as of a particular time. The money supply can include cash, coins and balances held in checking and savings accounts. Economists analyze the money supply and develop policies revolving around it through controlling interest rates and increasing or decreasing the amount of money flowing in the economy. Public and private sector analysis is performed because of the money supply's possible impacts on price level, inflation and the business cycle. An increase in the supply of money typically lowers interest rates, which in turns generates more investment and puts more money in the hands of consumers, thereby stimulating spending. Businesses respond by ordering more raw materials and increasing production. The increased business activity raises the demand for labor. The opposite can occur if the money supply falls or when its growth rate declines. M2 is a category within the money supply that includes M1 in addition to all time-related deposits, savings deposits, and non-institutional money-market funds. M2 is a broader classification of money than M1. Economists use M2 when looking to quantify the amount of money in circulation and trying to explain different economic monetary condition. Malaysia Money Supply (M0, M1, M2, M3)
Money Supply M0 in Malaysia decreased to RM65,928.13 million in October of 2014 from RM66,890.93 million in September of 2014. Money Supply M0, averaged RM26,355.52 million from 1970 until 2014, reaching an all time high of RM71,633.62 million in January of 2014 and a record low of RM1,000.20 million in December of 1970. Money Supply M1 in Malaysia increased to RM327,548.61 million in October of 2014 from RM322,962.38 million in September of 2014. Money Supply M1 in Malaysia averaged RM96,863.17 million from 1970 until 2014, reaching an all time high of RM332,313.92 million in January of 2014 and a record low of RM2,032.50 million in December of 1970.
Money Supply M2 increased to RM1,504,932.85 million in October of 2014 from RM1,480,702.70 million in September of 2014. Money Supply M2 averaged RM449,227.78 million from 1970 until 2014, reaching an all time high of RM1,504,932.85 million in October of 2014 and a record low of RM4,122.30 million in December of 1970. Money Supply M3 increased to RM151,6474.65 million in October of 2014 from RM149,3971.52 million in September of 2014. Money Supply M3 averaged RM505,870.73 million from 1973 until 2014, reaching an all time high of RM151,6474.million in October of 2014 and a record low of RM8,313.40 million in December of 1973.
Figure 9 Malaysia Money Supply
Source: Www.Tradingeconomics.Com & Central Bank Of Malaysia
02004006008001000120014001600
M0 M1 M2 M3 Sept (2014) 66.89 322.96 1,480.70 149.39
Oct (2014) 65.92 327.54 1,504.90 151.64
RM m
illion
D. Remittances
The remittance and money changing industry in Malaysia has grown significantly in the last
decade. Traditionally, remittance service in Malaysia was provided only by the banking institutions. With the growing importance and significance of remittance flows, in particular remittances abroad by foreign workers in the country and the objectives to increase access to formal
54

remittance channels, the Bank has liberalized the policy to allow non-bank players to provide remittance services. The number of non-bank remittance service providers had increased to 39 as at end 2010 from 3 as at end 2005, hence increasing the access points for remittance services. Consequently, total outward remittance through the formal channels had grown significantly by 119.7% to RM13.4 billion in 2010 (2005:RM6.1 billion). A more competitive environment in the remittance industry has also contributed towards enhancing services to consumers in terms of lower cost, faster speed and more extensive channels for remittance transactions.
The money-changing industry has evolved over time. Over the years, the money-changing industry has developed gradually as reflected in the increased total turnover of exchange transactions. As at end August 2011, the total turnover of the industry stood at RM17.7 billion, an increase of 49% from 2005. Presently, there are over 800 licensees operating at more than 1,000 premises. The remittance industry is regulated under the Exchange Control Act 1953 and the Payment Systems Act 2003. Specific legislation to regulate the money-changing industry, that is the Money-Changing Act 1998, was enacted in March 1998. Both industries are regulated by BNM. In addition to licensed money-changers which provide retail money changing services, Bank Negara Malaysia also regulates currency wholesalers. The main objective of regulation is to promote the protection of consumers though reliable, transparent and professional conduct in the provision of remittance and money-changing services, and preventing the industry from being used as a conduit for money laundering and terrorist financing.
In 2009, Bank Negara Malaysia initiated a review of the legal and regulatory framework for the money changing, remittance services and wholesale currency business industry in Malaysia, with the objective of modernizing the industry landscape, and strengthening safeguards to protect the integrity of the industry. The review culminated in the passing of the Money Services Business Act 2011 (MSB) in July 2011 which provides for the licensing, regulation and supervision of money changing, remittances and wholesale currency business under a single Act. Collectively, these businesses are described as money services business in the new landscape.
Remittance growth In 2013, two important outcomes of the enhanced regulatory and supervisory framework for money
services business are providing wider public access to money services through formal channels and improving the capture of money services business transactions. Substantial progress has been achieved on both counts as evidenced by higher outward remittances in 2013 totalling RM25.1 billion, an increase of 27% from RM19.7 billion recorded in 2012. Of this amount, remittance agents accounted for about RM1 billion involving 1.1 million transactions, reflecting greater access to authorised remittance channels through the broader branch and agent network. At the same time, the money changing business turnover expanded further by 22% to RM52 billion, compared to RM42.5 billion in 2012, largely due to improvements in record keeping systems.In the wholesale currency business sector, RM4.6 billion in domestic transactions were recorded in 2013, an increase of 35% from the RM3.4 billion reported in 2012.
This growth was supported by sustained demand for the exchange of foreign currencies, as well as the increasing presence of currency wholesalers throughout Malaysia which provided more reliable, efficient and cost-competitive services to meet the needs of licensed money changers for sourcing and clearing foreign currencies. The enlarged presence of currency wholesalers has also helped to reduce the risks associated with alternative means for obtaining foreign currency from questionable sources. The Malaysian Association of Money Services Business, which was launched in January 2014, is expected to complement the Bank’s efforts in driving and implementing initiatives to build capacity and raise standards of compliance and professionalism across the money services industry. The immediate priorities of the association are to develop a code of professional and ethical conduct for the industry; provide training and education on requirements under the relevant laws and sound business practices, including in respect of AML/CFT compliance; promote awareness among consumers of their responsibility to deal only with authorised money services providers; and facilitate constructive engagements with the Bank to achieve the consistent and effective implementation of regulatory requirements across the industry.
55
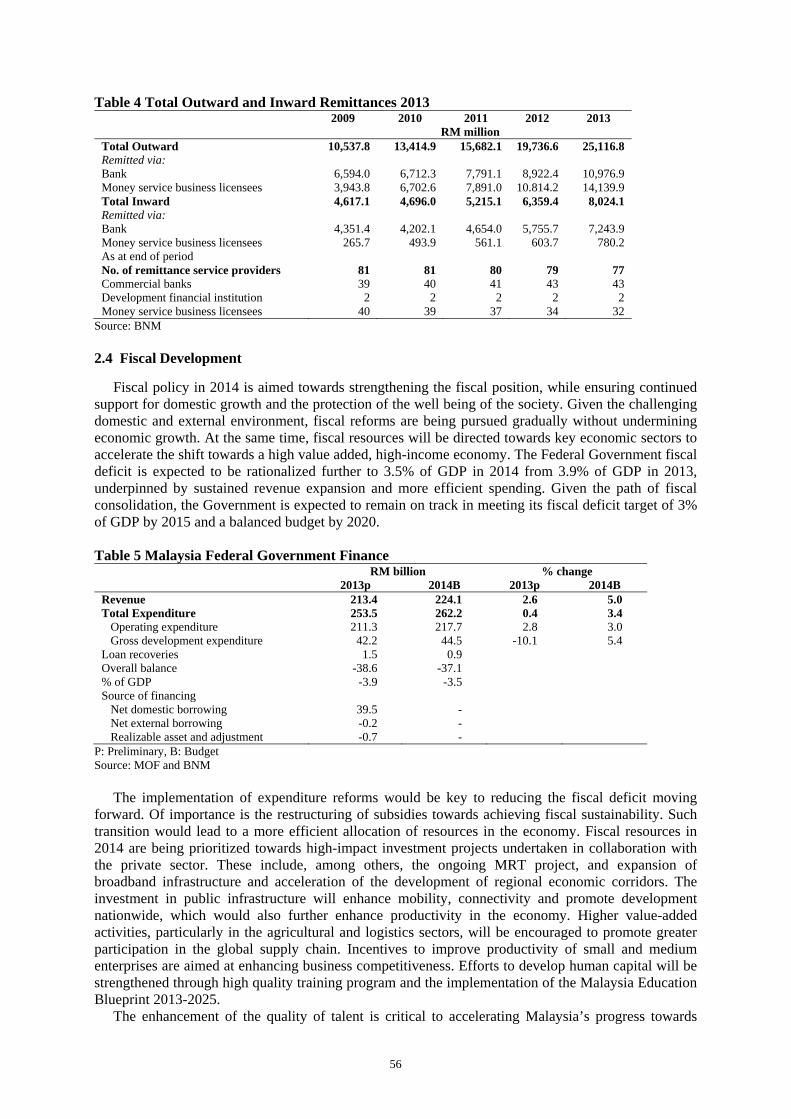
Table 4 Total Outward and Inward Remittances 2013 2009 2010 2011 2012 2013
RM million Total Outward 10,537.8 13,414.9 15,682.1 19,736.6 25,116.8 Remitted via: Bank 6,594.0 6,712.3 7,791.1 8,922.4 10,976.9 Money service business licensees 3,943.8 6,702.6 7,891.0 10.814.2 14,139.9 Total Inward 4,617.1 4,696.0 5,215.1 6,359.4 8,024.1 Remitted via: Bank 4,351.4 4,202.1 4,654.0 5,755.7 7,243.9 Money service business licensees 265.7 493.9 561.1 603.7 780.2 As at end of period No. of remittance service providers 81 81 80 79 77 Commercial banks 39 40 41 43 43 Development financial institution 2 2 2 2 2 Money service business licensees 40 39 37 34 32
Source: BNM 2.4 Fiscal Development
Fiscal policy in 2014 is aimed towards strengthening the fiscal position, while ensuring continued support for domestic growth and the protection of the well being of the society. Given the challenging domestic and external environment, fiscal reforms are being pursued gradually without undermining economic growth. At the same time, fiscal resources will be directed towards key economic sectors to accelerate the shift towards a high value added, high-income economy. The Federal Government fiscal deficit is expected to be rationalized further to 3.5% of GDP in 2014 from 3.9% of GDP in 2013, underpinned by sustained revenue expansion and more efficient spending. Given the path of fiscal consolidation, the Government is expected to remain on track in meeting its fiscal deficit target of 3% of GDP by 2015 and a balanced budget by 2020.
Table 5 Malaysia Federal Government Finance
RM billion % change 2013p 2014B 2013p 2014B
Revenue 213.4 224.1 2.6 5.0 Total Expenditure 253.5 262.2 0.4 3.4 Operating expenditure 211.3 217.7 2.8 3.0 Gross development expenditure 42.2 44.5 -10.1 5.4 Loan recoveries 1.5 0.9 Overall balance -38.6 -37.1 % of GDP -3.9 -3.5 Source of financing Net domestic borrowing 39.5 - Net external borrowing -0.2 - Realizable asset and adjustment -0.7 -
P: Preliminary, B: Budget Source: MOF and BNM
The implementation of expenditure reforms would be key to reducing the fiscal deficit moving forward. Of importance is the restructuring of subsidies towards achieving fiscal sustainability. Such transition would lead to a more efficient allocation of resources in the economy. Fiscal resources in 2014 are being prioritized towards high-impact investment projects undertaken in collaboration with the private sector. These include, among others, the ongoing MRT project, and expansion of broadband infrastructure and acceleration of the development of regional economic corridors. The investment in public infrastructure will enhance mobility, connectivity and promote development nationwide, which would also further enhance productivity in the economy. Higher value-added activities, particularly in the agricultural and logistics sectors, will be encouraged to promote greater participation in the global supply chain. Incentives to improve productivity of small and medium enterprises are aimed at enhancing business competitiveness. Efforts to develop human capital will be strengthened through high quality training program and the implementation of the Malaysia Education Blueprint 2013-2025.
The enhancement of the quality of talent is critical to accelerating Malaysia’s progress towards
56

being a high-income nation. Measures to promote affordable housing, quality healthcare services, security and public order, and environmental conservation will help to improve the quality of life and well-being of society. In June 2013, the Fiscal Policy Committee (FPC) was established to serve as the central policy-making committee for the formulation and implementation of fiscal strategies and giving due consideration to their impact on overall macro-economy. The objective is to have in place a holistic fiscal framework and the institutional mechanism for the successful implementation of reforms, including shifting towards a more broad-based tax system through the introduction of the Goods and Services Tax in April 2015 to ensure fiscal sustainability into the future.
A. Tax Revenue
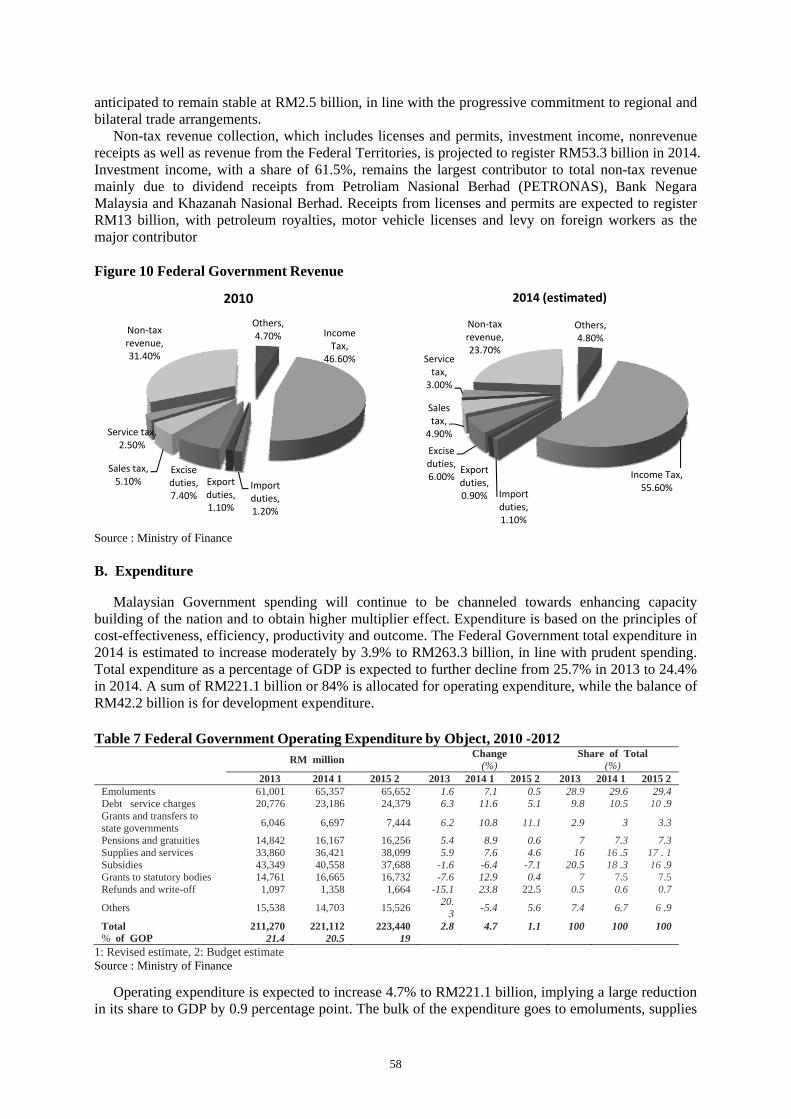
Tax revenue, with a share of 76.3% to total revenue, is estimated to grow 10.1% to RM171.8 billion and remains high at 15.9% of GDP (2013:15.8%). Meanwhile, non-tax revenue is expected to register RM53.3 billion. In addition, as the Government implements various measures to broaden the revenue base, the dependency on oil-related revenue will be reduced gradually. In 2014, oil-related revenue is expected to constitute 29.7% of total revenue compared with its peak at 41.3% in 2009. Table 6 Federal Government Revenue 2013-2015
RM million Change Share of Total (%) (%)
2013 20142 20153 2013 20142 20153 2013 20142 20153
Tax revenue 155,952 171,770 183,378 2.8 10.1 6.8 73.1 76.3 78Direct tax 120 , 523 133,148 135,646 3.1 10.5 1 .9 56.5 59.1 57.7of which: Companies 58,175 67 , 679 72,589 13.4 16.3 7.3 27.3 30.1 30.9
PITA1 29 , 753 28, 275 25, 600 -12.3 -5 -9.5 13.9 12.6 10.9Individuals 23, 055 26 , 746 26 , 553 0.3 16 -0.7 10.8 11.9 11.3Indirect tax 35, 429 38, 622 47 , 732 2.1 9 23.6 1 6.6 17.2 20.3of which:
Excise duties 12,193 13,442 13,717 0 10.2 2 5. 7 6 5.8Sales tax 10,068 10,986 2,734 6 9.1 -75.1 4.7 4.9 1.2Service tax 5,944 6,780 1,874 6.5 14.1 -72.4 2.8 3 0.8
GST 21'720 100 9.2Non-tax revenue 57,418 53,324 51,841 2 -7.1 -2.8 26.9 23.7 22
of which: Licences I permits 13, 418 13, 049 13,143 -1.1 -2.7 0 .7 6.3 5.8 5.6Investment income 35, 306 32 , 815 31 '144 -3.9 -7.1 -5.1 16.5 14 .6 13.2
Total revenue 213,370 225,094 235,219 2.6 5.5 4.5 100 100 100% of GOP 21.6 20.9 20
1: Petroleum income tax, 2: Revised estimate, 3: Budget estimates Source : Ministry of Finance
Direct tax, contributing 59.1% to total revenue, is estimated to increase 10.5% to RM133.1 billion
in 2014 (2013: 3.1%; RM120.5 billion) in tandem with the strong economic performance. Corporate income tax is anticipated to grow strongly by 16.3% to RM67.7 billion (2013: 13.4%; RM58.2 billion), anchored by an upsurge in business profits as well as higher tax compliance and auditing. Corporate income tax remains the largest component, representing 30.1% of total revenue. Similarly, individual income tax is expected to strengthen 16% to RM26.7 billion, underpinned by stable employment and wage growth. Revenue from petroleum income tax (PITA), which constitutes 12.6% of total revenue, is estimated to decline to RM28.3 billion due to moderating crude oil prices despite stable production. Other direct tax, which includes receipts from stamp duties and real property gains tax (RPGT), is expected to further strengthen. Receipts from stamp duties and RPGT are estimated to contribute RM7 billion and RM0.8 billion, respectively, reflecting high value of properties and strong economic activity during the year.
Indirect tax is envisaged to rise 9% to RM38.6 billion, with its share to total revenue increasing to 17.2% (2013: 16.6%). Excise duties are anticipated to expand 10.2% to RM13.4 billion (2013: RM12.2 billion) on account of higher sales of motor vehicles, cigarettes and alcoholic beverage. Collection from sales and service tax is expected to be higher at RM11 billion and RM6.8 billion, respectively, benefiting from the encouraging sales of motor vehicles and higher demand of telecommunication services, as well as increased tourist spending in conjunction with Visit Malaysia Year (VMY) 2014. In contrast, despite higher imports of goods, receipts from import duties are
57
anticipated to remain stable at RM2.5 billion, in line with the progressive commitment to regional and bilateral trade arrangements.
Non-tax revenue collection, which includes licenses and permits, investment income, nonrevenue receipts as well as revenue from the Federal Territories, is projected to register RM53.3 billion in 2014. Investment income, with a share of 61.5%, remains the largest contributor to total non-tax revenue mainly due to dividend receipts from Petroliam Nasional Berhad (PETRONAS), Bank Negara Malaysia and Khazanah Nasional Berhad. Receipts from licenses and permits are expected to register RM13 billion, with petroleum royalties, motor vehicle licenses and levy on foreign workers as the major contributor
Figure 10 Federal Government Revenue
Source : Ministry of Finance
Others, 4.70% Income
Tax, 46.60%
Import duties, 1.20%
Export duties, 1.10%
Excise duties, 7.40%
Sales tax, 5.10%
Service tax, 2.50%
Non‐tax revenue, 31.40%
2010
Others, 4.80%
Income Tax, 55.60%
Import duties, 1.10%
Export duties, 0.90%
Excise duties, 6.00%
Sales tax, 4.90%
Service tax, 3.00%
Non‐tax revenue, 23.70%
2014 (estimated)
B. Expenditure
Malaysian Government spending will continue to be channeled towards enhancing capacity building of the nation and to obtain higher multiplier effect. Expenditure is based on the principles of cost-effectiveness, efficiency, productivity and outcome. The Federal Government total expenditure in 2014 is estimated to increase moderately by 3.9% to RM263.3 billion, in line with prudent spending. Total expenditure as a percentage of GDP is expected to further decline from 25.7% in 2013 to 24.4% in 2014. A sum of RM221.1 billion or 84% is allocated for operating expenditure, while the balance of RM42.2 billion is for development expenditure. Table 7 Federal Government Operating Expenditure by Object, 2010 -2012
RM million Change
Share of Total
(%) (%) 2013 2014 1 2015 2 2013 2014 1 2015 2 2013 2014 1 2015 2
Emoluments 61,001 65,357 65,652 1.6 7.1 0.5 28.9 29.6 29.4Debt service charges 20,776 23,186 24,379 6.3 11.6 5.1 9.8 10.5 10 .9Grants and transfers to state governments 6,046 6,697 7,444 6.2 10.8 11.1 2.9 3 3.3
Pensions and gratuities 14,842 16,167 16,256 5.4 8.9 0.6 7 7.3 7.3Supplies and services 33,860 36,421 38,099 5.9 7.6 4.6 16 16 .5 17 . 1Subsidies 43,349 40,558 37,688 -1.6 -6.4 -7.1 20.5 18 .3 16 .9Grants to statutory bodies 14,761 16,665 16,732 -7.6 12.9 0.4 7 7.5 7.5Refunds and write-off 1,097 1,358 1,664 -15.1 23.8 22.5 0.5 0.6 0.7
Others 15,538 14,703 15,526 20.3 -5.4 5.6 7.4 6.7 6 .9
Total 211,270 221,112 223,440 2.8 4.7 1.1 100 100 100% of GOP 21.4 20.5 19
1: Revised estimate, 2: Budget estimate Source : Ministry of Finance
Operating expenditure is expected to increase 4.7% to RM221.1 billion, implying a large reduction in its share to GDP by 0.9 percentage point. The bulk of the expenditure goes to emoluments, supplies
58

and services, subsidies and debt service charges. Emoluments is the largest component constituting 29.6% of operating expenditure, is estimated to expand 7.1% to RM65.4 billion (2013: RM61 billion). Factors contributing to the increase include provision for an annual salary increment as well as a half-month bonus for 2013 and special financial assistance of RM500. Outlays on supplies and services are envisaged to register a growth of 7.6% to RM36.4 billion (2013: 5.9%; RM33.9 billion), mainly for maintenance and repairs, rentals, utilities and payments for professional and technical services. In consonance with administrative measures to rein in discretionary spending, cost-cutting initiatives have been implemented, which include reducing utility bills, travel, food and beverage expenses as well as optimizing the usage of government owned training facilities and existing office space to reduce rental charges. Nevertheless, such measure will not compromise the quality of public service delivery. C. Financing
The Federal Government gross borrowings are projected to be lower in line with the consolidation
measures as reflected in smaller deficit financing requirements. Borrowings are mainly to finance development expenditure, a strict rule observed by the Government. Given the ample liquidity in the financial market, funding requirements will be raised through domestic sources and are not expected to crowd out the private sector. In 2014, gross borrowings are expected to amount to RM84.7 billion with RM84.5 billion raised from domestic sources. After taking into account RM47.6 billion for redemption of existing loans, the net borrowing of RM37.1 billion will be used to finance the deficit. Table 8 Federal Government Financing, 2013 -2014
RM million Share(%)
2013 2014 2 2013 2014 2 Gross borrowings 100,870 84,687 100. 0 100
Domestic 100, 457 84,500 99.6 99.8Glls 41 ,000 33,500 40 .7 39.6MGS 59, 457 51 ,000 58 .9 60.2
External 413 187 0.4 0.2 Market loans - - - - Project loans 413 187 0 . 4 0.2
Repayments 61,565 4 7,556 100. 0 100Domestic 60,931 46,943 99 .0 98.7External 634 613 1 .0 1.3
Net borrowings 39,305 37,131 - -Domestic 39,526 37 ,557 - -External -221 -426 - -Change In assets1 -721 160 - -Total financing needs 38,584 37,291 - -
1 (+) indicates a drawdown of assets, 2 Estimate Source: Ministry of Finance
In 2014, RM51 billion will be raised through the issuance of Malaysian Government Securities (MGS) and RM33.5 billion through Government Investment Issues (GIIs). MGS remains the largest source of funding at 60.4% of total gross domestic borrowings. The issuance of GIIs has steadily increased in recent years as a result of growing demand for high-quality Shariah compliant debt papers. GIIs now account for 39.6% of gross domestic borrowings compared to below 20% prior to the global economic crisis in 2008. MGS and GIIs papers are expected to be raised through open tenders to leverage on the low interest rate and ample liquidity in the market as well as further develop a deep and stable capital market.
The gross borrowing of MGS will be raised through new issuances and re-opening of existing papers amounting to RM51 billion, of which RM26.4 billion will be used for repayment of matured papers. In response to market demand for longer maturity sovereign debt papers, four MGS with maturity of more than 10 years have been issued. The coupon rates of new MGS issuances ranged from 3.394% to 4.181% during the first eight months of 2014. Meanwhile, GIIs raised in 2014 will constitute a mixture of a new issuance and re-opening of existing GIIs amounting to RM33.5 billion.
59

To meet niche demand for longer-dated issues and to further develop the Islamic capital market, five issuances with longer-dated papers of 10 to 20 years have been issued. Gross offshore borrowing for 2014 will continue to decline in the absence of new external issuance envisaged for the year. A sum of RM187 million is expected to be drawn down from bilateral (RM184 million) and multilateral sources (RM3 million) to finance ongoing projects and programmed related to higher education, research and training as well as raw water transfer. D. Debt
The Government will ensure that its debt level remains manageable through the implementation of
sound macroeconomic policies, adherence to fiscal rules and regulations as well as prudent debt management strategies. As at end-June 2014, the Federal Government debt registered RM568.9 billion mainly due to higher domestic debt issuance to meet financing requirements. Of this, the debt which is raised domestically accounted for 97.1% or RM552.7 billion with MGS and GIIs constituting 91.1%, while the offshore borrowing amounted to RM16.2 billion. The major holders of MGS and GIIs include banking institutions (27.5%), Employees Provident Fund (21.8%), and insurance companies (6.2%) while the foreign holdings have increased to 30.5%.
The healthy demand from external investors is due to them seeking safe-haven and better quality debt instruments which give higher yields, amid excess liquidity and volatility in the global financial market. The growing foreign presence in the capital market also reflects confidence in Malaysia’s macroeconomic fundamentals and growth prospects. Hence, the Federal Government debt stood at 52.8% of GDP as at end-June 2014, within the prudent and manageable level of 55% of GDP. Despite the increasing debt level, the Government will ensure its commitments to debt servicing will be met accordingly. Debt service charges, which refer to interest payments on loans, are expected to remain manageable at 10.3% of revenue (2013: 9.7%), well below the threshold of 15% of total revenue under the administrative fiscal rules. Table 9 Malaysian Government Debt 2013-2014
RM million Share of Total Share of GOP % %
2013 20141 2013 20141 2013 20141 Domestic debt 523,095 552,652 96.9 97.1 53 51.3Treasury bills 4,320 4,320 0.8 0.7 0.4 0.4Glls 172,500 188,000 32.0 33 .0 17.5 17.4MGS 305,075 315,532 56.5 55. 5 30.9 29.3Housing Loan Fund 41,200 44,800 7.6 7 .9 4 .2 4.2Offshore borrowing 16,763 16,241 3.1 2.9 1 .7 1.5Market loans 10,791 10,545 2.0 1.9 1.1 1.0Project loans 5,971 5,696 1.1 1.0 0.6 0.5Total 539,858 568,893 100 100 54.7 52.8Memorandum item: Non-resident holdings of ringgit-
denominated 141,669 155,619 26.2 27 4 14.4 14.4
Government debt securities 1 End june 2014 Source : Ministry of Finance
Following the redefinition of external debt, Malaysia’s external debt will now comprise offshore borrowing by the Federal Government, public enterprises and the private sector as well as non-resident holdings of ringgit denominated debt securities, non-resident deposits, trade credit provided by foreign trade counterparts and other debt liabilities. As at end-June 2014, the newly-defined external debt stood at RM729 billion or 67.6% of GDP, of which public sector offshore borrowing accounted for only 9.2% of GDP while the private sector, 21.9% of GDP and non-resident holdings of ringgit-denominated debt securities, deposits and trade credit, 36.5% of GDP.
The higher external debt was attributed mainly to larger offshore borrowing by the private sector and non-resident holdings of ringgit-denominated debt securities and deposits. Offshore borrowing accounted for RM335.6 billion or 46% of total external debt as at end-June 2014. The increase was contributed by higher net borrowing of medium and long-term debt by the non-bank private sector as
60

well as the public enterprises, while Federal Government offshore debt remains unchanged at RM16.2 billion. On the other hand, the increase in short-term offshore borrowing was due to higher interbank borrowing activities. As at end-June 2014, the debt service ratio for offshore borrowing, which measures the principle and interest repayment of the loan to gross exports of goods and services, stood at 8.3%.
The non-resident holdings of ringgit-denominated debt securities issued by the Federal Government and other corporations increased to RM243 billion as at end-June 2014, on account of large holdings of medium and long-term debt securities. The increased holding of medium and long-term debt papers indicates investor confidence in the domestic economy together with the higher yields of these maturities, as well as reflects the deeper, more open and vibrant domestic financial markets. Of significance, the strong capacity of domestic institutional investors, resilient financial institutions, well developed capital markets as well as ample international reserves, are able to absorb any reversal of capital flows and financial market shocks. Table 10 Malaysian External Debt 2013-2014
RM million Share of Total Share of GOP % %
2013 20143 2013 20143 2013 20143 Offshore borrowing 324,088 335,572 46.5 46 32.8 31.1
Medium and long-term debt 195,986 204,816 28.1 28.1 19.9 19.0Public sector 98,904 98,662 14.2 13.5 10.0 9.2
Federal Government 16,763 16,241 2.4 2.2 1.7 1 .5Public enterprises 82,141 82,421 11.8 11 . 3 8 . 3 7.7
Private sector 97,082 106,154 13.9 14 .6 9 .8 9 .8Short-term debt 128,102 130,756 18.4 17 .9 13 .0 12 . 1
Non-resident holdings of ringgit denominated debt securities 229,674 243,002 33 33.4 23.3 22.5Medium and long-term debt 151,100 167,250 21.7 23 15.3 15.5
Federal Government 140,397 154,282 20.2 21 . 2 14.2 14 . 3Others1 10,703 12,968 1.5 1 .8 1 . 1 1 . 2
Short-term debt 78,574 75,752 11.3 10 .4 8. 0 7. 0Non-resident deposits 77,325 86,186 11.1 11.8 7.8 8Others2 65,523 64,274 9.4 8.8 6.7 6Total 696,610 729,034 100 100 70.6 67.6
1 Includes private sector & public enterprise, 2 Comprise trade credits, IMF allocation, 3 End June 2014 Source : Ministry of Finance
61
III. Tax Structure: Institutions and Reality III.1 Inland Revenue Board of Malaysia (IRBM)
The Inland Revenue Board of Malaysia (IRBM) is one of the main revenue collecting agencies of the Ministry of Finance. IRBM was established in accordance with the Inland Revenue Board of Malaysia Act 1995 to give it more autonomy especially in financial and personnel management as well as to improve the quality and effectiveness of tax administration. The Department of Inland Revenue Malaysia became a board on March 1, 1996, and is now formally known as IRBM.
A. Responsibilities of IRBM IRBM is responsible for the administration of the following laws:
a. Income tax Act 1967; b. Petroleum Act (Income Tax) 1967; c. Real Property Gains Tax Act 1976; d. Stamp Act 1949; e. Labuan Offshore Business Activity Tax Act 1990; f. Promotion of Investment Act 1986.
IRBM must comply with all Double Taxation Agreements (DTAs) signed by the Malaysian Government with governments of foreign countries. In addition, IRBM must comply with all regulations related to the administration of IRBM:
a. Federal Constitution 1957; b. Interpretation Act 1948 and 1967; c. Limitation Act 1953; d. Courts of Judicature Act 1964; e. Companies Act 1965; f. Bankruptcy Act 1967; g. National Land Code 1965; h. Criminal Procedure Code (Act 593); i. Penal Code (Act 574); j. Company Winding-Up Rules 1965; k. Rules of the High Court 1980; and l. Subordinate Courts Rules 1980
IRBM also continues to administer several repealed legislation to resolve outstanding cases from previous years:
a. Estate Duty Enactment 1941; and b. Share Transfer Tax Act (Land based Companies) 1984
B. Members of the Inland Revenue Board of Malaysia A board member was appointed to check the function and objective of IRBM. The member is regulated by the following Board Members:
a. The Secretary General of Malaysian Treasury cum IRBM Chairman; b. Attorney General or its representative; c. Director General of Public Services or its representative; d. Two other individuals appointed by the Finance Minister to represent the government; and e. Two other individuals appointed by the Finance Minister from the private sector.
C. Functions of the Board
a. To act as agent of the Government and to provide services in administering, assessing,
collecting and enforcing payment of income tax, petroleum income tax, real property gains
62

tax, estate duty, stamp duties and such other taxes as may be agreed between the Government and the Board.
b. To advise the Government on matters relating to taxation and to liaise with the appropriate Ministries and statutory bodies on such matters;
c. To participate in or outside Malaysia in respect of matters relating to taxation; d. To perform such other functions as are conferred on the Board by any other written law; e. May act as a collection agent for and on behalf of any body for the recovery of loans due for
repayment to that body under any written law. D. Powers of the Board
a. To enter into contracts; b. To utilise all property of the Board, movable and immovable, in such manner as the Board
may think expedient including the raising of loans by mortgaging such property; c. To engage in any activity, either alone or in conjunction with other organisations or
international agencies, to promote better understanding of taxation; d. To provide technical advice or assistance, including training facilities, to tax authorities of
other countries; e. To impose fees or charges for services rendered by the Board; f. To grant loans to employees of the Board for any purpose specifically approved by the
Board; g. To provide recreational facilities and promote recreational activities for, and activities
conducive to, the welfare of employees of the Board; h. To provide training for employees of the Board and to award scholarships or otherwise pay
for such training; and i. To do anything incidental to any of its powers.
Figure 12 Organisation Chart
Source : Inland Revenue Board Of Malaysia
63
III.2 Tax Specific Analysis III.2.1. Income Tax (PAYE) A. Background
The self-assessment system (SAS) for individuals (include salaried individual and sole proprietors) and for partnership was implemented with effect from YA2004 following the release of the Income Tax (Amendment) Act 2002. Under SAS, which is based on the concept of ‘File and Pay’, individuals are required to:
a. File their completed income tax return forms to the IRB together with the payment of the balance of tax payable (if any).
b. Pay their income tax liability through monthly salary deductions for salaried individuals or through bimonthly installments for individuals having business income.
B. Estimate of Tax For individuals other than salaried individuals, the IRB may issue a prescribed form (Form
CP500) setting out the estimate of tax payable (ETP) under an installment scheme. ETP is determined by the IRB based on the tax assessed in the preceding year. The taxpayer is required to pay the ETP in 6 bi-monthly installments as directed by the IRB commencing from the month of March. Each installment payment accompanied by a remittance slip (Form CP501) must be paid to the IRB within 30 days from the due date. For salaried individuals, income tax will continue to be deducted through the monthly salary deductions under the Monthly Tax Deduction (MTD) scheme.
C. Variation of installments
Every individual under an installment payment scheme may apply to revise the installment payments not later than 30 June of the relevant year by submitting the Form CP502. The IRB will issue a revised notice of installment payments (Form CP503) if the application is successful, setting out the revised installment payments. Where the revised estimate exceeds the amount of installment paid to date, the difference shall be payable in the remaining months of the installment scheme. In addition, if the revised estimated tax for a year of assessment is less than RM300, the individual is allowed to stop the subsequent payment starting from the date of submission of the Form CP502.
D. Penalty provisions a. Late payment of installment: Where any installment due and payable on the date specified
by the IRB has been paid within 30 days from the due date, a penalty of 10% shall be imposed on the amount unpaid without any further notice.
b. Difference between revised estimate submitted and final tax liability: When the tax payable excluding tax attributable to employment income, if any, exceeds the revised estimate (if a revision is submitted) by an amount exceeding 30% of the tax payable, the difference exceeding the 30% will be subject to a penalty of 10%.
E. Filling of Tax Returns Every individual who: a. Has chargeable income for a year of assessment ;or b. Has no chargeable income for that year of assessment but:
i. has chargeable income for the year of assessment immediately preceding that year of assessment; or
ii. has furnished a return for the immediately preceding year; or iii. has been required to furnish a return (but failed to furnish a return) for the
immediately preceding year, Must file a tax return to the Director General by 30 April of the following year unless that
individual with no chargeable income receives a waiver from the Director General or has business income. The tax-filing deadline for a person carrying on a business, such as sole proprietor, partnership, club association and Hindu joint family, is 30 June of the following year. Under SAS, no
64

supporting documents need to be submitted to the IRB, but should be kept for the purpose of tax audit. The taxpayer also has to indicate whether he/she has complied with the Public Ruling issued by the IRB. In cases where the taxpayer receive dividend income which results in a tax repayable position HK-3 (Helaian Kerja 3) should be submitted together with the return. Effective YA2008, the original dividend vouchers are not required to be submitted to the IRB.
An individual and his/ her spouse are required to file separate income tax return forms regardless of whether tax return forms are filed on a separate or combined assessment basis. The tax return furnished by the taxpayer is deemed to be a notice of assessment and the notice of assessment and the notice are deemed to be issued on the day the return is submitted to the IRB. Any balance of tax payable after taking into account the installment payment made via the installment payment scheme or salary deductions, if any, would have to be remitted to the IRB by 30 April/ 30 June of the following year.
With effect from YA2012, to further enhance the e-Filing system in line with current technological advance, it is proposed that:
a. Individual taxpayers are allowed to furnish tax returns through e-Filing via mobile devices; and
b. Information on total income, Monthly Tax Deduction, Employees Provident Fund contributions, insurance and zakat are pre-filled by the IRB for salaried taxpayer using the e-Filing system information must be submitted by their employers to the IRB.
With effect from YA 2013, taxpayers who file income tax returns before the expiry of the stipulated due date will be given compensation of 2% p.a on the amount of tax refunded late by the IRB computed on a daily basis commencing 1 day:
a. After 90 days from the due date for e-Filing; and b. 120 days from the due date for manual tax filing.
F. Amendment to the self-assessed return
A new provision has been gazette in the Income Tax Act 1967 (ITA 1967) effective from YA 2009 to allow taxpayers to make self amendments for additional assessment under the following conditions:
a. Amendments allowed are in respect of errors resulting in increased assessments. b. Self-amendments be allowed only once for each year of assessment. c. Self amendment be allowed within a period of 6 months from the due date of furnishing
the tax forms d. Taxpayer makes self-amendment in specified forms.
G. Penalty provisions
a. Failure to submit a tax return Failure to submit a tax return will constitute an offence under the Act and upon conviction; the taxpayer will be liable to a fine ranging from RM200 to RM2,000 or to imprisonment for a term not exceeding 6 months or both. The IRB is allowed to impose a penalty of up to 3 times the amount of tax and/or additional tax payable if no prosecution action is taken against the taxpayer. As a matter of practice, with effect from 1 October 2011, the IRB will impose penalties ranging from 20% to 35% of the tax payable for late filing of tax returns.
b. Failure to remit tax payable
Failure to remit the balance of tax payable by 30 April/ 30 June of the following year will attract a penalty of 10%. A further 5% penalty will imposed on any balance remaining unpaid after 60 days.
c. Under declaration of income or excessive claim on deduction or expenses.
A taxpayer who makes a self-assessment within 6 months from the due date of furnishing the return will not be subject to a penalty for under-declaration of income or excessive claim on deduction or expenses. However, he/she will be subject to a late payment penalty equivalent
65

to the penalty imposed on a taxpayer who files a correct return but defaults in paying tax due within the stipulated period.
III.2.2. Corporate Tax
A. Background Following the announcement of the 1999 Budget and the subsequent release of the Income Tax
(Amendment) Act 2002, the official assessment system was changed to the self-assessment system. The effective years of self-assessment system are as follows:
a. Companies – effective year is 2001 b. Business, partnership and co-operatives – effective year is 2004 c. Salaried individual - effective year is 2004
Under the self- assessment system, the burden of computing the taxpayer’s liability is shifted from the Inland Revenue Board (IRB) to the taxpayer and accordingly, taxpayers are expected to compute their tax liability based on the tax laws, guidelines and ruling issued by the IRB. The tax returns submitted will no longer be subject to a detailed review by the IRB.
The main objective of the self-assessment system is to inculcate a practice of voluntary compliance by the taxpayers and at the same time reduce the workload of the IRB to enable them to concentrate on areas in which have a high tax risk and a potentially significant loss in revenue. The implementation of the self-assessment system has also resulted in changes to the tax compliance cycle and the penalty provisions. These changes are explained in greater detail below.
B. Estimate of tax payable and payment of installment-company
Estimate of tax Under the self-assessment system, every company is required to determine and submit in a
prescribed form (Form CP204) an estimate of its tax payable for a year of assessment, 30 days before the beginning of the basis period. However when a company first commences operations (’i.e. during the first basis period), the estimate of tax payable must be submitted to the IRB within 3 months from the date of commencement of its business and thereafter no later than 30 days before the beginning of the basis period.
The estimate of tax payable submitted for a particular year cannot be less than the revised estimate or the estimate of tax payable (if no revised estimate was submitted) for the immediately preceding year of assessment. With effect from Y/A 2006 and subsequent years, the estimate of tax payable for that year cannot be less than 85% of the revised estimate of tax payable for the immediate preceding year of assessment or if no revised estimate is furnished, cannot be less than 85% of the estimate of tax payable for immediate preceding year of assessment.
A company is still required to submit the prescribed Form CP204 within the stipulated deadline even if it expects its estimate of tax payable to be NIL. With effect from YA 2008, where a SME first commences operations in a year of assessment, the SME is not required to furnish an estimate of tax payable or make installment payments for a period of 2 years beginning from the year of assessment in which the SME commences operations. With effect from YA 2011, where a company first commence operations in a year of assessment and the basis period for that year of assessment is less than 6 months, that company is not required to furnish an estimate of tax payable or make installment payment for that year of assessment.
A SME which is exempted from furnishing an estimate of tax payable mentioned above is advised to submit the prescribed Form CP204 notifying the IRB of its SME status without having to state the amount of estimate of tax payable for that particular year of assessment to avoid any penalty under-estimation of tax or penalty for non-submission being wrongly imposed by the IRB.
Installment payment scheme (s. 107 of the Income Tax Act 1967 (ITA 1967))
When the estimate of tax payable has been submitted to the IRB, the company is required to remit this amount to the IRB in equal monthly installments according to the number of months in its basis period. For example, if a company has a 12-month basis period, the estimate of tax payable must be paid over a 12-month installment scheme. Each month installment is due and
66

payable to the IRB by the 10th day of the following month. For example, the January installment will be due for payment by the 10th of February and so forth. However, where a company first commences operations (i.e. during the first basis period); its first installment will commence from the 6th month of the basis period.
Revision of estimate of tax payable Under s. 107C(7) of the ITA 1967, every company is allowed to revise its estimate of tax payable
by submitting a Form CP204A in the 6th month and/or 9th month of its basis period from Y/A
2003onwards. Where the revised estimate exceeds the amount of installments paid to date, the difference shall be payable in the remaining months of the installment scheme. Conversely, when installments paid to date exceed the revised estimate, the company may discontinue its original installment scheme. For Y/A 2001 only, the IRB has granted an administrative concession to companies allowing them to revise their estimate of tax payable up to 3 times (including the 6th
month revision). The additional 2 revisions may be made in either the 3rd, 9th or 12th month of the basis period. For Y/A 2002, the IRB as a concession allows companies to further revise their estimate of tax payable in the 9th month.
C. Penalty provision
a. Failure to furnish estimate of tax payable Under s. 120(1)(f) of the ITA 1967, any company which, without reasonable excuse fails to submit the estimate of tax payable for a year of assessment shall be guilty of an offence and upon conviction, be liable to a fine ranging from RM200 to RM2,000 or face imprisonment for a term not exceeding 6 months or both. With effect from Y/A 2011, where no prosecution is instituted by the Director general and no direction is issued by the Director General under s. 107C(8) of the ITA 1967; but there is a tax payable by that company for that year of assessment, such amount of tax payable will be subject to a penalty of 10%.
b. Late payment penalty As explained earlier, monthly payments should be remitted to the IRB by the due dates, i.e. by the 10th day of the following month. Failure to remit the installments on a timely basis will result in an automatic penalty of 10% being imposed on the unpaid amount. c. Difference between the estimate submitted and final tax payable When the tax payable for a particular year of assessment exceeds the original or the revised estimate (if a revision is submitted) by an amount exceeding 30% of the tax payable, the difference will be subject to a penalty of 10%.
D. Return by Employer
a. Filing of return by employer Under s. 83(1) and 83(1A), every employer must finish the return (Form E) of its employees’ employment income no later than 31 March for each year. In addition, the employer must also prepare and deliver to his employee the statement of remuneration (Form EA) on or before the last day of February for each year.
b. Penalty provisions Under S. 120(1)(b) of the ITA 1967, any person who, without reasonable excuse fails to submit the return by employer as well as prepare and deliver the statement of remuneration shall be guilty of an offence and upon conviction, be liable to a fine ranging from RM200 to RM2,000 or to imprisonment for a term not exceeding 6 months or both.
F. Tax return
a. Filing of tax returns A fundamental difference between the previous official system and the newly introduced self-
67
assessment system is the discontinuance of a detailed review of returns submitted and the subsequent issuance of notices of assessment by the IRB. This is due to the fact that the burden of computing the tax liability is passed on to the taxpayer. Accordingly, all the returns submitted by the taxpayer would be deemed as notices of assessment being served on the taxpayer. Under the self-assessment system, all companies must file the tax returns within 7 months from the end of the accounting period (S77 (1A), ITS 1967) from YA 2003 onwards. For example, a company with an accounting period ending on 31 January must file its tax return to the IRB by 31 August. As an administrative concession, the IRB has allowed the YA 2001 and YA 2002 tax return to be filed within 8 months respectively after the end of the accounting period.
G. Penalty provisions
a. Failure to submit a tax return Failure to submit a tax return will constitute as an offence under the ITA 1967 and upon conviction, the taxpayer will be liable to a fine ranging from RM200 to RM2,000 or face imprisonment for a term not exceeding 6 months or both. However, if no prosecution is initiated, the Director General may require the person to pay a penalty equal to treble the amount of tax and/or additional tax which is payable (before any set-off, repayment or relief) for that year. As a matter of practice, with effect from 1 October 2011, the IRB will impose penalties ranging from 20% to 35% of the tax payable for late filing of tax returns. b. Failure to remit tax payable As explained above, since the tax return is deemed as a notice of assessment, the balance of tax payable (if any) should be remitted to the IRB together with the tax return. Failure to do so will result in the IRB imposing a penalty equivalent to 10% on the balance of tax payable and if the tax is still not paid after 60 days, a further 5% penalty will be imposed.
III.2.3. Tax Audit
The IRB issued the Tax Audit Framework, which takes effect from 1 Apr 2013. This revised tax audit framework replaces the tax audit framework issued in January 2009. A. Nature
Under the self-assessment system, tax audits will be IRB’s key enforcement tool to ensure that the tax returns submitted are correct and have been prepared in accordance with the provisions of the law, guidelines and rulings issued by the IRB. Essentially, an audit is an examination of a taxpayer’s records to ensure that the income and tax liability declared to the IRB in the tax return are true, correct and comply with the tax laws and rulings. IRB carries out 2 types of audits namely desk audit and field audit. The former will involve the review of documents / information obtained by correspondence and interviews at the IRB’s offices whilst the latter would entail a visit to the taxpayer’s premises for a detailed review of all relevant documents. Cases for audit are selected through the computerized system based on risk analysis criteria and on various criteria such as business performance, financial ratios, type of industry, past compliance records, third party information, etc.
Once a taxpayer is selected for an audit, the IRB will inform the taxpayer via a telephone call followed by an official notification letter sent via mail or fax. The period between the date of notification and the audit visit is 14 days. A shorter period of notification may be fixed by IRB with the consent of the taxpayer. The scope of a tax audit under self-assessment normally covers a period of 1 to 3 years, unless there are valid reasons to go beyond that period. The time frame for the conclusion of a tax audit is normally within 3 months. Upon the completion of an audit, the IRB will issue a tax computation summarizing the tax adjustments based on their findings and subsequently an additional assessment to collect the additional taxes from the taxpayer. The taxpayer may still appeal against this assessment by submitting the appeal, through the prescribed Form Q to the Special Commissioners of Income Tax within 30 days from when the assessment is raised. With effect from 1 Jan 2014, the time-bar for tax audits is reduced from 6 years to 5 years. B. Framework
68
To maintain and enhance public confidence in the tax administration, the IRB has issued the Revised Tax Audit Framework and the Tax Investigation Framework. The main areas covered in the frameworks are as follows:
a. Criteria for audit and investigation selection; b. Tax audit and investigation methodology; c. Rights and responsibilities of taxpayers and tax agents, audit and investigation officers; d. Settlement upon completion of an audit or investigation; and e. Offences and penalties.
The Tax Investigation Framework is effective 1 Jan 2007, whilst the Revised Tax Audit Framework is effective 1 Apr 2013. C. Penalty provision
a. Penalties for omission / non-disclosure Under the tax audit system, the IRB has also introduced a new penalty regime for non-disclosure and omission of information that affects a taxpayer’s tax liability. The penalty regime is summarized as follows:
Table 11 Penalty Rate NO. ITEM PENALTY RATE 1. Voluntary disclosure before selection for
audit Within 60 days from the due date for furnishing the return form 10%
More than 60 days but less than 6 months from the due date for furnishing the return form
15.5%
> 6 months to 1 year 20% > 1 year to 3 years 25% 3 years and above 30%
2. Voluntary disclosure after the case is selected for audit but before audit commences
35%
3. Non-disclosure (discovery during audit) 100% of tax undercharged (may consider for 45% for
1st offence) 4. Repeated offences +10% for each repeated
offence not exceeding 100%Source : Inland Revenue Board Of Malaysia
b. Penalty for not providing reasonable facilities and assistance Based on Public Ruling 7/2000, failure by a taxpayer to provide reasonable facilities and assistance to the IRB when conducting an audit is an offence and upon conviction, the taxpayer may be liable to a fine of between RM1,000 to RM10,000 or face imprisonment for a term not exceeding 1 year or both. c. Failure to keep sufficient records The company or persons responsible, upon conviction will be liable to a fine of between RM200 to RM2,000 or face imprisonment for a term not exceeding 6 months or both.
D. Appeal against an assessment
If a taxpayer is dissatisfied with an assessment deemed to be served on him, he should file an appeal by submitting an appeal letter or a Form Q within 30 days of the assessment being serving on him, i.e. within 30 days of the date of submission of the tax return. Specific details and the grounds of appeal should be stated in the appeal letter. In the event the IRB is unable to reach an agreement with the taxpayer, the case will be forwarded to the Special Commissioners. If the appeal was done by way of a letter, Form Q must be submitted by the taxpayer.
Effective YA 2009, taxpayers with no chargeable income can file an appeal by using the Notification of Non-Chargeability instead of notice of assessment. The appeal is to be filed through the Director General using Form Q. Effective 1 January 2012; the issuance of Notification of Non-Chargeability is extended to the following cases:
69
a. Persons exempted from tax under the ITA 1967 or the PIA 1986; b. Person with no statutory income from a business source but assessment has been made in
respect of other sources of income. III.2.4. Real Property Gains Tax Rates and Exemptions A. Real property gain tax rates
Real Property Gains Tax (RPGT) is charged on gains arising from the disposal of real property, which is defined as any land situated in Malaysia and any interest, option or other right in or over such land. RPGT is also charged on the disposal of shares in a real property company (RPC). An RPC is a controlled company holding real property or shares in another RPC of which the defined value is not less than 75% of the value of the company’s total tangible assets.
The Minister has exempted all persons from all provisions of the Real Property Gains Tax Act 1976 (RPGT Act 1976) in respect of any disposal of chargeable assets between 1 April 2007 to 31 December 2009. For any disposal of chargeable assets made by any person after 31 December 2009, the Minister will impose tax at a fixed rate of 5% on the gains arising from the disposal of real properties that are disposed of within 5 years of the date of acquisition of such chargeable assets. It is proposed that with effect from 1 January 2012, a tax rate of 10% will be imposed for a holding period exceeding 5 years.
B. Exemption of Real Property Gains Tax.
RPGT exemptions are available in the following circumstances: Exemptions under the RPGT Act 1976;
a. An individual will be given an exemption equal to RM10,000 or 10% of the chargeable gain, whichever is greater. Prior to 1 January 2010, the exemption was equal to RM5,000 or 10% of the chargeable gain, whichever was greater.
b. An individual who is a Malaysian citizen or a permanent resident will be given a once in a lifetime exemption on any chargeable gain arising from the disposal of his/her private residence if she/he elects in writing for the exemption to apply to that private residence.
c. Transaction in which the disposal price is deemed equal to acquisition price (i.e. No gain no loss transaction) – per Para 3 Sch 2 of the RPGT Act 1976:
1. Devolution of a deceased person’s assets to his trustee or legatee 2. Transfer between spouses 3. Transfer of assets owned by an individual, his wife or by an individual jointly with
his wife or with a connected person to a company controlled by the individual, his wife or by an individual jointly with his wife or with a connected person, for a consideration consisting substantially (more than 75%) of shares in that company
4. Transfer between an individual and a nominee who has no vested interest in assets 5. Transfer by way of security in or over an asset 6. Gifts to the Government, local authority or charity exempt from income tax 7. Disposal due to compulsory acquisition 8. Disposal of chargeable assets pursuant to an approved financing scheme, which is in
accordance with Syariah principles, where such disposal will not be required for conventional financing schemes.
d. Gifts- per Schedule 2 Paragraphs 12 of the RPGT Act 1976. Gifts between husband and wife, parent and child or grandparent and grandchild are deemed to be ‘No gain, no loss’ transactions.
e. Transfer between companies – per Para 17 Schedule 2 of the RPGT Act 1976 1. Transfer within the same group to bring about greater efficiency and for a consideration
consisting substantially of shares in the transferee’s company 2. Transfer between companies for the purposes of reorganization, reconstruction or
amalgamation where the transferee company is being restructured to comply with the Government’s policy on capital participation in industry
3. Assets distributed by a liquidator under a scheme of reorganization, reconstruction or amalgamation where the transferee company is being restructured to comply with the
70

Government’s policy on capital participation in industry f. Exemption via Gazette Orders which are currently available include:
1. Disposal of chargeable assets: i) To or in favour of a special purpose vehicle; or ii) In connection with the repurchase of the chargeable assets, to or in favour of the
person from whom those assets were required, for the purpose of a transaction 2. Disposal of chargeable assets in relation to the Sukuk issued by the Malaysian
Global Sukuk Incorporated 3. Disposal of chargeable assets in relation to the Sukuk Bank Negara Malaysia-Ijarah issued
or to be issued by BNM Sukuk Berhad 4. Disposal of chargeable assets to Real Estate Investment Trust and Property Trust Funds 5. Disposal of chargeable assets in relation to the issuance of private debt securities
under Islamic principles
III.2.5. Sales Tax Sales tax is a single stage tax imposed on taxable goods manufactured locally and/or imported.
“taxable goods” means goods of a class or kind not for the time being exempted from sales tax. The sales tax Act 1972 and its related legislation apply throughout Malaysia excluding the Joint Development Area (JDA). Free Zones and Licensed Manufacturing Warehouses are deemed to be places outside Malaysia an as such, do not fall within the ambit of the tax. Special provision applies to Labuan, Langkawi and Tioman, which generally exclude these places from the scope of sales tax. Sales tax is a consumption tax and under the system, the onus is on manufacturer of taxable goods to levy, charge and collect the tax from their customers. For imported goods, sales tax is collected from the importer upon the release of taxable goods from Custom control.
A. Rates of tax
Sales tax is an ad valorem tax and can be computed based on the value of taxable goods sold, used or disposed of, or imported. Specific sales tax rates are currently only imposed on certain classes of petroleum (generally, refined petroleum). Broadly, sales tax is chargeable at the following rates; Table 12 Tax Rates
NO. CLASS OF GOODS RATE (%) 1. Fruits, certain foodstuff, timber and building material 5 2. Liquor and alcoholic drinks 5 3. Cigarette and tobacco products 5 4. All other goods not specifically exempted 10
Source : Inland Revenue Board Of Malaysia B. Goods Exempted
All export is exempted from sales tax. Goods, which are specifically exempted, include: a. Live animals, fish, seafood and certain essential food items including meat, milk, eggs,
vegetables, fruits, bread, etc. b. Medical and educational equipment including sports equipment, books, etc. c. Photographic equipment and films d. Motorcycles not exceeding 200 cc capacity, bicycles for adult use including parts and
accessories e. Machinery for textile industry, food preparation industry, paper and printing industry,
construction industry, metal industry, etc. f. Primary commodities including cocoa, rubber and their related products g. Naturally occurring mineral substances, chemicals, etc. h. Helicopters, aircraft, ships and other vessels
C. Licensing
Any person who manufactures taxable goods in the course of business is required to be licensed
71

as a licensed manufacturer. “Manufacture” means: a. In relation to goods other than petroleum, the conversion by manual or mechanical
means of organic or inorganic materials into a new product by changing the size, shape or nature of such materials and includes the assembly of parts into a piece of machinery or other products, but does not include the installation of machinery or equipment for the purpose of construction; and
b. In relation to petroleum, refining or compounding and includes the addition of any foreign substance
D. Exemption from licensing A manufacturer of taxable goods whole total sales value did not exceed RM10,000 in the
preceding year and is not expected to exceed RM10,000 during the next 12 month may apply for a certificate of exemption from licensing. Certain manufacturing operations are also exempted from the licensing requirement. They include the following:
a. Developing and printing of photographs and production of film slides. b. Engraving of articles with the name of the recipient, his sports record or other circumstances
under which the article was donated or awarded. c. Incorporation of goods into buildings d. Manufacture of ready-mixed concrete e. Repacking of bulk goods into smaller packages by a person other than a licensed manufacturer. f. Repair of second hand goods g. Installation of air conditioners in motor vehicles. h. Manufacture of jewellery and goldsmith wares
E. Tax free raw materials
In order to uphold the single-stage concept, there are facilities for licensed manufacturers obtain taxable raw materials/packing materials free of sales tax for use in the manufacture of taxable goods. F. Drawback
This is an incentive to promote export of domestically manufactured products by reducing the cost of production, thereby enhancing the competiveness of such products in the global market. Where sales tax is paid in respect of goods, which are subsequently re-exported, drawback of sales tax is allowed on:
a. Tax paid finished goods, either imported or purchased from licensed manufacturer; and b. Tax paid raw materials/packing materials, which are used in the manufacture of finished
goods for export. Drawback is not allowed for petroleum. G. Payment of sales tax
Generally, sales tax shall be due at the time the taxable goods are sold, or disposed of otherwise than by sale by the taxable person. Any sales tax that falls during any taxable period, which is 2 calendar months, shall be paid to the customs authorities within 28 days from the expiration of the taxable period. In relation to the classes of petroleum that are subject to sales tax, there are special provisions regarding the time when sales tax is due and payable, as follows:
a. Where taxable petroleum is manufactured in Malaysia: b. Sales tax is due at the time the taxable petroleum is sold or disposed of otherwise than by sale;
and c. Any sales tax that falls due during a taxable period, which is 1 calendar month, is payable
within 10 days from the expiration of the taxable period d. Where imported taxable petroleum is stored in licensed warehouses under S. 65 of the
Custom Act1967: e. The sales tax is due at the time the taxable petroleum is released from the licensed
warehouses for home consumption; and f. Any sales tax that falls due during a calendar month is payable within 10 days from the
72
expiration of that month. III.2.6. Import Duties
A. Rates of Duties Import duties are levied on goods that are subject to import duties and imported into country.
Import duties are generally levied on an ad valorem basis but may also be imposed on a specific basis. The ad valorem rates of import duties range from 0% - 60%. Raw materials, machinery, essential foodstuffs and pharmaceutical products are generally non-dutiable or subject to duties at lower rates. Claim to pay duty at preferential rate can be made in respect of qualifying goods originating from country that has a free trade agreement with Malaysia. In addition, in and out quota tariff rate is applicable to certain goods subject to tariff rate quota. B. Tariff rate quota
Certain agricultural products, such as chicken, hen eggs, cabbages imported are subject to tariff rate quota (TRQ). Under TRQ, the tariff charged depends on the volume of imports. Import within quota will be subject to the in-quota tariff rate, whilst import in excess of quota will be subject to out –quota tariff rate, which is generally higher (sometimes much higher) than the in quota tariff rate. The quota applicable is determined by the relevant agency, e.g. Department Veterinary Services. C. Preferential duty
Qualifying goods originating from China, Japan, Korea, Pakistan, Australia, New Zealand, India and ASEAN countries (Brunei, Cambodia, Indonesia, Laos, Malaysia, Myanmar, Philippines, Singapore, Thailand and Vietnam) imported into Malaysia may enjoy preferential rates of duty under the relevant free trade agreements. The preferential rates can be significantly lower than the standard rates of duty. In order to qualify for the preferential rates can be significantly lower than the standard rates of duty. In order to qualify for the preferential rate of duty, evidence of qualification (usually a certificate of origin) issued by the relevant Government Agency or Ministry in the exporting country must be produced at the time of importation.
D. Classification of goods The rates of import duty on dutiable goods are dependent on the classification of the goods under
the Customs Duties Order 2007. Malaysia adopts a coding or classification system commonly referred to as the Harmonized System (HS), which was established under the International Convention on the Harmonized Commodity Description, and Coding system.
The general Rules of Interpretation (GRI) of the HS is an integral part of the Customs Duties Order 2007. Classification of goods under the HS is applicable to goods imported from all countries other than ASEAN. Goods imported from ASEAN countries are classified under the ASEAN Harmonized Tariff Nomenclature (AHTN) in which although based on the HS, allows for certain variations. Imported may apply for classification ruling from the respective State Customs office or Customs Headquarters in advance to avoid potential dispute with Customs during importation/exportation clearance.
E. Value of goods The custom value of imported goods is determined largely in accordance with the World
Trade Organization (WTO) principles of custom valuation. F. Exemptions
In general, manufacturers are eligible to apply for the following exemptions. a. Import duty exemption on raw materials and components used directly for the manufacture of
goods for export and domestic markets not available locally; and b. Import duty and sales tax exemption on machinery and equipment, which are used
directly in the manufacturing, process and are not available locally. Malaysian Industrial Development (MIDA) is the processing authority.
III.2.7. Licensed Manufacturing Warehouse
73

Quantitative import restriction is seldom imposed except on a limited range of products for protection of local industries and reasons of security and environment grounds. Non-automatic import permits/license issued by prescribed Authorities are required on selected goods (including motor vehicles, fish and fish products, certain chemicals and drugs, liquor and tobacco, radioactive materials, explosives and fireworks, etc.). Absolute prohibition applies to 15 categories of goods prescribed (including turtle eggs, Piranha fish, certain poisonous chemicals, etc.).
III.2.8. Free Zone A free zone is deemed to be place outside Malaysia for customs purposes and is not subject to
most customs formalities except certain Prohibition Orders on imports and exports. Goods can be brought into or provided in free zones without payment of customs duties and sales tax, except those that are specifically excluded (e.g. forklifts, tires, petroleum products, air conditioning equipment, office furniture construction/ building materials). III.2.9. Export Duties A. Basis of taxation
Export duties are generally imposed on the country’s main commodities. The ad valorem rates of export duty range from 0% to 20%. Some of the commodities that attract export duty are crude petroleum oil (at 10%), rattan whole (at RM2.70 per kg) and crude palm oil (based on scaled rates on gazette value)
B. Value of goods
For the purpose of computing export duty, the value of the goods is the price, which an exporter would receive for the goods calculated to the stage where such goods are released by customs at the place of export. III.2.10. Excise Duties
A. Basis of Taxation Excises duties were previously imposed on a selected range of goods manufactured in Malaysia.
With effect from 1 January 2004, the scope of excise duty has been expanded to also cover selected imported goods, including motor vehicles. Goods, which are subject to excise duty, include:
a. Beer, stout and other intoxicating liquor (e.g. cider and perry, rice wine, mead, brandy, whisky rum and tafia, gin);
b. Cigarettes containing tobacco c. Motor vehicles; and d. Playing cards
B. Rates of duties The rates of excise duties vary for each ‘excisable’ product for example:
a. RM0.22 stick and 20% for cigarettes; b. 10 cents per liter and 15% for spirituous beverages with alcohol content exceeding 0.5% vol
but not exceeding 1.14% volume; c. RM7.40 per liter and 15% - RM30 per 100% volume per liter and 15% for rice wine, mead
and wines (from juices other than juice of fresh grapes or from vegetables juices); d. 60% - 105% for motorcars (depending to the engine capacity)
C. Value of goods For goods manufactured locally, the definition of ‘value’ under the Excise Act 1976 for
computation of excise duty payable purposes is “ the price which a buyer would give for the goods on purchase in the open market at the time when duty is payable but will exclude any excise duty, costs, charges and expenses of transportation and storage immediately after removal from the place of manufacture”. In the case of goods imported into Malaysia, the value on which excise duty is charged is the sum total of the value of such imported goods as determined under the Custom Act
74
75
1967 and the amount of customs duty, if any, payable on such imported goods.
D. Licensing Unless exempted from licensing, a manufacturer of tobacco, intoxicating liquor or goods
subject to excise duties must have a license to manufacture such goods. A warehouse tobacco, intoxicating liquor or goods subject to excise duty also permits the holder to store such goods.
E. Payment of duty As a general rule, duty is payable at the time the goods leave the place of manufacture or any other
place under excise control. However, for motor vehicles, duty is payable at the time the vehicles are registered with the Road Transport Department, or, if not registered, within 4 years from the date of removal from the place of manufacture.
F. Export No excise duty is payable on dutiable goods that are exported.

IV. Malaysia Fiscal Issues
The Malaysian economy is expected to remain on a steady growth path in 2014, expanding by 4.5%-5.5%. Domestic demand will remain the key driver of growth, albeit at a more moderate pace. Private investment is forecast to register robust growth for the fifth consecutive year, driven by the ongoing implementation of multi-year projects and the improvement in external demand. Public investment is projected to register a higher growth, supported by both Government and public enterprise capital spending. Private consumption will be underpinned by healthy labor market conditions and sustained income growth. Public consumption is anticipated to record a lower growth due to the ongoing fiscal consolidation. In line with the improvement in external demand, Malaysia’s export performance across most product categories is expected to pick up in 2014.
Exports are expected to be further supported by a small positive growth in commodity exports and the stronger services exports, supported by Visit Malaysia Year 2014. At the same time, gross imports are projected to increase at a faster pace, driven mainly by higher intermediate imports. With import growth remaining robust, the current account surplus is projected to narrow in 2014. On the supply side, all economic sectors are expected to register positive growth in 2014. The services and manufacturing sectors will be the key drivers to the overall growth, benefiting from the improvement in the global economic environment. The construction sector is expected to continue recording high growth, albeit at a more moderate pace, as the completion of several large civil engineering projects will more than offset the progress in existing projects in the transport, utility, and oil and gas sectors. The growth in the agriculture sector is expected to improve on account of higher production of palm oil as both yields and the number of matured palm trees increase. In the mining sector, better performance is projected due to higher crude oil and natural gas production from deep water and marginal fields; and enhanced oil recovery.
Headline inflation is projected to average 3%-4% in 2014, due mainly to domestic cost factors. These include the recent price adjustments arising from the subsidy rationalization and the spillover effects of these adjustments on the prices of other goods and services. The higher cost pressures, however, will be partly contained by subdued external price pressures, continued expansion in domestic capacity and a moderation in domestic demand. Notwithstanding the moderation in domestic demand, the underlying fundamentals of the Malaysian economy remain strong. Growth will be driven by the private sector across a diversified range of economic activities. Of importance, employment remains strong and incomes are rising. The financial system is resilient with financial intermediation expected to provide continued support to investment and consumption. The strength of Malaysia’s external position also remains intact, with international reserves at healthy levels and external debt within prudent limits. Downside risks to global growth, however, could affect the performance of the domestic economy in 2014. The advanced economies will continue to experience excess capacity in the labor and product markets, while fiscal uncertainties may affect the pace of recovery. In several of the emerging economies, there could be slower-than-expected domestic demand amid policy measures to address risks arising from high growth in credit and asset prices. In addition, volatility in global financial markets could contribute to large and volatile capital flows. While the environment will continue to be challenging, the economy could also register stronger growth performance if the pace of global recovery exceeds expectations.
76

V. Conclusion: Where we stand? Where we go?
Malaysia is on track to achieve the goals of high income and developed nation status by the year 2020. While macroeconomic targets, especially GNI per capita at USD15,000 and 3.3 million new jobs are expected to be within reach, the graduation process to be a fully developed and inclusive nation would take a while longer than envisaged, if corrective actions are not vigorously pursued. The latter involves a lot more key metrics, encompassing changes in economic landscape, sovereign rating and creditworthiness, development of economic and social institutions and also "soft" infrastructures. These metrics cover both quantitative and qualitative measurements, encompassing social policy and environmental concerns. Achieving high income target at national level is not a stumbling block, especially for resource-rich developing economies, whereby the competent and prudent ones have already surpassed their GNI per capita thresholds. However, these "blessed countries" are still struggling with market imperfections and inequalities, under-developed and incomplete financial markets and of greater important, weak institutions and poor governance. In general, market microstructures, social and ecosystem services need to be strengthened, key institutions for economic and social development improved, and good governance, which is a hallmark of most developed economies, need to be fully incorporated and given a top priority. Most importantly, access to economic opportunities and social protection, especially for the poor and disadvantaged groups needs to be widened, so that they can really protect themselves. Core labour standards also need to be improved, covering those in the informal sector, including migrant workers. At the macroeconomic policy level, well-established rules and procedures need to be observed, while "discretions" constrained, especially those that invite greater public scrutiny, such as wasteful government spending, directed development projects, corporate sector tax avoidance and discounts, among others. Development projects need intensive project appraisals, identifying both costs and benefits to the society as well as who are the gainers and losers, and enhanced with rigorous risk analysis. Cost-benefit analyses (CBA) are mandated legislative requirements in most developed economies, while ironically Malaysia has almost abandoned it long time ago. Without fail, rakyat (people) are asking about development project beneficiaries, substantial cost escalation and environmental degradation.
The current development model, based on neoclassical welfare economics, is largely geared towards attaining macroeconomic aggregate targets, especially GNI per capita and the role of private investment. Excessive investment in structures and equipment, especially in luxurious real estate development and infrastructure projects skewed in certain areas, as seen in recent years will ultimately lead to "overcapacity", lowering the efficiency and quality of investment, raising private sector debt level and if not properly monitored, lead to financial instability, as seen in some "investment-driven economies" in the past as well as in recent years. Infrastructure projects that reduce bottlenecks and benefit the rakyat (people) on a wider scale, especially water supply and sanitation and electricity and public spending on education and health will surely go a long way in improving long-term productivity and nation's competitiveness. Trickle down policy (a rising tide lifts all boats) is grossly inadequate in meeting the basic needs of the rakyat, ensuring the quality of life, living standards and welfare of the society as a whole. Greater focus needs to be given on sustainable development and good governance, whereby specific measures are undertaken to enhance natural and social capital and minimize social costs and negative externalities, associated normally with free market activities and reduced role of government. Special considerations should be given on emerging social policy issues, addressing distributional conflicts across ethnic and income class, environmental degradation, intergenerational equity, social cohesion and justice, and the welfare of future generations. Pursuit of growth and economic efficiency need to be enhanced with strong ethical and moral standards, exemplified with less wasteful spending and less rampant corruption, thereby ensuring true allocative efficiency of nation's scare resources. Apart from achieving the ultimate goal of national unity and harmony in all angles, we need to ensure that the society and rakyat as a whole derive maximum benefits in terms of economic and social development. More importantly, rights in whatever forms need to be balanced with strong responsibilities, a prerequisite in ensuring tolerance and harmony in the society, which seemed to be eroding in recent years.
77

"Cost of living" is undeniably on the rise, especially with the planned implementation of goods
and services tax (GST) in April 2015 and an impending review of minimum wage policy in January next year. While household purchasing power is clearly shrinking, following mark up in prices by both firms and traders, there are unfortunately other social costs and potential welfare losses that should not be taken for granted by the authorities. These include continued softening in global commodity prices (affecting rubber and oil palm smallholders) and tightening of domestic credit conditions (business owners and borrowers). As for long-term savers, real interest rate is already in a negative territory, while macro-prudential and administrative tightening has to a large extent affected the corporate sector. Business owners are now coping hard with higher operating costs, especially production costs, as seen by elevated producer price index, particularly for local production, continued exchange rate volatility and heighthened business uncertainty.
The banking system is now exposed to significant systemic risk, especially with continuing high household debt, tightening of domestic credit conditions and large exposure to property and real estate development. The bulk of the household debt are in the housing loans, of which the majority is exposed to floating mortgage rates. In terms of GDP per capita in USD, Malaysia's household debt at 86.8% of GDP at end-December 2013 is one of the highest in the region, in comparison to Singapore and Korea which recorded substantially high GDP per capita, but each registering household debt of less than 80%. On the external account, international reserves remained more or less stagnant at about USD131.1 billion in the second quarter of 2014, following strong foreign exchange interventions by BNM to support depreciating ringgit (leaning against the wind), while net international investment position continued to be in a negative territory in 2013 at -RM47.2 billion (2012: -RM17.8 billion), affected by net outflows of direct investment abroad (DIA) and portfolio investment, especially for sovereign debt securities.
While the inflation rate in the first six months of 2014 increased by more than double the rate registered in the same period last year (January-June 2014: 3.4%, January-June 2013: 1.6%), growth in domestic liquidity, as measured by the broad money supply (M3), continues with its decelerating trend, attributed to a large extent by sharply lower net foreign assets, although domestic credit extension to the private sector remained supportive of economic activities. As for firms and businesses, real balances now become input to the production process, affecting marginal cost and ultimately will be passed through consumers with a mark-up in prices. As mentioned in the previous reports, the dynamics of monetary aggregates should be given greater attention, especially with the hike in OPR by 25 basis points on 10 July 2014. With tighter domestic liquidity conditions, average 3-month interbank rate is trending up to reach 3.43% in May 2014, representing 37 basis points (bps) higher than the prevailing 1-month interbank rate and also 32 bps higher than its lowest at 3.11%, recorded in April 2013.
Labour market conditions remained favourable, especially with an acceleration in external demand and a strong pick up in growth of the manufacturing sector. Unemployment rate improved slightly to 2.9% in April 2014 (December 2013: 3.0%, April 2013: 3.0%), while seasonally adjusted figure was also at 2.9%. Overall labour force participation rate has also improved to 67.3% in April 2014, up by 0.4 percentage point from the previous month, but remained below the average of 69%, registered during the period August to November 2013. There were new entrants to the labour markets, comprising of mostly young workforce aged between 20-24 years, while senior workforce participation rate has been declining, discouraged by longer duration of unemployment and de-skilling effects. The number of employed persons increased markedly by 75,300 persons to 13.50 million persons in April 2014 (March 2014: 13.43 million persons), while the number of unemployed has declined by 8,500 persons to 407,200 during the same period. Latest available data in May 2014 showed that total number of retrenchments has increased to 949 persons, while total number of vacancies declined to 71,837 persons, pointing to increasingly competitive labour market.
Bank Negara Malaysia (BNM) in its Monetary Policy Statement, released on 10 July 2014, raised the Overnight Policy Rate (OPR) by 25 basis points (bps) to 3.25% from 3.00% previously. While the hike is minimal and somewhat anticipated, bearing in mind that it has been in place for more than three years (since May 2011), there will definitely be wider economic implications.
78
Upward adjustment in lending rates will obviously push up debt servicing costs for borrowers, leading potentially to an increase in non-performing loans (NPLs) and required provisions.
Nonetheless, a relatively tight monetary policy is timely, not only helping to anchor inflation expectations in the medium and long-term, but also complementing the ongoing fiscal consolidation process. With output gap turning positive in the first quarter of 2014, terms of trade continued to register losses and real exchange rate remained to be undervalued, allowing market interest rates to reflect tight domestic liquidity conditions could be the best option. While in the current scenario, domestic cost-push factors far outweigh demand-induced inflation, the latter is clearly gaining momentum, especially with continued robust aggregate domestic demand and favourable labour market conditions. For greater transparency and better communication, "forward guidance" should be used to guide the public about the likelihood of higher interest rates in the coming quarters and in the years ahead, especially with likely earlier-than-expected unwinding of the US Federal Reserves (US Fed) quantitative easing (QE) scheme and the turning of global negative real interest rates to a positive territory. Higher interest rates overseas could come much earlier than expected, as wages are on the rise, especially with declining unemployment rate. While Government's commitment to fiscal consolidation process remains firm, Federal Government spending programs need to focus more on social policy concerns, such as inclusiveness, intergenerational equity and distributional issues of the society or rakyat as a whole. In fact, stronger fiscal consolidation process helps to significantly lower Federal Government debt, reduce substantially sovereign risk premium and improve to a large extent sovereign rating position. Government spending that provide wider benefits to the rakyat would also help to enhance public confidence and eliminate resentments.
79

80
References Asia Regional Integration Center website CCH Tax Auditor. (2013). Malaysia master tax guide 2013. Malaysia: CCH Asia Pte. Ltd. Economic Planning Unit of Malaysia - The Malaysia Economy in Figures 2013 John H. Drabble, Economic of Malaysia, University of Sydney, Australia Malaysian Institute of Economic Research website, Malaysia Malaysian Institute of Accountant. (2014). 2014 budget commentary and tax information. Kuala
Lumpur, Malaysia The Commissioner of Law revision. (2006). Laws Of Malaysia, Income Tax Act 1967. ___ (2014). Retrieved from Central Bank of Malaysia website (www.bnm.gov.my) ___ (2014). Retrieved from Malaysia External Trade Development Corporation website
(www.matrade.gov.my) ___ (2014). Retrieved from Department of Statistics Malaysia website (www.statistics.gov.my) ___ (2014). Retrieved from Ministry of Finance Malaysia website (www.treasury.gov.my) ___ (2014). Retrieved from Ministry of International Trade Industry website (www.miti.gov.my) ___ (2014). Retrieved from http://www.gdpinflation.com/2013/08/inflation-rate-in-malaysia- ___ (2014). Retrieved from http://www.tradingeconomics.com/malaysia/