Embed Size (px)
Citation preview
APERC Workshop, Washington,. D.C5 November 2012
2-3 Transport Alternative Scenarios
Luke Leaver, BE (Hons), MS (Stanford)
Large Opportunity in APEC to Improve Efficiency, Especially in Transportation
• Two alternative scenarios for improving energy efficiency in the transportation sector were developed for each APEC economy– Virtual Clean Car Race Scenarios
• Hyper-car Transition• Electric Vehicle Transition• Hydrogen Vehicle Transition• Natural Gas Vehicle Transition
– Alternative Urban Development Scenarios• High Sprawl• Constant Density• Fixed Urban Land
• For each alternative scenario, the impact on oil consumption and emissions reduction is assessed 2
Virtual Clean Car Race
3
Virtual Clean Car Race - Introduction
4
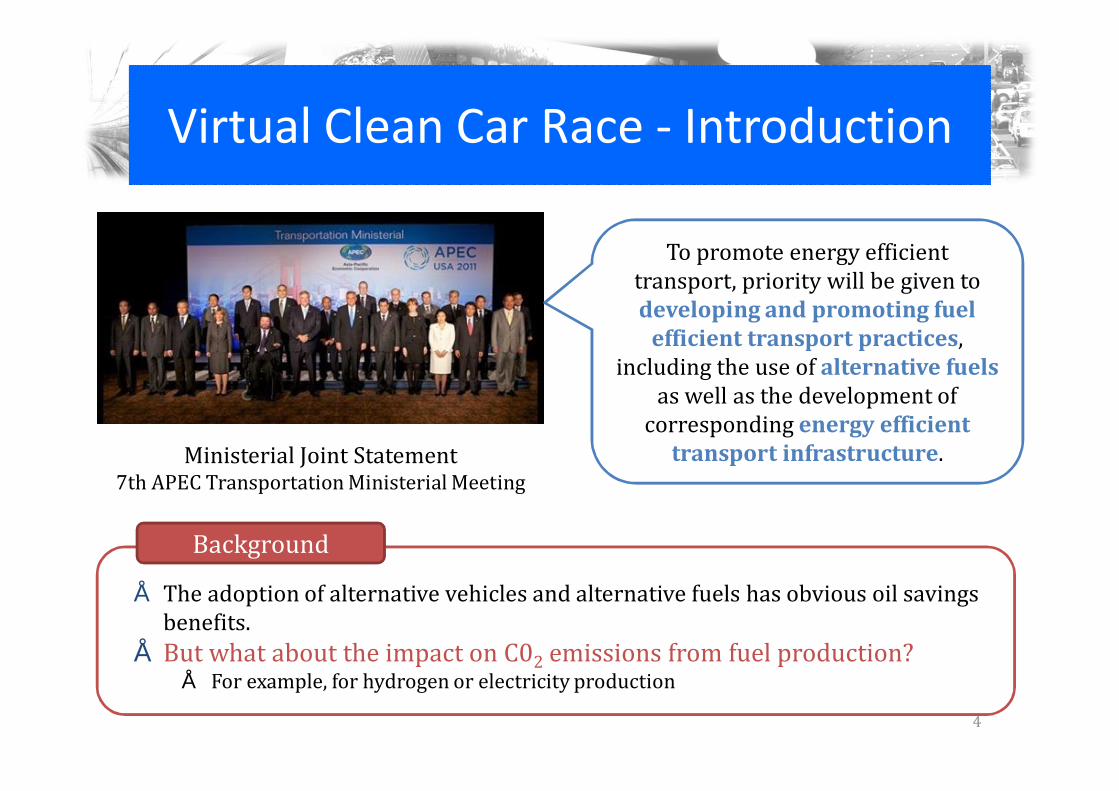
To promote energy efficient transport, priority will be given to developing and promoting fuel
efficient transport practices, including the use of alternative fuels as well as the development of corresponding energy efficient transport infrastructure. Ministerial Joint Statement7th APEC Transportation Ministerial Meeting
• The adoption of alternative vehicles and alternative fuels has obvious oil savings benefits. • But what about the impact on C02 emissions from fuel production?
• For example, for hydrogen or electricity productionBackground
Virtual Clean Car Race - Model
5
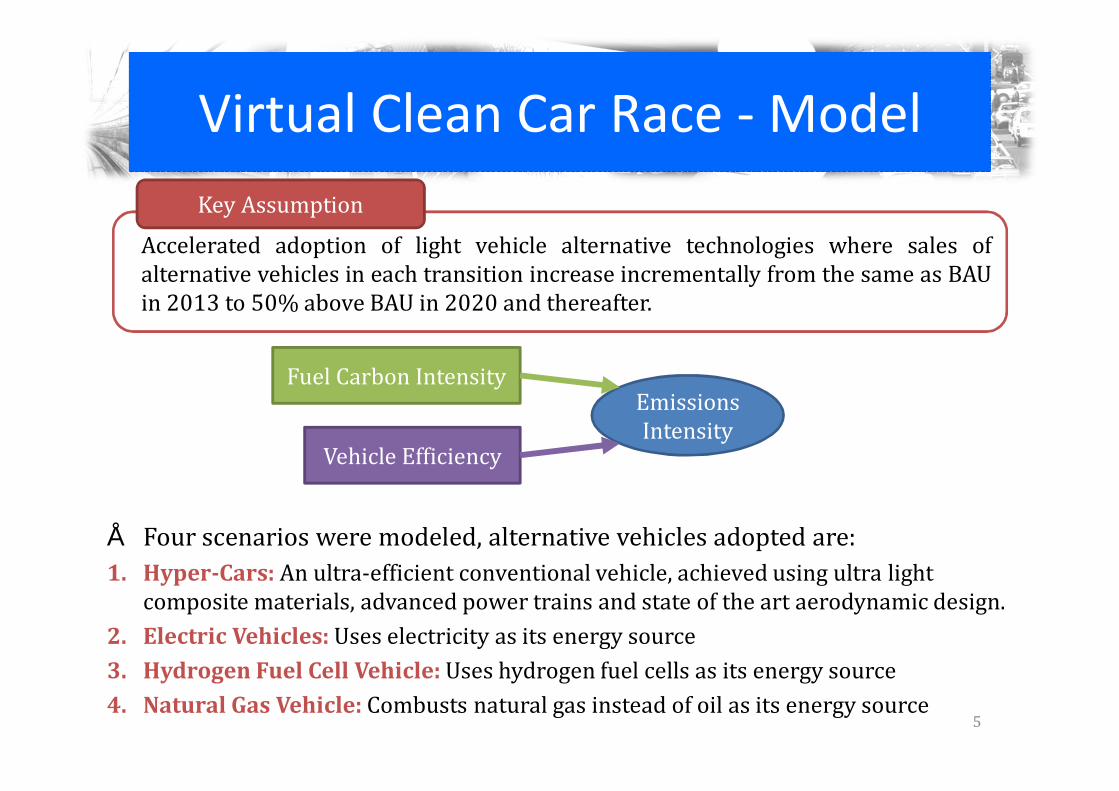
• Four scenarios were modeled, alternative vehicles adopted are:1. Hyper-Cars: An ultra-efficient conventional vehicle, achieved using ultra light composite materials, advanced power trains and state of the art aerodynamic design.2. Electric Vehicles: Uses electricity as its energy source3. Hydrogen Fuel Cell Vehicle: Uses hydrogen fuel cells as its energy source 4. Natural Gas Vehicle: Combusts natural gas instead of oil as its energy source
Vehicle EfficiencyFuel Carbon Intensity Emissions Intensity
Accelerated adoption of light vehicle alternative technologies where sales ofalternative vehicles in each transition increase incrementally from the same as BAUin 2013 to 50% above BAU in 2020 and thereafter.Key Assumption
Hyper Car Concept
6
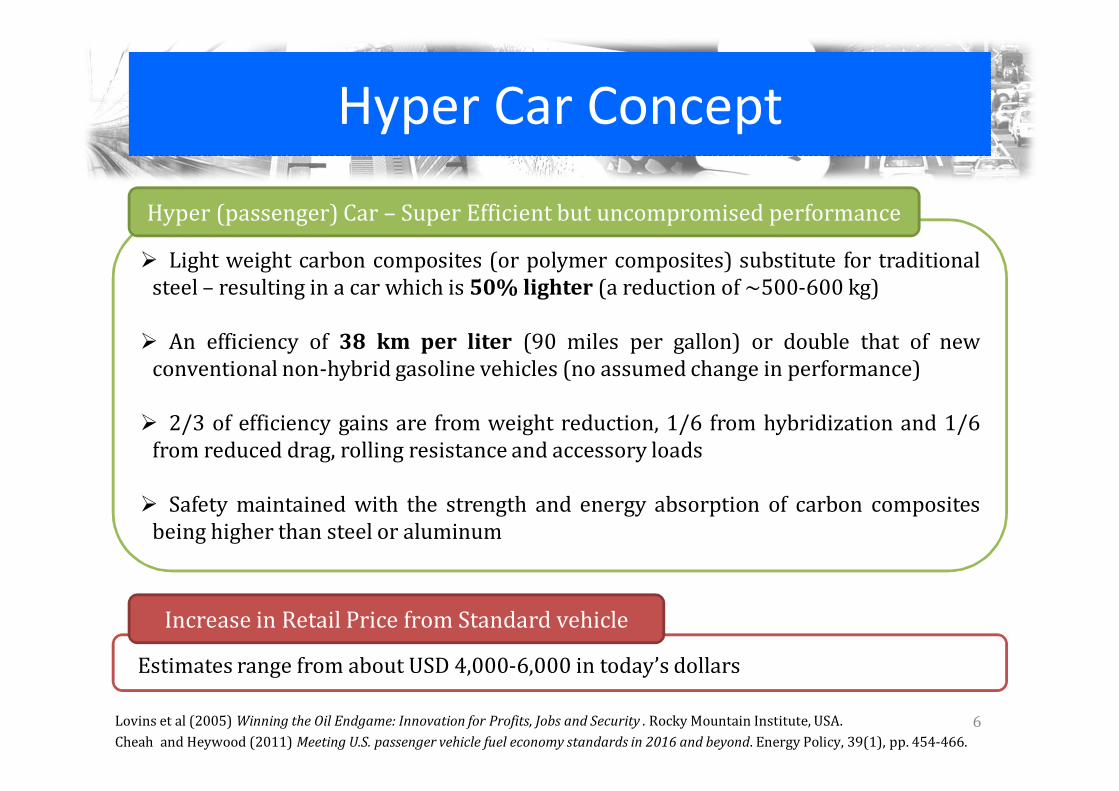
Ø Light weight carbon composites (or polymer composites) substitute for traditionalsteel – resulting in a car which is 50% lighter (a reduction of ~500-600 kg)Ø An efficiency of 38 km per liter (90 miles per gallon) or double that of newconventional non-hybrid gasoline vehicles (no assumed change in performance)Ø 2/3 of efficiency gains are from weight reduction, 1/6 from hybridization and 1/6from reduced drag, rolling resistance and accessory loadsØ Safety maintained with the strength and energy absorption of carbon compositesbeing higher than steel or aluminum
Hyper (passenger) Car – Super Efficient but uncompromised performance
Estimates range from about USD 4,000-6,000 in today’s dollarsIncrease in Retail Price from Standard vehicleLovins et al (2005) Winning the Oil Endgame: Innovation for Profits, Jobs and Security . Rocky Mountain Institute, USA. Cheah and Heywood (2011) Meeting U.S. passenger vehicle fuel economy standards in 2016 and beyond. Energy Policy, 39(1), pp. 454-466.
Relative Efficiency of Vehicles
7
012345678
Tank to Wheel
Fuel Consum
ption (gasoli
ne equivalent
Liters per 100
km)
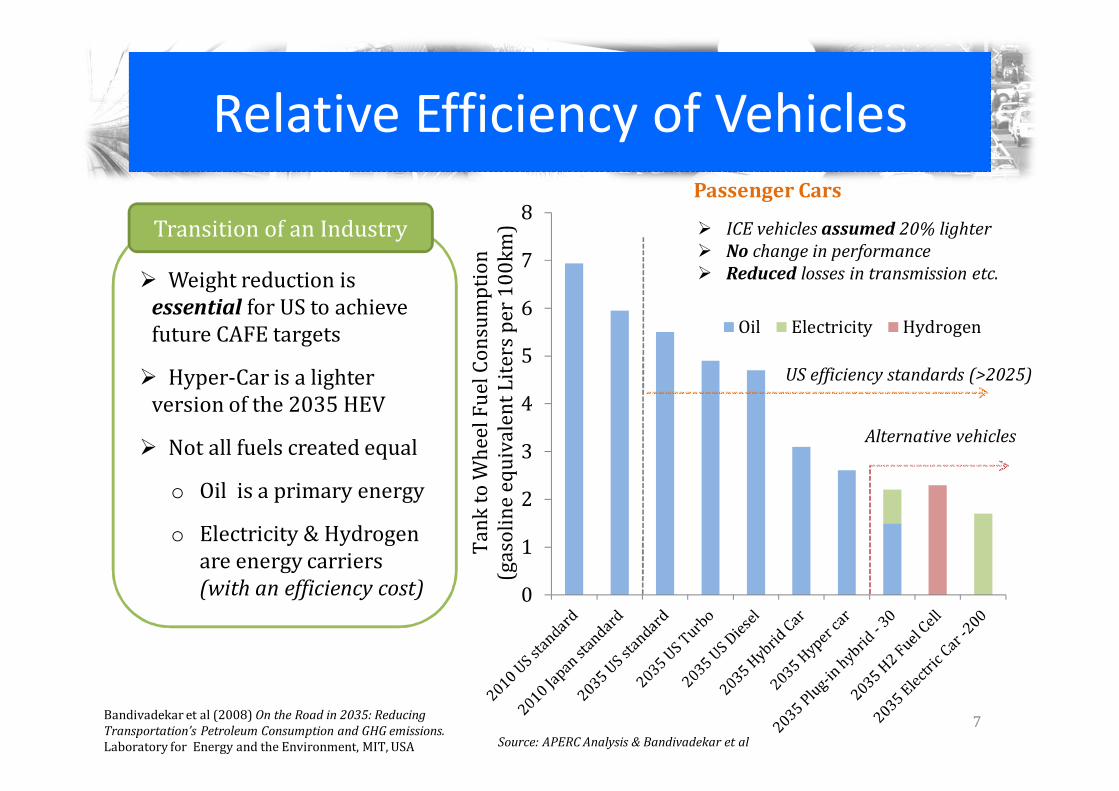
Oil Electricity HydrogenØ Weight reduction is essential for US to achieve future CAFE targetsØ Hyper-Car is a lighter version of the 2035 HEVØ Not all fuels created equal
o Oil is a primary energyo Electricity & Hydrogen are energy carriers
(with an efficiency cost)
Ø ICE vehicles assumed 20% lighterØ No change in performanceØ Reduced losses in transmission etc.
US efficiency standards (>2025)
Transition of an Industry Passenger Cars
Bandivadekar et al (2008) On the Road in 2035: Reducing Transportation’s Petroleum Consumption and GHG emissions. Laboratory for Energy and the Environment, MIT, USA Source: APERC Analysis & Bandivadekar et al
Alternative vehicles
Capital Costs Considerations
8
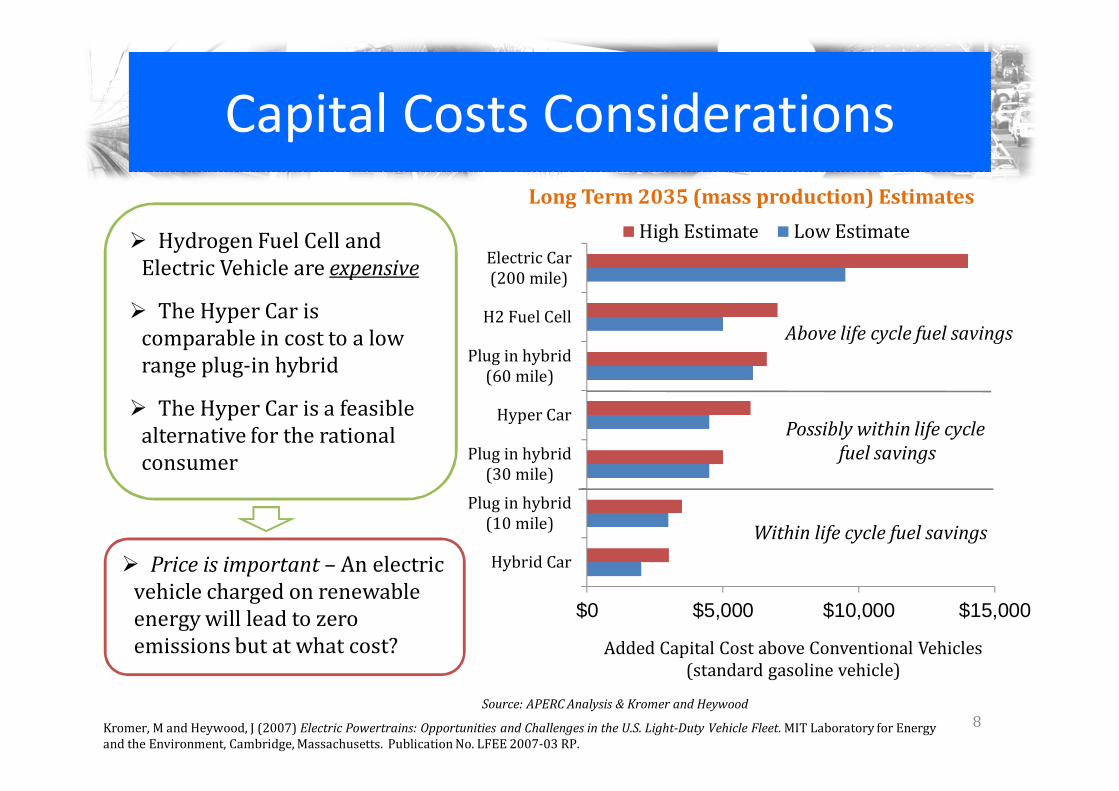
Ø Hydrogen Fuel Cell and Electric Vehicle are expensive
Ø The Hyper Car is comparable in cost to a low range plug-in hybridØ The Hyper Car is a feasible alternative for the rational consumerØ Price is important – An electric vehicle charged on renewable energy will lead to zero emissions but at what cost? $0 $5,000 $10,000 $15,000
Hybrid CarPlug in hybrid(10 mile)Plug in hybrid(30 mile)
Hyper CarPlug in hybrid(60 mile)
H2 Fuel CellElectric Car(200 mile)
Added Capital Cost above Conventional Vehicles(standard gasoline vehicle)
High Estimate Low Estimate
Within life cycle fuel savings
Above life cycle fuel savings
Possibly within life cycle fuel savings
Kromer, M and Heywood, J (2007) Electric Powertrains: Opportunities and Challenges in the U.S. Light-Duty Vehicle Fleet. MIT Laboratory for Energy and the Environment, Cambridge, Massachusetts. Publication No. LFEE 2007-03 RP.Source: APERC Analysis & Kromer and Heywood
Long Term 2035 (mass production) Estimates
9
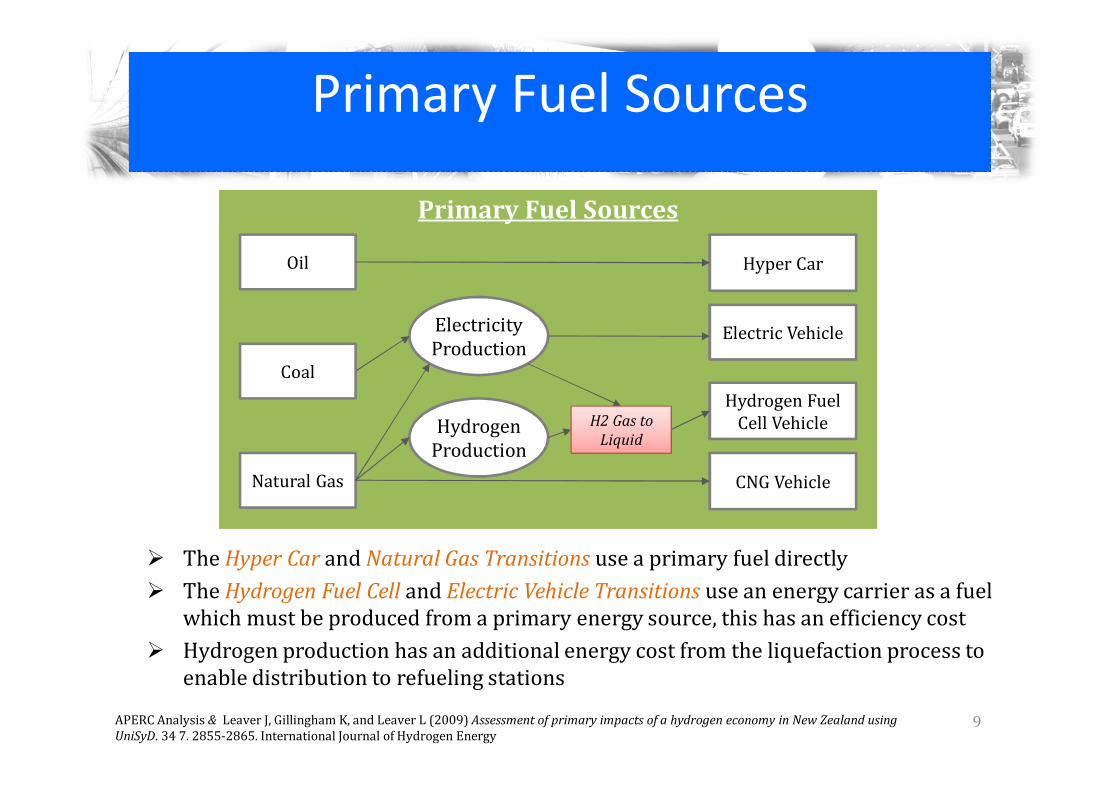
Primary Fuel Sources
Hydrogen Fuel Cell Vehicle
Hyper CarOilElectricity Production Electric Vehicle
CNG VehicleCoal
Natural GasHydrogenProduction H2 Gas to
Liquid
Primary Fuel Sources
Ø The Hyper Car and Natural Gas Transitions use a primary fuel directlyØ The Hydrogen Fuel Cell and Electric Vehicle Transitions use an energy carrier as a fuel which must be produced from a primary energy source, this has an efficiency costØ Hydrogen production has an additional energy cost from the liquefaction process to enable distribution to refueling stations
APERC Analysis & Leaver J, Gillingham K, and Leaver L (2009) Assessment of primary impacts of a hydrogen economy in New Zealand using UniSyD. 34 7. 2855-2865. International Journal of Hydrogen Energy
Urban Planning
10
Toronto
Chicago
Denver
Houston
Los Angeles
New York
Phoenix
San Francisco
Washington
Mexico City
BrisbaneMelbournePerth
Sydney
Vienna
Brussels
Copenhagen
ParisBerlin
FrankfurtHamburg
Munich
Amsterdam
Zurich
London
TokyoHong KongSingapore
Jakarta
KualaLumpur Beijing
ShanghaiGuangzhouManila
SeoulTaipeiBangkok
Ho Chi Minh City0
10000
20000
30000
40000
50000
60000
70000
80000
90000
100000
0 50 100 150 200 250 300 350 400
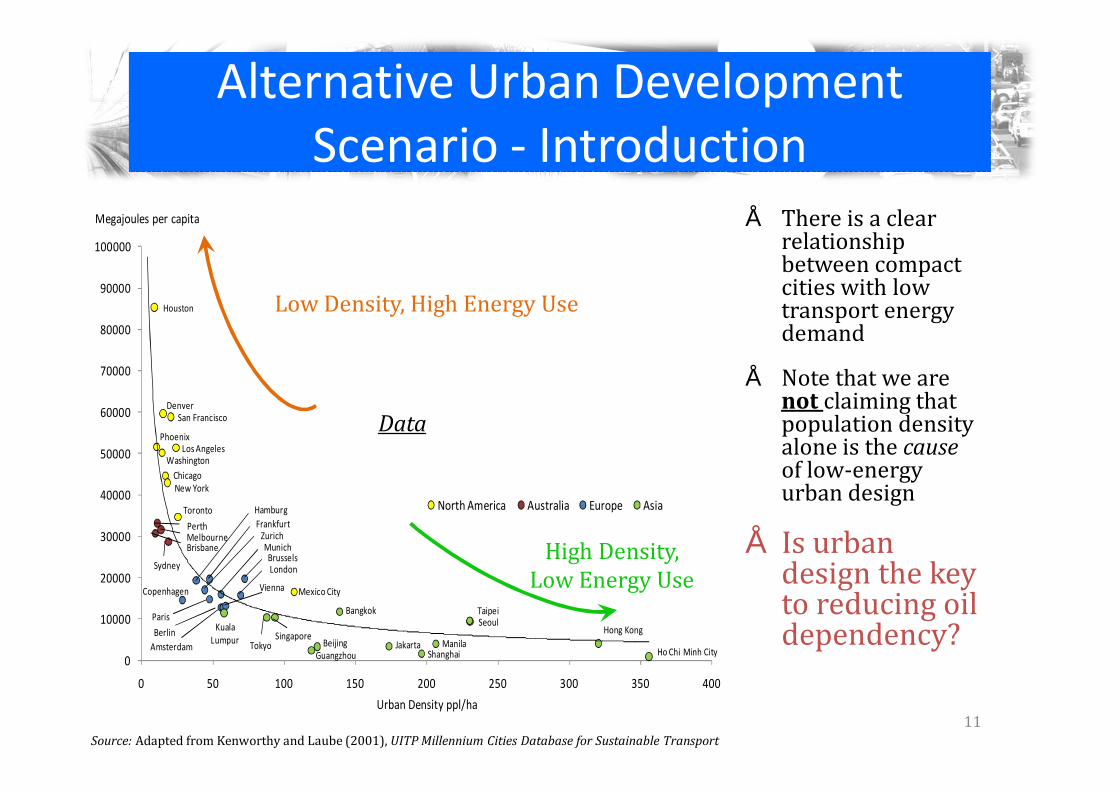
Megajoules per capita
Urban Density ppl/ha
North America Australia Europe Asia
Alternative Urban Development Scenario - Introduction
• There is a clear relationship between compact cities with low transport energy demand • Note that we are
not claiming that population density alone is the cause of low-energy urban design• Is urban design the key to reducing oil dependency?
11
Low Density, High Energy Use
High Density, Low Energy UseData
Source: Adapted from Kenworthy and Laube (2001), UITP Millennium Cities Database for Sustainable Transport
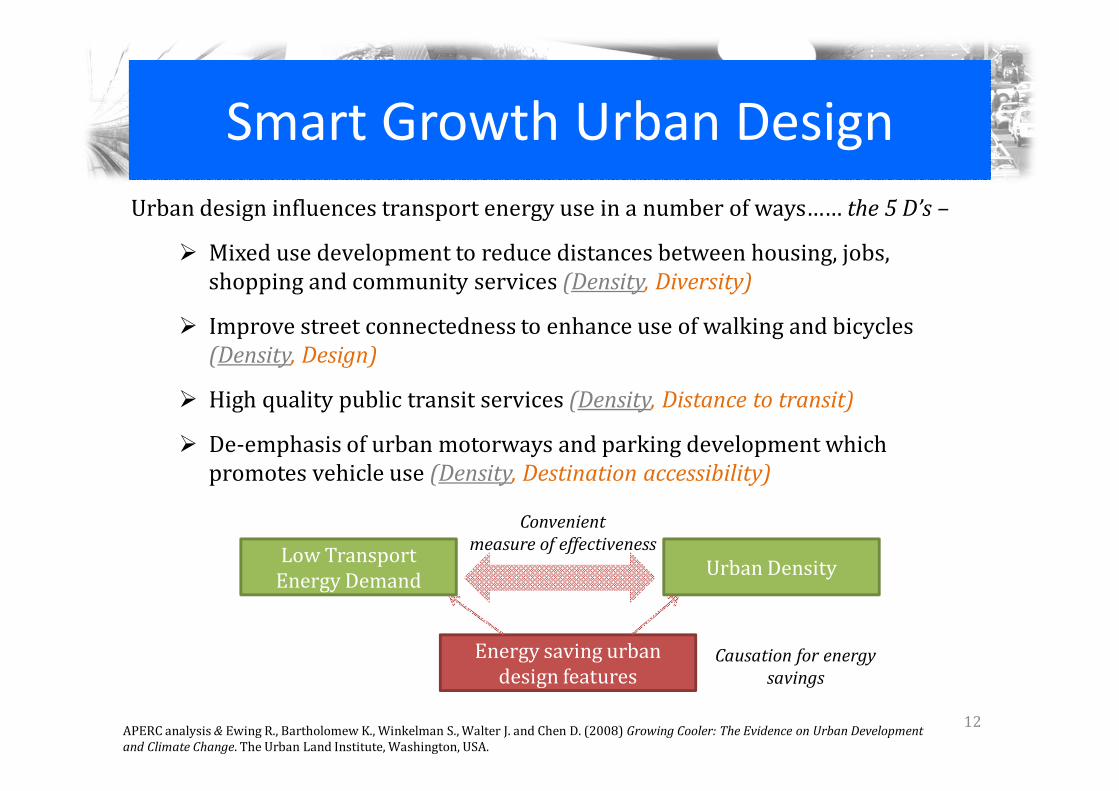
Smart Growth Urban Design
12
Urban design influences transport energy use in a number of ways…… the 5 D’s –
Ø Mixed use development to reduce distances between housing, jobs, shopping and community services (Density, Diversity)
Ø Improve street connectedness to enhance use of walking and bicycles (Density, Design)
Ø High quality public transit services (Density, Distance to transit)
Ø De-emphasis of urban motorways and parking development which promotes vehicle use (Density, Destination accessibility)
Energy saving urban design featuresLow Transport Energy Demand Urban DensityConvenient
measure of effectiveness
APERC analysis & Ewing R., Bartholomew K., Winkelman S., Walter J. and Chen D. (2008) Growing Cooler: The Evidence on Urban Development and Climate Change. The Urban Land Institute, Washington, USA.
Causation for energy savings
Akashi, JPN
Anging, CHN
Astrkhan, RUS
Bacolod, PHL
Bandung, IND
Chanzhi, CHNChinju, KOR
Cincinnati, USA
Fukuoka, JPN
Guadalajara, MEX
Guangzhou, CHN
Houston, USA
Ipoh, MAL
Kuala Lumpur, MALLeshan, CHN
Manilla, PHL
Minneapolis, USAModesto, USA
Moscow, RUS
Pusan, KOR
Songkhla, THA
Springfield, USA
St Cathariens, CANTijuana, MEX Victoria, CAN
Yiyang, CHN
Philadelphia, USA
05000
10000150002000025000300003500040000
0 5000 10000 15000 20000 25000 30000 35000 40000
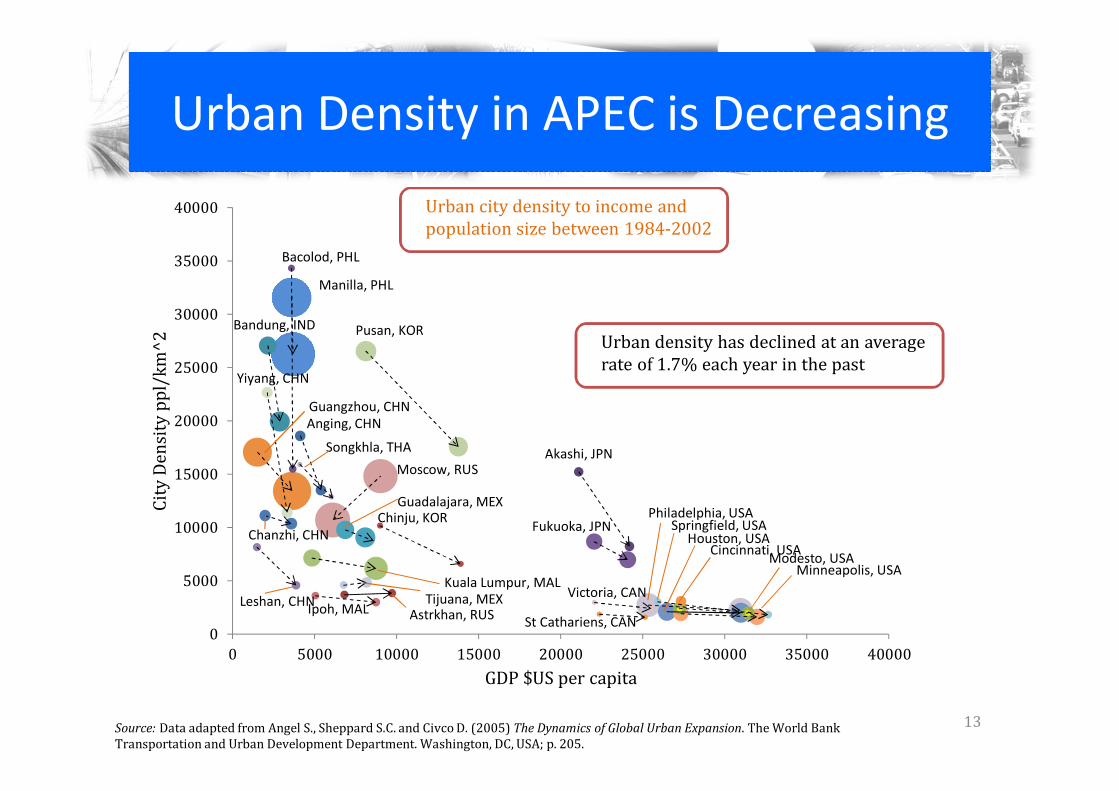
City Density p
pl/km^2
GDP $US per capita
Urban city density to income and population size between 1984-2002Urban Density in APEC is Decreasing
13Source: Data adapted from Angel S., Sheppard S.C. and Civco D. (2005) The Dynamics of Global Urban Expansion. The World Bank Transportation and Urban Development Department. Washington, DC, USA; p. 205.
Urban density has declined at an average rate of 1.7% each year in the past
Alternative Urban Development Scenario - Model
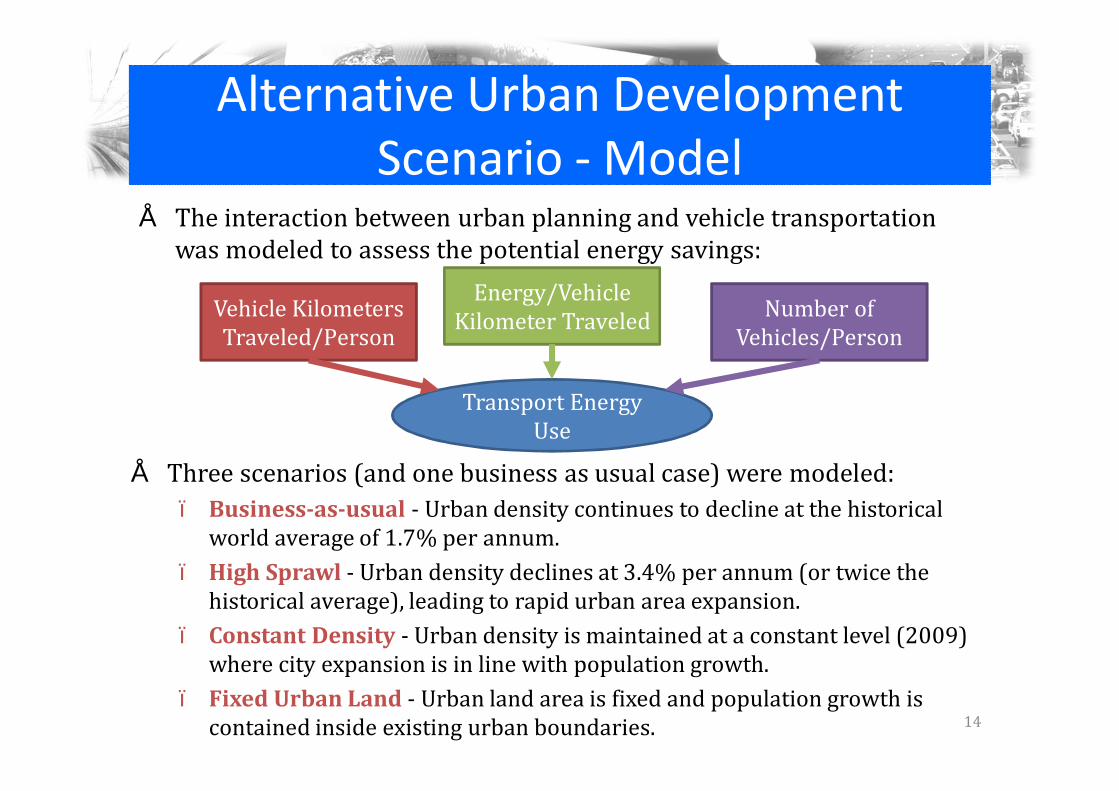
• The interaction between urban planning and vehicle transportation was modeled to assess the potential energy savings:
14
• Three scenarios (and one business as usual case) were modeled:– Business-as-usual - Urban density continues to decline at the historical world average of 1.7% per annum.– High Sprawl - Urban density declines at 3.4% per annum (or twice the historical average), leading to rapid urban area expansion.– Constant Density - Urban density is maintained at a constant level (2009) where city expansion is in line with population growth.– Fixed Urban Land - Urban land area is fixed and population growth is contained inside existing urban boundaries.
Vehicle Kilometers Traveled/Person Energy/Vehicle Kilometer Traveled Number of Vehicles/PersonTransport Energy Use
Key Findings
15
Virtual Clean Car–Overall Results for Oil Demand and CO2 Emissions
Source: APERC Analysis
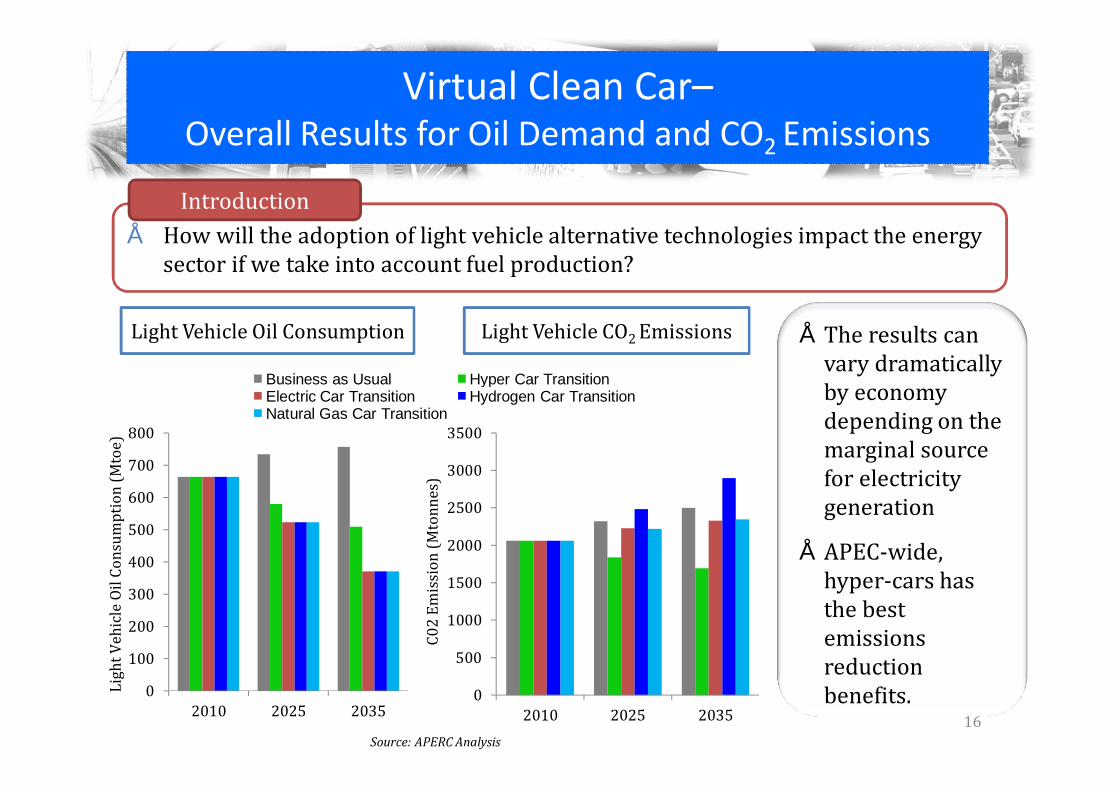
Light Vehicle Oil Consumption• How will the adoption of light vehicle alternative technologies impact the energy sector if we take into account fuel production?Introduction
Light Vehicle CO2 Emissions • The results can vary dramatically by economy depending on the marginal source for electricity generation• APEC-wide, hyper-cars has the best emissions reduction benefits. 0100200300400500600700800
2010 2025 2035Light Vehicle O
il Consumptio
n (Mtoe)
0500100015002000250030003500
2010 2025 2035
C02 Emission (
Mtonnes)
16
Business as Usual Hyper Car TransitionElectric Car Transition Hydrogen Car TransitionNatural Gas Car Transition
Virtual Clean Car–Results by Economy for CO2 Emissions
17
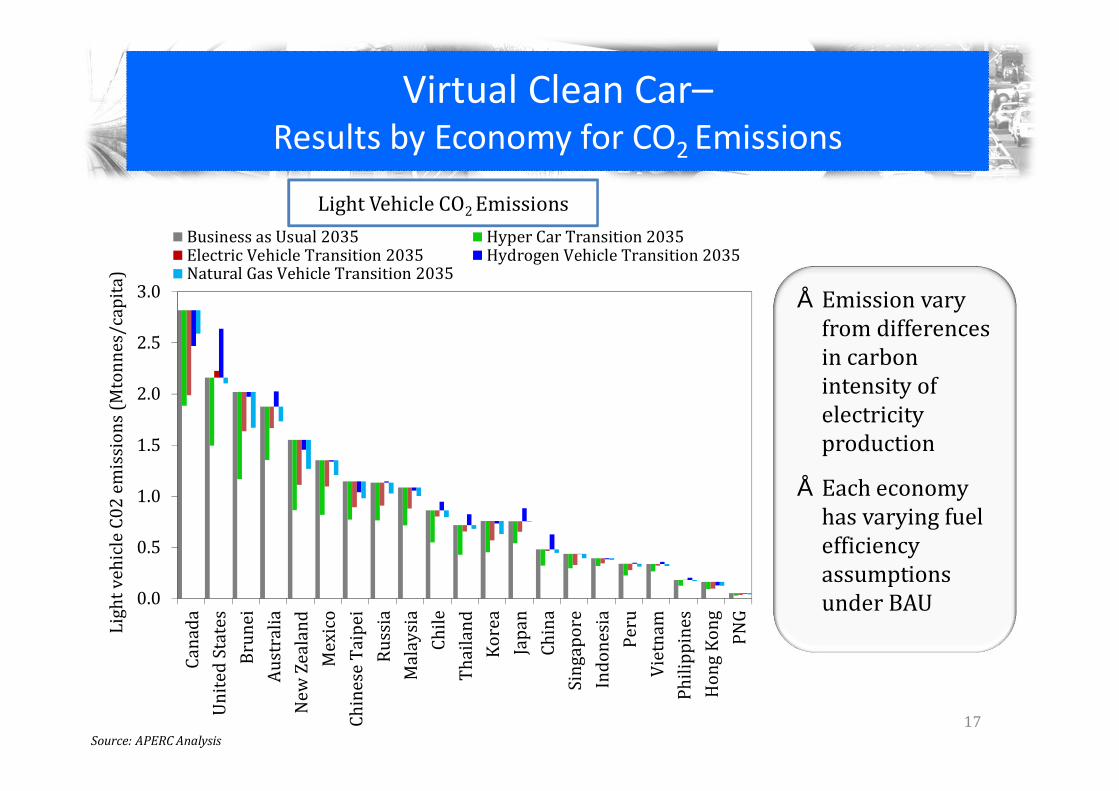
Light Vehicle CO2 EmissionsBIBJBKBLABCDAKALAMANEFGHUVWXACADAEAFBEBFBGBHAWAXAYAZAGAHAIAJBABBBCBDIJKLYZAAABMNOPAOAPAQARQRSTBMBNBOBPASATAUAV
0.00.51.01.52.02.53.0Canada United States Brunei Austra
liaNew Ze
aland MexicoChines
e Taipei Russia Malays
ia Chile Thailand Korea Japan China Singap
ore Indonesia Peru Vietnam Philipp
inesHong K
ong PNGLight vehicle C
02 emissions
(Mtonnes/cap
ita)Business as Usual 2035 Hyper Car Transition 2035Electric Vehicle Transition 2035 Hydrogen Vehicle Transition 2035Natural Gas Vehicle Transition 2035
Source: APERC Analysis
• Emission vary from differences in carbon intensity of electricity production• Each economy has varying fuel efficiency assumptions under BAU

Alternative Urban Development Scenario –Overall Results for Oil Demand and CO2 Emissions
18Source: APERC Analysis
Light Vehicle Oil Consumption• The rapid growth of APEC’s economies presents a unique opportunity to build cities in an energy efficient manner.Introduction
Light Vehicle CO2 Emissions• Compact cities
tend to favor transport energy-saving features in greater abundance• Results consistently show that cities with lower population densities has higher energy demand0500100015002000250030003500
2010 2025 2035
C02 Emissions
(Million tonne
s)
01002003004005006007008009001000
2010 2025 2035
MTOE
Buisness as Usual High Sprawl Constant Density Fixed Urban Land
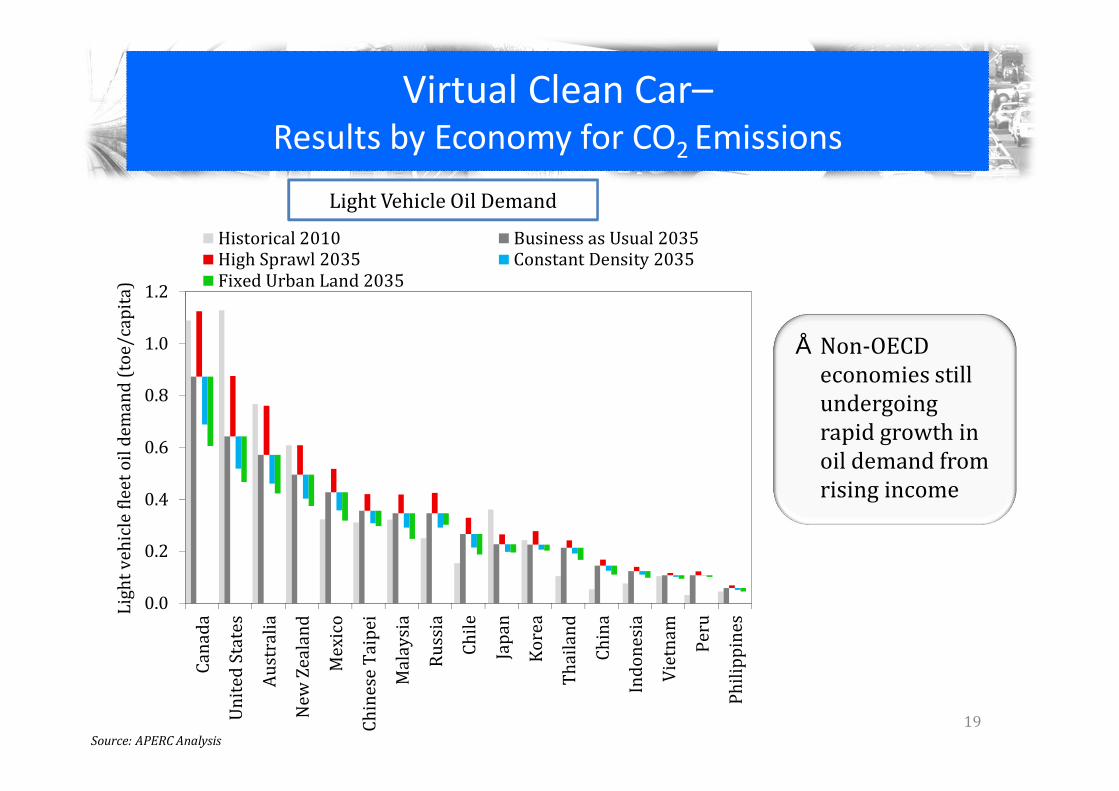
Virtual Clean Car–Results by Economy for CO2 Emissions
19
Light Vehicle Oil Demand• Non-OECD economies still undergoing rapid growth in oil demand from rising income
ABCDAKALAMANEFGHUVWXACADAEAFBEBFBGBHAWAXAYAZAGAHAIAJBABBBCBDIJKL YZAAABMNOPAOAPAQARQRSTBMBNBOBP
0.00.20.40.60.81.01.2
Canada United States Austra
liaNew Ze
aland MexicoChines
e Taipei
Malaysia Russia Chile Japan Korea Thailand China Indone
sia Vietnam PeruPhilipp
inesLight vehicle f
leet oil deman
d (toe/capita)
Historical 2010 Business as Usual 2035High Sprawl 2035 Constant Density 2035Fixed Urban Land 2035
Source: APERC Analysis
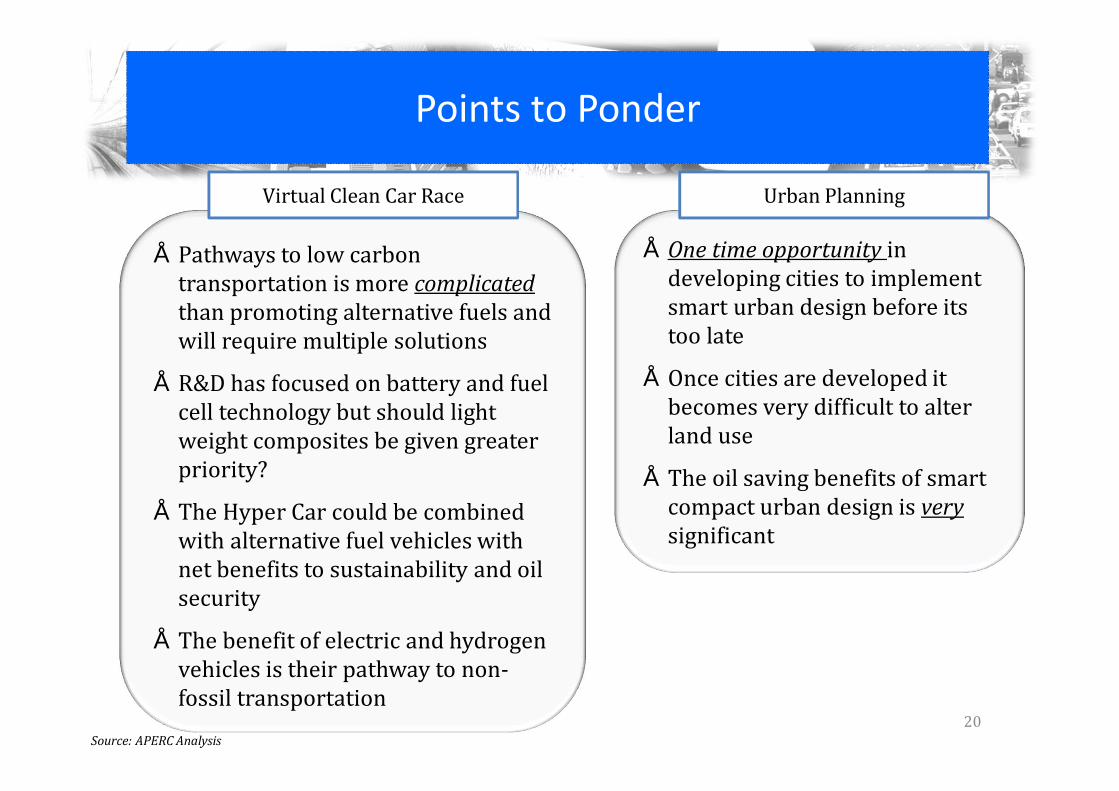
Points to Ponder
20Source: APERC Analysis
• Pathways to low carbon transportation is more complicated than promoting alternative fuels and will require multiple solutions• R&D has focused on battery and fuel cell technology but should light weight composites be given greater priority?• The Hyper Car could be combined with alternative fuel vehicles with net benefits to sustainability and oil security• The benefit of electric and hydrogen vehicles is their pathway to non-fossil transportation
• One time opportunity in developing cities to implement smart urban design before its too late• Once cities are developed it becomes very difficult to alter land use• The oil saving benefits of smart compact urban design is verysignificant
Virtual Clean Car Race Urban Planning