Embed Size (px)
Citation preview

32
Lektorica i prevoditeljica za engleski jezik /English Language Editor and TranslatorLjerka Radoš
Lektorica za hrvatski jezik /Croatian Language EditorEmina Berbić Kolar
Radovi objavljeni u časopisu referiraju se u:/ Indexed in:• CAB Abstract, Wallingford, United Kingdom• EconLit with Full Text, EBSCOhost, Ipswich,
USA• ABI/INFORM, ProQuest, London, United King-
dom• Hrčak – Portal znanstvenih časopisa Republike
Hrvatske (MZOS, Srce & HIDD)
Naklada / Edition150 primjeraka / copies
Godišnja pretplata / Annual subscription200 HRK / 30 €
Grafičko oblikovanje / Graphic DesignMIT d.o.o., Tenja
Tisak / Printed byIBL d.o.o., Tenja
Časopis izlazi dva puta godišnje /Published biannually
Adresa uredništva /Address of the editorial boardSveučilište Josipa Jurja Strossmayera u Osijeku,Ekonomski fakultet u OsijekuTrg Ljudevita Gaja 731000 OsijekCroatia
www.efos.unios.hr/ekonomski-vjesnikwww.efos.unios.hr/ekonomski-vjesnik/en/
Copyright© 2015 Sveučilište Josipa Jurja Strossmayera u Osijeku, Ekonomski fakultet u Osijeku
Prethodni naslov do prosinca 2013./Previous title to December 2013:
EKONOMSKI VJESNIKČasopis Ekonomskog fakulteta u Osijeku
Nakladnik / PublisherSVEUČILIŠTE JOSIPA JURJA STROSSMAYERA U OSIJEKU, EKONOMSKI FAKULTET U OSIJEKU / JOSIP JURAJ UNIVERSITY OF OSIJEK, FACULTY OF ECONOMICS IN OSIJEK
Glavni urednik / Editor-in-ChiefVladimir Cini, Josip Juraj Strossmayer University of Osijek, Faculty of Economics in Osijek, Croatia
Zamjenica glavnog urednika /Deputy Editor-in-ChiefSanja Pfeifer, Josip Juraj Strossmayer University of Osijek, Faculty of Economics in Osijek, Croatia
Počasna urednica / honorary editorSlavica Singer, Josip Juraj Strossmayer University of Osijek, Faculty of Economics in Osijek, Croatia
Izvršna urednica / Executive EditorJasminka Mihaljević, Josip Juraj Strossmayer Uni-versity of Osijek, Faculty of Economics in Osijek, Croatia
Urednik novak / Assistant EditorDario Šebalj, Josip Juraj Strossmayer University of Osijek, Faculty of Economics in Osijek, Croatia
Tehnički urednik/ Technical editorOto Wilhelm, Josip Juraj Strossmayer University of Osijek, Faculty of Economics in Osijek, Croatia
Uredništvo / Editorial BoardDražen Barković, Đula Borozan, Ivan Ferenčak, Jas-na Horvat, Mirna Leko Šimić, Marcel Meler, Josip Mesarić, Sunčica Oberman Peterka, Željko Požega, Domagoj Sajter, Nataša Šarlija, Antun Šundalić, Marijana Zekić Sušac, all from Josip Juraj Stross-mayer University of Osijek, Faculty of Economics in Osijek, Croatia, Maja Biljan – August, University of Rijeka, Faculty of Economics, Croatia, Suzana Marković, University of Rijeka, Faculty of Tourism and Hospitality Management, Croatia, Thomas Cleff and Regina Moczadlo, from Pforzheim Uni-versity, Faculty of Business and Law, Germany, Erzsebet Hetesi, University of Szeged, Faculty of Economics and Business Administration, Hunga-ry, Antal Szabo, Erenet, Hungary, Helena Maria Baptista Alves, University of Beira Interior, Depart-ment of Management and Economics, Portugal, Marius Gavriletea, Babes – Bolyai University, Fac-ulty of Business, Romania, Zsuzsanna Katalin Sza-bo, “Petru Maior” University, Faculty of Economics, Juridical and Administrative Sciences, Romania, Erich Schwarz, Alpen - Adria University of Kla-genfurt, Faculty of Management and Economics, Austria, Antti Paasio, University of Turku, Turku School of Economics, Finland, Irena Ograjenšek, University of Ljubljana, Faculty of Economics, Slo-venia, Miroslav Rebernik, University of Maribor, Faculty of Economics and Business, Slovenia, Igor Jakomin, University of Ljubljana, Faculty of Mari-time Studies and Transportation, Slovenia, Allan Gibb, Durham University, United Kingdom, Je-rome Katz, Saint Louis University, USA.
Review of contemporary business, entrepreneurship and economic issues
5
CONTENTS / SADRŽAJ
Original scientific articles / Izvorni znanstveni članci1. Safet Kozarević, Nerka Bešić .................................................................................................................... 9 Risk management in telecommunications services in Bosnia and Herzegovina Upravljanje rizicima u telekomunikacijskim uslugama u Bosni i Hercegovini
2. Marina Đukić, Ivica Šola .......................................................................................................................... 25 Preparing the public for commercialization and guidance of structural media space towards its fusion with advertising space Priprema javnosti za komercijalizaciju i usmjeravanje strukturalnog medijskog prostora za spajanje s oglašivačkim prostorom
3. Rory James Ridley-Duff ............................................................................................................................. 43 The FairShares Model: An ethical approach to social enterprise development? FairsShares model: Etičan pristup razvoju socijalnog poduzetništva?
Preliminary communications / Prethodna priopćenja1. Mario Banožić, Gabrijela Žalac, Marijana Sumpor ........................................................................... 69 Mapping of tourism potential: The preconditions for the development of tourism in Continental Croatia Mapiranje turističkog potencijala: Preduvjeti razvoja turizma u kontinentalnoj Hrvatskoj
2. Danimir Štros, Maja Coner, Daniel Bukovinski ................................................................................... 85 Management in rural areas Menadžment u ruralnom području
3. M. Mercedes Galán – Ladero, Clementina Galera – Casquet ........................................................... 97 The role of the retailers in cause-related marketing: A reference to the Spanish case Uloga trgovaca na malo u marketingu opće dobrobiti: Osvrt na španjolski slučaj
4. Ilija Nedić .................................................................................................................................................... 111 Break-even point in sugar-beet production Točka pokrića u proizvodnji šećerne repe
5. Jerko Glavaš, Luka Stanić, Damir Šebo: ................................................................................................ 129 The impact of the managers’ educational level on the development of the knowledge-based organizations: The case of insurance companies in Croatia Utjecaj razine obrazovanosti menadžera na razvoj organizacije temeljene na znanju: Slučaj osiguravajućih društava u Republici Hrvatskoj
6. Melita Balas Rant: ..................................................................................................................................... 143 Competing via creation of distinctive organizational competences: “How to do it” Natjecanje stvaranjem svojstvenih organizacijskih sposobnosti: „Kako to učiniti“
7. Dijana Mečev, Ivana Kardum Goleš: ...................................................................................................... 161 Primary healthcare service quality measurement: SeRvquAl scale Mjerenje kvalitete usluge u ustanovama primarne zdravstvene zaštite: SERvqUal ljestvica
8. Dražen Koški: .............................................................................................................................................. 179 Analyzing disequilibrium in the balance of payments: The case of Bosnia and Herzegovina analiza neravnoteže u bilanci plaćanja: Slučaj Bosne i Hercegovine
Review articles / Pregledni radovi1. Dražen Novaković ...................................................................................................................................... 199 evaluation of the financial performance of pension funds in Croatia Evaluacija financijske uspješnosti mirovinskih fondova u Hrvatskoj
2. Martina Harc .............................................................................................................................................. 213 The relationship between tangible assets and capital structure of small and medium-sized companies in Croatia veza između materijalne imovine i strukture kapitala malih i srednjih poduzeća u Hrvatskoj
3. Tomislav Galović ........................................................................................................................................ 225 The international competitiveness of the pharmaceutical industry within 21 oeCd countries Međunarodna konkurentost farmaceutske industrije 21 OEcd zemlje
4. Regina Moczadlo ........................................................................................................................................ 243 Creating competitive advantages – The european CSR-strategy compared with Porter’s and Kramer’s shared value approach Stvaranje konkurentske prednosti - europska strategija društveno odgovornoga poslovanja u usporedbi s Porterovim i Kramerovim konceptom zajedničke vrijednosti
5. Sabina Đonlagić, Samira Fazlić, Amra Nuhanović ............................................................................. 257 Introducing a framework for knowledge economy development in transition countries: The case of Bosnia and Herzegovina Uvođenje okvira za razvoj ekonomije znanja u tranzicijskim zemljama: Slučaj Bosne i Hercegovine
Conference reviews / Prikazi konferencija1. Jelena Franjković ........................................................................................................................................ 269 Prikaz Erasmus međunarodnog tjedna Savonia Sveučilište primijenjenih znanosti - Međunarodni tjedan 2015
2. Anita Frajman Ivković ............................................................................................................................... 271 europski eFoS tjedan 6. – 8. svibnja 2015.: Tvoja mogućnost za budućnost
3. Nives Tomašević ......................................................................................................................................... 273 Kreativna riznica: Popularizacijski simpozij kulturne i kreativne industrije ekonomskog fakulteta u osijeku
Upute autorima ................................................................................................................................. 277Guidelines for authors ....................................................................................................................... 279
4

Original scientific articlesIzvorni znanstveni članci
Safet Kozarević, Nerka BešićRisk management in telecommunications services in Bosnia and Herzegovina
Marina Đukić, Ivica ŠolaPreparing the public for commercialization and guidance of structural media space
towards its fusion with advertising space
Rory James Ridley-DuffThe FairShares Model: an ethical approach to social enterprise development?
9God. XXVIII, BR. 1/2015. str. 9-24
Abstract
In the last few decades, the issue of risk management has become an increasingly important aspect of every company’s business activities. Such views are more and more present in the service sector whose GDP share has registered a continuous growth within both national economies and on the global level. Intangi-bility and some other specific features of services when compared to physical products require a different approach to the activities in the field of risk management, particularly when it comes to capital intensive services such as telecommunications. This type of services is mainly provided within large companies that need to pay attention to the risk management process, from identification, risk evaluation to selection and application of the appropriate risk management method. Risk management methods include a group of methods for the physical control of risk and a group of methods for risk financing by means of risk retention or insurance. All these methods can be applied on a wide set of personal, property and liability risks met by the companies and employees in the telecommunications sector. The paper attempts to present an overview of the specific features of risk management in companies in the telecommunications sectors with the case study of the leading telecommunications service provider in Bosnia and Herzegovina. Keywords: Risk, risk management, insurance, accidents, telecommunications services, Bosnia and Herze-govina
RISK MANAGEMENT IN TELECOMMUNICATIONS SERVICES IN BOSNIA AND HERZEGOVINA
UDK: 65.011.3:621.39](497.6)Original scientific article
Received: January 22, 2015accepted for publishing: March 12, 2015
Safet Kozarević, Nerka Bešić:Risk management in telecommunications services in Bosnia and Herzegovina
Safet KozarevićUniversity of Tuzla Faculty of EconomicsUniverzitetska 8,75000 Tuzla,Bosnia and [email protected]: +38735320820
Nerka BešićBH Telecom, Sarajevo, Regional directorate Tuzlaaleja alije Izetbegovića,75000 Tuzla,Bosnia and [email protected]: +38761724083
1. Introduction
Dynamism, growing complexity of business, notice-able competitiveness, and the global market liber-alization lead to exposure to various risks met by economic subjects within their business activities. In other words, risks appear, transform, join and cumulate, which endangers the company’s business and its supply chains. That is precisely the reason why risk management needs to be given special at-tention within supply chain management.
Modern business conditions result in the need for risk management to be an integral part of every company’s business strategy. The company’s man-agement is well aware that good risk management can help a lot in the reduction of business costs. Risk management aims at protecting the company’s property and profit by decreasing potentials for loss and timely discovering new, still unidentified risks that can lead to potential losses (Corbett, 2004; Hodges, 2000).
10 11God. XXVIII, BR. 1/2015. str. 9-24 God. XXVIII, BR. 1/2015. str. 9-24
UDK: 65.011.3:621.39](497.6) / Original scientific articleSafet Kozarević, Nerka Bešić:Risk management in telecommunications services in Bosnia and Herzegovina
Christopher’s (2005) definition of supply chain management as “the management of upstream and downstream relationships with suppliers and cus-tomers to deliver superior customer value at less costs to the supply chain as a whole” shows how important risk management is for supply chains to-day (Bandaly et al., 2012; Ritchie and Brindley, 2007; Singhal et al., 2011). This is particularly evident in the service sector where, due to the specificities of the service product in comparison to the traditional supply chains, the risk management process is far more difficult to organize. It is very important to define the scope within which risks would be ob-served. The latest stage in the evolution of risk man-agement is Enterprise Risk Management (ERM) which represents a holistic approach to risk man-agement. It includes the correlation among various risks aimed at minimizing risk exposure for a com-pany as whole, whether the risks come from natural or political, economic, and technical sources. Now-adays, ERM has a very significant role in the regula-tion and business of financial institutions, primarily banks (Cumming and Hirtle, 2001; Rouse, 2004; Wu and Olson, 2010).
When considering risk exposure, a particular im-portance for economic subjects is given to personal, property, and liability risks, and they will be given the central position in this paper. These are pure risks that are the consequence of chance where the possible outcomes are either “loss” or “no loss”, meaning that there is no possibility for a profit as with the speculative risks (Kozarević, 2010). Since a part of an organization’s wealth is created by in-vesting into human resources, the possibility for an injury or death of an employee can cause significant loss to that organization. The specificity of these risks lies in the fact that they are related to an in-dividual (employee), which is why managing these risks can be treated as personal risk management. Namely, both companies and individuals (regard-less of the company’s interest) are interested in these risks. Also, the property provides its owners various benefits, depending on how they use it. Its value can drop or be lost due to a wide range of perils, which cause multiple losses. Property includes movable or immovable goods and/or rights in the company’s ownership, which can be represented by money and therefore has a certain value. Also, within its busi-ness activity, a company may cause losses for third parties by exposing itself to numerous liability-related risks that, whether the issue is intention or employees’ negligence, require a special approach
in the stage of identification and evaluation of these parties’ risk exposure. It is important to emphasize that the legislative system imposes various types of liability which is why it is important to discuss the risks that carry this type of liability. Therefore, the company needs to continuously monitor, measure, and find the methods for pure risk management.
Within every national economy, the sector of tel-ecommunications stands out as a specific segment of the service sector (Wu et al., 2011). This sector is characterized by increasing competition and a new generation of telecommunication networks which requires that the telecommunications sector com-panies redefine their role on the market and create new business models so as to create new sources of profits. These problems do not skirt small econo-mies such as the one of Bosnia and Herzegovina (BIH). Regarding this, the constant introduction of new services, investment into new infrastructure networks, change in employee number as well as changes in professional qualifications of employ-ees may have a significant impact on the number or work-related accidents as well as on the occurrence of potential loss on the company’s property and loss to third parties. Since modern business activi-ties in the telecommunications sector are challeng-ing in every respect, including the establishment of business security, where everything is planned and ultimately controlled, it is crucial to understand and predict personal, property and liability risks of potential sudden and unwanted losses. This is cer-tainly one of the most important issues in all stages of supply chain logistics management (Agrell et al., 2004; Bowersox et al., 2002).
The general aim of this paper is to determine the efficiency of the existing procedures for pure risk management, the efficiency of risk transfer by means of insurance, as well as the possibility for im-proving the existing situation in the telecommuni-cations sector in BIH by determining the key factors that are crucial for the efficiency of the risk manage-ment process. Therefore, the focus is on the largest telecommunications provider on the market of BIH, BH Telecom d.d. Sarajevo (joint stock company).
Section 1 introduces the research problem and presents a review of previous researches. Section 2 presents the theoretical background. Section 3 pro-vides the methodology of empirical research, and Section 4 presents the results and discussion of the case study of BH Telecom, while Section 5 wraps up the conclusions.
2. Theoretical background2.1 Specificities of risks and risk management in
telecommunications services
Today, the telecommunication network presents a “central nervous system” of the world economy. The telecommunications services sector is also a factor of the integration process in a society as well as a factor of the creation of a single market and globali-zation in business. Besides that, it is largely depend-ent on the level of development of a certain region in terms of technical-technological and socio-eco-nomic contexts. In addition, it also depends on the regulatory frameworks, both national and interna-tional (Pejčić-Tarle et al., 2005).
If we observe pure risks management in the tel-ecommunications sector, it is necessary to take into consideration the specificities of this sector. In other words, teletraffic is a complex phenomenon of providing the services of the transfer of various forms of information by activating the resources of the telecommunication network. Along with the accompanying processes and the technology that makes them possible, it is a significant source of various types of perils and possible accidents (Bošnjak, 2001; Ernst and Young, 2010). The risks in this sector also need to be analyzed in the context of the efforts to reduce the impact of these services on the environment, which have been labeled as green supply chain management (Swami and Shah, 2010). Provided that we start from personal risks, the spe-cificities of the risks to which human resources are exposed come from the fact that a significant num-ber of employees in this sector spend most of their working life on the tasks of building new and main-taining the existing telecommunication networks. In the process, they are in a potentially dangerous environment that can jeopardize their health and life. Some jobs are more exposed to risks than oth-ers, which is why knowing the employee structure and their business tasks is necessary for the identi-fication of the mentioned risks. Also, when it comes to the important company staff members, who have particular knowledge and skills, their exposure to risks is an important segment of the company’s business and it is necessary to plan special pro-grams for the risks to which they are exposed. By appropriate procedures for managing such risks the company casts off a great burden and directs more energy to other business issues. Aimed at improving personal risk management, special attention should
be given to staff training and education. Well-trained staff shall significantly reduce the number of workplace accidents and in case of an accident react better which reduces its negative consequenc-es. Also, a well trained employee shall have a higher productivity.
Perils that the property of telecommunications companies is exposed to are basically related to physical, social and economic sources (Williams et al., 1998). Physical perils are related to natural forc-es such as fire, storm, etc. while social perils are re-lated to individuals’ deviant behavior (such as theft, violence, frauds). Economic perils can be internal (such as inappropriate storage of products) and ex-ternal (for example a business partner’s breaking the contract due to a crisis in its industry). The level of exposure to property risks largely depends on the type of property which the company has, to what extent the property is used, and on the scope of the company’s activities. A drop in property value, lost profit and increased costs are negative financial ef-fects of property losses. Technical complexity of the telecommunications system, its high material value, the need for constant functioning of the supply chain, as well as a high level of sensitivity to vari-ous possible disorders characterize the property of the telecommunications sector. All the mentioned emphasized the importance of identification, evalu-ation, and application of appropriate methods for managing property risks in the telecommunica-tions sector in BIH. Namely, the most important property items of the telecommunications compa-nies are fixed intangible assets (patents, licenses, trademarks, software, etc) and tangible assets that include real estate, plants and equipment. Due to the fact that these are all highly valuable elements of business property, potential loss can significantly jeopardize a company’s business. Therefore, the analysis of the existing situation in the construction, security, and maintenance is the basis for identify-ing and evaluating property risks. The liability risks for the losses caused to third parties during business activities can materially endanger and have reper-cussions on regular business activities of a com-pany. That is the reason why an efficient system of managing these risks is also an important segment of a company’s business.
12 13
2.2 Place or risk management in the organiza-tional structure of companies in the telecom-munications sector
The companies in the telecommunications sector in BIH are in the category of large companies. In that context, it is necessary to provide an appropri-ate organizational solution by which the process of risk management would be improved. Besides the strategy and policy of risk management, meaning the procedures for identifying and evaluating risk, a successful and efficient system of the company’s risk management also includes appropriate organi-zational structures of a company (Andersen, 2010). Under modern economic conditions and rapid mar-ket changes that significantly affect the organization of a company’s business activities, it is an impera-tive to establish such an organizational structure that would provide the necessary flexibility and the basis for protection against potential risks of the company (Corvellec, 2009).
Due to the relation among various risks that a busi-ness organization is exposed to, a comprehensive approach to risks and coordination among various departments and levels of management increase the probability for the provision of the right programs for risk management (Klinke and Renn, 2002). The company’s sectors and services need to be aware of the risks that occur as a consequence of their eve-ryday activities and liabilities in the supply chain. The scopes of management responsibility clearly include the management of risk identification and care for the safety of employees and company’s as-sets. Proceeding from this, the company’s manage-ment becomes aware of the fact that the function of risk management, when compared to other func-tions in the company, significantly reduces the total business costs. Consequently, the importance and complexity of this managerial function increases day by day (Ward, 2003). The role of particular busi-ness functions in the process of risk management is observed from the aspect of their involvement in the stages of identification and evaluation of the present risks of a company.
2.3 Methods for risk management in the compa-nies in the telecommunications sector
Along with the development of the risk manage-ment process, numerous methods were developed
for risk management, based on the postulates of statistics, mathematics, financial and actuarial mathematics, etc. Balancing between the profit or the benefits that a certain method brings and the costs it creates is the basic criterion for selecting the method for risk management in the companies in the telecommunications sector. In some cases, out-er influence such as state regulations can affect the selection of the method. However, even when such initiatives do not exist, some technique for manag-ing risks must be used due to the following (Wil-liams et al., 1998):
• costs of financing the emerged risk are usually higher than the costs for its prevention and/or reduction of its consequences,
• loss usually creates indirect or hidden costs that are frequently revealed only much later, and
• loss can have an effect on the environment of the given company.
If the loss is of high probability and intensity, the only practical alternative is to avoid such risk. Risk avoidance includes avoiding the property, person, or the activity that can cause the losses. By avoid-ing risk, the companies in the telecommunications sector become certain that no potential loss would happen. However, bearing in mind the fact that risks act in a combination, accepting the decisions on risk avoidance can mean creating new or ex-panding the existing risks of the company. Also, the companies in the telecommunications sector are not able to avoid all the risks since some of the risks must be taken due to the nature of the service. That is why risk avoidance is usually not an acceptable option. Finally, it should be mentioned that risk can be so important for the company’s existence that its avoidance can in no way be taken into consid-eration, as is the case in mining (Evans et al., 2007; Komljenovic and Kecojevic, 2007; Kozarevic et al., 2013).
One of the more important ways of risk manage-ment is the prevention or reduction of loss prob-ability. It is a set of procedures and methods that act in the direction of potential sources of peril with the aim of preventing the occurrence of an accident. The application of modern methods of prevention and prevention engineering (safety protection on machines and equipment, constant controls of equipment, appliances, etc.) is the most efficient way of physical management of risks and they have a noticeable effect on risk occurrence and its devel-
God. XXVIII, BR. 1/2015. str. 9-24 God. XXVIII, BR. 1/2015. str. 9-24
UDK: 65.011.3:621.39](497.6) / Original scientific articleSafet Kozarević, Nerka Bešić:Risk management in telecommunications services in Bosnia and Herzegovina
opment. Besides the measures of technical protec-tion, risks are physically controlled by employees as well. Regarding this, constant education of employ-ees is needed in the field of work protection and fire protection, which enables proper handling of the work system in the companies in the telecommuni-cations sector. This significantly affects the absence or reduction of physical property risks.
Although the measures of loss reduction can be planned even before the occurrence of an accident, their basic function is to eliminate the effect of dam-age during their occurrence. By this technique, the companies in the telecommunications sector try to reduce the intensity of the potential damage using fire-prevention systems, limiting cash at the cash office, installing burglar-proof systems, etc.
The methods of financing risks ensure the resources for covering the damage by using internal and exter-nal resources. Internal financing is also called risk retention while the external financing includes the transfer of risks by means of insurance, contracts, etc. The inability to physically control all the risks present in the companies in the telecommunica-tions sector indicates that they need to be financed.
The method of risk retention implies that the iden-tified and evaluated risk is retained completely or partially. This method enables a simpler and faster way to cover the entire loss, neglecting the evalu-ated amount of the lost profit that occurred as the consequences of teletraffic loss. Also, risk retention as the method of risk financing is in many cases the best possible way for managing the risks that result in relatively small losses.
Insurance is the most appropriate method for man-aging the risks with the low probability and high amount of potential loss. By managing risks in the telecommunications sector by means of insurance, the potential loss, meaning the uncertain financial expenditure, turns into a definite cost, that is, in-surance premium. In that way, business activities are protected from potential costs that cannot be built into the business planning, as it can be done by means of an insurance premium that is a certain cost of the company’s business. Bearing in mind the aforementioned, insurance is not the cost but rather the investment that can prevent significant financial losses in business activities of the telecommunica-tions companies due to the sudden losses. For the risks with the high probability of loss, the insurance method is not the proper way to manage risk, since
the higher the probability the higher the premium paid for insurance. Therefore, if the method of risk transfer is used, there always needs to be a reasona-ble relation between the transfer costs and the value that is transferred. This means that one should not retain the risk with the potential loss that is high when compared to the premium saved by retaining the risk.
3. Methodology - Case study: BH Telecom
The telecommunications providers on the market of BIH are BH Telecom d.d. Sarajevo, M:tel a.d. Banja Luka and Hrvatske telekomunikacije d.d. Mostar. This research was conducted at BH Telecom d.d. Sarajevo, as the leading provider on the BIH mar-ket. A large number of employees at BH Telecom have jobs with special work conditions. They are exposed to the danger of working with electrical equipment and at heights to construct and maintain the telecommunication network, while the fitting and work with optic fibers can be dangerous due to fire caused by flammable matters. Consequently, one telecommunications activity demands various operations or functions that include the possibility of an injury or disease that was the consequence of dangerous exposure.
It is a fact that in 2012 BH Telecom had assets worth over EUR 700 million, out of which almost 50% belong to material assets. It is an indicator that particular attention should be paid to this type of property, with the aim of protecting it from vari-ous risks. The most important property items are immovables, plants and equipment. This is an im-portant value of business property where potential damage can evidently jeopardize the company’s business. The basic part of the material assets are access networks, the cable channel system, gener-ating plant and transmission devices, antenna pil-lars and towers as well as the stock of equipment and investment material that are also threatened by various types of danger.
3.1 Risk management methods
Based on the knowledge of the probability of occur-rence and size of potential loss, various methods of control and financing for risk management are used
14 15
in BH Telecom. The prevention method is used for both personal and property risks. Aimed at manag-ing the risks of poor health, the preventive system-atic examinations of employees are taken for early detection of chronic illnesses, illnesses that can be worsened by work, and for the purpose of preserv-ing the health and work abilities of employees. The company also secures preventive examinations for the workers who are hired for the jobs with special work conditions and for those who are transferred to such positions. In terms of property risks, serious technical prevention measures are taken against the risks such as surveillance cameras, a fire protection system and alarm, systems for fire detection and au-tomatic fire fighting systems (sprinkler, COD, foam, powder, steam, as well as hand firefighting equip-ment: movable fire distinguishers, hydrant, heat detectors, etc.)
At the places where there is a higher probability of the occurrence of fire, special measures of fire pro-tection are taken, depending on the materials and matters handled. Special measures of fire protec-tion refer to the rooms of electric power plants for supplying telecommunications devices. Aimed at the protection of this equipment, special attention should be given to the elimination of all the causes that can lead to a fire as well as to the usage of sever-al specialized fire fighting systems. Also, monitoring and data collection on the condition and application of fire protection measures are made, as well as the training program for the staff in the field of fire pro-tection. Besides the measures of technical protec-tion, certain measures of physical protection are implemented (such as outsourcing for security per-sonnel) that refer to the prevention and discovering harmful events and anti-burglary activities that can result in property loss or put the lives of employees in danger. For the purpose of protecting the prop-erty values, preventive maintenance is performed on access networks, the systems of terminal equip-ment and all other telecommunications equipment in order to ensure proper operating condition and decrease the probability of failure occurrence.
Regarding the risk financing methods, a special role is given to the transfer of risks by means of insur-ance. Besides employee’s accident insurance, a sig-nificant part of the property is insured from various risks with some liability risks insured as well. Apart from insurance, other types of risk transfer are rare-ly used, while a significant part of the risk is retained by the company.
3.2 Model
Developing the system for risk management at the telecommunications sector has improved the deci-sion making processes in terms of risk. It enables controlled separation of activities, contributes to the efficient allocation of capital and the company’s resources, and protects and increases the company’s assets. Starting from the theoretical background described in the previous sections of this paper, we can formulate the model of risk management as the function of three key factors:
RME = f (S, M, O)
where:RME – Risk management efficiency,S – Strategic approach,M – Risk management methods adequacy,O – Organization of risk management.
3.3 Methodology of empirical research
In order to define the exact indicators of the effi-ciency of the risk management processes at BH Telecom, the primary research was conducted. The data were gathered by means of a survey with a questionnaire especially made for this purpose. The questionnaire included the questions related to various aspects of risk management. A significant number of them were structured in such a way that the answers were presented in a form of a scale from 1 (the worst) to 5 (the best world’s practice). In ad-dition, the subjects answered some of the questions by selecting one or more answers offered, so after every question, the subjects had the option to insert comments, additional remarks and suggestions.
The first part of the questionnaire, Risk manage-ment process, is in terms of contents the largest and aimed at determining the level of the subjects’ un-derstanding of the risk management process. There-fore, the questions are formulated so as to enable the evaluation of the application of various methods for risk identification, risk evaluation, and risk man-agement. The responsibilities regarding risks and adaptation of the existing organizational structure of the company to the risk management process are also problematized in this part of the questionnaire.
Due to a wider discussion of the whole issue of the
God. XXVIII, BR. 1/2015. str. 9-24 God. XXVIII, BR. 1/2015. str. 9-24
UDK: 65.011.3:621.39](497.6) / Original scientific articleSafet Kozarević, Nerka Bešić:Risk management in telecommunications services in Bosnia and Herzegovina
risk management process, the risks that go beyond the framework of pure risks are briefly presented in the second part of the questionnaire Business risks. This part is dedicated to the identification and eval-uation of market risks caused by unexpected market disturbances and economic fluctuation. The issues of the company’s readiness to identify various finan-cial risks as well as the changes that emerged in the legal environment are also processed in this part of the questionnaire.
The third part of the questionnaire called Person-al risks covers the procedure of identification and evaluation of risks to which employees are exposed, in terms of safety and protection at work through the assessment of efficiency levels of defined and adopted procedures/instructions of the company.
The fourth part of the questionnaire, Property risks, presents the issue of property risks from the aspect of performing constant identification and evalu-ation of property risks and assessing the level of presence of a certain method for insurance against property risks. The questionnaire also discussed the issue of application and efficiency of the existing procedures for insurance of property through their implementation.
The fifth part of the questionnaire, liability risks, describes the procedure of identification and evalu-ation of the company’s liability risks as well as the level of the presence of insurance against this type of risk.
The questions in the last, sixth part of the question-naire named Resources are limited to those key risks that are related to investing into technology and equipment that support organization units in man-aging risks (report software, data bases on potential and present risks, etc.) along with the education of employees in the segment of risk management.
The data were collected by means of an on-line sur-vey, while the questionnaires were distributed by sending an e-mail to the subjects. The total num-ber of filled questionnaires was 53. Within every organization unit there was a survey of all relevant employees who were competent enough to evalu-ate this specific segment of management and whose perceptions need to be acknowledged during the evaluation of the efficiency of the entire risk man-agement process. These are usually the members of the company’s management (board of directors, heads of organizational units, department heads etc.) as well as the bodies of control and revision (in-
ternal control and audit department). Therefore, the research sample was designed as the expert sample based on long-term experience and knowledge of the subjects.
4. Results and discussion4.1 Descriptive analysis
According to the subjects, risk identification is mostly based on various types of reports on busi-ness while more complex techniques for risk identi-fication such as SWOT analysis, analysis of indirect perils, and flow chart diagrams are rarely used. It is obvious that risks are observed primarily from the point of view of business risks.
It is necessary to provide constant analysis and evaluation of risk in order to achieve early identi-fication of the company’s risks, understand their consequences and evaluate the probability of the occurrence of any type of loss, so that the problems could be prevented where possible and the com-pany prepared for unexpected situations. The larg-est number of the subjects (48%) believes that risk evaluation is mainly based on the usage of statistical methods, followed by the analysis of past experi-ence (46%) and expert evaluation (28%).
The subjects emphasized employees’ education (18%) and insurance (17%) as the most present methods for risk management. Only 15% of the subjects think that risk can be controlled and that risk protection is not only the use of the insurance method but also the use of prevention measures. It is also evident that in their relations with business partners, the company makes appropriate guaran-tees (bank guarantees) that are an integral part of the concluded contracts. Capital reserves are rarely set aside in case of emergency, which can be explained by significant usage of the insurance method in the company, while risk retention is mentioned in only 8% of the cases.
Due to the mutual relations among the risks to which a business organization is exposed, an inte-gral approach to risks and coordination among vari-ous departments and management levels increases the probability that the right programs for risk man-agement would be provided. Based on the subjects’ attitudes, it is evident that various departments and management levels take care of risk management. A total of 54% of the subjects believe that this task
16 17
is usually performed by the heads of organizational units, 48% of them think that this is mainly done by the company’s board of directors, while 12% of the subjects think that the company’s owners par-ticipate the least in the process or risk management.
Appropriate communication related to employees being informed on risk management is confirmed by 73% of the subjects while 27% of them gave nega-tive answers. This confirms that, due to a heteroge-neous nature of risk in the telecommunications sec-tor, employees are familiar with the framework for its management. Also, it is evident that the culture of risk as the general awareness of the existence of risks at all management levels as well as the attitude and behavior of employees regarding risks are at a desirable level. This also shows that there is an effi-cient communication and cooperation at all organi-zational levels when the risk management process is concerned.
For the purpose of identification, evaluation, con-trol and supervision of risks, numerous reports are made, analyzed and presented to the management. By the adopted procedures the company specifies regular monthly reporting to the management on the following: positive and negative changes and business indicators; the situation with work pro-tection with the suggested improvement measures aimed at reducing labor related injuries and provid-ing a higher level of safety; important internal losses and damage of the company’s property; the number of reported and paid damage claims by means of in-surance; etc.
As many as 90% of the subjects think that the com-pany has an efficient system of internal control over risk management with the aim of monitoring the efficiency of the company’s business, reliability of fi-nancial and other types of information, harmoniza-tion with regulations, procedures, internal acts and standards of the company.
As many as 38% of the subjects believe that the com-pany insures all its property exposed to risks, while 54% of them think that the company insures over 50% of its property. This proves that insurance is the most present method for managing a company’s property risks. This confirms that the importance and efficiency of this risk management instrument was recognized as one of the most appropriate ways for managing property risks.
Seventy-three percent of the subjects confirm that the company gives special attention to risks to which their employees are exposed. Thus, for the purpose of higher protection of workers, all employees are accident insured. Also, 63% of the subjects state that the company insures all its important exposure to liability risks.
Adopting business policies and procedures for risk management, which need to be integrated into the current activities of the company, is one of the more important steps taken with the aim of efficient risk management. Based on 91% of the positive answers given by the subjects, it is possible to state that the company has developed procedures for insuring property risks, personal risks and liability risks that entirely satisfy the company’s needs. This is also confirmed by the documents related to the proce-dure of reporting, registering, evaluating and liq-uidating losses on the basis of insurance contracts made by the company. Also, the company constant-ly educates its staff through permanent upgrading of their knowledge and skills in the field of risk man-agement.
4.2 Factor analysis
For the purpose of recognizing the key factors that are crucial for the efficiency of risk management, the collected responses on a 1-5 scale were pro-cessed by the application of the method of factorial analysis. By this method a higher number of vari-ables are decreased to a smaller number of the ba-sic variables that affect the development of the risk management process. Determining the basic factors that affect the development of the risk management process should help the company’s management in improving risk management.
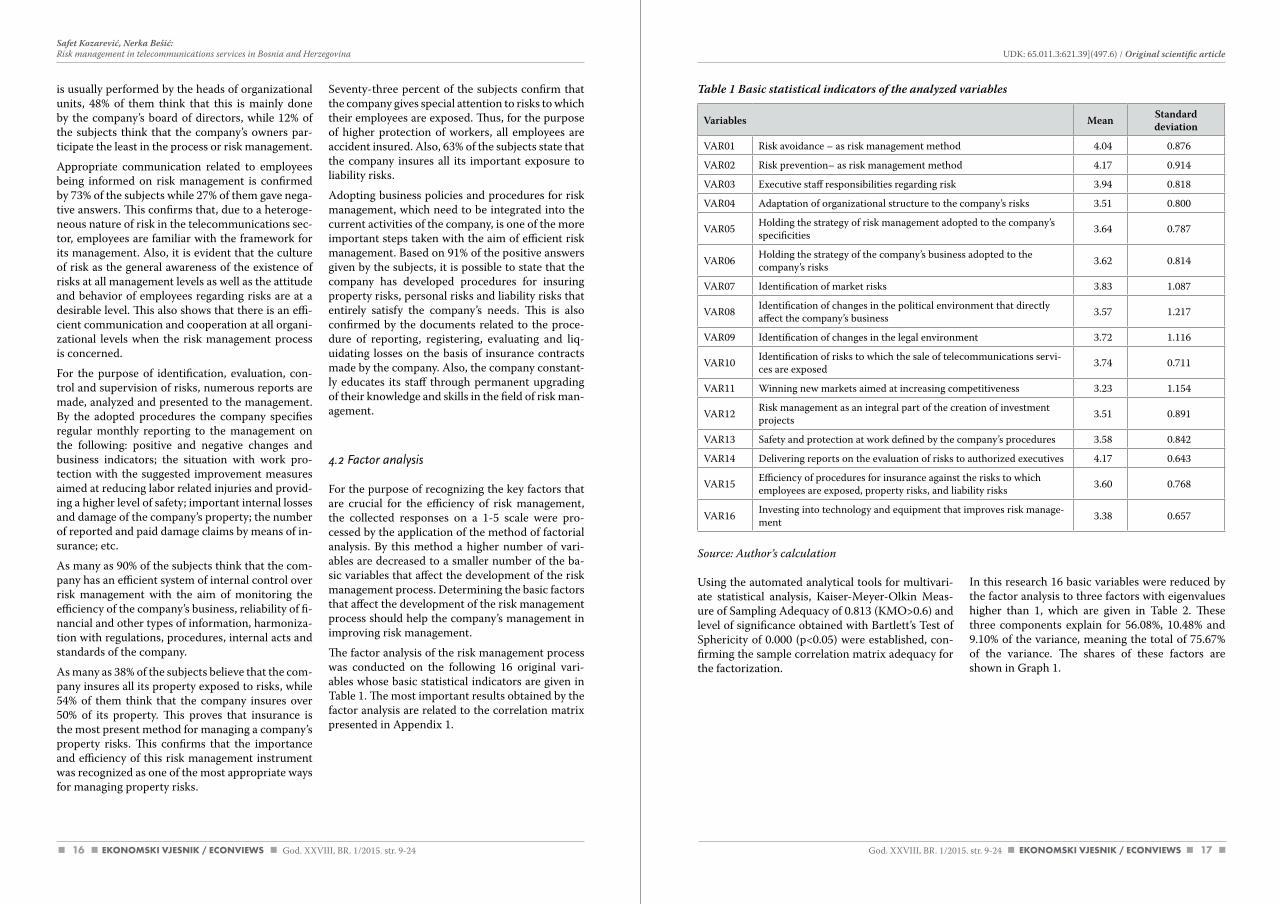
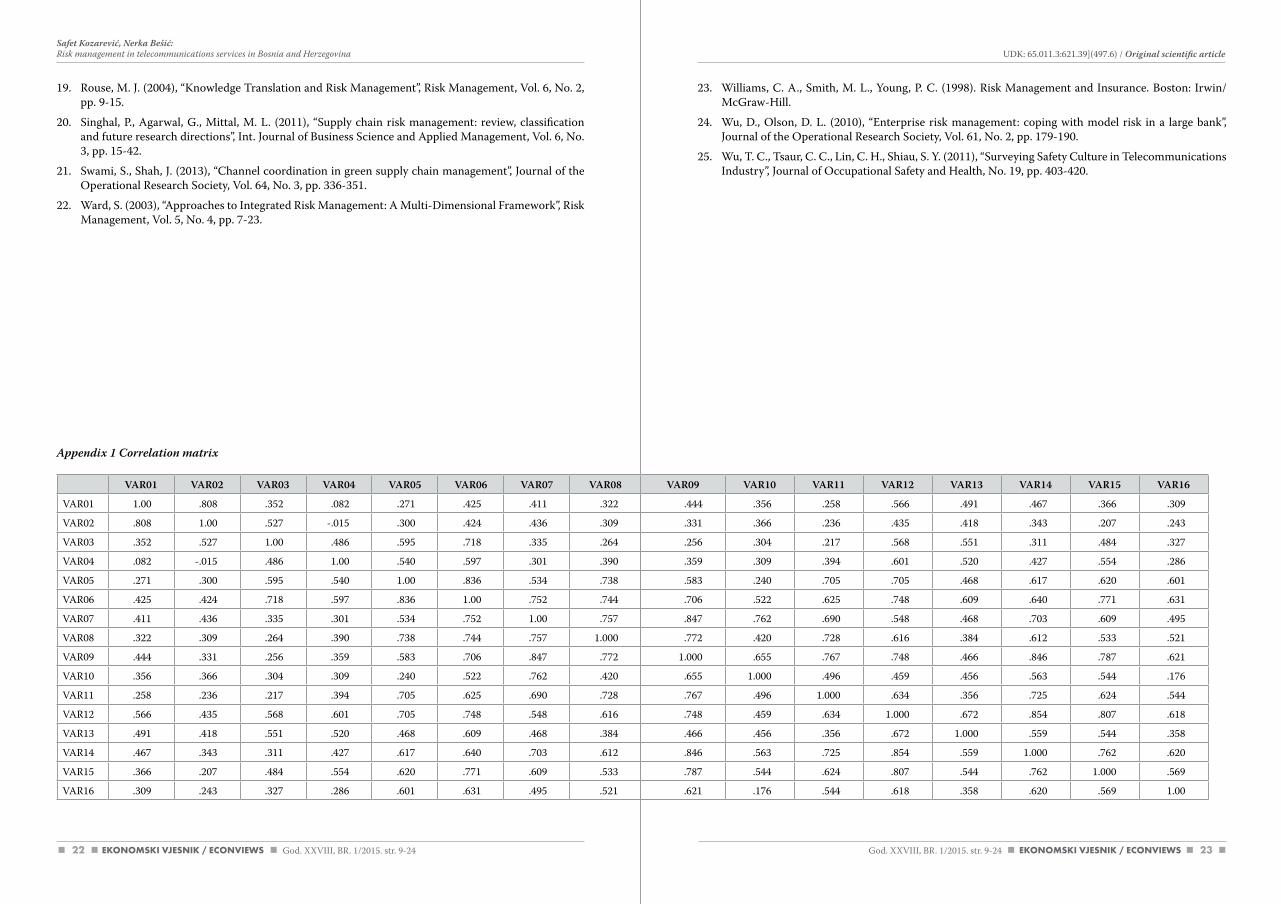
The factor analysis of the risk management process was conducted on the following 16 original vari-ables whose basic statistical indicators are given in Table 1. The most important results obtained by the factor analysis are related to the correlation matrix presented in Appendix 1.
Variables Mean Standarddeviation
VAR01 Risk avoidance – as risk management method 4.04 0.876
VAR02 Risk prevention– as risk management method 4.17 0.914
VAR03 Executive staff responsibilities regarding risk 3.94 0.818
VAR04 Adaptation of organizational structure to the company’s risks 3.51 0.800
VAR05 Holding the strategy of risk management adopted to the company’s specificities 3.64 0.787
VAR06 Holding the strategy of the company’s business adopted to the company’s risks 3.62 0.814
VAR07 Identification of market risks 3.83 1.087
VAR08 Identification of changes in the political environment that directly affect the company’s business 3.57 1.217
VAR09 Identification of changes in the legal environment 3.72 1.116
VAR10 Identification of risks to which the sale of telecommunications servi-ces are exposed 3.74 0.711
VAR11 Winning new markets aimed at increasing competitiveness 3.23 1.154
VAR12 Risk management as an integral part of the creation of investment projects 3.51 0.891
VAR13 Safety and protection at work defined by the company’s procedures 3.58 0.842
VAR14 Delivering reports on the evaluation of risks to authorized executives 4.17 0.643
VAR15 Efficiency of procedures for insurance against the risks to which employees are exposed, property risks, and liability risks 3.60 0.768
VAR16 Investing into technology and equipment that improves risk manage-ment 3.38 0.657
Table 1 Basic statistical indicators of the analyzed variables
God. XXVIII, BR. 1/2015. str. 9-24 God. XXVIII, BR. 1/2015. str. 9-24
UDK: 65.011.3:621.39](497.6) / Original scientific articleSafet Kozarević, Nerka Bešić:Risk management in telecommunications services in Bosnia and Herzegovina
Source: author’s calculation
Using the automated analytical tools for multivari-ate statistical analysis, Kaiser-Meyer-Olkin Meas-ure of Sampling Adequacy of 0.813 (KMO>0.6) and level of significance obtained with Bartlett’s Test of Sphericity of 0.000 (p<0.05) were established, con-firming the sample correlation matrix adequacy for the factorization.
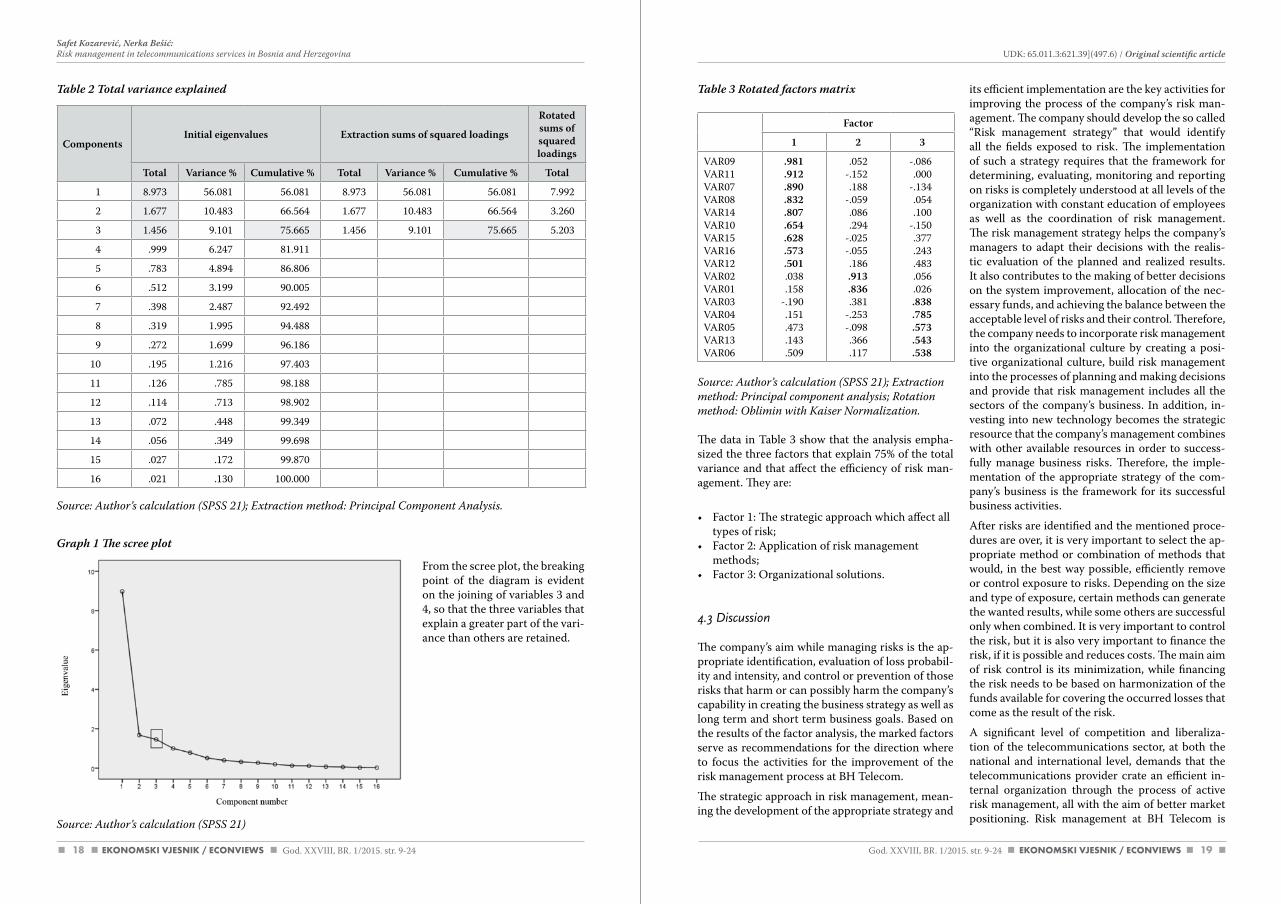
In this research 16 basic variables were reduced by the factor analysis to three factors with eigenvalues higher than 1, which are given in Table 2. These three components explain for 56.08%, 10.48% and 9.10% of the variance, meaning the total of 75.67% of the variance. The shares of these factors are shown in Graph 1.
18 19
Table 2 Total variance explained
Source: author’s calculation (SPSS 21); Extraction method: Principal component analysis.
Graph 1 The scree plot
Source: author’s calculation (SPSS 21)
ComponentsInitial eigenvalues Extraction sums of squared loadings
Rotated sums of squared loadings
Total Variance % Cumulative % Total Variance % Cumulative % Total
1 8.973 56.081 56.081 8.973 56.081 56.081 7.992
2 1.677 10.483 66.564 1.677 10.483 66.564 3.260
3 1.456 9.101 75.665 1.456 9.101 75.665 5.203
4 .999 6.247 81.911
5 .783 4.894 86.806
6 .512 3.199 90.005
7 .398 2.487 92.492
8 .319 1.995 94.488
9 .272 1.699 96.186
10 .195 1.216 97.403
11 .126 .785 98.188
12 .114 .713 98.902
13 .072 .448 99.349
14 .056 .349 99.698
15 .027 .172 99.870
16 .021 .130 100.000
God. XXVIII, BR. 1/2015. str. 9-24 God. XXVIII, BR. 1/2015. str. 9-24
UDK: 65.011.3:621.39](497.6) / Original scientific articleSafet Kozarević, Nerka Bešić:Risk management in telecommunications services in Bosnia and Herzegovina
Table 3 Rotated factors matrix
Factor
1 2 3
VAR09VAR11VAR07VAR08VAR14VAR10VAR15VAR16VAR12VAR02VAR01VAR03VAR04VAR05VAR13VAR06
.981
.912
.890
.832
.807
.654
.628
.573
.501.038.158
-.190.151.473.143.509
.052-.152.188
-.059.086.294
-.025-.055.186.913.836.381
-.253-.098.366.117
-.086.000
-.134.054.100
-.150.377.243.483.056.026.838.785.573.543.538
Source: author’s calculation (SPSS 21); Extraction method: Principal component analysis; Rotation method: Oblimin with Kaiser Normalization.
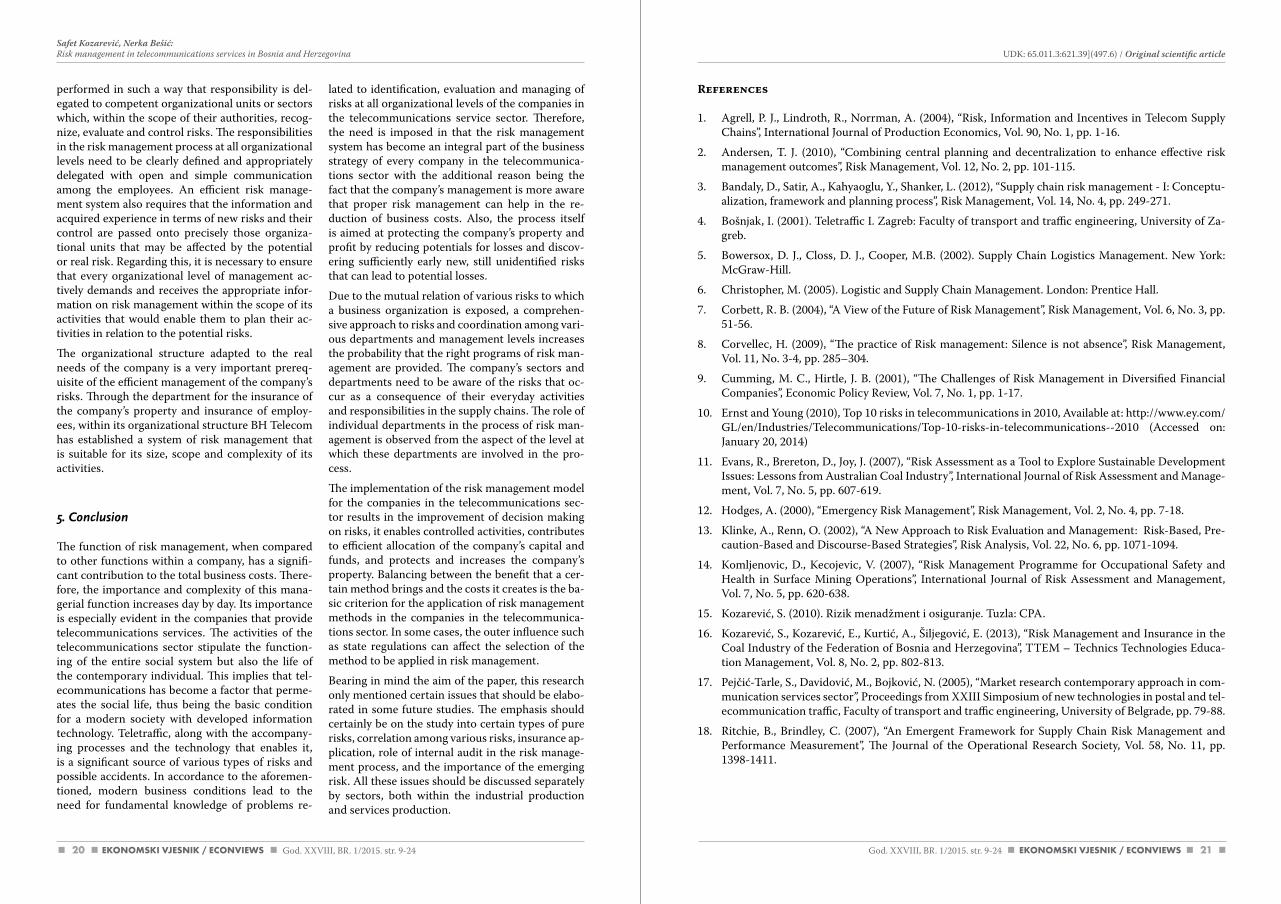
The data in Table 3 show that the analysis empha-sized the three factors that explain 75% of the total variance and that affect the efficiency of risk man-agement. They are:
• Factor 1: The strategic approach which affect all types of risk;
• Factor 2: Application of risk management methods;
• Factor 3: Organizational solutions.
4.3 Discussion
The company’s aim while managing risks is the ap-propriate identification, evaluation of loss probabil-ity and intensity, and control or prevention of those risks that harm or can possibly harm the company’s capability in creating the business strategy as well as long term and short term business goals. Based on the results of the factor analysis, the marked factors serve as recommendations for the direction where to focus the activities for the improvement of the risk management process at BH Telecom.
The strategic approach in risk management, mean-ing the development of the appropriate strategy and
its efficient implementation are the key activities for improving the process of the company’s risk man-agement. The company should develop the so called “Risk management strategy” that would identify all the fields exposed to risk. The implementation of such a strategy requires that the framework for determining, evaluating, monitoring and reporting on risks is completely understood at all levels of the organization with constant education of employees as well as the coordination of risk management. The risk management strategy helps the company’s managers to adapt their decisions with the realis-tic evaluation of the planned and realized results. It also contributes to the making of better decisions on the system improvement, allocation of the nec-essary funds, and achieving the balance between the acceptable level of risks and their control. Therefore, the company needs to incorporate risk management into the organizational culture by creating a posi-tive organizational culture, build risk management into the processes of planning and making decisions and provide that risk management includes all the sectors of the company’s business. In addition, in-vesting into new technology becomes the strategic resource that the company’s management combines with other available resources in order to success-fully manage business risks. Therefore, the imple-mentation of the appropriate strategy of the com-pany’s business is the framework for its successful business activities.
After risks are identified and the mentioned proce-dures are over, it is very important to select the ap-propriate method or combination of methods that would, in the best way possible, efficiently remove or control exposure to risks. Depending on the size and type of exposure, certain methods can generate the wanted results, while some others are successful only when combined. It is very important to control the risk, but it is also very important to finance the risk, if it is possible and reduces costs. The main aim of risk control is its minimization, while financing the risk needs to be based on harmonization of the funds available for covering the occurred losses that come as the result of the risk.
A significant level of competition and liberaliza-tion of the telecommunications sector, at both the national and international level, demands that the telecommunications provider crate an efficient in-ternal organization through the process of active risk management, all with the aim of better market positioning. Risk management at BH Telecom is
From the scree plot, the breaking point of the diagram is evident on the joining of variables 3 and 4, so that the three variables that explain a greater part of the vari-ance than others are retained.
20 21
performed in such a way that responsibility is del-egated to competent organizational units or sectors which, within the scope of their authorities, recog-nize, evaluate and control risks. The responsibilities in the risk management process at all organizational levels need to be clearly defined and appropriately delegated with open and simple communication among the employees. An efficient risk manage-ment system also requires that the information and acquired experience in terms of new risks and their control are passed onto precisely those organiza-tional units that may be affected by the potential or real risk. Regarding this, it is necessary to ensure that every organizational level of management ac-tively demands and receives the appropriate infor-mation on risk management within the scope of its activities that would enable them to plan their ac-tivities in relation to the potential risks.
The organizational structure adapted to the real needs of the company is a very important prereq-uisite of the efficient management of the company’s risks. Through the department for the insurance of the company’s property and insurance of employ-ees, within its organizational structure BH Telecom has established a system of risk management that is suitable for its size, scope and complexity of its activities.
5. Conclusion
The function of risk management, when compared to other functions within a company, has a signifi-cant contribution to the total business costs. There-fore, the importance and complexity of this mana-gerial function increases day by day. Its importance is especially evident in the companies that provide telecommunications services. The activities of the telecommunications sector stipulate the function-ing of the entire social system but also the life of the contemporary individual. This implies that tel-ecommunications has become a factor that perme-ates the social life, thus being the basic condition for a modern society with developed information technology. Teletraffic, along with the accompany-ing processes and the technology that enables it, is a significant source of various types of risks and possible accidents. In accordance to the aforemen-tioned, modern business conditions lead to the need for fundamental knowledge of problems re-
lated to identification, evaluation and managing of risks at all organizational levels of the companies in the telecommunications service sector. Therefore, the need is imposed in that the risk management system has become an integral part of the business strategy of every company in the telecommunica-tions sector with the additional reason being the fact that the company’s management is more aware that proper risk management can help in the re-duction of business costs. Also, the process itself is aimed at protecting the company’s property and profit by reducing potentials for losses and discov-ering sufficiently early new, still unidentified risks that can lead to potential losses.
Due to the mutual relation of various risks to which a business organization is exposed, a comprehen-sive approach to risks and coordination among vari-ous departments and management levels increases the probability that the right programs of risk man-agement are provided. The company’s sectors and departments need to be aware of the risks that oc-cur as a consequence of their everyday activities and responsibilities in the supply chains. The role of individual departments in the process of risk man-agement is observed from the aspect of the level at which these departments are involved in the pro-cess.
The implementation of the risk management model for the companies in the telecommunications sec-tor results in the improvement of decision making on risks, it enables controlled activities, contributes to efficient allocation of the company’s capital and funds, and protects and increases the company’s property. Balancing between the benefit that a cer-tain method brings and the costs it creates is the ba-sic criterion for the application of risk management methods in the companies in the telecommunica-tions sector. In some cases, the outer influence such as state regulations can affect the selection of the method to be applied in risk management.
Bearing in mind the aim of the paper, this research only mentioned certain issues that should be elabo-rated in some future studies. The emphasis should certainly be on the study into certain types of pure risks, correlation among various risks, insurance ap-plication, role of internal audit in the risk manage-ment process, and the importance of the emerging risk. All these issues should be discussed separately by sectors, both within the industrial production and services production.
God. XXVIII, BR. 1/2015. str. 9-24 God. XXVIII, BR. 1/2015. str. 9-24
UDK: 65.011.3:621.39](497.6) / Original scientific articleSafet Kozarević, Nerka Bešić:Risk management in telecommunications services in Bosnia and Herzegovina
References
1. Agrell, P. J., Lindroth, R., Norrman, A. (2004), “Risk, Information and Incentives in Telecom Supply Chains”, International Journal of Production Economics, Vol. 90, No. 1, pp. 1-16.
2. Andersen, T. J. (2010), “Combining central planning and decentralization to enhance effective risk management outcomes”, Risk Management, Vol. 12, No. 2, pp. 101-115.
3. Bandaly, D., Satir, A., Kahyaoglu, Y., Shanker, L. (2012), “Supply chain risk management - I: Conceptu-alization, framework and planning process”, Risk Management, Vol. 14, No. 4, pp. 249-271.
4. Bošnjak, I. (2001). Teletraffic I. Zagreb: Faculty of transport and traffic engineering, University of Za-greb.
5. Bowersox, D. J., Closs, D. J., Cooper, M.B. (2002). Supply Chain Logistics Management. New York: McGraw-Hill.
6. Christopher, M. (2005). Logistic and Supply Chain Management. London: Prentice Hall.
7. Corbett, R. B. (2004), “A View of the Future of Risk Management”, Risk Management, Vol. 6, No. 3, pp. 51-56.
8. Corvellec, H. (2009), “The practice of Risk management: Silence is not absence”, Risk Management, Vol. 11, No. 3-4, pp. 285–304.
9. Cumming, M. C., Hirtle, J. B. (2001), “The Challenges of Risk Management in Diversified Financial Companies”, Economic Policy Review, Vol. 7, No. 1, pp. 1-17.
10. Ernst and Young (2010), Top 10 risks in telecommunications in 2010, Available at: http://www.ey.com/GL/en/Industries/Telecommunications/Top-10-risks-in-telecommunications--2010 (Accessed on: January 20, 2014)
11. Evans, R., Brereton, D., Joy, J. (2007), “Risk Assessment as a Tool to Explore Sustainable Development Issues: Lessons from Australian Coal Industry”, International Journal of Risk Assessment and Manage-ment, Vol. 7, No. 5, pp. 607-619.
12. Hodges, A. (2000), “Emergency Risk Management”, Risk Management, Vol. 2, No. 4, pp. 7-18.
13. Klinke, A., Renn, O. (2002), “A New Approach to Risk Evaluation and Management: Risk-Based, Pre-caution-Based and Discourse-Based Strategies”, Risk Analysis, Vol. 22, No. 6, pp. 1071-1094.
14. Komljenovic, D., Kecojevic, V. (2007), “Risk Management Programme for Occupational Safety and Health in Surface Mining Operations”, International Journal of Risk Assessment and Management, Vol. 7, No. 5, pp. 620-638.
15. Kozarević, S. (2010). Rizik menadžment i osiguranje. Tuzla: CPA.
16. Kozarević, S., Kozarević, E., Kurtić, A., Šiljegović, E. (2013), “Risk Management and Insurance in the Coal Industry of the Federation of Bosnia and Herzegovina”, TTEM – Technics Technologies Educa-tion Management, Vol. 8, No. 2, pp. 802-813.
17. Pejčić-Tarle, S., Davidović, M., Bojković, N. (2005), “Market research contemporary approach in com-munication services sector”, Proceedings from XXIII Simposium of new technologies in postal and tel-ecommunication traffic, Faculty of transport and traffic engineering, University of Belgrade, pp. 79-88.
18. Ritchie, B., Brindley, C. (2007), “An Emergent Framework for Supply Chain Risk Management and Performance Measurement”, The Journal of the Operational Research Society, Vol. 58, No. 11, pp. 1398-1411.
22 23
VAR01 VAR02 VAR03 VAR04 VAR05 VAR06 VAR07 VAR08 VAR09 VAR10 VAR11 VAR12 VAR13 VAR14 VAR15 VAR16
VAR01 1.00 .808 .352 .082 .271 .425 .411 .322 .444 .356 .258 .566 .491 .467 .366 .309
VAR02 .808 1.00 .527 -.015 .300 .424 .436 .309 .331 .366 .236 .435 .418 .343 .207 .243
VAR03 .352 .527 1.00 .486 .595 .718 .335 .264 .256 .304 .217 .568 .551 .311 .484 .327
VAR04 .082 -.015 .486 1.00 .540 .597 .301 .390 .359 .309 .394 .601 .520 .427 .554 .286
VAR05 .271 .300 .595 .540 1.00 .836 .534 .738 .583 .240 .705 .705 .468 .617 .620 .601
VAR06 .425 .424 .718 .597 .836 1.00 .752 .744 .706 .522 .625 .748 .609 .640 .771 .631
VAR07 .411 .436 .335 .301 .534 .752 1.00 .757 .847 .762 .690 .548 .468 .703 .609 .495
VAR08 .322 .309 .264 .390 .738 .744 .757 1.000 .772 .420 .728 .616 .384 .612 .533 .521
VAR09 .444 .331 .256 .359 .583 .706 .847 .772 1.000 .655 .767 .748 .466 .846 .787 .621
VAR10 .356 .366 .304 .309 .240 .522 .762 .420 .655 1.000 .496 .459 .456 .563 .544 .176
VAR11 .258 .236 .217 .394 .705 .625 .690 .728 .767 .496 1.000 .634 .356 .725 .624 .544
VAR12 .566 .435 .568 .601 .705 .748 .548 .616 .748 .459 .634 1.000 .672 .854 .807 .618
VAR13 .491 .418 .551 .520 .468 .609 .468 .384 .466 .456 .356 .672 1.000 .559 .544 .358
VAR14 .467 .343 .311 .427 .617 .640 .703 .612 .846 .563 .725 .854 .559 1.000 .762 .620
VAR15 .366 .207 .484 .554 .620 .771 .609 .533 .787 .544 .624 .807 .544 .762 1.000 .569
VAR16 .309 .243 .327 .286 .601 .631 .495 .521 .621 .176 .544 .618 .358 .620 .569 1.00
God. XXVIII, BR. 1/2015. str. 9-24 God. XXVIII, BR. 1/2015. str. 9-24
UDK: 65.011.3:621.39](497.6) / Original scientific articleSafet Kozarević, Nerka Bešić:Risk management in telecommunications services in Bosnia and Herzegovina
19. Rouse, M. J. (2004), “Knowledge Translation and Risk Management”, Risk Management, Vol. 6, No. 2, pp. 9-15.
20. Singhal, P., Agarwal, G., Mittal, M. L. (2011), “Supply chain risk management: review, classification and future research directions”, Int. Journal of Business Science and Applied Management, Vol. 6, No. 3, pp. 15-42.
21. Swami, S., Shah, J. (2013), “Channel coordination in green supply chain management”, Journal of the Operational Research Society, Vol. 64, No. 3, pp. 336-351.
22. Ward, S. (2003), “Approaches to Integrated Risk Management: A Multi-Dimensional Framework”, Risk Management, Vol. 5, No. 4, pp. 7-23.
23. Williams, C. A., Smith, M. L., Young, P. C. (1998). Risk Management and Insurance. Boston: Irwin/McGraw-Hill.
24. Wu, D., Olson, D. L. (2010), “Enterprise risk management: coping with model risk in a large bank”, Journal of the Operational Research Society, Vol. 61, No. 2, pp. 179-190.
25. Wu, T. C., Tsaur, C. C., Lin, C. H., Shiau, S. Y. (2011), “Surveying Safety Culture in Telecommunications Industry”, Journal of Occupational Safety and Health, No. 19, pp. 403-420.
Appendix 1 Correlation matrix
2524
Marina Đukić, Ivica Šola:Preparing the public for commercialization and guidance of structural media space towards its fusion with advertising space
1. Introduction
Many theoreticians agree about the key effects that market-oriented media systemsproduce. The most obvious concerns the media content itself, which increasingly comes down to only those productive genres and forms which don´t need to win the au-
dience over, as they have already proven effective. Even if the audience’s wishes are taken into account, it´s done in a quite limited manner, one that can be commercially exploited, and the public “isn´t treat-ed as a single democratic corps, but merely as a pile of consumers” (McChesney, 2008: 89). The current presence of such a trend in the media surround-ings implicate key issues which were sought to be
PREPARING THE PUBLIC FOR COMMERCIALIZATION AND GUIDANCE OF STRUCTURAL MEDIA SPACE TOWARDS ITS FUSION WITH ADVERTISING SPACE
UDK: 659(497.5)Original scientific article
Received: april 03, 2015accepted for publishing: May 12, 2015
Marina ĐukićJosip Juraj Strossmayer University of Osijekdepartment of cultural StudiesTrg Svetog Trojstva 3,31000 Osijek, [email protected]: +385959093088
Ivica ŠolaJosip Juraj Strossmayer University of Osijekdepartment of cultural StudiesTrg Svetog Trojstva 3,31000 Osijek, [email protected]: +38598256665
Abstract
Through genre structure analysis of TV Zagreb’s First Channel schedule from the beginning of the 1970´s till the end of the 1980´s accompanied by analysis of advertising in the same period, the paper will examine the ways and intensity of the entry of commercialization intothe Croatian media space dominated then by state media. The television schedule genre change and the broadcasting of the economic propaganda pro-gram will point out the different character of the television. It can be said that it will serve for preparing the public for the entry of commercialization and guidance of structural media space towards its fusion with advertisingspace. The assumption is that in spite of the TV schedule change, which was in the economic sense accompanied by economic reforms in order to establish a market economy, the audience wasn´t yet handed over to theadvertisers. One of the explanations lies in the role of the media, which at the time had a revolutionary function with the main purpose of creating patriots and not a generation of voters.
The paper will reproduce a kind of public transformation genesis from latent status in the state guided me-dia system to same status of latent consumers in the dual media model.
Keywords: Public, commercialization, genres, television schedule, advertising
God. XXVIII, BR. 1/2015. str. 9-24
Safet Kozarević, Nerka Bešić:Risk management in telecommunications services in Bosnia and Herzegovina
Safet KozarevićNerka Bešić
Upravljanje rizicima u telekomunikacijskim uslugama u Bosni i Hercegovini
Sažetak
Pitanje upravljanja rizicima posljednjih nekoliko desetljeća postaje sve značajniji dio poslovanja svakoga poduzeća. Ovakva shvaćanja postaju sve prisutnija i u uslužnom sektoru čiji udio u BDP-u kontinuirano ras-te, kako u okviru nacionalnih ekonomija, tako i na globalnoj razini. Neopipljivost i neke druge specifičnosti usluga u odnosu na fizičke proizvode zahtijevaju i drugačiji pristup aktivnostima u području upravljanja rizicima, a posebno kada je riječ o kapitalno intenzivnim uslugama, kao što su usluge telekomunikacija. Ova vrsta usluga uglavnom se pruža u okviru velikih poduzeća koja moraju posebnu pažnju posvetiti pro-cesu upravljanja rizicima, od njihove identifikacije preko evaluacije rizika do izbora i primjene primjerene metode za upravljanje rizicima. Metode za upravljanje rizicima podrazumijevaju skupinu metoda za fizičku kontrolu rizika i skupinu metoda za financiranje rizika zadržavanjem rizika ili osiguranja. Sve se one mogu primijeniti na širok spektar imovinskih i rizika odgovornosti s kojima se susreću poduzeća i zaposleni u sektoru telekomunikacija. U radu se pokušava dati osvrt na specifičnosti procesa upravljanja rizicima u poduzećima iz sektora telekomunikacija uz studiju slučaja vodećeg telekomunikacijskoga operatera u Bosni i Hercegovini.
Ključne riječi: rizik, upravljanje rizicima, osiguranje, nezgoda, telekomunikacijske usluge, Bosna i Herce-govina
God. XXVIII, BR. 1/2015. str. 25-41
26 27
Marina Đukić, Ivica Šola:Preparing the public for commercialization and guidance of structural media space towards its fusion with advertising space UDK: 659(497.5) / Original scientific article
and active participation in political life). Thanks to these gatherings, a literary audience was formed and with the spread of political literature a critical attitude began to develop towards the government’s political decisions, so that thefree exchange of in-formation and the strengthening of critical thought became the drivers of change (Valković, 2009: 124). From this civil participation phase changes led to-wards action –the creation of politically active citi-zens. This idea of an idealized public sphere which kept the government in check with the help of in-formed and influential public opinion, through di-rect private conversations, was overcome by the emergence of new corporate interests and the ar-rival of mass communications which took the place of interpersonal discussions among the elite. The definition of the public sphere as a space which shapes the arena that is more or less autonomous and more or less open for public discussion is better suited in such a new environment (McQuail, 2000). It consists of different networks of public communi-cation which are interconnected by a central com-pound represented by mass media. The media “make the public communications of smaller arenas available to a broader audience” (Brϋggemann, 2010: 7). In doing so they provide the service of in-forming citizens and ensuring possibilities for their participation, encouraging and forming dialogue, as well as perform the fundamental functions attrib-uted to the public sphere itself, which is why we can discuss the media in terms of public institutions. According to Curran (1996), that is how a model of the public sphere as a neutral zone with wide access to information concerning the public good is formed. Discussion is free, participants are on the same level, and the means of communication make the process easier by creating a single arena for pub-lic debate and redefining private civil persons as a public organism in the form of public opinion (see McQuail, 2000). Such action, participation and in-clusion without any effect on mutual communica-tion behavior of all participants, is the creation of an ideal communication environment which doesn’texist in a pure form. Jantol talks about an ideally normative public which represents a com-munication compound in which everyone is equal and has the same communication conditions (2004: 94). Naturally, ideal conditions don´texist and the media, as social institutions, “adopt the form, struc-tures and functions according to the audience’s ex-pectations” (McQuail, cited in Valković, 2008: 117). By enabling communication between groups, not
only for physical communication channels but the creation of, for example, customs, habits and public opinion, the media intervene into the public sphere. However, the role of media in a public sphere where everyone should participate is different, just as the very notion of the public sphere is different in terms of independence from any form of interest and openness for public debate. By considering the communication conditions specific to certain socie-ties, a different role of the media and thereby the position of the public will be revealed. In order to determine the position of the public, Grunig and Hunt’s (1984) public typology will be used. The au-thors divide the publics into nonpublics, latent pub-lics, aware publics and active publics, thus explain-ing their perception level of connection with the problem situation they are in, and thereby defining their active or passive communication behavior. So, nonpublics don´t face the problem or situation they participate in at all. latent publics are immersed into the problem situation, but they don´t recognize it or they don´t see it as problematic “nor are they aware of their connections with other publics and organizations”. Whereas aware publics realize they are participating in a problem situation, but they don´t share that realization with others. Therefore, the aware public has perceived the faults of the situ-ation, independently or forced under pressure, however, it´s still not prepared to involve itself in order to change the situation; although it partici-pates, it´s not prepared to act. Lastly, active publics communicate and organize themselves in order to take action in a certain situation, which means that they´re involved in the effort of changing the situa-tion or resolving the issue – they act. According to Grunig, active communicative behavior is repre-sented in people who seek information regarding the issue at hand, whereas passive behavior is that which is also called information processing because the passive public can, but doesn´t have to, take the message into account (see Broom, 2010: 202). Grunig highlights the factors which are instrumen-tal for the transition of the latent public into an ac-tive one. A public will become active when the per-ception of a clear personal connection with a problematic situation is induced. This is where the public’s helm is taken over by the media which en-able communication in order to “create focused public opinion” and “assign topics that can become the subject of public debate through a selection of events deemed worthy of publication” (Kunczik and Ziepfel, 1998: 185). In this way the media intervene
answered within the frame of this paper, primarily ones concerning its entry point. Using genre struc-ture analysis of the television program during the 1970s and the 1980s on TV Zagreb’s First Channel and an analysis of the advertising itself , the paper will consider the methods and intensity of the en-try of commercialization into the Croatian media space, which was then under state media domina-tion. The basic assumption is that even though cer-tain structural changes were present in the televi-sion program (particularly concerning the present genres, the arrival of new genres, as well as the entry of advertising into the program), it can be argued that the audience was still not being handed over to advertisers. One of the explanations certainly lies in the very role of the media which at the time had a revolutionary function, with the sole purpose of creating patriots, not voters. Such state media policy demanded latent patriots from the public – a public that doesn´t get involved, a public that de-fines a problematic situation solely from the view-point of the ruling party’s general effort to preserve the status quo (within the tolerances of the actual situation deviating from that projected in the Party’s declarations). Even if it is recognized, the participa-tion to resolve the situation remains non-existent. Thus, within the first chapter, the basic media func-tions are considered, which by their behavior, sup-ported by a certain (de)regulatory agenda, affect the position and the behavior of the public. This is how the different position of the public is distinguished within the framework of the commercial model, in which the media serve to accrue profit and, instead of translating a latent public into an active public (one actively involved in the production and repro-duction of society), produce latent consumers. On the other hand, the public service model, whose central idea is public interest, and which is sensi-tive and open enough for social diversity, even for groups which aren´t attractive to advertisers due to their purchasing power, sees its audience as the public, an active public. By explaining the wider me-dia surroundings during the period encompassed by the research, the paper will endeavor to show-case certain expectations with regard to the changes of the public’s position considering the transforma-tion of the state media into public media and the entry of commercial media into the Croatian media market. In order to showcase the genesis of the pub-lic’s transformation from the government-led media system latent state, into the same latent state in a mixed media model, the paper will analyze the tel-
evision program genre structure. This will be done bearing in mind the influence of media contents on the ways in which the public (actively or passively) participates in public dialogue, given the basic fea-tures of the most typical media models presented. Therefore, the empirical part of the paper seeks to determine: the change in the character of televi-sion, the beginning of the public’s preparation for the entry of commercialization into the media space and the structural changes that led to the merging of that space with the advertising space. The afore-mentioned trends will be observed in the expected growth of commercially-oriented genres or genres which will be named as the “announcers” of com-mercialization within the framework of the paper.
2. The theoretical framework2.1 From a latent to an active public
The present-day public, the recipients of media con-tent, commonly referred to as media consumers, shouldn´t only be passive receivers of media mes-sages. In democratic societies, the public space within which a public opinion is formed should be a sphere, “space” in which citizens participate in so-cially relevant topics (Valković, 2009). The differ-ence in the concepts of participation, activity or in-action is crucial when defining the concept of the public, as well as its positioning in media space. In its primary meanings, the public is linked “with things of general interest or more specifically with official and state affairs” (Lamza-Posavec, 1995: 14). Habermas (1969) definesthe public as “a sphere of private people gathered in an audience” which is lo-cated in a tension field between the state and society and acts as a self-mediatory organ of the civil soci-ety with the state government. Dewey sees the pub-lic as an active unit in society comprised of all those who see the common issue for which they can seek a common solution (see Broom, 2010: 201). This represents precisely the aforementioned moment of citizen participation or action regarding socially rel-evant issues. Considering that the public is the main subject of public opinion, “a ‘framework’, an envi-ronment of public opinion formation in which all citizens should participate in an equal manner” (Valković, 2009: 124), Dewey’s definition of the ac-tive public unit can be linked to Habermas’ (1969) reconstruction of the historical version of the public sphere (elite gatherings in 18th century coffee houses
God. XXVIII, BR. 1/2015. str. 25-41 God. XXVIII, BR. 1/2015. str. 25-41
28 29
right to send and receive messages, but also to ques-tion themand the way they are controlled. Control is regarded not as censorship but rather as news se-lection criteria in accordance with production costs and profitability criteria. That a handful of wealthy individuals is “within the means to assert its market power in order to act as an influential cultural gate-keeper” (Freedman, 2008: 106). Led by profit as the supreme principle in production and media content broadcasting, these companies have interests that largely differ from the interests of the major part of the humanity, which then consequently has nega-tive effects on media contents and the public’s posi-tion in the public arena mediated by media reports. One of the most visible trends is the one by which the media product is subjected to increasing com-mercialization seeing as how dominant companies use their market power to extract the biggest pos-sible profit from their product (McChesney, 2008: 33). The media take away the ability and possibil-ity to favor impartial dialogue from public com-munication. In doing so, “access of private interests into the public sphere opens wide with the danger for that same public sphere to become someone’s ‘property’” (Valković, 2009: 129). Therefore, both the audience and the public are viewed solely as consumers, which means they are valued by how much information they consume, rather than how informed they are, which also promptly points to their communication behavior. Guided by Grunig’s classification, it can be argued that media commer-cialization leads to the creation of latent consumers or a passive audience. McChesney sees these effects particularly in the media’s hyper commercialization of culture and abandonment of public servitude as well as increasing citizen depoliticization. The pub-lic is present, but it is completely demoralized and resigned, and “accepts the state of things as natu-ral” (2008: 73/4). For the hyper-commercialization of the culture, Habermas (1969) calls out the media as the ones who in a commercialized world become the means in the service of “consumer culture”. That signifies the transition from an audience that was critical towards culture to an audience that be-comes a culture consumer (Valković, 2009: 125). Acting as a”cultural gatekeeper”,commercial media promote values such as “consumerism, material-ism, hedonism, passive society, and the contents lose their value in order to attract an audience and please advertisers” (McQuail, 1998: 110). Consumer latency is guided by psychological gratification, en-tertainment and illusion of its own position in the
world. Such an ideological process happens mostly due to the public’s dependency on commercial mass media in whose optics the content is focused more on a standardized form of entertainment and super-ficial, conformist and harmless idleness rather than originality (McQuail, 2000).
The opposite model is one connected to “public ser-vice policy” (Cuilenburg and McQuail, 2003) that predominantly deals more in sociopolitical strategy than economic or national and has in its foundations the ideal of a public service in the domain of radio-television communication from which a public ser-vice media model typical for European countries has developed. Since the very beginnings in Europe, a strategic importance of the media for the state, na-tion and industry was noticed, and under the strong influence of the largest European countries’ politi-cal traditions, media policy have focused on public monopoly, starting from telegraphs. Here the public interest was the central idea which created the need for a media system that would be sensitive and open enoughfor social diversity and stratification, even for groups who, due to their purchasing power, weren’t attractive to advertisers (Kurtić, 2014). The general goal was the stimulation of public media services in the function of all citizens and public interests, with an agenda dominated by the political and cultural dimensions (Kurtić, 2014: 137/8). Such media mod-els reject centralized control and the mass media (as well as communication itself and the news system) and the audiences are open to different opinions (Malović, 2003: 17). Unlike centralized models, as was the communist one, the individual, not the so-ciety, is the one with the right to receive the message and the society has the right to send it. So, society achieves certain supervision over the reception of the message, using this to protect its members from harmful contents and unwanted advertising (Bijelić and Tomašić, 2008: 184). Broadly speaking, an em-phasis on citizen participation and involvement is visible in the fundamental features and functions of public services. “It organizes its audience as the public, as citizens with different interests and tastes, with a common need for information, education and entertainment” (Car, 2007: 118). Features like the supply of a universal service, financing from all citizens (not only customers), public control over broadcasting, democratic responsibility to society (or nation) and achieving different targets of quality towards cultural and social priorities of the location (McQuail, 2000) point to public services as a public
into the public sphere, as well as hold a certain mo-nopoly over it, acting on behalf of different interests and individuals but always under the guise of public interest. Then, the question is how public interest is to be defined and who stands behind it? Today me-dia are more directed towards manipulating their audience instead of helping it form a rational opin-ion (McQuail, 2000). Rovigatti (1985) deems that even public opinion “doesn´t deserve such a name for it´s not the fruit of free conversation of the audi-ence about issues of actual interest: all information is manipulated and shaped by those who own the mass media” (cited in Valković, 2009: 129). This ma-nipulation takes place under the veil of secret public relations techniques. Lippmann states that public opinion is susceptible to control, just as behaviors and opinions, by means of propaganda or consent manufacturing (Barsamiam, 2013). Chomsky de-scribes the period of the 1920s (the birth of “opinion control experts”) as one which introduced the in-dustry control efficiency methodology by which workers were trained to become robots whose every motion is controlled, which “created an efficient in-dustry with people who become automated”. Even though the Bolsheviks tried to apply the same tech-nique, they didn´t realize that you can control not only the time spent at work, but also that outside of work. “Control him by inducing the philosophy of futility, focusing people on insignificant things in life such as fashionable consumption and in princi-ple move them away from yourself. Let people who are supposed to run the show do so without the in-terference of the masses, who have no business be-ing in the public arena” (Barsamiam, 2013). The gradual entry of commercialization, at least in the genre structure, had the preparation of the public in mind and, considering this transitional aspect, the control of free time as well. Keeping the status quo and creating a non-critical and passive public in every way suits the people (interests) who are in the background of the media and who dictate the ways of looking at the society. However, latent publics can be encouraged to activity, and the key factor which Chomsky highlights is cooperation (ibid.). The question raised is to what extent are the media the ones who can encourage the public to partici-pate and what kind of media content is it?
2.2 The historical and social framework of media models and policy development
Due to rapid changes and development of new com-munication technologies, new attitudes toward the role of media in different media models are being accepted. McQuail (2000) sees media changes as the reason for the printed press theory’s inapplica-bility to other media. Wiio deems that there is no single unique model to act as a framework for the media’s communication behavior because mass me-dia aren´t a single entity and don´t function in some idealized social system (Malović, 2003: 15). There are certain particulars which differ from society to society and from medium to medium.
Since media systems are created within a process of continual stimulation or suppression of a certain type of media, communication structures and com-munication behaviors, and in that sense they can be more or less democratic, or more or less in the func-tion of public interest (Kurtić, 2014: 136), certain activity models can still be identified. Cuilenburg and McQuail (2003) investigate the development of three types of media policies. The first one is the “communication industry support policy”, which in reality closely resembles a commercial media model typical for the USA. It produces “the stimulation of growth of the free media market and commercial media model by deregulatory cession of the mass media and communication sphere and infrastruc-ture to economic interests of transnational and national commercial media corporations” (Kurtić, 2014: 137). Present from the beginning in the USA, the idea of ensuring the industry’s profitability took hold before public service demands were set; “such dynamics meant that the demand of serving the public is by definition limited” (McChesney, 2008: 79). Except in terms of market efficiency, the me-dia are almost entirely supervision-free. Decentral-ized control rules out influence by any political or interest group in the creation of programs whereas private property directs the media towards news commercialization (Tomašić and Bijelić, 2008: 185). Albeit theoretically, this media model belongs to de-centralized media systems, but taking into consid-eration the dominant economic interests which run the media (read: owners), one can point to traces of a hidden centralized private model, if we take Wiio’s theory of society’s openness and the level of super-vision over the media into account (Malović, 2003: 17). In such systems, it is an individual’s nominal
Marina Đukić, Ivica Šola:Preparing the public for commercialization and guidance of structural media space towards its fusion with advertising space UDK: 659(497.5) / Original scientific article
God. XXVIII, BR. 1/2015. str. 25-41 God. XXVIII, BR. 1/2015. str. 25-41
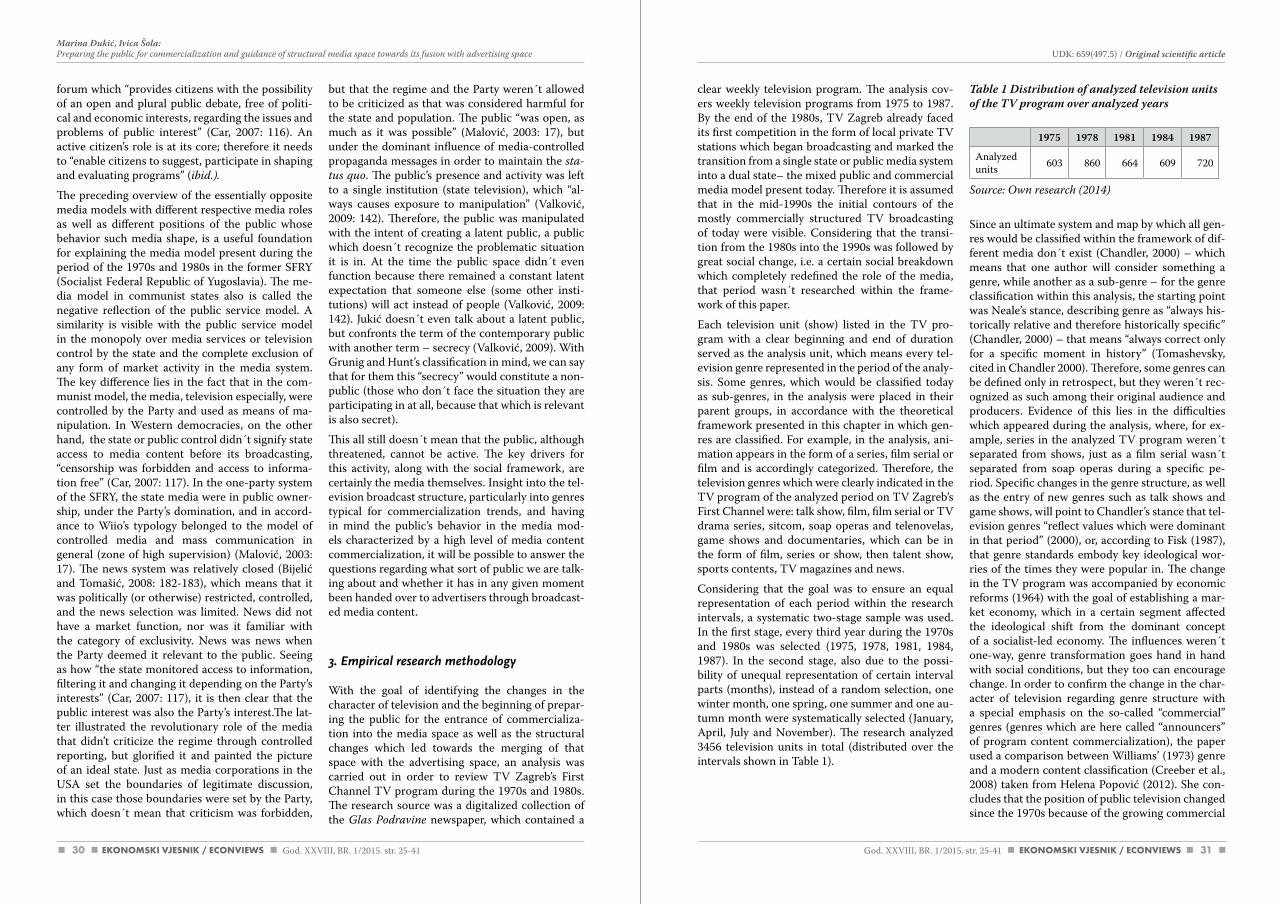
30 31
clear weekly television program. The analysis cov-ers weekly television programs from 1975 to 1987. By the end of the 1980s, TV Zagreb already faced its first competition in the form of local private TV stations which began broadcasting and marked the transition from a single state or public media system into a dual state– the mixed public and commercial media model present today. Therefore it is assumed that in the mid-1990s the initial contours of the mostly commercially structured TV broadcasting of today were visible. Considering that the transi-tion from the 1980s into the 1990s was followed by great social change, i.e. a certain social breakdown which completely redefined the role of the media, that period wasn´t researched within the frame-work of this paper.
Each television unit (show) listed in the TV pro-gram with a clear beginning and end of duration served as the analysis unit, which means every tel-evision genre represented in the period of the analy-sis. Some genres, which would be classified today as sub-genres, in the analysis were placed in their parent groups, in accordance with the theoretical framework presented in this chapter in which gen-res are classified. For example, in the analysis, ani-mation appears in the form of a series, film serial or film and is accordingly categorized. Therefore, the television genres which were clearly indicated in the TV program of the analyzed period on TV Zagreb’s First Channel were: talk show, film, film serial or TV drama series, sitcom, soap operas and telenovelas, game shows and documentaries, which can be in the form of film, series or show, then talent show, sports contents, TV magazines and news.
Considering that the goal was to ensure an equal representation of each period within the research intervals, a systematic two-stage sample was used. In the first stage, every third year during the 1970s and 1980s was selected (1975, 1978, 1981, 1984, 1987). In the second stage, also due to the possi-bility of unequal representation of certain interval parts (months), instead of a random selection, one winter month, one spring, one summer and one au-tumn month were systematically selected (January, April, July and November). The research analyzed 3456 television units in total (distributed over the intervals shown in Table 1).
Table 1 Distribution of analyzed television units of the TV program over analyzed years
1975 1978 1981 1984 1987
Analyzed units 603 860 664 609 720
Source: Own research (2014)
Since an ultimate system and map by which all gen-res would be classified within the framework of dif-ferent media don´t exist (Chandler, 2000) – which means that one author will consider something a genre, while another as a sub-genre – for the genre classification within this analysis, the starting point was Neale’s stance, describing genre as “always his-torically relative and therefore historically specific” (Chandler, 2000) – that means “always correct only for a specific moment in history” (Tomashevsky, cited in Chandler 2000). Therefore, some genres can be defined only in retrospect, but they weren´t rec-ognized as such among their original audience and producers. Evidence of this lies in the difficulties which appeared during the analysis, where, for ex-ample, series in the analyzed TV program weren´t separated from shows, just as a film serial wasn´t separated from soap operas during a specific pe-riod. Specific changes in the genre structure, as well as the entry of new genres such as talk shows and game shows, will point to Chandler’s stance that tel-evision genres “reflect values which were dominant in that period” (2000), or, according to Fisk (1987), that genre standards embody key ideological wor-ries of the times they were popular in. The change in the TV program was accompanied by economic reforms (1964) with the goal of establishing a mar-ket economy, which in a certain segment affected the ideological shift from the dominant concept of a socialist-led economy. The influences weren´t one-way, genre transformation goes hand in hand with social conditions, but they too can encourage change. In order to confirm the change in the char-acter of television regarding genre structure with a special emphasis on the so-called “commercial” genres (genres which are here called “announcers” of program content commercialization), the paper used a comparison between Williams’ (1973) genre and a modern content classification (Creeber et al., 2008) taken from Helena Popović (2012). She con-cludes that the position of public television changed since the 1970s because of the growing commercial
forum which “provides citizens with the possibility of an open and plural public debate, free of politi-cal and economic interests, regarding the issues and problems of public interest” (Car, 2007: 116). An active citizen’s role is at its core; therefore it needs to “enable citizens to suggest, participate in shaping and evaluating programs” (ibid.).
The preceding overview of the essentially opposite media models with different respective media roles as well as different positions of the public whose behavior such media shape, is a useful foundation for explaining the media model present during the period of the 1970s and 1980s in the former SFRY (Socialist Federal Republic of Yugoslavia). The me-dia model in communist states also is called the negative reflection of the public service model. A similarity is visible with the public service model in the monopoly over media services or television control by the state and the complete exclusion of any form of market activity in the media system. The key difference lies in the fact that in the com-munist model, the media, television especially, were controlled by the Party and used as means of ma-nipulation. In Western democracies, on the other hand, the state or public control didn´t signify state access to media content before its broadcasting, “censorship was forbidden and access to informa-tion free” (Car, 2007: 117). In the one-party system of the SFRY, the state media were in public owner-ship, under the Party’s domination, and in accord-ance to Wiio’s typology belonged to the model of controlled media and mass communication in general (zone of high supervision) (Malović, 2003: 17). The news system was relatively closed (Bijelić and Tomašić, 2008: 182-183), which means that it was politically (or otherwise) restricted, controlled, and the news selection was limited. News did not have a market function, nor was it familiar with the category of exclusivity. News was news when the Party deemed it relevant to the public. Seeing as how “the state monitored access to information, filtering it and changing it depending on the Party’s interests” (Car, 2007: 117), it is then clear that the public interest was also the Party’s interest.The lat-ter illustrated the revolutionary role of the media that didn’t criticize the regime through controlled reporting, but glorified it and painted the picture of an ideal state. Just as media corporations in the USA set the boundaries of legitimate discussion, in this case those boundaries were set by the Party, which doesn´t mean that criticism was forbidden,
but that the regime and the Party weren´t allowed to be criticized as that was considered harmful for the state and population. The public “was open, as much as it was possible” (Malović, 2003: 17), but under the dominant influence of media-controlled propaganda messages in order to maintain the sta-tus quo. The public’s presence and activity was left to a single institution (state television), which “al-ways causes exposure to manipulation” (Valković, 2009: 142). Therefore, the public was manipulated with the intent of creating a latent public, a public which doesn´t recognize the problematic situation it is in. At the time the public space didn´t even function because there remained a constant latent expectation that someone else (some other insti-tutions) will act instead of people (Valković, 2009: 142). Jukić doesn´t even talk about a latent public, but confronts the term of the contemporary public with another term – secrecy (Valković, 2009). With Grunig and Hunt’s classification in mind, we can say that for them this “secrecy” would constitute a non-public (those who don´t face the situation they are participating in at all, because that which is relevant is also secret).
This all still doesn´t mean that the public, although threatened, cannot be active. The key drivers for this activity, along with the social framework, are certainly the media themselves. Insight into the tel-evision broadcast structure, particularly into genres typical for commercialization trends, and having in mind the public’s behavior in the media mod-els characterized by a high level of media content commercialization, it will be possible to answer the questions regarding what sort of public we are talk-ing about and whether it has in any given moment been handed over to advertisers through broadcast-ed media content.
3. Empirical research methodology
With the goal of identifying the changes in the character of television and the beginning of prepar-ing the public for the entrance of commercializa-tion into the media space as well as the structural changes which led towards the merging of that space with the advertising space, an analysis was carried out in order to review TV Zagreb’s First Channel TV program during the 1970s and 1980s. The research source was a digitalized collection of the Glas Podravine newspaper, which contained a
Marina Đukić, Ivica Šola:Preparing the public for commercialization and guidance of structural media space towards its fusion with advertising space UDK: 659(497.5) / Original scientific article
God. XXVIII, BR. 1/2015. str. 25-41 God. XXVIII, BR. 1/2015. str. 25-41
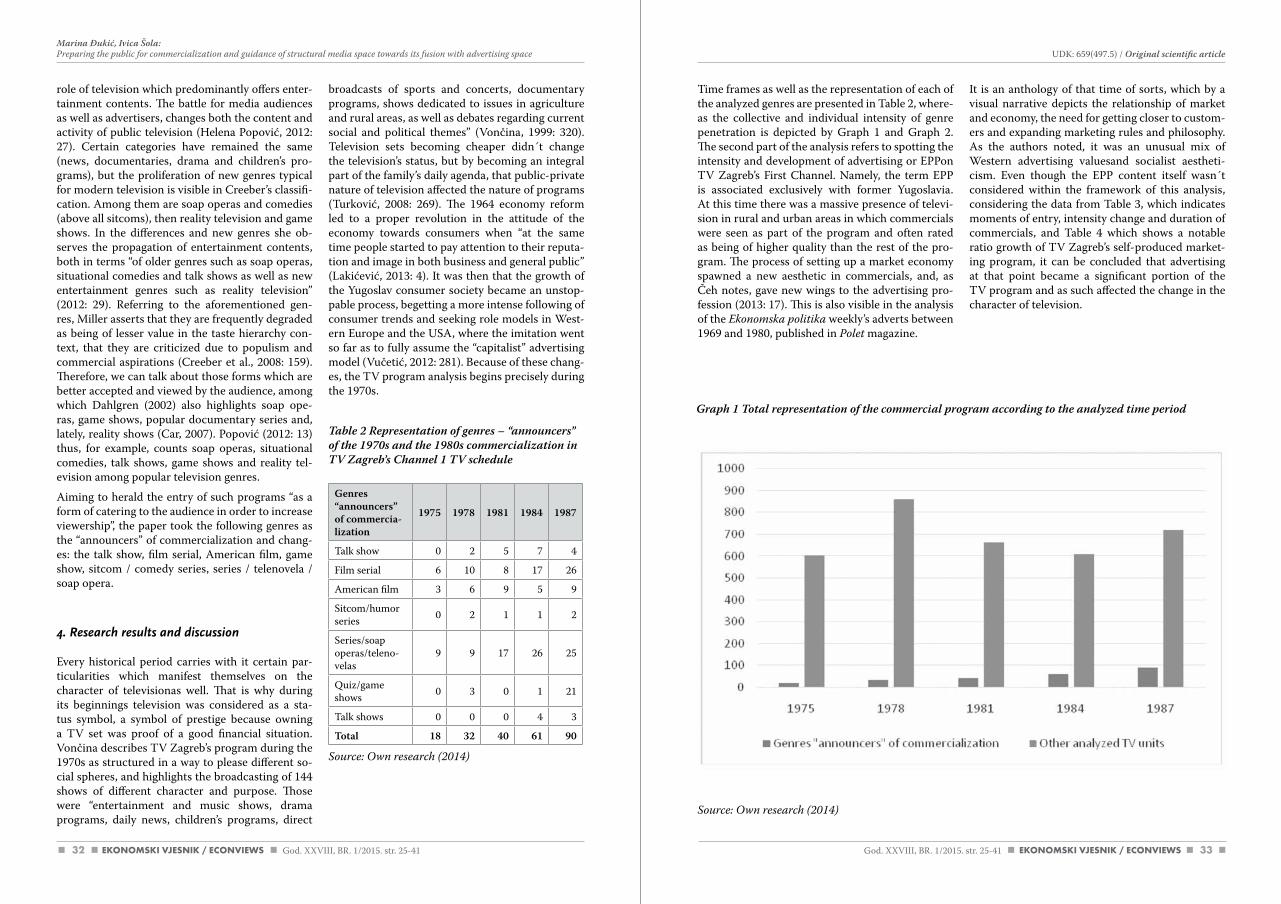
32 33
Time frames as well as the representation of each of the analyzed genres are presented in Table 2, where-as the collective and individual intensity of genre penetration is depicted by Graph 1 and Graph 2. The second part of the analysis refers to spotting the intensity and development of advertising or EPPon TV Zagreb’s First Channel. Namely, the term EPP is associated exclusively with former Yugoslavia. At this time there was a massive presence of televi-sion in rural and urban areas in which commercials were seen as part of the program and often rated as being of higher quality than the rest of the pro-gram. The process of setting up a market economy spawned a new aesthetic in commercials, and, as Čeh notes, gave new wings to the advertising pro-fession (2013: 17). This is also visible in the analysis of the Ekonomska politika weekly’s adverts between 1969 and 1980, published in Polet magazine.
Source: Own research (2014)
It is an anthology of that time of sorts, which by a visual narrative depicts the relationship of market and economy, the need for getting closer to custom-ers and expanding marketing rules and philosophy. As the authors noted, it was an unusual mix of Western advertising valuesand socialist aestheti-cism. Even though the EPP content itself wasn´t considered within the framework of this analysis, considering the data from Table 3, which indicates moments of entry, intensity change and duration of commercials, and Table 4 which shows a notable ratio growth of TV Zagreb’s self-produced market-ing program, it can be concluded that advertising at that point became a significant portion of the TV program and as such affected the change in the character of television.
role of television which predominantly offers enter-tainment contents. The battle for media audiences as well as advertisers, changes both the content and activity of public television (Helena Popović, 2012: 27). Certain categories have remained the same (news, documentaries, drama and children’s pro-grams), but the proliferation of new genres typical for modern television is visible in Creeber’s classifi-cation. Among them are soap operas and comedies (above all sitcoms), then reality television and game shows. In the differences and new genres she ob-serves the propagation of entertainment contents, both in terms “of older genres such as soap operas, situational comedies and talk shows as well as new entertainment genres such as reality television” (2012: 29). Referring to the aforementioned gen-res, Miller asserts that they are frequently degraded as being of lesser value in the taste hierarchy con-text, that they are criticized due to populism and commercial aspirations (Creeber et al., 2008: 159). Therefore, we can talk about those forms which are better accepted and viewed by the audience, among which Dahlgren (2002) also highlights soap ope-ras, game shows, popular documentary series and, lately, reality shows (Car, 2007). Popović (2012: 13) thus, for example, counts soap operas, situational comedies, talk shows, game shows and reality tel-evision among popular television genres.
Aiming to herald the entry of such programs “as a form of catering to the audience in order to increase viewership”, the paper took the following genres as the “announcers” of commercialization and chang-es: the talk show, film serial, American film, game show, sitcom / comedy series, series / telenovela / soap opera.
4. Research results and discussion
Every historical period carries with it certain par-ticularities which manifest themselves on the character of televisionas well. That is why during its beginnings television was considered as a sta-tus symbol, a symbol of prestige because owning a TV set was proof of a good financial situation. Vončina describes TV Zagreb’s program during the 1970s as structured in a way to please different so-cial spheres, and highlights the broadcasting of 144 shows of different character and purpose. Those were “entertainment and music shows, drama programs, daily news, children’s programs, direct
broadcasts of sports and concerts, documentary programs, shows dedicated to issues in agriculture and rural areas, as well as debates regarding current social and political themes” (Vončina, 1999: 320). Television sets becoming cheaper didn´t change the television’s status, but by becoming an integral part of the family’s daily agenda, that public-private nature of television affected the nature of programs (Turković, 2008: 269). The 1964 economy reform led to a proper revolution in the attitude of the economy towards consumers when “at the same time people started to pay attention to their reputa-tion and image in both business and general public” (Lakićević, 2013: 4). It was then that the growth of the Yugoslav consumer society became an unstop-pable process, begetting a more intense following of consumer trends and seeking role models in West-ern Europe and the USA, where the imitation went so far as to fully assume the “capitalist” advertising model (Vučetić, 2012: 281). Because of these chang-es, the TV program analysis begins precisely during the 1970s.
Table 2 Representation of genres – “announcers” of the 1970s and the 1980s commercialization in TV Zagreb’s Channel 1 TV schedule
Genres “announcers” of commercia-lization
1975 1978 1981 1984 1987
Talk show 0 2 5 7 4
Film serial 6 10 8 17 26
American film 3 6 9 5 9
Sitcom/humor series 0 2 1 1 2
Series/soap operas/teleno-velas
9 9 17 26 25
Quiz/game shows 0 3 0 1 21
Talk shows 0 0 0 4 3
Total 18 32 40 61 90
Source: Own research (2014)
Marina Đukić, Ivica Šola:Preparing the public for commercialization and guidance of structural media space towards its fusion with advertising space UDK: 659(497.5) / Original scientific article
Graph 1 Total representation of the commercial program according to the analyzed time period
God. XXVIII, BR. 1/2015. str. 25-41 God. XXVIII, BR. 1/2015. str. 25-41
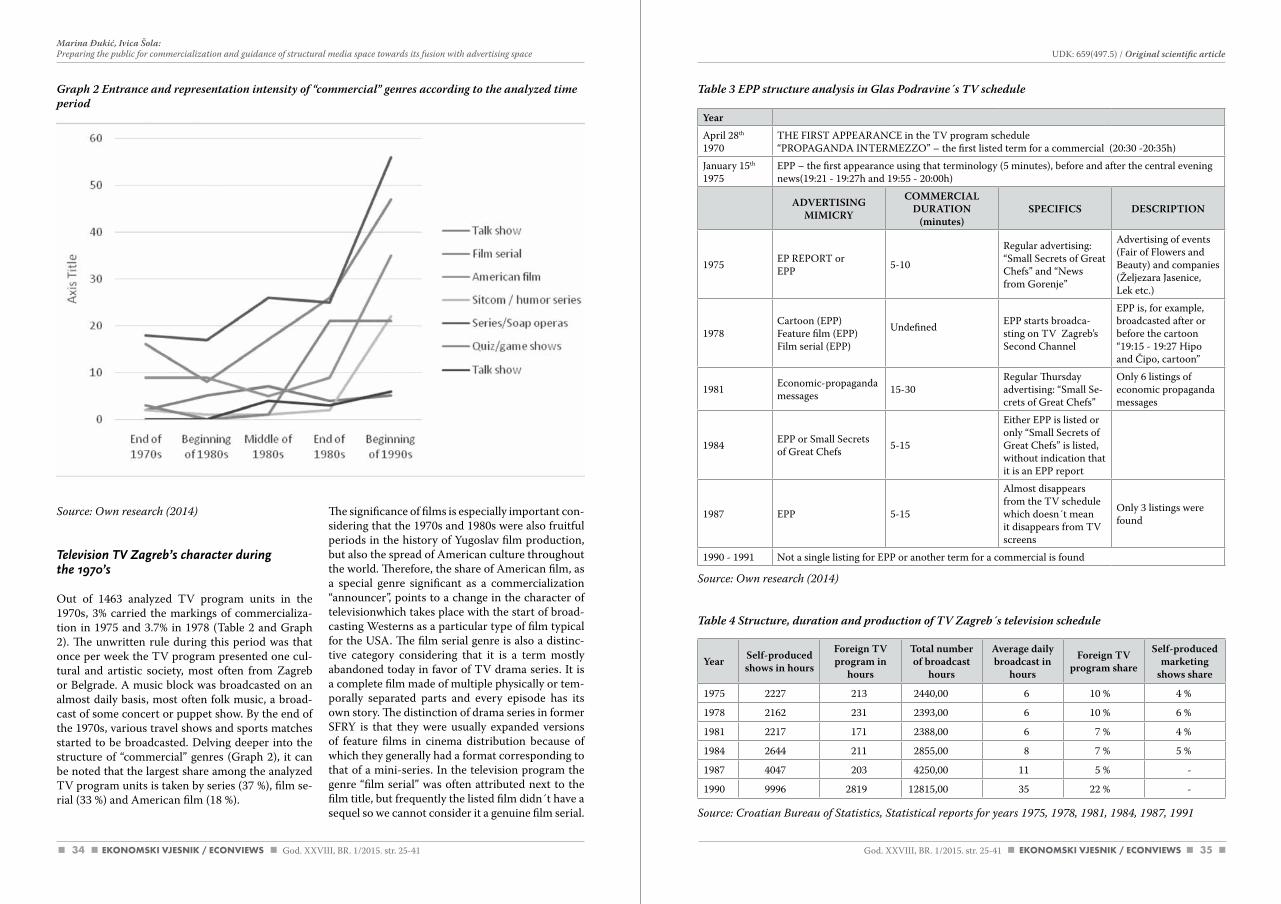
34 35
Source: Own research (2014)
Television TV Zagreb’s character duringthe 1970’s
Out of 1463 analyzed TV program units in the 1970s, 3% carried the markings of commercializa-tion in 1975 and 3.7% in 1978 (Table 2 and Graph 2). The unwritten rule during this period was that once per week the TV program presented one cul-tural and artistic society, most often from Zagreb or Belgrade. A music block was broadcasted on an almost daily basis, most often folk music, a broad-cast of some concert or puppet show. By the end of the 1970s, various travel shows and sports matches started to be broadcasted. Delving deeper into the structure of “commercial” genres (Graph 2), it can be noted that the largest share among the analyzed TV program units is taken by series (37 %), film se-rial (33 %) and American film (18 %).
The significance of films is especially important con-sidering that the 1970s and 1980s were also fruitful periods in the history of Yugoslav film production, but also the spread of American culture throughout the world. Therefore, the share of American film, as a special genre significant as a commercialization “announcer”, points to a change in the character of televisionwhich takes place with the start of broad-casting Westerns as a particular type of film typical for the USA. The film serial genre is also a distinc-tive category considering that it is a term mostly abandoned today in favor of TV drama series. It is a complete film made of multiple physically or tem-porally separated parts and every episode has its own story. The distinction of drama series in former SFRY is that they were usually expanded versions of feature films in cinema distribution because of which they generally had a format corresponding to that of a mini-series. In the television program the genre “film serial” was often attributed next to the film title, but frequently the listed film didn´t have a sequel so we cannot consider it a genuine film serial.
Graph 2 Entrance and representation intensity of “commercial” genres according to the analyzed time period
Table 3 EPP structure analysis in Glas Podravine´s TV schedule
Source: Own research (2014)
Table 4 Structure, duration and production of TV Zagreb´s television schedule
Source: croatian Bureau of Statistics, Statistical reports for years 1975, 1978, 1981, 1984, 1987, 1991
Year
April 28th 1970
THE FIRST APPEARANCE in the TV program schedule“PROPAGANDA INTERMEZZO” – the first listed term for a commercial (20:30 -20:35h)
January 15th 1975
EPP – the first appearance using that terminology (5 minutes), before and after the central evening news(19:21 - 19:27h and 19:55 - 20:00h)
ADVERTISING MIMICRY
COMMERCIAL DURATION
(minutes)SPECIFICS DESCRIPTION
1975 EP REPORT orEPP 5-10
Regular advertising: “Small Secrets of Great Chefs” and “News from Gorenje”
Advertising of events (Fair of Flowers and Beauty) and companies (Željezara Jasenice, Lek etc.)
1978Cartoon (EPP)Feature film (EPP)Film serial (EPP)
Undefined EPP starts broadca-sting on TV Zagreb’s Second Channel
EPP is, for example, broadcasted after or before the cartoon “19:15 - 19:27 Hipo and Čipo, cartoon”
1981 Economic-propaganda messages 15-30
Regular Thursday advertising: “Small Se-crets of Great Chefs”
Only 6 listings of economic propaganda messages
1984 EPP or Small Secrets of Great Chefs 5-15
Either EPP is listed or only “Small Secrets of Great Chefs” is listed, without indication that it is an EPP report
1987 EPP 5-15
Almost disappears from the TV schedule which doesn´t mean it disappears from TV screens
Only 3 listings were found
1990 - 1991 Not a single listing for EPP or another term for a commercial is found
Year Self-produced shows in hours
Foreign TV program in
hours
Total number of broadcast
hours
Average daily broadcast in
hours
Foreign TV program share
Self-produced marketing
shows share
1975 2227 213 2440,00 6 10 % 4 %
1978 2162 231 2393,00 6 10 % 6 %
1981 2217 171 2388,00 6 7 % 4 %
1984 2644 211 2855,00 8 7 % 5 %
1987 4047 203 4250,00 11 5 % -
1990 9996 2819 12815,00 35 22 % -
Marina Đukić, Ivica Šola:Preparing the public for commercialization and guidance of structural media space towards its fusion with advertising space UDK: 659(497.5) / Original scientific article
God. XXVIII, BR. 1/2015. str. 25-41 God. XXVIII, BR. 1/2015. str. 25-41
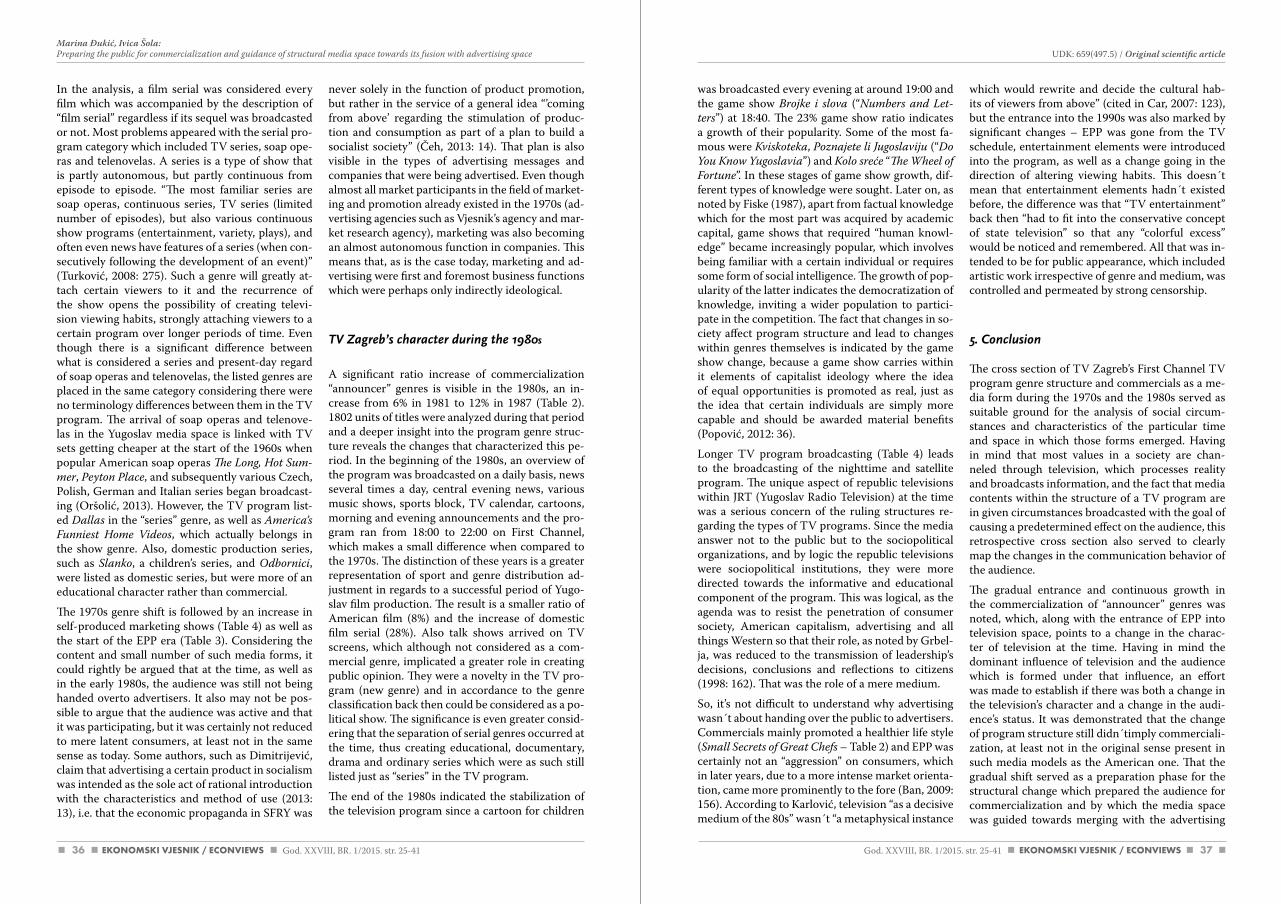
36 37
was broadcasted every evening at around 19:00 and the game show Brojke i slova (“Numbers and let-ters”) at 18:40. The 23% game show ratio indicates a growth of their popularity. Some of the most fa-mous were Kviskoteka, Poznajete li Jugoslaviju (“do You Know Yugoslavia”) and Kolo sreće “The Wheel of Fortune”. In these stages of game show growth, dif-ferent types of knowledge were sought. Later on, as noted by Fiske (1987), apart from factual knowledge which for the most part was acquired by academic capital, game shows that required “human knowl-edge” became increasingly popular, which involves being familiar with a certain individual or requires some form of social intelligence. The growth of pop-ularity of the latter indicates the democratization of knowledge, inviting a wider population to partici-pate in the competition. The fact that changes in so-ciety affect program structure and lead to changes within genres themselves is indicated by the game show change, because a game show carries within it elements of capitalist ideology where the idea of equal opportunities is promoted as real, just as the idea that certain individuals are simply more capable and should be awarded material benefits (Popović, 2012: 36).
Longer TV program broadcasting (Table 4) leads to the broadcasting of the nighttime and satellite program. The unique aspect of republic televisions within JRT (Yugoslav Radio Television) at the time was a serious concern of the ruling structures re-garding the types of TV programs. Since the media answer not to the public but to the sociopolitical organizations, and by logic the republic televisions were sociopolitical institutions, they were more directed towards the informative and educational component of the program. This was logical, as the agenda was to resist the penetration of consumer society, American capitalism, advertising and all things Western so that their role, as noted by Grbel-ja, was reduced to the transmission of leadership’s decisions, conclusions and reflections to citizens (1998: 162). That was the role of a mere medium.
So, it’s not difficult to understand why advertising wasn´t about handing over the public to advertisers. Commercials mainly promoted a healthier life style (Small Secrets of Great chefs – Table 2) and EPP was certainly not an “aggression” on consumers, which in later years, due to a more intense market orienta-tion, came more prominently to the fore (Ban, 2009: 156). According to Karlović, television “as a decisive medium of the 80s” wasn´t “a metaphysical instance
which would rewrite and decide the cultural hab-its of viewers from above” (cited in Car, 2007: 123), but the entrance into the 1990s was also marked by significant changes – EPP was gone from the TV schedule, entertainment elements were introduced into the program, as well as a change going in the direction of altering viewing habits. This doesn´t mean that entertainment elements hadn´t existed before, the difference was that “TV entertainment” back then “had to fit into the conservative concept of state television” so that any “colorful excess” would be noticed and remembered. All that was in-tended to be for public appearance, which included artistic work irrespective of genre and medium, was controlled and permeated by strong censorship.
5. Conclusion
The cross section of TV Zagreb’s First Channel TV program genre structure and commercials as a me-dia form during the 1970s and the 1980s served as suitable ground for the analysis of social circum-stances and characteristics of the particular time and space in which those forms emerged. Having in mind that most values in a society are chan-neled through television, which processes reality and broadcasts information, and the fact that media contents within the structure of a TV program are in given circumstances broadcasted with the goal of causing a predetermined effect on the audience, this retrospective cross section also served to clearly map the changes in the communication behavior of the audience.
The gradual entrance and continuous growth in the commercialization of “announcer” genres was noted, which, along with the entrance of EPP into television space, points to a change in the charac-ter of television at the time. Having in mind the dominant influence of television and the audience which is formed under that influence, an effort was made to establish if there was both a change in the television’s character and a change in the audi-ence’s status. It was demonstrated that the change of program structure still didn´timply commerciali-zation, at least not in the original sense present in such media models as the American one. That the gradual shift served as a preparation phase for the structural change which prepared the audience for commercialization and by which the media space was guided towards merging with the advertising
In the analysis, a film serial was considered every film which was accompanied by the description of “film serial” regardless if its sequel was broadcasted or not. Most problems appeared with the serial pro-gram category which included TV series, soap ope-ras and telenovelas. A series is a type of show that is partly autonomous, but partly continuous from episode to episode. “The most familiar series are soap operas, continuous series, TV series (limited number of episodes), but also various continuous show programs (entertainment, variety, plays), and often even news have features of a series (when con-secutively following the development of an event)” (Turković, 2008: 275). Such a genre will greatly at-tach certain viewers to it and the recurrence of the show opens the possibility of creating televi-sion viewing habits, strongly attaching viewers to a certain program over longer periods of time. Even though there is a significant difference between what is considered a series and present-day regard of soap operas and telenovelas, the listed genres are placed in the same category considering there were no terminology differences between them in the TV program. The arrival of soap operas and telenove-las in the Yugoslav media space is linked with TV sets getting cheaper at the start of the 1960s when popular American soap operas The long, Hot Sum-mer, Peyton Place, and subsequently various Czech, Polish, German and Italian series began broadcast-ing (Oršolić, 2013). However, the TV program list-ed dallas in the “series” genre, as well as america’s Funniest Home videos, which actually belongs in the show genre. Also, domestic production series, such as Slanko, a children’s series, and Odbornici, were listed as domestic series, but were more of an educational character rather than commercial.
The 1970s genre shift is followed by an increase in self-produced marketing shows (Table 4) as well as the start of the EPP era (Table 3). Considering the content and small number of such media forms, it could rightly be argued that at the time, as well as in the early 1980s, the audience was still not being handed overto advertisers. It also may not be pos-sible to argue that the audience was active and that it was participating, but it was certainly not reduced to mere latent consumers, at least not in the same sense as today. Some authors, such as Dimitrijević, claim that advertising a certain product in socialism was intended as the sole act of rational introduction with the characteristics and method of use (2013: 13), i.e. that the economic propaganda in SFRY was
never solely in the function of product promotion, but rather in the service of a general idea “’coming from above’ regarding the stimulation of produc-tion and consumption as part of a plan to build a socialist society” (Čeh, 2013: 14). That plan is also visible in the types of advertising messages and companies that were being advertised. Even though almost all market participants in the field of market-ing and promotion already existed in the 1970s (ad-vertising agencies such as Vjesnik’s agency and mar-ket research agency), marketing was also becoming an almost autonomous function in companies. This means that, as is the case today, marketing and ad-vertising were first and foremost business functions which were perhaps only indirectly ideological.
TV Zagreb’s character during the 1980s
A significant ratio increase of commercialization “announcer” genres is visible in the 1980s, an in-crease from 6% in 1981 to 12% in 1987 (Table 2). 1802 units of titles were analyzed during that period and a deeper insight into the program genre struc-ture reveals the changes that characterized this pe-riod. In the beginning of the 1980s, an overview of the program was broadcasted on a daily basis, news several times a day, central evening news, various music shows, sports block, TV calendar, cartoons, morning and evening announcements and the pro-gram ran from 18:00 to 22:00 on First Channel, which makes a small difference when compared to the 1970s. The distinction of these years is a greater representation of sport and genre distribution ad-justment in regards to a successful period of Yugo-slav film production. The result is a smaller ratio of American film (8%) and the increase of domestic film serial (28%). Also talk shows arrived on TV screens, which although not considered as a com-mercial genre, implicated a greater role in creating public opinion. They were a novelty in the TV pro-gram (new genre) and in accordance to the genre classification back then could be considered as a po-litical show. The significance is even greater consid-ering that the separation of serial genres occurred at the time, thus creating educational, documentary, drama and ordinary series which were as such still listed just as “series” in the TV program.
The end of the 1980s indicated the stabilization of the television program since a cartoon for children
Marina Đukić, Ivica Šola:Preparing the public for commercialization and guidance of structural media space towards its fusion with advertising space UDK: 659(497.5) / Original scientific article
God. XXVIII, BR. 1/2015. str. 25-41 God. XXVIII, BR. 1/2015. str. 25-41
38 39
References
1. Ban, Đ. (2009), „Utjecaj ekonomske propagande na učeničku populaciju u Dubrovniku“, Ekonomska misao i praksa, Vol. 18, No. 1, pp. 153-174.
2. Barsamiam, D. (2003), „Collateral Language“, Z-Magazine.online, July-August 2003, Available at: http://www.chomsky.info/interviews/200307--.htm (Accessed on: April 3, 2014)
3. Bijelić, G., Tomašić, A. (2008), „Modeli komuniciranja u javnom i komercijalnom servisu“, Medianali, Vol. 2, No. 3, pp. 179-186.
4. Brϋggemann, M. (2010), „Information Policy and the Public Sphere. EU Communications and the promises of dialogue and transparency“, Javnost – the Public, Vol. 17, No. 1, pp. 5-22.
5. Car, V. (2007), „Konvergirani javni medijski servis“, Politička misao, Vol. 44, No. 2, pp. 113-127.
6. Chandler, D. (2000), „An Introduction to Genre Theory“, Available at: http://www.aber.ac.uk/media/Documents/intgenre/intgenre1.html (Accessed on: March 26, 2014)
7. Cuilenburg, J. V., McQuail, D. (2003), „Media Policy Paradigm Shifts: Towards a New Communica-tions Policy Paradigm“, European Journal of Communication, Vol. 18, No. 2, pp. 181-207.
8. Creeber, G. (2008). The Television Genre Book. London: BFI, Palgrave Macmillian.
9. Broom, M. B. (2010). Cutlip&Center´s Učinkoviti odnosi s javnošću. Zagreb: Mate.
10. Čeh, V. (2013), „Ja letim za London, a vi?“, Polet/Ekonomska propaganda u Jugoslaviji 1969-1980, Zemun, pp. 16-19.
11. Dahlgren, P. (1996), „The not so staunch defence of Swedish public service broadcasting“, The Public, Vol. 3, No. 2, pp. 35-49.
12. Dimitrijević, B. (2013), „Nije mi toliko do bruke koliko do tržišta!“, Polet/Ekonomska propaganda u Jugoslaviji 1969-1980, Zemun, pp. 11-15
13. Državni zavod za statistiku Republike Hrvatske (1994), „Statistički izvještaj za 1993. godinu“, pp. 18-28.
14. Fiske, J. (1987). Television Culture. London: Routledge.
15. Freedman, D. (2008). The Politics of Media Policy. Malden: PolityPress.
16. Grbelja, J. (1998). Cenzura u hrvatskom novinstvu: 1945. – 1990. Zagreb: Naklada Jurčić.
17. Grunig, J. E., Hunt, T. (1984). Managing Public Relations. Holt, Rinehart and Winston.
18. Habermas, J. (1969). Javno mnenje. Istraživanje u oblasti jedne kategorije građanskog društva. Beo-grad: Kultura.
19. Jantol, T. (2004). Politička javnost. Zagreb: Birotisak.
20. Jukić, J. (1998), „Javno mnijenje u društvu“, In: Baloban, S. (Ed.), Socijalni nauk Crkve u hrvatskom društvu, Zagreb, pp. 97-110.
21. Kunczik, M., Zipfel, A. (1998). Uvod u publicističku znanost i komunikologiju. Zagreb: Zaklada Frie-drich Ebert.
22. Kurtić, N. (2014), „Medijska politika“, In: Malović, S. et al. (Eds.), Masovno komuniciranje, Golden-market Tehnička knjiga, Zagreb, pp. 95-174.
space. It was demonstrated that the role of the me-dia (which means the content itself ) significantly affects the position of the public in a given media system. Namely, in the communist one-party sys-tem the media were under constant supervision of the Party (through direct or indirect information censorship) which reduced them to sociopolitical institutions that transmitted the leadership’s official information, conclusions and thoughts to the citi-zens. Such transmission of information was carried out with the specific goal to influence the audience. That goal came down to the creation of a non-active public, or, as Grunig puts it, nonpublic where the media were just a medium which was supposed to create latent patriots, citizens who will believe in the system and will not question its legitimacy. The goal of such a revolutionary role of the media wasn´t to create voters, or a participating public, but a public that doesn´t get involved because it doesn´t need to as it was told how to think. From that perspec-
tive it´s not difficult to explain either the direction of the media contents or the very function of EPP at the time. The public wasn´t yet being sold out to advertisers back then, since EPP served to promote the socialist economy idea, stimulate the produc-tion and consumptionside-by-side with its business function.
Present-day media owners find themselves in a po-sition to control mass audiences through the media, to bestow information which unequivocally leads to unilateral conclusions. The fact that the public has been transformed from one type of latent state – la-tent patriots – into another – latent consumers, is reflected in the very role of the media. Viewers are guided, and it is of no importance whether they are guided by a totalitarian regime or entertainment, both turn them into passive consumers, unim-mersed in the problem situation.
Marina Đukić, Ivica Šola:Preparing the public for commercialization and guidance of structural media space towards its fusion with advertising space UDK: 659(497.5) / Original scientific article
God. XXVIII, BR. 1/2015. str. 25-41 God. XXVIII, BR. 1/2015. str. 25-41
40 41
Marina ĐukićIvica Šola
Priprema javnosti za komercijalizaciju i usmjeravanje strukturalnog medijskog prostora za spajanje s oglašivačkim prostorom
Sažetak
Analizom žanrovske strukture televizijskoga programa od početka 1970-ih do sredine 1990-ih na Prvom programu Televizije Zagreb i njegovim položajem oglašavanja,razmatraju se načini i intenzitet ulaska komercijalizacije u hrvatski medijski prostor u tadašnjemu vremenu, pod dominacijom državnih medija. Žanrovsko mijenjanje televizijskoga programa i emitiranje EPP-a (ekonomsko-propagandnoga programa) ukazivat će na drugi karakter kojega televizija dobiva, a može se reći da će i služiti kao priprema javnos-ti za ulazak komercijalizacije, odnosno usmjeravanje strukturalnoga medijskoga prostora za spajanje s oglašivačkim prostorom. Pretpostavka je da unatoč strukturalnim promjenama televizijskoga programa, koje su u ekonomskome smislu bile praćene privrednim reformama, u cilju uspostavljanja tržišne ekono-mije, publika još uvijek nije bila isporučivana oglašivačima. Objašnjenje leži u samoj ulozi medija, koji su tada imali revolucionarnu funkciju nestvaranja glasača, već isključivo patriota.
Analizom medijskoga sadržaja prezentiranoga u okviru televizijskoga programa, rad će prikazati svoje-vrsnu genezu transformacije javnosti iz stanja latentnosti u državnom vođenom medijskom sustavu, u isto stanje latentnosti u mješovitom modelu medija.
Ključne riječi: javnost, komercijalizacija, žanrovi, televizijski program, oglašavanje
23. Lakičević, M. (2013), „Privredna reforma 1965. kao preduslov za razvoj ekonomske propagande“, Polet/Ekonomska propaganda u Jugoslaviji 1969-1980, Zemun, pp. 4-7.
24. Lamza-Posavec, V. (1995). Javno mišljenje. Zagreb: Alinea.
25. Malović, S. (2003). Novine. Zagreb: Sveučilišna knjižara.
26. McChesney, W. R. (2008). Bogati mediji, siromašna demokratija: komunikacijske politike u mutnim vremenima. Sarajevo: Šahinpašić.
27. McQuail, D. (2000). Mass Communication Theory. 4th edition. London: Sage.
28. McQuail, D. (1998), „Commercialization and Beyond“, In: McQuail, D., Siune, K. (Eds.), Media Policy: Convergence, concentration and commerce, Sage, London, pp. 107-127.
29. Nordensterng, K. (1997), „Beyond the Four Theories of the Press“, In: Servaes, J., Lie, R. (Eds.), Media & Politics in Transition: Cultural Identity in the Age of Globalization, ACCO, Leuven, pp. 97-109.
30. Oršolić, M. (2013), „Sapunice i telenovele od kubanskih tvornica do gospodara malih ekrana“, Available at: http://www.prometej.ba/index.php/home-4/1097-sapunice-i-telenovele-od-kubanskih-tvornica-do-gospodara-malih-ekrana (Accessed on: January 2, 2014)
31. Popović, H. (2012), „Popularni televizijski žanrovi kao refleksija suvremenog društva“, Holon, Vol. 2, No. 3, pp. 18-43.
32. Rovigatti, V. (1985). Scienza dell’opinione pubblica. Milano: Cinisello Balsamo.
33. Siebert, F. S., Peterson,T., Schramm, W. (1956). Four Theories of the Press. Champaign: University of Illinois Press.
34. Statistički zavod SR Hrvatske (1976), „Statistički izvještaj za 1975. godinu“, pp. 31-38.
35. Statistički zavod SR Hrvatske (1979), „Statistički izvještaj za 1978. godinu“, pp. 62-66.
36. Statistički zavod SR Hrvatske (1982), „Statistički izvještaj za 1981. godinu“, pp. 21-25.
37. Statistički zavod SR Hrvatske (1985), „Statistički izvještaj za 1984. godinu“, pp. 21-24.
38. Statistički zavod SR Hrvatske (1988), „Statistički izvještaj za 1987. godinu“, pp. 17-20.
39. Statistički zavod SR Hrvatske (1990), „Statistički izvještaj za 1991. godinu“, pp. 19-22.
40. Šalković, H. (2000), „Hrvatska televizija u transformaciji prema modelu javne televizije – iluzija ili realnost?“, Medijska istraživanja, Vol. 6, No. 1, pp. 19-39.
41. Swanson, D. L., Mancini, P. (1996). Politics, media and modern democracy: an international study of innovations in electoral campaigning and their consequences. Connecticut: Praeger Publisher.
42. Tomić, Z., Skoko, J., Milas, Z. (2007), „Odnosi s javnošću: javnost i javno mišljenje“, Fakultet političkih nauka, Godišnjak 2007, Beograd, pp. 211-224.
43. Turković, H. (2008). Narav televizije. Zagreb: Meandar.
44. Valković, J. (2009), „Supsidijarnost u hrvatskom medijskom prostoru“, Bogoslovska smotra, Vol. 79, No. 1, pp. 113-146.
45. Vončina, N. (2001). RTV Zagreb: 1959. - 1964.: prilozi za povijest radija u Hrvatskoj IV. Zagreb: Treći Program Hrvatskog radija.
46. Vučetić, R. (2012), „Potrošačko društvo po američkom modelu (jedan pogled na jugoslavensku svakod-nevnicu šesdesetih)“, Časopis za suvremenu povijest, Vol. 44, No. 2, pp. 277-298.
God. XXVIII, BR. 1/2015. str. 25-41 God. XXVIII, BR. 1/2015. str. 25-41
Marina Đukić, Ivica Šola:Preparing the public for commercialization and guidance of structural media space towards its fusion with advertising space UDK: 659(497.5) / Original scientific article
43God. XXVIII, BR. 1/2015. str. 43-66
Rory James Ridley-Duff: The FairShares Model: An ethical approach to social enterprise development?
1. Introduction
In this paper, arguments to the 14th International Association of Public and Non-Profit Marketing (IAPNM) conference are reflexively scrutinised to develop a theory of social enterprise ethics. The work was developed and informed by the prepara-tion of the first and second editions of Understand-ing Social Enterprise: Theory and Practice (Ridley-Duff & Bull, 2011; 2015) and participation in the formation of FairShares Association.
The research question is: ‘What impact do ethical values in the FairShares Model have on social en-trepreneurial behaviour?’ The rationale for answer-ing this question has a personal aspect - the Fair-Shares Model (hereafter referred to as FairShares) is the product of a three-way relationship between: a decade of research clarifying the role of social enterprise in democratising work (Ridley-Duff, 2002; 2007; Bull, et al., 2010; Ridley-Duff & Ben-nett, 2011); its impact on social enterprise educa-tion (Ridley-Duff & Southcombe, 2012; Ridley-Duff
THE FAIRSHARES MODEL:AN ETHICAL APPROACH TO SOCIAL ENTERPRISE DEVELOPMENT?
UDK: 005.35:172Original scientific article
Received: april 28, 2015accepted for publishing: May 28, 2015
Rory James Ridley-DuffSheffield Hallam UniversitySheffield Business Schoolarundel GateSheffield, S1 1WB, United [email protected]: +441142255081
Abstract
This paper is based on the keynote address to the 14th International Association of Public and Non-Profit Marketing (IAPNM) conference. It explores the question “What impact do ethical values in the FairShares Model have on social entrepreneurial behaviour?” In the first part, three broad approaches to social enter-prise are set out: co-operative and mutual enterprises (CMEs), social and responsible businesses (SRBs) and charitable trading activities (CTAs). The ethics that guide each approach are examined to provide a conceptual framework for examining FairShares as a case study. In the second part, findings are scrutinised in terms of the ethical values and principles that are activated when FairShares is applied to practice. The paper contributes to knowledge by giving an example of the way OpenSource technology (Loomio) has been used to translate ‘espoused theories’ into ‘theories in use’ to advance social enterprise development. The review of FairShares using the conceptual framework suggests there is a fourth approach based on multi-stakeholder co-operation to create ‘associative democracy’ in the workplace.
Keywords: Social economy, ethics, solidarity, social enterprise, cooperation, mutuality
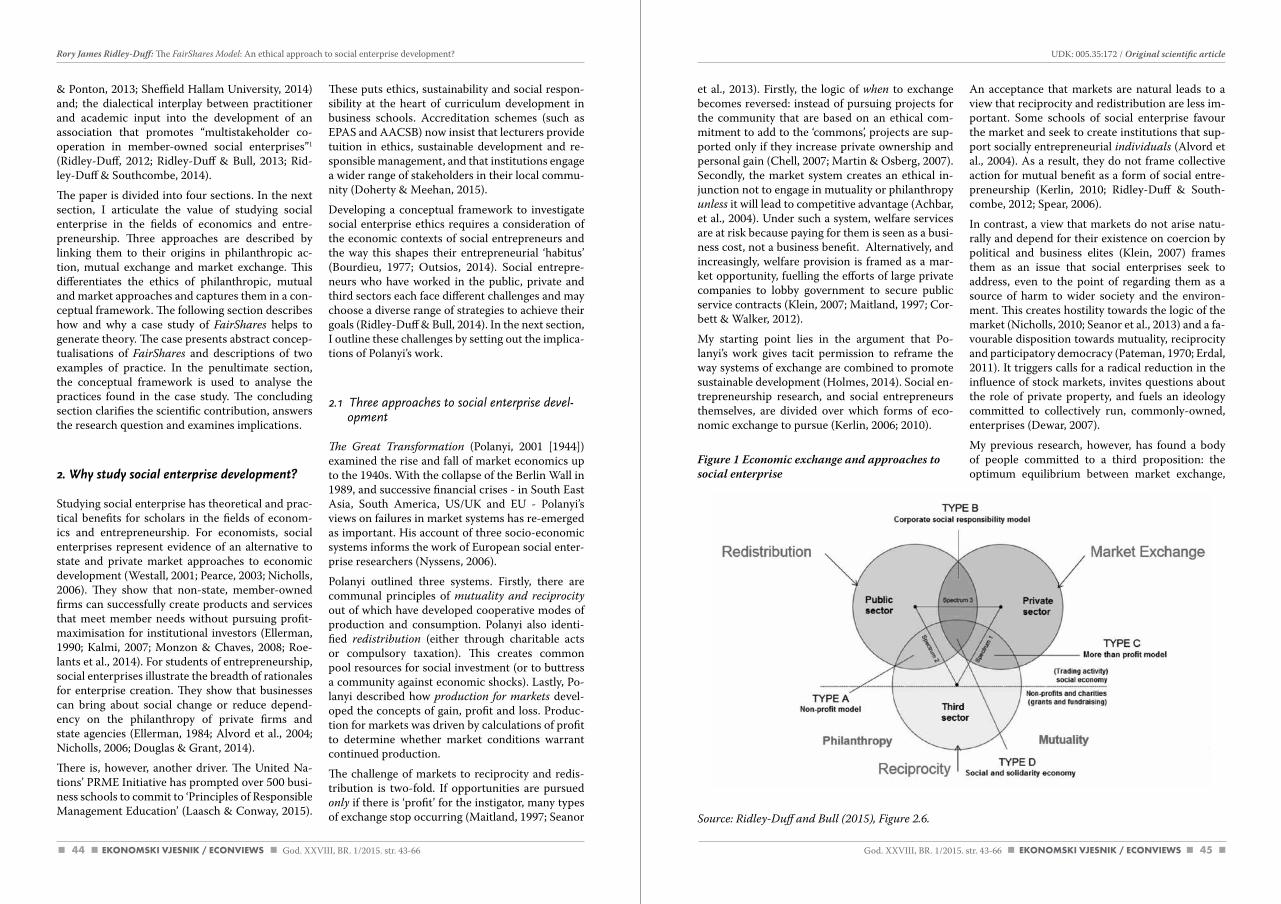
44 45
UDK: 005.35:172 / Original scientific article
God. XXVIII, BR. 1/2015. str. 43-66 God. XXVIII, BR. 1/2015. str. 43-66
Rory James Ridley-Duff: The FairShares Model: An ethical approach to social enterprise development?
et al., 2013). Firstly, the logic of when to exchange becomes reversed: instead of pursuing projects for the community that are based on an ethical com-mitment to add to the ‘commons’, projects are sup-ported only if they increase private ownership and personal gain (Chell, 2007; Martin & Osberg, 2007). Secondly, the market system creates an ethical in-junction not to engage in mutuality or philanthropy unless it will lead to competitive advantage (Achbar, et al., 2004). Under such a system, welfare services are at risk because paying for them is seen as a busi-ness cost, not a business benefit. Alternatively, and increasingly, welfare provision is framed as a mar-ket opportunity, fuelling the efforts of large private companies to lobby government to secure public service contracts (Klein, 2007; Maitland, 1997; Cor-bett & Walker, 2012).
My starting point lies in the argument that Po-lanyi’s work gives tacit permission to reframe the way systems of exchange are combined to promote sustainable development (Holmes, 2014). Social en-trepreneurship research, and social entrepreneurs themselves, are divided over which forms of eco-nomic exchange to pursue (Kerlin, 2006; 2010).
Figure 1 Economic exchange and approaches to social enterprise
Source: Ridley-duff and Bull (2015), Figure 2.6.
An acceptance that markets are natural leads to a view that reciprocity and redistribution are less im-portant. Some schools of social enterprise favour the market and seek to create institutions that sup-port socially entrepreneurial individuals (Alvord et al., 2004). As a result, they do not frame collective action for mutual benefit as a form of social entre-preneurship (Kerlin, 2010; Ridley-Duff & South-combe, 2012; Spear, 2006).
In contrast, a view that markets do not arise natu-rally and depend for their existence on coercion by political and business elites (Klein, 2007) frames them as an issue that social enterprises seek to address, even to the point of regarding them as a source of harm to wider society and the environ-ment. This creates hostility towards the logic of the market (Nicholls, 2010; Seanor et al., 2013) and a fa-vourable disposition towards mutuality, reciprocity and participatory democracy (Pateman, 1970; Erdal, 2011). It triggers calls for a radical reduction in the influence of stock markets, invites questions about the role of private property, and fuels an ideology committed to collectively run, commonly-owned, enterprises (Dewar, 2007).
My previous research, however, has found a body of people committed to a third proposition: the optimum equilibrium between market exchange,
& Ponton, 2013; Sheffield Hallam University, 2014) and; the dialectical interplay between practitioner and academic input into the development of an association that promotes “multistakeholder co-operation in member-owned social enterprises”1 (Ridley-Duff, 2012; Ridley-Duff & Bull, 2013; Rid-ley-Duff & Southcombe, 2014).
The paper is divided into four sections. In the next section, I articulate the value of studying social enterprise in the fields of economics and entre-preneurship. Three approaches are described by linking them to their origins in philanthropic ac-tion, mutual exchange and market exchange. This differentiates the ethics of philanthropic, mutual and market approaches and captures them in a con-ceptual framework. The following section describes how and why a case study of FairShares helps to generate theory. The case presents abstract concep-tualisations of FairShares and descriptions of two examples of practice. In the penultimate section, the conceptual framework is used to analyse the practices found in the case study. The concluding section clarifies the scientific contribution, answers the research question and examines implications.
2. Why study social enterprise development?
Studying social enterprise has theoretical and prac-tical benefits for scholars in the fields of econom-ics and entrepreneurship. For economists, social enterprises represent evidence of an alternative to state and private market approaches to economic development (Westall, 2001; Pearce, 2003; Nicholls, 2006). They show that non-state, member-owned firms can successfully create products and services that meet member needs without pursuing profit-maximisation for institutional investors (Ellerman, 1990; Kalmi, 2007; Monzon & Chaves, 2008; Roe-lants et al., 2014). For students of entrepreneurship, social enterprises illustrate the breadth of rationales for enterprise creation. They show that businesses can bring about social change or reduce depend-ency on the philanthropy of private firms and state agencies (Ellerman, 1984; Alvord et al., 2004; Nicholls, 2006; Douglas & Grant, 2014).
There is, however, another driver. The United Na-tions’ PRME Initiative has prompted over 500 busi-ness schools to commit to ‘Principles of Responsible Management Education’ (Laasch & Conway, 2015).
These puts ethics, sustainability and social respon-sibility at the heart of curriculum development in business schools. Accreditation schemes (such as EPAS and AACSB) now insist that lecturers provide tuition in ethics, sustainable development and re-sponsible management, and that institutions engage a wider range of stakeholders in their local commu-nity (Doherty & Meehan, 2015).
Developing a conceptual framework to investigate social enterprise ethics requires a consideration of the economic contexts of social entrepreneurs and the way this shapes their entrepreneurial ‘habitus’ (Bourdieu, 1977; Outsios, 2014). Social entrepre-neurs who have worked in the public, private and third sectors each face different challenges and may choose a diverse range of strategies to achieve their goals (Ridley-Duff & Bull, 2014). In the next section, I outline these challenges by setting out the implica-tions of Polanyi’s work.
2.1 Three approaches to social enterprise devel-opment
The Great Transformation (Polanyi, 2001 [1944]) examined the rise and fall of market economics up to the 1940s. With the collapse of the Berlin Wall in 1989, and successive financial crises - in South East Asia, South America, US/UK and EU - Polanyi’s views on failures in market systems has re-emerged as important. His account of three socio-economic systems informs the work of European social enter-prise researchers (Nyssens, 2006).
Polanyi outlined three systems. Firstly, there are communal principles of mutuality and reciprocity out of which have developed cooperative modes of production and consumption. Polanyi also identi-fied redistribution (either through charitable acts or compulsory taxation). This creates common pool resources for social investment (or to buttress a community against economic shocks). Lastly, Po-lanyi described how production for markets devel-oped the concepts of gain, profit and loss. Produc-tion for markets was driven by calculations of profit to determine whether market conditions warrant continued production.
The challenge of markets to reciprocity and redis-tribution is two-fold. If opportunities are pursued only if there is ‘profit’ for the instigator, many types of exchange stop occurring (Maitland, 1997; Seanor
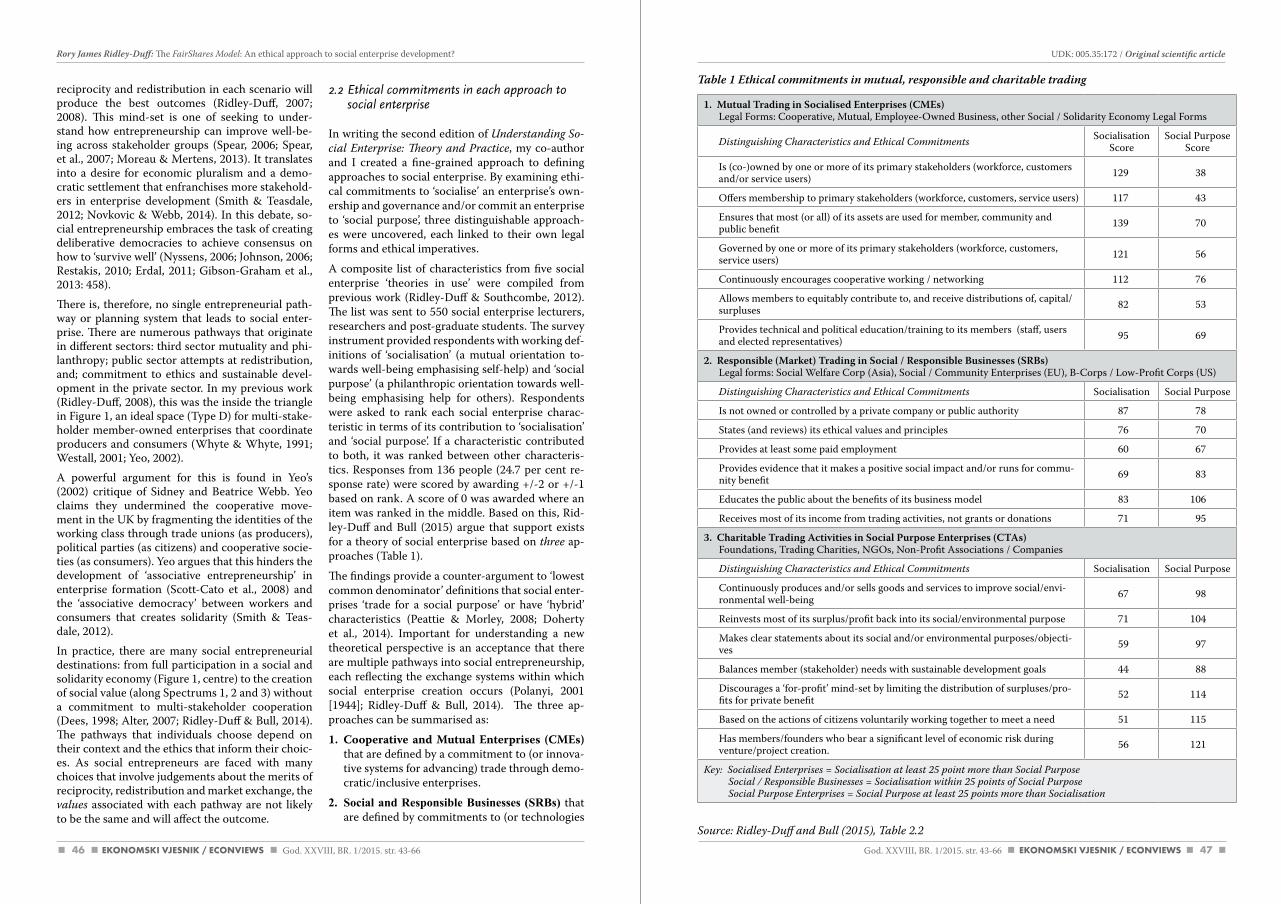
46 47
reciprocity and redistribution in each scenario will produce the best outcomes (Ridley-Duff, 2007; 2008). This mind-set is one of seeking to under-stand how entrepreneurship can improve well-be-ing across stakeholder groups (Spear, 2006; Spear, et al., 2007; Moreau & Mertens, 2013). It translates into a desire for economic pluralism and a demo-cratic settlement that enfranchises more stakehold-ers in enterprise development (Smith & Teasdale, 2012; Novkovic & Webb, 2014). In this debate, so-cial entrepreneurship embraces the task of creating deliberative democracies to achieve consensus on how to ‘survive well’ (Nyssens, 2006; Johnson, 2006; Restakis, 2010; Erdal, 2011; Gibson-Graham et al., 2013: 458).There is, therefore, no single entrepreneurial path-way or planning system that leads to social enter-prise. There are numerous pathways that originate in different sectors: third sector mutuality and phi-lanthropy; public sector attempts at redistribution, and; commitment to ethics and sustainable devel-opment in the private sector. In my previous work (Ridley-Duff, 2008), this was the inside the triangle in Figure 1, an ideal space (Type D) for multi-stake-holder member-owned enterprises that coordinate producers and consumers (Whyte & Whyte, 1991; Westall, 2001; Yeo, 2002). A powerful argument for this is found in Yeo’s (2002) critique of Sidney and Beatrice Webb. Yeo claims they undermined the cooperative move-ment in the UK by fragmenting the identities of the working class through trade unions (as producers), political parties (as citizens) and cooperative socie-ties (as consumers). Yeo argues that this hinders the development of ‘associative entrepreneurship’ in enterprise formation (Scott-Cato et al., 2008) and the ‘associative democracy’ between workers and consumers that creates solidarity (Smith & Teas-dale, 2012).In practice, there are many social entrepreneurial destinations: from full participation in a social and solidarity economy (Figure 1, centre) to the creation of social value (along Spectrums 1, 2 and 3) without a commitment to multi-stakeholder cooperation (Dees, 1998; Alter, 2007; Ridley-Duff & Bull, 2014). The pathways that individuals choose depend on their context and the ethics that inform their choic-es. As social entrepreneurs are faced with many choices that involve judgements about the merits of reciprocity, redistribution and market exchange, the values associated with each pathway are not likely to be the same and will affect the outcome.
2.2 Ethical commitments in each approach to social enterprise
In writing the second edition of Understanding So-cial Enterprise: Theory and Practice, my co-author and I created a fine-grained approach to defining approaches to social enterprise. By examining ethi-cal commitments to ‘socialise’ an enterprise’s own-ership and governance and/or commit an enterprise to ‘social purpose’, three distinguishable approach-es were uncovered, each linked to their own legal forms and ethical imperatives.
A composite list of characteristics from five social enterprise ‘theories in use’ were compiled from previous work (Ridley-Duff & Southcombe, 2012). The list was sent to 550 social enterprise lecturers, researchers and post-graduate students. The survey instrument provided respondents with working def-initions of ‘socialisation’ (a mutual orientation to-wards well-being emphasising self-help) and ‘social purpose’ (a philanthropic orientation towards well-being emphasising help for others). Respondents were asked to rank each social enterprise charac-teristic in terms of its contribution to ‘socialisation’ and ‘social purpose’. If a characteristic contributed to both, it was ranked between other characteris-tics. Responses from 136 people (24.7 per cent re-sponse rate) were scored by awarding +/-2 or +/-1 based on rank. A score of 0 was awarded where an item was ranked in the middle. Based on this, Rid-ley-Duff and Bull (2015) argue that support exists for a theory of social enterprise based on three ap-proaches (Table 1).
The findings provide a counter-argument to ‘lowest common denominator’ definitions that social enter-prises ‘trade for a social purpose’ or have ‘hybrid’ characteristics (Peattie & Morley, 2008; Doherty et al., 2014). Important for understanding a new theoretical perspective is an acceptance that there are multiple pathways into social entrepreneurship, each reflecting the exchange systems within which social enterprise creation occurs (Polanyi, 2001 [1944]; Ridley-Duff & Bull, 2014). The three ap-proaches can be summarised as:
1. Cooperative and Mutual Enterprises (CMEs) that are defined by a commitment to (or innova-tive systems for advancing) trade through demo-cratic/inclusive enterprises.
2. Social and Responsible Businesses (SRBs) that are defined by commitments to (or technologies
1. Mutual Trading in Socialised Enterprises (CMEs)Legal Forms: Cooperative, Mutual, Employee-Owned Business, other Social / Solidarity Economy Legal Forms
distinguishing characteristics and Ethical commitments Socialisation Score
Social Purpose Score
Is (co-)owned by one or more of its primary stakeholders (workforce, customers and/or service users) 129 38
Offers membership to primary stakeholders (workforce, customers, service users) 117 43
Ensures that most (or all) of its assets are used for member, community and public benefit 139 70
Governed by one or more of its primary stakeholders (workforce, customers, service users) 121 56
Continuously encourages cooperative working / networking 112 76
Allows members to equitably contribute to, and receive distributions of, capital/surpluses 82 53
Provides technical and political education/training to its members (staff, users and elected representatives) 95 69
2. Responsible (Market) Trading in Social / Responsible Businesses (SRBs)Legal forms: Social Welfare Corp (Asia), Social / Community Enterprises (EU), B-Corps / Low-Profit Corps (US)
distinguishing characteristics and Ethical commitments Socialisation Social Purpose
Is not owned or controlled by a private company or public authority 87 78
States (and reviews) its ethical values and principles 76 70
Provides at least some paid employment 60 67
Provides evidence that it makes a positive social impact and/or runs for commu-nity benefit 69 83
Educates the public about the benefits of its business model 83 106
Receives most of its income from trading activities, not grants or donations 71 95
3. Charitable Trading Activities in Social Purpose Enterprises (CTAs) Foundations, Trading Charities, NGOs, Non-Profit Associations / Companies
distinguishing characteristics and Ethical commitments Socialisation Social Purpose
Continuously produces and/or sells goods and services to improve social/envi-ronmental well-being 67 98
Reinvests most of its surplus/profit back into its social/environmental purpose 71 104
Makes clear statements about its social and/or environmental purposes/objecti-ves 59 97
Balances member (stakeholder) needs with sustainable development goals 44 88
Discourages a ‘for-profit’ mind-set by limiting the distribution of surpluses/pro-fits for private benefit 52 114
Based on the actions of citizens voluntarily working together to meet a need 51 115
Has members/founders who bear a significant level of economic risk during venture/project creation. 56 121
Key: Socialised Enterprises = Socialisation at least 25 point more than Social PurposeSocial / Responsible Businesses = Socialisation within 25 points of Social PurposeSocial Purpose Enterprises = Social Purpose at least 25 points more than Socialisation
Table 1 Ethical commitments in mutual, responsible and charitable trading
Source: Ridley-duff and Bull (2015), Table 2.2
UDK: 005.35:172 / Original scientific article
God. XXVIII, BR. 1/2015. str. 43-66 God. XXVIII, BR. 1/2015. str. 43-66
Rory James Ridley-Duff: The FairShares Model: An ethical approach to social enterprise development?
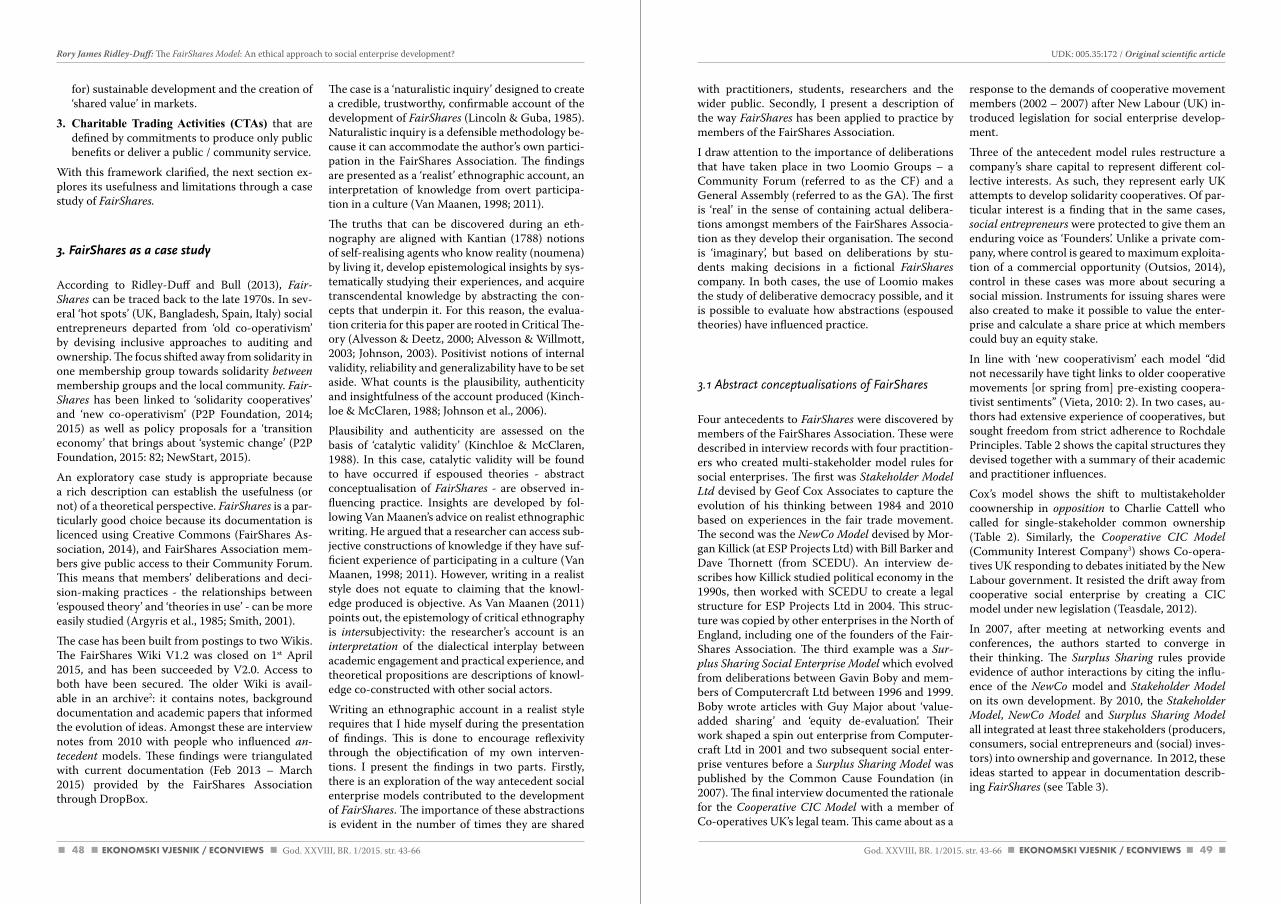
48 49
with practitioners, students, researchers and the wider public. Secondly, I present a description of the way FairShares has been applied to practice by members of the FairShares Association.
I draw attention to the importance of deliberations that have taken place in two Loomio Groups – a Community Forum (referred to as the CF) and a General Assembly (referred to as the GA). The first is ‘real’ in the sense of containing actual delibera-tions amongst members of the FairShares Associa-tion as they develop their organisation. The second is ‘imaginary’, but based on deliberations by stu-dents making decisions in a fictional FairShares company. In both cases, the use of Loomio makes the study of deliberative democracy possible, and it is possible to evaluate how abstractions (espoused theories) have influenced practice.
3.1 Abstract conceptualisations of FairShares
Four antecedents to FairShares were discovered by members of the FairShares Association. These were described in interview records with four practition-ers who created multi-stakeholder model rules for social enterprises. The first was Stakeholder Model ltd devised by Geof Cox Associates to capture the evolution of his thinking between 1984 and 2010 based on experiences in the fair trade movement. The second was the Newco Model devised by Mor-gan Killick (at ESP Projects Ltd) with Bill Barker and Dave Thornett (from SCEDU). An interview de-scribes how Killick studied political economy in the 1990s, then worked with SCEDU to create a legal structure for ESP Projects Ltd in 2004. This struc-ture was copied by other enterprises in the North of England, including one of the founders of the Fair-Shares Association. The third example was a Sur-plus Sharing Social Enterprise Model which evolved from deliberations between Gavin Boby and mem-bers of Computercraft Ltd between 1996 and 1999. Boby wrote articles with Guy Major about ‘value-added sharing’ and ‘equity de-evaluation’. Their work shaped a spin out enterprise from Computer-craft Ltd in 2001 and two subsequent social enter-prise ventures before a Surplus Sharing Model was published by the Common Cause Foundation (in 2007). The final interview documented the rationale for the cooperative cIc Model with a member of Co-operatives UK’s legal team. This came about as a
response to the demands of cooperative movement members (2002 – 2007) after New Labour (UK) in-troduced legislation for social enterprise develop-ment.
Three of the antecedent model rules restructure a company’s share capital to represent different col-lective interests. As such, they represent early UK attempts to develop solidarity cooperatives. Of par-ticular interest is a finding that in the same cases, social entrepreneurs were protected to give them an enduring voice as ‘Founders’. Unlike a private com-pany, where control is geared to maximum exploita-tion of a commercial opportunity (Outsios, 2014), control in these cases was more about securing a social mission. Instruments for issuing shares were also created to make it possible to value the enter-prise and calculate a share price at which members could buy an equity stake.
In line with ‘new cooperativism’ each model “did not necessarily have tight links to older cooperative movements [or spring from] pre-existing coopera-tivist sentiments” (Vieta, 2010: 2). In two cases, au-thors had extensive experience of cooperatives, but sought freedom from strict adherence to Rochdale Principles. Table 2 shows the capital structures they devised together with a summary of their academic and practitioner influences.
Cox’s model shows the shift to multistakeholder coownership in opposition to Charlie Cattell who called for single-stakeholder common ownership (Table 2). Similarly, the cooperative cIc Model (Community Interest Company3) shows Co-opera-tives UK responding to debates initiated by the New Labour government. It resisted the drift away from cooperative social enterprise by creating a CIC model under new legislation (Teasdale, 2012).
In 2007, after meeting at networking events and conferences, the authors started to converge in their thinking. The Surplus Sharing rules provide evidence of author interactions by citing the influ-ence of the Newco model and Stakeholder Model on its own development. By 2010, the Stakeholder Model, Newco Model and Surplus Sharing Model all integrated at least three stakeholders (producers, consumers, social entrepreneurs and (social) inves-tors) into ownership and governance. In 2012, these ideas started to appear in documentation describ-ing FairShares (see Table 3).
for) sustainable development and the creation of ‘shared value’ in markets.
3. Charitable Trading Activities (CTAs) that are defined by commitments to produce only public benefits or deliver a public / community service.
With this framework clarified, the next section ex-plores its usefulness and limitations through a case study of FairShares.
3. FairShares as a case study
According to Ridley-Duff and Bull (2013), Fair-Shares can be traced back to the late 1970s. In sev-eral ‘hot spots’ (UK, Bangladesh, Spain, Italy) social entrepreneurs departed from ‘old co-operativism’ by devising inclusive approaches to auditing and ownership. The focus shifted away from solidarity in one membership group towards solidarity between membership groups and the local community. Fair-Shares has been linked to ‘solidarity cooperatives’ and ‘new co-operativism’ (P2P Foundation, 2014; 2015) as well as policy proposals for a ‘transition economy’ that brings about ‘systemic change’ (P2P Foundation, 2015: 82; NewStart, 2015).
An exploratory case study is appropriate because a rich description can establish the usefulness (or not) of a theoretical perspective. FairShares is a par-ticularly good choice because its documentation is licenced using Creative Commons (FairShares As-sociation, 2014), and FairShares Association mem-bers give public access to their Community Forum. This means that members’ deliberations and deci-sion-making practices - the relationships between ‘espoused theory’ and ‘theories in use’ - can be more easily studied (Argyris et al., 1985; Smith, 2001).
The case has been built from postings to two Wikis. The FairShares Wiki V1.2 was closed on 1st April 2015, and has been succeeded by V2.0. Access to both have been secured. The older Wiki is avail-able in an archive2: it contains notes, background documentation and academic papers that informed the evolution of ideas. Amongst these are interview notes from 2010 with people who influenced an-tecedent models. These findings were triangulated with current documentation (Feb 2013 – March 2015) provided by the FairShares Association through DropBox.
The case is a ‘naturalistic inquiry’ designed to create a credible, trustworthy, confirmable account of the development of FairShares (Lincoln & Guba, 1985). Naturalistic inquiry is a defensible methodology be-cause it can accommodate the author’s own partici-pation in the FairShares Association. The findings are presented as a ‘realist’ ethnographic account, an interpretation of knowledge from overt participa-tion in a culture (Van Maanen, 1998; 2011).
The truths that can be discovered during an eth-nography are aligned with Kantian (1788) notions of self-realising agents who know reality (noumena) by living it, develop epistemological insights by sys-tematically studying their experiences, and acquire transcendental knowledge by abstracting the con-cepts that underpin it. For this reason, the evalua-tion criteria for this paper are rooted in Critical The-ory (Alvesson & Deetz, 2000; Alvesson & Willmott, 2003; Johnson, 2003). Positivist notions of internal validity, reliability and generalizability have to be set aside. What counts is the plausibility, authenticity and insightfulness of the account produced (Kinch-loe & McClaren, 1988; Johnson et al., 2006).
Plausibility and authenticity are assessed on the basis of ‘catalytic validity’ (Kinchloe & McClaren, 1988). In this case, catalytic validity will be found to have occurred if espoused theories - abstract conceptualisation of FairShares - are observed in-fluencing practice. Insights are developed by fol-lowing Van Maanen’s advice on realist ethnographic writing. He argued that a researcher can access sub-jective constructions of knowledge if they have suf-ficient experience of participating in a culture (Van Maanen, 1998; 2011). However, writing in a realist style does not equate to claiming that the knowl-edge produced is objective. As Van Maanen (2011) points out, the epistemology of critical ethnography is intersubjectivity: the researcher’s account is an interpretation of the dialectical interplay between academic engagement and practical experience, and theoretical propositions are descriptions of knowl-edge co-constructed with other social actors.
Writing an ethnographic account in a realist style requires that I hide myself during the presentation of findings. This is done to encourage reflexivity through the objectification of my own interven-tions. I present the findings in two parts. Firstly, there is an exploration of the way antecedent social enterprise models contributed to the development of FairShares. The importance of these abstractions is evident in the number of times they are shared
UDK: 005.35:172 / Original scientific article
God. XXVIII, BR. 1/2015. str. 43-66 God. XXVIII, BR. 1/2015. str. 43-66
Rory James Ridley-Duff: The FairShares Model: An ethical approach to social enterprise development?
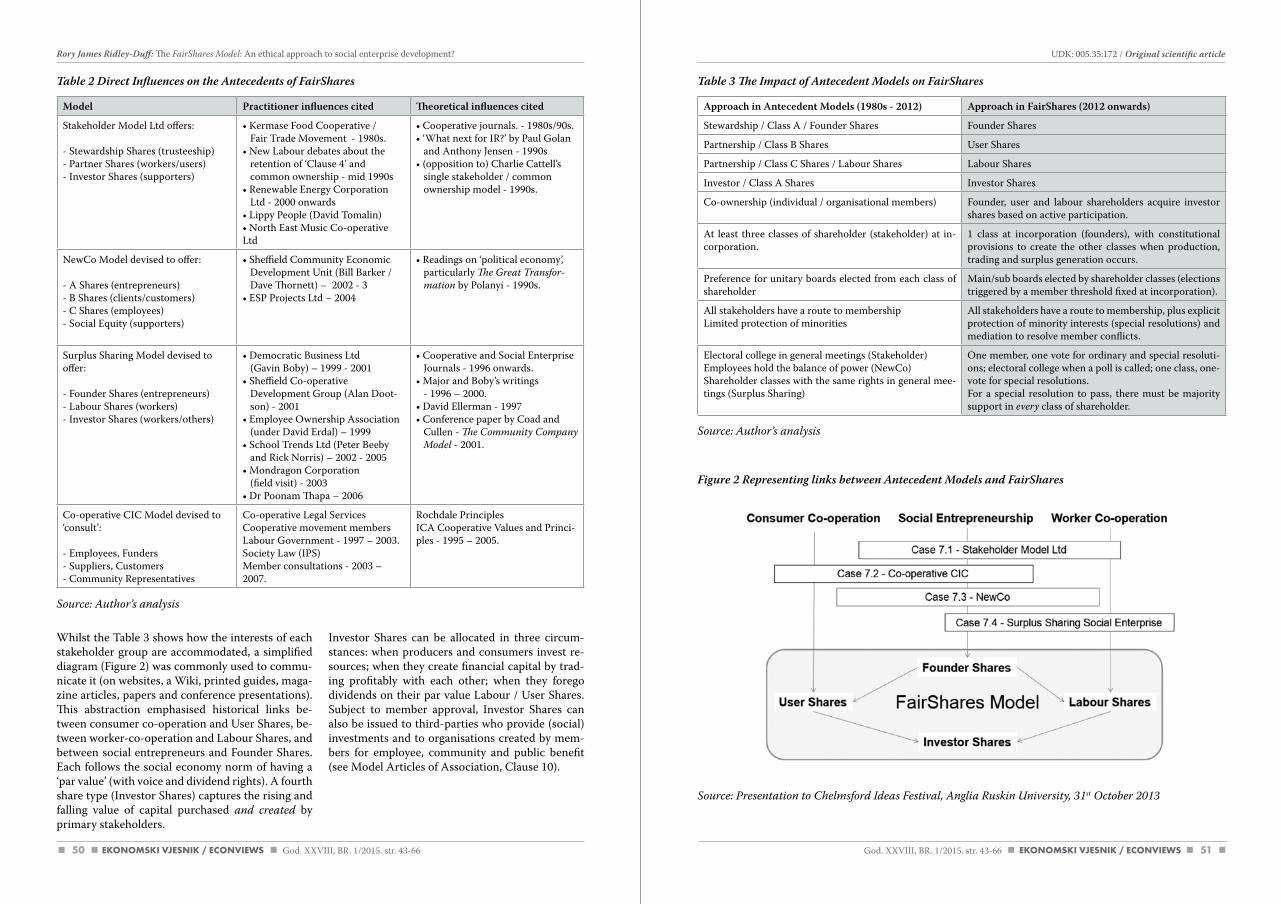
50 51
Source: author’s analysis
Figure 2 Representing links between Antecedent Models and FairShares
Source: Presentation to chelmsford Ideas Festival, anglia Ruskin University, 31st October 2013
Source: author’s analysis
Whilst the Table 3 shows how the interests of each stakeholder group are accommodated, a simplified diagram (Figure 2) was commonly used to commu-nicate it (on websites, a Wiki, printed guides, maga-zine articles, papers and conference presentations). This abstraction emphasised historical links be-tween consumer co-operation and User Shares, be-tween worker-co-operation and Labour Shares, and between social entrepreneurs and Founder Shares. Each follows the social economy norm of having a ‘par value’ (with voice and dividend rights). A fourth share type (Investor Shares) captures the rising and falling value of capital purchased and created by primary stakeholders.
Investor Shares can be allocated in three circum-stances: when producers and consumers invest re-sources; when they create financial capital by trad-ing profitably with each other; when they forego dividends on their par value Labour / User Shares. Subject to member approval, Investor Shares can also be issued to third-parties who provide (social) investments and to organisations created by mem-bers for employee, community and public benefit (see Model Articles of Association, Clause 10).
Model Practitioner influences cited Theoretical influences cited
Stakeholder Model Ltd offers:
- Stewardship Shares (trusteeship)- Partner Shares (workers/users)- Investor Shares (supporters)
• Kermase Food Cooperative /Fair Trade Movement - 1980s.
• New Labour debates about the retention of ‘Clause 4’ and common ownership - mid 1990s
• Renewable Energy CorporationLtd - 2000 onwards
• Lippy People (David Tomalin)• North East Music Co-operative Ltd
• Cooperative journals. - 1980s/90s.• ‘What next for IR?’ by Paul Golan
and Anthony Jensen - 1990s• (opposition to) Charlie Cattell’s
single stakeholder / common ownership model - 1990s.
NewCo Model devised to offer:
- A Shares (entrepreneurs)- B Shares (clients/customers)- C Shares (employees)- Social Equity (supporters)
• Sheffield Community EconomicDevelopment Unit (Bill Barker / Dave Thornett) – 2002 - 3
• ESP Projects Ltd – 2004
• Readings on ‘political economy’,particularly The Great Transfor-mation by Polanyi - 1990s.
Surplus Sharing Model devised to offer:
- Founder Shares (entrepreneurs)- Labour Shares (workers)- Investor Shares (workers/others)
• Democratic Business Ltd (Gavin Boby) – 1999 - 2001
• Sheffield Co-operative Development Group (Alan Doot-son) - 2001
• Employee Ownership Association(under David Erdal) – 1999
• School Trends Ltd (Peter Beebyand Rick Norris) – 2002 - 2005
• Mondragon Corporation(field visit) - 2003
• Dr Poonam Thapa – 2006
• Cooperative and Social EnterpriseJournals - 1996 onwards.
• Major and Boby’s writings- 1996 – 2000.
• David Ellerman - 1997• Conference paper by Coad and
Cullen - The community company Model - 2001.
Co-operative CIC Model devised to ‘consult’:
- Employees, Funders- Suppliers, Customers- Community Representatives
Co-operative Legal ServicesCooperative movement membersLabour Government - 1997 – 2003.Society Law (IPS)Member consultations - 2003 – 2007.
Rochdale PrinciplesICA Cooperative Values and Princi-ples - 1995 – 2005.
Table 2 Direct Influences on the Antecedents of FairShares Table 3 The Impact of Antecedent Models on FairShares
Approach in Antecedent Models (1980s - 2012) Approach in FairShares (2012 onwards)
Stewardship / Class A / Founder Shares Founder Shares
Partnership / Class B Shares User Shares
Partnership / Class C Shares / Labour Shares Labour Shares
Investor / Class A Shares Investor Shares
Co-ownership (individual / organisational members) Founder, user and labour shareholders acquire investor shares based on active participation.
At least three classes of shareholder (stakeholder) at in-corporation.
1 class at incorporation (founders), with constitutional provisions to create the other classes when production, trading and surplus generation occurs.
Preference for unitary boards elected from each class of shareholder
Main/sub boards elected by shareholder classes (elections triggered by a member threshold fixed at incorporation).
All stakeholders have a route to membershipLimited protection of minorities
All stakeholders have a route to membership, plus explicit protection of minority interests (special resolutions) and mediation to resolve member conflicts.
Electoral college in general meetings (Stakeholder)Employees hold the balance of power (NewCo)Shareholder classes with the same rights in general mee-tings (Surplus Sharing)
One member, one vote for ordinary and special resoluti-ons; electoral college when a poll is called; one class, one-vote for special resolutions.For a special resolution to pass, there must be majority support in every class of shareholder.
UDK: 005.35:172 / Original scientific article
God. XXVIII, BR. 1/2015. str. 43-66 God. XXVIII, BR. 1/2015. str. 43-66
Rory James Ridley-Duff: The FairShares Model: An ethical approach to social enterprise development?
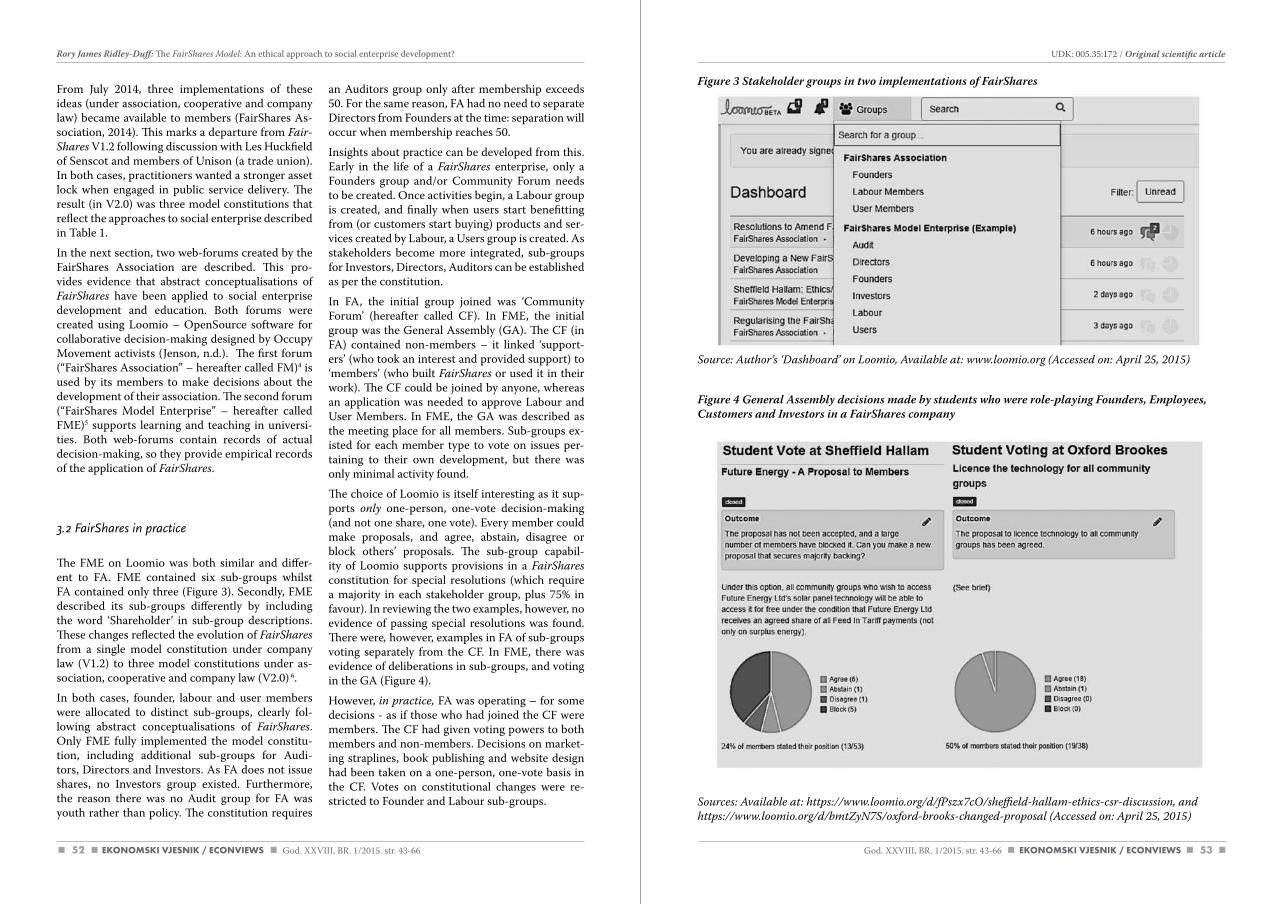
52 53
Source: author’s ‘dashboard’ on loomio, available at: www.loomio.org (accessed on: april 25, 2015)
Figure 4 General Assembly decisions made by students who were role-playing Founders, Employees, Customers and Investors in a FairShares company
Sources: available at: https://www.loomio.org/d/fPszx7cO/sheffield-hallam-ethics-csr-discussion, and https://www.loomio.org/d/bmtZyN7S/oxford-brooks-changed-proposal (accessed on: april 25, 2015)
From July 2014, three implementations of these ideas (under association, cooperative and company law) became available to members (FairShares As-sociation, 2014). This marks a departure from Fair-Shares V1.2 following discussion with Les Huckfield of Senscot and members of Unison (a trade union). In both cases, practitioners wanted a stronger asset lock when engaged in public service delivery. The result (in V2.0) was three model constitutions that reflect the approaches to social enterprise described in Table 1.
In the next section, two web-forums created by the FairShares Association are described. This pro-vides evidence that abstract conceptualisations of FairShares have been applied to social enterprise development and education. Both forums were created using Loomio – OpenSource software for collaborative decision-making designed by Occupy Movement activists (Jenson, n.d.). The first forum (“FairShares Association” – hereafter called FM)4 is used by its members to make decisions about the development of their association. The second forum (“FairShares Model Enterprise” – hereafter called FME)5 supports learning and teaching in universi-ties. Both web-forums contain records of actual decision-making, so they provide empirical records of the application of FairShares.
3.2 FairShares in practice
The FME on Loomio was both similar and differ-ent to FA. FME contained six sub-groups whilst FA contained only three (Figure 3). Secondly, FME described its sub-groups differently by including the word ‘Shareholder’ in sub-group descriptions. These changes reflected the evolution of FairShares from a single model constitution under company law (V1.2) to three model constitutions under as-sociation, cooperative and company law (V2.0) 6.
In both cases, founder, labour and user members were allocated to distinct sub-groups, clearly fol-lowing abstract conceptualisations of FairShares. Only FME fully implemented the model constitu-tion, including additional sub-groups for Audi-tors, Directors and Investors. As FA does not issue shares, no Investors group existed. Furthermore, the reason there was no Audit group for FA was youth rather than policy. The constitution requires
an Auditors group only after membership exceeds 50. For the same reason, FA had no need to separate Directors from Founders at the time: separation will occur when membership reaches 50.
Insights about practice can be developed from this. Early in the life of a FairShares enterprise, only a Founders group and/or Community Forum needs to be created. Once activities begin, a Labour group is created, and finally when users start benefitting from (or customers start buying) products and ser-vices created by Labour, a Users group is created. As stakeholders become more integrated, sub-groups for Investors, Directors, Auditors can be established as per the constitution.
In FA, the initial group joined was ‘Community Forum’ (hereafter called CF). In FME, the initial group was the General Assembly (GA). The CF (in FA) contained non-members – it linked ‘support-ers’ (who took an interest and provided support) to ‘members’ (who built FairShares or used it in their work). The CF could be joined by anyone, whereas an application was needed to approve Labour and User Members. In FME, the GA was described as the meeting place for all members. Sub-groups ex-isted for each member type to vote on issues per-taining to their own development, but there was only minimal activity found.
The choice of Loomio is itself interesting as it sup-ports only one-person, one-vote decision-making (and not one share, one vote). Every member could make proposals, and agree, abstain, disagree or block others’ proposals. The sub-group capabil-ity of Loomio supports provisions in a FairShares constitution for special resolutions (which require a majority in each stakeholder group, plus 75% in favour). In reviewing the two examples, however, no evidence of passing special resolutions was found. There were, however, examples in FA of sub-groups voting separately from the CF. In FME, there was evidence of deliberations in sub-groups, and voting in the GA (Figure 4).
However, in practice, FA was operating – for some decisions - as if those who had joined the CF were members. The CF had given voting powers to both members and non-members. Decisions on market-ing straplines, book publishing and website design had been taken on a one-person, one-vote basis in the CF. Votes on constitutional changes were re-stricted to Founder and Labour sub-groups.
Figure 3 Stakeholder groups in two implementations of FairShares
UDK: 005.35:172 / Original scientific article
God. XXVIII, BR. 1/2015. str. 43-66 God. XXVIII, BR. 1/2015. str. 43-66
Rory James Ridley-Duff: The FairShares Model: An ethical approach to social enterprise development?
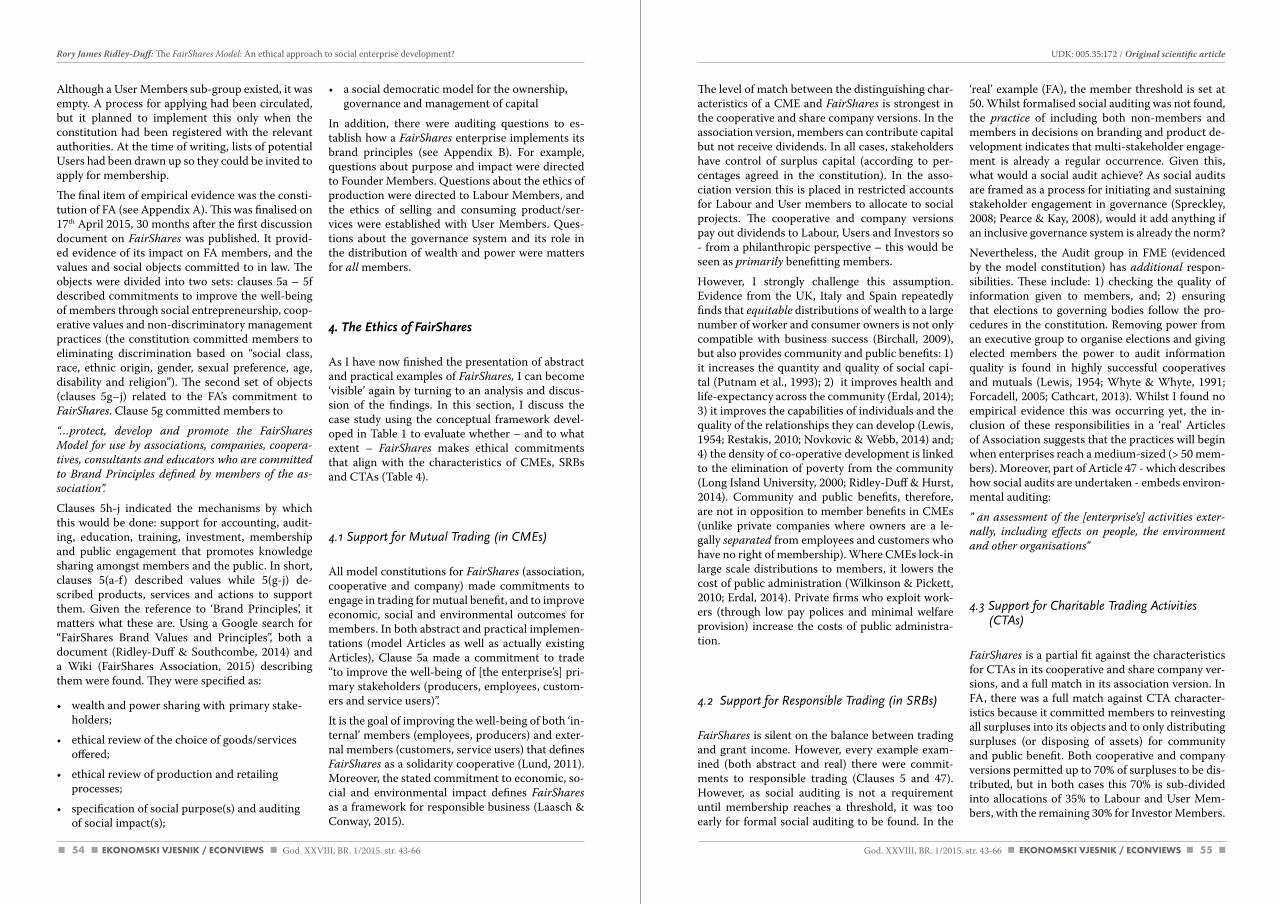
54 55
The level of match between the distinguishing char-acteristics of a CME and FairShares is strongest in the cooperative and share company versions. In the association version, members can contribute capital but not receive dividends. In all cases, stakeholders have control of surplus capital (according to per-centages agreed in the constitution). In the asso-ciation version this is placed in restricted accounts for Labour and User members to allocate to social projects. The cooperative and company versions pay out dividends to Labour, Users and Investors so - from a philanthropic perspective – this would be seen as primarily benefitting members.
However, I strongly challenge this assumption. Evidence from the UK, Italy and Spain repeatedly finds that equitable distributions of wealth to a large number of worker and consumer owners is not only compatible with business success (Birchall, 2009), but also provides community and public benefits: 1) it increases the quantity and quality of social capi-tal (Putnam et al., 1993); 2) it improves health and life-expectancy across the community (Erdal, 2014); 3) it improves the capabilities of individuals and the quality of the relationships they can develop (Lewis, 1954; Restakis, 2010; Novkovic & Webb, 2014) and; 4) the density of co-operative development is linked to the elimination of poverty from the community (Long Island University, 2000; Ridley-Duff & Hurst, 2014). Community and public benefits, therefore, are not in opposition to member benefits in CMEs (unlike private companies where owners are a le-gally separated from employees and customers who have no right of membership). Where CMEs lock-in large scale distributions to members, it lowers the cost of public administration (Wilkinson & Pickett, 2010; Erdal, 2014). Private firms who exploit work-ers (through low pay polices and minimal welfare provision) increase the costs of public administra-tion.
4.2 Support for Responsible Trading (in SRBs)
FairShares is silent on the balance between trading and grant income. However, every example exam-ined (both abstract and real) there were commit-ments to responsible trading (Clauses 5 and 47). However, as social auditing is not a requirement until membership reaches a threshold, it was too early for formal social auditing to be found. In the
‘real’ example (FA), the member threshold is set at 50. Whilst formalised social auditing was not found, the practice of including both non-members and members in decisions on branding and product de-velopment indicates that multi-stakeholder engage-ment is already a regular occurrence. Given this, what would a social audit achieve? As social audits are framed as a process for initiating and sustaining stakeholder engagement in governance (Spreckley, 2008; Pearce & Kay, 2008), would it add anything if an inclusive governance system is already the norm?
Nevertheless, the Audit group in FME (evidenced by the model constitution) has additional respon-sibilities. These include: 1) checking the quality of information given to members, and; 2) ensuring that elections to governing bodies follow the pro-cedures in the constitution. Removing power from an executive group to organise elections and giving elected members the power to audit information quality is found in highly successful cooperatives and mutuals (Lewis, 1954; Whyte & Whyte, 1991; Forcadell, 2005; Cathcart, 2013). Whilst I found no empirical evidence this was occurring yet, the in-clusion of these responsibilities in a ‘real’ Articles of Association suggests that the practices will begin when enterprises reach a medium-sized (> 50 mem-bers). Moreover, part of Article 47 - which describes how social audits are undertaken - embeds environ-mental auditing:
” an assessment of the [enterprise’s] activities exter-nally, including effects on people, the environment and other organisations”
4.3 Support for Charitable Trading Activities (CTAs)
FairShares is a partial fit against the characteristics for CTAs in its cooperative and share company ver-sions, and a full match in its association version. In FA, there was a full match against CTA character-istics because it committed members to reinvesting all surpluses into its objects and to only distributing surpluses (or disposing of assets) for community and public benefit. Both cooperative and company versions permitted up to 70% of surpluses to be dis-tributed, but in both cases this 70% is sub-divided into allocations of 35% to Labour and User Mem-bers, with the remaining 30% for Investor Members.
Although a User Members sub-group existed, it was empty. A process for applying had been circulated, but it planned to implement this only when the constitution had been registered with the relevant authorities. At the time of writing, lists of potential Users had been drawn up so they could be invited to apply for membership.
The final item of empirical evidence was the consti-tution of FA (see Appendix A). This was finalised on 17th April 2015, 30 months after the first discussion document on FairShares was published. It provid-ed evidence of its impact on FA members, and the values and social objects committed to in law. The objects were divided into two sets: clauses 5a – 5f described commitments to improve the well-being of members through social entrepreneurship, coop-erative values and non-discriminatory management practices (the constitution committed members to eliminating discrimination based on “social class, race, ethnic origin, gender, sexual preference, age, disability and religion”). The second set of objects (clauses 5g–j) related to the FA’s commitment to FairShares. Clause 5g committed members to
“…protect, develop and promote the FairShares Model for use by associations, companies, coopera-tives, consultants and educators who are committed to Brand Principles defined by members of the as-sociation”.
Clauses 5h-j indicated the mechanisms by which this would be done: support for accounting, audit-ing, education, training, investment, membership and public engagement that promotes knowledge sharing amongst members and the public. In short, clauses 5(a-f ) described values while 5(g-j) de-scribed products, services and actions to support them. Given the reference to ‘Brand Principles’, it matters what these are. Using a Google search for “FairShares Brand Values and Principles”, both a document (Ridley-Duff & Southcombe, 2014) and a Wiki (FairShares Association, 2015) describing them were found. They were specified as:
• wealth and power sharing with primary stake-holders;
• ethical review of the choice of goods/services offered;
• ethical review of production and retailing processes;
• specification of social purpose(s) and auditing of social impact(s);
• a social democratic model for the ownership, governance and management of capital
In addition, there were auditing questions to es-tablish how a FairShares enterprise implements its brand principles (see Appendix B). For example, questions about purpose and impact were directed to Founder Members. Questions about the ethics of production were directed to Labour Members, and the ethics of selling and consuming product/ser-vices were established with User Members. Ques-tions about the governance system and its role in the distribution of wealth and power were matters for all members.
4. The Ethics of FairShares
As I have now finished the presentation of abstract and practical examples of FairShares, I can become ‘visible’ again by turning to an analysis and discus-sion of the findings. In this section, I discuss the case study using the conceptual framework devel-oped in Table 1 to evaluate whether – and to what extent – FairShares makes ethical commitments that align with the characteristics of CMEs, SRBs and CTAs (Table 4).
4.1 Support for Mutual Trading (in CMEs)
All model constitutions for FairShares (association, cooperative and company) made commitments to engage in trading for mutual benefit, and to improve economic, social and environmental outcomes for members. In both abstract and practical implemen-tations (model Articles as well as actually existing Articles), Clause 5a made a commitment to trade “to improve the well-being of [the enterprise’s] pri-mary stakeholders (producers, employees, custom-ers and service users)”.
It is the goal of improving the well-being of both ‘in-ternal’ members (employees, producers) and exter-nal members (customers, service users) that defines FairShares as a solidarity cooperative (Lund, 2011). Moreover, the stated commitment to economic, so-cial and environmental impact defines FairShares as a framework for responsible business (Laasch & Conway, 2015).
UDK: 005.35:172 / Original scientific article
God. XXVIII, BR. 1/2015. str. 43-66 God. XXVIII, BR. 1/2015. str. 43-66
Rory James Ridley-Duff: The FairShares Model: An ethical approach to social enterprise development?
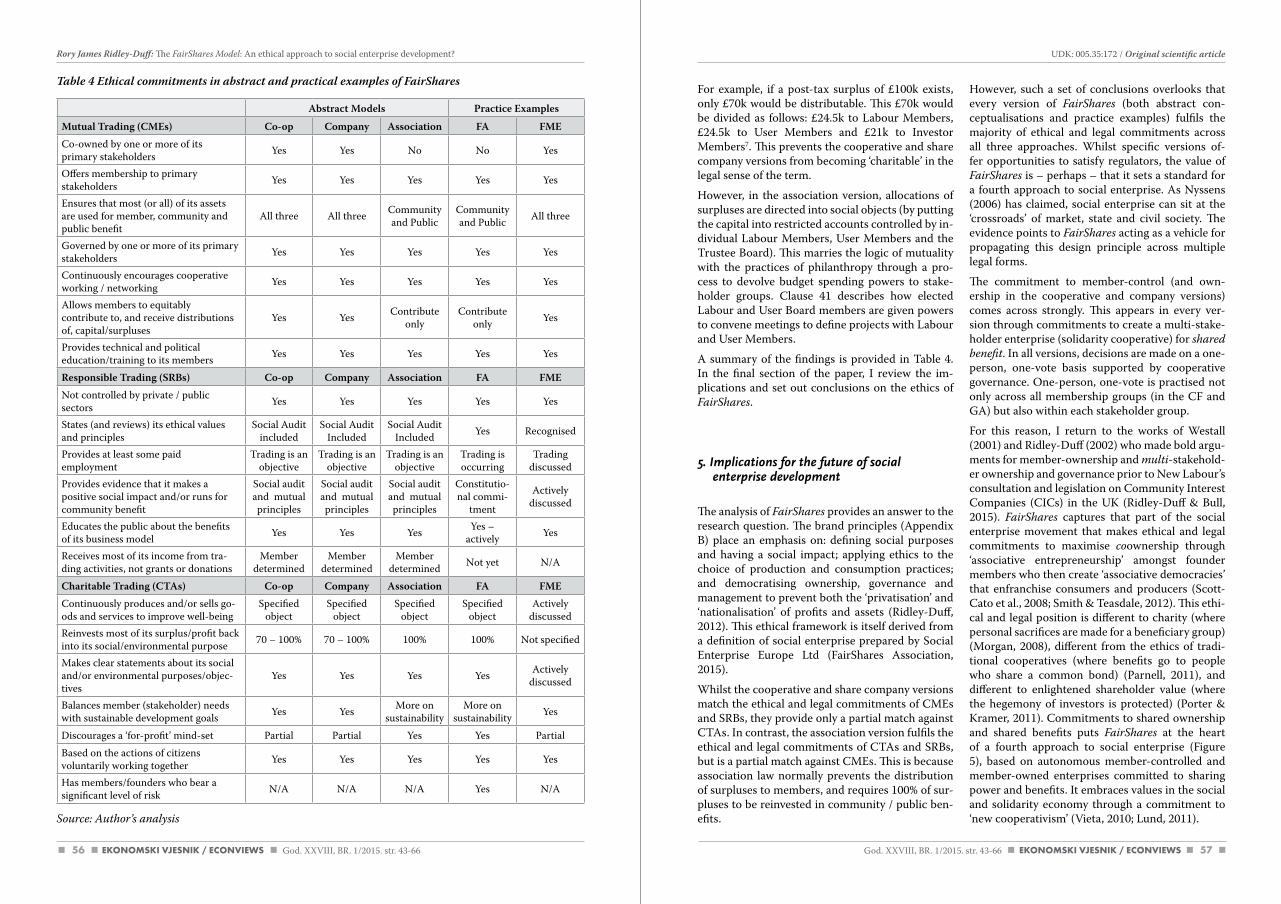
56 57
For example, if a post-tax surplus of £100k exists, only £70k would be distributable. This £70k would be divided as follows: £24.5k to Labour Members, £24.5k to User Members and £21k to Investor Members7. This prevents the cooperative and share company versions from becoming ‘charitable’ in the legal sense of the term.
However, in the association version, allocations of surpluses are directed into social objects (by putting the capital into restricted accounts controlled by in-dividual Labour Members, User Members and the Trustee Board). This marries the logic of mutuality with the practices of philanthropy through a pro-cess to devolve budget spending powers to stake-holder groups. Clause 41 describes how elected Labour and User Board members are given powers to convene meetings to define projects with Labour and User Members.
A summary of the findings is provided in Table 4. In the final section of the paper, I review the im-plications and set out conclusions on the ethics of FairShares.
5. Implications for the future of social enterprise development
The analysis of FairShares provides an answer to the research question. The brand principles (Appendix B) place an emphasis on: defining social purposes and having a social impact; applying ethics to the choice of production and consumption practices; and democratising ownership, governance and management to prevent both the ‘privatisation’ and ‘nationalisation’ of profits and assets (Ridley-Duff, 2012). This ethical framework is itself derived from a definition of social enterprise prepared by Social Enterprise Europe Ltd (FairShares Association, 2015).
Whilst the cooperative and share company versions match the ethical and legal commitments of CMEs and SRBs, they provide only a partial match against CTAs. In contrast, the association version fulfils the ethical and legal commitments of CTAs and SRBs, but is a partial match against CMEs. This is because association law normally prevents the distribution of surpluses to members, and requires 100% of sur-pluses to be reinvested in community / public ben-efits.
However, such a set of conclusions overlooks that every version of FairShares (both abstract con-ceptualisations and practice examples) fulfils the majority of ethical and legal commitments across all three approaches. Whilst specific versions of-fer opportunities to satisfy regulators, the value of FairShares is – perhaps – that it sets a standard for a fourth approach to social enterprise. As Nyssens (2006) has claimed, social enterprise can sit at the ‘crossroads’ of market, state and civil society. The evidence points to FairShares acting as a vehicle for propagating this design principle across multiple legal forms.
The commitment to member-control (and own-ership in the cooperative and company versions) comes across strongly. This appears in every ver-sion through commitments to create a multi-stake-holder enterprise (solidarity cooperative) for shared benefit. In all versions, decisions are made on a one-person, one-vote basis supported by cooperative governance. One-person, one-vote is practised not only across all membership groups (in the CF and GA) but also within each stakeholder group.
For this reason, I return to the works of Westall (2001) and Ridley-Duff (2002) who made bold argu-ments for member-ownership and multi-stakehold-er ownership and governance prior to New Labour’s consultation and legislation on Community Interest Companies (CICs) in the UK (Ridley-Duff & Bull, 2015). FairShares captures that part of the social enterprise movement that makes ethical and legal commitments to maximise coownership through ‘associative entrepreneurship’ amongst founder members who then create ‘associative democracies’ that enfranchise consumers and producers (Scott-Cato et al., 2008; Smith & Teasdale, 2012). This ethi-cal and legal position is different to charity (where personal sacrifices are made for a beneficiary group) (Morgan, 2008), different from the ethics of tradi-tional cooperatives (where benefits go to people who share a common bond) (Parnell, 2011), and different to enlightened shareholder value (where the hegemony of investors is protected) (Porter & Kramer, 2011). Commitments to shared ownership and shared benefits puts FairShares at the heart of a fourth approach to social enterprise (Figure 5), based on autonomous member-controlled and member-owned enterprises committed to sharing power and benefits. It embraces values in the social and solidarity economy through a commitment to ‘new cooperativism’ (Vieta, 2010; Lund, 2011).
Abstract Models Practice Examples
Mutual Trading (CMEs) Co-op Company Association FA FMECo-owned by one or more of its primary stakeholders Yes Yes No No Yes
Offers membership to primary stakeholders Yes Yes Yes Yes Yes
Ensures that most (or all) of its assets are used for member, community and public benefit
All three All three Community and Public
Community and Public All three
Governed by one or more of its primary stakeholders Yes Yes Yes Yes Yes
Continuously encourages cooperative working / networking Yes Yes Yes Yes Yes
Allows members to equitably contribute to, and receive distributions of, capital/surpluses
Yes Yes Contribute only
Contribute only Yes
Provides technical and political education/training to its members Yes Yes Yes Yes Yes
Responsible Trading (SRBs) Co-op Company Association FA FMENot controlled by private / public sectors Yes Yes Yes Yes Yes
States (and reviews) its ethical values and principles
Social Audit included
Social Audit Included
Social Audit Included Yes Recognised
Provides at least some paid employment
Trading is an objective
Trading is an objective
Trading is an objective
Trading is occurring
Trading discussed
Provides evidence that it makes a positive social impact and/or runs for community benefit
Social audit and mutual principles
Social audit and mutual principles
Social audit and mutual principles
Constitutio-nal commi-
tment
Actively discussed
Educates the public about the benefits of its business model Yes Yes Yes Yes –
actively Yes
Receives most of its income from tra-ding activities, not grants or donations
Member determined
Member determined
Member determined Not yet N/A
Charitable Trading (CTAs) Co-op Company Association FA FMEContinuously produces and/or sells go-ods and services to improve well-being
Specified object
Specified object
Specified object
Specified object
Actively discussed
Reinvests most of its surplus/profit back into its social/environmental purpose 70 – 100% 70 – 100% 100% 100% Not specified
Makes clear statements about its social and/or environmental purposes/objec-tives
Yes Yes Yes Yes Actively discussed
Balances member (stakeholder) needs with sustainable development goals Yes Yes More on
sustainabilityMore on
sustainability Yes
Discourages a ‘for-profit’ mind-set Partial Partial Yes Yes PartialBased on the actions of citizens voluntarily working together Yes Yes Yes Yes Yes
Has members/founders who bear a significant level of risk N/A N/A N/A Yes N/A
Table 4 Ethical commitments in abstract and practical examples of FairShares
Source: author’s analysis
UDK: 005.35:172 / Original scientific article
God. XXVIII, BR. 1/2015. str. 43-66 God. XXVIII, BR. 1/2015. str. 43-66
Rory James Ridley-Duff: The FairShares Model: An ethical approach to social enterprise development?
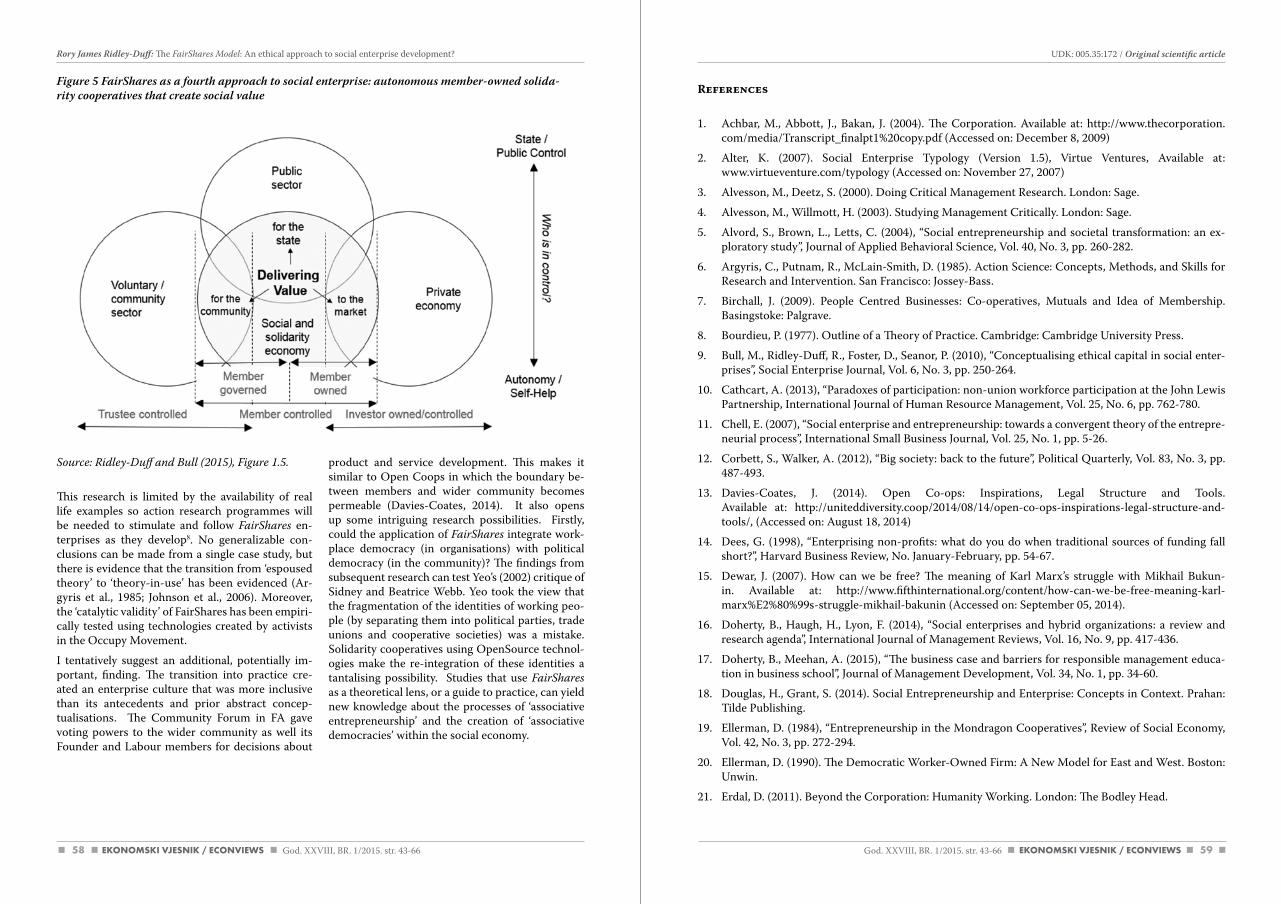
58 59
References
1. Achbar, M., Abbott, J., Bakan, J. (2004). The Corporation. Available at: http://www.thecorporation.com/media/Transcript_finalpt1%20copy.pdf (Accessed on: December 8, 2009)
2. Alter, K. (2007). Social Enterprise Typology (Version 1.5), Virtue Ventures, Available at: www.virtueventure.com/typology (Accessed on: November 27, 2007)
3. Alvesson, M., Deetz, S. (2000). Doing Critical Management Research. London: Sage.
4. Alvesson, M., Willmott, H. (2003). Studying Management Critically. London: Sage.
5. Alvord, S., Brown, L., Letts, C. (2004), “Social entrepreneurship and societal transformation: an ex-ploratory study”, Journal of Applied Behavioral Science, Vol. 40, No. 3, pp. 260-282.
6. Argyris, C., Putnam, R., McLain-Smith, D. (1985). Action Science: Concepts, Methods, and Skills for Research and Intervention. San Francisco: Jossey-Bass.
7. Birchall, J. (2009). People Centred Businesses: Co-operatives, Mutuals and Idea of Membership. Basingstoke: Palgrave.
8. Bourdieu, P. (1977). Outline of a Theory of Practice. Cambridge: Cambridge University Press.
9. Bull, M., Ridley-Duff, R., Foster, D., Seanor, P. (2010), “Conceptualising ethical capital in social enter-prises”, Social Enterprise Journal, Vol. 6, No. 3, pp. 250-264.
10. Cathcart, A. (2013), “Paradoxes of participation: non-union workforce participation at the John Lewis Partnership, International Journal of Human Resource Management, Vol. 25, No. 6, pp. 762-780.
11. Chell, E. (2007), “Social enterprise and entrepreneurship: towards a convergent theory of the entrepre-neurial process”, International Small Business Journal, Vol. 25, No. 1, pp. 5-26.
12. Corbett, S., Walker, A. (2012), “Big society: back to the future”, Political Quarterly, Vol. 83, No. 3, pp. 487-493.
13. Davies-Coates, J. (2014). Open Co-ops: Inspirations, Legal Structure and Tools. Available at: http://uniteddiversity.coop/2014/08/14/open-co-ops-inspirations-legal-structure-and-tools/, (Accessed on: August 18, 2014)
14. Dees, G. (1998), “Enterprising non-profits: what do you do when traditional sources of funding fall short?”, Harvard Business Review, No. January-February, pp. 54-67.
15. Dewar, J. (2007). How can we be free? The meaning of Karl Marx’s struggle with Mikhail Bukun-in. Available at: http://www.fifthinternational.org/content/how-can-we-be-free-meaning-karl-marx%E2%80%99s-struggle-mikhail-bakunin (Accessed on: September 05, 2014).
16. Doherty, B., Haugh, H., Lyon, F. (2014), “Social enterprises and hybrid organizations: a review and research agenda”, International Journal of Management Reviews, Vol. 16, No. 9, pp. 417-436.
17. Doherty, B., Meehan, A. (2015), “The business case and barriers for responsible management educa-tion in business school”, Journal of Management Development, Vol. 34, No. 1, pp. 34-60.
18. Douglas, H., Grant, S. (2014). Social Entrepreneurship and Enterprise: Concepts in Context. Prahan: Tilde Publishing.
19. Ellerman, D. (1984), “Entrepreneurship in the Mondragon Cooperatives”, Review of Social Economy, Vol. 42, No. 3, pp. 272-294.
20. Ellerman, D. (1990). The Democratic Worker-Owned Firm: A New Model for East and West. Boston: Unwin.
21. Erdal, D. (2011). Beyond the Corporation: Humanity Working. London: The Bodley Head.
Source: Ridley-duff and Bull (2015), Figure 1.5.
This research is limited by the availability of real life examples so action research programmes will be needed to stimulate and follow FairShares en-terprises as they develop8. No generalizable con-clusions can be made from a single case study, but there is evidence that the transition from ‘espoused theory’ to ‘theory-in-use’ has been evidenced (Ar-gyris et al., 1985; Johnson et al., 2006). Moreover, the ‘catalytic validity’ of FairShares has been empiri-cally tested using technologies created by activists in the Occupy Movement.
I tentatively suggest an additional, potentially im-portant, finding. The transition into practice cre-ated an enterprise culture that was more inclusive than its antecedents and prior abstract concep-tualisations. The Community Forum in FA gave voting powers to the wider community as well its Founder and Labour members for decisions about
product and service development. This makes it similar to Open Coops in which the boundary be-tween members and wider community becomes permeable (Davies-Coates, 2014). It also opens up some intriguing research possibilities. Firstly, could the application of FairShares integrate work-place democracy (in organisations) with political democracy (in the community)? The findings from subsequent research can test Yeo’s (2002) critique of Sidney and Beatrice Webb. Yeo took the view that the fragmentation of the identities of working peo-ple (by separating them into political parties, trade unions and cooperative societies) was a mistake. Solidarity cooperatives using OpenSource technol-ogies make the re-integration of these identities a tantalising possibility. Studies that use FairShares as a theoretical lens, or a guide to practice, can yield new knowledge about the processes of ‘associative entrepreneurship’ and the creation of ‘associative democracies’ within the social economy.
Figure 5 FairShares as a fourth approach to social enterprise: autonomous member-owned solida-rity cooperatives that create social value
UDK: 005.35:172 / Original scientific article
God. XXVIII, BR. 1/2015. str. 43-66 God. XXVIII, BR. 1/2015. str. 43-66
Rory James Ridley-Duff: The FairShares Model: An ethical approach to social enterprise development?
60 61
45. Martin, R., Osberg, S. (2007), “Social entrepreneurship: the case for definition”, Stanford Social Innova-tion Review, No. Spring, pp. 29-39.
46. Monzon, J., Chaves, R. (2008), “The European social economy: concept and dimensions of the third sector”, Annals of Public and Cooperative Economics, Vol. 79, No. 3/4, pp. 549-577.
47. Moreau, C., Mertens, S. (2013), “Managers’ competences in social enterprises: which specificities?”, Social Enterprise Journal, Vol. 9, No. 2, pp. 164 - 183.
48. Morgan, G. G. (2008). The Spirit of Charity (Professorial Lecture), Sheffield: Sheffield Hallam Univer-sity.
49. NewStart (2015). Ten ideas for creating systemic change. NewStart: The Magazine For Making Better Places.
50. Nicholls, A. (2006). Social Entrepreneurship: New Models of Sustainable Social Change. Oxford: Ox-ford University Press.
51. Nicholls, A. (2010), ”The institutionalization of social investment: the interplay of investment logics and investor rationalities”, Journal of Social Entrepreneurship, Vol. 1, No. 1, pp. 70-100.
52. Novkovic, S., Webb, T. (2014), “Co-operatives in a Post-Growth Era: Creating Co-operative Econom-ics”, London: Zed Books.
53. Nyssens, M. (2006). Social Enterprise at the Crossroads of Market, Public and Civil Society. London: Routledge.
54. Outsios, G. (2014). The Emergence of UK Environmental Entrepreneurs: A Practice Theory View on Mindsets and Constraints (Unpublished PhD Thesis). Stirling: University of Stirling.
55. P2P Foundation (2014). The Case for FairShares. Available at: http://blog.p2pfoundation.net/the-case-for-fairshares/2014/04/18 (Accessed on: April 17, 2015)
56. P2P Foundation (2015). Commons Transition: Policy Proposals for an Open Knowledge Commons Society, Amsterdam: Foundation for Peer to Peer Alternatives.
57. P2P Foundation (2015). New Cooperativism and the FairShares Model. Available at: http://p2pfounda-tion.net/New_Cooperativism_and_the_FairShares_Model (Accessed on: April 15, 2015)
58. Parnell, E. (2011). Co-operation: The Beautiful Idea. Los Gatos, CA: Smashwords.
59. Pateman, C. (1970). Participation and Democratic Theory. Cambridge: Cambridge University Press.
60. Pearce, J. (2003). Social Enterprise in Anytown. London: Calouste Gulbenkian Foundation.
61. Pearce, J., Kay, A. (2008). Really Telling Accounts: Report of a Social Accounting and Audit Research Project, Exeter: Social Audit Network.
62. Peattie, K., Morley, A. (2008). Social Enterprises: Diversity and Dynamics, Contexts and Contribu-tions, Cardiff: ESRC/Brass Research Centre.
63. Polanyi, K. (2001 [1944]). The Great Transformation: The Political and Economic Orgins of Our Time. Boston: Beacon.
64. Porter, M., Kramer, M. (2011), “Creating shared value”, Harvard Business Review, Vol. 89, No. 1/2, pp. 62-77.
65. Putnam, R., Leonardi, R., Nanneti, R. (1993). Making Democracy Work: Civic Traditions in Modern Italy. Princeton, NJ: Princeton University Press.
66. Restakis, J. (2010). Humanizing the Economy: Cooperatives in the Age of Capital. Gabroila Island, BC: New Society Publishers.
67. Ridley-Duff, R. (2002). Silent Revolution: Creating and Managing Social Enterprises. Barnsley: First Contact Software Ltd.
22. Erdal, D. (2014), “Employee Ownership and Health: An Initial Study”, In Novkovic, S., Webb, T., (Eds.), Co-operatives in a Post-Growth Era: Creating Co-operative Economics, Zed Books, New York.
23. FairShares Association (2014). FairShares Wiki V2.0. Available at: http://www.fairshares.coop/wiki/index.php?title=Main_Page (Accessed on: April 16, 2015)
24. FairShares Association (2014). Model Constitutions. Available at: www.fairshares.coop/wiki/index.php?title=Model_constitutions (Accessed on: April 17, 2015)
25. FairShares Association (2015). FairShares Model Brand Principles. Available at: http://www.fairshares.coop/wiki/index.php?title=FairShares_Brand (Accessed on: April 17, 2015)
26. Forcadell, F. (2005), “Democracy, cooperation and business success: the case of Mondragon Corpora-cion Cooperativa”, Journal of Business Ethics, Vol. 56, No. 3, pp. 225-274.
27. Gibson-Graham, J., Camerson, J., Healy, S. (2013). Take Back the Economy: An Ethical Guide for Transforming our Communities. Kindle ed. Minneapolis: University of Minnesota.
28. Holmes, C. (2014), “Introduction: a post-Polanyian political economy for our times”, Economy and Society, Vol. 43, No. 4, pp. 525-540.
29. Jenson, I. (n.d.). Loomio: a new tool to maximize people power (Occupy Wall Street). Available at: http://www.occupywallstreet.net/story/loomio-new-tool-maximize-people-power (Accessed on: Jan-uary 21, 2015)
30. Johnson, P. (2003), “Towards an epistemology for radical accounting: beyond objectivism and relativ-ism”, Critical Perspectives on Accounting, Vol. 6, No. 6, pp. 485-509.
31. Johnson, P. (2006), “Whence democracy? A review and critique of the conceptual dimensions and implications of the business case for organizational democracy”, Organization, Vol. 13, No. 2, pp. 245-274.
32. Johnson, P., Buehring, A., Cassell, C., Symon, G. (2006), “Evaluating qualitative management research: towards a contingent criteriology”, International Journal of Management Reviews, Vol. 8, No. 3, pp. 131-156.
33. Kalmi, P. (2007), “The disappearance of cooperatives from economics textbooks”, Cambridge Journal of Economics, Vol. 31, No. 4, pp. 625-647.
34. Kant, E. (1788). Critique of Pure Reason. trans. Gregor ed. Cambridge: New University Press.
35. Kerlin, J. (2006), “Social enterprise in the United States and Europe: understanding and learning from the differences“, Vol. 17, No. 3, pp. 246-262.
36. Kerlin, J. (2010). Social Enterprise: An International Comparison. Medford: Tuffs University Press.
37. Kinchloe, J., McClaren, P. (1988), “Rethinking critical theory and qualitative research”, In: Denzin, N., Lincoln, Y. (Eds.), The Landscape of Qualitative Research, Sage Publications, London, pp. 260–299.
38. Klein, N. (2007). The Shock Doctrine: The Rise of Disaster Capitalism. New York: Metropolitan Books.
39. Laasch, O., Conway, R. (2015). Principles of Responsible Management. New York: Cengage Learning.
40. Lewis, J. (1954). Fairer Shares: A Possible Advance in Civilisation and Perhaps the Only Alternative to Communism. London: Staples Press Ltd.
41. Lincoln, Y., Guba, E. (1985). Naturalistic Inquiry. New York: Sage Publications.
42. Long Island University (2000). Spanish Town Without Poverty. Available at: http://www.newswise.com/articles/view/17012, (Accessed on: April 25, 2015)
43. Lund, M. (2011). Solidarity as a Business Model: A Multi-stakeholder Co-operative’s Manual, Kent, OH: Kent State University.
44. Maitland, I. (1997), “Virtuous markets”, Business Ethics Quarterly, Vol. 7, No. 1, pp. 17-31.
UDK: 005.35:172 / Original scientific article
God. XXVIII, BR. 1/2015. str. 43-66 God. XXVIII, BR. 1/2015. str. 43-66
Rory James Ridley-Duff: The FairShares Model: An ethical approach to social enterprise development?
62 63
87. Spear, R., Cornforth, C., Aitken, M. (2007). For Love and Money: Governance and Social Enterprise. Milton Keynes: Open University Press.
88. Spreckley, F. (2008). The Social Audit Toolkit. 4th ed. Herefordshire: Local Livelihood.
89. Teasdale, S. (2012), “What’s in a name? Making sense of social enterprise discourses”, Public Policy and Administration, Vol. 27, No. 2, pp. 99-119.
90. Van Maanen, J. (1998). Tales from the Field: On Writing Ethnography. Chicago: University of Chicago Press.
91. Van Maanen, J. (2011), “Ethnography as work: some rules of engagement” Journal of Management Studies, Vol. 48, No. 1, pp. 218-234.
92. Vieta, M. (2010), “The New Co-operativism”, Affinities, Vol. 4, No. 1, Available at: http://www.affinitiesjournal.org/index.php/affinities (Accessed on: April 25, 2015)
93. Westall, A. (2001). Value-Led, Market-Driven: Social Enterprise Solutions to Public Policy Goals. Lon-don: IPPR.
94. Whyte, W., Whyte, K. (1991). Making Mondragon. New York: ILR Press/Itchaca
95. Wilkinson, R., Pickett, K. (2010). The Spirit Level: Why Equality is Better for Everyone. London: Pen-guin.
96. Yeo, S. (2002). Co-operative and Mutual Enterprises in Britain: Ideas from a Usable Past For a Modern Future (CCS Report 4, Centre for Civil Society, London School of Economics). Available at: http://eprints.lse.ac.uk/29393/ (Accessed on: April 17, 2015)
(Endnotes)
1 See www.fairshares.coop.
2 Now stored at http://www.fairshares.coop/wikispotarchive/fairshares.v1-2archive.xml
3 See http://www.cicregulator.gov.uk/cicregulator/about-us for further information on CICs.
4 This is accessible at: https://www.loomio.org/g/9asOJB5F/fairshares-association
5 This is accessible at: https://www.loomio.org/g/ugICXanW/fairshares-model-enterprise-example
6 See: http://www.fairshares.coop/wiki/index.php?title=What%27s_New_in_V2.0%3F
7 These percentages are set at incorporation and can be changed by special resolution. In a proposed application of FairShares at Massmosaic (a crowdsourcing project), the initial percentages will be 40% investors, 25% Labour, 25% Users and 10% to Founders.
8 This indicates that there will be international crowdsourcing, national health-care and social economy support projects, community broadband projects, and educational projects within the next 12 months.
68. Ridley-Duff, R. (2007), “Communitarian Perspectives on Social Enterprise”, Corporate Governance: An International Review, Vol. 15, No. 2, pp. 382-392.
69. Ridley-Duff, R. (2008), “Social Enterprise as a Socially Rational Business”, International Journal of En-trepreneurial Behaviour and Research, Vol. 14, No. 5, pp. 291-312.
70. Ridley-Duff, R. (2012), “New frontiers is democratic self-management”, In: McDonnell, D., MacKnight, E. (Eds.), The Co-operative Model in Practice: International Perspectives, Co-operative Education Trust Scotland, Glasgow, pp. 99-117.
71. Ridley-Duff, R., Bennett, A. (2011), „Towards mediation: developing a theoretical framework to under-stand alternative dispute resolution”, Industrial Relations Journal, Vol. 42, No. 2, pp. 106-132.
72. Ridley-Duff, R., Bull, M. (2011). Understanding Social Enterprise: Theory and Practice. London: Sage Publications.
73. Ridley-Duff, R., Bull, M. (2013), “The FairShares Model: a communtarian pluralist approach to consti-tuting social enterprises?”, ISBE Conference 2013, 4th - 6th November, Institute of Small Business and Entrepreneurship, Cardiff.
74. Ridley-Duff, R., Bull, M. (2014), “Entrepreneurship: Value-Added Ventures”, In: Laasch, O., Conway, R. (Eds.), Principles of Responsible Management, Cengage Learning, New York, pp. 186-219.
75. Ridley-Duff, R., Bull, M. (2015). Understanding Social Enterprise: Theory and Practice. 2nd (forthcom-ing) edition. London: Sage Publications.
76. Ridley-Duff, R., Hurst, J. (2014). International Cooperative Summit: A Video Report by Members of the FairShares Association. Available at: https://www.youtube.com/watch?v=uErStUtgFSo, (Accessed on: January 16, 2015)
77. Ridley-Duff, R., Ponton, A. (2013), “Workforce participation: developing a theoretical framework for longitudinal research”, Journal of Cooperative Studies, Vol. 46, No. 3, pp. 5-23.
78. Ridley-Duff, R., Southcombe, C. (2012), “The Social Enterprise Mark: a critical review of its conceptual dimensionss”, Social Enterprise Journal, Vol. 8, No. 3, pp. 178-200.
79. Ridley-Duff, R., Southcombe, C. (2014). The FairShares Model: A New Model for Self-Governing So-cial Enterprises Operating Under Association, Company and Co-operative Law, Sheffield: FairShares Association.
80. Roelants, B., Hyungsik, E., Terassi, E. (2014). Cooperatives and Employment: a global report, Quebec: CICOPA/Desjardin.
81. Scott-Cato, M., Arthur, L., Keenoy, T., Smith, J. (2008), “Entrepreneurial energy: associative entre-preneurship in the renewable energy sector”, International Journal of Entrepreneurial Behaviour and Research, Vol. 14, No. 5, pp. 313-329.
82. Seanor, P., Bull, M., Baines, S., Ridley-Duff, R. (2013), “Narratives of transition from social to enter-prise: you can’t get there from here!”, International Journal of Entrepreneurial Behaviour and Research, Vol. 19, No. 3, pp. 324-343.
83. Sheffield Hallam University (2014). Democratising Charities, Co-operatives and Social Enterprises (REF Impact Case - Unit 19). Available at: http://results.ref.ac.uk/Submissions/Impact/468, (Accessed on: April 14, 2015).
84. Smith, G., Teasdale, S. (2012), ”Associative democracy and the social economy: exploring the regula-tory challenge”, Economy and Society, Vol. 41, No. 2, pp. 151-176.
85. Smith, M. K. (2001). Chris Argyris: theories of action, double-loop learning and organizational learn-ing. Available at: http://www.infed.org/thinkers/argyris.htm (Accessed on: January 5, 2010)
86. Spear, R. (2006), “Social entrepreneurship: a different model?”, International Journal of Social Econom-ics, Vol. 33, No. 5/6, pp. 399-410.
UDK: 005.35:172 / Original scientific article
God. XXVIII, BR. 1/2015. str. 43-66 God. XXVIII, BR. 1/2015. str. 43-66
Rory James Ridley-Duff: The FairShares Model: An ethical approach to social enterprise development?
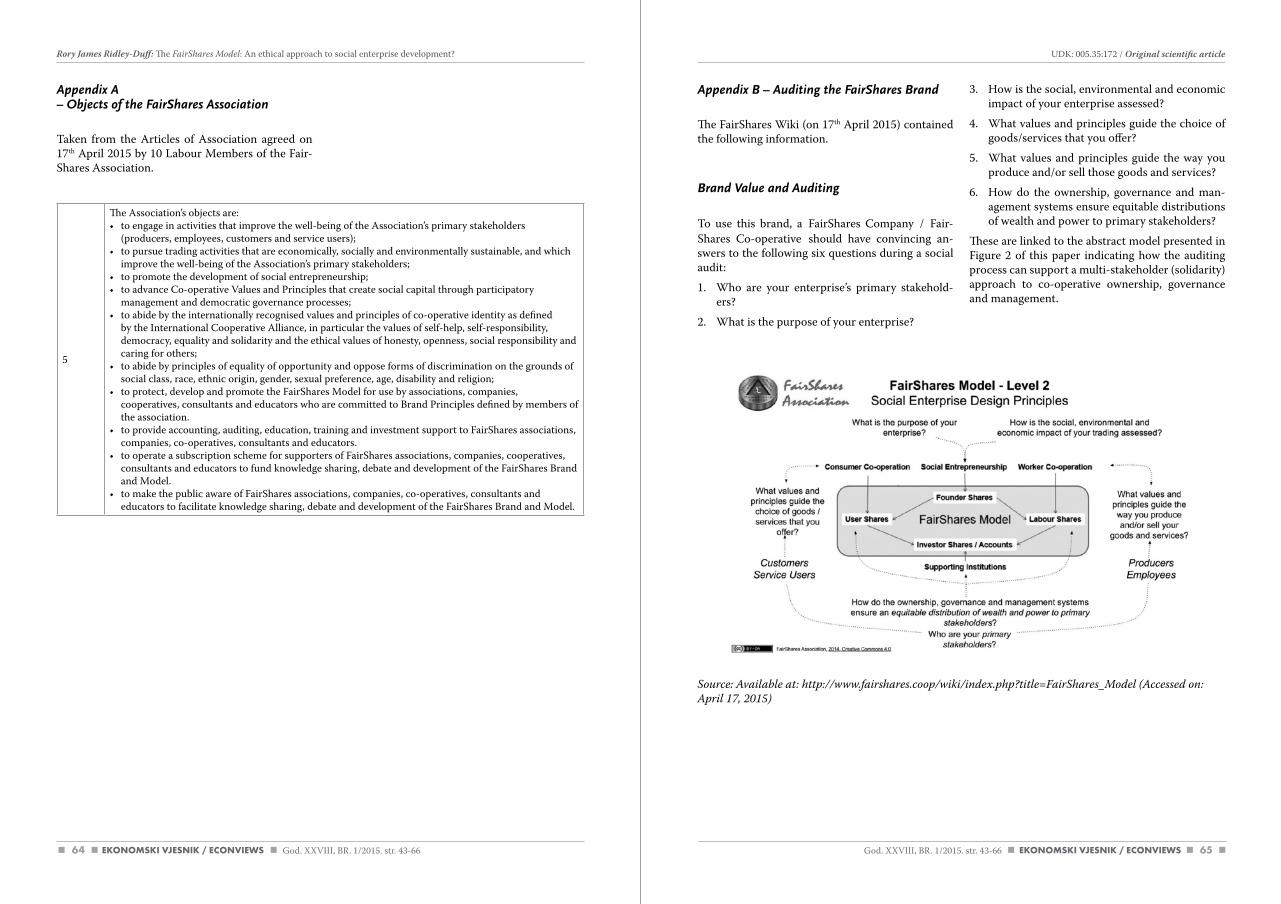
64 65
Appendix B – Auditing the FairShares Brand
The FairShares Wiki (on 17th April 2015) contained the following information.
Brand Value and Auditing
To use this brand, a FairShares Company / Fair-Shares Co-operative should have convincing an-swers to the following six questions during a social audit:
1. Who are your enterprise’s primary stakehold-ers?
2. What is the purpose of your enterprise?
3. How is the social, environmental and economic impact of your enterprise assessed?
4. What values and principles guide the choice of goods/services that you offer?
5. What values and principles guide the way you produce and/or sell those goods and services?
6. How do the ownership, governance and man-agement systems ensure equitable distributions of wealth and power to primary stakeholders?
These are linked to the abstract model presented in Figure 2 of this paper indicating how the auditing process can support a multi-stakeholder (solidarity) approach to co-operative ownership, governance and management.
Appendix A– Objects of the FairShares Association
Taken from the Articles of Association agreed on 17th April 2015 by 10 Labour Members of the Fair-Shares Association.
5
The Association’s objects are:• to engage in activities that improve the well-being of the Association’s primary stakeholders
(producers, employees, customers and service users);• to pursue trading activities that are economically, socially and environmentally sustainable, and which
improve the well-being of the Association’s primary stakeholders;• to promote the development of social entrepreneurship;• to advance Co-operative Values and Principles that create social capital through participatory
management and democratic governance processes;• to abide by the internationally recognised values and principles of co-operative identity as defined
by the International Cooperative Alliance, in particular the values of self-help, self-responsibility, democracy, equality and solidarity and the ethical values of honesty, openness, social responsibility and caring for others;
• to abide by principles of equality of opportunity and oppose forms of discrimination on the grounds of social class, race, ethnic origin, gender, sexual preference, age, disability and religion;
• to protect, develop and promote the FairShares Model for use by associations, companies, cooperatives, consultants and educators who are committed to Brand Principles defined by members of the association.
• to provide accounting, auditing, education, training and investment support to FairShares associations, companies, co-operatives, consultants and educators.
• to operate a subscription scheme for supporters of FairShares associations, companies, cooperatives, consultants and educators to fund knowledge sharing, debate and development of the FairShares Brand and Model.
• to make the public aware of FairShares associations, companies, co-operatives, consultants and educators to facilitate knowledge sharing, debate and development of the FairShares Brand and Model.
Source: available at: http://www.fairshares.coop/wiki/index.php?title=FairShares_Model (accessed on: april 17, 2015)
UDK: 005.35:172 / Original scientific article
God. XXVIII, BR. 1/2015. str. 43-66 God. XXVIII, BR. 1/2015. str. 43-66
Rory James Ridley-Duff: The FairShares Model: An ethical approach to social enterprise development?
66
Rory James Ridley-Duff
FairShares model:Etičan pristup razvoju socijalnog poduzetništva?
Sažetak
Ovaj je rad nastao na temelju uvodnog predavanja na 14. kongresu Međunarodne asocijacije za marketing u neprofitnom i javnom sektoru (IAPNM). Rad se bavi pitanjem „Kakav utjecaj imaju etičke vrijednosti u FairShares modelu na socijalno poduzetničko ponašanje?“ U prvome se dijelu prikazuju tri široka pristupa socijalnom poduzetništvu: zadruge i uzajamna društva (CMEs), socijalna i društveno odgovorna društva (SRBs) i dobrotvorne trgovačke aktivnosti (CTAs). Daje se pregled etičkih načela svakoga od ovih pristupa kako bi se definirao konceptualni okvir za ispitivanje FairShares modela kao studije slučaja. U drugome di-jelu, rezultati se analiziraju u odnosu na etičke vrijednosti i načela koja dolaze do izražaja kad se FairShares primjenjuje u praksi. Rad doprinosi proširenju spoznaja tako što pokazuje primjer upotrebe OpenSource tehnologije (Loomio) koja je poslužila da se ‘zagovarane teorije’ prenesu u ‘teorije u upotrebi’, sve u cilju raz-voja socijalnog poduzetništva. Ispitivanje FairShares modela uz pomoć konceptualnog modela pokazuje da bi mogao postojati i četvrti pristup koji bi se temeljio na suradnji više različitih dionika kako bi se ostvarila ‘asocijativna demokracija’ na radnom mjestu.
Ključne riječi: socijalno tržišno gospodarstvo, etika, solidarnost, socijalno poduzetništvo, suradnja, uza-jamnost
God. XXVIII, BR. 1/2015. str. 43-66
Rory James Ridley-Duff: The FairShares Model: An ethical approach to social enterprise development?
Preliminary communicationsPrethodna priopćenja
Mario Banožić, Gabrijela Žalac, Marijana Sumpor:Mapping of tourism potential: The preconditions for the development of tourism in continental croatia
Danimir Štros, Maja Coner, Daniel Bukovinski:Management in rural areas
M. Mercedes Galán – Ladero, Clementina Galera – Casquet:The role of the retailers in cause-related marketing: a reference to the Spanish case
Ilija Nedić:Break-even point in sugar-beet production
Jerko Glavaš, Luka Stanić, Damir Šebo:The impact of the managers’ educational level on the development of the knowledge-based organizations:
The case of insurance companies in croatia
Melita Balas Rant:competing via creation of distinctive organizational competences: “How to do it”
Dijana Mečev, Ivana Kardum Goleš:Primary healthcare service quality measurement: SERvqUal scale
69God. XXVIII, BR. 1/2015. str. 69-83
Mario Banožić, Gabrijela Žalac, Marijana Sumpor:Mapping of tourism potential: The preconditions for the development of tourism in Continental Croatia
MAPPING OF TOURISM POTENTIAL: THE PRECONDITIONS FOR THE DEVELOPMENT OF TOURISM IN CONTINENTAL CROATIA
UDK: 338.48(497.5)Preliminary communication
Received: November 7, 2014accepted for publishing: december 19, 2014
Mario Banožićcity of vinkovciBana Jelačića 1,32100 vinkovci, [email protected]: +38598792869
Gabrijela Žalacvukovar-Srijem countya. akšamovića 31,32100 vinkovci, [email protected]: +385989716679
Marijana SumporThe Institute of Economics ZagrebTrg Johna Kennedyja 7, 10000 Zagreb, [email protected]: +385915074975
Abstract
Many Croatian scientists indicate that there are significant opportunities in tourism that can beneficially in-fluence the overall socio-economic development of Croatia. It is recognised that Croatia has to follow more closely the contemporary tourism trends, in which much greater attention is given to ecology, the cultural identity of the destination, active vacations, service quality and selective forms of tourism development. There is also agreement that the clean sea, the coast, and the abundance of natural and cultural beauty are the advantages of Croatia’s tourism supply in the maritime part of the country. However, there are some discussions that the Continental part of Croatia is also abundant in natural beauty, cultural wealth, and gastronomy, and that it has many other underutilised tourism potentials. Different viewpoints on tourism in Croatia are based on statistical indicators, such as the level of development of tourist regions expressed through investments in infrastructure, the number of employed and the direct benefit of tourism to the economy. Despite the fact that the Continental part of Croatia abounds in tourism potential, what is offered is recognised only locally. This problem has negative impacts at the strategic level, as project planning and financing need to have a regional dimension. Some authors (Kušen, 1999; Koščak, 1998; Krippendorf, 1986; Müller, 1994; Stabler, 1996; Travis et al., 1994) have developed a cadastre of tourism potential, which has never been implemented. Therefore, this paper aims to map the tourism potentials of Continental Croatia by using the triple helix model, based on which regional tourism can be developed and future project fund-ing ensured.
Keywords: Continental Croatia, tourism development, tourism potential, triple helix model
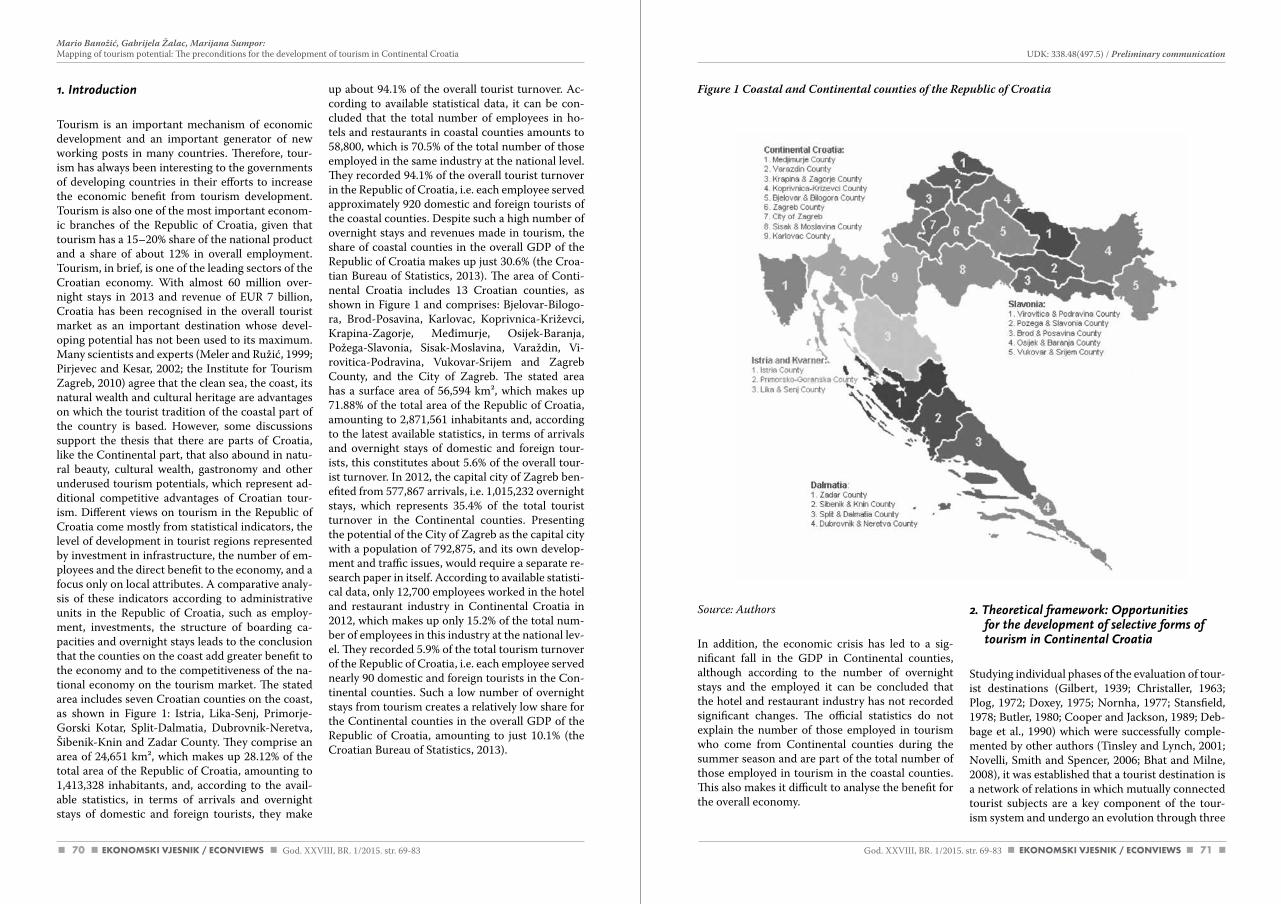
70 71God. XXVIII, BR. 1/2015. str. 69-83 God. XXVIII, BR. 1/2015. str. 69-83
Mario Banožić, Gabrijela Žalac, Marijana Sumpor:Mapping of tourism potential: The preconditions for the development of tourism in Continental Croatia UDK: 338.48(497.5) / Preliminary communication
Source: authors
In addition, the economic crisis has led to a sig-nificant fall in the GDP in Continental counties, although according to the number of overnight stays and the employed it can be concluded that the hotel and restaurant industry has not recorded significant changes. The official statistics do not explain the number of those employed in tourism who come from Continental counties during the summer season and are part of the total number of those employed in tourism in the coastal counties. This also makes it difficult to analyse the benefit for the overall economy.
2. Theoretical framework: Opportunities for the development of selective forms of tourism in Continental Croatia
Studying individual phases of the evaluation of tour-ist destinations (Gilbert, 1939; Christaller, 1963; Plog, 1972; Doxey, 1975; Nornha, 1977; Stansfield, 1978; Butler, 1980; Cooper and Jackson, 1989; Deb-bage et al., 1990) which were successfully comple-mented by other authors (Tinsley and Lynch, 2001; Novelli, Smith and Spencer, 2006; Bhat and Milne, 2008), it was established that a tourist destination is a network of relations in which mutually connected tourist subjects are a key component of the tour-ism system and undergo an evolution through three
1. Introduction
Tourism is an important mechanism of economic development and an important generator of new working posts in many countries. Therefore, tour-ism has always been interesting to the governments of developing countries in their efforts to increase the economic benefit from tourism development. Tourism is also one of the most important econom-ic branches of the Republic of Croatia, given that tourism has a 15–20% share of the national product and a share of about 12% in overall employment. Tourism, in brief, is one of the leading sectors of the Croatian economy. With almost 60 million over-night stays in 2013 and revenue of EUR 7 billion, Croatia has been recognised in the overall tourist market as an important destination whose devel-oping potential has not been used to its maximum. Many scientists and experts (Meler and Ružić, 1999; Pirjevec and Kesar, 2002; the Institute for Tourism Zagreb, 2010) agree that the clean sea, the coast, its natural wealth and cultural heritage are advantages on which the tourist tradition of the coastal part of the country is based. However, some discussions support the thesis that there are parts of Croatia, like the Continental part, that also abound in natu-ral beauty, cultural wealth, gastronomy and other underused tourism potentials, which represent ad-ditional competitive advantages of Croatian tour-ism. Different views on tourism in the Republic of Croatia come mostly from statistical indicators, the level of development in tourist regions represented by investment in infrastructure, the number of em-ployees and the direct benefit to the economy, and a focus only on local attributes. A comparative analy-sis of these indicators according to administrative units in the Republic of Croatia, such as employ-ment, investments, the structure of boarding ca-pacities and overnight stays leads to the conclusion that the counties on the coast add greater benefit to the economy and to the competitiveness of the na-tional economy on the tourism market. The stated area includes seven Croatian counties on the coast, as shown in Figure 1: Istria, Lika-Senj, Primorje-Gorski Kotar, Split-Dalmatia, Dubrovnik-Neretva, Šibenik-Knin and Zadar County. They comprise an area of 24,651 km², which makes up 28.12% of the total area of the Republic of Croatia, amounting to 1,413,328 inhabitants, and, according to the avail-able statistics, in terms of arrivals and overnight stays of domestic and foreign tourists, they make
up about 94.1% of the overall tourist turnover. Ac-cording to available statistical data, it can be con-cluded that the total number of employees in ho-tels and restaurants in coastal counties amounts to 58,800, which is 70.5% of the total number of those employed in the same industry at the national level. They recorded 94.1% of the overall tourist turnover in the Republic of Croatia, i.e. each employee served approximately 920 domestic and foreign tourists of the coastal counties. Despite such a high number of overnight stays and revenues made in tourism, the share of coastal counties in the overall GDP of the Republic of Croatia makes up just 30.6% (the Croa-tian Bureau of Statistics, 2013). The area of Conti-nental Croatia includes 13 Croatian counties, as shown in Figure 1 and comprises: Bjelovar-Bilogo-ra, Brod-Posavina, Karlovac, Koprivnica-Križevci, Krapina-Zagorje, Međimurje, Osijek-Baranja, Požega-Slavonia, Sisak-Moslavina, Varaždin, Vi-rovitica-Podravina, Vukovar-Srijem and Zagreb County, and the City of Zagreb. The stated area has a surface area of 56,594 km², which makes up 71.88% of the total area of the Republic of Croatia, amounting to 2,871,561 inhabitants and, according to the latest available statistics, in terms of arrivals and overnight stays of domestic and foreign tour-ists, this constitutes about 5.6% of the overall tour-ist turnover. In 2012, the capital city of Zagreb ben-efited from 577,867 arrivals, i.e. 1,015,232 overnight stays, which represents 35.4% of the total tourist turnover in the Continental counties. Presenting the potential of the City of Zagreb as the capital city with a population of 792,875, and its own develop-ment and traffic issues, would require a separate re-search paper in itself. According to available statisti-cal data, only 12,700 employees worked in the hotel and restaurant industry in Continental Croatia in 2012, which makes up only 15.2% of the total num-ber of employees in this industry at the national lev-el. They recorded 5.9% of the total tourism turnover of the Republic of Croatia, i.e. each employee served nearly 90 domestic and foreign tourists in the Con-tinental counties. Such a low number of overnight stays from tourism creates a relatively low share for the Continental counties in the overall GDP of the Republic of Croatia, amounting to just 10.1% (the Croatian Bureau of Statistics, 2013).
Figure 1 Coastal and Continental counties of the Republic of Croatia
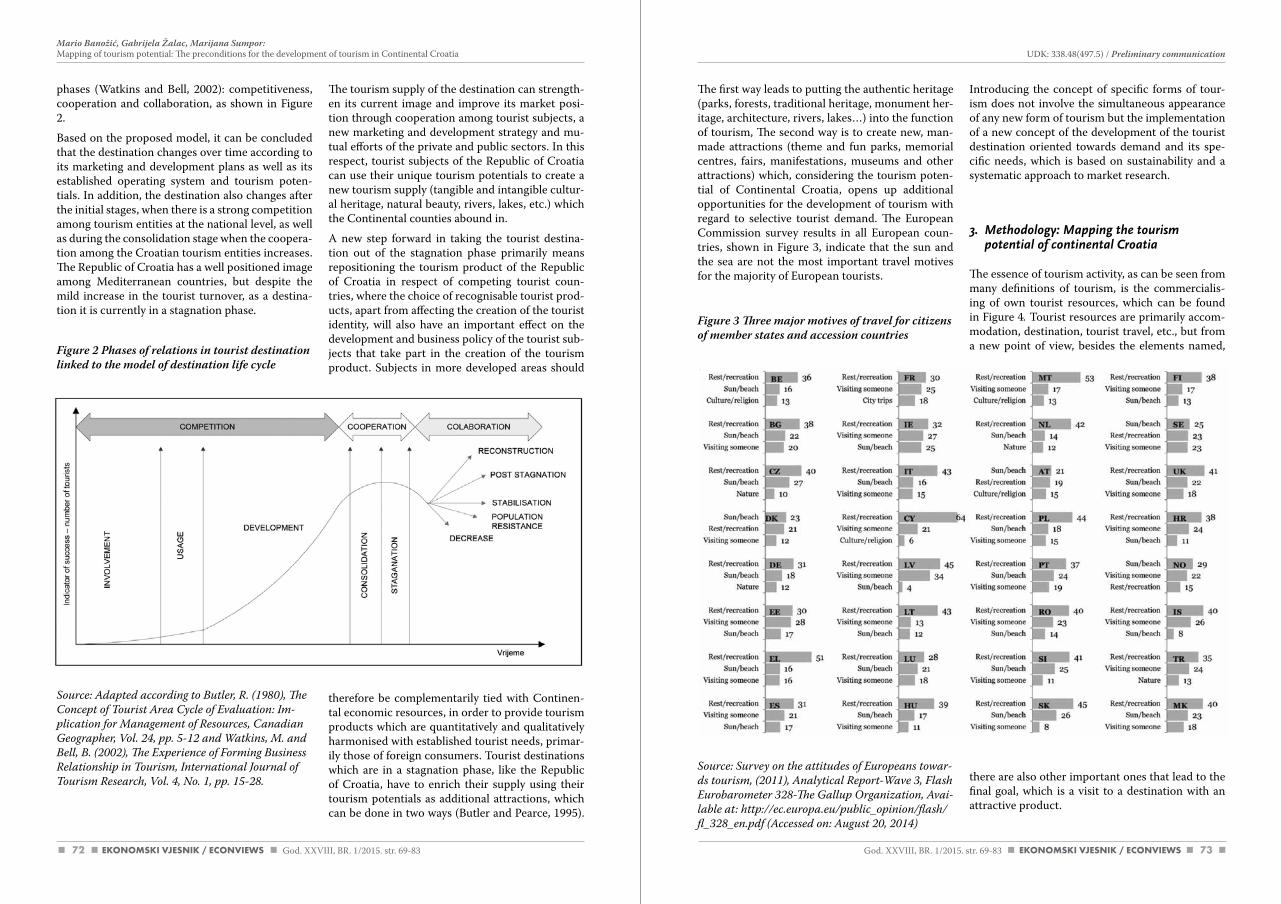
72 73
The first way leads to putting the authentic heritage (parks, forests, traditional heritage, monument her-itage, architecture, rivers, lakes…) into the function of tourism, The second way is to create new, man-made attractions (theme and fun parks, memorial centres, fairs, manifestations, museums and other attractions) which, considering the tourism poten-tial of Continental Croatia, opens up additional opportunities for the development of tourism with regard to selective tourist demand. The European Commission survey results in all European coun-tries, shown in Figure 3, indicate that the sun and the sea are not the most important travel motives for the majority of European tourists.
Figure 3 Three major motives of travel for citizens of member states and accession countries
Source: Survey on the attitudes of Europeans towar-ds tourism, (2011), analytical Report-Wave 3, Flash Eurobarometer 328-The Gallup Organization, avai-lable at: http://ec.europa.eu/public_opinion/flash/fl_328_en.pdf (accessed on: august 20, 2014)
Introducing the concept of specific forms of tour-ism does not involve the simultaneous appearance of any new form of tourism but the implementation of a new concept of the development of the tourist destination oriented towards demand and its spe-cific needs, which is based on sustainability and a systematic approach to market research.
3. Methodology: Mapping the tourism potential of continental Croatia
The essence of tourism activity, as can be seen from many definitions of tourism, is the commercialis-ing of own tourist resources, which can be found in Figure 4. Tourist resources are primarily accom-modation, destination, tourist travel, etc., but from a new point of view, besides the elements named,
there are also other important ones that lead to the final goal, which is a visit to a destination with an attractive product.
phases (Watkins and Bell, 2002): competitiveness, cooperation and collaboration, as shown in Figure 2.
Based on the proposed model, it can be concluded that the destination changes over time according to its marketing and development plans as well as its established operating system and tourism poten-tials. In addition, the destination also changes after the initial stages, when there is a strong competition among tourism entities at the national level, as well as during the consolidation stage when the coopera-tion among the Croatian tourism entities increases. The Republic of Croatia has a well positioned image among Mediterranean countries, but despite the mild increase in the tourist turnover, as a destina-tion it is currently in a stagnation phase.
Figure 2 Phases of relations in tourist destination linked to the model of destination life cycle
Source: adapted according to Butler, R. (1980), The concept of Tourist area cycle of Evaluation: Im-plication for Management of Resources, canadian Geographer, vol. 24, pp. 5-12 and Watkins, M. and Bell, B. (2002), The Experience of Forming Business Relationship in Tourism, International Journal of Tourism Research, vol. 4, No. 1, pp. 15-28.
The tourism supply of the destination can strength-en its current image and improve its market posi-tion through cooperation among tourist subjects, a new marketing and development strategy and mu-tual efforts of the private and public sectors. In this respect, tourist subjects of the Republic of Croatia can use their unique tourism potentials to create a new tourism supply (tangible and intangible cultur-al heritage, natural beauty, rivers, lakes, etc.) which the Continental counties abound in.
A new step forward in taking the tourist destina-tion out of the stagnation phase primarily means repositioning the tourism product of the Republic of Croatia in respect of competing tourist coun-tries, where the choice of recognisable tourist prod-ucts, apart from affecting the creation of the tourist identity, will also have an important effect on the development and business policy of the tourist sub-jects that take part in the creation of the tourism product. Subjects in more developed areas should
therefore be complementarily tied with Continen-tal economic resources, in order to provide tourism products which are quantitatively and qualitatively harmonised with established tourist needs, primar-ily those of foreign consumers. Tourist destinations which are in a stagnation phase, like the Republic of Croatia, have to enrich their supply using their tourism potentials as additional attractions, which can be done in two ways (Butler and Pearce, 1995).
God. XXVIII, BR. 1/2015. str. 69-83 God. XXVIII, BR. 1/2015. str. 69-83
Mario Banožić, Gabrijela Žalac, Marijana Sumpor:Mapping of tourism potential: The preconditions for the development of tourism in Continental Croatia UDK: 338.48(497.5) / Preliminary communication
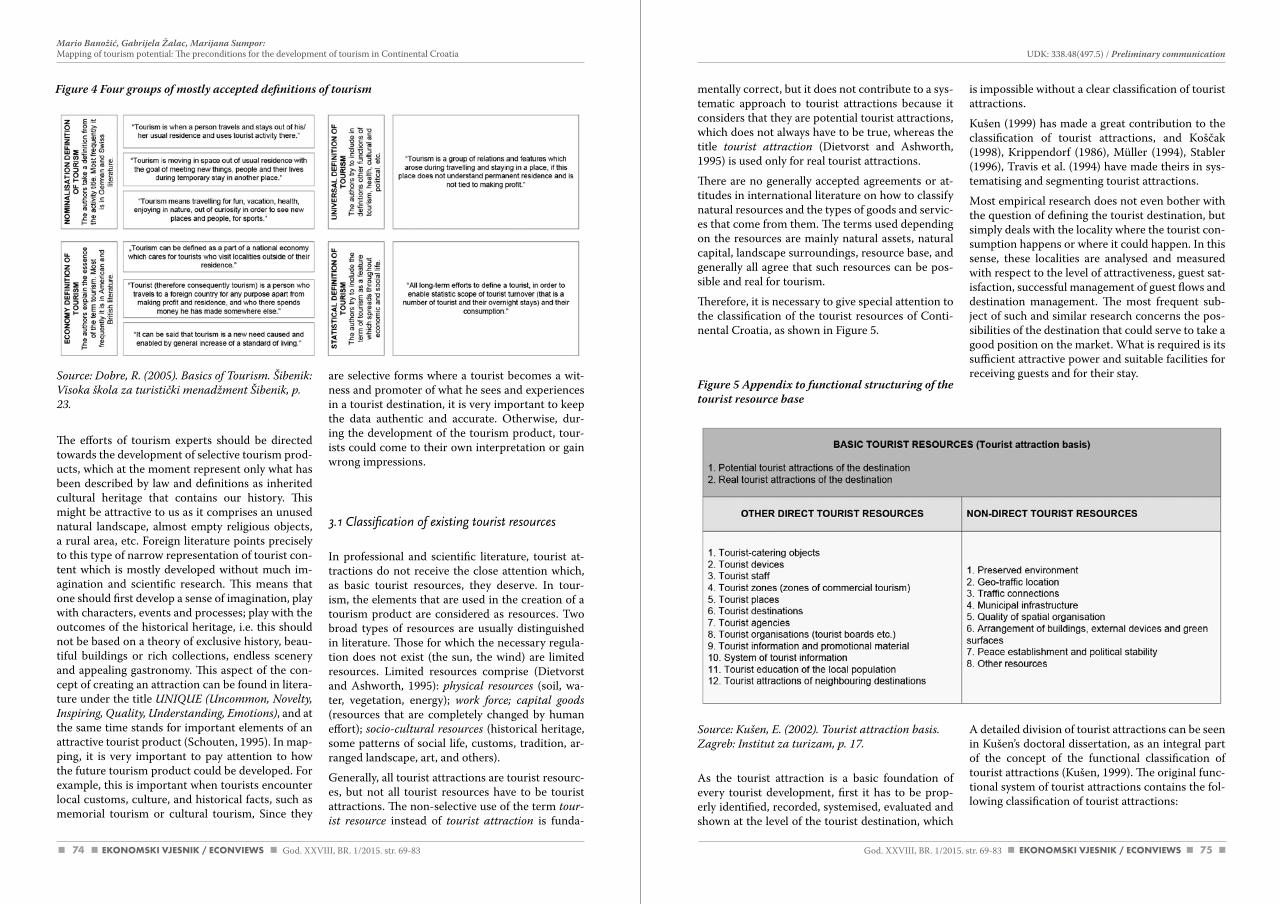
74 75
mentally correct, but it does not contribute to a sys-tematic approach to tourist attractions because it considers that they are potential tourist attractions, which does not always have to be true, whereas the title tourist attraction (Dietvorst and Ashworth, 1995) is used only for real tourist attractions.
There are no generally accepted agreements or at-titudes in international literature on how to classify natural resources and the types of goods and servic-es that come from them. The terms used depending on the resources are mainly natural assets, natural capital, landscape surroundings, resource base, and generally all agree that such resources can be pos-sible and real for tourism.
Therefore, it is necessary to give special attention to the classification of the tourist resources of Conti-nental Croatia, as shown in Figure 5.
Figure 5 Appendix to functional structuring of the tourist resource base
Source: Kušen, E. (2002). Tourist attraction basis. Zagreb: Institut za turizam, p. 17.
As the tourist attraction is a basic foundation of every tourist development, first it has to be prop-erly identified, recorded, systemised, evaluated and shown at the level of the tourist destination, which
is impossible without a clear classification of tourist attractions.
Kušen (1999) has made a great contribution to the classification of tourist attractions, and Koščak (1998), Krippendorf (1986), Müller (1994), Stabler (1996), Travis et al. (1994) have made theirs in sys-tematising and segmenting tourist attractions.
Most empirical research does not even bother with the question of defining the tourist destination, but simply deals with the locality where the tourist con-sumption happens or where it could happen. In this sense, these localities are analysed and measured with respect to the level of attractiveness, guest sat-isfaction, successful management of guest flows and destination management. The most frequent sub-ject of such and similar research concerns the pos-sibilities of the destination that could serve to take a good position on the market. What is required is its sufficient attractive power and suitable facilities for receiving guests and for their stay.
A detailed division of tourist attractions can be seen in Kušen’s doctoral dissertation, as an integral part of the concept of the functional classification of tourist attractions (Kušen, 1999). The original func-tional system of tourist attractions contains the fol-lowing classification of tourist attractions:
Source: dobre, R. (2005). Basics of Tourism. Šibenik: visoka škola za turistički menadžment Šibenik, p. 23.
The efforts of tourism experts should be directed towards the development of selective tourism prod-ucts, which at the moment represent only what has been described by law and definitions as inherited cultural heritage that contains our history. This might be attractive to us as it comprises an unused natural landscape, almost empty religious objects, a rural area, etc. Foreign literature points precisely to this type of narrow representation of tourist con-tent which is mostly developed without much im-agination and scientific research. This means that one should first develop a sense of imagination, play with characters, events and processes; play with the outcomes of the historical heritage, i.e. this should not be based on a theory of exclusive history, beau-tiful buildings or rich collections, endless scenery and appealing gastronomy. This aspect of the con-cept of creating an attraction can be found in litera-ture under the title UNIqUE (Uncommon, Novelty, Inspiring, quality, Understanding, Emotions), and at the same time stands for important elements of an attractive tourist product (Schouten, 1995). In map-ping, it is very important to pay attention to how the future tourism product could be developed. For example, this is important when tourists encounter local customs, culture, and historical facts, such as memorial tourism or cultural tourism, Since they
are selective forms where a tourist becomes a wit-ness and promoter of what he sees and experiences in a tourist destination, it is very important to keep the data authentic and accurate. Otherwise, dur-ing the development of the tourism product, tour-ists could come to their own interpretation or gain wrong impressions.
3.1 Classification of existing tourist resources
In professional and scientific literature, tourist at-tractions do not receive the close attention which, as basic tourist resources, they deserve. In tour-ism, the elements that are used in the creation of a tourism product are considered as resources. Two broad types of resources are usually distinguished in literature. Those for which the necessary regula-tion does not exist (the sun, the wind) are limited resources. Limited resources comprise (Dietvorst and Ashworth, 1995): physical resources (soil, wa-ter, vegetation, energy); work force; capital goods (resources that are completely changed by human effort); socio-cultural resources (historical heritage, some patterns of social life, customs, tradition, ar-ranged landscape, art, and others).
Generally, all tourist attractions are tourist resourc-es, but not all tourist resources have to be tourist attractions. The non-selective use of the term tour-ist resource instead of tourist attraction is funda-
Figure 4 Four groups of mostly accepted definitions of tourism
God. XXVIII, BR. 1/2015. str. 69-83 God. XXVIII, BR. 1/2015. str. 69-83
Mario Banožić, Gabrijela Žalac, Marijana Sumpor:Mapping of tourism potential: The preconditions for the development of tourism in Continental Croatia UDK: 338.48(497.5) / Preliminary communication
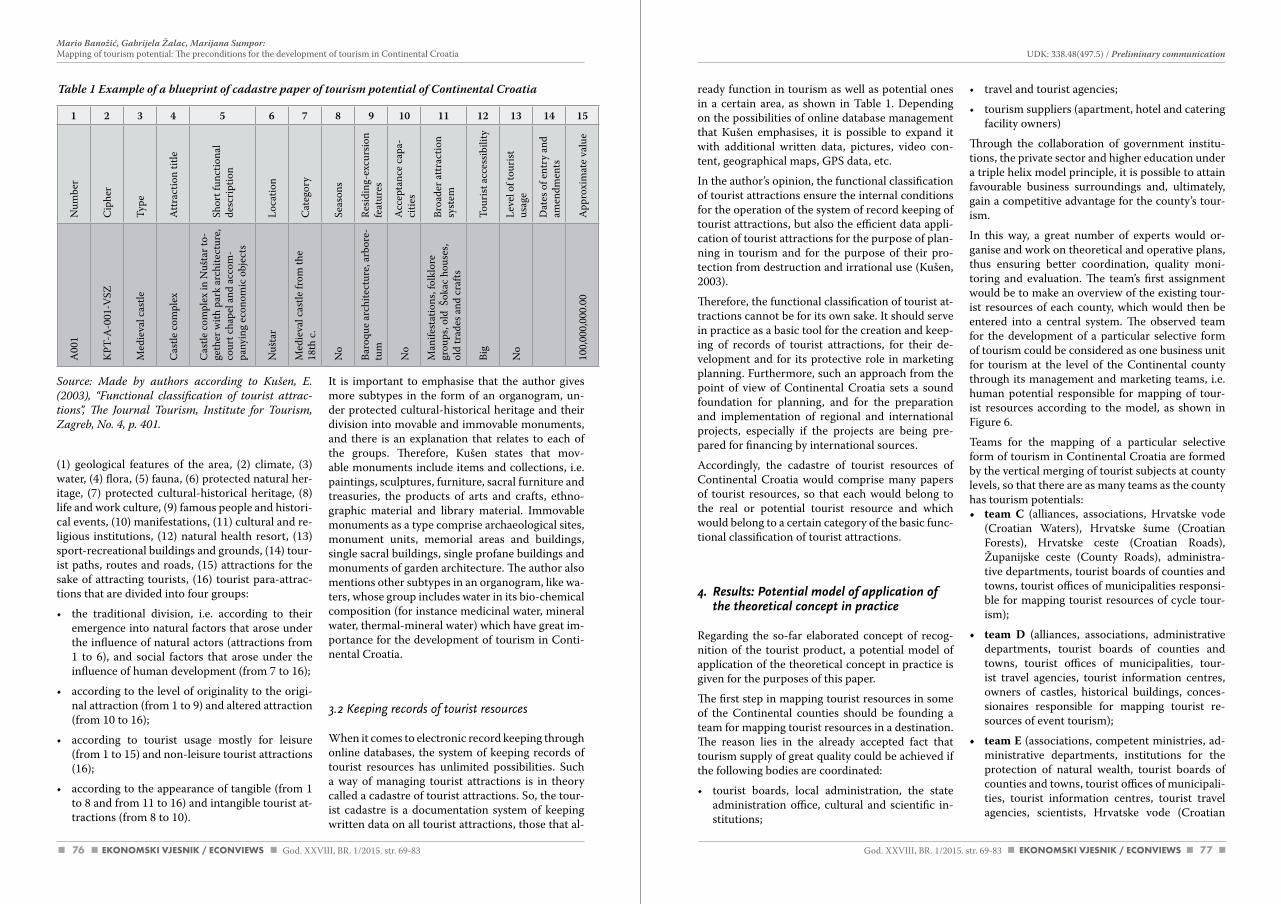
76 77
ready function in tourism as well as potential ones in a certain area, as shown in Table 1. Depending on the possibilities of online database management that Kušen emphasises, it is possible to expand it with additional written data, pictures, video con-tent, geographical maps, GPS data, etc.
In the author’s opinion, the functional classification of tourist attractions ensure the internal conditions for the operation of the system of record keeping of tourist attractions, but also the efficient data appli-cation of tourist attractions for the purpose of plan-ning in tourism and for the purpose of their pro-tection from destruction and irrational use (Kušen, 2003).
Therefore, the functional classification of tourist at-tractions cannot be for its own sake. It should serve in practice as a basic tool for the creation and keep-ing of records of tourist attractions, for their de-velopment and for its protective role in marketing planning. Furthermore, such an approach from the point of view of Continental Croatia sets a sound foundation for planning, and for the preparation and implementation of regional and international projects, especially if the projects are being pre-pared for financing by international sources.
Accordingly, the cadastre of tourist resources of Continental Croatia would comprise many papers of tourist resources, so that each would belong to the real or potential tourist resource and which would belong to a certain category of the basic func-tional classification of tourist attractions.
4. Results: Potential model of application of the theoretical concept in practice
Regarding the so-far elaborated concept of recog-nition of the tourist product, a potential model of application of the theoretical concept in practice is given for the purposes of this paper.
The first step in mapping tourist resources in some of the Continental counties should be founding a team for mapping tourist resources in a destination. The reason lies in the already accepted fact that tourism supply of great quality could be achieved if the following bodies are coordinated:
• tourist boards, local administration, the state administration office, cultural and scientific in-stitutions;
• travel and tourist agencies;
• tourism suppliers (apartment, hotel and catering facility owners)
Through the collaboration of government institu-tions, the private sector and higher education under a triple helix model principle, it is possible to attain favourable business surroundings and, ultimately, gain a competitive advantage for the county’s tour-ism.
In this way, a great number of experts would or-ganise and work on theoretical and operative plans, thus ensuring better coordination, quality moni-toring and evaluation. The team’s first assignment would be to make an overview of the existing tour-ist resources of each county, which would then be entered into a central system. The observed team for the development of a particular selective form of tourism could be considered as one business unit for tourism at the level of the Continental county through its management and marketing teams, i.e. human potential responsible for mapping of tour-ist resources according to the model, as shown in Figure 6.
Teams for the mapping of a particular selective form of tourism in Continental Croatia are formed by the vertical merging of tourist subjects at county levels, so that there are as many teams as the county has tourism potentials:• team C (alliances, associations, Hrvatske vode
(Croatian Waters), Hrvatske šume (Croatian Forests), Hrvatske ceste (Croatian Roads), Županijske ceste (County Roads), administra-tive departments, tourist boards of counties and towns, tourist offices of municipalities responsi-ble for mapping tourist resources of cycle tour-ism);
• team D (alliances, associations, administrative departments, tourist boards of counties and towns, tourist offices of municipalities, tour-ist travel agencies, tourist information centres, owners of castles, historical buildings, conces-sionaires responsible for mapping tourist re-sources of event tourism);
• team E (associations, competent ministries, ad-ministrative departments, institutions for the protection of natural wealth, tourist boards of counties and towns, tourist offices of municipali-ties, tourist information centres, tourist travel agencies, scientists, Hrvatske vode (Croatian
Source: Made by authors according to Kušen, E. (2003), “Functional classification of tourist attrac-tions”, The Journal Tourism, Institute for Tourism, Zagreb, No. 4, p. 401.
(1) geological features of the area, (2) climate, (3) water, (4) flora, (5) fauna, (6) protected natural her-itage, (7) protected cultural-historical heritage, (8) life and work culture, (9) famous people and histori-cal events, (10) manifestations, (11) cultural and re-ligious institutions, (12) natural health resort, (13) sport-recreational buildings and grounds, (14) tour-ist paths, routes and roads, (15) attractions for the sake of attracting tourists, (16) tourist para-attrac-tions that are divided into four groups:
• the traditional division, i.e. according to their emergence into natural factors that arose under the influence of natural actors (attractions from 1 to 6), and social factors that arose under the influence of human development (from 7 to 16);
• according to the level of originality to the origi-nal attraction (from 1 to 9) and altered attraction (from 10 to 16);
• according to tourist usage mostly for leisure (from 1 to 15) and non-leisure tourist attractions (16);
• according to the appearance of tangible (from 1 to 8 and from 11 to 16) and intangible tourist at-tractions (from 8 to 10).
It is important to emphasise that the author gives more subtypes in the form of an organogram, un-der protected cultural-historical heritage and their division into movable and immovable monuments, and there is an explanation that relates to each of the groups. Therefore, Kušen states that mov-able monuments include items and collections, i.e. paintings, sculptures, furniture, sacral furniture and treasuries, the products of arts and crafts, ethno-graphic material and library material. Immovable monuments as a type comprise archaeological sites, monument units, memorial areas and buildings, single sacral buildings, single profane buildings and monuments of garden architecture. The author also mentions other subtypes in an organogram, like wa-ters, whose group includes water in its bio-chemical composition (for instance medicinal water, mineral water, thermal-mineral water) which have great im-portance for the development of tourism in Conti-nental Croatia.
3.2 Keeping records of tourist resources
When it comes to electronic record keeping through online databases, the system of keeping records of tourist resources has unlimited possibilities. Such a way of managing tourist attractions is in theory called a cadastre of tourist attractions. So, the tour-ist cadastre is a documentation system of keeping written data on all tourist attractions, those that al-
1 2 3 4 5 6 7 8 9 10 11 12 13 14 15
Num
ber
Cip
her
Type
Attr
actio
n tit
le
Shor
t fun
ctio
nal
desc
ript
ion
Loca
tion
Cat
egor
y
Seas
ons
Resid
ing-
excu
rsio
n fe
atur
es
Acc
epta
nce
capa
-ci
ties
Broa
der a
ttrac
tion
syst
em
Tour
ist a
cces
sibili
ty
Leve
l of t
ouri
st
usag
e
Dat
es o
f ent
ry a
nd
amen
dmen
ts
App
roxi
mat
e va
lue
A00
1
KPT
-A-0
01-V
SZ
Med
ieva
l cas
tle
Cas
tle c
ompl
ex
Cas
tle c
ompl
ex in
Nuš
tar t
o-ge
ther
with
par
k ar
chite
ctur
e,
cour
t cha
pel a
nd a
ccom
-pa
nyin
g ec
onom
ic o
bjec
ts
Nuš
tar
Med
ieva
l cas
tle fr
om th
e 18
th c
.
No
Baro
que
arch
itect
ure,
arb
ore-
tum
No
Man
ifest
atio
ns, f
olkl
ore
grou
ps, o
ld Š
okac
hou
ses,
old
trad
es a
nd c
rafts
Big
No
100,
000,
000.
00
Table 1 Example of a blueprint of cadastre paper of tourism potential of Continental Croatia
God. XXVIII, BR. 1/2015. str. 69-83 God. XXVIII, BR. 1/2015. str. 69-83
Mario Banožić, Gabrijela Žalac, Marijana Sumpor:Mapping of tourism potential: The preconditions for the development of tourism in Continental Croatia UDK: 338.48(497.5) / Preliminary communication
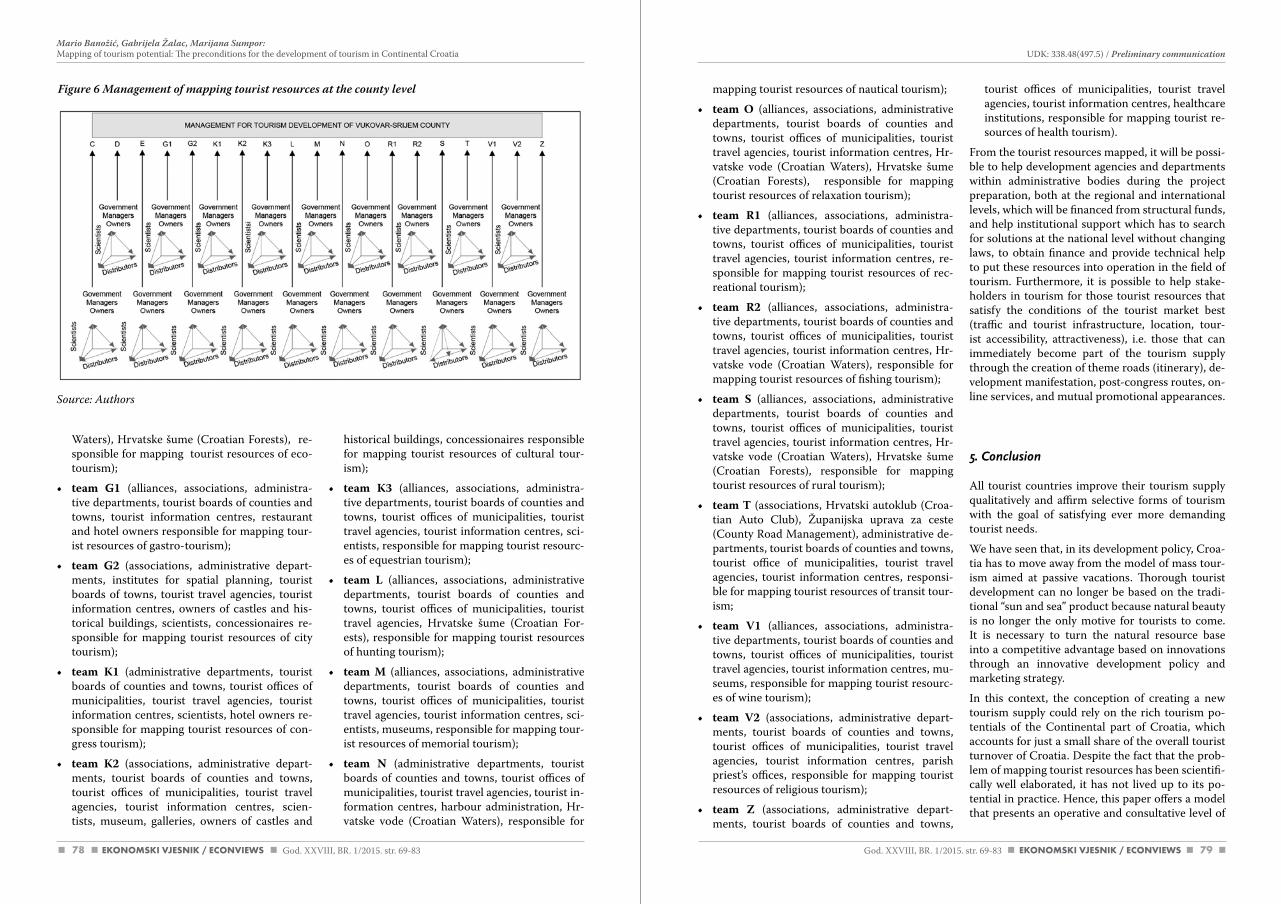
78 79
mapping tourist resources of nautical tourism);
• team O (alliances, associations, administrative departments, tourist boards of counties and towns, tourist offices of municipalities, tourist travel agencies, tourist information centres, Hr-vatske vode (Croatian Waters), Hrvatske šume (Croatian Forests), responsible for mapping tourist resources of relaxation tourism);
• team R1 (alliances, associations, administra-tive departments, tourist boards of counties and towns, tourist offices of municipalities, tourist travel agencies, tourist information centres, re-sponsible for mapping tourist resources of rec-reational tourism);
• team R2 (alliances, associations, administra-tive departments, tourist boards of counties and towns, tourist offices of municipalities, tourist travel agencies, tourist information centres, Hr-vatske vode (Croatian Waters), responsible for mapping tourist resources of fishing tourism);
• team S (alliances, associations, administrative departments, tourist boards of counties and towns, tourist offices of municipalities, tourist travel agencies, tourist information centres, Hr-vatske vode (Croatian Waters), Hrvatske šume (Croatian Forests), responsible for mapping tourist resources of rural tourism);
• team T (associations, Hrvatski autoklub (Croa-tian Auto Club), Županijska uprava za ceste (County Road Management), administrative de-partments, tourist boards of counties and towns, tourist office of municipalities, tourist travel agencies, tourist information centres, responsi-ble for mapping tourist resources of transit tour-ism;
• team V1 (alliances, associations, administra-tive departments, tourist boards of counties and towns, tourist offices of municipalities, tourist travel agencies, tourist information centres, mu-seums, responsible for mapping tourist resourc-es of wine tourism);
• team V2 (associations, administrative depart-ments, tourist boards of counties and towns, tourist offices of municipalities, tourist travel agencies, tourist information centres, parish priest’s offices, responsible for mapping tourist resources of religious tourism);
• team Z (associations, administrative depart-ments, tourist boards of counties and towns,
tourist offices of municipalities, tourist travel agencies, tourist information centres, healthcare institutions, responsible for mapping tourist re-sources of health tourism).
From the tourist resources mapped, it will be possi-ble to help development agencies and departments within administrative bodies during the project preparation, both at the regional and international levels, which will be financed from structural funds, and help institutional support which has to search for solutions at the national level without changing laws, to obtain finance and provide technical help to put these resources into operation in the field of tourism. Furthermore, it is possible to help stake-holders in tourism for those tourist resources that satisfy the conditions of the tourist market best (traffic and tourist infrastructure, location, tour-ist accessibility, attractiveness), i.e. those that can immediately become part of the tourism supply through the creation of theme roads (itinerary), de-velopment manifestation, post-congress routes, on-line services, and mutual promotional appearances.
5. Conclusion
All tourist countries improve their tourism supply qualitatively and affirm selective forms of tourism with the goal of satisfying ever more demanding tourist needs.
We have seen that, in its development policy, Croa-tia has to move away from the model of mass tour-ism aimed at passive vacations. Thorough tourist development can no longer be based on the tradi-tional “sun and sea” product because natural beauty is no longer the only motive for tourists to come. It is necessary to turn the natural resource base into a competitive advantage based on innovations through an innovative development policy and marketing strategy.
In this context, the conception of creating a new tourism supply could rely on the rich tourism po-tentials of the Continental part of Croatia, which accounts for just a small share of the overall tourist turnover of Croatia. Despite the fact that the prob-lem of mapping tourist resources has been scientifi-cally well elaborated, it has not lived up to its po-tential in practice. Hence, this paper offers a model that presents an operative and consultative level of
Source: authors
Waters), Hrvatske šume (Croatian Forests), re-sponsible for mapping tourist resources of eco-tourism);
• team G1 (alliances, associations, administra-tive departments, tourist boards of counties and towns, tourist information centres, restaurant and hotel owners responsible for mapping tour-ist resources of gastro-tourism);
• team G2 (associations, administrative depart-ments, institutes for spatial planning, tourist boards of towns, tourist travel agencies, tourist information centres, owners of castles and his-torical buildings, scientists, concessionaires re-sponsible for mapping tourist resources of city tourism);
• team K1 (administrative departments, tourist boards of counties and towns, tourist offices of municipalities, tourist travel agencies, tourist information centres, scientists, hotel owners re-sponsible for mapping tourist resources of con-gress tourism);
• team K2 (associations, administrative depart-ments, tourist boards of counties and towns, tourist offices of municipalities, tourist travel agencies, tourist information centres, scien-tists, museum, galleries, owners of castles and
historical buildings, concessionaires responsible for mapping tourist resources of cultural tour-ism);
• team K3 (alliances, associations, administra-tive departments, tourist boards of counties and towns, tourist offices of municipalities, tourist travel agencies, tourist information centres, sci-entists, responsible for mapping tourist resourc-es of equestrian tourism);
• team L (alliances, associations, administrative departments, tourist boards of counties and towns, tourist offices of municipalities, tourist travel agencies, Hrvatske šume (Croatian For-ests), responsible for mapping tourist resources of hunting tourism);
• team M (alliances, associations, administrative departments, tourist boards of counties and towns, tourist offices of municipalities, tourist travel agencies, tourist information centres, sci-entists, museums, responsible for mapping tour-ist resources of memorial tourism);
• team N (administrative departments, tourist boards of counties and towns, tourist offices of municipalities, tourist travel agencies, tourist in-formation centres, harbour administration, Hr-vatske vode (Croatian Waters), responsible for
Figure 6 Management of mapping tourist resources at the county level
God. XXVIII, BR. 1/2015. str. 69-83 God. XXVIII, BR. 1/2015. str. 69-83
Mario Banožić, Gabrijela Žalac, Marijana Sumpor:Mapping of tourism potential: The preconditions for the development of tourism in Continental Croatia UDK: 338.48(497.5) / Preliminary communication
80 81
References
1. Bhat, S. S., Milne, S. (2008), “Networks effects on cooperation in destination website development”, Tourism Management, Vol. 29, No. 6, pp. 1131-1140.
2. Butler, R. (1980), “The concept of tourist area cycle of evaluation”, Implication for management of re-sources Canadian Geographer, Vol. 24, No. 1, pp. 5-12.
3. Christaler, W. (1963), “Some considerations of tourism location in Europe: the peripheral regions-underdeveloped countries-recreation areas”, Papers of the Regional Science Association, Vol. 12, No. 1, pp. 95-105.
4. Cooper, C., Jackson, S. (1989), “Destination life cycle: The Isle of Man case study”, Annals of Tourism Research, Vol. 16, No. 3, pp. 377-398.
5. Debbage, K. G. (1990), “Oligopoly and the Resort Cycle in the Bahamas”, Annals of Tourism Research, Vol. 17, No. 4, pp. 513-527.
6. Dietvorst, A., Ashworth, G. J. (1995), “Tourism Spatial Transformations: An Introduction”, in Diet-vorst, A., Ashworth, G. J. (Eds.), Tourism Spatial Transformations: Implications for Policy and Plan-ning, CAB International, Wallingford, Oxon, pp. 4-5.
7. Dobre, R. (2005). Osnove turizma. Šibenik: Visoka škola za turistički menadžment Šibenik.
8. Doxey, G. (1975) “A Causation Theory of Visitor Resident Irritants, Methodology and Research”, The Impact of Tourism: Sixth Annual Conference Proceedings, Travel Research Association, San Diego, California, pp. 195-198.
9. Gilbert, E. W. (1999) “The growth of inland and seaside health resorts in England”, Scottish Geographi-cal Magazine, Vol. 55, No. 1, pp. 16-35.
10. Croatian Bureau of Statistics of the Republic of Croatia, Available at: http://www.dzs.hr/Hrv_Eng/ljetopis/2013/sljh2013.pdf (Accessed on: August 20, 2014)
11. Koščak, M. (1998), “Po poteh Dedinščine, Dolenske in Bele krajine”, Rast, Vol. 1, pp. 66-72.
12. Krippendorf, J. (1986). Putujuće čovječanstvo. Zagreb: Zavod za istraživanje turizma, Sveučilišna na-klada Liber.
13. Kušen, E. (2003), “Funkcionalna klasifikacija turističkih atrakcija”, Turizam, Vol. 51, No. 4, pp. 399-414.
14. Kušen, E. (1999). Metodologija prostorne valorizacije turističkih privlačnosti. Doctoral thesis, Zagreb: Arhitektonski fakultet Sveučilišta u Zagrebu.
15. Kušen, E. (2010), “Sustav turističkih atrakcija”, Turizam, Vol. 58, No. 4, pp. 443-458.
16. Meler, M., Ružić, D. (1999), “Marketing identity of tourist product of the Republic Croatia”, Tourism management, Vol. 20, No. 5, pp. 635-644.
17. Müller, M. (1994), “The thorny path to sustainable tourism development”, Journal of Sustainable Tour-ism, Vol. 2, No. 3, pp. 9-16.
18. Novelli, M., Schmitz, B. I., Spencer, T. (2006), “Networks, clusters and innovation in tourism: UK ex-perience”, Tourism Management, Vol. 27, No. 6, pp. 1141-1152.
19. Pirjevec, B., Kesar, O. (2002). Počela turizma, Zagreb: Mikrorad, Ekonomski fakultet Zagreb.
20. Plog, S. C. (1972), “Why destination areas rise and fall in popularity”, paper presented at The Southern California Chapter of the Travel Research Bureau, October 10.
21. Schouten, F. (1995), “Improving visitor care in heritage attractions”, Tourism Management, Vol. 16, No. 4, pp. 259-261.
management which could solve this problem appro-priately.
It is necessary to put into practice the question of mapping tourism potential as soon as possible in order to define a strategic approach to the develop-ment and management of the tourism supply of the Republic of Croatia in the best way possible. Moreo-ver, it is necessary that such data access should be visible not only to administrative bodies that make their spatial and strategic plans and prepare pro-jects, but also to all other private subjects in tourism within and outside the region. In this way, recog-nised tourist resources ready for presentation and commercialisation could be immediately put onto the market.
Furthermore, mapped tourist resources will greatly help not only the competent ministry in making de-cisions during strategic thinking and in forming the budget, but also other ministries and public compa-nies in passing laws, regulations, statutes, providing subsidies, and devising taxing systems, etc.
The scientific sector should also not be left out. De-spite numerous tourist resources, the problems of the Croatian Continental area have not been elabo-rated sufficiently from a scientific point of view. Such mapped tourism potentials available to every-body could therefore open great opportunities for necessary scientific elaboration.
God. XXVIII, BR. 1/2015. str. 69-83 God. XXVIII, BR. 1/2015. str. 69-83
Mario Banožić, Gabrijela Žalac, Marijana Sumpor:Mapping of tourism potential: The preconditions for the development of tourism in Continental Croatia UDK: 338.48(497.5) / Preliminary communication
82 83
Mario BanožićGabrijela ŽalacMarijana Sumpor
Mapiranje turističkog potencijala:Preduvjeti razvoja turizma u kontinentalnojHrvatskoj
Sažetak Mnogi hrvatski znanstvenici ističu kako turizam nudi značajne prilike koje mogu pozitivno utjecati na ukupni društveno-ekonomski razvoj Hrvatske. Postalo je jasno da Hrvatska mora bolje pratiti suvremene turističke trendove u kojima se više pozornosti poklanja ekologiji, kulturnom identitetu destinacije, ak-tivnom odmoru, kvaliteti usluge i selektivnim oblicima razvoja turizma. Nije sporno da su čisto more, atraktivna obala i bogatstvo prirodnih i kulturnih zanimljivosti prednost hrvatske turističke ponude u priobalnom dijelu zemlje. Međutim, postoje mišljenja kako i kontinentalna Hrvatska obiluje prirodnim ljepotama, kulturnim bogatstvom i kulinarskom ponudom te da ima i brojne druge nedovoljno iskorištene turističke potencijale. Različita mišljenja o turizmu u Hrvatskoj temelje se na statističkim pokazateljima, kao što su razina razvijenosti turističkih regija izražena kroz ulaganja u infrastrukturu, broj zaposlenih i izravna korist od turizma za gospodarstvo. Usprkos činjenici da kontinentalna Hrvatska ima obilje turističkoga potencijala, ono što se nudi prepoznato je samo na lokalnoj razini. Ovaj problem se negativno odražava u strateškom smislu, budući da je za planiranje i financiranje projekata potrebna regionalna dimenzija. Neki su autori (Kušen, 1999; Koščak, 1998; Krippendorf, 1986; Müller, 1994; Stabler, 1996; Travis et al., 1994) osmislili katastar turističkoga potencijala koji nikad nije bio implementiran. Namjera je ovoga rada mapirati turističke potencijale kontinentalne Hrvatske upotrebom triple helix modela, na temelju kojega se može razvijati regionalni turizam i osigurati financiranje budućih projekata.
Ključne riječi: kontinentalna Hrvatska, razvoj turizma, turistički potencijal, triple helix model
22. Stabler, M. (1996), “Managing the leisure natural resource base: utter confusion or evolving consensus”, paper presented at The 4th World Leisure and Recreation Association Congress, Cardiff, pp. 4-6.
23. Stansfield, C. (1978), “Atlantic city and resort cycle: background to the legalization of gambling”, An-nals of Tourism Research, Vol. 5, No. 2, pp. 238-251.
24. Survey on the attitudes of Europeans towards tourism, Analytical Report-Wave 3, Flash Eurobarome-ter 328, The Gallup Organization, 2011, Available at: http://ec.europa.eu/public_opinion/flash/fl_328_en.pdf (Accessed on: August 20, 2014)
25. Tinsley, R., Lynch, P. (2001), “Small Tourism Business Networks and Destination Development”, Inter-national Journal and Hospitality Management, Vol. 20, No. 4, pp. 367-378.
26. TOMAS (2010), “Stavovi i potrošnja i potrošnja turista u Hrvatskoj”, Institut za turizam Zagreb, Available at: http://www.iztzg.hr/UserFiles/File/novosti/Tomas-Ljeto-2010-Prezentacija-HR-CRO-TOUR-23-03-2011.pdf (Accessed on: August 20, 2014)
27. Travis, A. S. (1994), “Sustainable tourism concepts and innovations in coastal areas and coastal city tourism”, In Klarić, Z. (Ed.), Prema održivom razvitku turizma u Hrvatskoj, Institut za turizam, Zagreb, pp. 33-52.
28. Watkins, M., Bell, B. (2002), “The Experience of Forming Business Relationship in Tourism”, Interna-tional Journal of Tourism Research, Vol. 4, No. 1, pp. 15-28.
God. XXVIII, BR. 1/2015. str. 69-83 God. XXVIII, BR. 1/2015. str. 69-83
Mario Banožić, Gabrijela Žalac, Marijana Sumpor:Mapping of tourism potential: The preconditions for the development of tourism in Continental Croatia UDK: 338.48(497.5) / Preliminary communication

85God. XXVIII, BR. 1/2015. str. 85-96
Danimir Štros, Maja Coner, Daniel Bukovinski: Management in rural areas
1. Introduction
For the purposes of this article, secondary informa-tion research has been made, including the infor-mation available on the Internet and contemporary literature about rural areas, problems and means of solving them, as well as a review of the present situ-ation in countries which are members of the Euro-pean Union and other countries. Better understand-ing of the problem of rural areas requires screening
of the current situation in Croatia and comparison with other European countries’ attempts of dealing with the forementioned problem.
This article will make several strategic assumptions which might affect the development of rural areas in Croatia.
Tourism in Croatia is derived from tourism ac-tivities that take place at the seaside and it is the main industry, which is now the basis for tourism
MANAGEMENT IN RURAL AREAS
UDK: 338.48(497.5)Preliminary communication
Received: March 05, 2015accepted for publishing: april 26, 2015
Danimir ŠtrosMunicipality of BrdovecTrg dr. Franje Tuđmana 1,10291 Prigorje Brdovečko,[email protected]: +38513315886
Maja ConerMunicipality of BrdovecTrg dr. Franje Tuđmana 1,10291 Prigorje Brdovečko,[email protected]: +38513315885
Daniel BukovinskiMunicipality of BrdovecTrg dr. Franje Tuđmana 1,10291 Prigorje Brdovečko,[email protected]: +38513315881
Abstract
Croatia has been seeking to achieve pre-war results in tourism since its independence. Rural tourism in Croatia based on family farms faces a number of problems: legal foundations, the involvement of local com-munities, inadequate entrepreneur support etc. The political will for development exists, but there is a lack of willingness and the ability to get things started, which results in the closure of family farms that cannot cope simultaneously with agriculture and tourism. The main subject of this research is the implementation of tourism in rural areas in order to raise the quality of life and keep the young population in rural areas.
Arriving guests certainly want a new type of tourism: peace, clean environment, cultural intangible and tangible treasures, all without the noise and stress; and Croatia can definitely offer this, both in coastal or inland areas along with its traditional food and drinks.
The destination connection is not satisfactory. There is also an evident lack of legislation and regional spa-tial development plans for sustainable tourism which is a prerequisite for successful tourism. With these presumptions accepted, Croatian tourism would become distinctive and inland and coastal branches of tourism could complement each other so that the customer can spend his or her vacation both in the continental and the maritime part of the country, getting to know our culture and enjoying the traditional cuisine.
Keywords: Strategy, continental tourism, agriculture, regions, intangible and tangible goods, destinations
86 87God. XXVIII, BR. 1/2015. str. 85-96 God. XXVIII, BR. 1/2015. str. 85-96
Danimir Štros, Maja Coner, Daniel Bukovinski: Management in rural areas UDK: 338.48(497.5) / Preliminary communication
agricultural policies to reverse the trend and prior-itize rural development. The policies in question in-clude regional development policies, rural tourism and other policies, which encourage the youth to stay or return to the rural areas.
Some European countries such as France, the Neth-erlands and Sweden, have years of experience in the field of rural development, but most other Euro-pean countries started giving more attention to the rural areas because of the initiatives and programs of the European Union.
According to Juen, the differences in the cultural and social context of the region affect the selection of their strategies, which can be classified into two main groups:
a) Introvert strategy - the strategy of revitalizing rural areas based on their internal capabilities and strengths, and
b) Strategies focused on the import of resources necessary for the development of the primary and tertiary sectors and improvement of the overall quality of the products in the region (Veer, Tuunter, 2005).
The territory of the European Union consists of about 80% of the rural areas with about 25% of the total population (Veer, Tuunter, 2005). It is also very important to note that the initiatives for the devel-opment of rural areas are now coming from the region itself and not from the cities that were not aware of the situation in the rural areas. Pursuant to the above mentioned, one of the solutions offered is the developmental model IRQ - Integrated Rural Quality (Krajinović, Čičin-Šain, Predovan, 2011). This model is implemented by the European Union with its Directive IRQ, and should serve as a foun-dation and model development of tourist destina-tions. The model is based on the experience of 15 cases of successful rural tourism destinations in Eu-rope. IRQ will not completely solve these problems, because they are systemic and are a very important part of economic and social life, regional develop-ment, legislation and more, but it can be viewed as a prerequisite of better development of the rural area.
In accordance with the new policy towards rural areas of the European Union, support is given not only to the farmers but also to other participants in the development and promotion of rural areas.
The document titled “Agenda”, adopted in 1999, de-fines new areas of interest of the European Union,
primarily focused on the development of the entire economy of rural areas.
With the above mentioned documents, all meas-ures of development are sublimated and reduced to a single legislation or second tier because the first is focused on direct support to farmers (reform of market support, the European Community, 2003)
The most important strategies of the Agenda are (Krajinović, Čičin-Šain, Predovan, 2011):
- The strategy of strengthening agriculture and for-estry
- The strategy of raising the competitiveness of ru-ral areas
- The strategy of maintaining and protecting nature and rural cultural heritage.
The specificity of rural tourism is the rural devel-opment of tourist products, which are produced by the combination of agriculture and its resources, climate and natural diversity, traditions of local people, indigenous cultural resources and other facilities such as hiking trails, bike paths, cultural, entertainment and sporting events, exhibitions and fairs, souvenirs, recreational facilities, tourist signs, landscaping roads etc. (Krajinović, Čičin-Šain, Pre-dovan, 2011).
4. Rural tourism in the context of the rural development policy
Populations of Many European countries accept tourism as one of the strategies of rural area sus-tainable development and, thereby the local com-munity development. Rural tourism is developing as an entrepeneurship activity based on attracting visitors to non-traditional tourist destinations. Visi-tor growth in rural areas increases the demand for tourist services, which leads to an increase in entre-preneurial activities in services and activities avail-able for visitors, including accommodation services. If they are pleased with the rural area and the ser-vice given, it can be expected that the visitors shall return eventually, and even participate in voluntary marketing by transferring their experience through the ‘word of mouth’ system, which will generate ad-ditional demand in the rural area.
The specificity of rural areas in Croatia is that the agricultural lands are fragmented and there is no
in Croatia. The guests come to Croatia mostly be-cause of the clear sea and the indigenous environ-ment, especially on the islands. Thus it is necessary to take certain measures to avoid the devastation of the coast by overuse of concrete since it is evident that the guests come for the indigenous nature and everything that constitutes the tradition of living by the sea. Croatia should remain in this state not only because it will preserve the cultural identity of living by the sea, but also because the guests come for the beautiful nature that Croatia abounds in, especially at the seaside.
Of course, tourism itself is not sufficient without the other activities that will entertain the guests and al-low them to spend their holidays in an active way so that they remember that holiday for a long time.
Croatian tourism as a strategic sector can not be based on maritime tourism that lasts for three months but should define the elements that will al-low the extension of the pre-season and post-sea-son. In order to include the whole territory of Croa-tia in tourism, the best alternative is to include both the rural and continental tourism in the Croatian tourist offer.
On the one hand, as an important resource for sus-tainable tourism, as well as for economic and social development, rural tourism encounters numerous marketing, managerial and economic difficulties in its development. On the other hand, there is a great demand for this type of tourism.
The development strategy should be implementing appropriate management models in this sensitive area, making agri-tourism household networking necessary as well as networking with other stake-holders wishing to participate in the development of rural tourism.
2. Theoretical frame
The research of available secondary information and the use of historical and comparative methods are made in order to ascertain the assumptions of revitalizing rural areas. The example of European countries shows a historical review of the occur-rence of crisis in rural areas beginning with emi-gration from those areas which resulted in loss of income that supported the rural areas.
Theoreticians are not single-minded about the de-velopment of tourism in rural areas; they lack a unanimous stand on a common definition of rural tourism, but are unanimous in the stand that the ru-ral area revitalization is necessary only through sus-tainable development and that rural policy needs to be led with the goal of implementing tourism in rural areas as a form of sustainable development.
The objective of this research is to produce several methods of revitalizing rural areas in Croatia based on the available information, but also to compare the information and determine issues arising in the European countries’ policies and their positive aspects in order to implement tourism in the rural area as an aid in revitalizing the area and making sure that the domicile population stays, especially the younger ones.
3. The European Union and rural area development policies
Social and economic forces that operate globally de-termine not only the appearance but also the shape of the rural landscape and the manner of its evalu-ation and use (Butler, Hall, Jenkins, 1998). Since the 1970s, the process of economic restructuring and the crisis of agricultural production across Europe and the U.S. have threatened the economic poten-tial of rural areas. This process has led to the loss of jobs and the closure of rural production facilities which resulted in the reduced number of farmers.
The reduction in the number of jobs and the loss of agricultural product placement possibilities has had a negative impact on the restructuring of the own-ership structure in agricultural enterprises which has led to many of them abandoning primary pro-duction and searching for other sources of income, and even emigration.
Economic decisions regarding rural areas have been made in distant cities, which have also affected the development of rural areas – the ‘top down’ poli-cies did not include rural area regional policies or ‘bottom up’ policies. These policies therefore re-sulted in the decline of the development potential in rural areas, and thereby reduced the traditional development strategies. Aware of the facts which had a negative impact on rural area development, the European Union attempts to stop the rural area emigration and has made a great effort through its
88 89
opment of rural tourism in the region. According to the available data by the Istria Tourist Board from 2010, the status of rural tourism in Istria County is evident, and that is actually a small display of the level of rural tourism in the whole of Croatia. Ac-cording to the data, rural tourism is the occupation of only about 200 households.
The conclusions presented in the article were adopted on the basis of a comparative analysis of Croatia with other tourism oriented countries, and an analysis of the problems which the developed countries encountered in the stages of development of rural tourism. The conclusions of the Istrian re-gion were adopted from a survey of households engaged in rural tourism. A possible solution is the IRQ development model, which was implemented in 15 successful rural tourist destinations in Europe (such as Austria, Germany, Italy, etc.).
Sustainable Development Strategies are as follows (Krajinović, Čičin-Šain, Predovan, 2011):
- The strategy of agricultural development that does not harm the environment
- The strategy of efficient use of water and energy
- Waste management strategy
- Green building strategies- the traditional way
- Marketing Strategy
- The strategy of establishing ecological transpor-tation
- The strategy to preserve the cultural heritage
- Speech conservation Strategy
- The strategy of cooperation with local and re-gional governments.
6. Definitions of rural tourism
The definition of rural tourism has been the subject of many discussions, but a consensus has not been reached (Pearce, 1989; Bramwell, 1994; Seaton et al., 1994). The series of possible reasons include the fol-lowing:
- Areas where rural tourism is active are hard to define because different countries use different definitions,
- Not all tourist activities in rural areas are neces-sarily ‘rural’, but can be ‘urban’ by its context, only
not by its location
- Different regions establish different forms of rural tourism and it is difficult to find a common de-nominator
- Rural areas are in the midst of complex reform processes as a result of global changes, the com-munication and telecommunication revolution which altered the market conditions and the de-mand for traditional products and services.
Rural areas are experiencing severe depopulation processes and there is an evident lack of immigra-tion processes by retired people who could revital-ize the rural area for specific products and services. The once clear distinction between rural and urban has been all but erased, which has led to urbaniza-tion, a long-distance product exchange and building of vacation houses (OECD, 1994).
Besides the term ‘rural tourism’, there are many terms in use. There is an entire spectar of circum-stances leading to different concepts which ulti-mately separate their authors.
There are two types of definitions:
1. Nature tourism, rural tourism and agritourism (each of the mentioned categories is derivative of the former), based on the percentage of income distribution to the local population and to the entrepreneurs.
2. The difference is based on altering elements of the tourist offer.
Because of the forementioned in the second group, rural tourism exploits the situation when rural cul-ture is the centerpiece of the tourist offer. Based on the primary component of the product, terms such as agritourism, green tourism, hunting tourism, ad-venture tourism, historical tourism, cultural tour-ism and others are used.
Tourist activities taking place in large tourist settle-ments, hotels, golf resorts etc. can hardly be incor-porated into the rural tourism concept. Tourism in rural areas is specific in that it attempts to achieve close personal contact with the tourists and enable their participation in the local rural community’s everyday life. It is very important to note the aim of consuming cultural, gastronomical and other ele-ments through this form of tourism. If the authors’ views are to be summarized, rural tourism could be defined as an area with a natural, forested environ-ment where natural, economical and sociocultural
owner with 30 or more hectares. From the above mentioned, it is necessary to work on connecting with other owners to get a single successful unit. If rural tourism is to be implemented, it is necces-sary to offer indigenous agricultural products, as well as to cooperate with other manufacturers who are willing to engage in the rural tourism business, where this approach provides a synergistic effect.
Inclusion of family farms, local self-government units, tourist boards and tourist guides, charter companies etc. would successfully satisfy the ever-increasing demands of visitors and tourists. Specifi-cally, modern tourists, as they are referred to nowa-days, are eager to explore the culture, history and the living of the local population in the place where they stay.
According to Dr. Dragan Magaš, a professor at the University of Rijeka, the limit payload capacity of tourism is precisely the level of presence of tourists that creates a positive impact on the local popula-tion, environment, economy and tourists, and is sustainable in the future, which is a worthwhile con-cept (Magaš, 2000).
In order to minimize the negative impacts of tour-ism and maximize the positive effects, it is neces-sary to organize a high quality and professional management team that will manage the develop-ment process.
Tourism relies on the goodwill and cooperation of the local population because they are an integral part of the tourism product. Where development and planning are not in accordance with the local needs and opportunities, resistance and hostility can ruin the overall sector process.
5. Rural tourism as a means of developing the tourist market
Today’s tourist market is looking for new forms of spending free time. Mass tourism dominated by the sun and the sea has led to saturation, both in tourism demand and when it comes to offering new things. Tourists are looking for new places and ways to spend their holidays guided by the desire to learn about the native communities, local gastronomy, culture, authentic values and the quest for a way of life as lived by our ancestors.
One of the answers could be rural development and
Croatia should certainly increase its competitive-ness and comparative advantage valorizing the rural area as a tourist destination.
By developing rural tourism, a tourist country contributes to further development of adjacent ar-eas and enables their own tourist valorization. The evaluation of rural tourism of passive areas contrib-utes not only to the development of these regions, but also to the preservation of the natural, cultural and historical heritage; improves the quality of life and most importantly enables employment and prevents migration from rural areas. A prerequisite for young people to stay in a rural area is economic activity: in this case, rural tourism that will provide young people with a chance to stay and receive ad-equate education in rural areas.
The problem that is related to difficulties in the im-plementation of rural tourism is primarily the weak economic strength of family farms (OPG) where it is very difficult or almost impossible to work in both agriculture and tourism. It is therefore necessary to consider rural tourism as a separate branch which will develop family farms with the involvement of the local population on the basis of agreements, contracts and the like. This primarily refers to the subcontractors who will offer their agricultural products and accommodate guests who are eager to actively participate in daily farm choirs. In ad-dition, there is the problem of inadequate financial incentives and lack of recognition of rural tourism as a form of tourism which adds value to the tourist board.
Based on everything mentioned above, the whole problem lies in the inadequate way of managing the development of rural areas that should increase economic activity and keep young people in rural areas.
In Croatia, only the Istria region can be pointed out as a region which began the valorization of rural ar-eas with significant subsidies and incentives of the regional public sector and in the hinterland of the strongest tourist destinations in Croatia.
Unfortunately most of the Istrian farmhouses are on the verge of closure because they operate on the edge of economic viability due to the inability to manage two parallel economic sources: agricultural production and rural tourism.
This article aims to highlight one of the key issues, and that is the strategic management of the devel-
God. XXVIII, BR. 1/2015. str. 85-96 God. XXVIII, BR. 1/2015. str. 85-96
Danimir Štros, Maja Coner, Daniel Bukovinski: Management in rural areas UDK: 338.48(497.5) / Preliminary communication
90 91
see the surroundings in which the local people live (churches, parks, museums, customs, dialects etc).
The rural tourist destination as an integrated prod-uct is very fragile from an ecological, social and cul-tural aspect. Hence it requires a specific approach to its development aiming at achieving long-term sustainability.
Table 1 Rural and urban areas, population and settlements according to OECD criteria
Source: central Bureau of Statistics, in 2001* Includes both rural and urban areas
From Table 1 it is evident that Croatia has about 52,000 sq km of rural areas, which supports the fact that there are plenty of arguments for the imple-mentation of tourism in rural areas.The rural area is very sensitive to cultural, natural or any other dam-age triggered by the development of tourism. Dur-ing the valorization of rural tourism special care should be taken to protect nature, culture, water, etc., because in this way, the natural beauty and cul-tural heritage are preserved and can be adequately incorporated into the very offer. Special care should be taken because the historical aspect of the build-ings and construction should only be allowed in respect of indigenous architecture; or a modern architectural solution should attempt to fit the ac-commodation capacities into the rural. If the order and the existing natural resources are violated, the tourism would not make sense because the tourists in a rural area look for untouched nature, peace, tranquility, hospitality and of course the indigenous environment and the answer to the question of how our ancestors lived.
The main characteristic of the Croatian rural poli-cies is an attempt to stop the development lag in rural areas by using all of their resources.
Croatian policies follow the European Union’s ru-ral development policies with its development documents and acts. The objective is to keep the population in rural areas, equalize the quality of life in rural and urban areas, enable the return of the population from urban to rural areas, increase production competitiveness and thus create a larger income for the agricultural producers. Strategic objectives for Croatia’s rural development are con-tained in the Development strategy of the Republic of Croatia 2008-2013:
1. increase in the competitiveness of the agricul-tural and the forest sector;
2. preservation, protection and sustainable use of the landscape, the cultural and natural heritage;
3. increase in the quality of life in rural areas and the expansion of the economic programmes;
4. increase in the effectiveness of the institutional environment.
Croatia gained access to the LEADER programme through the IPARD instrument. The LEADER con-sists of connecting nearby local communities into a partnership for rural development (LAG – Local Action Group) based on common characteristics, resources and interests, which will define, prepare and conduct a local development strategy.
Basic elements of LEADER implementation are de-termined in the IPARD programme for agriculture and rural development according to the EU regu-lations. Although the implementation act adoption was delayed (Protocol on implementing the meas-ure 202 – preparation and implementation of local rural development strategies, or LEADER Proto-col), which would determine the criteria and means of co-financing local action partnerships business expenditures, LEADER implementation in practice has had significant progress in Croatia.
aspects such as tradition, local cooperation and in-terpersonal relations, based on small-scale econo-my with a ‘friendly’ treatment of the environment, combine to form sustainable development.
7. Rural tourism as a strategy of rural and regional development
Tourism as an economic activity primarily repre-sents a consumer activity. Most of the research is focused on the consumers, their needs, wishes and motivation. What attracts most of the consumers to rural areas is open space recreation, returning to ‘good old times’, simple way of life, gastronomy ‘like in your grandmother’s kitchen’, tangible and intan-gible assets of rural areas etc.
The necessity of returning to one’s roots and living a simple life with no stress or urban environment leads to an increased demand for rural areas (Kas-tenholz, Davis, Paul, 1999).
The importance of rural tourism as a part of the tourist offer certainly depends on the resources of an individual country, infrastructure, market avail-ability and competition.
Although rural tourism has less importance for the total tourism market, it is very significant for the development of rural areas and the return of the domicile young population. It is evident that tour-ism and its complementary entrepreneurship initia-tives have become one of the most popular develop-ment strategies of the rural area (Lane, 1990; Clarke, 1981; Witt, 1987).
The assumptions favoring tourism as a development strategy of rural areas:
- rural tourism can exist with cooperation from local self-government and small and medium en-terprises without the need for large companies and corporations
- rural tourism can be developed with relatively small capital and knowledge investment, result-ing in decreasing the operating costs
- rural tourism opens possibilities for small and medium enterprises whose business would not otherwise be possible in the rural area, especially entrepreneurs offering accommodation services, shops, recreation objects and other infrastructure necessary for successful business in rural tour-
ism – existing farms generate secondary income (Wilson et al. 2001).
Tourism as a development strategy contributes to the rural area revitalization, decreases social ten-sions, encourages employment, expands existing farm businesses and generally enables sustainable regional development.
Rural tourism in the world is experiencing an in-creasing demand growth in the tourism market due to public support for the development of rural ar-eas, which is typical for developed countries.
8. Rural tourism area product
Location specific products can not offer a univer-sal model of rural tourism product and destination development (Mathieson, Wall, 1982), but can cer-tainly contribute to defining a basic frame for a bet-ter understanding of the rural tourism destination and product.
Butler’s destination product life cycle theory (1980) had a pivotal role in defining the basic model for understanding the tourist destination and product. His flexible lifecycle model marks different phases in the evolution of the destination and the changes happening in it throughout its transition from one phase to another. The critical factors are: a change in the needs of the consumer, devastation of the natural environment and a change or the disappear-ance of the attractions that first brought tourists to the area. One of the major factors in the evolution of the destination is identification of potential con-sumers, adequate markets and modes to approach them. Understanding the rural tourists is necessary if their expectations are to be met.
For the tourist destinations to keep their competi-tiveness, they have to fulfill basic tourist needs – needs for accommodation and food. Along clas-sic venues for accommodation, village and farm houses are often wanted. By including services in their portfolio, farm owners diversify their activi-ties and raise the value of their product and estate services. Tourists that prefer such accommodation seek originality in diet, intimacy, participation in everyday tasks and forming friendships, which rep-resents values almost forgotten in the modern age. Tangible and intangible assets of the destination af-fect the decision to visit it because tourists want to
ClassificationOECD criteria
km2 % Number of settlements % Number of residents %
Rural areas* 51,872 91.6 6,001 88.7 2,110,988 47.6
Urban areas 4,731 8.4 763 11.3 2,326,472 52.4
Total 56,603 100 6,751 100 4,437,460 100
God. XXVIII, BR. 1/2015. str. 85-96 God. XXVIII, BR. 1/2015. str. 85-96
Danimir Štros, Maja Coner, Daniel Bukovinski: Management in rural areas UDK: 338.48(497.5) / Preliminary communication
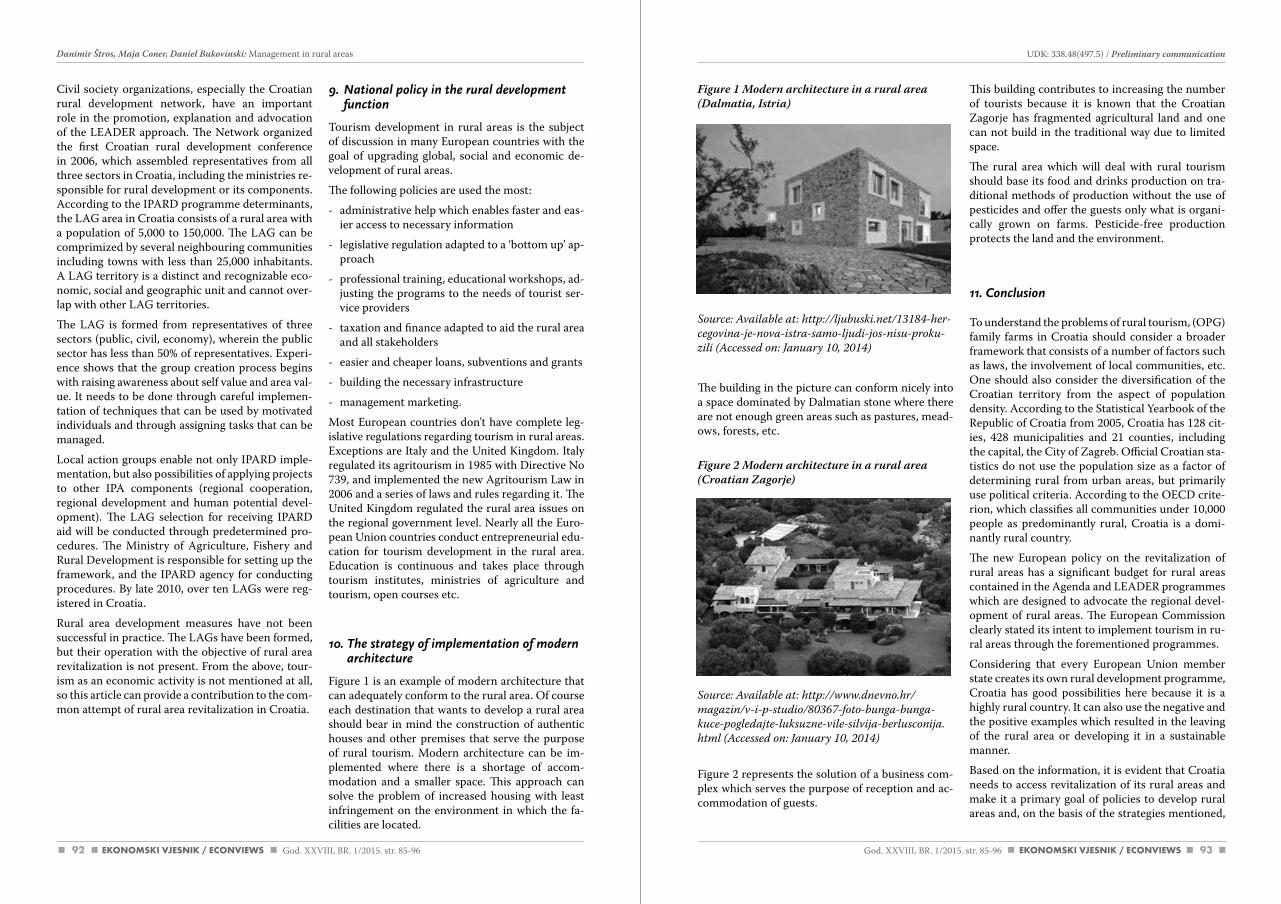
92 93
Figure 1 Modern architecture in a rural area (Dalmatia, Istria)
Source: available at: http://ljubuski.net/13184-her-cegovina-je-nova-istra-samo-ljudi-jos-nisu-proku-zili (accessed on: January 10, 2014)
The building in the picture can conform nicely into a space dominated by Dalmatian stone where there are not enough green areas such as pastures, mead-ows, forests, etc.
Figure 2 Modern architecture in a rural area (Croatian Zagorje)
Source: available at: http://www.dnevno.hr/magazin/v-i-p-studio/80367-foto-bunga-bunga-kuce-pogledajte-luksuzne-vile-silvija-berlusconija.html (accessed on: January 10, 2014)
Figure 2 represents the solution of a business com-plex which serves the purpose of reception and ac-commodation of guests.
This building contributes to increasing the number of tourists because it is known that the Croatian Zagorje has fragmented agricultural land and one can not build in the traditional way due to limited space.
The rural area which will deal with rural tourism should base its food and drinks production on tra-ditional methods of production without the use of pesticides and offer the guests only what is organi-cally grown on farms. Pesticide-free production protects the land and the environment.
11. Conclusion
To understand the problems of rural tourism, (OPG) family farms in Croatia should consider a broader framework that consists of a number of factors such as laws, the involvement of local communities, etc. One should also consider the diversification of the Croatian territory from the aspect of population density. According to the Statistical Yearbook of the Republic of Croatia from 2005, Croatia has 128 cit-ies, 428 municipalities and 21 counties, including the capital, the City of Zagreb. Official Croatian sta-tistics do not use the population size as a factor of determining rural from urban areas, but primarily use political criteria. According to the OECD crite-rion, which classifies all communities under 10,000 people as predominantly rural, Croatia is a domi-nantly rural country.
The new European policy on the revitalization of rural areas has a significant budget for rural areas contained in the Agenda and LEADER programmes which are designed to advocate the regional devel-opment of rural areas. The European Commission clearly stated its intent to implement tourism in ru-ral areas through the forementioned programmes.
Considering that every European Union member state creates its own rural development programme, Croatia has good possibilities here because it is a highly rural country. It can also use the negative and the positive examples which resulted in the leaving of the rural area or developing it in a sustainable manner.
Based on the information, it is evident that Croatia needs to access revitalization of its rural areas and make it a primary goal of policies to develop rural areas and, on the basis of the strategies mentioned,
Civil society organizations, especially the Croatian rural development network, have an important role in the promotion, explanation and advocation of the LEADER approach. The Network organized the first Croatian rural development conference in 2006, which assembled representatives from all three sectors in Croatia, including the ministries re-sponsible for rural development or its components. According to the IPARD programme determinants, the LAG area in Croatia consists of a rural area with a population of 5,000 to 150,000. The LAG can be comprimized by several neighbouring communities including towns with less than 25,000 inhabitants. A LAG territory is a distinct and recognizable eco-nomic, social and geographic unit and cannot over-lap with other LAG territories.
The LAG is formed from representatives of three sectors (public, civil, economy), wherein the public sector has less than 50% of representatives. Experi-ence shows that the group creation process begins with raising awareness about self value and area val-ue. It needs to be done through careful implemen-tation of techniques that can be used by motivated individuals and through assigning tasks that can be managed.
Local action groups enable not only IPARD imple-mentation, but also possibilities of applying projects to other IPA components (regional cooperation, regional development and human potential devel-opment). The LAG selection for receiving IPARD aid will be conducted through predetermined pro-cedures. The Ministry of Agriculture, Fishery and Rural Development is responsible for setting up the framework, and the IPARD agency for conducting procedures. By late 2010, over ten LAGs were reg-istered in Croatia.
Rural area development measures have not been successful in practice. The LAGs have been formed, but their operation with the objective of rural area revitalization is not present. From the above, tour-ism as an economic activity is not mentioned at all, so this article can provide a contribution to the com-mon attempt of rural area revitalization in Croatia.
9. National policy in the rural development function
Tourism development in rural areas is the subject of discussion in many European countries with the goal of upgrading global, social and economic de-velopment of rural areas.
The following policies are used the most:
- administrative help which enables faster and eas-ier access to necessary information
- legislative regulation adapted to a ‘bottom up’ ap-proach
- professional training, educational workshops, ad-justing the programs to the needs of tourist ser-vice providers
- taxation and finance adapted to aid the rural area and all stakeholders
- easier and cheaper loans, subventions and grants
- building the necessary infrastructure
- management marketing.
Most European countries don’t have complete leg-islative regulations regarding tourism in rural areas. Exceptions are Italy and the United Kingdom. Italy regulated its agritourism in 1985 with Directive No 739, and implemented the new Agritourism Law in 2006 and a series of laws and rules regarding it. The United Kingdom regulated the rural area issues on the regional government level. Nearly all the Euro-pean Union countries conduct entrepreneurial edu-cation for tourism development in the rural area. Education is continuous and takes place through tourism institutes, ministries of agriculture and tourism, open courses etc.
10. The strategy of implementation of modern architecture
Figure 1 is an example of modern architecture that can adequately conform to the rural area. Of course each destination that wants to develop a rural area should bear in mind the construction of authentic houses and other premises that serve the purpose of rural tourism. Modern architecture can be im-plemented where there is a shortage of accom-modation and a smaller space. This approach can solve the problem of increased housing with least infringement on the environment in which the fa-cilities are located.
God. XXVIII, BR. 1/2015. str. 85-96 God. XXVIII, BR. 1/2015. str. 85-96
Danimir Štros, Maja Coner, Daniel Bukovinski: Management in rural areas UDK: 338.48(497.5) / Preliminary communication
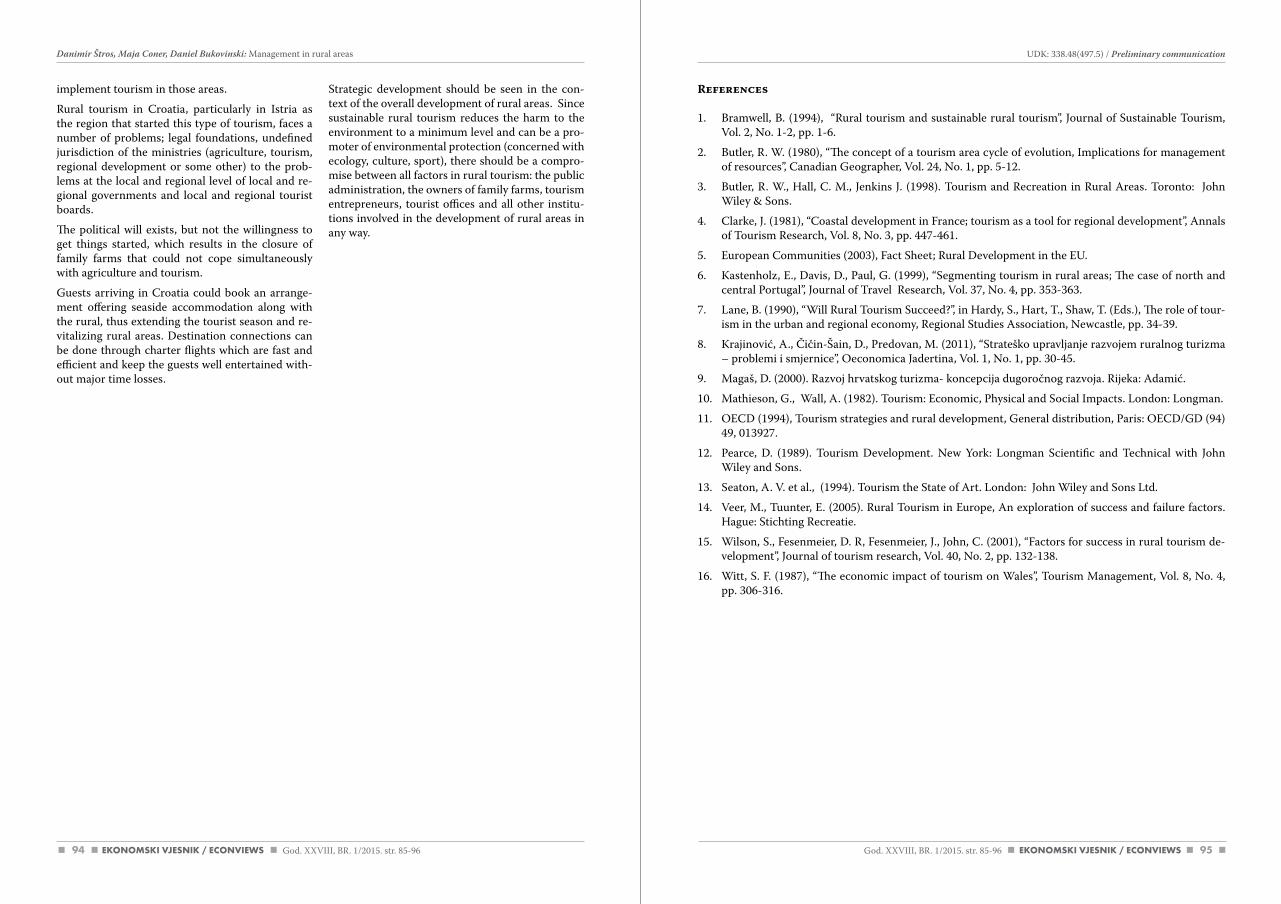
94 95
References
1. Bramwell, B. (1994), “Rural tourism and sustainable rural tourism”, Journal of Sustainable Tourism, Vol. 2, No. 1-2, pp. 1-6.
2. Butler, R. W. (1980), “The concept of a tourism area cycle of evolution, Implications for management of resources”, Canadian Geographer, Vol. 24, No. 1, pp. 5-12.
3. Butler, R. W., Hall, C. M., Jenkins J. (1998). Tourism and Recreation in Rural Areas. Toronto: John Wiley & Sons.
4. Clarke, J. (1981), “Coastal development in France; tourism as a tool for regional development”, Annals of Tourism Research, Vol. 8, No. 3, pp. 447-461.
5. European Communities (2003), Fact Sheet; Rural Development in the EU.
6. Kastenholz, E., Davis, D., Paul, G. (1999), “Segmenting tourism in rural areas; The case of north and central Portugal”, Journal of Travel Research, Vol. 37, No. 4, pp. 353-363.
7. Lane, B. (1990), “Will Rural Tourism Succeed?”, in Hardy, S., Hart, T., Shaw, T. (Eds.), The role of tour-ism in the urban and regional economy, Regional Studies Association, Newcastle, pp. 34-39.
8. Krajinović, A., Čičin-Šain, D., Predovan, M. (2011), “Strateško upravljanje razvojem ruralnog turizma – problemi i smjernice”, Oeconomica Jadertina, Vol. 1, No. 1, pp. 30-45.
9. Magaš, D. (2000). Razvoj hrvatskog turizma- koncepcija dugoročnog razvoja. Rijeka: Adamić.
10. Mathieson, G., Wall, A. (1982). Tourism: Economic, Physical and Social Impacts. London: Longman.
11. OECD (1994), Tourism strategies and rural development, General distribution, Paris: OECD/GD (94) 49, 013927.
12. Pearce, D. (1989). Tourism Development. New York: Longman Scientific and Technical with John Wiley and Sons.
13. Seaton, A. V. et al., (1994). Tourism the State of Art. London: John Wiley and Sons Ltd.
14. Veer, M., Tuunter, E. (2005). Rural Tourism in Europe, An exploration of success and failure factors. Hague: Stichting Recreatie.
15. Wilson, S., Fesenmeier, D. R, Fesenmeier, J., John, C. (2001), “Factors for success in rural tourism de-velopment”, Journal of tourism research, Vol. 40, No. 2, pp. 132-138.
16. Witt, S. F. (1987), “The economic impact of tourism on Wales”, Tourism Management, Vol. 8, No. 4, pp. 306-316.
implement tourism in those areas.
Rural tourism in Croatia, particularly in Istria as the region that started this type of tourism, faces a number of problems; legal foundations, undefined jurisdiction of the ministries (agriculture, tourism, regional development or some other) to the prob-lems at the local and regional level of local and re-gional governments and local and regional tourist boards.
The political will exists, but not the willingness to get things started, which results in the closure of family farms that could not cope simultaneously with agriculture and tourism.
Guests arriving in Croatia could book an arrange-ment offering seaside accommodation along with the rural, thus extending the tourist season and re-vitalizing rural areas. Destination connections can be done through charter flights which are fast and efficient and keep the guests well entertained with-out major time losses.
Strategic development should be seen in the con-text of the overall development of rural areas. Since sustainable rural tourism reduces the harm to the environment to a minimum level and can be a pro-moter of environmental protection (concerned with ecology, culture, sport), there should be a compro-mise between all factors in rural tourism: the public administration, the owners of family farms, tourism entrepreneurs, tourist offices and all other institu-tions involved in the development of rural areas in any way.
God. XXVIII, BR. 1/2015. str. 85-96 God. XXVIII, BR. 1/2015. str. 85-96
Danimir Štros, Maja Coner, Daniel Bukovinski: Management in rural areas UDK: 338.48(497.5) / Preliminary communication
9796 God. XXVIII, BR. 1/2015. str. 97-109
M. Mercedes Galán – Ladero, Clementina Galera – Casquet:The role of the retailers in cause-related marketing: A reference to the Spanish case
THE ROLE OF THE RETAILERS IN CAUSE-RELATED MARKETING: A REFERENCE TO THE SPANISH CASE
UDK: 658.89(460)Preliminary communication
Received: april 29, 2015accepted for publishing: May 20, 2015
M. Mercedes Galán – LaderoFaculty of Economics and BusinessUniversity of Extremaduraavda. Elvas, s/n.06006 Badajoz, [email protected]: +34924289300
Clementina Galera – Casquet Faculty of Economics and BusinessUniversity of Extremaduraavda. Elvas, s/n.06006 Badajoz, [email protected]: +34924289664
Abstract
Cause-Related Marketing (CRM) is one of the most relevant Corporate Social Responsibility (CSR) initia-tives nowadays. Its most important characteristic is that corporate donation is conditioned by sales, that is, CRM ultimately depends on consumer behavior.
In this paper, we focus on CRM programs and its application in a specific industry: the distribution sector. Thus, our aim is to understand the fundamental features or the practice of these programs in the distri-bution sector in Spain, to study the role played by retailers and their possible influence on the consumer behavior, so that companies can better design these campaigns and achieve greater success.
Hence, the paper is organized as follows. First, we review the CRM conceptual framework in which the theoretical development of this work is based. Secondly, from a list of companies associated with the Na-tional Association of Large Distribution Companies (ANGED), the most representative retail association in Spain, we observe the Spanish situation and analyze the main campaigns carried out by these retailers during the last years. This information was completed consulting each retailer´s website, asking them for additional information by email, and with a general Internet search. After that, we present and discuss the main results, and summarize the most relevant conclusions, as well as the theoretical contribution and managerial implications. One of the most important findings shows the retailer´s influence on consumer behavior and the key role of the retailers in the success of CRM programs. Finally, we also include possible limitations and further research.
Keywords: Cause-related marketing, retailers, consumer behavior, corporate social responsibility
Danimir ŠtrosMaja ConerDaniel Bukovinski
Menadžment u ruralnom području
Sažetak
Hrvatska od svoje samostalnosti nastoji postići turističke rezultate koje je imala prije rata. S obzirom na to da se deklarirala kao turistička destinacija i da joj je turizam strateško opredjeljenje, trebala bi iskoristiti sve svoje komparativne prednosti i implementirati turizam i u ruralna područja kako bi imala jedinstvenu ponudu od kontinentalnoga do priobalnoga dijela. Glavni je cilj istraživanja ovoga rada uvođenje turizma u ruralno područje te na taj način podizanje kvalitete života i zadržavanje mladoga domicilnog stanovništva u ruralnom području.
Problematika ruralnog turizma na obiteljskim poljoprivrednim gospodarstvima uključuje niz čimbenika kao što su zakoni, spremnost uključivanja lokalne zajednice, nedovoljna podrška za poduzetnike itd. Politička volja za razvoj postoji, no nedostaje spremnosti i sposobnosti za konkretne poteze što rezultira zatvaranjem obiteljskih poljoprivrednih gospodarstava koja se ne mogu nositi s paralelnim poslom vođenja poljoprivrede i turizma.
Gosti žele turizam koji uključuje mir, čist okoliš, kulturna nematerijalna i materijalna blaga. Priobalni i kontinentalni dijelovi Hrvatske svakako to mogu ponuditi, uz tradicionalna jela i pića.
Povezanost destinacija nije zadovoljavajuća. Nedostaju regionalni prostorni planovi razvoja održivoga tu-rizma (koji su njegov preduvjet) te zakonska regulativa. Kada bi se prihvatile navedene pretpostavke, hrvat-ski bi turizam bio prepoznatljiv te bi gost, za vrijeme godišnjega odmora u kontinentalnom i priobalnom području, upoznavao kulturu i uživao u tradicionalnoj kuhinji.
Ključne riječi: strategija, kontinentalni turizam, poljoprivreda, regije, nematerijalna i materijalna blaga, destinacije
God. XXVIII, BR. 1/2015. str. 85-96
Danimir Štros, Maja Coner, Daniel Bukovinski: Management in rural areas
98 99
UDK: 658.89(460) / Preliminary communication M. Mercedes Galán – Ladero, Clementina Galera – Casquet:The role of the retailers in cause-related marketing: A reference to the Spanish case
God. XXVIII, BR. 1/2015. str. 97-109 God. XXVIII, BR. 1/2015. str. 97-109
ings to respond to new demands and putting at-tention to groups with specific consumer needs – low sodium products, sugar-free products, gluten-free products, lactose-free products, organic products, labeled in Braille, … -; devel-oping awareness campaigns on nutrition and consumption; improving accessibility to stores – removing barriers to physical and sensorial mobility -; signing cooperation agreements with various NGOs; making donations - monetary and / or in kind ones -; collaborating in humani-tarian, aid and emergency campaigns; or devel-oping sponsorship activities in different areas – cultural, artistic, sporting, or scientific ones).
In addition, also supporting suppliers, with com-mitment to all territories and local economies in which they operate; with the implementation of good practices in the processes of production, pro-cessing, and distribution; or with codes of conduct for contacts with suppliers.
In this paper, we will focus on this last stream. In particular, we will observe the frequent collabora-tions with different NGOs, which include donations of surplus food, assignment of space in the stores for the collection of products and / or funds for solidarity projects, sales of ‘solidarity’ products (e.g. Christmas cards from different NGOs), or aware-ness about certain causes.
Table 1 Major CSR Initiatives
Source: adapted from Kotler and lee (2005)
Among the various CSR initiatives existing (see Ta-ble 1), we will focus on the so-called cause-related marketing programs, which refer to those cam-paigns where companies collaborate with nonprofit organizations making a contribution to a particular cause depending on the sales made (Kotler and Lee, 2005).Our study, therefore, aims to add to knowledge in the domain of cause-related marketing (CRM), fur-thering the commercial distribution sector. To do this, and from a review of the extant literature to set the conceptual framework, we conducted a de-scriptive study of the major campaigns undertaken by retailers in Spain in recent years. Our objective is to understand the fundamental features or the practice of these programs in the distribution sector in our country, to study the role played by retailers and their possible influence on the consumer behavior, so that companies can bet-ter design these campaigns and achieve greater suc-cess.Hence, the paper is organized as follows. First, we review the conceptual framework in which the the-oretical development of this work is based. Second-ly, we describe the adopted research design and the methodology followed. After that, we present the main results, which are also brought under discus-sion. Finally, we summarize the most relevant con-clusions that follow from the research findings, as well as the theoretical contribution and managerial implications. We also include possible limitations and further research.
1. Introduction
Corporate Social Responsibility (CSR) has become a relevant topic in the new 21st Century. It is a wide and complex concept that is evolving, and it has been defined in different ways. Thus, the European Commission (2011) defines CSR as “the responsibil-ity of enterprises for their impacts on society”. Kotler and Lee (2005) define it as “a commitment to im-prove community well-being through discretionary business practices and contributions of corporate resources”. AMA (2015) establishes that “cSR is seriously considering the impact of the company´s actions and operating in a way that balances short term profit needs with society´s long term needs, thus ensuring the company´s survival in a healthy envi-ronment”.
There are several theories that support the CSR theoretical framework. Among them, two theories stand out (Galán et al., 2013a): the Stakeholder The-ory and the Resource – Advantage Theory (Ferrell, 2010).
On the one hand, the Stakeholder Theory (devel-oped by Freeman, in 1984) considers the firm as a wide and complex network of relationships. The corporate management is directly linked to this net-work of relationships. It tries to harmonize different stakeholders´ interests, which are often multiple, divergent and even opposite, to create sustainable welfare and wealth for all the stakeholders, and the society in general in the long term.
On the other hand, the Resource – Advantage The-ory (developed by Hunt, in 1995) establishes that competitive advantage will come from firms that developed the best resources in a heterogeneous and changing environment. Thus, the defense of business ethics and CSR could help to get the re-source advantage.
Thereby, CSR is a new way of thinking, a corporate culture based on ethical management as a channel to improve the competitiveness and corporate repu-tation (Forética, 2002: 13). To actually get a com-petitive advantage, CSR should be integrated into the corporate culture, strategy and mission (Galán et al., 2013a).
Consequently, CSR has become a transcendental intangible resource for all kind of organizations. Although in an early stage CSR was mainly driven by certain large corporations, nowadays CSR is ap-plicable to any type of business, and in all sectors.
In this work, we focus on the commercial distribu-tion sector. We have chosen this sector because of its importance and because it is not enough studied (research on this topic is still scarce). It is a highly concentrated sector, dominated by a small number of companies (and the concentration level continues to increase). This sector has undergone a major re-structuring in the last years, because of the change of trend in consumer habits and the impact of the economic crisis (Núñez, 2014). In this context, CSR has gained greater relevance, and socially responsi-ble actions in this sector are becoming more numer-ous and varied.
In the specific case of commercial distribution, CSR tends to focus on three streams (ANGED, 2013; Martín, 2013; Vázquez, 2013; Galán and Galera 2014):
1. The commitment to the environment, with sus-tainable practices (e.g. environmental efficiency; energy saving; developing eco-efficient stores; redesigning the packaging of products to make them easier to recycle and less polluting – eco-design, use of more sustainable raw material, efficiency seals, … -; reducing the use of plastic bags for single use; encouraging recycling, reuse, recovery and proper treatment of waste to avoid possible impacts on the environment; awareness campaigns to reduce waste; or the optimization of logistics processes – routes and supplies -).
2. The commitment to employees (e.g. mainte-nance of employment – job stability and security -; improving working conditions and the working environment in general; establishing measures to reconcile work and family life; equality plans; improving the employees´ skills with training and expertise courses, and internal promotion programs; offering job opportunities to various groups at risk of social exclusion; establishing in-ternal codes of conduct; encouraging corporate volunteering; safety and prevention of occupa-tional hazards, etc.).
3. The commitment to society, defending the con-sumers´ interests and taking care of customer service (e.g. commitment to saving – prices, product efficiency -; better access to purchases, facilitating credit; quality and product safety; service channels and customer information – campaigns about consumer education, respon-sible purchasing, and prevention of childhood obesity; consistently improving product offer-
Initiatives Main Focus
Cause PromotionsPersuasive communications, to raise awareness or interest for a social cause.Emphasis on promotional strategies (focus on external communications).Target audiences, outside the organization.
Cause-Related MarketingContributions and support, linked to sales of the company’s specific products.It depends on the action or consumer’s response.It includes more communication (mainly advertising).
Corporate Social Marketing Influence the individual’s behavior changes (focus on behavior change).
Corporate Philanthropy‘Extending a check’. Direct contributions to a cause or a charity (cash donations and / or in kind).It is the most traditional of all corporate social initiatives.
Community Volunteering Corporate volunteering service in the community (employees donate their time and talent).
Socially ResponsibleBusiness Practices
Discretionary business practices and investments that support social causes to improve the community’s welfare and to protect the environment.
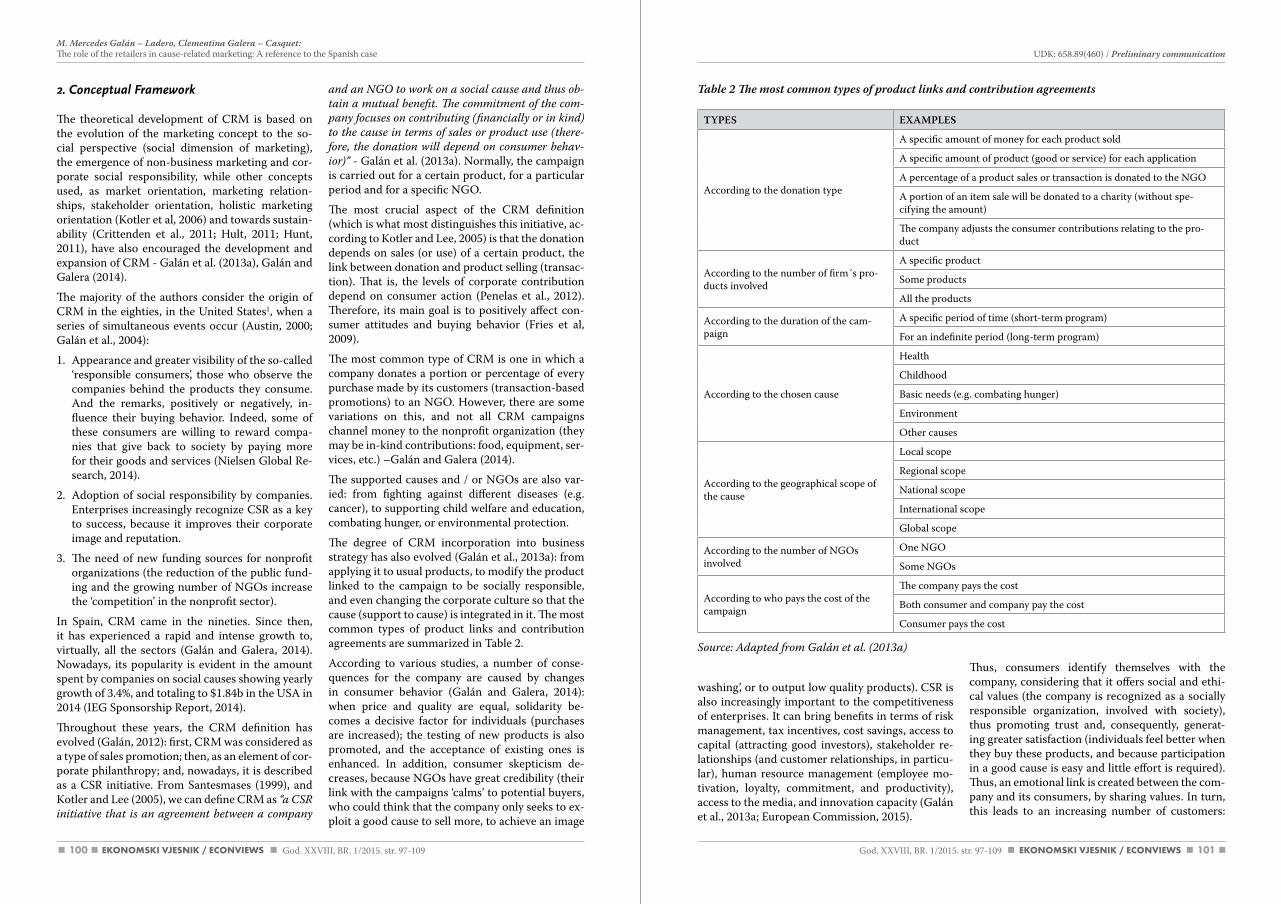
100 101
Source: adapted from Galán et al. (2013a)
washing’, or to output low quality products). CSR is also increasingly important to the competitiveness of enterprises. It can bring benefits in terms of risk management, tax incentives, cost savings, access to capital (attracting good investors), stakeholder re-lationships (and customer relationships, in particu-lar), human resource management (employee mo-tivation, loyalty, commitment, and productivity), access to the media, and innovation capacity (Galán et al., 2013a; European Commission, 2015).
Thus, consumers identify themselves with the company, considering that it offers social and ethi-cal values (the company is recognized as a socially responsible organization, involved with society), thus promoting trust and, consequently, generat-ing greater satisfaction (individuals feel better when they buy these products, and because participation in a good cause is easy and little effort is required). Thus, an emotional link is created between the com-pany and its consumers, by sharing values. In turn, this leads to an increasing number of customers:
2. Conceptual Framework
The theoretical development of CRM is based on the evolution of the marketing concept to the so-cial perspective (social dimension of marketing), the emergence of non-business marketing and cor-porate social responsibility, while other concepts used, as market orientation, marketing relation-ships, stakeholder orientation, holistic marketing orientation (Kotler et al, 2006) and towards sustain-ability (Crittenden et al., 2011; Hult, 2011; Hunt, 2011), have also encouraged the development and expansion of CRM - Galán et al. (2013a), Galán and Galera (2014).
The majority of the authors consider the origin of CRM in the eighties, in the United States1, when a series of simultaneous events occur (Austin, 2000; Galán et al., 2004):
1. Appearance and greater visibility of the so-called ‘responsible consumers’, those who observe the companies behind the products they consume. And the remarks, positively or negatively, in-fluence their buying behavior. Indeed, some of these consumers are willing to reward compa-nies that give back to society by paying more for their goods and services (Nielsen Global Re-search, 2014).
2. Adoption of social responsibility by companies. Enterprises increasingly recognize CSR as a key to success, because it improves their corporate image and reputation.
3. The need of new funding sources for nonprofit organizations (the reduction of the public fund-ing and the growing number of NGOs increase the ‘competition’ in the nonprofit sector).
In Spain, CRM came in the nineties. Since then, it has experienced a rapid and intense growth to, virtually, all the sectors (Galán and Galera, 2014). Nowadays, its popularity is evident in the amount spent by companies on social causes showing yearly growth of 3.4%, and totaling to $1.84b in the USA in 2014 (IEG Sponsorship Report, 2014).
Throughout these years, the CRM definition has evolved (Galán, 2012): first, CRM was considered as a type of sales promotion; then, as an element of cor-porate philanthropy; and, nowadays, it is described as a CSR initiative. From Santesmases (1999), and Kotler and Lee (2005), we can define CRM as “a cSR initiative that is an agreement between a company
and an NGO to work on a social cause and thus ob-tain a mutual benefit. The commitment of the com-pany focuses on contributing (financially or in kind) to the cause in terms of sales or product use (there-fore, the donation will depend on consumer behav-ior)” - Galán et al. (2013a). Normally, the campaign is carried out for a certain product, for a particular period and for a specific NGO.
The most crucial aspect of the CRM definition (which is what most distinguishes this initiative, ac-cording to Kotler and Lee, 2005) is that the donation depends on sales (or use) of a certain product, the link between donation and product selling (transac-tion). That is, the levels of corporate contribution depend on consumer action (Penelas et al., 2012). Therefore, its main goal is to positively affect con-sumer attitudes and buying behavior (Fries et al, 2009).
The most common type of CRM is one in which a company donates a portion or percentage of every purchase made by its customers (transaction-based promotions) to an NGO. However, there are some variations on this, and not all CRM campaigns channel money to the nonprofit organization (they may be in-kind contributions: food, equipment, ser-vices, etc.) –Galán and Galera (2014).
The supported causes and / or NGOs are also var-ied: from fighting against different diseases (e.g. cancer), to supporting child welfare and education, combating hunger, or environmental protection.
The degree of CRM incorporation into business strategy has also evolved (Galán et al., 2013a): from applying it to usual products, to modify the product linked to the campaign to be socially responsible, and even changing the corporate culture so that the cause (support to cause) is integrated in it. The most common types of product links and contribution agreements are summarized in Table 2.
According to various studies, a number of conse-quences for the company are caused by changes in consumer behavior (Galán and Galera, 2014): when price and quality are equal, solidarity be-comes a decisive factor for individuals (purchases are increased); the testing of new products is also promoted, and the acceptance of existing ones is enhanced. In addition, consumer skepticism de-creases, because NGOs have great credibility (their link with the campaigns ‘calms’ to potential buyers, who could think that the company only seeks to ex-ploit a good cause to sell more, to achieve an image
TYPES EXAMPLES
According to the donation type
A specific amount of money for each product sold
A specific amount of product (good or service) for each application
A percentage of a product sales or transaction is donated to the NGO
A portion of an item sale will be donated to a charity (without spe-cifying the amount)
The company adjusts the consumer contributions relating to the pro-duct
According to the number of firm´s pro-ducts involved
A specific product
Some products
All the products
According to the duration of the cam-paign
A specific period of time (short-term program)
For an indefinite period (long-term program)
According to the chosen cause
Health
Childhood
Basic needs (e.g. combating hunger)
Environment
Other causes
According to the geographical scope of the cause
Local scope
Regional scope
National scope
International scope
Global scope
According to the number of NGOs involved
One NGO
Some NGOs
According to who pays the cost of the campaign
The company pays the cost
Both consumer and company pay the cost
Consumer pays the cost
Table 2 The most common types of product links and contribution agreements
UDK: 658.89(460) / Preliminary communication M. Mercedes Galán – Ladero, Clementina Galera – Casquet:The role of the retailers in cause-related marketing: A reference to the Spanish case
God. XXVIII, BR. 1/2015. str. 97-109 God. XXVIII, BR. 1/2015. str. 97-109
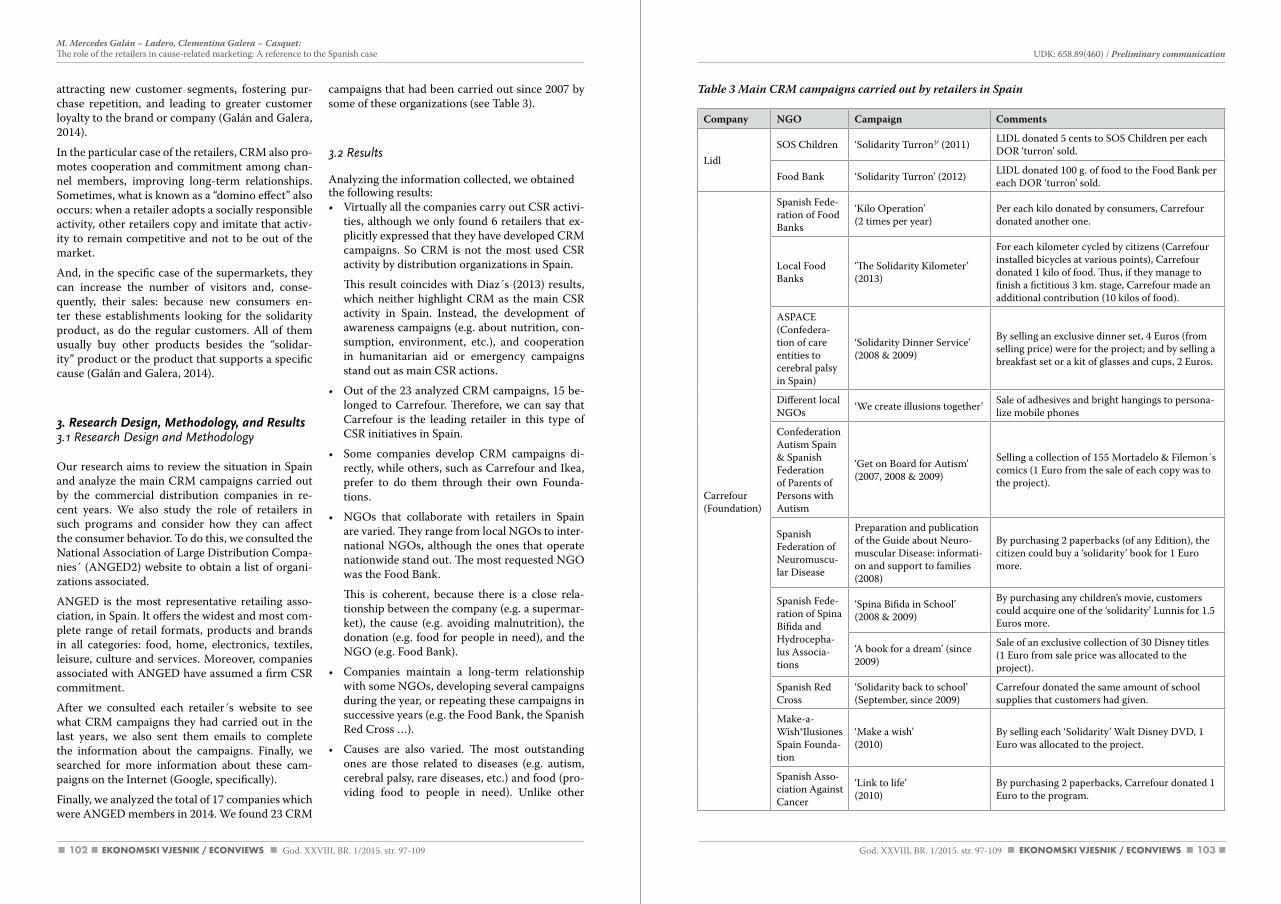
102 103
attracting new customer segments, fostering pur-chase repetition, and leading to greater customer loyalty to the brand or company (Galán and Galera, 2014).
In the particular case of the retailers, CRM also pro-motes cooperation and commitment among chan-nel members, improving long-term relationships. Sometimes, what is known as a “domino effect” also occurs: when a retailer adopts a socially responsible activity, other retailers copy and imitate that activ-ity to remain competitive and not to be out of the market.
And, in the specific case of the supermarkets, they can increase the number of visitors and, conse-quently, their sales: because new consumers en-ter these establishments looking for the solidarity product, as do the regular customers. All of them usually buy other products besides the “solidar-ity” product or the product that supports a specific cause (Galán and Galera, 2014).
3. Research Design, Methodology, and Results3.1 Research Design and Methodology
Our research aims to review the situation in Spain and analyze the main CRM campaigns carried out by the commercial distribution companies in re-cent years. We also study the role of retailers in such programs and consider how they can affect the consumer behavior. To do this, we consulted the National Association of Large Distribution Compa-nies´ (ANGED2) website to obtain a list of organi-zations associated.
ANGED is the most representative retailing asso-ciation, in Spain. It offers the widest and most com-plete range of retail formats, products and brands in all categories: food, home, electronics, textiles, leisure, culture and services. Moreover, companies associated with ANGED have assumed a firm CSR commitment.
After we consulted each retailer´s website to see what CRM campaigns they had carried out in the last years, we also sent them emails to complete the information about the campaigns. Finally, we searched for more information about these cam-paigns on the Internet (Google, specifically).
Finally, we analyzed the total of 17 companies which were ANGED members in 2014. We found 23 CRM
campaigns that had been carried out since 2007 by some of these organizations (see Table 3).
3.2 Results
Analyzing the information collected, we obtained the following results:• Virtually all the companies carry out CSR activi-
ties, although we only found 6 retailers that ex-plicitly expressed that they have developed CRM campaigns. So CRM is not the most used CSR activity by distribution organizations in Spain.
This result coincides with Diaz´s (2013) results, which neither highlight CRM as the main CSR activity in Spain. Instead, the development of awareness campaigns (e.g. about nutrition, con-sumption, environment, etc.), and cooperation in humanitarian aid or emergency campaigns stand out as main CSR actions.
• Out of the 23 analyzed CRM campaigns, 15 be-longed to Carrefour. Therefore, we can say that Carrefour is the leading retailer in this type of CSR initiatives in Spain.
• Some companies develop CRM campaigns di-rectly, while others, such as Carrefour and Ikea, prefer to do them through their own Founda-tions.
• NGOs that collaborate with retailers in Spain are varied. They range from local NGOs to inter-national NGOs, although the ones that operate nationwide stand out. The most requested NGO was the Food Bank.
This is coherent, because there is a close rela-tionship between the company (e.g. a supermar-ket), the cause (e.g. avoiding malnutrition), the donation (e.g. food for people in need), and the NGO (e.g. Food Bank).
• Companies maintain a long-term relationship with some NGOs, developing several campaigns during the year, or repeating these campaigns in successive years (e.g. the Food Bank, the Spanish Red Cross …).
• Causes are also varied. The most outstanding ones are those related to diseases (e.g. autism, cerebral palsy, rare diseases, etc.) and food (pro-viding food to people in need). Unlike other
Company NGO Campaign Comments
LidlSOS Children ‘Solidarity Turron3’ (2011) LIDL donated 5 cents to SOS Children per each
DOR ‘turron’ sold.
Food Bank ‘Solidarity Turron’ (2012) LIDL donated 100 g. of food to the Food Bank per each DOR ‘turron’ sold.
Carrefour (Foundation)
Spanish Fede-ration of Food Banks
‘Kilo Operation’(2 times per year)
Per each kilo donated by consumers, Carrefour donated another one.
Local Food Banks
‘The Solidarity Kilometer’ (2013)
For each kilometer cycled by citizens (Carrefour installed bicycles at various points), Carrefour donated 1 kilo of food. Thus, if they manage to finish a fictitious 3 km. stage, Carrefour made an additional contribution (10 kilos of food).
ASPACE (Confedera-tion of care entities to cerebral palsy in Spain)
‘Solidarity Dinner Service’(2008 & 2009)
By selling an exclusive dinner set, 4 Euros (from selling price) were for the project; and by selling a breakfast set or a kit of glasses and cups, 2 Euros.
Different local NGOs ‘We create illusions together’ Sale of adhesives and bright hangings to persona-
lize mobile phones
Confederation Autism Spain & Spanish Federation of Parents of Persons with Autism
‘Get on Board for Autism’(2007, 2008 & 2009)
Selling a collection of 155 Mortadelo & Filemon´s comics (1 Euro from the sale of each copy was to the project).
Spanish Federation of Neuromuscu-lar Disease
Preparation and publication of the Guide about Neuro-muscular Disease: informati-on and support to families(2008)
By purchasing 2 paperbacks (of any Edition), the citizen could buy a ‘solidarity’ book for 1 Euro more.
Spanish Fede-ration of Spina Bifida and Hydrocepha-lus Associa-tions
‘Spina Bifida in School’(2008 & 2009)
By purchasing any children’s movie, customers could acquire one of the ‘solidarity’ Lunnis for 1.5 Euros more.
‘A book for a dream’ (since 2009)
Sale of an exclusive collection of 30 Disney titles (1 Euro from sale price was allocated to the project).
Spanish Red Cross
‘Solidarity back to school’ (September, since 2009)
Carrefour donated the same amount of school supplies that customers had given.
Make-a-Wish®Ilusiones Spain Founda-tion
‘Make a wish’(2010)
By selling each ‘Solidarity’ Walt Disney DVD, 1 Euro was allocated to the project.
Spanish Asso-ciation Against Cancer
‘Link to life’(2010)
By purchasing 2 paperbacks, Carrefour donated 1 Euro to the program.
Table 3 Main CRM campaigns carried out by retailers in Spain
UDK: 658.89(460) / Preliminary communication M. Mercedes Galán – Ladero, Clementina Galera – Casquet:The role of the retailers in cause-related marketing: A reference to the Spanish case
God. XXVIII, BR. 1/2015. str. 97-109 God. XXVIII, BR. 1/2015. str. 97-109
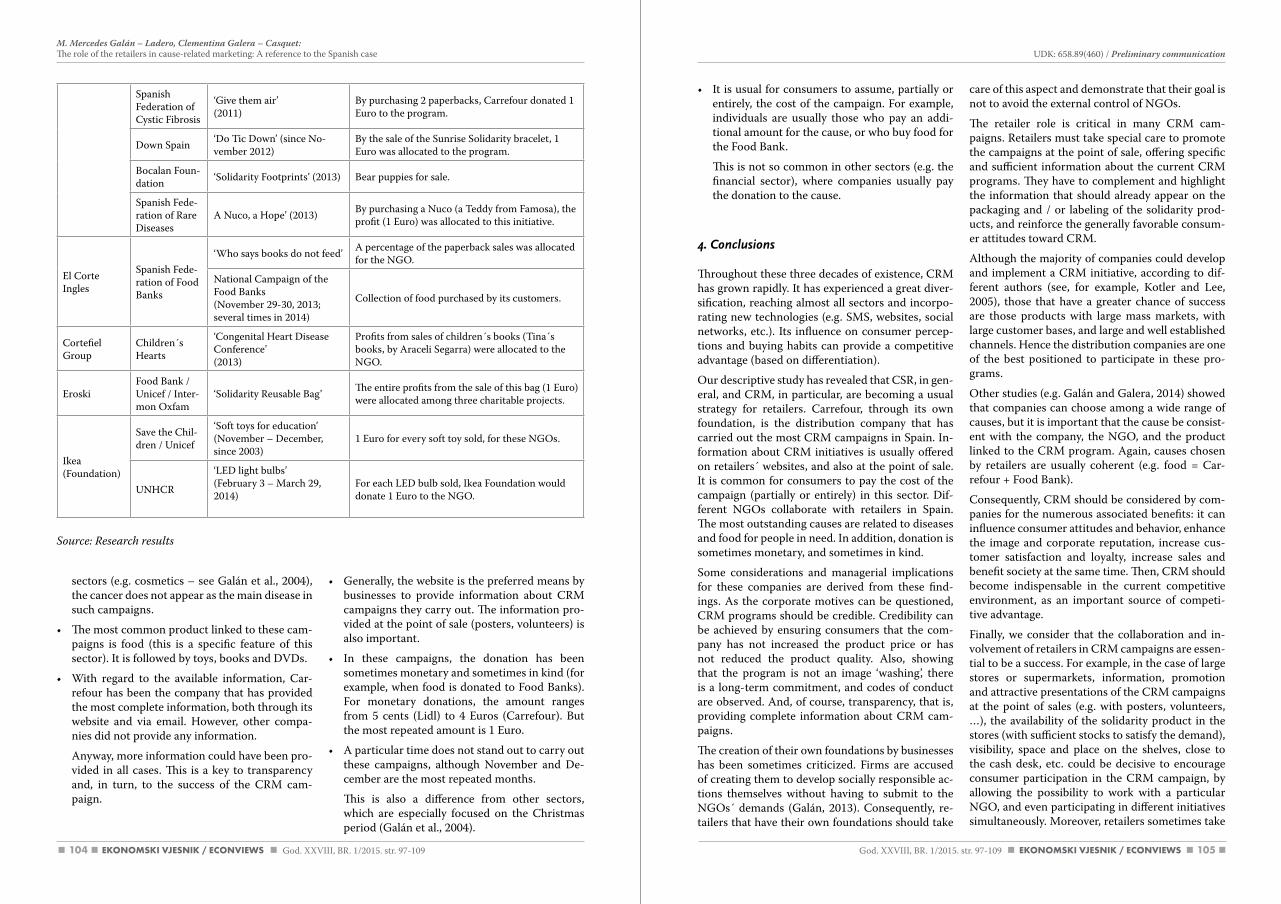
104 105
• It is usual for consumers to assume, partially or entirely, the cost of the campaign. For example, individuals are usually those who pay an addi-tional amount for the cause, or who buy food for the Food Bank.
This is not so common in other sectors (e.g. the financial sector), where companies usually pay the donation to the cause.
4. Conclusions
Throughout these three decades of existence, CRM has grown rapidly. It has experienced a great diver-sification, reaching almost all sectors and incorpo-rating new technologies (e.g. SMS, websites, social networks, etc.). Its influence on consumer percep-tions and buying habits can provide a competitive advantage (based on differentiation).
Our descriptive study has revealed that CSR, in gen-eral, and CRM, in particular, are becoming a usual strategy for retailers. Carrefour, through its own foundation, is the distribution company that has carried out the most CRM campaigns in Spain. In-formation about CRM initiatives is usually offered on retailers´ websites, and also at the point of sale. It is common for consumers to pay the cost of the campaign (partially or entirely) in this sector. Dif-ferent NGOs collaborate with retailers in Spain. The most outstanding causes are related to diseases and food for people in need. In addition, donation is sometimes monetary, and sometimes in kind.
Some considerations and managerial implications for these companies are derived from these find-ings. As the corporate motives can be questioned, CRM programs should be credible. Credibility can be achieved by ensuring consumers that the com-pany has not increased the product price or has not reduced the product quality. Also, showing that the program is not an image ‘washing’, there is a long-term commitment, and codes of conduct are observed. And, of course, transparency, that is, providing complete information about CRM cam-paigns.
The creation of their own foundations by businesses has been sometimes criticized. Firms are accused of creating them to develop socially responsible ac-tions themselves without having to submit to the NGOs´ demands (Galán, 2013). Consequently, re-tailers that have their own foundations should take
care of this aspect and demonstrate that their goal is not to avoid the external control of NGOs.
The retailer role is critical in many CRM cam-paigns. Retailers must take special care to promote the campaigns at the point of sale, offering specific and sufficient information about the current CRM programs. They have to complement and highlight the information that should already appear on the packaging and / or labeling of the solidarity prod-ucts, and reinforce the generally favorable consum-er attitudes toward CRM.
Although the majority of companies could develop and implement a CRM initiative, according to dif-ferent authors (see, for example, Kotler and Lee, 2005), those that have a greater chance of success are those products with large mass markets, with large customer bases, and large and well established channels. Hence the distribution companies are one of the best positioned to participate in these pro-grams.
Other studies (e.g. Galán and Galera, 2014) showed that companies can choose among a wide range of causes, but it is important that the cause be consist-ent with the company, the NGO, and the product linked to the CRM program. Again, causes chosen by retailers are usually coherent (e.g. food = Car-refour + Food Bank).
Consequently, CRM should be considered by com-panies for the numerous associated benefits: it can influence consumer attitudes and behavior, enhance the image and corporate reputation, increase cus-tomer satisfaction and loyalty, increase sales and benefit society at the same time. Then, CRM should become indispensable in the current competitive environment, as an important source of competi-tive advantage.
Finally, we consider that the collaboration and in-volvement of retailers in CRM campaigns are essen-tial to be a success. For example, in the case of large stores or supermarkets, information, promotion and attractive presentations of the CRM campaigns at the point of sales (e.g. with posters, volunteers, …), the availability of the solidarity product in the stores (with sufficient stocks to satisfy the demand), visibility, space and place on the shelves, close to the cash desk, etc. could be decisive to encourage consumer participation in the CRM campaign, by allowing the possibility to work with a particular NGO, and even participating in different initiatives simultaneously. Moreover, retailers sometimes take
Source: Research results
sectors (e.g. cosmetics – see Galán et al., 2004), the cancer does not appear as the main disease in such campaigns.
• The most common product linked to these cam-paigns is food (this is a specific feature of this sector). It is followed by toys, books and DVDs.
• With regard to the available information, Car-refour has been the company that has provided the most complete information, both through its website and via email. However, other compa-nies did not provide any information.
Anyway, more information could have been pro-vided in all cases. This is a key to transparency and, in turn, to the success of the CRM cam-paign.
• Generally, the website is the preferred means by businesses to provide information about CRM campaigns they carry out. The information pro-vided at the point of sale (posters, volunteers) is also important.
• In these campaigns, the donation has been sometimes monetary and sometimes in kind (for example, when food is donated to Food Banks). For monetary donations, the amount ranges from 5 cents (Lidl) to 4 Euros (Carrefour). But the most repeated amount is 1 Euro.
• A particular time does not stand out to carry out these campaigns, although November and De-cember are the most repeated months.
This is also a difference from other sectors, which are especially focused on the Christmas period (Galán et al., 2004).
Spanish Federation of Cystic Fibrosis
‘Give them air’(2011)
By purchasing 2 paperbacks, Carrefour donated 1 Euro to the program.
Down Spain ‘Do Tic Down’ (since No-vember 2012)
By the sale of the Sunrise Solidarity bracelet, 1 Euro was allocated to the program.
Bocalan Foun-dation ‘Solidarity Footprints’ (2013) Bear puppies for sale.
Spanish Fede-ration of Rare Diseases
A Nuco, a Hope’ (2013) By purchasing a Nuco (a Teddy from Famosa), the profit (1 Euro) was allocated to this initiative.
El Corte Ingles
Spanish Fede-ration of Food Banks
‘Who says books do not feed’ A percentage of the paperback sales was allocated for the NGO.
National Campaign of the Food Banks(November 29-30, 2013; several times in 2014)
Collection of food purchased by its customers.
Cortefiel Group
Children´s Hearts
‘Congenital Heart Disease Conference’(2013)
Profits from sales of children´s books (Tina´s books, by Araceli Segarra) were allocated to the NGO.
EroskiFood Bank / Unicef / Inter-mon Oxfam
‘Solidarity Reusable Bag’ The entire profits from the sale of this bag (1 Euro) were allocated among three charitable projects.
Ikea(Foundation)
Save the Chil-dren / Unicef
‘Soft toys for education’ (November – December, since 2003)
1 Euro for every soft toy sold, for these NGOs.
UNHCR
‘LED light bulbs’(February 3 – March 29, 2014)
For each LED bulb sold, Ikea Foundation would donate 1 Euro to the NGO.
UDK: 658.89(460) / Preliminary communication M. Mercedes Galán – Ladero, Clementina Galera – Casquet:The role of the retailers in cause-related marketing: A reference to the Spanish case
God. XXVIII, BR. 1/2015. str. 97-109 God. XXVIII, BR. 1/2015. str. 97-109
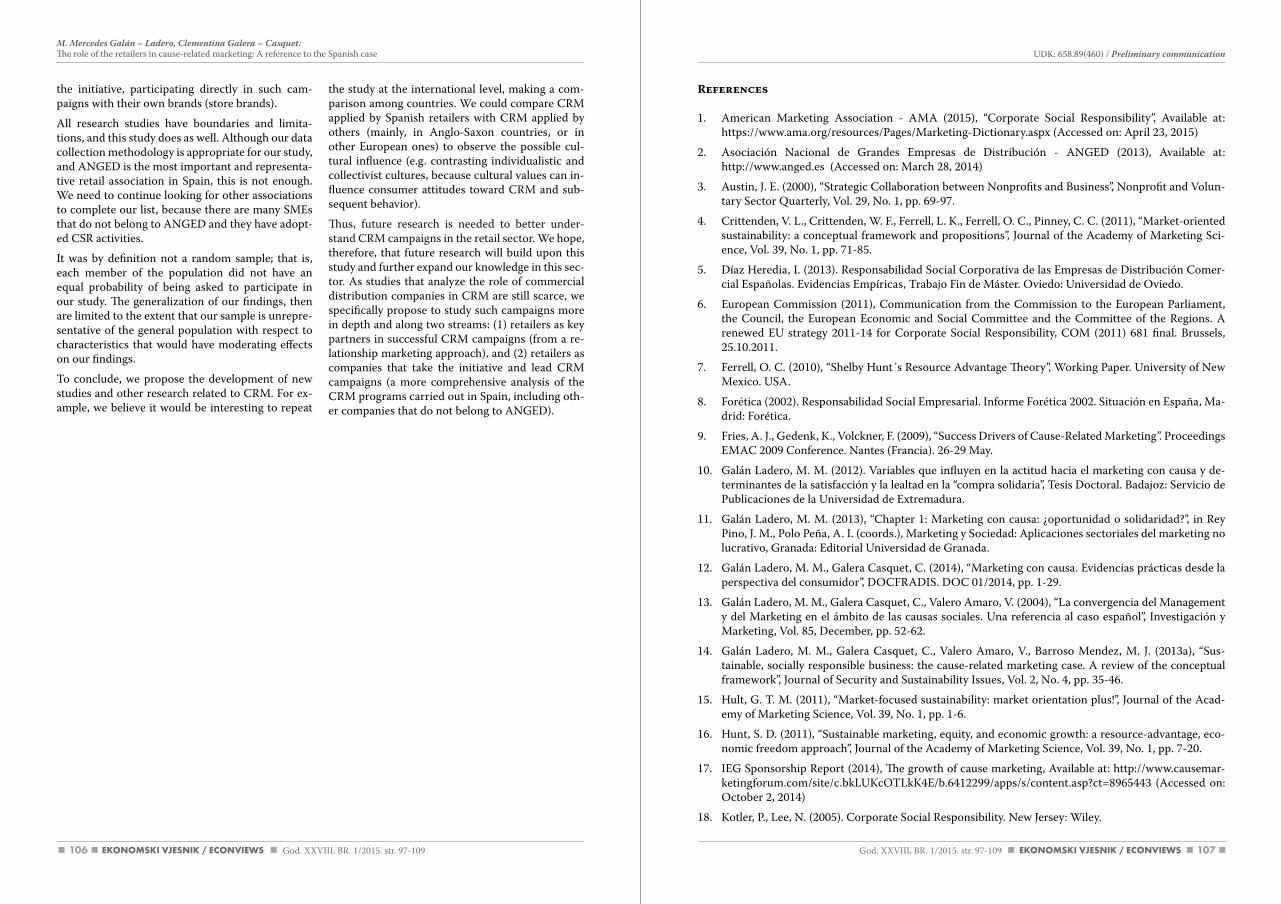
106 107
References
1. American Marketing Association - AMA (2015), “Corporate Social Responsibility”, Available at: https://www.ama.org/resources/Pages/Marketing-Dictionary.aspx (Accessed on: April 23, 2015)
2. Asociación Nacional de Grandes Empresas de Distribución - ANGED (2013), Available at: http://www.anged.es (Accessed on: March 28, 2014)
3. Austin, J. E. (2000), “Strategic Collaboration between Nonprofits and Business”, Nonprofit and Volun-tary Sector Quarterly, Vol. 29, No. 1, pp. 69-97.
4. Crittenden, V. L., Crittenden, W. F., Ferrell, L. K., Ferrell, O. C., Pinney, C. C. (2011), “Market-oriented sustainability: a conceptual framework and propositions”, Journal of the Academy of Marketing Sci-ence, Vol. 39, No. 1, pp. 71-85.
5. Díaz Heredia, I. (2013). Responsabilidad Social Corporativa de las Empresas de Distribución Comer-cial Españolas. Evidencias Empíricas, Trabajo Fin de Máster. Oviedo: Universidad de Oviedo.
6. European Commission (2011), Communication from the Commission to the European Parliament, the Council, the European Economic and Social Committee and the Committee of the Regions. A renewed EU strategy 2011-14 for Corporate Social Responsibility, COM (2011) 681 final. Brussels, 25.10.2011.
7. Ferrell, O. C. (2010), “Shelby Hunt´s Resource Advantage Theory”, Working Paper. University of New Mexico. USA.
8. Forética (2002). Responsabilidad Social Empresarial. Informe Forética 2002. Situación en España, Ma-drid: Forética.
9. Fries, A. J., Gedenk, K., Volckner, F. (2009), “Success Drivers of Cause-Related Marketing”. Proceedings EMAC 2009 Conference. Nantes (Francia). 26-29 May.
10. Galán Ladero, M. M. (2012). Variables que influyen en la actitud hacia el marketing con causa y de-terminantes de la satisfacción y la lealtad en la “compra solidaria”, Tesis Doctoral. Badajoz: Servicio de Publicaciones de la Universidad de Extremadura.
11. Galán Ladero, M. M. (2013), “Chapter 1: Marketing con causa: ¿oportunidad o solidaridad?”, in Rey Pino, J. M., Polo Peña, A. I. (coords.), Marketing y Sociedad: Aplicaciones sectoriales del marketing no lucrativo, Granada: Editorial Universidad de Granada.
12. Galán Ladero, M. M., Galera Casquet, C. (2014), “Marketing con causa. Evidencias prácticas desde la perspectiva del consumidor”, DOCFRADIS. DOC 01/2014, pp. 1-29.
13. Galán Ladero, M. M., Galera Casquet, C., Valero Amaro, V. (2004), “La convergencia del Management y del Marketing en el ámbito de las causas sociales. Una referencia al caso español”, Investigación y Marketing, Vol. 85, December, pp. 52-62.
14. Galán Ladero, M. M., Galera Casquet, C., Valero Amaro, V., Barroso Mendez, M. J. (2013a), “Sus-tainable, socially responsible business: the cause-related marketing case. A review of the conceptual framework”, Journal of Security and Sustainability Issues, Vol. 2, No. 4, pp. 35-46.
15. Hult, G. T. M. (2011), “Market-focused sustainability: market orientation plus!”, Journal of the Acad-emy of Marketing Science, Vol. 39, No. 1, pp. 1-6.
16. Hunt, S. D. (2011), “Sustainable marketing, equity, and economic growth: a resource-advantage, eco-nomic freedom approach”, Journal of the Academy of Marketing Science, Vol. 39, No. 1, pp. 7-20.
17. IEG Sponsorship Report (2014), The growth of cause marketing, Available at: http://www.causemar-ketingforum.com/site/c.bkLUKcOTLkK4E/b.6412299/apps/s/content.asp?ct=8965443 (Accessed on: October 2, 2014)
18. Kotler, P., Lee, N. (2005). Corporate Social Responsibility. New Jersey: Wiley.
the initiative, participating directly in such cam-paigns with their own brands (store brands).
All research studies have boundaries and limita-tions, and this study does as well. Although our data collection methodology is appropriate for our study, and ANGED is the most important and representa-tive retail association in Spain, this is not enough. We need to continue looking for other associations to complete our list, because there are many SMEs that do not belong to ANGED and they have adopt-ed CSR activities.
It was by definition not a random sample; that is, each member of the population did not have an equal probability of being asked to participate in our study. The generalization of our findings, then are limited to the extent that our sample is unrepre-sentative of the general population with respect to characteristics that would have moderating effects on our findings.
To conclude, we propose the development of new studies and other research related to CRM. For ex-ample, we believe it would be interesting to repeat
the study at the international level, making a com-parison among countries. We could compare CRM applied by Spanish retailers with CRM applied by others (mainly, in Anglo-Saxon countries, or in other European ones) to observe the possible cul-tural influence (e.g. contrasting individualistic and collectivist cultures, because cultural values can in-fluence consumer attitudes toward CRM and sub-sequent behavior).
Thus, future research is needed to better under-stand CRM campaigns in the retail sector. We hope, therefore, that future research will build upon this study and further expand our knowledge in this sec-tor. As studies that analyze the role of commercial distribution companies in CRM are still scarce, we specifically propose to study such campaigns more in depth and along two streams: (1) retailers as key partners in successful CRM campaigns (from a re-lationship marketing approach), and (2) retailers as companies that take the initiative and lead CRM campaigns (a more comprehensive analysis of the CRM programs carried out in Spain, including oth-er companies that do not belong to ANGED).
UDK: 658.89(460) / Preliminary communication M. Mercedes Galán – Ladero, Clementina Galera – Casquet:The role of the retailers in cause-related marketing: A reference to the Spanish case
God. XXVIII, BR. 1/2015. str. 97-109 God. XXVIII, BR. 1/2015. str. 97-109
108 109
M. Mercedes Galán – LaderoClementina Galera – Casquet
Uloga trgovaca na malo u marketingu opće dobrobiti: Osvrt na španjolski slučaj
Sažetak
Marketing opće dobrobiti (cause-related marketing - CRM) danas je jedna od najvažnijih inicijativa društveno odgovornoga poslovanja (corporate social responsibility - CSR). Njegova najvažnija karakteris-tika je to da je korporativna donacija uvjetovana prodajom, odnosno da CRM u konačnici ovisi o ponašanju potrošača.
U ovome radu usredotočit ćemo se na programe i primjenu CRM-a u određenoj gospodarskoj grani: sek-toru distribucije. Cilj nam je razumjeti temeljne značajke ili praksu tih programa u sektoru distribucije u Španjolskoj, istražiti ulogu trgovaca na malo i njihov mogući utjecaj na ponašanje potrošača kako bi poduzeća mogla unaprijediti te kampanje i poboljšati svoj uspjeh.
Rad je organiziran na sljedeći način. Na početku rada razmatra se konceptualni okvir CRM-a na kojemu se temelji teorijski dio ovoga rada. Potom se na osnovi popisa poduzeća udruženih u najreprezentativnije maloprodajno udruženje u Španjolskoj - Nacionalno udruženje velikih distribucijskih poduzeća (National Association of Large Distribution Companies - ANGED), promatramo situaciju u Španjolskoj i analiziramo glavne kampanje trgovaca tijekom posljednjih godina. Informacije su prikupljene s mrežnih stranica sva-koga od tih poduzeća, traženjem dodatnih objašnjenja putem e-pošte te pretraživanjem interneta. Nakon toga slijedi prezentacija i rasprava o glavnim rezultatima, sažetak najvažnijih zaključaka, kao i teorijska razmatranja i implikacije na upravljanje. Jedan od najvažnijih zaključaka ukazuje na utjecaj trgovaca na malo na ponašanje potrošača i njihovu ključnu ulogu u uspjehu programa CRM-a. Na kraju rada navode se moguća ograničenja istraživanja i ističe potreba za daljnjim istraživanjem.
Ključne riječi: marketing opće dobrobiti, trgovci na malo, ponašanje potrošača, društveno odgovorno poslovanje
19. Kotler, P., Keller, K. L., Cámara, D., Mollá, A. (2006). Dirección de Marketing, 12nd Edition. Madrid: Pearson Prentice Hall.
20. Martín, A. L. (2013), “Inauguración de la X Jornada ‘El sector de la distribución y responsabilidad so-cial corporativa’ ”, Forética, Madrid. 27th June.
21. Nielsen Global Research (2014), Doing well by doing good, Available at: http://www.nielsen.com/us/en/insights/reports/2014/doing-well-by-doing-good.html (Accessed on: October 2, 2014)
22. Núñez, G. (2014), “La Distribución en España perdió 388 establecimientos en 2013“, Available at: http://www.nielsen.com/es/es/insights/news/2014/la-distribucion-en-espana-perdio-388-establec-imientos-en-2013.html (Accessed on: April 23, 2015)
23. Penelas Leguía, A., Galera Casquet, C., Galán Ladero, M., Valero Amaro, V. (2012). Marketing Soli-dario. El marketing en las organizaciones no lucrativas. Madrid: Pirámide.
24. Santesmases Mestre, M. (1999). Marketing. Conceptos y Estrategias, 4th Edition. Madrid: Pirámide.
25. Vázquez Burguete, J. L. (2013), “La RSC de las Empresas de Distribución Comercial Españolas: ¿qué es, qué les pedimos y qué nos dan?”, Principales Conclusiones del Seminario sobre Marketing y Respon-sabilidad Social Corporativa: Reflexiones para empresas de Distribución Comercial. Seminario de la Cátedra Fundación Ramón Areces de Distribución Comercial (28th October, 2013), Available at: http://catedrafundacionarecesdc.uniovi.es (Accessed on: October 2, 2014)
(Endnotes)
1 In 1983, the American Express campaign to collaborate in the Statue of Liberty restoration (donating one cent for every transaction made with the credit card anywhere in the country, and one dollar for every new credit card issued) was the first to be called ‘cause-related marketing’. However, a year earlier, the company had already made a similar campaign to extend the use of the credit card, but only in San Francisco (the donations were made to various local arts organizations).
2 ANGED is the Spanish acronym.
3 ‘Turron’ is a typical Spanish Christmas sweet. DOR is a LIDL’s brand store.
UDK: 658.89(460) / Preliminary communication M. Mercedes Galán – Ladero, Clementina Galera – Casquet:The role of the retailers in cause-related marketing: A reference to the Spanish case
God. XXVIII, BR. 1/2015. str. 97-109 God. XXVIII, BR. 1/2015. str. 97-109
111God. XXVIII, BR. 1/2015. str. 111-127
Ilija Nedić: Break-even point in sugar-beet production
Abstract
World sugar consumption has been recording a steady growth in the past 70 years and, according to all relevant estimates, it will continue to grow also in the next decade, which puts sugar in the category of the most significant foods and commodities in the world.
Of the total world sugar production, around 77% is derived from sugar cane and 23% from sugar beet. Brazil has been the world leader in sugar production for a long period of time, producing white sugar from sugar cane only, whereas the leader in the production of sugar derived from sugar beet is the EU-28.
When the Republic of Croatia joined the EU, the Croatian sugar industry became part of the single Euro-pean sugar market, so the break-even point was used in the research to determine the competitiveness level of the Croatian sugar beet production.
Based on the expected selling price of sugar beet amounting to EUR 34 per ton of standard quality sugar beet, and using the break-even method, it was determined that the quantity required to cover total costs in sugar beet production in the Republic of Croatia amounts to 55.26 tons per hectare of payable sugar beet, standard quality, i.e. 8.84 tons of polarized sugar per hectare. As the average sugar beet production in the Republic of Croatia, expressed in the equivalent of polarized sugar, amounts to 7.8 tons per hectare, it is obvious that an average Croatian producer of sugar beet, without income from subsidies, operates at a loss.
Keywords: Break-even point, sugar, beet, cane
UDK: 657.4:664.1(497.5)Preliminary communication
Received: February 25, 2015accepted for publishing: May 20, 2015
Ilija NedićTena d.o.o. OsijekM. a. Reljkovića 7,31000 Osijek, [email protected]: +38598372005
BREAK-EVEN POINT IN SUGAR-BEET PRODUCTION
1. Introduction
The irrefutable truth is that in the modern world there is no developed society or developed economy without a developed agriculture. Therefore, it may well be concluded that the situation in agriculture is the best indicator of the overall situation in a socie-ty, particularly its abilities to efficiently utilise avail-able resources and competitive advantages.
By observing Croatian agriculture and key indica-tors of production, import, export, and the develop-
ment level of rural areas, unfortunately, a conclu-sion can be drawn that in the past twenty years the Republic of Croatia was unable to provide even the basic prerequisites (for example, formulating the agricultural strategy, establishing long-term land policy, irrigation, zoning, financing scheme, etc.) to use available resources. Despite huge resources invested in agricultural subsidies and preferential trade status with the European Union in the period 2005-2013, today we have mostly unorganised, non-competitive production and devastated rural areas. Such a situation in agriculture, of course, cannot
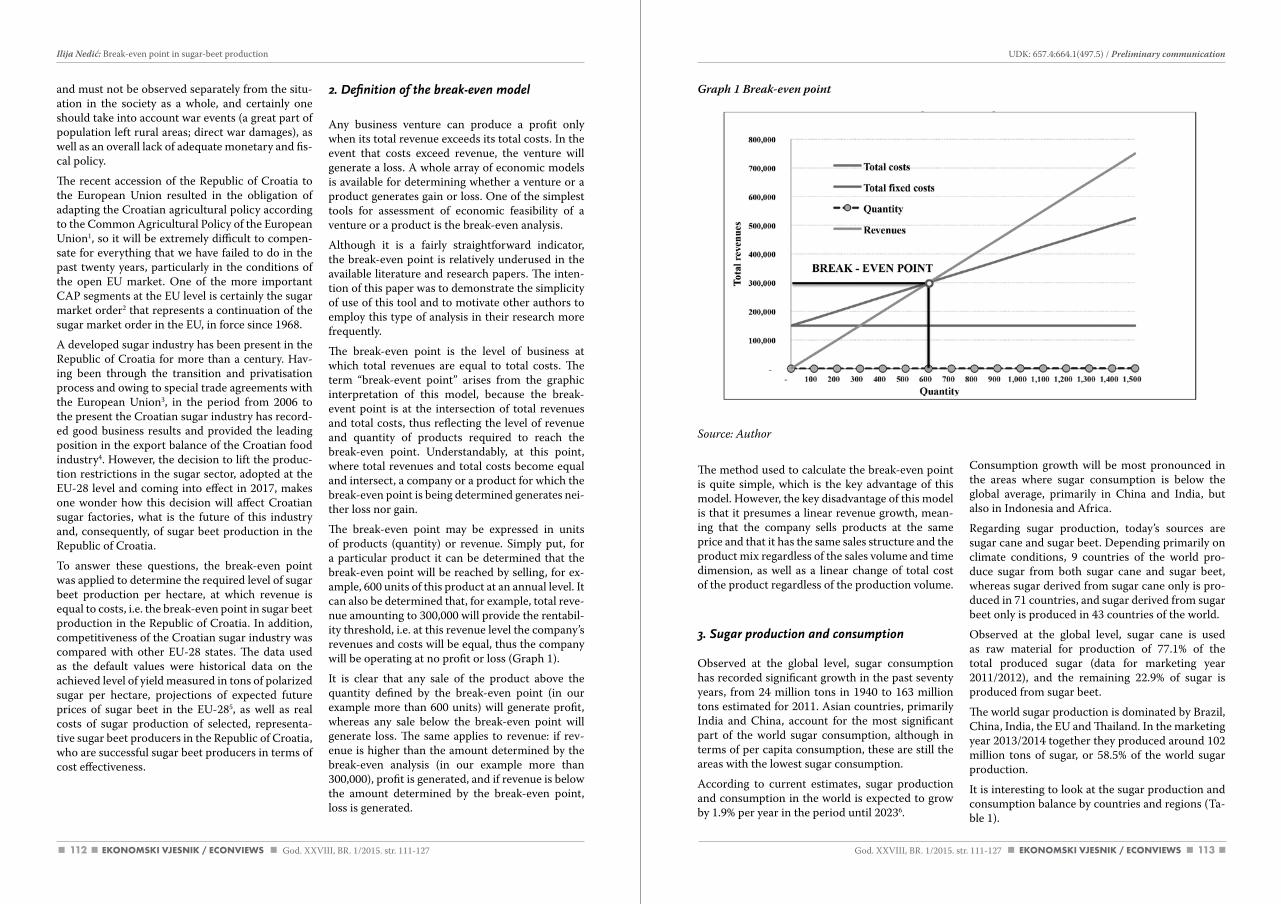
112 113God. XXVIII, BR. 1/2015. str. 111-127 God. XXVIII, BR. 1/2015. str. 111-127
UDK: 657.4:664.1(497.5) / Preliminary communication Ilija Nedić: Break-even point in sugar-beet production
Graph 1 Break-even point
Source: author
The method used to calculate the break-even point is quite simple, which is the key advantage of this model. However, the key disadvantage of this model is that it presumes a linear revenue growth, mean-ing that the company sells products at the same price and that it has the same sales structure and the product mix regardless of the sales volume and time dimension, as well as a linear change of total cost of the product regardless of the production volume.
3. Sugar production and consumption
Observed at the global level, sugar consumption has recorded significant growth in the past seventy years, from 24 million tons in 1940 to 163 million tons estimated for 2011. Asian countries, primarily India and China, account for the most significant part of the world sugar consumption, although in terms of per capita consumption, these are still the areas with the lowest sugar consumption.
According to current estimates, sugar production and consumption in the world is expected to grow by 1.9% per year in the period until 20236.
Consumption growth will be most pronounced in the areas where sugar consumption is below the global average, primarily in China and India, but also in Indonesia and Africa.
Regarding sugar production, today’s sources are sugar cane and sugar beet. Depending primarily on climate conditions, 9 countries of the world pro-duce sugar from both sugar cane and sugar beet, whereas sugar derived from sugar cane only is pro-duced in 71 countries, and sugar derived from sugar beet only is produced in 43 countries of the world.
Observed at the global level, sugar cane is used as raw material for production of 77.1% of the total produced sugar (data for marketing year 2011/2012), and the remaining 22.9% of sugar is produced from sugar beet.
The world sugar production is dominated by Brazil, China, India, the EU and Thailand. In the marketing year 2013/2014 together they produced around 102 million tons of sugar, or 58.5% of the world sugar production.
It is interesting to look at the sugar production and consumption balance by countries and regions (Ta-ble 1).
and must not be observed separately from the situ-ation in the society as a whole, and certainly one should take into account war events (a great part of population left rural areas; direct war damages), as well as an overall lack of adequate monetary and fis-cal policy.
The recent accession of the Republic of Croatia to the European Union resulted in the obligation of adapting the Croatian agricultural policy according to the Common Agricultural Policy of the European Union1, so it will be extremely difficult to compen-sate for everything that we have failed to do in the past twenty years, particularly in the conditions of the open EU market. One of the more important CAP segments at the EU level is certainly the sugar market order2 that represents a continuation of the sugar market order in the EU, in force since 1968.
A developed sugar industry has been present in the Republic of Croatia for more than a century. Hav-ing been through the transition and privatisation process and owing to special trade agreements with the European Union3, in the period from 2006 to the present the Croatian sugar industry has record-ed good business results and provided the leading position in the export balance of the Croatian food industry4. However, the decision to lift the produc-tion restrictions in the sugar sector, adopted at the EU-28 level and coming into effect in 2017, makes one wonder how this decision will affect Croatian sugar factories, what is the future of this industry and, consequently, of sugar beet production in the Republic of Croatia.
To answer these questions, the break-even point was applied to determine the required level of sugar beet production per hectare, at which revenue is equal to costs, i.e. the break-even point in sugar beet production in the Republic of Croatia. In addition, competitiveness of the Croatian sugar industry was compared with other EU-28 states. The data used as the default values were historical data on the achieved level of yield measured in tons of polarized sugar per hectare, projections of expected future prices of sugar beet in the EU-285, as well as real costs of sugar production of selected, representa-tive sugar beet producers in the Republic of Croatia, who are successful sugar beet producers in terms of cost effectiveness.
2. Definition of the break-even model
Any business venture can produce a profit only when its total revenue exceeds its total costs. In the event that costs exceed revenue, the venture will generate a loss. A whole array of economic models is available for determining whether a venture or a product generates gain or loss. One of the simplest tools for assessment of economic feasibility of a venture or a product is the break-even analysis.
Although it is a fairly straightforward indicator, the break-even point is relatively underused in the available literature and research papers. The inten-tion of this paper was to demonstrate the simplicity of use of this tool and to motivate other authors to employ this type of analysis in their research more frequently.
The break-even point is the level of business at which total revenues are equal to total costs. The term “break-event point” arises from the graphic interpretation of this model, because the break-event point is at the intersection of total revenues and total costs, thus reflecting the level of revenue and quantity of products required to reach the break-even point. Understandably, at this point, where total revenues and total costs become equal and intersect, a company or a product for which the break-even point is being determined generates nei-ther loss nor gain.
The break-even point may be expressed in units of products (quantity) or revenue. Simply put, for a particular product it can be determined that the break-even point will be reached by selling, for ex-ample, 600 units of this product at an annual level. It can also be determined that, for example, total reve-nue amounting to 300,000 will provide the rentabil-ity threshold, i.e. at this revenue level the company’s revenues and costs will be equal, thus the company will be operating at no profit or loss (Graph 1).
It is clear that any sale of the product above the quantity defined by the break-even point (in our example more than 600 units) will generate profit, whereas any sale below the break-even point will generate loss. The same applies to revenue: if rev-enue is higher than the amount determined by the break-even analysis (in our example more than 300,000), profit is generated, and if revenue is below the amount determined by the break-even point, loss is generated.
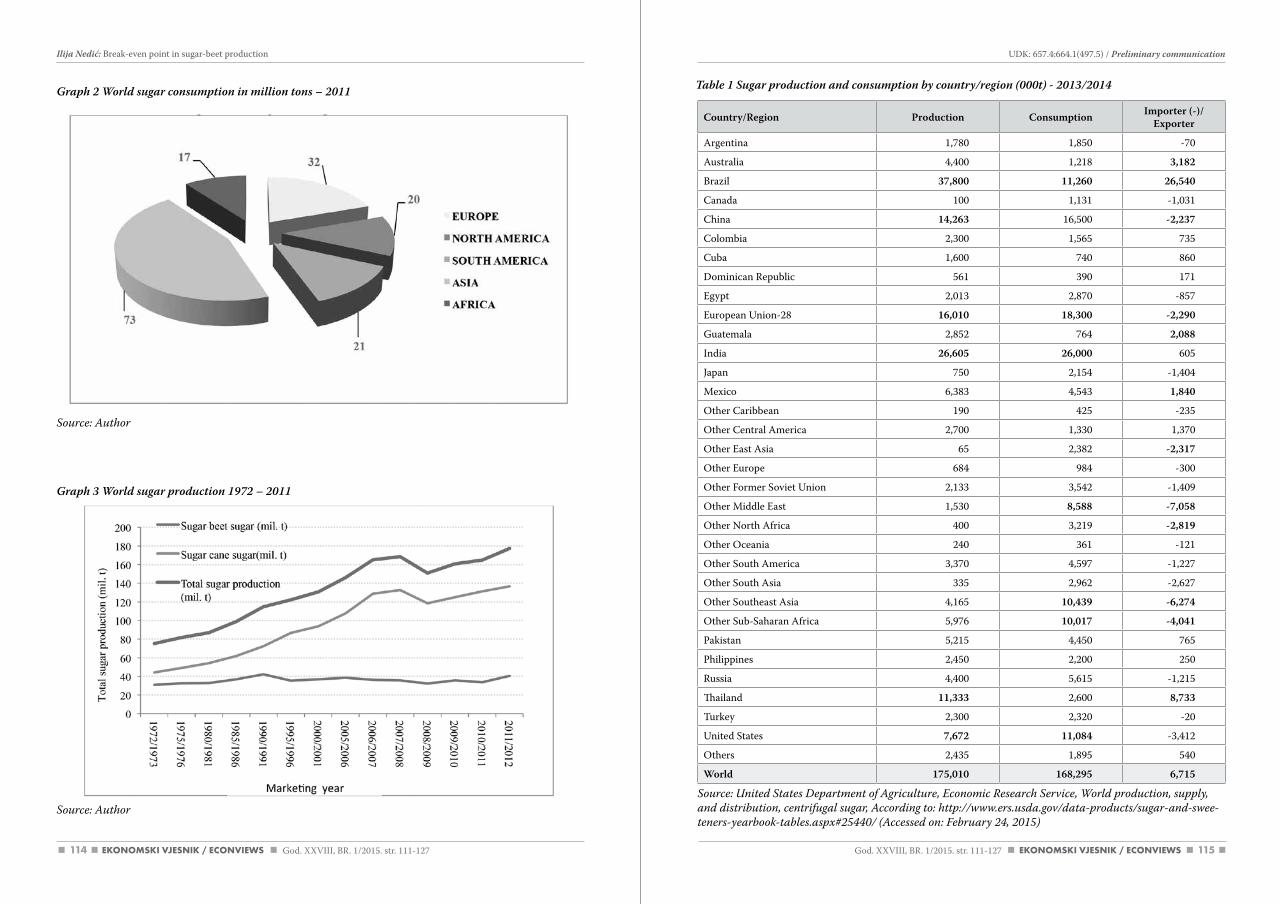
114 115
Source: United States department of agriculture, Economic Research Service, World production, supply, and distribution, centrifugal sugar, according to: http://www.ers.usda.gov/data-products/sugar-and-swee-teners-yearbook-tables.aspx#25440/ (accessed on: February 24, 2015)
Source: author
Source: author
Graph 2 World sugar consumption in million tons – 2011 Table 1 Sugar production and consumption by country/region (000t) - 2013/2014
Graph 3 World sugar production 1972 – 2011
Country/Region Production Consumption Importer (-)/ Exporter
Argentina 1,780 1,850 -70
Australia 4,400 1,218 3,182
Brazil 37,800 11,260 26,540
Canada 100 1,131 -1,031
China 14,263 16,500 -2,237
Colombia 2,300 1,565 735
Cuba 1,600 740 860
Dominican Republic 561 390 171
Egypt 2,013 2,870 -857
European Union-28 16,010 18,300 -2,290
Guatemala 2,852 764 2,088
India 26,605 26,000 605
Japan 750 2,154 -1,404
Mexico 6,383 4,543 1,840
Other Caribbean 190 425 -235
Other Central America 2,700 1,330 1,370
Other East Asia 65 2,382 -2,317
Other Europe 684 984 -300
Other Former Soviet Union 2,133 3,542 -1,409
Other Middle East 1,530 8,588 -7,058
Other North Africa 400 3,219 -2,819
Other Oceania 240 361 -121
Other South America 3,370 4,597 -1,227
Other South Asia 335 2,962 -2,627
Other Southeast Asia 4,165 10,439 -6,274
Other Sub-Saharan Africa 5,976 10,017 -4,041
Pakistan 5,215 4,450 765
Philippines 2,450 2,200 250
Russia 4,400 5,615 -1,215
Thailand 11,333 2,600 8,733
Turkey 2,300 2,320 -20
United States 7,672 11,084 -3,412
Others 2,435 1,895 540
World 175,010 168,295 6,715
God. XXVIII, BR. 1/2015. str. 111-127 God. XXVIII, BR. 1/2015. str. 111-127
UDK: 657.4:664.1(497.5) / Preliminary communication Ilija Nedić: Break-even point in sugar-beet production
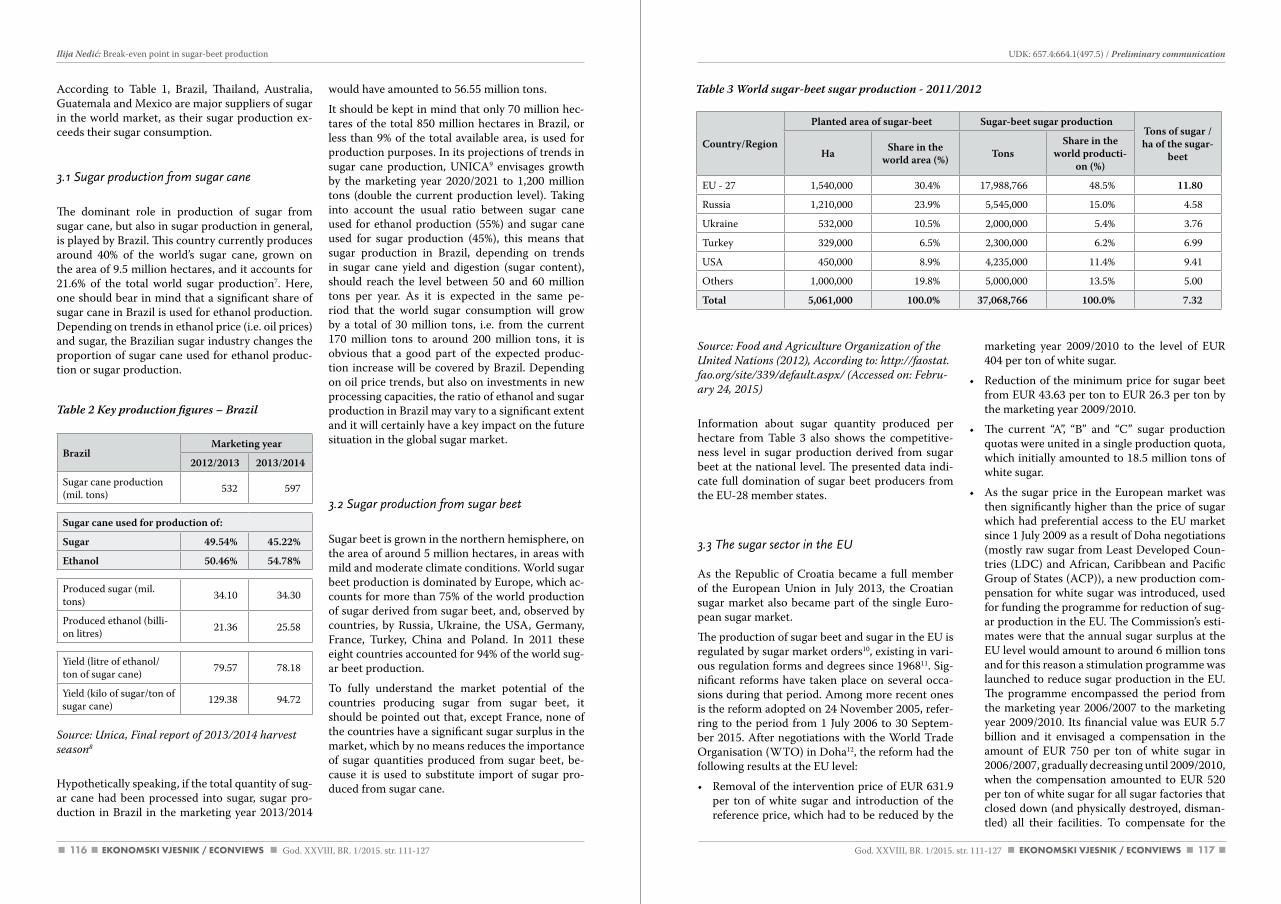
116 117
Source: Food and agriculture Organization of the United Nations (2012), according to: http://faostat.fao.org/site/339/default.aspx/ (accessed on: Febru-ary 24, 2015)
Information about sugar quantity produced per hectare from Table 3 also shows the competitive-ness level in sugar production derived from sugar beet at the national level. The presented data indi-cate full domination of sugar beet producers from the EU-28 member states.
3.3 The sugar sector in the EU
As the Republic of Croatia became a full member of the European Union in July 2013, the Croatian sugar market also became part of the single Euro-pean sugar market.
The production of sugar beet and sugar in the EU is regulated by sugar market orders10, existing in vari-ous regulation forms and degrees since 196811. Sig-nificant reforms have taken place on several occa-sions during that period. Among more recent ones is the reform adopted on 24 November 2005, refer-ring to the period from 1 July 2006 to 30 Septem-ber 2015. After negotiations with the World Trade Organisation (WTO) in Doha12, the reform had the following results at the EU level:
• Removal of the intervention price of EUR 631.9 per ton of white sugar and introduction of the reference price, which had to be reduced by the
marketing year 2009/2010 to the level of EUR 404 per ton of white sugar.
• Reduction of the minimum price for sugar beet from EUR 43.63 per ton to EUR 26.3 per ton by the marketing year 2009/2010.
• The current “A”, “B” and “C” sugar production quotas were united in a single production quota, which initially amounted to 18.5 million tons of white sugar.
• As the sugar price in the European market was then significantly higher than the price of sugar which had preferential access to the EU market since 1 July 2009 as a result of Doha negotiations (mostly raw sugar from Least Developed Coun-tries (LDC) and African, Caribbean and Pacific Group of States (ACP)), a new production com-pensation for white sugar was introduced, used for funding the programme for reduction of sug-ar production in the EU. The Commission’s esti-mates were that the annual sugar surplus at the EU level would amount to around 6 million tons and for this reason a stimulation programme was launched to reduce sugar production in the EU. The programme encompassed the period from the marketing year 2006/2007 to the marketing year 2009/2010. Its financial value was EUR 5.7 billion and it envisaged a compensation in the amount of EUR 750 per ton of white sugar in 2006/2007, gradually decreasing until 2009/2010, when the compensation amounted to EUR 520 per ton of white sugar for all sugar factories that closed down (and physically destroyed, disman-tled) all their facilities. To compensate for the
According to Table 1, Brazil, Thailand, Australia, Guatemala and Mexico are major suppliers of sugar in the world market, as their sugar production ex-ceeds their sugar consumption.
3.1 Sugar production from sugar cane
The dominant role in production of sugar from sugar cane, but also in sugar production in general, is played by Brazil. This country currently produces around 40% of the world’s sugar cane, grown on the area of 9.5 million hectares, and it accounts for 21.6% of the total world sugar production7. Here, one should bear in mind that a significant share of sugar cane in Brazil is used for ethanol production. Depending on trends in ethanol price (i.e. oil prices) and sugar, the Brazilian sugar industry changes the proportion of sugar cane used for ethanol produc-tion or sugar production.
Table 2 Key production figures – Brazil
BrazilMarketing year
2012/2013 2013/2014
Sugar cane production (mil. tons) 532 597
Sugar cane used for production of:
Sugar 49.54% 45.22%
Ethanol 50.46% 54.78%
Produced sugar (mil. tons) 34.10 34.30
Produced ethanol (billi-on litres) 21.36 25.58
Yield (litre of ethanol/ ton of sugar cane) 79.57 78.18
Yield (kilo of sugar/ton of sugar cane) 129.38 94.72
Source: Unica, Final report of 2013/2014 harvest season8
Hypothetically speaking, if the total quantity of sug-ar cane had been processed into sugar, sugar pro-duction in Brazil in the marketing year 2013/2014
would have amounted to 56.55 million tons.
It should be kept in mind that only 70 million hec-tares of the total 850 million hectares in Brazil, or less than 9% of the total available area, is used for production purposes. In its projections of trends in sugar cane production, UNICA9 envisages growth by the marketing year 2020/2021 to 1,200 million tons (double the current production level). Taking into account the usual ratio between sugar cane used for ethanol production (55%) and sugar cane used for sugar production (45%), this means that sugar production in Brazil, depending on trends in sugar cane yield and digestion (sugar content), should reach the level between 50 and 60 million tons per year. As it is expected in the same pe-riod that the world sugar consumption will grow by a total of 30 million tons, i.e. from the current 170 million tons to around 200 million tons, it is obvious that a good part of the expected produc-tion increase will be covered by Brazil. Depending on oil price trends, but also on investments in new processing capacities, the ratio of ethanol and sugar production in Brazil may vary to a significant extent and it will certainly have a key impact on the future situation in the global sugar market.
3.2 Sugar production from sugar beet
Sugar beet is grown in the northern hemisphere, on the area of around 5 million hectares, in areas with mild and moderate climate conditions. World sugar beet production is dominated by Europe, which ac-counts for more than 75% of the world production of sugar derived from sugar beet, and, observed by countries, by Russia, Ukraine, the USA, Germany, France, Turkey, China and Poland. In 2011 these eight countries accounted for 94% of the world sug-ar beet production.
To fully understand the market potential of the countries producing sugar from sugar beet, it should be pointed out that, except France, none of the countries have a significant sugar surplus in the market, which by no means reduces the importance of sugar quantities produced from sugar beet, be-cause it is used to substitute import of sugar pro-duced from sugar cane.
Country/Region
Planted area of sugar-beet Sugar-beet sugar productionTons of sugar / ha of the sugar-
beetHa Share in the world area (%) Tons
Share in the world producti-
on (%)
EU - 27 1,540,000 30.4% 17,988,766 48.5% 11.80
Russia 1,210,000 23.9% 5,545,000 15.0% 4.58
Ukraine 532,000 10.5% 2,000,000 5.4% 3.76
Turkey 329,000 6.5% 2,300,000 6.2% 6.99
USA 450,000 8.9% 4,235,000 11.4% 9.41
Others 1,000,000 19.8% 5,000,000 13.5% 5.00
Total 5,061,000 100.0% 37,068,766 100.0% 7.32
Table 3 World sugar-beet sugar production - 2011/2012
God. XXVIII, BR. 1/2015. str. 111-127 God. XXVIII, BR. 1/2015. str. 111-127
UDK: 657.4:664.1(497.5) / Preliminary communication Ilija Nedić: Break-even point in sugar-beet production
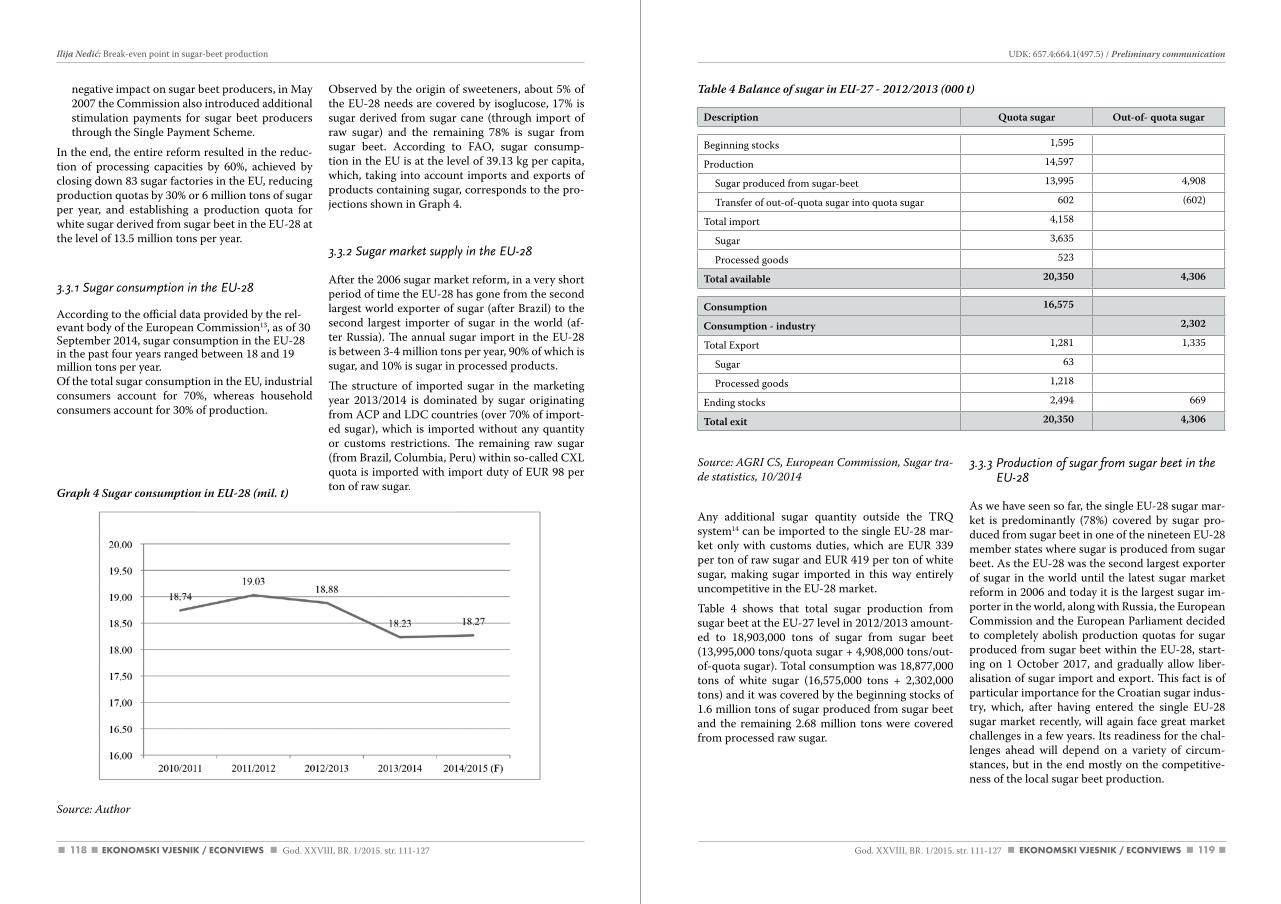
118 119
Source: aGRI c5, European commission, Sugar tra-de statistics, 10/2014
Any additional sugar quantity outside the TRQ system14 can be imported to the single EU-28 mar-ket only with customs duties, which are EUR 339 per ton of raw sugar and EUR 419 per ton of white sugar, making sugar imported in this way entirely uncompetitive in the EU-28 market.
Table 4 shows that total sugar production from sugar beet at the EU-27 level in 2012/2013 amount-ed to 18,903,000 tons of sugar from sugar beet (13,995,000 tons/quota sugar + 4,908,000 tons/out-of-quota sugar). Total consumption was 18,877,000 tons of white sugar (16,575,000 tons + 2,302,000 tons) and it was covered by the beginning stocks of 1.6 million tons of sugar produced from sugar beet and the remaining 2.68 million tons were covered from processed raw sugar.
3.3.3 Production of sugar from sugar beet in the EU-28
As we have seen so far, the single EU-28 sugar mar-ket is predominantly (78%) covered by sugar pro-duced from sugar beet in one of the nineteen EU-28 member states where sugar is produced from sugar beet. As the EU-28 was the second largest exporter of sugar in the world until the latest sugar market reform in 2006 and today it is the largest sugar im-porter in the world, along with Russia, the European Commission and the European Parliament decided to completely abolish production quotas for sugar produced from sugar beet within the EU-28, start-ing on 1 October 2017, and gradually allow liber-alisation of sugar import and export. This fact is of particular importance for the Croatian sugar indus-try, which, after having entered the single EU-28 sugar market recently, will again face great market challenges in a few years. Its readiness for the chal-lenges ahead will depend on a variety of circum-stances, but in the end mostly on the competitive-ness of the local sugar beet production.
negative impact on sugar beet producers, in May 2007 the Commission also introduced additional stimulation payments for sugar beet producers through the Single Payment Scheme.
In the end, the entire reform resulted in the reduc-tion of processing capacities by 60%, achieved by closing down 83 sugar factories in the EU, reducing production quotas by 30% or 6 million tons of sugar per year, and establishing a production quota for white sugar derived from sugar beet in the EU-28 at the level of 13.5 million tons per year.
3.3.1 Sugar consumption in the EU-28
According to the official data provided by the rel-evant body of the European Commission13, as of 30 September 2014, sugar consumption in the EU-28 in the past four years ranged between 18 and 19 million tons per year.Of the total sugar consumption in the EU, industrial consumers account for 70%, whereas household consumers account for 30% of production.
Graph 4 Sugar consumption in EU-28 (mil. t)
Source: author
Observed by the origin of sweeteners, about 5% of the EU-28 needs are covered by isoglucose, 17% is sugar derived from sugar cane (through import of raw sugar) and the remaining 78% is sugar from sugar beet. According to FAO, sugar consump-tion in the EU is at the level of 39.13 kg per capita, which, taking into account imports and exports of products containing sugar, corresponds to the pro-jections shown in Graph 4.
3.3.2 Sugar market supply in the EU-28
After the 2006 sugar market reform, in a very short period of time the EU-28 has gone from the second largest world exporter of sugar (after Brazil) to the second largest importer of sugar in the world (af-ter Russia). The annual sugar import in the EU-28 is between 3-4 million tons per year, 90% of which is sugar, and 10% is sugar in processed products.
The structure of imported sugar in the marketing year 2013/2014 is dominated by sugar originating from ACP and LDC countries (over 70% of import-ed sugar), which is imported without any quantity or customs restrictions. The remaining raw sugar (from Brazil, Columbia, Peru) within so-called CXL quota is imported with import duty of EUR 98 per ton of raw sugar.
Description Quota sugar Out-of- quota sugar
Beginning stocks 1,595
Production 14,597
Sugar produced from sugar-beet 13,995 4,908
Transfer of out-of-quota sugar into quota sugar 602 (602)
Total import 4,158
Sugar 3,635
Processed goods 523
Total available 20,350 4,306
Consumption 16,575
Consumption - industry 2,302
Total Export 1,281 1,335
Sugar 63
Processed goods 1,218
Ending stocks 2,494 669
Total exit 20,350 4,306
Table 4 Balance of sugar in EU-27 - 2012/2013 (000 t)
God. XXVIII, BR. 1/2015. str. 111-127 God. XXVIII, BR. 1/2015. str. 111-127
UDK: 657.4:664.1(497.5) / Preliminary communication Ilija Nedić: Break-even point in sugar-beet production
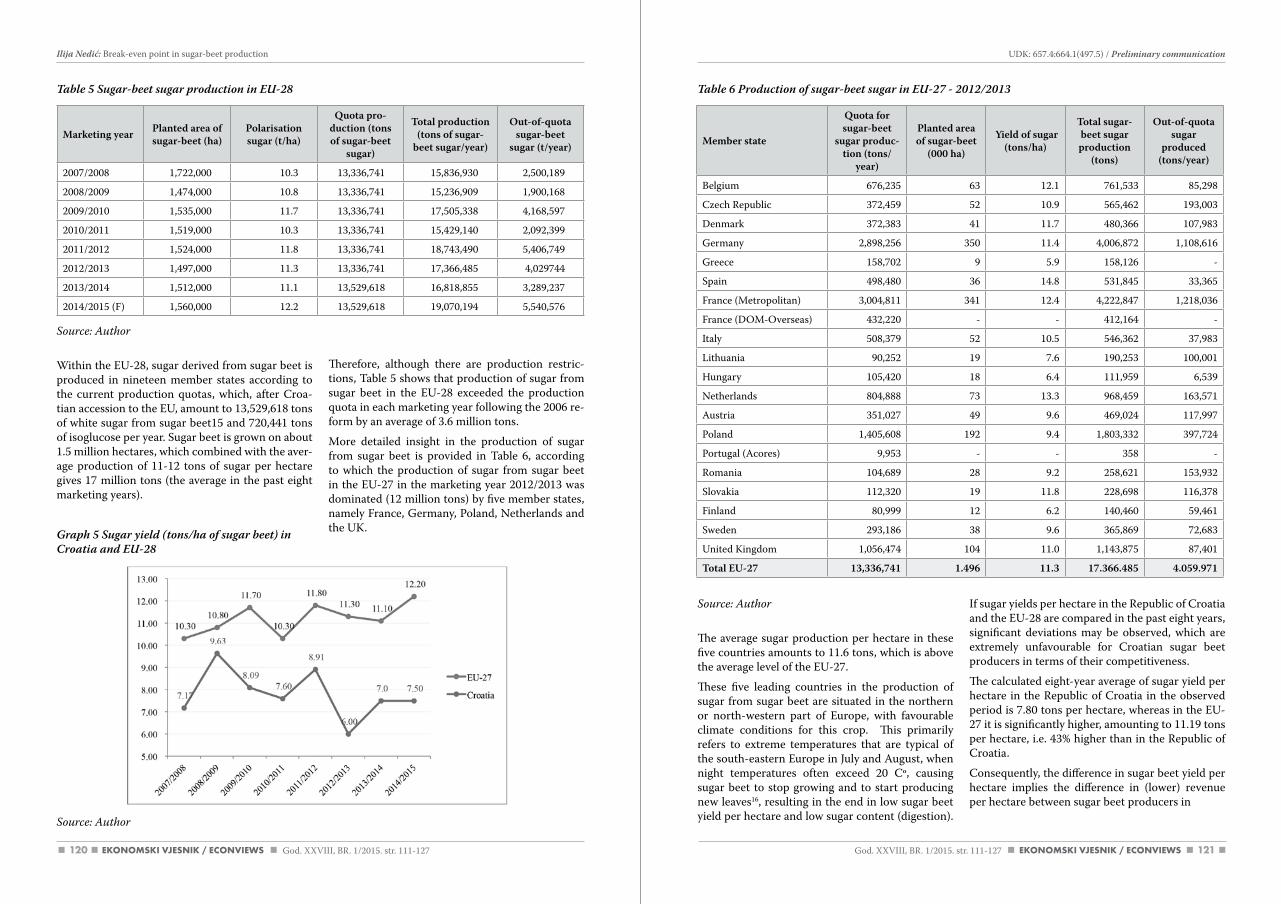
120 121
Source: author
The average sugar production per hectare in these five countries amounts to 11.6 tons, which is above the average level of the EU-27.
These five leading countries in the production of sugar from sugar beet are situated in the northern or north-western part of Europe, with favourable climate conditions for this crop. This primarily refers to extreme temperatures that are typical of the south-eastern Europe in July and August, when night temperatures often exceed 20 Cº, causing sugar beet to stop growing and to start producing new leaves16, resulting in the end in low sugar beet yield per hectare and low sugar content (digestion).
If sugar yields per hectare in the Republic of Croatia and the EU-28 are compared in the past eight years, significant deviations may be observed, which are extremely unfavourable for Croatian sugar beet producers in terms of their competitiveness.
The calculated eight-year average of sugar yield per hectare in the Republic of Croatia in the observed period is 7.80 tons per hectare, whereas in the EU-27 it is significantly higher, amounting to 11.19 tons per hectare, i.e. 43% higher than in the Republic of Croatia.
Consequently, the difference in sugar beet yield per hectare implies the difference in (lower) revenue per hectare between sugar beet producers in
Source: author
Within the EU-28, sugar derived from sugar beet is produced in nineteen member states according to the current production quotas, which, after Croa-tian accession to the EU, amount to 13,529,618 tons of white sugar from sugar beet15 and 720,441 tons of isoglucose per year. Sugar beet is grown on about 1.5 million hectares, which combined with the aver-age production of 11-12 tons of sugar per hectare gives 17 million tons (the average in the past eight marketing years).
Graph 5 Sugar yield (tons/ha of sugar beet) in Croatia and EU-28
Source: author
Therefore, although there are production restric-tions, Table 5 shows that production of sugar from sugar beet in the EU-28 exceeded the production quota in each marketing year following the 2006 re-form by an average of 3.6 million tons.
More detailed insight in the production of sugar from sugar beet is provided in Table 6, according to which the production of sugar from sugar beet in the EU-27 in the marketing year 2012/2013 was dominated (12 million tons) by five member states, namely France, Germany, Poland, Netherlands and the UK.
Member state
Quota for sugar-beet
sugar produc-tion (tons/
year)
Planted area of sugar-beet
(000 ha)
Yield of sugar (tons/ha)
Total sugar-beet sugar production
(tons)
Out-of-quota sugar
produced (tons/year)
Belgium 676,235 63 12.1 761,533 85,298
Czech Republic 372,459 52 10.9 565,462 193,003
Denmark 372,383 41 11.7 480,366 107,983
Germany 2,898,256 350 11.4 4,006,872 1,108,616
Greece 158,702 9 5.9 158,126 -
Spain 498,480 36 14.8 531,845 33,365
France (Metropolitan) 3,004,811 341 12.4 4,222,847 1,218,036
France (DOM-Overseas) 432,220 - - 412,164 -
Italy 508,379 52 10.5 546,362 37,983
Lithuania 90,252 19 7.6 190,253 100,001
Hungary 105,420 18 6.4 111,959 6,539
Netherlands 804,888 73 13.3 968,459 163,571
Austria 351,027 49 9.6 469,024 117,997
Poland 1,405,608 192 9.4 1,803,332 397,724
Portugal (Acores) 9,953 - - 358 -
Romania 104,689 28 9.2 258,621 153,932
Slovakia 112,320 19 11.8 228,698 116,378
Finland 80,999 12 6.2 140,460 59,461
Sweden 293,186 38 9.6 365,869 72,683
United Kingdom 1,056,474 104 11.0 1,143,875 87,401
Total EU-27 13,336,741 1.496 11.3 17.366.485 4.059.971
Table 6 Production of sugar-beet sugar in EU-27 - 2012/2013
Marketing year Planted area of sugar-beet (ha)
Polarisation sugar (t/ha)
Quota pro-duction (tons of sugar-beet
sugar)
Total production (tons of sugar-
beet sugar/year)
Out-of-quota sugar-beet
sugar (t/year)
2007/2008 1,722,000 10.3 13,336,741 15,836,930 2,500,189
2008/2009 1,474,000 10.8 13,336,741 15,236,909 1,900,168
2009/2010 1,535,000 11.7 13,336,741 17,505,338 4,168,597
2010/2011 1,519,000 10.3 13,336,741 15,429,140 2,092,399
2011/2012 1,524,000 11.8 13,336,741 18,743,490 5,406,749
2012/2013 1,497,000 11.3 13,336,741 17,366,485 4,029744
2013/2014 1,512,000 11.1 13,529,618 16,818,855 3,289,237
2014/2015 (F) 1,560,000 12.2 13,529,618 19,070,194 5,540,576
Table 5 Sugar-beet sugar production in EU-28
God. XXVIII, BR. 1/2015. str. 111-127 God. XXVIII, BR. 1/2015. str. 111-127
UDK: 657.4:664.1(497.5) / Preliminary communication Ilija Nedić: Break-even point in sugar-beet production
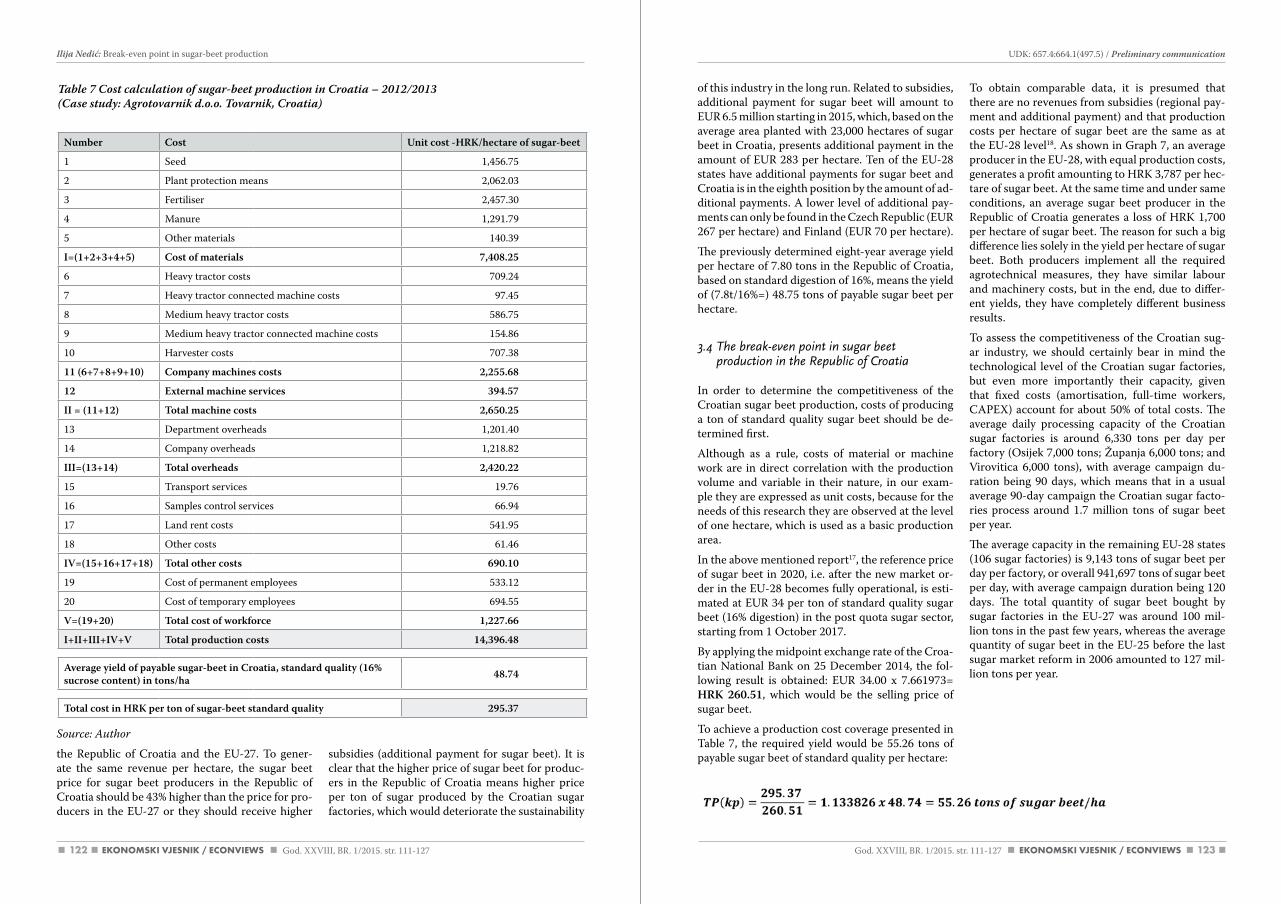
122 123
of this industry in the long run. Related to subsidies, additional payment for sugar beet will amount to EUR 6.5 million starting in 2015, which, based on the average area planted with 23,000 hectares of sugar beet in Croatia, presents additional payment in the amount of EUR 283 per hectare. Ten of the EU-28 states have additional payments for sugar beet and Croatia is in the eighth position by the amount of ad-ditional payments. A lower level of additional pay-ments can only be found in the Czech Republic (EUR 267 per hectare) and Finland (EUR 70 per hectare).
The previously determined eight-year average yield per hectare of 7.80 tons in the Republic of Croatia, based on standard digestion of 16%, means the yield of (7.8t/16%=) 48.75 tons of payable sugar beet per hectare.
3.4 The break-even point in sugar beet production in the Republic of Croatia
In order to determine the competitiveness of the Croatian sugar beet production, costs of producing a ton of standard quality sugar beet should be de-termined first.
Although as a rule, costs of material or machine work are in direct correlation with the production volume and variable in their nature, in our exam-ple they are expressed as unit costs, because for the needs of this research they are observed at the level of one hectare, which is used as a basic production area.
In the above mentioned report17, the reference price of sugar beet in 2020, i.e. after the new market or-der in the EU-28 becomes fully operational, is esti-mated at EUR 34 per ton of standard quality sugar beet (16% digestion) in the post quota sugar sector, starting from 1 October 2017.
By applying the midpoint exchange rate of the Croa-tian National Bank on 25 December 2014, the fol-lowing result is obtained: EUR 34.00 x 7.661973= HRK 260.51, which would be the selling price of sugar beet.
To achieve a production cost coverage presented in Table 7, the required yield would be 55.26 tons of payable sugar beet of standard quality per hectare:
To obtain comparable data, it is presumed that there are no revenues from subsidies (regional pay-ment and additional payment) and that production costs per hectare of sugar beet are the same as at the EU-28 level18. As shown in Graph 7, an average producer in the EU-28, with equal production costs, generates a profit amounting to HRK 3,787 per hec-tare of sugar beet. At the same time and under same conditions, an average sugar beet producer in the Republic of Croatia generates a loss of HRK 1,700 per hectare of sugar beet. The reason for such a big difference lies solely in the yield per hectare of sugar beet. Both producers implement all the required agrotechnical measures, they have similar labour and machinery costs, but in the end, due to differ-ent yields, they have completely different business results.
To assess the competitiveness of the Croatian sug-ar industry, we should certainly bear in mind the technological level of the Croatian sugar factories, but even more importantly their capacity, given that fixed costs (amortisation, full-time workers, CAPEX) account for about 50% of total costs. The average daily processing capacity of the Croatian sugar factories is around 6,330 tons per day per factory (Osijek 7,000 tons; Županja 6,000 tons; and Virovitica 6,000 tons), with average campaign du-ration being 90 days, which means that in a usual average 90-day campaign the Croatian sugar facto-ries process around 1.7 million tons of sugar beet per year.
The average capacity in the remaining EU-28 states (106 sugar factories) is 9,143 tons of sugar beet per day per factory, or overall 941,697 tons of sugar beet per day, with average campaign duration being 120 days. The total quantity of sugar beet bought by sugar factories in the EU-27 was around 100 mil-lion tons in the past few years, whereas the average quantity of sugar beet in the EU-25 before the last sugar market reform in 2006 amounted to 127 mil-lion tons per year.
Source: author
the Republic of Croatia and the EU-27. To gener-ate the same revenue per hectare, the sugar beet price for sugar beet producers in the Republic of Croatia should be 43% higher than the price for pro-ducers in the EU-27 or they should receive higher
subsidies (additional payment for sugar beet). It is clear that the higher price of sugar beet for produc-ers in the Republic of Croatia means higher price per ton of sugar produced by the Croatian sugar factories, which would deteriorate the sustainability
Number Cost Unit cost -HRK/hectare of sugar-beet
1 Seed 1,456.75
2 Plant protection means 2,062.03
3 Fertiliser 2,457.30
4 Manure 1,291.79
5 Other materials 140.39
I=(1+2+3+4+5) Cost of materials 7,408.25
6 Heavy tractor costs 709.24
7 Heavy tractor connected machine costs 97.45
8 Medium heavy tractor costs 586.75
9 Medium heavy tractor connected machine costs 154.86
10 Harvester costs 707.38
11 (6+7+8+9+10) Company machines costs 2,255.68
12 External machine services 394.57
II = (11+12) Total machine costs 2,650.25
13 Department overheads 1,201.40
14 Company overheads 1,218.82
III=(13+14) Total overheads 2,420.22
15 Transport services 19.76
16 Samples control services 66.94
17 Land rent costs 541.95
18 Other costs 61.46
IV=(15+16+17+18) Total other costs 690.10
19 Cost of permanent employees 533.12
20 Cost of temporary employees 694.55
V=(19+20) Total cost of workforce 1,227.66
I+II+III+IV+V Total production costs 14,396.48
Average yield of payable sugar-beet in Croatia, standard quality (16% sucrose content) in tons/ha 48.74
Total cost in HRK per ton of sugar-beet standard quality 295.37
Table 7 Cost calculation of sugar-beet production in Croatia – 2012/2013(Case study: Agrotovarnik d.o.o. Tovarnik, Croatia)
God. XXVIII, BR. 1/2015. str. 111-127 God. XXVIII, BR. 1/2015. str. 111-127
UDK: 657.4:664.1(497.5) / Preliminary communication Ilija Nedić: Break-even point in sugar-beet production
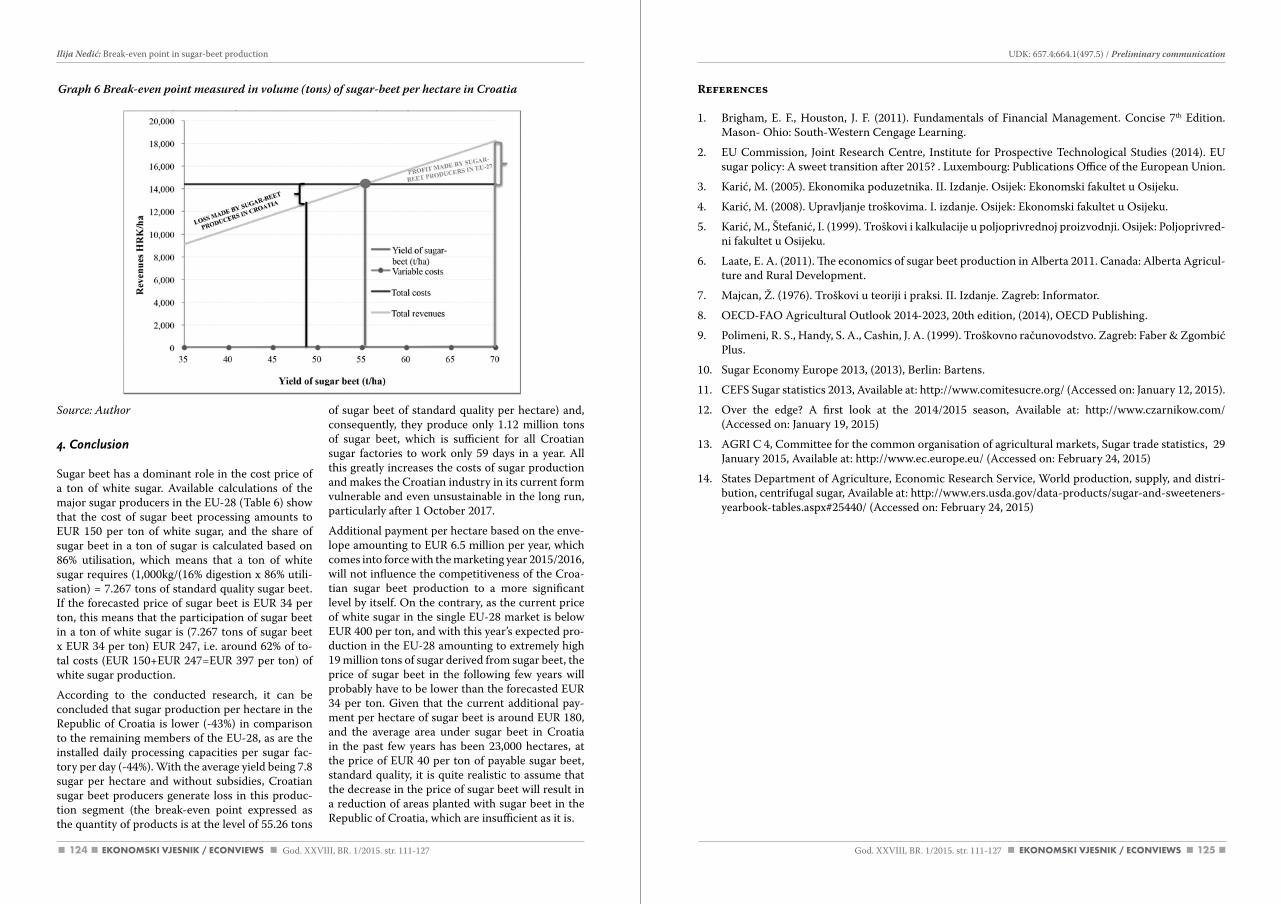
124 125
References
1. Brigham, E. F., Houston, J. F. (2011). Fundamentals of Financial Management. Concise 7th Edition. Mason- Ohio: South-Western Cengage Learning.
2. EU Commission, Joint Research Centre, Institute for Prospective Technological Studies (2014). EU sugar policy: A sweet transition after 2015? . Luxembourg: Publications Office of the European Union.
3. Karić, M. (2005). Ekonomika poduzetnika. II. Izdanje. Osijek: Ekonomski fakultet u Osijeku.
4. Karić, M. (2008). Upravljanje troškovima. I. izdanje. Osijek: Ekonomski fakultet u Osijeku.
5. Karić, M., Štefanić, I. (1999). Troškovi i kalkulacije u poljoprivrednoj proizvodnji. Osijek: Poljoprivred-ni fakultet u Osijeku.
6. Laate, E. A. (2011). The economics of sugar beet production in Alberta 2011. Canada: Alberta Agricul-ture and Rural Development.
7. Majcan, Ž. (1976). Troškovi u teoriji i praksi. II. Izdanje. Zagreb: Informator.
8. OECD-FAO Agricultural Outlook 2014-2023, 20th edition, (2014), OECD Publishing.
9. Polimeni, R. S., Handy, S. A., Cashin, J. A. (1999). Troškovno računovodstvo. Zagreb: Faber & Zgombić Plus.
10. Sugar Economy Europe 2013, (2013), Berlin: Bartens.
11. CEFS Sugar statistics 2013, Available at: http://www.comitesucre.org/ (Accessed on: January 12, 2015).
12. Over the edge? A first look at the 2014/2015 season, Available at: http://www.czarnikow.com/ (Accessed on: January 19, 2015)
13. AGRI C 4, Committee for the common organisation of agricultural markets, Sugar trade statistics, 29 January 2015, Available at: http://www.ec.europe.eu/ (Accessed on: February 24, 2015)
14. States Department of Agriculture, Economic Research Service, World production, supply, and distri-bution, centrifugal sugar, Available at: http://www.ers.usda.gov/data-products/sugar-and-sweeteners-yearbook-tables.aspx#25440/ (Accessed on: February 24, 2015)
Source: author
4. Conclusion
Sugar beet has a dominant role in the cost price of a ton of white sugar. Available calculations of the major sugar producers in the EU-28 (Table 6) show that the cost of sugar beet processing amounts to EUR 150 per ton of white sugar, and the share of sugar beet in a ton of sugar is calculated based on 86% utilisation, which means that a ton of white sugar requires (1,000kg/(16% digestion x 86% utili-sation) = 7.267 tons of standard quality sugar beet. If the forecasted price of sugar beet is EUR 34 per ton, this means that the participation of sugar beet in a ton of white sugar is (7.267 tons of sugar beet x EUR 34 per ton) EUR 247, i.e. around 62% of to-tal costs (EUR 150+EUR 247=EUR 397 per ton) of white sugar production.
According to the conducted research, it can be concluded that sugar production per hectare in the Republic of Croatia is lower (-43%) in comparison to the remaining members of the EU-28, as are the installed daily processing capacities per sugar fac-tory per day (-44%). With the average yield being 7.8 sugar per hectare and without subsidies, Croatian sugar beet producers generate loss in this produc-tion segment (the break-even point expressed as the quantity of products is at the level of 55.26 tons
of sugar beet of standard quality per hectare) and, consequently, they produce only 1.12 million tons of sugar beet, which is sufficient for all Croatian sugar factories to work only 59 days in a year. All this greatly increases the costs of sugar production and makes the Croatian industry in its current form vulnerable and even unsustainable in the long run, particularly after 1 October 2017.
Additional payment per hectare based on the enve-lope amounting to EUR 6.5 million per year, which comes into force with the marketing year 2015/2016, will not influence the competitiveness of the Croa-tian sugar beet production to a more significant level by itself. On the contrary, as the current price of white sugar in the single EU-28 market is below EUR 400 per ton, and with this year’s expected pro-duction in the EU-28 amounting to extremely high 19 million tons of sugar derived from sugar beet, the price of sugar beet in the following few years will probably have to be lower than the forecasted EUR 34 per ton. Given that the current additional pay-ment per hectare of sugar beet is around EUR 180, and the average area under sugar beet in Croatia in the past few years has been 23,000 hectares, at the price of EUR 40 per ton of payable sugar beet, standard quality, it is quite realistic to assume that the decrease in the price of sugar beet will result in a reduction of areas planted with sugar beet in the Republic of Croatia, which are insufficient as it is.
Graph 6 Break-even point measured in volume (tons) of sugar-beet per hectare in Croatia
God. XXVIII, BR. 1/2015. str. 111-127 God. XXVIII, BR. 1/2015. str. 111-127
UDK: 657.4:664.1(497.5) / Preliminary communication Ilija Nedić: Break-even point in sugar-beet production
126 127
Ilija Nedić
Točka pokrića u proizvodnji šećerne repe
Sažetak
Potrošnja šećera u svijetu u zadnjih 70-ak godina bilježi stabilan rast koji će se po svim relevantnim procjenama nastaviti i u sljedećem desetljeću, a što svrstava šećer u kategoriju najznačajnijih prehrambenih i burzovnih roba na svijetu.
Od ukupne svjetske proizvodnje šećera oko 77% čini šećer proizveden iz šećerne trske, a 23% šećer proizve-den iz šećerne repe. Vodeće mjesto u svjetskoj proizvodnji šećera, već duže vrijeme drži Brazil s proizvod-njom bijeloga šećera proizvedenoga isključivo iz šećerne trske, dok među proizvođačima šećera iz šećerne repe, vodeće mjesto u svijetu drži EU-28.
Kako je domaća industrija šećera od ulaska Republike Hrvatske u EU dio jedinstvenoga europskoga tržišta šećera, u istraživanju se primjenom Metode točke pokrića utvrdila razina konkurentnosti domaće proiz-vodnje šećerne repe.
Na bazi očekivane prodajne cijene za šećernu repu od 34 EUR/t šećerne repe standardne kakvoće prim-jenom Metode točke pokrića, utvrđeno je da potrebna količina za pokriće ukupnih troškova u prozvodnji šećerne repe u Republici Hrvatskoj iznosi 55,26 tone/ha plative šećerne repe, standardne kakvoće, odnosno 8,84 tone polarizacijskog šećera po hektaru. S obzirom da prosječna proizvodnja šećerne repe u RH iska-zana u ekvivalentu polarizacijskoga šećera iznosi 7,8 t/ha jasno je da prosječni domaći proizvođač šećerne repe, bez prihoda od poticaja, ostvaruje gubitak u ovoj proizvodnji.
Ključne riječi: točka pokrića, šećer, repa, trska
(Endnotes)
1 Common Agricultural Policy – CAP.
2 Single Common Market Organisation for Sugar (CMO Sugar).
3 Stabilisation and Association Agreement, Official Gazette – International Treaties No. 14, 27 December 2001, which came into force on 1 February 2005.
4 According to the Croatian Chamber of Economy, Sector for Agriculture, Food Industry and Forestry, exports of the sugar industry in 2011 amounted to 185 million USD, or nearly 20% of total exports in this sector.
5 Joint Research Centre Institute for Prospective Technological Studies; EU sugar policy: A sweet transition after 2015?
6 OECD and FAO Secretariats; http://www.oecd.org/site/oecd-faoagriculturaloutlook/sugar.htm/(January, 2015).
7 According to: http://www.unicadata.com.br/ (January, 2015).
8 Ibid.
9 Brazilian sugarcane industry association.
10 Common Market Organization for Sugar.
11 European Sugar Sector, 2005., Mariann Fischer Boel, Commissioner for Agriculture and Rural Development.
12 9th Round of multilateral trade negotiations, launched in November 2001, in Doha, Quatar, at the WTO’s Fourth WTO Ministerial Conference.
13 Committee for the common organisation of agricultural markets.
14 During the WTO’s Uruguay Round, members agreed to a tariff rate quota (TRQ) system as the most appropriate method to ensure market access during the transition from an agricultural trading system of complex tariffs and nontariff barriers to a tariffonly regime.
15 The annual production quota for Croatia of 192,877 tons of white sugar derived from sugar beet should be added to the quotas shown in Table 6.
16 According to: http//www.kws.de/aw/KWS/serbia-montenegro/_e_erna_rfb/Bolesti_secerne_repe/~dcvn/ Cercospora_ Beticola/un-defined/ (January, 2015).
17 See endnote 1.
18 The cost structure in sugar beet production is such (a large proportion of the costs is incurred by plant protection materials, fertili-zers and machinery) that given the single economic area, there is not much variation in the prices of these inputs, and thus also not in sugar beet production costs at the EU-28 level.
God. XXVIII, BR. 1/2015. str. 111-127 God. XXVIII, BR. 1/2015. str. 111-127
UDK: 657.4:664.1(497.5) / Preliminary communication Ilija Nedić: Break-even point in sugar-beet production

129God. XXVIII, BR. 1/2015. str. 129-142
Jerko Glavaš, Luka Stanić, Damir Šebo: The impact of the managers’ educational level on the developmentof the knowledge-based organizations: The case of insurance companies in Croatia
THE IMPACT OF THE MANAGERS’ EDUCATIONAL LEVEL ON THE DEVELOPMENT OF THE KNOWL-EDGE-BASED ORGANIZATIONS: THE CASE OF INSURANCE COMPANIES IN CROATIA
UDK: 65.012.4:368](497.5)Preliminary communication
Received: January 26, 2015accepted for publishing: May 20, 2015
Jerko GlavašJosip Juraj StrossmayerUniversity of OsijekFaculty of Economics in OsijekTrg ljudevita Gaja 7,31000 Osijek, [email protected]: +38531224400
Luka StanićMerkur osiguranje d.d. Ivana Gundulića 5,31000 Osijek, [email protected]: +38531215444
Damir ŠeboJosip Juraj StrossmayerUniversity of OsijekFaculty of MedicineJosipa Hutlera 4,31000 Osijek, [email protected]: +38531512819
Abstract
The key objective of the scientific research paper is to identify the key factors of knowledge management that have a direct impact on the economic growth of the national economy within the framework of the European Union. Through the implementation of primary research in the insurance sector (insurance com-panies), named variables are analyzed to create a model of competitiveness in terms of the knowledge economy based on the above research and proven hypotheses in the research conducted. An analysis of the results is necessary to determine the most important groups of variables that affect the economic growth and competitive advantage. The research is based on three key variables: education, knowledge and human resources.
Keywords: Management, education, knowledge, insurance, Croatia
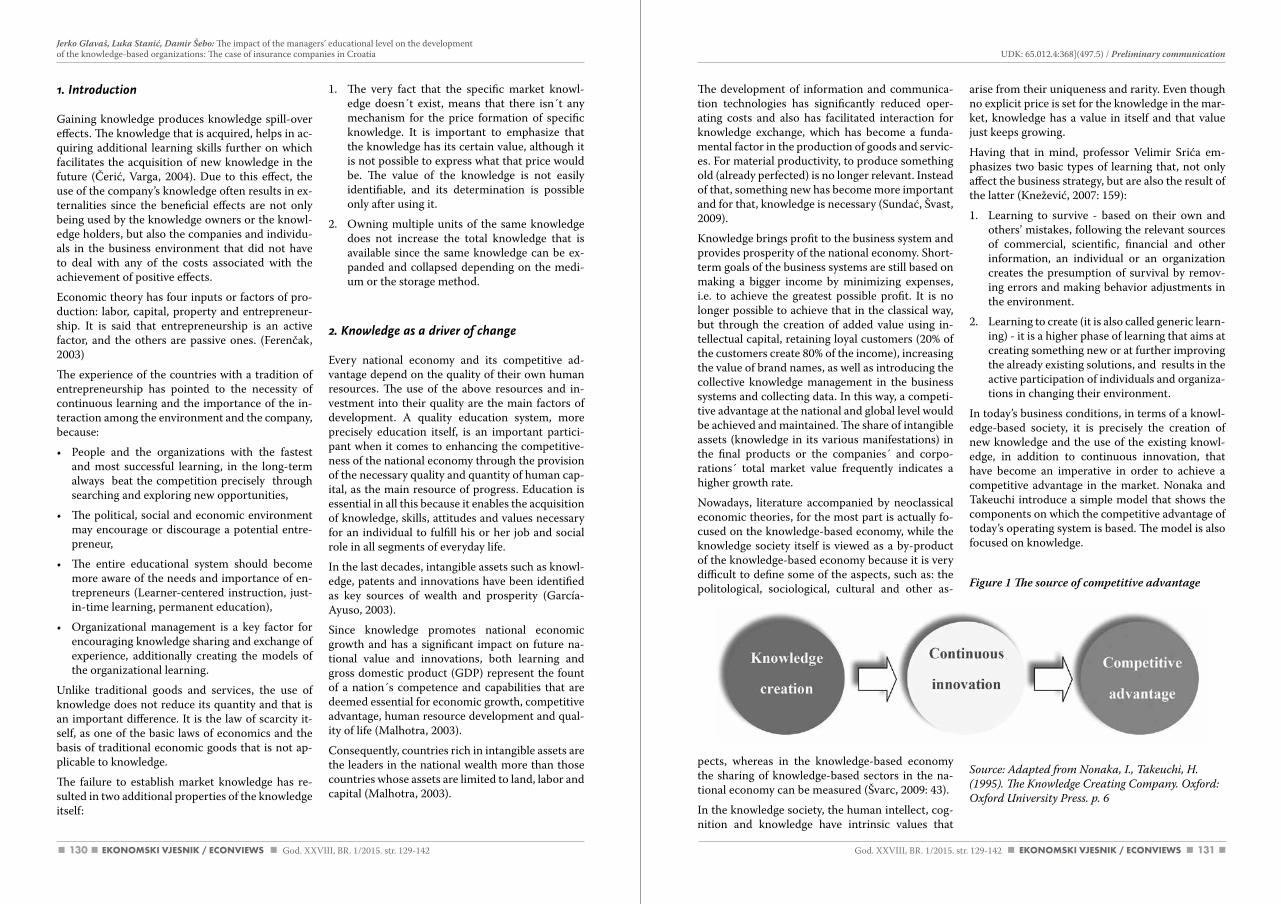
130 131God. XXVIII, BR. 1/2015. str. 129-142 God. XXVIII, BR. 1/2015. str. 129-142
UDK: 65.012.4:368](497.5) / Preliminary communication
The development of information and communica-tion technologies has significantly reduced oper-ating costs and also has facilitated interaction for knowledge exchange, which has become a funda-mental factor in the production of goods and servic-es. For material productivity, to produce something old (already perfected) is no longer relevant. Instead of that, something new has become more important and for that, knowledge is necessary (Sundać, Švast, 2009).
Knowledge brings profit to the business system and provides prosperity of the national economy. Short-term goals of the business systems are still based on making a bigger income by minimizing expenses, i.e. to achieve the greatest possible profit. It is no longer possible to achieve that in the classical way, but through the creation of added value using in-tellectual capital, retaining loyal customers (20% of the customers create 80% of the income), increasing the value of brand names, as well as introducing the collective knowledge management in the business systems and collecting data. In this way, a competi-tive advantage at the national and global level would be achieved and maintained. The share of intangible assets (knowledge in its various manifestations) in the final products or the companies´ and corpo-rations´ total market value frequently indicates a higher growth rate.
Nowadays, literature accompanied by neoclassical economic theories, for the most part is actually fo-cused on the knowledge-based economy, while the knowledge society itself is viewed as a by-product of the knowledge-based economy because it is very difficult to define some of the aspects, such as: the politological, sociological, cultural and other as-
pects, whereas in the knowledge-based economy the sharing of knowledge-based sectors in the na-tional economy can be measured (Švarc, 2009: 43).
In the knowledge society, the human intellect, cog-nition and knowledge have intrinsic values that
arise from their uniqueness and rarity. Even though no explicit price is set for the knowledge in the mar-ket, knowledge has a value in itself and that value just keeps growing.
Having that in mind, professor Velimir Srića em-phasizes two basic types of learning that, not only affect the business strategy, but are also the result of the latter (Knežević, 2007: 159):
1. Learning to survive - based on their own and others’ mistakes, following the relevant sources of commercial, scientific, financial and other information, an individual or an organization creates the presumption of survival by remov-ing errors and making behavior adjustments in the environment.
2. Learning to create (it is also called generic learn-ing) - it is a higher phase of learning that aims at creating something new or at further improving the already existing solutions, and results in the active participation of individuals and organiza-tions in changing their environment.
In today’s business conditions, in terms of a knowl-edge-based society, it is precisely the creation of new knowledge and the use of the existing knowl-edge, in addition to continuous innovation, that have become an imperative in order to achieve a competitive advantage in the market. Nonaka and Takeuchi introduce a simple model that shows the components on which the competitive advantage of today’s operating system is based. The model is also focused on knowledge.
Figure 1 The source of competitive advantage
Source: adapted from Nonaka, I., Takeuchi, H. (1995). The Knowledge creating company. Oxford: Oxford University Press. p. 6
1. Introduction
Gaining knowledge produces knowledge spill-over effects. The knowledge that is acquired, helps in ac-quiring additional learning skills further on which facilitates the acquisition of new knowledge in the future (Čerić, Varga, 2004). Due to this effect, the use of the company’s knowledge often results in ex-ternalities since the beneficial effects are not only being used by the knowledge owners or the knowl-edge holders, but also the companies and individu-als in the business environment that did not have to deal with any of the costs associated with the achievement of positive effects.
Economic theory has four inputs or factors of pro-duction: labor, capital, property and entrepreneur-ship. It is said that entrepreneurship is an active factor, and the others are passive ones. (Ferenčak, 2003)
The experience of the countries with a tradition of entrepreneurship has pointed to the necessity of continuous learning and the importance of the in-teraction among the environment and the company, because:
• People and the organizations with the fastest and most successful learning, in the long-term always beat the competition precisely through searching and exploring new opportunities,
• The political, social and economic environment may encourage or discourage a potential entre-preneur,
• The entire educational system should become more aware of the needs and importance of en-trepreneurs (Learner-centered instruction, just-in-time learning, permanent education),
• Organizational management is a key factor for encouraging knowledge sharing and exchange of experience, additionally creating the models of the organizational learning.
Unlike traditional goods and services, the use of knowledge does not reduce its quantity and that is an important difference. It is the law of scarcity it-self, as one of the basic laws of economics and the basis of traditional economic goods that is not ap-plicable to knowledge.
The failure to establish market knowledge has re-sulted in two additional properties of the knowledge itself:
1. The very fact that the specific market knowl-edge doesn´t exist, means that there isn´t any mechanism for the price formation of specific knowledge. It is important to emphasize that the knowledge has its certain value, although it is not possible to express what that price would be. The value of the knowledge is not easily identifiable, and its determination is possible only after using it.
2. Owning multiple units of the same knowledge does not increase the total knowledge that is available since the same knowledge can be ex-panded and collapsed depending on the medi-um or the storage method.
2. Knowledge as a driver of change
Every national economy and its competitive ad-vantage depend on the quality of their own human resources. The use of the above resources and in-vestment into their quality are the main factors of development. A quality education system, more precisely education itself, is an important partici-pant when it comes to enhancing the competitive-ness of the national economy through the provision of the necessary quality and quantity of human cap-ital, as the main resource of progress. Education is essential in all this because it enables the acquisition of knowledge, skills, attitudes and values necessary for an individual to fulfill his or her job and social role in all segments of everyday life.
In the last decades, intangible assets such as knowl-edge, patents and innovations have been identified as key sources of wealth and prosperity (García-Ayuso, 2003).
Since knowledge promotes national economic growth and has a significant impact on future na-tional value and innovations, both learning and gross domestic product (GDP) represent the fount of a nation´s competence and capabilities that are deemed essential for economic growth, competitive advantage, human resource development and qual-ity of life (Malhotra, 2003).
Consequently, countries rich in intangible assets are the leaders in the national wealth more than those countries whose assets are limited to land, labor and capital (Malhotra, 2003).
Jerko Glavaš, Luka Stanić, Damir Šebo: The impact of the managers’ educational level on the developmentof the knowledge-based organizations: The case of insurance companies in Croatia
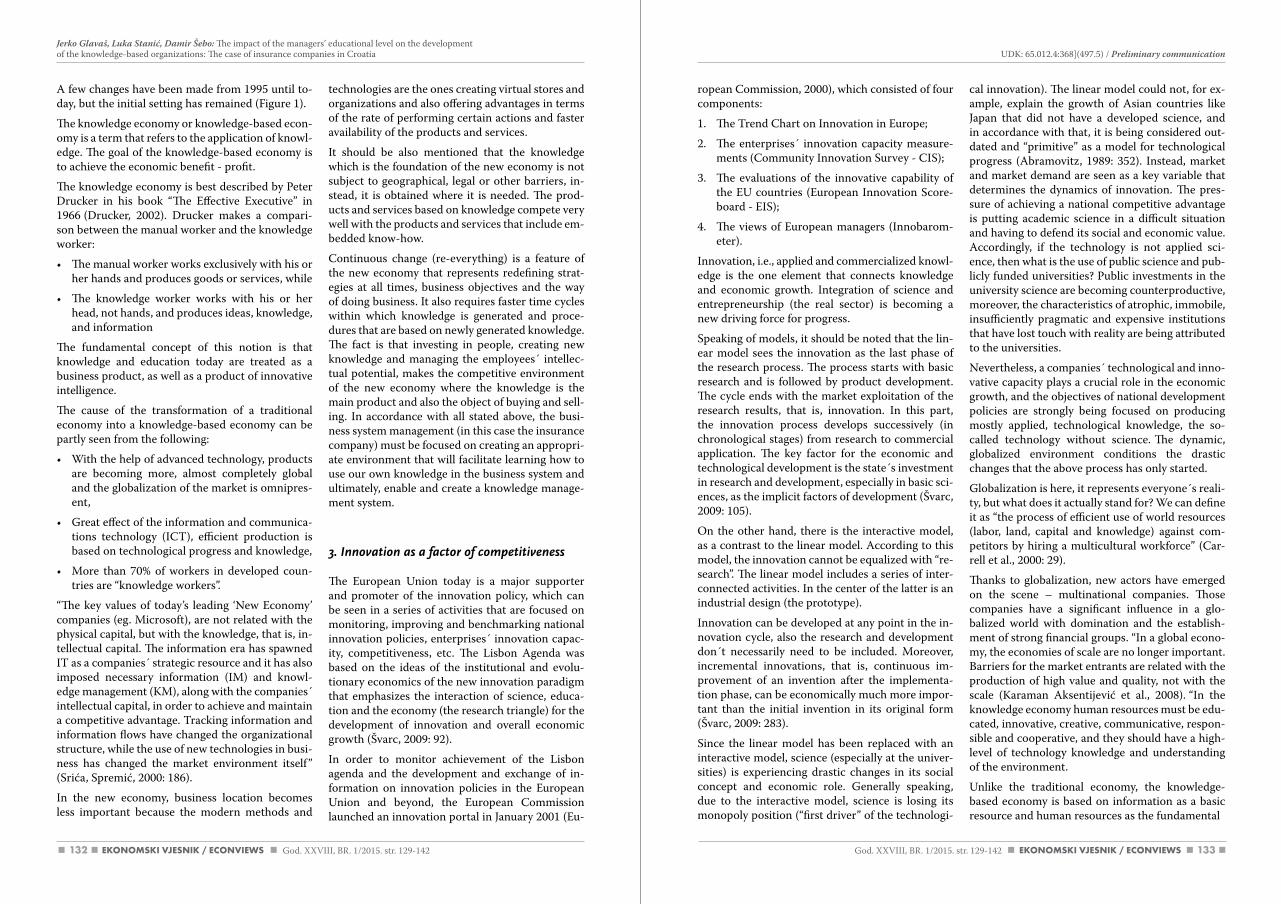
132 133
ropean Commission, 2000), which consisted of four components:
1. The Trend Chart on Innovation in Europe;
2. The enterprises´ innovation capacity measure-ments (Community Innovation Survey - CIS);
3. The evaluations of the innovative capability of the EU countries (European Innovation Score-board - EIS);
4. The views of European managers (Innobarom-eter).
Innovation, i.e., applied and commercialized knowl-edge is the one element that connects knowledge and economic growth. Integration of science and entrepreneurship (the real sector) is becoming a new driving force for progress.
Speaking of models, it should be noted that the lin-ear model sees the innovation as the last phase of the research process. The process starts with basic research and is followed by product development. The cycle ends with the market exploitation of the research results, that is, innovation. In this part, the innovation process develops successively (in chronological stages) from research to commercial application. The key factor for the economic and technological development is the state´s investment in research and development, especially in basic sci-ences, as the implicit factors of development (Švarc, 2009: 105).
On the other hand, there is the interactive model, as a contrast to the linear model. According to this model, the innovation cannot be equalized with “re-search”. The linear model includes a series of inter-connected activities. In the center of the latter is an industrial design (the prototype).
Innovation can be developed at any point in the in-novation cycle, also the research and development don´t necessarily need to be included. Moreover, incremental innovations, that is, continuous im-provement of an invention after the implementa-tion phase, can be economically much more impor-tant than the initial invention in its original form (Švarc, 2009: 283).
Since the linear model has been replaced with an interactive model, science (especially at the univer-sities) is experiencing drastic changes in its social concept and economic role. Generally speaking, due to the interactive model, science is losing its monopoly position (“first driver” of the technologi-
cal innovation). The linear model could not, for ex-ample, explain the growth of Asian countries like Japan that did not have a developed science, and in accordance with that, it is being considered out-dated and “primitive” as a model for technological progress (Abramovitz, 1989: 352). Instead, market and market demand are seen as a key variable that determines the dynamics of innovation. The pres-sure of achieving a national competitive advantage is putting academic science in a difficult situation and having to defend its social and economic value. Accordingly, if the technology is not applied sci-ence, then what is the use of public science and pub-licly funded universities? Public investments in the university science are becoming counterproductive, moreover, the characteristics of atrophic, immobile, insufficiently pragmatic and expensive institutions that have lost touch with reality are being attributed to the universities.
Nevertheless, a companies´ technological and inno-vative capacity plays a crucial role in the economic growth, and the objectives of national development policies are strongly being focused on producing mostly applied, technological knowledge, the so-called technology without science. The dynamic, globalized environment conditions the drastic changes that the above process has only started.
Globalization is here, it represents everyone´s reali-ty, but what does it actually stand for? We can define it as “the process of efficient use of world resources (labor, land, capital and knowledge) against com-petitors by hiring a multicultural workforce” (Car-rell et al., 2000: 29).
Thanks to globalization, new actors have emerged on the scene – multinational companies. Those companies have a significant influence in a glo-balized world with domination and the establish-ment of strong financial groups. “In a global econo-my, the economies of scale are no longer important. Barriers for the market entrants are related with the production of high value and quality, not with the scale (Karaman Aksentijević et al., 2008). “In the knowledge economy human resources must be edu-cated, innovative, creative, communicative, respon-sible and cooperative, and they should have a high-level of technology knowledge and understanding of the environment.
Unlike the traditional economy, the knowledge-based economy is based on information as a basic resource and human resources as the fundamental
A few changes have been made from 1995 until to-day, but the initial setting has remained (Figure 1).
The knowledge economy or knowledge-based econ-omy is a term that refers to the application of knowl-edge. The goal of the knowledge-based economy is to achieve the economic benefit - profit.
The knowledge economy is best described by Peter Drucker in his book “The Effective Executive” in 1966 (Drucker, 2002). Drucker makes a compari-son between the manual worker and the knowledge worker:
• The manual worker works exclusively with his or her hands and produces goods or services, while
• The knowledge worker works with his or her head, not hands, and produces ideas, knowledge, and information
The fundamental concept of this notion is that knowledge and education today are treated as a business product, as well as a product of innovative intelligence.
The cause of the transformation of a traditional economy into a knowledge-based economy can be partly seen from the following:
• With the help of advanced technology, products are becoming more, almost completely global and the globalization of the market is omnipres-ent,
• Great effect of the information and communica-tions technology (ICT), efficient production is based on technological progress and knowledge,
• More than 70% of workers in developed coun-tries are “knowledge workers”.
“The key values of today’s leading ‘New Economy’ companies (eg. Microsoft), are not related with the physical capital, but with the knowledge, that is, in-tellectual capital. The information era has spawned IT as a companies´ strategic resource and it has also imposed necessary information (IM) and knowl-edge management (KM), along with the companies´ intellectual capital, in order to achieve and maintain a competitive advantage. Tracking information and information flows have changed the organizational structure, while the use of new technologies in busi-ness has changed the market environment itself” (Srića, Spremić, 2000: 186).
In the new economy, business location becomes less important because the modern methods and
technologies are the ones creating virtual stores and organizations and also offering advantages in terms of the rate of performing certain actions and faster availability of the products and services.
It should be also mentioned that the knowledge which is the foundation of the new economy is not subject to geographical, legal or other barriers, in-stead, it is obtained where it is needed. The prod-ucts and services based on knowledge compete very well with the products and services that include em-bedded know-how.
Continuous change (re-everything) is a feature of the new economy that represents redefining strat-egies at all times, business objectives and the way of doing business. It also requires faster time cycles within which knowledge is generated and proce-dures that are based on newly generated knowledge. The fact is that investing in people, creating new knowledge and managing the employees´ intellec-tual potential, makes the competitive environment of the new economy where the knowledge is the main product and also the object of buying and sell-ing. In accordance with all stated above, the busi-ness system management (in this case the insurance company) must be focused on creating an appropri-ate environment that will facilitate learning how to use our own knowledge in the business system and ultimately, enable and create a knowledge manage-ment system.
3. Innovation as a factor of competitiveness
The European Union today is a major supporter and promoter of the innovation policy, which can be seen in a series of activities that are focused on monitoring, improving and benchmarking national innovation policies, enterprises´ innovation capac-ity, competitiveness, etc. The Lisbon Agenda was based on the ideas of the institutional and evolu-tionary economics of the new innovation paradigm that emphasizes the interaction of science, educa-tion and the economy (the research triangle) for the development of innovation and overall economic growth (Švarc, 2009: 92).
In order to monitor achievement of the Lisbon agenda and the development and exchange of in-formation on innovation policies in the European Union and beyond, the European Commission launched an innovation portal in January 2001 (Eu-
God. XXVIII, BR. 1/2015. str. 129-142 God. XXVIII, BR. 1/2015. str. 129-142
UDK: 65.012.4:368](497.5) / Preliminary communication Jerko Glavaš, Luka Stanić, Damir Šebo: The impact of the managers’ educational level on the developmentof the knowledge-based organizations: The case of insurance companies in Croatia
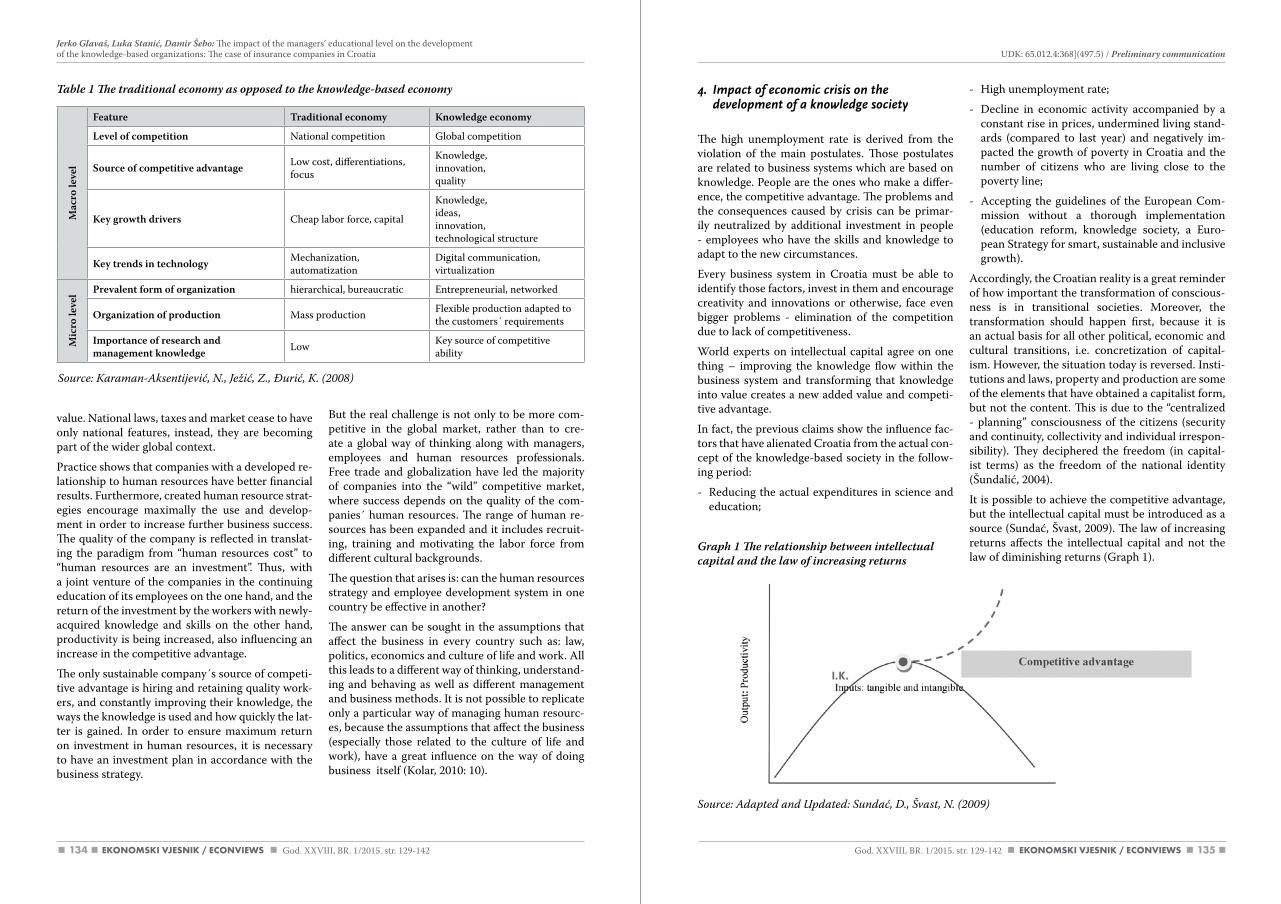
134 135
4. Impact of economic crisis on the development of a knowledge society
The high unemployment rate is derived from the violation of the main postulates. Those postulates are related to business systems which are based on knowledge. People are the ones who make a differ-ence, the competitive advantage. The problems and the consequences caused by crisis can be primar-ily neutralized by additional investment in people - employees who have the skills and knowledge to adapt to the new circumstances.
Every business system in Croatia must be able to identify those factors, invest in them and encourage creativity and innovations or otherwise, face even bigger problems - elimination of the competition due to lack of competitiveness.
World experts on intellectual capital agree on one thing – improving the knowledge flow within the business system and transforming that knowledge into value creates a new added value and competi-tive advantage.
In fact, the previous claims show the influence fac-tors that have alienated Croatia from the actual con-cept of the knowledge-based society in the follow-ing period:
- Reducing the actual expenditures in science and education;
Graph 1 The relationship between intellectual capital and the law of increasing returns
- High unemployment rate;
- Decline in economic activity accompanied by a constant rise in prices, undermined living stand-ards (compared to last year) and negatively im-pacted the growth of poverty in Croatia and the number of citizens who are living close to the poverty line;
- Accepting the guidelines of the European Com-mission without a thorough implementation (education reform, knowledge society, a Euro-pean Strategy for smart, sustainable and inclusive growth).
Accordingly, the Croatian reality is a great reminder of how important the transformation of conscious-ness is in transitional societies. Moreover, the transformation should happen first, because it is an actual basis for all other political, economic and cultural transitions, i.e. concretization of capital-ism. However, the situation today is reversed. Insti-tutions and laws, property and production are some of the elements that have obtained a capitalist form, but not the content. This is due to the “centralized - planning” consciousness of the citizens (security and continuity, collectivity and individual irrespon-sibility). They deciphered the freedom (in capital-ist terms) as the freedom of the national identity (Šundalić, 2004).
It is possible to achieve the competitive advantage, but the intellectual capital must be introduced as a source (Sundać, Švast, 2009). The law of increasing returns affects the intellectual capital and not the law of diminishing returns (Graph 1).
value. National laws, taxes and market cease to have only national features, instead, they are becoming part of the wider global context.
Practice shows that companies with a developed re-lationship to human resources have better financial results. Furthermore, created human resource strat-egies encourage maximally the use and develop-ment in order to increase further business success. The quality of the company is reflected in translat-ing the paradigm from “human resources cost” to “human resources are an investment”. Thus, with a joint venture of the companies in the continuing education of its employees on the one hand, and the return of the investment by the workers with newly-acquired knowledge and skills on the other hand, productivity is being increased, also influencing an increase in the competitive advantage.
The only sustainable company´s source of competi-tive advantage is hiring and retaining quality work-ers, and constantly improving their knowledge, the ways the knowledge is used and how quickly the lat-ter is gained. In order to ensure maximum return on investment in human resources, it is necessary to have an investment plan in accordance with the business strategy.
But the real challenge is not only to be more com-petitive in the global market, rather than to cre-ate a global way of thinking along with managers, employees and human resources professionals. Free trade and globalization have led the majority of companies into the “wild” competitive market, where success depends on the quality of the com-panies´ human resources. The range of human re-sources has been expanded and it includes recruit-ing, training and motivating the labor force from different cultural backgrounds.
The question that arises is: can the human resources strategy and employee development system in one country be effective in another?
The answer can be sought in the assumptions that affect the business in every country such as: law, politics, economics and culture of life and work. All this leads to a different way of thinking, understand-ing and behaving as well as different management and business methods. It is not possible to replicate only a particular way of managing human resourc-es, because the assumptions that affect the business (especially those related to the culture of life and work), have a great influence on the way of doing business itself (Kolar, 2010: 10).
Mac
ro le
vel
Feature Traditional economy Knowledge economy
Level of competition National competition Global competition
Source of competitive advantage Low cost, differentiations, focus
Knowledge, innovation, quality
Key growth drivers Cheap labor force, capital
Knowledge, ideas,innovation,technological structure
Key trends in technology Mechanization, automatization
Digital communication, virtualization
Mic
ro le
vel Prevalent form of organization hierarchical, bureaucratic Entrepreneurial, networked
Organization of production Mass production Flexible production adapted to the customers´ requirements
Importance of research and management knowledge Low Key source of competitive
ability
Table 1 The traditional economy as opposed to the knowledge-based economy
God. XXVIII, BR. 1/2015. str. 129-142 God. XXVIII, BR. 1/2015. str. 129-142
UDK: 65.012.4:368](497.5) / Preliminary communication Jerko Glavaš, Luka Stanić, Damir Šebo: The impact of the managers’ educational level on the developmentof the knowledge-based organizations: The case of insurance companies in Croatia
Source: Karaman-aksentijević, N., Ježić, Z., Đurić, K. (2008)
Source: adapted and Updated: Sundać, d., Švast, N. (2009)
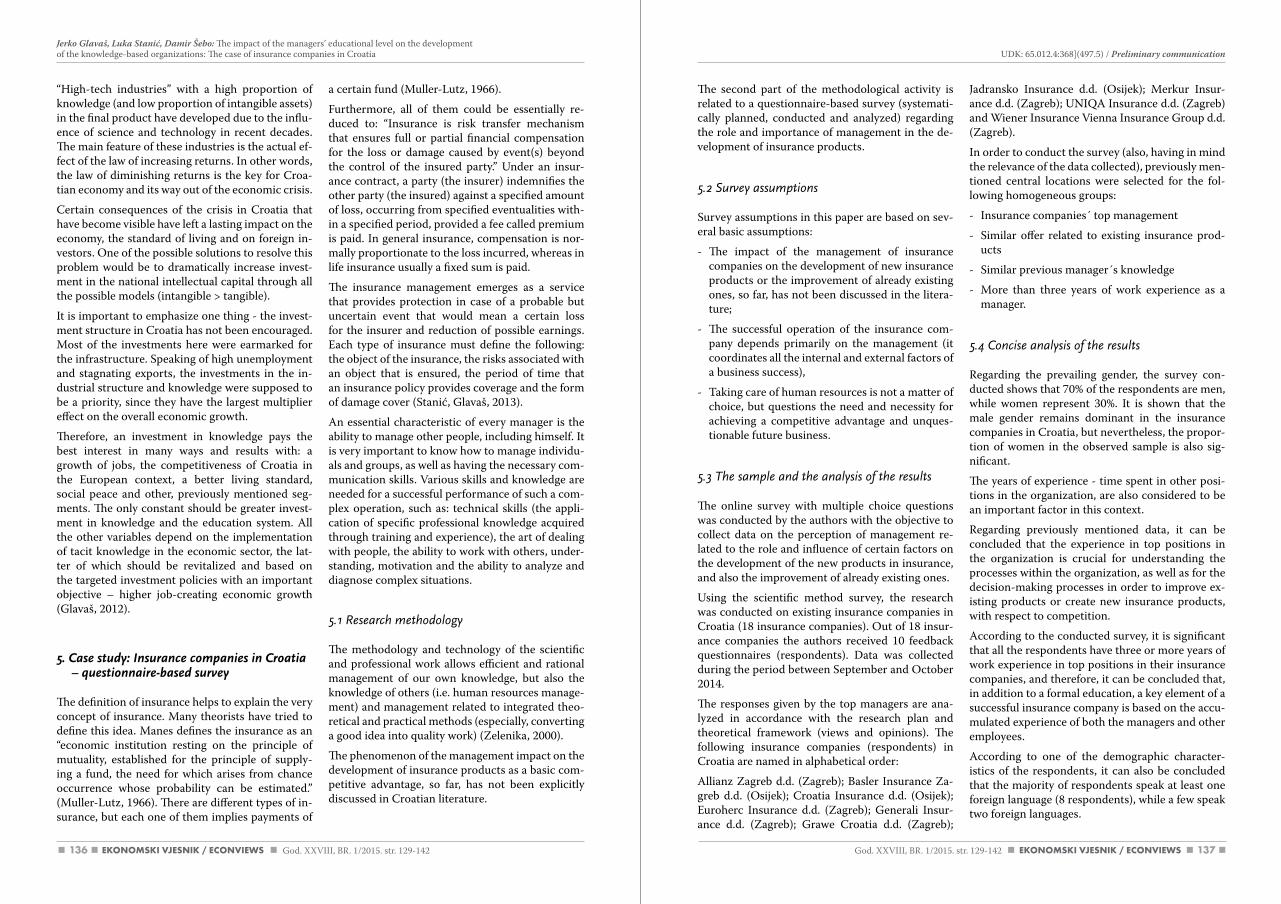
136 137
The second part of the methodological activity is related to a questionnaire-based survey (systemati-cally planned, conducted and analyzed) regarding the role and importance of management in the de-velopment of insurance products.
5.2 Survey assumptions
Survey assumptions in this paper are based on sev-eral basic assumptions:
- The impact of the management of insurance companies on the development of new insurance products or the improvement of already existing ones, so far, has not been discussed in the litera-ture;
- The successful operation of the insurance com-pany depends primarily on the management (it coordinates all the internal and external factors of a business success),
- Taking care of human resources is not a matter of choice, but questions the need and necessity for achieving a competitive advantage and unques-tionable future business.
5.3 The sample and the analysis of the results
The online survey with multiple choice questions was conducted by the authors with the objective to collect data on the perception of management re-lated to the role and influence of certain factors on the development of the new products in insurance, and also the improvement of already existing ones.
Using the scientific method survey, the research was conducted on existing insurance companies in Croatia (18 insurance companies). Out of 18 insur-ance companies the authors received 10 feedback questionnaires (respondents). Data was collected during the period between September and October 2014.
The responses given by the top managers are ana-lyzed in accordance with the research plan and theoretical framework (views and opinions). The following insurance companies (respondents) in Croatia are named in alphabetical order:
Allianz Zagreb d.d. (Zagreb); Basler Insurance Za-greb d.d. (Osijek); Croatia Insurance d.d. (Osijek); Euroherc Insurance d.d. (Zagreb); Generali Insur-ance d.d. (Zagreb); Grawe Croatia d.d. (Zagreb);
Jadransko Insurance d.d. (Osijek); Merkur Insur-ance d.d. (Zagreb); UNIQA Insurance d.d. (Zagreb) and Wiener Insurance Vienna Insurance Group d.d. (Zagreb).
In order to conduct the survey (also, having in mind the relevance of the data collected), previously men-tioned central locations were selected for the fol-lowing homogeneous groups:
- Insurance companies´ top management
- Similar offer related to existing insurance prod-ucts
- Similar previous manager´s knowledge
- More than three years of work experience as a manager.
5.4 Concise analysis of the results
Regarding the prevailing gender, the survey con-ducted shows that 70% of the respondents are men, while women represent 30%. It is shown that the male gender remains dominant in the insurance companies in Croatia, but nevertheless, the propor-tion of women in the observed sample is also sig-nificant.
The years of experience - time spent in other posi-tions in the organization, are also considered to be an important factor in this context.
Regarding previously mentioned data, it can be concluded that the experience in top positions in the organization is crucial for understanding the processes within the organization, as well as for the decision-making processes in order to improve ex-isting products or create new insurance products, with respect to competition.
According to the conducted survey, it is significant that all the respondents have three or more years of work experience in top positions in their insurance companies, and therefore, it can be concluded that, in addition to a formal education, a key element of a successful insurance company is based on the accu-mulated experience of both the managers and other employees.
According to one of the demographic character-istics of the respondents, it can also be concluded that the majority of respondents speak at least one foreign language (8 respondents), while a few speak two foreign languages.
“High-tech industries” with a high proportion of knowledge (and low proportion of intangible assets) in the final product have developed due to the influ-ence of science and technology in recent decades. The main feature of these industries is the actual ef-fect of the law of increasing returns. In other words, the law of diminishing returns is the key for Croa-tian economy and its way out of the economic crisis.
Certain consequences of the crisis in Croatia that have become visible have left a lasting impact on the economy, the standard of living and on foreign in-vestors. One of the possible solutions to resolve this problem would be to dramatically increase invest-ment in the national intellectual capital through all the possible models (intangible > tangible).
It is important to emphasize one thing - the invest-ment structure in Croatia has not been encouraged. Most of the investments here were earmarked for the infrastructure. Speaking of high unemployment and stagnating exports, the investments in the in-dustrial structure and knowledge were supposed to be a priority, since they have the largest multiplier effect on the overall economic growth.
Therefore, an investment in knowledge pays the best interest in many ways and results with: a growth of jobs, the competitiveness of Croatia in the European context, a better living standard, social peace and other, previously mentioned seg-ments. The only constant should be greater invest-ment in knowledge and the education system. All the other variables depend on the implementation of tacit knowledge in the economic sector, the lat-ter of which should be revitalized and based on the targeted investment policies with an important objective – higher job-creating economic growth (Glavaš, 2012).
5. Case study: Insurance companies in Croatia – questionnaire-based survey
The definition of insurance helps to explain the very concept of insurance. Many theorists have tried to define this idea. Manes defines the insurance as an “economic institution resting on the principle of mutuality, established for the principle of supply-ing a fund, the need for which arises from chance occurrence whose probability can be estimated.” (Muller-Lutz, 1966). There are different types of in-surance, but each one of them implies payments of
a certain fund (Muller-Lutz, 1966).
Furthermore, all of them could be essentially re-duced to: “Insurance is risk transfer mechanism that ensures full or partial financial compensation for the loss or damage caused by event(s) beyond the control of the insured party.” Under an insur-ance contract, a party (the insurer) indemnifies the other party (the insured) against a specified amount of loss, occurring from specified eventualities with-in a specified period, provided a fee called premium is paid. In general insurance, compensation is nor-mally proportionate to the loss incurred, whereas in life insurance usually a fixed sum is paid.
The insurance management emerges as a service that provides protection in case of a probable but uncertain event that would mean a certain loss for the insurer and reduction of possible earnings. Each type of insurance must define the following: the object of the insurance, the risks associated with an object that is ensured, the period of time that an insurance policy provides coverage and the form of damage cover (Stanić, Glavaš, 2013).
An essential characteristic of every manager is the ability to manage other people, including himself. It is very important to know how to manage individu-als and groups, as well as having the necessary com-munication skills. Various skills and knowledge are needed for a successful performance of such a com-plex operation, such as: technical skills (the appli-cation of specific professional knowledge acquired through training and experience), the art of dealing with people, the ability to work with others, under-standing, motivation and the ability to analyze and diagnose complex situations.
5.1 Research methodology
The methodology and technology of the scientific and professional work allows efficient and rational management of our own knowledge, but also the knowledge of others (i.e. human resources manage-ment) and management related to integrated theo-retical and practical methods (especially, converting a good idea into quality work) (Zelenika, 2000).
The phenomenon of the management impact on the development of insurance products as a basic com-petitive advantage, so far, has not been explicitly discussed in Croatian literature.
God. XXVIII, BR. 1/2015. str. 129-142 God. XXVIII, BR. 1/2015. str. 129-142
UDK: 65.012.4:368](497.5) / Preliminary communication Jerko Glavaš, Luka Stanić, Damir Šebo: The impact of the managers’ educational level on the developmentof the knowledge-based organizations: The case of insurance companies in Croatia
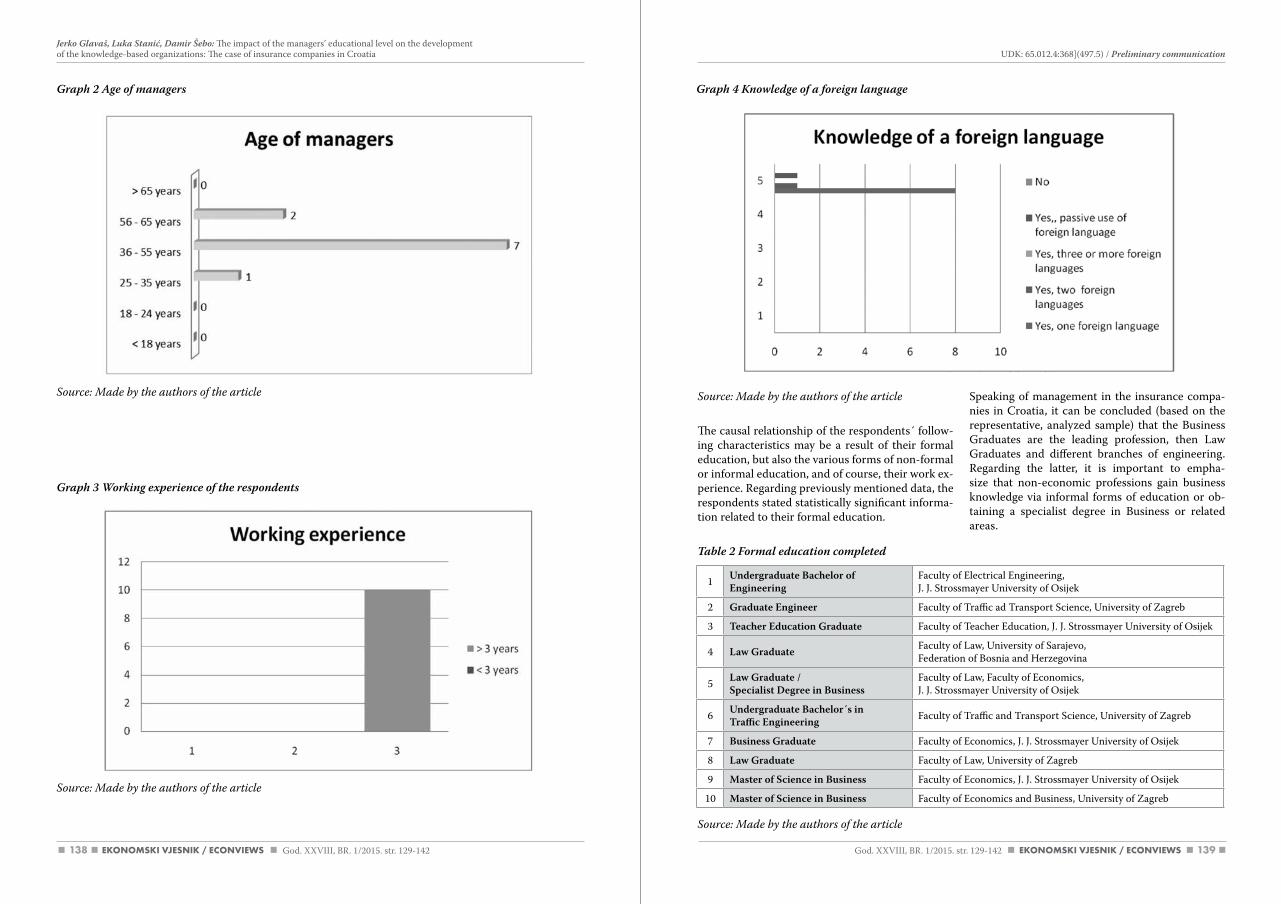
138 139
Source: Made by the authors of the article
The causal relationship of the respondents´ follow-ing characteristics may be a result of their formal education, but also the various forms of non-formal or informal education, and of course, their work ex-perience. Regarding previously mentioned data, the respondents stated statistically significant informa-tion related to their formal education.
Table 2 Formal education completed
Source: Made by the authors of the article
Speaking of management in the insurance compa-nies in Croatia, it can be concluded (based on the representative, analyzed sample) that the Business Graduates are the leading profession, then Law Graduates and different branches of engineering. Regarding the latter, it is important to empha-size that non-economic professions gain business knowledge via informal forms of education or ob-taining a specialist degree in Business or related areas.
Graph 2 Age of managers Graph 4 Knowledge of a foreign language
Source: Made by the authors of the article
Graph 3 Working experience of the respondents
Source: Made by the authors of the article
1 Undergraduate Bachelor of Engineering
Faculty of Electrical Engineering,J. J. Strossmayer University of Osijek
2 Graduate Engineer Faculty of Traffic ad Transport Science, University of Zagreb
3 Teacher Education Graduate Faculty of Teacher Education, J. J. Strossmayer University of Osijek
4 Law Graduate Faculty of Law, University of Sarajevo,Federation of Bosnia and Herzegovina
5 Law Graduate /Specialist Degree in Business
Faculty of Law, Faculty of Economics,J. J. Strossmayer University of Osijek
6 Undergraduate Bachelor´s inTraffic Engineering Faculty of Traffic and Transport Science, University of Zagreb
7 Business Graduate Faculty of Economics, J. J. Strossmayer University of Osijek
8 Law Graduate Faculty of Law, University of Zagreb
9 Master of Science in Business Faculty of Economics, J. J. Strossmayer University of Osijek
10 Master of Science in Business Faculty of Economics and Business, University of Zagreb
God. XXVIII, BR. 1/2015. str. 129-142 God. XXVIII, BR. 1/2015. str. 129-142
UDK: 65.012.4:368](497.5) / Preliminary communication Jerko Glavaš, Luka Stanić, Damir Šebo: The impact of the managers’ educational level on the developmentof the knowledge-based organizations: The case of insurance companies in Croatia
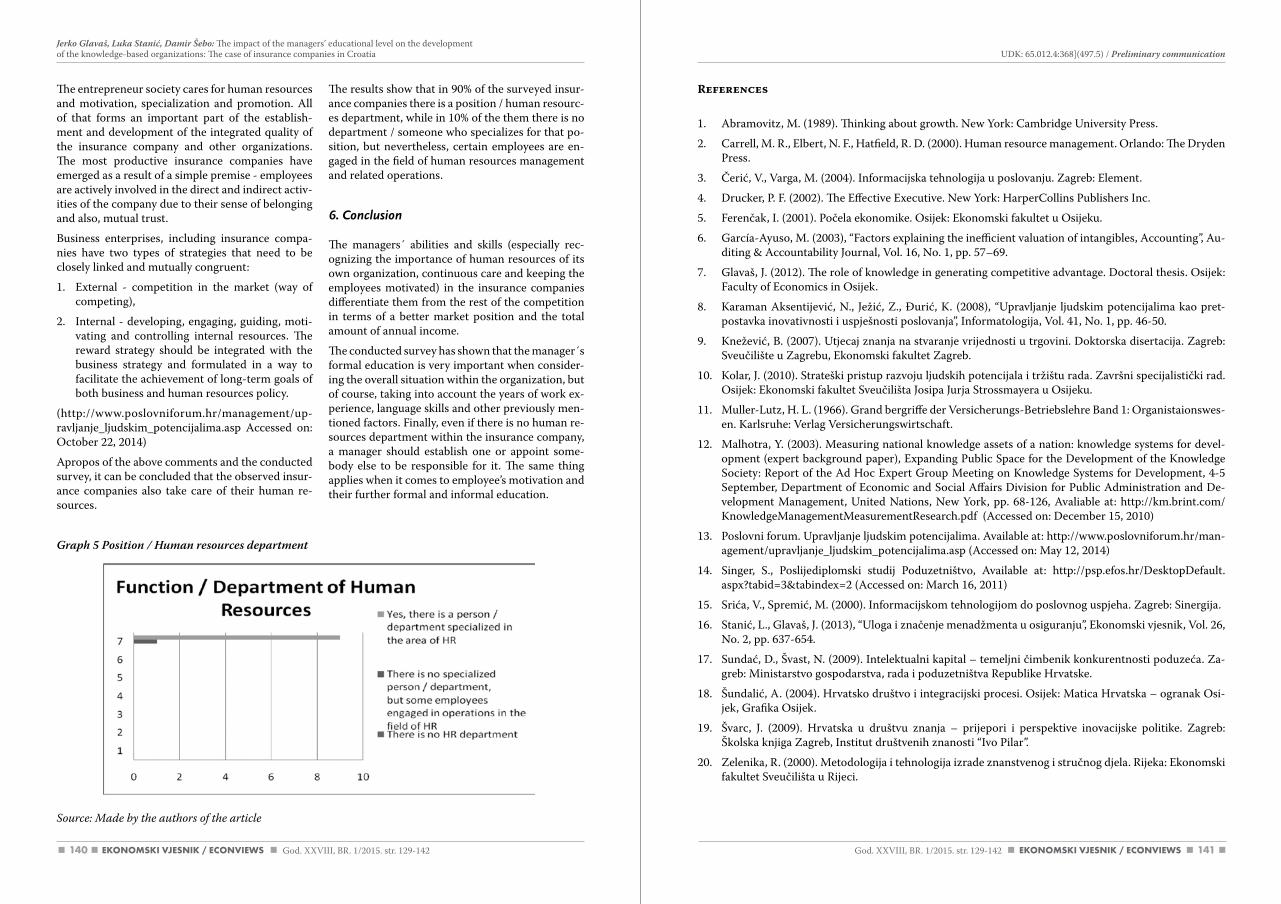
140 141
References
1. Abramovitz, M. (1989). Thinking about growth. New York: Cambridge University Press.
2. Carrell, M. R., Elbert, N. F., Hatfield, R. D. (2000). Human resource management. Orlando: The Dryden Press.
3. Čerić, V., Varga, M. (2004). Informacijska tehnologija u poslovanju. Zagreb: Element.
4. Drucker, P. F. (2002). The Effective Executive. New York: HarperCollins Publishers Inc.
5. Ferenčak, I. (2001). Počela ekonomike. Osijek: Ekonomski fakultet u Osijeku.
6. García-Ayuso, M. (2003), “Factors explaining the inefficient valuation of intangibles, Accounting”, Au-diting & Accountability Journal, Vol. 16, No. 1, pp. 57–69.
7. Glavaš, J. (2012). The role of knowledge in generating competitive advantage. Doctoral thesis. Osijek: Faculty of Economics in Osijek.
8. Karaman Aksentijević, N., Ježić, Z., Đurić, K. (2008), “Upravljanje ljudskim potencijalima kao pret-postavka inovativnosti i uspješnosti poslovanja”, Informatologija, Vol. 41, No. 1, pp. 46-50.
9. Knežević, B. (2007). Utjecaj znanja na stvaranje vrijednosti u trgovini. Doktorska disertacija. Zagreb: Sveučilište u Zagrebu, Ekonomski fakultet Zagreb.
10. Kolar, J. (2010). Strateški pristup razvoju ljudskih potencijala i tržištu rada. Završni specijalistički rad. Osijek: Ekonomski fakultet Sveučilišta Josipa Jurja Strossmayera u Osijeku.
11. Muller-Lutz, H. L. (1966). Grand bergriffe der Versicherungs-Betriebslehre Band 1: Organistaionswes-en. Karlsruhe: Verlag Versicherungswirtschaft.
12. Malhotra, Y. (2003). Measuring national knowledge assets of a nation: knowledge systems for devel-opment (expert background paper), Expanding Public Space for the Development of the Knowledge Society: Report of the Ad Hoc Expert Group Meeting on Knowledge Systems for Development, 4-5 September, Department of Economic and Social Affairs Division for Public Administration and De-velopment Management, United Nations, New York, pp. 68-126, Avaliable at: http://km.brint.com/KnowledgeManagementMeasurementResearch.pdf (Accessed on: December 15, 2010)
13. Poslovni forum. Upravljanje ljudskim potencijalima. Available at: http://www.poslovniforum.hr/man-agement/upravljanje_ljudskim_potencijalima.asp (Accessed on: May 12, 2014)
14. Singer, S., Poslijediplomski studij Poduzetništvo, Available at: http://psp.efos.hr/DesktopDefault.aspx?tabid=3&tabindex=2 (Accessed on: March 16, 2011)
15. Srića, V., Spremić, M. (2000). Informacijskom tehnologijom do poslovnog uspjeha. Zagreb: Sinergija.
16. Stanić, L., Glavaš, J. (2013), “Uloga i značenje menadžmenta u osiguranju”, Ekonomski vjesnik, Vol. 26, No. 2, pp. 637-654.
17. Sundać, D., Švast, N. (2009). Intelektualni kapital – temeljni čimbenik konkurentnosti poduzeća. Za-greb: Ministarstvo gospodarstva, rada i poduzetništva Republike Hrvatske.
18. Šundalić, A. (2004). Hrvatsko društvo i integracijski procesi. Osijek: Matica Hrvatska – ogranak Osi-jek, Grafika Osijek.
19. Švarc, J. (2009). Hrvatska u društvu znanja – prijepori i perspektive inovacijske politike. Zagreb: Školska knjiga Zagreb, Institut društvenih znanosti “Ivo Pilar”.
20. Zelenika, R. (2000). Metodologija i tehnologija izrade znanstvenog i stručnog djela. Rijeka: Ekonomski fakultet Sveučilišta u Rijeci.
The entrepreneur society cares for human resources and motivation, specialization and promotion. All of that forms an important part of the establish-ment and development of the integrated quality of the insurance company and other organizations. The most productive insurance companies have emerged as a result of a simple premise - employees are actively involved in the direct and indirect activ-ities of the company due to their sense of belonging and also, mutual trust.
Business enterprises, including insurance compa-nies have two types of strategies that need to be closely linked and mutually congruent:
1. External - competition in the market (way of competing),
2. Internal - developing, engaging, guiding, moti-vating and controlling internal resources. The reward strategy should be integrated with the business strategy and formulated in a way to facilitate the achievement of long-term goals of both business and human resources policy.
(http://www.poslovniforum.hr/management/up-ravljanje_ljudskim_potencijalima.asp Accessed on: October 22, 2014)
Apropos of the above comments and the conducted survey, it can be concluded that the observed insur-ance companies also take care of their human re-sources.
Graph 5 Position / Human resources department
Source: Made by the authors of the article
The results show that in 90% of the surveyed insur-ance companies there is a position / human resourc-es department, while in 10% of the them there is no department / someone who specializes for that po-sition, but nevertheless, certain employees are en-gaged in the field of human resources management and related operations.
6. Conclusion
The managers´ abilities and skills (especially rec-ognizing the importance of human resources of its own organization, continuous care and keeping the employees motivated) in the insurance companies differentiate them from the rest of the competition in terms of a better market position and the total amount of annual income.
The conducted survey has shown that the manager´s formal education is very important when consider-ing the overall situation within the organization, but of course, taking into account the years of work ex-perience, language skills and other previously men-tioned factors. Finally, even if there is no human re-sources department within the insurance company, a manager should establish one or appoint some-body else to be responsible for it. The same thing applies when it comes to employee’s motivation and their further formal and informal education.
God. XXVIII, BR. 1/2015. str. 129-142 God. XXVIII, BR. 1/2015. str. 129-142
UDK: 65.012.4:368](497.5) / Preliminary communication Jerko Glavaš, Luka Stanić, Damir Šebo: The impact of the managers’ educational level on the developmentof the knowledge-based organizations: The case of insurance companies in Croatia
143142
Melita Balas Rant: Competing via creation of distinctive organizational competences: “How to do it”
1. Introduction
Competitive advantage is defined as the wedge be-tween the value a company creates for the customer and the relative costs of producing this value; for a competitive advantage to exist these gaps should be greater than those of competitors (Brandenburger, Stuart, 1996). Every product/service creates a spe-cific value for customers (Anderson, Narus, Van
Rossum, 2006). The conceptual basis of customer value is referred as value proposition (Barnes, Blake, Pinder, 2009), distinct ways of competing (Por-ter, 1985), or value discipline (Treacy, Wiersema, 1993). Distinct ways of competing are broadly cat-egorized into three generic types: product leader-ship, customer intimacy and operational excellence. These value propositions are mutually exclusive and should be carried out by different business organi-zations (Hagel, Singer, 1999).
COMPETING VIA CREATION OF DISTINCTIVE ORGANIZATIONAL COMPETENCES: “HOW TO DO IT”
UDK: 339.137.2:65.01Preliminary communication
Received: March 26, 2015accepted for publishing: May 24, 2015
Melita Balas Rant University of ljubljanaFaculty of EconomicsKardeljeva ploščad 17, 1000 ljubljana, [email protected]: +38641779088
Abstract
The purpose of this paper is twofold: (1) to identify specific and generic organizational competences that comprise three different types of competitive advantages – product leadership, customer intimacy and op-erational excellence – and (2) to identify processes and approaches by which identified organizational com-petences are developed. Using the multi-case study approach, the main findings come into two tentative theory building conclusions. (1) Behind different ways of competing there are only four distinct organiza-tional competences – innovation competence, competence of managing business risks, operational compe-tence and stakeholder influence competence. These four competences form three distinct ways of compet-ing: competing via product leadership, competing via customer intimacy and competing via operational excellence. (2) All four organizational competences are composed of nine organizational processes and approaches: bonding, attracting, showcasing, specialization, capitalization, internationalization, specializa-tion, quality control, cost monitoring, and shielding. However, due to the case study research design, this paper provides limited generalizability and thus calls for validations via quantitative research approaches.
Keywords: Competitive advantage, value proposition, organizational competences, competence creation processes.
Jerko GlavašLuka StanićDamir Šebo
Utjecaj razine obrazovanosti menadžera na razvoj organizacije temeljene na znanju: Slučaj osiguravajućih društava u RepubliciHrvatskoj
Sažetak
Ključni cilj znanstveno-istraživačkoga rada je identificirati ključne faktore gospodarstva znanja koji imaju izravan utjecaj na postizanje ekonomskoga rasta nacionalne ekonomije u okvirima Europske unije. Analizirajući imenovane varijable kroz provođenje primarnoga istraživanja u sektoru osiguranja (osiguravajućih društava) kreirat će se model konkurentnosti u uvjetima gospodarstva znanja temeljen na navedenom istraživanju i dokazanim hipotezama u provedenom istraživanju.
Kroz analizu dobivenih rezultata potrebno je utvrditi najvažnije grupe varijabli koje utječu na gospodarski rast i konkurentsku prednost. Postavka istraživanja temelji se na tri ključne varijable: obrazovanju, znanju i ljudskim potencijalima.
Analizom rezultata istraživanja utvrdit će se statistički značajni elementi povezanosti između prethodno spomenutih varijabli te će se analizirati međusobni utjecaj varijabli na konkurentsku prednost promatranih osiguravajućih društava.
Ključne riječi: menadžment, obrazovanje, znanje, osiguranje, Republika Hrvatska
God. XXVIII, BR. 1/2015. str. 129-142
Jerko Glavaš, Luka Stanić, Damir Šebo: The impact of the managers’ educational level on the developmentof the knowledge-based organizations: The case of insurance companies in Croatia
God. XXVIII, BR. 1/2015. str. 143-159
144 145
halad, Hamel, 1990). The core competences present distinct clusters of knowledge that differentiate a company strategically from competitors. Distinct knowledge is hidden and embedded in technical systems, skills of employees, and managerial sys-tems and deeply rooted in values (Leonard Barton, 1992). These distinct technical systems, skills of employees, and managerial systems and value com-petitors cannot easily be copied by competitors; therefore they are asymmetric across companies – also referred to as organizational asymmetries - and thus compose the essence of the competitive advan-tage (Miller, 2003).
From an economic, competitive and cultural per-spective, there are three different types of business-es (Treacy, Wiersema, 1993): product leadership, customer intimacy, and operational excellence. Customer intimacy and operational excellence are different types of core competences behind product leadership,. The core competence behind product leadership is product innovation defined as the ca-pacity to conceive attractive new products and ser-vices and commercialize them (Hagel, Singer, 1999). The core competence behind customer intimacy is customer relationship management defined as the capacity to identify, find, acquire and build relation-ships with customers. The core organizational com-petence behind operational excellence is infrastruc-ture management defined as the capacity to build and manage facilities for high volume, repetitive operational tasks.
These core organizational competences behind dif-ferent types of competitive advantages provide lit-tle how-to advice to managers. A more fine-grained view of different organizational competences that fuel competitive advantage in product leadership, customer intimacy and operational excellence is needed. “What specific and generic organizational competences compose different types of competi-tive advantages and how these organizational com-petences are developed” is the focus of the research here.
3. Research methodology
We used a longitudinal case-study design (Eisen-hardt, 1989; Yin, 1996) and took a grounded ap-proach (Glaser, Strauss, 1967). The grounded theory approach requires researchers to ignore the litera-
ture of theory and fact on the area under study. Be-cause it is difficult to enter the field without precon-ceptions of organizational competences in mind, we followed Gavetti and Rivkin’s (2007) approach and tried to distinguish the notions of organizational competences with which we entered the field from concepts that we truly induced. To minimize the likelihood of replacement of actual findings with the preconception of organizational competences, the research design triangulated multiple data-col-lection methods, employed quantitative multi-case-study analysis, multiple investigators and multiple interpreters of data. Research methodology design and headings followed Eisenhardt’s (1989) recom-mendations for building theory from case-study research.
3.1 Getting Started
We started the research with a research question regarding what specific and generic organizational competences compose competitive advantages of product leadership, customer intimacy or opera-tional excellence, how these organizational compe-tences are developed and what distinctive learning processes lie behind each competence develop-ment. We began the data gathering process with preconceptions that organizational competences are a distinct composition of skills, knowledge, pro-cesses, relationship, proper ties, or outputs that fuel different types of competitive advantages. We re-corded these preconceptions in a document that is available from the author. We identified constructs at this stage and did not articulate a hypotheses, in order to maintain theoretical flexibility.
3.2 Selecting Cases
First, we needed to find companies with a distinct competitive advantage in three value disciplines – product leadership, customer intimacy and op-erational excellence. We approached that task by examining the business magazines, professional magazines, the Internet , business and professional circles and compiled a list of 15 Slovene compa-nies– Atech, Akrapovič, BiaSeparation, Bisol, Eu-rolabel, Hidria, Genelitik, GenePlanet, Instrumen-tation Technologies, Metrel, Optotek, Pipistrel,
Each value proposition has distinctive organiza-tional competences behind it. In theory, distinctive organizational competence behind product leader-ship is the capacity to conceive attractive new prod-ucts and services and commercialize them (Hagel, Singer, 1999). Distinctive organizational compe-tence behind customer intimacy is the capacity to identify, find, acquire and build relationships with customers. Distinctive organizational competence behind operational excellence is the capacity to build and manage facilities for high volume, repeti-tive operational tasks.
These core organizational competences behind different types of competitive advantages provide little how-to advice to managers. There is a need for a more fine-grained view of different organiza-tional competences that fuel competitive advantage in product leadership, customer intimacy and op-erational excellence. “What specific and generic or-ganizational competences compose different types of competitive advantages and how these organiza-tional competences are developed” is the focus of this research. Development of distinctive organi-zational competences is closely related to organi-zational learning, more specifically to knowledge creation (Argote, Ophir, 2002). Knowledge creation is about developing specific skills, expertise, pro-cesses, relationship, and outputs that (1) results in superior performance and (2) competitors are un-likely to acquire or copy in a cost or time-effective way (Miller, 2003). Knowledge creation is about development of VRIO resources that fuel the com-petitive advantage of the firm (Barney, 1997). Or-ganizational capabilities or competences build and manipulate existing VRIO resources of the firm (Ei-senhardt, Martin, 2000).
Though the essence of competitive success are or-ganizational competences (Prahalad, Hamel, 1990), existing literature provides little guidance how to create distinctive organizational competences that will result in a competitive advantage in product leadership, customer intimacy or operational excel-lence.
This paper aims to help fill this gap by studying how organizations detect, create and leverage distinc-tive organizational competences - skills, knowledge, processes, relationship, proper ties, or outputs an organization possesses – to sustain a competitive advantage in product leadership, customer intima-cy or operational excellence.
To do so, we used a longitudinal case-study design. We used the concept of organizational learning as a frame of reference and applied it to three different business organizations – Pipistrel with a competi-tive advantage in product leadership, BiaSeparation with a competitive advantage in customer intimacy and Optotek in operational excellence – to grasp how business organizations develop valuable skills, knowledge, processes, relationship, proper ties, or outputs and sustain a competitive advantage of product leadership, customer intimacy or opera-tional excellence over time. Thus, our paper has an inductive part and a deductive part (Gavetti, Rivkin, 2007). The inductive part uses detailed observation of the knowledge creation process of three compa-nies, Pipistrel, BiaSeparation and Optotek in order to identify often overlooked constructs that can play a crucial role in the knowledge creation process. The deductive part steps beyond our three focal firms and asks what our findings imply, in theoreti-cal generality, about how the process of knowledge creation/acquisition empowers the competitive ad-vantage of the firm.
The remainder of this paper is organized into four parts. The second section briefly discusses differ-ent types of competitive advantage and organiza-tional competences. The third section outlines the research design as suggested by Eisenhardt’s (1989) recommendation for building theory from case-study research. It introduces how cases were select-ed, the research instrument was crafted, and data were gathered and analyzed. Following Eisenhardt’s (1989) recommendations, the fourth section aims to come up with relevant hypothesis and unfolds the literature around how organizations detect, create and leverage distinctive organizational competenc-es. The final section comes up with some tentative closures.
2. Types of competitive advantage
Different types of competitive advantages build on different economic logics of the business, the nature of competitive battles and cultural impera-tives (Hagel, Singer, 1999). To leverage these dif-ferent economic, competitive and cultural impera-tives, specific competences are needed. Roots of competitive advantage are core competences (Pra-
UDK: 339.137.2:65.01 / Preliminary communication Melita Balas Rant: Competing via creation of distinctive organizational competences: “How to do it”
God. XXVIII, BR. 1/2015. str. 143-159 God. XXVIII, BR. 1/2015. str. 143-159
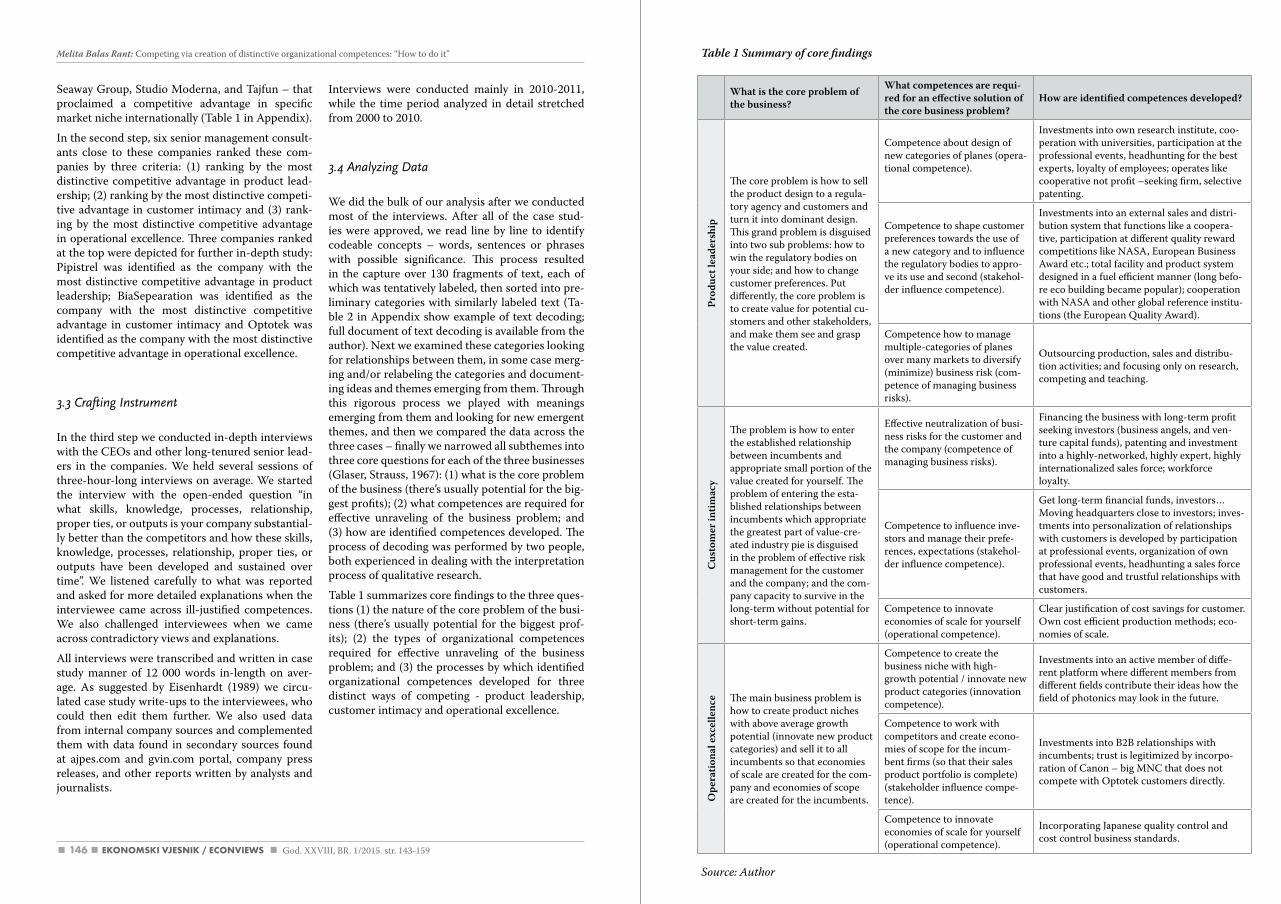
146
Table 1 Summary of core findings
Source: author
Seaway Group, Studio Moderna, and Tajfun – that proclaimed a competitive advantage in specific market niche internationally (Table 1 in Appendix).
In the second step, six senior management consult-ants close to these companies ranked these com-panies by three criteria: (1) ranking by the most distinctive competitive advantage in product lead-ership; (2) ranking by the most distinctive competi-tive advantage in customer intimacy and (3) rank-ing by the most distinctive competitive advantage in operational excellence. Three companies ranked at the top were depicted for further in-depth study: Pipistrel was identified as the company with the most distinctive competitive advantage in product leadership; BiaSepearation was identified as the company with the most distinctive competitive advantage in customer intimacy and Optotek was identified as the company with the most distinctive competitive advantage in operational excellence.
3.3 Crafting Instrument
In the third step we conducted in-depth interviews with the CEOs and other long-tenured senior lead-ers in the companies. We held several sessions of three-hour-long interviews on average. We started the interview with the open-ended question “in what skills, knowledge, processes, relationship, proper ties, or outputs is your company substantial-ly better than the competitors and how these skills, knowledge, processes, relationship, proper ties, or outputs have been developed and sustained over time”. We listened carefully to what was reported and asked for more detailed explanations when the interviewee came across ill-justified competences. We also challenged interviewees when we came across contradictory views and explanations.
All interviews were transcribed and written in case study manner of 12 000 words in-length on aver-age. As suggested by Eisenhardt (1989) we circu-lated case study write-ups to the interviewees, who could then edit them further. We also used data from internal company sources and complemented them with data found in secondary sources found at ajpes.com and gvin.com portal, company press releases, and other reports written by analysts and journalists.
Interviews were conducted mainly in 2010-2011, while the time period analyzed in detail stretched from 2000 to 2010.
3.4 Analyzing Data
We did the bulk of our analysis after we conducted most of the interviews. After all of the case stud-ies were approved, we read line by line to identify codeable concepts – words, sentences or phrases with possible significance. This process resulted in the capture over 130 fragments of text, each of which was tentatively labeled, then sorted into pre-liminary categories with similarly labeled text (Ta-ble 2 in Appendix show example of text decoding; full document of text decoding is available from the author). Next we examined these categories looking for relationships between them, in some case merg-ing and/or relabeling the categories and document-ing ideas and themes emerging from them. Through this rigorous process we played with meanings emerging from them and looking for new emergent themes, and then we compared the data across the three cases – finally we narrowed all subthemes into three core questions for each of the three businesses (Glaser, Strauss, 1967): (1) what is the core problem of the business (there’s usually potential for the big-gest profits); (2) what competences are required for effective unraveling of the business problem; and (3) how are identified competences developed. The process of decoding was performed by two people, both experienced in dealing with the interpretation process of qualitative research.
Table 1 summarizes core findings to the three ques-tions (1) the nature of the core problem of the busi-ness (there’s usually potential for the biggest prof-its); (2) the types of organizational competences required for effective unraveling of the business problem; and (3) the processes by which identified organizational competences developed for three distinct ways of competing - product leadership, customer intimacy and operational excellence.
What is the core problem of the business?
What competences are requi-red for an effective solution of the core business problem?
How are identified competences developed?
Prod
uct l
eade
rshi
p
The core problem is how to sell the product design to a regula-tory agency and customers and turn it into dominant design. This grand problem is disguised into two sub problems: how to win the regulatory bodies on your side; and how to change customer preferences. Put differently, the core problem is to create value for potential cu-stomers and other stakeholders, and make them see and grasp the value created.
Competence about design of new categories of planes (opera-tional competence).
Investments into own research institute, coo-peration with universities, participation at the professional events, headhunting for the best experts, loyalty of employees; operates like cooperative not profit –seeking firm, selective patenting.
Competence to shape customer preferences towards the use of a new category and to influence the regulatory bodies to appro-ve its use and second (stakehol-der influence competence).
Investments into an external sales and distri-bution system that functions like a coopera-tive, participation at different quality reward competitions like NASA, European Business Award etc.; total facility and product system designed in a fuel efficient manner (long befo-re eco building became popular); cooperation with NASA and other global reference institu-tions (the European Quality Award).
Competence how to manage multiple-categories of planes over many markets to diversify (minimize) business risk (com-petence of managing business risks).
Outsourcing production, sales and distribu-tion activities; and focusing only on research, competing and teaching.
Cus
tom
er in
timac
y
The problem is how to enter the established relationship between incumbents and appropriate small portion of the value created for yourself. The problem of entering the esta-blished relationships between incumbents which appropriate the greatest part of value-cre-ated industry pie is disguised in the problem of effective risk management for the customer and the company; and the com-pany capacity to survive in the long-term without potential for short-term gains.
Effective neutralization of busi-ness risks for the customer and the company (competence of managing business risks).
Financing the business with long-term profit seeking investors (business angels, and ven-ture capital funds), patenting and investment into a highly-networked, highly expert, highly internationalized sales force; workforce loyalty.
Competence to influence inve-stors and manage their prefe-rences, expectations (stakehol-der influence competence).
Get long-term financial funds, investors… Moving headquarters close to investors; inves-tments into personalization of relationships with customers is developed by participation at professional events, organization of own professional events, headhunting a sales force that have good and trustful relationships with customers.
Competence to innovate economies of scale for yourself (operational competence).
Clear justification of cost savings for customer. Own cost efficient production methods; eco-nomies of scale.
Ope
ratio
nal e
xcel
lenc
e The main business problem is how to create product niches with above average growth potential (innovate new product categories) and sell it to all incumbents so that economies of scale are created for the com-pany and economies of scope are created for the incumbents.
Competence to create the business niche with high-growth potential / innovate new product categories (innovation competence).
Investments into an active member of diffe-rent platform where different members from different fields contribute their ideas how the field of photonics may look in the future.
Competence to work with competitors and create econo-mies of scope for the incum-bent firms (so that their sales product portfolio is complete) (stakeholder influence compe-tence).
Investments into B2B relationships with incumbents; trust is legitimized by incorpo-ration of Canon – big MNC that does not compete with Optotek customers directly.
Competence to innovate economies of scale for yourself (operational competence).
Incorporating Japanese quality control and cost control business standards.
Melita Balas Rant: Competing via creation of distinctive organizational competences: “How to do it”
God. XXVIII, BR. 1/2015. str. 143-159
148 149
of organizational competences that are required for the effective resolution of different features of the business problem: (1) generic organizational competences that do not dependent on the nature of the business problem, and (2) specific organiza-tional competences that depend on the nature of the business problem. Generic competence independ-ent of the nature of the business problem is a com-petence to influence and manage the expectations of most relevant external stakeholders (customers, investors, regulators etc.). This is aligned with the Frooman (1999) proposition that the competence to influence stakeholders is the core VRIO resource of the firm. Specific organizational competences that depend on the nature of the business problem are: competence to innovate, competence to manage business risk and operational competence.
Proposition 2A. Regardless of the type of com-peting, the required competence for long-term company survival is competence to “influence stakeholders”.
Investments into the development of specific organ-izational competences are valuable only when they are aligned with the nature of the business problem. Research has shown that in addition to competence to influence stakeholders, Pipistrel, which holds a competitive advantage in product leadership, attrib-utes its success to two types of organizational com-petences: competence to innovate, and competence to manage business risk. Competence to innovate is – the capacity to think creatively, to relentlessly pur-sue new product variations, to commercialize them quickly (Treacy and Wiersema, 1993) – is needed to address “how to create and embody the value in a product” aspect as a core business problem.
Competence to innovate enormously increases the business risk due to over-exploration of the novel product categories on the account of exploitation of existing product categories (Levinthal and March, 1993). Due to above the average business risk, com-petence to innovate it has to be complemented with the competence to manage (minimize) business risks. More specifically, capacity to manage the fi-nancial aspect of the business risk is according to the Federation of European Risk Management As-sociation on the increase (Sadgrove, 2005).
Proposition 2B. Establishing the competitive advantage in product leadership requires two competences: innovation competence and com-petence to manage business risks.
In addition to competence to influence stakehold-ers, BiaSeparation, which holds a competitive ad-vantage in customer intimacy, attributes its busi-ness success to operational competence and to competence to innovate. Operational competence is important for effective tailoring of BiaSepara-tion’s generic products (CIM monolithic columns needed for purification of drug concentrates) to adapt specific drug production processes for a di-verse group of customers, ranging from big multi-national pharma companies to small bio-drug start-ups. Their drug production processes are unique, and present the source of the competitive advantage for BiaSeparation’s customers. Their drug produc-tion processes are in most cases wholly protected by patents at the national drug agencies like the FDA in the USA or the EMA in the EU. BiaSeparation holds state-of-the art operational competence in a very narrow product line. Being the only one in the world in this specific product line – the supply of CIM monolithic columns, BiaSeparation’s com-petitive advantage is driven by several drivers: scale, capacity utilization, linkages, vertical integration, location, timing, learning, policy decision and gov-ernment regulations (Porter, 1985).
Yet operational efficiency in tailoring CIM mono-lithic columns to individual customer needs is very expensive due to the fact that big revenues are ex-pected to come with substantial time delay. This creates substantial business risks. “One principle such companies understand well is the difference between profit and loss on a single transaction and profit over the lifetime of their relationships with a single customer” (Treacy and Wiersema, 1993). Operational competence has to be coupled with competence to manage business risk. More specifi-cally, the capacity to manage the commercial aspect of business risk, which presents the highest share of all types of risks according to FERMA (Sadgrove, 2005).
Proposition 2C. Establishing the competitive advantage in customer intimacy requires two competences: operational competence and competence of managing business risks.
Research has shown that Optotek attributes its suc-cess to the competence to innovate, operational competence and competence to influence stake-holders. Optotek seeks ways to minimize overhead costs, to reduce transaction costs, eliminate unnec-essary intermediate production costs, and optimize business processes across functional and organi-
4. Shaping Hypotheses
The fundamental business axiom is that the money lies where the biggest business problems are (Chris-tensen, 2003). Put differently, the tougher the busi-ness problem, the greater the profit creation op-portunities. However, the greatest profit creation opportunities are difficult to see and implement because top decision makers wrestle with cognitive, structural and institutional inertia (Gavetti, 2011). The theory of competitive advantage provides some tentative propositions where to search for biggest money-making opportunities (Brandenburger, Stu-art, 1996), namely to look for solutions that allow (1) effectively creating value for the customer in a completely novel way; (2) efficient capturing part of the customer value (a market pie) for yourself; or (3) effective creation and capturing value from incumbents firms.
The research has shown that the core business prob-lem of Pipistrel, which holds the competitive advan-tage in product leadership, is how to create value for the customer completely anew. In the case of Pipis-trel, creating value for the customer in a completely novel way mainly deals with how to innovate new product categories of UL planes; and how to make prospective customers and aviation regulators – regulators can be viewed as institutional customers - value these novel categories of UL planes. Put dif-ferently, the core business challenge of competing with product leadership is how to create value for the customer completely anew, which can be fur-ther divided into: (1) how to create and embody the value in a product; and (2) how to make others ap-preciate the value embodied in the product (change their structure of preferences).
Proposition 1A. Competing with product leadership is effective when the core business problems are related to: (1) how to create and embody the value in a product; and (2) how to make others appreciate the value embodied in the product (impact their preference structure).
The research has shown that the core business problem of BiaSeparation, which holds the com-petitive advantage in customer intimacy, is efficient capturing part of the customer value (a market pie) for itself. In the case of BiaSeparation, efficiently capturing part of the customer value (a market pie) for yourself mainly deals with how to reduce drug production cost for all kinds of customers ranging
from big pharma companies to small bio-drug firm start-ups; and how to manage business risks of long-term financing of the BiaSeparation business model. Universally speaking, the core business challenge of competing with customer intimacy is how to effi-ciently capture part of the customer value (a market pie) for oneself, which can be further decomposed into: (1) how to create and embody the value in a product that saves cost for customers; and (2) how to manage business risks that originate from short-age of long-term financers.
Proposition 1B. Competing with customer intimacy is effective when the core business problems are related to: (1) how to create and embody the value in a product that saves cost for customers; and (2) how to manage business risks that originate from shortage of long-term financers.
The research has shown that the core business problem of Optotek, which holds the competitive advantage in operational excellence, is the effective creation and capturing value from incumbent firms. In the case of Optotek, the effective creation and capturing value from incumbent firms mainly deals with how to innovate a new product category of medical lasers attractive for big global producers of medical lasers and how to produce this novel prod-uct category in a cost-efficient manner. To general-ize, the core business challenge of competing with operational excellence are: (1) how to enter incum-bents by innovating in a complementary product that create economies of scale for incumbent firms; and (2) how to reduce the production cost for one-self in such a way to maximize economies of scale.
Proposition 1C. Competing with product lead-ership is effective when the core business prob-lems are related to: (1) how to enter incumbents by innovating in a complementary product that create economies of scale for incumbent firms; and (2) how to reduce the production cost for oneself in such a way to maximize economies of scale.
Different types of competitive advantages evolve around different features of the core business prob-lem (Hamel and Heene, 1994, Dosi et al., 1998). The features of the core business problem define or-ganizational competences required for the effective resolution of the different features of the business problem (Gavetti et al., 2007, King et al., 2001, Dosi et al., 2000). Our research has revealed two types
UDK: 339.137.2:65.01 / Preliminary communication Melita Balas Rant: Competing via creation of distinctive organizational competences: “How to do it”
God. XXVIII, BR. 1/2015. str. 143-159 God. XXVIII, BR. 1/2015. str. 143-159
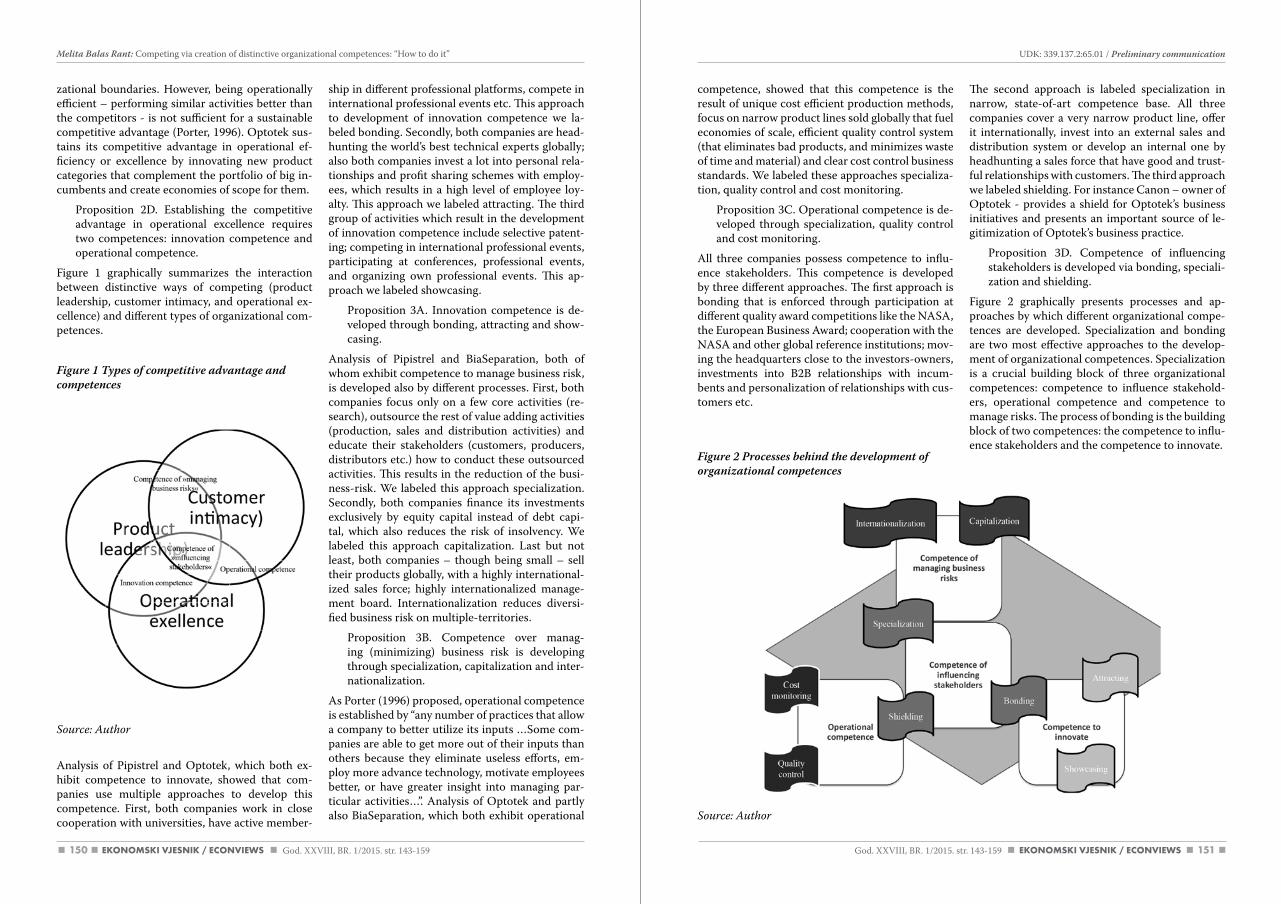
150 151
competence, showed that this competence is the result of unique cost efficient production methods, focus on narrow product lines sold globally that fuel economies of scale, efficient quality control system (that eliminates bad products, and minimizes waste of time and material) and clear cost control business standards. We labeled these approaches specializa-tion, quality control and cost monitoring.
Proposition 3C. Operational competence is de-veloped through specialization, quality control and cost monitoring.
All three companies possess competence to influ-ence stakeholders. This competence is developed by three different approaches. The first approach is bonding that is enforced through participation at different quality award competitions like the NASA, the European Business Award; cooperation with the NASA and other global reference institutions; mov-ing the headquarters close to the investors-owners, investments into B2B relationships with incum-bents and personalization of relationships with cus-tomers etc.
Figure 2 Processes behind the development of organizational competences
Source: author
The second approach is labeled specialization in narrow, state-of-art competence base. All three companies cover a very narrow product line, offer it internationally, invest into an external sales and distribution system or develop an internal one by headhunting a sales force that have good and trust-ful relationships with customers. The third approach we labeled shielding. For instance Canon – owner of Optotek - provides a shield for Optotek’s business initiatives and presents an important source of le-gitimization of Optotek’s business practice.
Proposition 3D. Competence of influencing stakeholders is developed via bonding, speciali-zation and shielding.
Figure 2 graphically presents processes and ap-proaches by which different organizational compe-tences are developed. Specialization and bonding are two most effective approaches to the develop-ment of organizational competences. Specialization is a crucial building block of three organizational competences: competence to influence stakehold-ers, operational competence and competence to manage risks. The process of bonding is the building block of two competences: the competence to influ-ence stakeholders and the competence to innovate.
zational boundaries. However, being operationally efficient – performing similar activities better than the competitors - is not sufficient for a sustainable competitive advantage (Porter, 1996). Optotek sus-tains its competitive advantage in operational ef-ficiency or excellence by innovating new product categories that complement the portfolio of big in-cumbents and create economies of scope for them.
Proposition 2D. Establishing the competitive advantage in operational excellence requires two competences: innovation competence and operational competence.
Figure 1 graphically summarizes the interaction between distinctive ways of competing (product leadership, customer intimacy, and operational ex-cellence) and different types of organizational com-petences.
Figure 1 Types of competitive advantage and competences
Source: author
Analysis of Pipistrel and Optotek, which both ex-hibit competence to innovate, showed that com-panies use multiple approaches to develop this competence. First, both companies work in close cooperation with universities, have active member-
ship in different professional platforms, compete in international professional events etc. This approach to development of innovation competence we la-beled bonding. Secondly, both companies are head-hunting the world’s best technical experts globally; also both companies invest a lot into personal rela-tionships and profit sharing schemes with employ-ees, which results in a high level of employee loy-alty. This approach we labeled attracting. The third group of activities which result in the development of innovation competence include selective patent-ing; competing in international professional events, participating at conferences, professional events, and organizing own professional events. This ap-proach we labeled showcasing.
Proposition 3A. Innovation competence is de-veloped through bonding, attracting and show-casing.
Analysis of Pipistrel and BiaSeparation, both of whom exhibit competence to manage business risk, is developed also by different processes. First, both companies focus only on a few core activities (re-search), outsource the rest of value adding activities (production, sales and distribution activities) and educate their stakeholders (customers, producers, distributors etc.) how to conduct these outsourced activities. This results in the reduction of the busi-ness-risk. We labeled this approach specialization. Secondly, both companies finance its investments exclusively by equity capital instead of debt capi-tal, which also reduces the risk of insolvency. We labeled this approach capitalization. Last but not least, both companies – though being small – sell their products globally, with a highly international-ized sales force; highly internationalized manage-ment board. Internationalization reduces diversi-fied business risk on multiple-territories.
Proposition 3B. Competence over manag-ing (minimizing) business risk is developing through specialization, capitalization and inter-nationalization.
As Porter (1996) proposed, operational competence is established by “any number of practices that allow a company to better utilize its inputs …Some com-panies are able to get more out of their inputs than others because they eliminate useless efforts, em-ploy more advance technology, motivate employees better, or have greater insight into managing par-ticular activities…”. Analysis of Optotek and partly also BiaSeparation, which both exhibit operational
UDK: 339.137.2:65.01 / Preliminary communication Melita Balas Rant: Competing via creation of distinctive organizational competences: “How to do it”
God. XXVIII, BR. 1/2015. str. 143-159 God. XXVIII, BR. 1/2015. str. 143-159
152 153
References
1. Anderson, J. C., Narus, J. A., Van Rossum, W. (2006), “Customer value propositions in business mar-kets”, Harvard Business Review, Vol. 84, No. 3, pp. 90-99.
2. Argote, L., Ophir, R. (2002), “Intraorganizational learning”, in Baum, J. A. (Ed.), The Blackwell compan-ion to organizations, Blackwell Publishers, pp. 181-207.
3. Balas Rant, M. (2013), “Hidden Champions from Slovenia”, in McKiernan, P., Purg, D. (Eds), Hidden Champions in CEE and Turkey, Springer, Berlin, pp. 357-383.
4. Baldwin, C. J., Clark, K. B. (2000). Design Rules. Boston (Ma): The MIT Press.
5. Barnes, C., Blake, H., Pinder, D. (2009). Creating and delivering your value proposition: Managing customer experience for profit. London: Kogan Page Publishers.
6. Barney, J. (1997). Gaining and Sustaining Competitive Advantage. Reading (Ma): Addison-Wesley.
7. Brandenburger, A. M., Stuart, H. (1996), “Value-based business strategy”, Journal of Economics & Management Strategy, Vol. 5, No. 1, pp. 5-24.
8. Christensen, C. M. (2003). The innovator’s solution: Creating and sustaining successful growth. Boston (Ma): Harvard Business Press.
9. Dosi, G., Nelson, R., Winter, S. (2000). The nature and dynamics of organizational capabilities. Oxford: Oxford University Press.
10. Dosi, G., Teece, D. J., Chytry, J. (1998). Technology, organization, and competitiveness. Oxford: Oxford University Press.
11. Eisenhardt, K. M. (1989), “Building Theories from Case Study Research”, Academy of Management Review, Vol. 14, No. 4, pp. 532-550.
12. Eisenhardt, K. M., Martin, J. A. (2000), “Dynamic capabilities: What are they?”, Strategic Management Journal, Vol 21, No. 10-11, pp. 1105-1121.
13. Frooman, J. (1999), “Stakeholder influence strategies”, Academy of Management Review, Vol. 24, No. 2, pp. 191-205.
14. Gavetti, G. (2011), “The New Psychology Of Strategic Leadership”, Harvard Business Review, Vol. 89, No. 7/8, pp. 118-125.
15. Gavetti, G., Levinthal, D., Ocasio, W. (2007), “Neo-Carnegie: The Carnegie School’s Past, Present, and Reconstructing for the Future”, Organization Science, Vol. 18, No. 3, pp. 523-536.
16. Gavetti, G., Rivkin, J. W. (2007), “On the Origin of Strategy: Action and Cognition over Time”, Organi-zation Science, Vol. 18, No. 3, pp. 420-439.
17. Glaser, B. G., Strauss, A. L. (1967). The discovery of grounded theory: Strategies for qualitative re-search. New York: Aldine de Gruyter.
18. Hagel, J., Singer, M. (1999), “Unbundling the corporation”, Harvard Business Review, Vol. 77, No. 2, pp. 133-141.
19. Hamel, G., Heene, A. (1994). Competence-based competition. Malden (Ma): Wiley.
20. King, A. W., Fowler, S. W., Zeithaml, C. P. (2001), “Managing organizational competencies for com-petitive advantage: The Middle-Management Edge”, The Academy of Management Executive, Vol. 15, No. 2, pp. 95-106.
21. Leonard Barton, D. (1992), “Core capabilities and core rigidities: A paradox in managing new product development”, Strategic Management Journal, Vol. 13, Special Issue: Strategy Process: Managing Cor-porate Self-Renewal, pp. 111-125.
5. Concluding Remarks
The processes by which core organizational com-petences that lie behind different types of competi-tive advantages remain a sort of puzzle. This paper aimed to look behind the veil and uncover some of the dominant processes that result in the creation of distinctive organizational competences and sustain-able competitive advantages.
The analysis we conducted here identifies nine pro-cesses that result in four distinct organizational competences: bonding, attracting, showcasing, specialization, capitalization, internationalization, specialization, quality control, cost monitoring, and shielding. The processes of bonding, attracting and showcasing create the organizational competence to innovate. Processes of specialization, capitaliza-tion, and internationalization create organizational competence to manage (minimize) risk. The pro-cesses of specialization, quality control, and cost monitoring build up the organizational competence of operational efficiency. And finally, the processes of bonding, specialization and shielding result in or-ganizational competence to influence stakeholders.
Furthermore, our research revealed that differ-ent organizational competences result in different types of competitive advantage. Competence to in-fluence stakeholders, competence to innovate and competence to manage risk result in a competitive advantage in product leadership. Competence to influence stakeholders, competence to manage risk and operational competence result in a competi-tive advantage in customer intimacy. Competence to influence stakeholders, competence to innovate and operational competence result in a competitive advantage in operational excellence.
Though product leadership, customer intimacy and operational excellence are three distinct, mutually exclusive ways of competing, our research revealed (1) that they are all built out of four organizational competences and (2) that these four organizational competences are developed by similar knowledge creation processes. The distinctive way of compet-ing does not come from different organizational competences or different competence creation pro-cesses, but from different ways of combining these competences into cohesive architectures (Baldwin, Clark, 2000). Each type of organizational compe-tence thus presents a unique module, and competi-tive advantage originates from unique compositions of different modules (organizational competences) together in cohesive wholes.
However, due to the case study approach, the paper provides limited generalizability of conclusions to mainly technologically intensive, small and medium sized companies that are run by entrepreneurial founders. To overcome the research limitation of limited reliability, the author suggests the applica-tion of a similar qualitative research approach to la-bor intensive, large companies with dispersed own-ership and management structure. To overcome the research limitation of limited research validity, the author also suggests the application of a large-scale quantitative research approach on a similar set of companies, namely technologically intensive, small and medium sized companies that are run by entre-preneurial founders.
UDK: 339.137.2:65.01 / Preliminary communication Melita Balas Rant: Competing via creation of distinctive organizational competences: “How to do it”
God. XXVIII, BR. 1/2015. str. 143-159 God. XXVIII, BR. 1/2015. str. 143-159
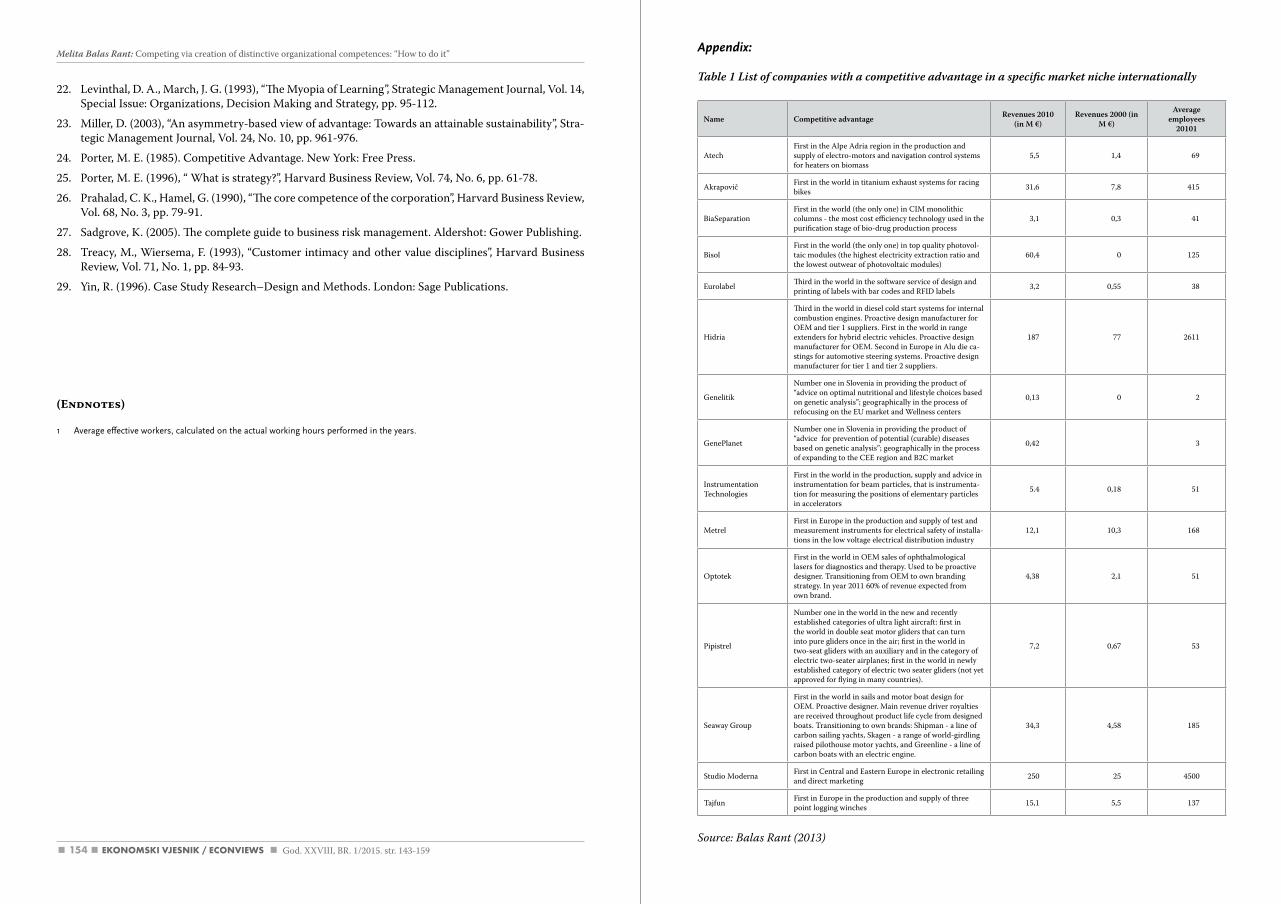
154
Appendix:
Table 1 List of companies with a competitive advantage in a specific market niche internationally
Name Competitive advantage Revenues 2010 (in M €)
Revenues 2000 (in M €)
Average employees
20101
AtechFirst in the Alpe Adria region in the production and supply of electro-motors and navigation control systems for heaters on biomass
5,5 1,4 69
Akrapovič First in the world in titanium exhaust systems for racing bikes 31,6 7,8 415
BiaSeparationFirst in the world (the only one) in CIM monolithic columns - the most cost efficiency technology used in the purification stage of bio-drug production process
3,1 0,3 41
BisolFirst in the world (the only one) in top quality photovol-taic modules (the highest electricity extraction ratio and the lowest outwear of photovoltaic modules)
60,4 0 125
Eurolabel Third in the world in the software service of design and printing of labels with bar codes and RFID labels 3,2 0,55 38
Hidria
Third in the world in diesel cold start systems for internal combustion engines. Proactive design manufacturer for OEM and tier 1 suppliers. First in the world in range extenders for hybrid electric vehicles. Proactive design manufacturer for OEM. Second in Europe in Alu die ca-stings for automotive steering systems. Proactive design manufacturer for tier 1 and tier 2 suppliers.
187 77 2611
Genelitik
Number one in Slovenia in providing the product of “advice on optimal nutritional and lifestyle choices based on genetic analysis”; geographically in the process of refocusing on the EU market and Wellness centers
0,13 0 2
GenePlanet
Number one in Slovenia in providing the product of “advice for prevention of potential (curable) diseases based on genetic analysis”; geographically in the process of expanding to the CEE region and B2C market
0,42 3
Instrumentation Technologies
First in the world in the production, supply and advice in instrumentation for beam particles, that is instrumenta-tion for measuring the positions of elementary particles in accelerators
5.4 0,18 51
MetrelFirst in Europe in the production and supply of test and measurement instruments for electrical safety of installa-tions in the low voltage electrical distribution industry
12,1 10,3 168
Optotek
First in the world in OEM sales of ophthalmological lasers for diagnostics and therapy. Used to be proactive designer. Transitioning from OEM to own branding strategy. In year 2011 60% of revenue expected from own brand.
4,38 2,1 51
Pipistrel
Number one in the world in the new and recently established categories of ultra light aircraft: first in the world in double seat motor gliders that can turn into pure gliders once in the air; first in the world in two-seat gliders with an auxiliary and in the category of electric two-seater airplanes; first in the world in newly established category of electric two seater gliders (not yet approved for flying in many countries).
7,2 0,67 53
Seaway Group
First in the world in sails and motor boat design for OEM. Proactive designer. Main revenue driver royalties are received throughout product life cycle from designed boats. Transitioning to own brands: Shipman - a line of carbon sailing yachts, Skagen - a range of world-girdling raised pilothouse motor yachts, and Greenline - a line of carbon boats with an electric engine.
34,3 4,58 185
Studio Moderna First in Central and Eastern Europe in electronic retailing and direct marketing 250 25 4500
Tajfun First in Europe in the production and supply of three point logging winches 15,1 5,5 137
Source: Balas Rant (2013)
22. Levinthal, D. A., March, J. G. (1993), “The Myopia of Learning”, Strategic Management Journal, Vol. 14, Special Issue: Organizations, Decision Making and Strategy, pp. 95-112.
23. Miller, D. (2003), “An asymmetry-based view of advantage: Towards an attainable sustainability”, Stra-tegic Management Journal, Vol. 24, No. 10, pp. 961-976.
24. Porter, M. E. (1985). Competitive Advantage. New York: Free Press.
25. Porter, M. E. (1996), “ What is strategy?”, Harvard Business Review, Vol. 74, No. 6, pp. 61-78.
26. Prahalad, C. K., Hamel, G. (1990), “The core competence of the corporation”, Harvard Business Review, Vol. 68, No. 3, pp. 79-91.
27. Sadgrove, K. (2005). The complete guide to business risk management. Aldershot: Gower Publishing.
28. Treacy, M., Wiersema, F. (1993), “Customer intimacy and other value disciplines”, Harvard Business Review, Vol. 71, No. 1, pp. 84-93.
29. Yin, R. (1996). Case Study Research–Design and Methods. London: Sage Publications.
(Endnotes)
1 Average effective workers, calculated on the actual working hours performed in the years.
Melita Balas Rant: Competing via creation of distinctive organizational competences: “How to do it”
God. XXVIII, BR. 1/2015. str. 143-159
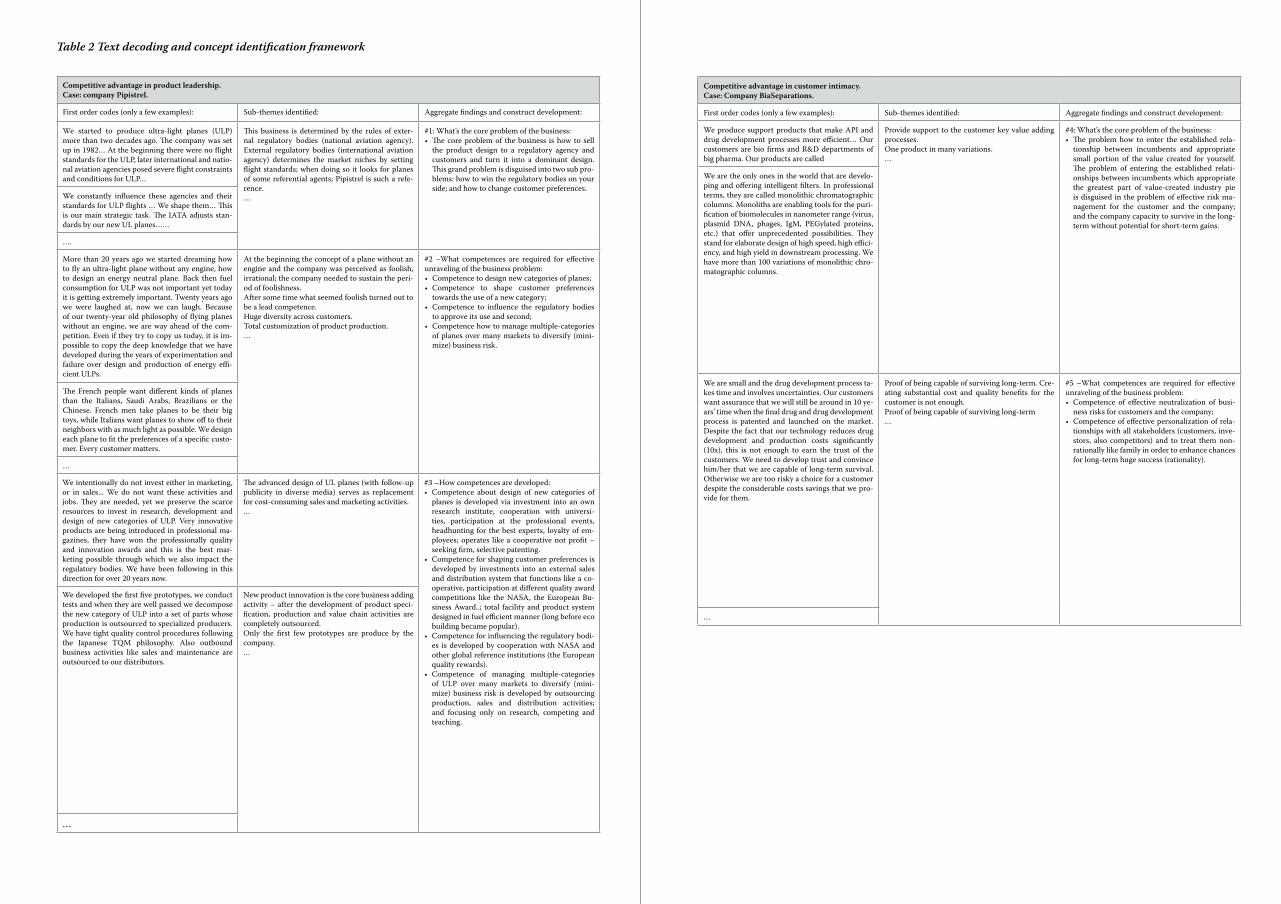
Competitive advantage in customer intimacy.Case: Company BiaSeparations.
First order codes (only a few examples): Sub-themes identified: Aggregate findings and construct development:
We produce support products that make API and drug development processes more efficient… Our customers are bio firms and R&D departments of big pharma. Our products are called
Provide support to the customer key value adding processes. One product in many variations.…
#4: What’s the core problem of the business:• The problem how to enter the established rela-
tionship between incumbents and appropriate small portion of the value created for yourself. The problem of entering the established relati-onships between incumbents which appropriate the greatest part of value-created industry pie is disguised in the problem of effective risk ma-nagement for the customer and the company; and the company capacity to survive in the long-term without potential for short-term gains.
We are the only ones in the world that are develo-ping and offering intelligent filters. In professional terms, they are called monolithic chromatographic columns. Monoliths are enabling tools for the puri-fication of biomolecules in nanometer range (virus, plasmid DNA, phages, IgM, PEGylated proteins, etc.) that offer unprecedented possibilities. They stand for elaborate design of high speed, high effici-ency, and high yield in downstream processing. We have more than 100 variations of monolithic chro-matographic columns.
We are small and the drug development process ta-kes time and involves uncertainties. Our customers want assurance that we will still be around in 10 ye-ars’ time when the final drug and drug development process is patented and launched on the market. Despite the fact that our technology reduces drug development and production costs significantly (10x), this is not enough to earn the trust of the customers. We need to develop trust and convince him/her that we are capable of long-term survival. Otherwise we are too risky a choice for a customer despite the considerable costs savings that we pro-vide for them.
Proof of being capable of surviving long-term. Cre-ating substantial cost and quality benefits for the customer is not enough.Proof of being capable of surviving long-term…
#5 –What competences are required for effective unraveling of the business problem: • Competence of effective neutralization of busi-
ness risks for customers and the company;• Competence of effective personalization of rela-
tionships with all stakeholders (customers, inve-stors, also competitors) and to treat them non-rationally like family in order to enhance chances for long-term huge success (rationality).
…
Table 2 Text decoding and concept identification framework
Competitive advantage in product leadership.Case: company Pipistrel.
First order codes (only a few examples): Sub-themes identified: Aggregate findings and construct development:
We started to produce ultra-light planes (ULP) more than two decades ago. The company was set up in 1982… At the beginning there were no flight standards for the ULP, later international and natio-nal aviation agencies posed severe flight constraints and conditions for ULP…
This business is determined by the rules of exter-nal regulatory bodies (national aviation agency). External regulatory bodies (international aviation agency) determines the market niches by setting flight standards; when doing so it looks for planes of some referential agents; Pipistrel is such a refe-rence.…
#1: What’s the core problem of the business:• The core problem of the business is how to sell
the product design to a regulatory agency and customers and turn it into a dominant design. This grand problem is disguised into two sub pro-blems: how to win the regulatory bodies on your side; and how to change customer preferences.
We constantly influence these agencies and their standards for ULP flights … We shape them… This is our main strategic task. The IATA adjusts stan-dards by our new UL planes……
….
More than 20 years ago we started dreaming how to fly an ultra-light plane without any engine, how to design an energy neutral plane. Back then fuel consumption for ULP was not important yet today it is getting extremely important. Twenty years ago we were laughed at, now we can laugh. Because of our twenty-year old philosophy of flying planes without an engine, we are way ahead of the com-petition. Even if they try to copy us today, it is im-possible to copy the deep knowledge that we have developed during the years of experimentation and failure over design and production of energy effi-cient ULPs.
At the beginning the concept of a plane without an engine and the company was perceived as foolish, irrational; the company needed to sustain the peri-od of foolishness. After some time what seemed foolish turned out to be a lead competence.Huge diversity across customers.Total customization of product production. …
#2 –What competences are required for effective unraveling of the business problem: • Competence to design new categories of planes; • Competence to shape customer preferences
towards the use of a new category; • Competence to influence the regulatory bodies
to approve its use and second;• Competence how to manage multiple-categories
of planes over many markets to diversify (mini-mize) business risk.
The French people want different kinds of planes than the Italians, Saudi Arabs, Brazilians or the Chinese. French men take planes to be their big toys, while Italians want planes to show off to their neighbors with as much light as possible. We design each plane to fit the preferences of a specific custo-mer. Every customer matters.
…
We intentionally do not invest either in marketing, or in sales... We do not want these activities and jobs. They are needed, yet we preserve the scarce resources to invest in research, development and design of new categories of ULP. Very innovative products are being introduced in professional ma-gazines, they have won the professionally quality and innovation awards and this is the best mar-keting possible through which we also impact the regulatory bodies. We have been following in this direction for over 20 years now.
The advanced design of UL planes (with follow-up publicity in diverse media) serves as replacement for cost-consuming sales and marketing activities.…
#3 –How competences are developed: • Competence about design of new categories of
planes is developed via investment into an own research institute, cooperation with universi-ties, participation at the professional events, headhunting for the best experts, loyalty of em-ployees; operates like a cooperative not profit –seeking firm, selective patenting.
• Competence for shaping customer preferences is developed by investments into an external sales and distribution system that functions like a co-operative, participation at different quality award competitions like the NASA, the European Bu-siness Award..; total facility and product system designed in fuel efficient manner (long before eco building became popular).
• Competence for influencing the regulatory bodi-es is developed by cooperation with NASA and other global reference institutions (the European quality rewards).
• Competence of managing multiple-categories of ULP over many markets to diversify (mini-mize) business risk is developed by outsourcing production, sales and distribution activities; and focusing only on research, competing and teaching.
We developed the first five prototypes, we conduct tests and when they are well passed we decompose the new category of ULP into a set of parts whose production is outsourced to specialized producers. We have tight quality control procedures following the Japanese TQM philosophy. Also outbound business activities like sales and maintenance are outsourced to our distributors.
New product innovation is the core business adding activity – after the development of product speci-fication, production and value chain activities are completely outsourced.Only the first few prototypes are produce by the company.…
…
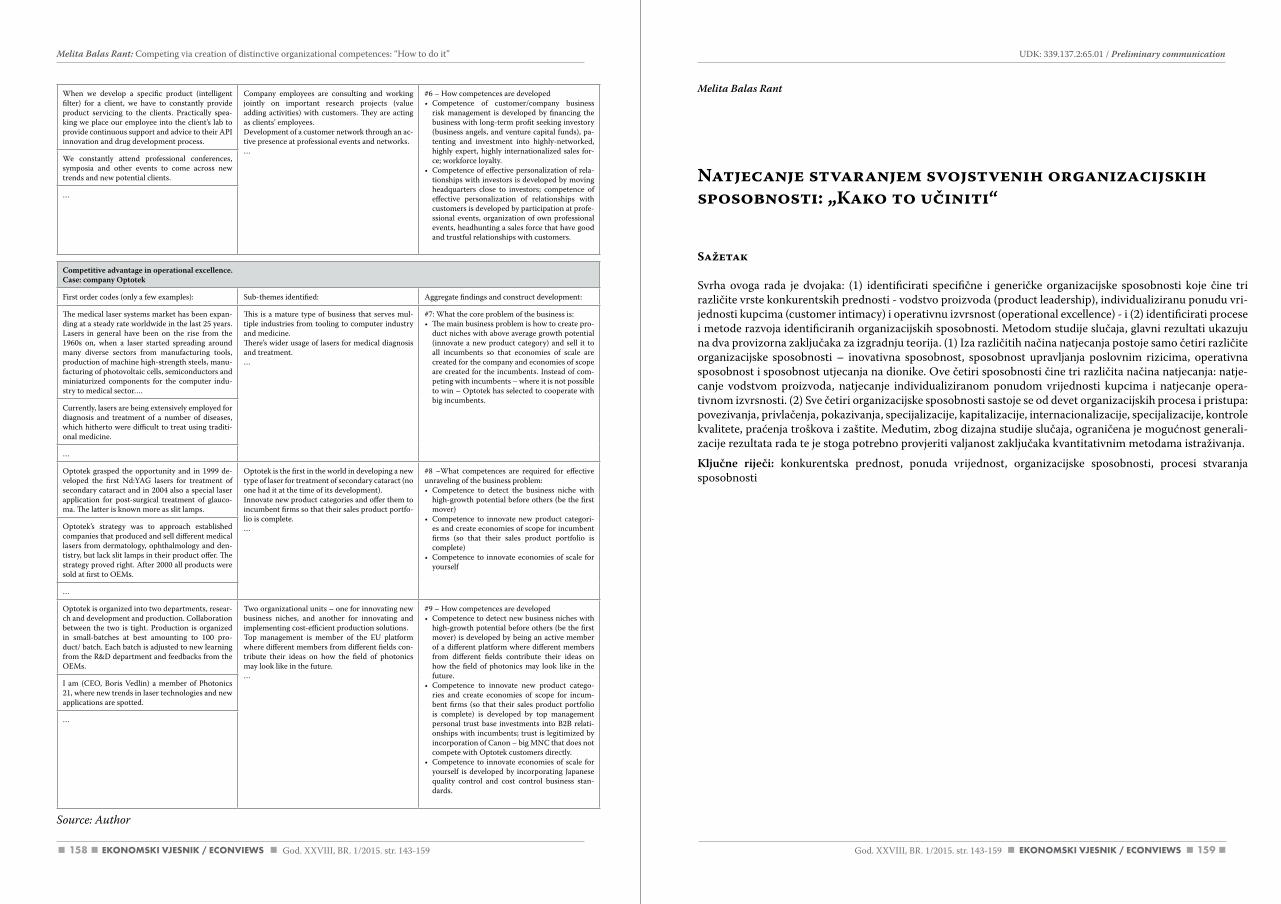
Melita Balas Rant
Natjecanje stvaranjem svojstvenih organizacijskih sposobnosti: „Kako to učiniti“
Sažetak
Svrha ovoga rada je dvojaka: (1) identificirati specifične i generičke organizacijske sposobnosti koje čine tri različite vrste konkurentskih prednosti - vodstvo proizvoda (product leadership), individualiziranu ponudu vri-jednosti kupcima (customer intimacy) i operativnu izvrsnost (operational excellence) - i (2) identificirati procese i metode razvoja identificiranih organizacijskih sposobnosti. Metodom studije slučaja, glavni rezultati ukazuju na dva provizorna zaključaka za izgradnju teorija. (1) Iza različitih načina natjecanja postoje samo četiri različite organizacijske sposobnosti – inovativna sposobnost, sposobnost upravljanja poslovnim rizicima, operativna sposobnost i sposobnost utjecanja na dionike. Ove četiri sposobnosti čine tri različita načina natjecanja: natje-canje vodstvom proizvoda, natjecanje individualiziranom ponudom vrijednosti kupcima i natjecanje opera-tivnom izvrsnosti. (2) Sve četiri organizacijske sposobnosti sastoje se od devet organizacijskih procesa i pristupa: povezivanja, privlačenja, pokazivanja, specijalizacije, kapitalizacije, internacionalizacije, specijalizacije, kontrole kvalitete, praćenja troškova i zaštite. Međutim, zbog dizajna studije slučaja, ograničena je mogućnost generali-zacije rezultata rada te je stoga potrebno provjeriti valjanost zaključaka kvantitativnim metodama istraživanja.
Ključne riječi: konkurentska prednost, ponuda vrijednost, organizacijske sposobnosti, procesi stvaranja sposobnosti
When we develop a specific product (intelligent filter) for a client, we have to constantly provide product servicing to the clients. Practically spea-king we place our employee into the client’s lab to provide continuous support and advice to their API innovation and drug development process.
Company employees are consulting and working jointly on important research projects (value adding activities) with customers. They are acting as clients’ employees.Development of a customer network through an ac-tive presence at professional events and networks.…
#6 – How competences are developed• Competence of customer/company business
risk management is developed by financing the business with long-term profit seeking investory (business angels, and venture capital funds), pa-tenting and investment into highly-networked, highly expert, highly internationalized sales for-ce; workforce loyalty.
• Competence of effective personalization of rela-tionships with investors is developed by moving headquarters close to investors; competence of effective personalization of relationships with customers is developed by participation at profe-ssional events, organization of own professional events, headhunting a sales force that have good and trustful relationships with customers.
We constantly attend professional conferences, symposia and other events to come across new trends and new potential clients.
…
Competitive advantage in operational excellence.Case: company Optotek
First order codes (only a few examples): Sub-themes identified: Aggregate findings and construct development:
The medical laser systems market has been expan-ding at a steady rate worldwide in the last 25 years. Lasers in general have been on the rise from the 1960s on, when a laser started spreading around many diverse sectors from manufacturing tools, production of machine high-strength steels, manu-facturing of photovoltaic cells, semiconductors and miniaturized components for the computer indu-stry to medical sector….
This is a mature type of business that serves mul-tiple industries from tooling to computer industry and medicine.There’s wider usage of lasers for medical diagnosis and treatment.…
#7: What the core problem of the business is:• The main business problem is how to create pro-
duct niches with above average growth potential (innovate a new product category) and sell it to all incumbents so that economies of scale are created for the company and economies of scope are created for the incumbents. Instead of com-peting with incumbents – where it is not possible to win – Optotek has selected to cooperate with big incumbents.
Currently, lasers are being extensively employed for diagnosis and treatment of a number of diseases, which hitherto were difficult to treat using traditi-onal medicine.
…
Optotek grasped the opportunity and in 1999 de-veloped the first Nd:YAG lasers for treatment of secondary cataract and in 2004 also a special laser application for post-surgical treatment of glauco-ma. The latter is known more as slit lamps.
Optotek is the first in the world in developing a new type of laser for treatment of secondary cataract (no one had it at the time of its development).Innovate new product categories and offer them to incumbent firms so that their sales product portfo-lio is complete.…
#8 –What competences are required for effective unraveling of the business problem:• Competence to detect the business niche with
high-growth potential before others (be the first mover)
• Competence to innovate new product categori-es and create economies of scope for incumbent firms (so that their sales product portfolio is complete)
• Competence to innovate economies of scale for yourself
Optotek’s strategy was to approach established companies that produced and sell different medical lasers from dermatology, ophthalmology and den-tistry, but lack slit lamps in their product offer. The strategy proved right. After 2000 all products were sold at first to OEMs.
…
Optotek is organized into two departments, resear-ch and development and production. Collaboration between the two is tight. Production is organized in small-batches at best amounting to 100 pro-duct/ batch. Each batch is adjusted to new learning from the R&D department and feedbacks from the OEMs.
Two organizational units – one for innovating new business niches, and another for innovating and implementing cost-efficient production solutions.Top management is member of the EU platform where different members from different fields con-tribute their ideas on how the field of photonics may look like in the future.…
#9 – How competences are developed• Competence to detect new business niches with
high-growth potential before others (be the first mover) is developed by being an active member of a different platform where different members from different fields contribute their ideas on how the field of photonics may look like in the future.
• Competence to innovate new product catego-ries and create economies of scope for incum-bent firms (so that their sales product portfolio is complete) is developed by top management personal trust base investments into B2B relati-onships with incumbents; trust is legitimized by incorporation of Canon – big MNC that does not compete with Optotek customers directly.
• Competence to innovate economies of scale for yourself is developed by incorporating Japanese quality control and cost control business stan-dards.
I am (CEO, Boris Vedlin) a member of Photonics 21, where new trends in laser technologies and new applications are spotted.
…
Source: author
158 159God. XXVIII, BR. 1/2015. str. 143-159 God. XXVIII, BR. 1/2015. str. 143-159
UDK: 339.137.2:65.01 / Preliminary communication Melita Balas Rant: Competing via creation of distinctive organizational competences: “How to do it”
161God. XXVIII, BR. 1/2015. str. 161-177
Dijana Mečev, Ivana Kardum Goleš: Primary healthcare service quality measurement: SERVQUAL scale
1. Introduction
Ever since the beginning of the 1990s, the health sector in Croatia has experienced significant re-forms, which predominantly comprised the level of primary healthcare protection. The main goal of these reforms was to liberate the system from ex-cessive bureaucracy and to enhance the professional and organizational responsibility of medical work-
ers (Katić et al., 2009) with the purpose of primarily “increasing service quality, providing greater avail-ability of medical care, regulating the number of pa-tients per doctor, improving existing informatiza-tion, and introducing a system of control” (Ministry of Finance, 2014).
The most significant change that was introduced by reforms was the transition which established the medical system as the mixture of public and pri-vate. The majority of doctors working in primary
PRIMARY HEALTHCARE SERVICE QUALITY MEASUREMENT: SERVQUAL SCALE
UDK: 614.2(497.5 Šibenik)Preliminary communication
Received: april 16, 2015accepted for publishing: May 25, 2015
Dijana MečevPolytechnic of Šibenik Trg andrije Hebranga 11, 21000 Šibenik, [email protected] Phone: +385992714269
Ivana Kardum GolešPolytechnic of Šibenik Trg andrije Hebranga 11, 21000 Šibenik, [email protected] Phone: +385989043819
Abstract
The purpose of this study is to examine customers’ perceptions of primary healthcare service quality in public institutions in the city of Šibenik. The research was aimed at investigating whether there is a dif-ference between customers’ expectations and their satisfaction with received medical services. The find-ings suggest that primary healthcare public institutions need to improve all the dimensions of SERVQUAL service quality from the carried out gap analysis. Furthermore, the research analyzed whether there is a difference in the perception of the given healthcare service among examinees considering their gender, age, employment status and frequency of using the mentioned services. It was established that demographic variables of age and gender do not generate significant differences in the perception of healthcare service quality while there is significant difference in satisfaction regarding employment status and frequency of services usage. The given results partially differ from the data acquired in other relevant and similar studies. The factor analysis which was conducted did not confirm “a priori” accepted theoretical model of Parasura-man et al. (1988) which claims that the concept of quality has five dimensions. On the contrary, it reached the conclusion that three highly reliable factors were identified regarding the perceived quality of primary healthcare services.
Keywords: Primary healthcare sector, SERVQUAL, factor analysis, reliability analysis
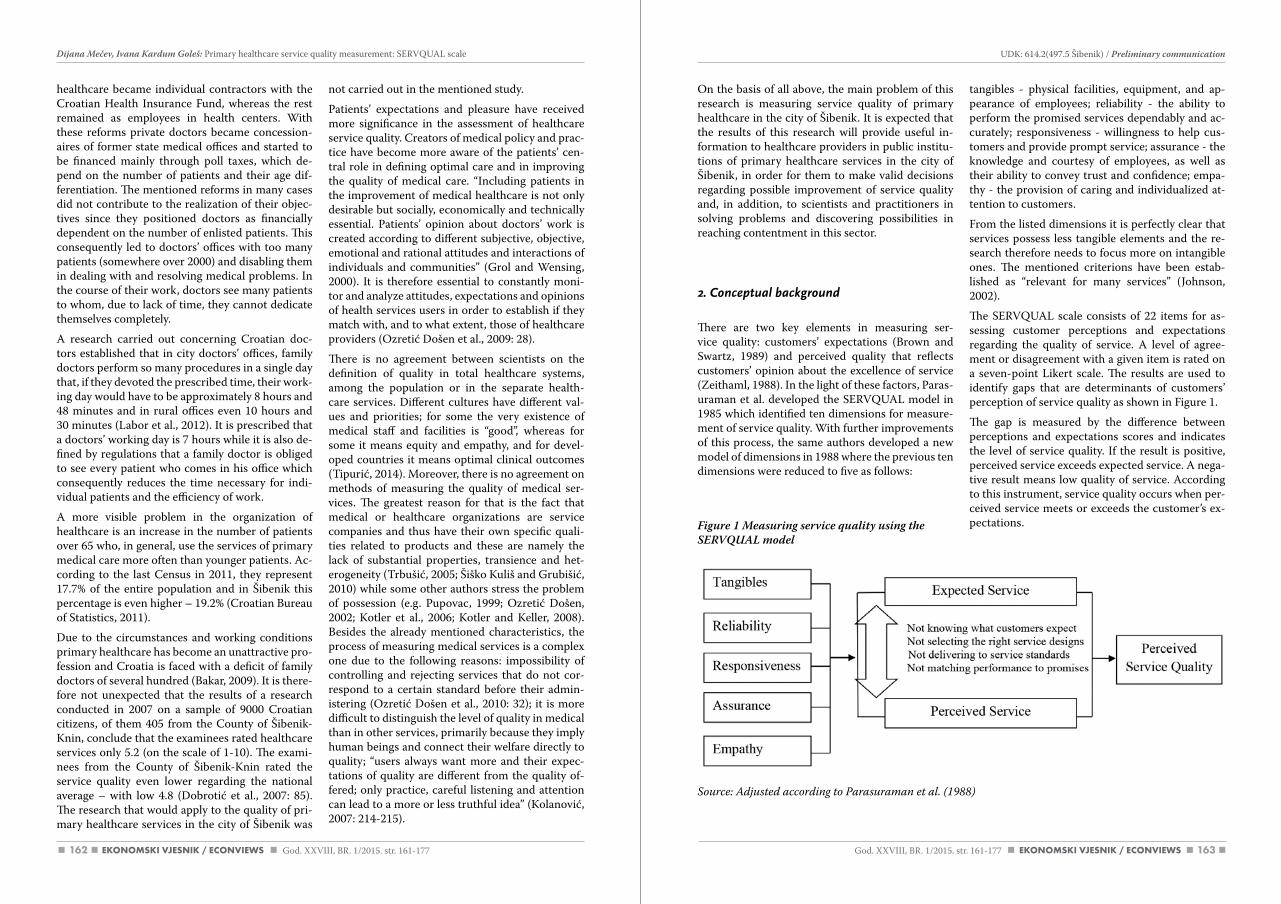
162 163
UDK: 614.2(497.5 Šibenik) / Preliminary communication Dijana Mečev, Ivana Kardum Goleš: Primary healthcare service quality measurement: SERVQUAL scale
God. XXVIII, BR. 1/2015. str. 161-177 God. XXVIII, BR. 1/2015. str. 161-177
On the basis of all above, the main problem of this research is measuring service quality of primary healthcare in the city of Šibenik. It is expected that the results of this research will provide useful in-formation to healthcare providers in public institu-tions of primary healthcare services in the city of Šibenik, in order for them to make valid decisions regarding possible improvement of service quality and, in addition, to scientists and practitioners in solving problems and discovering possibilities in reaching contentment in this sector.
2. Conceptual background
There are two key elements in measuring ser-vice quality: customers’ expectations (Brown and Swartz, 1989) and perceived quality that reflects customers’ opinion about the excellence of service (Zeithaml, 1988). In the light of these factors, Paras-uraman et al. developed the SERVQUAL model in 1985 which identified ten dimensions for measure-ment of service quality. With further improvements of this process, the same authors developed a new model of dimensions in 1988 where the previous ten dimensions were reduced to five as follows:
Figure 1 Measuring service quality using the SERVQUAL model
tangibles - physical facilities, equipment, and ap-pearance of employees; reliability - the ability to perform the promised services dependably and ac-curately; responsiveness - willingness to help cus-tomers and provide prompt service; assurance - the knowledge and courtesy of employees, as well as their ability to convey trust and confidence; empa-thy - the provision of caring and individualized at-tention to customers.
From the listed dimensions it is perfectly clear that services possess less tangible elements and the re-search therefore needs to focus more on intangible ones. The mentioned criterions have been estab-lished as “relevant for many services” (Johnson, 2002).
The SERVQUAL scale consists of 22 items for as-sessing customer perceptions and expectations regarding the quality of service. A level of agree-ment or disagreement with a given item is rated on a seven-point Likert scale. The results are used to identify gaps that are determinants of customers’ perception of service quality as shown in Figure 1.
The gap is measured by the difference between perceptions and expectations scores and indicates the level of service quality. If the result is positive, perceived service exceeds expected service. A nega-tive result means low quality of service. According to this instrument, service quality occurs when per-ceived service meets or exceeds the customer’s ex-pectations.
healthcare became individual contractors with the Croatian Health Insurance Fund, whereas the rest remained as employees in health centers. With these reforms private doctors became concession-aires of former state medical offices and started to be financed mainly through poll taxes, which de-pend on the number of patients and their age dif-ferentiation. The mentioned reforms in many cases did not contribute to the realization of their objec-tives since they positioned doctors as financially dependent on the number of enlisted patients. This consequently led to doctors’ offices with too many patients (somewhere over 2000) and disabling them in dealing with and resolving medical problems. In the course of their work, doctors see many patients to whom, due to lack of time, they cannot dedicate themselves completely.
A research carried out concerning Croatian doc-tors established that in city doctors’ offices, family doctors perform so many procedures in a single day that, if they devoted the prescribed time, their work-ing day would have to be approximately 8 hours and 48 minutes and in rural offices even 10 hours and 30 minutes (Labor et al., 2012). It is prescribed that a doctors’ working day is 7 hours while it is also de-fined by regulations that a family doctor is obliged to see every patient who comes in his office which consequently reduces the time necessary for indi-vidual patients and the efficiency of work.
A more visible problem in the organization of healthcare is an increase in the number of patients over 65 who, in general, use the services of primary medical care more often than younger patients. Ac-cording to the last Census in 2011, they represent 17.7% of the entire population and in Šibenik this percentage is even higher – 19.2% (Croatian Bureau of Statistics, 2011).
Due to the circumstances and working conditions primary healthcare has become an unattractive pro-fession and Croatia is faced with a deficit of family doctors of several hundred (Bakar, 2009). It is there-fore not unexpected that the results of a research conducted in 2007 on a sample of 9000 Croatian citizens, of them 405 from the County of Šibenik-Knin, conclude that the examinees rated healthcare services only 5.2 (on the scale of 1-10). The exami-nees from the County of Šibenik-Knin rated the service quality even lower regarding the national average – with low 4.8 (Dobrotić et al., 2007: 85). The research that would apply to the quality of pri-mary healthcare services in the city of Šibenik was
not carried out in the mentioned study.
Patients’ expectations and pleasure have received more significance in the assessment of healthcare service quality. Creators of medical policy and prac-tice have become more aware of the patients’ cen-tral role in defining optimal care and in improving the quality of medical care. “Including patients in the improvement of medical healthcare is not only desirable but socially, economically and technically essential. Patients’ opinion about doctors’ work is created according to different subjective, objective, emotional and rational attitudes and interactions of individuals and communities” (Grol and Wensing, 2000). It is therefore essential to constantly moni-tor and analyze attitudes, expectations and opinions of health services users in order to establish if they match with, and to what extent, those of healthcare providers (Ozretić Došen et al., 2009: 28).
There is no agreement between scientists on the definition of quality in total healthcare systems, among the population or in the separate health-care services. Different cultures have different val-ues and priorities; for some the very existence of medical staff and facilities is “good”, whereas for some it means equity and empathy, and for devel-oped countries it means optimal clinical outcomes (Tipurić, 2014). Moreover, there is no agreement on methods of measuring the quality of medical ser-vices. The greatest reason for that is the fact that medical or healthcare organizations are service companies and thus have their own specific quali-ties related to products and these are namely the lack of substantial properties, transience and het-erogeneity (Trbušić, 2005; Šiško Kuliš and Grubišić, 2010) while some other authors stress the problem of possession (e.g. Pupovac, 1999; Ozretić Došen, 2002; Kotler et al., 2006; Kotler and Keller, 2008). Besides the already mentioned characteristics, the process of measuring medical services is a complex one due to the following reasons: impossibility of controlling and rejecting services that do not cor-respond to a certain standard before their admin-istering (Ozretić Došen et al., 2010: 32); it is more difficult to distinguish the level of quality in medical than in other services, primarily because they imply human beings and connect their welfare directly to quality; “users always want more and their expec-tations of quality are different from the quality of-fered; only practice, careful listening and attention can lead to a more or less truthful idea” (Kolanović, 2007: 214-215).
Source: adjusted according to Parasuraman et al. (1988)
164 165
about the quality of doctors’ work and efficacy of individual doctors’ offices mainly focus on financial indicators of efficacy whereas patients’ opinions have almost entirely been neglected. Everything mentioned consequently, justifies this paper and the analysis that was conducted.
3. Research methodology
This empirical study reveals customer satisfaction with service quality in primary health care institu-tions. Therefore, the main objectives of this study are to:
• establish whether there is a difference between patients’ expectations and their satisfaction with the received health care;
• investigate whether there is a difference in per-ception of provided medical service quality among examinees regarding their gender, age, employment status and frequency of service us-age;
• provide useful information by applying SERV-QUAL instruments to healthcare providers in public institutions of primary healthcare services in the city of Šibenik in order for them to make valid decisions regarding possible improvement of service quality;
• establish reliability of the SERVQUAL model for the medical sector;
• analyze service quality dimensions that can be determined in the medical sector by using factor analysis.
According to the literature review and the defined goals, the following hypotheses were proposed:
H1: There is a statistically significant difference between users’ expectations and their satisfaction with given medical care in public institutions of pri-mary healthcare in Šibenik.
H2: There is no statistically significant difference in perception of given healthcare service quality among examinees regarding their gender.
H3: There is no statistically significant difference in perception of given healthcare service quality among examinees regarding their age.
H4: There is no statistically significant difference
in perception of given healthcare service quality among examinees regarding their employment sta-tus.
H5: There is no statistically significant difference in perception of given healthcare service quality among examinees regarding their frequency of us-ing health care services.
H6: The SERVQUAL model is reliable for measur-ing service quality in the health care sector.
H7: It is possible to confirm the original dimensions from the SERVQUAL model into the health care sector by factor analysis.
The questionnaire consisted of three parts. In the first part, the expectations of examinees were meas-ured with regard to the quality of primary healthcare services in general, while in the second, the custom-ers’ perception of the provided services were meas-ured. The third part contained questions regarding gender, age, employment status, frequency of using services in primary healthcare public institutions and use of medical services in private institutions of primary healthcare. At the end of the questionnaire, examinees were asked to express their satisfaction with the quality of services in primary healthcare institutions by giving a single evaluation mark.
The questionnaire was prepared according to di-mensions from the SERVQUAL model and adjusted to the specific characteristics of medical services. After a pre-testing was conducted on 8 examinees, the range of the questionnaire was reduced from the initial 22 to 20 claims. Two items of the original SERVQUAL instrument were deleted because of their unsuitability for the research context and due to the shown lack of understanding by the ques-tioned respondents. The final questionnaire con-sisted of two sets of 20 items.
The Likert scale of 5 degrees was used to meas-ure the quality of expected and provided service, instead of 7 degrees proposed by Zeithaml, Par-asuraman and Malhotra (2002). The reason is the fact that grading from 1 to 5 is generally accepted in Croatia (eg. Legčević, 2009; Ozretić Došen et al., 2010; Brumini et al., 2012; Raspor et al., 2013), so it was believed that the examinees would find it easier to evaluate statements according to notions and di-mensions.
The main population in this survey consisted of all users of services in primary healthcare public insti-tutions in Šibenik over the age of 16. The question-
The SERVQUAL model has been subjected to criti-cism by numerous scientists (e.g. Lewis and Mitch-ell, 1990: 15; Cronin and Taylor, 1992: 55-56; Teas, 1993: 29). These critical comments have largely been directed towards the theoretical base of the model and its operational mode (measurement principles). The most frequent criticism is related towards va-lidity and reliability of the model, measurements of expectations and structure of dimensions. “How-ever, due to its positive elements – simplicity of use and ability of instruments to provide quantitative assessment, the model has been accepted and ap-plied for measuring quality of different types of ser-vices” (Ozretić Došen et al., 2010: 33) such as bank-ing, (Pepur, 2006; Mei Mei et al., 2013), educational (Legčević, 2010; Behdioğlu and Şener, 2014; Ansary and Jayashree, 2014), hotel (Marković and Rapor Janković, 2013; Madar, 2014) and similar ones. There is a general attitude that results obtained by the SERVQUAL model predict the overall quality of services in a very reliable way (Khan, 2003: 121).
This model has been accepted as the key instrument for measuring immediate service quality in the med-ical sector and due to this reason, an ever increas-ing number of researchers has been using it in their work. The research results of a significant number of authors, regardless of the county or region where they were conducted, can be brought to one com-mon conclusion: expectations of health care users are considerably higher than the actual satisfaction which implies that the service quality is not satisfac-tory (e.g. Anderson, 1995; Lam, 1997; Wong, 2002; Ozretić Došen et al., 2010; Papanikolaou and Zygia-ris, 2012). The same conclusions have been reached by authors who conducted their research on health-care users in private establishments (e.g. Camilleri and O’Callaghan, 1998; Sohail, 2000).
As far as the importance of individual dimensions of the SERVQUAL model is concerned, the results vary to some extent. A research which Anderson (1995) conducted in Houston by applying the SERVQUAL model proved that the most significant dimensions according to healthcare users were reliability, as-surance and responsiveness, and while empathy and tangible elements, such as the building and its exterior or interior features, were considered less important, medical equipment, on the other hand, was considered extremely important. Lam (1997) reached similar conclusions in a survey conducted in Hong Kong. However, Papanikolaou and Zygiaris (2012) carried out a research which concluded that
empathy was the most important element.
Furthermore, according to reliability and validity of the SERVQUAL model in the healthcare sector, available research provides mixed results. Some au-thors found that SERVQUAL is reliable and valid in the health care environment (Babakus and Mana-gold, 1992; Lam, 1997; Papanikolaou and Zygiaris, 2012), some authors have modified it to a certain point (Anderson, 1995) while others identified new dimensions. Brown and Swartz (1989) reported additional dimensions not captured by the SERV-QUAL instrument – “professional credibility”, “pro-fessional competence” and “communications”.
However, in Croatia, there have been only a few researches on the quality of medical service by ap-plying the SERVQUAL model. Verner (2005) con-ducted a research in Osijek on a sample of 434 healthcare users. The results showed a gap with eve-ry dimension of primary healthcare service quality. Ozretić et al. (2010) measured healthcare service quality in primary healthcare institutions in the city of Zagreb and the County of Zagreb on a sample of 181 examinees. They have also stressed a gap for all dimensions of services and the greatest being for the dimensions of responsiveness, assurance and reliability. The study that refers to only one health-care institution was conducted by Bajto and Kondić (2005) who measured customers’ satisfaction with the Public municipal hospital in Našice, where the unsatisfactory elements of healthcare service were medical equipment and communication between the medical staff and the patients. Marković et al. (2014) who measured quality in one specialty hospi-tal for medical rehabilitation by applying a modified SERVQUAL model, have found the greatest gap in social activities and recreational programs offered in that hospital.
In all these previously mentioned studies in Croatia, the authors have not analyzed whether socio-demo-graphic characteristics of the examinees generate significant differences in the perception of health-care service quality. In studies of foreign authors, socio-demographic variables were mostly proven to be inconsistent and weak predictors of patients’ satisfaction (e.g. Mummalaneni and Gopalakrishna, 1995).
The lack of available research indicates the conclu-sion that there are still not enough relevant data in Croatia which could identify the level of content-ment of medical services users. Reports of institutes
UDK: 614.2(497.5 Šibenik) / Preliminary communication Dijana Mečev, Ivana Kardum Goleš: Primary healthcare service quality measurement: SERVQUAL scale
God. XXVIII, BR. 1/2015. str. 161-177 God. XXVIII, BR. 1/2015. str. 161-177
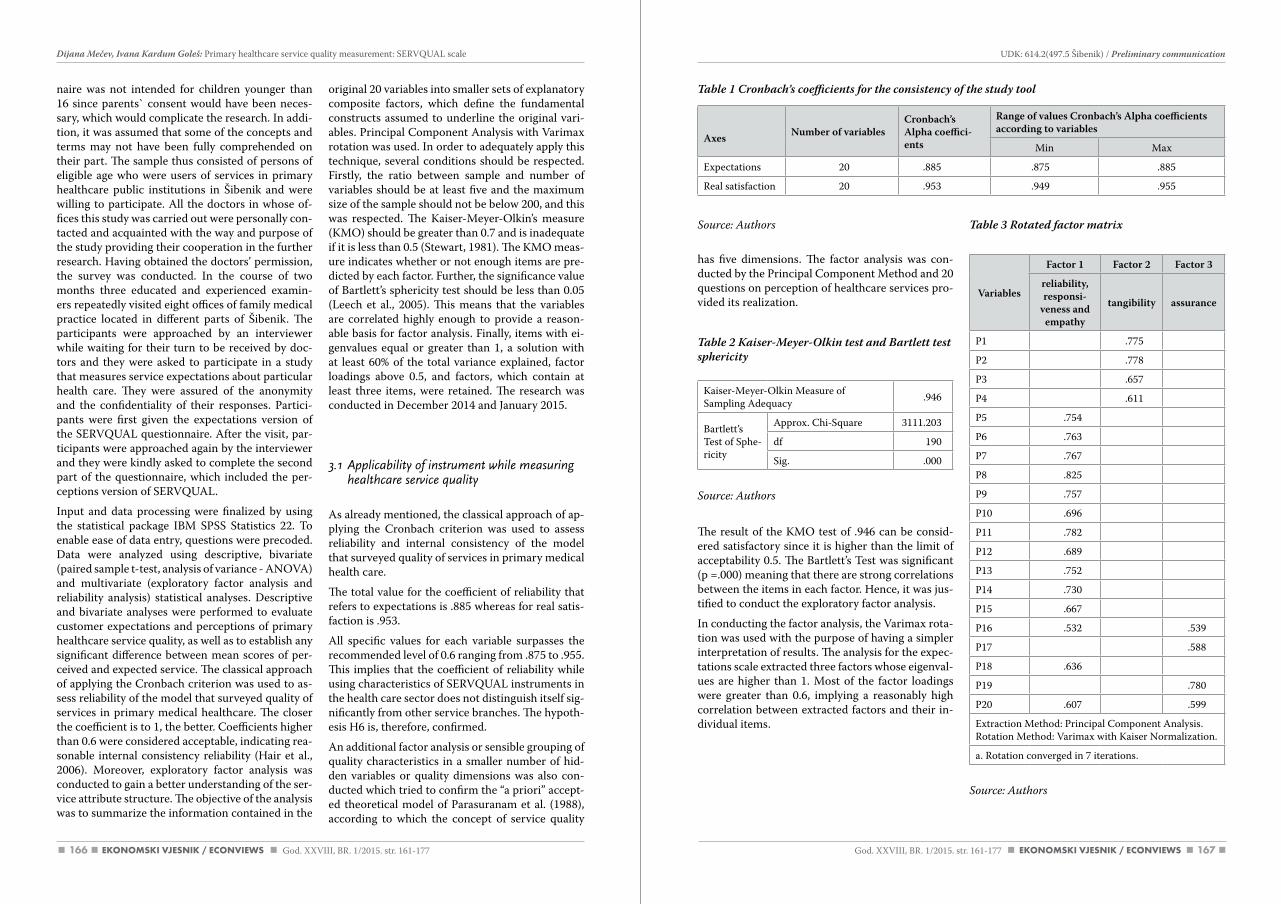
166 167
Source: authors
has five dimensions. The factor analysis was con-ducted by the Principal Component Method and 20 questions on perception of healthcare services pro-vided its realization.
Table 2 Kaiser-Meyer-Olkin test and Bartlett test sphericity
Kaiser-Meyer-Olkin Measure of Sampling Adequacy .946
Bartlett’s Test of Sphe-ricity
Approx. Chi-Square 3111.203
df 190
Sig. .000
Source: authors
The result of the KMO test of .946 can be consid-ered satisfactory since it is higher than the limit of acceptability 0.5. The Bartlett’s Test was significant (p =.000) meaning that there are strong correlations between the items in each factor. Hence, it was jus-tified to conduct the exploratory factor analysis.
In conducting the factor analysis, the Varimax rota-tion was used with the purpose of having a simpler interpretation of results. The analysis for the expec-tations scale extracted three factors whose eigenval-ues are higher than 1. Most of the factor loadings were greater than 0.6, implying a reasonably high correlation between extracted factors and their in-dividual items.
Table 3 Rotated factor matrix
Variables
Factor 1 Factor 2 Factor 3
reliability, responsi-
veness and empathy
tangibility assurance
P1 .775
P2 .778
P3 .657
P4 .611
P5 .754
P6 .763
P7 .767
P8 .825
P9 .757
P10 .696
P11 .782
P12 .689
P13 .752
P14 .730
P15 .667
P16 .532 .539
P17 .588
P18 .636
P19 .780
P20 .607 .599
Extraction Method: Principal Component Analysis. Rotation Method: Varimax with Kaiser Normalization.
a. Rotation converged in 7 iterations.
Source: authors
naire was not intended for children younger than 16 since parents` consent would have been neces-sary, which would complicate the research. In addi-tion, it was assumed that some of the concepts and terms may not have been fully comprehended on their part. The sample thus consisted of persons of eligible age who were users of services in primary healthcare public institutions in Šibenik and were willing to participate. All the doctors in whose of-fices this study was carried out were personally con-tacted and acquainted with the way and purpose of the study providing their cooperation in the further research. Having obtained the doctors’ permission, the survey was conducted. In the course of two months three educated and experienced examin-ers repeatedly visited eight offices of family medical practice located in different parts of Šibenik. The participants were approached by an interviewer while waiting for their turn to be received by doc-tors and they were asked to participate in a study that measures service expectations about particular health care. They were assured of the anonymity and the confidentiality of their responses. Partici-pants were first given the expectations version of the SERVQUAL questionnaire. After the visit, par-ticipants were approached again by the interviewer and they were kindly asked to complete the second part of the questionnaire, which included the per-ceptions version of SERVQUAL.
Input and data processing were finalized by using the statistical package IBM SPSS Statistics 22. To enable ease of data entry, questions were precoded. Data were analyzed using descriptive, bivariate (paired sample t-test, analysis of variance - ANOVA) and multivariate (exploratory factor analysis and reliability analysis) statistical analyses. Descriptive and bivariate analyses were performed to evaluate customer expectations and perceptions of primary healthcare service quality, as well as to establish any significant difference between mean scores of per-ceived and expected service. The classical approach of applying the Cronbach criterion was used to as-sess reliability of the model that surveyed quality of services in primary medical healthcare. The closer the coefficient is to 1, the better. Coefficients higher than 0.6 were considered acceptable, indicating rea-sonable internal consistency reliability (Hair et al., 2006). Moreover, exploratory factor analysis was conducted to gain a better understanding of the ser-vice attribute structure. The objective of the analysis was to summarize the information contained in the
original 20 variables into smaller sets of explanatory composite factors, which define the fundamental constructs assumed to underline the original vari-ables. Principal Component Analysis with Varimax rotation was used. In order to adequately apply this technique, several conditions should be respected. Firstly, the ratio between sample and number of variables should be at least five and the maximum size of the sample should not be below 200, and this was respected. The Kaiser-Meyer-Olkin’s measure (KMO) should be greater than 0.7 and is inadequate if it is less than 0.5 (Stewart, 1981). The KMO meas-ure indicates whether or not enough items are pre-dicted by each factor. Further, the significance value of Bartlett’s sphericity test should be less than 0.05 (Leech et al., 2005). This means that the variables are correlated highly enough to provide a reason-able basis for factor analysis. Finally, items with ei-genvalues equal or greater than 1, a solution with at least 60% of the total variance explained, factor loadings above 0.5, and factors, which contain at least three items, were retained. The research was conducted in December 2014 and January 2015.
3.1 Applicability of instrument while measuring healthcare service quality
As already mentioned, the classical approach of ap-plying the Cronbach criterion was used to assess reliability and internal consistency of the model that surveyed quality of services in primary medical health care.
The total value for the coefficient of reliability that refers to expectations is .885 whereas for real satis-faction is .953.
All specific values for each variable surpasses the recommended level of 0.6 ranging from .875 to .955. This implies that the coefficient of reliability while using characteristics of SERVQUAL instruments in the health care sector does not distinguish itself sig-nificantly from other service branches. The hypoth-esis H6 is, therefore, confirmed.
An additional factor analysis or sensible grouping of quality characteristics in a smaller number of hid-den variables or quality dimensions was also con-ducted which tried to confirm the “a priori” accept-ed theoretical model of Parasuranam et al. (1988), according to which the concept of service quality
Axes Number of variablesCronbach’s Alpha coeffici-ents
Range of values Cronbach’s Alpha coefficients according to variables
Min Max
Expectations 20 .885 .875 .885
Real satisfaction 20 .953 .949 .955
UDK: 614.2(497.5 Šibenik) / Preliminary communication Dijana Mečev, Ivana Kardum Goleš: Primary healthcare service quality measurement: SERVQUAL scale
God. XXVIII, BR. 1/2015. str. 161-177 God. XXVIII, BR. 1/2015. str. 161-177
Table 1 Cronbach’s coefficients for the consistency of the study tool
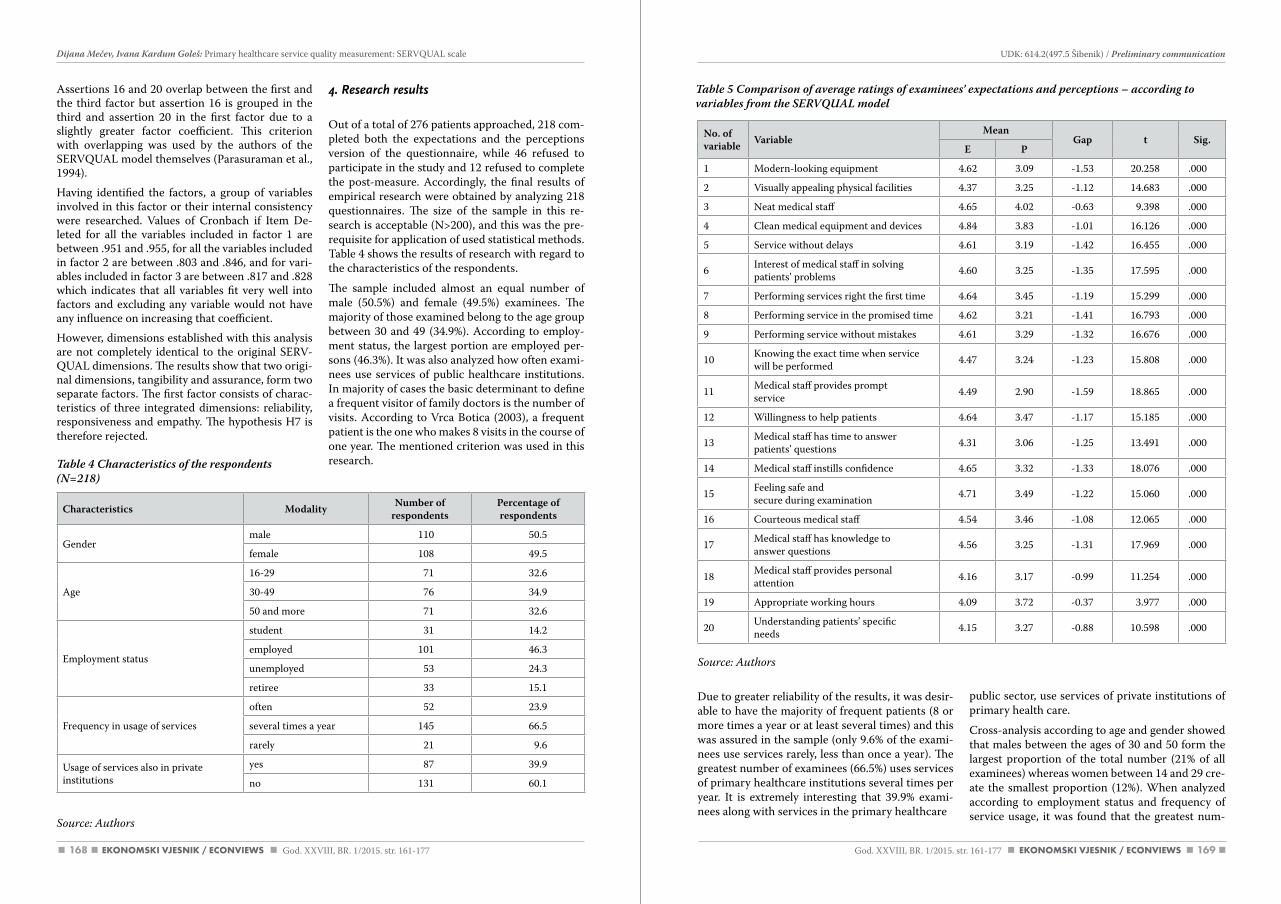
168 169
Source: authors
Due to greater reliability of the results, it was desir-able to have the majority of frequent patients (8 or more times a year or at least several times) and this was assured in the sample (only 9.6% of the exami-nees use services rarely, less than once a year). The greatest number of examinees (66.5%) uses services of primary healthcare institutions several times per year. It is extremely interesting that 39.9% exami-nees along with services in the primary healthcare
public sector, use services of private institutions of primary health care.
Cross-analysis according to age and gender showed that males between the ages of 30 and 50 form the largest proportion of the total number (21% of all examinees) whereas women between 14 and 29 cre-ate the smallest proportion (12%). When analyzed according to employment status and frequency of service usage, it was found that the greatest num-
Assertions 16 and 20 overlap between the first and the third factor but assertion 16 is grouped in the third and assertion 20 in the first factor due to a slightly greater factor coefficient. This criterion with overlapping was used by the authors of the SERVQUAL model themselves (Parasuraman et al., 1994).Having identified the factors, a group of variables involved in this factor or their internal consistency were researched. Values of Cronbach if Item De-leted for all the variables included in factor 1 are between .951 and .955, for all the variables included in factor 2 are between .803 and .846, and for vari-ables included in factor 3 are between .817 and .828 which indicates that all variables fit very well into factors and excluding any variable would not have any influence on increasing that coefficient.However, dimensions established with this analysis are not completely identical to the original SERV-QUAL dimensions. The results show that two origi-nal dimensions, tangibility and assurance, form two separate factors. The first factor consists of charac-teristics of three integrated dimensions: reliability, responsiveness and empathy. The hypothesis H7 is therefore rejected.
Table 4 Characteristics of the respondents (N=218)
Source: authors
4. Research results
Out of a total of 276 patients approached, 218 com-pleted both the expectations and the perceptions version of the questionnaire, while 46 refused to participate in the study and 12 refused to complete the post-measure. Accordingly, the final results of empirical research were obtained by analyzing 218 questionnaires. The size of the sample in this re-search is acceptable (N>200), and this was the pre-requisite for application of used statistical methods. Table 4 shows the results of research with regard to the characteristics of the respondents.
The sample included almost an equal number of male (50.5%) and female (49.5%) examinees. The majority of those examined belong to the age group between 30 and 49 (34.9%). According to employ-ment status, the largest portion are employed per-sons (46.3%). It was also analyzed how often exami-nees use services of public healthcare institutions. In majority of cases the basic determinant to define a frequent visitor of family doctors is the number of visits. According to Vrca Botica (2003), a frequent patient is the one who makes 8 visits in the course of one year. The mentioned criterion was used in this research.
Characteristics Modality Number of respondents
Percentage of respondents
Gendermale 110 50.5
female 108 49.5
Age
16-29 71 32.6
30-49 76 34.9
50 and more 71 32.6
Employment status
student 31 14.2
employed 101 46.3
unemployed 53 24.3
retiree 33 15.1
Frequency in usage of services
often 52 23.9
several times a year 145 66.5
rarely 21 9.6
Usage of services also in private institutions
yes 87 39.9
no 131 60.1
No. of variable Variable
MeanGap t Sig.
E P
1 Modern-looking equipment 4.62 3.09 -1.53 20.258 .000
2 Visually appealing physical facilities 4.37 3.25 -1.12 14.683 .000
3 Neat medical staff 4.65 4.02 -0.63 9.398 .000
4 Clean medical equipment and devices 4.84 3.83 -1.01 16.126 .000
5 Service without delays 4.61 3.19 -1.42 16.455 .000
6 Interest of medical staff in solving patients’ problems 4.60 3.25 -1.35 17.595 .000
7 Performing services right the first time 4.64 3.45 -1.19 15.299 .000
8 Performing service in the promised time 4.62 3.21 -1.41 16.793 .000
9 Performing service without mistakes 4.61 3.29 -1.32 16.676 .000
10 Knowing the exact time when service will be performed 4.47 3.24 -1.23 15.808 .000
11 Medical staff provides promptservice 4.49 2.90 -1.59 18.865 .000
12 Willingness to help patients 4.64 3.47 -1.17 15.185 .000
13 Medical staff has time to answerpatients’ questions 4.31 3.06 -1.25 13.491 .000
14 Medical staff instills confidence 4.65 3.32 -1.33 18.076 .000
15 Feeling safe andsecure during examination 4.71 3.49 -1.22 15.060 .000
16 Courteous medical staff 4.54 3.46 -1.08 12.065 .000
17 Medical staff has knowledge toanswer questions 4.56 3.25 -1.31 17.969 .000
18 Medical staff provides personalattention 4.16 3.17 -0.99 11.254 .000
19 Appropriate working hours 4.09 3.72 -0.37 3.977 .000
20 Understanding patients’ specificneeds 4.15 3.27 -0.88 10.598 .000
Table 5 Comparison of average ratings of examinees’ expectations and perceptions – according to variables from the SERVQUAL model
UDK: 614.2(497.5 Šibenik) / Preliminary communication Dijana Mečev, Ivana Kardum Goleš: Primary healthcare service quality measurement: SERVQUAL scale
God. XXVIII, BR. 1/2015. str. 161-177 God. XXVIII, BR. 1/2015. str. 161-177
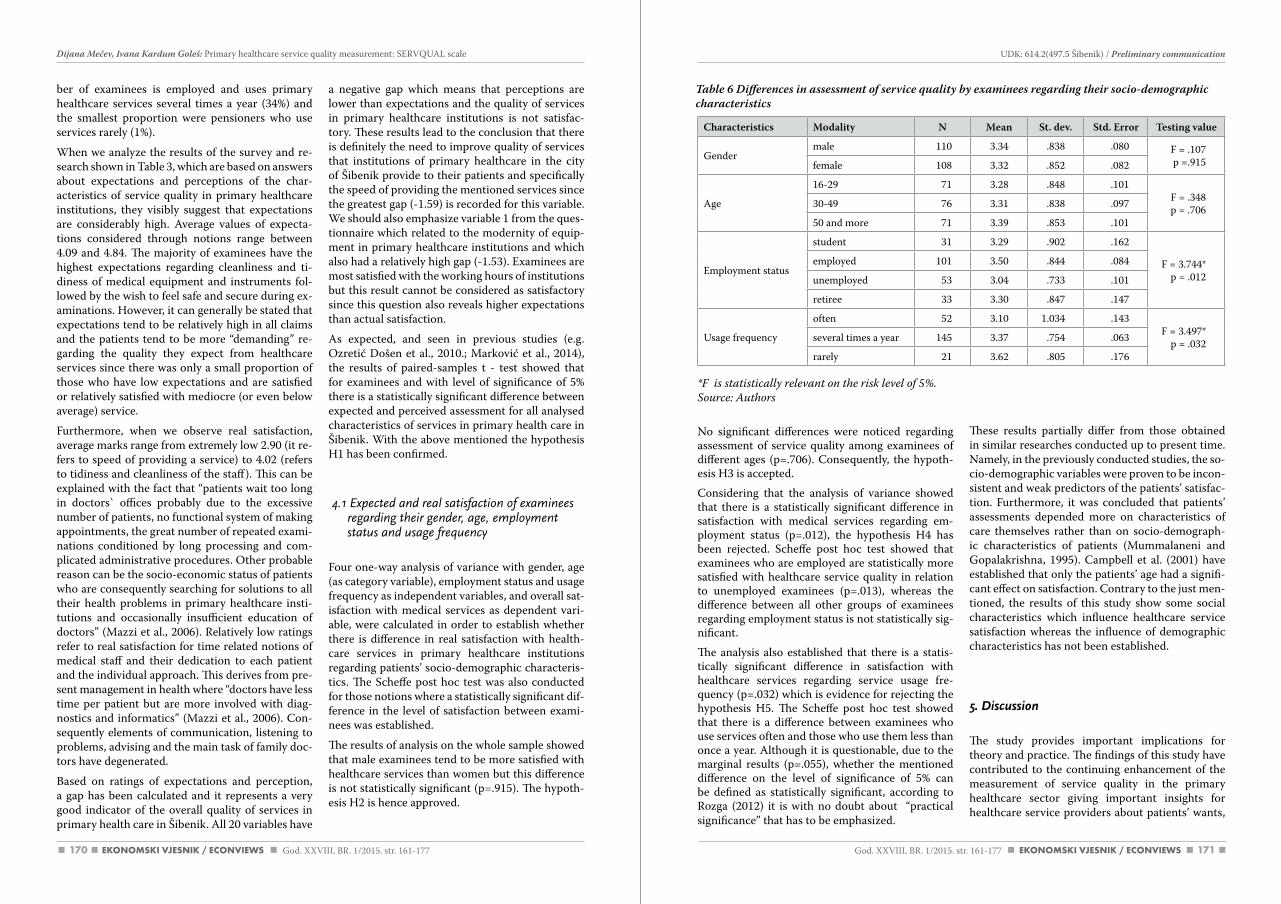
170 171
*F is statistically relevant on the risk level of 5%. Source: authors
No significant differences were noticed regarding assessment of service quality among examinees of different ages (p=.706). Consequently, the hypoth-esis H3 is accepted.Considering that the analysis of variance showed that there is a statistically significant difference in satisfaction with medical services regarding em-ployment status (p=.012), the hypothesis H4 has been rejected. Scheffe post hoc test showed that examinees who are employed are statistically more satisfied with healthcare service quality in relation to unemployed examinees (p=.013), whereas the difference between all other groups of examinees regarding employment status is not statistically sig-nificant. The analysis also established that there is a statis-tically significant difference in satisfaction with healthcare services regarding service usage fre-quency (p=.032) which is evidence for rejecting the hypothesis H5. The Scheffe post hoc test showed that there is a difference between examinees who use services often and those who use them less than once a year. Although it is questionable, due to the marginal results (p=.055), whether the mentioned difference on the level of significance of 5% can be defined as statistically significant, according to Rozga (2012) it is with no doubt about “practical significance” that has to be emphasized.
These results partially differ from those obtained in similar researches conducted up to present time. Namely, in the previously conducted studies, the so-cio-demographic variables were proven to be incon-sistent and weak predictors of the patients’ satisfac-tion. Furthermore, it was concluded that patients’ assessments depended more on characteristics of care themselves rather than on socio-demograph-ic characteristics of patients (Mummalaneni and Gopalakrishna, 1995). Campbell et al. (2001) have established that only the patients’ age had a signifi-cant effect on satisfaction. Contrary to the just men-tioned, the results of this study show some social characteristics which influence healthcare service satisfaction whereas the influence of demographic characteristics has not been established.
5. Discussion
The study provides important implications for theory and practice. The findings of this study have contributed to the continuing enhancement of the measurement of service quality in the primary healthcare sector giving important insights for healthcare service providers about patients’ wants,
ber of examinees is employed and uses primary healthcare services several times a year (34%) and the smallest proportion were pensioners who use services rarely (1%).
When we analyze the results of the survey and re-search shown in Table 3, which are based on answers about expectations and perceptions of the char-acteristics of service quality in primary healthcare institutions, they visibly suggest that expectations are considerably high. Average values of expecta-tions considered through notions range between 4.09 and 4.84. The majority of examinees have the highest expectations regarding cleanliness and ti-diness of medical equipment and instruments fol-lowed by the wish to feel safe and secure during ex-aminations. However, it can generally be stated that expectations tend to be relatively high in all claims and the patients tend to be more “demanding” re-garding the quality they expect from healthcare services since there was only a small proportion of those who have low expectations and are satisfied or relatively satisfied with mediocre (or even below average) service.
Furthermore, when we observe real satisfaction, average marks range from extremely low 2.90 (it re-fers to speed of providing a service) to 4.02 (refers to tidiness and cleanliness of the staff). This can be explained with the fact that “patients wait too long in doctors` offices probably due to the excessive number of patients, no functional system of making appointments, the great number of repeated exami-nations conditioned by long processing and com-plicated administrative procedures. Other probable reason can be the socio-economic status of patients who are consequently searching for solutions to all their health problems in primary healthcare insti-tutions and occasionally insufficient education of doctors” (Mazzi et al., 2006). Relatively low ratings refer to real satisfaction for time related notions of medical staff and their dedication to each patient and the individual approach. This derives from pre-sent management in health where “doctors have less time per patient but are more involved with diag-nostics and informatics” (Mazzi et al., 2006). Con-sequently elements of communication, listening to problems, advising and the main task of family doc-tors have degenerated.
Based on ratings of expectations and perception, a gap has been calculated and it represents a very good indicator of the overall quality of services in primary health care in Šibenik. All 20 variables have
a negative gap which means that perceptions are lower than expectations and the quality of services in primary healthcare institutions is not satisfac-tory. These results lead to the conclusion that there is definitely the need to improve quality of services that institutions of primary healthcare in the city of Šibenik provide to their patients and specifically the speed of providing the mentioned services since the greatest gap (-1.59) is recorded for this variable. We should also emphasize variable 1 from the ques-tionnaire which related to the modernity of equip-ment in primary healthcare institutions and which also had a relatively high gap (-1.53). Examinees are most satisfied with the working hours of institutions but this result cannot be considered as satisfactory since this question also reveals higher expectations than actual satisfaction.
As expected, and seen in previous studies (e.g. Ozretić Došen et al., 2010.; Marković et al., 2014), the results of paired-samples t - test showed that for examinees and with level of significance of 5% there is a statistically significant difference between expected and perceived assessment for all analysed characteristics of services in primary health care in Šibenik. With the above mentioned the hypothesis H1 has been confirmed.
4.1 Expected and real satisfaction of examinees regarding their gender, age, employment status and usage frequency
Four one-way analysis of variance with gender, age (as category variable), employment status and usage frequency as independent variables, and overall sat-isfaction with medical services as dependent vari-able, were calculated in order to establish whether there is difference in real satisfaction with health-care services in primary healthcare institutions regarding patients’ socio-demographic characteris-tics. The Scheffe post hoc test was also conducted for those notions where a statistically significant dif-ference in the level of satisfaction between exami-nees was established.
The results of analysis on the whole sample showed that male examinees tend to be more satisfied with healthcare services than women but this difference is not statistically significant (p=.915). The hypoth-esis H2 is hence approved.
Characteristics Modality N Mean St. dev. Std. Error Testing value
Gendermale 110 3.34 .838 .080 F = .107
p =.915female 108 3.32 .852 .082
Age
16-29 71 3.28 .848 .101F = .348p = .70630-49 76 3.31 .838 .097
50 and more 71 3.39 .853 .101
Employment status
student 31 3.29 .902 .162
F = 3.744*p = .012
employed 101 3.50 .844 .084
unemployed 53 3.04 .733 .101
retiree 33 3.30 .847 .147
Usage frequency
often 52 3.10 1.034 .143F = 3.497*
p = .032several times a year 145 3.37 .754 .063
rarely 21 3.62 .805 .176
Table 6 Differences in assessment of service quality by examinees regarding their socio-demographic characteristics
UDK: 614.2(497.5 Šibenik) / Preliminary communication Dijana Mečev, Ivana Kardum Goleš: Primary healthcare service quality measurement: SERVQUAL scale
God. XXVIII, BR. 1/2015. str. 161-177 God. XXVIII, BR. 1/2015. str. 161-177
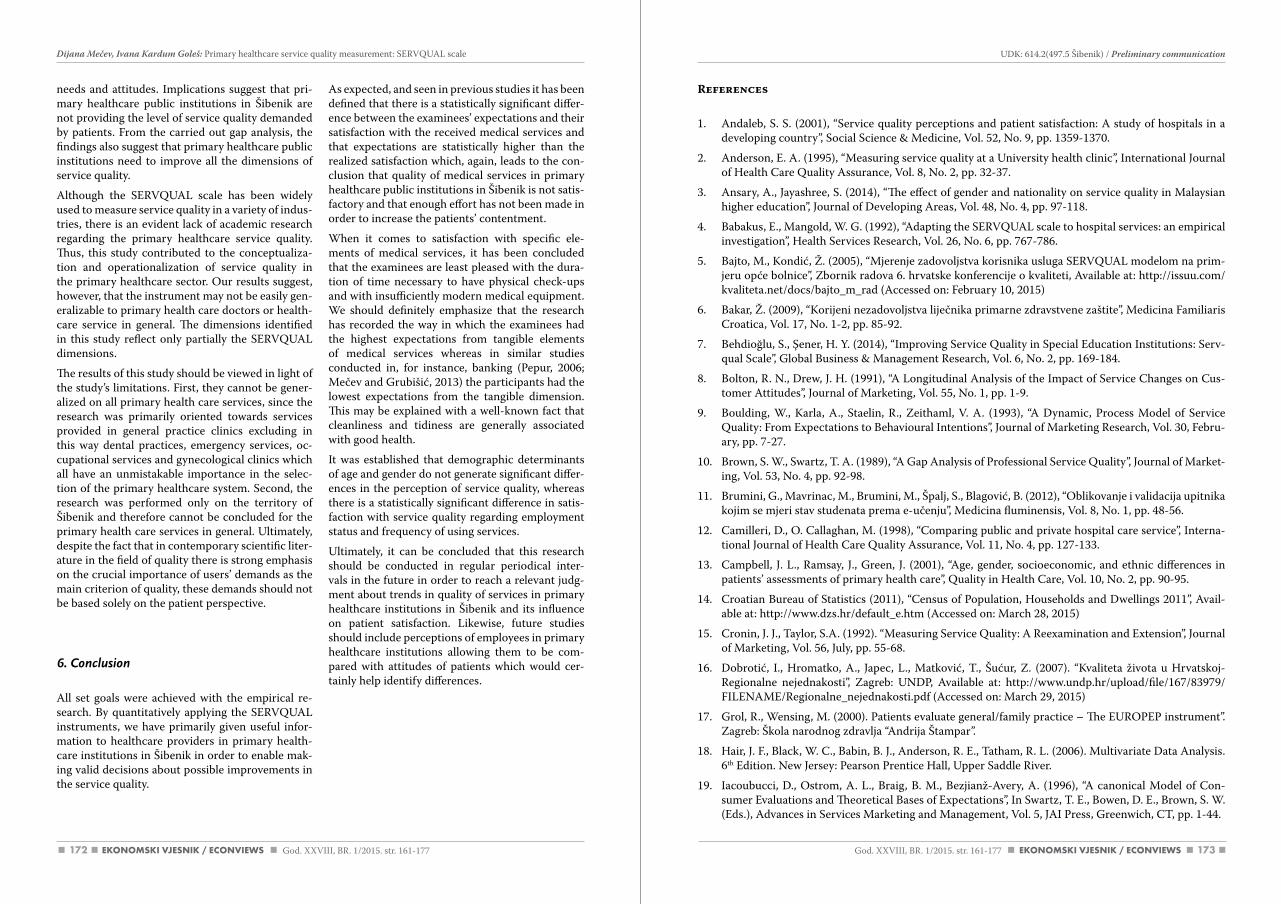
172 173
References
1. Andaleb, S. S. (2001), “Service quality perceptions and patient satisfaction: A study of hospitals in a developing country”, Social Science & Medicine, Vol. 52, No. 9, pp. 1359-1370.
2. Anderson, E. A. (1995), “Measuring service quality at a University health clinic”, International Journal of Health Care Quality Assurance, Vol. 8, No. 2, pp. 32-37.
3. Ansary, A., Jayashree, S. (2014), “The effect of gender and nationality on service quality in Malaysian higher education”, Journal of Developing Areas, Vol. 48, No. 4, pp. 97-118.
4. Babakus, E., Mangold, W. G. (1992), “Adapting the SERVQUAL scale to hospital services: an empirical investigation”, Health Services Research, Vol. 26, No. 6, pp. 767-786.
5. Bajto, M., Kondić, Ž. (2005), “Mjerenje zadovoljstva korisnika usluga SERVQUAL modelom na prim-jeru opće bolnice”, Zbornik radova 6. hrvatske konferencije o kvaliteti, Available at: http://issuu.com/kvaliteta.net/docs/bajto_m_rad (Accessed on: February 10, 2015)
6. Bakar, Ž. (2009), “Korijeni nezadovoljstva liječnika primarne zdravstvene zaštite”, Medicina Familiaris Croatica, Vol. 17, No. 1-2, pp. 85-92.
7. Behdioğlu, S., Şener, H. Y. (2014), “Improving Service Quality in Special Education Institutions: Serv-qual Scale”, Global Business & Management Research, Vol. 6, No. 2, pp. 169-184.
8. Bolton, R. N., Drew, J. H. (1991), “A Longitudinal Analysis of the Impact of Service Changes on Cus-tomer Attitudes”, Journal of Marketing, Vol. 55, No. 1, pp. 1-9.
9. Boulding, W., Karla, A., Staelin, R., Zeithaml, V. A. (1993), “A Dynamic, Process Model of Service Quality: From Expectations to Behavioural Intentions”, Journal of Marketing Research, Vol. 30, Febru-ary, pp. 7-27.
10. Brown, S. W., Swartz, T. A. (1989), “A Gap Analysis of Professional Service Quality”, Journal of Market-ing, Vol. 53, No. 4, pp. 92-98.
11. Brumini, G., Mavrinac, M., Brumini, M., Špalj, S., Blagović, B. (2012), “Oblikovanje i validacija upitnika kojim se mjeri stav studenata prema e-učenju”, Medicina fluminensis, Vol. 8, No. 1, pp. 48-56.
12. Camilleri, D., O. Callaghan, M. (1998), “Comparing public and private hospital care service”, Interna-tional Journal of Health Care Quality Assurance, Vol. 11, No. 4, pp. 127-133.
13. Campbell, J. L., Ramsay, J., Green, J. (2001), “Age, gender, socioeconomic, and ethnic differences in patients’ assessments of primary health care”, Quality in Health Care, Vol. 10, No. 2, pp. 90-95.
14. Croatian Bureau of Statistics (2011), “Census of Population, Households and Dwellings 2011”, Avail-able at: http://www.dzs.hr/default_e.htm (Accessed on: March 28, 2015)
15. Cronin, J. J., Taylor, S.A. (1992). “Measuring Service Quality: A Reexamination and Extension”, Journal of Marketing, Vol. 56, July, pp. 55-68.
16. Dobrotić, I., Hromatko, A., Japec, L., Matković, T., Šućur, Z. (2007). “Kvaliteta života u Hrvatskoj-Regionalne nejednakosti”, Zagreb: UNDP, Available at: http://www.undp.hr/upload/file/167/83979/FILENAME/Regionalne_nejednakosti.pdf (Accessed on: March 29, 2015)
17. Grol, R., Wensing, M. (2000). Patients evaluate general/family practice – The EUROPEP instrument”. Zagreb: Škola narodnog zdravlja “Andrija Štampar”.
18. Hair, J. F., Black, W. C., Babin, B. J., Anderson, R. E., Tatham, R. L. (2006). Multivariate Data Analysis. 6th Edition. New Jersey: Pearson Prentice Hall, Upper Saddle River.
19. Iacoubucci, D., Ostrom, A. L., Braig, B. M., Bezjianž-Avery, A. (1996), “A canonical Model of Con-sumer Evaluations and Theoretical Bases of Expectations”, In Swartz, T. E., Bowen, D. E., Brown, S. W. (Eds.), Advances in Services Marketing and Management, Vol. 5, JAI Press, Greenwich, CT, pp. 1-44.
needs and attitudes. Implications suggest that pri-mary healthcare public institutions in Šibenik are not providing the level of service quality demanded by patients. From the carried out gap analysis, the findings also suggest that primary healthcare public institutions need to improve all the dimensions of service quality.
Although the SERVQUAL scale has been widely used to measure service quality in a variety of indus-tries, there is an evident lack of academic research regarding the primary healthcare service quality. Thus, this study contributed to the conceptualiza-tion and operationalization of service quality in the primary healthcare sector. Our results suggest, however, that the instrument may not be easily gen-eralizable to primary health care doctors or health-care service in general. The dimensions identified in this study reflect only partially the SERVQUAL dimensions.
The results of this study should be viewed in light of the study’s limitations. First, they cannot be gener-alized on all primary health care services, since the research was primarily oriented towards services provided in general practice clinics excluding in this way dental practices, emergency services, oc-cupational services and gynecological clinics which all have an unmistakable importance in the selec-tion of the primary healthcare system. Second, the research was performed only on the territory of Šibenik and therefore cannot be concluded for the primary health care services in general. Ultimately, despite the fact that in contemporary scientific liter-ature in the field of quality there is strong emphasis on the crucial importance of users’ demands as the main criterion of quality, these demands should not be based solely on the patient perspective.
6. Conclusion
All set goals were achieved with the empirical re-search. By quantitatively applying the SERVQUAL instruments, we have primarily given useful infor-mation to healthcare providers in primary health-care institutions in Šibenik in order to enable mak-ing valid decisions about possible improvements in the service quality.
As expected, and seen in previous studies it has been defined that there is a statistically significant differ-ence between the examinees’ expectations and their satisfaction with the received medical services and that expectations are statistically higher than the realized satisfaction which, again, leads to the con-clusion that quality of medical services in primary healthcare public institutions in Šibenik is not satis-factory and that enough effort has not been made in order to increase the patients’ contentment.
When it comes to satisfaction with specific ele-ments of medical services, it has been concluded that the examinees are least pleased with the dura-tion of time necessary to have physical check-ups and with insufficiently modern medical equipment. We should definitely emphasize that the research has recorded the way in which the examinees had the highest expectations from tangible elements of medical services whereas in similar studies conducted in, for instance, banking (Pepur, 2006; Mečev and Grubišić, 2013) the participants had the lowest expectations from the tangible dimension. This may be explained with a well-known fact that cleanliness and tidiness are generally associated with good health.
It was established that demographic determinants of age and gender do not generate significant differ-ences in the perception of service quality, whereas there is a statistically significant difference in satis-faction with service quality regarding employment status and frequency of using services.
Ultimately, it can be concluded that this research should be conducted in regular periodical inter-vals in the future in order to reach a relevant judg-ment about trends in quality of services in primary healthcare institutions in Šibenik and its influence on patient satisfaction. Likewise, future studies should include perceptions of employees in primary healthcare institutions allowing them to be com-pared with attitudes of patients which would cer-tainly help identify differences.
UDK: 614.2(497.5 Šibenik) / Preliminary communication Dijana Mečev, Ivana Kardum Goleš: Primary healthcare service quality measurement: SERVQUAL scale
God. XXVIII, BR. 1/2015. str. 161-177 God. XXVIII, BR. 1/2015. str. 161-177
174 175
37. Mečev, D., Grubišić, D. (2013), “Mjerenje kvalitete usluge Internet bankarstva primjenom modi-ficiranog E-S-QUAL modela”, In Belošević, D. (Ed.), Zbornik radova 13. hrvatske konferencije o kvaliteti i 4. znanstvenog skupa hrvatskog društva za kvalitetu “Kvaliteta – put izvrsnosti”, Hrvatsko društvo za kvalitetu, Zagreb, pp. 1848-8633.
38. Mei Mei, L., Cheung, R., Lam, A., Yuen Ting, C. (2013). “Measuring Service Quality in the Banking In-dustry: A Hong Kong Based Study”, Contemporary Management Research, Vol. 9, No. 3, pp. 263-282.
39. Ministry of Finance (2014b) “Podrška Svjetske banke hrvatskome zdravstvu”, Available at: http://www.mfin.hr/hr/novosti/podrska-svjetske-banke-hrvatskome-zdravstvu-2014-06-10-17-40-59 (Accessed on: Fabruary 2, 2015)
40. Ozretić Došen, Đ. (2002). Osnove marketinga usluga. Zagreb: Mikrorad.
41. Ozretić Došen, Đ., Škare, V., Škare, T. (2010), “Mjerenje kvalitete usluge primarne zdravstvene zaštite SERVQUAL instrumentom”, Revija za socijalnu politiku, Vol. 17, No. 1, pp. 27-44.
42. Papanikolaou, V., Zygiaris, S. (2012), ”Service quality perceptions in primary health care centres in Greece”, Health Expectations, Vol. 17, No. 2, pp.197-207.
43. Parasuraman, A., Berry, L. L., Zeithaml, V. A. (1985), ”A conceptual model of service quality and its implications for future research”, Journal of Marketing, Vol. 49, Fall, pp. 41-50.
44. Parasuraman, A., Berry, L. L., Zeithaml, V. A. (1988), ”SERVQUAL: A Multiple-Item Scale for Measur-ing Consumer Perceptions of Service Quality”, Journal of Retailing, Vol. 64, No. 1, pp. 12-40.
45. Parasuraman, A., Berry, L. L., Zeithaml, V. A. (1994), ”Alternative Scales for Measuring Service Qual-ity: A Comparative Assessment Based on Psychometric and Diagnostic Criteria”, Journal of retailing, Vol. 70, No. 3, pp. 201-230.
46. Pupovac, D. (1999), ”Međuodnos kvalitete i cijena prijevoznih usluga”, Suvremeni promet, Vol. 19, No. 1-2, pp. 101-106.
47. Raspor, S., Žunić, C., Ribarić Aidone, E. (2013), ”Mjerenje zadovoljstva klijenta uslugama na kioscima u gradu Rijeci”, Zbornik radova Veleučilišta u Rijeci, Vol. 1, No 1, pp. 17-30.
48. Pepur, M. (2006), “Kvaliteta usluga u bankarskoj industriji: koncept i mjerenje”, Tržište, Vol. 18, No. 1-2, pp. 53-66.
49. Rozga, A. (2012). “Multivarijatna analiza”, authorized lectures for PhD students, Split: Faculty of Eco-nomics.
50. Sohail, M. S. (2003), “Service quality in hospitals: more favourable than you might think”, Managing Service Quality, Vol. 13, No. 3, pp. 197-206.
51. Stewart, D. W. (1981). “The Application and Misapplication of Factor Analysis in Marketing Research”, Journal of Marketing Research, Vol. 18, No. 1, pp. 51-62.
52. Šiško Kuliš, M., Grubišić, D. (2010). ”Upravljanje kvalitetom”, Split: Faculty of Economics.
53. Teas, R. K. (1993), “Expectations, performance evaluation, and consumers’ perceptions of quality”, Journal of Marketing, Vol. 57, No. 4, pp. 18-34.
54. Tipurić, D. (2014.), “Upravljanje kvalitetom u zdravstvu”, Available at: http://www.zzjzfbih.ba/wp-con-tent/uploads/2013/07/Upravljanje-kvalitetom-u-zdravstvu.pdf (Accessed on: Fabruary 5, 2015)
55. Trbušić, T. (2005). Povećanje kvalitete javnog putničkog prijevoza izazov ali i neminovna potreba, e-Quality, Available at: http://kvaliteta.inet.hr/e-quality/prethodni/20/index.htm (Accessed on: Fabru-ary 5, 2015)
56. Verner, J. (2005), “SERVQUAL: A tool for measuring service quality”, Pravni vjesnik, Vol. 21, No. 1-2, pp. 247-258.
20. Johnson, L. (2002), “Using the Critical Incident Technique to Assess Gambling Customer Satisfaction”, UNLV Gaming Research & Review Journal, Vol. 6, No. 2, pp. 1-12.
21. Katić, M., Rumboldt, M., Materljan, E., Gmajnić, R. (2009). “Analiza stanja u obiteljskoj medicini u Hrvatskoj i nužnost promjena”, Medix, Vol. 15, No. 80/81, pp. 51-56.
22. Khan, M. (2003). “ECOSERV: Ecotourists Quality Expectations”, Annals of Tourism Research, Vol. 30, No. 1, pp. 109-124.
23. Kilbourne, W. E., Duffy, J. A., Duffy, M., Giarchi, G. (2004). “The applicability of SERVQUAL in cross-national measurements of health-care quality”, Journal of Services Marketing, Vol. 18, No. 7, pp. 524-533.
24. Kolanović, I. (2007). “Temeljne dimenzije kvalitete lučke usluge”, Pomorstvo, Vol. 21, No. 2, pp. 207-224.
25. Kotler, P., Wong, V., Saunders, J., Armstrong, G. (2006). Osnove marketinga. 4th edition. Zagreb: MATE d.o.o.
26. Kotler, P., Keller K. L. (2008). Upravljanje marketingom. 12th edition. Zagreb: MATE d.o.o.
27. Kumar, M., Kee, F. T., Manshor, A. T. (2009), “Determining the relative importance of critical factors in delivering service quality of banks: An application of dominance analysis in SERVQUAL model”, Managing Service Quality, Vol. 19, No. 2, pp. 211-228.
28. Labor M., Jurić, I., Labor, S., Mihić, D., Jurić, I., Gmajnić, R. (2012), “Deset-satni radni dan liječnika obiteljske medicine”, In Rumbolt, M., Petrić, D. (Eds.), Zbornik radova XIX. kongresa obiteljske medi-cine, Hrvatska udružba obiteljske medicine, Zagreb, pp. 347-356.
29. Lam, S. S. K. (1997), “SERVQUAL: A tool for measuring patient’s opinions of hospital service quality in Hong Kong”, Total Quality Management, Vol. 8, No. 4, pp. 145-152.
30. Leech, N. L., Barrett, K. C., Morgan, G. A. (2005). SPSS for Intermediate Statistics: Use and Interpreta-tion. 2nd edition. New Jersey: Lawrence Erlbaum Associates Publishers.
31. Legičević, J. (2009), “Quality gap of educational service in viewpoints of students”, Ekonomska misao i praksa, Vol. 19, No. 2, pp. 279-298.
32. Lewis, B. R., Mitchell, V. W. (1990), “Defining and measuring the quality of customer service”, Market-ing intelligence & planning, Vol. 8, No. 6, pp. 11-17.
33. Madar, A. (2014), “Hotel services quality assessment using SERVQUAL method. Case study: Athénée Palace hotel”, Bulletin of the Transilvania University of Brasov, Series V: Economic Sciences, Vol. 7, No. 2, pp. 71-76.
34. Marković, S., Lončarić, Di., Lončarić, Da. (2014), “Service Quality and Customer Satisfaction in the Health Care Industry - Towards Health Tourism Market”, Tourism & Hospitality Management, Vol. 20, No. 2, pp. 155-170.
35. Markovic, S., Raspor Jankovic, S. (2013), “Exploring the relationship between service quality and cus-tomer satisfaction in Croatian hotel industry”, Tourism and Hospitality Management, Vol. 19, No. 2, pp. 149-164.
36. Mazzi, B., Krčmar, N., Gržalja, N., Ferlin, D., Ivančić, A., Grgurev, Z., Kroato Vujčić, V., Malnar, M. (2006). “Mišljenje pacijenata o našem radu – element u procjeni kvalitete”, in Mazzi, B. (Ed.), Zbornik radova 6. kongresa HDOD HLZ, Hrvatsko društvo obiteljskih doktora, Zagreb. Available at: http://www.hdod.net/rad_drustva/RAD%20-%20Misljenje%20pacijenata%20o%20nasem%20radu%20-%202006.pdf (Accessed on: April 1, 2015)
UDK: 614.2(497.5 Šibenik) / Preliminary communication Dijana Mečev, Ivana Kardum Goleš: Primary healthcare service quality measurement: SERVQUAL scale
God. XXVIII, BR. 1/2015. str. 161-177 God. XXVIII, BR. 1/2015. str. 161-177
176 177
Dijana MečevIvana Kardum Goleš
Mjerenje kvalitete usluge u ustanovama primarne zdravstvene zaštite: SERvqUAl ljestvica
Sažetak
Svrha ovoga istraživanja je ispitati percepciju kvalitete usluge korisnika u javnim ustanovama primarne zdravstvene zaštite u Šibeniku. Istraživanje je za jedan od ciljeva imalo istražiti postoji li razlika između očekivanja korisnika i njihovoga zadovoljstva pruženim zdravstvenim uslugama. Budući da je za sve SERV-QUAL dimenzije utvrđen negativan jaz, rezultati ukazuju na činjenicu da bi ustanove primarne zdravstvene zaštite trebale poboljšati kvalitetu svojih usluga prema svim analiziranim dimenzijama. Također se istražilo postoji li razlika u percepciji ostvarene kvalitete zdravstvene usluge između ispitanika s obzirom na spol, dob, radni status i učestalost korištenja zdravstvenih usluga. Utvrđeno je da demografske odrednice dob i spol ne generiraju značajne razlike u percepciji kvalitete zdravstvenih usluga dok postoji značajna razlika u zadovoljstvu zdravstvenim uslugama s obzirom na radni status i učestalost korištenja usluga. Dobiveni re-zultati djelomično se razlikuju od onih dobivenih u do sada provedenim sličnim istraživanjima. Provedena faktorska analiza nije potvrdila „a priori“ prihvaćeni teorijski model Parasuramana et al. (1988), prema ko-jem se koncept kvalitete usluge sastoji od pet dimenzija, već su u kontekstu percipirane kvalitete primarne zdravstvene usluge identificirana tri visoko pouzdana faktora.
Ključne riječi: primarna zdravstvena zaštita, SERVQUAL, faktorska analiza, analiza pouzdanosti
57. Vrca Botica, M. (2003). “Dijabetičar kao učestali posjetilac ordinacije obiteljske medicine”, doctoral thesis, Zagreb: University of Zagreb, School of Medicine.
58. Wong, J. C. H. (2002), ”Service quality measurement in a medical imaging department”, International Journal of Health Care Quality Assurance, Vol. 15, No. 5, pp. 206-212.
59. Zeithaml, V. A. (1988). “Consumer Perceptions of Price, Quality, and Value: a means–end model and synthesis of evidence”, Journal of Marketing, Vol. 52, No. 3, pp. 2-22.
60. Zeithaml, V. A., Berry, L. L., Parasuraman, A. (1993), ”The nature and determinants of customer ex-pections of service”, Journal of the Academy of Marketing Science, Vol. 21, No. 1, pp. 1-12.
61. Zeithaml, V. A, Parasuraman, A., Malhotra, A. (2002), ”Service Quality Delivery trough Web Sites: A Critical Review of Extant Knowledge”, Journal of the Academy of Marketing Science, Vol. 30, No. 4, pp. 362-375.
UDK: 614.2(497.5 Šibenik) / Preliminary communication Dijana Mečev, Ivana Kardum Goleš: Primary healthcare service quality measurement: SERVQUAL scale
God. XXVIII, BR. 1/2015. str. 161-177 God. XXVIII, BR. 1/2015. str. 161-177
179God. XXVIII, BR. 1/2015. str. 179-196
Dražen Koški: Analyzing disequilibrium in the balance of payments: The case of Bosnia and Herzegovina
1. Introduction
For many years, Bosnia and Herzegovina’s current account balance has been in deficit. The cause of this deficit is the merchandise trade balance defi-cit, which is higher than the sum of the balance of services, balance of primary income and balance of
secondary income surpluses. In order to settle this deficit, Bosnia and Herzegovina has to sell state-owned property or go into debt abroad. However, both options can have far-reaching consequences for Bosnia and Herzegovina’ economy. Moreo-ver, these financing sources are not infinite. Given the surpluses in other components of the balance on the current account, Bosnia and Herzegovina
ANALYZING DISEQUILIBRIUM IN THE BALANCE OF PAYMENTS: THE CASE OF BOSNIA AND HERZEGOVINA
UDK: 339.72.053(497.6)Preliminary communication
Received: april 25, 2015accepted for publishing: May 27, 2015
Dražen KoškiJosip Juraj Strossmayer University of Osijek Faculty of Economics in OsijekTrg ljudevita Gaja 7,31000 Osijek, [email protected]: +38531224486
Abstract
For many years, Bosnia and Herzegovina’s current account balance has been in deficit. The goal of the research described in this paper is to investigate the causes and sources of financing this deficit. Hence, an analysis of disequilibrium measures in the balance of payments was conducted for the past five-year period, or, more precisely, from 2010 to 2014. The analysis comprised the standard measures of disequilibrium, as well as some currently not so frequently used measures such as the basic balance, the net liquidity balance and the official settlements balance.
The cause of the current account deficit is the merchandise trade balance deficit, which is higher than the sum of the balance of services, balance of primary income and balance of secondary income surpluses. This deficit is financed largely by foreign direct investment, but also by debt instruments based on other invest-ment, because of which the country’s external debt grows.
Given that the merchandise trade balance deficit was the main cause of Bosnia and Herzegovina’s current account deficit, in order to solve this problem, the country has to stimulate exports of goods and reduce its import dependence. Simultaneously, the country needs to strengthen the balance of services surplus.
Keywords: The balance of payments, the basic balance, the net liquidity balance, the official statements balance, measures of disequilibrium
180 181God. XXVIII, BR. 1/2015. str. 179-196 God. XXVIII, BR. 1/2015. str. 179-196
UDK: 339.72.053(497.6) / Preliminary communication Dražen Koški: Analyzing disequilibrium in the balance of payments: The case of Bosnia and Herzegovina
sis. A current account deficit “is tantamount to an increase in the international indebtedness of report-ing country” (Chacholiades, 1990: 295). Reversely, a current account surplus “represents an increase in the net foreign wealth of the reporting country” (Chacholiades, 1990: 295). In other words, a current account surplus is referred to as net foreign invest-ment, and a current account deficit is usually called the net foreign disinvestment.
If the line is drawn below the balance on the current account and long-term capital, the basic balance is obtained. This balance “represents an attempt to measure underlying trends, abstracting from such ‘volatile’ transactions as short-term capital move-ments” (Cooper, 1966: 384). Except for the differ-ences in prices of goods and services, in the long run, this balance reflects the differences in invest-ment opportunities among countries. Put another way, “it reflects tastes and preferences of consumers, efficiency of producers, and the time preference of all decisionmaking units” (Bach & Balbach, 1971: 9).
However, there are several problems in the interpre-tation and preparation of the basic balance.
First, a deficit of this balance must be financed by a surplus of short-term capital, so sustainability of this situation in the long run and the usefulness of this balance as an indicator of long run trends in economic transactions abroad are questionable. In other words, the basic balance can be a truthful indicator of long run trends solely if it is in equilib-rium. Because of this, Pippinger (1973: 11) argues that “a deficit or surplus on current account plus long-term capital financed by a short-term capital inflow is only temporary”.
Second, a deficit of the basic balance is not neces-sarily bad, if it arose due to investing abroad and if it will result in the future in return on investment. In addition, a surplus of this balance is not necessarily good if it is a result of going into debt abroad.
Third, there is a problem in the classification of capital into long and short-term capital. Because of this, Kenen warns that “one can find as many transi-tory elements in the so-called ‘basic’ balance, even in direct investment, and one can also argue that short-term private capital has its structural component”. Furthermore, a part of long-term liabilities can be converted into short-term ones and short-term li-abilities may be renewed and so get characteristics of long-term ones. In addition, the long-term com-ponent of portfolio investment may be as volatile as
the short-term. According to Branson (1971: 222):
“Portfolio capital reacts to changes in interest dif-ferentials and credit market conditions, rather than real investment incentive”.
Consequently, it is sometimes useful to compute the basic balance without portfolio investment, as Branson (1971) did.
The net liquidity balance is a result of drawing the line below the basic balance, short-term non-liq-uid capital, SDR allocation, and the net errors and omissions. In this fashion, short-term liquid capital, international reserves, liabilities to foreign official agencies and exceptional financing remain below the line. Hence, the net liquidity balance represents potential pressure on international reserves (Kemp, 1975: 20). In other words, foreigners may request conversion of their liquid claims into foreign ex-change, which is a component of international re-serves.
Similar to the basic balance, there are several dif-ficulties in interpreting and computing this balance.
First, it is sometimes difficult to classify the capi-tal into liquid and non-liquid. That which is by one criterion liquid, may be, by another criterion, non-liquid. Likewise, the net errors and omissions is the item above the line “as if this item represents only nonliquid capital flows” (Kuwayama, 1975: 187).
Second, given short-term private liquid capital, foreigners hold foreign exchange for transactions purposes as well, so it is inappropriate to consider all liquid liabilities to foreigners as potential pres-sure on international reserves. According to Kemp (1975: 20):
“Only those foreign-held claims which are in excess of those desired for transactions purposes can be rightfully considered as a potential source of pres-sure on our reserve assets”.
Hence, short-term liquid capital, which is held by foreigners for speculative purposes, may be consid-ered as a potential danger to international reserves. In addition, Kindleberger (1969: 880) notes:
“The liquidity definition is appropriate to a crisis but not to the steady state. It is well known that bank reserves suffer from the dilemma that in ordinary times none are needed, and that in crisis 100 percent reserves are hardly sufficient”.
Kindlberger’s statement is often confirmed in prac-tice, so Stiglitz (2001: 13) points out:
should stimulate a surplus in the merchandise trade balance and simultaneously strengthen the surplus in the balance of services.
The goal of this paper is to investigate the causes and ways of financing Bosnia and Herzegovina’s bal-ance of payments deficit. Likewise, the paper men-tions some consequences that this financing has (or could have) on the country’s economy, considering the fact that the Central Bank of Bosnia and Her-zegovina functions on the principles of a currency board.
In the paper, there is an analysis of Bosnia and Her-zegovina’s balance of payments in the past five-year period, i.e. from 2010 to 2014. For the analysis, the data from the International Monetary Fund da-tabase Balance of Payments Statistics (BOPS) are used1. The balance of payments concepts and their components are shown on the presentational basis from the Sixth Edition Balance of Payments and International Investment Position Manual (IMF, 2009). However, their amounts are presented on the sign-based presentation basis, which is described in the Fifth Edition Balance of Payments Manual (IMF, 1993). According to the sign-based presenta-tion, the negative sign means net foreign exchange outflow, and the positive sign means net foreign ex-change inflow2.
The structure of the paper is as follows. After the introduction, in the second section there is an ex-planation of the methodology of measuring dis-equilibrium in the balance of payments. Measures of disequilibrium in Bosnia and Herzegovina’s bal-ance of payments are analyzed in the third section. Besides the standard measures of disequilibrium, some currently not so frequently used measures are applied, but keeping in mind their limitations. These measures include the basic balance, the net li-quidity balance and the official settlements balance. At the end of the paper, in the fourth section, the conclusion is given.
2. Measures of Disequilibrium in the Balance of Payments
In the accounting sense, the balance of payments, just as any other balance, always balances. The rea-son for this is the double-entry bookkeeping sys-tem whose application has, as a consequence, that the sum of all credit items must equal the sum of
all debit items. In the context of the balance of pay-ments, this equality is most often shown as equality between a current account balance on the one hand and a capital and financial account balance on the other. In other words, the current account balance must be equal to the capital and financial account balance with reversed sign3. As a result, the current account deficit will be financed or settled by the capital and financial account surplus.
However, the same interpretation is valid for any other disequilibrium item of the balance of pay-ments. A deficit in any item (or in a group of items) of the balance of payments is financed by the sum of surpluses in all other items. Technically, analytical emphasis is most often indicated by drawing a line below a particular item. In this fashion, the items that are considered autonomous are above the line – they cause the items below the line, and the items that are below the line are considered financing or accommodating ones – they result from interna-tional transactions or they are needed for financing these transactions. Thus, by drawing the line in the balance of payments one can get useful information on the ways of financing deficit items.
Over time, it became usual to draw the line be-low certain items in the balance of payments and to analyze their balance. For instance, if the line is drawn below imports and exports of goods, the merchandise trade balance or the balance of goods arises. Given that imports and exports are, in this case, above the line, a deficit in this balance is fi-nanced by the net surplus in all items below the line. Furthermore, if imports and exports of services are added to the balance of goods, the balance of goods and services arises. This balance is a component of the gross domestic product. By drawing the line below income inflows and outflows, the balance of primary income is obtained, and below inflows and outflows of current transfers, the balance of second-ary income arises. The balance of primary income together with the balance of goods and services are components of gross national income.
All the four mentioned balances, the balance of goods, the balance of services, the balance of pri-mary income and the balance of secondary income make up the balance on the current account. The balance on the current account is a part of the gross national disposable income. Given the equality of this balance and the balance of the capital and the financial account (with reversed sign), this balance has a special meaning in a macroeconomic analy-
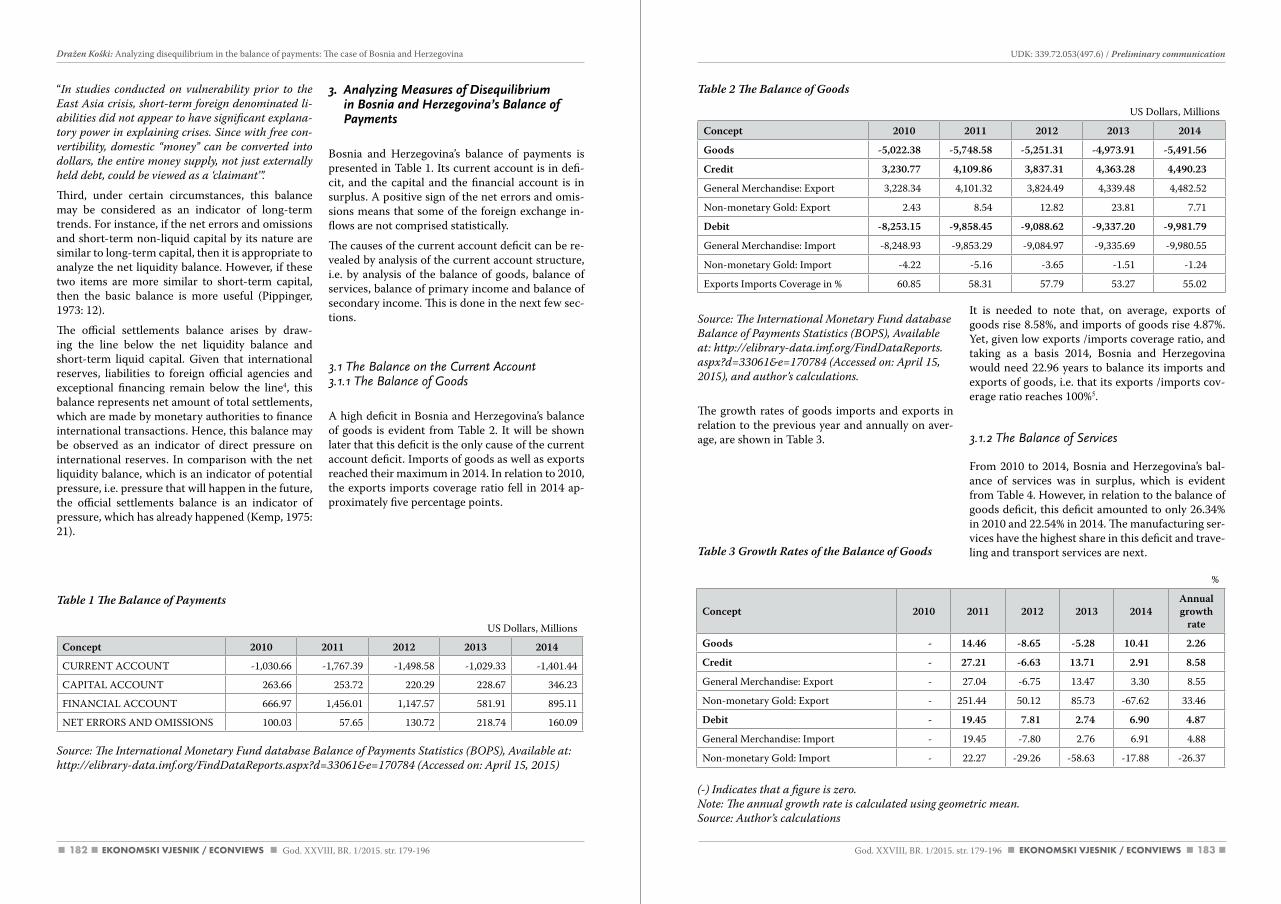
182 183
Table 2 The Balance of Goods
Source: The International Monetary Fund database Balance of Payments Statistics (BOPS), available at: http://elibrary-data.imf.org/FinddataReports.aspx?d=33061&e=170784 (accessed on: april 15, 2015), and author’s calculations.
The growth rates of goods imports and exports in relation to the previous year and annually on aver-age, are shown in Table 3.
Table 3 Growth Rates of the Balance of Goods
It is needed to note that, on average, exports of goods rise 8.58%, and imports of goods rise 4.87%. Yet, given low exports /imports coverage ratio, and taking as a basis 2014, Bosnia and Herzegovina would need 22.96 years to balance its imports and exports of goods, i.e. that its exports /imports cov-erage ratio reaches 100%5.
3.1.2 The Balance of Services
From 2010 to 2014, Bosnia and Herzegovina’s bal-ance of services was in surplus, which is evident from Table 4. However, in relation to the balance of goods deficit, this deficit amounted to only 26.34% in 2010 and 22.54% in 2014. The manufacturing ser-vices have the highest share in this deficit and trave-ling and transport services are next.
“In studies conducted on vulnerability prior to the East asia crisis, short-term foreign denominated li-abilities did not appear to have significant explana-tory power in explaining crises. Since with free con-vertibility, domestic “money” can be converted into dollars, the entire money supply, not just externally held debt, could be viewed as a ‘claimant’”.
Third, under certain circumstances, this balance may be considered as an indicator of long-term trends. For instance, if the net errors and omissions and short-term non-liquid capital by its nature are similar to long-term capital, then it is appropriate to analyze the net liquidity balance. However, if these two items are more similar to short-term capital, then the basic balance is more useful (Pippinger, 1973: 12).
The official settlements balance arises by draw-ing the line below the net liquidity balance and short-term liquid capital. Given that international reserves, liabilities to foreign official agencies and exceptional financing remain below the line4, this balance represents net amount of total settlements, which are made by monetary authorities to finance international transactions. Hence, this balance may be observed as an indicator of direct pressure on international reserves. In comparison with the net liquidity balance, which is an indicator of potential pressure, i.e. pressure that will happen in the future, the official settlements balance is an indicator of pressure, which has already happened (Kemp, 1975: 21).
Table 1 The Balance of Payments
3. Analyzing Measures of Disequilibrium in Bosnia and Herzegovina’s Balance of Payments
Bosnia and Herzegovina’s balance of payments is presented in Table 1. Its current account is in defi-cit, and the capital and the financial account is in surplus. A positive sign of the net errors and omis-sions means that some of the foreign exchange in-flows are not comprised statistically.
The causes of the current account deficit can be re-vealed by analysis of the current account structure, i.e. by analysis of the balance of goods, balance of services, balance of primary income and balance of secondary income. This is done in the next few sec-tions.
3.1 The Balance on the Current Account3.1.1 The Balance of Goods
A high deficit in Bosnia and Herzegovina’s balance of goods is evident from Table 2. It will be shown later that this deficit is the only cause of the current account deficit. Imports of goods as well as exports reached their maximum in 2014. In relation to 2010, the exports imports coverage ratio fell in 2014 ap-proximately five percentage points.
US Dollars, Millions
Concept 2010 2011 2012 2013 2014
CURRENT ACCOUNT -1,030.66 -1,767.39 -1,498.58 -1,029.33 -1,401.44
CAPITAL ACCOUNT 263.66 253.72 220.29 228.67 346.23
FINANCIAL ACCOUNT 666.97 1,456.01 1,147.57 581.91 895.11
NET ERRORS AND OMISSIONS 100.03 57.65 130.72 218.74 160.09
US Dollars, Millions
Concept 2010 2011 2012 2013 2014
Goods -5,022.38 -5,748.58 -5,251.31 -4,973.91 -5,491.56
Credit 3,230.77 4,109.86 3,837.31 4,363.28 4,490.23
General Merchandise: Export 3,228.34 4,101.32 3,824.49 4,339.48 4,482.52
Non-monetary Gold: Export 2.43 8.54 12.82 23.81 7.71
Debit -8,253.15 -9,858.45 -9,088.62 -9,337.20 -9,981.79
General Merchandise: Import -8,248.93 -9,853.29 -9,084.97 -9,335.69 -9,980.55
Non-monetary Gold: Import -4.22 -5.16 -3.65 -1.51 -1.24
Exports Imports Coverage in % 60.85 58.31 57.79 53.27 55.02
Source: The International Monetary Fund database Balance of Payments Statistics (BOPS), available at:http://elibrary-data.imf.org/FinddataReports.aspx?d=33061&e=170784 (accessed on: april 15, 2015)
%
Concept 2010 2011 2012 2013 2014Annual growth
rate
Goods - 14.46 -8.65 -5.28 10.41 2.26
Credit - 27.21 -6.63 13.71 2.91 8.58
General Merchandise: Export - 27.04 -6.75 13.47 3.30 8.55
Non-monetary Gold: Export - 251.44 50.12 85.73 -67.62 33.46
Debit - 19.45 7.81 2.74 6.90 4.87
General Merchandise: Import - 19.45 -7.80 2.76 6.91 4.88
Non-monetary Gold: Import - 22.27 -29.26 -58.63 -17.88 -26.37
God. XXVIII, BR. 1/2015. str. 179-196 God. XXVIII, BR. 1/2015. str. 179-196
UDK: 339.72.053(497.6) / Preliminary communication Dražen Koški: Analyzing disequilibrium in the balance of payments: The case of Bosnia and Herzegovina
(-) Indicates that a figure is zero.Note: The annual growth rate is calculated using geometric mean.Source: author’s calculations
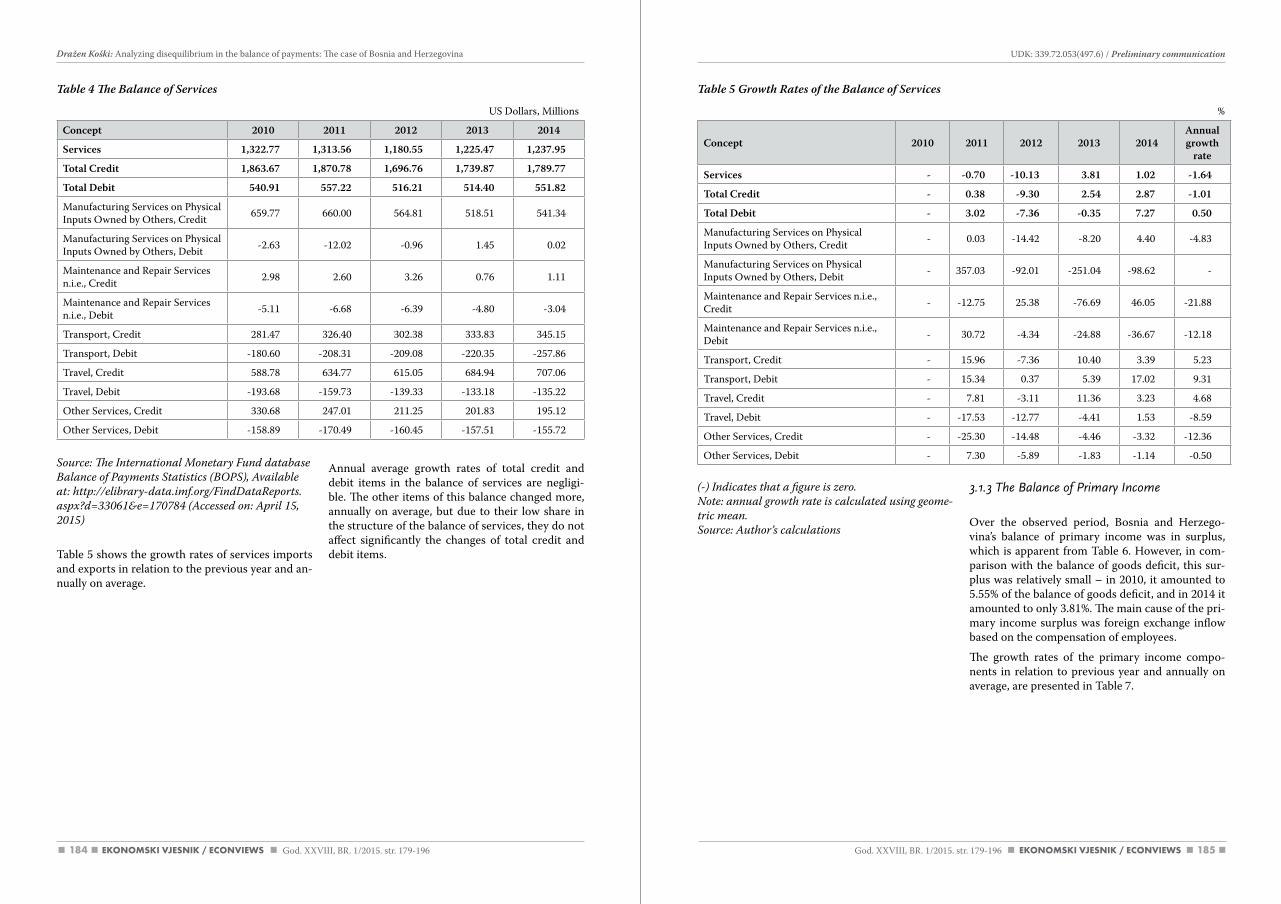
184 185
(-) Indicates that a figure is zero. Note: annual growth rate is calculated using geome-tric mean.Source: author’s calculations
3.1.3 The Balance of Primary Income
Over the observed period, Bosnia and Herzego-vina’s balance of primary income was in surplus, which is apparent from Table 6. However, in com-parison with the balance of goods deficit, this sur-plus was relatively small – in 2010, it amounted to 5.55% of the balance of goods deficit, and in 2014 it amounted to only 3.81%. The main cause of the pri-mary income surplus was foreign exchange inflow based on the compensation of employees.
The growth rates of the primary income compo-nents in relation to previous year and annually on average, are presented in Table 7.
Table 4 The Balance of Services
Source: The International Monetary Fund database Balance of Payments Statistics (BOPS), available at: http://elibrary-data.imf.org/FinddataReports.aspx?d=33061&e=170784 (accessed on: april 15, 2015)
Table 5 shows the growth rates of services imports and exports in relation to the previous year and an-nually on average.
Annual average growth rates of total credit and debit items in the balance of services are negligi-ble. The other items of this balance changed more, annually on average, but due to their low share in the structure of the balance of services, they do not affect significantly the changes of total credit and debit items.
US Dollars, Millions
Concept 2010 2011 2012 2013 2014
Services 1,322.77 1,313.56 1,180.55 1,225.47 1,237.95
Total Credit 1,863.67 1,870.78 1,696.76 1,739.87 1,789.77
Total Debit 540.91 557.22 516.21 514.40 551.82
Manufacturing Services on Physical Inputs Owned by Others, Credit 659.77 660.00 564.81 518.51 541.34
Manufacturing Services on Physical Inputs Owned by Others, Debit -2.63 -12.02 -0.96 1.45 0.02
Maintenance and Repair Services n.i.e., Credit 2.98 2.60 3.26 0.76 1.11
Maintenance and Repair Services n.i.e., Debit -5.11 -6.68 -6.39 -4.80 -3.04
Transport, Credit 281.47 326.40 302.38 333.83 345.15
Transport, Debit -180.60 -208.31 -209.08 -220.35 -257.86
Travel, Credit 588.78 634.77 615.05 684.94 707.06
Travel, Debit -193.68 -159.73 -139.33 -133.18 -135.22
Other Services, Credit 330.68 247.01 211.25 201.83 195.12
Other Services, Debit -158.89 -170.49 -160.45 -157.51 -155.72
%
Concept 2010 2011 2012 2013 2014Annual growth
rate
Services - -0.70 -10.13 3.81 1.02 -1.64
Total Credit - 0.38 -9.30 2.54 2.87 -1.01
Total Debit - 3.02 -7.36 -0.35 7.27 0.50
Manufacturing Services on Physical Inputs Owned by Others, Credit - 0.03 -14.42 -8.20 4.40 -4.83
Manufacturing Services on Physical Inputs Owned by Others, Debit - 357.03 -92.01 -251.04 -98.62 -
Maintenance and Repair Services n.i.e., Credit - -12.75 25.38 -76.69 46.05 -21.88
Maintenance and Repair Services n.i.e., Debit - 30.72 -4.34 -24.88 -36.67 -12.18
Transport, Credit - 15.96 -7.36 10.40 3.39 5.23
Transport, Debit - 15.34 0.37 5.39 17.02 9.31
Travel, Credit - 7.81 -3.11 11.36 3.23 4.68
Travel, Debit - -17.53 -12.77 -4.41 1.53 -8.59
Other Services, Credit - -25.30 -14.48 -4.46 -3.32 -12.36
Other Services, Debit - 7.30 -5.89 -1.83 -1.14 -0.50
Table 5 Growth Rates of the Balance of Services
God. XXVIII, BR. 1/2015. str. 179-196 God. XXVIII, BR. 1/2015. str. 179-196
UDK: 339.72.053(497.6) / Preliminary communication Dražen Koški: Analyzing disequilibrium in the balance of payments: The case of Bosnia and Herzegovina
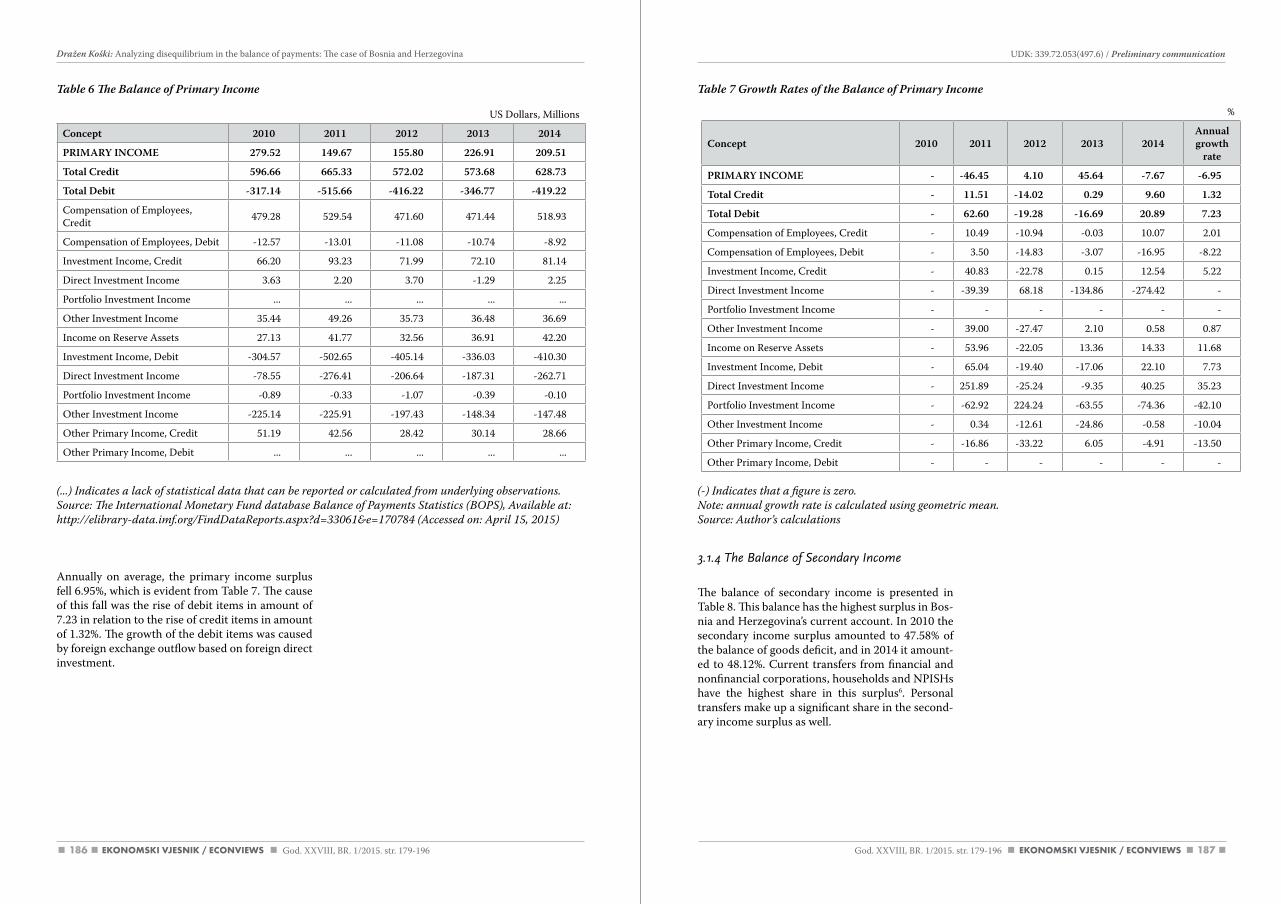
186 187
3.1.4 The Balance of Secondary Income
The balance of secondary income is presented in Table 8. This balance has the highest surplus in Bos-nia and Herzegovina’s current account. In 2010 the secondary income surplus amounted to 47.58% of the balance of goods deficit, and in 2014 it amount-ed to 48.12%. Current transfers from financial and nonfinancial corporations, households and NPISHs have the highest share in this surplus6. Personal transfers make up a significant share in the second-ary income surplus as well.
Annually on average, the primary income surplus fell 6.95%, which is evident from Table 7. The cause of this fall was the rise of debit items in amount of 7.23 in relation to the rise of credit items in amount of 1.32%. The growth of the debit items was caused by foreign exchange outflow based on foreign direct investment.
Table 6 The Balance of Primary Income Table 7 Growth Rates of the Balance of Primary Income
(...) Indicates a lack of statistical data that can be reported or calculated from underlying observations. Source: The International Monetary Fund database Balance of Payments Statistics (BOPS), available at:http://elibrary-data.imf.org/FinddataReports.aspx?d=33061&e=170784 (accessed on: april 15, 2015)
(-) Indicates that a figure is zero. Note: annual growth rate is calculated using geometric mean.Source: author’s calculations
US Dollars, Millions
Concept 2010 2011 2012 2013 2014
PRIMARY INCOME 279.52 149.67 155.80 226.91 209.51
Total Credit 596.66 665.33 572.02 573.68 628.73
Total Debit -317.14 -515.66 -416.22 -346.77 -419.22
Compensation of Employees, Credit 479.28 529.54 471.60 471.44 518.93
Compensation of Employees, Debit -12.57 -13.01 -11.08 -10.74 -8.92
Investment Income, Credit 66.20 93.23 71.99 72.10 81.14
Direct Investment Income 3.63 2.20 3.70 -1.29 2.25
Portfolio Investment Income ... ... ... ... ...
Other Investment Income 35.44 49.26 35.73 36.48 36.69
Income on Reserve Assets 27.13 41.77 32.56 36.91 42.20
Investment Income, Debit -304.57 -502.65 -405.14 -336.03 -410.30
Direct Investment Income -78.55 -276.41 -206.64 -187.31 -262.71
Portfolio Investment Income -0.89 -0.33 -1.07 -0.39 -0.10
Other Investment Income -225.14 -225.91 -197.43 -148.34 -147.48
Other Primary Income, Credit 51.19 42.56 28.42 30.14 28.66
Other Primary Income, Debit ... ... ... ... ...
%
Concept 2010 2011 2012 2013 2014Annual growth
rate
PRIMARY INCOME - -46.45 4.10 45.64 -7.67 -6.95
Total Credit - 11.51 -14.02 0.29 9.60 1.32
Total Debit - 62.60 -19.28 -16.69 20.89 7.23
Compensation of Employees, Credit - 10.49 -10.94 -0.03 10.07 2.01
Compensation of Employees, Debit - 3.50 -14.83 -3.07 -16.95 -8.22
Investment Income, Credit - 40.83 -22.78 0.15 12.54 5.22
Direct Investment Income - -39.39 68.18 -134.86 -274.42 -
Portfolio Investment Income - - - - - -
Other Investment Income - 39.00 -27.47 2.10 0.58 0.87
Income on Reserve Assets - 53.96 -22.05 13.36 14.33 11.68
Investment Income, Debit - 65.04 -19.40 -17.06 22.10 7.73
Direct Investment Income - 251.89 -25.24 -9.35 40.25 35.23
Portfolio Investment Income - -62.92 224.24 -63.55 -74.36 -42.10
Other Investment Income - 0.34 -12.61 -24.86 -0.58 -10.04
Other Primary Income, Credit - -16.86 -33.22 6.05 -4.91 -13.50
Other Primary Income, Debit - - - - - -
God. XXVIII, BR. 1/2015. str. 179-196 God. XXVIII, BR. 1/2015. str. 179-196
UDK: 339.72.053(497.6) / Preliminary communication Dražen Koški: Analyzing disequilibrium in the balance of payments: The case of Bosnia and Herzegovina
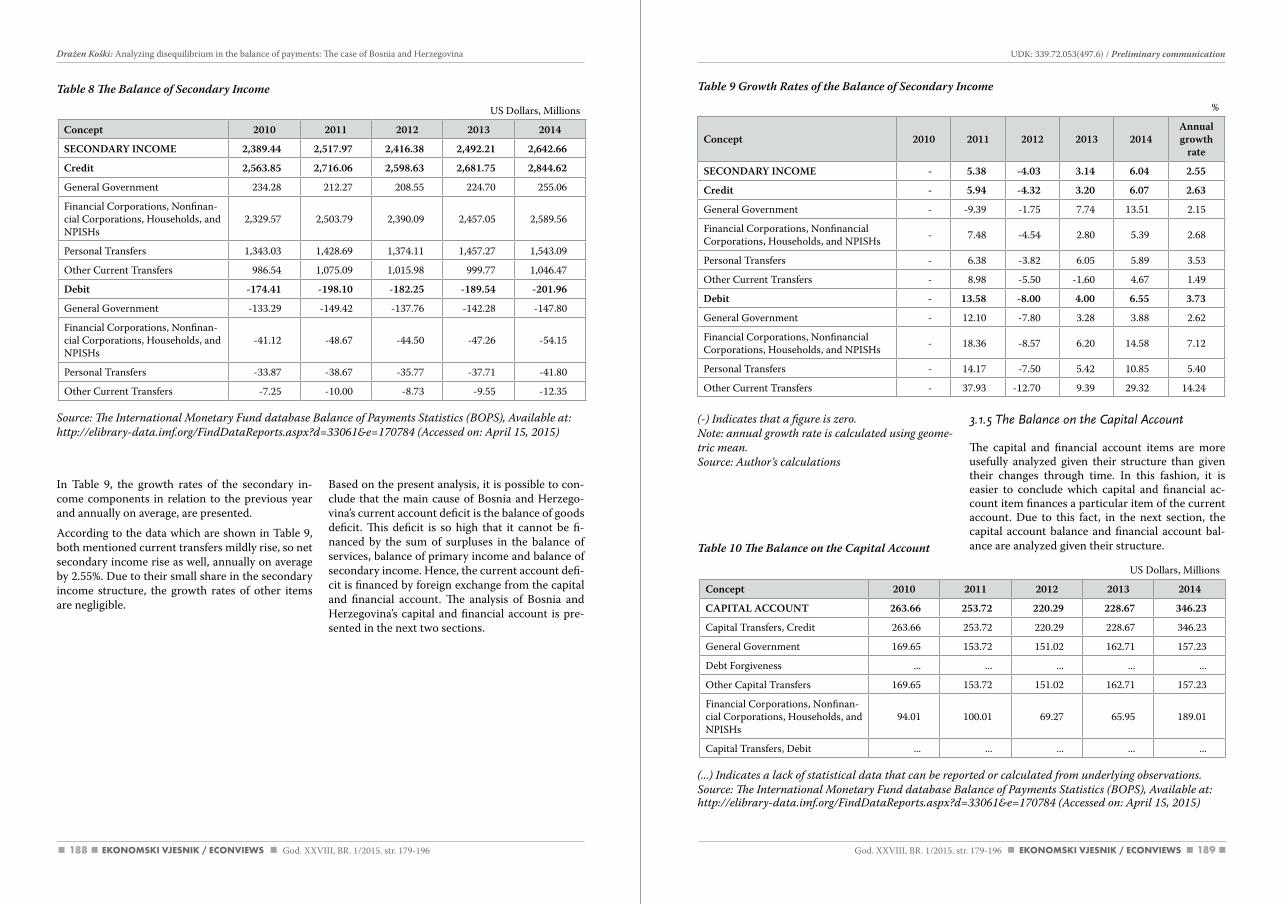
188 189
(-) Indicates that a figure is zero. Note: annual growth rate is calculated using geome-tric mean.Source: author’s calculations
Table 10 The Balance on the Capital Account
3.1.5 The Balance on the Capital Account
The capital and financial account items are more usefully analyzed given their structure than given their changes through time. In this fashion, it is easier to conclude which capital and financial ac-count item finances a particular item of the current account. Due to this fact, in the next section, the capital account balance and financial account bal-ance are analyzed given their structure.
In Table 9, the growth rates of the secondary in-come components in relation to the previous year and annually on average, are presented.
According to the data which are shown in Table 9, both mentioned current transfers mildly rise, so net secondary income rise as well, annually on average by 2.55%. Due to their small share in the secondary income structure, the growth rates of other items are negligible.
Based on the present analysis, it is possible to con-clude that the main cause of Bosnia and Herzego-vina’s current account deficit is the balance of goods deficit. This deficit is so high that it cannot be fi-nanced by the sum of surpluses in the balance of services, balance of primary income and balance of secondary income. Hence, the current account defi-cit is financed by foreign exchange from the capital and financial account. The analysis of Bosnia and Herzegovina’s capital and financial account is pre-sented in the next two sections.
US Dollars, Millions
Concept 2010 2011 2012 2013 2014
SECONDARY INCOME 2,389.44 2,517.97 2,416.38 2,492.21 2,642.66
Credit 2,563.85 2,716.06 2,598.63 2,681.75 2,844.62
General Government 234.28 212.27 208.55 224.70 255.06
Financial Corporations, Nonfinan-cial Corporations, Households, and NPISHs
2,329.57 2,503.79 2,390.09 2,457.05 2,589.56
Personal Transfers 1,343.03 1,428.69 1,374.11 1,457.27 1,543.09
Other Current Transfers 986.54 1,075.09 1,015.98 999.77 1,046.47
Debit -174.41 -198.10 -182.25 -189.54 -201.96
General Government -133.29 -149.42 -137.76 -142.28 -147.80
Financial Corporations, Nonfinan-cial Corporations, Households, and NPISHs
-41.12 -48.67 -44.50 -47.26 -54.15
Personal Transfers -33.87 -38.67 -35.77 -37.71 -41.80
Other Current Transfers -7.25 -10.00 -8.73 -9.55 -12.35
Table 8 The Balance of Secondary Income Table 9 Growth Rates of the Balance of Secondary Income
Source: The International Monetary Fund database Balance of Payments Statistics (BOPS), available at:http://elibrary-data.imf.org/FinddataReports.aspx?d=33061&e=170784 (accessed on: april 15, 2015)
%
Concept 2010 2011 2012 2013 2014Annual growth
rate
SECONDARY INCOME - 5.38 -4.03 3.14 6.04 2.55
Credit - 5.94 -4.32 3.20 6.07 2.63
General Government - -9.39 -1.75 7.74 13.51 2.15
Financial Corporations, Nonfinancial Corporations, Households, and NPISHs - 7.48 -4.54 2.80 5.39 2.68
Personal Transfers - 6.38 -3.82 6.05 5.89 3.53
Other Current Transfers - 8.98 -5.50 -1.60 4.67 1.49
Debit - 13.58 -8.00 4.00 6.55 3.73
General Government - 12.10 -7.80 3.28 3.88 2.62
Financial Corporations, Nonfinancial Corporations, Households, and NPISHs - 18.36 -8.57 6.20 14.58 7.12
Personal Transfers - 14.17 -7.50 5.42 10.85 5.40
Other Current Transfers - 37.93 -12.70 9.39 29.32 14.24
US Dollars, Millions
Concept 2010 2011 2012 2013 2014
CAPITAL ACCOUNT 263.66 253.72 220.29 228.67 346.23
Capital Transfers, Credit 263.66 253.72 220.29 228.67 346.23
General Government 169.65 153.72 151.02 162.71 157.23
Debt Forgiveness ... ... ... ... ...
Other Capital Transfers 169.65 153.72 151.02 162.71 157.23
Financial Corporations, Nonfinan-cial Corporations, Households, and NPISHs
94.01 100.01 69.27 65.95 189.01
Capital Transfers, Debit ... ... ... ... ...
(...) Indicates a lack of statistical data that can be reported or calculated from underlying observations.Source: The International Monetary Fund database Balance of Payments Statistics (BOPS), available at:http://elibrary-data.imf.org/FinddataReports.aspx?d=33061&e=170784 (accessed on: april 15, 2015)
God. XXVIII, BR. 1/2015. str. 179-196 God. XXVIII, BR. 1/2015. str. 179-196
UDK: 339.72.053(497.6) / Preliminary communication Dražen Koški: Analyzing disequilibrium in the balance of payments: The case of Bosnia and Herzegovina
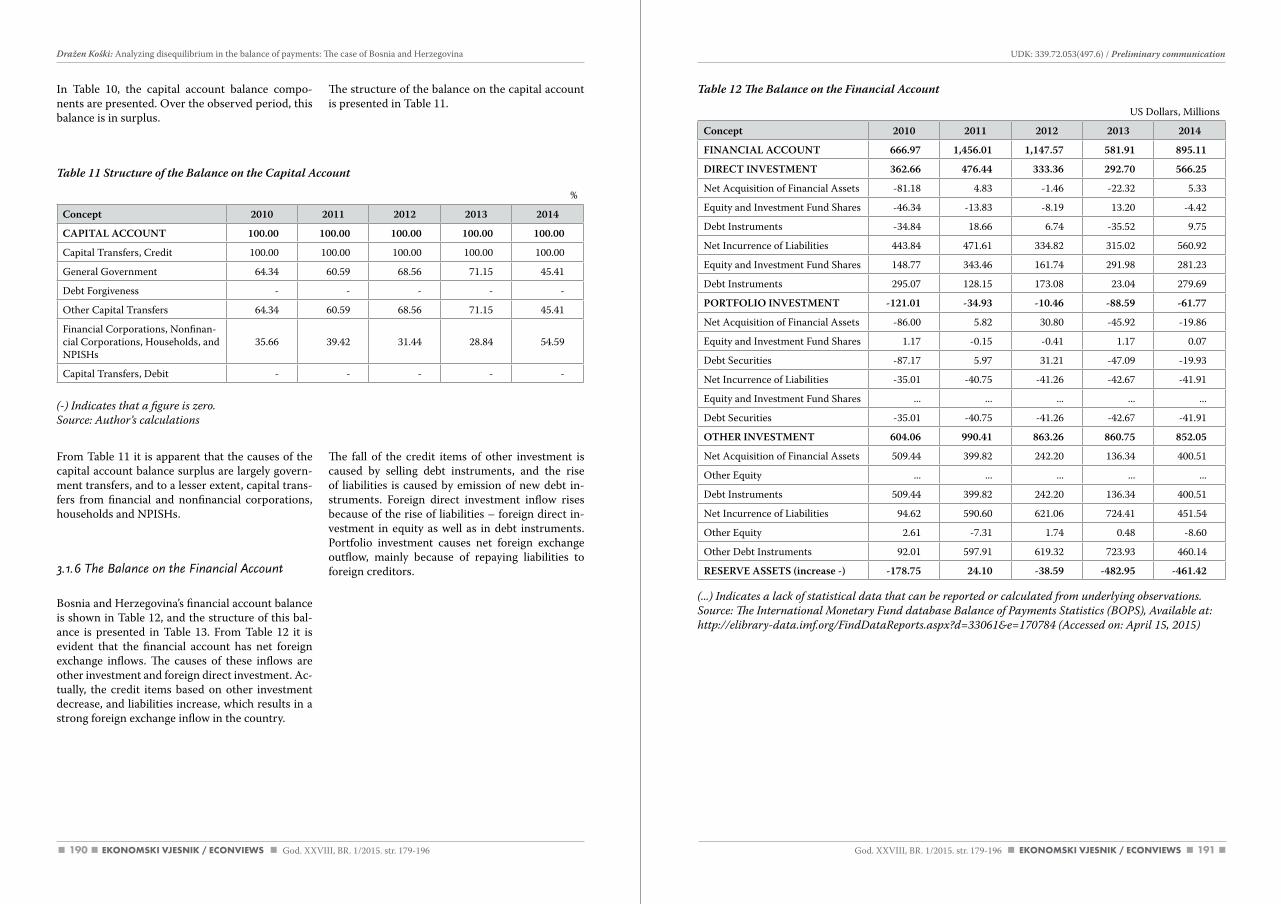
190 191
From Table 11 it is apparent that the causes of the capital account balance surplus are largely govern-ment transfers, and to a lesser extent, capital trans-fers from financial and nonfinancial corporations, households and NPISHs.
3.1.6 The Balance on the Financial Account
Bosnia and Herzegovina’s financial account balance is shown in Table 12, and the structure of this bal-ance is presented in Table 13. From Table 12 it is evident that the financial account has net foreign exchange inflows. The causes of these inflows are other investment and foreign direct investment. Ac-tually, the credit items based on other investment decrease, and liabilities increase, which results in a strong foreign exchange inflow in the country.
The fall of the credit items of other investment is caused by selling debt instruments, and the rise of liabilities is caused by emission of new debt in-struments. Foreign direct investment inflow rises because of the rise of liabilities – foreign direct in-vestment in equity as well as in debt instruments. Portfolio investment causes net foreign exchange outflow, mainly because of repaying liabilities to foreign creditors.
In Table 10, the capital account balance compo-nents are presented. Over the observed period, this balance is in surplus.
The structure of the balance on the capital account is presented in Table 11.
%
Concept 2010 2011 2012 2013 2014
CAPITAL ACCOUNT 100.00 100.00 100.00 100.00 100.00
Capital Transfers, Credit 100.00 100.00 100.00 100.00 100.00
General Government 64.34 60.59 68.56 71.15 45.41
Debt Forgiveness - - - - -
Other Capital Transfers 64.34 60.59 68.56 71.15 45.41
Financial Corporations, Nonfinan-cial Corporations, Households, and NPISHs
35.66 39.42 31.44 28.84 54.59
Capital Transfers, Debit - - - - -
Table 11 Structure of the Balance on the Capital Account
Table 12 The Balance on the Financial Account
(-) Indicates that a figure is zero. Source: author’s calculations
(...) Indicates a lack of statistical data that can be reported or calculated from underlying observations. Source: The International Monetary Fund database Balance of Payments Statistics (BOPS), available at:http://elibrary-data.imf.org/FinddataReports.aspx?d=33061&e=170784 (accessed on: april 15, 2015)
US Dollars, Millions
Concept 2010 2011 2012 2013 2014
FINANCIAL ACCOUNT 666.97 1,456.01 1,147.57 581.91 895.11
DIRECT INVESTMENT 362.66 476.44 333.36 292.70 566.25
Net Acquisition of Financial Assets -81.18 4.83 -1.46 -22.32 5.33
Equity and Investment Fund Shares -46.34 -13.83 -8.19 13.20 -4.42
Debt Instruments -34.84 18.66 6.74 -35.52 9.75
Net Incurrence of Liabilities 443.84 471.61 334.82 315.02 560.92
Equity and Investment Fund Shares 148.77 343.46 161.74 291.98 281.23
Debt Instruments 295.07 128.15 173.08 23.04 279.69
PORTFOLIO INVESTMENT -121.01 -34.93 -10.46 -88.59 -61.77
Net Acquisition of Financial Assets -86.00 5.82 30.80 -45.92 -19.86
Equity and Investment Fund Shares 1.17 -0.15 -0.41 1.17 0.07
Debt Securities -87.17 5.97 31.21 -47.09 -19.93
Net Incurrence of Liabilities -35.01 -40.75 -41.26 -42.67 -41.91
Equity and Investment Fund Shares ... ... ... ... ...
Debt Securities -35.01 -40.75 -41.26 -42.67 -41.91
OTHER INVESTMENT 604.06 990.41 863.26 860.75 852.05
Net Acquisition of Financial Assets 509.44 399.82 242.20 136.34 400.51
Other Equity ... ... ... ... ...
Debt Instruments 509.44 399.82 242.20 136.34 400.51
Net Incurrence of Liabilities 94.62 590.60 621.06 724.41 451.54
Other Equity 2.61 -7.31 1.74 0.48 -8.60
Other Debt Instruments 92.01 597.91 619.32 723.93 460.14
RESERVE ASSETS (increase -) -178.75 24.10 -38.59 -482.95 -461.42
God. XXVIII, BR. 1/2015. str. 179-196 God. XXVIII, BR. 1/2015. str. 179-196
UDK: 339.72.053(497.6) / Preliminary communication Dražen Koški: Analyzing disequilibrium in the balance of payments: The case of Bosnia and Herzegovina
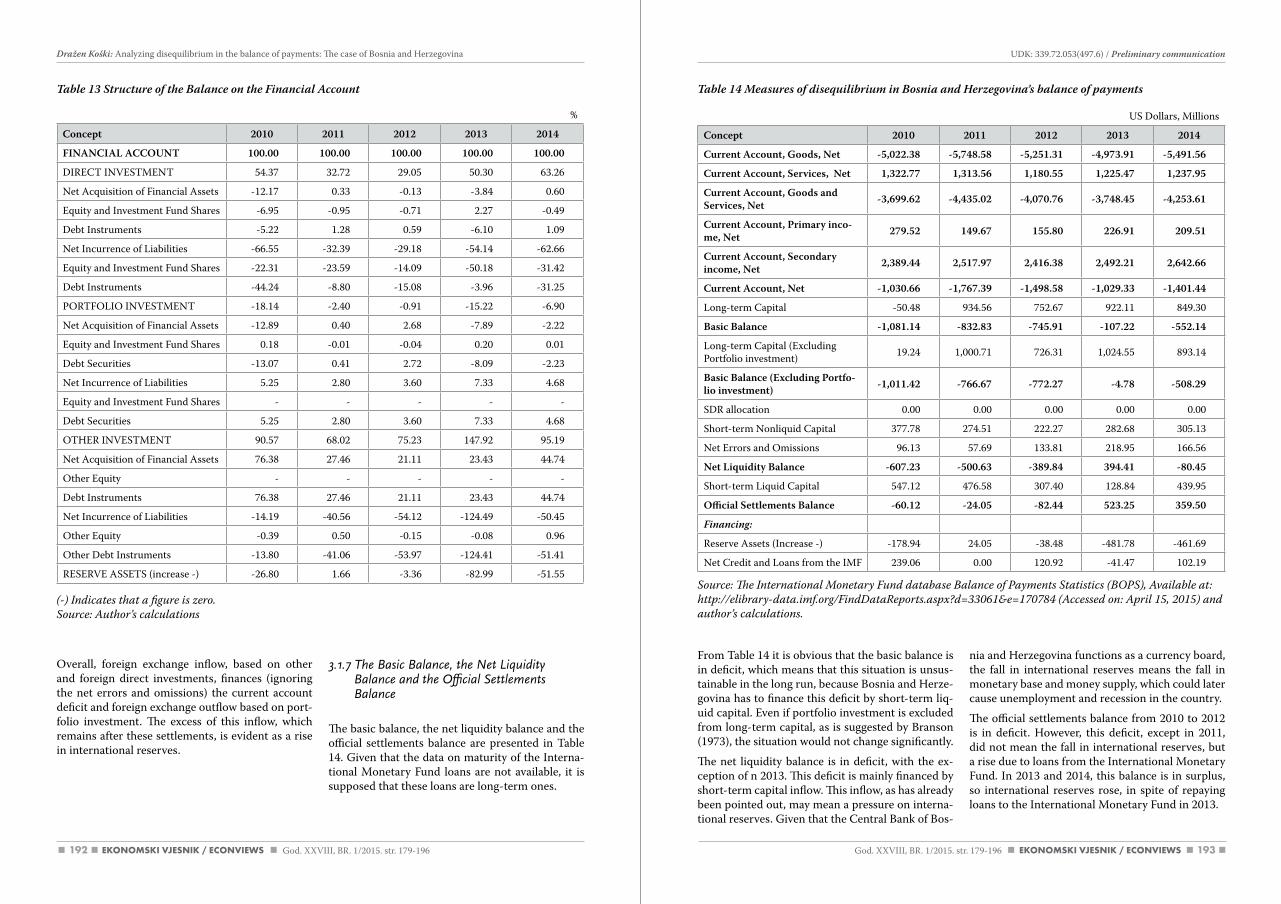
192 193
From Table 14 it is obvious that the basic balance is in deficit, which means that this situation is unsus-tainable in the long run, because Bosnia and Herze-govina has to finance this deficit by short-term liq-uid capital. Even if portfolio investment is excluded from long-term capital, as is suggested by Branson (1973), the situation would not change significantly.
The net liquidity balance is in deficit, with the ex-ception of n 2013. This deficit is mainly financed by short-term capital inflow. This inflow, as has already been pointed out, may mean a pressure on interna-tional reserves. Given that the Central Bank of Bos-
nia and Herzegovina functions as a currency board, the fall in international reserves means the fall in monetary base and money supply, which could later cause unemployment and recession in the country.
The official settlements balance from 2010 to 2012 is in deficit. However, this deficit, except in 2011, did not mean the fall in international reserves, but a rise due to loans from the International Monetary Fund. In 2013 and 2014, this balance is in surplus, so international reserves rose, in spite of repaying loans to the International Monetary Fund in 2013.
Overall, foreign exchange inflow, based on other and foreign direct investments, finances (ignoring the net errors and omissions) the current account deficit and foreign exchange outflow based on port-folio investment. The excess of this inflow, which remains after these settlements, is evident as a rise in international reserves.
3.1.7 The Basic Balance, the Net Liquidity Balance and the Official Settlements Balance
The basic balance, the net liquidity balance and the official settlements balance are presented in Table 14. Given that the data on maturity of the Interna-tional Monetary Fund loans are not available, it is supposed that these loans are long-term ones.
%
Concept 2010 2011 2012 2013 2014
FINANCIAL ACCOUNT 100.00 100.00 100.00 100.00 100.00
DIRECT INVESTMENT 54.37 32.72 29.05 50.30 63.26
Net Acquisition of Financial Assets -12.17 0.33 -0.13 -3.84 0.60
Equity and Investment Fund Shares -6.95 -0.95 -0.71 2.27 -0.49
Debt Instruments -5.22 1.28 0.59 -6.10 1.09
Net Incurrence of Liabilities -66.55 -32.39 -29.18 -54.14 -62.66
Equity and Investment Fund Shares -22.31 -23.59 -14.09 -50.18 -31.42
Debt Instruments -44.24 -8.80 -15.08 -3.96 -31.25
PORTFOLIO INVESTMENT -18.14 -2.40 -0.91 -15.22 -6.90
Net Acquisition of Financial Assets -12.89 0.40 2.68 -7.89 -2.22
Equity and Investment Fund Shares 0.18 -0.01 -0.04 0.20 0.01
Debt Securities -13.07 0.41 2.72 -8.09 -2.23
Net Incurrence of Liabilities 5.25 2.80 3.60 7.33 4.68
Equity and Investment Fund Shares - - - - -
Debt Securities 5.25 2.80 3.60 7.33 4.68
OTHER INVESTMENT 90.57 68.02 75.23 147.92 95.19
Net Acquisition of Financial Assets 76.38 27.46 21.11 23.43 44.74
Other Equity - - - - -
Debt Instruments 76.38 27.46 21.11 23.43 44.74
Net Incurrence of Liabilities -14.19 -40.56 -54.12 -124.49 -50.45
Other Equity -0.39 0.50 -0.15 -0.08 0.96
Other Debt Instruments -13.80 -41.06 -53.97 -124.41 -51.41
RESERVE ASSETS (increase -) -26.80 1.66 -3.36 -82.99 -51.55
Table 13 Structure of the Balance on the Financial Account Table 14 Measures of disequilibrium in Bosnia and Herzegovina’s balance of payments
(-) Indicates that a figure is zero. Source: author’s calculations
Source: The International Monetary Fund database Balance of Payments Statistics (BOPS), available at:http://elibrary-data.imf.org/FinddataReports.aspx?d=33061&e=170784 (accessed on: april 15, 2015) and author’s calculations.
US Dollars, Millions
Concept 2010 2011 2012 2013 2014
Current Account, Goods, Net -5,022.38 -5,748.58 -5,251.31 -4,973.91 -5,491.56
Current Account, Services, Net 1,322.77 1,313.56 1,180.55 1,225.47 1,237.95
Current Account, Goods and Services, Net -3,699.62 -4,435.02 -4,070.76 -3,748.45 -4,253.61
Current Account, Primary inco-me, Net 279.52 149.67 155.80 226.91 209.51
Current Account, Secondary income, Net 2,389.44 2,517.97 2,416.38 2,492.21 2,642.66
Current Account, Net -1,030.66 -1,767.39 -1,498.58 -1,029.33 -1,401.44
Long-term Capital -50.48 934.56 752.67 922.11 849.30
Basic Balance -1,081.14 -832.83 -745.91 -107.22 -552.14
Long-term Capital (Excluding Portfolio investment) 19.24 1,000.71 726.31 1,024.55 893.14
Basic Balance (Excluding Portfo-lio investment) -1,011.42 -766.67 -772.27 -4.78 -508.29
SDR allocation 0.00 0.00 0.00 0.00 0.00
Short-term Nonliquid Capital 377.78 274.51 222.27 282.68 305.13
Net Errors and Omissions 96.13 57.69 133.81 218.95 166.56
Net Liquidity Balance -607.23 -500.63 -389.84 394.41 -80.45
Short-term Liquid Capital 547.12 476.58 307.40 128.84 439.95
Official Settlements Balance -60.12 -24.05 -82.44 523.25 359.50
Financing:
Reserve Assets (Increase -) -178.94 24.05 -38.48 -481.78 -461.69
Net Credit and Loans from the IMF 239.06 0.00 120.92 -41.47 102.19
God. XXVIII, BR. 1/2015. str. 179-196 God. XXVIII, BR. 1/2015. str. 179-196
UDK: 339.72.053(497.6) / Preliminary communication Dražen Koški: Analyzing disequilibrium in the balance of payments: The case of Bosnia and Herzegovina
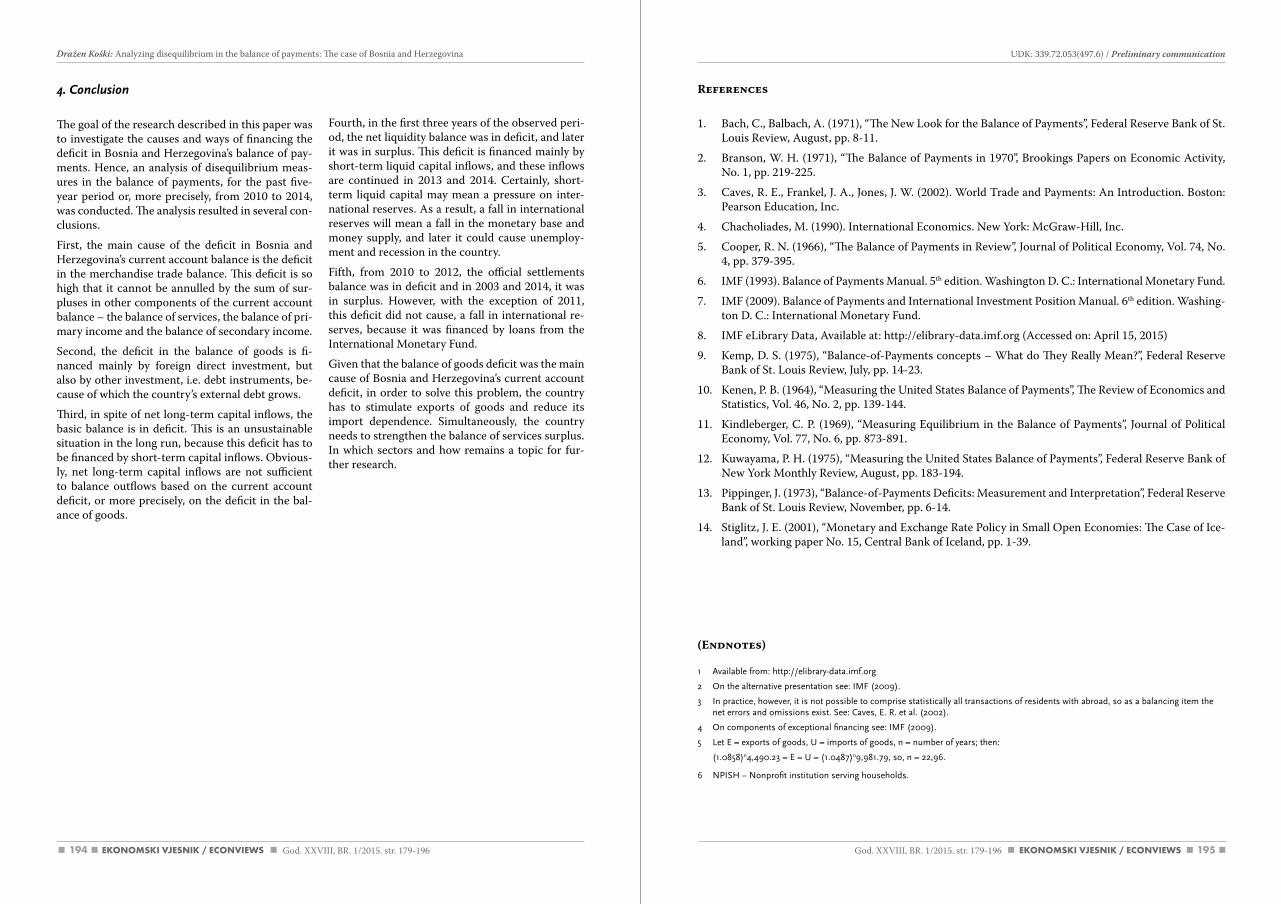
194 195
References
1. Bach, C., Balbach, A. (1971), “The New Look for the Balance of Payments”, Federal Reserve Bank of St. Louis Review, August, pp. 8-11.
2. Branson, W. H. (1971), “The Balance of Payments in 1970”, Brookings Papers on Economic Activity, No. 1, pp. 219-225.
3. Caves, R. E., Frankel, J. A., Jones, J. W. (2002). World Trade and Payments: An Introduction. Boston: Pearson Education, Inc.
4. Chacholiades, M. (1990). International Economics. New York: McGraw-Hill, Inc.
5. Cooper, R. N. (1966), “The Balance of Payments in Review”, Journal of Political Economy, Vol. 74, No. 4, pp. 379-395.
6. IMF (1993). Balance of Payments Manual. 5th edition. Washington D. C.: International Monetary Fund.
7. IMF (2009). Balance of Payments and International Investment Position Manual. 6th edition. Washing-ton D. C.: International Monetary Fund.
8. IMF eLibrary Data, Available at: http://elibrary-data.imf.org (Accessed on: April 15, 2015)
9. Kemp, D. S. (1975), “Balance-of-Payments concepts – What do They Really Mean?”, Federal Reserve Bank of St. Louis Review, July, pp. 14-23.
10. Kenen, P. B. (1964), “Measuring the United States Balance of Payments”, The Review of Economics and Statistics, Vol. 46, No. 2, pp. 139-144.
11. Kindleberger, C. P. (1969), “Measuring Equilibrium in the Balance of Payments”, Journal of Political Economy, Vol. 77, No. 6, pp. 873-891.
12. Kuwayama, P. H. (1975), “Measuring the United States Balance of Payments”, Federal Reserve Bank of New York Monthly Review, August, pp. 183-194.
13. Pippinger, J. (1973), “Balance-of-Payments Deficits: Measurement and Interpretation”, Federal Reserve Bank of St. Louis Review, November, pp. 6-14.
14. Stiglitz, J. E. (2001), “Monetary and Exchange Rate Policy in Small Open Economies: The Case of Ice-land”, working paper No. 15, Central Bank of Iceland, pp. 1-39.
(Endnotes)
1 Available from: http://elibrary-data.imf.org
2 On the alternative presentation see: IMF (2009).
3 In practice, however, it is not possible to comprise statistically all transactions of residents with abroad, so as a balancing item the net errors and omissions exist. See: Caves, E. R. et al. (2002).
4 On components of exceptional financing see: IMF (2009).
5 Let E = exports of goods, U = imports of goods, n = number of years; then:
(1.0858)n4,490.23 = E = U = (1.0487)n9,981.79, so, n = 22,96.
6 NPISH – Nonprofit institution serving households.
4. Conclusion
The goal of the research described in this paper was to investigate the causes and ways of financing the deficit in Bosnia and Herzegovina’s balance of pay-ments. Hence, an analysis of disequilibrium meas-ures in the balance of payments, for the past five-year period or, more precisely, from 2010 to 2014, was conducted. The analysis resulted in several con-clusions.
First, the main cause of the deficit in Bosnia and Herzegovina’s current account balance is the deficit in the merchandise trade balance. This deficit is so high that it cannot be annulled by the sum of sur-pluses in other components of the current account balance – the balance of services, the balance of pri-mary income and the balance of secondary income.
Second, the deficit in the balance of goods is fi-nanced mainly by foreign direct investment, but also by other investment, i.e. debt instruments, be-cause of which the country’s external debt grows.
Third, in spite of net long-term capital inflows, the basic balance is in deficit. This is an unsustainable situation in the long run, because this deficit has to be financed by short-term capital inflows. Obvious-ly, net long-term capital inflows are not sufficient to balance outflows based on the current account deficit, or more precisely, on the deficit in the bal-ance of goods.
Fourth, in the first three years of the observed peri-od, the net liquidity balance was in deficit, and later it was in surplus. This deficit is financed mainly by short-term liquid capital inflows, and these inflows are continued in 2013 and 2014. Certainly, short-term liquid capital may mean a pressure on inter-national reserves. As a result, a fall in international reserves will mean a fall in the monetary base and money supply, and later it could cause unemploy-ment and recession in the country.
Fifth, from 2010 to 2012, the official settlements balance was in deficit and in 2003 and 2014, it was in surplus. However, with the exception of 2011, this deficit did not cause, a fall in international re-serves, because it was financed by loans from the International Monetary Fund.
Given that the balance of goods deficit was the main cause of Bosnia and Herzegovina’s current account deficit, in order to solve this problem, the country has to stimulate exports of goods and reduce its import dependence. Simultaneously, the country needs to strengthen the balance of services surplus. In which sectors and how remains a topic for fur-ther research.
God. XXVIII, BR. 1/2015. str. 179-196 God. XXVIII, BR. 1/2015. str. 179-196
UDK: 339.72.053(497.6) / Preliminary communication Dražen Koški: Analyzing disequilibrium in the balance of payments: The case of Bosnia and Herzegovina
196
Dražen Koški
Analiza neravnoteže u bilanci plaćanja:Slučaj Bosne i Hercegovine
Sažetak
Mnogo je godina bilanca na tekućem računu Bosne i Hercegovine u deficitu. Cilj istraživanja ovoga rada bio je istražiti uzroke i izvore financiranja tog deficita. Provedena je analiza mjera neravnoteže u bilanci plaćanja za razdoblje od proteklih pet godina, preciznije od 2010. do 2014. Analiza je obuhvatila standardne mjere neravnoteže, ali i neke danas, ne tako često korištene mjere kao što su temeljna bilanca, bilanca neto likvidnosti i bilanca službenih podmirenja.
Uzrok deficita bilance na tekućem računu je deficit bilance roba koji je veći nego suma suficita bilance uslu-ga, bilance primarnoga dohotka i bilance sekundarnoga dohotka. Taj deficit uvelike je financiran stranim izravnim investicijama, ali i dužničkim instrumentima po osnovi ostalih investicija zbog kojih raste in-ozemni dug zemlje.
S obzirom da je deficit bilance roba glavni uzrok deficita bilance na tekućem računu Bosne i Hercegovine, da bi se riješio ovaj problem, zemlja mora poticati izvoz roba i smanjiti uvoznu ovisnost. Istodobno, zemlja treba jačati suficit u bilanci usluga.
Ključne riječi: bilanca plaćanja, temeljna bilanca, bilanca neto likvidnosti, bilanca službenih podmirenja, mjere neravnoteže
God. XXVIII, BR. 1/2015. str. 179-196
Dražen Koški: Analyzing disequilibrium in the balance of payments: The case of Bosnia and Herzegovina
Review articlesPregledni članci
Dražen Novaković:Evaluation of the financial performance of pension funds in croatia
Martina Harc:The relationship between tangible assets and capital structure of small
and medium-sized companies in croatia
Tomislav Galović:The international competitiveness of the pharmaceutical industry within 21 OEcd countries
Regina Moczadlo:creating competitive advantages – The European cSR-strategy compared
with Porter’s and Kramer’s Shared value approach
Sabina Đonlagić, Samira Fazlić, Amra Nuhanović: Introducing a framework for knowledge economy development in transition countries:
The case of Bosnia and Herzegovina
199God. XXVIII, BR. 1/2015. str. 199-212
Dražen Novaković: Evaluation of the financial performance of pension funds in Croatia
EVALUATION OF THE FINANCIAL PERFORMANCE OF PENSION FUNDS IN CROATIA
UDK: 336.714(497.5)Review article
Received: November 3, 2014accepted for publishing: February 9, 2015
Dražen NovakovićJosip Juraj Stossmayer University of Osijek Faculty of Economics in OsijekGajev trg 7,31000 Osijek, [email protected]: +385912244134
Abstract
The aim of this paper is to evaluate the financial performance of pension funds in Croatia. Although there are other factors which are important in the pension funds overall performance, this paper focuses on investment accomplishments. The purpose of measuring portfolio performance is to determine whether portfolio managers add value compared to passive investment strategies. The traditional approach to pen-sion funds’ performance evaluation underlines standard measures of financial performance (e.g. ratios such as Sharpe’s, Sortino’s, Treynor’s, etc.) which quantify the ability of pension fund managers to deliver an ac-tive management risk premium, with respect to benchmarks.
In this paper, the previously mentioned traditional measures of risk-adjusted performance are applied to Croatian pension funds. Due to recent changes in pension systems in other Eastern European countries once again emphasis is put on this issue in Croatia. The analysis furthermore includes evaluation of pen-sion funds’ asset allocation. The period of analysis covers twelve years, from the establishment of pension funds in Croatia in 2002 until 2013. The main hypothesis of the paper states that Croatian pension funds underperform with respect to benchmark comparisons, set as return on the combined CROBEX/CROBIS portfolio. Results show that the main hypothesis does not hold.
The financial performance of pension funds directly influences their competitiveness, derived from the possibility of measuring their success in active portfolio management. In addition, pension funds are ex-pected to support the national economy. By investing their accumulating assets, they can protect jobs and enhance economic growth. However, they can achieve that only if they are competitive in means of financial performance.
Keywords: Pension funds, financial performance, competitiveness, Croatia
200 201God. XXVIII, BR. 1/2015. str. 199-212 God. XXVIII, BR. 1/2015. str. 199-212
UDK: 336.714(497.5) / Review article Dražen Novaković: Evaluation of the financial performance of pension funds in Croatia
the accumulated savings of the contributors, while Poland has shifted the long-term revenue from pen-sion contributions, by reducing contributions to the second pillar. These measures are still not recom-mended as a way of crisis management. A better alternative to this kind of nationalization of pension savings is a reduction of contributions to the sec-ond pillar. Rudolph et al. (2010) argued that these actions appear to be primarily motivated by short-term fiscal considerations. Stańko (2003) in his study of the Polish pension system concluded that an investment in pension funds is worthless, at least at the present stage due to unsatisfactory returns, cost ineffectiveness, wrong measurement practices and lack of infrastructure.
Researches of pension funds are quite numerous, both globally and in Croatia, but in the Croatian case they are rarely considering performance meas-urement. Eror-Matić and Latković (2002) analyzed the performance of the biggest Croatian invest-ment fund at that time, trying to understand in-vestment operations of future pension funds. Ac-cording to them, it is necessary to compare yields obtained with the risk level chosen, considering the given market portfolio or using various ratios like Sharpe’s or Treynor’s. Bakić (2002) analyzed the investment constraints of the pension funds, con-nected technical provisions and their appropriate-ness. Latković and Liker (2009) have calculated the fund’s expected annual real return of 3.22% by us-ing securities’ returns in developed markets in the period from 1900 to 2008. As Croatian pension funds generally invest in riskier domestic assets, they adjusted the obtained values and considered a moderately conservative portfolio, suitable for the Croatian investment structure. On the other hand, Škember (2002) concluded that the pension model proposed by the World Bank is defective from the standpoint of social policy, and that is far from the certainty of strengthening economic growth. He believed that there was a certain dose of neoliber-alism ideology in proclaiming these reforms which can neither protect the elderly, nor achieve faster economic growth. However, it does not dispute the serious difficulties that existing public pension sys-tems are facing. Bahovec et al. (2011) explored the tendency in the movement of the concentration of total pension fund assets in Croatia and noticed a slight increasing trend of concentration. Bejaković (2012) stated that the average annual return of pen-sion funds since their creation is 5.49%, which is
2.7% above inflation, but also more than the return set as the preferred when the pension reform began (2% above inflation). He also stated that Croatian pension funds returns are among the higher ones in the region and Europe. Thus, during 2010 the German pension funds achieved a return of 4-5%, the Austrian 6.6% and the Croatian 8.6%. However, the analysis is not complete without considering the investment structure. Thus, the Polish pension funds had a greater loss then the Croatian in 2008, although Poland was less affected by the crisis, due to significantly higher equity investment.
Ammann and Zingg (2008) investigated the per-formance of Swiss pension funds and investment foundations over the period of 1996 to 2006. Swiss pension funds follow a more active approach but it seems useless as the risk-adjusted performance is much better for the more passively managed invest-ment foundations. Clare et al. (2009) also argued in favor of passive investment vehicles after analyzing performance of the pooled pension funds in the UK. Similar results for larger funds were obtained by An-donov et al. (2012). They analyzed active manage-ment components (asset allocation, market timing and security selection) in the risk-adjusted net per-formance of U.S. pension funds. Blake et al. (2009) studied decentralization in UK pension funds’ in-vestment management from 1984 to 2004. Over this time period, most pension funds shifted from balanced to specialist managers and from a single to competing multiple managers within each asset class. Schwaiger et al. (2009) examined the perfor-mance of alternative decision models for pension funds and used the Sortino and the Solvency ratio to measure their performance over time. Walker and Iglesias (2010) used monthly data to calculate the Sharpe ratio for the pension funds on a sample of 11 countries. Performance is calculated against four proxies for the risk-free rate: a short-term local rate, a local long-term rate, a short-term U.S. Treas-ury bills rate, and the annual return on long-term U.S. Treasury bonds. Rudolph et al. (2010) conclud-ed that long-term profitability of equity investments is not derived from the instruments themselves, but from a well-diversified portfolio at the international level. Therefore, significant investing in domestic equity markets is risky for pension funds due to country risk.
1. Introduction
The pension system is a very important part of every economy. In addition to the social role, it also has an important role in the functioning of the market economy. Given that the pension funds are large investors in the domestic economy, by invest-ing their accumulating assets in different securi-ties, they can protect jobs and enhance economic growth. However, they can achieve that only if they are competitive and successful in means of financial performance. Therefore, it is very interesting to ana-lyze their financial performance.
The contribution of this research lies in the pres-entation of the financial performance of Croatian mandatory pension funds from the perspective of risk-adjusted measures, in an attempt to determine whether pension funds in Croatia could contribute to raising the competitiveness of the whole econo-my. This paper also has the intention of encourag-ing further exploration of the various measures of the pension funds’ performance in Croatia, as well as studying the impact of various legal provisions regulating Croatian pension system on its perfor-mance. The author is the first, to the best of his knowledge, to analyze the risk-adjusted financial performance of Croatian mandatory pension funds.
Based on the data provided by HANFA (the Croa-tian Financial Services Supervisory Agency) and mandatory pension funds, an analysis of the risk-adjusted financial performance of Croatian pension funds has been done. Risk-adjusted measures in-cluding the Sharpe ratio, the Treynor ratio, the Sor-tino ratio and the information ratio were used. The analysis furthermore includes evaluation of pension funds’ asset allocation. The period of analysis cov-ers twelve years, from the establishment of pension funds in Croatia in 2002, until 2013. The main hy-pothesis of the paper states that Croatian pension funds underperform with respect to benchmark comparisons. Return on the combined CROBEX/CROBIS portfolio is set as a benchmark, as it re-flects a large proportion of the current investment structure of Croatian mandatory pension funds. Re-sults show that the main hypothesis does not hold.
The paper consists of seven chapters. After the introduction, there is a chapter on previous re-searches with an overview of the previous papers in Croatia and worldwide that are to some extent connected with this paper’s topic. In the chapter
“discussion on appropriate benchmark”, numerous examples of benchmarks are presented in order to understand their strengths and weaknesses and to understand the selection of the benchmark in this paper. The chapter “discussion on competitiveness” theoretically discusses the influence of the pension funds’ success on the competitiveness of the econo-my, which is one of the reasons for the analysis. The chapter “methodology and data” which includes an overview of the methods and data used, is followed by a chapter that deals with the empirical analysis itself and research findings. Finally, there is the con-clusion in which the hypothesis is rejected by the results of the analysis and the causes of such results are tried to be explained.
2. Previous researches
Pension systems today have numerous challenges. According to Puljiz (2011), demographic changes, pressures for competitiveness on the globalized market, labor market transformation and citizen re-sistance to pension reforms are just some of them. Pension systems in post-socialist countries have ex-perienced radical changes in the last two decades, largely driven by “neo-liberal orthodoxy” promoted by the World Bank. The pension contributors were offered to invest a portion of their contributions into private funded pension funds. Hungary and Poland reformed the mandatory pension insurance. Bejaković (2012) pointed out that this model greatly influenced Croatia and other countries in the im-plementation of their pension reforms. On the other hand, Czech and Slovenian pension systems have not undergone fundamental changes since the number of pensioners and the unemployed was growing relatively slowly, so only a voluntary pen-sion scheme was introduced (Puljiz, 2011). Since 1998, Croatia has established a tripartite pension system that has been in effect since 2002. The sys-tem now consists of the mandatory pay-as-you-go subsystem (defined benefit scheme, first pillar) and the compulsory and voluntary market capitaliza-tion subsystems (defined contribution schemes, the second and third pillars) (Potočnjak, Vukorepa, 2012). However, Puljiz (2011) noted several exam-ples of pension systems returning to the pre-reform situation. Slovakia has enabled the return of retirees from the second, market capitalized into the first public pillar. By legislative change, Hungary seized
202 203
reference rate for pension funds in Croatia was not yet defined, Bakić (2002) warned that if a weighted average yield of pension funds were to be chosen, with weights proportionate to the size of the funds, it would lead to the herd effect, which causes inef-ficient allocation of resources for all funds. Twelve years after this note, the Croatian pension funds’ performance shows the herd effect as reference rate has been wrongly defined. Blake and Timmermann (2002) conclude that “performance benchmarks are important for three key reasons: they help to meas-ure the investment performance of institutional fund managers, they provide clients with a refer-ence point for monitoring that performance, and they can also have the effect of modifying the be-havior of fund managers. A good benchmark would be one that did not have built-in biases either in favor of or against particular asset classes. A good benchmark might therefore be based on a multiple of indices that covers all the key asset categories.”
4. Discussion on competitiveness
Some governments argue that competition among pension funds helps to optimize individual retire-ment plans. Fund managers would compete for available funds and contributors would choose a pension fund whose investments match their risk aversion. This competition disadvantages pension funds that cannot show good short-term returns in comparison to those competitors that can, simply by investing in short-term deposits. Such a situation creates a bias against investing in long-term instru-ments that cannot provide an immediate return, which is a significant problem as pension funds should be long-term oriented. In addition, in order for the system to function in practice, the contribu-tors should be able to assess the funds’ performance which is not common. The information is often in-accessible and incomprehensible for the majority of contributors (Rudolph et al., 2010). Investment restrictions, the prudent person rule and the differ-ent forms of asset protection in mandatory capital-funded pension schemes from the negative or insuf-ficient return (like relative return guarantee) aim at increasing pension contributions’ security due to the return risk. As responsibility is shifted to the in-dividual, his awareness of the benefits and risks of the capital-funded pension system is extremely im-portant and, according to Potočnjak and Vukorepa
(2008), it is the state’s responsibility to provide him with such information. Furthermore, although vari-ous investment restrictions do not encourage com-petition, they are of high importance. The question of the prohibition for Croatian pension funds to in-vest in real estate was very interesting considering the tourism development of the country. However, after a sharp drop in real estate prices due to the 2008 crisis, it was obviously an extremely wise idea. Potočnjak and Vukorepa (2008) conclude that con-sidering the second pillar of the pension system only from the standpoint of its contribution to the devel-opment of financial markets and economic growth is unacceptable. The approach that emphasizes the importance of this system for social security in old age is at least of the same importance.
When it comes to future investments of pension funds, pension companies want to invest in profit-able and secure new development projects in Croa-tia. Creative ideas are the most important while possible technical adjustment of legislation should not be a problem. Pension companies are aware of the need for redefinition of pension fund invest-ments in the Croatian economy as it is a very im-portant issue for the further development of the pension system. Pension companies are willing to participate in future large infrastructure projects if the risk-return ratio is acceptable. Pension compa-nies are interested in the future privatizations and other ownership transformation forms (especially the recapitalization) and wish to continue engaging in corporate governance (UMFO, 2011). Consider-ing the large funds available for their further invest-ments, mandatory pension funds are definitely a natural partner for Croatian companies as a signifi-cant source of new equity.
5. Methodology and data
The performance of any fund can be measured us-ing different measures. Among the most used ones are the Sharpe ratio, the Sortino ratio, the informa-tion ratio and the Treynor ratio. These risk-adjusted performance measures are used by fund managers to rank and compare their portfolio performance with other managers (Schwaiger et al., 2009). All methods used in this paper are based on the papers by Schwaiger et al. (2009) and Tonks (2006), with some adjustments for the purposes of this paper.
3. Discussion on appropriate benchmark
After strong turbulences hit the global capital mar-kets and the Zagreb Stock Exchange in 2008, the is-sue of pension contributors protection against the risks associated with pension funds’ investments has become even more important (Potočnjak, Vu-korepa, 2008). Investment rules are designed to limit the risk of a portfolio, but they do not guaran-tee achieving positive returns. This is why lifecycle portfolio modeling methods have been globally de-veloping, based on the age of retirement. An indi-vidual’s ability to withstand investment risks varies indeed with his age (Potočnjak, Vukorepa, 2012). This system was introduced in Croatia at the time of writing this paper.
Pension funds comparison and setting benchmarks for measuring success are problematic issues. Potočnjak and Vukorepa (2012) stated that due to major practical differences in investment strategy and the long-term character of investments, clas-sic comparison of performance among the funds on an annual basis is not appropriate. Walker and Iglesias (2010) also counseled against international comparisons of traditional performance measures. Potočnjak and Vukorepa (2012) proposed the in-troduction of complex criteria for assessing the performance of each fund. The alternative is in-troducing investment performance measurement with respect to the risk degree. The main objective of pension funds’ performance measurement is to ascertain whether fund managers added value com-pared to the passive strategy presented by a specific benchmark. If the Efficient Markets Hypothesis is taken into account, it can be assumed that the ac-tive fund management gives results very similar to the benchmark because it is not easy to beat the market (Walker, Iglesias, 2010). On the other hand, Latković and Liker (2009) argued that if the fund does not yield higher returns than those achieved by the passive portfolio (benchmark), for the amount of management fees, then the collective investment scheme is worthless for contributors.
Benchmarks used for evaluation of the risk-adjust-ed performance are various. The two main types of benchmarks used in the UK are external asset-class benchmarks and peer-group benchmarks (median return). When it was widely recognized that the objectives of different pension funds differ widely, customized benchmarks of external type became more common. The US has similar benchmarks as
the UK. Benchmarking is usually done on an asset class basis against well-known total return indexes. Thus the performance is assessed relative to the S&P 500 total return index, the Lehman Aggregate Index (now the Barclays Capital Aggregate Bond Index), etc. (Blake, Timmermann, 2002). However, the popularity of S&P 500 as a large cap bench-mark has significantly declined from 50% of large cap funds in 1996 to only 26% in 2006. Instead, funds are increasingly using the Russell 1000, Rus-sell 3000 and Wilshire 5000. The Russell 2000 is the dominant small cap benchmark (Bauer et al., 2010). The other kind of benchmarking is relative to the average within a peer group. Other countries tend to use fixed or bond-based benchmarks. In Japan, the annual rate of return from the Treasury bond, with maturity in excess of 10 years, plus 0.1% is used. In Italy, a combination of well-known indices like JPM bond and MSCI stocks is used in varying proportions. The benchmark in Chile is the aver-age of the return of the other pension funds (AFPs). The use of market indices has been rejected because the local market benchmarks are of questionable applicability (Blake, Timmermann, 2002). Stańko (2003) notes that the Polish system of performance measurement is similar to the Latin American. The results of pension managers are compared to the in-dustry’s average return (AR) calculated every three months as an arithmetic average of individual funds weighted by their market shares during the period (a peer-group index).
When it comes to the limitations on investment, es-pecially outside the domestic market, with a hedg-ing purpose, Potočnjak and Vukorepa (2008) point out that limitations encourage similar behavior of pension funds in terms of investment (investment herding), which consequently leads to similarities in the return level and possible losses. Blake and Tim-mermann (2002) agree by stating that “in effect, a target that uses a group’s median will create an out-come very close to this median.” Not knowing what the median fund manager result will be at the end of the period makes managers stick to one another so as not to deviate from the final result. That is why the results are not much higher than those obtained from passive investment strategies. This is also a reason why an external benchmark should be used. Finally, Stańko (2003) notes that “the guarantees of the minimal rate facility are illusionary as it is the client, after all, onto whom the cost will be passed in the long run.” It is interesting that in 2002, when the
God. XXVIII, BR. 1/2015. str. 199-212 God. XXVIII, BR. 1/2015. str. 199-212
UDK: 336.714(497.5) / Review article Dražen Novaković: Evaluation of the financial performance of pension funds in Croatia
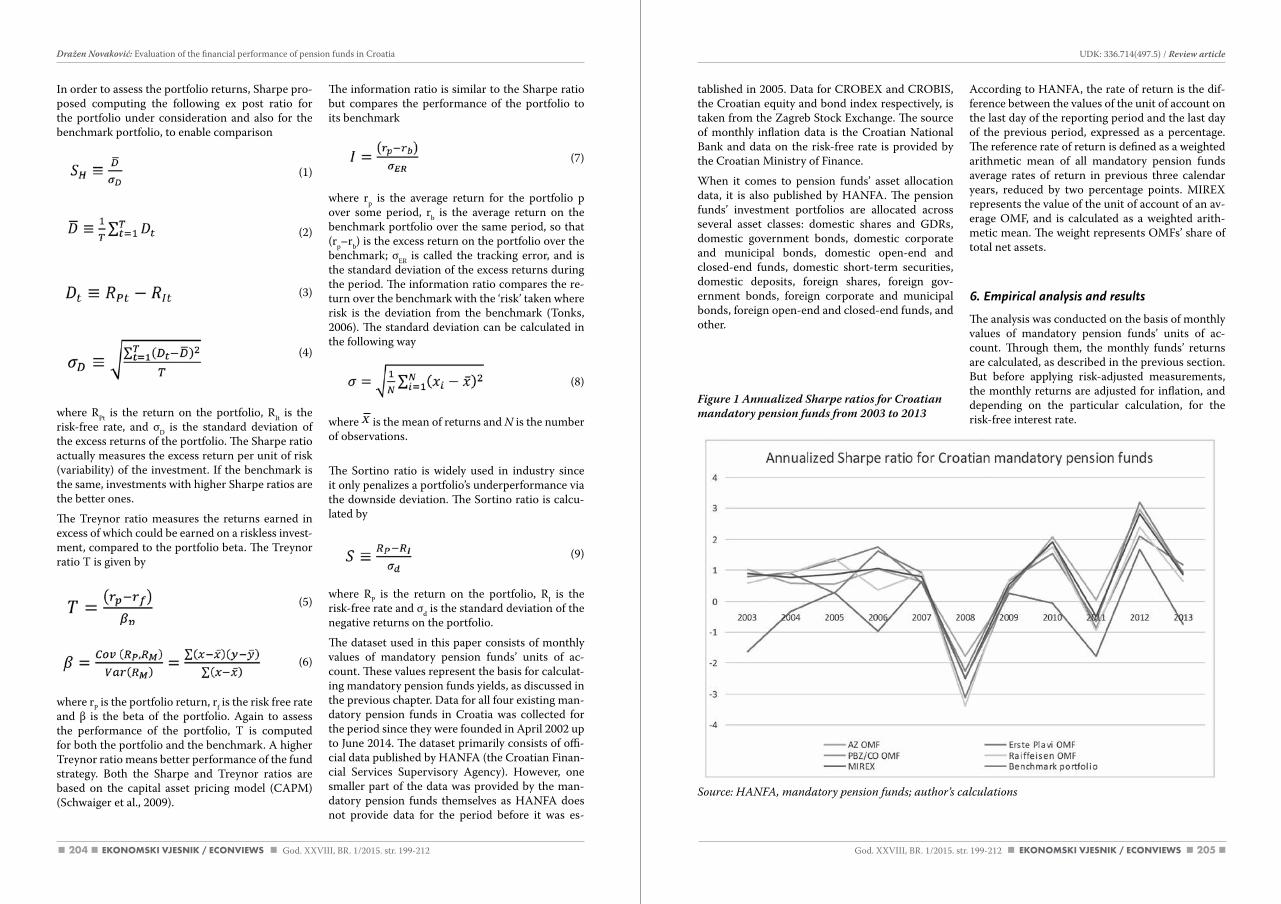
204 205
tablished in 2005. Data for CROBEX and CROBIS, the Croatian equity and bond index respectively, is taken from the Zagreb Stock Exchange. The source of monthly inflation data is the Croatian National Bank and data on the risk-free rate is provided by the Croatian Ministry of Finance.
When it comes to pension funds’ asset allocation data, it is also published by HANFA. The pension funds’ investment portfolios are allocated across several asset classes: domestic shares and GDRs, domestic government bonds, domestic corporate and municipal bonds, domestic open-end and closed-end funds, domestic short-term securities, domestic deposits, foreign shares, foreign gov-ernment bonds, foreign corporate and municipal bonds, foreign open-end and closed-end funds, and other.
Figure 1 Annualized Sharpe ratios for Croatian mandatory pension funds from 2003 to 2013
According to HANFA, the rate of return is the dif-ference between the values of the unit of account on the last day of the reporting period and the last day of the previous period, expressed as a percentage. The reference rate of return is defined as a weighted arithmetic mean of all mandatory pension funds average rates of return in previous three calendar years, reduced by two percentage points. MIREX represents the value of the unit of account of an av-erage OMF, and is calculated as a weighted arith-metic mean. The weight represents OMFs’ share of total net assets.
6. Empirical analysis and results
The analysis was conducted on the basis of monthly values of mandatory pension funds’ units of ac-count. Through them, the monthly funds’ returns are calculated, as described in the previous section. But before applying risk-adjusted measurements, the monthly returns are adjusted for inflation, and depending on the particular calculation, for the risk-free interest rate.
In order to assess the portfolio returns, Sharpe pro-posed computing the following ex post ratio for the portfolio under consideration and also for the benchmark portfolio, to enable comparison
(1)
(2)
(3)
(4)
where RPt is the return on the portfolio, RIt is the risk-free rate, and σD is the standard deviation of the excess returns of the portfolio. The Sharpe ratio actually measures the excess return per unit of risk (variability) of the investment. If the benchmark is the same, investments with higher Sharpe ratios are the better ones.
The Treynor ratio measures the returns earned in excess of which could be earned on a riskless invest-ment, compared to the portfolio beta. The Treynor ratio T is given by
(5)
(6)
where rP is the portfolio return, rf is the risk free rate and β is the beta of the portfolio. Again to assess the performance of the portfolio, T is computed for both the portfolio and the benchmark. A higher Treynor ratio means better performance of the fund strategy. Both the Sharpe and Treynor ratios are based on the capital asset pricing model (CAPM) (Schwaiger et al., 2009).
The information ratio is similar to the Sharpe ratio but compares the performance of the portfolio to its benchmark
(7)
where rp is the average return for the portfolio p over some period, rb is the average return on the benchmark portfolio over the same period, so that (rp–rb) is the excess return on the portfolio over the benchmark; σER is called the tracking error, and is the standard deviation of the excess returns during the period. The information ratio compares the re-turn over the benchmark with the ‘risk’ taken where risk is the deviation from the benchmark (Tonks, 2006). The standard deviation can be calculated in the following way
(8)
where is the mean of returns and N is the number of observations.
The Sortino ratio is widely used in industry since it only penalizes a portfolio’s underperformance via the downside deviation. The Sortino ratio is calcu-lated by
(9)
where RP is the return on the portfolio, RI is the risk-free rate and σd is the standard deviation of the negative returns on the portfolio.
The dataset used in this paper consists of monthly values of mandatory pension funds’ units of ac-count. These values represent the basis for calculat-ing mandatory pension funds yields, as discussed in the previous chapter. Data for all four existing man-datory pension funds in Croatia was collected for the period since they were founded in April 2002 up to June 2014. The dataset primarily consists of offi-cial data published by HANFA (the Croatian Finan-cial Services Supervisory Agency). However, one smaller part of the data was provided by the man-datory pension funds themselves as HANFA does not provide data for the period before it was es-
God. XXVIII, BR. 1/2015. str. 199-212 God. XXVIII, BR. 1/2015. str. 199-212
UDK: 336.714(497.5) / Review article Dražen Novaković: Evaluation of the financial performance of pension funds in Croatia
Source: HaNFa, mandatory pension funds; author’s calculations
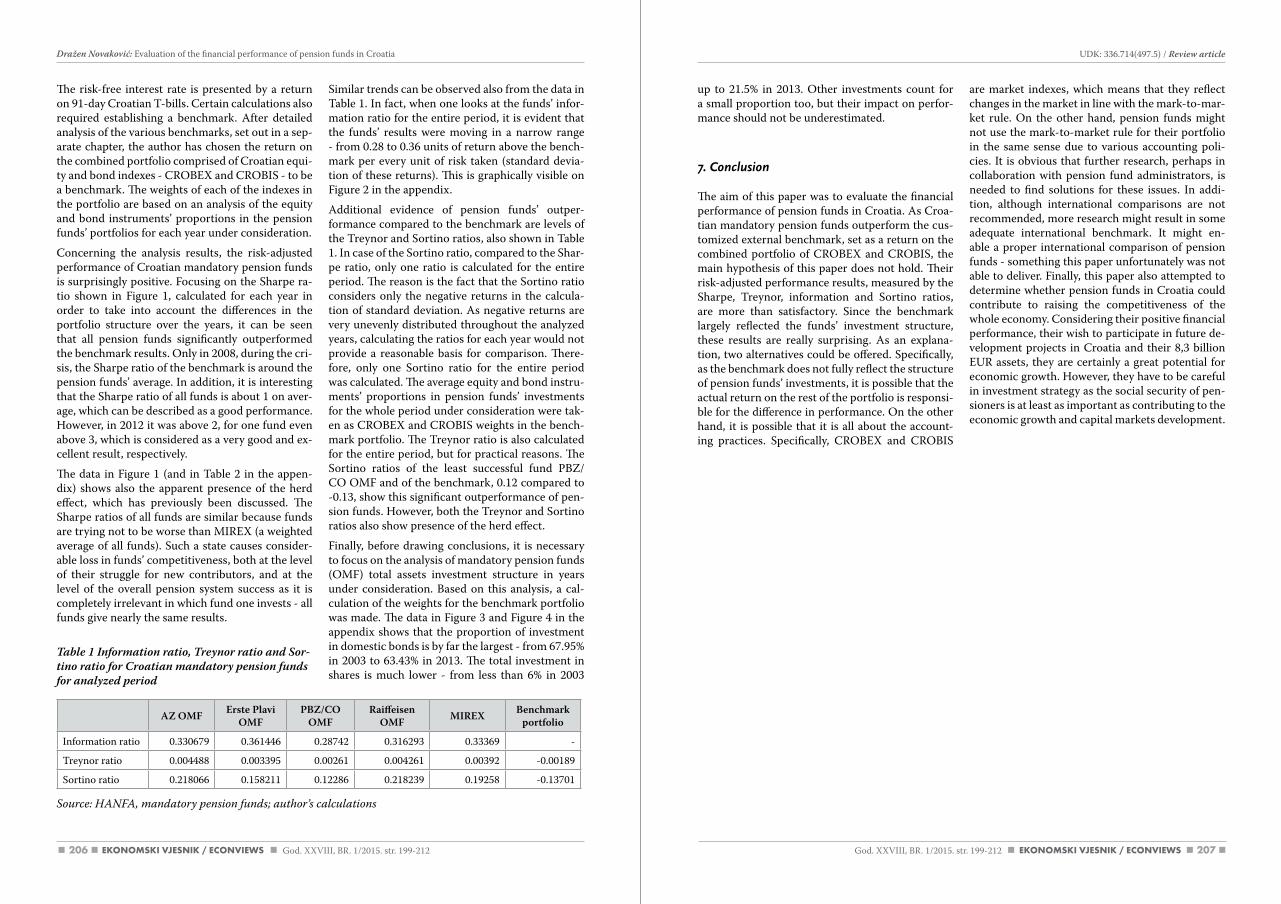
206 207
up to 21.5% in 2013. Other investments count for a small proportion too, but their impact on perfor-mance should not be underestimated.
7. Conclusion
The aim of this paper was to evaluate the financial performance of pension funds in Croatia. As Croa-tian mandatory pension funds outperform the cus-tomized external benchmark, set as a return on the combined portfolio of CROBEX and CROBIS, the main hypothesis of this paper does not hold. Their risk-adjusted performance results, measured by the Sharpe, Treynor, information and Sortino ratios, are more than satisfactory. Since the benchmark largely reflected the funds’ investment structure, these results are really surprising. As an explana-tion, two alternatives could be offered. Specifically, as the benchmark does not fully reflect the structure of pension funds’ investments, it is possible that the actual return on the rest of the portfolio is responsi-ble for the difference in performance. On the other hand, it is possible that it is all about the account-ing practices. Specifically, CROBEX and CROBIS
are market indexes, which means that they reflect changes in the market in line with the mark-to-mar-ket rule. On the other hand, pension funds might not use the mark-to-market rule for their portfolio in the same sense due to various accounting poli-cies. It is obvious that further research, perhaps in collaboration with pension fund administrators, is needed to find solutions for these issues. In addi-tion, although international comparisons are not recommended, more research might result in some adequate international benchmark. It might en-able a proper international comparison of pension funds - something this paper unfortunately was not able to deliver. Finally, this paper also attempted to determine whether pension funds in Croatia could contribute to raising the competitiveness of the whole economy. Considering their positive financial performance, their wish to participate in future de-velopment projects in Croatia and their 8,3 billion EUR assets, they are certainly a great potential for economic growth. However, they have to be careful in investment strategy as the social security of pen-sioners is at least as important as contributing to the economic growth and capital markets development.
The risk-free interest rate is presented by a return on 91-day Croatian T-bills. Certain calculations also required establishing a benchmark. After detailed analysis of the various benchmarks, set out in a sep-arate chapter, the author has chosen the return on the combined portfolio comprised of Croatian equi-ty and bond indexes - CROBEX and CROBIS - to be a benchmark. The weights of each of the indexes in the portfolio are based on an analysis of the equity and bond instruments’ proportions in the pension funds’ portfolios for each year under consideration.
Concerning the analysis results, the risk-adjusted performance of Croatian mandatory pension funds is surprisingly positive. Focusing on the Sharpe ra-tio shown in Figure 1, calculated for each year in order to take into account the differences in the portfolio structure over the years, it can be seen that all pension funds significantly outperformed the benchmark results. Only in 2008, during the cri-sis, the Sharpe ratio of the benchmark is around the pension funds’ average. In addition, it is interesting that the Sharpe ratio of all funds is about 1 on aver-age, which can be described as a good performance. However, in 2012 it was above 2, for one fund even above 3, which is considered as a very good and ex-cellent result, respectively.
The data in Figure 1 (and in Table 2 in the appen-dix) shows also the apparent presence of the herd effect, which has previously been discussed. The Sharpe ratios of all funds are similar because funds are trying not to be worse than MIREX (a weighted average of all funds). Such a state causes consider-able loss in funds’ competitiveness, both at the level of their struggle for new contributors, and at the level of the overall pension system success as it is completely irrelevant in which fund one invests - all funds give nearly the same results.
Table 1 Information ratio, Treynor ratio and Sor-tino ratio for Croatian mandatory pension funds for analyzed period
Similar trends can be observed also from the data in Table 1. In fact, when one looks at the funds’ infor-mation ratio for the entire period, it is evident that the funds’ results were moving in a narrow range - from 0.28 to 0.36 units of return above the bench-mark per every unit of risk taken (standard devia-tion of these returns). This is graphically visible on Figure 2 in the appendix.
Additional evidence of pension funds’ outper-formance compared to the benchmark are levels of the Treynor and Sortino ratios, also shown in Table 1. In case of the Sortino ratio, compared to the Shar-pe ratio, only one ratio is calculated for the entire period. The reason is the fact that the Sortino ratio considers only the negative returns in the calcula-tion of standard deviation. As negative returns are very unevenly distributed throughout the analyzed years, calculating the ratios for each year would not provide a reasonable basis for comparison. There-fore, only one Sortino ratio for the entire period was calculated. The average equity and bond instru-ments’ proportions in pension funds’ investments for the whole period under consideration were tak-en as CROBEX and CROBIS weights in the bench-mark portfolio. The Treynor ratio is also calculated for the entire period, but for practical reasons. The Sortino ratios of the least successful fund PBZ/CO OMF and of the benchmark, 0.12 compared to -0.13, show this significant outperformance of pen-sion funds. However, both the Treynor and Sortino ratios also show presence of the herd effect.
Finally, before drawing conclusions, it is necessary to focus on the analysis of mandatory pension funds (OMF) total assets investment structure in years under consideration. Based on this analysis, a cal-culation of the weights for the benchmark portfolio was made. The data in Figure 3 and Figure 4 in the appendix shows that the proportion of investment in domestic bonds is by far the largest - from 67.95% in 2003 to 63.43% in 2013. The total investment in shares is much lower - from less than 6% in 2003
AZ OMF Erste Plavi OMF
PBZ/CO OMF
Raiffeisen OMF MIREX Benchmark
portfolio
Information ratio 0.330679 0.361446 0.28742 0.316293 0.33369 -
Treynor ratio 0.004488 0.003395 0.00261 0.004261 0.00392 -0.00189
Sortino ratio 0.218066 0.158211 0.12286 0.218239 0.19258 -0.13701
God. XXVIII, BR. 1/2015. str. 199-212 God. XXVIII, BR. 1/2015. str. 199-212
UDK: 336.714(497.5) / Review article Dražen Novaković: Evaluation of the financial performance of pension funds in Croatia
Source: HaNFa, mandatory pension funds; author’s calculations
208 209
17. Stańko, D. (2003), “Polish Pension Funds, Does the System Work? Cost, Efficiency and Performance Measurement Issues”, Discussion Paper PI-0302, The Pensions Institute, London, January 2003, Avail-able at: http://www.pensions-institute.org/workingpapers/wp0302.pdf (Accessed on: July 10, 2014)
18. Škember, A. (2002), “Mirovinska reforma po modelu Svjetske banke - čarobna formula za prevladavan-je krize mirovinskog sustava i promicanje gospodarskog rasta ili strategija visokog rizika”, Ekonomski pregled, Vol. 53, No. 7-8, pp. 720-737.
19. Tonks, I. (2006), “Pension Fund Management and Investment Performance”, in Clark, G. L., Munnell, A. H., Orszag, J. M. (Eds.), The Oxford Handbook of Pensions and Retirement Income, Oxford: Uni-versity Press, pp. 456-480.
20. Udruženje društava za upravljanje mirovinskim fondovima i mirovinskih osiguravajućih društava (UMFO) (2011), “Mirovinska reforma u Republici Hrvatskoj – Dosadašnji učinci, aktualno stanje i pri-jedlozi za budućnost”, Available at: http://www.azfond.hr/doc/Mirovinska%20reforma.pdf (Accessed on: July 10, 2014)
21. Walker, E., Iglesias, A. (2010), “Financial Performance of Pension Funds: An Exploratory Study”, in Hinz, R., Rudolph, H. P., Antolín, P., Yermo, J. (Eds.), Evaluating the Financial Performance of Pension Funds, The World Bank, Washington DC, pp. 39-95.
References
1. Ammann, M., Zingg, A. (2008), “Investment Performance of Swiss Pension Funds and Investment Foundations”, Available at: http://ssrn.com/abstract=1091165 (Accessed on: July 10, 2014)
2. Andonov, A., Bauer, R., Cremers, M. (2012), “Can Large Pension Funds Beat the Market? Asset Allo-cation, Market Timing, Security Selection, and the Limits of Liquidity”, Available at: http://ssrn.com/abstract=1885536 (Accessed on: July 10, 2014)
3. Bahovec, V., Dumičić, K., Žalac, A. (2011), “Trendovi u koncentraciji imovine mirovinskih fondova u Republici Hrvatskoj”, Zbornik Ekonomskog fakulteta u Zagrebu, Vol. 9, No. 2, pp. 53-75.
4. Bakić, N. (2002), “Ulaganja mirovinskih fondova u Republici Hrvatskoj”, Financijska teorija i praksa, Vol. 26, No. 2, pp. 435-445.
5. Bauer, R., Cremers, M., Frehen, R. (2010), “Pension Fund Performance and Costs: Small is Beautiful”, Available at: http://papers.ssrn.com/sol3/papers.cfm?abstract_id=965388 (Accessed on: July 10, 2014)
6. Bejaković, P. (2012), “Obilježja i učinci kapitalizirane obvezne i dobrovoljne mirovinske štednje u Hr-vatskoj”, Revija za socijalnu politiku, Vol. 19, No. 2, pp. 219-230.
7. Blake, D., Timmermann, A. (2002), “Performance Benchmarks for Institutional Investors: Measuring, Monitoring and Modifying Investment Behaviour”, Discussion Paper PI-0106, The Pensions Institute, London, June 2002, Available at: http://www.pensions-institute.org/workingpapers/wp0106.pdf (Ac-cessed on: July 10, 2014)
8. Blake, D., Timmermann, A., Tonks, I., Wermers, R. (2009), “Pension Fund Performance and Risk-Tak-ing Under Decentralized Investment Management”, Available at: http://papers.ssrn.com/sol3/papers.cfm?abstract_id=1365036 (Accessed on: July 10, 2014)
9. Clare, A., Cuthbertson, K., Nitzsche, D. (2009), “An empirical investigation into the performance of UK pension fund managers”, Available at: http://ssrn.com/abstract=1325410 (Accessed on: July 10, 2014)
10. Eror-Matić, B., Latković, M. (2002), “Uspješnost poslovanja investicijskog fonda: mirovinska reforma i problem odabira fonda”, Financijska teorija i praksa, Vol. 26, No. 2, pp. 447-461.
11. Latković, M., Liker, I. (2009), “Analiza utjecaja parametara u kapitaliziranom sustavu mirovinskog osi-guranja”, Financijska teorija i praksa, Vol. 33, No. 4, pp. 445-461.
12. Potočnjak, Ž., Vukorepa, I. (2008), “Upravljanje rizikom prinosa u obveznim kapitalno financiranim mirovinskim sustavima”, Revija za socijalnu politiku, Vol. 15, No. 3, pp. 323-342.
13. Potočnjak, Ž., Vukorepa, I. (2012), “Cjeloživotno modeliranje portfelja u kapitalno financiranim mi-rovinskim sustavima određenih doprinosa”, Privredna kretanja i ekonomska politika, Vol. 22, No. 130, pp. 29-60.
14. Puljiz, V. (2011), “Kriza, reforme i perspektive mirovinskih sustava u europskim zemljama i u Hrvat-skoj”, Privredna kretanja i ekonomska politika, Vol. 21, No. 129, pp. 27-63.
15. Rudolph, H. P., Hinz, R., Antolín, P., Yermo, J. (2010), “Evaluating the Financial Performance of Pension Funds”, In Hinz, R., Rudolph, H. P., Antolín, P., Yermo, J. (Eds.), Evaluating the Financial Performance of Pension Funds, The World Bank, Washington DC, pp. 1-23.
16. Schwaiger, K., Lucas, C., Mitra, G. (2009), “Measuring Pension Fund Performance using Risk-Adjusted Measurements”, Available at: http://optirisk-systems.com/papers/opt008.pdf (Accessed on: July 10, 2014)
God. XXVIII, BR. 1/2015. str. 199-212 God. XXVIII, BR. 1/2015. str. 199-212
UDK: 336.714(497.5) / Review article Dražen Novaković: Evaluation of the financial performance of pension funds in Croatia
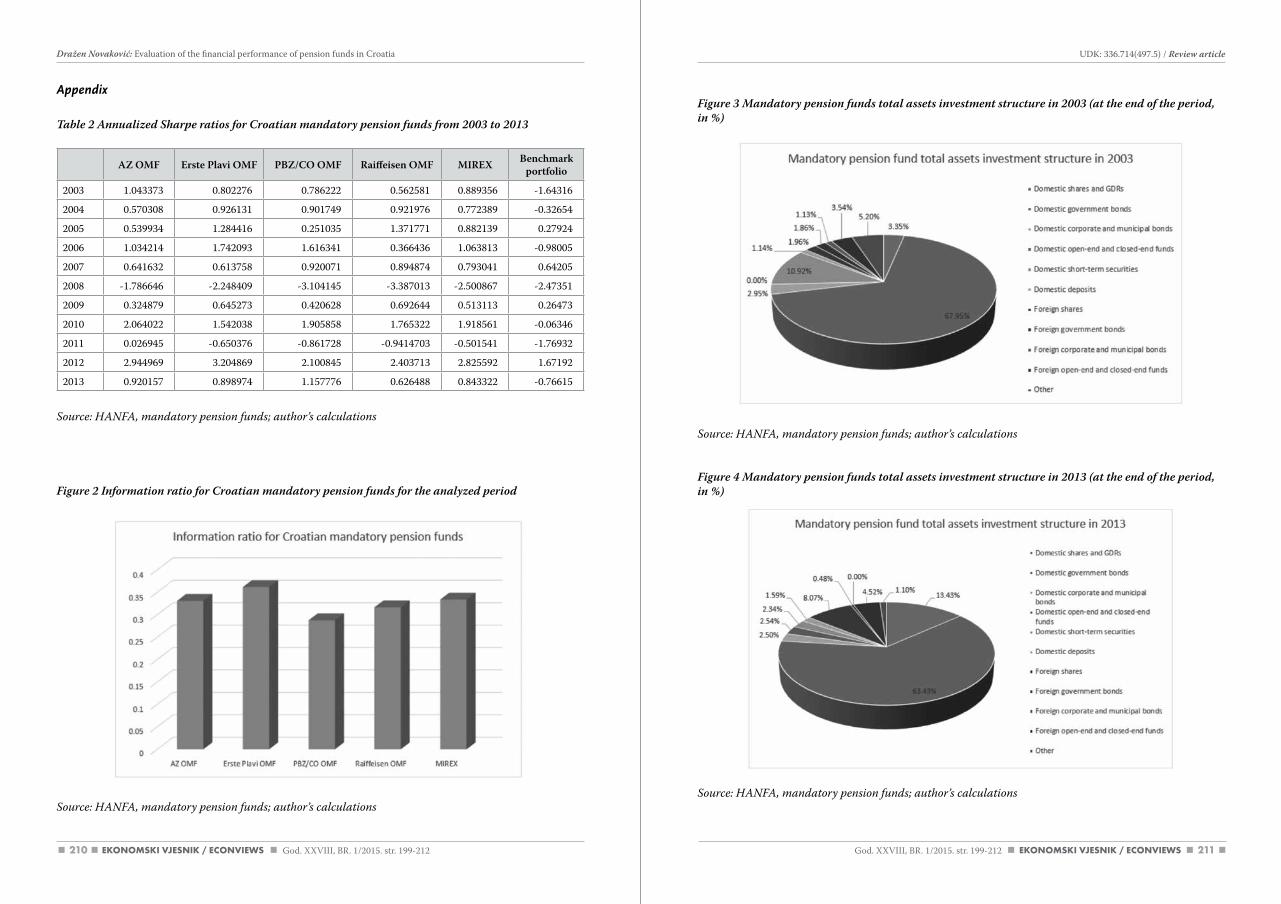
210 211
Figure 3 Mandatory pension funds total assets investment structure in 2003 (at the end of the period, in %)
Source: HaNFa, mandatory pension funds; author’s calculations
Figure 4 Mandatory pension funds total assets investment structure in 2013 (at the end of the period, in %)
Source: HaNFa, mandatory pension funds; author’s calculations
Appendix
Table 2 Annualized Sharpe ratios for Croatian mandatory pension funds from 2003 to 2013
AZ OMF Erste Plavi OMF PBZ/CO OMF Raiffeisen OMF MIREX Benchmark portfolio
2003 1.043373 0.802276 0.786222 0.562581 0.889356 -1.64316
2004 0.570308 0.926131 0.901749 0.921976 0.772389 -0.32654
2005 0.539934 1.284416 0.251035 1.371771 0.882139 0.27924
2006 1.034214 1.742093 1.616341 0.366436 1.063813 -0.98005
2007 0.641632 0.613758 0.920071 0.894874 0.793041 0.64205
2008 -1.786646 -2.248409 -3.104145 -3.387013 -2.500867 -2.47351
2009 0.324879 0.645273 0.420628 0.692644 0.513113 0.26473
2010 2.064022 1.542038 1.905858 1.765322 1.918561 -0.06346
2011 0.026945 -0.650376 -0.861728 -0.9414703 -0.501541 -1.76932
2012 2.944969 3.204869 2.100845 2.403713 2.825592 1.67192
2013 0.920157 0.898974 1.157776 0.626488 0.843322 -0.76615
Source: HaNFa, mandatory pension funds; author’s calculations
Figure 2 Information ratio for Croatian mandatory pension funds for the analyzed period
Source: HaNFa, mandatory pension funds; author’s calculations
God. XXVIII, BR. 1/2015. str. 199-212 God. XXVIII, BR. 1/2015. str. 199-212
UDK: 336.714(497.5) / Review article Dražen Novaković: Evaluation of the financial performance of pension funds in Croatia
213212 God. XXVIII, BR. 1/2015. str. 213-224
Martina Harc: The relationship between tangible assets and capital structure of small and medium-sized companies in Croatia
THE RELATIONSHIP BETWEEN TANGIBLE ASSETS AND CAPITAL STRUCTURE OF SMALL AND MEDIUM-SIZED COMPANIES IN CROATIA
UDK: 658.14(497.5)Review article
Received: November 5, 2014accepted for publishing: March 16, 2015
Martina Harccroatian academy of Sciences and artsInstitute for Scientific Research andartistic Work in OsijekFranje Kuhača 29,31000 Osijek, [email protected]: +38531214928
Abstract
The asset structure of companies should matter for financing decisions. Small and medium-sized com-panies in Croatia may use tangible assets as collateral, either providing more access to creditors or as a guarantee in case of bankruptcy. The aim of this paper is to investigate the relationship between tangible assets and the capital structure of Croatian small and medium-sized enterprises. Most previous studies have shown various relationships between tangible assets and leverage. This study has been conducted on a sample of 500 Croatian SMEs for the period between 2005 and 2010. The data used for the empirical analysis were taken from companies’ annual reports. The Pearson Correlation Coefficient is applied in or-der to examine the relationship between tangible assets and leverage measures. The results of this research indicate that tangible assets are differently correlated with short-term and long-term leverage. The relation-ship between tangible assets and short-term leverage is negative and statistically significant in all observed years. The relationship between tangible assets and long-term leverage is positive in all observed years and statistically significant. The results show that small and medium-sized companies use their collateral to attract long-term debt, which means that small and medium-sized companies use lower costs and the interest rate of long-term debt in relation to short-term debt. These findings correspond with the maturity matching principle, according to which long-term assets are financed with long-term financing and short-term assets are financed with short-term funds. These results suggest that tangible assets have a positive impact on the long-term debt of Croatian SMEs because tangible assets constitute a positive signal to the financial institutions, which can request the selling of these assets in case of bankruptcy. These findings are consistent with the trade-off theory which predicts a positive relation between leverage and tangibility, but also with the pecking order theory, which is generally interpreted as predicting a negative relation between leverage and tangibility.
Keywords: Tangible assets, capital structure, leverage, small and medium-sized enterprises
Dražen Novaković
Evaluacija financijske uspješnosti mirovinskihfondova u Hrvatskoj
Sažetak
Cilj je ovog rada ocijeniti financijsku uspješnost mirovinskih fondova u Hrvatskoj. Iako postoje i drugi čimbenici koji su važni za ukupnu uspješnost mirovinskih fondova, ovaj je rad okrenut investicijskoj uspješnosti. Općenito govoreći, svrha mjerenja uspješnosti portfelja jest utvrditi dodaju li menadžeri port-felja vrijednost u odnosu na pasivne investicijske strategije. Tradicionalni pristup ocjenjivanju uspješnosti mirovinskih fondova naglašava standardne mjere financijske uspješnosti (npr. omjere poput Sharpe-a, Sor-tino-a, Treynor-a itd.). Ova mjerila kvantificiraju sposobnost menadžera mirovinskih fondova da ostvare premije rizika za aktivni menadžment, s obzirom na određenu referentnu vrijednost.
U ovome radu, prethodno spomenute tradicionalne mjere uspješnosti prilagođene za rizik primjenjuju se na hrvatskim mirovinskim fondovima. Nedavne promjene u mirovinskim sustavima drugih istočnoeuropskih zemalja i zemalja u razvoju stavljaju naglasak još jednom na ovo pitanje i u Hrvatskoj. Analiza nadalje uključuje evaluaciju ulagačke strukture mirovinskih fondova. Promatrano razdoblje obuhvaća dvanaest godina, od osnivanja mirovinskih fondova u Republici Hrvatskoj 2002. godine do 2013. godine. Glavna hipoteza rada navodi da hrvatski mirovinski fondovi podbacuju u odnosu na referentnu vrijednost, postav-ljenu kao povrat na portfelj sastavljen od indeksa CROBEX i CROBIS. Rezultati odbacuju glavnu hipotezu.
Financijsko poslovanje mirovinskih fondova izravno utječe na njihovu konkurentnost, proizlazeći iz mogućnosti mjerenja njihovoga uspjeha u aktivnom upravljanju portfeljem. Osim toga, od mirovinskih fondova se očekuje da će podržati nacionalno gospodarstvo. Ulaganjem svoje rastuće imovine u različite vrijednosne papire, oni mogu zaštititi radna mjesta i poduprijeti gospodarski rast i na lokalnoj i na region-alnoj razini. Međutim, to mogu postići samo ako su konkurentni i uspješni u smislu financijske uspješnosti.
Ključne riječi: mirovinski fondovi, financijska uspješnost, konkurentnost, Hrvatska
God. XXVIII, BR. 1/2015. str. 199-212
Dražen Novaković: Evaluation of the financial performance of pension funds in Croatia
214 215God. XXVIII, BR. 1/2015. str. 213-224 God. XXVIII, BR. 1/2015. str. 213-224
UDK: 658.14(497.5) / Review articleMartina Harc: The relationship between tangible assets and capital structure of small and medium-sized companies in Croatia
pothesis is: tangible assets are positively related to leverage and the trade-off theory predicts a posi-tive relation between leverage and tangibility. This relationship exists because tangible assets are eas-ier to collateralize and they suffer a smaller loss of value when firms go into distress. Since firms tend to match the maturity of assets with maturity of li-abilities, tangibility should be positively related with leverage (Koksal et al., 2013). Degryse et al. (2010) argues that the positive effect on total debt comes entirely from long-term debt, so an additional hy-pothesis is that tangible assets are positively related to long-term leverage. The second hypothesis is: tangible assets are negatively related to leverage, i.e. the negative relationship between leverage and as-set structure indicates that firms that employ lots of tangible assets seem to rely more on internal funds generated from these assets, which is predicted by the pecking order theory. Based on the discussion above, Bas et al. (2009) and Degryse et al. (2010) ar-gue that short-term debt is negatively related with asset tangibility. According to them, the second ad-ditional hypothesis is: tangible assets are negatively related to short-term leverage.
This article is organized as follows: Section 2 reviews the relevant theoretical and empirical literatures on how tangible assets influence capital structure. Sec-tion 3 presents a description of the methodology that includes a description of data and variables, and methods applied in the research. Sections 4 and 5 present the results, discussion and conclusions.
2. Literature review and previous studies
According to recent papers, although there is no consensus among authors on the direction of the relationship, asset structure plays an important role in determining the capital structure (Ellili and Farouk, 2011). Harris and Raviv (1991) argue that the larger share of tangible assets increases the liq-uidation value of a company. This is due to the fact that the tangible assets constitute collateral for the debt in case of bankruptcy. Morellec (2001) argues that when a firm is solvent, asset sales increase the firm value by allocating assets to better uses. He also argues that when the firm is in distress, asset sales represent the cheapest source of funds for the firm. Moreover, asset sales allow the firm to finance continued operation of its remaining assets without requiring external capital. Sanyal and Mann (2010)
examined the financial structure of start-up firms. They found that start-ups with more tangible assets as potential collateral are more likely to use external debt in the financial structure, since these assets have a high liquidation value. As the authors above concluded, collateral value of assets was found to be an important determinant in capital structure. Re-cent papers confirmed either a negative or positive relation between tangibility and capital structure. Koksal et al. (2013) investigated the factors that de-termine the capital structure choices in Turkey. They used tangibility as a proxy for the type of as-sets. They found that tangibility appears to be the key determinant of long-term leverage (positive re-lationship), but is not important for short-term lev-erage (negative relationship). Their empirical find-ings suggested that the trade-off theory is a better description of the capital structure of Turkish firms then the pecking order theory. In their study, Daskalakis and Thanou (2010) investigated deter-minants of capital structure of Greek SMEs in the period between 2003 and 2007. They found that the firms’ debt ratio is negatively related to asset struc-ture. They concluded that firms that generate rela-tively high internal funds tend to avoid debt financ-ing. Thus, firms that rely more on tangible assets tend to use less debt than firms with relatively fewer tangible assets. Psillaki and Daskalakis (2008) inves-tigated the capital structure of Greek, French, Ital-ian and Portuguese small and medium-sized enter-prises. They argue that the costs of financial distress depend on the types of assets that a firm employs. If a firm retains large investments in land, equipment and other tangible assets, it will have smaller costs of financial distress than a firm that relies on intan-gible assets. Thus, firms with more tangible assets should issue more debt. On the other hand, large holdings of tangible assets may imply that a firm has already a stable source of return, which provides more internally generated funds and discourages it from turning to external financing. So, the negative relationship between leverage and asset structure indicates that firms employ lots of tangible assets and seem to rely more on internal funds generated from these assets, which is predicted by the pecking order theory. They found that asset structure is sig-nificant and negatively correlated with leverage. A possible explanation is that firms with lots of tangi-ble assets may have already found a stable source of return, which provides them more internally gener-ated funds and discourages them from turning to external financing. Campello and Giambina (2011)
1. Introduction
Capital structure choice is one of the most impor-tant decisions faced by firm management (Degryse et al., 2010). Capital structure refers to the way a firm is financing its assets through a combination of equity and debt (Titman and Wessels, 1988). The process of financing takes a very important place in firm management because it must ensure financial continuity necessary for growth and maintaining competitiveness in their environment. This is espe-cially evident in transition economies, where due to underdeveloped capital markets debt remains the main source of financing. Capital structure can be defined as a mixture of a firm’s capital with debt and equity. The form of financing and types of funding sources will define a firm’s capital structure.
Capital structure theories offer a number of deter-minants that are responsible for various impacts on capital structure, while the empirical literature tends to find evidence that firms behave in accord-ance with the theoretical predictions (Shamshur, 2010). Mostly they focus on those determinants which are more likely to have a major role on lev-erage decisions. Although there have been various studies analysing capital structure, it is still debated what the determinants of capital structure are and how they impact capital structure decisions. Since Modigliani and Miller published their seminal pa-per in 1958, the issue of capital structure has gen-erated great interest among researchers. From the theoretical point of view, existing empirical stud-ies widely used two models of capital structure: the trade-off theory and the pecking order theory. The trade-off theory implies that a company’s capi-tal structure decisions involve a trade-off between the tax benefits of debt financing and the costs of financial distress. The pecking order theory points out that there is a certain order in financing, start-ing from retained earnings as a primary source of internal financing, then moving to debt and using equity only as the last resort. Each of these theories suggests how certain determinants affect capital structure. According to theories, researchers found various impacts of determinants on capital struc-ture depending on the country they are analysing.
In this paper the focus is on one determinant: tan-gible assets. Why tangible assets? Firstly, because the asset structure of companies should matter for financing decisions. Small and medium-sized com-
panies in Croatia may use tangible assets as collat-eral, either providing more access to the creditor or as a guarantee in case of bankruptcy. Olakunle and Oni (2014) pointed that tangibility of assets is characterized by the effect of the collateral values of assets on a firm’s leverage level. Secondly, the type of assets that a firm possesses can be consid-ered as an ambiguous factor in the determination of the debt-equity ratio. The cost of financial distress depends of the types of assets that a firm has. If a firm retains large investments in land, equipment and other tangible assets, it will have smaller costs of financial distress than firms that rely on intan-gible assets (Daskalakis and Psillaki, 2008). Thirdly, tangible assets are relatively easy to identify in con-trast to intangible assets, which are more difficult to identify, separate, utilize, account or imitate. It is important to see whether tangible assets are in function of debt or not, and whether the hypotheses support the pecking order theory or the trade-off theory.
This paper adds to the existing literature by examin-ing the relationship between tangible assets and the capital structure of small and medium-sized enter-prises (SMEs). These enterprises represent impor-tant parts of all economies in terms of both their total number and their job offer and job creation. One of the major topics that has been analysed in previous studies is how SMEs finance themselves. Financing is an essential part of operating any busi-ness. Without adequate access to financing poten-tial the growth of a firm is jeopardized. In reality, obtaining finance and other banking services has never been easy for small and medium-sized en-terprises. According to Degryse et al. (2010), large companies are more aware of better financing methods, since they employ more financial and ad-ministrative staff and may have a stronger bargain-ing position towards lenders. Croatia is a country in transition and a new member of the European Union, and as such it is an interesting case study. In a country like Croatia the private equity market is poor and the financial system is bank-based, so the role of debt is fundamental. It is important to analyse whether there is a positive or negative cor-relation between the capital structure and tangible assets of Croatian small and medium-sized enter-prises.
According to the existing empirical studies and results of the researches, the research hypotheses of this paper are formed as follows. The first hy-
216 217
3. Methodology
For the purposes of this research a data sample con-sisting of Croatian firms was selected. The sample contains small and medium-sized enterprises as defined in the Accounting Act. A small enterprise has an average of up to 50 employees and an annual income of up to HRK 65 million. A medium enter-prise has an average of up to 250 employees and an annual income of up to HRK 260 million. They are randomly selected from the Financial Agency data-base. The sample consists of 500 Croatian SMEs for the period between 2005 and 2010. The year 2005 is the reference year, and the number of SMEs de-creased or stayed the same in other years, depend-ing on whether the SMEs survived and submitted financial statements to the Financial Agency every year (in 2006 the number of observed SMEs was 386, in 2007 447 SMEs, in 2008 425 SMEs, in 2009 380 SMEs and in 2010 366 SMEs). Some enterprises appear twice or three times, while others appear for all six years which makes the dataset unbalanced. The sample included enterprises from all industry sectors in accordance with the National Classifica-tion of Activities, except enterprises in public ad-ministration and defence, the insurance industry and pension funds. Financial statements in the form of balance sheets and income statements were avail-able for all SMEs in the sample. Different measures of leverage are used in past papers and each lever-age measure is defined in a different way. In general, two most common proxies of leverage exist, such as calculated at book value of equity and at market value of equity (Loof, 2004). The most commonly used measure for leverage is defined as total debt over total assets. In this paper, the short-term and long-term debt ratio will be considered separately. Debt is measured by its book value. Market values are not known for SMEs. Managers have to base their financing decisions on book values.
Following Degryse et al. (2010), in this research the leverage of a company is calculated as the ratio of total debt to total assets, long-term debt to total as-sets and short-term debt to total assets. Research papers offer similar definitions of tangible assets. Many authors used a similar measure of tangibility. Koksal (2013) defined tangibility as the ratio of net fixed assets to total assets. Daskalakis and Thanou (2010) and Psillaki and Daskalakis (2008) measured the assets structure as the ratio of tangible assets di-vided by the total assets of the firm. Campello and
Giambina (2011) measured overall tangibility as the ratio of total tangible assets to book value of assets. La Rocca et al. (2009) measured tangibility as the ratio of property, plant and equipment to total book assets. Degryse et al. (2010) measured tangible as-sets as ratio of tangible fixed assets to total assets. According to the authors mentioned in this paper, tangibility is measured as the ratio of tangible assets to total assets.
Descriptive statistics consist of the mean and the standard deviation. The mean deviation represents the average of the sample. The standard deviation measures the amount of variation or dispersion from the average. In order to examine the relation-ships between variables and to test the hypotheses set out in the study, the Pearson correlation coef-ficient, which determines the degree to which two variables covary, is used.
4. Results
Descriptive statistics of the used ratios are given in Table 1. The numbers in the mean column represent mean values of each ratio calculated for all 500 firms in the sample. The numbers in the standard devia-tion column represent standard deviation values of each ratio calculated for all 500 firms in the sample.
It is interesting to notice that Croatian SMEs have more short-terms loans than long-term loans (they are high short-term levered around 58%). But in general, Croatian SMEs are highly levered (around 70% in the observed period). It is interesting to no-tice that despite the global economic crisis, Croatian SMEs increased their tangible assets. The reason might be that companies which retain investments in land, equipment and other tangible assets will have smaller costs of bankruptcy than companies that rely on intangible assets.
In order to examine the relationship between tan-gible assets and leverage, correlation coefficients between the tangible assets and leverage ratios are calculated. The aim is to examine whether high tan-gible assets means less leverage or vice versa. The results are presented in Table 2.
examined the relation between corporate asset structure and capital structure by exploiting varia-tion in the salability of tangible assets. They argued that tangible assets are often illiquid, so they show that redeployability of tangible assets is the main determinant of corporate leverage for firms that are more likely to face credit frictions, especially during periods of tight credit. Their evidence shows that tangible assets drive capital structure to the extent that they are redeployable. Only the component of asset tangibility that responds to salability has ex-planatory power over firm leverage. They found that the relation between redeployability and leverage is important and pronounced in firms for which the collateral resource is particularly important in the borrowing process. For large firms, in contrast, re-deployability is an irrelevant driver for leverage. La Rocca et al. (2009) examined the strategic financing choices of small businesses through the lens of the business life cycle. They conclude that tangibility has a positive relationship with debt, but its inten-sity varied across a firm’s life cycle. Their research shows that young firms have less-tangible assets in the form of stock, which makes them more reliant on collateral assets to secure debt and obtain credit under better terms. In the growing and mature stag-es of a firm’s life cycle, this effect decreases, but is still relevant. Degryse et al. (2010) expected asset tangibility to be positively correlated with debt as it provides collateral. They found strong support con-cerning the positive relationship between total debt and collateral. The positive effect on total debt came entirely from long-term debt, as short-term debt is negatively affected by the collateral. Since the col-lateral is a way to reduce risk of SMEs, these firms can fully use their collateral to attract long-term debt. For the firm, the costs of long-term debt are lower because banks charge relatively higher inter-est rates on short-term loans. These findings are in accordance with the maturity matching principle that long-term assets are financed with long-term financing and short-term assets are financed with short-term funds. Bas et al. (2009) studied the de-terminants of capital structure decisions of small and private firms in 25 developing countries from five different regions. They confirmed the impor-tance of firm level factors in accordance with the capital structure theory. Based on the maturity matching principle, long-term debt is financed by long-term assets, implying that as asset tangibility increases, firms borrow more long-term debt, while short-term debt is negatively related with asset tan-gibility. Leverage is negatively related with asset
tangibility because firms in their sample had more short-term debt than long-term debt, suggesting that small firms with more collateral borrow less short-term debt, but their results showed that me-dium firms with more collateral also borrow less. Heyman et al. (2007) examined the determinants of debt-equity choice and the debt maturity choice for a sample of small, privately held firms in the credi-tor oriented environment of Belgium. They hypoth-esized a positive relation between the proportion of tangible assets and the debt ratio of small firms. Their results strongly confirmed the hypothesis that firms seek to match the maturities of assets and lia-bilities, meaning that firms with less tangible assets have a lower debt ratio. This study confirmed that leverage increases with asset tangibility. Deari and Deari (2009) analysed which determinants influ-ence a company’s leverage. They selected two sam-ples. The first one was made up of Macedonian companies registered on the Macedonian Stock Ex-change, and the second sample consisted of Mace-donian small and medium businesses. They found that tangibility is negatively associated with lever-age for listed and unlisted companies and is consist-ent with the implication of the pecking order theo-ry. They concluded that Macedonian listed companies are evaluated from lenders not just based on tangibility assets, but also from other per-spectives, for example goodwill. The authors also found that managers, mostly of unlisted companies, believe that for approving loans in their business plan, profitability and growth are more important than tangibility. Han-Suck Song (2005) analysed the capital structure determinants of Swedish firms. Tangibility confirmed to be highly statistically sig-nificant for all three debt measures. The results showed that tangibility has a positive relationship with the total debt ratio and the long-term debt ra-tio, while it is negatively related to the short-term ratio. Their results supported the maturity match-ing principle: long-term debt is used to finance fixed tangible assets, while non-fixed tangible assets are financed by short-term debt. According to overall assets, Herciu and Ogrean (2012) argued that a firm is highly competitive as long as its managers are able to mix tangible and intangible assets in the most ef-fective and efficient manner. Therefore, a firm can get the same score of competitiveness by using a dif-ferent combination of assets and by giving different importance coefficients to the tangible and intangi-ble assets.
God. XXVIII, BR. 1/2015. str. 213-224 God. XXVIII, BR. 1/2015. str. 213-224
UDK: 658.14(497.5) / Review articleMartina Harc: The relationship between tangible assets and capital structure of small and medium-sized companies in Croatia
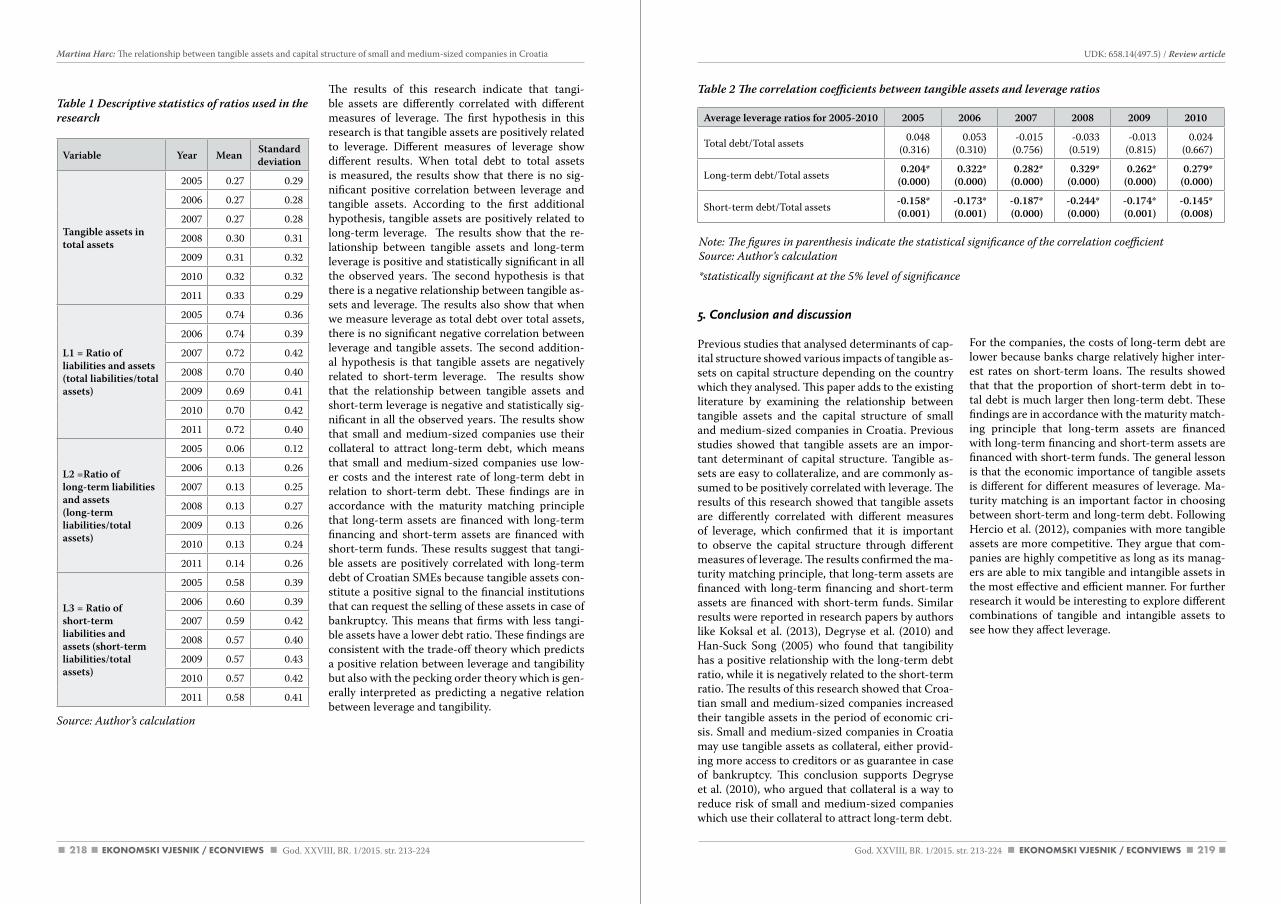
218 219
5. Conclusion and discussion
Previous studies that analysed determinants of cap-ital structure showed various impacts of tangible as-sets on capital structure depending on the country which they analysed. This paper adds to the existing literature by examining the relationship between tangible assets and the capital structure of small and medium-sized companies in Croatia. Previous studies showed that tangible assets are an impor-tant determinant of capital structure. Tangible as-sets are easy to collateralize, and are commonly as-sumed to be positively correlated with leverage. The results of this research showed that tangible assets are differently correlated with different measures of leverage, which confirmed that it is important to observe the capital structure through different measures of leverage. The results confirmed the ma-turity matching principle, that long-term assets are financed with long-term financing and short-term assets are financed with short-term funds. Similar results were reported in research papers by authors like Koksal et al. (2013), Degryse et al. (2010) and Han-Suck Song (2005) who found that tangibility has a positive relationship with the long-term debt ratio, while it is negatively related to the short-term ratio. The results of this research showed that Croa-tian small and medium-sized companies increased their tangible assets in the period of economic cri-sis. Small and medium-sized companies in Croatia may use tangible assets as collateral, either provid-ing more access to creditors or as guarantee in case of bankruptcy. This conclusion supports Degryse et al. (2010), who argued that collateral is a way to reduce risk of small and medium-sized companies which use their collateral to attract long-term debt.
For the companies, the costs of long-term debt are lower because banks charge relatively higher inter-est rates on short-term loans. The results showed that that the proportion of short-term debt in to-tal debt is much larger then long-term debt. These findings are in accordance with the maturity match-ing principle that long-term assets are financed with long-term financing and short-term assets are financed with short-term funds. The general lesson is that the economic importance of tangible assets is different for different measures of leverage. Ma-turity matching is an important factor in choosing between short-term and long-term debt. Following Hercio et al. (2012), companies with more tangible assets are more competitive. They argue that com-panies are highly competitive as long as its manag-ers are able to mix tangible and intangible assets in the most effective and efficient manner. For further research it would be interesting to explore different combinations of tangible and intangible assets to see how they affect leverage.
Table 1 Descriptive statistics of ratios used in the research
Variable Year Mean Standard deviation
Tangible assets in total assets
2005 0.27 0.29
2006 0.27 0.28
2007 0.27 0.28
2008 0.30 0.31
2009 0.31 0.32
2010 0.32 0.32
2011 0.33 0.29
L1 = Ratio of liabilities and assets(total liabilities/total assets)
2005 0.74 0.36
2006 0.74 0.39
2007 0.72 0.42
2008 0.70 0.40
2009 0.69 0.41
2010 0.70 0.42
2011 0.72 0.40
L2 =Ratio of long-term liabilities and assets (long-term liabilities/total assets)
2005 0.06 0.12
2006 0.13 0.26
2007 0.13 0.25
2008 0.13 0.27
2009 0.13 0.26
2010 0.13 0.24
2011 0.14 0.26
L3 = Ratio of short-term liabilities and assets (short-term liabilities/total assets)
2005 0.58 0.39
2006 0.60 0.39
2007 0.59 0.42
2008 0.57 0.40
2009 0.57 0.43
2010 0.57 0.42
2011 0.58 0.41
Source: author’s calculation
The results of this research indicate that tangi-ble assets are differently correlated with different measures of leverage. The first hypothesis in this research is that tangible assets are positively related to leverage. Different measures of leverage show different results. When total debt to total assets is measured, the results show that there is no sig-nificant positive correlation between leverage and tangible assets. According to the first additional hypothesis, tangible assets are positively related to long-term leverage. The results show that the re-lationship between tangible assets and long-term leverage is positive and statistically significant in all the observed years. The second hypothesis is that there is a negative relationship between tangible as-sets and leverage. The results also show that when we measure leverage as total debt over total assets, there is no significant negative correlation between leverage and tangible assets. The second addition-al hypothesis is that tangible assets are negatively related to short-term leverage. The results show that the relationship between tangible assets and short-term leverage is negative and statistically sig-nificant in all the observed years. The results show that small and medium-sized companies use their collateral to attract long-term debt, which means that small and medium-sized companies use low-er costs and the interest rate of long-term debt in relation to short-term debt. These findings are in accordance with the maturity matching principle that long-term assets are financed with long-term financing and short-term assets are financed with short-term funds. These results suggest that tangi-ble assets are positively correlated with long-term debt of Croatian SMEs because tangible assets con-stitute a positive signal to the financial institutions that can request the selling of these assets in case of bankruptcy. This means that firms with less tangi-ble assets have a lower debt ratio. These findings are consistent with the trade-off theory which predicts a positive relation between leverage and tangibility but also with the pecking order theory which is gen-erally interpreted as predicting a negative relation between leverage and tangibility.
Average leverage ratios for 2005-2010 2005 2006 2007 2008 2009 2010
Total debt/Total assets 0.048 (0.316)
0.053 (0.310)
-0.015 (0.756)
-0.033 (0.519)
-0.013 (0.815)
0.024 (0.667)
Long-term debt/Total assets 0.204*(0.000)
0.322* (0.000)
0.282* (0.000)
0.329* (0.000)
0.262* (0.000)
0.279* (0.000)
Short-term debt/Total assets -0.158* (0.001)
-0.173* (0.001)
-0.187* (0.000)
-0.244* (0.000)
-0.174* (0.001)
-0.145* (0.008)
Table 2 The correlation coefficients between tangible assets and leverage ratios
God. XXVIII, BR. 1/2015. str. 213-224 God. XXVIII, BR. 1/2015. str. 213-224
UDK: 658.14(497.5) / Review articleMartina Harc: The relationship between tangible assets and capital structure of small and medium-sized companies in Croatia
Note: The figures in parenthesis indicate the statistical significance of the correlation coefficientSource: author’s calculation
*statistically significant at the 5% level of significance
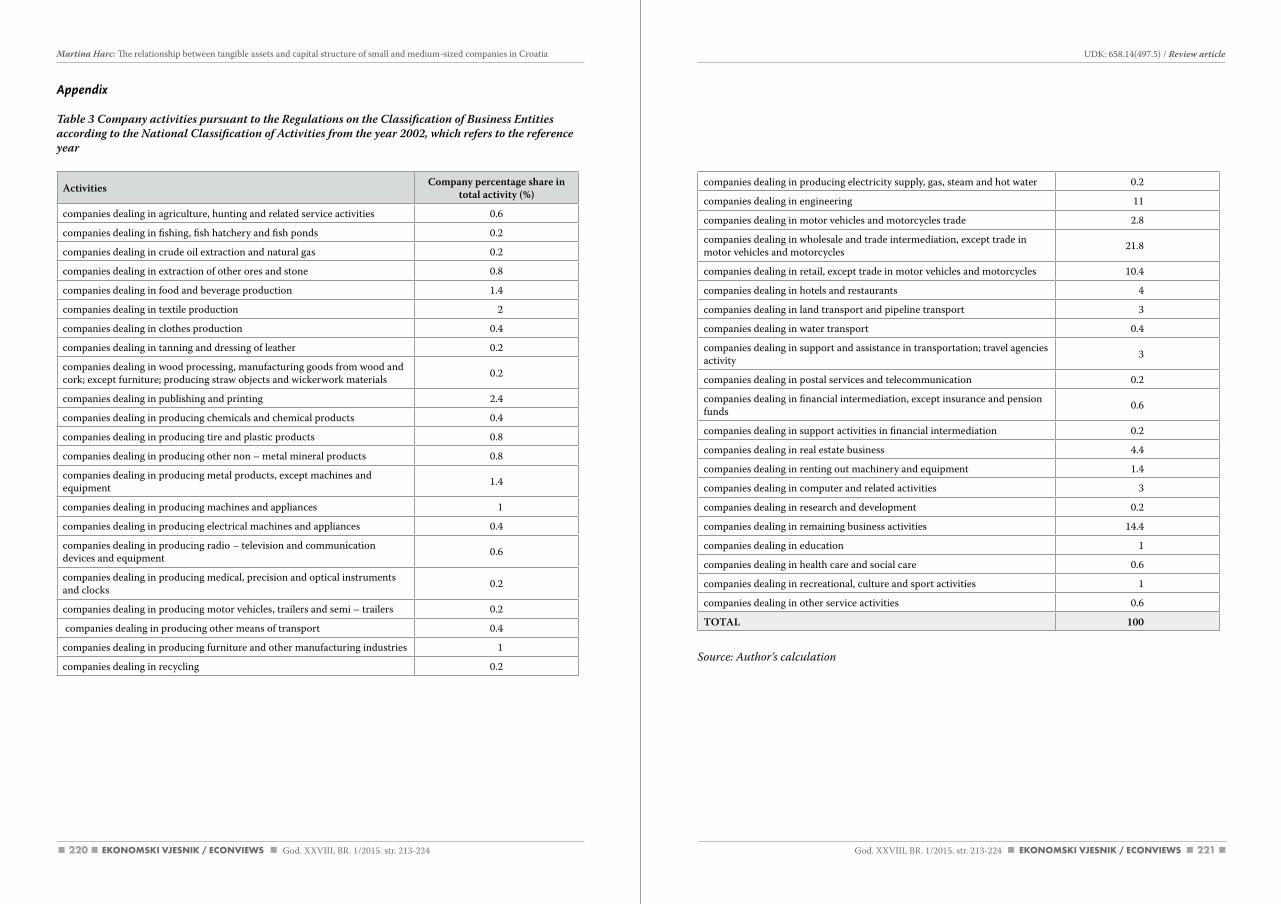
220 221
companies dealing in producing electricity supply, gas, steam and hot water 0.2
companies dealing in engineering 11
companies dealing in motor vehicles and motorcycles trade 2.8
companies dealing in wholesale and trade intermediation, except trade in motor vehicles and motorcycles 21.8
companies dealing in retail, except trade in motor vehicles and motorcycles 10.4
companies dealing in hotels and restaurants 4
companies dealing in land transport and pipeline transport 3
companies dealing in water transport 0.4
companies dealing in support and assistance in transportation; travel agencies activity 3
companies dealing in postal services and telecommunication 0.2
companies dealing in financial intermediation, except insurance and pension funds 0.6
companies dealing in support activities in financial intermediation 0.2
companies dealing in real estate business 4.4
companies dealing in renting out machinery and equipment 1.4
companies dealing in computer and related activities 3
companies dealing in research and development 0.2
companies dealing in remaining business activities 14.4
companies dealing in education 1
companies dealing in health care and social care 0.6
companies dealing in recreational, culture and sport activities 1
companies dealing in other service activities 0.6
TOTAL 100
Source: author’s calculation
Appendix
Table 3 Company activities pursuant to the Regulations on the Classification of Business Entities according to the National Classification of Activities from the year 2002, which refers to the reference year
Activities Company percentage share in total activity (%)
companies dealing in agriculture, hunting and related service activities 0.6
companies dealing in fishing, fish hatchery and fish ponds 0.2
companies dealing in crude oil extraction and natural gas 0.2
companies dealing in extraction of other ores and stone 0.8
companies dealing in food and beverage production 1.4
companies dealing in textile production 2
companies dealing in clothes production 0.4
companies dealing in tanning and dressing of leather 0.2
companies dealing in wood processing, manufacturing goods from wood and cork; except furniture; producing straw objects and wickerwork materials 0.2
companies dealing in publishing and printing 2.4
companies dealing in producing chemicals and chemical products 0.4
companies dealing in producing tire and plastic products 0.8
companies dealing in producing other non – metal mineral products 0.8
companies dealing in producing metal products, except machines and equipment 1.4
companies dealing in producing machines and appliances 1
companies dealing in producing electrical machines and appliances 0.4
companies dealing in producing radio – television and communication devices and equipment 0.6
companies dealing in producing medical, precision and optical instruments and clocks 0.2
companies dealing in producing motor vehicles, trailers and semi – trailers 0.2
companies dealing in producing other means of transport 0.4
companies dealing in producing furniture and other manufacturing industries 1
companies dealing in recycling 0.2
God. XXVIII, BR. 1/2015. str. 213-224 God. XXVIII, BR. 1/2015. str. 213-224
UDK: 658.14(497.5) / Review articleMartina Harc: The relationship between tangible assets and capital structure of small and medium-sized companies in Croatia
222 223
16. Ellili, N. O. D., Farouk, S. (2011), „Examining the capital structure determinants: empirical analysis of companies traded on Abu Dhabi Stock Exchange“, International research journal of finance and economics, No. 67, pp. 82-96.
17. Olakunle, A. O., Oni, E. O. (2014) “Assessing the impact of asset tangibility on capital structure: choice for listed firms in Nigeria”, Available at http://www.aebjournal.org/articles/0203/020301.pdf (Accessed on: September 20, 2014)
18. Sanyal, P., Mann L. (2010), “The financial structure of startup firms: the role of assets, information and entrepreneur characteristics”, Available at: https://www.bostonfed.org/economic/wp/wp2010/wp1017.pdf (Accessed on: September 22, 2014)
19. Shamsur, A. (2010), “Access to capital and capital structure of the firm”, CERGE-EI WP No. 429, Available at http://dx.doi.org/10.2139/ssrn.1721455 (Accessed on: September 20, 2014)
20. Titman, S., Wessels, R. (1988), “The determinants of capital structure choice”, Journal of Finance, Vol. 43, No. 1, pp. 1-19.
References
1. Accounting Act, (NN 109/97, 54/13, 121/14) Article 3, Available at: http://www.zakon.hr/z/118/Za-kon-o-ra%C4%8Dunovodstvu (Accessed on: November 28, 2014)
2. Bas, T., Muradoglu, G., Phylaktis, K. (2009), “Determinants of capital structure in developing countries”, Available at: http://www.efmaefm.org/0EFMSYMPOSIUM/2010-China/papers/determinants%20of%20capital%20structure%20in%20developing%20countries.pdf (Accessed on: September 20, 2014)
3. Campello, M. Giambina E. (2011), “Capital structure and the redeployability of tangible assets”, Tin-bergen Institute Discussion Paper, No.11-091/2/DSF24.
4. Daskalakis, N., Psillaki, M. (2008), “Do country of firm explain capital structure? Evidence from SMEs in France and Greece”, Applied financial economics, Vol. 18, No. 2, pp. 87-97.
5. Daskalakis, N., Thanou, E. (2010), “Capital structure of SMEs: to what extent does size matter?”, Available at: http://papers.ssrn.com/sol3/papers.cfm?abstract_id=1683161 (Accessed on: September 20, 2014)
6. Deari, F., Deari, M. (2009), “The determinants of capital structure: evidence from Macedonian list-ed and unlisted companies”, Available at: http://ideas.repec.org/a/aic/journl/y2009v56p91-102.html (Accessed on: September 20, 2014)
7. Degryse, H., Goeij, P., Kappert, P. (2010), “The impact of firm and industry characteristics on small firms capital structure”, Small Bus Econ, Vol. 38, No. 4, pp. 431-447.
8. Song, H. (2005), “Capital structure determinants: an empirical study of Swedish companies”, CEIS Electronic working paper series, Available at: http://papers.cesis.se/CESISWP25.pdf (Accessed on: September 23, 2014)
9. Harris, M., Raviv, A. (1991) “The theory of capital structure”, Journal of Finance, Vol. 46, No. 1, pp. 297-355.
10. Heyman, D., Deloof, M., Ooghe, H. (2007), “The financial structure of private held Belgian firms”, Small business economics, Vol. 30, No. 3, pp. 301-313.
11. Herciu, M., Ogrean, C., Belascu, L. (2012), “Leveraging tangible and intangible assets by using a pos-sible firm competitiveness index”, Global business and economics review, Vol. 14, No. 1/2, pp. 115-124.
12. Koksal, B., Orman, C., Oduncu, A. (2013), “Determinants of capital structure: evidence from a major emerging market economy”, Available at: http://mpra.ub.uni-muenchen.de/48415/ (Accessed on: Sep-tember 23, 2014)
13. La Rocca, M., La Rocca, T., Cariola, A. (2009), “Small business financing. Financial preferences throughout the life cycle of a firm”, Available at: http://www.researchgate.net/publication/242086295_Small_Business_Financing._Financial_preferences_throughout_the_life_cycle_of_a_firm (Accessed on: September 22, 2014)
14. Loof, H. (2004), “Dynamic optimal capital structure and technical change”, Structure Change and Eco-nomic Dynamics, Vol. 15, No. 4, pp. 449-468.
15. Morellec, E. (2001), “Asset liquidity, capital structure and secured debt”, Journal of financial econom-ics, Vol. 61, No. 2, pp. 173-206.
God. XXVIII, BR. 1/2015. str. 213-224 God. XXVIII, BR. 1/2015. str. 213-224
UDK: 658.14(497.5) / Review articleMartina Harc: The relationship between tangible assets and capital structure of small and medium-sized companies in Croatia
225224 God. XXVIII, BR. 1/2015. str. 225-241
Tomislav Galović: The international competitiveness of the pharmaceutical industry within 21 OECD countries
1. Introduction
The pharmaceutical industry represents a capital intensive sector whose competitiveness is mostly based on technology, which is a characteristic for segments of the high-technology industry. Al-though the pharmaceutical industry is based on production innovation and high level of R&D activ-ity like other high-technology industries, there are certain evident particularities (Bezić and Galović, 2013). In other words, the pharmaceutical industry invests, by far, the largest amount in research and development (R&D) (as a proportion of sales) of any industry.
Generally speaking, the pharmaceutical industry is under the influence of two main factors: large phar-maceutical companies and state legislation. State legislation covers the safety, effectiveness, and price of the pharmaceutical products, but it also devotes attention to the importance of R&D and innovative policy. The world’s supply of the pharmaceutical in-dustry is characterized by a small number of indus-trial economies on a high-technology and product innovation level (Karn, 1997). World demand for pharmaceutical products mostly records a growing trend. The demand can be determined by income level as well as price movements, distribution, age of the population, health care system, etc.
THE INTERNATIONAL COMPETITIVENESS OF THE PHARMACEUTICAL INDUSTRY WITHIN 21 OECD COUNTRIES
UDK: 339.137.2:661.12](100)OECDReview article
Received: January 13, 2015accepted for publishing: May 05, 2015
Tomislav GalovićUniversity of RijekaFaculty of EconomicsIvana Filipovića 4,51000 Rijeka, [email protected]: +38551355155
Abstract
This research consists of the results of 21 pharmaceutical OECD industries in the period between 2004 and 2009. The main objective of this paper is to measure international trade and competitiveness of the phar-maceutical industry within the observed OECD countries. The methodology in the paper is based on the application of various indicators which include intra-industry trade, trade balance, the import penetration indicator, composition of manufacturing exports and other relevant indicators. The main research results include facts from measuring international trade and competitiveness, as well as an estimation of the posi-tion of the pharmaceuticals of the observed OECD countries, especially on the external market, and recom-mendations and proposals for reaching a higher level of international competitiveness.
Keywords: International competitiveness, international trade, OECD countries, pharmaceutical industry
Martina Harc
veza između materijalne imovine i strukture kapitala malih i srednjih poduzeća u Hrvatskoj
Sažetak
Imovina poduzeća važna je za donošenje financijskih odluka u poduzeću. Mala i srednja poduzeća u Hr-vatskoj koriste materijalnu imovinu u svojstvu kolaterala prema financijskim institucijama ili kao jamstvo u slučaju stečaja poduzeća.
Cilj ovog rada je istražiti vezu između materijalne imovine poduzeća i strukture kapitala malih i srednjih poduzeća u Hrvatskoj. Većina prethodnih istraživanja pokazala je i pozitivnu i negativnu vezu između materijalne imovine poduzeća i strukture kapitala. Istraživanje za ovaj rad provedeno je na uzorku od 500 malih i srednjih poduzeća u Hrvatskoj u razdoblju od 2005. do 2010. godine. Za poduzeća u uzorku na raspolaganju su bili godišnji financijski izvještaji poduzeća u obliku računa dobiti i gubitka te bilance. Da bi se ispitala veza između materijalne imovine poduzeća i strukture kapitala, korišten je Pearsonov koeficijent korelacije. Rezultati istraživanja potvrdili su da materijalna imovina poduzeća različito utječe na kratkoročnu i dugoročnu zaduženost poduzeća. Veza između materijalne imovine poduzeća i kratkoročne zaduženosti poduzeća je negativna i statistički značajna u svim godinama promatranja. Veza između ma-terijalne imovine poduzeća i dugoročne zaduženosti poduzeća je pozitivna i statistički značajna u svim godinama promatranja. Rezultati ukazuju da mala i srednja poduzeća koriste materijalnu imovinu kao kolateral prilikom dugoročnog zaduživanja i na taj način koriste niže kamatne stope i niže troškove obrade kredita u odnosu na kratkoročno zaduživanje.
Rezultati istraživanja pokazuju da se poduzeća financiraju po principu dospijeća, odnosno da se kratkotra-jna imovina financira kratkoročnim sredstvima, a dugotrajna imovina dugoročnim financijskim sredstvima. Rezultati istraživanja pokazali su da je veza između materijalne imovine i dugoročnog zaduživanja pozi-tivna jer materijalna imovina za financijske institucije predstavlja jamstvo na način da ju mogu unovčiti u slučaju stečaja poduzeća.
S obzirom kako mjerimo zaduženost poduzeća, rezultati istraživanja podupiru teoriju izbora koja predviđa pozitivnu vezu između materijalne imovine i zaduženosti poduzeća, no također rezultati istraživanja podupiru i teoriju postupka slaganja koja predviđa negativnu vezu između materijalna imovine i zaduženosti poduzeća.
Ključne riječi: materijalna imovina, struktura kapitala, zaduženost, mala i srednja poduzeća
God. XXVIII, BR. 1/2015. str. 213-224
Martina Harc: The relationship between tangible assets and capital structure of small and medium-sized companies in Croatia
226 227God. XXVIII, BR. 1/2015. str. 225-241 God. XXVIII, BR. 1/2015. str. 225-241
UDK: 339.137.2:661.12](100)OECD / Review articleTomislav Galović: The international competitiveness of the pharmaceutical industry within 21 OECD countries
Most experts are partly or completely familiar with two theoretical frameworks from trade based on comparative advantages: Ricardo’s theory and Heckscher-Ohlin (H-O) theory. Ricardo’s theory covers comparative advantages achieved on the ba-sis of different technologies, while the H-O theory uses as an example the equal level of technology in all countries. The H-O theory at the same time points out the significance of comparative advan-tages in relation to different levels of costs derived from unequal prices of the manufacturing factors in the analyzed countries. Postulates of traditional trade theories are based on the principle of relative prices of comparative advantages, i.e. inequalities in prices which are under the influence of supply and demand factors (Bezić and Galović, 2013).
According to the H-O theory, a comparative advan-tage of an economy is defined by the relative scarcity factor. However, irregularities in measuring of com-parative advantages and verifying of the Heckscher-Ohlin theory were discovered by empirical analysis because of the inability to observe relative prices under the influence of autarky (Balassa, 1989: 42). Bearing in mind these insights, Balassa (1965) sug-gested avoiding full inclusion of all the components which affect the comparative advantages of differ-ent economies. Instead, it is pointed out in Balassa’s analysis that “revealed” comparative advantage is in accordance with the theoretical postulates, except for one exception, which is the inability to analyse relative prices. Deriving conclusions from the ana-lyzed data, Balassa called the results of his research revealed comparative advantage, i.e. RCA (Revealed Comparative Advantage). RCA is, at the same time, an accepted method in the analysis of trade in the observed countries. Furthermore, Balassa created an index (known as Balassa’s Revealed Comparative Advantage Index) whose main objective is measur-ing comparative advantages of countries. It should be pointed out that Balassa’s index is reflected in the identification of revealed comparative advantages instead of revealing “hidden” elements of econom-ic advantages of an economy (Bezić and Galović, 2013).
However, the initial version of Balassa’s Revealed Comparative Advantage Index was modified and revised, so that, presently, there are different indi-ces for measuring comparative advantages. In some research, the RCA is measured on the global level (Vollrath, 1991), while in other studies, the RCA is measured on the regional level. There are also cases
in which Balassa’s Revealed Comparative Advan-tage Index was used as a measure for bilateral trade (Dimelis and Gatsios, 1995).
According to Krugman (1985), trade models have given a precise description of the pattern of trade in goods. In traditional theory, the answer emerges from the explanation of trade itself: countries pro-duce goods that would have been relatively cheap in the absence of trade. The comparative advantage may arise from a variety of sources, but in any case the attributes of a country determine what it pro-duces. Krugman (1996) claims that traditional the-ory is the usual basis for advocating free trade, one of the most strongly held positions in the econom-ics profession (although actually even in traditional theory a second-best case can be made for protec-tion as a corrective for domestic market failures). The new trade theory suggests a more complex view. The potential gains from trade are even larger in a world of increasing returns, and thus, in a way, the case for free trade is all the stronger. New trade models show that it is possible (not certain) that such tools as export subsidies, temporary tariffs, and so on, may shift world specialization in a way favourable to the protecting nation.
The basic scientific hypothesis of the paper is set up, namely, that it is possible to estimate the interna-tional competitiveness of the pharmaceutical indus-try within 21 OECD countries (including several EU Member Countries) by using various international trade and competitiveness indicators.
In this relation, the basic objective of the research is to measure international competitiveness, ob-jectively estimate international trade of the phar-maceuticals of 21 OECD countries, and to propose measures and activities for the improvement of their international trade competitiveness in accordance with the results.
The paper consists of five systematically interrelated parts. After the Introduction, the second part of the paper presents the research methodology. The third part includes the analytical framework and results of international competitiveness based on the anal-ysis of foreign trade activity and export competi-tiveness of the OECD pharmaceutical industry. The final part comprises proposals, recommendations and conclusions.
One of the main threats to the competitiveness of pharmaceutical companies, among other things, is reflected in the inability to maximize benefits from knowledge and innovation, in other words, the so-called “technological spillovers”. Namely, if pharma-ceutical companies produce innovation accepted by competitive companies without any costs, they can face the loss of their competitiveness (Bezić and Galović, 2013).
Products of the pharmaceutical industry are con-tinuously placed on the market with the objective to sustain and prolong human life. Taking into consideration that health is a basic human need, pharmaceutical products have a significant social impact in relation to other industries. Pharmaceuti-cal products are chemical and biological substances used in therapies and prevention of illnesses. The pharmaceutical industry may be viewed from the aspect of consumers. Namely, the pharmaceutical industry comprises a group of companies which sell and distribute medicaments as final products. From the manufacturers’ point of view, the phar-maceutical industry is defined in a narrower sense which implies manufacturing and processing activi-ties (Reekie, 1975: 1). Multinational corporations and foreign direct investments are a driving force behind the world pharmaceutical manufacturing and trade. In general, pharmaceutical products have been classified by the distribution channels and choice of use into two main groups: over-the-counter (OTC) and prescription (ethical) products. The first group (OTC) consists of drugs which have small market shares, but their importance is grow-ing. The second group (ethical) accounts for the bulk of medicines sold on prescription. In many countries, prescription drugs are available only through retail pharmacies or hospitals. Therefore, pharmacists and physicians are important parts of the distribution channel. Price competition is often more aggressive. Generic drugs are out-of-patent products which may be produced by more than one company because their patents have already expired. These types of drugs are price-competitive since they contain the same active ingredient as the original brand. Generic drugs may be substituted for the prescribed brand name if they are cheaper (Prasit, 1997).
In this paper several indicators of export and import of pharmaceuticals in the OECD countries are ana-lyzed in order to measure international trade and competitiveness.
Moreover, definitions of competitiveness by the OECD and DTI (Department of Trade and Industry) point out the significance of technological factors in the creation of competitiveness. DTI (DTI, 1994) defines competitiveness of firms as a possibility for manufacturing of adequate goods and services, at the right time and at the right price. The definition by the OECD (OECD, 1992), from the micro aspect, includes competitiveness which refers to a firms’ ability to compete, to maximize profit and realize growth based on costs and prices by using technol-ogy, improvement of quality, and maximization of the effect of its products. Many scientists explore the relationship between competitiveness and tech-nological possibilities. Scientists like Kaldor (1971), Porter (2001), Lall (2001), and Wignaraja (2003), and institutions like the OECD challenged in an ar-gumented manner the opinions of other scientists who tried to define competitiveness only from the aspect of price-based factors with emphasis on non-price factors such as technology.
The discussion led to the revision of traditional theories in the framework of the problem of com-petitiveness. There are two aspects which clarify the term “competitiveness” in more detail. The general macroeconomic aspect presents international com-petitiveness in the framework of price-based fac-tors. On the other hand, the microeconomic aspect tries to define competitiveness on the firm level with the factors which are not price-based and emphasis is placed on analysis of the rivalry between firms.
The macroeconomic aspect is accompanied by in-ternal and external balance of economies where special attention was devoted to effects of price-based factors on the competition. The microeco-nomic aspect analyzed internal company dynamics which makes companies strong or weak in relation to influences (Wignaraja, 2003).
The microeconomic aspect refers to presentation of competitiveness on the firm level. Perspective as such includes rivalry among firms and their strate-gies. In the past few years, the microeconomic as-pect implies new dimensions: the impact of tech-nology and innovation. Lall (2001) criticizes the neoclassical theory, whose hypotheses are based on the thesis that technology is available to all firms which are able to use technology at technically “high” levels. However, this long learning process starts by import of technology followed by innova-tion.
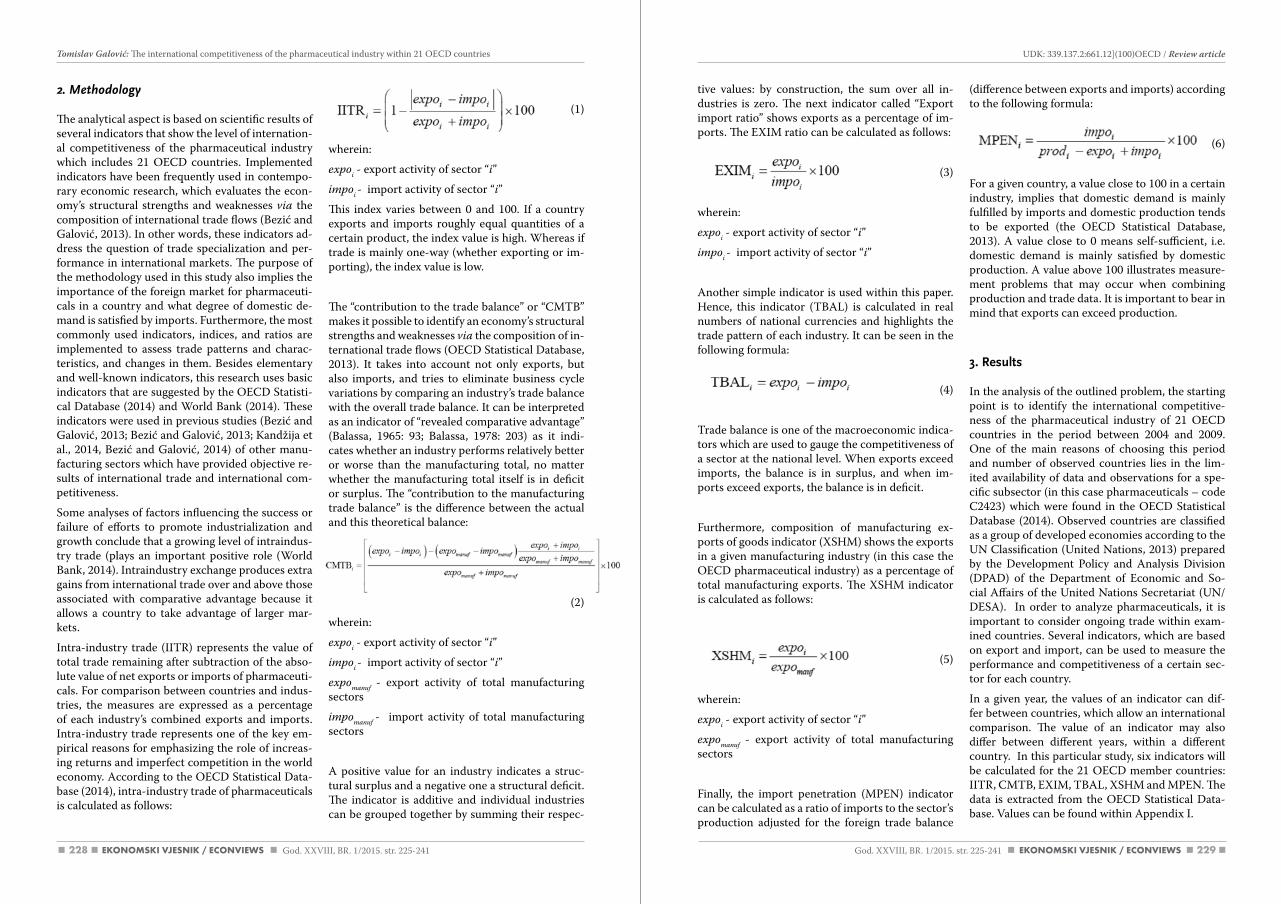
228 229
tive values: by construction, the sum over all in-dustries is zero. The next indicator called “Export import ratio” shows exports as a percentage of im-ports. The EXIM ratio can be calculated as follows:
(3)
wherein:
expoi - export activity of sector “i”
impoi - import activity of sector “i”
Another simple indicator is used within this paper. Hence, this indicator (TBAL) is calculated in real numbers of national currencies and highlights the trade pattern of each industry. It can be seen in the following formula:
(4)
Trade balance is one of the macroeconomic indica-tors which are used to gauge the competitiveness of a sector at the national level. When exports exceed imports, the balance is in surplus, and when im-ports exceed exports, the balance is in deficit.
Furthermore, composition of manufacturing ex-ports of goods indicator (XSHM) shows the exports in a given manufacturing industry (in this case the OECD pharmaceutical industry) as a percentage of total manufacturing exports. The XSHM indicator is calculated as follows:
(5)
wherein:
expoi - export activity of sector “i”
expomanuf - export activity of total manufacturing sectors
Finally, the import penetration (MPEN) indicator can be calculated as a ratio of imports to the sector’s production adjusted for the foreign trade balance
(difference between exports and imports) according to the following formula:
(6)
For a given country, a value close to 100 in a certain industry, implies that domestic demand is mainly fulfilled by imports and domestic production tends to be exported (the OECD Statistical Database, 2013). A value close to 0 means self-sufficient, i.e. domestic demand is mainly satisfied by domestic production. A value above 100 illustrates measure-ment problems that may occur when combining production and trade data. It is important to bear in mind that exports can exceed production.
3. Results
In the analysis of the outlined problem, the starting point is to identify the international competitive-ness of the pharmaceutical industry of 21 OECD countries in the period between 2004 and 2009. One of the main reasons of choosing this period and number of observed countries lies in the lim-ited availability of data and observations for a spe-cific subsector (in this case pharmaceuticals – code C2423) which were found in the OECD Statistical Database (2014). Observed countries are classified as a group of developed economies according to the UN Classification (United Nations, 2013) prepared by the Development Policy and Analysis Division (DPAD) of the Department of Economic and So-cial Affairs of the United Nations Secretariat (UN/DESA). In order to analyze pharmaceuticals, it is important to consider ongoing trade within exam-ined countries. Several indicators, which are based on export and import, can be used to measure the performance and competitiveness of a certain sec-tor for each country.
In a given year, the values of an indicator can dif-fer between countries, which allow an international comparison. The value of an indicator may also differ between different years, within a different country. In this particular study, six indicators will be calculated for the 21 OECD member countries: IITR, CMTB, EXIM, TBAL, XSHM and MPEN. The data is extracted from the OECD Statistical Data-base. Values can be found within Appendix I.
2. Methodology
The analytical aspect is based on scientific results of several indicators that show the level of internation-al competitiveness of the pharmaceutical industry which includes 21 OECD countries. Implemented indicators have been frequently used in contempo-rary economic research, which evaluates the econ-omy’s structural strengths and weaknesses via the composition of international trade flows (Bezić and Galović, 2013). In other words, these indicators ad-dress the question of trade specialization and per-formance in international markets. The purpose of the methodology used in this study also implies the importance of the foreign market for pharmaceuti-cals in a country and what degree of domestic de-mand is satisfied by imports. Furthermore, the most commonly used indicators, indices, and ratios are implemented to assess trade patterns and charac-teristics, and changes in them. Besides elementary and well-known indicators, this research uses basic indicators that are suggested by the OECD Statisti-cal Database (2014) and World Bank (2014). These indicators were used in previous studies (Bezić and Galović, 2013; Bezić and Galović, 2013; Kandžija et al., 2014, Bezić and Galović, 2014) of other manu-facturing sectors which have provided objective re-sults of international trade and international com-petitiveness.
Some analyses of factors influencing the success or failure of efforts to promote industrialization and growth conclude that a growing level of intraindus-try trade (plays an important positive role (World Bank, 2014). Intraindustry exchange produces extra gains from international trade over and above those associated with comparative advantage because it allows a country to take advantage of larger mar-kets.
Intra-industry trade (IITR) represents the value of total trade remaining after subtraction of the abso-lute value of net exports or imports of pharmaceuti-cals. For comparison between countries and indus-tries, the measures are expressed as a percentage of each industry’s combined exports and imports. Intra-industry trade represents one of the key em-pirical reasons for emphasizing the role of increas-ing returns and imperfect competition in the world economy. According to the OECD Statistical Data-base (2014), intra-industry trade of pharmaceuticals is calculated as follows:
(1)
wherein:
expoi - export activity of sector “i”
impoi - import activity of sector “i”
This index varies between 0 and 100. If a country exports and imports roughly equal quantities of a certain product, the index value is high. Whereas if trade is mainly one-way (whether exporting or im-porting), the index value is low.
The “contribution to the trade balance” or “CMTB” makes it possible to identify an economy’s structural strengths and weaknesses via the composition of in-ternational trade flows (OECD Statistical Database, 2013). It takes into account not only exports, but also imports, and tries to eliminate business cycle variations by comparing an industry’s trade balance with the overall trade balance. It can be interpreted as an indicator of “revealed comparative advantage” (Balassa, 1965: 93; Balassa, 1978: 203) as it indi-cates whether an industry performs relatively better or worse than the manufacturing total, no matter whether the manufacturing total itself is in deficit or surplus. The “contribution to the manufacturing trade balance” is the difference between the actual and this theoretical balance:
(2)
wherein:
expoi - export activity of sector “i”
impoi - import activity of sector “i”
expomanuf - export activity of total manufacturing sectors
impomanuf - import activity of total manufacturing sectors
A positive value for an industry indicates a struc-tural surplus and a negative one a structural deficit. The indicator is additive and individual industries can be grouped together by summing their respec-
God. XXVIII, BR. 1/2015. str. 225-241 God. XXVIII, BR. 1/2015. str. 225-241
UDK: 339.137.2:661.12](100)OECD / Review articleTomislav Galović: The international competitiveness of the pharmaceutical industry within 21 OECD countries
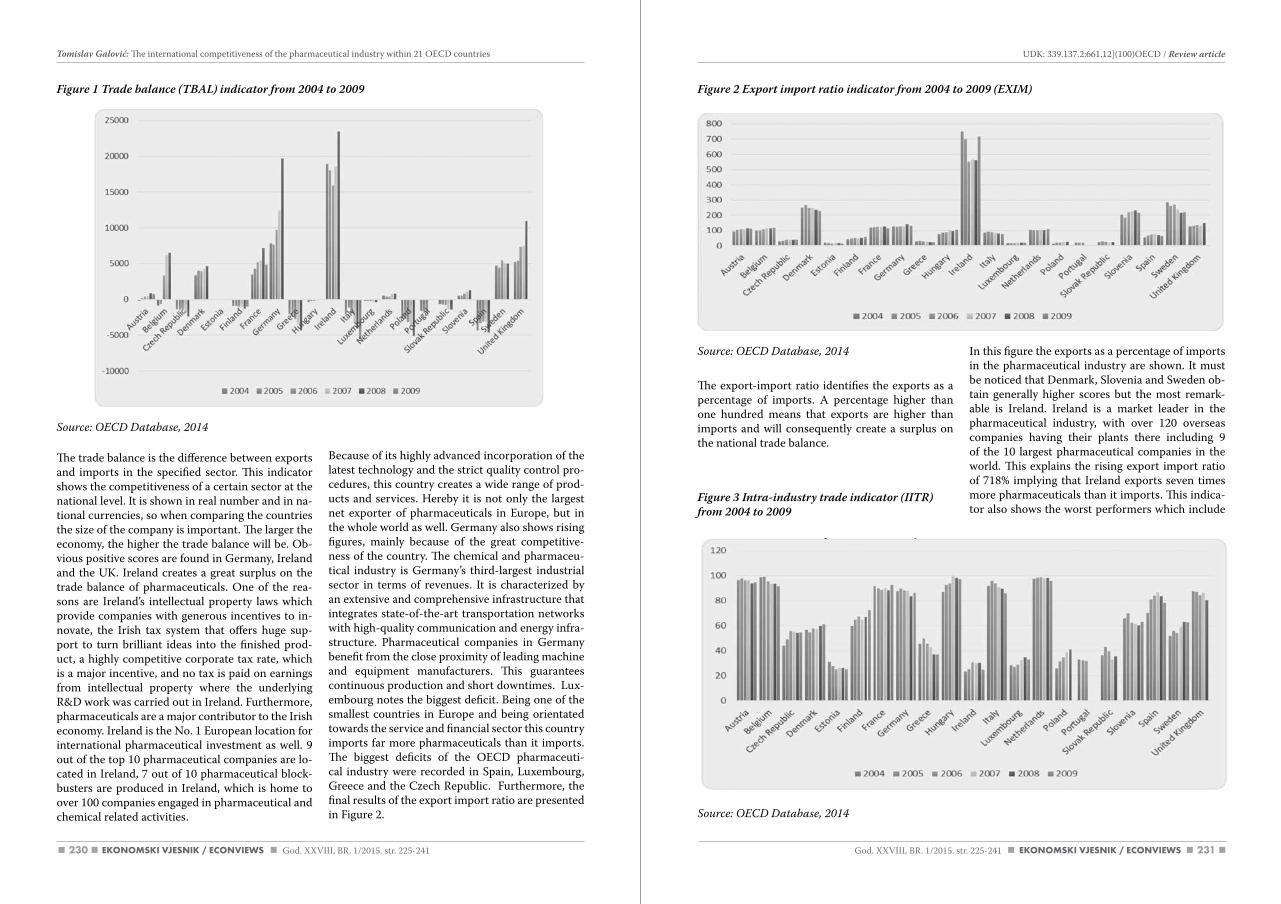
230 231
Source: OEcd database, 2014
The export-import ratio identifies the exports as a percentage of imports. A percentage higher than one hundred means that exports are higher than imports and will consequently create a surplus on the national trade balance.
Figure 3 Intra-industry trade indicator (IITR) from 2004 to 2009
Source: OEcd database, 2014
In this figure the exports as a percentage of imports in the pharmaceutical industry are shown. It must be noticed that Denmark, Slovenia and Sweden ob-tain generally higher scores but the most remark-able is Ireland. Ireland is a market leader in the pharmaceutical industry, with over 120 overseas companies having their plants there including 9 of the 10 largest pharmaceutical companies in the world. This explains the rising export import ratio of 718% implying that Ireland exports seven times more pharmaceuticals than it imports. This indica-tor also shows the worst performers which include
Source: OEcd database, 2014
The trade balance is the difference between exports and imports in the specified sector. This indicator shows the competitiveness of a certain sector at the national level. It is shown in real number and in na-tional currencies, so when comparing the countries the size of the company is important. The larger the economy, the higher the trade balance will be. Ob-vious positive scores are found in Germany, Ireland and the UK. Ireland creates a great surplus on the trade balance of pharmaceuticals. One of the rea-sons are Ireland’s intellectual property laws which provide companies with generous incentives to in-novate, the Irish tax system that offers huge sup-port to turn brilliant ideas into the finished prod-uct, a highly competitive corporate tax rate, which is a major incentive, and no tax is paid on earnings from intellectual property where the underlying R&D work was carried out in Ireland. Furthermore, pharmaceuticals are a major contributor to the Irish economy. Ireland is the No. 1 European location for international pharmaceutical investment as well. 9 out of the top 10 pharmaceutical companies are lo-cated in Ireland, 7 out of 10 pharmaceutical block-busters are produced in Ireland, which is home to over 100 companies engaged in pharmaceutical and chemical related activities.
Because of its highly advanced incorporation of the latest technology and the strict quality control pro-cedures, this country creates a wide range of prod-ucts and services. Hereby it is not only the largest net exporter of pharmaceuticals in Europe, but in the whole world as well. Germany also shows rising figures, mainly because of the great competitive-ness of the country. The chemical and pharmaceu-tical industry is Germany’s third-largest industrial sector in terms of revenues. It is characterized by an extensive and comprehensive infrastructure that integrates state-of-the-art transportation networks with high-quality communication and energy infra-structure. Pharmaceutical companies in Germany benefit from the close proximity of leading machine and equipment manufacturers. This guarantees continuous production and short downtimes. Lux-embourg notes the biggest deficit. Being one of the smallest countries in Europe and being orientated towards the service and financial sector this country imports far more pharmaceuticals than it imports. The biggest deficits of the OECD pharmaceuti-cal industry were recorded in Spain, Luxembourg, Greece and the Czech Republic. Furthermore, the final results of the export import ratio are presented in Figure 2.
Figure 1 Trade balance (TBAL) indicator from 2004 to 2009 Figure 2 Export import ratio indicator from 2004 to 2009 (EXIM)
God. XXVIII, BR. 1/2015. str. 225-241 God. XXVIII, BR. 1/2015. str. 225-241
UDK: 339.137.2:661.12](100)OECD / Review articleTomislav Galović: The international competitiveness of the pharmaceutical industry within 21 OECD countries
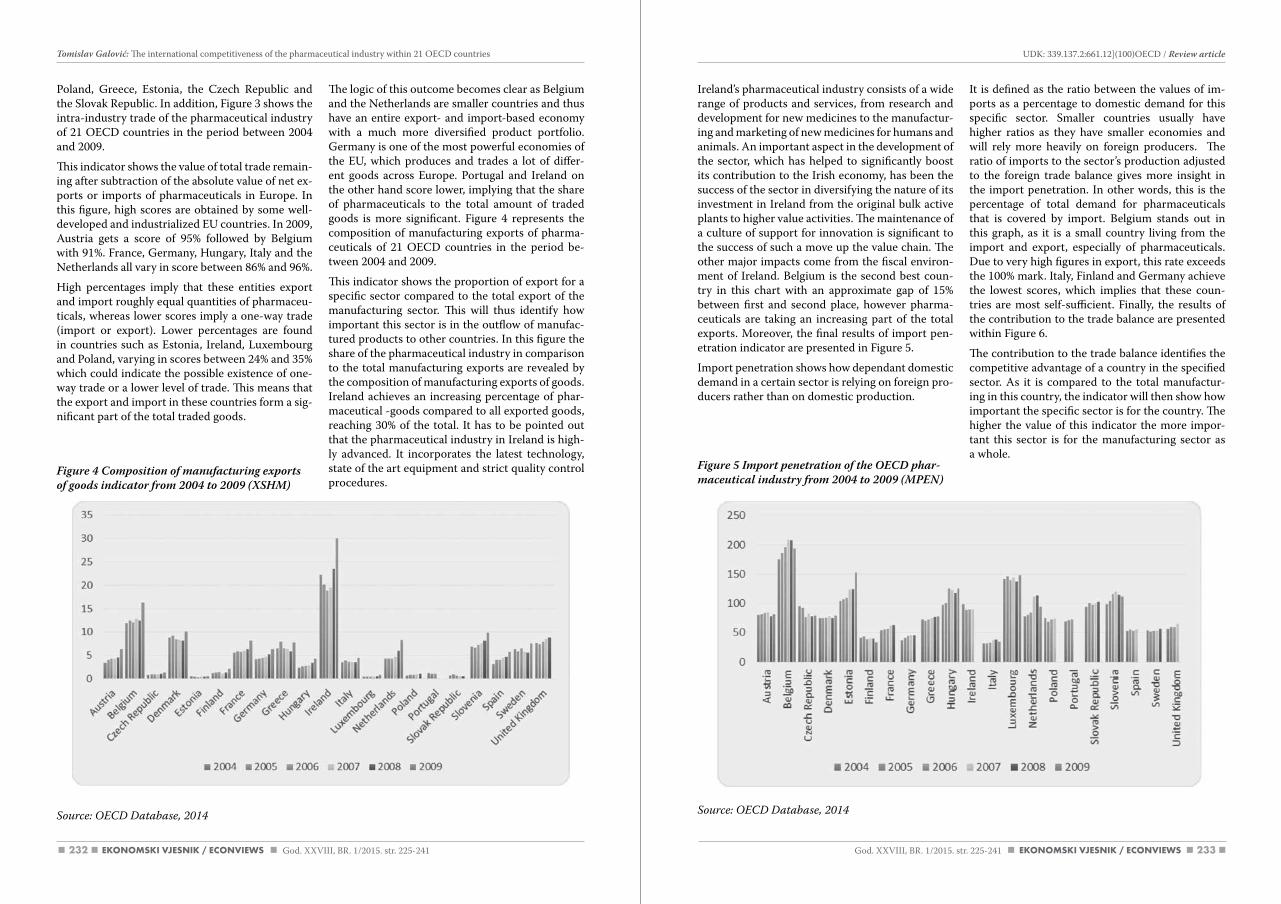
232 233
Ireland’s pharmaceutical industry consists of a wide range of products and services, from research and development for new medicines to the manufactur-ing and marketing of new medicines for humans and animals. An important aspect in the development of the sector, which has helped to significantly boost its contribution to the Irish economy, has been the success of the sector in diversifying the nature of its investment in Ireland from the original bulk active plants to higher value activities. The maintenance of a culture of support for innovation is significant to the success of such a move up the value chain. The other major impacts come from the fiscal environ-ment of Ireland. Belgium is the second best coun-try in this chart with an approximate gap of 15% between first and second place, however pharma-ceuticals are taking an increasing part of the total exports. Moreover, the final results of import pen-etration indicator are presented in Figure 5.
Import penetration shows how dependant domestic demand in a certain sector is relying on foreign pro-ducers rather than on domestic production.
Figure 5 Import penetration of the OECD phar-maceutical industry from 2004 to 2009 (MPEN)
Source: OEcd database, 2014
It is defined as the ratio between the values of im-ports as a percentage to domestic demand for this specific sector. Smaller countries usually have higher ratios as they have smaller economies and will rely more heavily on foreign producers. The ratio of imports to the sector’s production adjusted to the foreign trade balance gives more insight in the import penetration. In other words, this is the percentage of total demand for pharmaceuticals that is covered by import. Belgium stands out in this graph, as it is a small country living from the import and export, especially of pharmaceuticals. Due to very high figures in export, this rate exceeds the 100% mark. Italy, Finland and Germany achieve the lowest scores, which implies that these coun-tries are most self-sufficient. Finally, the results of the contribution to the trade balance are presented within Figure 6.
The contribution to the trade balance identifies the competitive advantage of a country in the specified sector. As it is compared to the total manufactur-ing in this country, the indicator will then show how important the specific sector is for the country. The higher the value of this indicator the more impor-tant this sector is for the manufacturing sector as a whole.
Poland, Greece, Estonia, the Czech Republic and the Slovak Republic. In addition, Figure 3 shows the intra-industry trade of the pharmaceutical industry of 21 OECD countries in the period between 2004 and 2009.
This indicator shows the value of total trade remain-ing after subtraction of the absolute value of net ex-ports or imports of pharmaceuticals in Europe. In this figure, high scores are obtained by some well-developed and industrialized EU countries. In 2009, Austria gets a score of 95% followed by Belgium with 91%. France, Germany, Hungary, Italy and the Netherlands all vary in score between 86% and 96%.
High percentages imply that these entities export and import roughly equal quantities of pharmaceu-ticals, whereas lower scores imply a one-way trade (import or export). Lower percentages are found in countries such as Estonia, Ireland, Luxembourg and Poland, varying in scores between 24% and 35% which could indicate the possible existence of one-way trade or a lower level of trade. This means that the export and import in these countries form a sig-nificant part of the total traded goods.
Figure 4 Composition of manufacturing exports of goods indicator from 2004 to 2009 (XSHM)
Source: OEcd database, 2014
The logic of this outcome becomes clear as Belgium and the Netherlands are smaller countries and thus have an entire export- and import-based economy with a much more diversified product portfolio. Germany is one of the most powerful economies of the EU, which produces and trades a lot of differ-ent goods across Europe. Portugal and Ireland on the other hand score lower, implying that the share of pharmaceuticals to the total amount of traded goods is more significant. Figure 4 represents the composition of manufacturing exports of pharma-ceuticals of 21 OECD countries in the period be-tween 2004 and 2009.
This indicator shows the proportion of export for a specific sector compared to the total export of the manufacturing sector. This will thus identify how important this sector is in the outflow of manufac-tured products to other countries. In this figure the share of the pharmaceutical industry in comparison to the total manufacturing exports are revealed by the composition of manufacturing exports of goods. Ireland achieves an increasing percentage of phar-maceutical -goods compared to all exported goods, reaching 30% of the total. It has to be pointed out that the pharmaceutical industry in Ireland is high-ly advanced. It incorporates the latest technology, state of the art equipment and strict quality control procedures.
God. XXVIII, BR. 1/2015. str. 225-241 God. XXVIII, BR. 1/2015. str. 225-241
UDK: 339.137.2:661.12](100)OECD / Review articleTomislav Galović: The international competitiveness of the pharmaceutical industry within 21 OECD countries
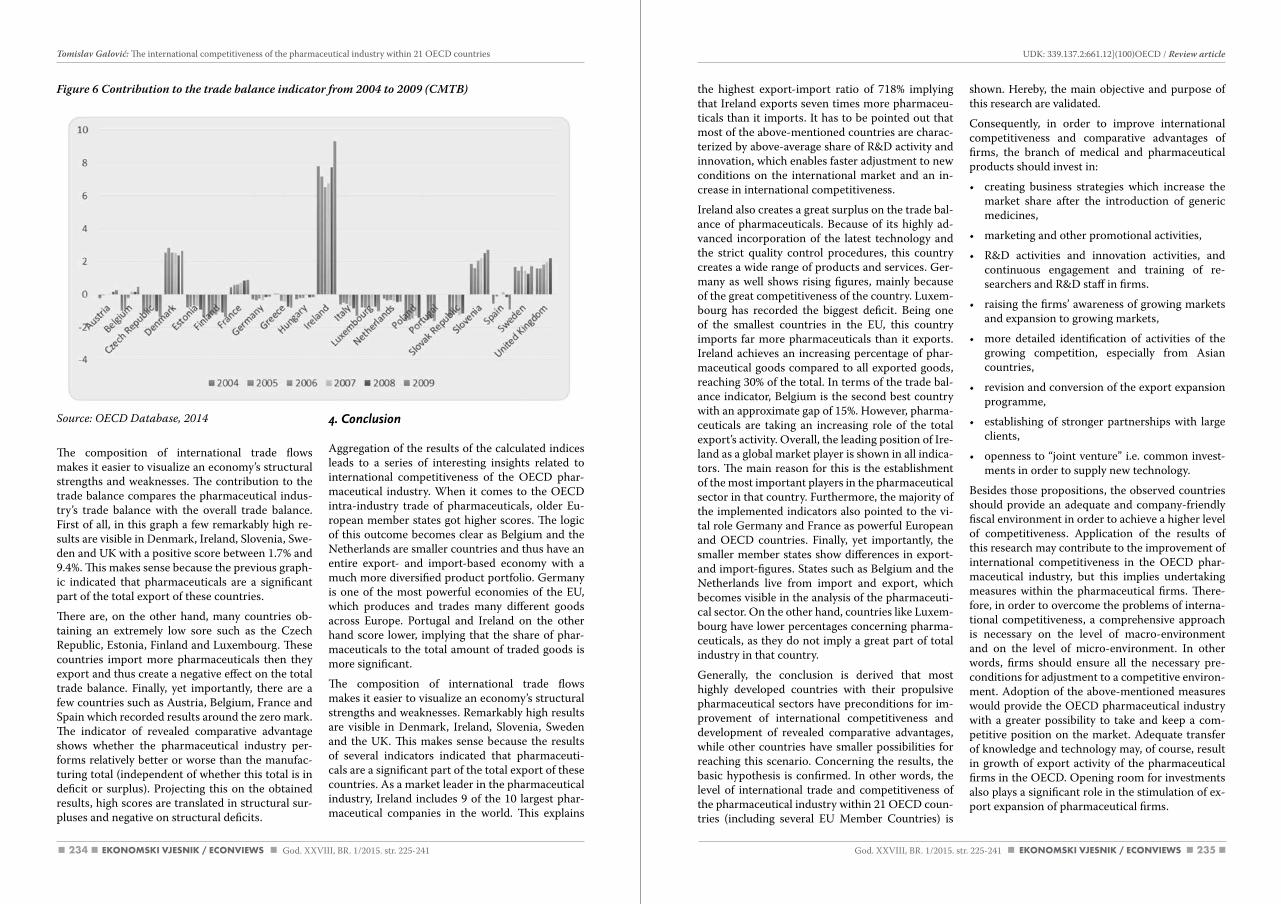
234 235
the highest export-import ratio of 718% implying that Ireland exports seven times more pharmaceu-ticals than it imports. It has to be pointed out that most of the above-mentioned countries are charac-terized by above-average share of R&D activity and innovation, which enables faster adjustment to new conditions on the international market and an in-crease in international competitiveness.
Ireland also creates a great surplus on the trade bal-ance of pharmaceuticals. Because of its highly ad-vanced incorporation of the latest technology and the strict quality control procedures, this country creates a wide range of products and services. Ger-many as well shows rising figures, mainly because of the great competitiveness of the country. Luxem-bourg has recorded the biggest deficit. Being one of the smallest countries in the EU, this country imports far more pharmaceuticals than it exports. Ireland achieves an increasing percentage of phar-maceutical goods compared to all exported goods, reaching 30% of the total. In terms of the trade bal-ance indicator, Belgium is the second best country with an approximate gap of 15%. However, pharma-ceuticals are taking an increasing role of the total export’s activity. Overall, the leading position of Ire-land as a global market player is shown in all indica-tors. The main reason for this is the establishment of the most important players in the pharmaceutical sector in that country. Furthermore, the majority of the implemented indicators also pointed to the vi-tal role Germany and France as powerful European and OECD countries. Finally, yet importantly, the smaller member states show differences in export- and import-figures. States such as Belgium and the Netherlands live from import and export, which becomes visible in the analysis of the pharmaceuti-cal sector. On the other hand, countries like Luxem-bourg have lower percentages concerning pharma-ceuticals, as they do not imply a great part of total industry in that country.
Generally, the conclusion is derived that most highly developed countries with their propulsive pharmaceutical sectors have preconditions for im-provement of international competitiveness and development of revealed comparative advantages, while other countries have smaller possibilities for reaching this scenario. Concerning the results, the basic hypothesis is confirmed. In other words, the level of international trade and competitiveness of the pharmaceutical industry within 21 OECD coun-tries (including several EU Member Countries) is
shown. Hereby, the main objective and purpose of this research are validated.
Consequently, in order to improve international competitiveness and comparative advantages of firms, the branch of medical and pharmaceutical products should invest in:
• creating business strategies which increase the market share after the introduction of generic medicines,
• marketing and other promotional activities,
• R&D activities and innovation activities, and continuous engagement and training of re-searchers and R&D staff in firms.
• raising the firms’ awareness of growing markets and expansion to growing markets,
• more detailed identification of activities of the growing competition, especially from Asian countries,
• revision and conversion of the export expansion programme,
• establishing of stronger partnerships with large clients,
• openness to “joint venture” i.e. common invest-ments in order to supply new technology.
Besides those propositions, the observed countries should provide an adequate and company-friendly fiscal environment in order to achieve a higher level of competitiveness. Application of the results of this research may contribute to the improvement of international competitiveness in the OECD phar-maceutical industry, but this implies undertaking measures within the pharmaceutical firms. There-fore, in order to overcome the problems of interna-tional competitiveness, a comprehensive approach is necessary on the level of macro-environment and on the level of micro-environment. In other words, firms should ensure all the necessary pre-conditions for adjustment to a competitive environ-ment. Adoption of the above-mentioned measures would provide the OECD pharmaceutical industry with a greater possibility to take and keep a com-petitive position on the market. Adequate transfer of knowledge and technology may, of course, result in growth of export activity of the pharmaceutical firms in the OECD. Opening room for investments also plays a significant role in the stimulation of ex-port expansion of pharmaceutical firms.
Source: OEcd database, 2014
The composition of international trade flows makes it easier to visualize an economy’s structural strengths and weaknesses. The contribution to the trade balance compares the pharmaceutical indus-try’s trade balance with the overall trade balance. First of all, in this graph a few remarkably high re-sults are visible in Denmark, Ireland, Slovenia, Swe-den and UK with a positive score between 1.7% and 9.4%. This makes sense because the previous graph-ic indicated that pharmaceuticals are a significant part of the total export of these countries.
There are, on the other hand, many countries ob-taining an extremely low sore such as the Czech Republic, Estonia, Finland and Luxembourg. These countries import more pharmaceuticals then they export and thus create a negative effect on the total trade balance. Finally, yet importantly, there are a few countries such as Austria, Belgium, France and Spain which recorded results around the zero mark. The indicator of revealed comparative advantage shows whether the pharmaceutical industry per-forms relatively better or worse than the manufac-turing total (independent of whether this total is in deficit or surplus). Projecting this on the obtained results, high scores are translated in structural sur-pluses and negative on structural deficits.
4. Conclusion
Aggregation of the results of the calculated indices leads to a series of interesting insights related to international competitiveness of the OECD phar-maceutical industry. When it comes to the OECD intra-industry trade of pharmaceuticals, older Eu-ropean member states got higher scores. The logic of this outcome becomes clear as Belgium and the Netherlands are smaller countries and thus have an entire export- and import-based economy with a much more diversified product portfolio. Germany is one of the most powerful economies of the EU, which produces and trades many different goods across Europe. Portugal and Ireland on the other hand score lower, implying that the share of phar-maceuticals to the total amount of traded goods is more significant.
The composition of international trade flows makes it easier to visualize an economy’s structural strengths and weaknesses. Remarkably high results are visible in Denmark, Ireland, Slovenia, Sweden and the UK. This makes sense because the results of several indicators indicated that pharmaceuti-cals are a significant part of the total export of these countries. As a market leader in the pharmaceutical industry, Ireland includes 9 of the 10 largest phar-maceutical companies in the world. This explains
Figure 6 Contribution to the trade balance indicator from 2004 to 2009 (CMTB)
God. XXVIII, BR. 1/2015. str. 225-241 God. XXVIII, BR. 1/2015. str. 225-241
UDK: 339.137.2:661.12](100)OECD / Review articleTomislav Galović: The international competitiveness of the pharmaceutical industry within 21 OECD countries
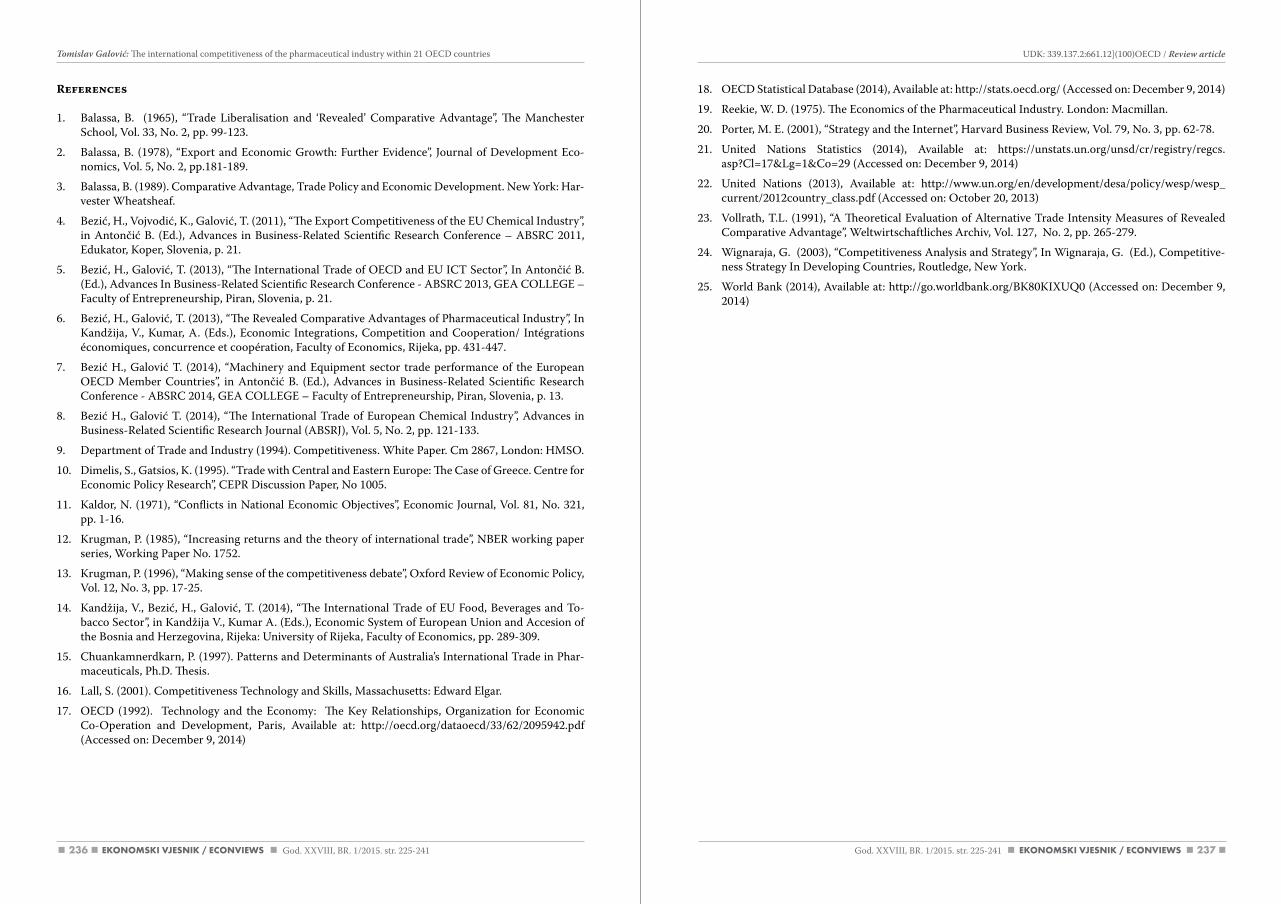
236 237
18. OECD Statistical Database (2014), Available at: http://stats.oecd.org/ (Accessed on: December 9, 2014)
19. Reekie, W. D. (1975). The Economics of the Pharmaceutical Industry. London: Macmillan.
20. Porter, M. E. (2001), “Strategy and the Internet”, Harvard Business Review, Vol. 79, No. 3, pp. 62-78.
21. United Nations Statistics (2014), Available at: https://unstats.un.org/unsd/cr/registry/regcs.asp?Cl=17&Lg=1&Co=29 (Accessed on: December 9, 2014)
22. United Nations (2013), Available at: http://www.un.org/en/development/desa/policy/wesp/wesp_current/2012country_class.pdf (Accessed on: October 20, 2013)
23. Vollrath, T.L. (1991), “A Theoretical Evaluation of Alternative Trade Intensity Measures of Revealed Comparative Advantage”, Weltwirtschaftliches Archiv, Vol. 127, No. 2, pp. 265-279.
24. Wignaraja, G. (2003), “Competitiveness Analysis and Strategy”, In Wignaraja, G. (Ed.), Competitive-ness Strategy In Developing Countries, Routledge, New York.
25. World Bank (2014), Available at: http://go.worldbank.org/BK80KIXUQ0 (Accessed on: December 9, 2014)
References
1. Balassa, B. (1965), “Trade Liberalisation and ‘Revealed’ Comparative Advantage”, The Manchester School, Vol. 33, No. 2, pp. 99-123.
2. Balassa, B. (1978), “Export and Economic Growth: Further Evidence”, Journal of Development Eco-nomics, Vol. 5, No. 2, pp.181-189.
3. Balassa, B. (1989). Comparative Advantage, Trade Policy and Economic Development. New York: Har-vester Wheatsheaf.
4. Bezić, H., Vojvodić, K., Galović, T. (2011), “The Export Competitiveness of the EU Chemical Industry”, in Antončić B. (Ed.), Advances in Business-Related Scientific Research Conference – ABSRC 2011, Edukator, Koper, Slovenia, p. 21.
5. Bezić, H., Galović, T. (2013), “The International Trade of OECD and EU ICT Sector”, In Antončić B. (Ed.), Advances In Business-Related Scientific Research Conference - ABSRC 2013, GEA COLLEGE – Faculty of Entrepreneurship, Piran, Slovenia, p. 21.
6. Bezić, H., Galović, T. (2013), “The Revealed Comparative Advantages of Pharmaceutical Industry”, In Kandžija, V., Kumar, A. (Eds.), Economic Integrations, Competition and Cooperation/ Intégrations économiques, concurrence et coopération, Faculty of Economics, Rijeka, pp. 431-447.
7. Bezić H., Galović T. (2014), “Machinery and Equipment sector trade performance of the European OECD Member Countries”, in Antončić B. (Ed.), Advances in Business-Related Scientific Research Conference - ABSRC 2014, GEA COLLEGE – Faculty of Entrepreneurship, Piran, Slovenia, p. 13.
8. Bezić H., Galović T. (2014), “The International Trade of European Chemical Industry”, Advances in Business-Related Scientific Research Journal (ABSRJ), Vol. 5, No. 2, pp. 121-133.
9. Department of Trade and Industry (1994). Competitiveness. White Paper. Cm 2867, London: HMSO.
10. Dimelis, S., Gatsios, K. (1995). “Trade with Central and Eastern Europe: The Case of Greece. Centre for Economic Policy Research”, CEPR Discussion Paper, No 1005.
11. Kaldor, N. (1971), “Conflicts in National Economic Objectives”, Economic Journal, Vol. 81, No. 321, pp. 1-16.
12. Krugman, P. (1985), “Increasing returns and the theory of international trade”, NBER working paper series, Working Paper No. 1752.
13. Krugman, P. (1996), “Making sense of the competitiveness debate”, Oxford Review of Economic Policy, Vol. 12, No. 3, pp. 17-25.
14. Kandžija, V., Bezić, H., Galović, T. (2014), “The International Trade of EU Food, Beverages and To-bacco Sector”, in Kandžija V., Kumar A. (Eds.), Economic System of European Union and Accesion of the Bosnia and Herzegovina, Rijeka: University of Rijeka, Faculty of Economics, pp. 289-309.
15. Chuankamnerdkarn, P. (1997). Patterns and Determinants of Australia’s International Trade in Phar-maceuticals, Ph.D. Thesis.
16. Lall, S. (2001). Competitiveness Technology and Skills, Massachusetts: Edward Elgar.
17. OECD (1992). Technology and the Economy: The Key Relationships, Organization for Economic Co-Operation and Development, Paris, Available at: http://oecd.org/dataoecd/33/62/2095942.pdf (Accessed on: December 9, 2014)
God. XXVIII, BR. 1/2015. str. 225-241 God. XXVIII, BR. 1/2015. str. 225-241
UDK: 339.137.2:661.12](100)OECD / Review articleTomislav Galović: The international competitiveness of the pharmaceutical industry within 21 OECD countries
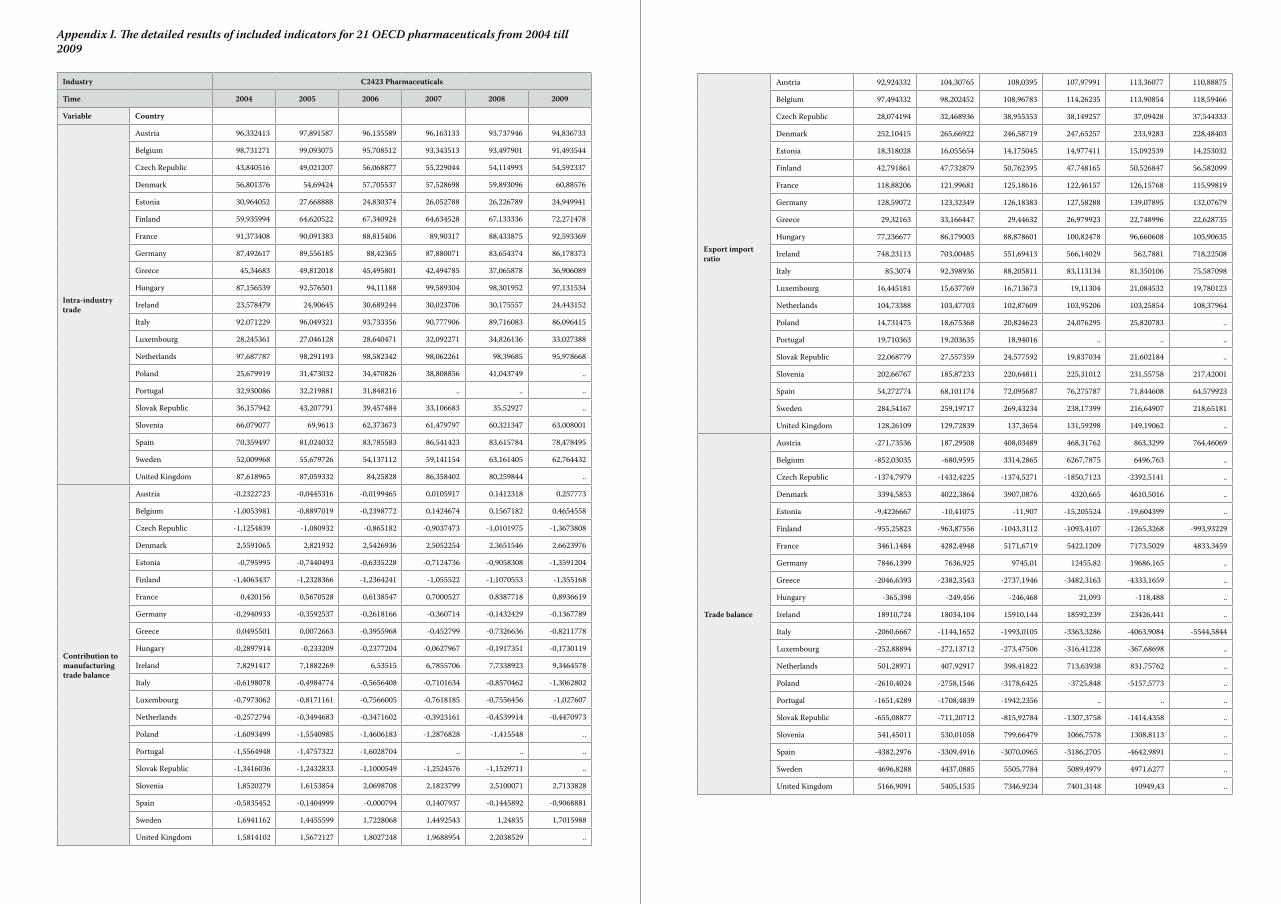
Export import ratio
Austria 92,924332 104,30765 108,0395 107,97991 113,36077 110,88875
Belgium 97,494332 98,202452 108,96783 114,26235 113,90854 118,59466
Czech Republic 28,074194 32,468936 38,955353 38,149257 37,09428 37,544333
Denmark 252,10415 265,66922 246,58719 247,65257 233,9283 228,48403
Estonia 18,318028 16,055654 14,175045 14,977411 15,092539 14,253032
Finland 42,791861 47,732879 50,762395 47,748165 50,526847 56,582099
France 118,88206 121,99681 125,18616 122,46157 126,15768 115,99819
Germany 128,59072 123,32349 126,18383 127,58288 139,07895 132,07679
Greece 29,32163 33,166447 29,44632 26,979923 22,748996 22,628735
Hungary 77,236677 86,179003 88,878601 100,82478 96,660608 105,90635
Ireland 748,23113 703,00485 551,69413 566,14029 562,7881 718,22508
Italy 85,3074 92,398936 88,205811 83,113134 81,350106 75,587098
Luxembourg 16,445181 15,637769 16,713673 19,11304 21,084532 19,780123
Netherlands 104,73388 103,47703 102,87609 103,95206 103,25854 108,37964
Poland 14,731475 18,675368 20,824623 24,076295 25,820783 ..
Portugal 19,710363 19,203635 18,94016 .. .. ..
Slovak Republic 22,068779 27,557359 24,577592 19,837034 21,602184 ..
Slovenia 202,66767 185,87233 220,64811 225,31012 231,55758 217,42001
Spain 54,272774 68,101174 72,095687 76,275787 71,844608 64,579923
Sweden 284,54167 259,19717 269,43234 238,17399 216,64907 218,65181
United Kingdom 128,26109 129,72839 137,3654 131,59298 149,19062 ..
Trade balance
Austria -271,73536 187,29508 408,03489 468,31762 863,3299 764,46069
Belgium -852,03035 -680,9595 3314,2865 6267,7875 6496,763 ..
Czech Republic -1374,7979 -1432,4225 -1374,5271 -1850,7123 -2392,5141 ..
Denmark 3394,5853 4022,3864 3907,0876 4320,665 4610,5016 ..
Estonia -9,4226667 -10,41075 -11,907 -15,205524 -19,604399 ..
Finland -955,25823 -963,87556 -1043,3112 -1093,4107 -1265,3268 -993,93229
France 3461,1484 4282,4948 5171,6719 5422,1209 7173,5029 4833,3459
Germany 7846,1399 7636,925 9745,01 12455,82 19686,165 ..
Greece -2046,6393 -2382,3543 -2737,1946 -3482,3163 -4333,1659 ..
Hungary -365,398 -249,456 -246,468 21,093 -118,488 ..
Ireland 18910,724 18034,104 15910,144 18592,239 23426,441 ..
Italy -2060,6667 -1144,1652 -1993,0105 -3363,3286 -4063,9084 -5544,5844
Luxembourg -252,88894 -272,13712 -273,47506 -316,41228 -367,68698 ..
Netherlands 501,28971 407,92917 398,41822 713,63938 831,75762 ..
Poland -2610,4024 -2758,1546 -3178,6425 -3725,848 -5157,5773 ..
Portugal -1651,4289 -1708,4839 -1942,2356 .. .. ..
Slovak Republic -655,08877 -711,20712 -815,92784 -1307,3758 -1414,4358 ..
Slovenia 541,45011 530,01058 799,66479 1066,7578 1308,8113 ..
Spain -4382,2976 -3309,4916 -3070,0965 -3186,2705 -4642,9891 ..
Sweden 4696,8288 4437,0885 5505,7784 5089,4979 4971,6277 ..
United Kingdom 5166,9091 5405,1535 7346,9234 7401,3148 10949,43 ..
Appendix I. The detailed results of included indicators for 21 OECD pharmaceuticals from 2004 till 2009
Industry C2423 Pharmaceuticals
Time 2004 2005 2006 2007 2008 2009
Variable Country
Intra-industry trade
Austria 96,332413 97,891587 96,135589 96,163133 93,737946 94,836733
Belgium 98,731271 99,093075 95,708512 93,343513 93,497901 91,493544
Czech Republic 43,840516 49,021207 56,068877 55,229044 54,114993 54,592337
Denmark 56,801376 54,69424 57,705537 57,528698 59,893096 60,88576
Estonia 30,964052 27,668888 24,830374 26,052788 26,226789 24,949941
Finland 59,935994 64,620522 67,340924 64,634528 67,133336 72,271478
France 91,373408 90,091383 88,815406 89,90317 88,433875 92,593369
Germany 87,492617 89,556185 88,42365 87,880071 83,654374 86,178373
Greece 45,34683 49,812018 45,495801 42,494785 37,065878 36,906089
Hungary 87,156539 92,576501 94,11188 99,589304 98,301952 97,131534
Ireland 23,578479 24,90645 30,689244 30,023706 30,175557 24,443152
Italy 92,071229 96,049321 93,733356 90,777906 89,716083 86,096415
Luxembourg 28,245361 27,046128 28,640471 32,092271 34,826136 33,027388
Netherlands 97,687787 98,291193 98,582342 98,062261 98,39685 95,978668
Poland 25,679919 31,473032 34,470826 38,808856 41,043749 ..
Portugal 32,930086 32,219881 31,848216 .. .. ..
Slovak Republic 36,157942 43,207791 39,457484 33,106683 35,52927 ..
Slovenia 66,079077 69,9613 62,373673 61,479797 60,321347 63,008001
Spain 70,359497 81,024032 83,785583 86,541423 83,615784 78,478495
Sweden 52,009968 55,679726 54,137112 59,141154 63,161405 62,764432
United Kingdom 87,618965 87,059332 84,25828 86,358402 80,259844 ..
Contribution to manufacturing trade balance
Austria -0,2322723 -0,0445316 -0,0199465 0,0105917 0,1412318 0,257773
Belgium -1,0053981 -0,8897019 -0,2398772 0,1424674 0,1567182 0,4654558
Czech Republic -1,1254839 -1,080932 -0,865182 -0,9037473 -1,0101975 -1,3673808
Denmark 2,5591065 2,821932 2,5426936 2,5052254 2,3651546 2,6623976
Estonia -0,795995 -0,7440493 -0,6335228 -0,7124736 -0,9058308 -1,3591204
Finland -1,4063437 -1,2328366 -1,2364241 -1,055522 -1,1070553 -1,355168
France 0,420156 0,5670528 0,6138547 0,7000527 0,8387718 0,8936619
Germany -0,2940933 -0,3592537 -0,2618166 -0,360714 -0,1432429 -0,1367789
Greece 0,0495501 0,0072663 -0,3955968 -0,452799 -0,7326636 -0,8211778
Hungary -0,2897914 -0,233209 -0,2377204 -0,0627967 -0,1917351 -0,1730119
Ireland 7,8291417 7,1882269 6,53515 6,7855706 7,7338923 9,3464578
Italy -0,6198078 -0,4984774 -0,5656408 -0,7101634 -0,8570462 -1,3062802
Luxembourg -0,7973062 -0,8171161 -0,7566005 -0,7618185 -0,7556456 -1,027607
Netherlands -0,2572794 -0,3494683 -0,3471602 -0,3923161 -0,4539914 -0,4470973
Poland -1,6093499 -1,5540985 -1,4606183 -1,2876828 -1,415548 ..
Portugal -1,5564948 -1,4757322 -1,6028704 .. .. ..
Slovak Republic -1,3416036 -1,2432833 -1,1000549 -1,2524576 -1,1529711 ..
Slovenia 1,8520279 1,6153854 2,0698708 2,1823799 2,5100071 2,7133828
Spain -0,5835452 -0,1404999 -0,000794 0,1407937 -0,1445892 -0,9068881
Sweden 1,6941162 1,4455599 1,7228068 1,4492543 1,24835 1,7015988
United Kingdom 1,5814102 1,5672127 1,8027248 1,9688954 2,2038529 ..
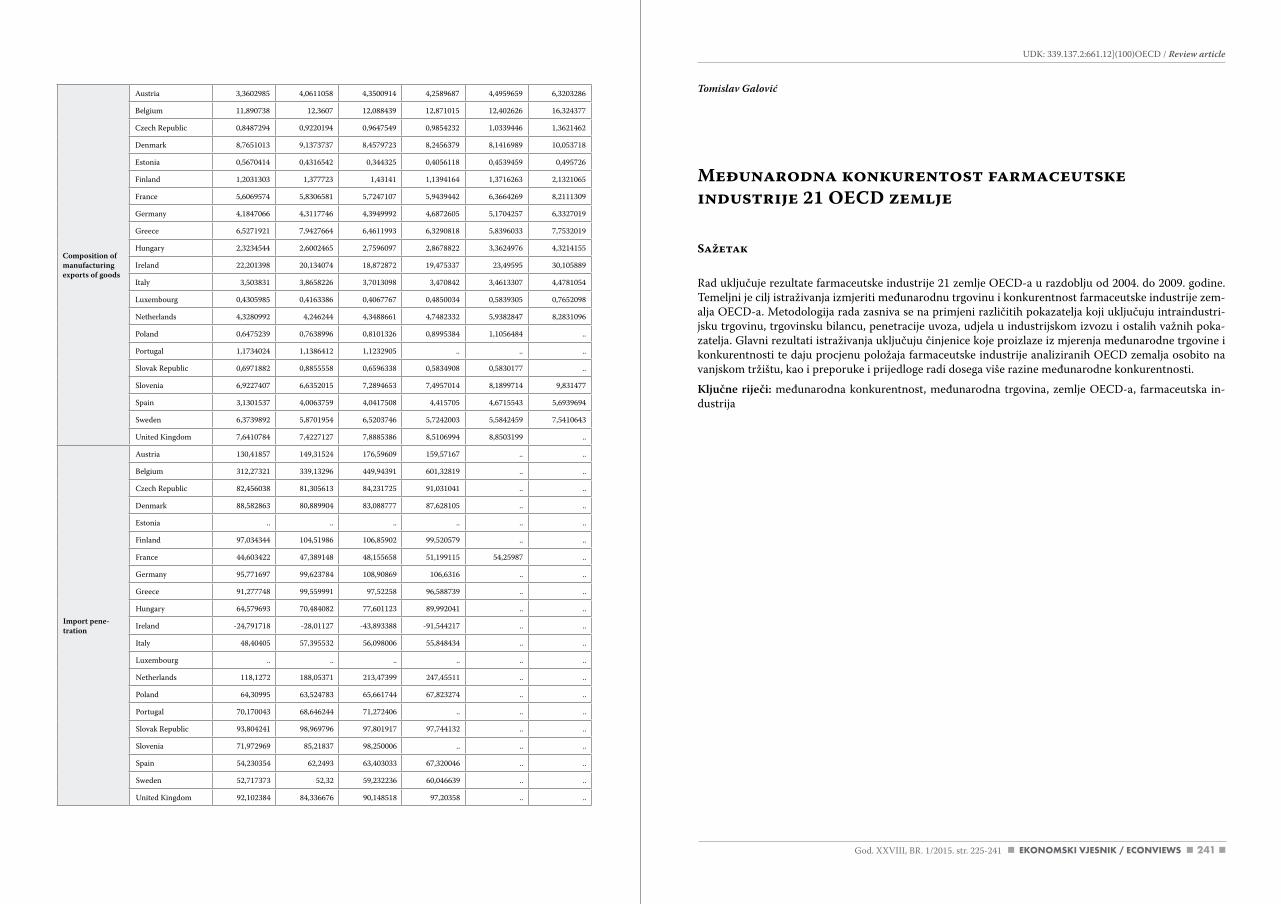
241
Tomislav Galović
Međunarodna konkurentost farmaceutske industrije 21 OECd zemlje
Sažetak
Rad uključuje rezultate farmaceutske industrije 21 zemlje OECD-a u razdoblju od 2004. do 2009. godine. Temeljni je cilj istraživanja izmjeriti međunarodnu trgovinu i konkurentnost farmaceutske industrije zem-alja OECD-a. Metodologija rada zasniva se na primjeni različitih pokazatelja koji uključuju intraindustri-jsku trgovinu, trgovinsku bilancu, penetracije uvoza, udjela u industrijskom izvozu i ostalih važnih poka-zatelja. Glavni rezultati istraživanja uključuju činjenice koje proizlaze iz mjerenja međunarodne trgovine i konkurentnosti te daju procjenu položaja farmaceutske industrije analiziranih OECD zemalja osobito na vanjskom tržištu, kao i preporuke i prijedloge radi dosega više razine međunarodne konkurentnosti.
Ključne riječi: međunarodna konkurentnost, međunarodna trgovina, zemlje OECD-a, farmaceutska in-dustrija
Composition of manufacturing exports of goods
Austria 3,3602985 4,0611058 4,3500914 4,2589687 4,4959659 6,3203286
Belgium 11,890738 12,3607 12,088439 12,871015 12,402626 16,324377
Czech Republic 0,8487294 0,9220194 0,9647549 0,9854232 1,0339446 1,3621462
Denmark 8,7651013 9,1373737 8,4579723 8,2456379 8,1416989 10,053718
Estonia 0,5670414 0,4316542 0,344325 0,4056118 0,4539459 0,495726
Finland 1,2031303 1,377723 1,43141 1,1394164 1,3716263 2,1321065
France 5,6069574 5,8306581 5,7247107 5,9439442 6,3664269 8,2111309
Germany 4,1847066 4,3117746 4,3949992 4,6872605 5,1704257 6,3327019
Greece 6,5271921 7,9427664 6,4611993 6,3290818 5,8396033 7,7532019
Hungary 2,3234544 2,6002465 2,7596097 2,8678822 3,3624976 4,3214155
Ireland 22,201398 20,134074 18,872872 19,475337 23,49595 30,105889
Italy 3,503831 3,8658226 3,7013098 3,470842 3,4613307 4,4781054
Luxembourg 0,4305985 0,4163386 0,4067767 0,4850034 0,5839305 0,7652098
Netherlands 4,3280992 4,246244 4,3488661 4,7482332 5,9382847 8,2831096
Poland 0,6475239 0,7638996 0,8101326 0,8995384 1,1056484 ..
Portugal 1,1734024 1,1386412 1,1232905 .. .. ..
Slovak Republic 0,6971882 0,8855558 0,6596338 0,5834908 0,5830177 ..
Slovenia 6,9227407 6,6352015 7,2894653 7,4957014 8,1899714 9,831477
Spain 3,1301537 4,0063759 4,0417508 4,415705 4,6715543 5,6939694
Sweden 6,3739892 5,8701954 6,5203746 5,7242003 5,5842459 7,5410643
United Kingdom 7,6410784 7,4227127 7,8885386 8,5106994 8,8503199 ..
Import pene-tration
Austria 130,41857 149,31524 176,59609 159,57167 .. ..
Belgium 312,27321 339,13296 449,94391 601,32819 .. ..
Czech Republic 82,456038 81,305613 84,231725 91,031041 .. ..
Denmark 88,582863 80,889904 83,088777 87,628105 .. ..
Estonia .. .. .. .. .. ..
Finland 97,034344 104,51986 106,85902 99,520579 .. ..
France 44,603422 47,389148 48,155658 51,199115 54,25987 ..
Germany 95,771697 99,623784 108,90869 106,6316 .. ..
Greece 91,277748 99,559991 97,52258 96,588739 .. ..
Hungary 64,579693 70,484082 77,601123 89,992041 .. ..
Ireland -24,791718 -28,01127 -43,893388 -91,544217 .. ..
Italy 48,40405 57,395532 56,098006 55,848434 .. ..
Luxembourg .. .. .. .. .. ..
Netherlands 118,1272 188,05371 213,47399 247,45511 .. ..
Poland 64,30995 63,524783 65,661744 67,823274 .. ..
Portugal 70,170043 68,646244 71,272406 .. .. ..
Slovak Republic 93,804241 98,969796 97,801917 97,744132 .. ..
Slovenia 71,972969 85,21837 98,250006 .. .. ..
Spain 54,230354 62,2493 63,403033 67,320046 .. ..
Sweden 52,717373 52,32 59,232236 60,046639 .. ..
United Kingdom 92,102384 84,336676 90,148518 97,20358 .. ..
God. XXVIII, BR. 1/2015. str. 225-241
UDK: 339.137.2:661.12](100)OECD / Review article
243God. XXVIII, BR. 1/2015. str. 243-256
Regina Moczadlo:Creating competitive advantages – The European CSR-strategy compared with Porter’s and Kramer’s Shared value approach
CREATING COMPETITIVE ADVANTAGES – THE EUROPEAN CSR-STRATEGY COMPARED WITH PORTER’S AND KRAMER’S SHARED VALUE APPROACH
UDK: 339.137.2:65.012.4](4-67)Review article
Received: February 11, 2015accepted for publishing: May 12, 2015
Regina MoczadloHochschule Pforzheim University Tiefenbronnerstr. 65 75175 Pforzheim, [email protected]: +497231286595
Abstract
In 2011 the European Commission changed the definition and strategy for corporate social responsibil-ity (CSR) with the creation of shared value as a core element of the new concept. In the same year Porter and Kramer published in the Harvard Business Review their approach of creating shared value (CSV) as a core element of long-term business strategies. The starting point of both approaches is the societal le-gitimation of enterprises to do business. The CSR respective CSV are evaluated to be a mean for reaching this legitimation and to further it to gain back the trust of the society that was lost during the financial crisis. This paper describes the two concepts and analyzes the similarities and differences. From the overall aim and intention, the EU concept has a wider focus and much higher requirements for enterprises. The European Commission assesses CSR as a measure for business to contribute to inclusive growth, employ-ment and well-being of the society. Hence, companies have to take into account that economic, social and environmental targets further include ethical human rights and consumer concerns when developing their long-term business strategy. The CSV of Porter and Kramer also goes beyond the pure business case of CSR because CSV also is defined as a long-term measure which has to be integrated systematically into the strategic core business of companies. The Commission sees the shareholders as just one common group of a company’s stakeholders and gives no preference to them. For Porter and Kramer the simultaneous creation of profit and societal value are decisive.
Keywords: Shared value creation, corporate social responsibility, European CSR policy
244 245God. XXVIII, BR. 1/2015. str. 243-256 God. XXVIII, BR. 1/2015. str. 243-256
UDK: 339.137.2:65.012.4](4-67) / Review article Regina Moczadlo:Creating competitive advantages – The European CSR-strategy compared with Porter’s and Kramer’s Shared value approach
• Gaining new customers through sustainable in-novations,
• Increasing sales of green products.
Nevertheless, the results about the influence of CSR on firm performance during the last two decades of empirical research are mixed. All has been shown: positive, negative and no relationship (Husted and Allen, 2007: 595; Perrini et al., 2011: 60).
For Windsor (2013: 1940), there is the question of whether there is convincing evidence for a strong negative influence of CSR on financial performance in multiple cases. Otherwise, she argues, it would make sense to follow CSR aims. She concludes that companies can generate more wealth by taking into account CSR than by irresponsible behavior. Barnett and Salomon (2012) however argue that it depends on the capability of firms to capitalize their social responsibility costs of whether it pays for them to be good or not.
Consumer demand for CSR depends on several factors. It is mostly a phenomenon of developed countries and influenced by the country’s economic stability. Furthermore, it increases with the educa-tional, social and financial status of the individual person (Claydon, 2011: 415). The empirical research by Peloza and Shang (2011: 126–127) shows that purchase decisions are mostly product related. Moreover, human responsibilities are a main pur-chasing factor. One study found that for customers, Caroll’s four dimensions are relevant in descending order: the economic, philanthropic, legal and ethi-cal orientation of companies and that these evalu-ations are influenced by culture; whereas another study found the ethical orientation as most relevant.
Within the scope of stakeholder management, a huge variety of divergent points of view have been expressed. Despite the fact that the importance of stakeholders can be traced back even to Adam Smith, the work of Freeman (1984) can be seen as the starting point for the ongoing discussions and developments in stakeholder theory (Ribeiro Sori-ano et al., 2011: 227).
Similar to the approaches of CSR, the inclusion or exclusion of stakeholder groups into strategic planning depends finally on the target function of the enterprise. Even if the overall aim still remains pure profit maximization - which is highly under discussion in theory and practice - it is necessary to identify the power and strategic importance of
stakeholders. It is shown in literature that powerful stakeholders are able to extract additional value and that strategically important stakeholders can cre-ate value for companies through reciprocity (Har-rison and Bosse, 2013: 321). Various stakeholder theories to identify and manage stakeholders and their different interests have been developed (see e.g. the summary in O’Riordan and Fairbrass, 2014: 122–124).
Within the stakeholder theories, two main kinds of stakeholder groups are differentiated. Primary stakeholders with direct and contractual relation-ships with the enterprise, like shareholders, cus-tomers, employees and suppliers, regulators and secondary stakeholders with non-contractual ties, but who may affect or be affected by the enterprise (Pesqueux and Damak‐Ayadi, 2005: 6). In the begin-ning stakeholder management was – comparable to the business case of CSR - seen as an instrument to gain economic success either directly through business transactions or indirectly by increasing trust, reputation, and cooperation or by reducing economic risk. The arguments given here are very similar to the business case of CSR. The focus shift-ed and today’s secondary stakeholder groups like non-governmental organizations (NGOs), media and government are also important for enterprises. Hörisch et al. (2014: 329), referring to Freeman (1984: 25) and Freeman et al. (2010: 9), define there-fore stakeholders “… as ‘those groups and individu-als who can affect or be affected’ by the actions con-nected to value creation and trade.”
Most kinds of normative stakeholder theories are based on the social relationship between enterpris-es and the respective community or society (Crane and Ruebottom, 2011: 79). Companies here have a moral duty towards their stakeholders (O’Riordan and Fairbrass, 2014: 123).
Freeman et al. (2007: 309-313) discuss the ques-tion of who in the competition of interests is the dominant group and go on describing the priorities different authors have. This is the state for Keynes, laborers for Marx, the rights of the management for Berle and Means and investors for Friedman. They develop six principles for capitalism, amongst them the principle of continuous creation of value in co-operation with stakeholders. “Business should be about the best that we can create together, rather than about avoiding the worst” (Freeman et al., 2007: 313). Hence enterprises should not focus on a dominant group. Rather they should include
1. Introduction
What the various definitions one can find for cor-porate social responsibility (CSR) have in common is that most of them refer to the triple bottom line approach of Elkington (1997) that focuses on the simultaneous consideration of economic, environ-mental and social goals. Various stakeholder groups expect from companies to go beyond economic targets and include sustainability aims in their busi-ness strategy. Hereby business is confronted with partly contradictorily perceptions.
Due to the fact that enterprises have leeway in decision-making about their impact on the society and the environment, they are also held responsi-ble for the results of their decisions. Ignoring the expected CSR obligations can lead to threats like e.g. image losses, negative reports in the media or customer boycotts with negative consequences for the economic performance. Hence it is also in the interest of shareholders that managers fulfill basic CSR targets at least in the sense of risk management (Calabrese et al., 2013: 51; Friedman, 1970: 177). On the other hand, companies can gain competitive ad-vantages while fulfilling the environmental and so-cial bottom line and thereby gain competitiveness.
In 2011 the European Commission changed the definition of corporate social responsibility (CSR). According to the new definition, the creation of shared value (CSV) is a core element for companies with their owners and shareholders respectively, as well as for other stakeholders and the society. The commission further evaluates strategic CSR as an important mean for the competitiveness of compa-nies (European Commission, 2011: 3–4).
Also in 2011, Porter and Kramer published a paper in the Harvard Business Review with the title ‘Cre-ating Shared Value’ (CSV). The authors point out the development of a new strategic business con-cept that is able to simultaneously create economic and societal value and increase the competitiveness of companies.
While the European Commission sees CSR as a driving concept, Porter and Kramer differentiate CSV from CSR. Hence the question about the com-mon ground and differences of both concepts aris-es. This analysis further shows the consequences both approaches might have for the development of business strategies.
The paper proceeds as follows: Chapter 2 describes
the methodology. For analyzing both approaches, a content analysis is used. Core elements of both concepts are CSR respective CSV and stakehold-ers. Therefore chapter 3 gives a brief overview about CSR and stakeholder management. Chapter 4 describes the CSR concept of the EU from 2011. Chapter 5 introduces the CSV concept of Porter and Kramer. In chapter 6 the two approaches are com-pared and discussed. Here the main commonalities and differences are shown. In chapter 7 the paper ends with a discussion and raises open questions.
2. CSR and stakeholders
Carroll (1991: 43) points out: “There is a natural fit between the idea of corporate social responsibility and an organization’s stakeholders.” Nonetheless, he states the word social might be too vague and there-fore it has to be specified to whom the enterprise is responsible. Hence the question occurs who are the stakeholders that the companies should aim at and how these stakeholders should be part of the companies’ activities.
Hence, the CSR and the stakeholder theory are in-terconnected. While the CSR theory has the aim to define the responsibilities that the enterprises are expected to fulfill, the stakeholder theory address the social groups that companies are expected to take into account in their decisions (Jamali, 2008: 228).
In their literature review, Peloza and Shang (2011: 120–121) found philanthropy to be the dominant motivation for CSR followed by the business case and mixed strategies.
The CSR can be a mean for companies to gain com-petitiveness (e.g. Husted and Allen, 2007: 598–599; Reefke and Trocchi, 2013: 806; Weber, 2008: 248–251). Competitiveness increase can evolve by:
• Positive effects on the image and reputation of a company,
• Increasing employee’s motivation and intention, further advantages in the phase of recruitment,
• Access to capital of investors who are sensitive in respect of sustainable behavior,
• Cost savings and efficiency gains especially from the environmental bottom line, e.g. energy, wa-ter and/or waste savings,
246 247
not mentioned any longer. Instead, the Commis-sion expanded the scope of CSR to an integration of CSR into the core business of companies. The Eu-ropean Commission (2011: 3) does not differentiate between philanthropic and strategic CSR and de-scribes the value of CSR for companies as follows: “A strategic approach to CSR is increasingly important to the competitiveness of enterprises. It can bring benefits in terms of risk management, cost savings, access to capital, customer relationships, human resource management, and innovation capacity.” In cooperation with their stakeholders companies therefore should create a strategic management process that involves “… social, environmental, ethi-cal human rights and consumer concerns.” (Euro-pean Commission, 2011: 6). Hence the aim of such processes is the maximization of shared value for all three target groups alike: shareholders, other stake-holders and the society. Further, companies should identify, prevent and mitigate their unfavorable impact on these target groups. With this new ap-proach, the CSR has definitely a higher significance for business because it fully overlaps with the core business (Brunn et al., 2013: 6).
The compliance of applicable legislation as well as collective agreements between social partners are seen as prerequisites for CSR. The Commission re-quest especially large companies with a more formal approach to CSR to follow international standards and guidelines. Here, the Commission refers to the OECD Guidelines for Multinational Enterprises, the ten principles of the United Nations Global Compact, the ISO 26000 Guidance Standard on So-cial Responsibility, the ILO Tripartite Declaration of Principles Concerning Multinational Enterpris-es and Social Policy, as well as the United Nations Guiding Principles on Business and Human Rights.
The Commission encourages companies to apply a long-term strategic CSR that contributes to societal wellbeing. Companies should develop innovative goods of higher quality and provide more produc-tive jobs. The European Commission (2011: 7) de-scribes the multidimensional nature of CSR and dif-ferentiates three areas of activities that companies should consider. The first includes four different topics which companies have to apply; therefore, these topics can be evaluated as core requirements, followed by the so-called further parts by cross-cutting issues.
1. Core requirements:
- Human rights,
- Labor and employment practices like train-ing, diversity, gender equality and employ-ee health and well-being,
- Environmental issues like biodiversity, cli-mate change, resource efficiency, life-cycle assessment and pollution prevention,
- Combating bribery and corruption.
2. Further parts:
- Community involvement and develop-ment,
- Integration of disabled persons,
- Consumer interests, including privacy.
3. Cross-cutting issues:
- Promotion of social and environmental re-sponsibility through the supply-chain,
- Disclosure of non-financial information.
Furthermore, the European Commission (2011: 3–9) evaluates CSR as a basis for sustainability and an important contribution for businesses to build up long-term trust between them and important stakeholders like employees, consumers and citi-zens. The Commission points out that all organiza-tions, businesses, governments and the EU itself, needs the trust of the citizens and argues further that the social consequences of the economic cri-sis have seriously lowered the trust in business. The public attention now focuses on sustainable and re-sponsible business behavior as well as durable em-ployment generation. The Commission diagnoses a gap between these expectations of citizens and their perceived business reality. The reason therefore is seen in the irresponsible behavior of some compa-nies regarding environmental and social issues.
The European Commission (2011: 7) also defines the role of public authorities. Companies them-selves are seen as the ones who should lead the de-velopment of long term CSR strategies supported by public authorities through a mix of regulations and voluntary policy measures, e.g. incentives for responsible business conduct. Public authorities should give enough flexibility to business to inno-vate and develop CSR strategies according to their specific circumstances. Concrete recommendations for activities are not given, which fits in with the ap-proach of flexibility. Action plans and strategies are
mutual stakeholders’ interests. Hörisch et al. (2014: 336–340) therefore propose a model of stakeholder interactions based on the value of sustainability.
A successful business strategy including CSR meas-ures and stakeholders’ involvement has to comprise transparency and an effective communication as core elements. According to their transparency atti-tude, Lahme and Klenk (2013: 158–159) differenti-ate three types of companies:
1. Companies just fulfilling their legal reporting obligations,
2. Followers who see transparency as important and who are partly transparent,
3. Convinced companies that integrate transpar-ency into their business strategy and equity sto-ry and are already in an open dialog with their stakeholders.
For them most Dax-30 and Fortune-500 companies can be characterized as the second type. Within the EU one can find a high diversity between the CSR policies of the EU states. Leading regions are Scan-dinavia, the Anglo-Saxon region and Central Eu-rope, while many Eastern European states have yet not developed national CSR strategies (Martinuzzi et al., 2011: 35–99).
All in all, one can conclude that literature is not giv-ing a conclusive picture about the consequences of CSR and stakeholder measures for enterprises.
3. Methodology
A qualitative content analysis method is used. This method aims at the understanding of a text while analyzing the explicit and implicit content. The qualitative content analysis can be defined as a sub-jective interpretation of a text by a systematic classi-fication and the identification of themes (Hsieh and Shannon, 2005: 1277). It is no standardized instru-ment and has to “…be fitted to suit the particular object or material in question and constructed es-pecially for the issue at hand” (Mayring, 2014: 39). Therefore, it is important to work with a category system (Mayring, 2014: 40).
While analyzing both approaches of CSR it is nec-essary first of all to have a look at the motivation for introducing and, respectively, changing the view on CSR. The first category therefore is the “role
of business in society,” to see how both concepts evaluate the societal importance of business. Then the prerequisites for CSR have to be explained. Next, one has to look at the aims which should be reached through CSR. It is further of importance to know which societal groups are addressed by CSR because the inclusion or exclusion of stake-holder groups is essential for the strategic focus of business. Definitely, strategic orientation is an im-portant category because this is the basis of the re-quirements for business and shows the expectations the authors of both papers have about the business strategy and business behavior. Furthermore, these requirements are the parameters to evaluate busi-ness behavior. Moreover of interest is the division of functions between governments and business. Therefore, seven categories for analyzing the two texts are used:
• Role of business in society,
• Prerequisites for CSR,
• Aims,
• Stakeholders,
• Strategic orientation,
• Role of government.
In the first step the content of both concepts are an-alyzed separately. Then, the findings are compared to evaluate the common grounds and the differenc-es of the approaches.
4. The CSR strategy of the European Commission
With the revised definition of CSR in 2011, the Eu-ropean Commission aims to achieve a highly com-petitive social market economy where companies significantly contribute to sustainable development and inclusive growth. It is part of the Europe 2020 strategy. Until 2011, the European Commission fol-lowed the definition of CSR as “… a concept where-by companies integrate social and environmental concerns in their business operations and in their interaction with their stakeholders on a voluntary basis” (European Commission, 2011: 3). The core elements were ‘voluntariness’ and ‘beyond compli-ance’.
In the renewed EU strategy the Commission un-derlines the importance of CSR. Voluntariness is
God. XXVIII, BR. 1/2015. str. 243-256 God. XXVIII, BR. 1/2015. str. 243-256
UDK: 339.137.2:65.012.4](4-67) / Review article Regina Moczadlo:Creating competitive advantages – The European CSR-strategy compared with Porter’s and Kramer’s Shared value approach
248 249
These are further fields for shared value crea-tion. They explicitly name different issues “… natural resource and water use, health and safe-ty, working conditions, and equal treatment in the workplace” (Porter and Kramer, 2011: 66–67). They state that even without governmental regulation or resource taxes externalities can create internal costs. For illustration they use the example of excess product packaging. They list different fields where environmental or so-cial improvements serve both the company and the supply chain members.
3. Enabling local cluster development
Companies have various relations to other com-panies, suppliers, service providers, institu-tions and the communities they are working in. Also, they depend on infrastructure. Porter and Kramer see a variety of options for value crea-tion that only can be achieved in co-operation with theses partners.
Government regulations, under certain condi-tions, are evaluated to stimulate shared value creation of business by focusing on measurable social improvement and by setting:
- clear and measurable social goals,
- resource prices reflecting the real costs,
- performance standards without specifying how to achieve them, because these are com-petitive parameters,
- phase-in periods for meeting standards,
- universal measurement and performance-reporting systems, where governments are providing the infrastructure for benchmark-ing data,
- efficient and timely result reports instead of detailed and expensive compliance reports,
- regulations against behaviors that benefit business at the expense of the society.
Government regulations therefore might have a positive impact on CSV but should not be too re-strictive. Otherwise business might be delimited in the development of innovative and promising new CSV concepts.
6. Evaluation and comparison
• The European Commission’s strategy
In the new strategy of the Commission, CSR and shared value creation becomes the main aim of business. The former approach of voluntariness disappeared. CSR is seen as an important tool to redefine the purpose and the legitimation of business in the society. The Commission goes with the new definition definitively beyond the triple bottom line approach. Besides economic, social and environmental goals, companies have to include ethical human rights and consumer concerns into their long-term strategy. That widens the scope significantly (Martinuzzi et al., 2011: 21).
Shareholders are just one of the groups of diverse stakeholders. They have no particular position. Arguments like the one of Smith (2007: 191) that economic success both in the short and in the long run is a prerequisite for all other activities of companies because it builds the indispensable basis for all other activities are not mentioned. Roberts and Markley (2011: 1) criticize the sight of the European Commission as follows: “In this definition, a company is not really a business but rather an agency administering the distribution of ‘shared value’ to its ‘triple bottom line’ con-stituencies.”
Trust is an important element in the strategy of the Commission. They argue that business lost trust in the last economic crisis. According to Edelman’s Trust Barometer (Edelman, 2014), globally people have more trust in NGOs (64% of the respondents) than in business (58% of the respondents). Trust in business in general is lower in developed than in developing coun-tries and varies depending on industry sectors and the location of the headquarters. Nonethe-less, business is in the second place in this survey whereas trust in media and especially in govern-ments not only decreases but more than half of the respondents distrust their governments.
Roberts and Markley (2011: 3) remark “that pri-vate companies become ‘responsible’ only by meeting codes such as ISO 26000 and must be thrust into a quasi-governmental role in order to address challenges facing modern society. However, not only do companies already provide many valuable benefits to peoples and socie-
part of the CSR public policies. According to Mul-lerat (2013: 16), the CSR policy framework can ei-ther be implicit, made up by institutions supporting CSR indirectly or explicit, consisting of institutions aiming at CSR. The latter are responsible for de-signing a strategic and consistent approach to CSR. Further, government contracting should follow new developed and implemented government procure-ment directives that include CSR measures of com-panies (Roberts and Markley, 2011: 2).
Summarizing one can state that the shared value concept of the European Commission goes far be-yond the three sides of the triple bottom line of Elk-ington to which many definitions of CSR refer. But words like ‘economic success’, ‘yield’ or ‘profit’ are not even mentioned in the whole paper.
5. Porter’s and Kramer’s shared value concept
Likewise for Porter and Kramer (2011), the purpose of business has to be redefined. Instead of just fo-cusing on profit, companies have to create shared value (CSV) by considering societal needs in their managerial strategy.
Porter and Kramer (2011: 63) are persuaded that their concept of CSV will lead to a major trans-formation in business thinking and that it “…will drive the next wave of innovation and productivity growth in the global economy. It will also reshape capitalism and its relationship to society. Perhaps most important of all, learning how to create shared value is our best chance to legitimize business again.” (Porter and Kramer, 2011: 65).
Porter and Kramer (2011: 65–66) explicitly empha-size that their new concept is not social responsi-bility. They evaluate corporate social responsibility (CSR) initiatives as a reaction to the external pres-sure of stakeholders, as an instrument to improve the reputation of companies and state further com-panies would evaluate the costs involved as neces-sary expenses. For them the focus of this kind of CSR is a too narrow comprehension hence they dif-ferentiate CSV that focuses on both economic and societal yields.
The concept enjoys huge popularity in the business community. That might be the case because it was developed for and with senior managers of global players (Crane et al., 2014: 132). In 2014 the concept was a core topic at the World Economic Forum in
Davos (Ennes, 2014). Major global players like e.g. Nestlé, Wal-Mart or Coca-Cola are applying this concept under the consultancy of FSG (Porter and Kramer, 2011: 71), where Porter and Kramer are members of the Board of Directors.
The definition of CSV is clearly outlined. Both eco-nomic and social progress are quantified with value principles. Value itself is measured with the relation of benefits to costs; hence it follows the well-known definition of profit (revenues minus costs). Social enterprises should also aim at shared value, accord-ing to Porter and Kramer (2014: 71) a single aim, whether of social or of economic character, is not sufficient any longer.
Porter and Kramer (2011: 66–67) outline three ways of shared value creation:
1. Reconceiving products and markets
In this field the authors differentiate between developed and developing countries. In devel-oped countries they see new market opportuni-ties for products and services that meet societal needs. Their examples include fundamental needs like better nutrition or housing as well as special products for the aging population. Moreover, due to the concentrated purchasing power, underserved markets in poor urban ar-eas can deliver new business opportunities.
In developing countries they focus on the bot-tom of the pyramid. In this context, Porter and Kramer refer to Prahalad. Prahalad and Ham-mond (2002) pointed out the business oppor-tunities for multinational companies (MNC) selling products to the poor in developing countries. They evaluate these markets on the one hand, as a source of growth for MNC them-selves, on the other hand they state that, due to the increasing competition through MNC, the performance of these markets will increase. Hence, customers have advantages and enjoy higher quality products and/or better services than the ones delivered by international devel-opment agencies or national governments. The identification of societal needs, benefits and harm is seen as a prerequisite to develop prod-ucts and markets for shared value.
2. Redefining productivity in the value chain
Porter and Kramer refer to the correlation be-tween societal problems and economic costs.
God. XXVIII, BR. 1/2015. str. 243-256 God. XXVIII, BR. 1/2015. str. 243-256
UDK: 339.137.2:65.012.4](4-67) / Review article Regina Moczadlo:Creating competitive advantages – The European CSR-strategy compared with Porter’s and Kramer’s Shared value approach
250 251
Porter and Kramer recommend the application of strategic CSR where profit creation remains an important goal. A double bottom line of ei-ther economic and social or economic and en-vironmental value creation is sufficient to reach their understanding of CSV.
The Nestlé case given by Porter and Kramer il-lustrates the general differences in the perspec-tives of the two approaches. The authors high-light the social progress in the value chain of Nestlé’s Nespresso where the company has im-plemented various social benefits for their local coffee growers. “Nespresso combines a sophis-ticated espresso machine with single-cup alu-minum capsules containing ground coffees from around the world. Offering quality and conveni-ence, Nespresso has expanded the market for premium coffee” (Porter and Kramer, 2011: 69). It can be assumed that the environmental bot-tom line is not taken into account in this case, because aluminum capsules might have a higher negative environmental impact than paper pads or coffee filters.
When comparing several statements and ele-ments of both approaches one finds a lot of simi-larities. Both concepts emphasize shared value as the most important element in the business strategy and the responsiveness of business for societal needs. Furthermore, the compliance of applicable legislation as well as collective agree-ments between social partners are prerequisites for CSR. Also, in common is the persuasion that creating shared value leads to competitive ad-vances for companies. In this context, both ap-proaches point out the importance of the crea-tion of innovative goods of higher quality that serve societal needs.
Both concepts stress the significance of a sus-tainable supply chain that companies shall en-sure. Also common is the emphasis on the im-pact enterprises have for the communities they are working in.
Porter and Kramer keep these issues more gen-eral but they ask for governmental regulation in cases where businesses benefit at the expense of the society. This demand definitely goes in line with the core requirements of the Commission. Moreover, both refer to the relation between business and government, i.e. public authorities, and see an important role for governments to
establish a supportive framework for CSR. Both concepts highlight that business needs flexibility for the development of sustainable innovations and strategies for creating shared value. Public authorities should therefore support business and not overregulate. The European Commis-sion further stresses the responsibility of busi-ness for job creation and sustainable growth. For Porter and Kramer job creation and sustainable growth are results of CSV.
The biggest difference between the two ap-proaches is the importance they give to profit. Porter and Kramer define the term creating shared value with the relation of benefits to costs. For them profit creation definitively is one main aim of companies. They should simultaneously focus on both profit and societal gains. This can be doubted for the approach of the EU. Profit creation is not even mentioned. Shareholders are one equal group amongst the many stakeholders companies have.
Both approaches estimate to a great extent that economic and societal aims can be reached si-multaneously but ignore the established fact of conflicts in a multidimensional target function. It is the definitely the case that some CSR activi-ties simultaneously serve economic and societal targets, while others don’t. Husted and Allen (2007: 595) give in this context the example of General Motors that maintain pension commit-ments whereas their competitors do not have to fulfill such obligations. Several researchers on multiple objectives in the target function of com-panies show the problematics and impacts for involved managers (Pirson, 2012: 33). As pointed out in the introduction of this paper, it is well-known that there are not only conflicts between shareholders and other stakeholder groups but further trade-offs between the aims of different stakeholder groups themselves. Furthermore, agency conflicts can hardly be removed through governance by companies (see e.g. Crilly and Io-annou, 2014: 1).
The core contents of the two approaches are summarized in the following synopsis (see table 1). The structure follows the categories devel-oped in the methodology.
ties around the world, but the challenges facing modern society will be met only by effective and responsible government, a vibrant civil society, and a dynamic economy.”
• Porter’s and Kramer’s CSV
Pirson (2012: 32) points out that business in a broader sense always creates a shared value, and contractual relationships between companies and customers, suppliers and employee have to be beneficial for both sides; hence, “… the nov-elty of the argument [of Porter and Kramer] must lie in a substantial recalibration of social value and financial value creation.”
This is definitely the case in the approach of Porter and Kramer. They expect from all kinds of companies to integrate societal aims in their target function and their business strategy.
This evaluation is in line with Crane et al. (2014: 133) who critically analyze the concept of Por-ter and Kramer. They likewise highlight the fact that social goals are becoming elements of com-panies’ strategic management. Furthermore they emphasize that Porter and Kramer are able to persuade both managers and scholars, with what they call the Porter effect.
Indeed this fact should not be underestimated. It is important that leading managers of global players as well as of small and medium compa-nies discuss and apply CSR very seriously and beyond ‘green washing’ or ‘window dressing’, which is here defined in the understanding of e.g. Altenburger (2013: 2) where ‘green washing’ and ‘window dressing’ are CSR activities with a high public relation focus.
Moreover Crane et al. (2014: 133) emphasize the clear role that government has in this con-cept, and point out that the role of government normally gets little attention in CSR literature. As another advantage of the approach, they as-sess the attention Porter and Kramer give to the sustainable supply chain management. As weak-nesses they evaluate the approach of Porter and Kramer to be unoriginal, to ignore the tensions between social and economic goals, to be naive about the challenges of business compliance and the CSV to be based on a shallow conception of the role of business in the society. It is remark-able that Crane et al. on the one hand favors
the supply chain argumentation of Porter and Kramer despite the fact that a huge literature on sustainable supply chain management litera-ture already exists, while on the other hand, they criticize the originality of the approach. Without entering the discussion about originality, it is a merit of Porter and Kramer to bring CSV much closer to the business world.
Taking into account the examples Porter and Kramer (2011) list in their article, their under-standing of CSV seems to correspond in some respects with strategic CSR. Strategic CSR can be located in between strict compliance of giv-en rules and regulations and good corporate citizenship (Windsor, 2013: 1939). Nonetheless, CSV is going beyond the pure business case ap-proach of CSR because it requires integrating CSV into the core business and the long term strategic alignment of companies. It seems that the combination of business success with ei-ther environmental or societal aims is sufficient for creating shared value in the sense of Porter and Kramer. Pfitzer, Bockstette, Stamp, (2013, 1), FSG colleagues of Porter and Kramer, speak about twin goals as the next competitive frontier.
• Comparison
The two approaches have in common that they both redefine the role of business in the society. Profit maximization alone is not any longer suffi-cient for the legitimization of business. The CSR, i.e. the CSV, is evaluated as a long-term measure which has to be integrated into the strategic core business alignment of companies. Shared value creation is a way to combine business success with societal benefits.
From the overall aim, the concept of the Euro-pean Commission has a wider focus than the concept of Porter and Kramer. The core require-ments of the European Commission are clearly specified. For the European Commission it is the task of business to contribute to inclusive growth and the well-being of the society. CSR is a way to fulfill this task. Shareholder value is integrated and builds one part of shared value creation. Ob-viously the interests of owners, other stakeholder and the society are evaluated equally (Roberts and Markley, 2011: 1).
God. XXVIII, BR. 1/2015. str. 243-256 God. XXVIII, BR. 1/2015. str. 243-256
UDK: 339.137.2:65.012.4](4-67) / Review article Regina Moczadlo:Creating competitive advantages – The European CSR-strategy compared with Porter’s and Kramer’s Shared value approach
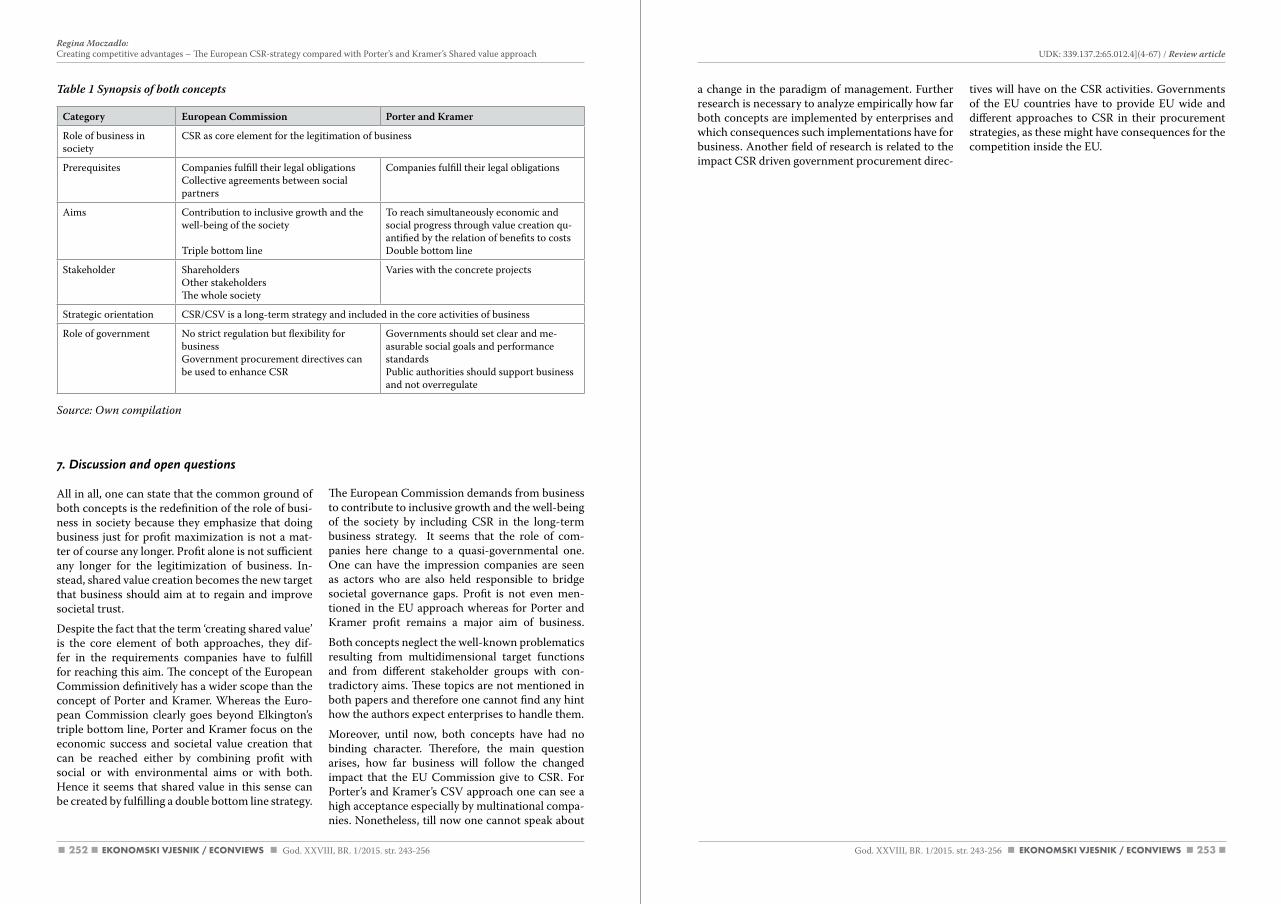
252 253
a change in the paradigm of management. Further research is necessary to analyze empirically how far both concepts are implemented by enterprises and which consequences such implementations have for business. Another field of research is related to the impact CSR driven government procurement direc-
tives will have on the CSR activities. Governments of the EU countries have to provide EU wide and different approaches to CSR in their procurement strategies, as these might have consequences for the competition inside the EU.
Source: Own compilation
7. Discussion and open questions
All in all, one can state that the common ground of both concepts is the redefinition of the role of busi-ness in society because they emphasize that doing business just for profit maximization is not a mat-ter of course any longer. Profit alone is not sufficient any longer for the legitimization of business. In-stead, shared value creation becomes the new target that business should aim at to regain and improve societal trust.
Despite the fact that the term ‘creating shared value’ is the core element of both approaches, they dif-fer in the requirements companies have to fulfill for reaching this aim. The concept of the European Commission definitively has a wider scope than the concept of Porter and Kramer. Whereas the Euro-pean Commission clearly goes beyond Elkington’s triple bottom line, Porter and Kramer focus on the economic success and societal value creation that can be reached either by combining profit with social or with environmental aims or with both. Hence it seems that shared value in this sense can be created by fulfilling a double bottom line strategy.
The European Commission demands from business to contribute to inclusive growth and the well-being of the society by including CSR in the long-term business strategy. It seems that the role of com-panies here change to a quasi-governmental one. One can have the impression companies are seen as actors who are also held responsible to bridge societal governance gaps. Profit is not even men-tioned in the EU approach whereas for Porter and Kramer profit remains a major aim of business.
Both concepts neglect the well-known problematics resulting from multidimensional target functions and from different stakeholder groups with con-tradictory aims. These topics are not mentioned in both papers and therefore one cannot find any hint how the authors expect enterprises to handle them.
Moreover, until now, both concepts have had no binding character. Therefore, the main question arises, how far business will follow the changed impact that the EU Commission give to CSR. For Porter’s and Kramer’s CSV approach one can see a high acceptance especially by multinational compa-nies. Nonetheless, till now one cannot speak about
Category European Commission Porter and Kramer
Role of business in society
CSR as core element for the legitimation of business
Prerequisites Companies fulfill their legal obligationsCollective agreements between social partners
Companies fulfill their legal obligations
Aims Contribution to inclusive growth and the well-being of the society
Triple bottom line
To reach simultaneously economic and social progress through value creation qu-antified by the relation of benefits to costsDouble bottom line
Stakeholder ShareholdersOther stakeholders The whole society
Varies with the concrete projects
Strategic orientation CSR/CSV is a long-term strategy and included in the core activities of business
Role of government No strict regulation but flexibility for businessGovernment procurement directives can be used to enhance CSR
Governments should set clear and me-asurable social goals and performance standardsPublic authorities should support business and not overregulate
Table 1 Synopsis of both concepts
God. XXVIII, BR. 1/2015. str. 243-256 God. XXVIII, BR. 1/2015. str. 243-256
UDK: 339.137.2:65.012.4](4-67) / Review article Regina Moczadlo:Creating competitive advantages – The European CSR-strategy compared with Porter’s and Kramer’s Shared value approach
254 255
19. Hsieh, H. F., Shannon, S. E. (2005), “Three approaches to qualitative content analysis”, Qualitative health research, Vol. 15 No. 9, pp. 1277–1288.
20. Husted, B. W., Allen, D. B. (2007), “Strategic Corporate Social Responsibility and Value Creation among Large Firms”, Long Range Planning, Vol. 40, No. 6, pp. 594–610.
21. Jamali, D. (2008), “A Stakeholder Approach to Corporate Social Responsibility: A Fresh Perspective into Theory and Practice”, Journal of Business Ethics, Vol. 82, No. 1, pp. 213–231.
22. Lahme, G., Klenk, V. (2013), “Telling the Backstory - Transparenz in globalen Wertschöpfungsketten”, in D‘heur, M. (Ed.), CSR und Value Chain Management - Profitables Wachstum durch nachhaltig ge-meinsame Werztschöpfung, Springer, Heidelberg, pp. 155–171.
23. Martinuzzi, A., Krumay, B., Pisano, U. (2011), Focus CSR: The New Communication of the EU Com-mission on CSR and National CSR Strategies and Action Plans, ESDN Quarterly Report, Vienna.
24. Mayring, P. (2014). Qualitative content analysis: theoretical foundation, basic procedures and software solution. Klagenfurt: Institute of Psychology and Center for Evaluation and Research.
25. Mullerat, R. (2013), “Corporate Social Responsibility: A European Perspective”, The Jean Monnet/Rob-ert Schuman Paper Series, Vol. 13, 13th ed., Coral Gables, FL.
26. O’Riordan, L., Fairbrass, J. (2014), “Managing CSR Stakeholder Engagement: A New Conceptual Framework”, Journal of Business Ethics, Vol. 125, No. 1, pp. 121–145.
27. Peloza, J., Shang, J. (2011), “How can corporate social responsibility activities create value for stake-holders? A systematic review”, Journal of the Academy of Marketing Science, Vol. 39, No. 1, pp. 117–135.
28. Perrini, F., Russo, A., Tencati, A., Vurro, C. (2011), “Deconstructing the Relationship Between Corpo-rate Social and Financial Performance”, Journal of Business Ethics, Vol. 102, No. S1, pp. 59–76.
29. Pesqueux, Y., Damak‐Ayadi, S. (2005), “Stakeholder theory in perspective”, Corporate Governance: The international journal of business in society, Vol. 5, No. 2, pp. 5–21.
30. Pirson, M. (2012), “Social entrepreneurs as the paragons of shared value creation? A critical perspec-tive”, Social Enterprise Journal, Vol. 8, No. 1, pp. 31–48.
31. Porter, M. E., Kramer, M. R. (2011), “Creating shared value”, Harvard Business Review, Vol. 89, No. 1/2, pp. 62–77.
32. Prahalad, C. K., Hammond, A. (2002), “Serving the World’s Poor, Profitably”, Harvard Business Review, Vol. 80, No. 9, pp. 48–57.
33. Reefke, H., Trocchi, M. (2013), “Balanced scorecard for sustainable supply chains: design and develop-ment guidelines”, International Journal of Productivity and Performance Management, Vol. 62 No. 8, pp. 805–826.
34. Ribeiro Soriano, D., Wagner Mainardes, E., Alves, H., Raposo, M. (2011), “Stakeholder theory: issues to resolve”, Management Decision, Vol. 49, No. 2, pp. 226–252.
35. Roberts, J. M., Markley, A. W. (2011), CSR: New EU Strategy Threatens U.S. and European Companies, WebMemo, Washington DC.
36. Smith, A. D. (2007), “Making the case for the competitive advantage of corporate social responsibility”, Business Strategy Series, Vol. 8, No. 3, pp. 186–195.
37. Weber, M. (2008), “The business case for corporate social responsibility: A company-level measure-ment approach for CSR”, European Management Journal, Vol. 26, No. 4, pp. 247–261.
38. Windsor, D. (2013), “Corporate social responsibility and irresponsibility: A positive theory approach”, Journal of Business Research, Vol. 66, No. 10, pp. 1937–1944.
References
1. Altenburger, R. (2013), “Gesellschaftliche Verantwortung als Innovationsquelle”, in Altenburger, R. (Ed.), CSR und Innovationsmanagement: Gesellschaftliche Verantwortung als Innovationstreiber und Wettbewerbsvorteil, SpringerLink Bücher, Springer Gabler, Berlin, Heidelberg, pp. 1–14.
2. Barnett, M. L., Salomon, R. M. (2012), “Does it pay to be really good? addressing the shape of the re-lationship between social and financial performance”, Strategic Management Journal, Vol. 33, No. 11, pp. 1304–1320.
3. Brunn, C., Bernard, B., Kudlak, R. (2013), “Report on cross-WP compilation and assessment of CSR performance & impacts on EU objectives. (2013): (IMPACT Working Paper, 15), Available at: http://csr-impact.eu/documents/documents-detail.html?documentid=33 (Accessed on: February 6, 2014).
4. Calabrese, A., Costa, R., Menichini, T., Rosati, F., Sanfelice, G. (2013), “Turning Corporate Social Re-sponsibility-driven Opportunities in Competitive Advantages: a Two-dimensional Model”, Knowledge and Process Management, Vol. 20, No. 1, pp. 50–58.
5. Carroll, A. B. (1991), “The pyramid of corporate social responsibility: Toward the moral management of organizational stakeholders”, Business Horizons, Vol. 34, No. 4, pp. 39–48.
6. Claydon, J. (2011), “A new direction for CSR: the shortcomings of previous CSR models and the ration-ale for a new model”, Social Responsibility Journal, Vol. 7, No. 3, pp. 405–420.
7. Crane, A., Palazzo, G., Spence, L. J., Matten, D. (2014), “Contesting the Value of ‘Creating Shared Value’”, California Management Review, Vol. 56, No. 2, pp. 130–153.
8. Crane, A., Ruebottom, T. (2011), “Stakeholder Theory and Social Identity: Rethinking Stakeholder Identification”, Journal of Business Ethics, Vol. 102, No. S1, pp. 77–87.
9. Crilly, D., Ioannou, I. (2014), “Managing Conflicting Objectives: The Role of Cognition in Reconciling Corporate Financial and Social Performance Expectations”, SSRN Electronic Journal.
10. Edelman (2014), “Edelman Trust Barometer Global Results”, Available at: http://www.edelman.com/insights/intellectual-property/2014-edelman-trust-barometer/about-trust/global-results/ (Accessed on: July 10, 2014)
11. Ennes, M. (2014), “Everything You Need to Know About Shared Value at Davos”, Available at: http://sharedvalue.org/groups/shared-value-initiative-community/everything-you-need-know-about-shared-value-davos (Accessed on: February 6, 2014)
12. European Commission (2011), “Communication from the Commission to the European Parliament, the Council, the European Economic and Social Committee and the Committee of the Regions”. A renewed EU strategy 2011-14 for Corporate Social Responsibility”, Available at: http://eur-lex.europa.eu/LexUriServ/LexUriServ.do?uri=COM:2011:0681:FIN:EN:PDF (Accessed on: July 3, 2014)
13. Freeman, R. E. (1984). Strategic management: A stakeholder approach. Pitman series in business and public policy, Boston: Pitman.
14. Freeman, R. E., Harrison, J. S., Wicks, A. C., Parmar, B. L., Colle, S. de (2010). Stakeholder theory: The state of the art. New York: Cambridge University Press.
15. Freeman, R. E., Martin, K., Parmar, B. (2007), “Stakeholder Capitalism”, Journal of Business Ethics, Vol. 74, No. 4, pp. 303–314.
16. Friedman, M. (1970). The Social Responsibility of Business Is to Increase Its Profits. New York: New York Times Magazine.
17. Harrison, J. S., Bosse, D. A. (2013), “How much is too much? The limits to generous treatment of stake-holders”, Business Horizons, Vol. 56, No. 3, pp. 313–322.
18. Hörisch, J., Freeman, R. E., Schaltegger, S. (2014), “Applying Stakeholder Theory in Sustainability Man-agement: Links, Similarities, Dissimilarities, and a Conceptual Framework”, Organization & Environ-ment, Vol. 27, No. 4, pp. 328–346.
God. XXVIII, BR. 1/2015. str. 243-256 God. XXVIII, BR. 1/2015. str. 243-256
UDK: 339.137.2:65.012.4](4-67) / Review article Regina Moczadlo:Creating competitive advantages – The European CSR-strategy compared with Porter’s and Kramer’s Shared value approach
257256 God. XXVIII, BR. 1/2015. str. 257-266
Sabina Đonlagić, Samira Fazlić, Amra Nuhanović: Introducing a framework for knowledge economy development in transition countries: The case of Bosnia and Herzegovina
INTRODUCING A FRAMEWORK FOR KNOWLEDGE ECONOMY DEVELOPMENT IN TRANSITION COUNTRIES: THE CASE OF BOSNIA AND HERZEGOVINA
UDK: 65.012.4(497.6)Review article
Received: december 28, 2014accepted for publishing: May 25, 2015
Sabina ĐonlagićUniversity of TuzlaFaculty of EconomicsUniverzitetska 9, 75000 Tuzla, Bosnia and [email protected]: +38762246534
Samira FazlićUniversity of TuzlaFaculty of EconomicsUniverzitetska 9, 75000 Tuzla, Bosnia and [email protected]: +38761800889
Amra NuhanovićUniversity of TuzlaFaculty of EconomicsUniverzitetska 9, 75000 Tuzla, Bosnia and [email protected]: +38761300929
Abstract
In the context of the current socio-economic situation in Bosnia and Herzegovina as well as its medium-term aspirations to join the European Union, a question arises as to whether and to what extent Bosnia and Herzegovina responds to set demands related to the creation of a knowledge society and knowledge econo-my, which should lead to its economy’s competitiveness. Bosnia and Herzegovina has been in the transition period for almost two decades. Its current socio-economic situation is urging academics, policy makers and other relevant bodies to address these problems. A shift towards new drivers of economic growth is necessary. In this paper we will identify the key drivers and explore the readiness of Bosnia and Herzegovina to develop a new economy - a knowledge economy. Results which have been presented in this paper are based on data which has been collected from the sample of 143 medium and large enterprises in Bosnia and Herzegovina. The factor analysis results indicated relevance of the six main drivers of knowledge economy development. The findings confirm the relevance of the conceptual framework for assessing readiness of countries in developing a knowledge economy. The main contribution of the paper is the empirical valida-tion of the conceptual framework related to the knowledge based economic development of a transitional country. The identification of key drivers for knowledge economy development is relevant to governments and other policy makers involved in developing and implementing strategies for economic development in Bosnia and Herzegovina as well as the academic community and higher education institutions which are key institutions in knowledge creation and diffusion.
Keywords: Knowledge economy, model for knowledge economy development, transition country, Bosnia and Herzegovina
Regina Moczadlo
Stvaranje konkurentske prednosti - europska strategija društveno odgovornoga poslovanja u usporedbi s Porterovim i Kramerovim konceptom zajedničke vrijednosti
Sažetak
2011. godine Europska komisija izmijenila je definiciju i strategiju društveno odgovornoga poslovanja (cor-porate social responsibility - CSR) stvaranjem zajedničke vrijednosti kao osnovnog elementa novog kon-cepta. Iste su godine Porter i Kramer, u časopisu Harvard Business Review, objavili svoj koncept stvaranja zajedničke vrijednosti (creating shared value - CSV) kao osnovni element dugoročnih poslovnih strate-gija. Oba pristupa polaze od društvene opravdanosti poslovanja poduzeća. CSR, odnosno CSV, smatra se sredstvom za postizanje opravdanosti poslovanja i vraćanja povjerenja društva koje je izgubljeno tijekom financijske krize. U ovome radu opisuju se dva koncepta i analiziraju njihove sličnosti i razlike. S obzirom na opći cilj i svrhu, koncept EU-a obuhvatniji je i zahtjevniji u odnosu na poduzeća. Europska komisija ocjen-juje CSR kao mjeru kojom se poslovanjem pridonosi uključivom rastu, zapošljavanju i dobrobiti društva. Poduzeća pri izradi dugoročne poslovne strategije moraju uzeti u obzir gospodarske, društvene i ekološke ciljeve te uključiti pitanja koja se tiču etike poslovanja, ljudskih prava i potrošača. Porterov i Kramerov koncept CSV-a ide i dalje od čistog poslovnog slučaja CSR-a jer je po svojoj definiciji CSV dugoročna mjera koju treba sustavno integrirati u stratešku osnovnu djelatnost poduzeća. Europska komisija smatra vlasnike poslovnog udjela samo jednom zajedničkom skupinom dionika poduzeća i ne daje im nikakvu prednost. Prema Porteru i Krameru presudno je istodobno stvaranje dobiti i društvene vrijednosti.
Ključne riječi: stvaranje zajedničke vrijednosti, društveno odgovorno poslovanje, europska politika društveno odgovornoga poslovanja
God. XXVIII, BR. 1/2015. str. 243-256
Regina Moczadlo:Creating competitive advantages – The European CSR-strategy compared with Porter’s and Kramer’s Shared value approach
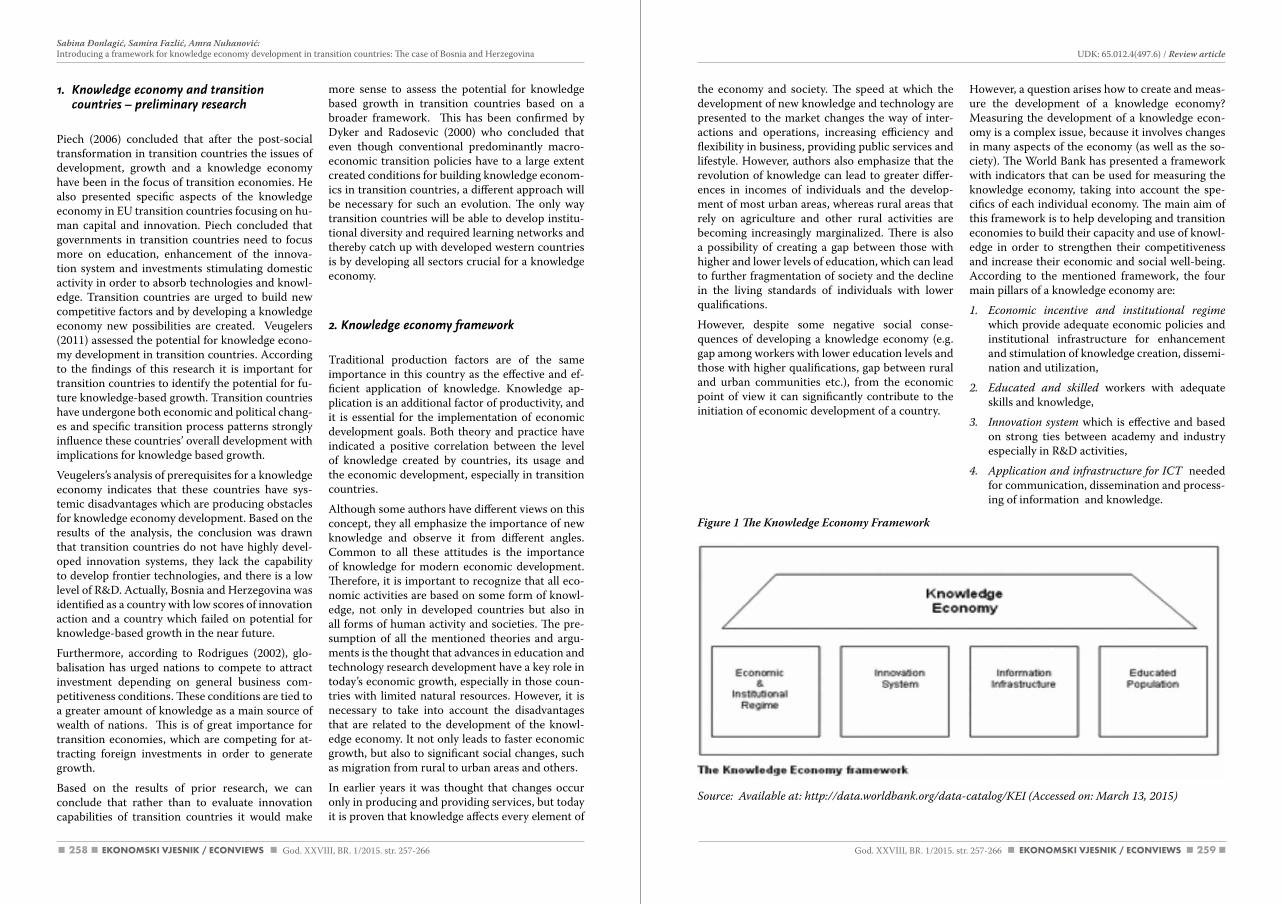
258 259God. XXVIII, BR. 1/2015. str. 257-266 God. XXVIII, BR. 1/2015. str. 257-266
UDK: 65.012.4(497.6) / Review article Sabina Đonlagić, Samira Fazlić, Amra Nuhanović: Introducing a framework for knowledge economy development in transition countries: The case of Bosnia and Herzegovina
the economy and society. The speed at which the development of new knowledge and technology are presented to the market changes the way of inter-actions and operations, increasing efficiency and flexibility in business, providing public services and lifestyle. However, authors also emphasize that the revolution of knowledge can lead to greater differ-ences in incomes of individuals and the develop-ment of most urban areas, whereas rural areas that rely on agriculture and other rural activities are becoming increasingly marginalized. There is also a possibility of creating a gap between those with higher and lower levels of education, which can lead to further fragmentation of society and the decline in the living standards of individuals with lower qualifications.
However, despite some negative social conse-quences of developing a knowledge economy (e.g. gap among workers with lower education levels and those with higher qualifications, gap between rural and urban communities etc.), from the economic point of view it can significantly contribute to the initiation of economic development of a country.
Figure 1 The Knowledge Economy Framework
However, a question arises how to create and meas-ure the development of a knowledge economy? Measuring the development of a knowledge econ-omy is a complex issue, because it involves changes in many aspects of the economy (as well as the so-ciety). The World Bank has presented a framework with indicators that can be used for measuring the knowledge economy, taking into account the spe-cifics of each individual economy. The main aim of this framework is to help developing and transition economies to build their capacity and use of knowl-edge in order to strengthen their competitiveness and increase their economic and social well-being. According to the mentioned framework, the four main pillars of a knowledge economy are:
1. Economic incentive and institutional regime which provide adequate economic policies and institutional infrastructure for enhancement and stimulation of knowledge creation, dissemi-nation and utilization,
2. Educated and skilled workers with adequate skills and knowledge,
3. Innovation system which is effective and based on strong ties between academy and industry especially in R&D activities,
4. application and infrastructure for IcT needed for communication, dissemination and process-ing of information and knowledge.
1. Knowledge economy and transition countries – preliminary research
Piech (2006) concluded that after the post-social transformation in transition countries the issues of development, growth and a knowledge economy have been in the focus of transition economies. He also presented specific aspects of the knowledge economy in EU transition countries focusing on hu-man capital and innovation. Piech concluded that governments in transition countries need to focus more on education, enhancement of the innova-tion system and investments stimulating domestic activity in order to absorb technologies and knowl-edge. Transition countries are urged to build new competitive factors and by developing a knowledge economy new possibilities are created. Veugelers (2011) assessed the potential for knowledge econo-my development in transition countries. According to the findings of this research it is important for transition countries to identify the potential for fu-ture knowledge-based growth. Transition countries have undergone both economic and political chang-es and specific transition process patterns strongly influence these countries’ overall development with implications for knowledge based growth.
Veugelers’s analysis of prerequisites for a knowledge economy indicates that these countries have sys-temic disadvantages which are producing obstacles for knowledge economy development. Based on the results of the analysis, the conclusion was drawn that transition countries do not have highly devel-oped innovation systems, they lack the capability to develop frontier technologies, and there is a low level of R&D. Actually, Bosnia and Herzegovina was identified as a country with low scores of innovation action and a country which failed on potential for knowledge-based growth in the near future.
Furthermore, according to Rodrigues (2002), glo-balisation has urged nations to compete to attract investment depending on general business com-petitiveness conditions. These conditions are tied to a greater amount of knowledge as a main source of wealth of nations. This is of great importance for transition economies, which are competing for at-tracting foreign investments in order to generate growth.
Based on the results of prior research, we can conclude that rather than to evaluate innovation capabilities of transition countries it would make
more sense to assess the potential for knowledge based growth in transition countries based on a broader framework. This has been confirmed by Dyker and Radosevic (2000) who concluded that even though conventional predominantly macro-economic transition policies have to a large extent created conditions for building knowledge econom-ics in transition countries, a different approach will be necessary for such an evolution. The only way transition countries will be able to develop institu-tional diversity and required learning networks and thereby catch up with developed western countries is by developing all sectors crucial for a knowledge economy.
2. Knowledge economy framework
Traditional production factors are of the same importance in this country as the effective and ef-ficient application of knowledge. Knowledge ap-plication is an additional factor of productivity, and it is essential for the implementation of economic development goals. Both theory and practice have indicated a positive correlation between the level of knowledge created by countries, its usage and the economic development, especially in transition countries.
Although some authors have different views on this concept, they all emphasize the importance of new knowledge and observe it from different angles. Common to all these attitudes is the importance of knowledge for modern economic development. Therefore, it is important to recognize that all eco-nomic activities are based on some form of knowl-edge, not only in developed countries but also in all forms of human activity and societies. The pre-sumption of all the mentioned theories and argu-ments is the thought that advances in education and technology research development have a key role in today’s economic growth, especially in those coun-tries with limited natural resources. However, it is necessary to take into account the disadvantages that are related to the development of the knowl-edge economy. It not only leads to faster economic growth, but also to significant social changes, such as migration from rural to urban areas and others.
In earlier years it was thought that changes occur only in producing and providing services, but today it is proven that knowledge affects every element of
Source: available at: http://data.worldbank.org/data-catalog/KEI (accessed on: March 13, 2015)
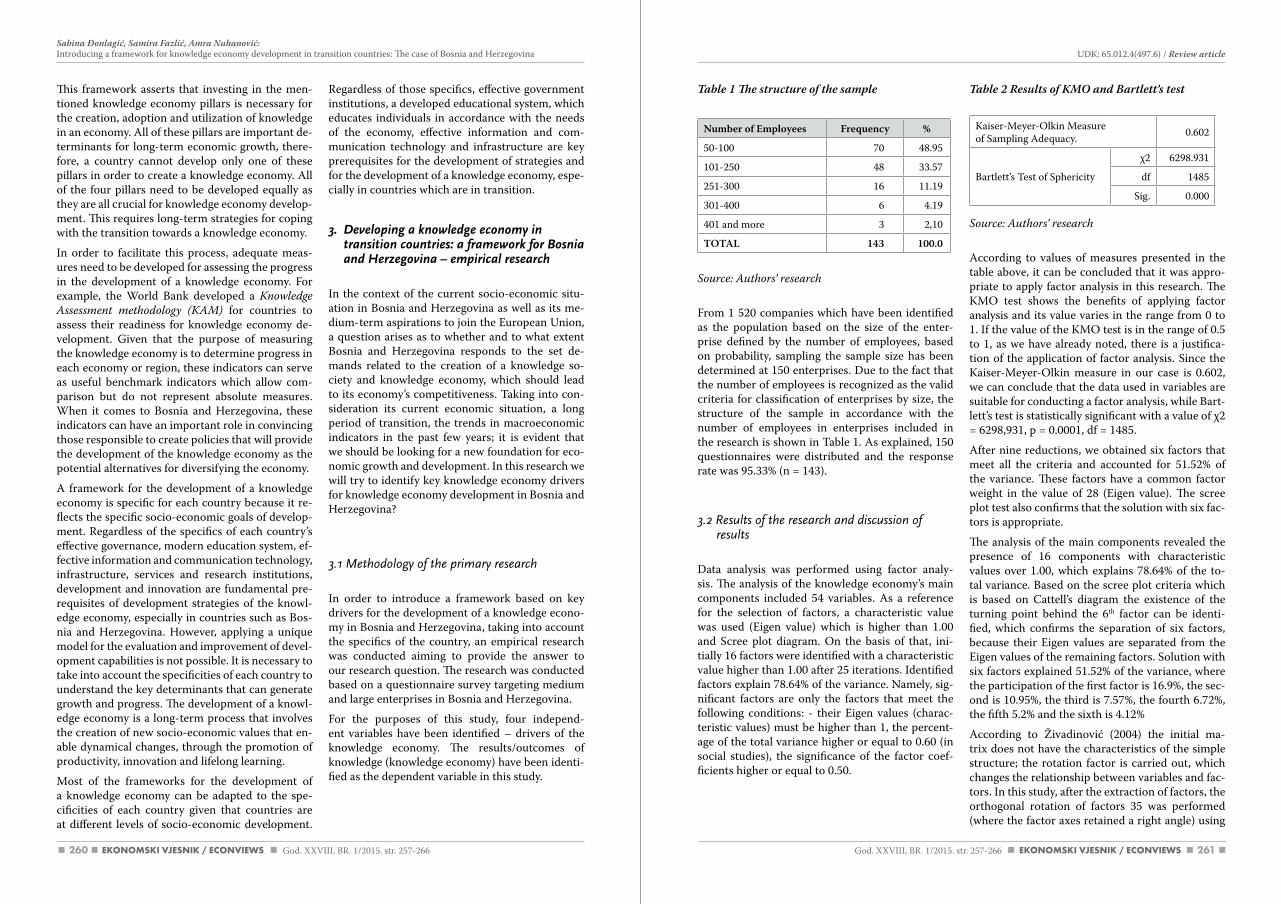
260 261
Table 1 The structure of the sample
Number of Employees Frequency %
50-100 70 48.95
101-250 48 33.57
251-300 16 11.19
301-400 6 4.19
401 and more 3 2,10
TOTAL 143 100.0
Source: authors’ research
From 1 520 companies which have been identified as the population based on the size of the enter-prise defined by the number of employees, based on probability, sampling the sample size has been determined at 150 enterprises. Due to the fact that the number of employees is recognized as the valid criteria for classification of enterprises by size, the structure of the sample in accordance with the number of employees in enterprises included in the research is shown in Table 1. As explained, 150 questionnaires were distributed and the response rate was 95.33% (n = 143).
3.2 Results of the research and discussion of results
Data analysis was performed using factor analy-sis. The analysis of the knowledge economy’s main components included 54 variables. As a reference for the selection of factors, a characteristic value was used (Eigen value) which is higher than 1.00 and Scree plot diagram. On the basis of that, ini-tially 16 factors were identified with a characteristic value higher than 1.00 after 25 iterations. Identified factors explain 78.64% of the variance. Namely, sig-nificant factors are only the factors that meet the following conditions: - their Eigen values (charac-teristic values) must be higher than 1, the percent-age of the total variance higher or equal to 0.60 (in social studies), the significance of the factor coef-ficients higher or equal to 0.50.
Table 2 Results of KMO and Bartlett’s test
Kaiser-Meyer-Olkin Measure of Sampling Adequacy. 0.602
Bartlett’s Test of Sphericity
χ2 6298.931
df 1485
Sig. 0.000
Source: authors’ research
According to values of measures presented in the table above, it can be concluded that it was appro-priate to apply factor analysis in this research. The KMO test shows the benefits of applying factor analysis and its value varies in the range from 0 to 1. If the value of the KMO test is in the range of 0.5 to 1, as we have already noted, there is a justifica-tion of the application of factor analysis. Since the Kaiser-Meyer-Olkin measure in our case is 0.602, we can conclude that the data used in variables are suitable for conducting a factor analysis, while Bart-lett’s test is statistically significant with a value of χ2 = 6298,931, p = 0.0001, df = 1485.
After nine reductions, we obtained six factors that meet all the criteria and accounted for 51.52% of the variance. These factors have a common factor weight in the value of 28 (Eigen value). The scree plot test also confirms that the solution with six fac-tors is appropriate.
The analysis of the main components revealed the presence of 16 components with characteristic values over 1.00, which explains 78.64% of the to-tal variance. Based on the scree plot criteria which is based on Cattell’s diagram the existence of the turning point behind the 6th factor can be identi-fied, which confirms the separation of six factors, because their Eigen values are separated from the Eigen values of the remaining factors. Solution with six factors explained 51.52% of the variance, where the participation of the first factor is 16.9%, the sec-ond is 10.95%, the third is 7.57%, the fourth 6.72%, the fifth 5.2% and the sixth is 4.12%
According to Živadinović (2004) the initial ma-trix does not have the characteristics of the simple structure; the rotation factor is carried out, which changes the relationship between variables and fac-tors. In this study, after the extraction of factors, the orthogonal rotation of factors 35 was performed (where the factor axes retained a right angle) using
This framework asserts that investing in the men-tioned knowledge economy pillars is necessary for the creation, adoption and utilization of knowledge in an economy. All of these pillars are important de-terminants for long-term economic growth, there-fore, a country cannot develop only one of these pillars in order to create a knowledge economy. All of the four pillars need to be developed equally as they are all crucial for knowledge economy develop-ment. This requires long-term strategies for coping with the transition towards a knowledge economy.
In order to facilitate this process, adequate meas-ures need to be developed for assessing the progress in the development of a knowledge economy. For example, the World Bank developed a Knowledge assessment methodology (KaM) for countries to assess their readiness for knowledge economy de-velopment. Given that the purpose of measuring the knowledge economy is to determine progress in each economy or region, these indicators can serve as useful benchmark indicators which allow com-parison but do not represent absolute measures. When it comes to Bosnia and Herzegovina, these indicators can have an important role in convincing those responsible to create policies that will provide the development of the knowledge economy as the potential alternatives for diversifying the economy.
A framework for the development of a knowledge economy is specific for each country because it re-flects the specific socio-economic goals of develop-ment. Regardless of the specifics of each country’s effective governance, modern education system, ef-fective information and communication technology, infrastructure, services and research institutions, development and innovation are fundamental pre-requisites of development strategies of the knowl-edge economy, especially in countries such as Bos-nia and Herzegovina. However, applying a unique model for the evaluation and improvement of devel-opment capabilities is not possible. It is necessary to take into account the specificities of each country to understand the key determinants that can generate growth and progress. The development of a knowl-edge economy is a long-term process that involves the creation of new socio-economic values that en-able dynamical changes, through the promotion of productivity, innovation and lifelong learning.
Most of the frameworks for the development of a knowledge economy can be adapted to the spe-cificities of each country given that countries are at different levels of socio-economic development.
Regardless of those specifics, effective government institutions, a developed educational system, which educates individuals in accordance with the needs of the economy, effective information and com-munication technology and infrastructure are key prerequisites for the development of strategies and for the development of a knowledge economy, espe-cially in countries which are in transition.
3. Developing a knowledge economy in transition countries: a framework for Bosnia and Herzegovina – empirical research
In the context of the current socio-economic situ-ation in Bosnia and Herzegovina as well as its me-dium-term aspirations to join the European Union, a question arises as to whether and to what extent Bosnia and Herzegovina responds to the set de-mands related to the creation of a knowledge so-ciety and knowledge economy, which should lead to its economy’s competitiveness. Taking into con-sideration its current economic situation, a long period of transition, the trends in macroeconomic indicators in the past few years; it is evident that we should be looking for a new foundation for eco-nomic growth and development. In this research we will try to identify key knowledge economy drivers for knowledge economy development in Bosnia and Herzegovina?
3.1 Methodology of the primary research
In order to introduce a framework based on key drivers for the development of a knowledge econo-my in Bosnia and Herzegovina, taking into account the specifics of the country, an empirical research was conducted aiming to provide the answer to our research question. The research was conducted based on a questionnaire survey targeting medium and large enterprises in Bosnia and Herzegovina.
For the purposes of this study, four independ-ent variables have been identified – drivers of the knowledge economy. The results/outcomes of knowledge (knowledge economy) have been identi-fied as the dependent variable in this study.
God. XXVIII, BR. 1/2015. str. 257-266 God. XXVIII, BR. 1/2015. str. 257-266
UDK: 65.012.4(497.6) / Review article Sabina Đonlagić, Samira Fazlić, Amra Nuhanović: Introducing a framework for knowledge economy development in transition countries: The case of Bosnia and Herzegovina
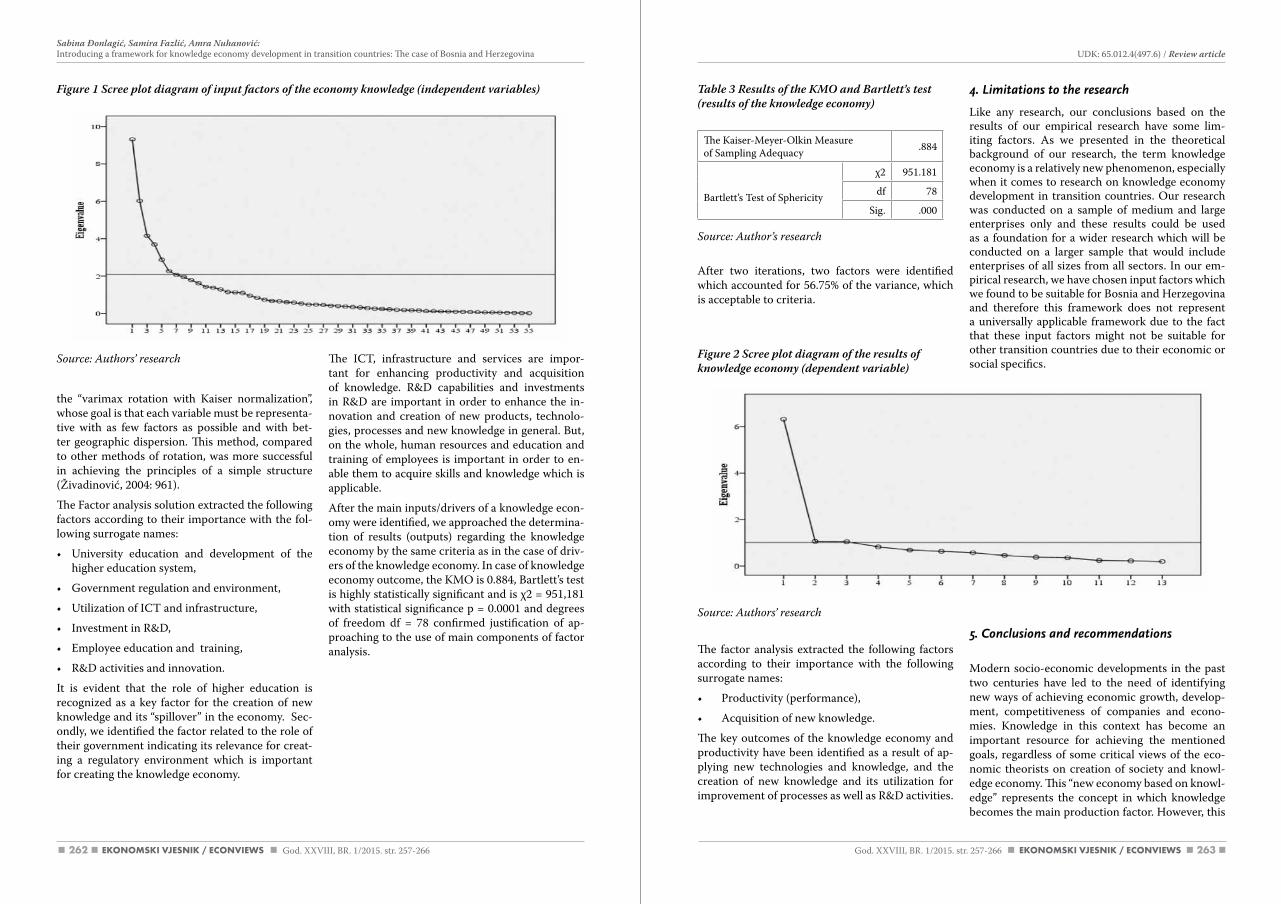
262 263
Table 3 Results of the KMO and Bartlett’s test (results of the knowledge economy)
The Kaiser-Meyer-Olkin Measure of Sampling Adequacy .884
Bartlett’s Test of Sphericity
χ2 951.181
df 78
Sig. .000
Source: author’s research
After two iterations, two factors were identified which accounted for 56.75% of the variance, which is acceptable to criteria.
Figure 2 Scree plot diagram of the results of knowledge economy (dependent variable)
Source: authors’ research
The factor analysis extracted the following factors according to their importance with the following surrogate names:
• Productivity (performance),
• Acquisition of new knowledge.
The key outcomes of the knowledge economy and productivity have been identified as a result of ap-plying new technologies and knowledge, and the creation of new knowledge and its utilization for improvement of processes as well as R&D activities.
4. Limitations to the research
Like any research, our conclusions based on the results of our empirical research have some lim-iting factors. As we presented in the theoretical background of our research, the term knowledge economy is a relatively new phenomenon, especially when it comes to research on knowledge economy development in transition countries. Our research was conducted on a sample of medium and large enterprises only and these results could be used as a foundation for a wider research which will be conducted on a larger sample that would include enterprises of all sizes from all sectors. In our em-pirical research, we have chosen input factors which we found to be suitable for Bosnia and Herzegovina and therefore this framework does not represent a universally applicable framework due to the fact that these input factors might not be suitable for other transition countries due to their economic or social specifics.
5. Conclusions and recommendations
Modern socio-economic developments in the past two centuries have led to the need of identifying new ways of achieving economic growth, develop-ment, competitiveness of companies and econo-mies. Knowledge in this context has become an important resource for achieving the mentioned goals, regardless of some critical views of the eco-nomic theorists on creation of society and knowl-edge economy. This “new economy based on knowl-edge” represents the concept in which knowledge becomes the main production factor. However, this
Source: authors’ research
the “varimax rotation with Kaiser normalization”, whose goal is that each variable must be representa-tive with as few factors as possible and with bet-ter geographic dispersion. This method, compared to other methods of rotation, was more successful in achieving the principles of a simple structure (Živadinović, 2004: 961).
The Factor analysis solution extracted the following factors according to their importance with the fol-lowing surrogate names:
• University education and development of the higher education system,
• Government regulation and environment,
• Utilization of ICT and infrastructure,
• Investment in R&D,
• Employee education and training,
• R&D activities and innovation.
It is evident that the role of higher education is recognized as a key factor for the creation of new knowledge and its “spillover” in the economy. Sec-ondly, we identified the factor related to the role of their government indicating its relevance for creat-ing a regulatory environment which is important for creating the knowledge economy.
The ICT, infrastructure and services are impor-tant for enhancing productivity and acquisition of knowledge. R&D capabilities and investments in R&D are important in order to enhance the in-novation and creation of new products, technolo-gies, processes and new knowledge in general. But, on the whole, human resources and education and training of employees is important in order to en-able them to acquire skills and knowledge which is applicable.
After the main inputs/drivers of a knowledge econ-omy were identified, we approached the determina-tion of results (outputs) regarding the knowledge economy by the same criteria as in the case of driv-ers of the knowledge economy. In case of knowledge economy outcome, the KMO is 0.884, Bartlett’s test is highly statistically significant and is χ2 = 951,181 with statistical significance p = 0.0001 and degrees of freedom df = 78 confirmed justification of ap-proaching to the use of main components of factor analysis.
Figure 1 Scree plot diagram of input factors of the economy knowledge (independent variables)
God. XXVIII, BR. 1/2015. str. 257-266 God. XXVIII, BR. 1/2015. str. 257-266
UDK: 65.012.4(497.6) / Review article Sabina Đonlagić, Samira Fazlić, Amra Nuhanović: Introducing a framework for knowledge economy development in transition countries: The case of Bosnia and Herzegovina
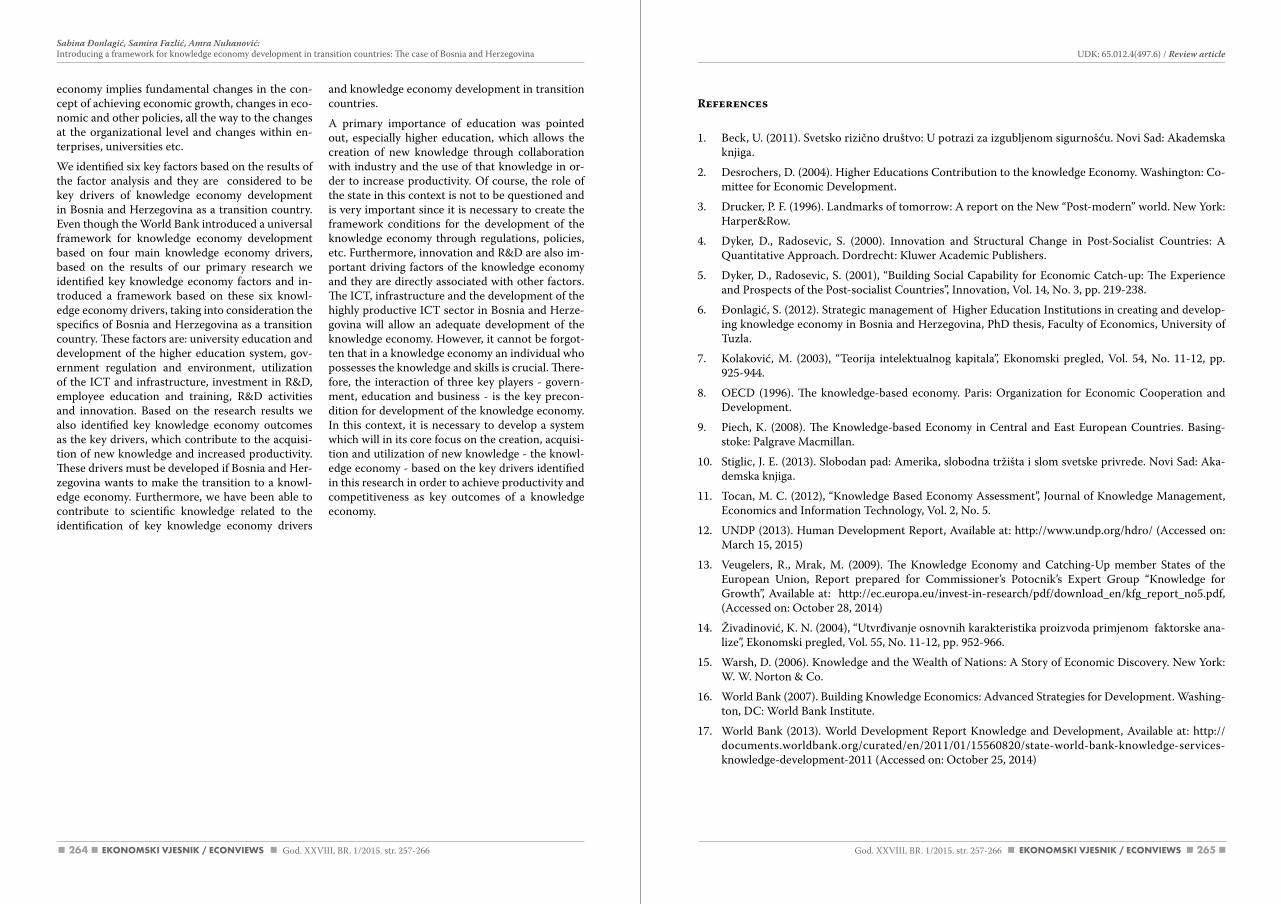
264 265
References
1. Beck, U. (2011). Svetsko rizično društvo: U potrazi za izgubljenom sigurnošću. Novi Sad: Akademska knjiga.
2. Desrochers, D. (2004). Higher Educations Contribution to the knowledge Economy. Washington: Co-mittee for Economic Development.
3. Drucker, P. F. (1996). Landmarks of tomorrow: A report on the New “Post-modern” world. New York: Harper&Row.
4. Dyker, D., Radosevic, S. (2000). Innovation and Structural Change in Post-Socialist Countries: A Quantitative Approach. Dordrecht: Kluwer Academic Publishers.
5. Dyker, D., Radosevic, S. (2001), “Building Social Capability for Economic Catch-up: The Experience and Prospects of the Post-socialist Countries”, Innovation, Vol. 14, No. 3, pp. 219-238.
6. Đonlagić, S. (2012). Strategic management of Higher Education Institutions in creating and develop-ing knowledge economy in Bosnia and Herzegovina, PhD thesis, Faculty of Economics, University of Tuzla.
7. Kolaković, M. (2003), “Teorija intelektualnog kapitala”, Ekonomski pregled, Vol. 54, No. 11-12, pp. 925-944.
8. OECD (1996). The knowledge-based economy. Paris: Organization for Economic Cooperation and Development.
9. Piech, K. (2008). The Knowledge-based Economy in Central and East European Countries. Basing-stoke: Palgrave Macmillan.
10. Stiglic, J. E. (2013). Slobodan pad: Amerika, slobodna tržišta i slom svetske privrede. Novi Sad: Aka-demska knjiga.
11. Tocan, M. C. (2012), “Knowledge Based Economy Assessment”, Journal of Knowledge Management, Economics and Information Technology, Vol. 2, No. 5.
12. UNDP (2013). Human Development Report, Available at: http://www.undp.org/hdro/ (Accessed on: March 15, 2015)
13. Veugelers, R., Mrak, M. (2009). The Knowledge Economy and Catching-Up member States of the European Union, Report prepared for Commissioner’s Potocnik’s Expert Group “Knowledge for Growth”, Available at: http://ec.europa.eu/invest-in-research/pdf/download_en/kfg_report_no5.pdf, (Accessed on: October 28, 2014)
14. Živadinović, K. N. (2004), “Utvrđivanje osnovnih karakteristika proizvoda primjenom faktorske ana-lize”, Ekonomski pregled, Vol. 55, No. 11-12, pp. 952-966.
15. Warsh, D. (2006). Knowledge and the Wealth of Nations: A Story of Economic Discovery. New York: W. W. Norton & Co.
16. World Bank (2007). Building Knowledge Economics: Advanced Strategies for Development. Washing-ton, DC: World Bank Institute.
17. World Bank (2013). World Development Report Knowledge and Development, Available at: http://documents.worldbank.org/curated/en/2011/01/15560820/state-world-bank-knowledge-services-knowledge-development-2011 (Accessed on: October 25, 2014)
economy implies fundamental changes in the con-cept of achieving economic growth, changes in eco-nomic and other policies, all the way to the changes at the organizational level and changes within en-terprises, universities etc.
We identified six key factors based on the results of the factor analysis and they are considered to be key drivers of knowledge economy development in Bosnia and Herzegovina as a transition country. Even though the World Bank introduced a universal framework for knowledge economy development based on four main knowledge economy drivers, based on the results of our primary research we identified key knowledge economy factors and in-troduced a framework based on these six knowl-edge economy drivers, taking into consideration the specifics of Bosnia and Herzegovina as a transition country. These factors are: university education and development of the higher education system, gov-ernment regulation and environment, utilization of the ICT and infrastructure, investment in R&D, employee education and training, R&D activities and innovation. Based on the research results we also identified key knowledge economy outcomes as the key drivers, which contribute to the acquisi-tion of new knowledge and increased productivity. These drivers must be developed if Bosnia and Her-zegovina wants to make the transition to a knowl-edge economy. Furthermore, we have been able to contribute to scientific knowledge related to the identification of key knowledge economy drivers
and knowledge economy development in transition countries.
A primary importance of education was pointed out, especially higher education, which allows the creation of new knowledge through collaboration with industry and the use of that knowledge in or-der to increase productivity. Of course, the role of the state in this context is not to be questioned and is very important since it is necessary to create the framework conditions for the development of the knowledge economy through regulations, policies, etc. Furthermore, innovation and R&D are also im-portant driving factors of the knowledge economy and they are directly associated with other factors. The ICT, infrastructure and the development of the highly productive ICT sector in Bosnia and Herze-govina will allow an adequate development of the knowledge economy. However, it cannot be forgot-ten that in a knowledge economy an individual who possesses the knowledge and skills is crucial. There-fore, the interaction of three key players - govern-ment, education and business - is the key precon-dition for development of the knowledge economy. In this context, it is necessary to develop a system which will in its core focus on the creation, acquisi-tion and utilization of new knowledge - the knowl-edge economy - based on the key drivers identified in this research in order to achieve productivity and competitiveness as key outcomes of a knowledge economy.
God. XXVIII, BR. 1/2015. str. 257-266 God. XXVIII, BR. 1/2015. str. 257-266
UDK: 65.012.4(497.6) / Review article Sabina Đonlagić, Samira Fazlić, Amra Nuhanović: Introducing a framework for knowledge economy development in transition countries: The case of Bosnia and Herzegovina
266
Sabina ĐonlagićSamira FazlićAmra Nuhanović
Uvođenje okvira za razvoj ekonomije znanja u tranzicijskim zemljama: Slučaj Bosne i Hercegovine
Sažetak
U kontekstu trenutačne društveno-ekonomske situacije u Bosni i Hercegovini, kao i njezine srednjoročne težnje pristupanju Europskoj uniji, postavlja se pitanje udovoljava li i u kojoj mjeri Bosna i Hercegovina postavljenim zahtjevima koji se odnose na stvaranje društva znanja i ekonomije znanja, što bi gospodarstvo te zemlje učinilo konkurentnim. Tranzicijsko razdoblje u Bosni i Hercegovini traje gotovo dva desetljeća. Trenutačna društveno-ekonomska situacija nameće potrebu rješavanja tih problema i to s razine akadem-ske zajednice, donositelja politika i drugih relevantnih tijela. Potreban je zaokret prema novim pokretačima gospodarskoga rasta. U ovome radu identificiraju se ključni pokretači i istražuje spremnost Bosne i Her-cegovine za razvoj nove ekonomije - ekonomije znanja. Rezultati prikazani u ovome radu temelje se na podatcima prikupljenima na uzorku od 143 srednja i velika poduzeća u Bosni i Hercegovini. Rezultati fak-torske analize pokazuju relevantnost šest glavnih pokretača razvoja ekonomije znanja. Rezultati potvrđuju važnost konceptualnoga okvira za procjenu spremnosti zemalja na razvoj ekonomije znanja. Glavni dopri-nos ovoga rada je empirijska validacija konceptualnoga okvira koji se odnosi na razvoj ekonomije temeljen na znanju u tranzicijskoj zemlji. Identifikacija ključnih pokretača razvoja ekonomije znanja važna je za vlade i druge donositelje politika uključene u izradu i provedbu strategija ekonomskoga razvoja u Bosni i Her-cegovini, kao i akademsku zajednicu i visokoškolske ustanove koje su ključne u stvaranju i širenju znanja.
Ključne riječi: ekonomija znanja, model razvoja ekonomije znanja, tranzicijska zemlja, Bosna i Hercego-vina
God. XXVIII, BR. 1/2015. str. 257-266
Conference reviewsPrikazi konferencija
Jelena Franjković:Prikaz Erasmus međunarodnog tjedna
Savonia Sveučilište primijenjenih znanosti - Međunarodni tjedan 2015
Anita Frajman Ivković:Europski EFOS tjedan 6. – 8. svibnja 2015.: Tvoja mogućnost za budućnost
Nives Tomašević:Kreativna riznica: Popularizacijski simpozij kulturnei kreativne industrije Ekonomskog fakulteta u Osijeku
Sabina Đonlagić, Samira Fazlić, Amra Nuhanović: Introducing a framework for knowledge economy development in transition countries: The case of Bosnia and Herzegovina
269God. XXVIII, BR. 1/2015. str. 269-270
Jelena Franjković: Prikaz Erasmus međunarodnog tjednaSavonia Sveučilište primijenjenih znanosti - Međunarodni tjedan 2015
Sveučilište primijenjenih znanosti Savonia drugu godinu zaredom organiziralo je Međunarodni tjedan koji se održao od 9. do 13. veljače 2015. u Kuo-piu u Finskoj. Iako je prošle godine Međunarodni tjedan uključivao samo nastavnike i studente s područja socijalnih usluga i zdravstvene njege, ove je godine proširen na gotovo sva područja kojima se bavi Sveučilište Savonia – turizam i ugostiteljstvo, poslovna ekonomija, socijalna i zdravstvena skrb, ruralne industrije, inženjerstvo i tehnologija, diza-jn te glazba i ples. Sveučilište Savonia jedno je od najvećih sveučilišta u Finskoj s oko 5800 studenata i 470 nastavnika. Smješteno je u središnjoj Finskoj, a djeluje u tri grada međusobno udaljena stotinjak kilometara: Kuopio, koji je najveći grad te najbro-jniji po broju studenata i osoblja, Iisalmi i Varkaus. Kako su i sami naveli, svrha njihovoga sveučilišta, kao sveučilišta primijenjenih znanosti, jest raz-voj regije u kojoj djeluju i u tome uvelike uspije-vaju, a finska ekonomija temelji se na efektivnom iskorištenju inovacija za koje su, između ostalih, upravo i oni zaduženi.
Pedesetak sudionika Međunarodnoga tjedna bili su studenti preddiplomskih, diplomskih i posli-jediplomskih studija, nastavnici i osoblje iz ureda za međunarodnu suradnju, a pristigli su iz bro-jnih europskih zemalja poput Belgije, Bugarske, Češke, Estonije, Francuske, Hrvatske, Kosova, Litve, Nizozemske, Njemačke, Poljske, Rumunjske,
Slovenije, Švicarske, Turske, Ujedinjenog Kraljevst-va, ali i iz nekoliko afričkih zemalja s kojima Savonia ima višegodišnju suradnju.
Službeni dio Međunarodnoga tjedna održavao se većinom u dva kampusa u Kuopiu, Opistotie i Microkatu. Microkatu je novi kompleks, izgrađen prije nekoliko godina, velikim dijelom financijskim sredstvima iz fondova Europske unije, a oprem-ljen je vrhunskom opremom koja studentima i nastavnicima pruža odlične uvjete za praktično učenje iz raznih područja. U pauzama između pre-davanja i radionica bili su organizirani svojevrsni „turistički obilasci“ u kojima su glavnu ulogu imali studenti koji su sudionike entuzijastično provodili kroz kampus, pokazujući sve mogućnosti koje nudi i demonstriravši što i kako oni praktično uče. Naglasak na predavanjima i radionicama bio je na područjima koji su u prioritetu istraživanja Savonie u sljedećih nekoliko godina, a to su bili: poljoprivre-da i hrana - restrukturiranje lanca prehrane; integri-rani razvoj proizvoda; usluge zdravstvene i socijalne skrbi orijentirane na korisnika te energija, okoliš i sigurnost. Veliki dio vremena organizatori su pos-vetili prezentiranju vlastitih uspješnih primjera i njihovoga pristupa učenju otvorenog inovacijama, poput Oivalle – virtualnog grada kojeg su kreirali i u kojem se studenti susreću s velikim brojem izazova koji ih čekaju u stvarnome poslovanju.
PRIKAZ ERASMUS MEĐUNARODNOG TJEDNASavonia Sveučilište primijenjenih znanosti - Međunarodni tjedan 2015
Jelena FranjkovićJosip Juraj Strossmayer University of OsijekFaculty of Economics in OsijekTrg ljudevita Gaja 7,31000 Osijek, [email protected]: +385912244062
271270 God. XXVIII, BR. 1/2015. str. 271-272
Anita Frajman Ivković: Europski EFOS tjedan 6. – 8. svibnja 2015.: Tvoja mogućnost za budućnost
Na Ekonomskom fakultetu u Osijeku od 6. do 8. svibnja 2015. godine obilježen je Europski EFOS tjedan povodom Dana Europe 9. svibnja. Događanje pod sloganom „Tvoja mogućnost za budućnost“ pružilo je sudionicima pregršt konkretnih infor-macija o Europskoj uniji i mogućnostima koje ona nudi. Sva predavanja, radionice i tribine bile su be-splatne i nagradnog karaktera. Organizator projekta bio je Ekonomski fakultet u Osijeku s brojnim part-nerima i sponzorima, a predsjednica Programskoga odbora doc. dr. sc. Anita Frajman Ivković istaknula je kako je preko 40 volontera tri mjeseca aktivno radilo na pripremi događanja te kako su upravo stu-denti bili u samom središtu događanja (kao voditelji, moderatori, organizacijski odbor, i sl.). Tijekom svečanoga otvorenja, kojeg je uveličala iz-vedba Kulturno umjetničkog društva “Osijek 1862”, posjetiteljima su se obratili brojni važni sudionici koji su svi bili i aktivni sudionici barem jednog od događanja koje je uslijedilo. Važno je napome-nuti kako je gospodin Branko Baričević (voditelj Predstavništva Europske komisije u Hrvatskoj) otvorio EFOS EU kutak, koji je jedan od članka Sporazuma o uspostavljanju i razvijanju znanst-veno-razvojne i stručne suradnje potpisanog tom prigodom između Regionalne razvojne agencije (dr. sc. Stjepan Ribić) i Ekonomskoga fakulteta u Osi-jeku (prof. dr. sc. Vladimir Cini). Publikacije EU-a će tijekom godine biti dostupne u EFOS EU kutku zahvaljujući Informacijskom centru Europe Direct, a brigu u kutku vodit će Knjižnica EFOS-a koja je također partner događanja te koja je tom prigodom organizirala izložbu EU korner (http://www.efos.
unios.hr/efos-eu-kutak/). Više informacija o EFOS EU kutku dostupno je na http://www.efos.unios.hr/knjiznica/europski-kutak/Europski EFOS tjedan započeo je okruglim stolom naziva „Unija predrasuda” kojeg je moderirao Dani-jel Čehajić, a na kojemu su gostovali mr. sc. Branko Baričević (voditelj Predstavništva Europske komisi-je u Hrvatskoj), dr. sc. Stjepan Ribić (direktor Re-gionalne razvojne agencije SiB), doc. dr. sc. Tunjica Petrašević (nositelj Jean Monnet katedre za proces-no pravo EU na Pravnom fakultetu u Osijeku), izv. prof. dr. sc. Mario Vinković (prorektor za nastavu i studente Sveučilišta J. J. Strossmayera u Osijeku), doc. dr. sc. Anita Frajman Ivković (predsjednica Programskog odbora Europskog EFOS tjedna), An-ita Đordić (bivša studentica EFOS-a i pripravnica u Europskoj komisiji), Marko Vidakušić, mao. oec. (bivši student EFOS-a i asistent u Europskom par-lamentu). Razgovor na „Uniji predrasuda“ temeljio se na prethodno provedenom istraživanju kojemu je cilj bio testirati određene predrasude vezane za Europsku uniju, a koje su u većoj ili manjoj mjeri postale stav građana (posebice studenata). Gosti okrugloga stola svojom su ekspertizom i radnim iskustvom argumentirano komentirali postavljene predrasude, kao i rezultate istraživanja.Europsku kavu u mom Osijeku po konceptu okru-gloga stola moderirala je studentica Vedrana Sabljo koja je svoju želju napuštanja Osijeka u potrazi za bojim životom podijelila s Draganom Vulinom, mag. ing. el. (zamjenikom župana Osječko-baranjske županije), Vladimirom Hamom, dipl. oec. (zamjenikom gradonačelnika Grada Osijeka), izv.
EUROPSKI EFOS TJEDAN 6. – 8. SVIBNJA 2015.Tvoja mogućnost za budućnost
Anita Frajman IvkovićJosip Juraj Strossmayer University of OsijekFaculty of Economics in OsijekTrg ljudevita Gaja 7,31000 Osijek, [email protected]: +385912244095
God. XXVIII, BR. 1/2015. str. 269-270
Jelena Franjković: Prikaz Erasmus međunarodnog tjednaSavonia Sveučilište primijenjenih znanosti - Međunarodni tjedan 2015
Kao i većina Finske, i sam Kuopio okružen je bro-jnim jezerima i šumama. Finci su uvelike povezani s prirodom i vrlo su ponosni na prirodna bogat-stva koja imaju. Organizatori su goste upoznali s njihovim uobičajenim društvenim životom i tradi-cionalnom hranom. Organiziran je posjet najvećoj prirodnoj parnoj sauni na svijetu, Jätkänämppä, na-
kon koje su se oni hrabriji mogli okupati u ledenom jezeru i iskusiti prave čari Finske. Završna večer održana je u Puijo tornju, tornju za skijaške skokove i prepoznatljivom simbolu Kuopia s kojeg se pruža predivan pogled na cijeli grad te jezera i otočiće koji ga okružuju.
273272 God. XXVIII, BR. 1/2015. str. 273-275
Nives Tomašević: Kreativna riznica: Popularizacijski simpozij kulturne i kreativne industrije Ekonomskog fakulteta u Osijeku
Svako promicanje razumijevanja, osvještavanja, a prije svega educiranje i informiranja svih dobnih skupina o kulturnoj i kreativnoj industriji trebalo bi se nalaziti u fokusu interesa političkih i akademskih institucija te strukovnih i umjetničkih udruženja kreativaca buduće industrije. Jedan od pozitivnih primjera koji je ujedinio navedene elemente popu-larizacijski je simpozij „Kreativna riznica“ održan na Ekonomskom fakultetu u Osijeku u travnju 2015. godine.
Pema riječima organizatora i sudionika Kreativna riznica događanje je koje primiče i naglašava važnost kulturne i kreativne industrije za cjelokupnu zajed-nicu, a poseban naglasak je stavljen na akademsku zajednicu i mlađe dobne skupine. Kreativna riznica bio je prvi popularizacijski simpozij kulturne i krea-tivne industrije u Republici Hrvatskoj te se drži izn-imno važnim za promicanje ovih industrija. Popu-larizacijski simpozij uspio je udružiti sveučilišne potencijale te okupiti nastavnike s više sveučilišnih sastavnica Osječkog i Zadarskog Sveučilišta. U medijskim najavama izdvajana su ugledna imena kulturne i kreativne industrije, poput akademika Stjepana Damjanovića i Dubravke Oraić-Tolić te prof. Stanislava Marijanovića (člana suradnika HAZU), brojna imena iz javnoga života, poput Ivane Nikolić Popović iz Klastera konkurentnosti
kreativnih i kulturni industrija, Mladena Špehara i Ane Perišić Mijić iz Ministarstva kulture, Ante Šalinovića iz Agnecije Ipsos Puls, Renate Margaretić Urlić i Deana Šoše s HRT-a, Antonija Todorovikja Dimishkovkog iz Infinite Solutions, Ivane Ljevak Lebeda i Petre Ljevak iz Naklade Ljevak, Nevena Antičevića iz Algoritma, dogradonačelnika Osijeka Vladimira Hama, itd. Program je organiziran na način da se poveća svijest sudionika o važnosti kul-turne i kreativne industrije kao stvaratelja proizvo-da i usluga izrazitog izvoznog potencijala, odnosno stvaranja 100% domaćeg proizvoda.
Program je trajao 4 dana (22. – 25. travnja 2015.). Sva četiri dana u cijelosti su bila ispunjena zanim-ljivim sadržajima. Događaj iako namijenjen pr-venstveno studentima preddiplomskih i diplom-skih studija svih sastavnica Sveučilišta Josipa Jurja Strossmayera u Osijeku, privukao je i srednjoškolce, umirovljenike, samozaposlene, nezaposlene osobe te gospodarstvenike.
Programski odbor u kojem se nalazilo 15 znan-stvenika potpisalo je program prve Kreativne riznice. U programu je svoje mjesto našlo više od 70 raznovrsnih događanja (predavanja, radionice, okrugli stolovi, tribine, izložbe, performansi, pred-stavljanje knjiga, kinopojekcije te glazbeni program)
KREATIVNA RIZNICA: POPULARIZACIJSKI SIMPOZIJ KULTURNE I KREATIVNE INDUSTRIJE EKONOMSKOG FAKULTETA U OSIJEKU
Nives TomaševićUniversity of Zadardepartment of library and Information SciencesUl. dr. Franje Tuđmana 24i,23000 Zadar, [email protected]: +38598202279
Anita Frajman Ivković: Europski EFOS tjedan 6. – 8. svibnja 2015.: Tvoja mogućnost za budućnost
God. XXVIII, BR. 1/2015. str. 271-272
prof. dr. sc. Sunčicom Oberman Peterkom (prode-kanicom za nastavu Ekonomskoga fakulteta u Osi-jeku), dr. sc. Stjepanom Ribićem (predsjednikom uprave Regionalne razvojne agencije Slavonije i Baranje), mr. sc. Darijom Krstić (voditeljicom cen-tra za poduzetništvo Osijek) te Donnom Šimatić (predsjednicom Savjeta mladih Osječko-baranjske županije). Gosti kave su, svatko iz svoje perspek-tive, iznijeli pozitivne pomake koji se događaju u Gradu i Županiji te razloge zbog koji ova sredina ima potencijala za rast, razvoj i napredak. Pri tome je naglasak bio na brojnim mogućnostima za mlade ljude koji mogu svojim proaktivnim djelovanjem i u ovoj sredini ostvariti svoje potencijale čineći ju time privlačnijim i ugodnijim mjestom za život. U nastavku je uslijedilo predavanje „Moj Osijek 2020“ na kojem su prof. dr. sc. Sunčica Oberman Pe-terka i Kornelija Mlinarević (pročelnica Upravnog odjela za programe i projekte Europske unije i gosp-odarstvo Grada Osijeka) komentirale Strategiju raz-voja Grada Osijeka do 2020. „Od industrijskog do inteligentnoga grada“ i aktualnu situaciju u gradu. Nastavno na to, Danijela Beretin je kroz dvosatnu radionicu „Upomoć - kamo s otpadom“ pojasnila su-dionicima kojih se direktiva EU moramo pridržavati u tome sektoru te kako održivo gospodariti otpa-dom na siguran i učinkovit način bez sankcija. Prvi dan završio je kratkim osvrtom Marijane Bošnjak (direktorice Kinematografa Osijek d.d.) nakon čega je pred punim kinom Urania prikazan europski film.S obzirom da su studentski projekti doprinosu oblik-ovanja javnoga mnijenja o EU-u (ostvareni u okviru kolegija Institucijski sustav EU-a) bili jedan od poti-caja organizacije obilježavanja Europskog tjedana na EFOS-u, studenti su tom prilikom nastavili rani-je započetu suradnju s OŠ Antuna Mihanovića te je četrdesetoro učenika 2. razreda dva dana sudjelovao na radionici „Na (naj)mlađima EU ostaje“. Djeca su pokazala zavidno znanje o EU-u, a njihova aktivnost i spremnost za suradnju oduševila je studente koji su moderirali radionicu. Maskota EU znalac, koju su studenti izradili za tu prigodu, upotpunila je dječje viđenje i spoznaju važnosti posjedovanja znanja o Europskoj uniji. Četvrtak, 7. svibnja, nastavio se četirima radioni-cama: „Koga briga za (moju) sreću“ koju su vodili doc. dr. sc. Anita Frajman Ivković i Danijel Mišura, mag. psych, „Ostvari utjecaj kroz profesionalno lo-biranje na etičan način“ mr. Tanje Milošević, „Vo-lontiram – dakle jesam, u Europi“ doc. dr. sc. Julie Perić i Volonterskoga centra Osijek, te „EURES – moja mogućnost za bolju budućnost“ Enise Kifer,
dip. oec. Pred punom Aulom glagoljice tribinu “Ne dirajte mi ravnicu prava - bilo kuda glazba svuda” održao je Miroslav Škoro. Radionica za koju su studenti inicijalno pokazali najviše interesa bila je „Usudi se prijeći granice – Erasmusiraj se“ koju je moderirao student Mislav Mihaljević. Predavanje „Semestar u inozemstvu“ održale su Martina Šuto, prof., prof. dr. sc. Sanja Pfeifer i doc. dr. sc. Marina Jeger, a gostovali su i brojni studenti koji su već bili na razmjeni i koji su svoja iskustva iz prve ruke po-dijelili i u nastavku dana u ležernijoj atmosferi „EU cafea“.Zadnji dan programa Europskog EFOS tjedna obilježio je talk show „Petkom u podne” tijekom kojeg je Danijel Čahajić ugostio prof. dr. sc. Davora Škrleca (zastupnika u Europskom parlamentu) koji je svojim otvorenim pristupom govorio o održivom razvoju, te na kraju proglasio pobjednike natječaja „Pravim pitanjem do Bruxellesa“. Njegov asist-ent, Uroš-Valentino Saraja nastavio je s otvorenim razgovorom „EU lega u Osijeku“ kojim se nastavila suradnja ostvarena prethodne akademske godine. Ostatak dana upotpunile su radionice „Naši novci, njihova naša briga“ doc. dr. sc. Ive Mijoča, „Kako kroz europsku pra(v)šumu“ doc. dc. sc. Dunje Duić, predavanje „Zdrav (pre)živjeti u Europi“ prof. prim. dr. sc. Dragutina Kadojića i Kristijana Dinjara, dr.med., te radionice „Prečaci za podatkovni EU la-birint“ doc. dr. sc. Josipe Mijoč i „Kupi me, zaštiti se“ Dunje Mak, mag. iur. Obilježavanje Europ-skog EFOS tjedna završilo je stand up programom „Smiješna strana Europe” u Auli glagoljice.U konačnici, cilj događanja bio je biti centralno mjesto za pronalaženje informacija koje mogu i trebaju oblikovati budućnost mladih, posebice stu-denata. Brojne ostvarene suradnje koje su rezul-tat ovog događanja govore tome u prilog: najbolji studenti imali su priliku nakon dva tjedna pos-jetiti Kuću Europe u Zagrebu (http://www.efos.unios.hr/studenti-efos-a-u-kuci-europe-u-zagrebu-21-i-22-5-2015/) te sudjelovati na studentskoj kon-ferenciji u suradnji s Kućom Europe i Fakultetom političkih znanosti; pobjednici natječaja „Pravim pitanjem do Bruxellesa” (http://www.efos.unios.hr/natjecaj-pravim-pitanjem-do-bruxellesa/) otputo-vat će u Bruxelles krajem lipnja, a desetak volontera ide na Open Days u Bruxelles u listopadu. Ostaje vidjeti kakve će dodatne učinke cijelo događanje imati na studente i ostale posjetitelje koji bi, svjesni svojega potencijala i mogućnosti, iste mogli staviti u funkciju razvoja lokalne zajednice stvarajući pri tome sinergijske učinke.
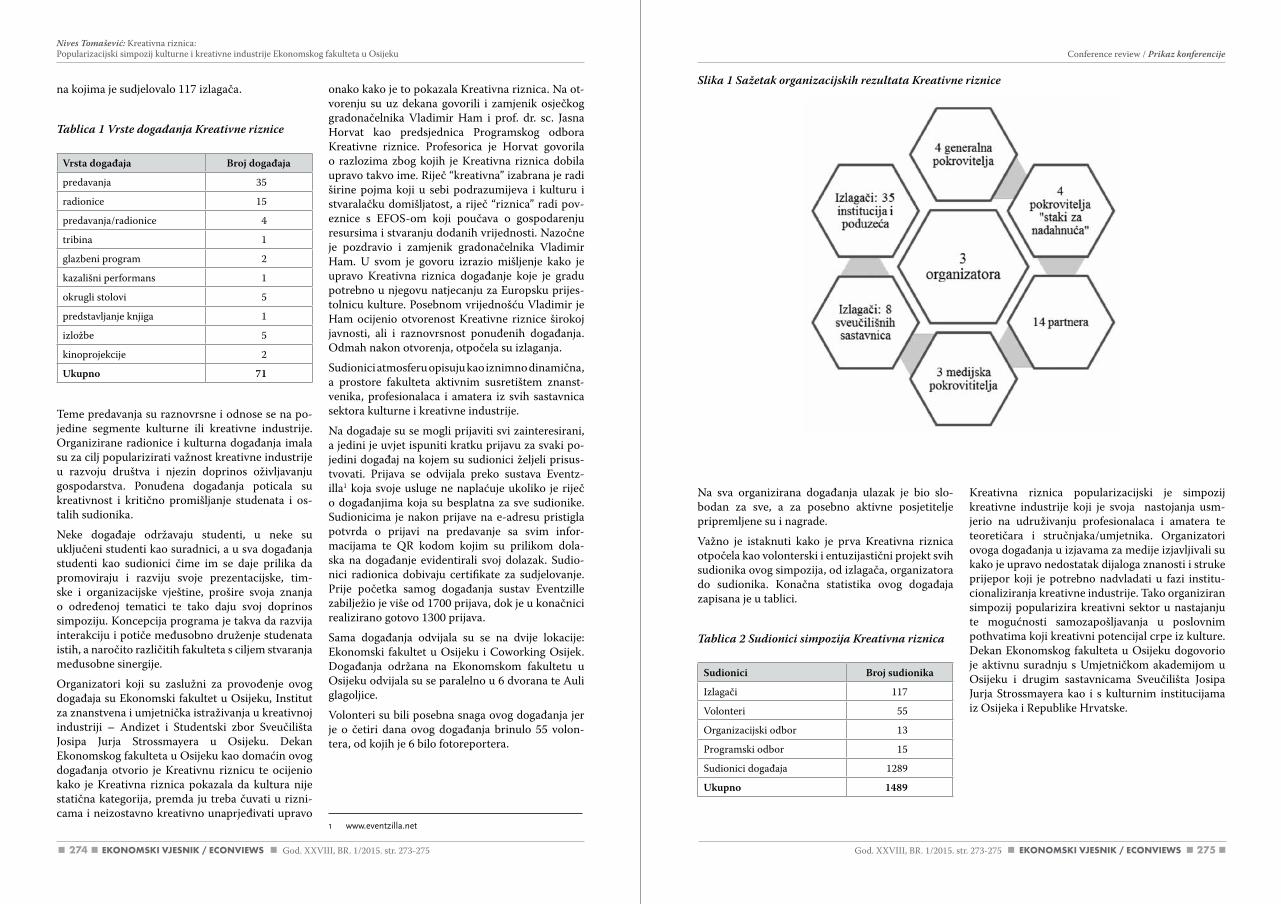
274 275
Nives Tomašević: Kreativna riznica: Popularizacijski simpozij kulturne i kreativne industrije Ekonomskog fakulteta u Osijeku Conference review / Prikaz konferencije
God. XXVIII, BR. 1/2015. str. 273-275 God. XXVIII, BR. 1/2015. str. 273-275
Na sva organizirana događanja ulazak je bio slo-bodan za sve, a za posebno aktivne posjetitelje pripremljene su i nagrade.
Važno je istaknuti kako je prva Kreativna riznica otpočela kao volonterski i entuzijastični projekt svih sudionika ovog simpozija, od izlagača, organizatora do sudionika. Konačna statistika ovog događaja zapisana je u tablici.
Tablica 2 Sudionici simpozija Kreativna riznica
Sudionici Broj sudionika
Izlagači 117
Volonteri 55
Organizacijski odbor 13
Programski odbor 15
Sudionici događaja 1289
Ukupno 1489
Kreativna riznica popularizacijski je simpozij kreativne industrije koji je svoja nastojanja usm-jerio na udruživanju profesionalaca i amatera te teoretičara i stručnjaka/umjetnika. Organizatori ovoga događanja u izjavama za medije izjavljivali su kako je upravo nedostatak dijaloga znanosti i struke prijepor koji je potrebno nadvladati u fazi institu-cionaliziranja kreativne industrije. Tako organiziran simpozij popularizira kreativni sektor u nastajanju te mogućnosti samozapošljavanja u poslovnim pothvatima koji kreativni potencijal crpe iz kulture. Dekan Ekonomskog fakulteta u Osijeku dogovorio je aktivnu suradnju s Umjetničkom akademijom u Osijeku i drugim sastavnicama Sveučilišta Josipa Jurja Strossmayera kao i s kulturnim institucijama iz Osijeka i Republike Hrvatske.
na kojima je sudjelovalo 117 izlagača.
Tablica 1 Vrste događanja Kreativne riznice
Vrsta događaja Broj događaja
predavanja 35
radionice 15
predavanja/radionice 4
tribina 1
glazbeni program 2
kazališni performans 1
okrugli stolovi 5
predstavljanje knjiga 1
izložbe 5
kinoprojekcije 2
Ukupno 71
Teme predavanja su raznovrsne i odnose se na po-jedine segmente kulturne ili kreativne industrije. Organizirane radionice i kulturna događanja imala su za cilj popularizirati važnost kreativne industrije u razvoju društva i njezin doprinos oživljavanju gospodarstva. Ponuđena događanja poticala su kreativnost i kritično promišljanje studenata i os-talih sudionika.
Neke događaje održavaju studenti, u neke su uključeni studenti kao suradnici, a u sva događanja studenti kao sudionici čime im se daje prilika da promoviraju i razviju svoje prezentacijske, tim-ske i organizacijske vještine, prošire svoja znanja o određenoj tematici te tako daju svoj doprinos simpoziju. Koncepcija programa je takva da razvija interakciju i potiče međusobno druženje studenata istih, a naročito različitih fakulteta s ciljem stvaranja međusobne sinergije.
Organizatori koji su zaslužni za provođenje ovog događaja su Ekonomski fakultet u Osijeku, Institut za znanstvena i umjetnička istraživanja u kreativnoj industriji – Andizet i Studentski zbor Sveučilišta Josipa Jurja Strossmayera u Osijeku. Dekan Ekonomskog fakulteta u Osijeku kao domaćin ovog događanja otvorio je Kreativnu riznicu te ocijenio kako je Kreativna riznica pokazala da kultura nije statična kategorija, premda ju treba čuvati u rizni-cama i neizostavno kreativno unaprjeđivati upravo
onako kako je to pokazala Kreativna riznica. Na ot-vorenju su uz dekana govorili i zamjenik osječkog gradonačelnika Vladimir Ham i prof. dr. sc. Jasna Horvat kao predsjednica Programskog odbora Kreativne riznice. Profesorica je Horvat govorila o razlozima zbog kojih je Kreativna riznica dobila upravo takvo ime. Riječ “kreativna” izabrana je radi širine pojma koji u sebi podrazumijeva i kulturu i stvaralačku domišljatost, a riječ “riznica” radi pov-eznice s EFOS-om koji poučava o gospodarenju resursima i stvaranju dodanih vrijednosti. Nazočne je pozdravio i zamjenik gradonačelnika Vladimir Ham. U svom je govoru izrazio mišljenje kako je upravo Kreativna riznica događanje koje je gradu potrebno u njegovu natjecanju za Europsku prijes-tolnicu kulture. Posebnom vrijednošću Vladimir je Ham ocijenio otvorenost Kreativne riznice širokoj javnosti, ali i raznovrsnost ponuđenih događanja. Odmah nakon otvorenja, otpočela su izlaganja.
Sudionici atmosferu opisuju kao iznimno dinamična, a prostore fakulteta aktivnim susretištem znanst-venika, profesionalaca i amatera iz svih sastavnica sektora kulturne i kreativne industrije.
Na događaje su se mogli prijaviti svi zainteresirani, a jedini je uvjet ispuniti kratku prijavu za svaki po-jedini događaj na kojem su sudionici željeli prisus-tvovati. Prijava se odvijala preko sustava Eventz-illa1 koja svoje usluge ne naplaćuje ukoliko je riječ o događanjima koja su besplatna za sve sudionike. Sudionicima je nakon prijave na e-adresu pristigla potvrda o prijavi na predavanje sa svim infor-macijama te QR kodom kojim su prilikom dola-ska na događanje evidentirali svoj dolazak. Sudio-nici radionica dobivaju certifikate za sudjelovanje. Prije početka samog događanja sustav Eventzille zabilježio je više od 1700 prijava, dok je u konačnici realizirano gotovo 1300 prijava.
Sama događanja odvijala su se na dvije lokacije: Ekonomski fakultet u Osijeku i Coworking Osijek. Događanja održana na Ekonomskom fakultetu u Osijeku odvijala su se paralelno u 6 dvorana te Auli glagoljice.
Volonteri su bili posebna snaga ovog događanja jer je o četiri dana ovog događanja brinulo 55 volon-tera, od kojih je 6 bilo fotoreportera.
1 www.eventzilla.net
Slika 1 Sažetak organizacijskih rezultata Kreativne riznice
277
Opis časopisa
Ekonomski vjesnik / Econviews - Review of Con-temporary Business, Entrepreneurship and Eco-nomic Issues usmjeren je znanstvenicima i praktičarima. Objavljuje radove koji doprinose te-orijskim, metodološkim i empirijskim spoznajama u kompleksnom području ekonomije. Radovi se mogu temeljiti na kvantitativnim i na kvalitativnim analizama, mogu predstavljati sinteze dosadašnjih istraživanja i ukazivati na otvorena pitanja u poseb-nim područjima društveno-ekonomske prakse. Prihvaćaju se radovi usmjereni na različite razine istraživanja (od pojedinačnih slučajeva do manjih ili velikih uzoraka) i različite kontekstualne okvire (mala, srednja i velika poduzeća, industrijski sek-tori, lokalna, regionalna i nacionalna gospodarst-va, međunarodna ekonomija, gospodarske grane, zdravstvo i obrazovanje, rad i demografija, prirodni potencijali i drugi društveno-ekonomski okviri).
Časopis je usmjeren na znanstvena područja ekonomije, poslovne ekonomije i poduzetništva, a zbog njihove neodvojive povezanosti s drugim dis-ciplinama - informacijskim i tehničkim znanostima, pravom, sociologijom, psihologijom i drugima, ob-javljuju se i radovi s multidisciplinarnim sadržajima.
Vrste radova
Časopis objavljuje recenzirane radove (znanstvene članke), izvješća o istraživanju, znanstvene rasprave i prikaze. Povremeno se izdaju i tematski brojevi. Radovi podliježu postupku dvostruke slijepe recen-zije (eng. double blind review) koju provode domaći i međunarodni recenzenti. U okviru postupka stručnog recenziranja, radovi objavljeni u časopisu svrstavaju se u jednu od sljedećih kategorija: izvorni znanstveni radovi, prethodna priopćenja, pregledni radovi i stručni radovi. Radovi moraju biti na en-gleskom jeziku. Stručni radovi, prikazi i slični prilo-zi mogu se objavljivati na hrvatskom jeziku.
Podnošenje radova
Podneseni radovi ne bi smjeli biti ranije objavljeni niti predani na razmatranje za objavljivanje negdje drugdje. Radovi se dostavljaju u elektroničkom ob-liku na elektroničku adresu: [email protected]. Detaljne upute za autore mogu se pronaći na http://www.efos.unios.hr/ekonomski-vjesnik/upute-autorima/. Uz rad u odvojenoj datoteci potrebno je dostaviti naslovnu stranicu i kratku bio-grafiju (ne više od 100 riječi) za svakog (su)autora.
Autorska prava (Copyright)
Autori čiji se rad objavljuje u časopisu Ekonomski vjesnik / Econviews - Review of Contemporary Business, Entrepreneurship and Economic Issues automatski prenose svoja autorska prava na časopis, koji pridržava ta prava za sve radove koji su u njemu objavljeni. Rukopisi se ne vraćaju.
Upute autorima
278 279
Upute autorima
Etička načela
Etička načela za časopis Ekonomski Vjesnik / Econ-views - Review of Contemporary Business, Entre-preneurship and Economic Issues temelje se na sm-jernicama za najbolju praksu za urednike časopisa Udruge za etiku objavljivanja (COPE - Committee on Publication Ethics).
Opće smjernice za autore(General guidelines for authors)
Ne postoje strogi uvjeti, ali svi radovi moraju sadržavati bitne elemente kao što su: sažetak, ključne riječi, uvod, pregled dosadašnjih istraživanja (teorijski okvir), metodologija, rezultati, rasprava, zaključak. Takva se struktura preporučuje za znan-stvene članke u kategoriji izvornih članaka, preth-odnih priopćenja i preglednih radova.
Radove je potrebno formatirati za ispis na papiru veličine 210 x 297 mm. Treba koristiti fontove Times New Roman ili Arial veličine 12 (osim ako ovdje nije drugačije navedeno), a prored treba biti 1.5. Margine stranica (lijevu, desnu, gornju i donju) treba postaviti na 25 mm. Tekst mora biti poravnat s lijevom i desnom marginom (obostrano poravnato). Rad bi trebao imati između 5000 i 8000 riječi.
Detaljne Upute za autore mogu se pronaći na http://www.efos.unios.hr/ekonomski-vjesnik/upute-autorima/. Radovi koji nisu napisani u skladu s uputama neće se uzeti u obzir za objavljivanje.
UredništvoDescription of the journal
Ekonomski Vjesnik / Econviews – Review of Con-temporary Entrepreneurship, Business, and Eco-nomic Issues is intended for researchers and prac-titioners, and devoted to the publication of papers that contribute to the theoretical, methodological and empirical insights in the complex field of eco-nomics. Articles can be based on quantitative as well as qualitative analyses; they can be a synthe-sis of previous research and discuss open issues in specific areas of social and economic practice. The journal welcomes papers focused on different levels of analysis (from individual cases to small or large samples) and contexts (SMEs and large compa-nies, industrial sectors, local, regional and national economies, international economics, branches of economy, healthcare and education, labour and demographics, natural resources and other socio-economic frameworks).
The journal is focused on research in economics, business economics and entrepreneurship, how-ever, as these are closely intertwined with other dis-ciplines – information and technical sciences, law, sociology, psychology and other fields – multidisci-plinary submissions are also welcome.
Types of papers
The journal publishes reviewed papers (scholarly articles), research reports, scholarly debates and re-views. Individual issues can be dedicated to more specific topics. Submissions will undergo a double blind review. Within the peer review process, pa-pers published in the journal are categorized in one of the following categories: original scientific pa-pers, preliminary communications, review papers and professional papers. Papers must be in English.Professional papers, presentations and other contri-butions can be published in Croatian.
Submission
Submissions should not be published earlier or be under consideration for publication elsewhere. The papers should be submitted electronically to the e-mail address: [email protected] addition to the main manuscript, a separate file should be sent containing the title page with a brief biographical note for each author (details below).
Copyright
Contributing authors automatically waive their copyright in favour of the journal. The journal re-serves copyright of all papers published in it.
Ethical policy
The ethics statements for Ekonomski Vjesnik / Econviews - Review of Contemporary Entrepre-neurship, Business and Economic Issues are based on the Committee on Publication Ethics (COPE) Best Practice Guidelines for Journal Editors.
Guidelines for authors
280
Guidelines for authors
General guidelines for authors
There are no strict requirements but all manu-scripts must contain the essential elements, for ex-ample: Title; Abstract; Keywords; Main part of the paper: Introduction, Review of previous research (Theoretical framework), Methodology, Results, Discussion, Conclusion, References. Such article structure is recommended for scholarly articles in the category of original scientific papers, prelimi-nary communications and review papers. Papers must be formatted so as to allow printing on paper size 210 X 297 mm. Times New Roman or Arial font, size 12 (unless otherwise stated herein) should be used, and line spacing should be 1.5.
The margins (left, right, top and bottom) should be 25mm wide. The text should be aligned with both the right and left margins (justified). The paper should have between 5000 and 8000 words.
Detailed guidelines for authors can be found at http://www.efos.unios.hr/ekonomski-vjesnik/en/guidelines-for-authors/. Papers that do not adhere to these guidelines will not be considered for pub-lication.
Editorial Board


![Untitled-1 [untz.ba]](https://img.pdfslide.us/doc/110x75/6170c406ce95310d177bbfd2/untitled-1-untzba.jpg)