Embed Size (px)
Citation preview

01/27/2015 i:\Budget\2015-16 Budget\2015-01-27 Budget Presentation 1
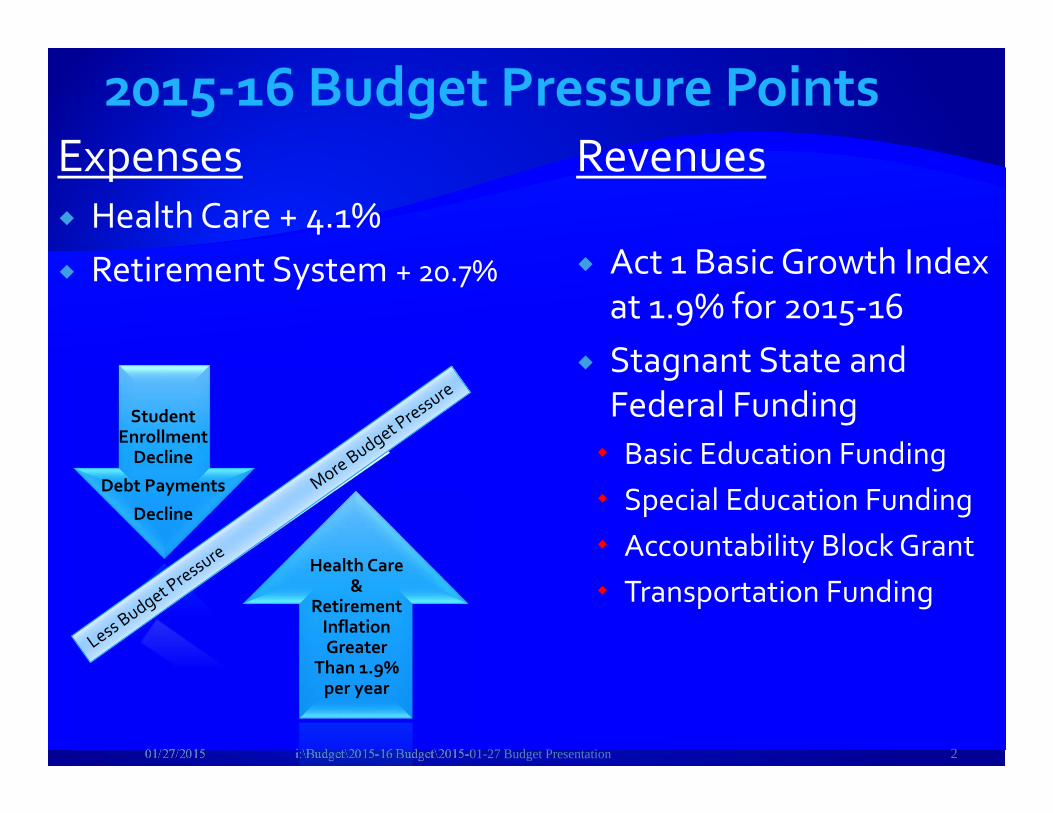
Expenses Health Care + 4.1% Retirement System + 20.7%
Revenues
Act 1 Basic Growth Index at 1.9% for 2015‐16
Stagnant State and Federal Funding Basic Education Funding Special Education Funding Accountability Block Grant Transportation Funding
01/27/2015 i:\Budget\2015-16 Budget\2015-01-27 Budget Presentation 2
Student Enrollment Decline
Debt Payments
Decline
Health Care &
Retirement Inflation Greater
Than 1.9% per year
01/27/2015 3i:\Budget\2015-16 Budget\2015-01-27 Budget Presentation
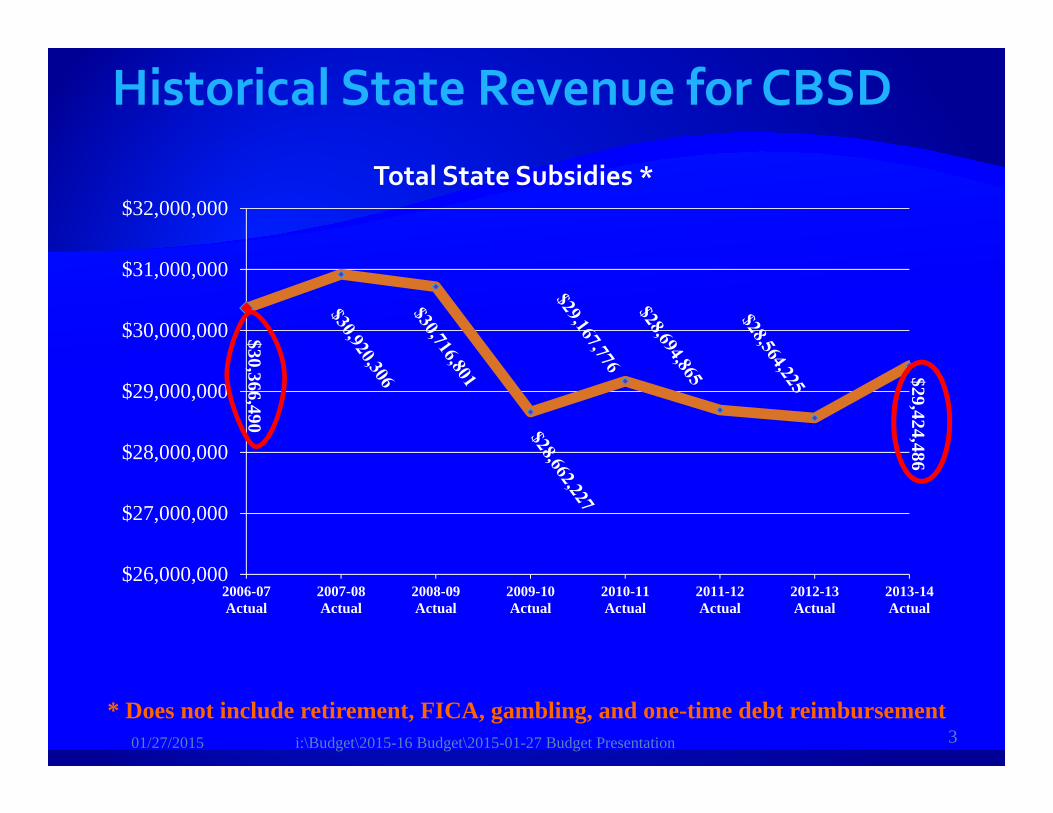
* Does not include retirement, FICA, gambling, and one-time debt reimbursement
$30,366,490
$29,424,486
$26,000,000
$27,000,000
$28,000,000
$29,000,000
$30,000,000
$31,000,000
$32,000,000
2006-07Actual
2007-08Actual
2008-09Actual
2009-10Actual
2010-11Actual
2011-12Actual
2012-13Actual
2013-14Actual
Total State Subsidies *
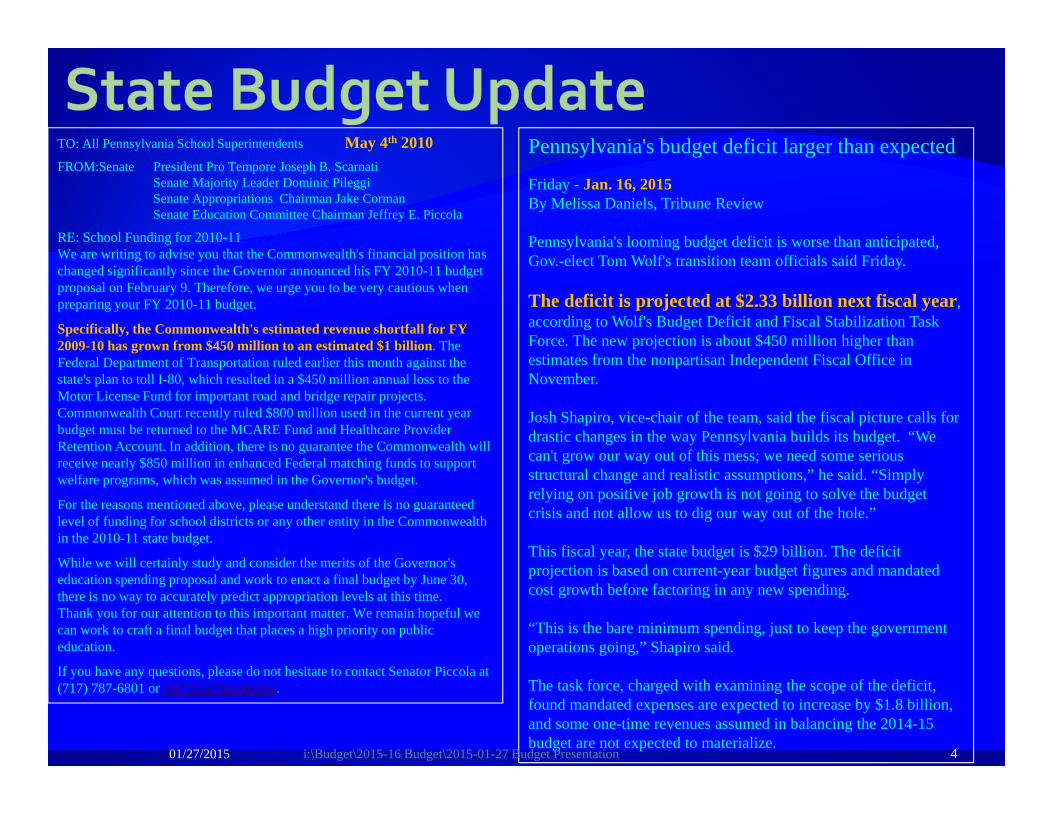
TO: All Pennsylvania School Superintendents May 4th 2010FROM:Senate President Pro Tempore Joseph B. Scarnati
Senate Majority Leader Dominic PileggiSenate Appropriations Chairman Jake CormanSenate Education Committee Chairman Jeffrey E. Piccola
RE: School Funding for 2010-11 We are writing to advise you that the Commonwealth's financial position has changed significantly since the Governor announced his FY 2010-11 budget proposal on February 9. Therefore, we urge you to be very cautious when preparing your FY 2010-11 budget.
Specifically, the Commonwealth's estimated revenue shortfall for FY 2009-10 has grown from $450 million to an estimated $1 billion. The Federal Department of Transportation ruled earlier this month against the state's plan to toll I-80, which resulted in a $450 million annual loss to the Motor License Fund for important road and bridge repair projects. Commonwealth Court recently ruled $800 million used in the current year budget must be returned to the MCARE Fund and Healthcare Provider Retention Account. In addition, there is no guarantee the Commonwealth will receive nearly $850 million in enhanced Federal matching funds to support welfare programs, which was assumed in the Governor's budget.
For the reasons mentioned above, please understand there is no guaranteed level of funding for school districts or any other entity in the Commonwealth in the 2010-11 state budget.
While we will certainly study and consider the merits of the Governor's education spending proposal and work to enact a final budget by June 30, there is no way to accurately predict appropriation levels at this time. Thank you for our attention to this important matter. We remain hopeful we can work to craft a final budget that places a high priority on public education.
If you have any questions, please do not hesitate to contact Senator Piccola at (717) 787-6801 or [email protected].
01/27/2015 4
Pennsylvania's budget deficit larger than expected
Friday - Jan. 16, 2015 By Melissa Daniels, Tribune Review
Pennsylvania's looming budget deficit is worse than anticipated, Gov.-elect Tom Wolf's transition team officials said Friday.
The deficit is projected at $2.33 billion next fiscal year, according to Wolf's Budget Deficit and Fiscal Stabilization Task Force. The new projection is about $450 million higher than estimates from the nonpartisan Independent Fiscal Office in November.
Josh Shapiro, vice-chair of the team, said the fiscal picture calls for drastic changes in the way Pennsylvania builds its budget. “We can't grow our way out of this mess; we need some serious structural change and realistic assumptions,” he said. “Simply relying on positive job growth is not going to solve the budget crisis and not allow us to dig our way out of the hole.”
This fiscal year, the state budget is $29 billion. The deficit projection is based on current-year budget figures and mandated cost growth before factoring in any new spending.
“This is the bare minimum spending, just to keep the government operations going,” Shapiro said.
The task force, charged with examining the scope of the deficit, found mandated expenses are expected to increase by $1.8 billion, and some one-time revenues assumed in balancing the 2014-15 budget are not expected to materialize.
i:\Budget\2015-16 Budget\2015-01-27 Budget Presentation
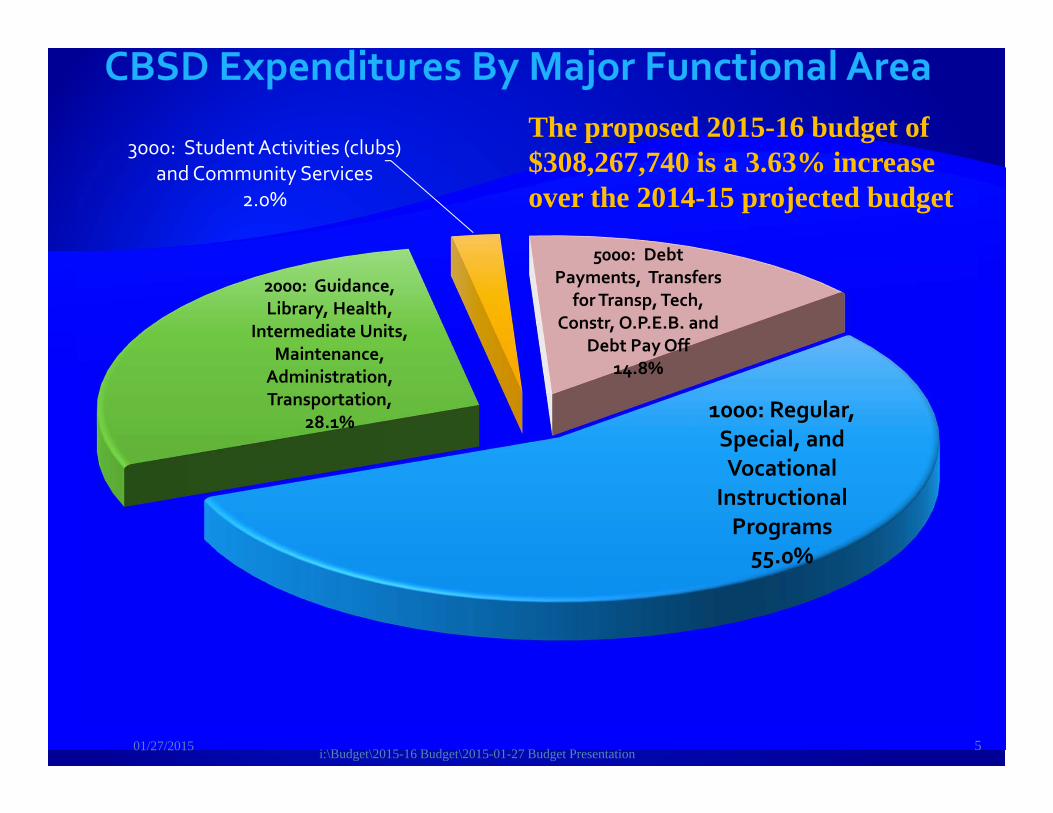
1000: Regular, Special, and Vocational Instructional Programs55.0%
2000: Guidance, Library, Health,
Intermediate Units, Maintenance, Administration, Transportation,
28.1%
3000: Student Activities (clubs) and Community Services
2.0%
5000: Debt Payments, Transfers
for Transp, Tech, Constr, O.P.E.B. and
Debt Pay Off14.8%
The proposed 2015-16 budget of $308,267,740 is a 3.63% increase over the 2014-15 projected budget
01/27/2015 i:\Budget\2015-16 Budget\2015-01-27 Budget Presentation 5
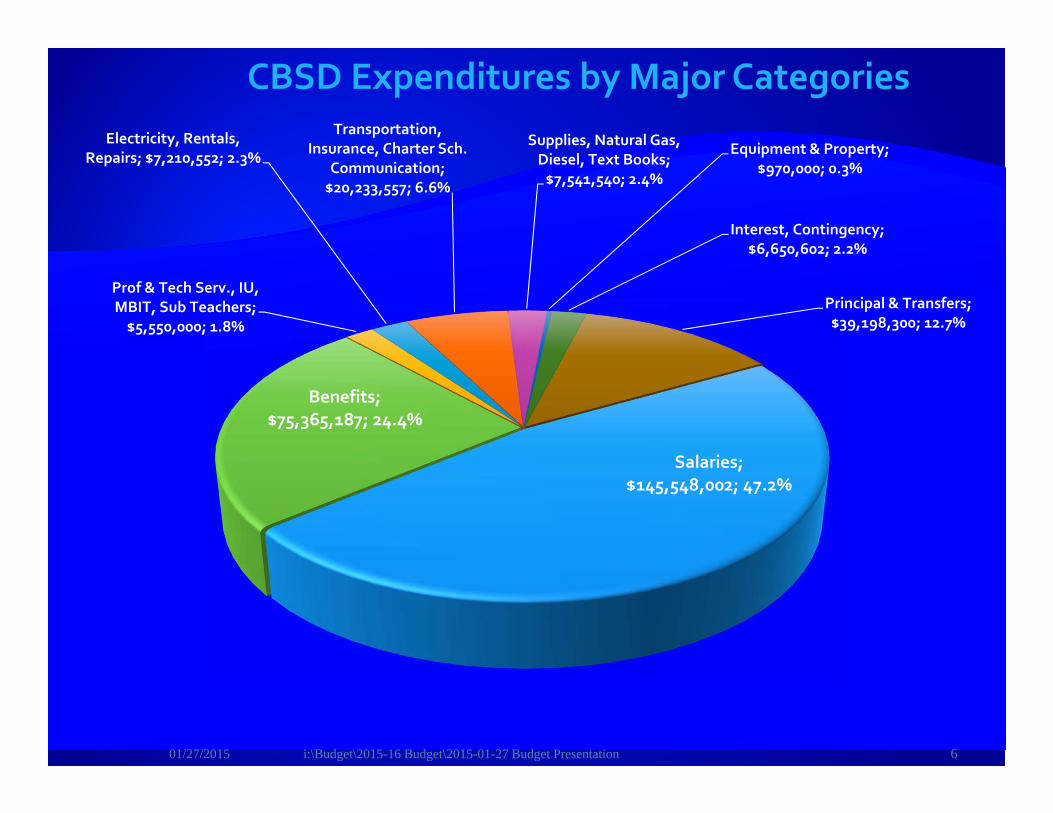
Salaries; $145,548,002; 47.2%
Benefits; $75,365,187; 24.4%
Prof & Tech Serv., IU, MBIT, Sub Teachers; $5,550,000; 1.8%
Electricity, Rentals, Repairs; $7,210,552; 2.3%
Transportation, Insurance, Charter Sch.
Communication; $20,233,557; 6.6%
Supplies, Natural Gas, Diesel, Text Books; $7,541,540; 2.4%
Equipment & Property; $970,000; 0.3%
Interest, Contingency; $6,650,602; 2.2%
Principal & Transfers; $39,198,300; 12.7%
01/27/2015 i:\Budget\2015-16 Budget\2015-01-27 Budget Presentation 6
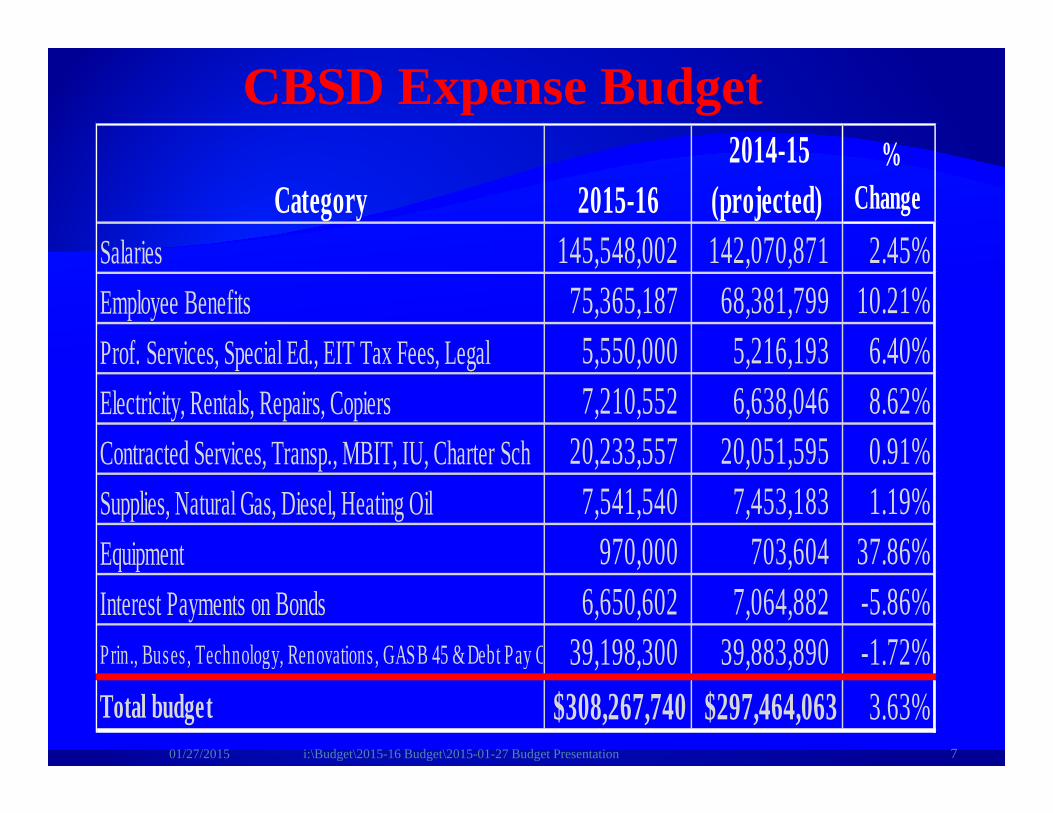
Category 2015-16 2014-15
(projected) %
Change Salaries 145,548,002 142,070,871 2.45%Employee Benefits 75,365,187 68,381,799 10.21%Prof. Services, Special Ed., EIT Tax Fees, Legal 5,550,000 5,216,193 6.40%Electricity, Rentals, Repairs, Copiers 7,210,552 6,638,046 8.62%Contracted Services, Transp., MBIT, IU, Charter Sch 20,233,557 20,051,595 0.91%Supplies, Natural Gas, Diesel, Heating Oil 7,541,540 7,453,183 1.19%Equipment 970,000 703,604 37.86%Interest Payments on Bonds 6,650,602 7,064,882 -5.86%Prin., Buses , Technology, Renovations , GASB 45 & Debt Pay O 39,198,300 39,883,890 -1.72%Total budget $308,267,740 $297,464,063 3.63%
CBSD Expense Budget
01/27/2015 i:\Budget\2015-16 Budget\2015-01-27 Budget Presentation 7
01/27/2015 i:\Budget\2015-16 Budget\2015-01-27 Budget Presentation 8
1.09
%1.
15% 3.
77%
4.23
%4.
69% 6.46
%7.
13%
4.76
%4.
78%
5.64
%
8.65
%16.93%
21.40%
25.84%
29.6
9%30
.62%
31.5
6%32
.23%
32.0
2%31
.90%
31.9
6%31
.90%
31.8
3%31
.90%
31.9
9%32
.10%
32.2
0%32
.31%
32.4
3%32
.58%
32.7
2%32
.88%
33.0
3%18
.12%
14.2
7%12
.46%
10.4
3%8.
80%
7.28
%5.
93%
4.55
%4.
14%
4.00
%3.
88%
3.75
%3.
62%
0%
5%
10%
15%
20%
25%
30%
35%01
-02
02-0
303
-04
04-0
505
-06
06-0
707
-08
08-0
909
-10
10-1
111
-12
12-1
313
-14
14-1
515
-16
16-1
717
-18
18-1
919
-20
20-2
121
-22
22-2
323
-24
24-2
525
-26
26-2
727
-28
28-2
929
-30
30-3
131
-32
32-3
333
-34
34-3
535
-36
36-3
737
-38
38-3
939
-40
40-4
141
-42
42-4
343
-44
44-4
545
-46
46-4
747
-48
Scho
ol D
istr
ict a
nd S
tate
Con
trib
utio
ns
History Budget Year Projected by PSERS as of June, 2014 ( published December 2014)
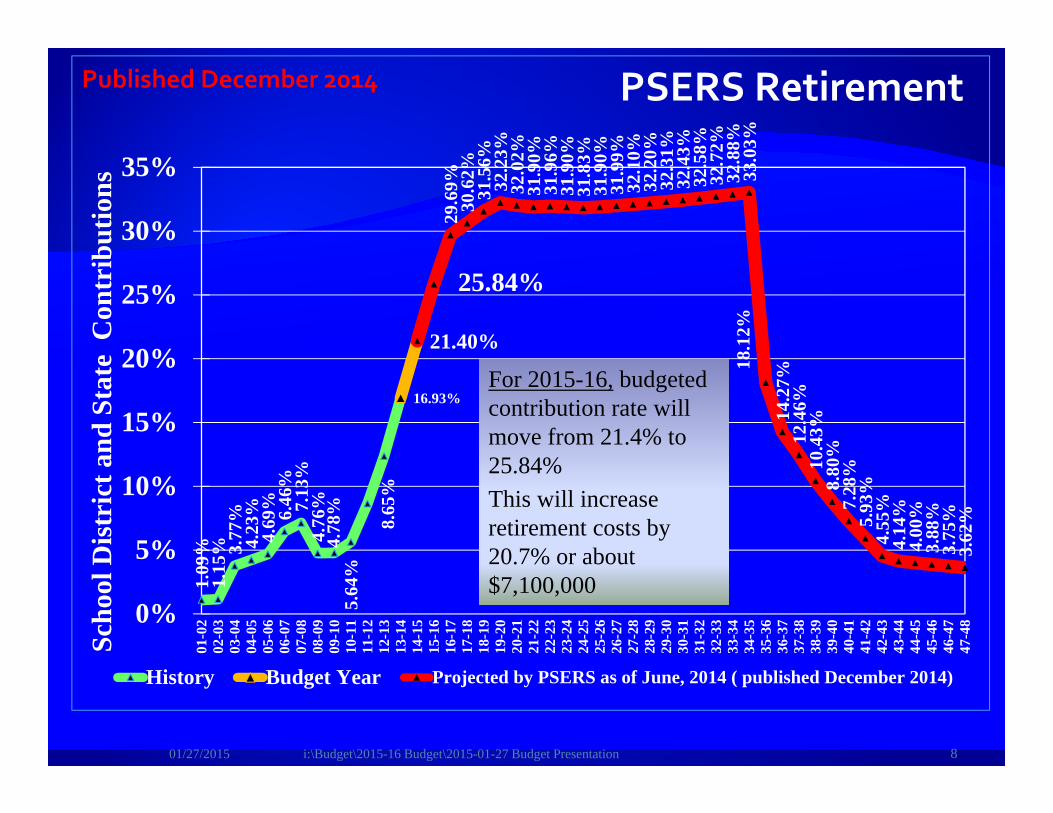
PSERS Retirement Published December 2014
For 2015-16, budgeted contribution rate will move from 21.4% to 25.84%This will increase retirement costs by 20.7% or about $7,100,000
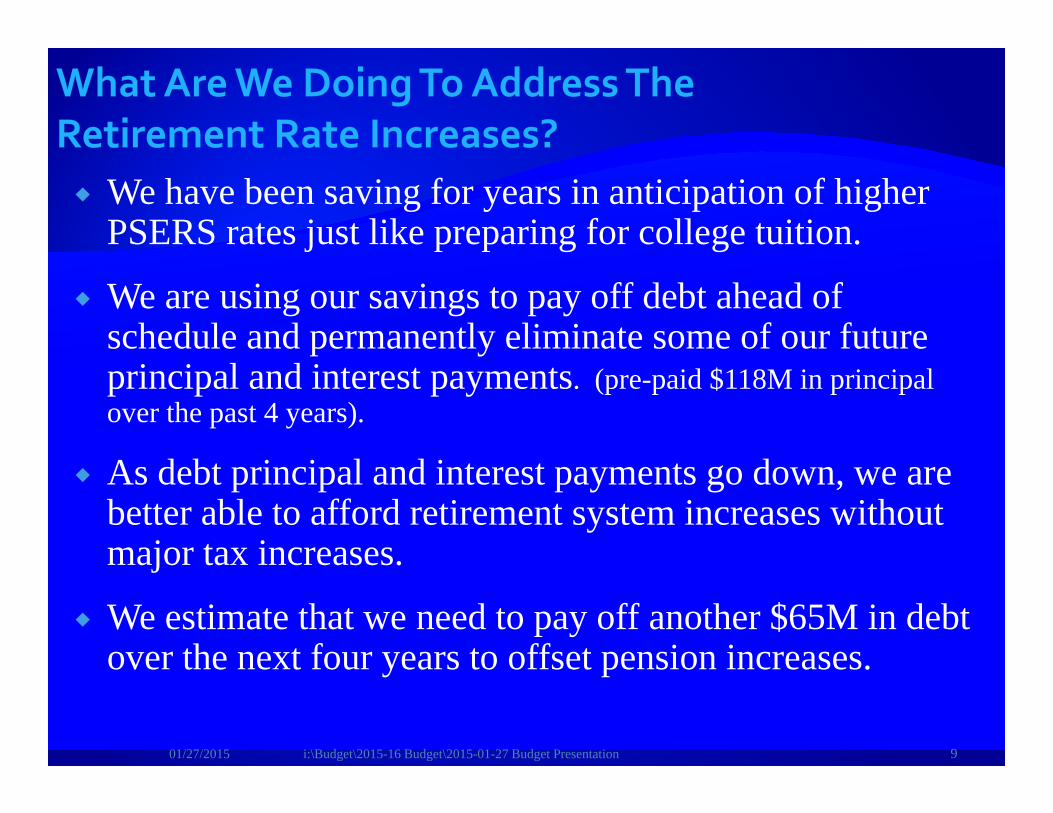
We have been saving for years in anticipation of higher PSERS rates just like preparing for college tuition.
We are using our savings to pay off debt ahead of schedule and permanently eliminate some of our future principal and interest payments. (pre-paid $118M in principal over the past 4 years).
As debt principal and interest payments go down, we are better able to afford retirement system increases without major tax increases.
We estimate that we need to pay off another $65M in debt over the next four years to offset pension increases.
01/27/2015 i:\Budget\2015-16 Budget\2015-01-27 Budget Presentation 9
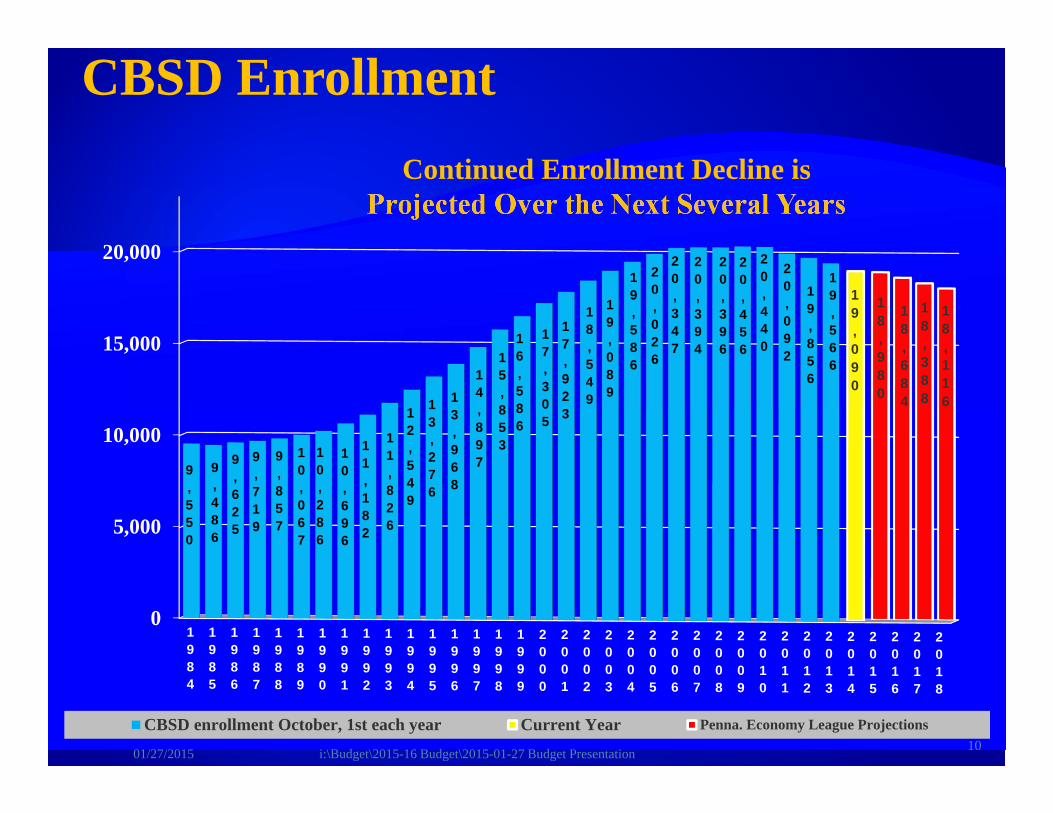
Continued Enrollment Decline is Projected Over the Next Several Years
0
5,000
10,000
15,000
20,000
1984
1985
1986
1987
1988
1989
1990
1991
1992
1993
1994
1995
1996
1997
1998
1999
2000
2001
2002
2003
2004
2005
2006
2007
2008
2009
2010
2011
2012
2013
2014
2015
2016
2017
2018
9,550
9,486
9,625
9,719
9,857
10,067
10,286
10,696
11,182
11,826
12,549
13,276
13,968
14,897
15,853
16,586
17,305
17,923
18,549
19,089
19,586
20,026
20,347
20,394
20,396
20,456
20,440
20,092
19,856
19,566
19,090
18,980
18,684
18,388
18,116
CBSD enrollment October, 1st each year Current Year Penna. Economy League Projections
CBSD Enrollment
01/27/2015 i:\Budget\2015-16 Budget\2015-01-27 Budget Presentation 10
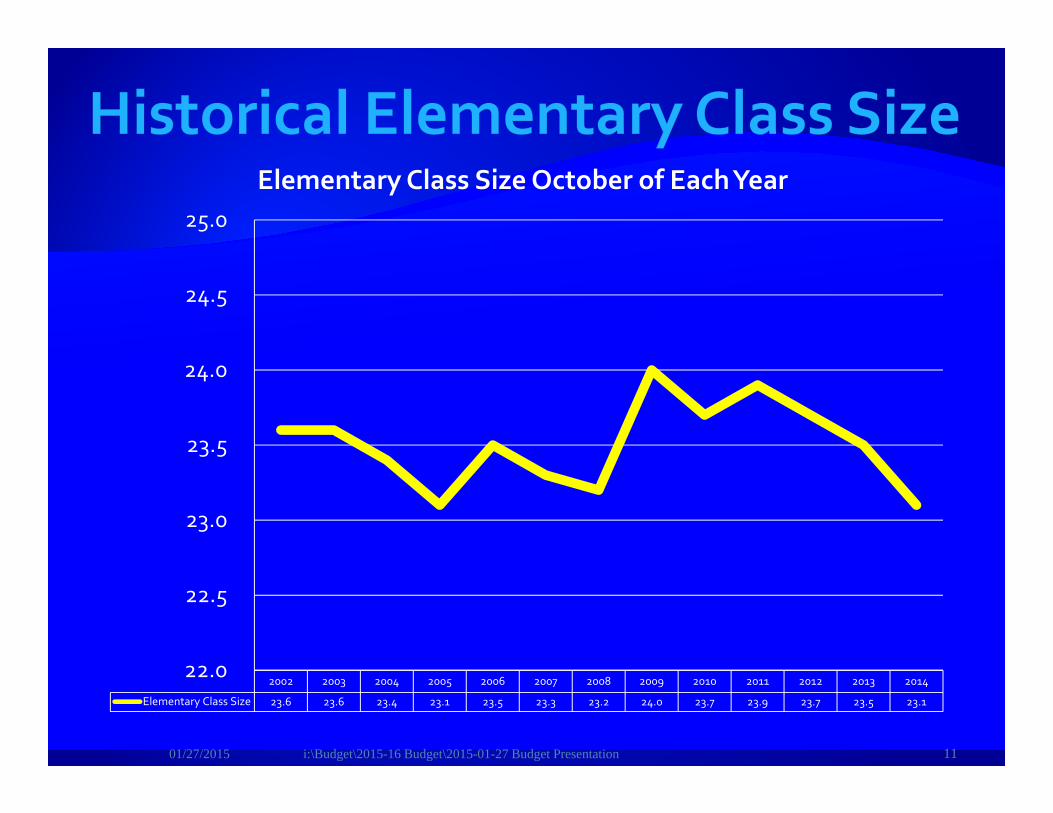
2002 2003 2004 2005 2006 2007 2008 2009 2010 2011 2012 2013 2014
Elementary Class Size 23.6 23.6 23.4 23.1 23.5 23.3 23.2 24.0 23.7 23.9 23.7 23.5 23.1
22.0
22.5
23.0
23.5
24.0
24.5
25.0
Elementary Class Size October of Each Year
01/27/2015 i:\Budget\2015-16 Budget\2015-01-27 Budget Presentation 11
0
5,000
10,000
15,000
20,000
Ben
sale
m
Bris
tol B
oro
Bris
tol T
own
Cen
tenn
ial
Cen
tral B
ucks
Cou
ncil
Roc
k
Mor
risvi
lle
Nes
ham
iny
New
Hop
e So
le.
Palis
ades
Penn
ridge
Penn
sbur
y
Qua
kerto
wn
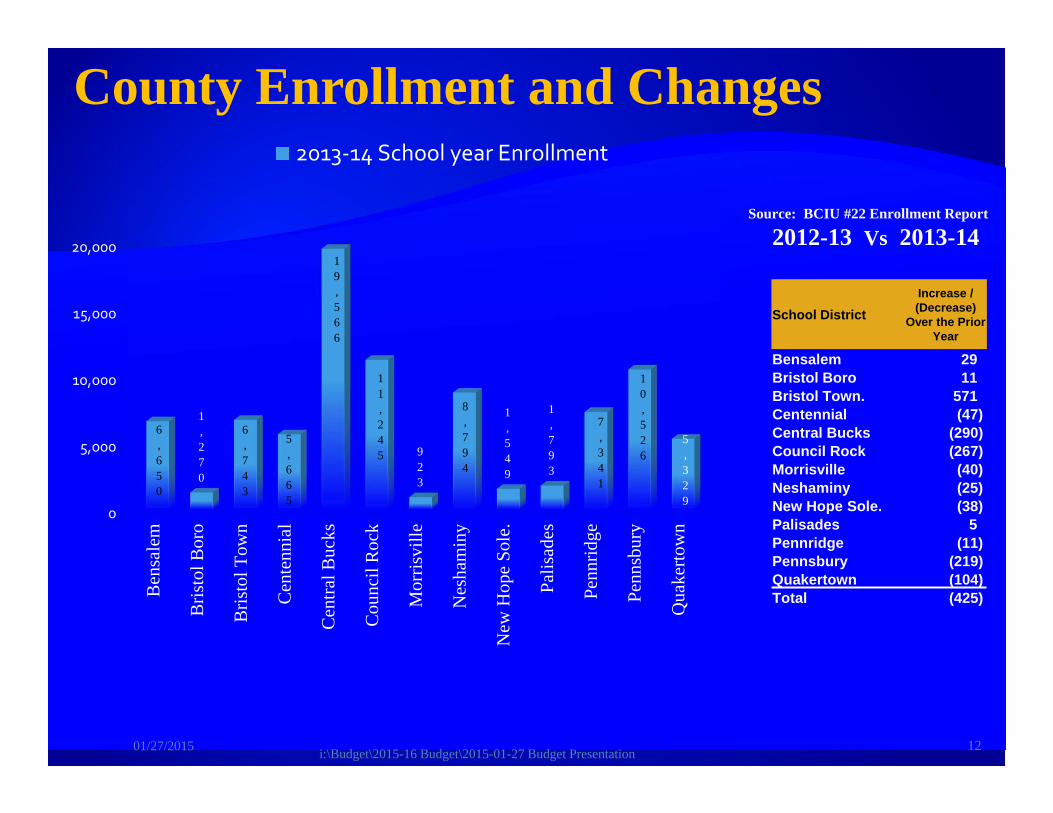
6,650
1,270
6,743
5,665
19,566
11,245 9
23
8,794
1,549
1,793
7,341
10,526
5,329
2013‐14 School year Enrollment
County Enrollment and Changes
01/27/2015 i:\Budget\2015-16 Budget\2015-01-27 Budget Presentation 12
Source: BCIU #22 Enrollment Report
2012-13 Vs 2013-14
School DistrictIncrease / (Decrease)
Over the Prior Year
Bensalem 29 Bristol Boro 11 Bristol Town. 571 Centennial (47)Central Bucks (290)Council Rock (267)Morrisville (40)Neshaminy (25)New Hope Sole. (38)Palisades 5 Pennridge (11)Pennsbury (219)Quakertown (104)Total (425)
In general our local revenues have been improving the past two years (2012-13 & 2013-14).
So far during 2014-15 our revenues are trending about $2.5M above the budgeted amount.
We will provide a complete run down on projected revenues once we see what the Governor proposes for school districts in his budget address on March 3rd.
If 2015-16 state revenues at least stay even with current budget estimates, we should be in good shape for 2015-16.
01/27/2015 i:\Budget\2015-16 Budget\2015-01-27 Budget Presentation 13
December 1, 2014 14
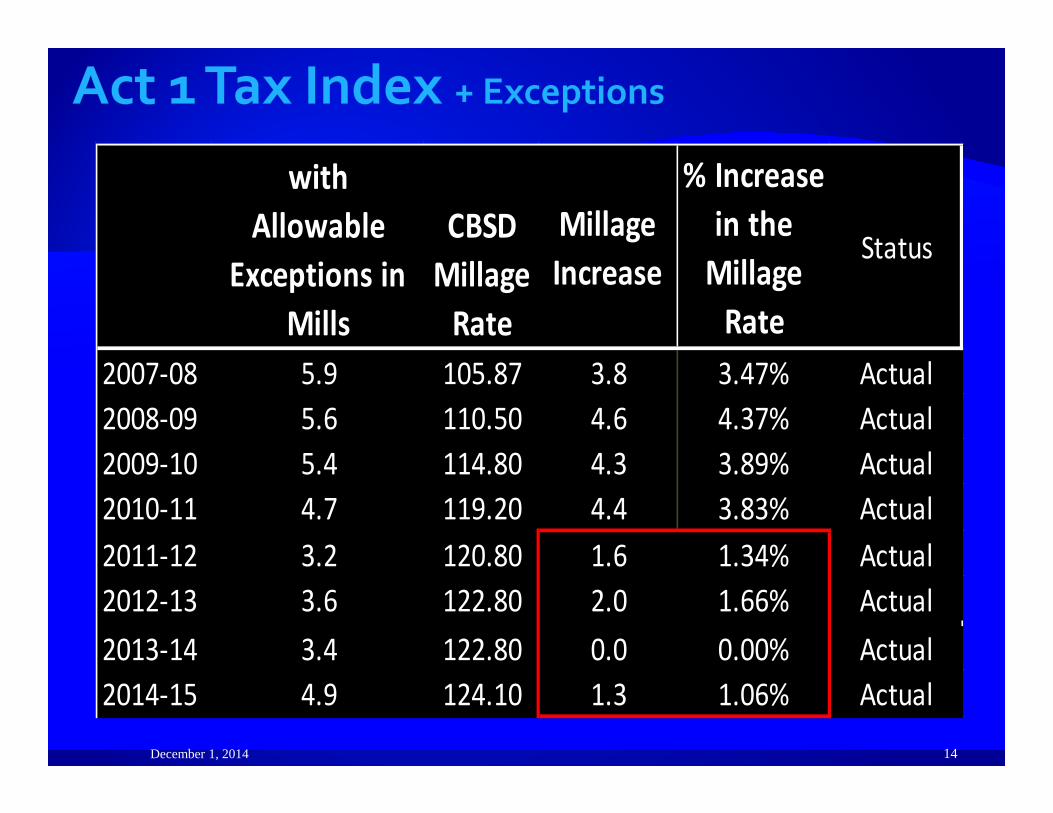
with Allowable
Exceptions in Mills
CBSD Millage Rate
Millage Increase
% Increase in the Millage Rate
Status
2007‐08 5.9 105.87 3.8 3.47% Actual2008‐09 5.6 110.50 4.6 4.37% Actual2009‐10 5.4 114.80 4.3 3.89% Actual2010‐11 4.7 119.20 4.4 3.83% Actual2011‐12 3.2 120.80 1.6 1.34% Actual2012‐13 3.6 122.80 2.0 1.66% Actual2013‐14 3.4 122.80 0.0 0.00% Actual2014‐15 4.9 124.10 1.3 1.06% Actual
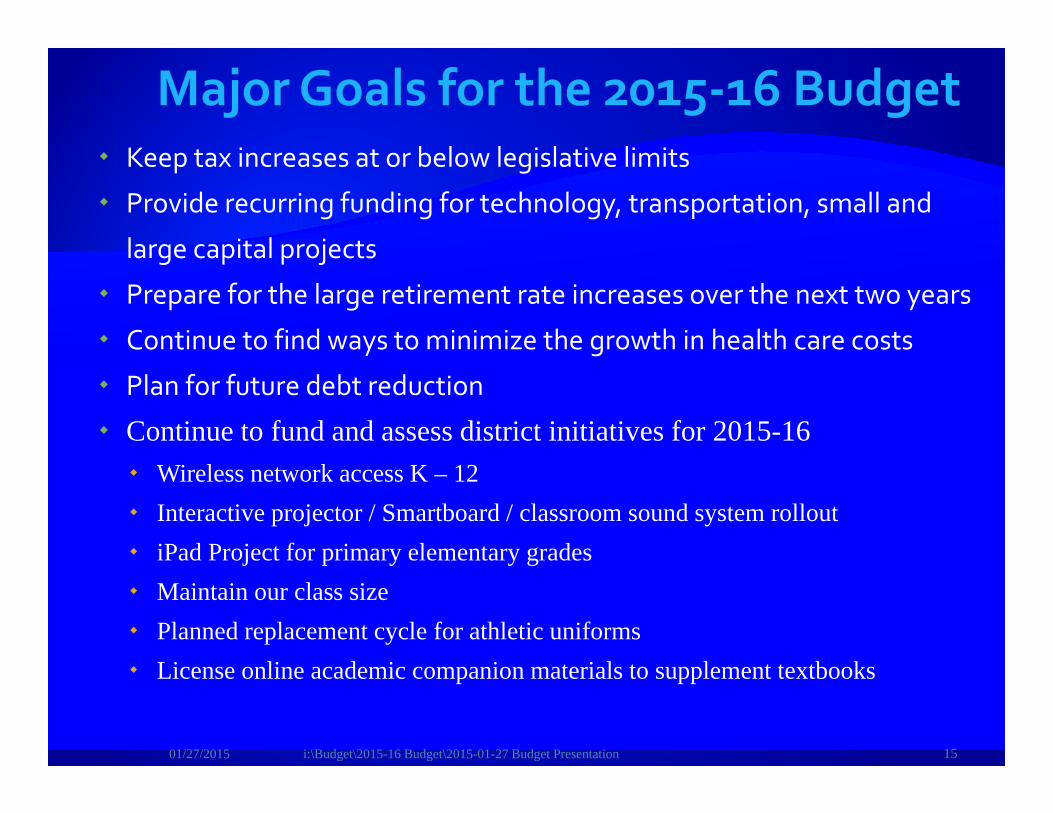
Keep tax increases at or below legislative limits
Provide recurring funding for technology, transportation, small and
large capital projects
Prepare for the large retirement rate increases over the next two years
Continue to find ways to minimize the growth in health care costs
Plan for future debt reduction
Continue to fund and assess district initiatives for 2015-16 Wireless network access K – 12 Interactive projector / Smartboard / classroom sound system rollout iPad Project for primary elementary grades Maintain our class size Planned replacement cycle for athletic uniforms License online academic companion materials to supplement textbooks
01/27/2015 i:\Budget\2015-16 Budget\2015-01-27 Budget Presentation 15
01/27/2015 i:\Budget\2015-16 Budget\2015-01-27 Budget Presentation 16
Actual Dollar Value of Estimated
Paymentsfor 2014-2015
Actual Dollar Value of Estimated
Paymentsfor 2015-2016
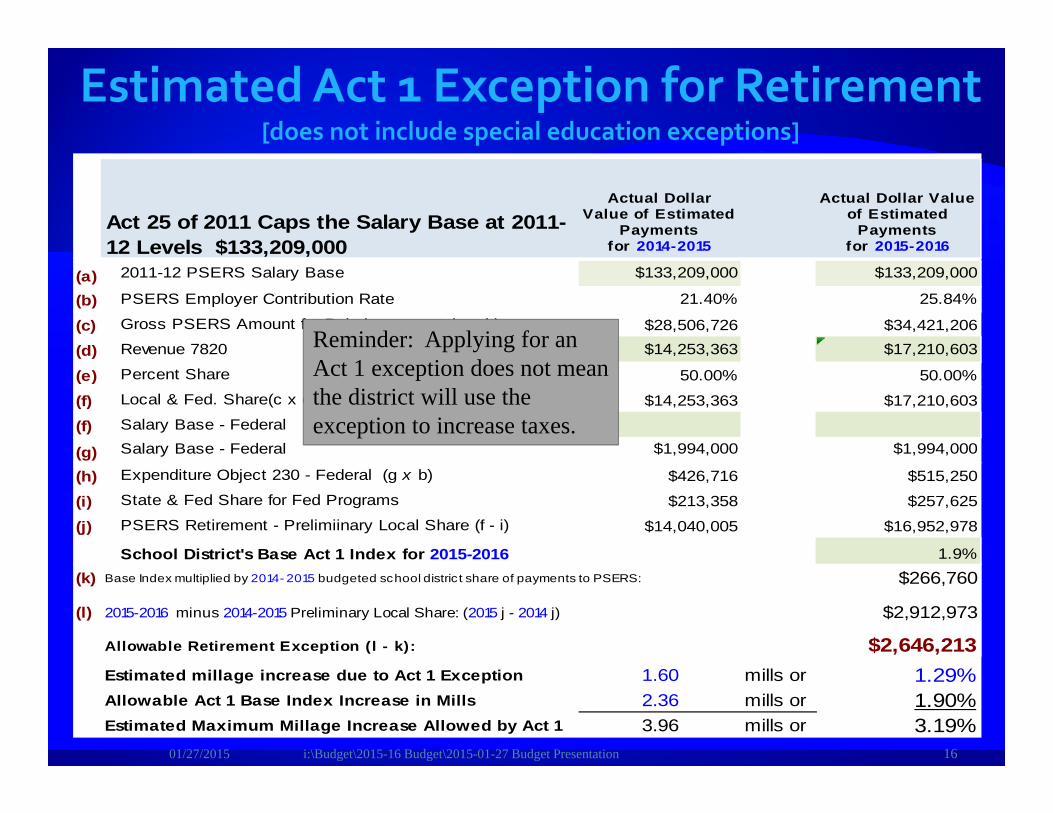
(a) 2011-12 PSERS Salary Base $133,209,000 $133,209,000
(b) PSERS Employer Contribution Rate 21.40% 25.84%
(c) Gross PSERS Amount for Reimbursement (a x b) $28,506,726 $34,421,206
(d) Revenue 7820 $14,253,363 $17,210,603
(e) Percent Share 50.00% 50.00%
(f) Local & Fed. Share(c x e) $14,253,363 $17,210,603
(f) Salary Base - Federal
(g) Salary Base - Federal $1,994,000 $1,994,000
(h) Expenditure Object 230 - Federal (g x b) $426,716 $515,250
(i) State & Fed Share for Fed Programs $213,358 $257,625
(j) PSERS Retirement - Prelimiinary Local Share (f - i) $14,040,005 $16,952,978
School District's Base Act 1 Index for 2015-2016 1.9%(k) $266,760
(l) $2,912,973
$2,646,213Estimated millage increase due to Act 1 Exception 1.60 mills or 1.29%Allowable Act 1 Base Index Increase in Mills 2.36 mills or 1.90%Estimated Maximum Millage Increase Allowed by Act 1 3.96 mills or 3.19%
Base Index multiplied by 2014- 2015 budgeted school district share of payments to PSERS:
2015-2016 minus 2014-2015 Preliminary Local Share: (2015 j - 2014 j)
Allowable Retirement Exception (l - k):
Act 25 of 2011 Caps the Salary Base at 2011-12 Levels $133,209,000
Reminder: Applying for an Act 1 exception does not mean the district will use the exception to increase taxes.
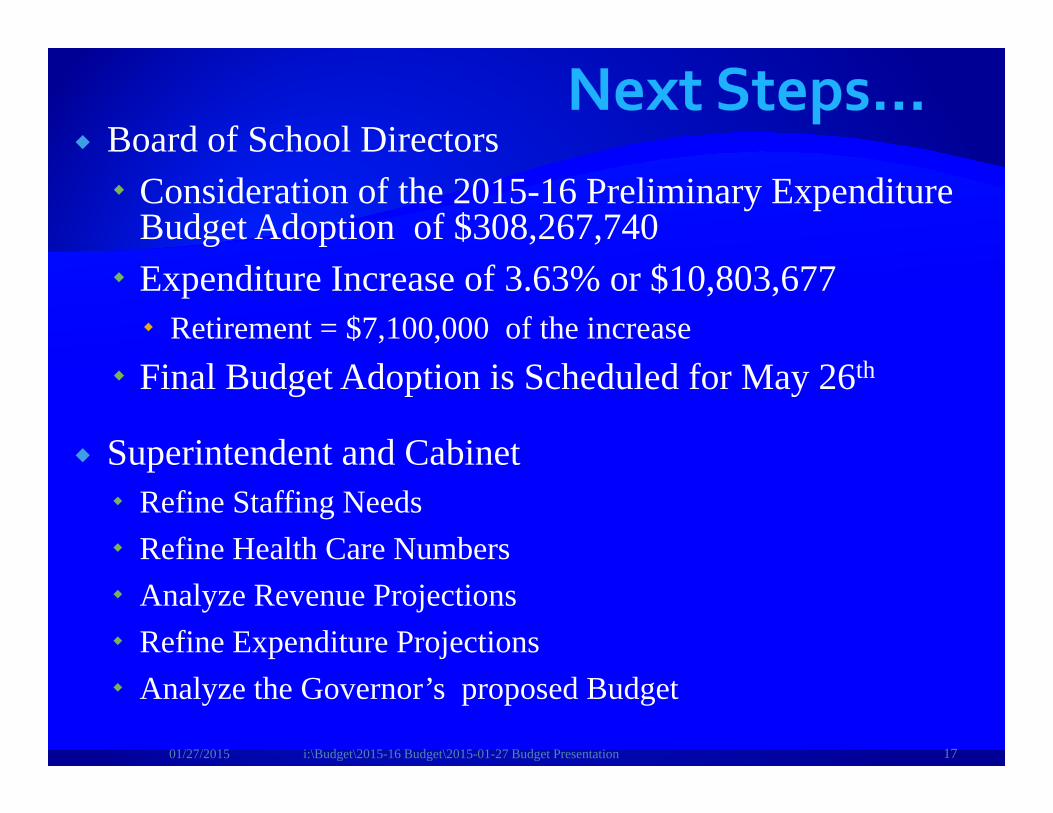
Board of School Directors Consideration of the 2015-16 Preliminary Expenditure
Budget Adoption of $308,267,740 Expenditure Increase of 3.63% or $10,803,677 Retirement = $7,100,000 of the increase
Final Budget Adoption is Scheduled for May 26th
Superintendent and Cabinet Refine Staffing Needs Refine Health Care Numbers Analyze Revenue Projections Refine Expenditure Projections Analyze the Governor’s proposed Budget
01/27/2015 i:\Budget\2015-16 Budget\2015-01-27 Budget Presentation 17
01/27/2015 i:\Budget\2015-16 Budget\2015-01-27 Budget Presentation 18
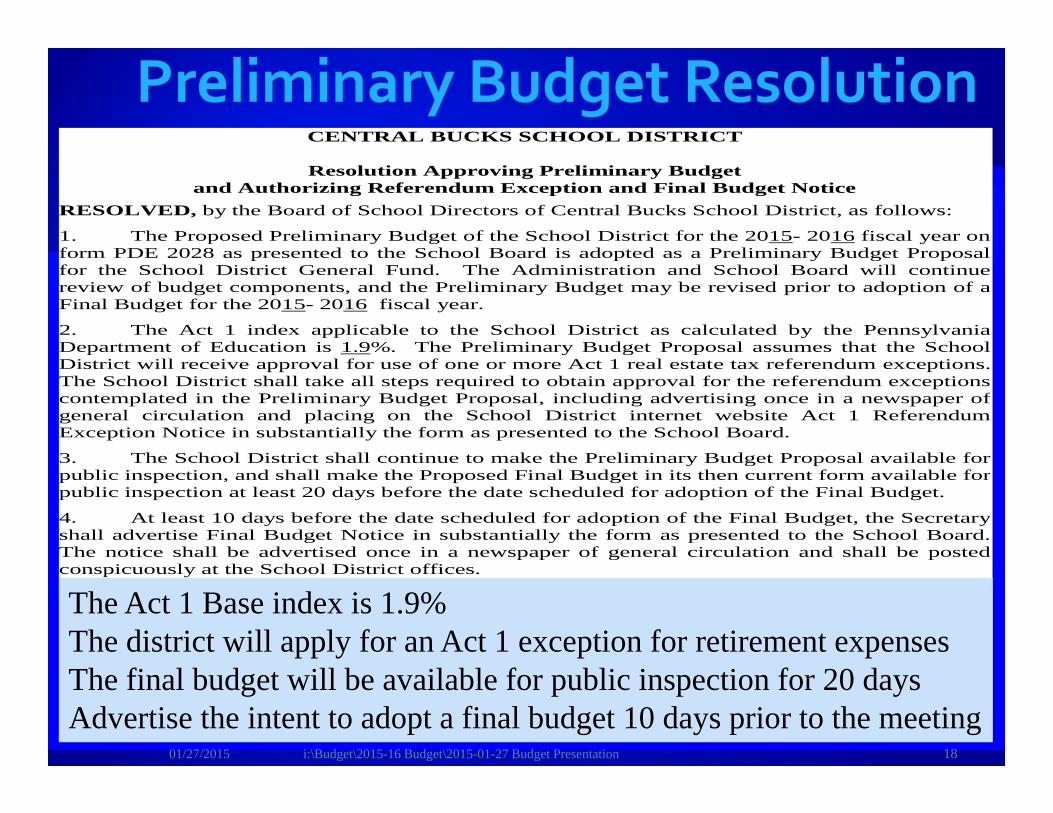
CENTRAL BUCKS SCHOOL DISTRICT
Resolution Approving Preliminary Budget and Authorizing Referendum Exception and Final Budget Notice
RESOLVED, by the Board of School Directors of Central Bucks School District, as follows:
1. The Proposed Preliminary Budget of the School District for the 2015- 2016 fiscal year on form PDE 2028 as presented to the School Board is adopted as a Preliminary Budget Proposalfor the School District General Fund. The Administration and School Board will continuereview of budget components, and the Preliminary Budget may be revised prior to adoption of a Final Budget for the 2015- 2016 fiscal year.
2. The Act 1 index applicable to the School District as calculated by the PennsylvaniaDepartment of Education is 1.9%. The Preliminary Budget Proposal assumes that the SchoolDistrict will receive approval for use of one or more Act 1 real estate tax referendum exceptions.The School District shall take all steps required to obtain approval for the referendum exceptionscontemplated in the Preliminary Budget Proposal, including advertising once in a newspaper ofgeneral circulation and placing on the School District internet website Act 1 Referendum Exception Notice in substantially the form as presented to the School Board.
3. The School District shall continue to make the Preliminary Budget Proposal available forpublic inspection, and shall make the Proposed Final Budget in its then current form available forpublic inspection at least 20 days before the date scheduled for adoption of the Final Budget.
4. At least 10 days before the date scheduled for adoption of the Final Budget, the Secretary shall advertise Final Budget Notice in substantially the form as presented to the School Board. The notice shall be advertised once in a newspaper of general circulation and shall be posted conspicuously at the School District offices.
5. School District officials shall take all action necessary or appropriate to carry out theintent of this resolution. The Act 1 Base index is 1.9%The district will apply for an Act 1 exception for retirement expensesThe final budget will be available for public inspection for 20 daysAdvertise the intent to adopt a final budget 10 days prior to the meeting
01/27/2015 i:\Budget\2015-16 Budget\2015-01-27 Budget Presentation 19
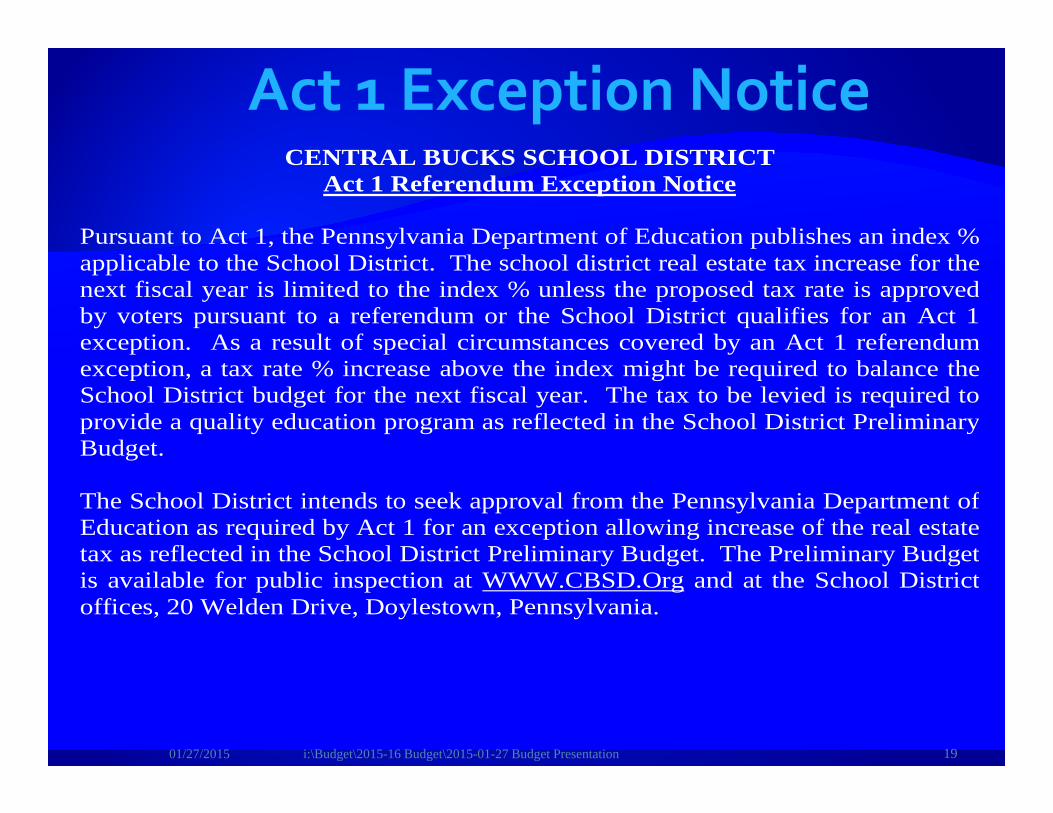
CENTRAL BUCKS SCHOOL DISTRICT Act 1 Referendum Exception Notice
Pursuant to Act 1, the Pennsylvania Department of Education publishes an index %applicable to the School District. The school district real estate tax increase for thenext fiscal year is limited to the index % unless the proposed tax rate is approvedby voters pursuant to a referendum or the School District qualifies for an Act 1 exception. As a result of special circumstances covered by an Act 1 referendumexception, a tax rate % increase above the index might be required to balance the School District budget for the next fiscal year. The tax to be levied is required to provide a quality education program as reflected in the School District Preliminary Budget. The School District intends to seek approval from the Pennsylvania Department ofEducation as required by Act 1 for an exception allowing increase of the real estatetax as reflected in the School District Preliminary Budget. The Preliminary Budgetis available for public inspection at WWW.CBSD.Org and at the School District offices, 20 Welden Drive, Doylestown, Pennsylvania.

01/27/2015 i:\Budget\2015-16 Budget\2015-01-27 Budget Presentation 20
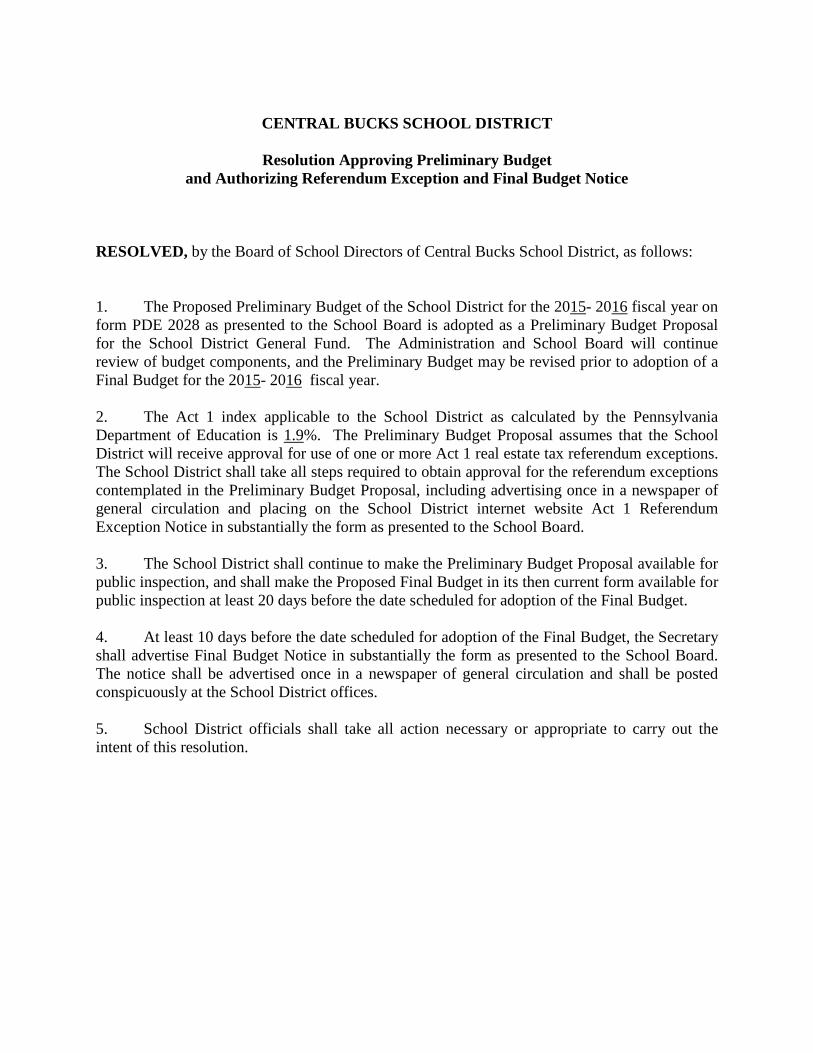
CENTRAL BUCKS SCHOOL DISTRICT
Resolution Approving Preliminary Budget
and Authorizing Referendum Exception and Final Budget Notice
RESOLVED, by the Board of School Directors of Central Bucks School District, as follows: 1. The Proposed Preliminary Budget of the School District for the 2015- 2016 fiscal year on form PDE 2028 as presented to the School Board is adopted as a Preliminary Budget Proposal for the School District General Fund. The Administration and School Board will continue review of budget components, and the Preliminary Budget may be revised prior to adoption of a Final Budget for the 2015- 2016 fiscal year. 2. The Act 1 index applicable to the School District as calculated by the Pennsylvania Department of Education is 1.9%. The Preliminary Budget Proposal assumes that the School District will receive approval for use of one or more Act 1 real estate tax referendum exceptions. The School District shall take all steps required to obtain approval for the referendum exceptions contemplated in the Preliminary Budget Proposal, including advertising once in a newspaper of general circulation and placing on the School District internet website Act 1 Referendum Exception Notice in substantially the form as presented to the School Board. 3. The School District shall continue to make the Preliminary Budget Proposal available for public inspection, and shall make the Proposed Final Budget in its then current form available for public inspection at least 20 days before the date scheduled for adoption of the Final Budget. 4. At least 10 days before the date scheduled for adoption of the Final Budget, the Secretary shall advertise Final Budget Notice in substantially the form as presented to the School Board. The notice shall be advertised once in a newspaper of general circulation and shall be posted conspicuously at the School District offices. 5. School District officials shall take all action necessary or appropriate to carry out the intent of this resolution.
CENTRAL BUCKS SCHOOL DISTRICT
Act 1 Referendum Exception Notice
Pursuant to Act 1, the Pennsylvania Department of Education publishes an index % applicable to the School District. The school district real estate tax increase for the next fiscal year is limited to the index % unless the proposed tax rate is approved by voters pursuant to a referendum or the School District qualifies for an Act 1 exception. As a result of special circumstances covered by an Act 1 referendum exception, a tax rate % increase above the index might be required to balance the School District budget for the next fiscal year. The tax to be levied is required to provide a quality education program as reflected in the School District Preliminary Budget. The School District intends to seek approval from the Pennsylvania Department of Education as required by Act 1 for an exception allowing increase of the real estate tax as reflected in the School District Preliminary Budget. The Preliminary Budget is available for public inspection at WWW.CBSD.Org and at the School District offices, 20 Welden Drive, Doylestown, Pennsylvania.
, Secretary
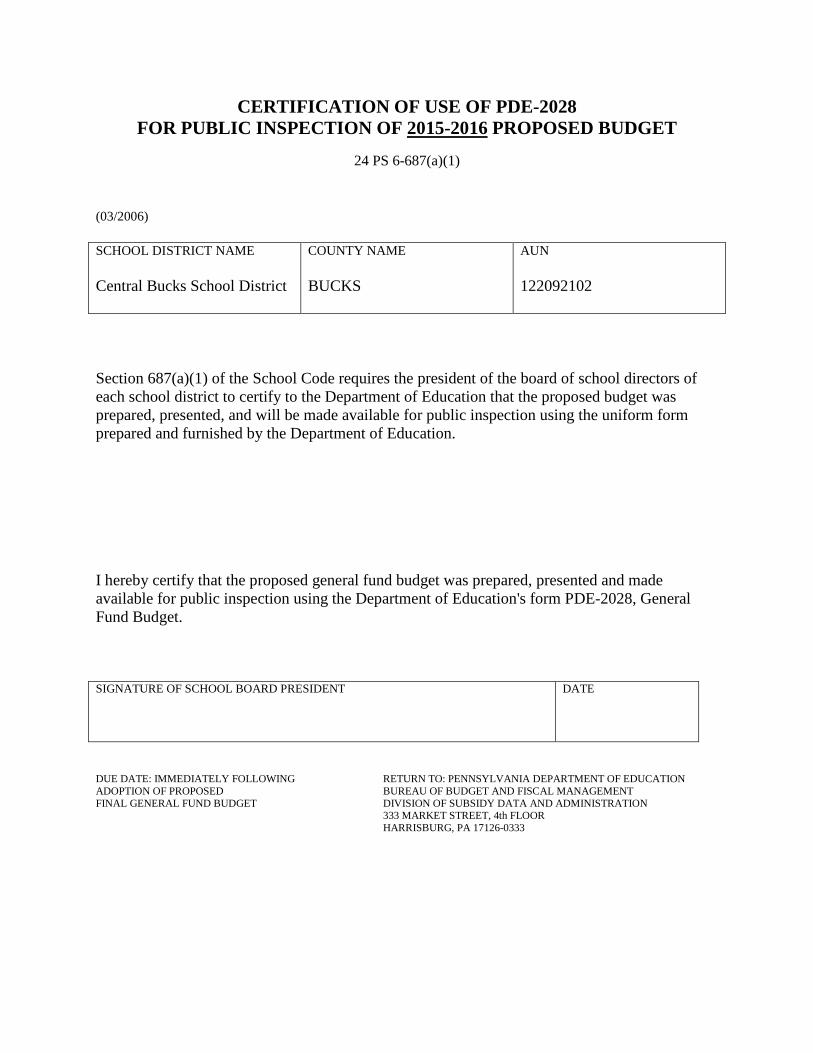
CERTIFICATION OF USE OF PDE-2028 FOR PUBLIC INSPECTION OF 2015-2016 PROPOSED BUDGET
24 PS 6-687(a)(1)
(03/2006) SCHOOL DISTRICT NAME Central Bucks School District
COUNTY NAME BUCKS
AUN 122092102
Section 687(a)(1) of the School Code requires the president of the board of school directors of each school district to certify to the Department of Education that the proposed budget was prepared, presented, and will be made available for public inspection using the uniform form prepared and furnished by the Department of Education. I hereby certify that the proposed general fund budget was prepared, presented and made available for public inspection using the Department of Education's form PDE-2028, General Fund Budget. SIGNATURE OF SCHOOL BOARD PRESIDENT DATE
DUE DATE: IMMEDIATELY FOLLOWING RETURN TO: PENNSYLVANIA DEPARTMENT OF EDUCATION ADOPTION OF PROPOSED BUREAU OF BUDGET AND FISCAL MANAGEMENT FINAL GENERAL FUND BUDGET DIVISION OF SUBSIDY DATA AND ADMINISTRATION
333 MARKET STREET, 4th FLOOR HARRISBURG, PA 17126-0333
15-16 PrelimBudget
15-16 Budg/ 14-15Budg
14-15 Budget 15-16Budg/ 14-15 Proj
14-15 Projected 14-15Proj/ 13-14Actual
13-14 Actual
1000 Instruction
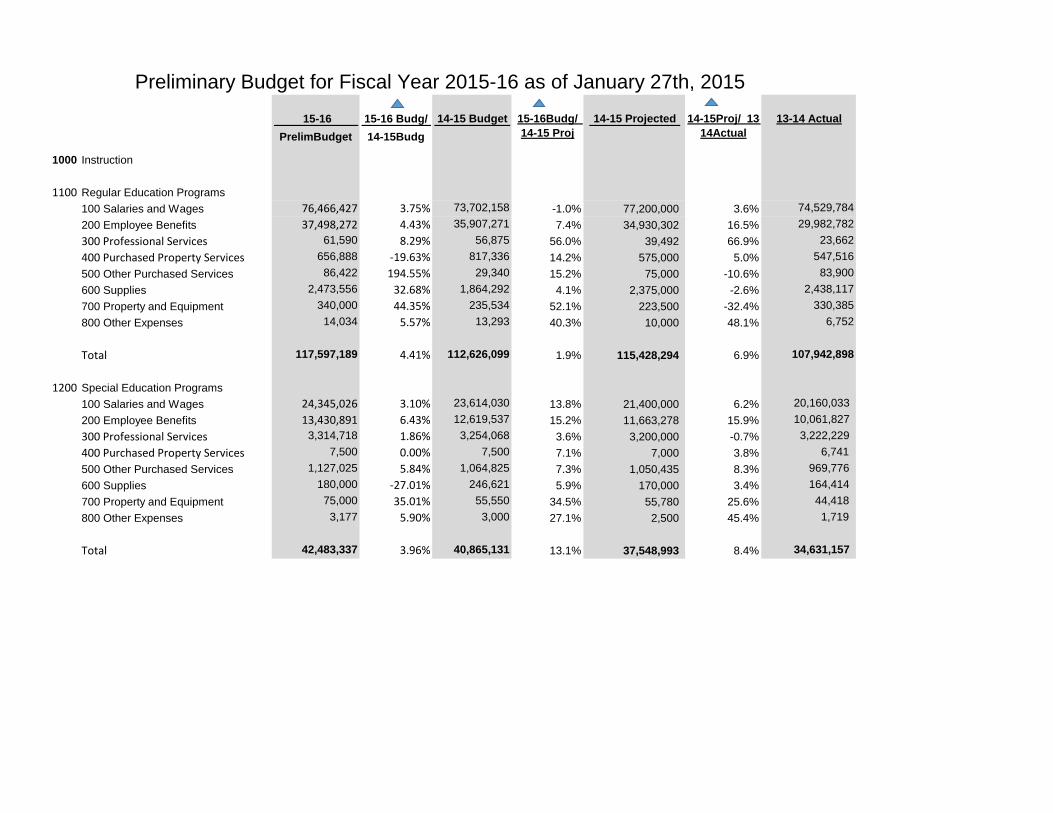
1100 Regular Education Programs100 Salaries and Wages 76,466,427 3.75% 73,702,158 -1.0% 77,200,000 3.6% 74,529,784 200 Employee Benefits 37,498,272 4.43% 35,907,271 7.4% 34,930,302 16.5% 29,982,782 300 Professional Services 61,590 8.29% 56,875 56.0% 39,492 66.9% 23,662 400 Purchased Property Services 656,888 -19.63% 817,336 14.2% 575,000 5.0% 547,516 500 Other Purchased Services 86,422 194.55% 29,340 15.2% 75,000 -10.6% 83,900 600 Supplies 2,473,556 32.68% 1,864,292 4.1% 2,375,000 -2.6% 2,438,117 700 Property and Equipment 340,000 44.35% 235,534 52.1% 223,500 -32.4% 330,385 800 Other Expenses 14,034 5.57% 13,293 40.3% 10,000 48.1% 6,752
Total 117,597,189 4.41% 112,626,099 1.9% 115,428,294 6.9% 107,942,898
1200 Special Education Programs100 Salaries and Wages 24,345,026 3.10% 23,614,030 13.8% 21,400,000 6.2% 20,160,033 200 Employee Benefits 13,430,891 6.43% 12,619,537 15.2% 11,663,278 15.9% 10,061,827 300 Professional Services 3,314,718 1.86% 3,254,068 3.6% 3,200,000 -0.7% 3,222,229 400 Purchased Property Services 7,500 0.00% 7,500 7.1% 7,000 3.8% 6,741 500 Other Purchased Services 1,127,025 5.84% 1,064,825 7.3% 1,050,435 8.3% 969,776 600 Supplies 180,000 -27.01% 246,621 5.9% 170,000 3.4% 164,414 700 Property and Equipment 75,000 35.01% 55,550 34.5% 55,780 25.6% 44,418 800 Other Expenses 3,177 5.90% 3,000 27.1% 2,500 45.4% 1,719
Total 42,483,337 3.96% 40,865,131 13.1% 37,548,993 8.4% 34,631,157
Preliminary Budget for Fiscal Year 2015-16 as of January 27th, 2015
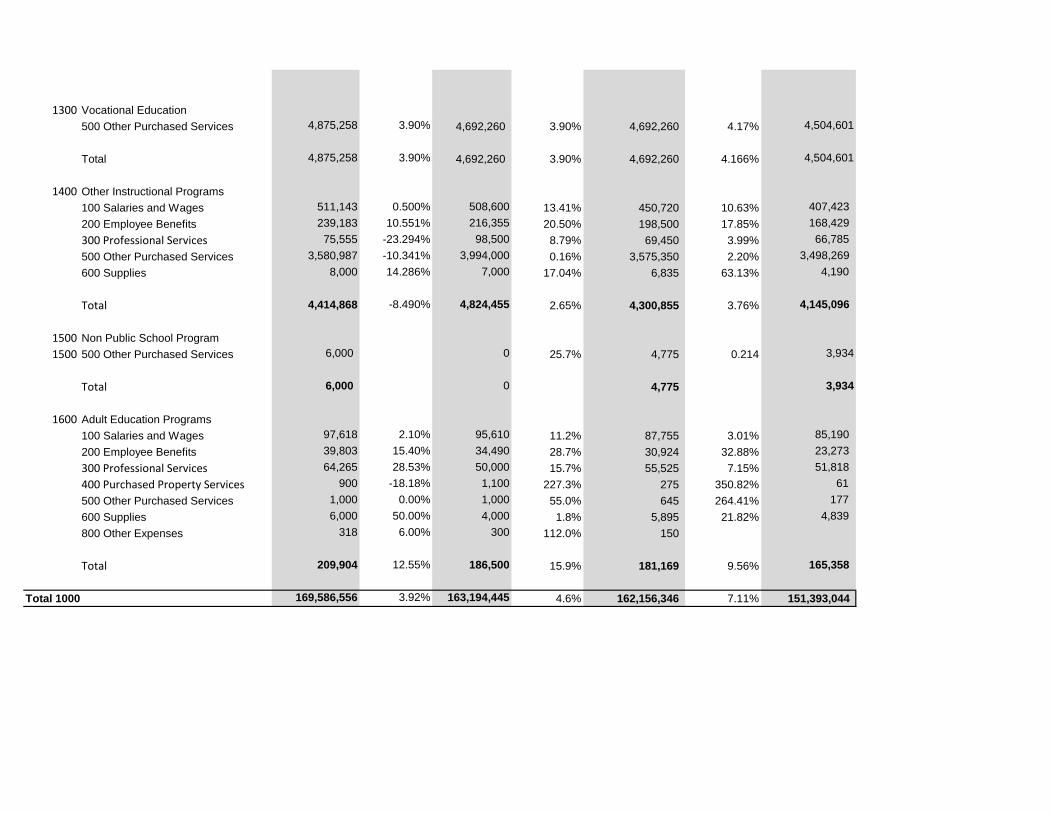
1300 Vocational Education500 Other Purchased Services 4,875,258 3.90% 4,692,260 3.90% 4,692,260 4.17% 4,504,601
Total 4,875,258 3.90% 4,692,260 3.90% 4,692,260 4.166% 4,504,601
1400 Other Instructional Programs100 Salaries and Wages 511,143 0.500% 508,600 13.41% 450,720 10.63% 407,423 200 Employee Benefits 239,183 10.551% 216,355 20.50% 198,500 17.85% 168,429 300 Professional Services 75,555 -23.294% 98,500 8.79% 69,450 3.99% 66,785 500 Other Purchased Services 3,580,987 -10.341% 3,994,000 0.16% 3,575,350 2.20% 3,498,269 600 Supplies 8,000 14.286% 7,000 17.04% 6,835 63.13% 4,190
Total 4,414,868 -8.490% 4,824,455 2.65% 4,300,855 3.76% 4,145,096
1500 Non Public School Program1500 500 Other Purchased Services 6,000 0 25.7% 4,775 0.214 3,934
Total 6,000 0 4,775 3,934
1600 Adult Education Programs100 Salaries and Wages 97,618 2.10% 95,610 11.2% 87,755 3.01% 85,190 200 Employee Benefits 39,803 15.40% 34,490 28.7% 30,924 32.88% 23,273 300 Professional Services 64,265 28.53% 50,000 15.7% 55,525 7.15% 51,818 400 Purchased Property Services 900 -18.18% 1,100 227.3% 275 350.82% 61 500 Other Purchased Services 1,000 0.00% 1,000 55.0% 645 264.41% 177 600 Supplies 6,000 50.00% 4,000 1.8% 5,895 21.82% 4,839 800 Other Expenses 318 6.00% 300 112.0% 150
Total 209,904 12.55% 186,500 15.9% 181,169 9.56% 165,358
Total 1000 169,586,556 3.92% 163,194,445 4.6% 162,156,346 7.11% 151,393,044
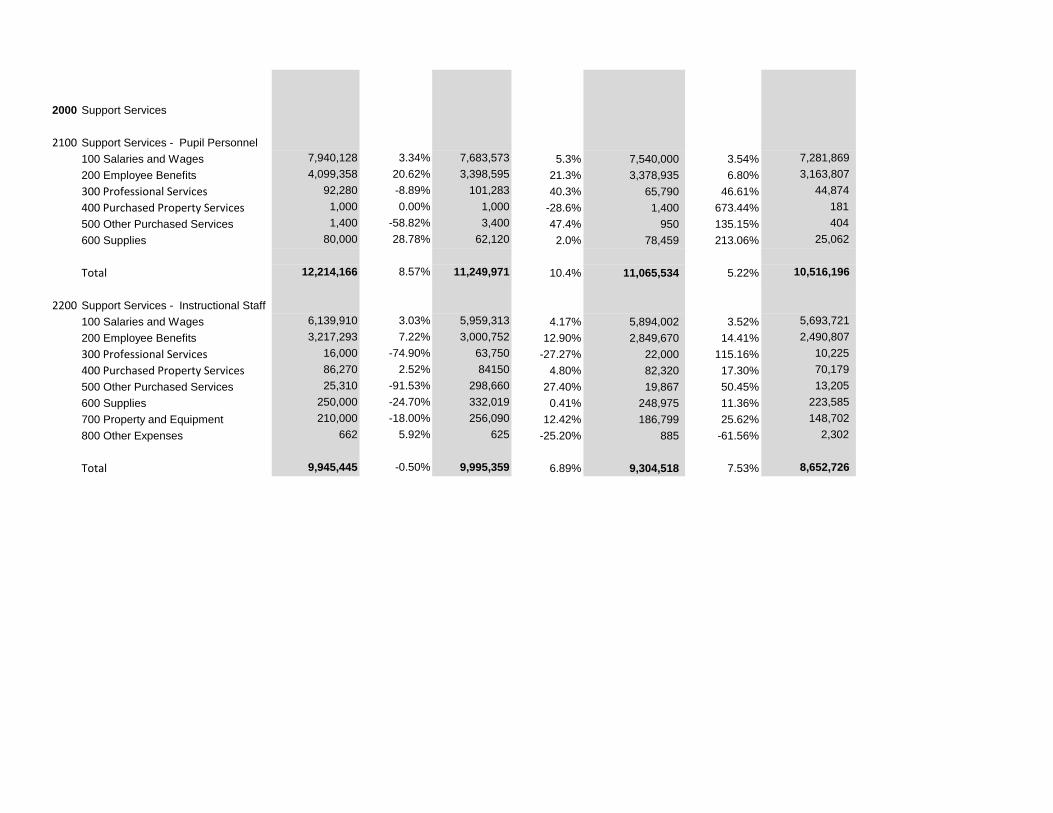
2000 Support Services
2100 Support Services - Pupil Personnel100 Salaries and Wages 7,940,128 3.34% 7,683,573 5.3% 7,540,000 3.54% 7,281,869 200 Employee Benefits 4,099,358 20.62% 3,398,595 21.3% 3,378,935 6.80% 3,163,807 300 Professional Services 92,280 -8.89% 101,283 40.3% 65,790 46.61% 44,874 400 Purchased Property Services 1,000 0.00% 1,000 -28.6% 1,400 673.44% 181 500 Other Purchased Services 1,400 -58.82% 3,400 47.4% 950 135.15% 404 600 Supplies 80,000 28.78% 62,120 2.0% 78,459 213.06% 25,062
Total 12,214,166 8.57% 11,249,971 10.4% 11,065,534 5.22% 10,516,196
2200 Support Services - Instructional Staff100 Salaries and Wages 6,139,910 3.03% 5,959,313 4.17% 5,894,002 3.52% 5,693,721 200 Employee Benefits 3,217,293 7.22% 3,000,752 12.90% 2,849,670 14.41% 2,490,807 300 Professional Services 16,000 -74.90% 63,750 -27.27% 22,000 115.16% 10,225 400 Purchased Property Services 86,270 2.52% 84150 4.80% 82,320 17.30% 70,179 500 Other Purchased Services 25,310 -91.53% 298,660 27.40% 19,867 50.45% 13,205 600 Supplies 250,000 -24.70% 332,019 0.41% 248,975 11.36% 223,585 700 Property and Equipment 210,000 -18.00% 256,090 12.42% 186,799 25.62% 148,702 800 Other Expenses 662 5.92% 625 -25.20% 885 -61.56% 2,302
Total 9,945,445 -0.50% 9,995,359 6.89% 9,304,518 7.53% 8,652,726
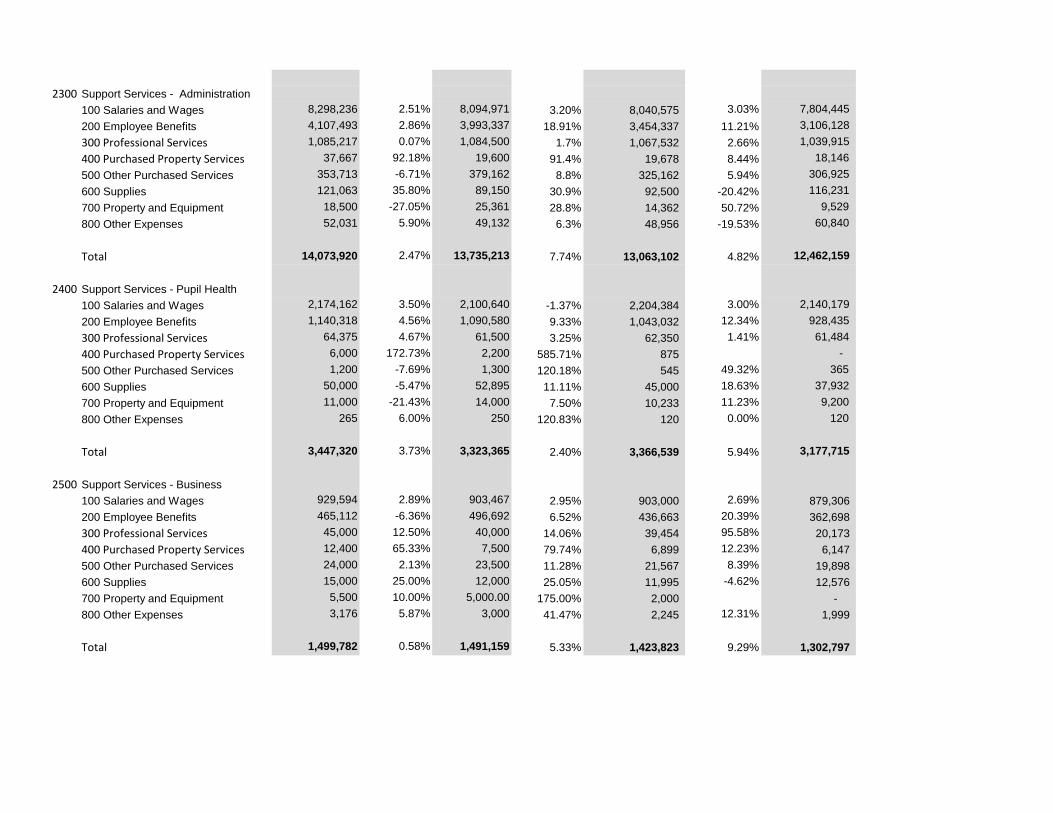
2300 Support Services - Administration100 Salaries and Wages 8,298,236 2.51% 8,094,971 3.20% 8,040,575 3.03% 7,804,445 200 Employee Benefits 4,107,493 2.86% 3,993,337 18.91% 3,454,337 11.21% 3,106,128 300 Professional Services 1,085,217 0.07% 1,084,500 1.7% 1,067,532 2.66% 1,039,915 400 Purchased Property Services 37,667 92.18% 19,600 91.4% 19,678 8.44% 18,146 500 Other Purchased Services 353,713 -6.71% 379,162 8.8% 325,162 5.94% 306,925 600 Supplies 121,063 35.80% 89,150 30.9% 92,500 -20.42% 116,231 700 Property and Equipment 18,500 -27.05% 25,361 28.8% 14,362 50.72% 9,529 800 Other Expenses 52,031 5.90% 49,132 6.3% 48,956 -19.53% 60,840
Total 14,073,920 2.47% 13,735,213 7.74% 13,063,102 4.82% 12,462,159
2400 Support Services - Pupil Health100 Salaries and Wages 2,174,162 3.50% 2,100,640 -1.37% 2,204,384 3.00% 2,140,179 200 Employee Benefits 1,140,318 4.56% 1,090,580 9.33% 1,043,032 12.34% 928,435 300 Professional Services 64,375 4.67% 61,500 3.25% 62,350 1.41% 61,484 400 Purchased Property Services 6,000 172.73% 2,200 585.71% 875 - 500 Other Purchased Services 1,200 -7.69% 1,300 120.18% 545 49.32% 365 600 Supplies 50,000 -5.47% 52,895 11.11% 45,000 18.63% 37,932 700 Property and Equipment 11,000 -21.43% 14,000 7.50% 10,233 11.23% 9,200 800 Other Expenses 265 6.00% 250 120.83% 120 0.00% 120
Total 3,447,320 3.73% 3,323,365 2.40% 3,366,539 5.94% 3,177,715
2500 Support Services - Business100 Salaries and Wages 929,594 2.89% 903,467 2.95% 903,000 2.69% 879,306 200 Employee Benefits 465,112 -6.36% 496,692 6.52% 436,663 20.39% 362,698 300 Professional Services 45,000 12.50% 40,000 14.06% 39,454 95.58% 20,173 400 Purchased Property Services 12,400 65.33% 7,500 79.74% 6,899 12.23% 6,147 500 Other Purchased Services 24,000 2.13% 23,500 11.28% 21,567 8.39% 19,898 600 Supplies 15,000 25.00% 12,000 25.05% 11,995 -4.62% 12,576 700 Property and Equipment 5,500 10.00% 5,000.00 175.00% 2,000 - 800 Other Expenses 3,176 5.87% 3,000 41.47% 2,245 12.31% 1,999
Total 1,499,782 0.58% 1,491,159 5.33% 1,423,823 9.29% 1,302,797
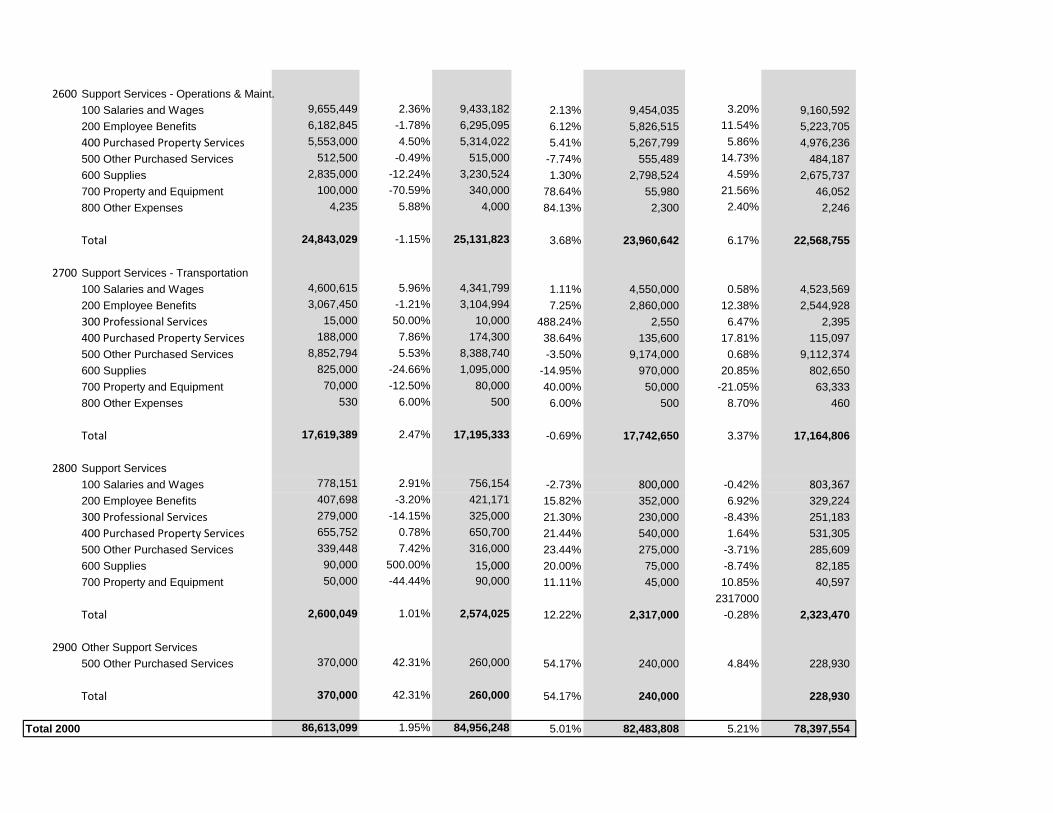
2600 Support Services - Operations & Maint.100 Salaries and Wages 9,655,449 2.36% 9,433,182 2.13% 9,454,035 3.20% 9,160,592 200 Employee Benefits 6,182,845 -1.78% 6,295,095 6.12% 5,826,515 11.54% 5,223,705 400 Purchased Property Services 5,553,000 4.50% 5,314,022 5.41% 5,267,799 5.86% 4,976,236 500 Other Purchased Services 512,500 -0.49% 515,000 -7.74% 555,489 14.73% 484,187 600 Supplies 2,835,000 -12.24% 3,230,524 1.30% 2,798,524 4.59% 2,675,737 700 Property and Equipment 100,000 -70.59% 340,000 78.64% 55,980 21.56% 46,052 800 Other Expenses 4,235 5.88% 4,000 84.13% 2,300 2.40% 2,246
Total 24,843,029 -1.15% 25,131,823 3.68% 23,960,642 6.17% 22,568,755
2700 Support Services - Transportation100 Salaries and Wages 4,600,615 5.96% 4,341,799 1.11% 4,550,000 0.58% 4,523,569 200 Employee Benefits 3,067,450 -1.21% 3,104,994 7.25% 2,860,000 12.38% 2,544,928 300 Professional Services 15,000 50.00% 10,000 488.24% 2,550 6.47% 2,395 400 Purchased Property Services 188,000 7.86% 174,300 38.64% 135,600 17.81% 115,097 500 Other Purchased Services 8,852,794 5.53% 8,388,740 -3.50% 9,174,000 0.68% 9,112,374 600 Supplies 825,000 -24.66% 1,095,000 -14.95% 970,000 20.85% 802,650 700 Property and Equipment 70,000 -12.50% 80,000 40.00% 50,000 -21.05% 63,333 800 Other Expenses 530 6.00% 500 6.00% 500 8.70% 460
Total 17,619,389 2.47% 17,195,333 -0.69% 17,742,650 3.37% 17,164,806
2800 Support Services100 Salaries and Wages 778,151 2.91% 756,154 -2.73% 800,000 -0.42% 803,367 200 Employee Benefits 407,698 -3.20% 421,171 15.82% 352,000 6.92% 329,224 300 Professional Services 279,000 -14.15% 325,000 21.30% 230,000 -8.43% 251,183 400 Purchased Property Services 655,752 0.78% 650,700 21.44% 540,000 1.64% 531,305 500 Other Purchased Services 339,448 7.42% 316,000 23.44% 275,000 -3.71% 285,609 600 Supplies 90,000 500.00% 15,000 20.00% 75,000 -8.74% 82,185 700 Property and Equipment 50,000 -44.44% 90,000 11.11% 45,000 10.85% 40,597
2317000Total 2,600,049 1.01% 2,574,025 12.22% 2,317,000 -0.28% 2,323,470
2900 Other Support Services500 Other Purchased Services 370,000 42.31% 260,000 54.17% 240,000 4.84% 228,930
Total 370,000 42.31% 260,000 54.17% 240,000 228,930
Total 2000 86,613,099 1.95% 84,956,248 5.01% 82,483,808 5.21% 78,397,554
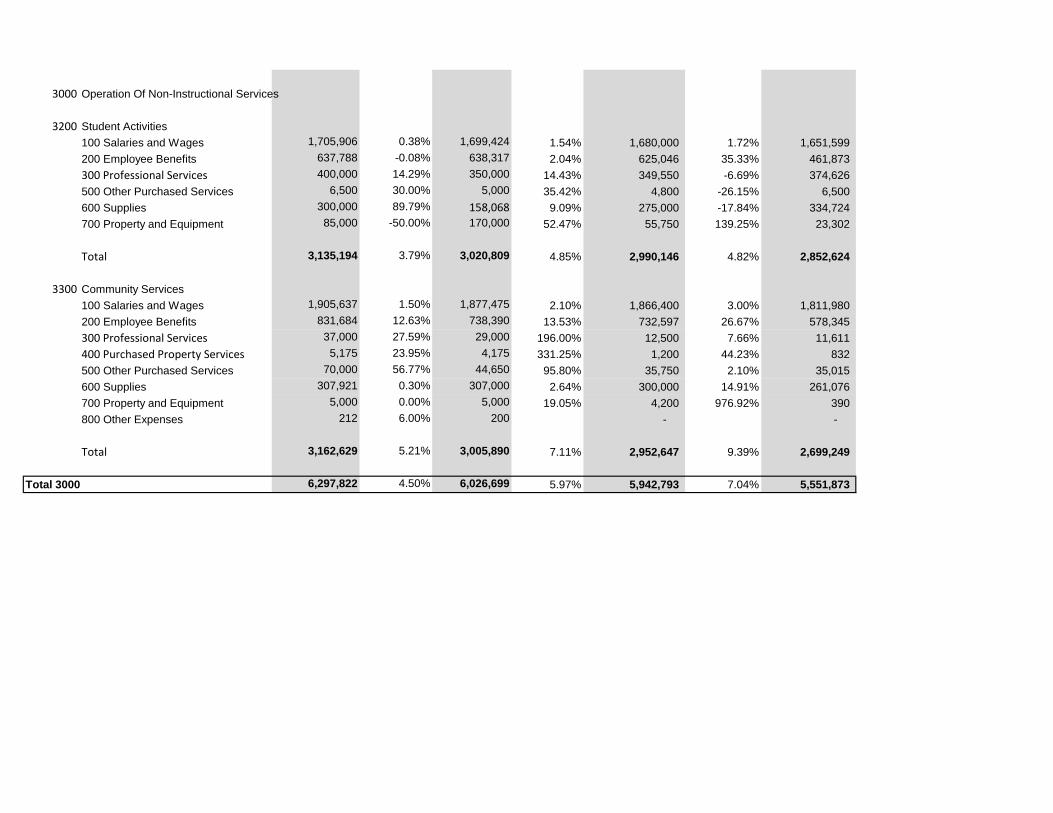
3000 Operation Of Non-Instructional Services
3200 Student Activities100 Salaries and Wages 1,705,906 0.38% 1,699,424 1.54% 1,680,000 1.72% 1,651,599 200 Employee Benefits 637,788 -0.08% 638,317 2.04% 625,046 35.33% 461,873 300 Professional Services 400,000 14.29% 350,000 14.43% 349,550 -6.69% 374,626 500 Other Purchased Services 6,500 30.00% 5,000 35.42% 4,800 -26.15% 6,500 600 Supplies 300,000 89.79% 158,068 9.09% 275,000 -17.84% 334,724 700 Property and Equipment 85,000 -50.00% 170,000 52.47% 55,750 139.25% 23,302
Total 3,135,194 3.79% 3,020,809 4.85% 2,990,146 4.82% 2,852,624
3300 Community Services100 Salaries and Wages 1,905,637 1.50% 1,877,475 2.10% 1,866,400 3.00% 1,811,980 200 Employee Benefits 831,684 12.63% 738,390 13.53% 732,597 26.67% 578,345 300 Professional Services 37,000 27.59% 29,000 196.00% 12,500 7.66% 11,611 400 Purchased Property Services 5,175 23.95% 4,175 331.25% 1,200 44.23% 832 500 Other Purchased Services 70,000 56.77% 44,650 95.80% 35,750 2.10% 35,015 600 Supplies 307,921 0.30% 307,000 2.64% 300,000 14.91% 261,076 700 Property and Equipment 5,000 0.00% 5,000 19.05% 4,200 976.92% 390 800 Other Expenses 212 6.00% 200 - -
Total 3,162,629 5.21% 3,005,890 7.11% 2,952,647 9.39% 2,699,249
Total 3000 6,297,822 4.50% 6,026,699 5.97% 5,942,793 7.04% 5,551,873
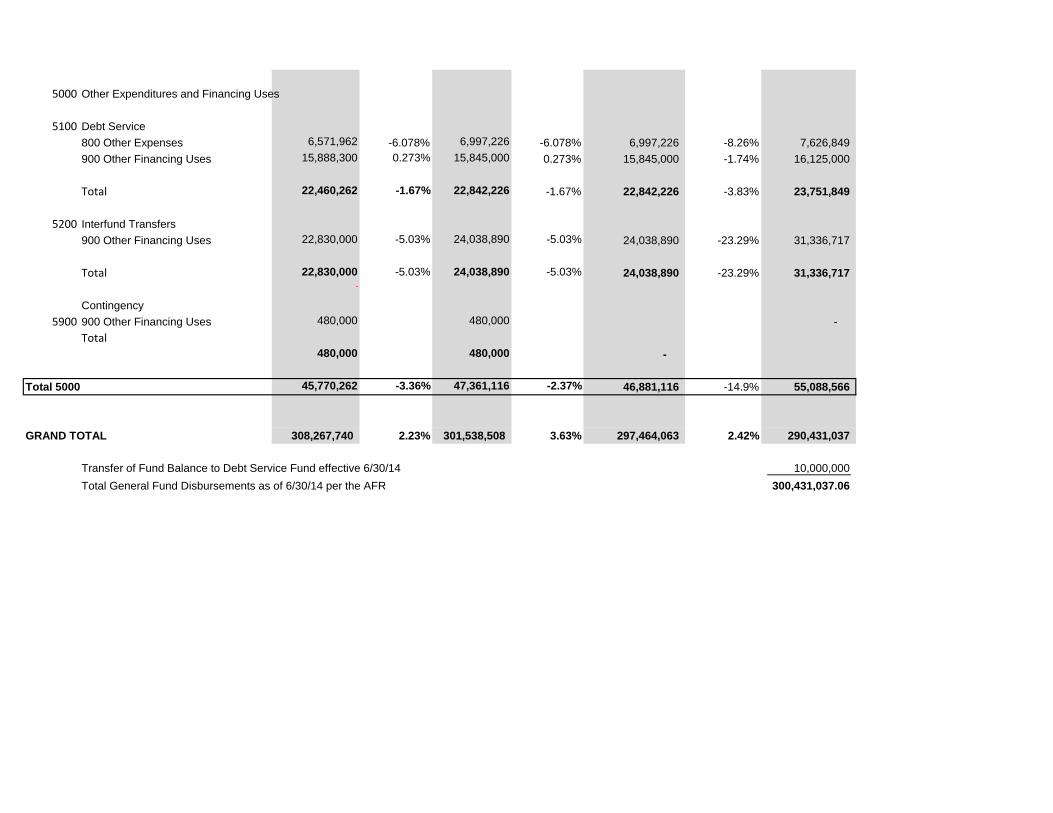
5000 Other Expenditures and Financing Uses
5100 Debt Service800 Other Expenses 6,571,962 -6.078% 6,997,226 -6.078% 6,997,226 -8.26% 7,626,849 900 Other Financing Uses 15,888,300 0.273% 15,845,000 0.273% 15,845,000 -1.74% 16,125,000
Total 22,460,262 -1.67% 22,842,226 -1.67% 22,842,226 -3.83% 23,751,849
5200 Interfund Transfers900 Other Financing Uses 22,830,000 -5.03% 24,038,890 -5.03% 24,038,890 -23.29% 31,336,717
Total 22,830,000 -5.03% 24,038,890 -5.03% 24,038,890 -23.29% 31,336,717 -
Contingency5900 900 Other Financing Uses 480,000 480,000 -
Total 480,000 480,000 -
Total 5000 45,770,262 -3.36% 47,361,116 -2.37% 46,881,116 -14.9% 55,088,566
GRAND TOTAL 308,267,740 2.23% 301,538,508 3.63% 297,464,063 2.42% 290,431,037
Transfer of Fund Balance to Debt Service Fund effective 6/30/14 10,000,000 Total General Fund Disbursements as of 6/30/14 per the AFR 300,431,037.06