Embed Size (px)
DESCRIPTION
AQA A Geog Urban Unit L1
Citation preview
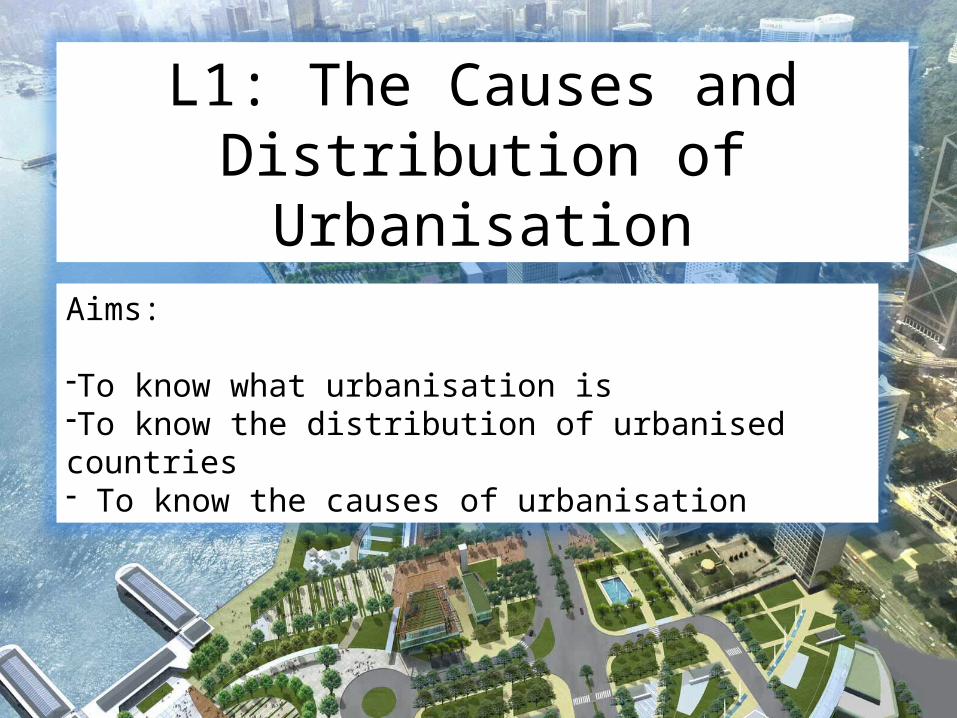
L1: The Causes and Distribution of Urbanisation
Aims:
-To know what urbanisation is-To know the distribution of urbanised countries- To know the causes of urbanisation

Watch the video...
Make brief notes during the video – what do you think it is showing?
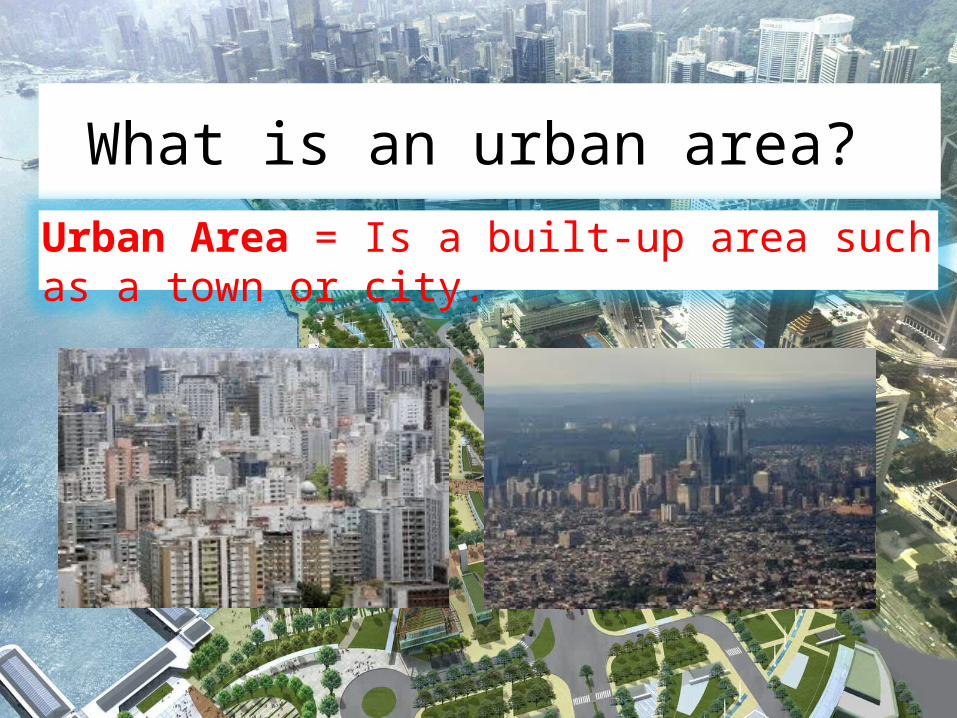
What is an urban area? Urban AreaUrban Area = Is a built-up area such as a town or city.
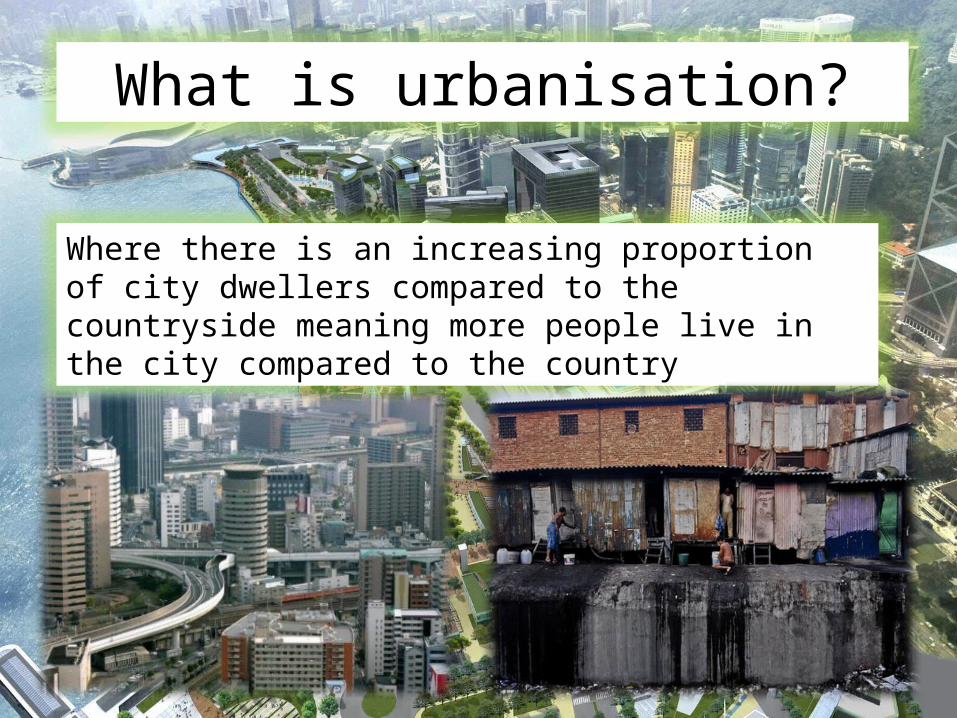
What is urbanisation?
Where there is an increasing proportion of city dwellers compared to the countryside meaning more people live in the city compared to the country
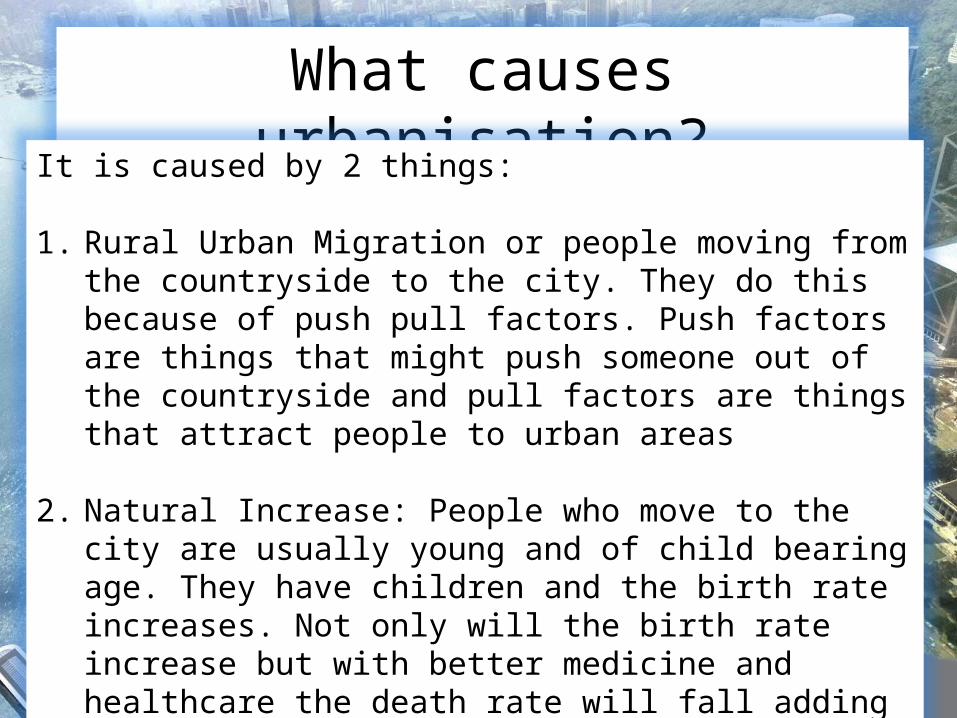
What causes urbanisation?
It is caused by 2 things:
1. Rural Urban Migration or people moving from the countryside to the city. They do this because of push pull factors. Push factors are things that might push someone out of the countryside and pull factors are things that attract people to urban areas
2. Natural Increase: People who move to the city are usually young and of child bearing age. They have children and the birth rate increases. Not only will the birth rate increase but with better medicine and healthcare the death rate will fall adding to population increase.
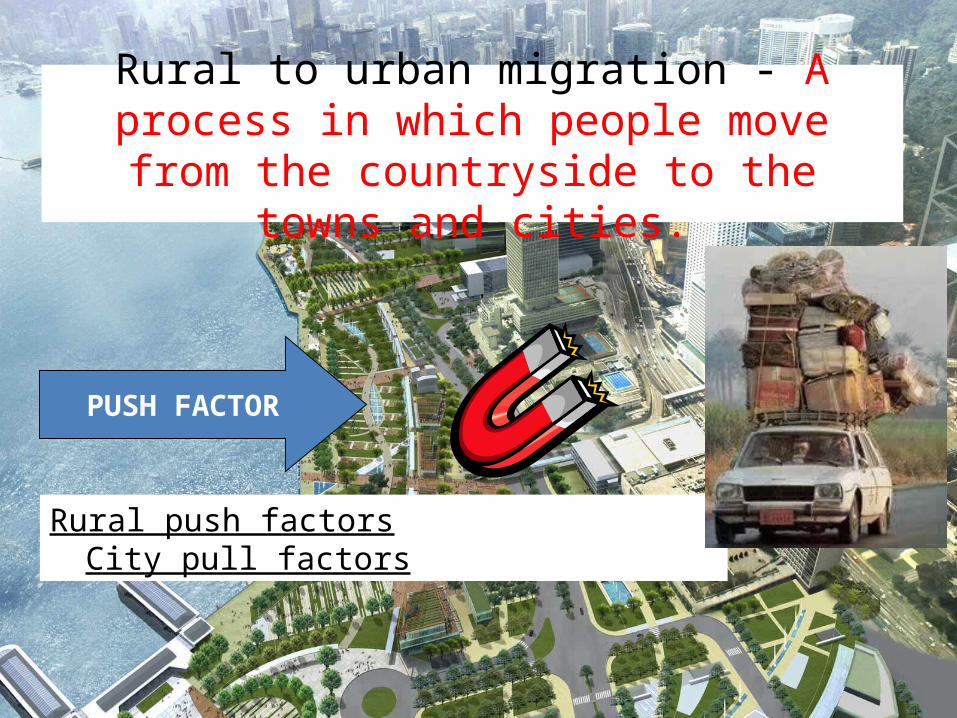
Rural to urban migration - A process in which people move from the countryside to the towns
and cities.
Rural push factors City pull factors
PUSH FACTOR
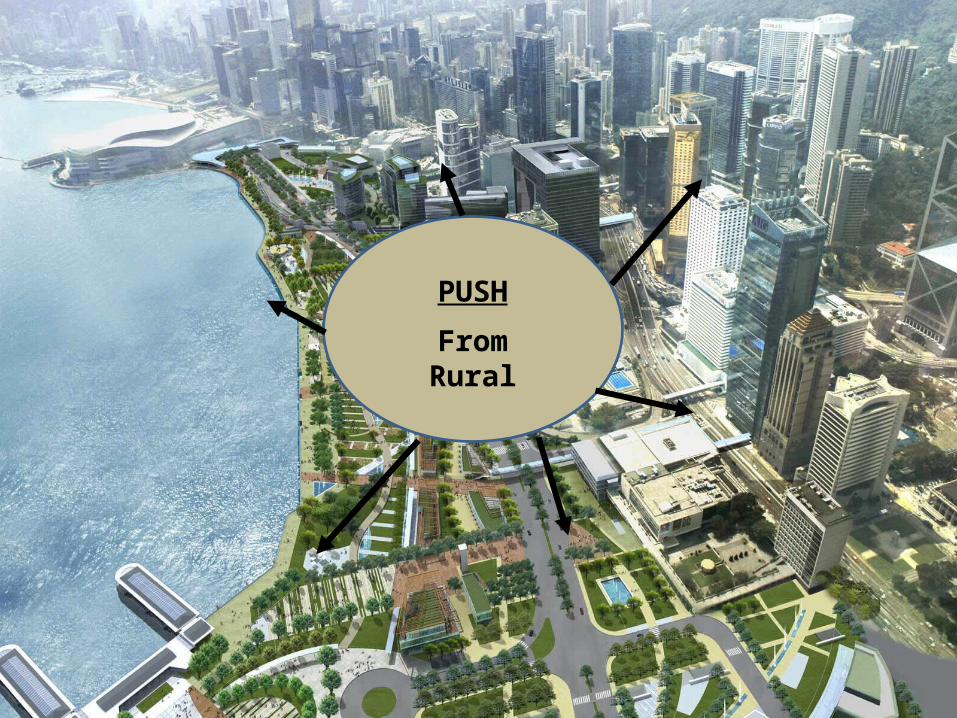
PUSH
From Rural
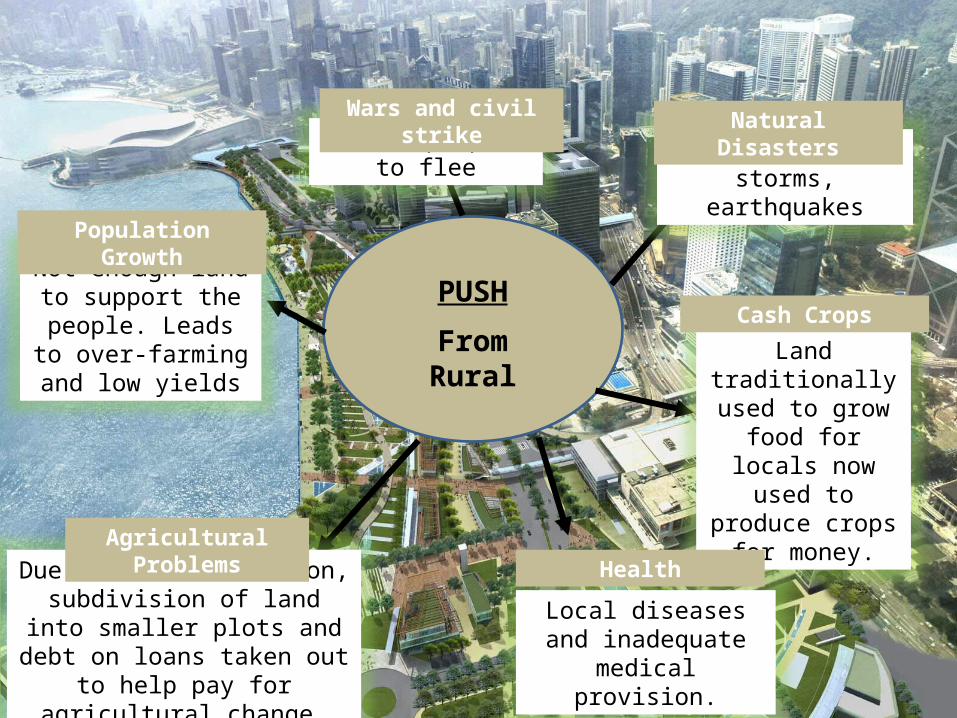
PUSH
From Rural
Not enough land to support the people.
Leads to over-farming and low yields
Due to desertification, subdivision of land into smaller plots and debt on loans taken out to help pay for
agricultural change.
Local diseases and inadequate medical
provision.
Land traditionally used to grow food for locals now used
to produce crops for money.
Floods, tropical storms, earthquakes
Cause people to flee
Population Growth
Agricultural Problems
Wars and civil strike Natural Disasters
Cash Crops
Health
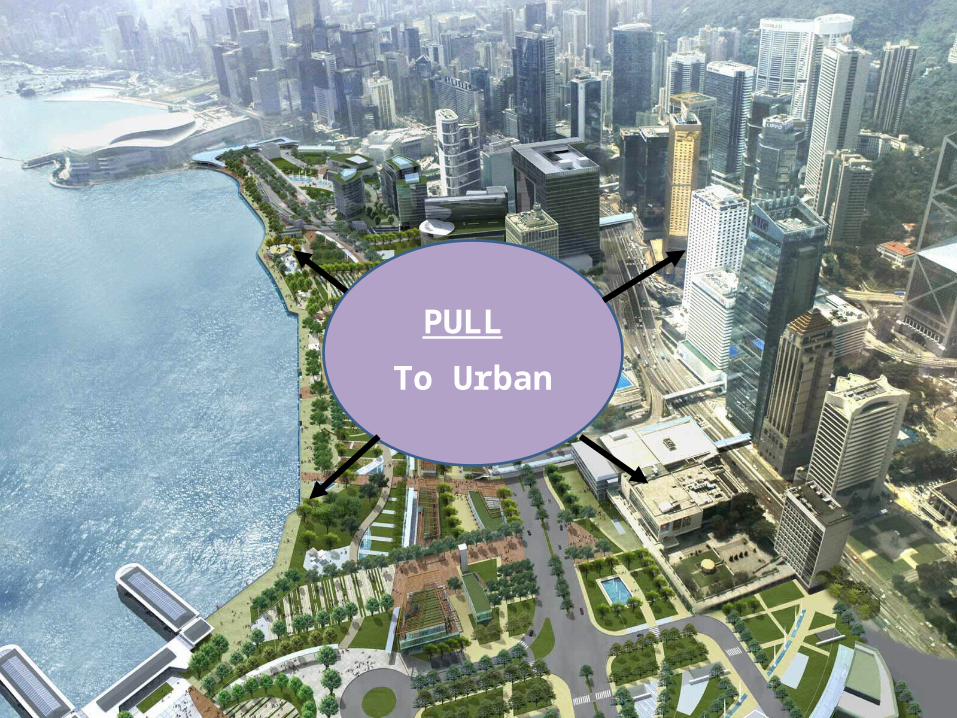
PULL
To Urban
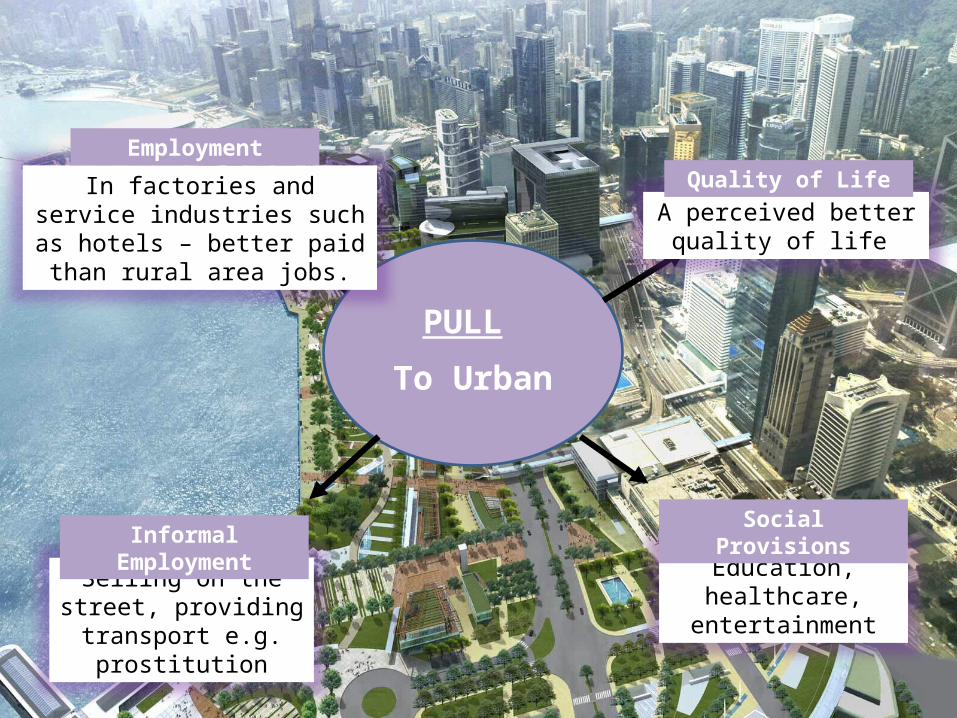
PULL
To Urban
In factories and service industries such as hotels – better paid than
rural area jobs.
Selling on the street, providing transport e.g.
prostitution
Education, healthcare, entertainment
A perceived better quality of life
Employment
Informal EmploymentSocial Provisions
Quality of Life
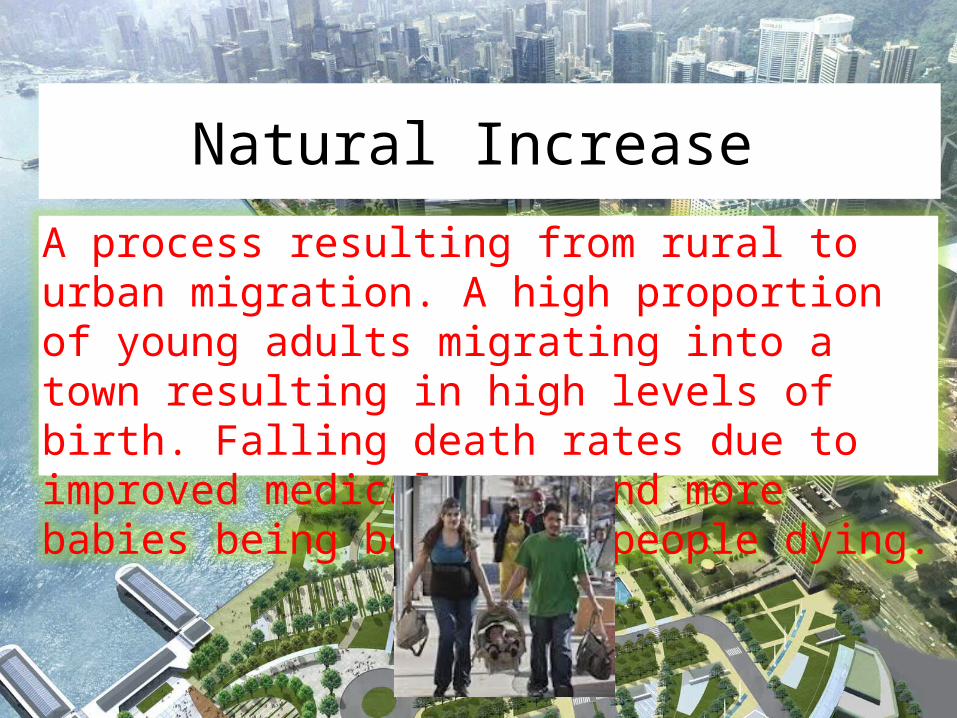
Natural Increase
A process resulting from rural to urban migration. A high proportion of young adults migrating into a town resulting in high levels of birth. Falling death rates due to improved medical care and more babies being born than people dying.
Urban population increase
http://news.bbc.co.uk/1/shared/spl/hi/world/06/urbanisation/html/urbanisation.stm
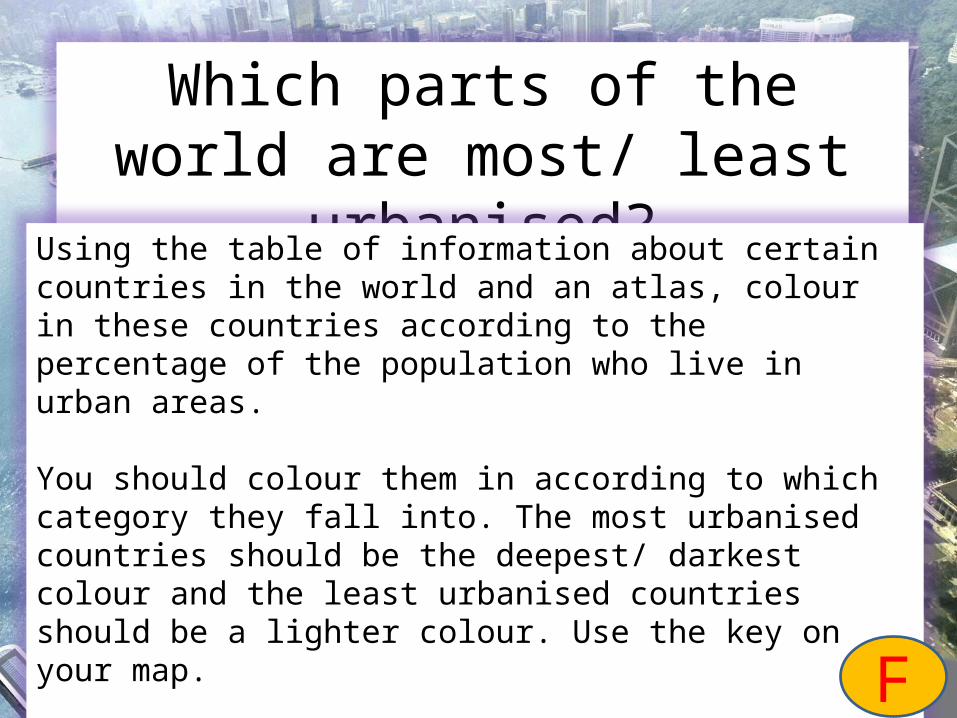
Which parts of the world are most/ least urbanised?
Using the table of information about certain countries in the world and an atlas, colour in these countries according to the percentage of the population who live in urban areas.
You should colour them in according to which category they fall into. The most urbanised countries should be the deepest/ darkest colour and the least urbanised countries should be a lighter colour. Use the key on your map.
Title: Chloropeth Map showing the distribution of urbanisation F
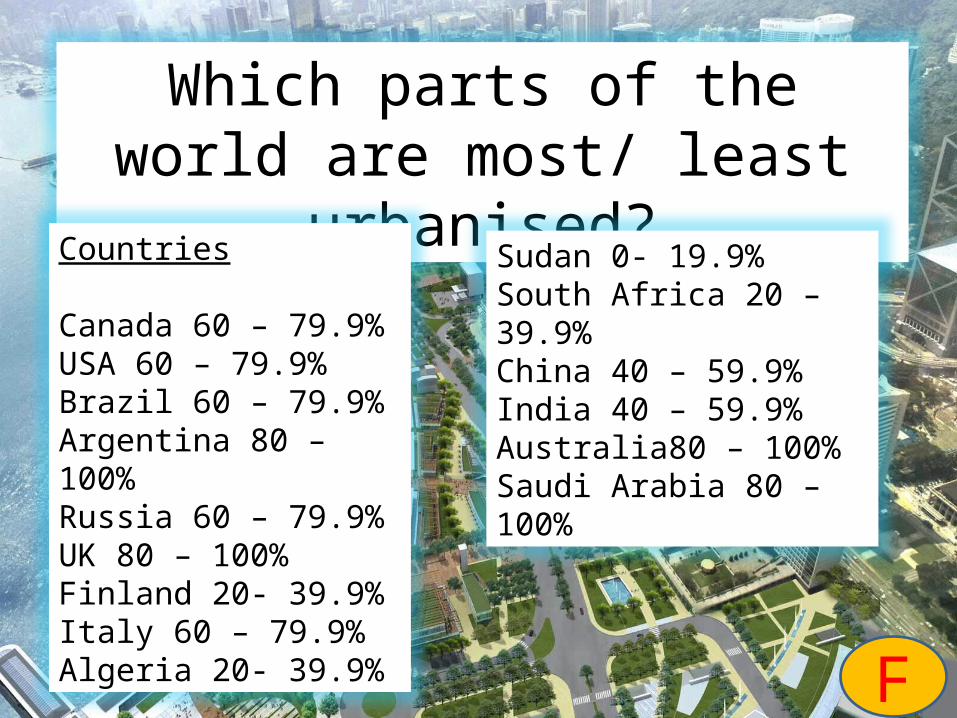
Which parts of the world are most/ least urbanised?
Countries
Canada 60 – 79.9%USA 60 – 79.9%Brazil 60 – 79.9%Argentina 80 – 100%Russia 60 – 79.9%UK 80 – 100%Finland 20- 39.9%Italy 60 – 79.9%Algeria 20- 39.9%
Sudan 0- 19.9%South Africa 20 – 39.9%China 40 – 59.9%India 40 – 59.9%Australia80 – 100%Saudi Arabia 80 – 100%
F
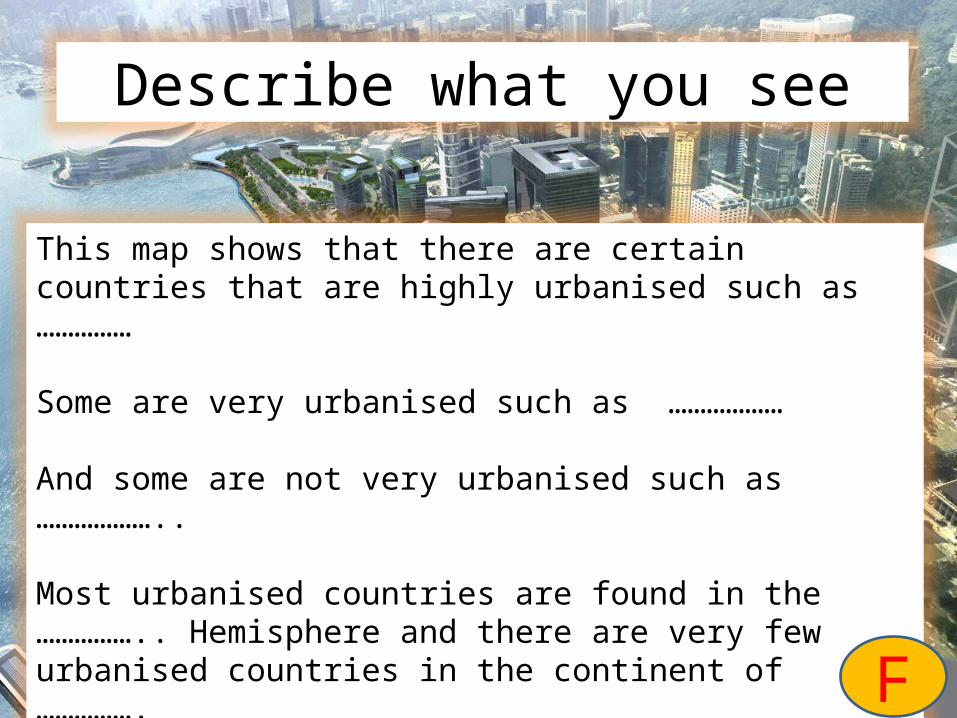
Describe what you see
This map shows that there are certain countries that are highly urbanised such as ……………
Some are very urbanised such as ………………
And some are not very urbanised such as ………………..
Most urbanised countries are found in the …………….. Hemisphere and there are very few urbanised countries in the continent of …………….
F
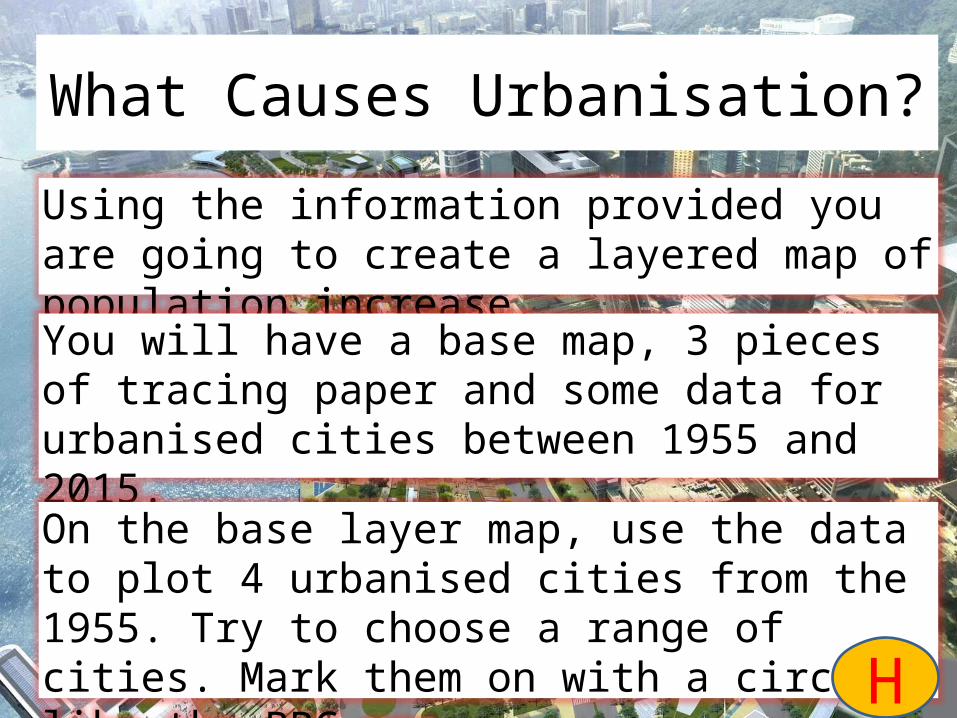
What Causes Urbanisation?
Using the information provided you are going to create a layered map of population increase.
You will have a base map, 3 pieces of tracing paper and some data for urbanised cities between 1955 and 2015.
On the base layer map, use the data to plot 4 urbanised cities from the 1955. Try to choose a range of cities. Mark them on with a circle like the BBC map. H
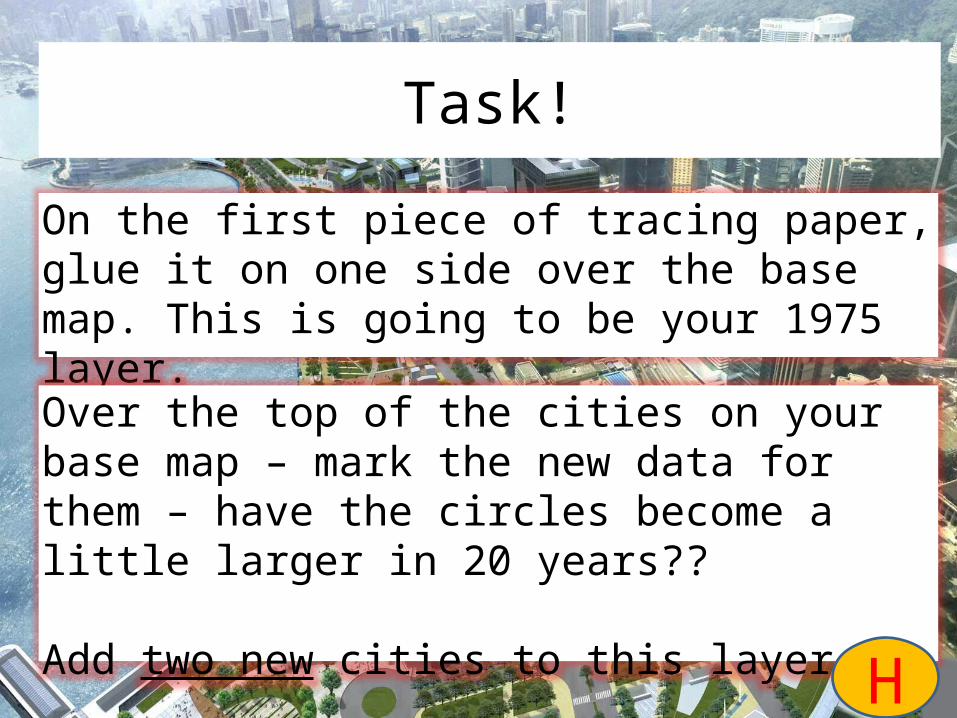
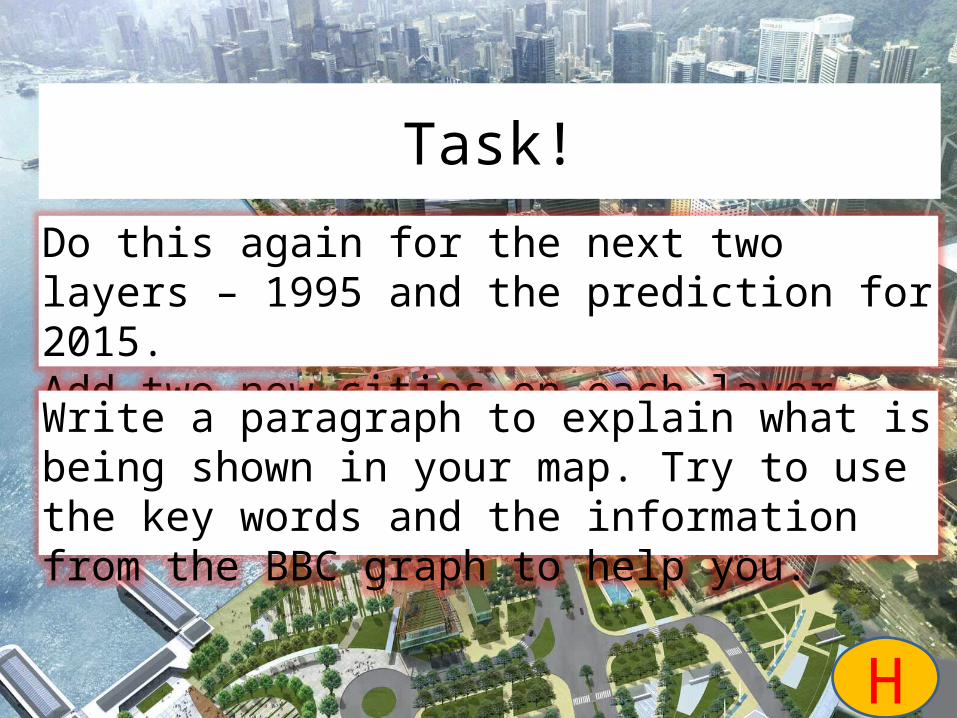
Task!
On the first piece of tracing paper, glue it on one side over the base map. This is going to be your 1975 layer.
Over the top of the cities on your base map – mark the new data for them – have the circles become a little larger in 20 years??
Add two new cities to this layer.
H
Task!
Do this again for the next two layers – 1995 and the prediction for 2015.Add two new cities on each layer.
Write a paragraph to explain what is being shown in your map. Try to use the key words and the information from the BBC graph to help you.
H
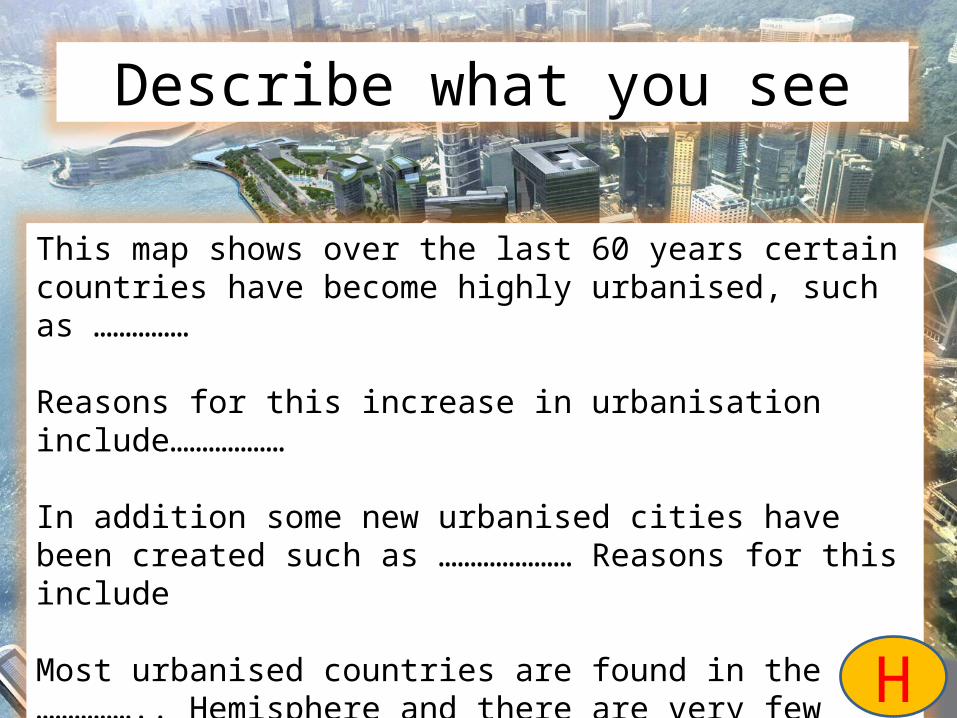
Describe what you see
This map shows over the last 60 years certain countries have become highly urbanised, such as ……………
Reasons for this increase in urbanisation include………………
In addition some new urbanised cities have been created such as ………………… Reasons for this include
Most urbanised countries are found in the …………….. Hemisphere and there are very few urbanised countries in the continent of ……………. H

True or False
1. The most urbanised countries in the world are generally in the northern hemisphere
2. China is highly urbanised
3. Globally, the number of people who live in urban areas has increased
4. A push factor is something that pushed you out of a place
5. When the birth rate increases and death rate decreases then there is natural population increases
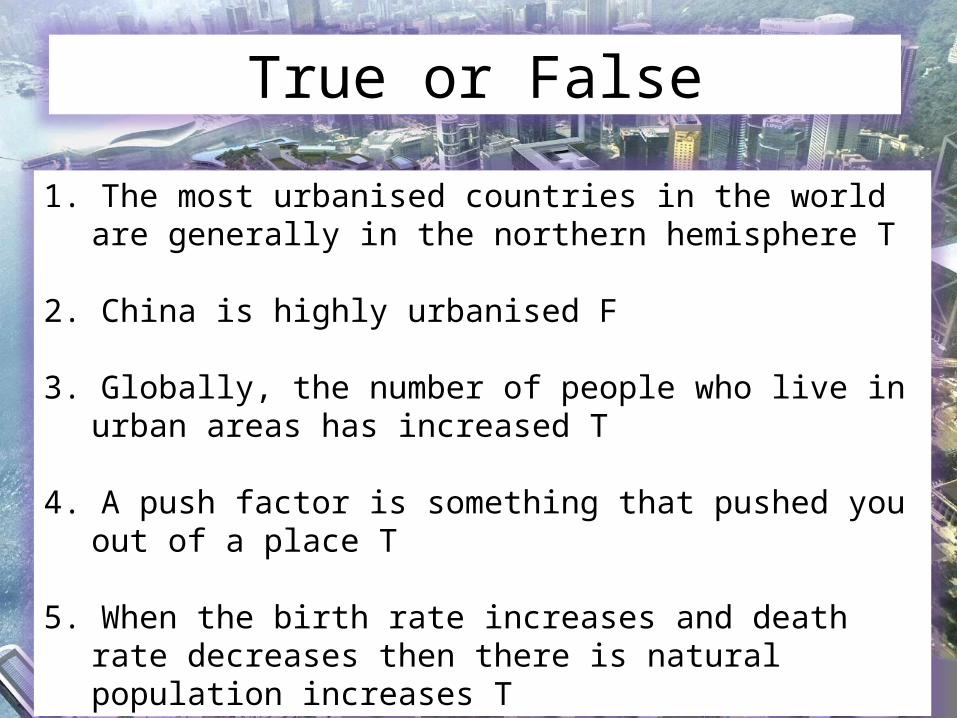
True or False
1. The most urbanised countries in the world are generally in the northern hemisphere T
2. China is highly urbanised F
3. Globally, the number of people who live in urban areas has increased T
4. A push factor is something that pushed you out of a place T
5. When the birth rate increases and death rate decreases then there is natural population increases T

Homework
Look at the graph in front of you
Your task is to describe each line on the graph
Help is provided on the sheet to get you going
Write into your book


