Embed Size (px)
Citation preview
8/3/2019 1st Semester Exam Paper1
http://slidepdf.com/reader/full/1st-semester-exam-paper1 1/5
This question paper consists of 40 questions. Answer all questions. Each question is followed by four choices of answers A , B , C and D. For each question, choose one answer only. Non-
programmable calculator is allowed.
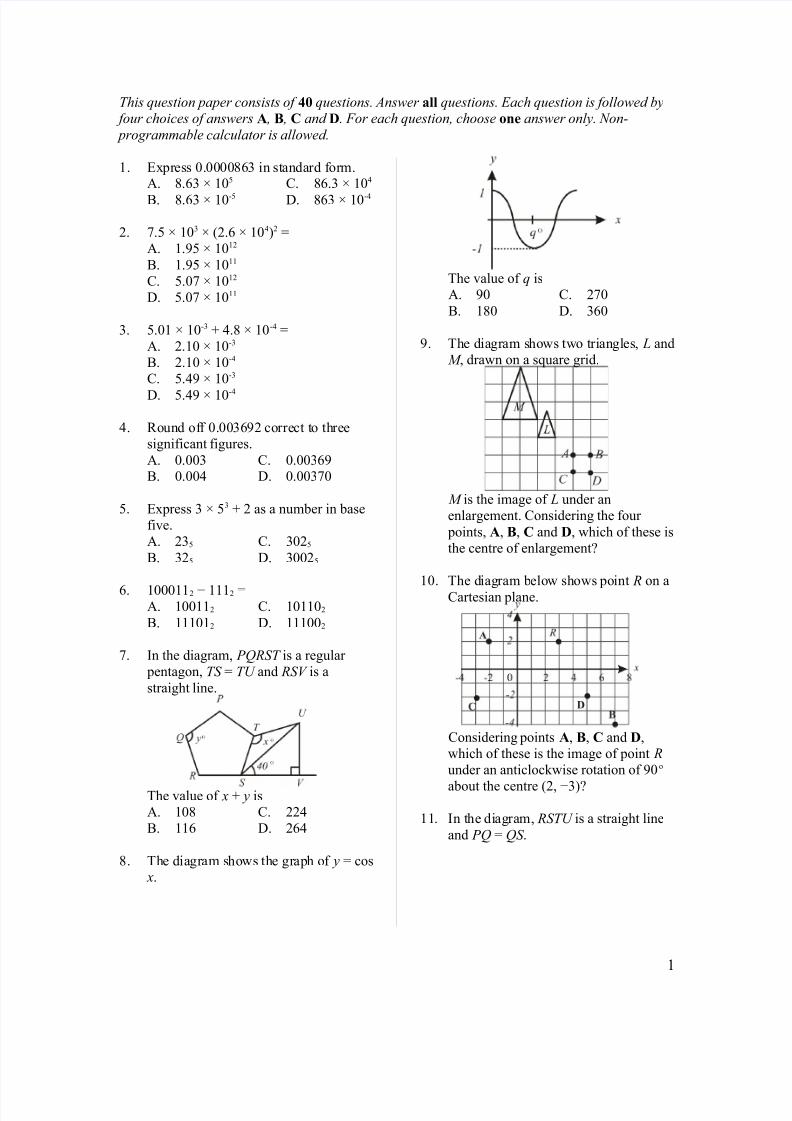
1. Express 0.0000863 in standard form.A. 8.63 × 10⁵ C. 86.3 × 10⁴
B. 8.63 × 10⁻⁵ D. 863 × 10-4
2. 7.5 × 103 × (2.6 × 104)2 =
A. 1.95 × 10¹²
B. 1.95 × 10¹¹
C. 5.07 × 10¹²
D. 5.07 × 10¹¹
3. 5.01 × 10⁻³ + 4.8 × 10-4 =
A. 2.10 × 10⁻³
B. 2.10 × 10⁻⁴
C. 5.49 × 10⁻³
D. 5.49 × 10⁻⁴
4. Round off 0.003692 correct to three
significant figures.
A. 0.003 C. 0.00369B. 0.004 D. 0.00370
5. Express 3 × 53 + 2 as a number in base
five.
A. 235 C. 3025
B. 325 D. 30025
6. 1000112 − 1112 =A. 100112 C. 101102
B. 111012 D. 111002
7. In the diagram, PQRST is a regular
pentagon, TS = TU and RSV is a
straight line.
The value of x + y is
A. 108 C. 224
B. 116 D. 264
8. The diagram shows the graph of y = cos
x.
The value of q is
A. 90 C. 270
B. 180 D. 360
9. The diagram shows two triangles, L and
M , drawn on a square grid.
M is the image of L under an
enlargement. Considering the four
points, A, B, C and D, which of these is
the centre of enlargement?
10. The diagram below shows point R on a
Cartesian plane.
Considering points A, B, C and D,
which of these is the image of point Runder an anticlockwise rotation of 90o
about the centre (2, −3)?
11. In the diagram, RSTU is a straight line
and PQ = QS .
1
8/3/2019 1st Semester Exam Paper1
http://slidepdf.com/reader/full/1st-semester-exam-paper1 2/5
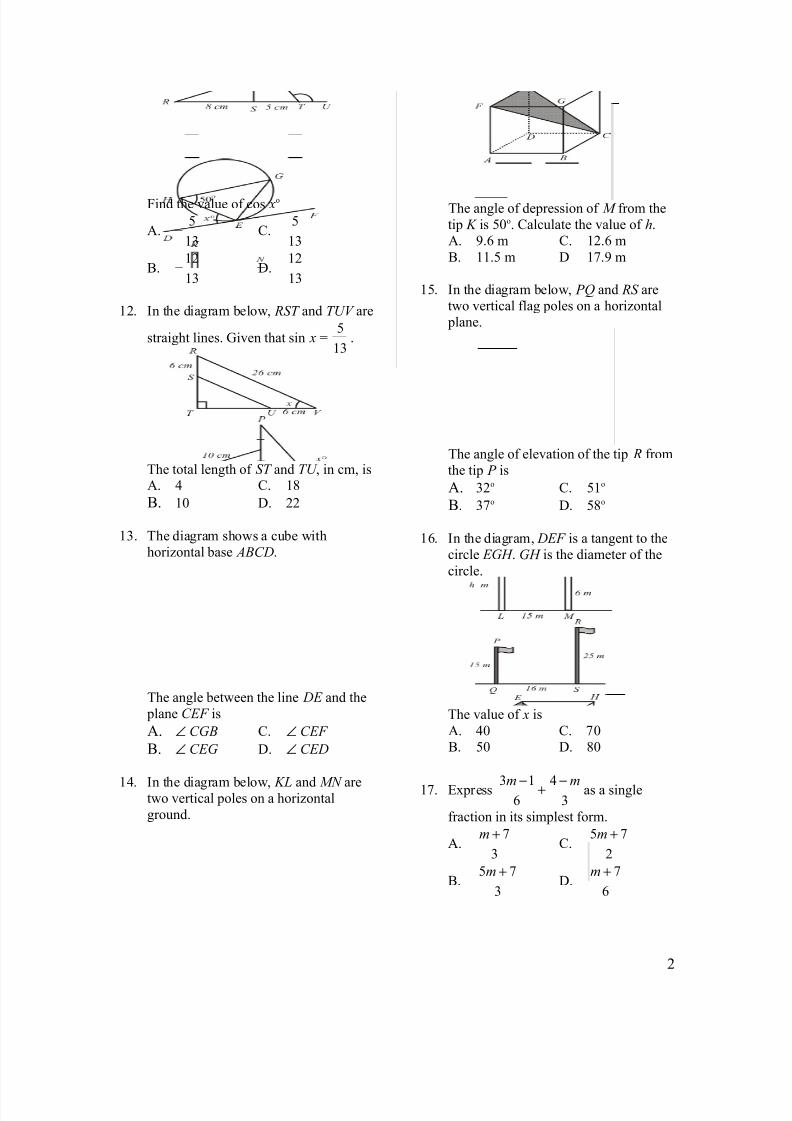
Find the value of cos xo
A. −5
13C.
5
13
B. −12
13D.
12
13
12. In the diagram below, RST and TUV are
straight lines. Given that sin x =5
13.
The total length of ST and TU , in cm, isA. 4 C. 18
B. 10 D. 22
13. The diagram shows a cube with
horizontal base ABCD.
The angle between the line DE and the
plane CEF is
A. ∠ CGB C. ∠ CEF
B. ∠ CEG D. ∠ CED
14. In the diagram below, KL and MN aretwo vertical poles on a horizontal
ground.
The angle of depression of M from the
tip K is 50o. Calculate the value of h.
A. 9.6 m C. 12.6 m
B. 11.5 m D 17.9 m
15. In the diagram below, PQ and RS are
two vertical flag poles on a horizontal
plane.
The angle of elevation of the tip R from
the tip P is
A. 32o C. 51o
B. 37o D. 58o
16. In the diagram, DEF is a tangent to the
circle EGH . GH is the diameter of the
circle.
The value of x is
A. 40 C. 70
B. 50 D. 80
17. Express 3 1 46 3
m m− −+ as a single
fraction in its simplest form.
A.7
3
m +C.
5 7
2
m +
B.5 7
3
m +D.
7
6
m +
2
8/3/2019 1st Semester Exam Paper1
http://slidepdf.com/reader/full/1st-semester-exam-paper1 3/5
18. (−2 x − y)2 – 4 x(1 – 3 x) =
A. 16 x2 – xyB. 16 x2 + 4 xyC. 16 x2 + y2 + 4 xy – 4 xD. 16 x2 – y2 – 4 xy – 4 x
19. (2 x + 5)(3 x – 8) =A. 6 x2 – x – 40
B. 6 x2 + x – 40
C. 6 x2 + 31 x – 40
D. 6 x2 – x + 40
20. Given that y – 2 =3
5
x
− 1, then x =
A.5 1
3
y −C,
3
5( y + 1)
B.5
3
( y – 1) D.3 1
5
y +
21. Given that 2(4 − n) = 3n – 2, then n =
A. 2 C. 6
B. 4 d. 8
22.4 2 2
2
16 3
4
m n n s
mn s
×=
A.312m
nsC.
3
12
nm
sB. 12m3ns D. 12mns
23. Simplify = (d 4)3 ÷ d 6
A. d 6 C. d 3
B. d 4 D. d 2
24. Given that 2 x =3
64
2 x, find the value of
x.
A. 4 C.3
2
B. 2 D.1
2
25. List all the integers which satisfy the
inequalities 3 x – 10 < x ≤ 2 + 5 x.
A. −1, 0, 1, 2, 3, 4, 5
B. −1, 0, 1, 2, 3, 4
C. 0, 1, 2, 3, 4
D. 0, 1, 2, 3, 4, 5
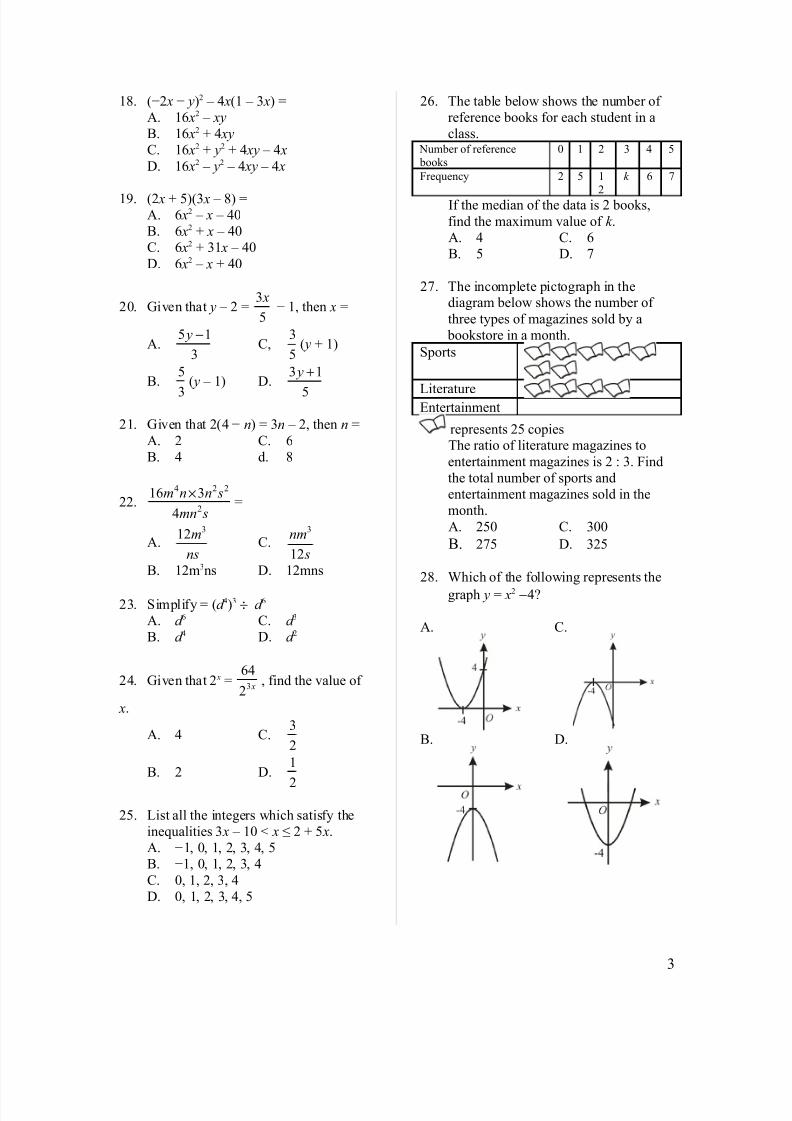
26. The table below shows the number of
reference books for each student in a
class. Number of reference books
0 1 2 3 4 5
Frequency 2 5 12
k 6 7
If the median of the data is 2 books,
find the maximum value of k .A. 4 C. 6
B. 5 D. 7
27. The incomplete pictograph in thediagram below shows the number of
three types of magazines sold by a
bookstore in a month.
Sports
LiteratureEntertainment
represents 25 copiesThe ratio of literature magazines to
entertainment magazines is 2 : 3. Find
the total number of sports and
entertainment magazines sold in the
month.
A. 250 C. 300
B. 275 D. 325
28. Which of the following represents the
graph y = x2 −4?
A. C.
B. D.
3
8/3/2019 1st Semester Exam Paper1
http://slidepdf.com/reader/full/1st-semester-exam-paper1 4/5
29. Which of the following Venn diagrams
represents set Q ⊂ P , such that the
universal set ξ = P ∪ Q?
A.
B.
C.
D.
30. The diagram below is a Venn diagram
with the universal set ξ = P ∪ Q ∪ R.
Which of the regions A, B, C or D,
represents the set Q ′ ∩ R′ ∩ P ?
31. The Venn diagram below shows the
elements of set A, set B and set C.
It is given that the universal set ξ = A
∪ B ∪ C and n(C ′ ) = n( A ∩ C ). Findthe value of x.
A. 5 C. 7
B. 5 D. 9
32. Find the y-intercept of the straight line
3 x – 4 y – 12 = 0
A. −4 C. 3B. −3 D. 4
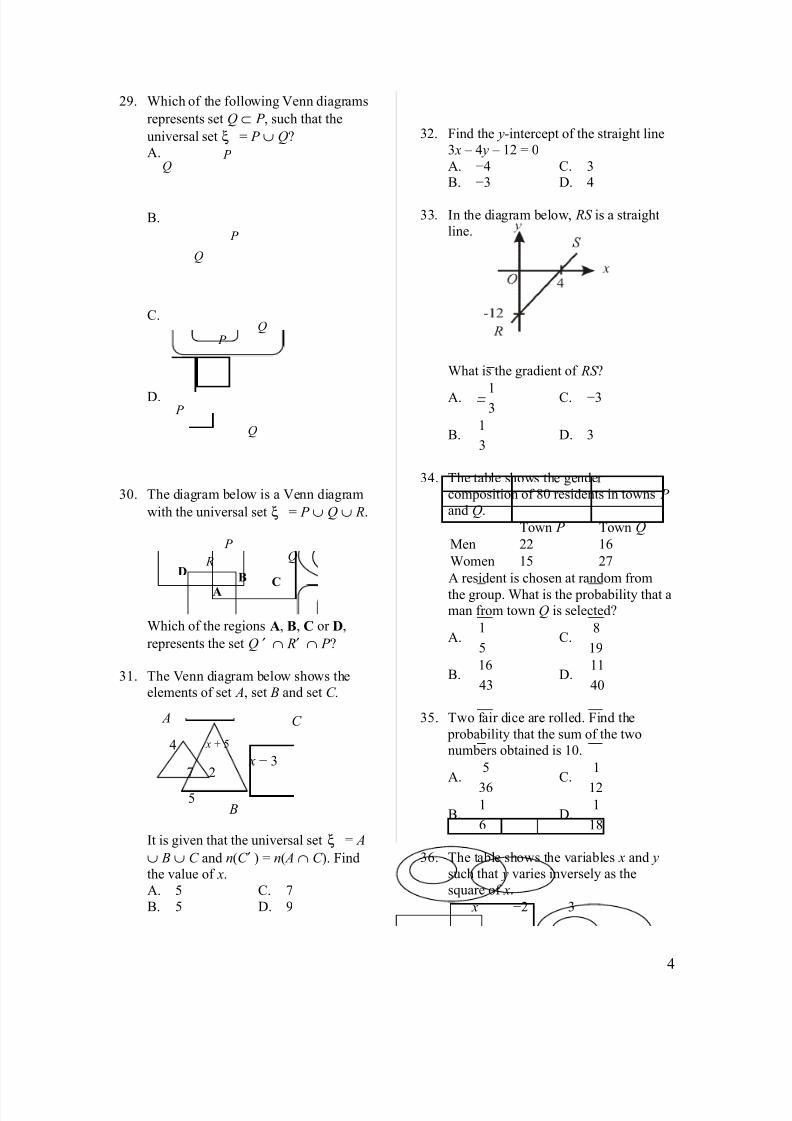
33. In the diagram below, RS is a straight
line.
What is the gradient of RS ?
A. 13
− C. −3
B.1
3D. 3
34. The table shows the gender
composition of 80 residents in towns P and Q.
Town P Town Q
Men 22 16
Women 15 27
A resident is chosen at random from
the group. What is the probability that aman from town Q is selected?
A.1
5C.
8
19
B.16
43D.
11
40
35. Two fair dice are rolled. Find the
probability that the sum of the two
numbers obtained is 10.
A.5
36
C.1
12
B.1
6D.
1
18
36. The table shows the variables x and ysuch that y varies inversely as the
square of x.
x −2 3
4
P Q
Q
P
Q P
Q
P
P Q R
A
BC
D
A
B
C
4 x + 5
7 2
5
x − 3
8/3/2019 1st Semester Exam Paper1
http://slidepdf.com/reader/full/1st-semester-exam-paper1 5/5
y 9 4
Find the relation between y and x.
A. y =9
4 x2 C. y =
4
9 x2
B. y = 2
36
x
D. y = 36 x2
37. It is given that y varies directly as the
square root of x and y = 42 when x =
36. Calculate the value of x when y =
28.
A. 4 C. 16
B. 8 D. 21
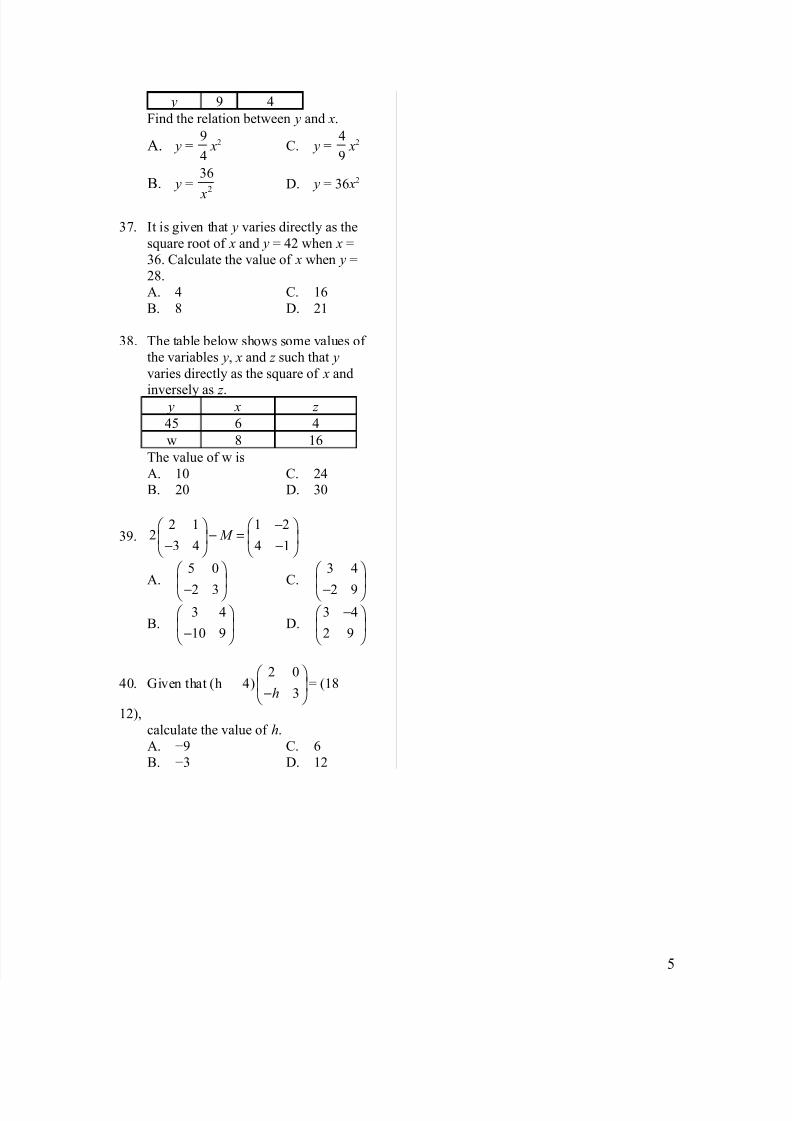
38. The table below shows some values of
the variables y, x and z such that yvaries directly as the square of x and
inversely as z . y x z
45 6 4
w 8 16
The value of w is
A. 10 C. 24B. 20 D. 30
39.2 1 1 2
23 4 4 1
M −
− = − −
A.5 0
2 3
− C.
3 4
2 9
−
B.3 4
10 9
−
D.3 4
2 9
−
40. Given that (h 4)2 0
3h
−
= (18
12),
calculate the value of h.
A. −9 C. 6
B. −3 D. 12
5