Embed Size (px)
Citation preview

September 30, 2020(Un-Audited)
1st Quarterly Accounts


1st Quarterly AccountsFor the period September 30, 2020
01
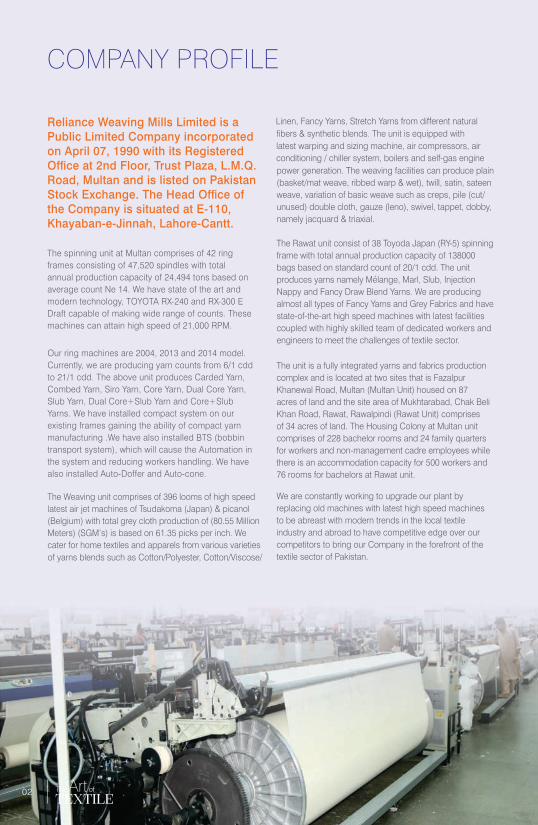
02

1st Quarterly AccountsFor the period September 30, 2020
03

04
Date: October 27, 2020Place: Multan
Dear Members,
On the behalf of the Board of Directors, We are pleased to present first quarterly Financial
Statements of the Company for the period ended September 30, 2020.
Financial Highlights
The Company earned net profit of Rs. 203 million during the period as compared to Rs. 100
million. Turnover of the Company has improved from Rs 4,633 million to Rs. 5,920 million,
which depicts 28% improvement. Financial cost of the Company has reduced from Rs 330
million to Rs. 200 million which is almost 40% reduction as compared to last period due to
reduction in KIBOR from 13% to 7.5% and availed dollar based financing.
Cotton production in Pakistan is estimated around 7.5 million bales depicting a shortfall of 7
million bales. Cotton prices increased from Rs. 9,000 per maund to 10,500 per maund. The
yarn prices soared due to rise in cotton prices. Current year cotton prices shall play important
role in profitability of textile sector. BMR of 50 latest looms shall be completed in 2nd quarter
of the current year.
For and on behalf of the board,
DIRECTORS' REVIEW
Faisal Ahmed Mukhtar
1st Quarterly AccountsFor the period September 30, 2020
05
(Chief Executive)
Dr. M. Shaukat Malik
(Director)
06
10,500
st1 QuarterlyAccounts
September 30, 2020(Un-Audited)
The annexed notes form an integral part of this condensed interim financial information.
CONDENSED INTERIM STATEMENT OFFINANCIAL POSITION (UN-AUDITED)
(Un-audited) (Audited)
September 30 June 30
2020 2020
-----------Rupees in ''000''------------
AS AT SEPTEMBER 30, 2020
Note
5 7,168,306 6,393,392
1,545 1,781
6 35,635 35,635
28,776 28,776
135,874 135,874
7,370,136 6,595,458
218,498 268,499
4,446,696 4,669,118
3,017,973 1,827,071
7 1,300,368 974,612
145,751 75,940
8 789,936
782,192
428,004
585,410
99,332
42,972
10,446,557
9,225,814
17,816,693
15,821,272
700,000 700,000
308,109 308,109
168,794 161,050
1,708,083 949,486
2,661,818 2,458,268
4,846,804 3,876,913
9 2,764,973 2,663,635
31,500 -
63,662 58,229
271,555 258,431
10,434 5,662
3,142,124 2,985,957
2,171,737 1,684,521
8,467 8,523
207,136 266,274
7,109,806 6,658,071
262,362 143,401
68,257 197,612
9,827,765 8,958,402
12,969,889 11,944,359
10
ASSETS
Non-current assets
Property, plant and equipment
Intangible assets
Long term investments
Long term deposits
Deferred tax asset
Current assets
Stores, spares and loose tools
Stock-in-trade
Trade debts
Loans and advances
Prepayments and other receivables
Short term investments
Tax refunds & export rebate due from the government
Cash and bank balances
TOTAL ASSETS
SHARE CAPITAL AND RESERVES
Authorized share capital
Issued, subscribed and paid-up share capital
Reserves
Revaluation surplus on freehold land
Unappropriated profit
Liabilities
Non-current liabilities
Long term finances
Directors' loan
Lease liabilities
Staff retirement benefits - gratuity
Government grant
Current liabilities
Trade and other payables
Unclaimed dividend
Accrued mark-up
Short term borrowings
Current portion of non-current liabilities
Taxation
Total liabilities
Contingencies and commitments
TOTAL EQUITY AND LIABILITIES 17,816,693 15,821,272
08
Chief Executive
FOR THE PERIOD ENDED SEPTEMBER 30, 2020
September 30 September 30
2020 2019
Three months period ended
---------------Rs in ''000''---------------Note
CONDENSED INTERIM STATEMENTOF PROFIT OR LOSS (UN-AUDITED)
Sales - net 11 5,920,354 4,633,336
Cost of sales (5,332,442) (3,997,418)
Gross profit 587,912 635,918
Distribution and marketing expenses (70,197) (59,431)
Administrative expenses (47,753)
(49,000)
Other expenses (21,747)
(41,974)
Other income 24,054
5,435
(115,643)
(144,970)
Profit from operations 472,269 490,948
Finance cost (200,462)
(330,553)
271,807
160,395
Share of loss of associates - (3,000)
Profit before taxation 271,807 157,395
Provision for taxation (68,257) (56,752)
Profit after Taxation 203,550 100,643
Earnings per share 6.61 3.27
The annexed notes form an integral part of this condensed interim financial information.
Chief Executive
1st Quarterly AccountsFor the period September 30, 2020
09
The annexed notes form an integral part of this condensed interim financial information.
September 30 September 30
2020 2019
Three months period ended
---------------Rs in ''000''---------------
CONDENSED INTERIM STATEMENT OFCOMPREHENSIVE INCOME (UN-AUDITED)FOR THE PERIOD ENDED SEPTEMBER 30, 2020
Profit after taxation 203,550 100,643
Other comprehensive income:
Items that will not be reclassified subsequently to
statement of profit or loss:
- Unrealised Gain / (Loss) on remeasurement of short term
investments at fair value through other
comprehensive income 7,744 (6,589)
-Surplus arisen upon revaluation of freehold land 758,597 -
Total comprehensive income for the period 969,891 94,054
10
Chief Executive
Revenue reserve
-----------------------------------Rupees in ''000'' -----------------------------------
Capital reserve
Share capital Share
premium
Revaluation
surplus on
freehold land
General reserve
Fair value
gain / (loss)
on short term
investments
CONDENSED INTERIM STATEMENTOF CHANGES IN EQUITY (UN-AUDITED)FOR THE PERIOD ENDED SEPTEMBER 30, 2020
Unappropriated
profit
Total
The annexed notes form an integral part of this condensed interim financial information.
Balance as at July 01, 2020 (audited) 308,109 41,081 949,486 74,172 45,797
Total comprehensive income for the
period ended September 30, 2020
- profit for the period - - - - -
- other comprehensive income - -
758,597 - 7,744
- - 758,597 - 7,744
Balance as at September 30, 2020 (Un-audited) 308,109 41,081 1,708,083 74,172 53,541
Balance as at July 01, 2019 (audited) 308,109 41,081 949,486 74,172 50,544
Total comprehensive income for the
period ended September 30, 2019
- profit for the period - - - - -
- other comprehensive (loss) (6,589)
- - - - (6,589)
Balance as at September 30, 2019 (Un-audited) 308,109 41,081 949,486 74,172 43,955
2,458,268
203,550
-
203,550
2,661,818
2,467,192
100,643
100,643
2,567,835
3,876,913
203,550
766,341
969,891
4,846,804
3,890,584
100,643
(6,589)
94,054
3,984,638
1st Quarterly AccountsFor the period September 30, 2020
11
Chief Executive
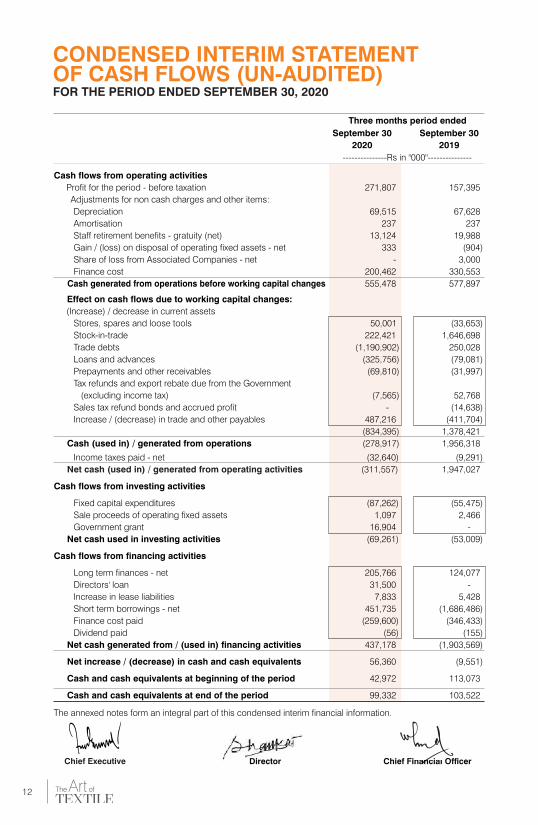
CONDENSED INTERIM STATEMENTOF CASH FLOWS (UN-AUDITED)FOR THE PERIOD ENDED SEPTEMBER 30, 2020
September 30 September 30
2020 2019
Three months period ended
---------------Rs in ''000''---------------
Cash flows from operating activities
Profit for the period - before taxation 271,807 157,395
Adjustments for non cash charges and other items:
Depreciation 69,515 67,628
Amortisation 237 237
Staff retirement benefits - gratuity (net) 13,124 19,988
Gain / (loss) on disposal of operating fixed assets - net 333 (904)
Share of loss from Associated Companies - net - 3,000
Finance cost 200,462 330,553
Cash generated from operations before working capital changes 555,478 577,897
Effect on cash flows due to working capital changes:
(Increase) / decrease in current assets
Stores, spares and loose tools 50,001
(33,653)
Stock-in-trade 222,421
1,646,698
Trade debts (1,190,902)
250,028
Loans and advances (325,756)
(79,081)
Prepayments and other receivables (69,810) (31,997)
Tax refunds and export rebate due from the Government
(excluding income tax) (7,565)
52,768
Sales tax refund bonds and accrued profit -
(14,638)
Increase / (decrease) in trade and other payables 487,216 (411,704)
(834,395) 1,378,421
Cash (used in) / generated from operations (278,917)
1,956,318
Income taxes paid - net (32,640)
(9,291)
Net cash (used in) / generated from operating activities (311,557) 1,947,027
Cash flows from investing activities
Fixed capital expenditures (87,262)
(55,475)
Sale proceeds of operating fixed assets 1,097
2,466
Government grant 16,904
-
Net cash used in investing activities (69,261) (53,009)
Cash flows from financing activities
Long term finances - net 205,766 124,077
Directors' loan 31,500 -
Increase in lease liabilities 7,833 5,428
Short term borrowings - net 451,735 (1,686,486)
Finance cost paid (259,600) (346,433)
Dividend paid (56) (155)
Net cash generated from / (used in) financing activities 437,178 (1,903,569)
Net increase / (decrease) in cash and cash equivalents 56,360 (9,551)
Cash and cash equivalents at beginning of the period 42,972 113,073
Cash and cash equivalents at end of the period 99,332 103,522
The annexed notes form an integral part of this condensed interim financial information.
12
Chief Executive
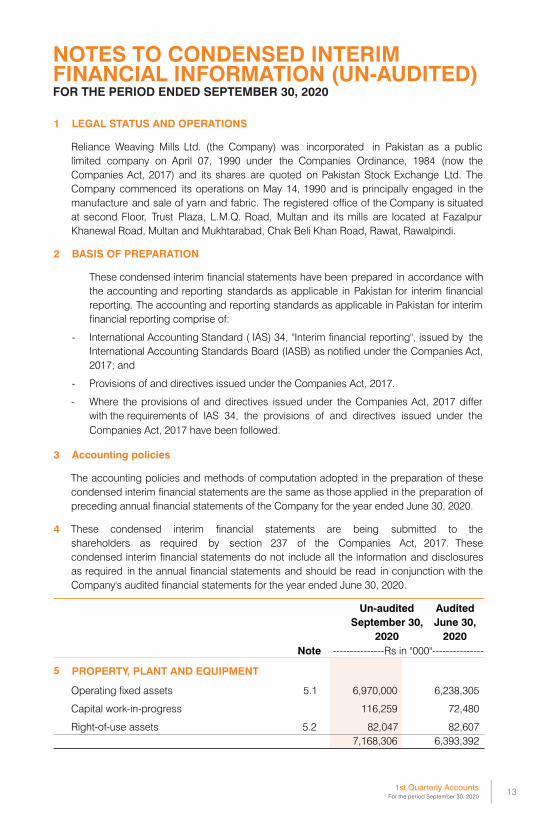
1 LEGAL STATUS AND OPERATIONS
2 BASIS OF PREPARATION
-
-
-
3 Accounting policies
4
Un-audited Audited
September 30, June 30,
Note
2020 2020
5 PROPERTY, PLANT AND EQUIPMENT
Operating fixed assets 5.1 6,970,000 6,238,305
Capital work-in-progress 116,259 72,480
Right-of-use assets 5.2 82,047 82,607
7,168,306 6,393,392
Provisions of and directives issued under the Companies Act, 2017.
Where the provisions of and directives issued under the Companies Act, 2017 differ
with the requirements of IAS 34, the provisions of and directives issued under the
Companies Act, 2017 have been followed.
The accounting policies and methods of computation adopted in the preparation of these
condensed interim financial statements are the same as those applied in the preparation of
preceding annual financial statements of the Company for the year ended June 30, 2020.
These condensed interim financial statements are being submitted to the
shareholders as required by section 237 of the Companies Act, 2017. These
condensed interim financial statements do not include all the information and disclosures
as required in the annual financial statements and should be read in conjunction with the
Company's audited financial statements for the year ended June 30, 2020.
Reliance Weaving Mills Ltd. (the Company) was incorporated in Pakistan as a public
limited company on April 07, 1990 under the Companies Ordinance, 1984 (now the
Companies Act, 2017) and its shares are quoted on Pakistan Stock Exchange Ltd. The
Company commenced its operations on May 14, 1990 and is principally engaged in the
manufacture and sale of yarn and fabric. The registered office of the Company is situated
at second Floor, Trust Plaza, L.M.Q. Road, Multan and its mills are located at Fazalpur
Khanewal Road, Multan and Mukhtarabad, Chak Beli Khan Road, Rawat, Rawalpindi.
These condensed interim financial statements have been prepared in accordance with
the accounting and reporting standards as applicable in Pakistan for interim financial
reporting. The accounting and reporting standards as applicable in Pakistan for interim
financial reporting comprise of:
International Accounting Standard ( IAS) 34, ''Interim financial reporting'', issued by the
International Accounting Standards Board (IASB) as notified under the Companies Act,
2017; and
NOTES TO CONDENSED INTERIMFINANCIAL INFORMATION (UN-AUDITED)FOR THE PERIOD ENDED SEPTEMBER 30, 2020
---------------Rs in ''000''---------------
1st Quarterly AccountsFor the period September 30, 2020
13
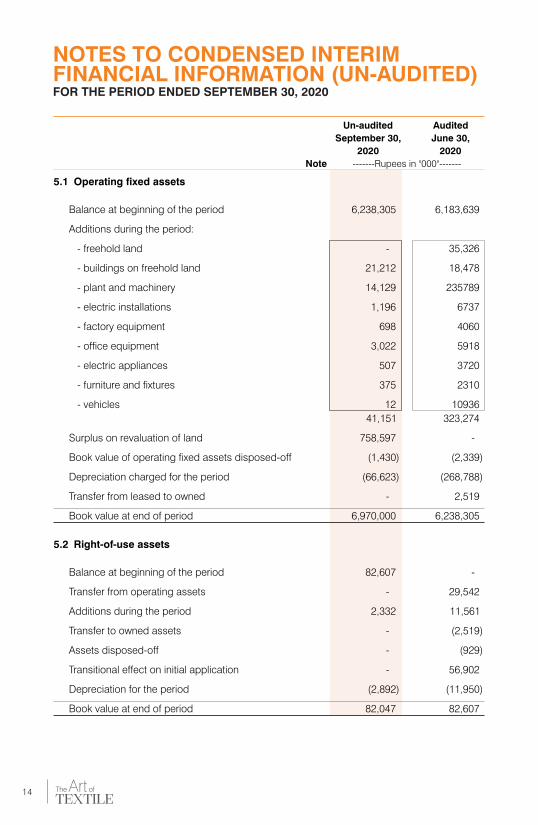
5.1 Operating fixed assets
Balance at beginning of the period 6,238,305 6,183,639
Additions during the period:
- freehold land - 35,326
- buildings on freehold land 21,212 18,478
- plant and machinery 14,129 235789
- electric installations 1,196
6737
- factory equipment 698
4060
- office equipment 3,022
5918
- electric appliances 507
3720
- furniture and fixtures 375
2310
- vehicles 12
10936
41,151 323,274
Surplus on revaluation of land 758,597
Book value of operating fixed assets disposed-off (1,430) (2,339)
Depreciation charged for the period (66,623) (268,788)
Transfer from leased to owned -
2,519
Book value at end of period 6,970,000 6,238,305
5.2 Right-of-use assets
Balance at beginning of the period 82,607 -
Transfer from operating assets - 29,542
Additions during the period 2,332 11,561
Transfer to owned assets - (2,519)
Assets disposed-off - (929)
Transitional effect on initial application - 56,902
Depreciation for the period (2,892) (11,950)
Book value at end of period 82,047 82,607
Un-audited Audited
September 30, June 30,
2020 2020
Note -------Rupees in ''000''-------
14
NOTES TO CONDENSED INTERIMFINANCIAL INFORMATION (UN-AUDITED)FOR THE PERIOD ENDED SEPTEMBER 30, 2020
-
Un-audited Audited
September 30, June 30,
2020 2020
Note
9.
-------Rupees in ''000''-------
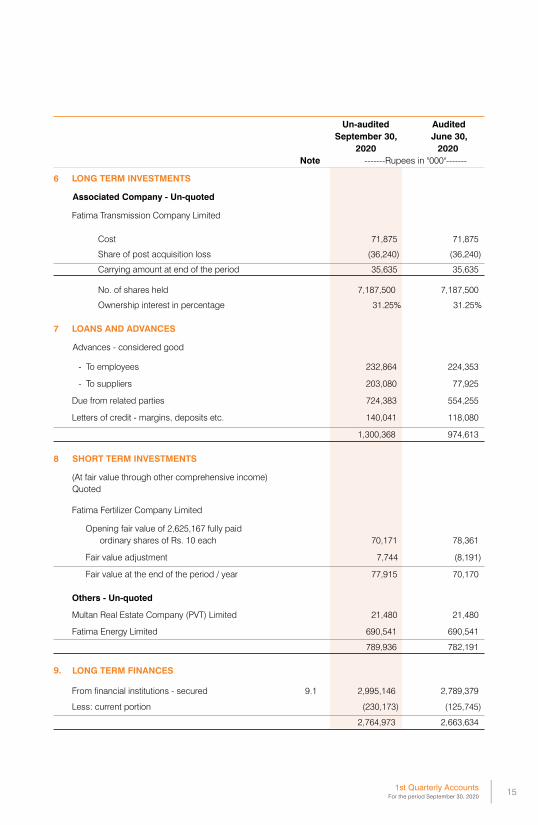
6 LONG TERM INVESTMENTS
Associated Company - Un-quoted
Fatima Transmission Company Limited
Cost 71,875 71,875
Share of post acquisition loss (36,240) (36,240)
Carrying amount at end of the period 35,635 35,635
No. of shares held 7,187,500 7,187,500
Ownership interest in percentage 31.25% 31.25%
7 LOANS AND ADVANCES
Advances - considered good
- To employees 232,864
224,353
- To suppliers 203,080
77,925
Due from related parties 724,383
554,255
Letters of credit - margins, deposits etc. 140,041
118,080
1,300,368 974,613
8 SHORT TERM INVESTMENTS
(At fair value through other comprehensive income)
Quoted
Fatima Fertilizer Company Limited
Opening fair value of 2,625,167 fully paid
ordinary shares of Rs. 10 each 70,171
78,361
Fair value adjustment 7,744
(8,191)
Fair value at the end of the period / year 77,915 70,170
Others - Un-quoted
Multan Real Estate Company (PVT) Limited 21,480 21,480
Fatima Energy Limited 690,541 690,541
789,936 782,191
From financial institutions - secured 9.1 2,995,146 2,789,379
Less: current portion (230,173) (125,745)
2,764,973 2,663,634
1st Quarterly AccountsFor the period September 30, 2020
15
LONG TERM FINANCES
Un-audited Audited
September 30, June 30,
2020 2020
Note -------Rupees in ''000''-------
9.1 The movement of long term finance during the period / year ended is as follows:
Opening balance 2,789,379 2,343,895
Add: obtained during the period / year 215,662 822,825
3,005,041 3,166,720
Less: repaid during the period / year (9,895) (377,341)
Closing balance 2,995,146 2,789,379
10 CONTINGENCIES AND COMMITMENTS
10.1 Contingencies
10.2 Commitments
10.2.1 Letters of credit for:
-Capital expenditures 674,019 575,633
-Other than capital expenditures 572,737 690,685
1,246,756
1,266,318
11 SALES - net
Export 11.1 4,307,502 2,701,612
Local 1,625,416 1,923,966
Waste 49,051 57,896
5,981,969 4,683,474
Less: Commission (61,615) (50,138)
5,920,354 4,633,336
11.1
Foreign bills discounted outstanding as at September 30, 2020 are Rs. 642.019 million ( June 30,
2020: Rs. 1078.650 million).
There is no significant change in the status of contingent liabilities since the annual published
audited financial statements as at June 30, 2020, except the following;
Bank guarantee outstanding as at September 30, 2020 are Rs. 267.606 million ( June 30, 2020:
Rs. 267.606 million).
These includes indirect exports of fabric and yarn aggregating Rs. 1,723 million (September 30,
2019: Nil)
2020 2019
Un-audited
Three months period
ended September 30,
-------Rupees in ''000''-------
16
NOTES TO CONDENSED INTERIMFINANCIAL INFORMATION (UN-AUDITED)FOR THE PERIOD ENDED SEPTEMBER 30, 2020
12 TRANSACTIONS WITH RELATED PARTIES
Nature of transaction
Associated undertakings
- purchase of goods 43,366 68,527
- mark-up income 640
3,393
- mark-up expense 3,059
465
- advances obtained 309,348 105,000
- advances repaid 497,702
317,689
- other expenses shared 1,602
1,242
Key management personnel
- remuneration and other benefits 7,968
7,978
Others
Donations to Mian Mukhtar A. Sheikh Trust 7,700 7,300
13 FINANCIAL RISK MANAGEMENT
14 CAPITAL MANAGEMENT
The Company's financial risk management objective and policies are consistent with those
disclosed in the financial statements as at and for the year ended June 30, 2020.
The Company's capital management objective and policies are consistent with those disclosed in
the financial statements as at and for the year ended June 30, 2020.
The related parties comprise of associated companies, undertakings and key management
personnel. The Company in the normal course of business carries-out transactions with various
related parties. Amounts due from and to related parties are shown under receivables and
payables. Other significant transactions with related parties are as follows:
2020 2019
Un-audited
Three months period
ended September 30,
-------Rupees in ''000''-------
1st Quarterly AccountsFor the period September 30, 2020
17
15
SE
GM
EN
T R
EP
OR
TIN
G
15.1
Re
po
rtab
le s
eg
me
nts
- -
15.2
Se
gm
en
t re
ve
nu
e a
nd
re
su
lts
Th
e C
om
pa
ny'
s re
po
rta
ble
seg
men
ts a
re a
s fo
llow
s:
Sp
inn
ing
seg
men
t -
pro
du
ctio
n o
f d
iffere
nt
qu
alit
y o
f ya
rn u
sin
g n
atu
ral a
nd
art
ificia
l fib
ers
Wea
vin
g s
eg
men
t -
pro
du
ctio
n o
f d
iffere
nt
qu
alit
y o
f g
reig
e f
ab
ric u
sin
g y
arn
Info
rma
tion
reg
ard
ing
th
e C
om
pa
ny’
s re
po
rta
ble
seg
men
ts is
pre
sen
ted
belo
w:
Fo
llow
ing
is a
n a
na
lysi
s o
f th
e C
om
pa
ny'
s re
ven
ue a
nd
resu
lts b
y re
po
rta
ble
seg
men
ts
2020
2019
2020
2019
2020
2019
2020
2019
(Elim
inati
on
of
inte
r-se
gm
en
ttr
an
sacti
on
sTo
tal
----
----
----
----
----
----
----
----
----
----
----
----
----
----
----
----
----
----
----
-- U
n-a
ud
ite
d -
----
----
----
----
----
----
----
----
----
----
----
----
----
----
----
----
----
----
----
-
----
----
----
----
----
----
----
----
----
----
----
----
----
----
----
----
----
----
----
Ru
pe
es in
"000"-
----
----
----
----
----
----
----
----
----
----
----
----
----
----
----
----
----
----
--
Sp
inn
ing
We
avin
g
NOTES TO CONDENSED INTERIMFINANCIAL INFORMATION (UN-AUDITED)FOR THE PERIOD ENDED SEPTEMBER 30, 2020
Sa
les
- n
et
3,1
83
,95
3
2
,44
7,2
44
3
,48
2,2
82
3,1
57
,48
7
(7
45
,88
0)
(97
1,3
95
)5
,92
0,3
54
4,6
33
,33
6
Co
st o
f sa
les
(2,9
23
,55
3)
(2,1
80
,45
7)
(3,1
54
,76
9)
(2,7
88
,35
6)
74
5,8
80
97
1,3
95
(5,3
32
,44
2)
(3,9
97
,41
8)
Gro
ss p
rofit
26
0,4
00
26
6,7
87
32
7,5
12
36
9,1
31
--
58
7,9
12
63
5,9
18
Dis
trib
utio
n a
nd
ma
rketin
g e
xpen
ses
(12
,84
2)
(10
,15
4)
(57
,35
4)
(49
,27
7)
-
-(7
0,1
97
)(5
9,4
31
)
Ad
min
istr
ativ
e e
xpen
ses
(14
,62
4)
(4,0
65
)
(33
,12
9)
(44
,93
5)
-
-(4
7,7
53
)(4
9,0
00
)
Oth
er
exp
en
ses
(11
,96
6)
(8,6
62
)
(9,7
80
)(3
3,3
12
)-
-(2
1,7
47
)(4
1,9
74
)
Oth
er
inco
me
12
,09
6
1,9
33
11
,95
8
3,5
02
24
,05
45
,43
5
(27
,33
7)
(20
,94
8)
(88
,30
6)
(12
4,0
22
)-
-(1
15
,64
3)
(14
4,9
70
)
Pro
fit f
rom
op
era
tion
s2
33
,06
32
45
,83
92
39
,20
72
45
,10
9-
-4
72
,26
94
90
,94
8
Fin
an
ce c
ost
(9
4,9
13
)(1
74
,62
9)
(10
5,5
48
)(1
55
,92
4)
--
(20
0,4
62
)(3
30
,55
3)
13
8,1
49
71
,21
01
33
,65
88
9,1
85
--
27
1,8
07
16
0,3
95
Sh
are
of
loss
fro
m a
sso
cia
te-
(1,5
00
)-
(1,5
00
)-
--
(3,0
00
)
Pro
fit /
(Lo
ss)
befo
re t
axa
tion
13
8,1
49
69
,71
01
33
,65
88
7,6
85
--
27
1,8
07
15
7,3
95
Pro
visi
on
fo
r ta
xatio
n(2
8,5
11
)(2
0,4
50
)(3
9,7
45
)(3
6,3
02
)(6
8,2
57
)(5
6,7
52
)
Pro
fit /
(Lo
ss)
for
the p
erio
d1
09
,63
84
9,2
60
93
,91
35
1,3
83
--
20
3,5
50
10
0,6
43
15.2
.1
Th
ree
mo
nth
s e
nd
ed
Se
pte
mb
er
30,
Th
e a
cco
un
ting
po
licie
s o
f th
e r
ep
ort
ab
le s
eg
men
ts a
re t
he s
am
e a
s th
e C
om
pa
ny'
s a
cco
un
ting
po
licie
s d
esc
ribed
in t
he a
nn
ua
l fin
an
cia
l sta
tem
en
ts fo
r th
e y
ea
r en
ded
Ju
ne 3
0, 2020
18
Un
-au
dit
ed
Au
dit
ed
Un
-au
dit
ed
Au
dit
ed
Un
-au
dit
ed
Au
dit
ed
Se
pte
mb
er
30
Ju
ne
30
Se
pte
mb
er
30
Ju
ne
30
Se
pte
mb
er
30
Ju
ne
30
2020
2020
2020
2020
2020
2020
----
----
----
----
----
----
----
----
----
----
----
----
----
----
Ru
pees
in "
000"-
----
----
----
----
----
----
----
----
----
----
----
----
----
---
Sp
inn
ing
We
avin
gTo
tal
15.3
Se
gm
en
t asse
ts a
nd
lia
bilit
ies
Rep
ort
ab
le s
eg
men
ts' a
ssets
an
d li
ab
ilitie
s a
re r
eco
ncile
d t
o t
ota
l ass
ets
an
d t
ota
l lia
bili
ties
as
follo
ws:
Op
era
ting
fix
ed
ass
ets
4,1
79
,79
73
,62
7,7
51
2,9
88
,50
92
,61
0,5
54
7,1
68
,30
66
,23
8,3
05
Sto
res,
sp
are
s a
nd
loo
se t
oo
ls1
41
,10
4
14
6,3
80
7
7,3
94
12
2,1
19
2
18
,49
82
68
,49
9
Sto
ck
in t
rad
e2
,55
0,2
11
2,2
26
,12
41
,89
6,4
85
2,4
42
,99
44
,44
6,6
96
4,6
69
,11
8
6,8
71
,11
1
6,0
00
,25
5
4,9
62
,38
8
5,1
75
,66
7
11
,83
3,5
00
11
,17
5,9
22
Un
allo
ca
ted
co
rpo
rate
ass
ets
5,9
83
,19
44
,64
5,3
50
Tota
l asse
ts a
s p
er
bala
nce
sh
ee
t1
7,8
16
,69
31
5,8
21
,27
2
15.4
Se
gm
en
t liab
ilit
ies f
or
rep
ort
ab
le s
eg
me
nts
5,1
14
,52
04
,68
7,1
28
5,0
86
,28
34
,84
1,8
69
10
,20
0,8
02
9,5
28
,99
7
Un
allo
ca
ted
co
rpo
rate
lia
bili
ties
2,7
69
,08
72
,41
5,3
62
Tota
l liab
ilit
ies a
s p
er
bala
nce
sh
ee
t1
2,9
69
,88
91
1,9
44
,35
9
Se
gm
en
t asse
ts f
or
rep
ort
ab
le
1st Quarterly AccountsFor the period September 30, 2020
19
16 CORRESPONDING FIGURES
16.1
16.2
17 DATE OF AUTHORIZATION
18 GENERAL
Figures have been rounded off to the nearest thousand rupees except as stated otherwise.
In order to comply with the requirements of IAS 34 "Interim financial reporting", the
condensed interim statement of financial position has been compared with the balances of
annual audited financial statements of the preceding financial year, whereas, condensed
interim statement of profit or loss, condensed interim statement of other comprehensive
income, condensed interim statement of changes in equity and condensed interim
statement of cash flows have been compared with the balances of comparable period of
immediately preceding financial year.
Corresponding figures have been re-arranged and re-classified, wherever necessary, for the
purposes of comparison; however, no significant re-classifications / re-statements have
been made to these condensed interim financial statements.
These condensed interim financial information are authorized for issue on October 27, 2020 by the
Board of Directors of the Company.
NOTES TO CONDENSED INTERIMFINANCIAL INFORMATION (UN-AUDITED)FOR THE PERIOD ENDED SEPTEMBER 30, 2020
20
Chief Executive


2nd Floor Trust Plaza, LMQ Road, Multan
+92 61 450 9700, 450 9749
+92 61 458 4288, 451 1267
rust Plaza, LMQ Road, Multan