Embed Size (px)
Citation preview
Quarterly National Accounts Inventory
Sources and Methods for the Quarterly Compilation of the National Accounts for the Maltese Islands
Compiled by the National Accounts Unit
Economic Statistics Division
Version 1.0 April 2008
Quarterly National Accounts Inventory
National Accounts Unit 2
Foreword
The Quarterly National Accounts (QNA) Inventory for the Maltese Islands was written
by the staff of the National Accounts Unit, with the help of other colleagues from the
Government Finance Unit and the Balance of Payments Unit. This Inventory was
primarily funded by Eurostat grant agreement number 41100.2005.006-2006.554. The
inventory refers to quarterly National Accounts for benchmark year 2004 and uses the
structure recommended by Eurostat in document CN598b. This first version was
completed in April 2008 and submitted to Eurostat. Where quarterly compilation
methods are similar to annual ones, further detail may be found in the GNI Inventory of
Sources and Methods (2008 version).
I would like to thank the writers of this document: Michael Pace Ross, Joseph Vella,
Jennifer Vassallo, Mary Grace Buttigieg, Annabelle Mifsud, Vanessa Dimech, Waldemar
David Galea, Caroline Porter, Dorota Zammit, Mark Theuma and Mark Galea.
Reno Camilleri Acting Director General
April 2008
Quarterly National Accounts Inventory
Economic Statistics Division 3
Table of contents
Chapter 1 Overview of the system of quarterly national accounts 5
1.1 Organisation and institutional arrangements
1.2 Publication timetable, revisions policy and dissemination of QNA
1.3 QNA compilation approach
1.4 Balancing, benchmarking and other reconciliation procedures
1.5 Volume estimates
1.6 Seasonal adjustment and working day correction
1.7 Additional information
Chapter 2 Publication timetable, revisions policy and dissemination of QNA 8
2.1 Release policy
2.2 Contents published
2.3 Special transmissions
2.4 Policy for metadata
Chapter 3 Overall QNA compilation approach 12
3.1 Overall compilation approach
3.2 Balancing, benchmarking and other reconciliation procedures
3.3 Volume estimates
3.4 Seasonal adjustment and working day correction
Chapter 4 GDP components: the production approach 19
4.1 Gross value added, including industry breakdowns (but excluding FISIM)
4.2 FISIM
4.3 Taxes less subsidies on products
Chapter 5 GDP components: the expenditure approach 54
5.1 Household final consumption
5.2 Government final consumption, including split individual/collective consumption
Quarterly National Accounts Inventory
National Accounts Unit 4
5.3 NPISH final consumption
5.4 Gross capital formation
5.5 Imports/Exports
Chapter 6 GDP components: the income approach 61
6.1 Compensation of employees, including components (wages and salaries)
6.2 Taxes less subsidies on production
6.3 Gross operating surplus and mixed income
Chapter 7 Population and employment 67
7.1 Population
7.2 Employment: persons
7.3 Employment: total hours worked
Chapter 8 From GDP to net lending/borrowing 69
8.1 Primary income from/to the ROW (D.1 to D.4), gross national income
8.2 Consumption of fixed capital (K.1), net national income, acquisitions less disposals of non-financial non produced assets (K.2)
8.3 Current transfers from/to the ROW (D.5 to D.7), net national disposable income (B.6n)
8.4 Adjustment for the change in net equity (D.8), net saving (B.8)
8.5 Capital transfers (D.9), net lending/borrowing (B.9)
Chapter 9 Flash estimates 75
9.1 Flash GDP estimate
9.2 Flash employment estimate
9.3 Other existing flash estimate, if any
Chapter 10 Main data sources used 78
Quarterly National Accounts Inventory
Economic Statistics Division 5
Chapter 1 Overview of the system of quarterly national
accounts
1.1 Organisational and institutional arrangements
1.1.1 The National Statistics Office (NSO) is the executive arm of the Malta Statistics Authority and was set up by Act XXIV of 2000 as an independent authority distinct from the government of the day to take over the functions previously done by a Government Department. The NSO was formerly known as the Central Office of Statistics (COS). The mission statement of NSO is “to serve the statistical information needs of Parliament, Government and the community by striving for excellence through the rigorous protection of confidential data, quality information from respondents and a timely and responsive statistical service. 1.1.2 The NSO’s vision statement is “to contribute to a sustainable and orderly pattern of socio-economic development in Malta and in the European Union by excelling in the provision of relevant, timely and quality statistical information in a credible and coherent manner so as to enable decision-making and knowledge accumulation at all levels and in all spheres of the community.” 1.1.3 The responsibility for producing Malta’s quarterly national accounts lies within the Economic Statistics Directorate of the NSO, which post at the time of writing (April 2008) is assumed by the Acting Director Mr Michael Pace Ross. One of the five units within this directorate is the National Accounts Unit, which is directly responsible for the compilation and co-ordination of all quarterly National Accounts. Within the National Accounts Unit there are five senior statisticians and five statisticians and the same persons responsible for the annual accounts are also responsible for the quarterly accounts.
1.2 Publications timetable, revisions policy and dissemination of
QNA
1.2.1 A revisions policy was adopted in 2007. The policy focuses on the revisions of published data. It organizes and limits the number of periods for which data can be revised in terms of various frequencies. The depth of a revision refers to the number of periods that are revised. There are usually three frequencies at which data are revised backwards, namely quarterly, annually and benchmark revisions. 1.2.2 The quarterly national accounts are disseminated through a quarterly news release which is published t+70 days following the end of the quarter under review, or, if the 70th day is a holiday, on the nearest working day before this day. All quarterly news releases are available from the NSO’s website (www.nso.gov.mt). Occasionally,
Quarterly National Accounts Inventory
National Accounts Unit 6
notifications containing explanations of quarterly revisions accompany the news release when this is deemed necessary.
1.3 QNA compilation approach
1.3.1 The benchmark approach for the quarterly National Accounts is the Production Approach. The Expenditure Approach is also estimated independently and the difference between both approaches is classified under ‘changes in inventories’ as a statistical discrepancy. The Income Approach is derived from the other two approaches. 1.3.2 The production approach to the estimation of GDP looks at the contribution to production of each economic unit, in other words the value of their total output less the value of the inputs used up in the production process. For market producers, value added is derived as the difference between gross output and intermediate consumption. Value added for non-market producers is calculated as the sum of the compensation of employees, other taxes less subsidies on production and consumption of fixed capital. 1.3.3 The expenditure approach measures total expenditure on final goods and services produced in the domestic territory or, alternatively, the sum of final uses of goods and services by resident institutional units less the value of imports of goods and services. The total is obtained as the sum of: final consumption expenditure by households, non-profit institutions serving households (NPISH) and government, on goods and services; gross fixed capital formation (capital expenditure on fixed and intangible assets, changes in inventories and acquisitions less disposals of valuables); and net exports of goods and services. These categories are estimated from a wide variety of sources including expenditure surveys, the government’s departmental accounting system, surveys of traders and the administrative documents used in the imports and exports of goods. 1.3.4 The income measure is made up of the different uses to which value added is put. It consists of compensation of employees, other taxes less subsidies on production, gross operating surplus and mixed income. This approach adds up all income earned by resident individuals and corporations in the production of goods and services. Some types of income are not included. These are transfer payments, such as unemployment benefits, children’s allowances, or state pensions. Although these payments provide individuals with money to spend, the payments do not represent remuneration for production during the accounting period.
1.4 Balancing, benchmarking and other reconciliation procedures
1.4.1 The sum of the quarterly National Accounts is always equivalent to the annual figures. Balancing, benchmarking and other reconciliation procedures are conducted on an annual basis rather than on a quarterly basis. What is done quarterly are the basic checks to ensure that there is consistency between the Production Approach and the
Quarterly National Accounts Inventory
Economic Statistics Division 7
Expenditure Approach by analyzing the statistical discrepancy and checking that it is within the established threshold.
1.5 Volume estimates
1.5.1 The estimate of GDP at constant 2000 prices is arrived at by adding the separately deflated final expenditures to exports of goods and services at constant prices and deducting imports of goods and services at constant prices. A Chain Laspeyres Index formula is used throughout for indices which are computed specifically for the deflation of GDP. Specific price indices are compiled by obtaining the quantities, values, unit prices, rates, fees, etc., relative to the items concerned. The unit prices are compared to the same period in the previous year, using the previous year’s values or alternatives as weights. 2000 is the existing base year. 1.5.2 The sources and methods for the compilation of price deflators for Malta’s GDP at constant 2000 prices is available on the NSO’s website through the following link: http://www.nso.gov.mt/docs/GDP_Deflators.pdf
1.6 Seasonal adjustment and working day correction
1.6.1 Seasonal adjustment, inclusive of working day correction, is performed using the latest release of Demetra software provided by Eurostat (Demetra serving as the interface between two popular seasonal adjustment sub-programs adopted by Eurostat – X-12 ARIMA and TRAMO-SEATS). The combined seasonal adjustment and working-day procedure is undertaken on selected variables following the compilation and publication of the required national accounting figures at the end of every quarter. The quarterly seasonal adjustment process is performed on a continuous and complete time series for each variable (generally going back to the first quarter of 2000), with each quarter including fresh data points as they become available.
1.7 Additional information
1.7.1 The following links on NSO’s website provide more detail on quarterly National Accounts: (i) Latest Quarterly National Accounts News Release (2004Q1 to 2007Q4): http://www.nso.gov.mt/statdoc/document_file.aspx?id=2187 (ii) Finalisation of Annual and Quarterly National Accounts (1995-2003): http://www.nso.gov.mt/statdoc/document_file.aspx?id=2014 (iii) GDP Deflators: http://www.nso.gov.mt/docs/GDP_Deflators.pdf (iv) Latest Quarterly accounts for General Government (2002Q1 to 2007Q3): http://www.nso.gov.mt/statdoc/document_file.aspx?id=2148
Quarterly National Accounts Inventory
National Accounts Unit 8
Chapter 2 Publication timetable, revisions policy and
dissemination of QNA
2.1 Release policy
2.1.1 The National Accounts Unit presents quarterly data for the period under review in a news release which is published after t+70 days, or earlier if the 70th day is not a working day. This is in line with Eurostat regulations. The news release is also available online at 11 a.m. on the same day. No one outside NSO has access to the news release prior to its publication. Flash estimates are not released or published prior to the quarterly release. Quarterly institutional sector accounts are not available whilst quarterly public finance statistics are published monthly within t+30 days, except for December data which is published at a later date. 2.1.2 Once data is released locally, it is immediately transmitted to Eurostat. Within a couple of days, the National Accounts database on the NSO website is also updated with the published figures. 2.1.3 The releases are published according to a pre-established calendar which is placed online three months in advance. Internally the National Accounts news release calendar is available twelve months in advance. In the case of unforeseen circumstances, news releases are subject to deferral. However this has never been the case for National Accounts releases since Malta joined the EU.
2.2 Contents published
2.2.1 The quarterly National Accounts news release normally contains 20 pages, with annual data for the last three or four calendar years and their corresponding quarters. The news release is structured as follows:
1. A brief commentary with an overview of the economic activities which contributed towards GDP growth, or otherwise
2. Overall tables with the aggregates of the three GDP approaches 3. An analysis of Gross Value Added by industry at A31 classification, showing
also Output (P.1) and Intermediate Consumption (P.2) 4. Sectoral annual GDP at A17 classification, showing the production account and
the generation of income account for the last four years 5. Sectoral quarterly GDP at A17 classification, showing the production account
and the generation of income account for the quarters of the last four calendar years
6. Household final consumption expenditure by COICOP 7. NPISH final consumption expenditure by COPNI 8. General Government final consumption expenditure by COFOG 9. Gross Fixed Capital Formation by Pi6 10. GDP Expenditure aggregates at constant 2000 prices
Quarterly National Accounts Inventory
Economic Statistics Division 9
11. Seasonally adjusted real GDP 12. GDP per capita (quarterly) 13. GDP deflators (quarterly) 14. Methodological notes
2.2.2 All the data published locally is transmitted to Eurostat on the same day. Occasionally, a notification on revisions accompanies the news release when major revisions occur. A typical National Accounts quarterly news release may be accessed using the following link: http://www.nso.gov.mt/statdoc/document_file.aspx?id=2187
2.3 Special transmissions
2.3.1 The special transmissions carried out by the National Accounts Unit on a quarterly basis to international organizations and other privileged users, besides Eurostat, are the following:
(i) International Monetary Fund (IMF) (ii) Central Bank of Malta (CBM) (iii)Ministry of Finance (Economic Policy Division)
2.3.2 These transmissions normally take place a couple of days after the news release is issued locally and after the data have been sent to Eurostat. Specific requests by other institutions or individuals are dealt with on an ad hoc basis and are normally channeled through the Library and Information Unit. NSO has a pricing policy for all data requests, which is available on the website.
2.4 Policy for metadata
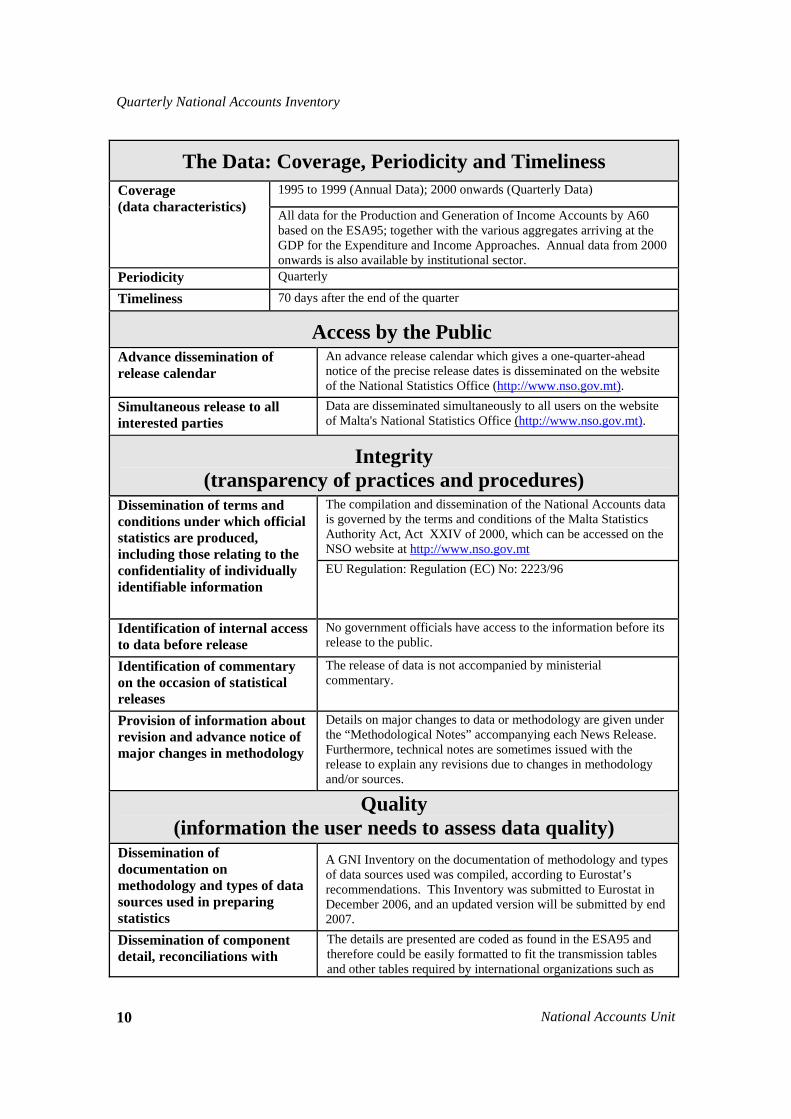
2.4.1 The policy for metadata was last updated in November 2007, and follows the SDDS standard, as shown in the template below:
GEOGRAPHICAL AREA Malta DATA CATEGORY National Accounts LAST UPDATE 13th November 2007 Contact: Mr Michael Pace Ross, A/Director, Economic Statistics Division Phone: 00356 2599 7253 Fax: 00356 2599 7256 Email: [email protected]
Quarterly National Accounts Inventory
National Accounts Unit 10
The Data: Coverage, Periodicity and Timeliness 1995 to 1999 (Annual Data); 2000 onwards (Quarterly Data) Coverage
(data characteristics) All data for the Production and Generation of Income Accounts by A60 based on the ESA95; together with the various aggregates arriving at the GDP for the Expenditure and Income Approaches. Annual data from 2000 onwards is also available by institutional sector.
Periodicity Quarterly
Timeliness 70 days after the end of the quarter
Access by the Public
Advance dissemination of release calendar
An advance release calendar which gives a one-quarter-ahead notice of the precise release dates is disseminated on the website of the National Statistics Office (http://www.nso.gov.mt).
Simultaneous release to all interested parties
Data are disseminated simultaneously to all users on the website of Malta's National Statistics Office (http://www.nso.gov.mt).
Integrity (transparency of practices and procedures)
The compilation and dissemination of the National Accounts data is governed by the terms and conditions of the Malta Statistics Authority Act, Act XXIV of 2000, which can be accessed on the NSO website at http://www.nso.gov.mt
Dissemination of terms and conditions under which official statistics are produced, including those relating to the confidentiality of individually identifiable information
EU Regulation: Regulation (EC) No: 2223/96
Identification of internal access to data before release
No government officials have access to the information before its release to the public.
Identification of commentary on the occasion of statistical releases
The release of data is not accompanied by ministerial commentary.
Provision of information about revision and advance notice of major changes in methodology
Details on major changes to data or methodology are given under the “Methodological Notes” accompanying each News Release. Furthermore, technical notes are sometimes issued with the release to explain any revisions due to changes in methodology and/or sources.
Quality (information the user needs to assess data quality)
Dissemination of documentation on methodology and types of data sources used in preparing statistics
A GNI Inventory on the documentation of methodology and types of data sources used was compiled, according to Eurostat’s recommendations. This Inventory was submitted to Eurostat in December 2006, and an updated version will be submitted by end 2007.
Dissemination of component detail, reconciliations with
The details are presented are coded as found in the ESA95 and therefore could be easily formatted to fit the transmission tables and other tables required by international organizations such as
Quarterly National Accounts Inventory
Economic Statistics Division 11
related data, and statistical frameworks that support cross-checks and provide assurance of reasonableness
the IMF.
Notes:
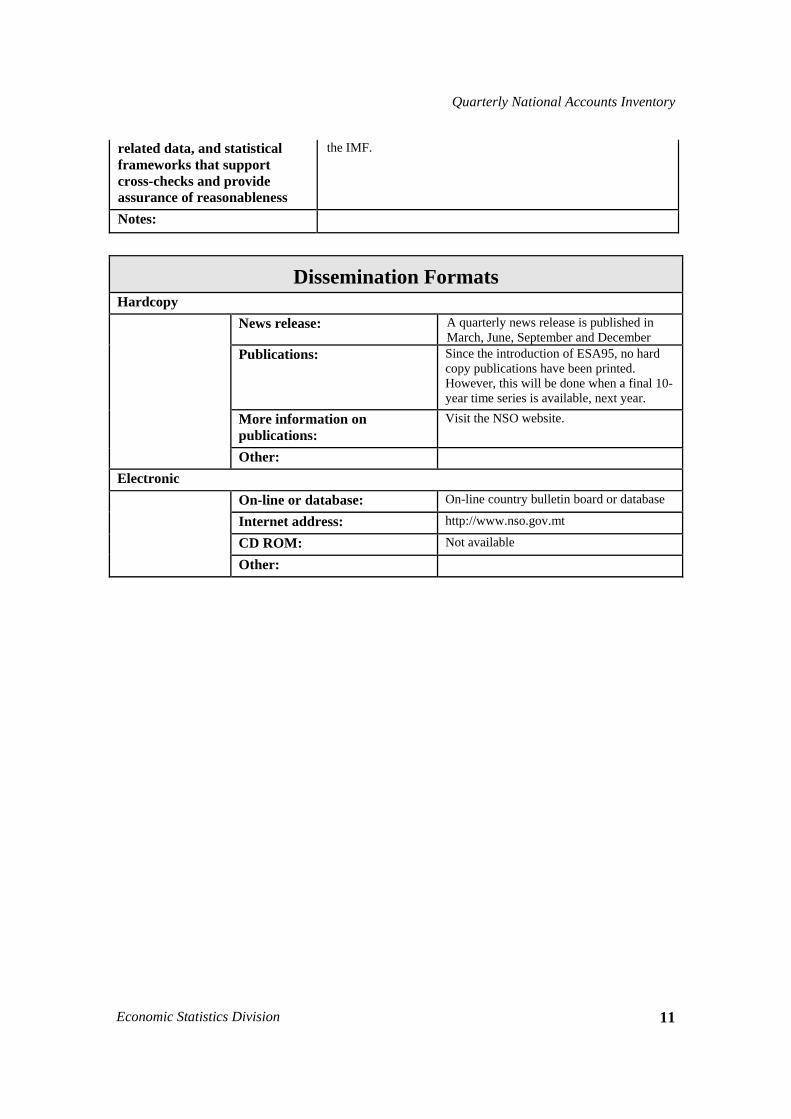
Dissemination Formats Hardcopy
News release: A quarterly news release is published in March, June, September and December
Publications: Since the introduction of ESA95, no hard copy publications have been printed. However, this will be done when a final 10-year time series is available, next year.
More information on publications:
Visit the NSO website.
Other: Electronic
On-line or database: On-line country bulletin board or database
Internet address: http://www.nso.gov.mt
CD ROM: Not available
Other:
Quarterly National Accounts Inventory
National Accounts Unit 12
Chapter 3 Overall QNA compilation approach
3.1 Overall compilation approach
3.1.1 General architecture of the QNA system
3.1.1 The Production Approach is the main approach to estimate quarterly GDP. The basic elements of the production approach are output and intermediate consumption, with gross value added as the balancing item, recorded in the production account of the system. A satisfactory solution to applying the production approach for the GDP compilation depends on the conceptual framework as well as measurement issues. 3.1.2 Production is defined by reference to the production boundary. This boundary is defined as any activity carried out by an institutional unit that uses inputs of material, labour and capital to produce output of goods and services. Purely natural processes of production are excluded by the need for the institutional unit to control and be responsible for the activity. The production boundary therefore includes production of individual and collective services by government, own-account production of housing services by owner-occupiers and production of goods for own final consumption. It also includes the production of services by paid domestic staff, and in principle production forbidden by law, and production from which revenues are not declared to the fiscal authorities. 3.1.3 Production for own final use includes production, storage and processing of agricultural products for own-account by households, including fishing. Likewise, own account production of capital goods includes construction of dwellings by households, but do not include other capital formation like software, literary and artistic originals, and minerals exploration under the heading of production. 3.1.4 Institutional units that are involved in production are called enterprises. These can be corporations, non-profit institutions or unincorporated enterprises. Large enterprises are partitioned into units that are reasonably homogenous with respect to output, cost structure and technology, called ‘kind-of-activity units’ (KAU). These correspond to the class level of the European Classification of Economic Activities (NACE). At a minimum, an enterprises’s information system needs to be capable of recording the value of production, intermediate consumption, compensation of employees, operating surplus, employment and gross fixed capital formation for each KAU. This data is extracted from the Business Register. 3.1.5 The main data sources used for the quarterly Income Approach, which is not estimated independently, relate to compensation of employees, taxes and subsidies, and operating surplus and mixed income. 3.1.6 Various sources are used for compensation of employees, depending on the economic activity under review, and these sources are verified against others when possible. The main sources are quarterly administrative records from the Employment
Quarterly National Accounts Inventory
Economic Statistics Division 13
and Training Corporation (ETC), Labour Force Survey (LFS) data, and quarterly returns from large enterprises. 3.1.7 The main sources of data for both taxes and subsidies are the Government’s Departmental Accounting System (DAS) and eventually the annual financial report. 3.1.8 Operating surplus is the balancing item of the generation of income account (of which, for the household sector, mixed income represents one segment of operating surplus, while income for owner-occupiers producing dwelling services still remains operating surplus). It is the surplus accruing from processes of production before deducting any interest charges, rent or other property incomes payable on the financial assets, land, or other tangible non-produced assets required to carry on production. 3.1.9 The principal data sources used for the quarterly Expenditure Approach are outlined below for each of the main basic components. 3.1.10 Household final consumption expenditure is made up of three broad categories: locally produced consumer goods, imported consumer goods and services to consumers. Household final consumption expenditure in the domestic market consists of expenditure in Malta by residents and non-residents. Expenditure abroad by residents is added while expenditure by tourists in Malta is deducted to arrive at the total final consumption expenditure estimate. The commodity flow method is used extensively on a quarterly basis for imported and locally manufactured goods while services are covered by extensive enquiries and use of existing data. Non-profit institutions serving households’ (NPISH) final consumption expenditure has been estimated for the first time in 1995 and classified by COPNI. 3.1.11 Detailed statements of the government’s recurrent expenditure are obtained on a quarterly basis from the Treasury Department and classified. Extra-budgetary units (EBUs) are surveyed quarterly too. Detailed information on local councils’ expenditure is available from the quarterly accounts. Government recurrent expenditure is classified by COFOG. 3.1.12 The main source for the calculation of changes in inventories is the quarterly stock survey carried out by NSO. Inventories are split in the four recommended categories in ESA 95: materials and supplies, work-in-progress, finished goods and goods for resale. However this breakdown is not explicitly shown in the news releases. In news releases, the quarterly statistical discrepancy is added to changes in inventories and shown as one figure. 3.1.13 Exports and income received from abroad are derived from the credit side of the quarterly BoP statement, and include export s of merchandise including ship repairing, freight, transshipment activities within the Freeport, port services such as stores, bunker oil, fuel and port dues, registration fees, passenger service charges, route air navigation charges, air and sea fares, non-residents expenditure in Malta, income of residents from
Quarterly National Accounts Inventory
National Accounts Unit 14
investments abroad, non-residents’ reinvested earnings and diplomatic expenditure in Malta. 3.1.14 Imports and income paid abroad are derived from the debit side of the quarterly BoP statement and include imported merchandise, freight and insurance, air and sea passenger fares, port services such as stores, bunker oil, fuel and port dues, expenditure by residents abroad, non-residents’ income from investments in Malta and diplomatic expenditure.
3.2 Balancing, benchmarking and other reconciliation procedures
3.2.1 Quarterly GDP balancing procedure
3.2.1.1 Balancing procedures are normally done on an annual basis. This section is therefore not applicable to Malta.
3.2.2 Benchmarking of QNA and ANA
3.2.2.1 Benchmarking is important when undertaking revisions. It is usually both convenient and useful to establish revised levels for the national accounts estimates for a benchmark year in the first place. Generally, when audited annual sources become available, the quarterly estimates are benchmarked to tally with the annual figure, however trends are kept so as not to have big revisions in growth rates.
3.2.3 Other reconciliation(s) of QNA different from balancing and benchmarking
3.2.3.1 This section is not applicable to Malta.
3.2.4 Amount of estimation in various releases
3.2.4.1 This is calculated for annual estimates (not quarterly) through an exercise called “Process Tables”. The extent of estimates may be derived from these tables which are available on the NSO website: http://www.nso.gov.mt/site/page.aspx?pageid=394
3.3 Volume estimates
3.3.1 General volume policy
3.3.1.1 Deflation is performed on the various components of the GDP Expenditure approach using specific indices (deflators): (i) computed every quarter specifically for the purpose (particularly in the case of the services items forming part of the balance of payments current account); or
Quarterly National Accounts Inventory
Economic Statistics Division 15
(ii) readily available on a quarterly basis to the National Accounts Unit, such as the Harmonized Index of Consumer Prices (HICP), as well as the Consumer Price Indices of various countries, made available through the International Monetary Fund/International Financial Statistics (IMF-IFS) online database. 3.3.1.2 2000 is the established reference year; a chain Laspeyres index formula is applied to preserve the linkage to the base year of those quarterly indices (as described in the previous paragraph) which are computed specifically for the deflation of GDP. The annual overlap Laspeyres method is used in such instances. 3.3.1.3 The constant 2000 price variables which are published, both annually and quarterly, are the following: P.3 Total final consumption expenditure P.3 Household final consumption expenditure P.3 NPISH final consumption expenditure P.3 General Government final consumption expenditure P.5 Gross capital formation P.51 Gross fixed capital formation P.52 Changes in inventories (including a statistical discrepancy) P.53 Acquisitions and disposals of valuables P.6 Exports of goods and services P.7 Imports of goods and services
Gross Domestic Product (GDP at constant 2000 prices) 3.3.1.4 Quarterly growth rates of volume quantities of GDP (quarter-on-corresponding quarter of the previous year) are also computed and published in the same news release.
3.3.2 Chain-linking and benchmarking
3.3.2.1 Quarterly data are always compared to data in the previous year (the moving base year) and the sum of the quarters is equal to annual values. The process of chain-linking and benchmarking is described in the following document on GDP Deflators, available on the NSO website: http://www.nso.gov.mt/docs/GDP_Deflators.pdf
3.3.3 Chain-linking and seasonal adjustment
3.3.3.1 There are different practices regarding how to derive seasonal adjusted GDP which may be summed up in the following three options: (i) Indirect adjustment: GDP is calculated as the sum of the seasonally adjusted components (usually from the output approach) (ii) Direct adjustment: (a) GDP and its components are directly adjusted independently. A discrepancy emerges and is reported as a statistical discrepancy (b) GDP and its components are directly adjusted independently but a reconciliation process is performed to ensure additivity
Quarterly National Accounts Inventory
National Accounts Unit 16
(i) If the discrepancy is relatively small it is allocated to a residual item (like change in inventories). (ii) If the discrepancy is not relatively small it is allocated (usually proportionally) to GDP components (consumption, investment, GVA by economic activity, etc) 3.3.3.2 All options are acceptable to Eurostat. In Malta the direct adjustment method is applied. NSO produces additive estimates and ensures that the reconciliation process does not introduce residual seasonality in the components affected. The same process applies for GDP at constant prices.
3.4 Seasonal adjustment and working day correction
3.4.1 Policy for seasonal adjustment
3.4.1.1 Seasonal adjustment means using analytical techniques to break down a series into its components. The purpose is to identify the different components of the time series and to provide a better understanding of the behaviour of that time series for modeling and forecasting purposes, and to remove the regular within-a-year seasonal pattern to highlight the underlying trends and short-run movements in the series. The purpose is not to smoothen the series, which is the objective of trend and trend-cycle estimates. 3.4.1.2 Adjusting a series for seasonal variations removes the identifiable, regularly repeated influences on the series but not the impact of any irregular events. Consequently, if the impact of irregular events is strong, seasonally adjusted series may not represent a smooth, easily interpretable series. To further highlight the underlying trend-cycle, most standard seasonal adjustment packages provide a smoothed trend line running through the seasonally adjusted data. This represents a combined estimate of the underlying long-term trend and the business-cycle movements in the series. 3.4.1.3 The seasonal adjustment process is initially performed using the output approach, utilizing the Gross Value Added at A6 level; the seasonally adjusted A6 GVA components, when appropriately combined with the seasonally adjusted Taxes and Subsidies on products, indirectly yield the GDP from the output side. Nominal GDP is also directly seasonally adjusted, and the discrepancy between this seasonally adjusted figure and that obtained indirectly from the output (GVA) approach is apportioned to each A6 coding classification according to each individual coding’s contribution to GVA. In order to prevent distortion, apportionment of the discrepancy to taxes and subsidies is avoided. 3.4.1.4 The next step is to seasonally adjust the following series at current prices: (i) household final consumption expenditure (ii) NPISH consumption expenditure (iii) government expenditure (iv) exports of goods
Quarterly National Accounts Inventory
Economic Statistics Division 17
(v) exports of services (vi) imports of goods (vii) imports of services 3.4.1.5 The aggregate of these seven variables is then deducted from the seasonally adjusted GDP (obtained as explained above using the output approach), in order to obtain as a residual item seasonally adjusted Gross Capital Formation (GCF) at current prices; the Gross Fixed Capital Formation (GFCF) at current prices is independently seasonally adjusted, at detailed Pi6 level – the difference between the seasonally adjusted GCF expenditure component and the aggregate of the Pi6 seasonally adjusted figures translates into the current price changes in inventories and acquisitions less disposals, which, by default (being a residual item) is already seasonally adjusted. 3.4.1.6 With respect to volume measures of GDP, the seasonal adjustment process can only be conducted from the expenditure approach; at this point in time, the NSO is still compiling the necessary PPI’s in preparation to finally changing over to deflating the output approach. 3.4.1.7 The following constant price components are seasonally adjusted: (i) household final consumption expenditure (ii) NPISH consumption expenditure (iii) government expenditure (iv) gross capital formation (GCF) (v) exports of goods (vi) exports of services (vii) imports of goods (viii) imports of services 3.4.1.8 The gross fixed capital formation at constant prices is seasonally adjusted independently (but not at the same level of detail as undertaken in current prices), with the seasonally adjusted results being then deducted from item (iv) above in order to produce, by default, the residual seasonally adjusted constant price changes in inventories and acquisitions less disposal of valuables. 3.4.1.9 The sum of the individual seasonally adjusted constant price components gives the indirectly derived seasonally adjusted GDP. The constant price GDP aggregate is also directly and separately seasonally adjusted, and then reconciled with the former figure by apportioning the discrepancy to the various expenditure components in accordance with their numerical weight in the overall indirectly seasonally adjusted GDP. 3.4.1.10 Additionally, seasonal adjustment is also performed on the following series: (i) compensation of employees at A6 level (ii) number of employees, self-employed and unemployed in the total economy (iii) total population
Quarterly National Accounts Inventory
National Accounts Unit 18
3.4.1.11 With all the series considered here (with the exception of total population), seasonal adjustment is carried out on a quarterly basis commencing from 2000Q1; in the case of total population, the procedure is extended further to the first quarter of 1986. 3.4.1.12 Seasonal adjustment is performed mainly using the automatic module with default parameters for new automatic processing. Seasonal adjusted and working day adjustments are carried out concurrently (at the moment no separate treatment to identify pure working day effects is being performed). The preferred seasonal adjustment method using Demetra is the Tramo-Seats option, adjusted for Monday to Friday working days (1 regressor). The Maltese public holiday calendar is used, consisting of 13 fixed holidays and 1 moving holiday (Good Friday). 3.4.1.13 Seasonal adjustment is normally done using off-the-shelf programs. These are most commonly provided by one of the programs in the X-11 family, X-12 ARIMA being the latest improved version used by NSO. 3.4.1.14 Eurostat has implemented the beneficial features of the following two seasonal adjustment methods: (i) TRAMO-SEATS, an ARIMA model-based approach, developed by A Maravall and V Gomez of the Bank of Spain; (ii) X-12 ARIMA, based on a moving average filtering algorithm, and developed by the US Bureau of the Census; by incorporating them within a single user-friendly interface called DEMETRA.
3.4.2 Policy for working day correction
3.4.2.1 A seasonal effect is a systematic, calendar-related effect arising from influences such as calendar events related to social and cultural behaviour and also public and religious holidays. For example one may notice the sharp escalation in most retail series which occurs around December in response to the Christmas period, and an increase in water consumption in summer due to hot weather. Other seasonal effects include trading day effects (the number of working or trading days in a given month differs from year to year, and this will impact upon the level of activity in that month or quarter) and moving holidays (the timing of certain holidays such as Easter varies, so the effects of the holiday will be experienced in different periods each year). 3.4.2.2 It is therefore NSO’s policy to seasonally adjust quarterly macroeconomic time series, like GDP and employment since it is believed that seasonal effects are mainly caused by weather and institutional issues, and hence are exogenous to the economic system, since they are mainly caused by non-economic phenomena. These phenomena, whilst uncontrollable, are nevertheless predictable.
Quarterly National Accounts Inventory
Economic Statistics Division 19
Chapter 4 GDP components: the production approach
4.1 Gross value added, including industry breakdowns (but
excluding FISIM)
NACE A
4.1.1 Basic sources for the compilation of quarterly production and generation of income accounts include data from civil abattoir, the fruit and vegetables market, and Malta Dairy Products Ltd (MDP). In the absence of quarterly Economic Agricultural Accounts (EAA) such data sources form the basis of estimation of the agricultural sector on a quarterly basis. 4.1.2 Measurement of output for the Maltese agricultural sector comprises mainly of crop and animal output. Output is valued at basic prices, which is the price receivable by the producers from the producer for a unit of a good or service produced as output minus and taxes payable on that unit as a consequence of its production or sale (i.e taxes on products) plus any subsidy receivable on that unit as a consequence of its production or sale (subsidies on products). 4.1.3 The compilation of quarterly production and generation of income accounts estimates of crop output is based on data on production volumes, prices and wholesale values gathered from the organised fruit and vegetable market. Results from the direct sales survey are applied to quantify direct sales relating to the agricultural sector. 4.1.4 Data from the civil abattoir provide information on a quarterly basis regarding meat production and meat producer prices by animal species registered at slaughterhouses. Information obtained from MDP on a quarterly basis is used principally as a data source for milk production. A factor value is applied to such animal output production. 4.1.5 Exhaustiveness adjustments in the form of factor ratios are applied to source data so as to cover direct and undeclared output. The exhaustive adjustment factor values applied to crop data are based on a direct sales survey conducted by the Agriculture and Fisheries Unit. Minor exhaustiveness adjustments are applied to animal production since a large proportion of animal production is registered at the local slaughterhouses. 4.1.6 Quarterly estimates for Intermediate Consumption (IC) of the agricultural sector are based on the IC/output ratio derived from the annually published EAA. The main data source for the estimation of intermediate consumption in the EAA accounts include importation of goods used within the process of production and information from surveys regarding the production of specific agricultural goods. The amount for rents paid presented in the EAA is added to intermediate consumption, in line with ESA 95 requirements.
Quarterly National Accounts Inventory
National Accounts Unit 20
NACE B
4.1.7 The compilation of quarterly production and generation of income accounts for NACE B is similar to the procedure adopted for the estimation of annual accounts, in that the main sources include information gathered from the organised fish markets, trade data, and the Census of Fisheries. 4.1.8 Output of sea fishing is based on quarterly data obtained from the fish report and trade data. Reference is also made to other independent data sources, such as household final consumption estimates so as to ensure that figures are as accurate as possible. Export data and information obtained from the National Aquaculture Centre form the basis of quarterly estimates of local fish farm output.
4.1.9 The Census of Fisheries serves as the main data source for the calculation of intermediate consumption on a quarterly basis. An intermediate consumption to output ratio based on the census was established and applied to the total output of wild fish landings so as to obtain the value of intermediate consumption per quarter.
NACE C
4.1.10 NACE C is defined by group of producer units and covers the following industries:
(i) NACE 11: Extraction of crude petroleum and natural gas: service activities incidental to oil and gas extraction, excluding surveying
(ii) NACE 14: Other mining and quarrying 4.1.11 Quarterly estimates of output, intermediate consumption and value added for NACE 11 are based on direct company data received on a quarterly basis. This quarterly information is eventually benchmarked with annual audited financial accounts.
4.1.12 Based on output and intermediate consumption per FTE employment ratios obtained from SBS data, quarterly estimates of output and intermediate consumption for NACE 14 are estimated in line with developments in quarterly employment data from the Employment and Training Corporation (ETC), an administrative source.
NACE D
Non-financial corporations (S.11), Households (S.14) and NPISH (S.15) 4.1.13 Quarterly estimates for activities in Section D are worked out for 28 industries (within the 23 A60 levels) and published quarterly figures are at A17 level.
Quarterly National Accounts Inventory
Economic Statistics Division 21
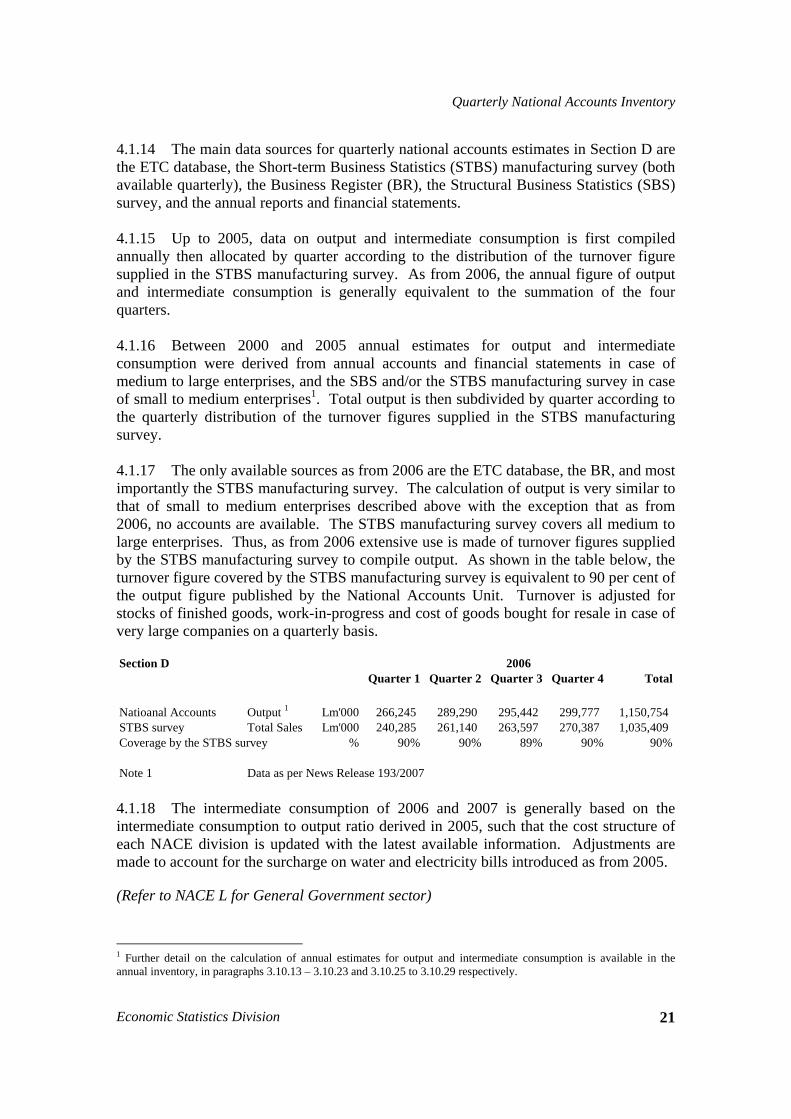
4.1.14 The main data sources for quarterly national accounts estimates in Section D are the ETC database, the Short-term Business Statistics (STBS) manufacturing survey (both available quarterly), the Business Register (BR), the Structural Business Statistics (SBS) survey, and the annual reports and financial statements. 4.1.15 Up to 2005, data on output and intermediate consumption is first compiled annually then allocated by quarter according to the distribution of the turnover figure supplied in the STBS manufacturing survey. As from 2006, the annual figure of output and intermediate consumption is generally equivalent to the summation of the four quarters. 4.1.16 Between 2000 and 2005 annual estimates for output and intermediate consumption were derived from annual accounts and financial statements in case of medium to large enterprises, and the SBS and/or the STBS manufacturing survey in case of small to medium enterprises1. Total output is then subdivided by quarter according to the quarterly distribution of the turnover figures supplied in the STBS manufacturing survey. 4.1.17 The only available sources as from 2006 are the ETC database, the BR, and most importantly the STBS manufacturing survey. The calculation of output is very similar to that of small to medium enterprises described above with the exception that as from 2006, no accounts are available. The STBS manufacturing survey covers all medium to large enterprises. Thus, as from 2006 extensive use is made of turnover figures supplied by the STBS manufacturing survey to compile output. As shown in the table below, the turnover figure covered by the STBS manufacturing survey is equivalent to 90 per cent of the output figure published by the National Accounts Unit. Turnover is adjusted for stocks of finished goods, work-in-progress and cost of goods bought for resale in case of very large companies on a quarterly basis.
Section DQuarter 1 Quarter 2 Quarter 3 Quarter 4 Total
Natioanal Accounts Output 1 Lm'000 266,245 289,290 295,442 299,777 1,150,754 STBS survey Total Sales Lm'000 240,285 261,140 263,597 270,387 1,035,409 Coverage by the STBS survey % 90% 90% 89% 90% 90%
Note 1 Data as per News Release 193/2007
2006
4.1.18 The intermediate consumption of 2006 and 2007 is generally based on the intermediate consumption to output ratio derived in 2005, such that the cost structure of each NACE division is updated with the latest available information. Adjustments are made to account for the surcharge on water and electricity bills introduced as from 2005.
(Refer to NACE L for General Government sector)
1 Further detail on the calculation of annual estimates for output and intermediate consumption is available in the annual inventory, in paragraphs 3.10.13 – 3.10.23 and 3.10.25 to 3.10.29 respectively.
Quarterly National Accounts Inventory
National Accounts Unit 22
NACE E
4.1.19 Estimated quarterly market output of the two main corporations operating within NACE E is based on their turnover as submitted in quarterly returns. Turnover of Enemalta Corporation (Electricity Division) is inclusive of the fuel surcharge. The government subsidy payable to the Water Services Corporation (WSC) to cover for the losses incurred due to subsidised water rates is classified as a subsidy on products (D.319) and is added to turnover. 4.1.20 Quarterly turnover is adjusted by the National Accounts Unit in order to arrive at a preliminary estimate of market output. The adjustment is based on the relationship between market output, compiled from the latest audited annual financial statements, and turnover (including D.319) in respect of the same accounting period as per quarterly returns. Quarterly estimates are eventually revised when the annual audited financial statements are published. Market output is re-calculated from published accounts and quarterly estimates are re-scaled to come in line with the annual data from the financial statements. 4.1.21 As from 2005, quarterly returns of Enemalta also include details of other operating income. Other operating income, excluding interest income, insurance claims receivable and gains on disposals of fixed assets are added to turnover to arrive at a preliminary estimate for quarterly market output. No further adjustments to Enemalta’s quarterly data are therefore carried out at this stage. Quarterly estimates are then reviewed when the annual audited financial statements are available. 4.1.22 Market output calculated from the annual financial statements of the Malta Desalination Services Ltd (MDS) is distributed quarterly based on the quarterly market output of the WSC. Market output for water distributed by trucks is estimated on the number of licensed bowsers, estimated trips per day and basic price per metres cubed as derived from the preliminary report on the development of a programme of measures for Malta groundwater. 4.1.23 Quarterly estimates of output for own final use relates to staff costs that are capitalised within property, plant and equipment during the quarter under review. 4.1.24 Quarterly estimates of intermediate consumption relating to Enemalta and WSC are based on their quarterly recurrent expenditure, excluding gross wages and salaries, social security contribution paid by employer in respect of employees and provisions for depreciation. An adjustment is made to quarterly data based on the relationship between intermediate consumption as derived from the latest audited annual financial statements and ‘other recurrent expenditure’ in respect of the same accounting period as per quarterly returns. As from 2005, quarterly returns of Enemalta include data on interest payable and claims receivable. Both items are deducted from ‘other recurrent expenditure’ in order to arrive at a quarterly estimate for intermediate consumption. When annual financial statements are published, intermediate consumption is re-calculated and quarterly estimates are reviewed.
Quarterly National Accounts Inventory
Economic Statistics Division 23
4.1.25 Intermediate Consumption of MDS Ltd, calculated from annual financial statements, is distributed quarterly. The ratio of intermediate consumption to output as derived from the annual accounts is applied to the quarterly output in order to arrive at an estimate of intermediate consumption. Intermediate Consumption for bowser operators is estimated at 20 per cent of market output. NACE F 4.1.26 The output of NACE F, for the purpose of making an appropriate distinction between public and private activity (since the relative size and performance of the former is significant in construction), is conveniently subdivided into government and private output; whilst quarterly estimates of the former are readily provided from the Government Finance Unit, quarterly output of the private sector is estimated as described below. 4.1.27 To arrive first at the annual figure of private output for 2004, the average of private output for the consecutive years 2000 – 2003 is computed. The average output for this period is then divided by the average full-time equivalent gainfully occupied in the private sector during the corresponding period, so as to extract the annual average output per FTE gainfully occupied for this reference period. The 2004 figure is then obtained by taking this ratio and multiplying it by the annual average of FTE gainfully occupied for that same year. The figure for private output in each quarter is subsequently obtained by multiplying this annual output estimate to the proportion of FTE gainfully occupied for the quarter when compared to the FTE gainfully occupied for all quarters. 4.1.28 The intermediate consumption of NACE F is also appropriately subdivided (for the same purpose as described earlier) by public and private activity, with quarterly estimates of the former being readily provided by the Government Finance Unit. For computing the annual estimate of private intermediate consumption for 2004, the average of the annual ratios of private consumption to output for the period 2000-2003 is computed. This ratio is then applied to the annual figure of output for 2004 to provide an estimate of intermediate consumption for that same year. In a similar manner, this same ratio is applied to the quarterly estimate of output to arrive at the figure for private intermediate consumption for the quarter. NACE G 4.1.29 The output of enterprises classified in Section G is defined as the trade margin (sales of goods for resale less purchases of goods for resale plus change in stocks of goods for resale) plus income from any other activity. 4.1.30 The quarterly output of enterprises whose principal economic activity falls under NACE 50.1, NACE 50.4 and NACE 50.5 is estimated using the total output of these enterprises per licensed motor vehicle in the benchmark years multiplied by the total
Quarterly National Accounts Inventory
National Accounts Unit 24
stock of motor vehicles published by the Transport Unit (NSO) each quarter. For NACE 50.2, output per motor vehicle for the benchmark years is linked to the HICP item 7.2.3 (Maintenance and Repair of Personal Transport), and for NACE 50.3 output per motor vehicle is linked to the HICP item 7.2.1 (Spare parts and accessories for personal transport). 4.1.31 Quarterly estimates of output of enterprises classified as NACE 51 are estimated in part from direct information derived each quarter directly from large enterprises. Those enterprises, for which no direct information is available quarterly, are estimated using the growth rate in imports of goods by importers classified as NACE 51. This information is obtained from the International Trade Unit within the NSO. 4.1.32 Trade data is classified using the Harmonised System (HS) product codes and is provided to the National Accounts unit at the lowest level of import product detail and with data on the importers buying these products, classified according to NACE. The growth rate in this variable is then used to extrapolate quarterly the purchases of goods for resale in the benchmark year. 4.1.33 For both NACE 51 and NACE 52, the ratio of cost of sales to purchases of goods for resale is calculated for benchmark years from the SBS and applied to the estimated quarterly purchases of goods for resale. The ratio of total sales (which is the sum of sales of goods for resale and turnover from the provision of secondary output) to total cost of sales is also calculated and applied to estimated quarterly total cost of sales. 4.1.34 The model allows for these two ratios to be adjusted for changing trends, in the event that such information is available. Total production value of NACE 51 is the difference between total estimated sales and total estimated cost of sales as described above. This is then added to the production value collected directly from large enterprises. 4.1.35 Quarterly output of NACE 52 is extrapolated on the basis of an index for purchases of resale. This index of purchases for resale is made up of:
(a) Total imports by importers classified as NACE 52: this data is obtained from the International Trade Unit. The National Accounts Unit adjusts this information with an estimate of the amount of imports that do are not captured by Intrastat forms, to anticipate average revisions in the data. An adjustment is carried out to estimate the amount of imports (from Sicily, for example) that are not captured in Intrastat.
(b) Imports of consumer goods by enterprises classified as NACE 51: this data is obtained from the International Trade Unit and the definition of imports of consumer goods is according to the Broad Economic Category (BEC) import classification.
(c) Domestic sales of manufacturing companies: this data is obtained from the STBS manufacturing survey.
(d) Domestic sales of non-manufacturing companies: this data is obtained from the Agriculture Unit. Assumptions are made on the proportions of these domestic sales that
Quarterly National Accounts Inventory
Economic Statistics Division 25
actually pass through retail outlets, and are not sold directly to the consumer by manufacturing and non-manufacturing enterprises. 4.1.36 Quarterly intermediate consumption is calculated in the same manner for all three divisions by using benchmark intermediate consumption to output ratios multiplied by the quarterly output. When more recent data is available, these are incorporated into the quarterly ratio calculations. For some companies, compensation paid to employees is collected directly from quarterly returns. NACE H 4.1.37 Output of Nace 55.1 (Hotels) is made up of: - accommodation revenue (income from tourists and income from Maltese residents); - rent received - annual data from the Hotels Census divided equally among the four quarters; - other income – allocated according to the quarterly total accommodation revenue. 4.1.38 For the period 2000-2004 calculation of accommodation revenue is based on annual information from the Hotels Census. Revenue from local residents is obtained from quarterly HBS 2000 distributions as a percentage of output and is extrapolated forward annually and apportioned quarterly according to the previous year’s ratios. Data on revenue from tourists is compiled annually as a difference between total accommodation revenue and revenue from local residents, then apportioned and extrapolated quarterly according to accommodation expenditure from the Tourism Inbound Survey. 4.1.39 Where information is not available from the Hotels Census, income from tourists is based on the last year’s quarter and the growth rate of accommodation expenditure from the Tourism Inbound Survey (corresponding quarters). Income from Maltese residents is calculated as the difference between total accommodation revenue and income from tourists. Total accommodation revenue is based on income from tourists of the quarter and annual ratios of these components in the previous year. 4.1.40 Output of Nace 55.2 (Camping sites and other short-stay accommodation) is the sum of rent received from tourists in private accommodation, in other short-stay accommodation like hostels, in holiday flats and expenditure by local residents on other short-stay accommodation. 4.1.41 Expenditure by tourists is estimated quarterly by multiplying days stayed in other accommodation by rates for single and twin rooms. Expenditure by local residents is taken from the quarterly HBS 2000 as the base year. For the following years it is based on the previous year’s information and the growth rate of tourist expenditure in the corresponding quarters. 4.1.42 Output of Nace 55.3-55.4 (Bars and Restaurants) is made up of:
Quarterly National Accounts Inventory
National Accounts Unit 26
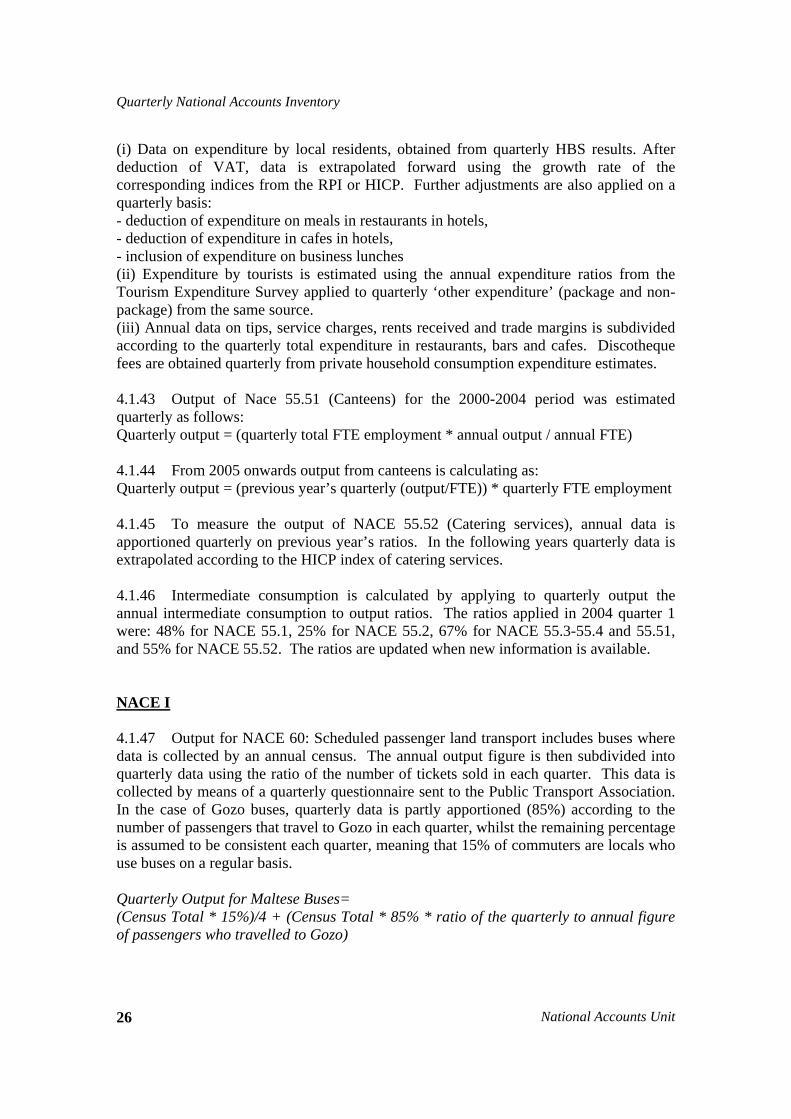
(i) Data on expenditure by local residents, obtained from quarterly HBS results. After deduction of VAT, data is extrapolated forward using the growth rate of the corresponding indices from the RPI or HICP. Further adjustments are also applied on a quarterly basis: - deduction of expenditure on meals in restaurants in hotels, - deduction of expenditure in cafes in hotels, - inclusion of expenditure on business lunches (ii) Expenditure by tourists is estimated using the annual expenditure ratios from the Tourism Expenditure Survey applied to quarterly ‘other expenditure’ (package and non-package) from the same source. (iii) Annual data on tips, service charges, rents received and trade margins is subdivided according to the quarterly total expenditure in restaurants, bars and cafes. Discotheque fees are obtained quarterly from private household consumption expenditure estimates. 4.1.43 Output of Nace 55.51 (Canteens) for the 2000-2004 period was estimated quarterly as follows: Quarterly output = (quarterly total FTE employment * annual output / annual FTE) 4.1.44 From 2005 onwards output from canteens is calculating as: Quarterly output = (previous year’s quarterly (output/FTE)) * quarterly FTE employment 4.1.45 To measure the output of NACE 55.52 (Catering services), annual data is apportioned quarterly on previous year’s ratios. In the following years quarterly data is extrapolated according to the HICP index of catering services. 4.1.46 Intermediate consumption is calculated by applying to quarterly output the annual intermediate consumption to output ratios. The ratios applied in 2004 quarter 1 were: 48% for NACE 55.1, 25% for NACE 55.2, 67% for NACE 55.3-55.4 and 55.51, and 55% for NACE 55.52. The ratios are updated when new information is available. NACE I 4.1.47 Output for NACE 60: Scheduled passenger land transport includes buses where data is collected by an annual census. The annual output figure is then subdivided into quarterly data using the ratio of the number of tickets sold in each quarter. This data is collected by means of a quarterly questionnaire sent to the Public Transport Association. In the case of Gozo buses, quarterly data is partly apportioned (85%) according to the number of passengers that travel to Gozo in each quarter, whilst the remaining percentage is assumed to be consistent each quarter, meaning that 15% of commuters are locals who use buses on a regular basis. Quarterly Output for Maltese Buses= (Census Total * 15%)/4 + (Census Total * 85% * ratio of the quarterly to annual figure of passengers who travelled to Gozo)
Quarterly National Accounts Inventory
Economic Statistics Division 27
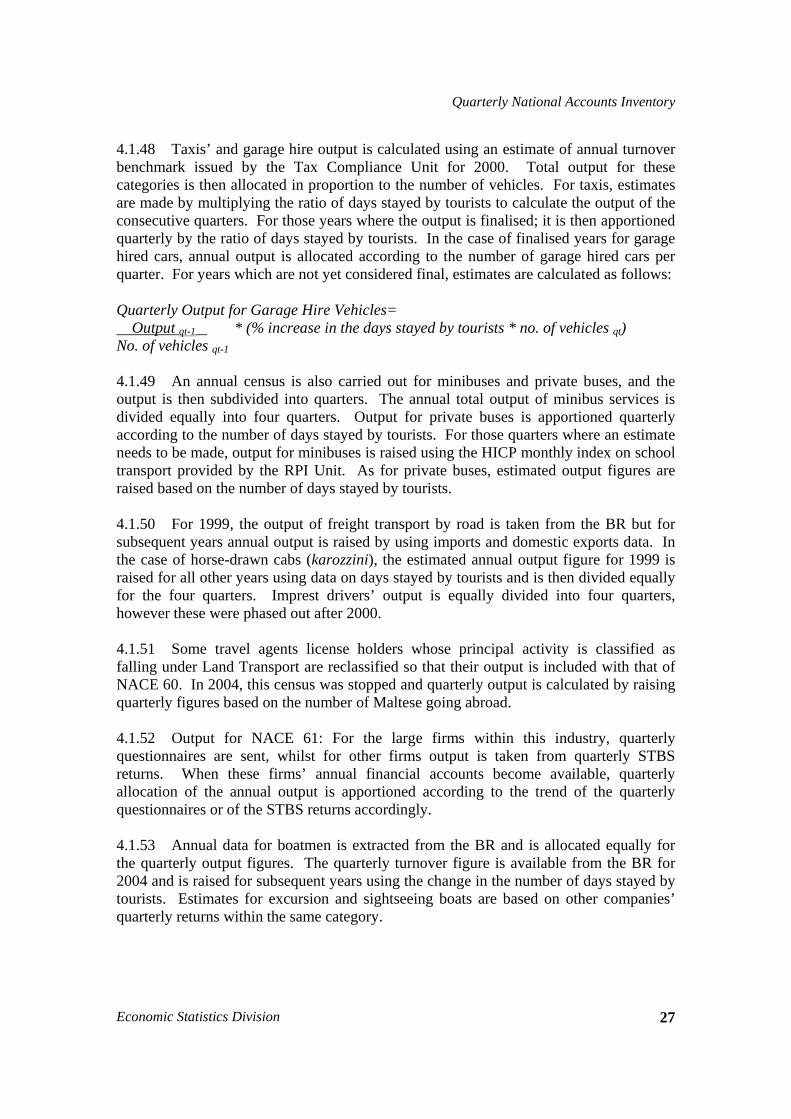
4.1.48 Taxis’ and garage hire output is calculated using an estimate of annual turnover benchmark issued by the Tax Compliance Unit for 2000. Total output for these categories is then allocated in proportion to the number of vehicles. For taxis, estimates are made by multiplying the ratio of days stayed by tourists to calculate the output of the consecutive quarters. For those years where the output is finalised; it is then apportioned quarterly by the ratio of days stayed by tourists. In the case of finalised years for garage hired cars, annual output is allocated according to the number of garage hired cars per quarter. For years which are not yet considered final, estimates are calculated as follows: Quarterly Output for Garage Hire Vehicles= Output qt-1 * (% increase in the days stayed by tourists * no. of vehicles qt) No. of vehicles qt-1 4.1.49 An annual census is also carried out for minibuses and private buses, and the output is then subdivided into quarters. The annual total output of minibus services is divided equally into four quarters. Output for private buses is apportioned quarterly according to the number of days stayed by tourists. For those quarters where an estimate needs to be made, output for minibuses is raised using the HICP monthly index on school transport provided by the RPI Unit. As for private buses, estimated output figures are raised based on the number of days stayed by tourists. 4.1.50 For 1999, the output of freight transport by road is taken from the BR but for subsequent years annual output is raised by using imports and domestic exports data. In the case of horse-drawn cabs (karozzini), the estimated annual output figure for 1999 is raised for all other years using data on days stayed by tourists and is then divided equally for the four quarters. Imprest drivers’ output is equally divided into four quarters, however these were phased out after 2000. 4.1.51 Some travel agents license holders whose principal activity is classified as falling under Land Transport are reclassified so that their output is included with that of NACE 60. In 2004, this census was stopped and quarterly output is calculated by raising quarterly figures based on the number of Maltese going abroad. 4.1.52 Output for NACE 61: For the large firms within this industry, quarterly questionnaires are sent, whilst for other firms output is taken from quarterly STBS returns. When these firms’ annual financial accounts become available, quarterly allocation of the annual output is apportioned according to the trend of the quarterly questionnaires or of the STBS returns accordingly. 4.1.53 Annual data for boatmen is extracted from the BR and is allocated equally for the quarterly output figures. The quarterly turnover figure is available from the BR for 2004 and is raised for subsequent years using the change in the number of days stayed by tourists. Estimates for excursion and sightseeing boats are based on other companies’ quarterly returns within the same category.
Quarterly National Accounts Inventory
National Accounts Unit 28
4.1.54 Output for NACE 62: For a large firm in this industry, a quarterly return is sent to collect the output variable whilst for another, the STBS return is used. This quarterly information is bind with annual audited financial accounts. 4.1.55 In the case of small firms, for which little or no data is available, annual financial accounts are apportioned using the quarterly output to annual output ratio of a large firm in the same industry. In non-finalised years, quarterly estimates are based on the most recent annual accounts and raised by the employment data available from ETC. 4.1.56 Output for NACE 63: For the largest firms a quarterly questionnaire is submitted, whilst for other enterprises STBS returns are used. For some of those firms for which little or no data is available, an estimate is made using the formula:
Quarterly Output =
Output of Travel Agents qt * Output qt-1
Output of Travel Agents qt-1
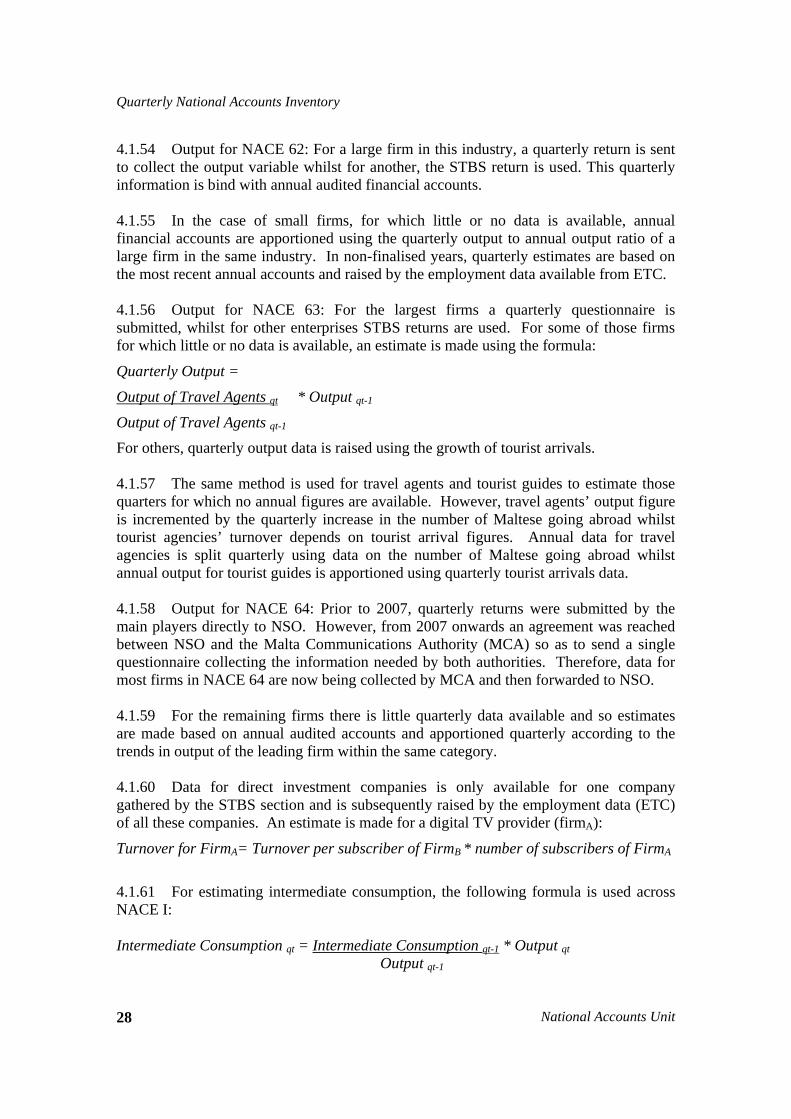
For others, quarterly output data is raised using the growth of tourist arrivals. 4.1.57 The same method is used for travel agents and tourist guides to estimate those quarters for which no annual figures are available. However, travel agents’ output figure is incremented by the quarterly increase in the number of Maltese going abroad whilst tourist agencies’ turnover depends on tourist arrival figures. Annual data for travel agencies is split quarterly using data on the number of Maltese going abroad whilst annual output for tourist guides is apportioned using quarterly tourist arrivals data. 4.1.58 Output for NACE 64: Prior to 2007, quarterly returns were submitted by the main players directly to NSO. However, from 2007 onwards an agreement was reached between NSO and the Malta Communications Authority (MCA) so as to send a single questionnaire collecting the information needed by both authorities. Therefore, data for most firms in NACE 64 are now being collected by MCA and then forwarded to NSO. 4.1.59 For the remaining firms there is little quarterly data available and so estimates are made based on annual audited accounts and apportioned quarterly according to the trends in output of the leading firm within the same category. 4.1.60 Data for direct investment companies is only available for one company gathered by the STBS section and is subsequently raised by the employment data (ETC) of all these companies. An estimate is made for a digital TV provider (firmA):
Turnover for FirmA= Turnover per subscriber of FirmB * number of subscribers of FirmA
4.1.61 For estimating intermediate consumption, the following formula is used across NACE I: Intermediate Consumption qt = Intermediate Consumption qt-1 * Output qt Output qt-1
Quarterly National Accounts Inventory
Economic Statistics Division 29
i.e. The ratio of intermediate consumption to output of the previous year but same quarter multiplied by the current year’s quarter output. 4.1.62 However, in certain cases a separate method had to be applied, as follows: (i) Horse-drawn cabs (Karozzini) in NACE 60 intermediate consumption is estimated to be 20% of turnover. (ii) One firm in NACE 63 whose intermediate consumption is assumed to be 10% of wages based on expert advice. (iii) In NACE 64, intermediate consumption of two firms is calculated to be intermediate consumption to output ratio of another firm within the same industry multiplied by the firm’s output.
NACE J
4.1.63 Quarterly data for the Central Bank of Malta, Deposit Money Banks (DMB) and International Banking Institutions (IBI) is supplied by the CBM through the quarterly profit and loss accounts (variables and methods used can be found in the Annual GNI inventory paragraphs 3.16.1-4). All FISIM output is added to the market output of DMBs; the method for calculating quarterly FISIM is dealt with in section 4.2. For two credit granting institutions no quarterly data is available so an estimate is made based on those years for which annual reports and financial statements are available. 4.1.64 For annual Collective Investment Schemes’ data, when annual financial accounts are not yet available, the following formula is used:
CIS Quarterly Output (estimate) =
Total Resident Shareholders’ Units (Funds)qt * output of CIS qt-1
Total Resident Shareholders’ Units (Funds)qt-1
4.1.65 For NACE 66, all quarterly output data for the eight insurance principals is received from the CBM. To estimate output other than gross premium, output as a percentage of gross premiums is taken for those years finalised by accounts. This data is updated when annual financial accounts become available.
Quarterly Output for Insurance Principals =
Gross Premiums Written (from quarterly questionnaires) * (output/gross premiums written [from finalised accounts])
4.1.66 Output for MFSA in NACE 67 is collected from the quarterly returns submitted to NSO. Quarterly output data for insurance agents is gathered by the CBM on a bi-annual basis. Output is made up of commissions earned and other income. For non-respondents, the following calculations are made:
Per Capita Total Commission Earned =
Quarterly National Accounts Inventory
National Accounts Unit 30
Total Commission earned/Full-time employees + Full-time equivalent (Grossed up by employment figures of non-respondent brokers/agents)
Total Commission Earned Grossed up =
Per Capita Total Commission earned * Full-time employees + Full-time equivalent (Grossed up by employment figures of non-respondent brokers/agents) 4.1.67 Exchange Bureaus quarterly data is raised with the expenditure of tourists in Malta. When the annual figure is finalised it is apportioned quarterly using tourism expenditure. 4.1.68 The output of the Malta Stock Exchange is allocated by quarter using the ratio of quarter to total output of the trading made from government stocks, equities and corporate bonds. For the quarters where an estimate needs to be made, quarterly data is raised by the growth rate of the total amount of trading on the MSE Trading Floor. Data source for the total trading made is available from the Quarterly Report of the MSE. 4.1.69 Travel agents license holders are estimated by raising quarterly data by the growth in the number of Maltese going abroad. This same growth in the number of Maltese going abroad is used for finalised years so as to apportion the annual figure by quarter. 4.1.70 The list of Investment Service Providers is provided by the CBM for the quarters not yet finalised an estimate is made for the annual output using the following formula:
ISP Outputt= ISP Outputt-1 * ISP Outputt-1
ISP Outputt-2 This estimated annual figure is then apportioned quarterly by:
ISP Outputqt= ISP Outputqt-1 * ISP Outputt
ISP Outputt-1
4.1.71 Intermediate Consumption for NACE J: Methods and variables used for calculation of CBM, DMBs and IBIs are the same as those found in the Annual GNI inventory (paragraphs 3.16.4-5). For the remaining firms, including Collective Investment Schemes, estimation is made to calculate the quarterly intermediate consumption; the equation is:
Intermediate Consumption qt = Intermediate Consumption qt-1 * Output qt Output qt-1
4.1.72 Calculation of intermediate consumption for NACE 66 and 67 is done using the following formula:
Intermediate Consumption qt = Intermediate Consumption qt-1 * Output qt
Quarterly National Accounts Inventory
Economic Statistics Division 31
Output qt-1 For insurance agents, data from the questionnaire is used and divided equally between the quarters.
NACE K 4.1.73 Quarterly output of NACE 70.1 and NACE 70.3 is calculated using a value index that measures the change in the stamp duty on the sales/purchases of dwellings in a given year collected by government. Quarterly market output of NACE 70.2 generated from the imputed rental and the actual rental of residential dwellings is calculated by extrapolating the average rent per dwelling using a rent price index. The rent price index is the HICP for residential rentals compiled by NSO, and a volume index. The volume index measures the net increase (additions less discards) in the number of dwellings by tenancy estimated on the basis of the number of permits issued by the Malta Environment and Planning Authority (MEPA), received by NSO on a monthly basis. 4.1.74 Quarterly output of the non-financial and household sectors operating in NACE 71 is extrapolated using various indicators for the different types of entities operating within this industry. For income earned from the hire of self-drive cars, the average turnover earned for each car in the benchmark years is extrapolated using information on the quarterly net increase of self-drive cars and data on the number of nights spent by tourists to capture seasonal fluctuations in this variable. Both quarterly indicators are collected and compiled by the Transport Unit within NSO. Income from the hire of garments is extrapolated using data on the number of weddings each quarter. The quarterly income from renting of machinery is estimated using data on the output of the construction industry. Other categories are extrapolated using quarterly ratios from the HBS applied to annual estimates. Quarterly output of the government sector in these industries is collected via quarterly surveys. 4.1.75 Quarterly output of the non-financial and household sectors operating in NACE 72, 73 and 74 is estimated using benchmark per capita ratios multiplied by employment from ETC as an indicator. For software consultancy and supply in particular, the method and sources used are similar to those used for other activities under NACE 72. Some information is collected directly from large companies on a quarterly basis. Quarterly output of the government sector in these industries is collected via quarterly surveys. 4.1.76 Quarterly intermediate consumption is calculated for all divisions within Section K by using benchmark intermediate consumption to output ratios multiplied by the quarterly output. When more recent data is available, these are incorporated into the quarterly ratio calculations. 4.1.77 The only exception is the calculation of intermediate consumption for owner-occupiers earning imputed rentals in NACE 70.2. This is estimated quarterly using the intermediate consumption per dwelling ratio of owner occupiers multiplied by the estimated number of owner-occupied dwellings on a quarterly basis.
Quarterly National Accounts Inventory
National Accounts Unit 32
NACE L 4.1.78 The General Government Sector consists of the Budgetary Central Government (including Ministries and Departments), Extra-Budgetary Units (EBUs) (47 units) and Local Councils (LCs) (68 councils). These are classified into 11 NACE categories, with the Public Administration being the largest contributor. However, the following paragraphs apply also to the other 10 categories. 4.1.79 The main data source for the Budgetary Central Government is the Departmental Accounting System (DAS), which is a day-to-day bookkeeping system, owned by the Treasury Department and made available online in real time to NSO. Monthly aggregates are considered final eight days after the reference month (apart from December). All the revenue and expenditure transactions are coded according to ESA95 classifications. As the DAS is cash-based, the Treasury ensures that all Ministries and Departments report on quarterly basis accruals templates (including debtors, accrued income and deferred income for revenue items and creditors, accrued expenditure and deferred income for expenditure items). These accruals templates are subsequently provided to NSO to be to be used in the compilation of quarterly national accounts data. 4.1.80 The data sources for the EBUs are essentially the quarterly questionnaires that NSO sends to out to all EBUs. To compliment the quarterly questionnaires some EBUs submit their management accounts too. On a quarterly basis, councils submit main aggregates. Once the annual financial statements are available, the quarterly data for the EBUs and the LCs are revised, so that aggregates of the four quarters are equal to the annual data. 4.1.81 The cost approach is used to measure the total output, and the total general government sector operating surplus is zero. Non-market output is calculated as a residual after deducting the output for own final use and the market output. To calculate both the market output and the output for own final use as well as the intermediate consumption on a quarterly basis the above mentioned sources are used. NACE M 4.1.82 Education services are provided by the Non Financial Corporations Sector (S.11), Government Sector (S.13), Household Sector (S.14) and the Non-Profit Institutions Serving Households (S.15). Non Financial Corporations (S.11) and the Households (S.14) Sector 4.1.83 The main sources used to compile output and intermediate consumption of institutions and individuals providing education services in these sectors are:
o Private Independent Schools Survey;
Quarterly National Accounts Inventory
Economic Statistics Division 33
o English Language Schools Survey; o Household Budgetary Survey (HBS) 2000; o Financial Statements; o HICP indices and population data;
4.1.84 Since the above mentioned surveys and financial statements are made available on annual basis, quarterly estimates for output and intermediate consumption are applied every quarter. Once annual results are available, these estimates are revised accordingly. 4.1.85 The main source used to calculate the quarterly production account of independent private schools is the Private Independent Schools Survey where annual output data is distributed quarterly using expenditure ratios resulting from HBS 2000. 4.1.86 The quarterly output of independent private schools – pre-primary, primary and secondary schools – is calculated as the product of output per student and the number of students attending private schools.
Quarterly Output = Quarterly Output per student * No of students per quart 4.1.87 In absence of financial information, quarterly output per student is estimated by extrapolating forward previous quarter’s information according to the weighted growth rates of the HICP indices of pre-primary, primary and secondary school fees
Quarterly Output per Student = Output per student q-1* Weighted Growth rateq/q-1
4.1.88 Since the number of students is made available annually, this indicator is distributed among the quarters by dividing the quarterly output of private schools with the quarterly output per student. In absence of the annual data, the number of students is assumed to be the same as that of the previous year. 4.1.89 Total output produced by English language schools is partly compiled from the English language schools survey and financial statements. Total output is apportioned on quarterly basis using the number of students attending English language schools.
Quarterly Output = Quarterly Output/student * No of students per quarter 4.1.90 In absence of annual information, quarterly output is estimated as the product of quarterly output per student which is assumed to be the same as in previous year and the number of foreign students that is estimated using the quarterly number of tourist departures by air (excluding UK and USA) and the ratio of the number of students attending English language schools to the number of tourist departures (excluding UK and USA) of the same quarter of the previous year. Estimated Quarterly no of students = No of tourist departures q *(the no of studentsqt-
1/no. of tourist departuresqt-1)
Quarterly National Accounts Inventory
National Accounts Unit 34
4.1.91 Total output of private tuition, driving schools and adult and other education is mainly compiled from the HBS 2000. 4.1.92 The output of driving lessons is distributed quarterly as the product of the quarterly output per driving license and the number of driving licenses issued after driving tests every quarter. Output of driving lessons qt = Output per driving license qt * No of driving licenses qt
4.1.93 Unless further information is available quarterly output of driving lessons is estimated as follows: Estimated output of driving lessons Eqt = Output per FTE employment qt-1 * FTE employment qt
4.1.94 Quarterly output of private tuition is calculated as the product of the quarterly output per head and quarterly population between the age of 5 and 24 years of age. Quarterly Output of private tuition = (Quarterly Output per head of total population [5-24 years of age] *Quarterly total population [5 – 24 years of age]) 4.1.95 Since population by age is available on annual basis, quarterly population between the age of 5 and 24 is estimated using the previous years’ ratio of the mentioned age bracket to the total quarterly population. 4.1.96 Total output of adult and other education is distributed using quarterly output per student and the number of students attending evening classes.
Output of adult and other education qt = Output per student qt * No of students qt
4.1.97 The number of students attending evening classes is apportioned quarterly as follows:
No of students qt = Total Output qt * Output per student qt
4.1.98 Unless annual data is available the number of students is assumed to be the same as that of the previous year. 4.1.99 Since HBS 2000 is the benchmark source of information for private tuition and adult and other education, quarterly output per head or student is estimated by extrapolating forward previous year’s data using quarterly developments of weighted price indices of primary and secondary tuition fees. 4.1.100 Output and intermediate consumption of two other institutions which form part of adult and other education services are compiled using annual financial statements.
Quarterly National Accounts Inventory
Economic Statistics Division 35
Total output is distributed quarterly using FTE employment. Quarterly estimates of output of these institutions are compiled using previous year’s information and FTE employment. 4.1.101 Intermediate Consumption for all private education institutions and individuals in sectors S.11 and S.14 is calculated quarterly by applying the annual IC/Output ratio resulting from the direct information to the quarterly output figure. In absence of annual information, previous years’ ratios are used to estimate intermediate consumption.
Quarterly Intermediate Consumption [IC] = Quarterly Output * IC/Output ratio Government Sector (S.13) 4.1.102 The main source used to compile the quarterly production account for the government sector is the Departmental Accounting System (DAS) where data is available on real time. Data on output and intermediate consumption of government education services is provided on quarterly basis by the government section. Non-Profit Institutions Serving Households (S.15) 4.1.103 Education services provided by the NPISH are covered mainly by an annual church school’s survey which is sent to the Archdiocese of Malta and compiled by the Labour and Education Unit and financial statements of major seminaries. 4.1.104 Quarterly total output of education services by NPISH is calculated as the sum of costs. The 50% criterion has been applied to distinguish between market and non market output. Non-market output for education services is calculated as total output less market output and output for own final use. The market output of the NPISH sector is mainly tuition fees received by church schools. 4.1.105 Quarterly market output of church schools is calculated as the product of tuition fees per student per quarter and the quarterly number of students attending church schools. The third quarter is assumed to be summer recess, so market output is not allocated to this quarter. Quarterly Market Output of church schools = Tuition fees per student per quarter * Quarterly number of students 4.1.106 In absence of the annual information from the church school’s survey, quarterly tuition fees per student are estimated by extrapolating forward previous year’s information according to the quarterly developments of the HICP index of education. The quarterly number of students attending church schools is assumed to be the same as previous year. 4.1.107 Quarterly output of the two major seminaries of Malta and Gozo is calculated as the product of market output per FTE employment per quarter and the respective FTE
Quarterly National Accounts Inventory
National Accounts Unit 36
employment, where financial information is obtained from annual financial statements. In absence of annual information, quarterly market output per FTE employment is estimated by extrapolating forward previous year’s information using quarterly developments of the overall price index. 4.1.108 No market output is compiled for those organizations without any financial information available, as their market output is assumed to be negligible. Quarterly intermediate consumption of the above organizations is calculated as the product of the IC/FTE employment per quarter from direct information and the quarterly FTE employment. Quarterly Intermediate Consumption = IC/FTE employment per quarter * FTE employment 4.1.109 In absence of available information IC/FTE employment is estimated by extrapolating the previous year’s data with quarterly developments of the overall RPI index. NACE N 4.1.110 Health and Social Work Activities are provided by the Non Financial Corporations Sector (S.11), Government Sector (S.13), Households Sector (S.14) and the Non Profit Institutions Serving Households (NPISH) Sector (S.15). Non Financial Corporations (S.11) and Households (S.14) Sectors 4.1.111 The main sources used to compile the production account – output and intermediate consumption – are:
o Annual Financial Statements; o Household Budgetary Survey 2000 results; o Demography Statistics; o Health Survey 2003 conducted by the Health Department; o Quarterly employment data provided to the National Accounts Unit by ETC;
4.1.112 Since the HBS is available for 2000 only and financial statements are made available on annual basis, quarterly estimates for output and intermediate consumption are applied every quarter. Once annual results are available, estimates are revised accordingly. 4.1.113 Total output of hospital activities – NACE 85.11 – is covered from annual financial statements derived from the MFSA website and distributed quarterly using FTE employment. In absence of annual financial data quarterly output is estimated as the product of quarterly output per FTE employment which is assumed to be the same as previous year and the FTE employment.
Quarterly National Accounts Inventory
Economic Statistics Division 37
4.1.114 Quarterly Intermediate Consumption of hospital activities is calculated using the annual IC/Output ratio together with the quarterly output figure. 4.1.115 Medical, dental practices and other human health activities – (NACE 85.12 to NACE 85.14) are estimated annually using the same source of information – HBS 2000. Since the majority of these activities are performed by self-employed workers, output is calculated from the expenditure side. 4.1.116 Quarterly output of medical activities – NACE 85.12 and dental practice activities – NACE 85.13 is calculated as the product of the fee per visit – total expenditure divided by the number of visitors - and the quarterly number of visitors. 4.1.117 The quarterly number of visitors in each health activity is estimated using quarterly total population together with the percentage of persons that either are visited by a private general practitioner at home or clinic, a private specialist and a dentist and the quarterly average number of visits. Quarterly number of visitors = (Quarterly Population * % of percentage of persons i * Average no. of visits i) Where i = general practitioner, specialist or a dentist; 4.1.118 For dental activities the number of visitors is estimated using different age categories from total population for every dental activity. 4.1.119 Since 2000 is considered as the benchmark year, quarterly estimates of output of the following years are compiled using the above method, where the fee per visit is extrapolated forward using the growth rates of HICP price indices related to the respective health activities. 4.1.120 Quarterly output of other human health activities – NACE 85.14 – is calculated as the product of output per FTE employment per quarter and the respective quarterly FTE employment. In absence of annual information quarterly output per FTE employment is assumed to be the same as that of previous year. 4.1.121 Quarterly intermediate consumption of medical practice, dental and other human health activities is calculated by applying the annual IC/Output ratio to the quarterly output figure. The IC/Output ratio of each activity is derived from the VAT database. 4.1.122 Output of veterinary services – NACE 85.20 is partly compiled from the HBS 2000 and financial statements for one private company. Quarterly output of one private company is derived as the product of the quarterly output per FTE employment and the FTE employment of the respective quarter. In absence of annual financial statements, the quarterly output per FTE employment is assumed the same as that of the previous year.
Quarterly National Accounts Inventory
National Accounts Unit 38
4.1.123 The rest of the quarterly output of veterinary services is compiled as the product of quarterly output per FTE employment and the quarterly FTE employment. Since 2000 is assumed to be the benchmark year, quarterly output per FTE employment is estimated by extrapolating forward using the quarterly developments of the HICP index of veterinary services. 4.1.124 Total output and intermediate consumption of social work activities with accommodation – NACE 85.31 of two major companies is derived from financial statements. Annual output of these companies is distributed quarterly on the basis of FTE employment. In absence of financial information, quarterly output per FTE employment is estimated to be the same as previous year. Quarterly Output of the rest of the private residential homes is estimated as the product of the average quarterly market output per FTE employment of the major companies and quarterly FTE employment. 4.1.125 HBS 2000 is the main source used to compile the total output figure of social work activities without accommodation – NACE 85.32. Total output is distributed quarterly using FTE employment. Quarterly Output of NACE 85.32 = (Quarterly Output per FTE employment * Quarterly FTE employment) 4.1.126 Quarterly output estimates of the following years are calculated using the above method, where quarterly output per FTE employment is extrapolated forward using quarterly developments of the HICP index of domestic help. 4.1.127 Quarterly intermediate consumption for NACE 85.20, 85.31 and 85.32 is estimated using the annual IC/Output ratio and applying it to the quarterly output figure. Government Sector (S.13) 4.1.128 The main source used to compile the quarterly production account for the government sector is the Departmental Accounting System (DAS) where data is available on real time. Data on output and intermediate consumption of government health services is provided on quarterly basis by the Government Finance Unit. Non-Profit Institutions Serving Households (NPISH) (S.15) 4.1.129 The main sources used to calculate the production account of NPISH are:
o Financial Statements; o NGO’s Survey;
4.1.130 Quarterly total output is calculated using the cost approach. The 50% criterion has been applied to distinguish between market and non market output. Quarterly non-market output is calculated as a residual after deducting market output from total output.
Quarterly National Accounts Inventory
Economic Statistics Division 39
4.1.131 The output and intermediate consumption (IC) of the majority of the organizations providing other human health activities – NACE 85.14 are covered by the annual NGO’s Survey conducted by the Population and Social Statistics. Quarterly market output is calculated as the product of the quarterly market output per member and the number of members. The quarterly number of members is assumed to be the same as the annual average number of members. Quarterly intermediate consumption is calculated as the product of the quarterly IC per member and the number of members. Quarterly estimates of market output and intermediate consumption are estimated using the above method, where both quarterly market output and IC per member are extrapolated forward using the quarterly developments of the overall price index. 4.1.132 Non-Governmental Organisations’ Survey and annual financial statements are used to compile figures of output and intermediate consumption of organizations providing social work activities with accommodation – NACE 85.31 and social work activities without accommodation – NACE 85.32. 4.1.133 Market output of NACE 85.31 is calculated as the product of quarterly market output per resident and the number of residents staying in non profit residential homes. The quarterly number of residents is assumed to be the same as the annual average residents. Annual intermediate Consumption (IC) of these organizations is distributed quarterly using the IC per resident and the number of residents. In absence of financial information quarterly market output and IC per resident are estimated by extrapolating forward previous year’s information with quarterly developments of the HICP item index of residential homes for the elderly – market output and the quarterly developments of the overall price index – intermediate consumption. Market output and intermediate consumption of those organizations without financial information are estimated the same as the rest of the organizations. 4.1.134 Quarterly output of social work activities without accommodation – NACE 85.32 is calculated as the product of the quarterly market output per member and the number of members, whereas quarterly intermediate consumption is calculated as the product of IC per member per quarter and the number of members. In absence of financial information quarterly market output and IC per member are estimated using the quarterly developments of the overall price index. 4.1.135 Organizations having employment data available, market output is assumed to be zero and intermediate consumption is estimated quarterly on the basis of the available direct information per FTE employees as follows:
IC qt (NACE 85.32) = IC qt per FTE employees * FTE employees qt
4.1.136 In absence of direct information, quarterly IC per FTE is estimated by extrapolating it forward using quarterly developments of the overall RPI index. Whereas those organizations without any form of information available, quarterly intermediate consumption is calculated as the product of IC per organization – extrapolated forward using the quarterly growth rate of the RPI index – and the number of organizations.
Quarterly National Accounts Inventory
National Accounts Unit 40
NACE O 4.1.137 Section O covers the following activities:
• NACE 90 – Sewage and Refuse Disposal, sanitation and similar activities; • NACE 91 – Activities of Other membership organizations; • NACE 92 – Recreational, Cultural and Sporting Activities; • NACE 93 – Other Services activities;
NACE 90 – Sewage and Refuse Disposal, sanitation and similar activities 4.1.138 Sewage and Refuse Disposal, sanitation and similar activities are provided by the Non-Financial Corporations Sector (S.11), the Government Sector (S.13) and the Households Sector (S.14). Non Financial Corporations Sector (S.11) 4.1.139 The main sources used to calculate quarterly output and intermediate consumption are:
• Annual Financial Statements; • Employment data derived from the ETC database;
4.1.140 Quarterly output is calculated by distributing annual information among all the quarters according to the quarterly output of the government sector. Since quarterly financial information about these activities is not available, quarterly output for the following years is estimated using previous year’s quarterly output and extrapolating it forward using the growth rate of the government sector market output related to these activities. Quarterly Output Qt = Market OutputQt-1 * (Market Output Gqt / Market OutputGqt-1) Where Qt is the quarter of year t; Qt-1 is previous year’s quarter; Gqt is the quarterly government sector’s output of year t; Gqt-1 is the quarterly government sector’s output of the previous year t-1; 4.1.141 Quarterly intermediate consumption is calculated using the annual IC/Output ratio derived from financial statements and applying it to the quarterly output figure. Unless further information is available previous year’s ratio is used to estimate quarterly intermediate consumption. Output and Intermediate Consumption of the Drainage Unit – which is part of the Water Services Corporation is calculated using financial information derived from a quarterly questionnaire sent to the Corporation. Government Sector (S.13)
Quarterly National Accounts Inventory
Economic Statistics Division 41
4.1.142 Quarterly output and intermediate consumption of the sewage and refuse disposal and sanitation activities which are provided by the government sector are obtained from the Government Finance Unit. The main source used to compile output and intermediate consumption is the Departmental Accounting System (DAS) as financial data is available on real time. Total output of the government sector is made up of market output, non market output and output for own final use. The cost approach is used to calculate total output and non market output is calculated as a residual after deducting market output and output for own final use. Households Sector (S.14) 4.1.143 The main sources used to calculate the production account of this sector are:
• Business Register; • Employment Data – ETC database;
4.1.144 Output within this sector is mainly provided by self-employed workers. The annual output figure is distributed quarterly according to the quarterly government sector output. 4.1.145 For the following years quarterly output is estimated using previous year’s quarterly output by extrapolating forward according to the quarterly developments government sector’s output of this industry. Quarterly intermediate consumption is estimated using the IC/Output ratio derived from financial statements and applying it to the quarterly output figure. This information is used unless further data is available. NACE 91 – Other membership organizations 4.1.146 The Non financial Corporations and the NPISH Sectors are the main providers of the activities of other membership organizations. Non Financial Corporations Sector (S.11) 4.1.147 Annual financial statements and questionnaires are used to compute the production account of activities of business and employers’ organizations – NACE 91.11. The major employers’ associations which cover about 88 per cent of the total number of members are calculated using annual information derived from financial statements. Output is distributed quarterly using FTE employment. Quarterly employment data is obtained from the Employment Training Corporation database. For those years without financial information previous year’s information is used to calculate quarterly market output, together with FTE employment. 4.1.148 Output of other employers’ associations without financial information is estimated quarterly either as the product of the market output per member and the number of members or else it is calculated as the product of the quarterly market output per FTE employment and the FTE employment. Market output per member or per FTE employment is estimated on information derived from financial statements. The number
Quarterly National Accounts Inventory
National Accounts Unit 42
of members subscribed to these employers’ associations is derived from data published by the Department of Industrial and Employment Relations. 4.1.149 Total output of business associations is calculated using data derived from annual questionnaires, where output is distributed quarterly using FTE employment. For the years without annual information, quarterly market output is calculated using previous year’s information together with FTE employment. 4.1.150 Quarterly intermediate consumption of business and employers’ associations is calculated using the annual IC/Output ratio derived from financial statements and questionnaires and applied to the quarterly output figure. Non Profit Institutions Serving Households (S.15) 4.1.151 This sector covers activities of professional organizations – NACE 91.12, activities of trade unions – NACE 91.20, activities of religious organizations – NACE 91.31, activities of political organizations – NACE 91.32 and activities of other membership organizations n.e.c – NACE 91.33. 4.1.152 The main sources used to calculate output and intermediate consumption are:
• Financial Statements; • Non Governmental Organizations’ (NGOs) Survey; • Youth Organizations’ Survey; • Band Clubs’ Survey
4.1.153 Annual information derived from surveys and financial statements is used to calculate quarterly output and intermediate consumption. In absence of annual information, estimates are derived to compile the quarterly production account of activities of membership organizations not elsewhere classified. Quarterly output is calculated using the cost approach. Total output is calculated as the sum of production costs – intermediate consumption, consumption of fixed capital and compensation of employees – and non-market output is calculated as a residual after deducting market output. NACE 91.12 – Activities of Professional Organizations 4.1.154 Direct information about activities of professional organizations is derived from annual financial statements and NGO’s Survey, where quarterly market output and intermediate consumption are calculated by distributing annual figures of these components using the number of members affiliated within these organizations. Quarterly Market Output = (Market Output/member qt)*(No of members qt) Quarterly Intermediate Consumption = (IC/member qt )*(No of members qt)
Quarterly National Accounts Inventory
Economic Statistics Division 43
4.1.155 In the absence of quarterly data sources, quarterly market output per member is assumed to be the same as at the previous year whereas quarterly intermediate consumption per member is estimated by extrapolating forward previous year’s data with the quarterly developments of the price index. 4.1.156 Quarterly market output of those organizations without any financial information is assumed to be equal to zero, as there is no information regarding the market output of these organizations. Quarterly intermediate consumption of those organizations having only employment data available is calculated as the product of the quarterly intermediate consumption per FTE employees and the quarterly FTE employees, whereas 4.1.157 Quarterly intermediate consumption of those organizations without any information available is estimated as the product of quarterly intermediate consumption per organization and the number of organizations each quarter. 4.1.158 For the following years, intermediate consumption of these organizations is estimated using the same method where quarterly intermediate consumption per FTE employees or per organization is extrapolated forward using the quarterly developments of price indices. NACE 91.20 - Activities of trade unions 4.1.159 The main source used to compile the production account of trade unions is the annual financial statements which are provided to NSO by the Department of Industrial and Employment Relations. 4.1.160 Since quarterly data sources are not available, market output and intermediate consumption are distributed quarterly on the basis of the number of members. In absence of financial information quarterly market output and intermediate consumption per member are estimated using previous year’s information and extrapolating forward using quarterly developments of the overall price index.
Quarterly Market Output = (Market Output/member qt)*(No of members qt) Quarterly Intermediate Consumption = (IC/member qt )*(No of members qt)
NACE 91.31 – Activities of religious organizations 4.1.161 NACE 91.31 covers the following organizations:
• Religious Organizations (Christian organizations, cathechism etc.); • Convents, monasteries and oratories of religious orders; • Religious Churches, metropolitan and cathedrals etc;
Religious Organizations
Quarterly National Accounts Inventory
National Accounts Unit 44
4.1.162 Financial information from annual financial statements and surveys is used to calculate quarterly production account – output and intermediate consumption – where financial data derived from financial statements is distributed quarterly using the FTE employment and the information regarding output and intermediate consumption derived from surveys is distributed quarterly using the number of members. 4.1.163 In absence of direct information quarterly market output and intermediate consumption are estimated using previous year’s quarterly data and extrapolated forward using quarterly developments in the overall price index. 4.1.164 Those religious organizations having only employment data available, market output is assumed to be zero whereas intermediate consumption is estimated on the basis of the available direct information from the above mentioned sources. Quarterly intermediate consumption is calculated by distributing annual IC among the quarters using the FTE employment. As regards to the rest of the organizations without any information available, quarterly market output is assumed zero, where a set of estimates is applied to this set of organizations, keeping 2000 as a benchmark year and extrapolating forward using the quarterly developments of the overall price index. Convents, Monasteries and Oratories 4.1.165 Some monasteries are covered by annual financial statements where quarterly output and intermediate consumption of these organizations are calculated by distributing annual information equally among the quarters. For the following years the above components are estimated by extrapolating forward previous year’s quarterly data using quarterly developments of price indices. 4.1.166 Since there is no financial information regarding the rest of the convents and monasteries, 2000 is assumed to be a benchmark year and quarterly intermediate consumption is estimated by extrapolating forward previous year’s quarterly data using the quarterly developments of the overall price index. Quarterly market output is assumed to be zero, as there is no indication regarding the type of market output that is produced by these organizations. Religious Churches 4.1.167 Religious churches include both the Archdiocese of Malta and the Diocese of Gozo – these institutions are in charge of catholic churches in Malta and Gozo, catholic parishes run by religious orders and other religious churches. 4.1.168 Financial information about the curia and parishes which form part of the Archdiocese of Malta is obtained from annual financial statements. Quarterly market output and intermediate consumption are calculated by distributing annual information among the quarters using the quarterly Maltese population residing in towns or villages of these catholic parishes.
Quarterly National Accounts Inventory
Economic Statistics Division 45
4.1.169 As no financial information is available about the Diocese and catholic parishes in Gozo and the parishes run by religious orders, quarterly market output and intermediate consumption of these parishes are estimated using market output and intermediate consumption per head derived from the financial statements of the Archdiocese of Malta together with their respective population. 4.1.170 For the years without financial information, quarterly market output and intermediate consumption are estimated using previous year’s quarterly information together with the respective population. NACE 91.32 – Activities of Political Organisations 4.1.171 Since financial information regarding the two major political parties (PN and MLP) and their clubs around Malta and Gozo is not available, estimates are applied to calculate output and intermediate consumption of these organizations. As regards to quarterly data, 2000 is assumed to be the benchmark year, where quarterly components are extrapolated forwards using quarterly developments of the overall price index and multiplied either by the quarterly FTE employees or the number of organizations. NACE 91.33 – Activities of Membership Organisations 4.1.172 NGO’s, Youth Organisations, Band Clubs surveys and financial statements are used to compile market output and intermediate consumption of membership organizations. 4.1.173 Quarterly market output and intermediate consumption which are derived from financial statements are calculated by distributing annual data among the quarters using the FTE employees. Market output and intermediate consumption of those organizations covered by youth and non governmental organizations’ surveys are distributed equally among the quarters. As regards to market output and intermediate consumption derived from the Band Clubs’ survey, these components are calculated quarterly according to the ratio of feasts celebrated every quarter. 4.1.174 Those organizations having either employment data available or no information at all, quarterly market output is assumed to be zero as no information is available regarding the type of market output produced by these organizations. Quarterly intermediate consumption of organizations with employment data available is calculated by distributing annual information among the quarters with FTE employees. In absence of annual information, intermediate consumption is estimated by extrapolating previous year’s information with the quarterly development of the overall price index. 4.1.175 Intermediate consumption of those organizations without any information available, is estimated quarterly as the product of quarterly intermediate consumption per organization and the number of organizations. Quarterly intermediate consumption per organization is estimated by keeping 2000 as the benchmark year and extrapolating forward using quarterly developments of the overall price index.
Quarterly National Accounts Inventory
National Accounts Unit 46
NACE 92 – Recreation and Culture 4.1.176 Recreation and cultural activities are provided by the non financial corporations (S.11), the government sector (S.13), the household sector (S.14) and the non profit institutions serving households sector (S.15). Government Sector (S.13) 4.1.177 Quarterly government production accounts are compiled from the DAS as this system provides real time data. Quarterly surveys are used to compile data for production accounts of state-owned enterprises providing recreational, cultural or sporting activities. Quarterly output is calculated using the cost approach – sum of production costs – where non market output is calculated as a residual after deducting market output and output for own final use. Quarterly government production accounts are provided by the government finance unit. Non Financial Corporations (S.11) and the Households (S.14) sectors 4.1.178 The main sources used to calculate the output and intermediate consumption of motion picture and video activities – NACE 92.1 are financial statements, cinemas’ survey, Structural Business Survey (SBS) and data regarding the film production in Malta derived from the Malta Film Commission. 4.1.179 Quarterly market output of film production is calculated from direct information derived on quarterly basis from the Malta Film Commission. The rest of the activities under NACE 92.1 are calculated using annual information and distributing it among the quarters by the FTE employment. For the following years quarterly market output is estimated as the product of previous years’ quarterly market output data extrapolated forward by the quarterly developments of the cultural services index and FTE employment. 4.1.180 Quarterly intermediate consumption of motion pictures and video activities is calculated by applying the IC/Output ratio to the quarterly market output figure. For the following years intermediate consumption is estimated using previous year’s ratio. 4.1.181 Financial statements and the Structural Business Survey are the main sources used to calculate output and intermediate consumption of radio and television activities – NACE 92.20. Quarterly market output of the major establishment operating within this sub-industry are compiled using information from a quarterly questionnaire, where quarterly market output is calculated as the product of the ratio of output to gross income – derived from financial statements – and the quarterly gross income. Intermediate consumption is calculated using previous year’s ratio and applying it to the quarterly output figure.
Quarterly National Accounts Inventory
Economic Statistics Division 47
4.1.182 Once financial statements are made available to the National Accounts Unit, market output is apportioned according to the income reported in the quarterly returns, whereas intermediate consumption is calculated using the annual ratio derived from the financial statements and applying it to the quarterly output. 4.1.183 For the rest of the establishments, quarterly market output is calculated by distributing annual information using the FTE employment, whereas intermediate consumption is calculated using the annual IC/Output ratio and applying it to the quarterly output figure. In absence of information from direct sources, quarterly market output and intermediate consumption are estimated using previous year’s data. 4.1.184 Output and intermediate consumption of other entertainment activities – NACE 92.30, news agency activities – NACE 92.4, libraries, archives, museums and other cultural activities – NACE 92.5 and sporting activities – NACE 92.6 are calculated using information from the Dance Schools Survey, museums’ survey , financial statements and Structural Business Survey (SBS). Quarterly market output is calculated as the product of quarterly market output per FTE employment and FTE employment of the respective quarter, whereas quarterly intermediate consumption is calculated using the annual IC/Output ratio and applying it to the quarterly output figure. Once annual information from the above sources is made available, quarterly market output and intermediate consumption ratios are revised accordingly. 4.1.185 Other recreational activities – NACE 92.7 incorporates gambling and betting activities and other recreational activities not elsewhere classified. NACE 92.71- gambling and betting activities are provided by the major casinos, a large market producer, small lotto receivers and remote gaming companies. The main sources used to calculate the production account of this sub-industry are:
• Financial statements and annual returns; • Remote Gaming Survey; • Public Lotto Department; • Structural Business Survey;
4.1.186 Quarterly output of casinos is calculated as the product of percentage of output of casinos to casino charges and the amount of casino charges paid every quarter. As financial statements are made available, the percentage of output of casinos to casino charges is revised accordingly. The quarterly output of another market producer company is estimated by extrapolating forward previous year’s quarterly output with the growth rate of the national lottery duty paid each quarter. As financial statements are made available output estimates are revised accordingly where market output is distributed quarterly according to the national lottery duty paid each quarter. Quarterly output of lotto receivers is calculated using data on commission on sales of lotto receivers derived quarterly from the Public Lotto Department. In absence of financial information quarterly output is estimated using previous year’s information.
Quarterly National Accounts Inventory
National Accounts Unit 48
4.1.187 Quarterly intermediate consumption of the above operators is calculated using the annual IC/Output ratio and applying it to the quarterly output figures. Once annual sources are made available these ratios are updated. 4.1.188 Output and intermediation consumption of remote betting companies is estimated quarterly using data provided by the Balance of Payments Unit. An annual survey about these companies is conducted by the same section. Once financial information from this survey is provided to the National Accounts, annual data is distributed quarterly according to the number of companies operating every quarter. 4.1.189 Quarterly output of other recreational activities n.e.c – NACE 92.72 is estimated using previous year’s market output per FTE employment derived from the Structural Business Survey together with quarterly FTE employment, whereas intermediate consumption is calculated quarterly using annual IC/Output ratio and applying it to the quarterly output figure. These ratios are updated once new information from the SBS is provided to the National Accounts Unit. Non Profit Institutions Serving Households (S.15) 4.1.190 The major activities provided by the NPISH are mainly sporting activities. Total quarterly output of the NPISH is calculated using the same annual procedure, where output is calculated as the sum of production costs and non-market output is calculated as the difference between total output and market output. 4.1.191 The major organizations are covered using financial statements and annual returns. Quarterly output of these organizations is estimated same as previous year, whereas quarterly intermediate consumption is calculated using previous year’s information and extrapolating it forward using the quarterly developments of the overall price index. Quarterly estimates are revised accordingly once financial data is made available. 4.1.192 Quarterly output of those organizations which are covered by the youth, non governmental, radio and television, museums and sports organizations’ surveys is calculated by distributing the annual information equally among the quarters or else as the product of quarterly market output per member and the number of members. Quarterly intermediate consumption is calculated using a similar method to that of market output. In absence of direct information from surveys, output is estimated quarterly using previous year’s information, whereas intermediate consumption is estimated by extrapolating forward previous year’s information with the quarterly developments of the overall price index. 4.1.193 Special quarterly estimates are provided to cover football club activities, where 2000 is taken as the benchmark year. Quarterly output is distributed among all the quarters, except for revenue derived from gates money as this is apportioned among the first, second and the fourth quarter. As regards to quarterly intermediate consumption it
Quarterly National Accounts Inventory
Economic Statistics Division 49
is calculated by extrapolating forward previous year’s data with the quarterly developments of the overall price index. 4.1.194 For those organizations having only employment data or nothing at all, quarterly market output is assumed to be zero, as there is no information regarding the output generated by these organizations. Quarterly intermediate consumption of those organizations having only employment data available is calculated as the product of the quarterly IC per FTE employment and the FTE employment. In absence of annual estimates, intermediate consumption is calculated in the same method, where quarterly intermediate consumption per FTE employment is extrapolated forward using the quarterly developments of the overall price index. With regards to quarterly intermediate consumption of those organizations without any information available, it is calculated as the product of the IC per organization and the number of organizations, where 2000 is taken as the benchmark year and IC per organization is estimated by extrapolating it forward using quarterly developments of the price index. NACE 93 – Other Services activities 4.1.195 Other services activities are mainly provided by the Non Financial Corporations (S.11) and the Households (S.14) Sectors. The main sources used to compile the production account of these activities are:
• Business Register • Households Budgetary Survey • Financial Statements • Sports Organisations Survey
4.1.196 Quarterly output and intermediate consumption of washing and dry cleaning of textile and fur products – NACE 93.01 are calculated using financial statements as the main data source. Quarterly output is calculated as the product of quarterly output per FTE employment and the FTE employment, where quarterly output per FTE employment is estimated using previous year’s quarterly information and extrapolated forward using quarterly developments of the HICP index for dry cleaning services. Intermediate consumption is calculated quarterly using the annual IC/Output ratio and applying it to quarterly output figure. Once financial statements are made available, quarterly estimates are revised accordingly. 4.1.197 The quarterly production account of Hairdressing and Other beauty treatments – NACE 93.02 is calculated using the HBS 2000 as the main source of information. Quarterly output is calculated as the sum of expenditure on these activities by Maltese residents, business and tourists. 4.1.198 Expenditure by residents and businesses on hairdressing and beauty treatments is calculated as the product of quarterly expenditure per head of population and quarterly total population. Quarterly expenditure per head of population is estimated taking previous year’s information and extrapolating forward using quarterly developments of the HICP index of hairdressing salons and personal grooming treatments.
Quarterly National Accounts Inventory
National Accounts Unit 50
4.1.199 Quarterly intermediate consumption is estimated quarterly using the IC/output ratio derived from a set of financial statements. 4.1.200 Output of funeral services – NACE 93.03 is calculated using expenditure data from the HBS 2000 as a benchmark source together with adjustments for underreporting purposes and it is distributed quarterly according to the number of deaths. For the following years quarterly output of these activities is estimated by extrapolating forward previous year’s quarterly data using quarterly developments of the overall price index and the number of deaths. Intermediate consumption is estimated by applying the annual ratio to quarterly output data. 4.1.201 Quarterly output and intermediate consumption of physical well-being activities – NACE 93.04, is calculated using the sports organizations survey for the benchmark years. For the following years quarterly output is estimated using previous year’s data together with quarterly developments of the overall price index, whereas intermediate consumption is estimated using previous year’s ratios. NACE P 4.1.202 The quarterly output of households as employers of domestic staff is estimated using the HBS 2000 and extrapolating forward using quarterly developments in the HICP index for domestic maids. No intermediate consumption (except FISIM) is estimated for this industry, since all cleaning material and equipment are supplied by the employer (households).
4.2 FISIM
4.2.1 FISIM output can only be produced by ‘Other monetary financial institutions’ (S.122) and ‘Other financial intermediaries, except insurance corporations and pension funds’. However, only S.122 is being taken into consideration. Total Production of FISIM = FISIM output of S122 by domestic sector + FISIM output of S122 exported (1) FISIM output of S122 by domestic sector = Accrued interest1 – (Stock of loans * Internal Reference Rate) + (Stock of deposits * Internal Reference Rate)-Accrued Interest2 where Accrued interest1 and Accrued Interest2 = Interest received by DMBs on loans granted to residents and interest paid by local DMBs on deposits by residents respectively. Data is collected from the quarterly profit and loss statement of DMBs supplied by CBM.
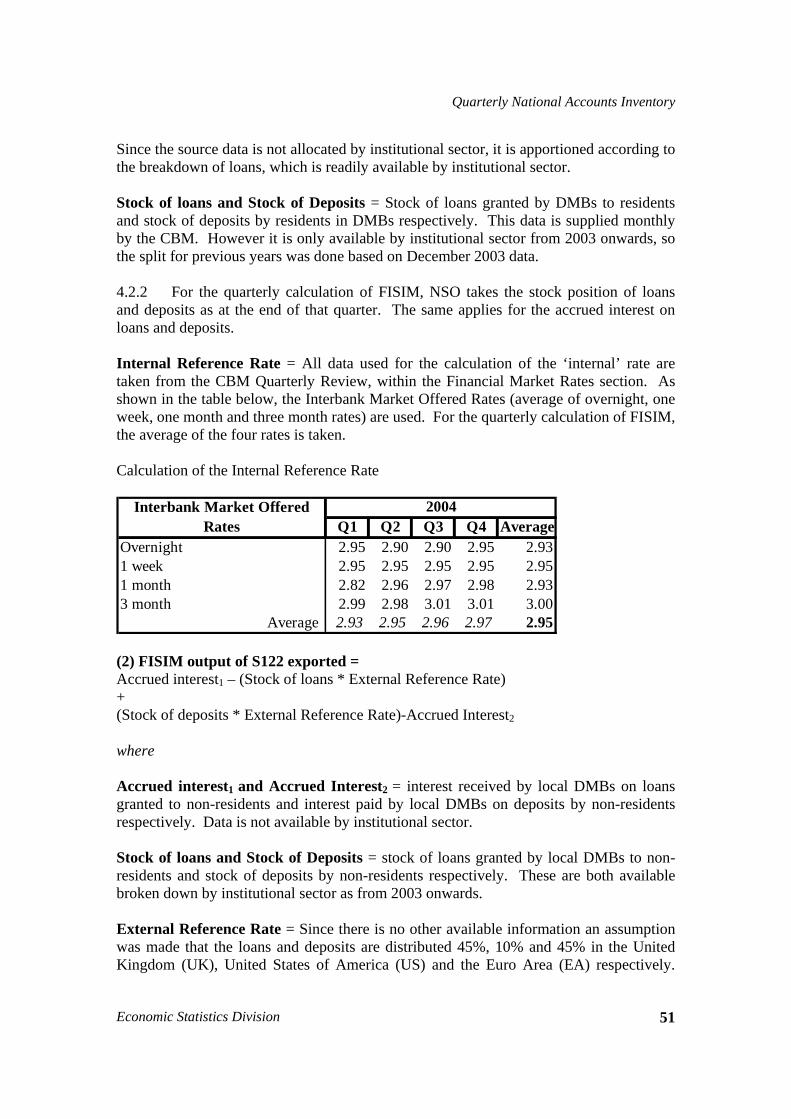
Quarterly National Accounts Inventory
Economic Statistics Division 51
Since the source data is not allocated by institutional sector, it is apportioned according to the breakdown of loans, which is readily available by institutional sector. Stock of loans and Stock of Deposits = Stock of loans granted by DMBs to residents and stock of deposits by residents in DMBs respectively. This data is supplied monthly by the CBM. However it is only available by institutional sector from 2003 onwards, so the split for previous years was done based on December 2003 data. 4.2.2 For the quarterly calculation of FISIM, NSO takes the stock position of loans and deposits as at the end of that quarter. The same applies for the accrued interest on loans and deposits. Internal Reference Rate = All data used for the calculation of the ‘internal’ rate are taken from the CBM Quarterly Review, within the Financial Market Rates section. As shown in the table below, the Interbank Market Offered Rates (average of overnight, one week, one month and three month rates) are used. For the quarterly calculation of FISIM, the average of the four rates is taken. Calculation of the Internal Reference Rate
Q1 Q2 Q3 Q4 AverageOvernight 2.95 2.90 2.90 2.95 2.931 week 2.95 2.95 2.95 2.95 2.951 month 2.82 2.96 2.97 2.98 2.933 month 2.99 2.98 3.01 3.01 3.00
Average 2.93 2.95 2.96 2.97 2.95
2004Interbank Market Offered Rates
(2) FISIM output of S122 exported = Accrued interest1 – (Stock of loans * External Reference Rate) + (Stock of deposits * External Reference Rate)-Accrued Interest2 where Accrued interest1 and Accrued Interest2 = interest received by local DMBs on loans granted to non-residents and interest paid by local DMBs on deposits by non-residents respectively. Data is not available by institutional sector. Stock of loans and Stock of Deposits = stock of loans granted by local DMBs to non-residents and stock of deposits by non-residents respectively. These are both available broken down by institutional sector as from 2003 onwards. External Reference Rate = Since there is no other available information an assumption was made that the loans and deposits are distributed 45%, 10% and 45% in the United Kingdom (UK), United States of America (US) and the Euro Area (EA) respectively.
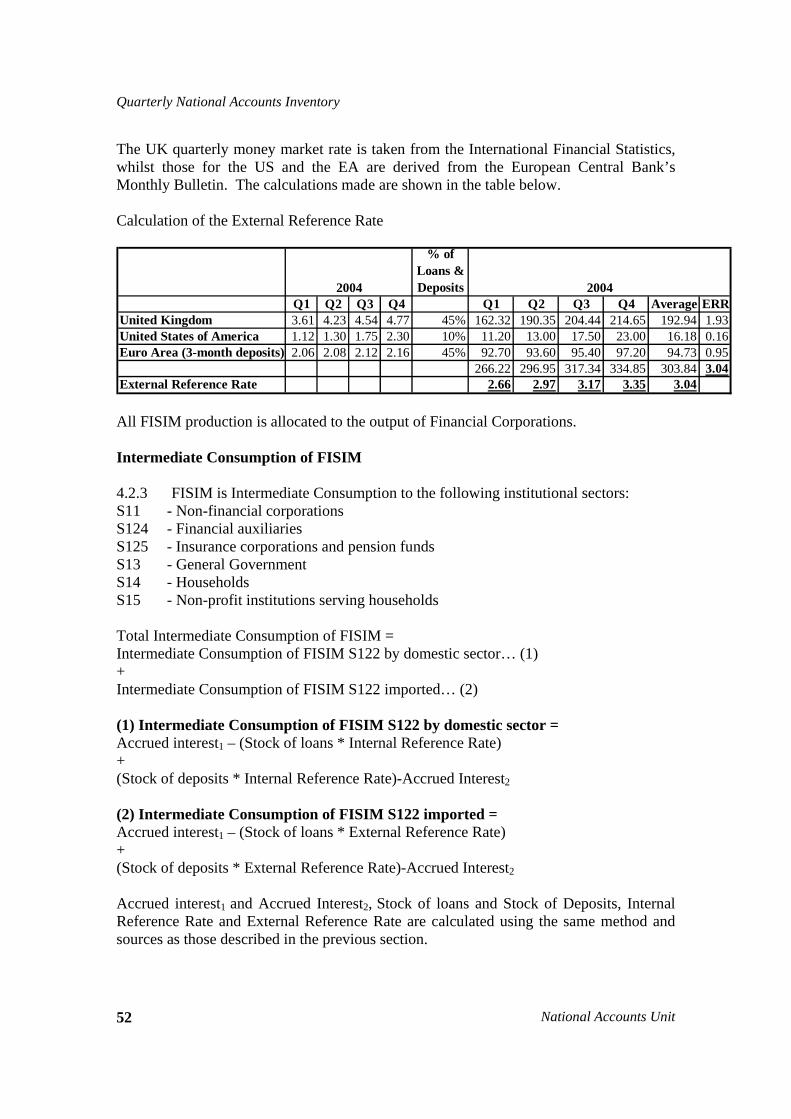
Quarterly National Accounts Inventory
National Accounts Unit 52
The UK quarterly money market rate is taken from the International Financial Statistics, whilst those for the US and the EA are derived from the European Central Bank’s Monthly Bulletin. The calculations made are shown in the table below. Calculation of the External Reference Rate
% of Loans & Deposits
Q1 Q2 Q3 Q4 Q1 Q2 Q3 Q4 Average ERRUnited Kingdom 3.61 4.23 4.54 4.77 45% 162.32 190.35 204.44 214.65 192.94 1.93United States of America 1.12 1.30 1.75 2.30 10% 11.20 13.00 17.50 23.00 16.18 0.16Euro Area (3-month deposits) 2.06 2.08 2.12 2.16 45% 92.70 93.60 95.40 97.20 94.73 0.95
266.22 296.95 317.34 334.85 303.84 3.04External Reference Rate 2.66 2.97 3.17 3.35 3.04
2004 2004
All FISIM production is allocated to the output of Financial Corporations. Intermediate Consumption of FISIM 4.2.3 FISIM is Intermediate Consumption to the following institutional sectors: S11 - Non-financial corporations S124 - Financial auxiliaries S125 - Insurance corporations and pension funds S13 - General Government S14 - Households S15 - Non-profit institutions serving households Total Intermediate Consumption of FISIM = Intermediate Consumption of FISIM S122 by domestic sector… (1) + Intermediate Consumption of FISIM S122 imported… (2) (1) Intermediate Consumption of FISIM S122 by domestic sector = Accrued interest1 – (Stock of loans * Internal Reference Rate) + (Stock of deposits * Internal Reference Rate)-Accrued Interest2 (2) Intermediate Consumption of FISIM S122 imported = Accrued interest1 – (Stock of loans * External Reference Rate) + (Stock of deposits * External Reference Rate)-Accrued Interest2
Accrued interest1 and Accrued Interest2, Stock of loans and Stock of Deposits, Internal Reference Rate and External Reference Rate are calculated using the same method and sources as those described in the previous section.
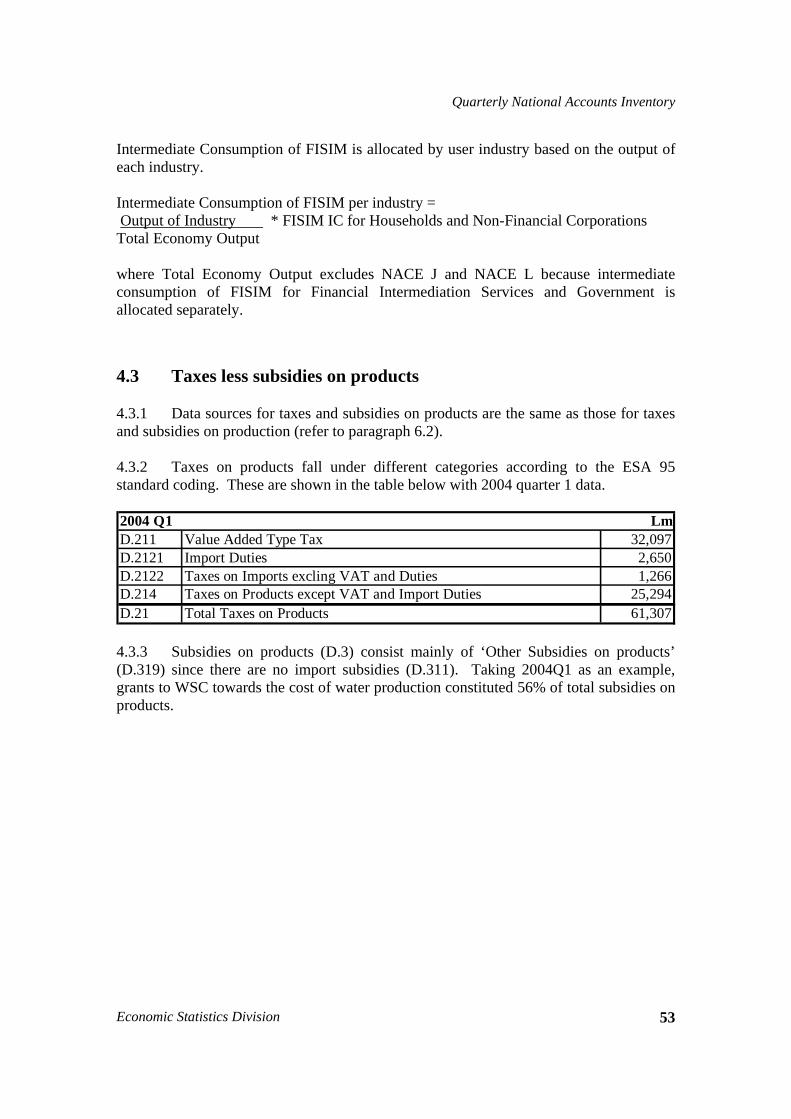
Quarterly National Accounts Inventory
Economic Statistics Division 53
Intermediate Consumption of FISIM is allocated by user industry based on the output of each industry. Intermediate Consumption of FISIM per industry = Output of Industry * FISIM IC for Households and Non-Financial Corporations Total Economy Output where Total Economy Output excludes NACE J and NACE L because intermediate consumption of FISIM for Financial Intermediation Services and Government is allocated separately.
4.3 Taxes less subsidies on products
4.3.1 Data sources for taxes and subsidies on products are the same as those for taxes and subsidies on production (refer to paragraph 6.2). 4.3.2 Taxes on products fall under different categories according to the ESA 95 standard coding. These are shown in the table below with 2004 quarter 1 data. 2004 Q1D.211 Value Added Type Tax 32,097D.2121 Import Duties 2,650D.2122 Taxes on Imports excling VAT and Duties 1,266D.214 Taxes on Products except VAT and Import Duties 25,294D.21 Total Taxes on Products 61,307
Lm
4.3.3 Subsidies on products (D.3) consist mainly of ‘Other Subsidies on products’ (D.319) since there are no import subsidies (D.311). Taking 2004Q1 as an example, grants to WSC towards the cost of water production constituted 56% of total subsidies on products.
Quarterly National Accounts Inventory
National Accounts Unit 54
Chapter 5 GDP components: the expenditure approach
5.1 Household final consumption
5.1.1 Household final consumption expenditure is compiled in the context of ESA 95 and COICOP classification requirements. Quarterly estimates are derived primarily through the use of a commodity flow method in which trade, manufacturing and tourism data form an important source for quarterly estimates of private household consumption. 5.1.2 The value of the imported consumer goods is obtained from the International Trade Statistics Unit on a quarterly basis through Intrastat forms classified using the harmonised system product codes. Product taxes, transport costs and trade margins are added to estimate PHC at purchasers’ prices. 5.1.3 Sales of locally produced manufactured goods are derived by means of a monthly manufacturing survey. Information obtained from the HBS along with direct data from organisations providing services to consumers serve as the basic source for quarterly estimates of private household consumption on services.
5.1.4 Non-resident expenditure on the economic territory is based on information extracted from the Tourism Inbound Survey (Tourstat). This monthly survey, conducted by the Tourism Unit, serves to collect data on inbound tourism. Total resident households’ expenditure in the rest of the world used in the calculation of PHC (national concept) is compiled by the Balance of Payments Unit in cooperation with the CBM.
Private Household Consumption on goods
5.1.5 For most categories of household consumption expenditure on goods both trade and manufacturing data form the main data source. Quarterly estimates of food, beverages and tobacco are based on a combination of import data, local manufacturing data and information obtained directly from producers. Direct information include quarterly data received from the civil abattoir regarding monthly slaughtering statistics, the value of fresh fish caught and passed through the local fish market, dairy statistics compiled by MDP (used principally as a data source for milk consumption and data on production volumes), prices and wholesale values gathered from the organised fruit and vegetable market. 5.1.6 Quarterly expenditure of households on medicines are based on trade and manufacturing data. However, government’s payments to market producers for commodities such as medicines have been classified as final consumption expenditure of government in line with ESA 95 requirements.
5.1.7 Import data along with information of newly licensed motor vehicles by type provided by the Police Department form the main source of data for quarterly estimates
Quarterly National Accounts Inventory
Economic Statistics Division 55
of household consumption expenditure on new automobiles. Expenditure by households on fuel, oil and liquid gases are also based on data provided by the supplying companies.
Private Household Consumption on Services
5.1.8 Estimation of quarterly household expenditure on services is based primarily on quarterly data supplied by service providers. Data from public corporations are the basis for estimation of water and electricity consumption by households. 5.1.9 Quarterly estimates of imputed rents and actual rentals of residential dwellings are measured by extrapolating the average rent per dwelling using a rent price index. The rent price index is made up of the HICP for residential rentals compiled by NSO, and a volume index. The volume index measures the net increase (additions less discards) in the number of dwellings by tenancy estimated on the basis of the number of permits issued by the MEPA, received by NSO on a monthly basis. 5.1.10 Quarterly household consumption estimates on services of physicians, nurses and related practitioners form the major part of out-patient services. Such services are estimated by use of the HBS and quarterly HICP data for price adjustments.
5.1.11 Direct information from all the main enterprises providing transport and communication services including postal, mobile and telephone service are utilized for estimation of quarterly household expenditure on such services. Information on the number of travelling residents by air and average fares paid for various destinations form the basis of estimation of households’ expenditure on air travel.
5.1.12 Household consumption on betting and gaming, including national lottery, is measured as the amounts paid less the amount returned in winnings, representing the cost of the service, i.e. the net loss incurred by households which is equivalent to the net takings of persons engaged in the industry plus the amount taken by the government in the form of betting duties. Direct quarterly data from national lottery sources serves the basis for the estimate of household consumption on such services. For the various other forms of betting expenditure estimates are based on average household expenditure along with data obtained regarding the number of existing tombla license holders. 5.1.13 Based on information obtained from an annual private independent schools survey, the quarterly estimates for household consumption expenditure on education are estimated and distributed using expenditure ratios resulting from the 2000 HBS. 5.1.14 The main data source for quarterly estimates of household expenditure on bars and restaurants are expenditure data derived from the 2000 HBS, and quarterly data from both the Tourstat Survey and Price Index/HICP data. Included in this expenditure category are food, tobacco, wine and spirits consumed in restaurants and hotels. Data obtained from the Hotel Census along with results for accommodation expenditure from
Quarterly National Accounts Inventory
National Accounts Unit 56
the Tourism Inbound Survey form the basis for estimates of household consumption expenditure on accommodation services. 5.1.15 Household expenditure on service charges for insurance services is based on information obtained directly from insurance companies. Reference is also made to data obtained from the 2000 HBS when estimating this particular expenditure group.
5.2 Government final consumption, including split
individual/collective consumption
5.2.1 The final consumption expenditure for General Government is equal to the sum of the non-market output of the sector and the purchases by government of goods and services produced by market producers that are supplied to household – without any transformation – as part of social transfers in kind. 5.2.2 The sources used are the same as described in Section 4.1 for Nace L. The data for the social transfers in kind is obtained from the DAS and from other administrative sources. These consist mainly of provision of free pharmaceutical products (including medicine), school transport for primary and secondary students and other transfers in kind to old persons. 5.2.3 As far as split between individual and collective consumption is concerned, we follow the recommendations set out in the chapter dealing with the Classification of Functions of Government (COFOG) in the IMF Government Finance Statistics Manual 20012. However this split, for the time being, is calculated only on annual basis, therefore for quarterly data the split between individual and collective consumption is estimated based on the ratios calculated in previous years.
5.3 NPISH final consumption
5.3.1 The NPISH final consumption expenditure is available quarterly from 2000 onwards. NPISH final consumption expenditure is equal to non-market output. The value of total output is calculated as the sum of production costs, where non-market output (P.13) is calculated as a residual after deducting the market output (P.11) and output for own final use (P.12) from the total output (P.1). 5.3.2 The main sources used to calculate the quarterly output of the NPISH are annual financial statements which are obtained from the Archdiocese of Malta, Department of Industrial and Employment relations and the NGO’s Liasion Unit and surveys – non
2 The Annex to Chapter 6 (pages 79-110) classifies each class of expenditure as ‘CS’ or ‘IS’ to indicate whether the services produced by general government and included in the respective classes are collective or individual services. This distinction is used for the computation of final consumption expenditure and actual final consumption in the national accounts.
Quarterly National Accounts Inventory
Economic Statistics Division 57
governmental organizations, youth, sports organizations, band clubs and museums – which are conducted by the Population and Social Statistics Unit. These sources are then combined with other quarterly indicators such as employment, population and price indices. 5.3.3 Once quarterly NPISH final consumption expenditure is compiled, it is then classified using the Classification of the Purpose of Non-Profit Institutions Serving Households (COPNI). Unless the production account is final, previous years ratios are used to classify NPISH final consumption expenditure in terms of COPNI classification.
5.4 Gross capital formation
5.4.1 Gross fixed capital formation
5.4.1.1 Gross fixed capital formation (GFCF) is available for the period 1995 to 2004 by activity at A60, by product at P90, and by sector on an annual basis. At present 2004 is considered to be the benchmark year, although data is still provisional. This benchmark year is eventually used for the quarterly estimates as from 2005 onwards. 5.4.1.2 Quarterly GFCF from 1995 to 2004 is in Pi6 and Pi3 formats. Four main indicators are used to subdivide the annual estimate by quarter:
(i) Import data of capital goods (ii) Output of NACE F (Construction): Non-financial corporations (S.11) and
Households (S.14) sectors (iii)Output of NACE 72.2 (Software consultancy and supply services) (iv) Expenditures on GFCF by the central government (S.13111) and local government
(S.1313) sectors are available on a quarterly basis in Pi6 and Pi3 format. 5.4.1.3 For 1995 to 2003 the total imports of capital goods were used as an indicator for products of agriculture, forestry, fisheries and aquaculture (Pi6 code 1), metal products and machinery (Pi6 code 2), transport equipment (Pi6 code 3), and other products (Pi6 code 6). As from 2004 two further refinements were introduced. Imports were first broken down by Pi6 and used as indicators accordingly for code 1, code 2 and code 3. Given that 66 per cent of the other products (Pi6 Code 6) in the benchmark year consisted in software, it has been decided to link the quarterly estimate of ‘other products’ to the output of NACE 72.2. The reason behind this was that software in reality is a service and is therefore not captured in trade statistics. 5.4.1.4 The output of NACE F (Construction), derived from the production approach for non-financial corporations (S.11) and the households (S.14) sectors is used as an indicator to subdivide annual estimates of GFCF on Construction (Pi6 codes 4 and 5) by quarter. A further refinement was introduced as from 2007. Output is being used as an indicator just for ‘other construction’ (Pi6 code 5), whilst ‘housing’ (Pi6 code 4) is being calculated directly from building permits issued by MEPA on a quarterly basis.
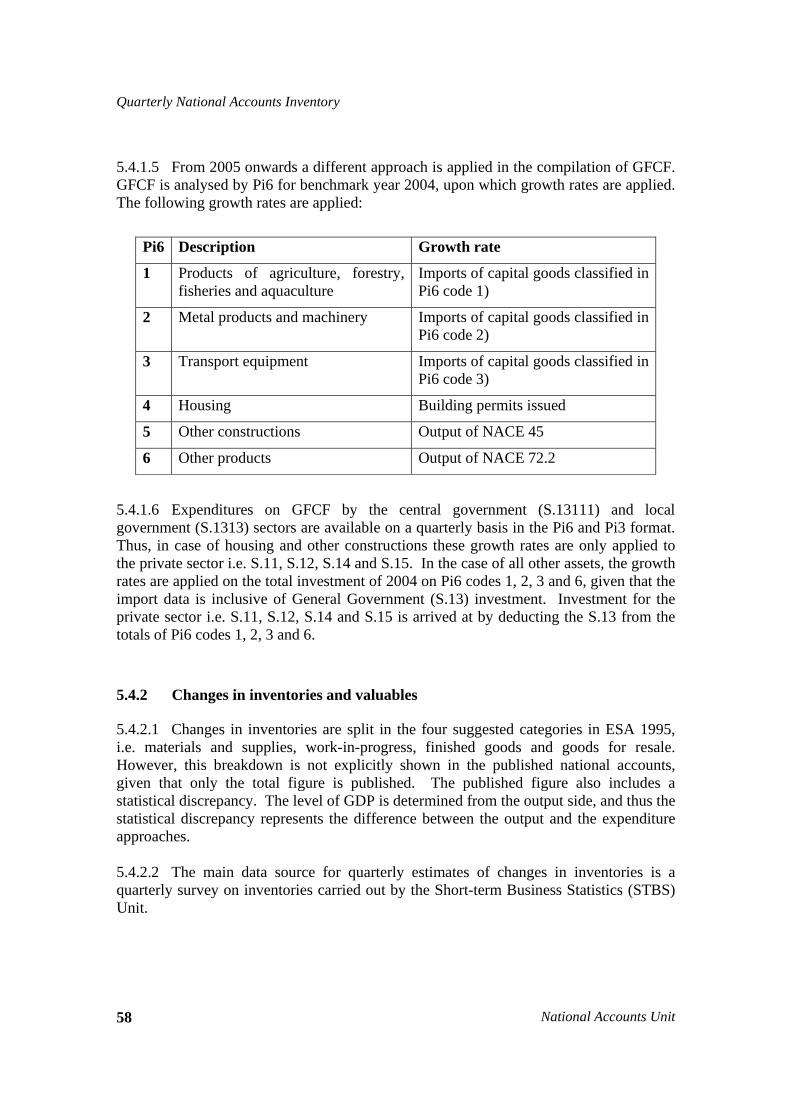
Quarterly National Accounts Inventory
National Accounts Unit 58
5.4.1.5 From 2005 onwards a different approach is applied in the compilation of GFCF. GFCF is analysed by Pi6 for benchmark year 2004, upon which growth rates are applied. The following growth rates are applied:
Pi6 Description Growth rate
1 Products of agriculture, forestry, fisheries and aquaculture
Imports of capital goods classified in Pi6 code 1)
2 Metal products and machinery Imports of capital goods classified in Pi6 code 2)
3 Transport equipment Imports of capital goods classified in Pi6 code 3)
4 Housing Building permits issued
5 Other constructions Output of NACE 45
6 Other products Output of NACE 72.2
5.4.1.6 Expenditures on GFCF by the central government (S.13111) and local government (S.1313) sectors are available on a quarterly basis in the Pi6 and Pi3 format. Thus, in case of housing and other constructions these growth rates are only applied to the private sector i.e. S.11, S.12, S.14 and S.15. In the case of all other assets, the growth rates are applied on the total investment of 2004 on Pi6 codes 1, 2, 3 and 6, given that the import data is inclusive of General Government (S.13) investment. Investment for the private sector i.e. S.11, S.12, S.14 and S.15 is arrived at by deducting the S.13 from the totals of Pi6 codes 1, 2, 3 and 6.
5.4.2 Changes in inventories and valuables
5.4.2.1 Changes in inventories are split in the four suggested categories in ESA 1995, i.e. materials and supplies, work-in-progress, finished goods and goods for resale. However, this breakdown is not explicitly shown in the published national accounts, given that only the total figure is published. The published figure also includes a statistical discrepancy. The level of GDP is determined from the output side, and thus the statistical discrepancy represents the difference between the output and the expenditure approaches. 5.4.2.2 The main data source for quarterly estimates of changes in inventories is a quarterly survey on inventories carried out by the Short-term Business Statistics (STBS) Unit.
Quarterly National Accounts Inventory
Economic Statistics Division 59
5.4.2.3 Acquisitions less disposals of valuables have been compiled annually up till 2006. The annual estimate was then equally subdivided across quarter. As from 2007 a quarterly estimate is being compiled, using the commodity flow method i.e.
Imports plus Domestic Production plus Margins
less Exports less Household Final Consumption Expenditure
5.4.2.4 The same data sources are used both for annual and quarterly estimates:
Imports and Exports of Jewellery and Related Articles (CPA 36.2) including collectors items such as stamps and coins (CPA36.21) and Works of Art (CPA 92.31.1)
Domestic production of jewellery and related articles was derived from the results in the production approach, whilst that of artists, sculptors etc. was derived from the business register.
Margins were calculated for auctioneers and antiques dealers.
Household final consumption expenditure is deducted in the commodity flow method in order to avoid double counting of some expenditure items already included in the expenditure approach.
5.4.2.5 The production of valuables is valued at basic prices. All other acquisitions of valuables are valued at the purchasers’ prices paid for them including any agents’ fees of commissions. They also include trade margins when bought from dealers.
5.5 Imports/Exports
5.5.1 The quarterly data on imports and exports is supplied by the Balance of Payments Unit, normally at t+60, in time for the National Accounts release. Data on imports and exports of goods are supplied to the BoP unit on a monthly basis by the International Trade Statistics Unit at t+40. Goods data conforms to the definitions set out in IMF’s BPM5. Imports and exports are adjusted on a f.o.b. basis, and merchandise trade statistics by country of destination are also compiled. 5.5.2 The main source for merchandise trade data is the trade statistics compiled by the International Trade Statistics Unit from records received from the Customs Department. Adjustments for coverage are subsequently made by the BoP unit for both imports (which are reported by Customs on a c.i.f. basis) and exports. The adjustments made to Customs data are also based on information obtained through ad hoc letters to various data suppliers. In addition, ship repair activities carried out in Malta are also included.
Quarterly National Accounts Inventory
National Accounts Unit 60
5.5.3 Data on repairs of goods are collected from the quarterly survey of private and public entities. It essentially includes information about income earned on aircraft repairs carried out locally, as well as expenditure on aircraft and sea craft repairs carried out abroad. 5.5.4 Statistical data on goods sold in domestic ports to non-resident carriers is derived from trade statistics, whereas data on goods purchases by resident entities in foreign ports is derived from the quarterly survey of resident shipping and airline companies. 5.5.5 The reporting of imports and exports of services transactions also conforms to the definitions and guidelines set out in IMF’s BPM5. 5.5.6 Data for transportation services is split into three: passenger, freight and other transportation. Data on receipts and payments for passenger carriage is primarily retrieved from the quarterly BoP enterprise survey carried out for shipping and airline companies (including their representative agencies operating in Malta). Data on revenue from freight is derived from the same survey. However, for freight payments, where shipment data (insurance and freight) is not available separately, an estimate of 10 per cent of the value of imports (c.i.f.) is made. Of this estimate, 90 per cent is allocated to freight and the remainder to insurance (which is included in the Current Transfers Account). A statistical adjustment is made for freight on imports carried by domestic carriers. Other transportation services are obtained from the BoP quarterly enterprise survey together with specific data requests sent to public authorities such as Malta International Airport plc, Malta Air Traffic Services Ltd and the Malta Maritime Authority. 5.5.7 Data on gross earnings from tourism and data on gross expenditures by residents traveling abroad are mainly derived from foreign currency transactions reported by banking institutions and other authorized dealers to the CBM on a monthly basis. 5.5.8 The primary source of data for other services is the quarterly BoP survey for non-financial enterprises. The data sources for government transactions are the Ministry of Finance and the CBM’s settlements based system. The latter is also the source of data for transactions carried out by the personal sector. The service transactions of the banking sector are obtained from their profit and loss statements.
Quarterly National Accounts Inventory
Economic Statistics Division 61
Chapter 6 GDP components: the income approach
6.1 Compensation of employees, including components (wages and
salaries)
NACE A
6.1.1 Quarterly data for compensation of employees is based on a wage per full-time equivalent employee. Data for employment is obtained from the Employment and Training Corporation on a quarterly basis.
NACE B 6.1.2 Calculation of quarterly compensation of employees is based on a wage per full time equivalent employee. Data from ETC is the major source for employment data of both employees engaged in sea fishing and in fish farm activity.
NACE C
6.1.3 Quarterly estimates of compensation of employees of NACE C is based partly on direct company data indicating the value of wages and salaries paid per quarter with relation to NACE 11 and a wage per FTE based on ETC data in the case of NACE 14. Data regarding wages and salaries paid in the case of NACE 11 is compared to annual audited financial accounts when made available. NACE D Non-financial corporations (S.11), Households (S.14) and NPISH (S.15) 6.1.4 Up to 2005, data on compensation of employees is first compiled annually then subdivided by quarter according to the quarterly distribution of the wages and salaries supplied in the STBS manufacturing survey. As from 2006 onwards the annual figure of compensation of employees is generally equivalent to the summation of the four quarters.
6.1.5 For the years 2000 to 2005 annual estimates for compensation of employees are derived from annual accounts and financial statements in case of medium to large enterprises, and the SBS and/or the STBS manufacturing survey in case of small to medium enterprises. Financial statements are available with a time lag of two years. Gaps are filled using the wages and salaries available in the STBS data, since all the large enterprises are covered by the STBS survey on manufacturing.
6.1.6 In case of small to medium enterprises, compensation of employees is derived partly from the STBS survey and partly from the SBS survey. Roughly, compensation of employees is being calculated as follows:
Compensation of employees =
Quarterly National Accounts Inventory
National Accounts Unit 62
Wages and Salaries derived from the STBS survey (excluding companies covered by accounts) plus [(Total full-time equivalent employees less the full-time equivalent employees covered by the STBS and accounts) multiplied by the wages and salaries per full-time equivalent employees]
6.1.7 Wages and salaries per full-time equivalent employees are derived from the SBS census for each size-class at 2 or 3-digit NACE. This is then applied to the number of full-time equivalent employees which were neither covered by the STBS survey nor the annual accounts. The size-class applied generally depends on the NACE category being estimated. The wages per full-time equivalent employees derived from the SBS of 2003 are adjusted each year to include the relevant cost of living increase, when applied to 2004 onwards. The SBS is also used to calculate the social security contributions in case of small to medium enterprises. This method is also applied for all enterprises as from 2006, when audited accounts are not yet available.
(Refer to NACE L for General Government sector)
NACE E
6.1.8 Quarterly data for gross wages and salaries and social security contribution payable by the employer in respect of employees are extracted from quarterly returns receivable from the Electricity Division within Enemalta Corporation and from the Water Services Corporation (WSC). An adjustment is made to the quarterly data based on the relationship between data for compensation of employees as derived from the latest annual audited financial statements and data for the same accounting period extracted from quarterly returns. When audited accounts are eventually published, quarterly estimates are re-scaled to come in line with the annual data from the financial statements. 6.1.9 Quarterly estimated for compensation of employees payable by the Malta Desalination Services Ltd (MDS) are based on the number of full-time equivalent employees extracted from the ETC database and an average wage per employee resulting from the latest audited financial statements but adjusted for any cost of living increases. Quarterly estimates are re-scaled to come in line with the annual data from the financial statements when published. 6.1.10 Compensation of employees of water bowser operators is based on the number of employees as per preliminary report on the development of a programme of measures for Malta groundwater and an estimated gross wage, which is adjusted by the cost of living increase.
Quarterly National Accounts Inventory
Economic Statistics Division 63
NACE F 6.1.11 A distinction is made between compensation of employees working in the public sector and the remuneration of employees working in the private sector. In the case of the former, data on a quarterly basis is provided by the Government Finance Unit; in the case of compensation of workers employed with private enterprises, a quarterly estimate is made according to the procedure described below. 6.1.12 To arrive first at the annual figure of compensation of employees for 2004, the average of private compensation for the consecutive 2000–2003 period is computed. This period has been selected as the reference period since data both in respect of the SBS as well as company financial statements represent the most reliable and complete records prior to 2004. After the average compensation of employees per FTE employees for this period is computed, this average ratio is then applied to the annual average FTE employees for 2004. The resulting 2004 figure thus represents an estimate of compensation of employees based on the preceding 4-year period for which data was readily available. The quarterly figure for private compensation of employees in each 2004 quarter is subsequently obtained by multiplying this annual compensation estimate to the proportion of private FTE employees for the relevant quarter out of all the FTE employees for the four quarters of 2004. NACE G 6.1.13 Quarterly compensation of employees is calculated for all divisions within Section G by using benchmark compensation of employees to full-time equivalent employee ratios multiplied by the quarterly employment. Data on quarterly employment is obtained from ETC. Information about government bonuses and cost of living allowances granted are incorporated in the quarterly calculations. For some companies, compensation paid to employees is collected directly from quarterly returns.
NACE H 6.1.14 Compensation of Employees of NACE 55.1 (Hotels) is subdivided by quarters using quarterly employment data. Annual employment data is obtained from the Hotels Census, and is then distributed quarterly according to the ETC employment by activity. Compensation of Employees of NACE 55.2 is estimated as 2% of output. 6.1.15 Compensation of employees in NACE 55.3-55.5 (Bars and restaurants, Canteens and Catering) is estimated as follows: - for the 2000-2003 period annual figures of compensation of employee are subdivided by quarter based on quarterly employment, - from 2004 onwards it is calculated as: Compensation of employees = [(previous year’s COE/FTE adjusted by cost of living, wage allowances and bonuses) * quarterly employment] + cost of living, wage allowances and bonuses

Quarterly National Accounts Inventory
National Accounts Unit 64
Quarterly employment is obtained from the ETC database. NACE I 6.1.16 For finalized years, sources for compensation of employees data include: - Annual Census carried out by the National Accounts Unit for route buses, minibuses and private coaches and subsequently equally divided per quarter. - Reports and Financial Statements which are then apportioned quarterly. 6.1.17 In the case where quarters are not yet finalised, the following sources are used: - Quarterly letters and questionnaires - Short-term Business Statistics - for certain companies within Nace 64, a survey is sent by the Malta Communications Authority (MCA) on behalf of NSO 6.1.18 However, when the above sources are not available for some companies, the following formula is used to estimate compensation of employees: CoE/FTEqt-1 + 52 * COLA/Qtr * FTEqt NACE J 6.1.19 NACE J is mostly surveyed by the CBM and data is forwarded to NSO, including compensation of employees. Quarterly surveys by CBM include:
- Quarterly Profit and Loss Accounts - DMBs and IBIs Quarterly Profit and Loss Accounts - Quarterly Insurance Principal Questionnaire - Biannual Questionnaires for Insurance Agents and Brokers
Other sources besides those provided by the CBM are:
- Annual Reports and Financial Statements which are then apportioned quarterly. - Quarterly letter sent to MFSA
6.1.20 For all those firms where annual data is not yet available and there is no quarterly source, an estimate is made using the following formula: CoE/FTEqt-1 + 52 * COLA/Qtr * FTEqt NACE K 6.1.21 Quarterly compensation of employees is calculated for all divisions within Section K by using benchmark compensation of employees to full-time equivalent employee ratios multiplied by the quarterly employment. Data on quarterly employment is obtained from ETC. Information about government bonuses and cost of living allowances granted are incorporated in the quarterly calculations.
Quarterly National Accounts Inventory
Economic Statistics Division 65
NACE L 6.1.22 The quarterly compensation of employees for the General Government sector (divided into 11 sections) is calculated using actual data from established data sources (DAS and quarterly returns from EBUs and Local Councils). From 2004Q1 onwards the public sector employees’ wages and salaries were being paid every four weeks (13 salaries per year); therefore on a quarterly basis the wages and salaries are adjusted accordingly. NACE M 6.1.23 Quarterly compensation of employees for all activities is calculated using benchmark compensation of employees to FTE employee ratios and quarterly employment. Government bonuses and cost of living allowances are included to the benchmark data. Quarterly employment data is obtained from the ETC database. For some activities quarterly employment data derived from surveys is estimated using benchmark employment data and extrapolating it forwards using quarterly developments in the ETC database. Government employment data is provided by the Government Finance Unit. NACE N 6.1.24 The method is similar to NACE M. NACE O 6.1.25 The method is similar to NACE M. NACE P 6.1.26 No compensation of employees is calculated for this section.
6.2 Taxes less subsidies on production
6.2.1 In Malta taxes are collected by the central government, by and large by the Budgetary Central Government and in recent years by a few EBUs, while subsidies on production are solely paid by the Budgetary Central Government. 6.2.2 The main data source for the Budgetary Central Government is the Departmental Accounting System (DAS), which is the government’s day-to-day bookkeeping system, held at the Treasury Department and for which the NSO has an online access. The data is accessible on a monthly basis and eight days after the end of month the data is final (apart from December). All the revenue and expenditure items are coded according to ESA 95 methodology. As the DAS is cash-based, the Treasury ensures that all Ministries and
Quarterly National Accounts Inventory
National Accounts Unit 66
Departments report on quarterly basis accruals templates (including debtors, accrued income and deferred income for revenue items and creditors, accrued expenditure and deferred income for expenditure items). These accruals templates are subsequently provided to the NSO to be included in our quarterly national accounts data. 6.2.3 The data sources for the EBUs for quarterly purposes are mainly based on a quarterly questionnaire that NSO sends to out to the 48 EBUs. To compliment the quarterly questionnaires some EBUs send also their management accounts. Once the annual financial statements are available, the quarterly data are revised, so that all the four quarters are equal to annual data. 6.2.4 The distribution of taxes on production is allocated in two ways. In the cases where license on services are easily identifiable to a particular NACE, they are directly distributed to that industry. When the license is not so straightforward, allocation is done by apportioning depending on the number of enterprises per NACE registered in the BR. 6.2.5 The same is done when allocating subsidies on production; these are distributed directly to their respective NACE. This does not apply only in the case of two subsidies; the ‘Export Incentive Scheme’ and ‘Training Grants’. It is difficult to allocate them to one particular NACE or to be sure how much each industry benefits from these subsidies. Hence these are distributed according the number of enterprises registered with the BR but only for the manufacturing sectors as it is these which make most use of such schemes.
6.3 Gross operating surplus and mixed income
6.3.1 Gross operating surplus and mixed income are calculated as a residual. This balance is arrived at after subtracting compensation of employees and other taxes on production, and adding other subsidies on production, from the value added. Value added should be measured net – after deducting consumption of fixed capital – but provision has to be made in the accounts of the system for value added to be measured gross or net of consumption of fixed capital because of the practical difficulty of measuring the latter. Operating surplus is basically the surplus (or deficit) on production activities before account has been taken of the interest, rents or charges which the production units must pay or receive as a borrower or owner of assets. It corresponds to the income which units obtain from their own use of production facilities. Mixed income is the remuneration for the work carried out by the owner (or members of his family) of an unincorporated enterprise. This is referred to as ‘mixed income’ as it cannot be distinguished from the entrepreneurial profit of the owner.
Quarterly National Accounts Inventory
Economic Statistics Division 67
Chapter 7 Population and employment
7.1 Population
7.1.1 The main source for population data are demographic statistics provided by the Population and Social Statistics Unit. This unit provides the National Accounts Unit with monthly total population data. Total population figures include both Maltese and foreign residents. Further information regarding the calculation of population statistics can be found on the website. For National Accounts purposes quarterly population data is taken as the average of three months, whereas annual total population is calculated as an average of the four quarters.
7.2 Employment: persons
7.2.1 Data on total employment in terms of persons that is currently being transmitted to Eurostat is calculated from two main sources of employment – Employment Training Corporation (ETC) Database and the Labour Force Survey. Full-time employment is obtained from the ETC database whereas part-time primary and full-time with reduced hours employment is taken from the Labour Force Survey. 7.2.2 In Malta each employer must register his employees, both full-time and part-time, with ETC. Self-employed persons, both full-time and part-time, must also register with the ETC. This administrative source contains the unique identity card number of each person and also the company number of each establishment. On a quarterly basis the NSO sends an updated BR to ETC, where individuals and establishments are classified by NACE according to the BR. NSO ensures that misclassifications are kept to a minimum. Having this head count the National Accounts Unit uses the ETC as a base for its employment figures by NACE. However some adjustments are necessary for refinement. 7.2.3 Since 2000, there has been another source for employment data: the Labour Force Survey. The LFS figure is passed on to the National Accounts Unit, and the total employment figure is also compared to the ETC figure. It is pertinent to point out that the parameters for ETC and LFS are not exactly the same. On the other hand, certain industries, which are small, may be under represented by the LFS. The quarterly development may also contain a statistical margin of error for the smaller industries as expected. Therefore, for industry-by-industry employment, the ETC figure is considered to be more reliable for trends. 7.2.4 Apart from the ETC database there are other sources for employment used within the National Accounts, depending on the industry. For example in some industries business surveys are relied on, for others administrative sources are more reliable, and for some others direct information from financial reports and company quarterly returns are used (enterprise data). Data from enterprise surveys are generally considered better than

Quarterly National Accounts Inventory
National Accounts Unit 68
LFS for identifying data on employment by industry breakdown. The LFS was previously used until the ETC classified employment data by NACE. 7.2.5 For Government (general government departments, local councils, extra-budgetary units) and financial institutions, exhaustive employment data are available and are very reliable. These sources however provide information on number of persons or jobs, not on hours worked. 7.2.6 For the time being only an aggregate figure of employment is being transmitted to Eurostat by the National Accounts. This is due to the fact that employment data in A6 classification is still being validated by the National Accounts. However in Regulation (EC) No 1392/2007, Malta has obtained a derogation related to this table where the first transmission of the employment data in persons broken down by industry level is to be effected by the end of 2008.
7.3 Employment: total hours worked
7.3.1 The collection of data on hours worked is extracted from the LFS. Since 2004, LFS data is collected on an ongoing basis. Prior to 2004 all data relating to LFS refers to a particular week within each quarter. Information on hours worked is collected with respect to two aspects:
(i) normal hours worked per week (ii) actual hours worked in the reference week
7.3.2 These questions are addressed to all employed persons irrespective of their professional status. 7.3.3 Analysis of this data is carried out on a quarterly basis and this includes checking for data inconsistencies with respect to hours worked, type of employment, economic activity and occupation of respondent. In addition reference is also made to national wage regulation orders in order to check data inconsistencies within specific economic activities. 7.3.4 When quarterly data on hours worked is grossed up to reflect the whole population, all data is representative at NACE section level except for the following categories: B, C, P and Q. Annual data for the same variables is on the other hand under-represented for the following NACE categories P and Q. Annual data for the rest of the NACE categories are all reliable. Employment data in terms of total hours worked is not yet transmitted to Eurostat, as this data is still under validation process by the National Accounts Unit. However in Regulation (EC) No 1392/2007, Malta has obtained a derogation related to this table where the first transmission of the employment data in total hours worked broken down by industry level is to be effected by the end of 2008.
Quarterly National Accounts Inventory
Economic Statistics Division 69
Chapter 8 From GDP to net lending/borrowing
8.1 Primary income from/to the ROW (D.1 to D.4), gross national
income
Primary income from/to the ROW (D.1 to D.4), gross national income
8.1.0 Primary income received from the rest of the world (ROW) is the sum of compensation of employees received from the ROW (D.1), subsidies received from the Institutions of the EU (D.3) and property income received from the ROW (D.4). Property income received from the ROW (D.4) is the sum of interest (D.41), dividends (D.42), and reinvested earnings (D.43) from the ROW. Dividends received from the ROW (D.42) are in turn calculated separately for (a) dividends related to foreign direct investment (FDI) and dividends related to portfolio investment (PI). 8.1.1 Quarterly calculations of incoming flows of compensation of employees (D.1), interest (D.41) and dividends (D.42) are based on the direct reporting survey. This survey is carried out monthly, or quarterly, for large units and for those units having substantial transactions with non-residents, and on an annual basis for the smaller units. 8.1.2 The annual enterprise survey covers about 3,500 companies. The sample is not a random sample but is stratified on the basis of:
1. Size of foreign exchange transactions carried out through the banking system 2. Size of foreign shareholding 3. Number of employees 4. Quantity of imports and exports 5. Information obtained from newspaper cuttings 6. Other sources, e.g. national accounts unit
8.1.3 Information on the size of foreign exchange transactions by company is obtained monthly from the Partial Settlements System (PSS) described in below. Data on the number of employees by company is obtained from the BR, which is compiled by the NSO. Information on the quantity of imports and exports by enterprise is obtained from the International Trade Unit. This information is regularly used to update the enterprise sample base of this survey. 8.1.4 Another important criterion for a company to be included within the enterprise sample-base is whether it has a foreign shareholding or not. The list of enterprises with a foreign shareholding is obtained annually from the Registrar of Partnerships at the MFSA. Information on new companies with a foreign shareholding is also collected via the SBS, which includes a question on whether the enterprise has a foreign shareholding or not.
Quarterly National Accounts Inventory
National Accounts Unit 70
8.1.5 For 2004 onwards, the annual enterprise survey sample base of the financial institutional sector has been expanded to cover exchange bureaux, banks, the CBM and the Malta Stock Exchange (MSE). Collective Investment Schemes (CISs) have been included for the reference year 2006 onwards. 8.1.6 The sample base for the non-financial corporate sector is based on the Business Register compiled by the NSO. These are indicated in the table below, which shows that a census is carried out for enterprises whose turnover exceeds Lm100,000 (€232,920) and for enterprises whose turnover falls below this threshold, but which have more than fifty employees. Those enterprises with turnover and employment falling below the specified thresholds are surveyed on the basis of a stratified sample representative of selected NACE activities at the class level.
Enlargement of BOP Enterprise Survey Sample Base
8.1.7 A filter question has also been included within the SBS for 2004 asking enterprises whether they carry out financial transactions or transactions in goods or services with non-residents. On the basis of this information, only these companies (apart from the 700 companies selected on the basis of the criteria described in paragraph 8.3.1) are targeted by the BOP Unit. The SBS covers around a third of the entire population such that in three years time all the population would have been surveyed. 8.1.8 The population frame for the enterprise survey is also updated regularly using data from the CBM on the transactions of residents with non-residents that pass through the banking system. Large transactions are identified and used to update the non-financial enterprise population of the BOP. 8.1.9 The design of all the questionnaires pertaining to the direct reporting survey is based on the stock-flow-income model. This model requests detailed information on changes in the international investment position of enterprises by financial instrument as shown below:
Criterion A Criterion B Data Collection Method
Turnover > Lm100,000 Census
Turnover < Lm100,000 Employment > 50 Employees
Census
Turnover < Lm100,000 Employment < 50 Employees
Stratified sample for selected NACE Code
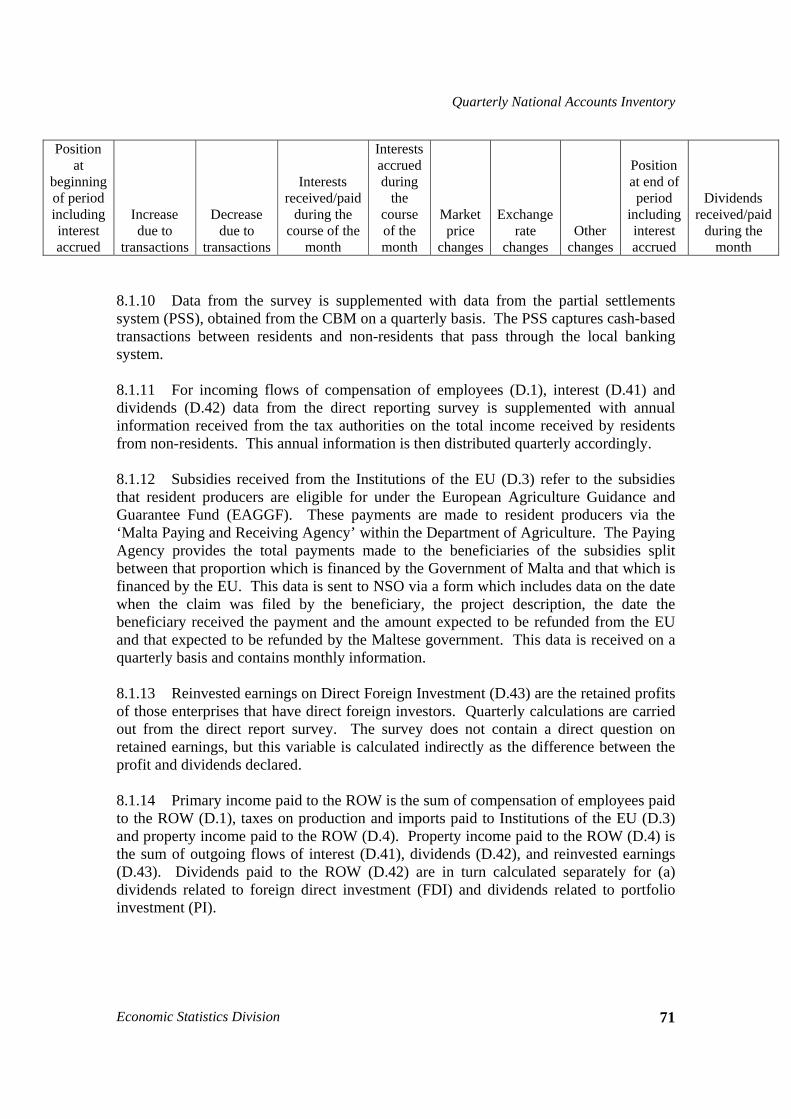
Quarterly National Accounts Inventory
Economic Statistics Division 71
Position at
beginning of period including interest accrued
Increase due to
transactions
Decrease due to
transactions
Interests received/paid
during the course of the
month
Interests accrued during
the course of the month
Market price
changes
Exchange rate
changes Other
changes
Position at end of period
including interest accrued
Dividends received/paid
during the month
8.1.10 Data from the survey is supplemented with data from the partial settlements system (PSS), obtained from the CBM on a quarterly basis. The PSS captures cash-based transactions between residents and non-residents that pass through the local banking system. 8.1.11 For incoming flows of compensation of employees (D.1), interest (D.41) and dividends (D.42) data from the direct reporting survey is supplemented with annual information received from the tax authorities on the total income received by residents from non-residents. This annual information is then distributed quarterly accordingly. 8.1.12 Subsidies received from the Institutions of the EU (D.3) refer to the subsidies that resident producers are eligible for under the European Agriculture Guidance and Guarantee Fund (EAGGF). These payments are made to resident producers via the ‘Malta Paying and Receiving Agency’ within the Department of Agriculture. The Paying Agency provides the total payments made to the beneficiaries of the subsidies split between that proportion which is financed by the Government of Malta and that which is financed by the EU. This data is sent to NSO via a form which includes data on the date when the claim was filed by the beneficiary, the project description, the date the beneficiary received the payment and the amount expected to be refunded from the EU and that expected to be refunded by the Maltese government. This data is received on a quarterly basis and contains monthly information. 8.1.13 Reinvested earnings on Direct Foreign Investment (D.43) are the retained profits of those enterprises that have direct foreign investors. Quarterly calculations are carried out from the direct report survey. The survey does not contain a direct question on retained earnings, but this variable is calculated indirectly as the difference between the profit and dividends declared. 8.1.14 Primary income paid to the ROW is the sum of compensation of employees paid to the ROW (D.1), taxes on production and imports paid to Institutions of the EU (D.3) and property income paid to the ROW (D.4). Property income paid to the ROW (D.4) is the sum of outgoing flows of interest (D.41), dividends (D.42), and reinvested earnings (D.43). Dividends paid to the ROW (D.42) are in turn calculated separately for (a) dividends related to foreign direct investment (FDI) and dividends related to portfolio investment (PI).
Quarterly National Accounts Inventory
National Accounts Unit 72
8.1.15 Quarterly calculations of outgoing flows of compensation of employees (D.1), interest (D.41) and dividends (D.42) are based on the same direct reporting survey, described above and used for the corresponding income flows. 8.1.16 Data on outgoing flows from the survey is supplemented with data from the partial settlements system (PSS), obtained from the CBM on a quarterly basis, where the PSS captures cash-based transactions between residents and non-residents that pass through the local banking system. 8.1.17 Data on taxes on production and imports paid to EU Institutions is obtained on a quarterly basis from the Ministry of Finance. This data is subsequently corroborated with the Departmental Accounting System (DAS), and incorporated into the general government accounts and in BoP statistics. These taxes include the traditional own resource (TOR) group and VAT own resource payments. 8.1.18 Taxes on production and imports paid to EU Institutions are included in the GDP to GNI calculations gross of reimbursement of collection costs. The revenue collected from traditional own resources and passed on to the EU is recorded in line with ESA 95 paragraph 4.26. Accordingly, this revenue is paid to the EU two months after it is collected, but recorded in the GNI calculations in the month when it is due, that is when the activity that creates the liability to pay the taxes occurs. Traditional own resource (TOR) funds make up around 70 per cent of total taxes on production and imports paid to the Institutions of the EU. The remaining 30 per cent, consisting of VAT based own resource payments to the EU are adjusted for the advances paid in January by the Maltese Government to the EU for a given year, and for the reconciliation balances at the end of December. 8.1.19 Outgoing reinvested earnings on Direct Foreign Investment (D.43) are the retained profits of those enterprises that have direct foreign investors. Quarterly calculations are also carried out from the direct reporting survey and this variable is calculated indirectly as the difference between the profit and dividends declared.
8.2 Consumption of fixed capital (K.1), net national income,
acquisitions less disposals of non-financial non-produced assets (K.2)
8.2.1 Consumption of fixed capital (K.1)
8.2.1.1 For the calculation of Consumption of Fixed Capital (CFC), two approaches have been used. The direct method was applied in the case of dwellings whilst the perpetual inventory method (PIM) was applied for the remaining products. 8.2.1.2 The straight-line depreciation model has been applied in the computation of CFC for the owner-occupied dwellings stock for the benchmark years 1995 and 2005. The dwellings stock is first valued at current replacement cost and CFC is subsequently
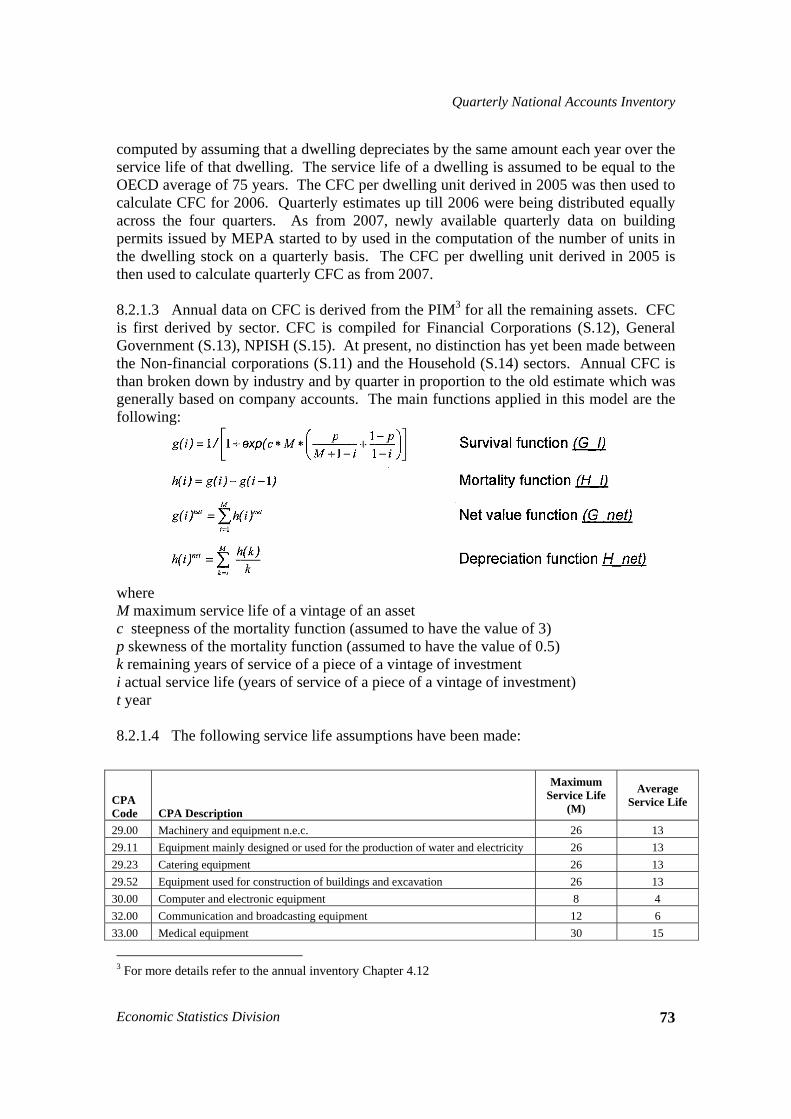
Quarterly National Accounts Inventory
Economic Statistics Division 73
computed by assuming that a dwelling depreciates by the same amount each year over the service life of that dwelling. The service life of a dwelling is assumed to be equal to the OECD average of 75 years. The CFC per dwelling unit derived in 2005 was then used to calculate CFC for 2006. Quarterly estimates up till 2006 were being distributed equally across the four quarters. As from 2007, newly available quarterly data on building permits issued by MEPA started to by used in the computation of the number of units in the dwelling stock on a quarterly basis. The CFC per dwelling unit derived in 2005 is then used to calculate quarterly CFC as from 2007. 8.2.1.3 Annual data on CFC is derived from the PIM3 for all the remaining assets. CFC is first derived by sector. CFC is compiled for Financial Corporations (S.12), General Government (S.13), NPISH (S.15). At present, no distinction has yet been made between the Non-financial corporations (S.11) and the Household (S.14) sectors. Annual CFC is than broken down by industry and by quarter in proportion to the old estimate which was generally based on company accounts. The main functions applied in this model are the following:
where M maximum service life of a vintage of an asset c steepness of the mortality function (assumed to have the value of 3) p skewness of the mortality function (assumed to have the value of 0.5) k remaining years of service of a piece of a vintage of investment i actual service life (years of service of a piece of a vintage of investment) t year 8.2.1.4 The following service life assumptions have been made:
CPA Code CPA Description
Maximum Service Life
(M)
Average Service Life
29.00 Machinery and equipment n.e.c. 26 13 29.11 Equipment mainly designed or used for the production of water and electricity 26 13 29.23 Catering equipment 26 13 29.52 Equipment used for construction of buildings and excavation 26 13 30.00 Computer and electronic equipment 8 4 32.00 Communication and broadcasting equipment 12 6 33.00 Medical equipment 30 15
3 For more details refer to the annual inventory Chapter 4.12
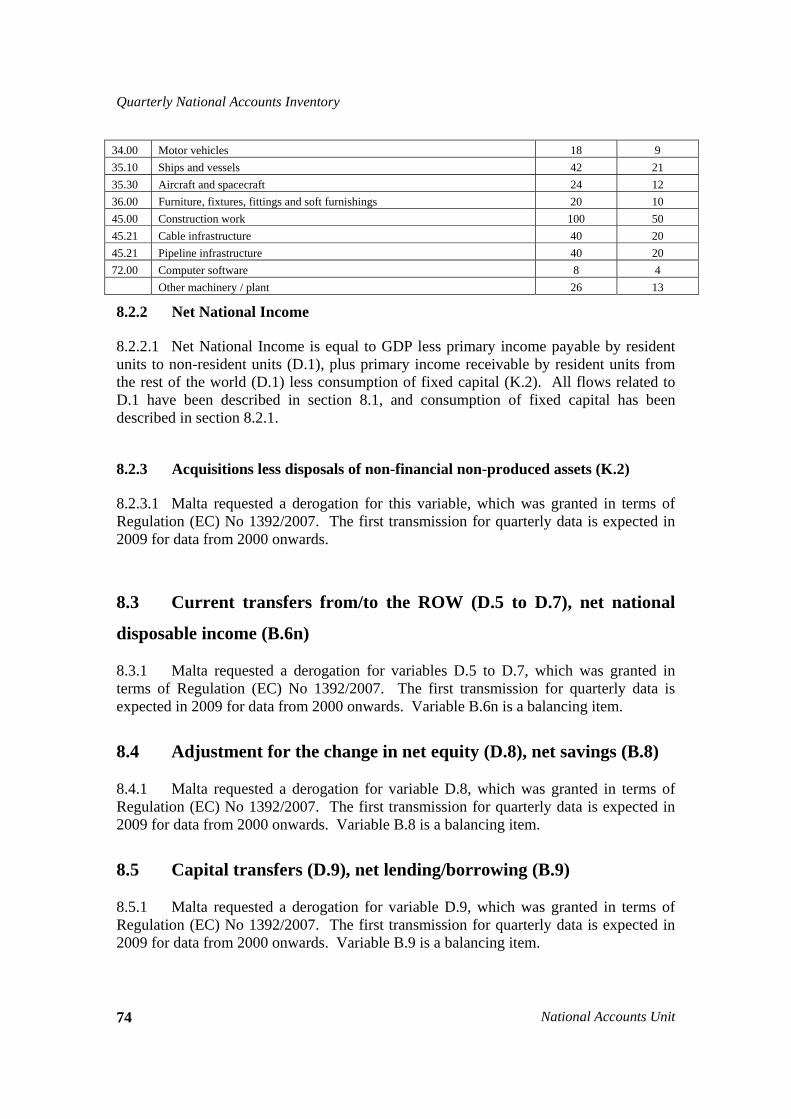
Quarterly National Accounts Inventory
National Accounts Unit 74
34.00 Motor vehicles 18 9 35.10 Ships and vessels 42 21 35.30 Aircraft and spacecraft 24 12 36.00 Furniture, fixtures, fittings and soft furnishings 20 10 45.00 Construction work 100 50 45.21 Cable infrastructure 40 20 45.21 Pipeline infrastructure 40 20 72.00 Computer software 8 4 Other machinery / plant 26 13
8.2.2 Net National Income
8.2.2.1 Net National Income is equal to GDP less primary income payable by resident units to non-resident units (D.1), plus primary income receivable by resident units from the rest of the world (D.1) less consumption of fixed capital (K.2). All flows related to D.1 have been described in section 8.1, and consumption of fixed capital has been described in section 8.2.1.
8.2.3 Acquisitions less disposals of non-financial non-produced assets (K.2)
8.2.3.1 Malta requested a derogation for this variable, which was granted in terms of Regulation (EC) No 1392/2007. The first transmission for quarterly data is expected in 2009 for data from 2000 onwards.
8.3 Current transfers from/to the ROW (D.5 to D.7), net national
disposable income (B.6n)
8.3.1 Malta requested a derogation for variables D.5 to D.7, which was granted in terms of Regulation (EC) No 1392/2007. The first transmission for quarterly data is expected in 2009 for data from 2000 onwards. Variable B.6n is a balancing item.
8.4 Adjustment for the change in net equity (D.8), net savings (B.8)
8.4.1 Malta requested a derogation for variable D.8, which was granted in terms of Regulation (EC) No 1392/2007. The first transmission for quarterly data is expected in 2009 for data from 2000 onwards. Variable B.8 is a balancing item.
8.5 Capital transfers (D.9), net lending/borrowing (B.9)
8.5.1 Malta requested a derogation for variable D.9, which was granted in terms of Regulation (EC) No 1392/2007. The first transmission for quarterly data is expected in 2009 for data from 2000 onwards. Variable B.9 is a balancing item.
Quarterly National Accounts Inventory
Economic Statistics Division 75
Chapter 9 Flash estimates
9.1 Flash GDP estimate
9.1.1 The FLASH project envisaged the production of prompt and reliable estimates of the main Quarterly National Accounts constant price aggregates of the European Economic and Monetary Union and of the EU member states. The target delay was deemed to be 40-45 days after the end of the reference period, with such a delay seemingly deemed to be ‘reasonable’ according to experience gained in the UK and the USA – whilst earlier estimates would suffer a consequent loss in reliability. The aim of the project was to supply a coherent system designed to conduct short-term economic analysis as well as in tackling monetary policy decisions, whilst the shortcomings of the delay of availability of the official quarterly figures would be avoided.
9.1.2 The FLASH software is the final product of a shared-cost action within the information society programme CPA8-research and technological development of the European Commission. It is led by the English National Institute of Economic and Social Research (NIESR), with other participants including:
• Joint Research Centre (JRC) of the European Commission
• Italian Statistical Office (ISTAT)
• National Bank of Belgium (BNB)
• German Institute of Economic Research (DIW)
9.1.3 In order to produce a GDP flash estimate, suitable related indicators are required to satisfy the following criteria:
• Availability of the indicator within 40 to 45 days following the end of the reference quarter;
• Official availability – preference is always be given to the utilization of officially recognized statistics;
• Economic meaningfulness with respect to the primary variable being forecasted, in this case the quarterly GDP
• An anticipated statistical correlation with the target variable (GDP) 9.1.4 Following the fulfillment of the above criteria, relevant indicators are subsequently chosen according to the following step-wise process:
- a list of indicators deemed to be possibly suitable to produce the flash estimates initially identified by economic reasoning; - the list is than further narrowed down on the basis of the strength, or otherwise, of
the correlation exhibited between the indicator and the dependent variable i.e. on the basis of a bivariate pairwise analysis of correlation with the target variable.
Quarterly National Accounts Inventory
National Accounts Unit 76
9.1.5 The indicator selection menu in the FLASH program incorporates an option which allows one to conduct bivariate tests, and is thereby utilized to investigate the pairwise relationship between a given aggregate and the corresponding variables by means of one or more of the following procedures: (i) R-squared (ii) Granger causality test (iii) Johansen cointegration test (iv) Chow inequality test 9.1.6 Currently, the R
2 test was being selected on the basis of its straightforwardness
and simplicity (therefore hastening the whole forecasting process). Only those indicators which show a sufficiently high squared coefficient of determination (close to 1, and therefore the variation in Y can be attributed to the change in X viz. the indicator) with the explanatory variable are selected for eventual incorporation in the chosen regression model. 9.1.7 Looking at quarterly comparisons in log-levels and considering the R
2 criterion,
the best indicators seemed to be exports of goods and services, and imports of goods; other indicators considered as second best by according to the R
2 selection procedure
were the power generated by the local energy distributor (Enemalta) during the quarter under review, as well as new motor-vehicle registrations (available from the transport statistics). However, due to the unstable nature of these latter two indicators, in that they had a tendency to contribute to ambiguous t-value statistics in the subsequent analysis, their use was eventually discontinued. Due to the availability of a narrow range of complete, adequate and reliable statistics within the time-frame for the production of flash estimates, sub-categories of imports (details according to BEC classification readily provided by the trade section, such as imports of consumer durables and non-durables, imports of capital goods as well as imports of fuel) were also incorporated in the analysis. 9.1.8 After narrowing down the choice of appropriate indicators by means of the R-squared test, the prospective indicators (the X-variables) or the aggregate (the Y-variable) are subjected to a further battery of tests to determine whether either of the quarterly series is stationary or not. These tests range from simple visual tools such as plotting the series to determine whether the series is trending to obtaining plots of the autocorrelation function (ACF or correlogram) and of the partial autocorrelation function (PACF). 9.1.9 However, a more reliable test which enables the user to definitely detect whether the series under consideration possesses unit root characteristics (and is therefore non-stationary) is the Augmented Dickey Fuller (ADF) test; the results of ADF tests on log-levels of most of the quarterly indicators and aggregates suggest that that most of the quarterly time series are integrated of order 1 (I1), thus strongly supporting the a priori expected view that the indicators/variables are non-stationary. Subsequent ADF tests on the quarterly log-differences indicate that first differencing removes the non-stationarity in the majority of the series under review. Therefore, in order to avoid the problem of spurious regression creeping into the final analysis, the original values of both the indicator/s and variable series are transformed by:
Quarterly National Accounts Inventory
Economic Statistics Division 77
(i) taking the original logarithm of the indicator and/or variable in question, and (ii) first differencing the resulting logarithm 9.1.10 Once the set of indicators have been selected and appropriately transformed as described earlier, a forecast of the given aggregate is undertaken using one of the following standard statistical approaches: (i) Autoregressive Distributed lags (ADL) model (ii) Regression model with ARMA errors (RegARMA) (iii) Temporal disaggregation method using the Chow-Lin Approach 9.1.11 Only the workings of the first method (the ADL) were mastered to some degree, and only after a great deal of experimenting and adapting the flash program to work in a Windows XP environment; the other two models mentioned above require much more extensive knowledge of the theoretical foundations in order to be able to handle the intricacies of the software and extract meaningful results. At the same time, it can also be stated that, even whilst experimenting with the simpler ADL model, conflicting information was sometimes obtained from the model. Thus, for example, the signs of the estimated coefficients could sometimes conflict with those expected a priori from economic theory. This especially became evident as the lag structure became progressively reduced according to an established iterative procedure: this consisted of commencing with the maximum number of lags theoretically attributable to each indicator variable (for quarterly data – theoretical maximum of 4 lags), and then stepwise eliminating spurious lags by means of significance testing. Because of this, and because the use of slightly different lags also gave rise to quite diverging forecasts, it was not felt that the procedure could be relied upon to give consistent figures. 9.1.12 NSO only twice published flash GDP estimates in news releases dated 31st October 2005 and 18th October 2006. These releases may be viewed on NSO’s website.
9.2 Flash employment estimate
9.2.1 This section is not applicable to Malta.
9.3 Other existing flash estimate, if any
9.3.1 This section is not applicable to Malta.
Quarterly National Accounts Inventory
National Accounts Unit 78
Chapter 10 Main data sources used
10.1 Chapter 10 serves as a guide to the system of statistical surveys and other data, such as administrative and fiscal data sources, used as the basis for the quarterly national accounts in Malta. To support the adoption of the ESA 95, new surveys were introduced and the coverage of others was extended. Compilation of Maltese national accounts relies on a number of statistical surveys, censuses, and data prepared within the NSO, as well as administrative data supplied by other agencies. 10.2 The Business Register (BR) is used as a common sample frame for all enterprise surveys and is essential in estimating GDP using the production approach. The BR was created in 1997 based on information from the VAT Register, supplemented by secondary sources provided by the MFSA. It is maintained on an ongoing basis by the Business and Enterprise Unit of the NSO, and its updating relies mostly on information from the Structural Business Statistics (SBS), the monthly updates from the VAT Department, and the information on financial, insurance and renting companies provided by the CBM. The BR includes a comprehensive list of units consisting of large and small enterprises, as well as self-employed persons/unincorporated enterprises, covering all the economic activities in Malta. Variables included in the records provide information on status, type of activities the unit is engaged in, turnover, investment, employment data and institutional sector code. Enterprises are classified according to 4-digit NACE level. 10.3 SBS is a major survey undertaken annually covering the following activities: • 14 to 37 and 45 are available since 1995 in NACE Rev.1 and Rev.1.1 and by ISIC • 50 to 52 are available since 1999 in NACE Rev.1.1 • 55, 60.2, 62, 63 and 65 to 67 are available since 2000 in NACE Rev.1.1 • 70, 71, 72, 74 and 92 are available since 2001 in NACE Rev.1.1 10.4 The HBS is another important data source. The last HBS was carried out between March 2000 and February 2001. It covered a national representative sample of 2,586 households throughout Malta. The sample was randomly divided into seven batches or sub-samples. Each batch consists of about 900 households. Corrections for sampling error were made and the standard error on household annual expenditure was estimated to 1.5 per cent. The next HBS will be held in 2008, following the adoption of the euro as Malta’s national currency. 10.5 The Labour Force Survey (LFS) is carried out on a quarterly basis with a specific reference week for the quarter using a random sample of 2,500 households spread across the country. The methodology of the survey follows the recommendations of the International Labour Organisation (ILO) and Eurostat. The economic activities of the interviewed persons (aged 15 and over) are classified according to NACE and the reference period is a calendar week. Due to the small sample, the survey does not provide accurate information at a disaggregated level. For this reason, the National Accounts Unit uses it in conjunction with the data from ETC.
Quarterly National Accounts Inventory
Economic Statistics Division 79
10.6 The STBS survey is another main data source for compiling quarterly accounts for the manufacturing sector. The data available includes employment, wages, local and export sales, and investment covering all activities, similar to the SBS. Timely response is a problem and the response rate varies by indicator; however, adjustments are made using the trade data and fixed ratios between various indicators (for example export sales in total sales) since for these, reporting is close to 100 per cent. Estimated data are replaced in the following quarters with actual reported data. 10.7 The Agricultural census is undertaken every ten years by NSO’s Agriculture Unit, the last one being conducted in 2001. However, every two years a Farm Structure Survey (FSS) is undertaken. This survey uses a sample covering about 18 per cent of the respective population derived on the basis of the economic size of farms. The response rate is 95 per cent. Updates to the sampling frame are based on the monthly returns from the Ministry for Rural Affairs. NSO also conducts an annual survey on livestock. 10.8 In addition, data from a series of surveys, enquiries and registers from within or outside NSO are used for national accounts purposes, as appears in the description of source data in the rest of this chapter. 10.9 Monetary and banking statistics are provided by the CBM. This covers annual and quarterly financial statements of the CBM and the commercial banks, as well as those of the insurance companies. 10.10 BOP data are produced by a unit within the NSO in accordance with the fifth edition of the Balance of Payments Manual (BPM5). 10.11 The Treasury Department makes available its database (DAS) to NSO. The local councils provide a copy of their quarterly management accounts. 10.12 Quarterly customs statistics on imports and exports of goods are used for compiling trade and BOP statistics by specialized units in NSO. 10.13 The VAT Department also provides quarterly data to the NSO. The register is encompasses Register A, covering large companies (over €10,000 sales), and Register B, covering small companies. In spite of its availability, several weaknesses limit its use, in particular: (i) classification used is not fully aligned with the NACE assigned to enterprises by NSO; (ii) accrual problem because of staggering and different periods of reporting; and (iii) coverage – timeliness. 10.14 ETC, the official employment agency provides a quarterly database which includes all enterprises and their employees, full-time and part-time. 10.15 The range of price statistics available at the NSO is limited. For the current compilation of the national accounts, extensive use is made of the harmonised index of consumer prices (HICP), and unit value indices for trade. In view of compilation of GDP volume measures by production, the scope of price and volume indices could be further
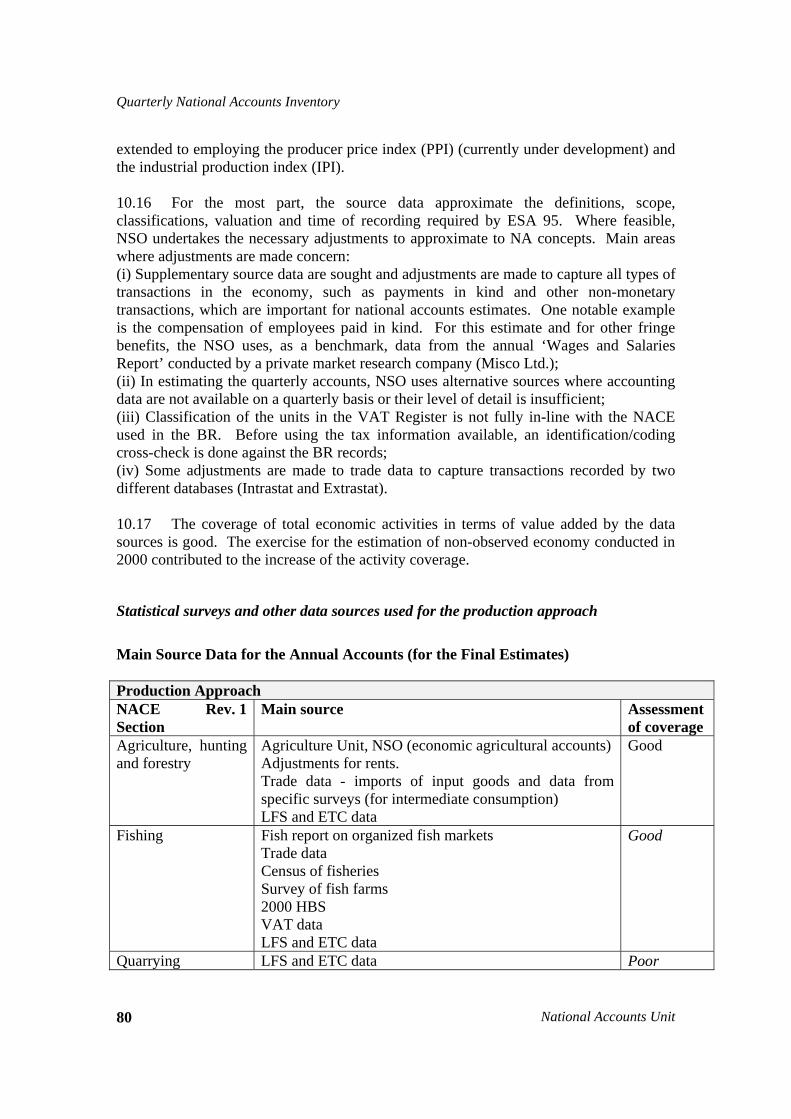
Quarterly National Accounts Inventory
National Accounts Unit 80
extended to employing the producer price index (PPI) (currently under development) and the industrial production index (IPI). 10.16 For the most part, the source data approximate the definitions, scope, classifications, valuation and time of recording required by ESA 95. Where feasible, NSO undertakes the necessary adjustments to approximate to NA concepts. Main areas where adjustments are made concern: (i) Supplementary source data are sought and adjustments are made to capture all types of transactions in the economy, such as payments in kind and other non-monetary transactions, which are important for national accounts estimates. One notable example is the compensation of employees paid in kind. For this estimate and for other fringe benefits, the NSO uses, as a benchmark, data from the annual ‘Wages and Salaries Report’ conducted by a private market research company (Misco Ltd.); (ii) In estimating the quarterly accounts, NSO uses alternative sources where accounting data are not available on a quarterly basis or their level of detail is insufficient; (iii) Classification of the units in the VAT Register is not fully in-line with the NACE used in the BR. Before using the tax information available, an identification/coding cross-check is done against the BR records; (iv) Some adjustments are made to trade data to capture transactions recorded by two different databases (Intrastat and Extrastat). 10.17 The coverage of total economic activities in terms of value added by the data sources is good. The exercise for the estimation of non-observed economy conducted in 2000 contributed to the increase of the activity coverage.
Statistical surveys and other data sources used for the production approach Main Source Data for the Annual Accounts (for the Final Estimates) Production Approach NACE Rev. 1 Section
Main source Assessment of coverage
Agriculture, hunting and forestry
Agriculture Unit, NSO (economic agricultural accounts) Adjustments for rents. Trade data - imports of input goods and data from specific surveys (for intermediate consumption) LFS and ETC data
Good
Fishing Fish report on organized fish markets Trade data Census of fisheries Survey of fish farms 2000 HBS VAT data LFS and ETC data
Good
Quarrying LFS and ETC data Poor
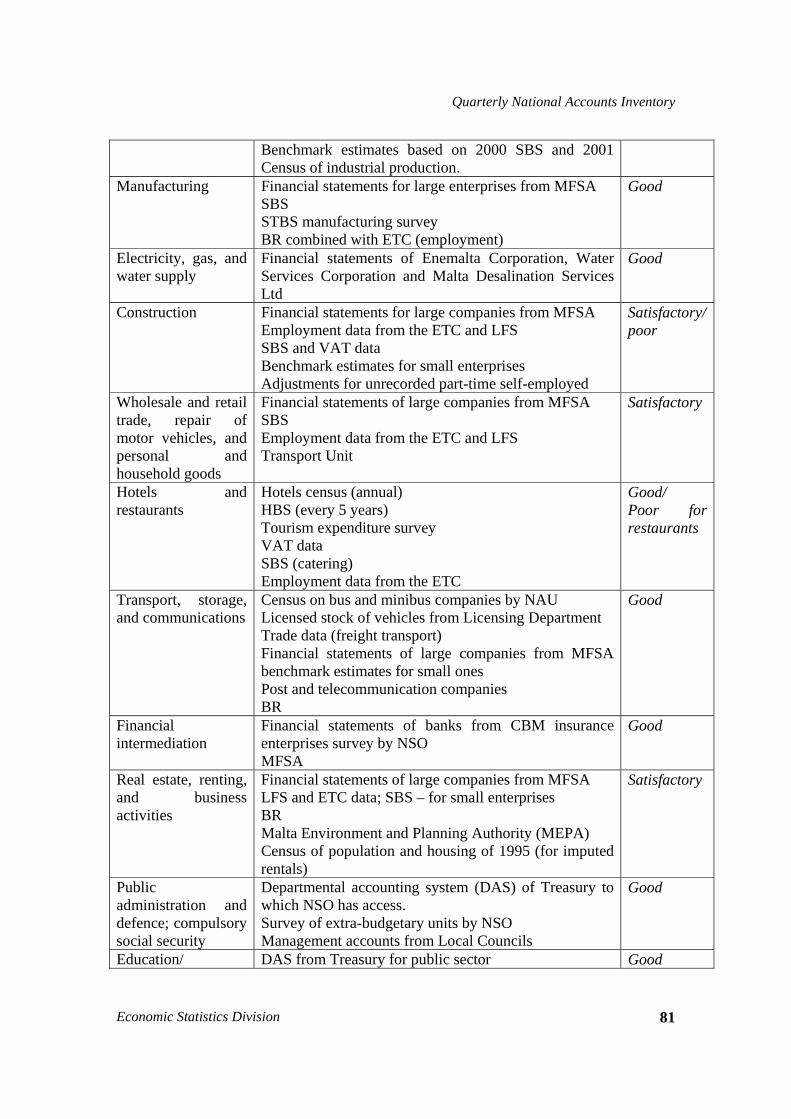
Quarterly National Accounts Inventory
Economic Statistics Division 81
Benchmark estimates based on 2000 SBS and 2001 Census of industrial production.
Manufacturing Financial statements for large enterprises from MFSA SBS STBS manufacturing survey BR combined with ETC (employment)
Good
Electricity, gas, and water supply
Financial statements of Enemalta Corporation, Water Services Corporation and Malta Desalination Services Ltd
Good
Construction Financial statements for large companies from MFSA Employment data from the ETC and LFS SBS and VAT data Benchmark estimates for small enterprises Adjustments for unrecorded part-time self-employed
Satisfactory/poor
Wholesale and retail trade, repair of motor vehicles, and personal and household goods
Financial statements of large companies from MFSA SBS Employment data from the ETC and LFS Transport Unit
Satisfactory
Hotels and restaurants
Hotels census (annual) HBS (every 5 years) Tourism expenditure survey VAT data SBS (catering) Employment data from the ETC
Good/ Poor for restaurants
Transport, storage, and communications
Census on bus and minibus companies by NAU Licensed stock of vehicles from Licensing Department Trade data (freight transport) Financial statements of large companies from MFSA benchmark estimates for small ones Post and telecommunication companies BR
Good
Financial intermediation
Financial statements of banks from CBM insurance enterprises survey by NSO MFSA
Good
Real estate, renting, and business activities
Financial statements of large companies from MFSA LFS and ETC data; SBS – for small enterprises BR Malta Environment and Planning Authority (MEPA) Census of population and housing of 1995 (for imputed rentals)
Satisfactory
Public administration and defence; compulsory social security
Departmental accounting system (DAS) of Treasury to which NSO has access. Survey of extra-budgetary units by NSO Management accounts from Local Councils
Good
Education/ DAS from Treasury for public sector Good
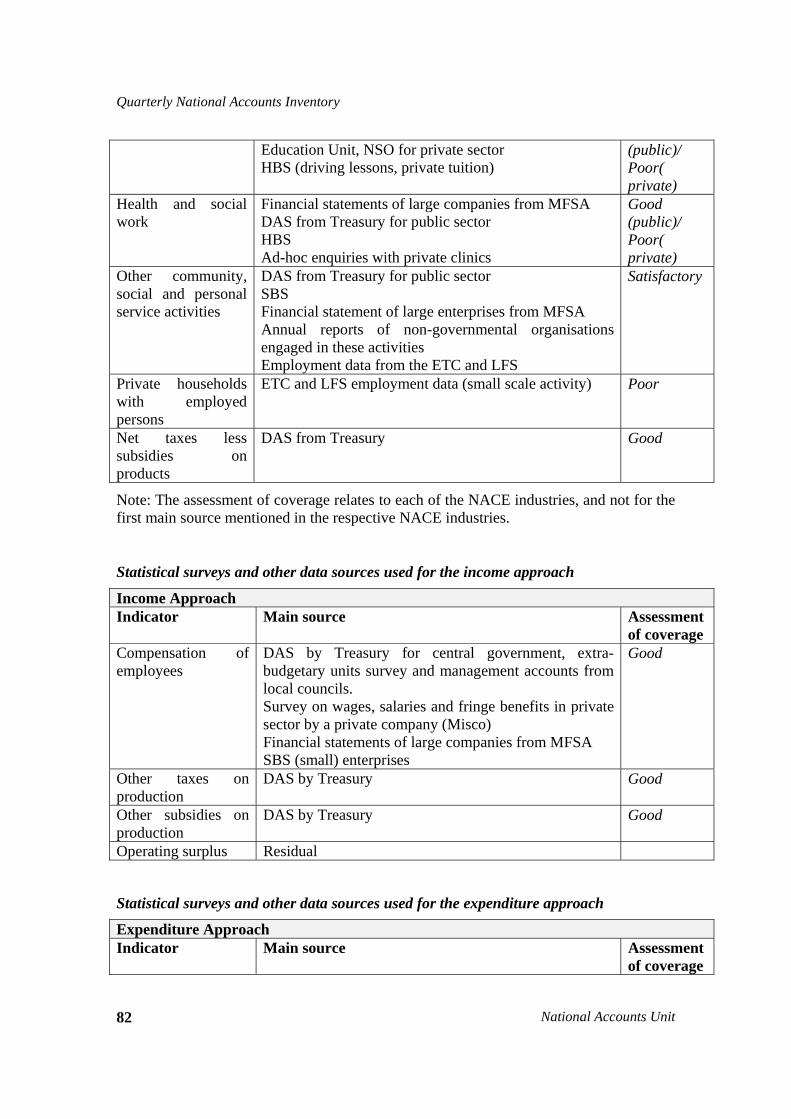
Quarterly National Accounts Inventory
National Accounts Unit 82
Education Unit, NSO for private sector HBS (driving lessons, private tuition)
(public)/ Poor( private)
Health and social work
Financial statements of large companies from MFSA DAS from Treasury for public sector HBS Ad-hoc enquiries with private clinics
Good (public)/ Poor( private)
Other community, social and personal service activities
DAS from Treasury for public sector SBS Financial statement of large enterprises from MFSA Annual reports of non-governmental organisations engaged in these activities Employment data from the ETC and LFS
Satisfactory
Private households with employed persons
ETC and LFS employment data (small scale activity) Poor
Net taxes less subsidies on products
DAS from Treasury
Good
Note: The assessment of coverage relates to each of the NACE industries, and not for the first main source mentioned in the respective NACE industries.
Statistical surveys and other data sources used for the income approach
Income Approach Indicator Main source Assessment
of coverage Compensation of employees
DAS by Treasury for central government, extra-budgetary units survey and management accounts from local councils. Survey on wages, salaries and fringe benefits in private sector by a private company (Misco) Financial statements of large companies from MFSA SBS (small) enterprises
Good
Other taxes on production
DAS by Treasury Good
Other subsidies on production
DAS by Treasury Good
Operating surplus Residual
Statistical surveys and other data sources used for the expenditure approach
Expenditure Approach Indicator Main source Assessment
of coverage
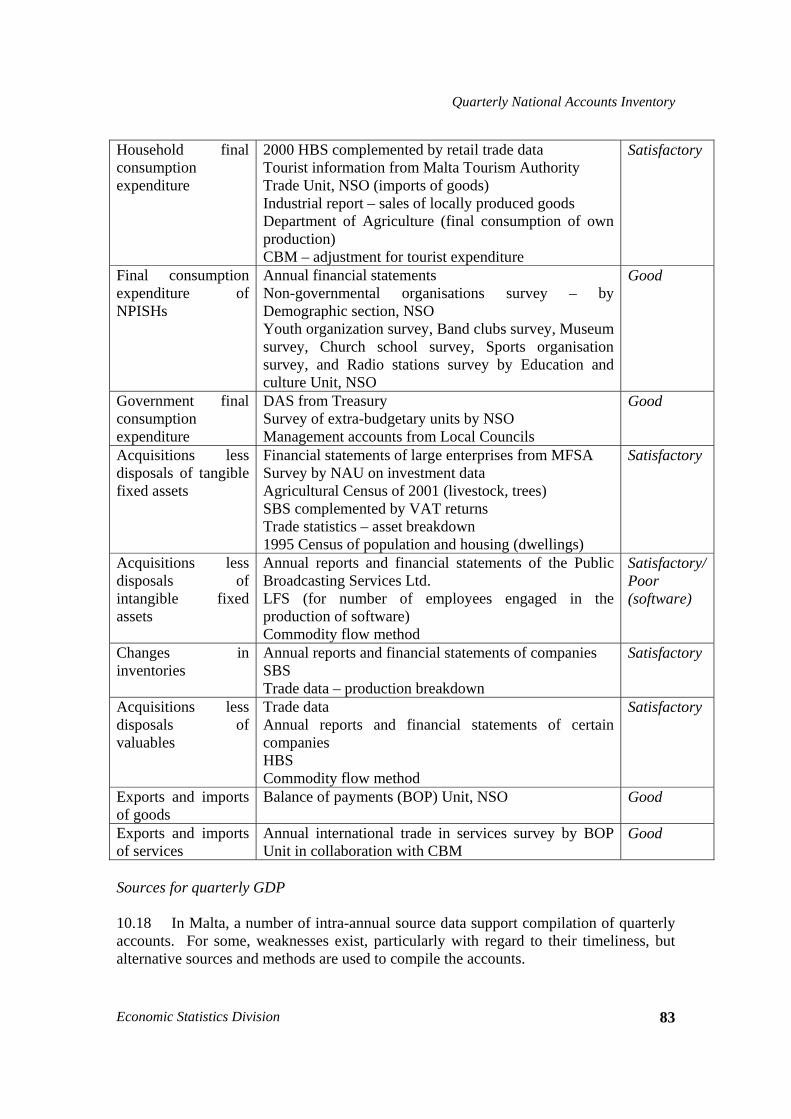
Quarterly National Accounts Inventory
Economic Statistics Division 83
Household final consumption expenditure
2000 HBS complemented by retail trade data Tourist information from Malta Tourism Authority Trade Unit, NSO (imports of goods) Industrial report – sales of locally produced goods Department of Agriculture (final consumption of own production) CBM – adjustment for tourist expenditure
Satisfactory
Final consumption expenditure of NPISHs
Annual financial statements Non-governmental organisations survey – by Demographic section, NSO Youth organization survey, Band clubs survey, Museum survey, Church school survey, Sports organisation survey, and Radio stations survey by Education and culture Unit, NSO
Good
Government final consumption expenditure
DAS from Treasury Survey of extra-budgetary units by NSO Management accounts from Local Councils
Good
Acquisitions less disposals of tangible fixed assets
Financial statements of large enterprises from MFSA Survey by NAU on investment data Agricultural Census of 2001 (livestock, trees) SBS complemented by VAT returns Trade statistics – asset breakdown 1995 Census of population and housing (dwellings)
Satisfactory
Acquisitions less disposals of intangible fixed assets
Annual reports and financial statements of the Public Broadcasting Services Ltd. LFS (for number of employees engaged in the production of software) Commodity flow method
Satisfactory/ Poor (software)
Changes in inventories
Annual reports and financial statements of companies SBS Trade data – production breakdown
Satisfactory
Acquisitions less disposals of valuables
Trade data Annual reports and financial statements of certain companies HBS Commodity flow method
Satisfactory
Exports and imports of goods
Balance of payments (BOP) Unit, NSO Good
Exports and imports of services
Annual international trade in services survey by BOP Unit in collaboration with CBM
Good
Sources for quarterly GDP 10.18 In Malta, a number of intra-annual source data support compilation of quarterly accounts. For some, weaknesses exist, particularly with regard to their timeliness, but alternative sources and methods are used to compile the accounts.
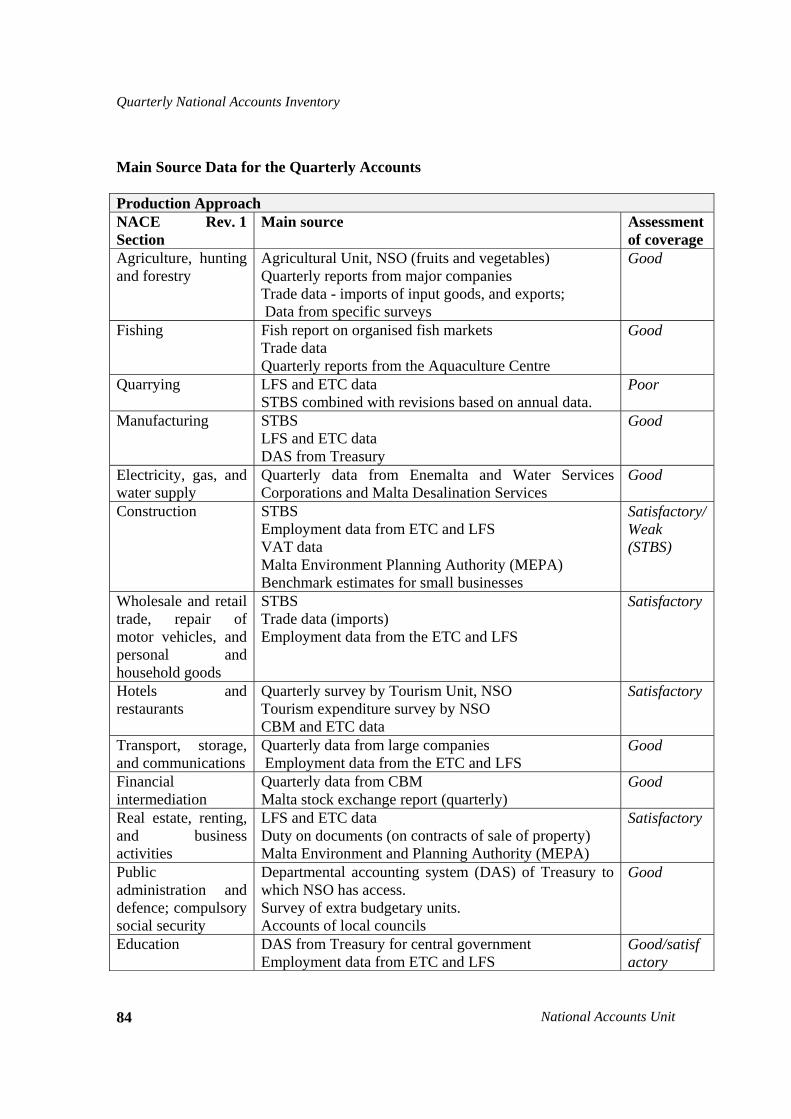
Quarterly National Accounts Inventory
National Accounts Unit 84
Main Source Data for the Quarterly Accounts Production Approach NACE Rev. 1 Section
Main source Assessment of coverage
Agriculture, hunting and forestry
Agricultural Unit, NSO (fruits and vegetables) Quarterly reports from major companies Trade data - imports of input goods, and exports; Data from specific surveys
Good
Fishing Fish report on organised fish markets Trade data Quarterly reports from the Aquaculture Centre
Good
Quarrying LFS and ETC data STBS combined with revisions based on annual data.
Poor
Manufacturing STBS LFS and ETC data DAS from Treasury
Good
Electricity, gas, and water supply
Quarterly data from Enemalta and Water Services Corporations and Malta Desalination Services
Good
Construction STBS Employment data from ETC and LFS VAT data Malta Environment Planning Authority (MEPA) Benchmark estimates for small businesses
Satisfactory/Weak (STBS)
Wholesale and retail trade, repair of motor vehicles, and personal and household goods
STBS Trade data (imports) Employment data from the ETC and LFS
Satisfactory
Hotels and restaurants
Quarterly survey by Tourism Unit, NSO Tourism expenditure survey by NSO CBM and ETC data
Satisfactory
Transport, storage, and communications
Quarterly data from large companies Employment data from the ETC and LFS
Good
Financial intermediation
Quarterly data from CBM Malta stock exchange report (quarterly)
Good
Real estate, renting, and business activities
LFS and ETC data Duty on documents (on contracts of sale of property) Malta Environment and Planning Authority (MEPA)
Satisfactory
Public administration and defence; compulsory social security
Departmental accounting system (DAS) of Treasury to which NSO has access. Survey of extra budgetary units. Accounts of local councils
Good
Education
DAS from Treasury for central government Employment data from ETC and LFS
Good/satisfactory
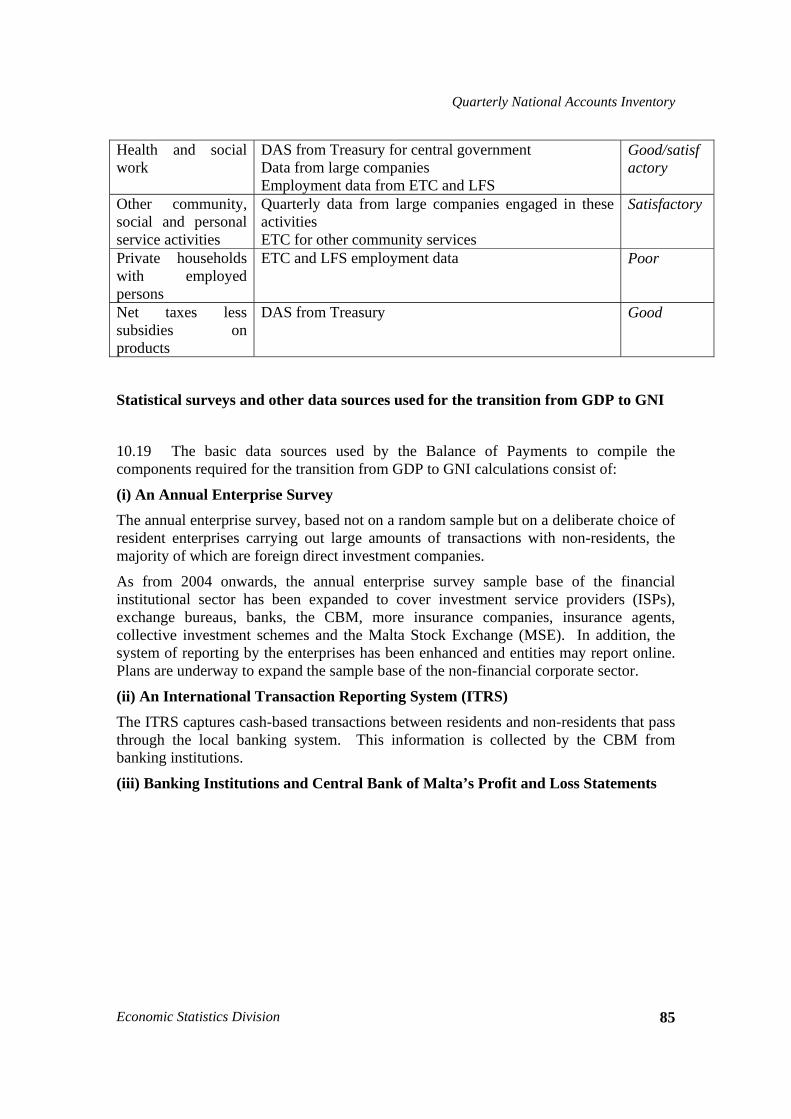
Quarterly National Accounts Inventory
Economic Statistics Division 85
Health and social work
DAS from Treasury for central government Data from large companies Employment data from ETC and LFS
Good/satisfactory
Other community, social and personal service activities
Quarterly data from large companies engaged in these activities ETC for other community services
Satisfactory
Private households with employed persons
ETC and LFS employment data Poor
Net taxes less subsidies on products
DAS from Treasury Good
Statistical surveys and other data sources used for the transition from GDP to GNI
10.19 The basic data sources used by the Balance of Payments to compile the components required for the transition from GDP to GNI calculations consist of:
(i) An Annual Enterprise Survey The annual enterprise survey, based not on a random sample but on a deliberate choice of resident enterprises carrying out large amounts of transactions with non-residents, the majority of which are foreign direct investment companies.
As from 2004 onwards, the annual enterprise survey sample base of the financial institutional sector has been expanded to cover investment service providers (ISPs), exchange bureaus, banks, the CBM, more insurance companies, insurance agents, collective investment schemes and the Malta Stock Exchange (MSE). In addition, the system of reporting by the enterprises has been enhanced and entities may report online. Plans are underway to expand the sample base of the non-financial corporate sector.
(ii) An International Transaction Reporting System (ITRS)
The ITRS captures cash-based transactions between residents and non-residents that pass through the local banking system. This information is collected by the CBM from banking institutions.
(iii) Banking Institutions and Central Bank of Malta’s Profit and Loss Statements