Embed Size (px)
Citation preview
Longleaf Partners Funds®
Annual Report
Partners Fund
Small-Cap Fund
International Fund
December 31, 2012
Cautionary Statement
One of Southeastern’s “Governing Principles” isthat “we will communicate with our investmentpartners as candidly as possible,” because webelieve Longleaf shareholders benefit fromunderstanding our investment philosophy andapproach. Our views and opinions regarding theinvestment prospects of our portfolio holdings andFunds are “forward looking statements” which mayor may not be accurate over the long term. Whilewe believe we have a reasonable basis for ourappraisals, and we have confidence in ouropinions, actual results may differ materially fromthose we anticipate. Information provided in thisreport should not be considered a recommendationto purchase or sell any particular security.
You can identify forward looking statements bywords like “believe,” “expect,” “anticipate,” orsimilar expressions when discussing prospects forparticular portfolio holdings and/or one of theFunds. We cannot assure future results andachievements. You should not place undue relianceon forward looking statements, which speak only asof the date of this report. We disclaim any obligationto update or alter any forward looking statements,whether as a result of new information, futureevents, or otherwise. Current performance may belower or higher than the performance quoted herein.Past performance does not guarantee future results,fund prices fluctuate, and the value of an investmentmay be worth more or less than the purchase price.Call (800)445-9469 or go tolongleafpartners.com for current performanceinformation and longleafpartners.com/mutual_fund_documents/prospectus
for the Prospectus and Summary Prospectus,both of which should be read carefully beforeinvesting to learn about fund investmentobjectives, risks and expenses.
The price-to-value ratio (“P/V”) is a calculationthat compares the prices of the stocks in a portfolioto Southeastern’s appraisals of their intrinsicvalues. P/V represents a single data point about aFund, and should not be construed as somethingmore. We caution our shareholders not to give thiscalculation undue weight. P/V alone tellsnothing about:
• The quality of the businesses we own or themanagements that run them;
• The cash held in the portfolio and when that cashwill be invested;
• The range or distribution of individual P/V’s thatcomprise the average; and
• The sources of and changes in the P/V.
When all of the above information is considered,the P/V is a useful tool to gauge the attractivenessof a Fund’s potential opportunity. It does not,however, tell when that opportunity will berealized, nor does it guarantee that any particularcompany’s price will ever reach its value. Weremind our shareholders who want to find a singlesilver bullet of information that investments arerarely that simple. To the extent an investorconsiders P/V in assessing a Fund’s returnopportunity, the limits of this tool should beconsidered along with other factors relevant toeach investor.
© 2013 Southeastern Asset Management, Inc. All Rights Reserved.Longleaf, Longleaf Partners Funds and the pine cone logo are registered trademarks of Longleaf PartnersFunds Trust. Southeastern Asset Management, Inc. is a registered trademark.
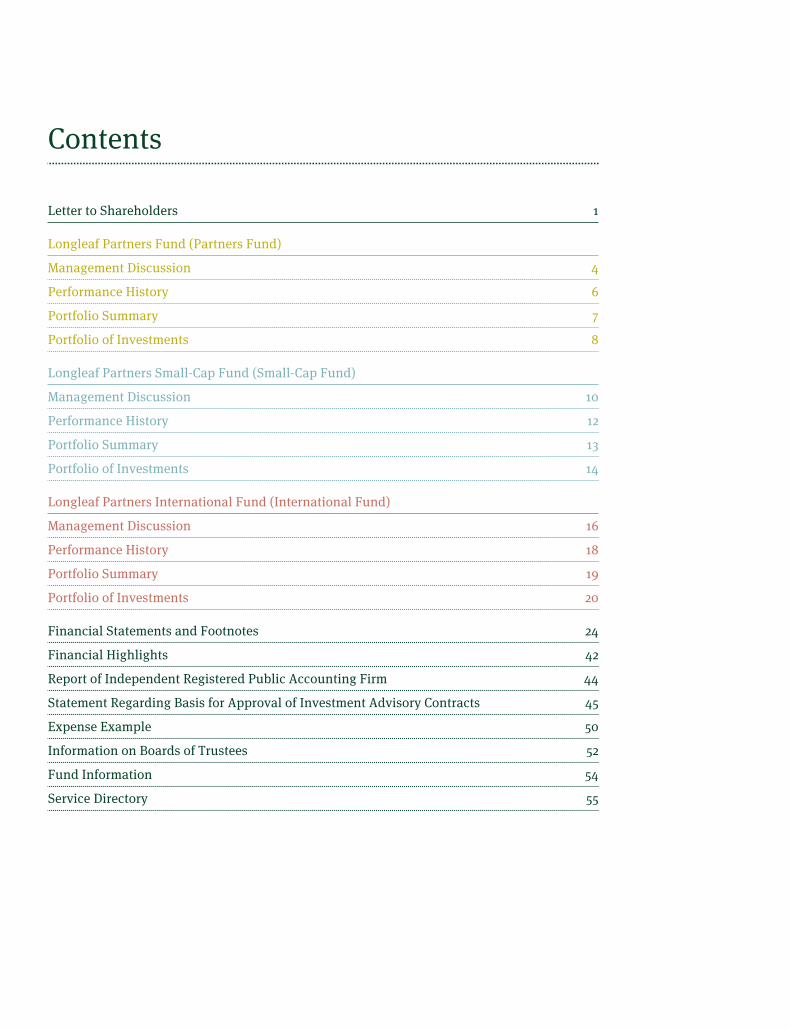
Contents
Letter to Shareholders 1
Longleaf Partners Fund (Partners Fund)
Management Discussion 4
Performance History 6
Portfolio Summary 7
Portfolio of Investments 8
Longleaf Partners Small-Cap Fund (Small-Cap Fund)
Management Discussion 10
Performance History 12
Portfolio Summary 13
Portfolio of Investments 14
Longleaf Partners International Fund (International Fund)
Management Discussion 16
Performance History 18
Portfolio Summary 19
Portfolio of Investments 20
Financial Statements and Footnotes 24
Financial Highlights 42
Report of Independent Registered Public Accounting Firm 44
Statement Regarding Basis for Approval of Investment Advisory Contracts 45
Expense Example 50
Information on Boards of Trustees 52
Fund Information 54
Service Directory 55

This page is intentionally left blank.
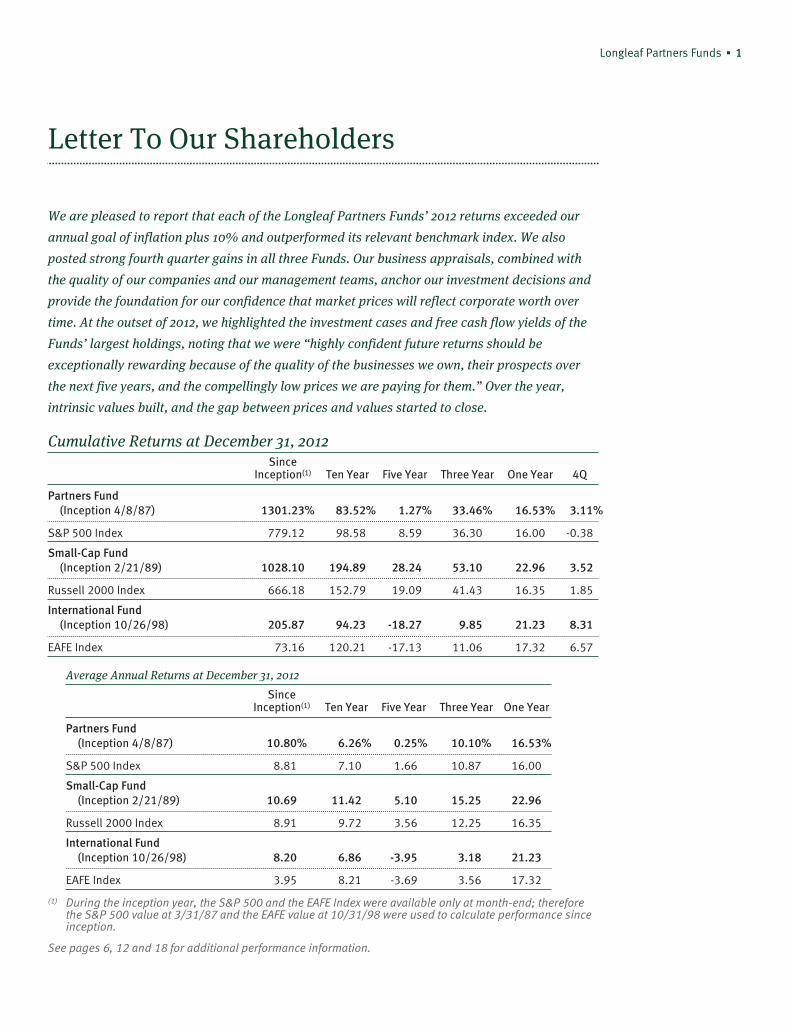
Longleaf Partners Funds ▪ 1
Letter To Our Shareholders
We are pleased to report that each of the Longleaf Partners Funds’ 2012 returns exceeded our
annual goal of inflation plus 10% and outperformed its relevant benchmark index. We also
posted strong fourth quarter gains in all three Funds. Our business appraisals, combined with
the quality of our companies and our management teams, anchor our investment decisions and
provide the foundation for our confidence that market prices will reflect corporate worth over
time. At the outset of 2012, we highlighted the investment cases and free cash flow yields of the
Funds’ largest holdings, noting that we were “highly confident future returns should be
exceptionally rewarding because of the quality of the businesses we own, their prospects over
the next five years, and the compellingly low prices we are paying for them.” Over the year,
intrinsic values built, and the gap between prices and values started to close.
Cumulative Returns at December 31, 2012Since
Inception(1) Ten Year Five Year Three Year One Year 4Q
Partners Fund(Inception 4/8/87) 1301.23% 83.52% 1.27% 33.46% 16.53% 3.11%
S&P 500 Index 779.12 98.58 8.59 36.30 16.00 -0.38
Small-Cap Fund(Inception 2/21/89) 1028.10 194.89 28.24 53.10 22.96 3.52
Russell 2000 Index 666.18 152.79 19.09 41.43 16.35 1.85
International Fund(Inception 10/26/98) 205.87 94.23 -18.27 9.85 21.23 8.31
EAFE Index 73.16 120.21 -17.13 11.06 17.32 6.57
Average Annual Returns at December 31, 2012
SinceInception(1) Ten Year Five Year Three Year One Year
Partners Fund(Inception 4/8/87) 10.80% 6.26% 0.25% 10.10% 16.53%
S&P 500 Index 8.81 7.10 1.66 10.87 16.00
Small-Cap Fund(Inception 2/21/89) 10.69 11.42 5.10 15.25 22.96
Russell 2000 Index 8.91 9.72 3.56 12.25 16.35
International Fund(Inception 10/26/98) 8.20 6.86 -3.95 3.18 21.23
EAFE Index 3.95 8.21 -3.69 3.56 17.32
(1) During the inception year, the S&P 500 and the EAFE Index were available only at month-end; thereforethe S&P 500 value at 3/31/87 and the EAFE value at 10/31/98 were used to calculate performance sinceinception.
See pages 6, 12 and 18 for additional performance information.
2 ▪ Annual Report
Letter To Our Shareholders
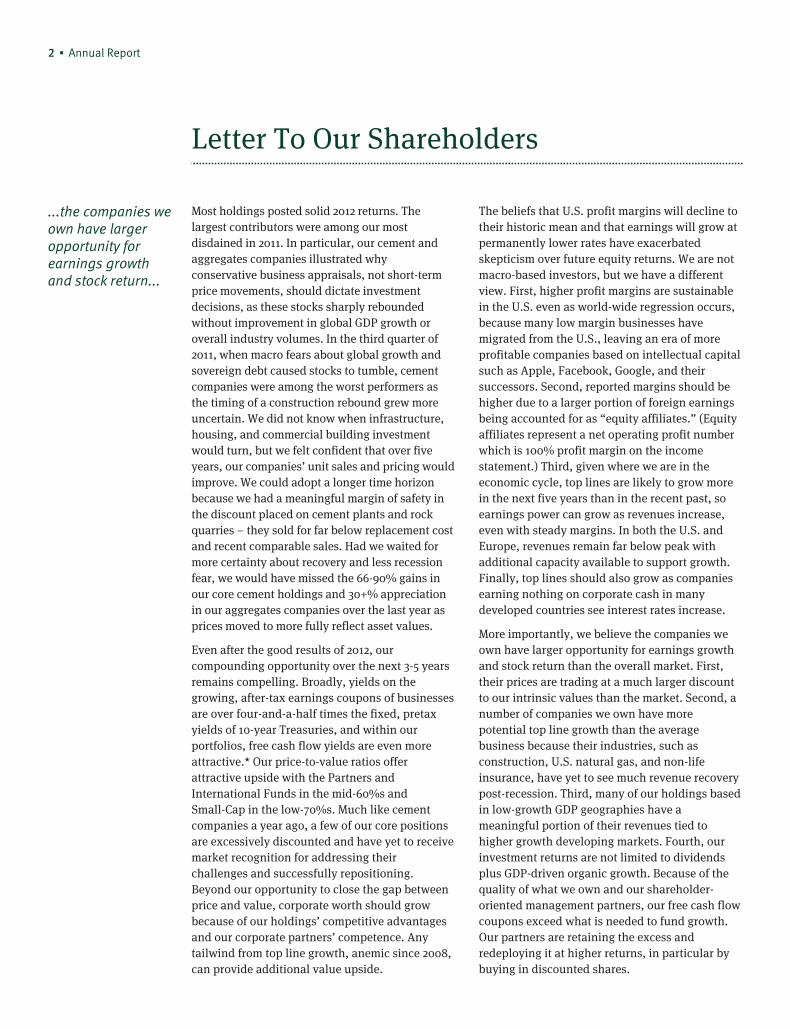
...the companies weown have largeropportunity forearnings growthand stock return...
Most holdings posted solid 2012 returns. Thelargest contributors were among our mostdisdained in 2011. In particular, our cement andaggregates companies illustrated whyconservative business appraisals, not short-termprice movements, should dictate investmentdecisions, as these stocks sharply reboundedwithout improvement in global GDP growth oroverall industry volumes. In the third quarter of2011, when macro fears about global growth andsovereign debt caused stocks to tumble, cementcompanies were among the worst performers asthe timing of a construction rebound grew moreuncertain. We did not know when infrastructure,housing, and commercial building investmentwould turn, but we felt confident that over fiveyears, our companies’ unit sales and pricing wouldimprove. We could adopt a longer time horizonbecause we had a meaningful margin of safety inthe discount placed on cement plants and rockquarries – they sold for far below replacement costand recent comparable sales. Had we waited formore certainty about recovery and less recessionfear, we would have missed the 66-90% gains inour core cement holdings and 30+% appreciationin our aggregates companies over the last year asprices moved to more fully reflect asset values.
Even after the good results of 2012, ourcompounding opportunity over the next 3-5 yearsremains compelling. Broadly, yields on thegrowing, after-tax earnings coupons of businessesare over four-and-a-half times the fixed, pretaxyields of 10-year Treasuries, and within ourportfolios, free cash flow yields are even moreattractive.* Our price-to-value ratios offerattractive upside with the Partners andInternational Funds in the mid-6o%s andSmall-Cap in the low-7o%s. Much like cementcompanies a year ago, a few of our core positionsare excessively discounted and have yet to receivemarket recognition for addressing theirchallenges and successfully repositioning.Beyond our opportunity to close the gap betweenprice and value, corporate worth should growbecause of our holdings’ competitive advantagesand our corporate partners’ competence. Anytailwind from top line growth, anemic since 2008,can provide additional value upside.
The beliefs that U.S. profit margins will decline totheir historic mean and that earnings will grow atpermanently lower rates have exacerbatedskepticism over future equity returns. We are notmacro-based investors, but we have a differentview. First, higher profit margins are sustainablein the U.S. even as world-wide regression occurs,because many low margin businesses havemigrated from the U.S., leaving an era of moreprofitable companies based on intellectual capitalsuch as Apple, Facebook, Google, and theirsuccessors. Second, reported margins should behigher due to a larger portion of foreign earningsbeing accounted for as “equity affiliates.” (Equityaffiliates represent a net operating profit numberwhich is 100% profit margin on the incomestatement.) Third, given where we are in theeconomic cycle, top lines are likely to grow morein the next five years than in the recent past, soearnings power can grow as revenues increase,even with steady margins. In both the U.S. andEurope, revenues remain far below peak withadditional capacity available to support growth.Finally, top lines should also grow as companiesearning nothing on corporate cash in manydeveloped countries see interest rates increase.
More importantly, we believe the companies weown have larger opportunity for earnings growthand stock return than the overall market. First,their prices are trading at a much larger discountto our intrinsic values than the market. Second, anumber of companies we own have morepotential top line growth than the averagebusiness because their industries, such asconstruction, U.S. natural gas, and non-lifeinsurance, have yet to see much revenue recoverypost-recession. Third, many of our holdings basedin low-growth GDP geographies have ameaningful portion of their revenues tied tohigher growth developing markets. Fourth, ourinvestment returns are not limited to dividendsplus GDP-driven organic growth. Because of thequality of what we own and our shareholder-oriented management partners, our free cash flowcoupons exceed what is needed to fund growth.Our partners are retaining the excess andredeploying it at higher returns, in particular bybuying in discounted shares.
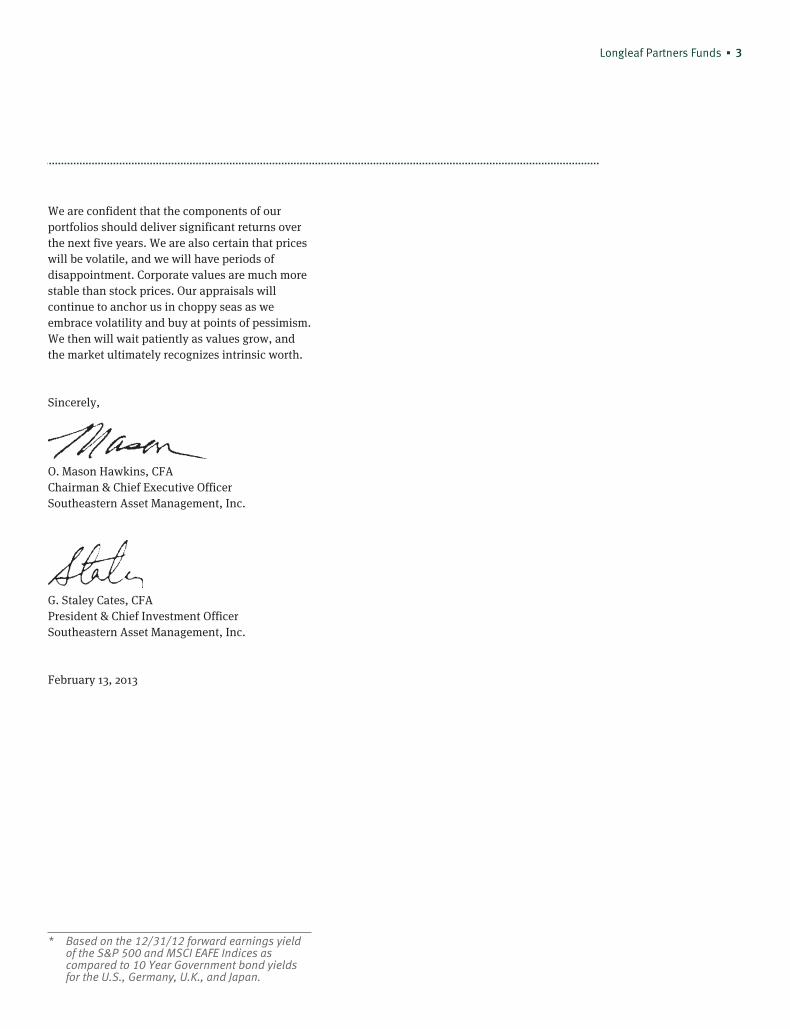
Longleaf Partners Funds ▪ 3
We are confident that the components of ourportfolios should deliver significant returns overthe next five years. We are also certain that priceswill be volatile, and we will have periods ofdisappointment. Corporate values are much morestable than stock prices. Our appraisals willcontinue to anchor us in choppy seas as weembrace volatility and buy at points of pessimism.We then will wait patiently as values grow, andthe market ultimately recognizes intrinsic worth.
Sincerely,
O. Mason Hawkins, CFAChairman & Chief Executive OfficerSoutheastern Asset Management, Inc.
G. Staley Cates, CFAPresident & Chief Investment OfficerSoutheastern Asset Management, Inc.
February 13, 2013
* Based on the 12/31/12 forward earnings yieldof the S&P 500 and MSCI EAFE Indices ascompared to 10 Year Government bond yieldsfor the U.S., Germany, U.K., and Japan.
4 ▪ Annual Report
Partners Fund Management Discussion
Longleaf Partners Fund delivered strong absolute and relative returns in the fourth quarter and
for the year. The Fund gained 3.1% over the last three months versus a loss of 0.4% for the
S&P 500. The 16.5% return in 2012 exceeded our annual inflation plus 10% goal and beat the
Index’s 16.0% rise. Since the 2008 financial crisis and recession, the Partners Fund has more
than doubled, gaining 105.0% for shareholders versus a 72.4% return for the Index.
Cumulative Returns at December 31, 2012Since Inception Four Year One Year 4Q
Partners Fund (lnception 4/8/87) 1301.23% 105.00% 16.53% 3.11%
S&P 500 779.12 72.37 16.00 -0.38
See page 6 for additional performance information.
Over the course of 2012, most holdings rose. Thelargest contributor in the fourth quarter and theyear, Cemex, a global cement company, had beenamong the largest detractors in 2011. The positionrose 79% over the course of the year. As thecombined position grew, we sold the equity andended the year with a 5% position in the converts.Cemex benefitted from both company-specificactions and broader changes. Managementsuccessfully reduced and renegotiated debt termswithout diluting shareholders, continued to cutcosts, and IPO’d part of the growing LatinAmerican business. Construction-related stocksmoved up as recession fears declined, U.S.housing strengthened, and worldwide cementand aggregates prices rose. These dynamics alsoimpacted Vulcan Materials, the U.S. aggregatescompany, which added 10% in the last quarterand 33% for the year. Management continued tocut costs and increased free cash flow evenwithout volume increases. We trimmed ourposition to 4.8% of the portfolio.
Philips Electronics, the global medical, lightingand personal care company, rose 12% in thequarter and 31% over the year. In spite ofeconomic headwinds around the world, revenues,margins, and income exceeded expectationsacross all segments. Hitting, if not surpassing,margin targets in a tough revenue environmentfor 2013 looks increasingly likely. Managementalso grew value through significant sharerepurchases of discounted shares throughout theyear. Bank of New York Mellon appreciated 14%
in the last quarter and 32% in 2012. Managementsurpassed Basel III tier 1 capital requirements andused excess cash to repurchase shares. Costsavings and strength in the asset managementbusiness helped convince investors that currentearnings are sustainable. We trimmed theposition to a 4.9% weight.
InterContinental Hotels and Disney both contributedsignificantly to 2012 results even after slight stockretreats in the fourth quarter. InterContinentalgained 45%, and we sold the stock aftermanagement completed a $500 million specialdividend and launched a $500 million repurchase.This worldwide hotel company met our buy criteriain August 2011 when macroeconomic fears drovedown the price. In the fifteen months we owned thestock, REVPAR (revenue per available room) roseacross all geographies and brands, and managementannounced a plan to sell the London trophyproperty. We made 84% over our relatively briefholding period. Disney gained 37% over the year,and we trimmed our position as the gap betweenprice and value began to close. Results at the themeparks drove much of the positive news, and ESPNgrew operating income at a solid pace. Managementused excess cash flow to buy in shares and toacquire Lucasfilm, maker of Star Wars.
Of the names that lost ground in 2012, two ofour core positions, Dell and Chesapeake,penalized results meaningfully. Dell gained 5%in the final quarter but fell 37% for the year. Wewrote at length in the third quarter report about
Partners Fund Longleaf Partners Funds ▪ 5
the End User Computing (EUC) segment’s declineas PC and notebook sales fell. Even though thehigher margin Enterprise Solutions and Services(ESS) business grew, overall top line declined asEUC was a larger percent of Dell’s revenues. Overtime these two divisions will trade places in termsof revenue importance, reaping higher marginsand stronger long-term growth for Dell. Post year-end, the stock is up significantly following anoffer to take the company private.
Chesapeake was the primary detractor in thefourth quarter, losing 10% and ending down 22%for the year. Low natural gas prices have hurt thestock and caused investors to question thecompany’s ability to cover expenses. In thesecond quarter, we participated in majorgovernance improvements, essentially replacingfive board members. Subsequently, the companyhas sold assets, reduced board and CEOcompensation, cut G&A expenses, andsubsequent to year-end, CEO Aubrey McLendonannounced his retirement. Investors remainskeptical of additional asset sales and reductionsin 2013 capex spending. We anticipate that theboard, which collectively purchased substantialshares in 2012, will continue to implementdecisions that protect and grow shareholdervalue, and that over time, supply and demand ofnatural gas will come into balance, causing pricesto more closely reflect the marginal cost ofproduction. In the interim, Chesapeake continuesto increase its liquids production and reduce theoutput from its dry gas plays.
We identified five new qualifiers (CONSOLEnergy, Berkshire Hathaway, Vivendi, RepublicServices, and Mondelez) during the year,although none in the fourth quarter. We filled outour Mondelez position over the last few months asKraft completed the spin out of these leadingglobal snack brands including Nabisco, Cadbury,and Trident. We closed out our Republic Servicesposition in the fourth quarter after we adjustedour appraisal of the second largest U.S. solidwaste company to reflect a lower volume outlook.We also sold Liberty Interactive as the stockapproached our appraisal. While the 2008recession’s impact on QVC reduced ouranticipated return in this investment, from the
November 2008 low, the holding gained over 98%as management subsequently strengthened thebalance sheet, bought in shares, and separatedLiberty Ventures to create a simplified company.Also noteworthy is the split in Abbott Labs thatoccurred at the start of 2013. To maintain ourposition size post-split, we bought “when issued”shares of the new Abbott Labs and sold shares ofAbbVie, the separated pharmaceutical company.
As we begin 2013, the portfolio trades at an attractivemid-60%s P/V, and long-term value growth shouldadd more opportunity for return. We primarily ownindustry leaders that have proven their strengththrough a challenging economic environment. Ourmanagement partners have shown their abilities tocut costs, take share, and build value in both goodand tough times. We expect that several of ourholdings will be controversial at any given point, butas managements effectively address challenges, theskepticism will subside and value will begin to berecognized. For example, over the last year, bothCemex and Level(3) eliminated their debtchallenges, and Chesapeake and Level(3) improvedtheir boards. Our long-term shareholders rememberother names that evoked controversy and eventuallypaid off. Even a successful year such as 2012 seemedmore dominated by the two most controversialnames rather than the remainder of stocks thatactually drove our good returns. As long as weanchor our decisions on conservative businessappraisals, ensure we have capable andshareholder-aligned management teams, and ownbusinesses with sustainable competitiveadvantages, we can use patience and a long timehorizon to our advantage. This has been true overour 38 years of investing, through numerous marketenvironments and challenges, and nothing indicatesthat it will change over the next forty years.
...the portfoliotrades at anattractivemid-60%s P/V...
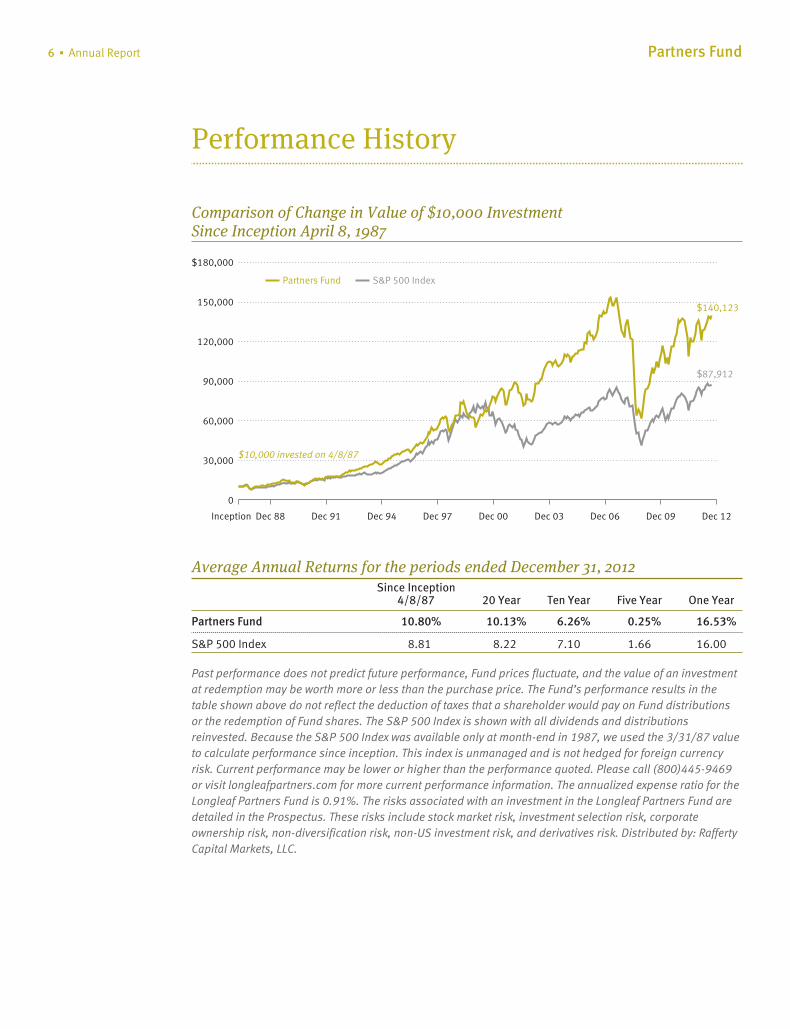
6 ▪ Annual Report Partners Fund
Performance History
Comparison of Change in Value of $10,000 InvestmentSince Inception April 8, 1987
$87,912
$10,000 invested on 4/8/87
$140,123
Inception Dec 91 Dec 94 Dec 97 Dec 00 Dec 03 Dec 06 Dec 09 Dec 12Dec 88
0
30,000
60,000
90,000
120,000
150,000
$180,000
Partners Fund S&P 500 Index
Average Annual Returns for the periods ended December 31, 2012Since Inception
4/8/87 20 Year Ten Year Five Year One Year
Partners Fund 10.80% 10.13% 6.26% 0.25% 16.53%
S&P 500 Index 8.81 8.22 7.10 1.66 16.00
Past performance does not predict future performance, Fund prices fluctuate, and the value of an investmentat redemption may be worth more or less than the purchase price. The Fund’s performance results in thetable shown above do not reflect the deduction of taxes that a shareholder would pay on Fund distributionsor the redemption of Fund shares. The S&P 500 Index is shown with all dividends and distributionsreinvested. Because the S&P 500 Index was available only at month-end in 1987, we used the 3/31/87 valueto calculate performance since inception. This index is unmanaged and is not hedged for foreign currencyrisk. Current performance may be lower or higher than the performance quoted. Please call (800)445-9469or visit longleafpartners.com for more current performance information. The annualized expense ratio for theLongleaf Partners Fund is 0.91%. The risks associated with an investment in the Longleaf Partners Fund aredetailed in the Prospectus. These risks include stock market risk, investment selection risk, corporateownership risk, non-diversification risk, non-US investment risk, and derivatives risk. Distributed by: RaffertyCapital Markets, LLC.
Partners Fund Longleaf Partners Funds ▪ 7
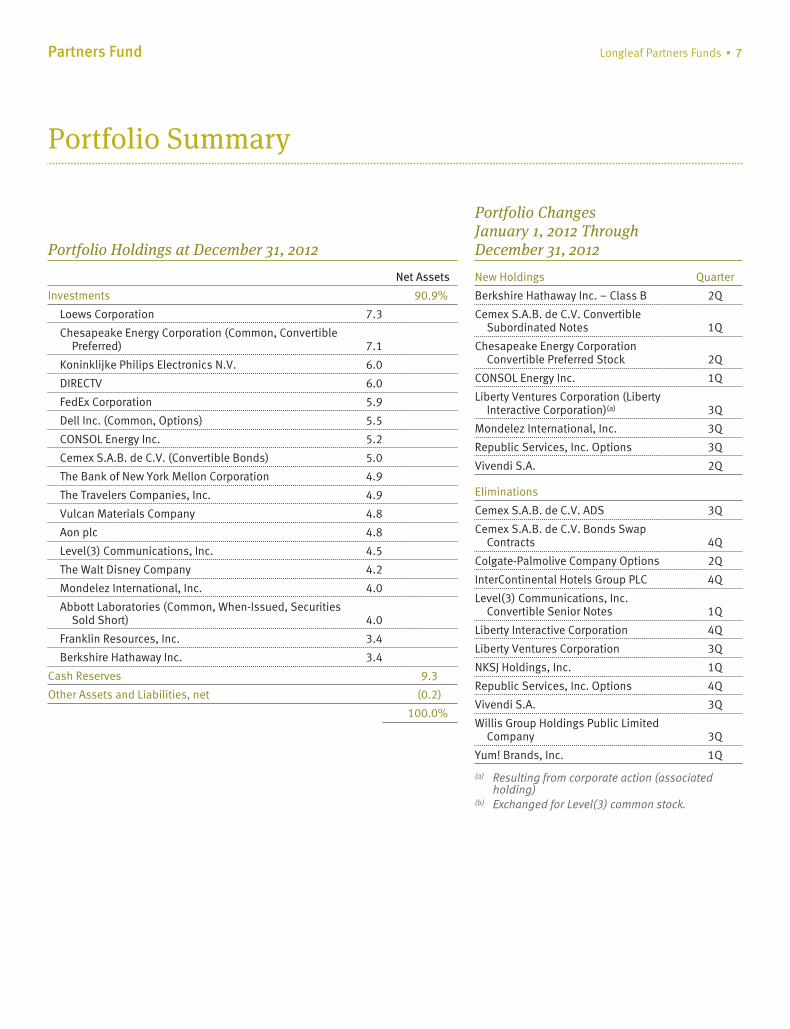
Portfolio Summary
Portfolio Holdings at December 31, 2012
Net Assets
Investments 90.9%
Loews Corporation 7.3
Chesapeake Energy Corporation (Common, ConvertiblePreferred) 7.1
Koninklijke Philips Electronics N.V. 6.0
DIRECTV 6.0
FedEx Corporation 5.9
Dell Inc. (Common, Options) 5.5
CONSOL Energy Inc. 5.2
Cemex S.A.B. de C.V. (Convertible Bonds) 5.0
The Bank of New York Mellon Corporation 4.9
The Travelers Companies, Inc. 4.9
Vulcan Materials Company 4.8
Aon plc 4.8
Level(3) Communications, Inc. 4.5
The Walt Disney Company 4.2
Mondelez International, Inc. 4.0
Abbott Laboratories (Common, When-Issued, SecuritiesSold Short) 4.0
Franklin Resources, Inc. 3.4
Berkshire Hathaway Inc. 3.4
Cash Reserves 9.3
Other Assets and Liabilities, net (0.2)
100.0%
Portfolio ChangesJanuary 1, 2012 ThroughDecember 31, 2012
New Holdings Quarter
Berkshire Hathaway Inc. – Class B 2Q
Cemex S.A.B. de C.V. ConvertibleSubordinated Notes 1Q
Chesapeake Energy CorporationConvertible Preferred Stock 2Q
CONSOL Energy Inc. 1Q
Liberty Ventures Corporation (LibertyInteractive Corporation)(a) 3Q
Mondelez International, Inc. 3Q
Republic Services, Inc. Options 3Q
Vivendi S.A. 2Q
Eliminations
Cemex S.A.B. de C.V. ADS 3Q
Cemex S.A.B. de C.V. Bonds SwapContracts 4Q
Colgate-Palmolive Company Options 2Q
InterContinental Hotels Group PLC 4Q
Level(3) Communications, Inc.Convertible Senior Notes 1Q
Liberty Interactive Corporation 4Q
Liberty Ventures Corporation 3Q
NKSJ Holdings, Inc. 1Q
Republic Services, Inc. Options 4Q
Vivendi S.A. 3Q
Willis Group Holdings Public LimitedCompany 3Q
Yum! Brands, Inc. 1Q
(a) Resulting from corporate action (associatedholding)
(b) Exchanged for Level(3) common stock.
8 ▪ Annual Report Partners Fund
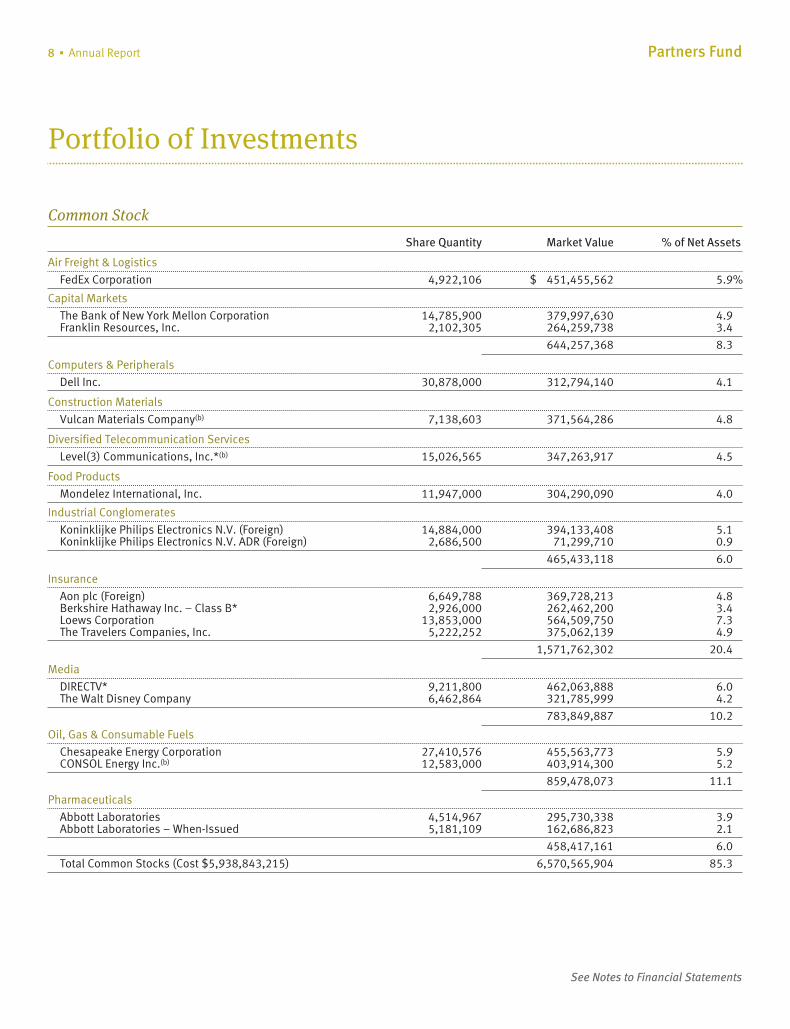
Portfolio 0f Investments
Common Stock
Share Quantity Market Value % of Net Assets
Air Freight & Logistics
FedEx Corporation 4,922,106 $ 451,455,562 5.9%
Capital Markets
The Bank of New York Mellon Corporation 14,785,900 379,997,630 4.9Franklin Resources, Inc. 2,102,305 264,259,738 3.4
644,257,368 8.3
Computers & Peripherals
Dell Inc. 30,878,000 312,794,140 4.1
Construction Materials
Vulcan Materials Company(b) 7,138,603 371,564,286 4.8
Diversified Telecommunication Services
Level(3) Communications, Inc.*(b) 15,026,565 347,263,917 4.5
Food Products
Mondelez International, Inc. 11,947,000 304,290,090 4.0
Industrial Conglomerates
Koninklijke Philips Electronics N.V. (Foreign) 14,884,000 394,133,408 5.1Koninklijke Philips Electronics N.V. ADR (Foreign) 2,686,500 71,299,710 0.9
465,433,118 6.0
Insurance
Aon plc (Foreign) 6,649,788 369,728,213 4.8Berkshire Hathaway Inc. – Class B* 2,926,000 262,462,200 3.4Loews Corporation 13,853,000 564,509,750 7.3The Travelers Companies, Inc. 5,222,252 375,062,139 4.9
1,571,762,302 20.4
Media
DIRECTV* 9,211,800 462,063,888 6.0The Walt Disney Company 6,462,864 321,785,999 4.2
783,849,887 10.2
Oil, Gas & Consumable Fuels
Chesapeake Energy Corporation 27,410,576 455,563,773 5.9CONSOL Energy Inc.(b) 12,583,000 403,914,300 5.2
859,478,073 11.1
Pharmaceuticals
Abbott Laboratories 4,514,967 295,730,338 3.9Abbott Laboratories – When-Issued 5,181,109 162,686,823 2.1
458,417,161 6.0
Total Common Stocks (Cost $5,938,843,215) 6,570,565,904 85.3
See Notes to Financial Statements
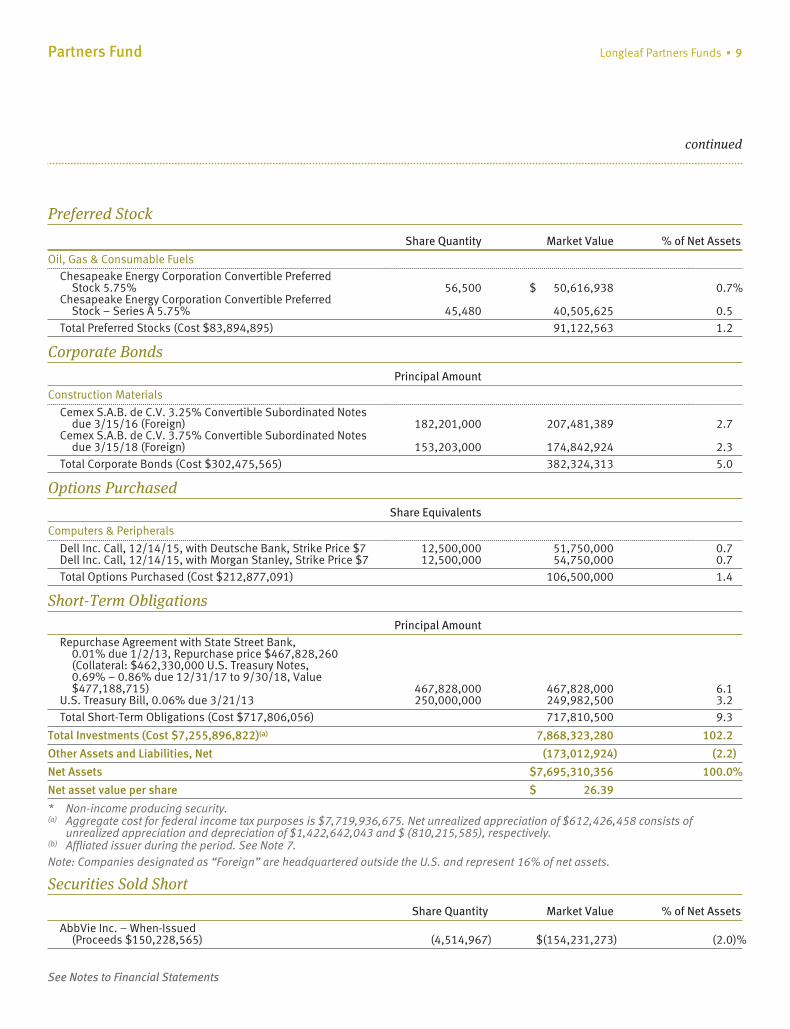
Partners Fund Longleaf Partners Funds ▪ 9
continued
Preferred Stock
Share Quantity Market Value % of Net Assets
Oil, Gas & Consumable FuelsChesapeake Energy Corporation Convertible Preferred
Stock 5.75% 56,500 $ 50,616,938 0.7%Chesapeake Energy Corporation Convertible Preferred
Stock – Series A 5.75% 45,480 40,505,625 0.5Total Preferred Stocks (Cost $83,894,895) 91,122,563 1.2
Corporate Bonds
Principal Amount
Construction Materials
Cemex S.A.B. de C.V. 3.25% Convertible Subordinated Notesdue 3/15/16 (Foreign) 182,201,000 207,481,389 2.7
Cemex S.A.B. de C.V. 3.75% Convertible Subordinated Notesdue 3/15/18 (Foreign) 153,203,000 174,842,924 2.3
Total Corporate Bonds (Cost $302,475,565) 382,324,313 5.0
Options Purchased
Share Equivalents
Computers & Peripherals
Dell Inc. Call, 12/14/15, with Deutsche Bank, Strike Price $7 12,500,000 51,750,000 0.7Dell Inc. Call, 12/14/15, with Morgan Stanley, Strike Price $7 12,500,000 54,750,000 0.7Total Options Purchased (Cost $212,877,091) 106,500,000 1.4
Short-Term Obligations
Principal AmountRepurchase Agreement with State Street Bank,
0.01% due 1/2/13, Repurchase price $467,828,260(Collateral: $462,330,000 U.S. Treasury Notes,0.69% – 0.86% due 12/31/17 to 9/30/18, Value$477,188,715) 467,828,000 467,828,000 6.1
U.S. Treasury Bill, 0.06% due 3/21/13 250,000,000 249,982,500 3.2Total Short-Term Obligations (Cost $717,806,056) 717,810,500 9.3
Total Investments (Cost $7,255,896,822)(a) 7,868,323,280 102.2
Other Assets and Liabilities, Net (173,012,924) (2.2)
Net Assets $7,695,310,356 100.0%
Net asset value per share $ 26.39
* Non-income producing security.(a) Aggregate cost for federal income tax purposes is $7,719,936,675. Net unrealized appreciation of $612,426,458 consists of
unrealized appreciation and depreciation of $1,422,642,043 and $ (810,215,585), respectively.(b) Affliated issuer during the period. See Note 7.Note: Companies designated as “Foreign” are headquartered outside the U.S. and represent 16% of net assets.
Securities Sold Short
Share Quantity Market Value % of Net AssetsAbbVie Inc. – When-Issued
(Proceeds $150,228,565) (4,514,967) $(154,231,273) (2.0)%
See Notes to Financial Statements
10 ▪ Annual Report
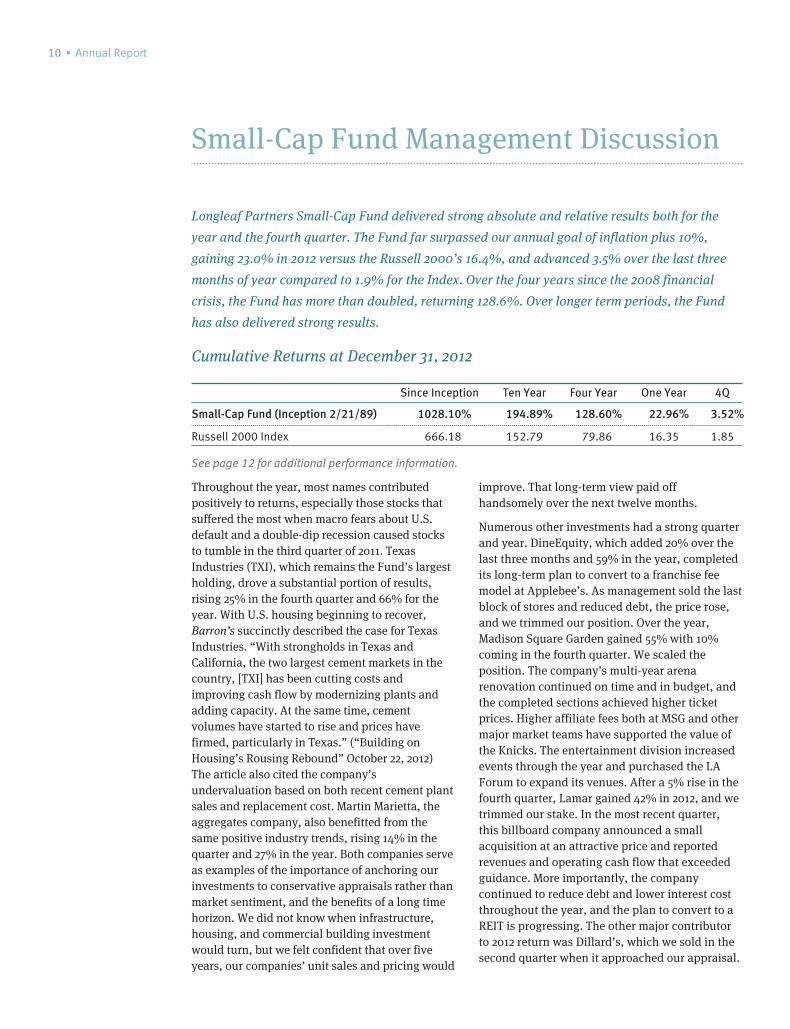
Small-Cap Fund Management Discussion
Longleaf Partners Small-Cap Fund delivered strong absolute and relative results both for the
year and the fourth quarter. The Fund far surpassed our annual goal of inflation plus 10%,
gaining 23.0% in 2012 versus the Russell 2000’s 16.4%, and advanced 3.5% over the last three
months of year compared to 1.9% for the Index. Over the four years since the 2008 financial
crisis, the Fund has more than doubled, returning 128.6%. Over longer term periods, the Fund
has also delivered strong results.
Cumulative Returns at December 31, 2012
Since Inception Ten Year Four Year One Year 4Q
Small-Cap Fund (Inception 2/21/89) 1028.10% 194.89% 128.60% 22.96% 3.52%
Russell 2000 Index 666.18 152.79 79.86 16.35 1.85
See page 12 for additional performance information.
Throughout the year, most names contributedpositively to returns, especially those stocks thatsuffered the most when macro fears about U.S.default and a double-dip recession caused stocksto tumble in the third quarter of 2011. TexasIndustries (TXI), which remains the Fund’s largestholding, drove a substantial portion of results,rising 25% in the fourth quarter and 66% for theyear. With U.S. housing beginning to recover,Barron’s succinctly described the case for TexasIndustries. “With strongholds in Texas andCalifornia, the two largest cement markets in thecountry, [TXI] has been cutting costs andimproving cash flow by modernizing plants andadding capacity. At the same time, cementvolumes have started to rise and prices havefirmed, particularly in Texas.” (“Building onHousing’s Rousing Rebound” October 22, 2012)The article also cited the company’sundervaluation based on both recent cement plantsales and replacement cost. Martin Marietta, theaggregates company, also benefitted from thesame positive industry trends, rising 14% in thequarter and 27% in the year. Both companies serveas examples of the importance of anchoring ourinvestments to conservative appraisals rather thanmarket sentiment, and the benefits of a long timehorizon. We did not know when infrastructure,housing, and commercial building investmentwould turn, but we felt confident that over fiveyears, our companies’ unit sales and pricing would
improve. That long-term view paid offhandsomely over the next twelve months.
Numerous other investments had a strong quarterand year. DineEquity, which added 20% over thelast three months and 59% in the year, completedits long-term plan to convert to a franchise feemodel at Applebee’s. As management sold the lastblock of stores and reduced debt, the price rose,and we trimmed our position. Over the year,Madison Square Garden gained 55% with 10%coming in the fourth quarter. We scaled theposition. The company’s multi-year arenarenovation continued on time and in budget, andthe completed sections achieved higher ticketprices. Higher affiliate fees both at MSG and othermajor market teams have supported the value ofthe Knicks. The entertainment division increasedevents through the year and purchased the LAForum to expand its venues. After a 5% rise in thefourth quarter, Lamar gained 42% in 2012, and wetrimmed our stake. In the most recent quarter,this billboard company announced a smallacquisition at an attractive price and reportedrevenues and operating cash flow that exceededguidance. More importantly, the companycontinued to reduce debt and lower interest costthroughout the year, and the plan to convert to aREIT is progressing. The other major contributorto 2012 return was Dillard’s, which we sold in thesecond quarter when it approached our appraisal.
Small-Cap Fund Longleaf Partners Funds ▪ 11
Of the names that declined in the portfolio duringthe quarter or year, only Quicksilver had ameaningful impact, losing 27% over the last threemonths and 53% in 2012. Low natural gas priceshampered this oil and gas exploration andproduction company’s plan to raise capitalthrough joint ventures in its Horn River, Barnett,and west Texas assets and through an MLPlisting. Production declined in the fourth quarter.CEO Glenn Darden is an owner-operator who isfocused on building value for his shareholderpartners in spite of a challenging environment.
We bought three new names during the year:Leucadia, Tribune via its debt, and Legg Mason inthe fourth quarter. Legg Mason has multiplestrong brands including small cap specialistRoyce and bond manager Western Asset, forwhich we paid less than ten times adjusted freecash flow. We began purchasing the stock whenthe CEO stepped down, knowing that the searchfor a replacement is being led by largeshareholder Trian Partners, and the new leadershould be able to meaningfully raise marginscloser to industry average. Over the last threemonths we added to several positions, includingSaks (via equity and convertible bonds), Wendy’s,Everest Re, and Fairfax. Earlier in the year we soldDillard’s, Olympus, and Markel, and in the fourthquarter, we eliminated Leucadia after a briefholding period. The company merged with JeffriesGroup, increasing the importance of investmentbanking to its value and reducing the influence ofthe management team with whom we originallypartnered. In addition to previously mentionedtrims of the Fund’s strongest performers, we alsoscaled our positions in Service Corp, tw telecom,and Potlatch.
The Fund’s strong 2012 performance combinedwith shaving some of our positions left the P/V inthe low-70%s and cash at 10.5%. We believe thatthe companies we own will continue to grow theirvalues through both solid operations and astutecapital allocation. We have ample liquidity to buyseveral new qualifying opportunities when wefind them to further enhance our return upside.We will continue to be patient and follow ourproven discipline that has guided us for almostfour decades.
We believe that thecompanies we ownwill continue togrow their values...
12 ▪ Annual Report Small-Cap Fund
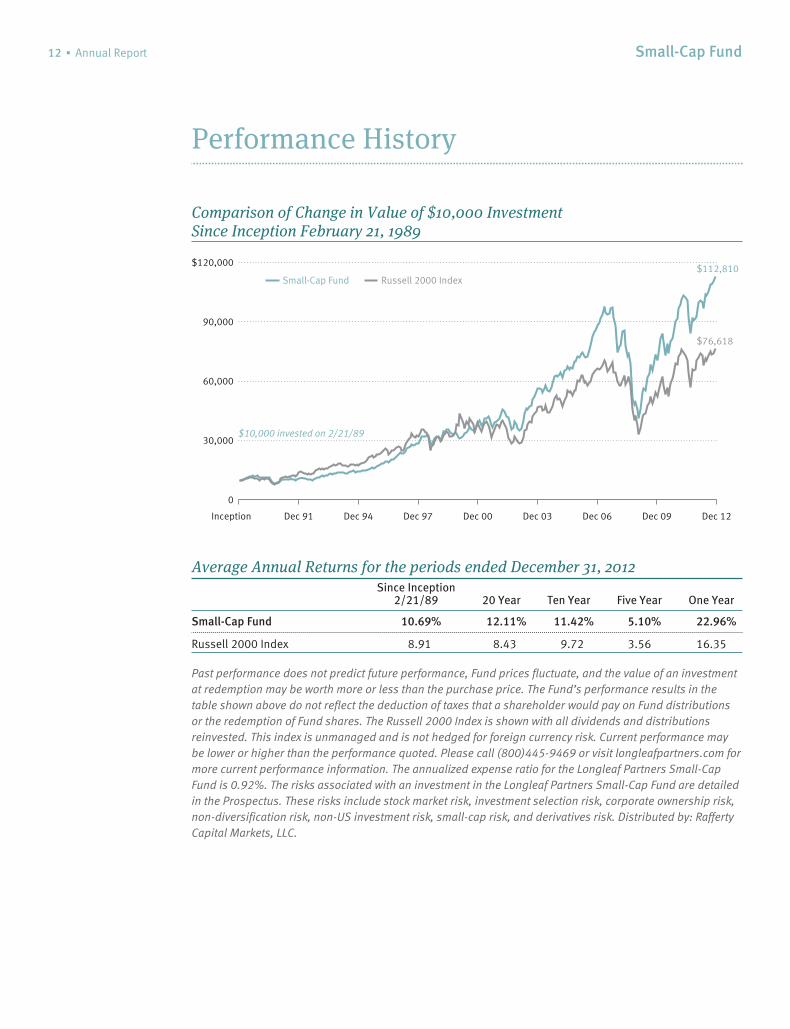
Performance History
Comparison of Change in Value of $10,000 InvestmentSince Inception February 21, 1989
$76,618
$10,000 invested on 2/21/89
$112,810
Inception Dec 91 Dec 94 Dec 97 Dec 00 Dec 03 Dec 06 Dec 09 Dec 12
0
30,000
60,000
90,000
$120,000
Small-Cap Fund Russell 2000 Index
Average Annual Returns for the periods ended December 31, 2012Since Inception
2/21/89 20 Year Ten Year Five Year One Year
Small-Cap Fund 10.69% 12.11% 11.42% 5.10% 22.96%
Russell 2000 Index 8.91 8.43 9.72 3.56 16.35
Past performance does not predict future performance, Fund prices fluctuate, and the value of an investmentat redemption may be worth more or less than the purchase price. The Fund’s performance results in thetable shown above do not reflect the deduction of taxes that a shareholder would pay on Fund distributionsor the redemption of Fund shares. The Russell 2000 Index is shown with all dividends and distributionsreinvested. This index is unmanaged and is not hedged for foreign currency risk. Current performance maybe lower or higher than the performance quoted. Please call (800)445-9469 or visit longleafpartners.com formore current performance information. The annualized expense ratio for the Longleaf Partners Small-CapFund is 0.92%. The risks associated with an investment in the Longleaf Partners Small-Cap Fund are detailedin the Prospectus. These risks include stock market risk, investment selection risk, corporate ownership risk,non-diversification risk, non-US investment risk, small-cap risk, and derivatives risk. Distributed by: RaffertyCapital Markets, LLC.
Small-Cap Fund Longleaf Partners Funds ▪ 13
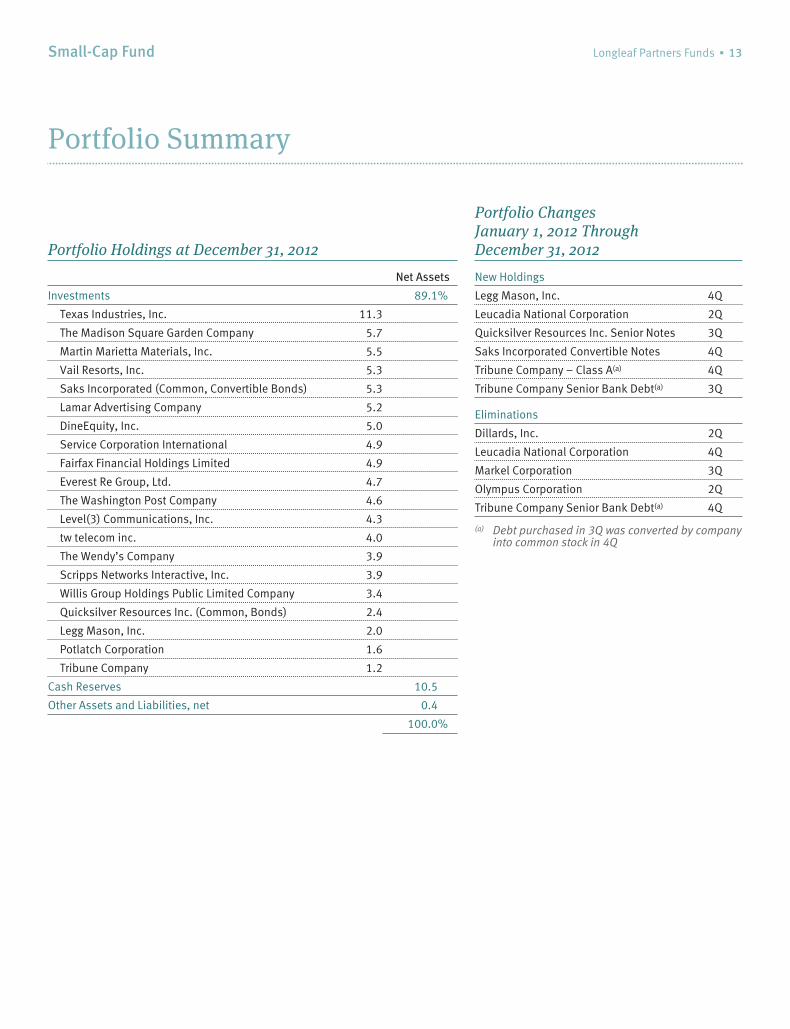
Portfolio Summary
Portfolio Holdings at December 31, 2012
Net Assets
Investments 89.1%
Texas Industries, Inc. 11.3
The Madison Square Garden Company 5.7
Martin Marietta Materials, Inc. 5.5
Vail Resorts, Inc. 5.3
Saks Incorporated (Common, Convertible Bonds) 5.3
Lamar Advertising Company 5.2
DineEquity, Inc. 5.0
Service Corporation International 4.9
Fairfax Financial Holdings Limited 4.9
Everest Re Group, Ltd. 4.7
The Washington Post Company 4.6
Level(3) Communications, Inc. 4.3
tw telecom inc. 4.0
The Wendy’s Company 3.9
Scripps Networks Interactive, Inc. 3.9
Willis Group Holdings Public Limited Company 3.4
Quicksilver Resources Inc. (Common, Bonds) 2.4
Legg Mason, Inc. 2.0
Potlatch Corporation 1.6
Tribune Company 1.2
Cash Reserves 10.5
Other Assets and Liabilities, net 0.4
100.0%
Portfolio ChangesJanuary 1, 2012 ThroughDecember 31, 2012
New Holdings
Legg Mason, Inc. 4Q
Leucadia National Corporation 2Q
Quicksilver Resources Inc. Senior Notes 3Q
Saks Incorporated Convertible Notes 4Q
Tribune Company – Class A(a) 4Q
Tribune Company Senior Bank Debt(a) 3Q
Eliminations
Dillards, Inc. 2Q
Leucadia National Corporation 4Q
Markel Corporation 3Q
Olympus Corporation 2Q
Tribune Company Senior Bank Debt(a) 4Q
(a) Debt purchased in 3Q was converted by companyinto common stock in 4Q
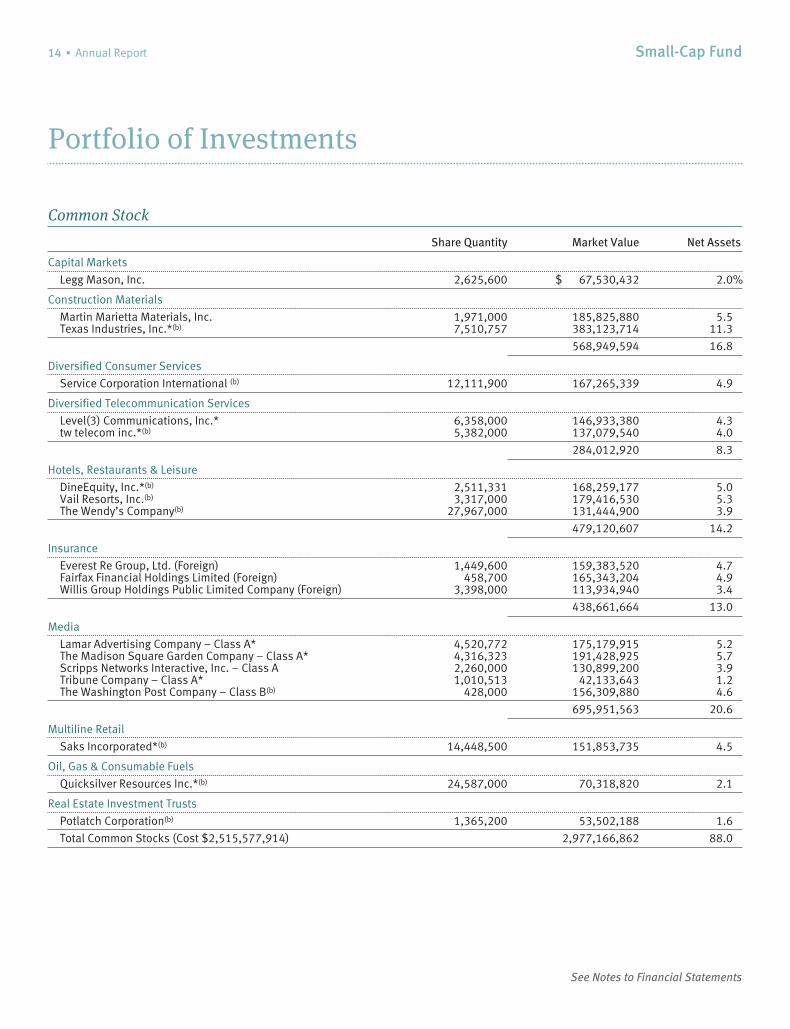
14 ▪ Annual Report Small-Cap Fund
Portfolio of Investments
Common Stock
Share Quantity Market Value Net Assets
Capital Markets
Legg Mason, Inc. 2,625,600 $ 67,530,432 2.0%
Construction Materials
Martin Marietta Materials, Inc. 1,971,000 185,825,880 5.5Texas Industries, Inc.*(b) 7,510,757 383,123,714 11.3
568,949,594 16.8
Diversified Consumer Services
Service Corporation International (b) 12,111,900 167,265,339 4.9
Diversified Telecommunication Services
Level(3) Communications, Inc.* 6,358,000 146,933,380 4.3tw telecom inc.*(b) 5,382,000 137,079,540 4.0
284,012,920 8.3
Hotels, Restaurants & Leisure
DineEquity, Inc.*(b) 2,511,331 168,259,177 5.0Vail Resorts, Inc.(b) 3,317,000 179,416,530 5.3The Wendy’s Company(b) 27,967,000 131,444,900 3.9
479,120,607 14.2
Insurance
Everest Re Group, Ltd. (Foreign) 1,449,600 159,383,520 4.7Fairfax Financial Holdings Limited (Foreign) 458,700 165,343,204 4.9Willis Group Holdings Public Limited Company (Foreign) 3,398,000 113,934,940 3.4
438,661,664 13.0
Media
Lamar Advertising Company – Class A* 4,520,772 175,179,915 5.2The Madison Square Garden Company – Class A* 4,316,323 191,428,925 5.7Scripps Networks Interactive, Inc. – Class A 2,260,000 130,899,200 3.9Tribune Company – Class A* 1,010,513 42,133,643 1.2The Washington Post Company – Class B(b) 428,000 156,309,880 4.6
695,951,563 20.6
Multiline Retail
Saks Incorporated*(b) 14,448,500 151,853,735 4.5
Oil, Gas & Consumable Fuels
Quicksilver Resources Inc.*(b) 24,587,000 70,318,820 2.1
Real Estate Investment Trusts
Potlatch Corporation(b) 1,365,200 53,502,188 1.6
Total Common Stocks (Cost $2,515,577,914) 2,977,166,862 88.0
See Notes to Financial Statements
Small-Cap Fund Longleaf Partners Funds ▪ 15
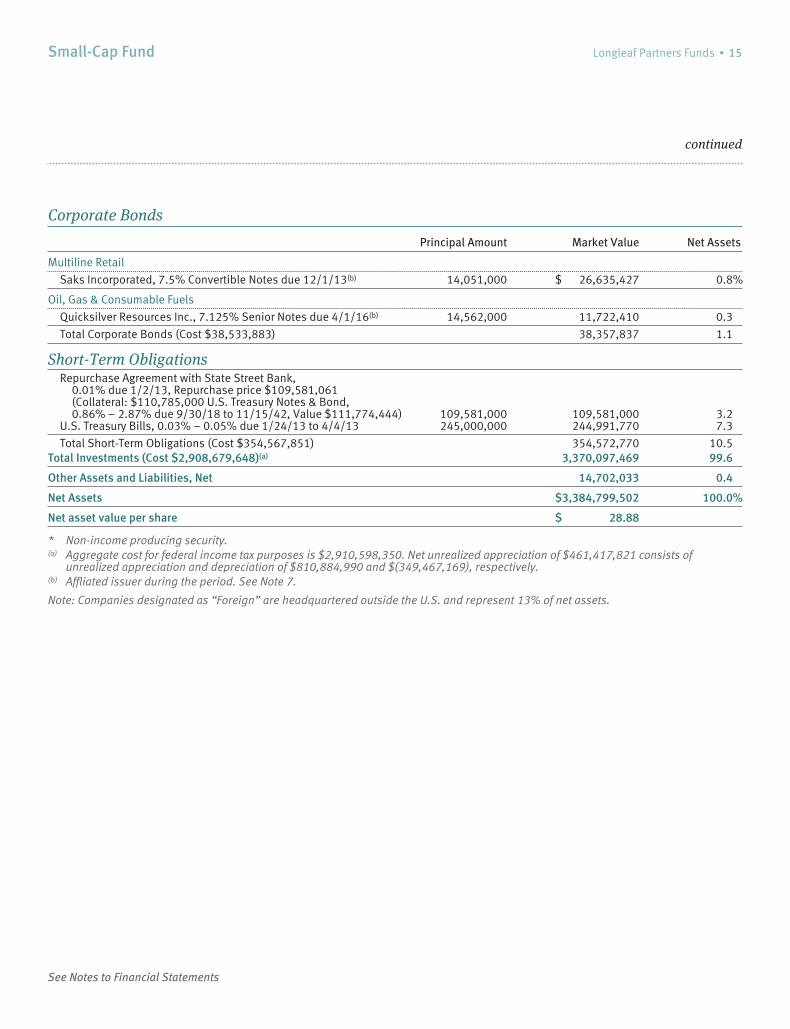
continued
Corporate Bonds
Principal Amount Market Value Net Assets
Multiline Retail
Saks Incorporated, 7.5% Convertible Notes due 12/1/13(b) 14,051,000 $ 26,635,427 0.8%
Oil, Gas & Consumable Fuels
Quicksilver Resources Inc., 7.125% Senior Notes due 4/1/16(b) 14,562,000 11,722,410 0.3
Total Corporate Bonds (Cost $38,533,883) 38,357,837 1.1
Short-Term ObligationsRepurchase Agreement with State Street Bank,
0.01% due 1/2/13, Repurchase price $109,581,061(Collateral: $110,785,000 U.S. Treasury Notes & Bond,0.86% – 2.87% due 9/30/18 to 11/15/42, Value $111,774,444) 109,581,000 109,581,000 3.2
U.S. Treasury Bills, 0.03% – 0.05% due 1/24/13 to 4/4/13 245,000,000 244,991,770 7.3
Total Short-Term Obligations (Cost $354,567,851) 354,572,770 10.5Total Investments (Cost $2,908,679,648)(a) 3,370,097,469 99.6
Other Assets and Liabilities, Net 14,702,033 0.4
Net Assets $3,384,799,502 100.0%
Net asset value per share $ 28.88
* Non-income producing security.(a) Aggregate cost for federal income tax purposes is $2,910,598,350. Net unrealized appreciation of $461,417,821 consists of
unrealized appreciation and depreciation of $810,884,990 and $(349,467,169), respectively.(b) Affliated issuer during the period. See Note 7.
Note: Companies designated as “Foreign” are headquartered outside the U.S. and represent 13% of net assets.
See Notes to Financial Statements
16 ▪ Annual Report
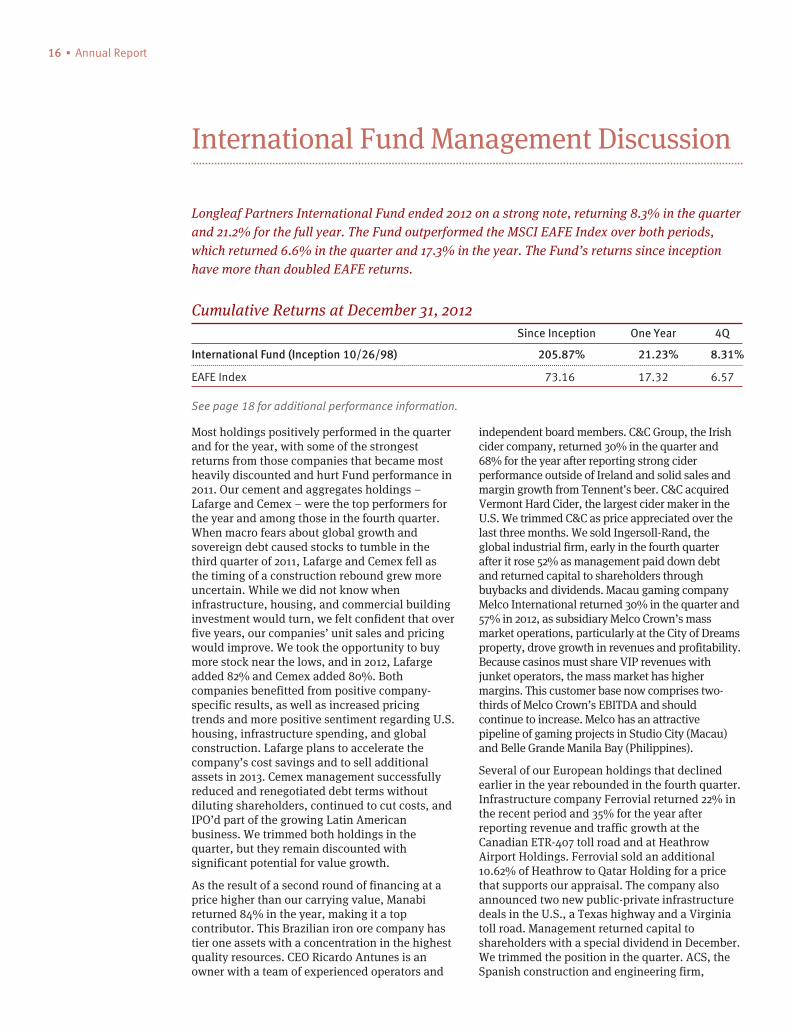
International Fund Management Discussion
Longleaf Partners International Fund ended 2012 on a strong note, returning 8.3% in the quarterand 21.2% for the full year. The Fund outperformed the MSCI EAFE Index over both periods,which returned 6.6% in the quarter and 17.3% in the year. The Fund’s returns since inceptionhave more than doubled EAFE returns.
Cumulative Returns at December 31, 2012Since Inception One Year 4Q
International Fund (Inception 10/26/98) 205.87% 21.23% 8.31%
EAFE Index 73.16 17.32 6.57
See page 18 for additional performance information.
Most holdings positively performed in the quarterand for the year, with some of the strongestreturns from those companies that became mostheavily discounted and hurt Fund performance in2011. Our cement and aggregates holdings –Lafarge and Cemex – were the top performers forthe year and among those in the fourth quarter.When macro fears about global growth andsovereign debt caused stocks to tumble in thethird quarter of 2011, Lafarge and Cemex fell asthe timing of a construction rebound grew moreuncertain. While we did not know wheninfrastructure, housing, and commercial buildinginvestment would turn, we felt confident that overfive years, our companies’ unit sales and pricingwould improve. We took the opportunity to buymore stock near the lows, and in 2012, Lafargeadded 82% and Cemex added 80%. Bothcompanies benefitted from positive company-specific results, as well as increased pricingtrends and more positive sentiment regarding U.S.housing, infrastructure spending, and globalconstruction. Lafarge plans to accelerate thecompany’s cost savings and to sell additionalassets in 2013. Cemex management successfullyreduced and renegotiated debt terms withoutdiluting shareholders, continued to cut costs, andIPO’d part of the growing Latin Americanbusiness. We trimmed both holdings in thequarter, but they remain discounted withsignificant potential for value growth.
As the result of a second round of financing at aprice higher than our carrying value, Manabireturned 84% in the year, making it a topcontributor. This Brazilian iron ore company hastier one assets with a concentration in the highestquality resources. CEO Ricardo Antunes is anowner with a team of experienced operators and
independent board members. C&C Group, the Irishcider company, returned 30% in the quarter and68% for the year after reporting strong ciderperformance outside of Ireland and solid sales andmargin growth from Tennent’s beer. C&C acquiredVermont Hard Cider, the largest cider maker in theU.S. We trimmed C&C as price appreciated over thelast three months. We sold Ingersoll-Rand, theglobal industrial firm, early in the fourth quarterafter it rose 52% as management paid down debtand returned capital to shareholders throughbuybacks and dividends. Macau gaming companyMelco International returned 30% in the quarter and57% in 2012, as subsidiary Melco Crown’s massmarket operations, particularly at the City of Dreamsproperty, drove growth in revenues and profitability.Because casinos must share VIP revenues withjunket operators, the mass market has highermargins. This customer base now comprises two-thirds of Melco Crown’s EBITDA and shouldcontinue to increase. Melco has an attractivepipeline of gaming projects in Studio City (Macau)and Belle Grande Manila Bay (Philippines).
Several of our European holdings that declinedearlier in the year rebounded in the fourth quarter.Infrastructure company Ferrovial returned 22% inthe recent period and 35% for the year afterreporting revenue and traffic growth at theCanadian ETR-407 toll road and at HeathrowAirport Holdings. Ferrovial sold an additional10.62% of Heathrow to Qatar Holding for a pricethat supports our appraisal. The company alsoannounced two new public-private infrastructuredeals in the U.S., a Texas highway and a Virginiatoll road. Management returned capital toshareholders with a special dividend in December.We trimmed the position in the quarter. ACS, theSpanish construction and engineering firm,
International Fund Longleaf Partners Funds ▪ 17
rebounded 22% in the quarter following positivedevelopments at Hochtief, the Germanconstruction company in which ACS holds justover 50%. Hochtief reported solid results andannounced the promotion to CEO of COOMarcelino Fernandez, former CEO of ACS’sDragados construction arm. Hochtief benefitted aspublic holding Leighton completed itsunprofitable Victorian desalination project, easingfears of further cost overruns. Leighton also soldits waste management business and is auctioningits telecom business. After adding to ACS near itslow in the first half, we trimmed the position in thefourth quarter following its rebound.
While most holdings rose in 2012, a fewcompanies detracted from performance in spite offourth quarter gains. Our Dell options added 2%in the final quarter but fell 53% for the year. Wewrote at length in the third quarter report aboutthe End User Computing (EUC) segment’s declineas PC and notebook sales fell. Even though thehigher margin Enterprise Solutions and Services(ESS) business grew, overall top line declined asEUC was a larger percent of Dell’s revenues. Overtime these two divisions will trade places in termsof revenue importance, reaping higher marginsand stronger long-term growth for Dell. Post year-end, the stock is up significantly following anoffer to take the company private. Brazilian-basedoil and gas exploration and production companyHRT returned 5% in the fourth quarter, butremained a top detractor for the year afterdeclining 62%. Positive developments in thesecond half included a letter of intent withPetrobras to monetize Solimoes Basin gas, a farmin deal for 14% of Namibian assets, and theappointment of a majority of new independentboard members. This progress, however, was notenough to overcome the dearth of oil discoveries.
During the fourth quarter several names detractedfrom the Fund’s strong results. Japanese homefurniture and fashion company Nitori declined21% in the quarter and for the year after reportingdisappointing same store sales. The homefurnishings industry in Japan experienced similarsales declines on the back of unusually hotweather and depressed housing starts. Nitori’ssame store sales rebounded late in the quarter,and management reiterated its operating incomeforecast for the 2013 fiscal year.
In a year of strong performance, we sold sevenholdings and trimmed an additional twelve. Webought six new positions, three in the most recentquarter, and added to six existing names in 2012.Exor, the Agnelli family holding company led byChairman and CEO John Elkann, owns publicstakes in competitively positioned businesses,including Fiat Industrial, Fiat Auto, and SGS.Management has opportunistically bought inshares at a discount and is focused on drivingvalue creation at Exor’s underlying businesses.Elkann sits on the boards of Fiat Auto and FiatIndustrial and appointed Sergio Marchionne tooversee the restructuring of these two businesses.We also bought Fiat Industrial, a global leader inagriculture machinery and commercial truckmanufacturing. Over 60% of profits come fromNorth and South America through its 88% stakein agricultural equipment business CNH Global.CNH has a comprehensive product offering with astrong distribution network in an oligopolisticindustry with pricing power. Fiat Industrial is inthe process of merging with the remainder of CNHGlobal and plans to list the company on the NYSEand move from Italy to the Netherlands to lowerits cost of capital and reduce taxes. After weinitiated our position in Fiat Industrial, CNHbecame a cheaper entry point to purchase thesame assets. We bought a 1% position in CNH,which we view as a single position with FiatIndustrial. We also initiated a partial position inNidec, a leader in brushless motor technologythat is more energy efficient, quieter, and smallerthan conventional motors. This Japanesecompany serves the commercial, industrial, andauto space, and has over 70% market share inglobal brushless spindle motors for hard diskdrives. We are partnering with the founder andlargest shareholder, CEO Nagamori, who has atrack record of building shareholder value.
Even after the gains in 2012, the portfolio trades at aprice-to-value ratio in the mid-60%s, offeringattractive upside. Although we do not know whenvalues will be recognized, we believe that – like atCemex and Lafarge in 2011 – we own undervaluedstrong market leaders, with many in depressedindustries positioned for recovery, and we expect tosee continued value growth across our companies.Thank you for your continued partnership.
...we ownundervalued strongmarket leaders, withmany in depressedindustriespositioned forrecovery...
18 ▪ Annual Report International Fund
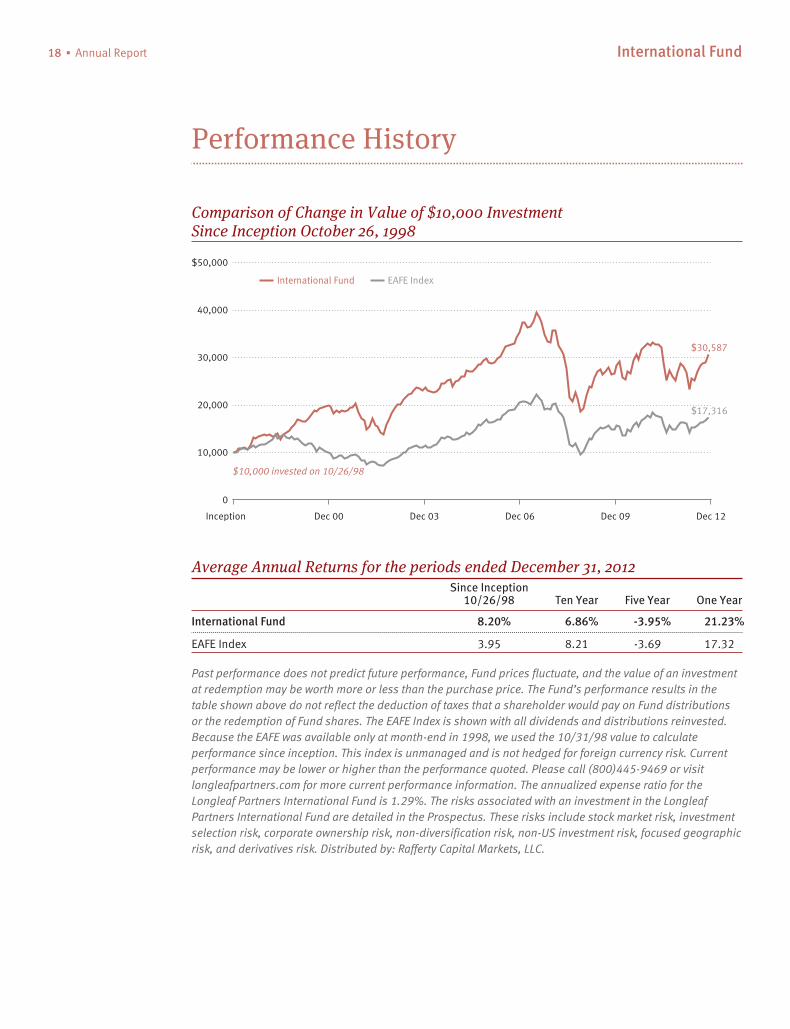
Performance History
Comparison of Change in Value of $10,000 InvestmentSince Inception October 26, 1998
$17,316
$10,000 invested on 10/26/98
$30,587
Inception Dec 00 Dec 03 Dec 06 Dec 09 Dec 12
0
10,000
20,000
30,000
$50,000
40,000
International Fund EAFE Index
Average Annual Returns for the periods ended December 31, 2012Since Inception
10/26/98 Ten Year Five Year One Year
International Fund 8.20% 6.86% -3.95% 21.23%
EAFE Index 3.95 8.21 -3.69 17.32
Past performance does not predict future performance, Fund prices fluctuate, and the value of an investmentat redemption may be worth more or less than the purchase price. The Fund’s performance results in thetable shown above do not reflect the deduction of taxes that a shareholder would pay on Fund distributionsor the redemption of Fund shares. The EAFE Index is shown with all dividends and distributions reinvested.Because the EAFE was available only at month-end in 1998, we used the 10/31/98 value to calculateperformance since inception. This index is unmanaged and is not hedged for foreign currency risk. Currentperformance may be lower or higher than the performance quoted. Please call (800)445-9469 or visitlongleafpartners.com for more current performance information. The annualized expense ratio for theLongleaf Partners International Fund is 1.29%. The risks associated with an investment in the LongleafPartners International Fund are detailed in the Prospectus. These risks include stock market risk, investmentselection risk, corporate ownership risk, non-diversification risk, non-US investment risk, focused geographicrisk, and derivatives risk. Distributed by: Rafferty Capital Markets, LLC.
International Fund Longleaf Partners Funds ▪ 19
Portfolio Summary
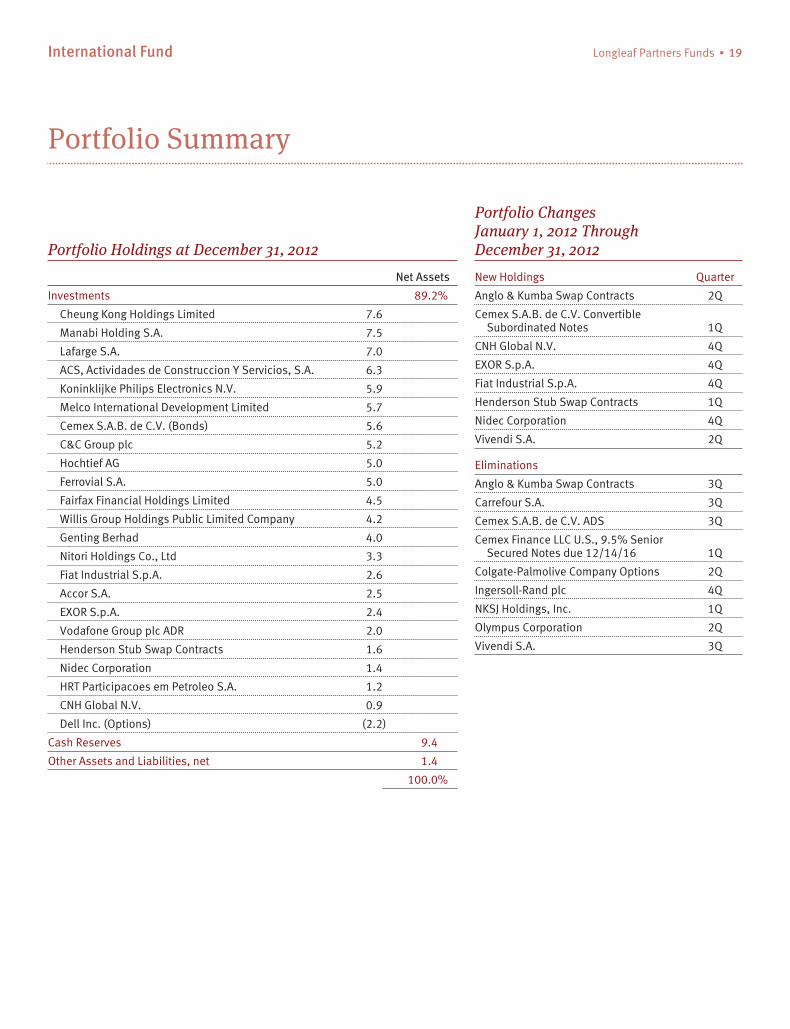
Portfolio Holdings at December 31, 2012
Net Assets
Investments 89.2%
Cheung Kong Holdings Limited 7.6
Manabi Holding S.A. 7.5
Lafarge S.A. 7.0
ACS, Actividades de Construccion Y Servicios, S.A. 6.3
Koninklijke Philips Electronics N.V. 5.9
Melco International Development Limited 5.7
Cemex S.A.B. de C.V. (Bonds) 5.6
C&C Group plc 5.2
Hochtief AG 5.0
Ferrovial S.A. 5.0
Fairfax Financial Holdings Limited 4.5
Willis Group Holdings Public Limited Company 4.2
Genting Berhad 4.0
Nitori Holdings Co., Ltd 3.3
Fiat Industrial S.p.A. 2.6
Accor S.A. 2.5
EXOR S.p.A. 2.4
Vodafone Group plc ADR 2.0
Henderson Stub Swap Contracts 1.6
Nidec Corporation 1.4
HRT Participacoes em Petroleo S.A. 1.2
CNH Global N.V. 0.9
Dell Inc. (Options) (2.2)
Cash Reserves 9.4
Other Assets and Liabilities, net 1.4
100.0%
Portfolio ChangesJanuary 1, 2012 ThroughDecember 31, 2012
New Holdings Quarter
Anglo & Kumba Swap Contracts 2Q
Cemex S.A.B. de C.V. ConvertibleSubordinated Notes 1Q
CNH Global N.V. 4Q
EXOR S.p.A. 4Q
Fiat Industrial S.p.A. 4Q
Henderson Stub Swap Contracts 1Q
Nidec Corporation 4Q
Vivendi S.A. 2Q
Eliminations
Anglo & Kumba Swap Contracts 3Q
Carrefour S.A. 3Q
Cemex S.A.B. de C.V. ADS 3Q
Cemex Finance LLC U.S., 9.5% SeniorSecured Notes due 12/14/16 1Q
Colgate-Palmolive Company Options 2Q
Ingersoll-Rand plc 4Q
NKSJ Holdings, Inc. 1Q
Olympus Corporation 2Q
Vivendi S.A. 3Q
20 ▪ Annual Report International Fund
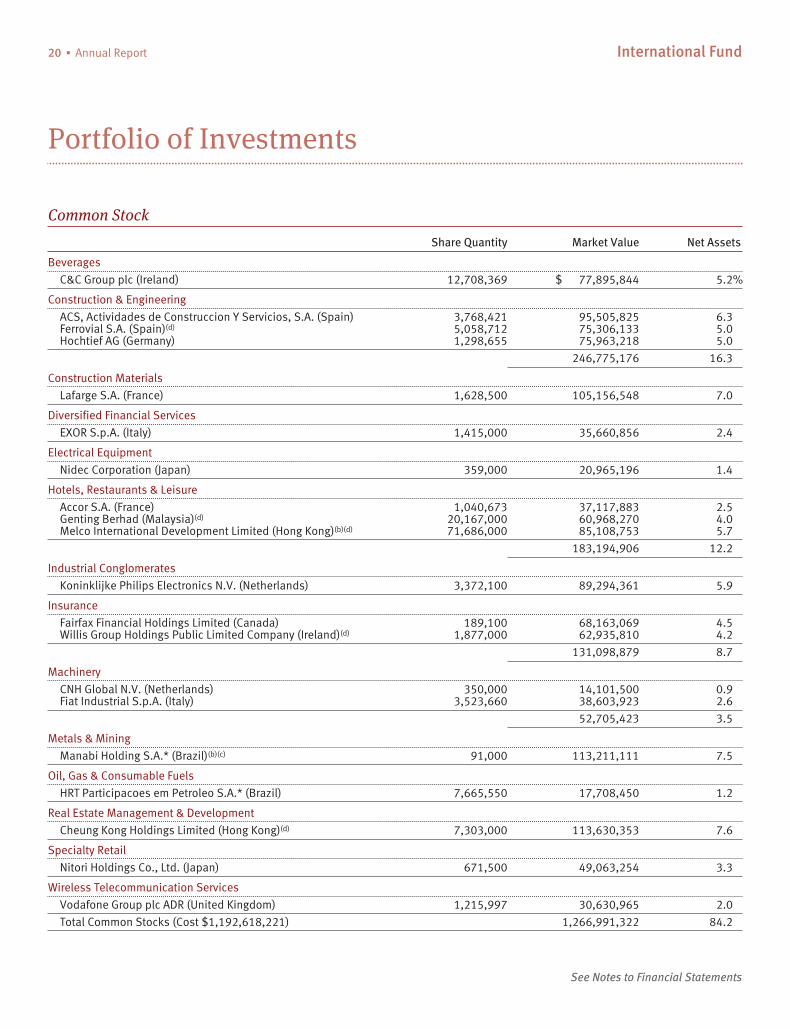
Portfolio of Investments
Common Stock
Share Quantity Market Value Net Assets
Beverages
C&C Group plc (Ireland) 12,708,369 $ 77,895,844 5.2%
Construction & Engineering
ACS, Actividades de Construccion Y Servicios, S.A. (Spain) 3,768,421 95,505,825 6.3Ferrovial S.A. (Spain)(d) 5,058,712 75,306,133 5.0Hochtief AG (Germany) 1,298,655 75,963,218 5.0
246,775,176 16.3
Construction Materials
Lafarge S.A. (France) 1,628,500 105,156,548 7.0
Diversified Financial Services
EXOR S.p.A. (Italy) 1,415,000 35,660,856 2.4
Electrical Equipment
Nidec Corporation (Japan) 359,000 20,965,196 1.4
Hotels, Restaurants & Leisure
Accor S.A. (France) 1,040,673 37,117,883 2.5Genting Berhad (Malaysia)(d) 20,167,000 60,968,270 4.0Melco International Development Limited (Hong Kong)(b)(d) 71,686,000 85,108,753 5.7
183,194,906 12.2
Industrial Conglomerates
Koninklijke Philips Electronics N.V. (Netherlands) 3,372,100 89,294,361 5.9
Insurance
Fairfax Financial Holdings Limited (Canada) 189,100 68,163,069 4.5Willis Group Holdings Public Limited Company (Ireland)(d) 1,877,000 62,935,810 4.2
131,098,879 8.7
Machinery
CNH Global N.V. (Netherlands) 350,000 14,101,500 0.9Fiat Industrial S.p.A. (Italy) 3,523,660 38,603,923 2.6
52,705,423 3.5
Metals & Mining
Manabi Holding S.A.* (Brazil)(b)(c) 91,000 113,211,111 7.5
Oil, Gas & Consumable Fuels
HRT Participacoes em Petroleo S.A.* (Brazil) 7,665,550 17,708,450 1.2
Real Estate Management & Development
Cheung Kong Holdings Limited (Hong Kong)(d) 7,303,000 113,630,353 7.6
Specialty Retail
Nitori Holdings Co., Ltd. (Japan) 671,500 49,063,254 3.3
Wireless Telecommunication Services
Vodafone Group plc ADR (United Kingdom) 1,215,997 30,630,965 2.0
Total Common Stocks (Cost $1,192,618,221) 1,266,991,322 84.2
See Notes to Financial Statements
International Fund Longleaf Partners Funds ▪ 21
continued
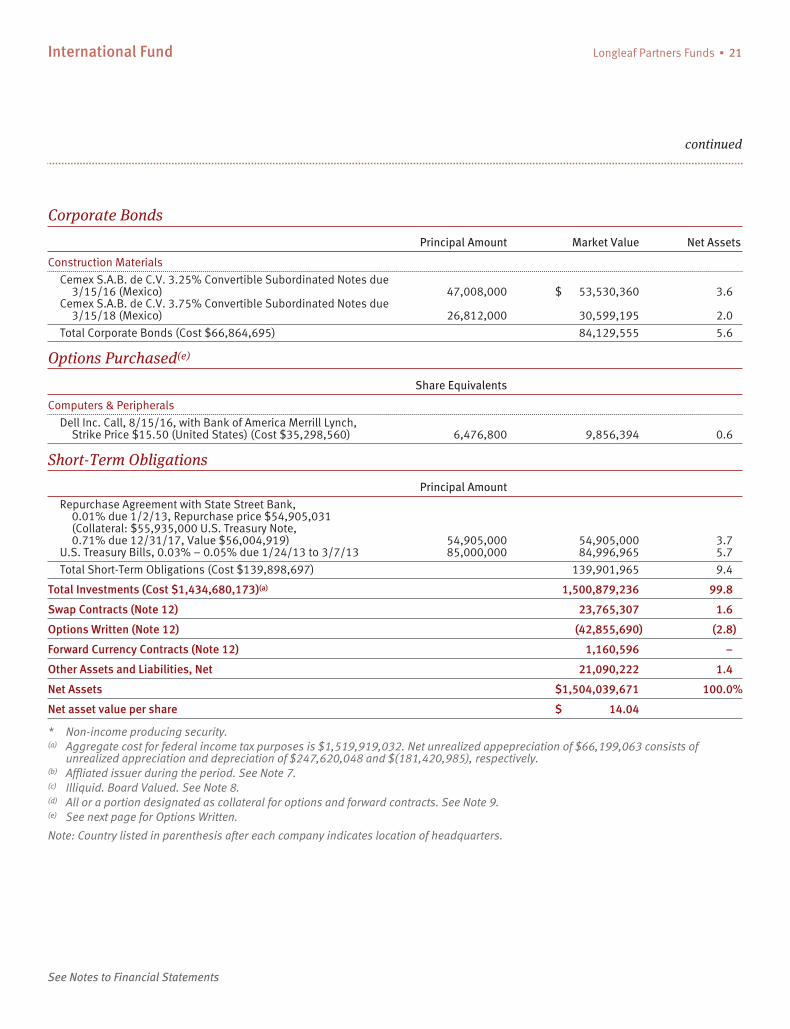
Corporate Bonds
Principal Amount Market Value Net Assets
Construction Materials
Cemex S.A.B. de C.V. 3.25% Convertible Subordinated Notes due3/15/16 (Mexico) 47,008,000 $ 53,530,360 3.6
Cemex S.A.B. de C.V. 3.75% Convertible Subordinated Notes due3/15/18 (Mexico) 26,812,000 30,599,195 2.0
Total Corporate Bonds (Cost $66,864,695) 84,129,555 5.6
Options Purchased(e)
Share Equivalents
Computers & Peripherals
Dell Inc. Call, 8/15/16, with Bank of America Merrill Lynch,Strike Price $15.50 (United States) (Cost $35,298,560) 6,476,800 9,856,394 0.6
Short-Term Obligations
Principal Amount
Repurchase Agreement with State Street Bank,0.01% due 1/2/13, Repurchase price $54,905,031(Collateral: $55,935,000 U.S. Treasury Note,0.71% due 12/31/17, Value $56,004,919) 54,905,000 54,905,000 3.7
U.S. Treasury Bills, 0.03% – 0.05% due 1/24/13 to 3/7/13 85,000,000 84,996,965 5.7
Total Short-Term Obligations (Cost $139,898,697) 139,901,965 9.4
Total Investments (Cost $1,434,680,173)(a) 1,500,879,236 99.8
Swap Contracts (Note 12) 23,765,307 1.6
Options Written (Note 12) (42,855,690) (2.8)
Forward Currency Contracts (Note 12) 1,160,596 –
Other Assets and Liabilities, Net 21,090,222 1.4
Net Assets $1,504,039,671 100.0%
Net asset value per share $ 14.04
* Non-income producing security.(a) Aggregate cost for federal income tax purposes is $1,519,919,032. Net unrealized appepreciation of $66,199,063 consists of
unrealized appreciation and depreciation of $247,620,048 and $(181,420,985), respectively.(b) Affliated issuer during the period. See Note 7.(c) Illiquid. Board Valued. See Note 8.(d) All or a portion designated as collateral for options and forward contracts. See Note 9.(e) See next page for Options Written.
Note: Country listed in parenthesis after each company indicates location of headquarters.
See Notes to Financial Statements
22 ▪ Annual Report International Fund
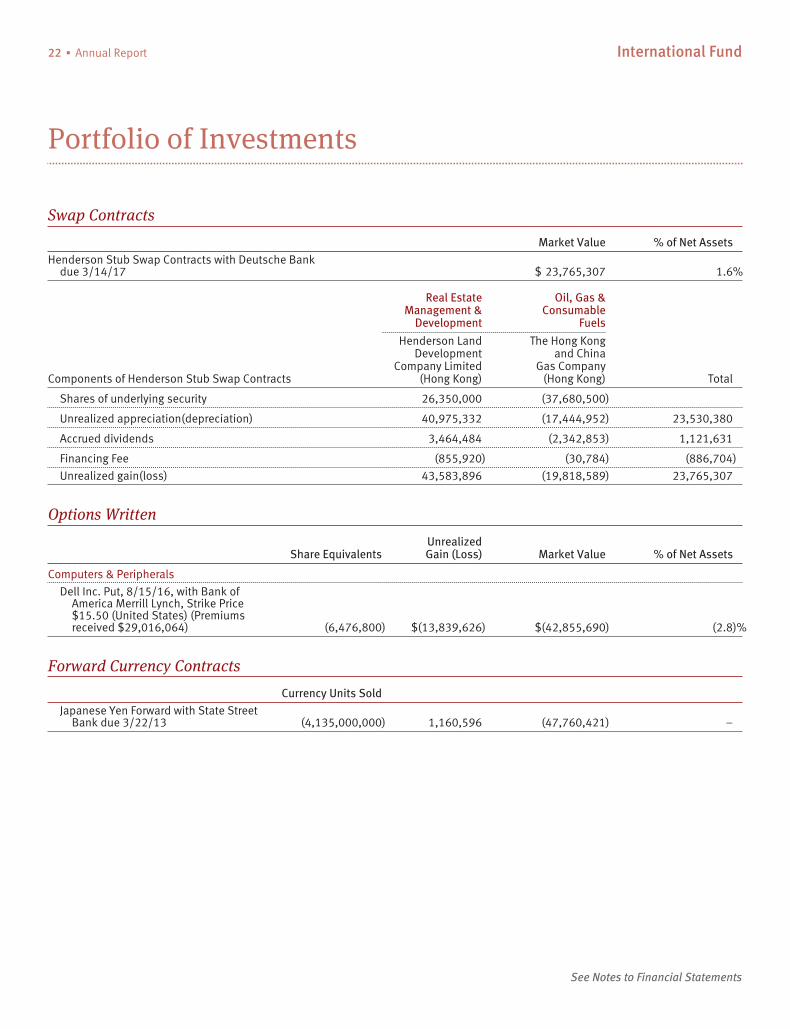
Portfolio of Investments
Swap Contracts
Market Value % of Net Assets
Henderson Stub Swap Contracts with Deutsche Bankdue 3/14/17 $ 23,765,307 1.6%
Real EstateManagement &
Development
Oil, Gas &Consumable
Fuels
Components of Henderson Stub Swap Contracts
Henderson LandDevelopment
Company Limited(Hong Kong)
The Hong Kongand China
Gas Company(Hong Kong) Total
Shares of underlying security 26,350,000 (37,680,500)
Unrealized appreciation(depreciation) 40,975,332 (17,444,952) 23,530,380
Accrued dividends 3,464,484 (2,342,853) 1,121,631
Financing Fee (855,920) (30,784) (886,704)
Unrealized gain(loss) 43,583,896 (19,818,589) 23,765,307
Options Written
Share EquivalentsUnrealizedGain (Loss) Market Value % of Net Assets
Computers & Peripherals
Dell Inc. Put, 8/15/16, with Bank ofAmerica Merrill Lynch, Strike Price$15.50 (United States) (Premiumsreceived $29,016,064) (6,476,800) $(13,839,626) $(42,855,690) (2.8)%
Forward Currency Contracts
Currency Units Sold
Japanese Yen Forward with State StreetBank due 3/22/13 (4,135,000,000) 1,160,596 (47,760,421) –
See Notes to Financial Statements
International Fund Longleaf Partners Funds ▪ 23
continued
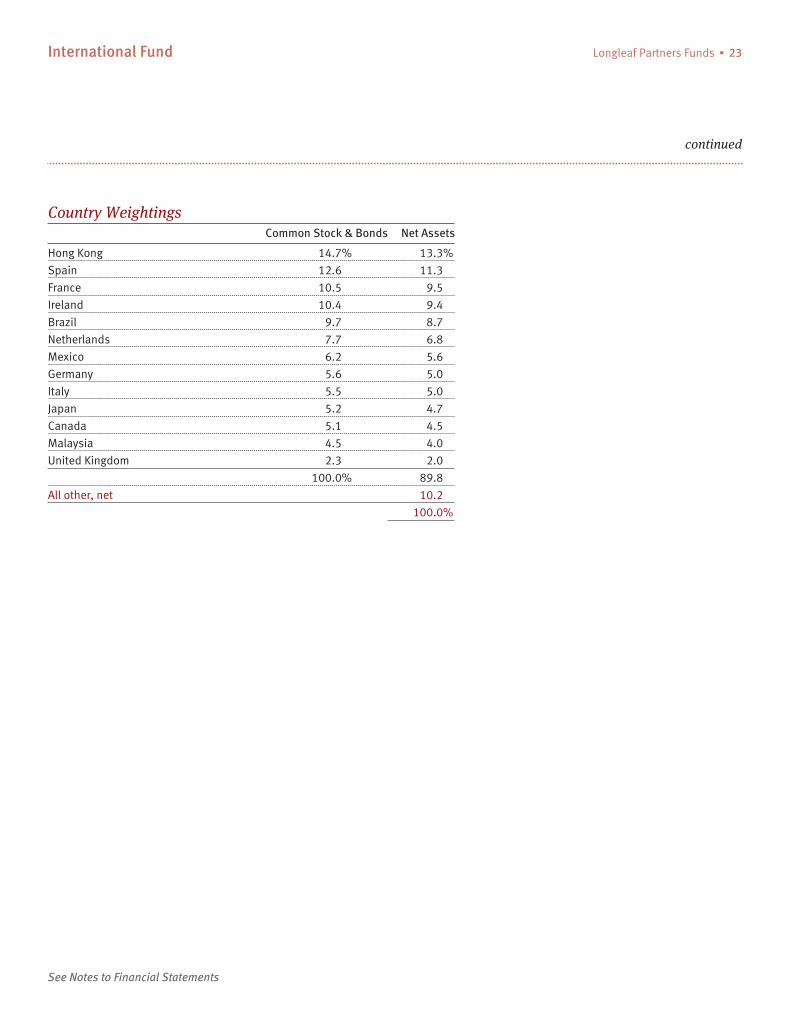
Country WeightingsCommon Stock & Bonds Net Assets
Hong Kong 14.7% 13.3%
Spain 12.6 11.3
France 10.5 9.5
Ireland 10.4 9.4
Brazil 9.7 8.7
Netherlands 7.7 6.8
Mexico 6.2 5.6
Germany 5.6 5.0
Italy 5.5 5.0
Japan 5.2 4.7
Canada 5.1 4.5
Malaysia 4.5 4.0
United Kingdom 2.3 2.0
100.0% 89.8
All other, net 10.2
100.0%
See Notes to Financial Statements
24 ▪ Annual Report
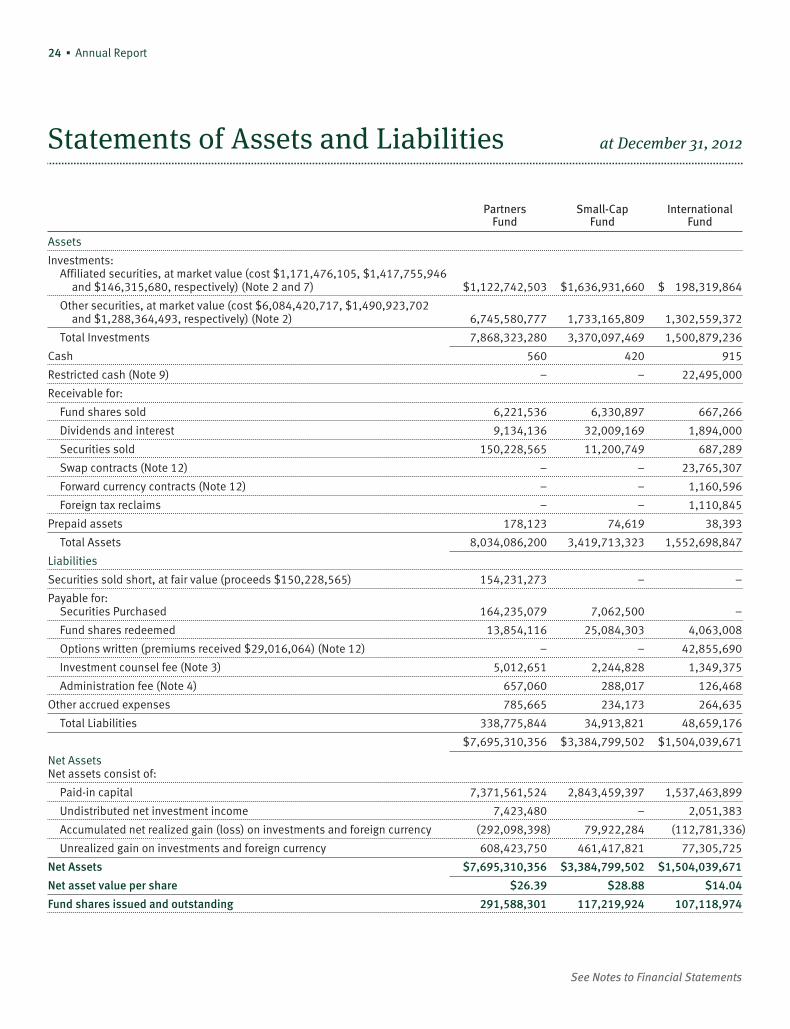
Statements of Assets and Liabilities at December 31, 2012
PartnersFund
Small-CapFund
InternationalFund
Assets
Investments:Affiliated securities, at market value (cost $1,171,476,105, $1,417,755,946
and $146,315,680, respectively) (Note 2 and 7) $1,122,742,503 $1,636,931,660 $ 198,319,864
Other securities, at market value (cost $6,084,420,717, $1,490,923,702and $1,288,364,493, respectively) (Note 2) 6,745,580,777 1,733,165,809 1,302,559,372
Total Investments 7,868,323,280 3,370,097,469 1,500,879,236
Cash 560 420 915
Restricted cash (Note 9) – – 22,495,000
Receivable for:
Fund shares sold 6,221,536 6,330,897 667,266
Dividends and interest 9,134,136 32,009,169 1,894,000
Securities sold 150,228,565 11,200,749 687,289
Swap contracts (Note 12) – – 23,765,307
Forward currency contracts (Note 12) – – 1,160,596
Foreign tax reclaims – – 1,110,845
Prepaid assets 178,123 74,619 38,393
Total Assets 8,034,086,200 3,419,713,323 1,552,698,847
Liabilities
Securities sold short, at fair value (proceeds $150,228,565) 154,231,273 – –
Payable for:Securities Purchased 164,235,079 7,062,500 –
Fund shares redeemed 13,854,116 25,084,303 4,063,008
Options written (premiums received $29,016,064) (Note 12) – – 42,855,690
Investment counsel fee (Note 3) 5,012,651 2,244,828 1,349,375
Administration fee (Note 4) 657,060 288,017 126,468
Other accrued expenses 785,665 234,173 264,635
Total Liabilities 338,775,844 34,913,821 48,659,176
$7,695,310,356 $3,384,799,502 $1,504,039,671
Net AssetsNet assets consist of:
Paid-in capital 7,371,561,524 2,843,459,397 1,537,463,899
Undistributed net investment income 7,423,480 – 2,051,383
Accumulated net realized gain (loss) on investments and foreign currency (292,098,398) 79,922,284 (112,781,336)
Unrealized gain on investments and foreign currency 608,423,750 461,417,821 77,305,725
Net Assets $7,695,310,356 $3,384,799,502 $1,504,039,671
Net asset value per share $26.39 $28.88 $14.04
Fund shares issued and outstanding 291,588,301 117,219,924 107,118,974
See Notes to Financial Statements
Longleaf Partners Funds ▪ 25
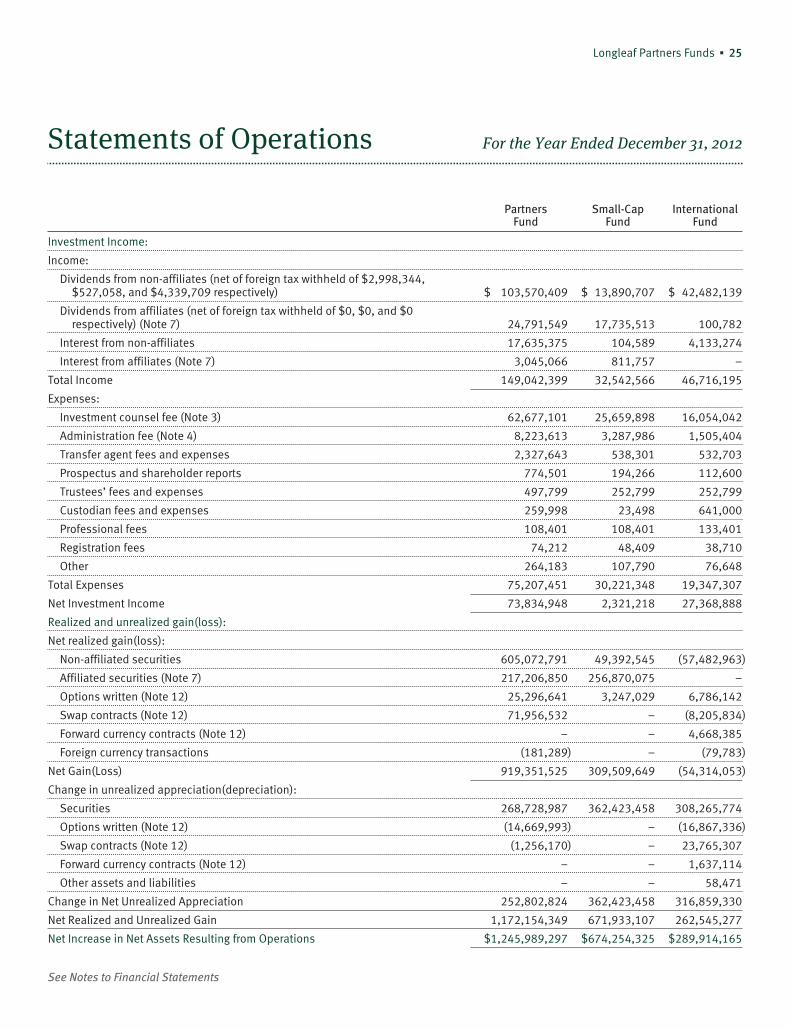
Statements of Operations For the Year Ended December 31, 2012
PartnersFund
Small-CapFund
InternationalFund
Investment Income:
Income:
Dividends from non-affiliates (net of foreign tax withheld of $2,998,344,$527,058, and $4,339,709 respectively) $ 103,570,409 $ 13,890,707 $ 42,482,139
Dividends from affiliates (net of foreign tax withheld of $0, $0, and $0respectively) (Note 7) 24,791,549 17,735,513 100,782
Interest from non-affiliates 17,635,375 104,589 4,133,274
Interest from affiliates (Note 7) 3,045,066 811,757 –
Total Income 149,042,399 32,542,566 46,716,195
Expenses:
Investment counsel fee (Note 3) 62,677,101 25,659,898 16,054,042
Administration fee (Note 4) 8,223,613 3,287,986 1,505,404
Transfer agent fees and expenses 2,327,643 538,301 532,703
Prospectus and shareholder reports 774,501 194,266 112,600
Trustees’ fees and expenses 497,799 252,799 252,799
Custodian fees and expenses 259,998 23,498 641,000
Professional fees 108,401 108,401 133,401
Registration fees 74,212 48,409 38,710
Other 264,183 107,790 76,648
Total Expenses 75,207,451 30,221,348 19,347,307
Net Investment Income 73,834,948 2,321,218 27,368,888
Realized and unrealized gain(loss):
Net realized gain(loss):
Non-affiliated securities 605,072,791 49,392,545 (57,482,963)
Affiliated securities (Note 7) 217,206,850 256,870,075 –
Options written (Note 12) 25,296,641 3,247,029 6,786,142
Swap contracts (Note 12) 71,956,532 – (8,205,834)
Forward currency contracts (Note 12) – – 4,668,385
Foreign currency transactions (181,289) – (79,783)
Net Gain(Loss) 919,351,525 309,509,649 (54,314,053)
Change in unrealized appreciation(depreciation):
Securities 268,728,987 362,423,458 308,265,774
Options written (Note 12) (14,669,993) – (16,867,336)
Swap contracts (Note 12) (1,256,170) – 23,765,307
Forward currency contracts (Note 12) – – 1,637,114
Other assets and liabilities – – 58,471
Change in Net Unrealized Appreciation 252,802,824 362,423,458 316,859,330
Net Realized and Unrealized Gain 1,172,154,349 671,933,107 262,545,277
Net Increase in Net Assets Resulting from Operations $1,245,989,297 $674,254,325 $289,914,165
See Notes to Financial Statements
26 ▪ Annual Report
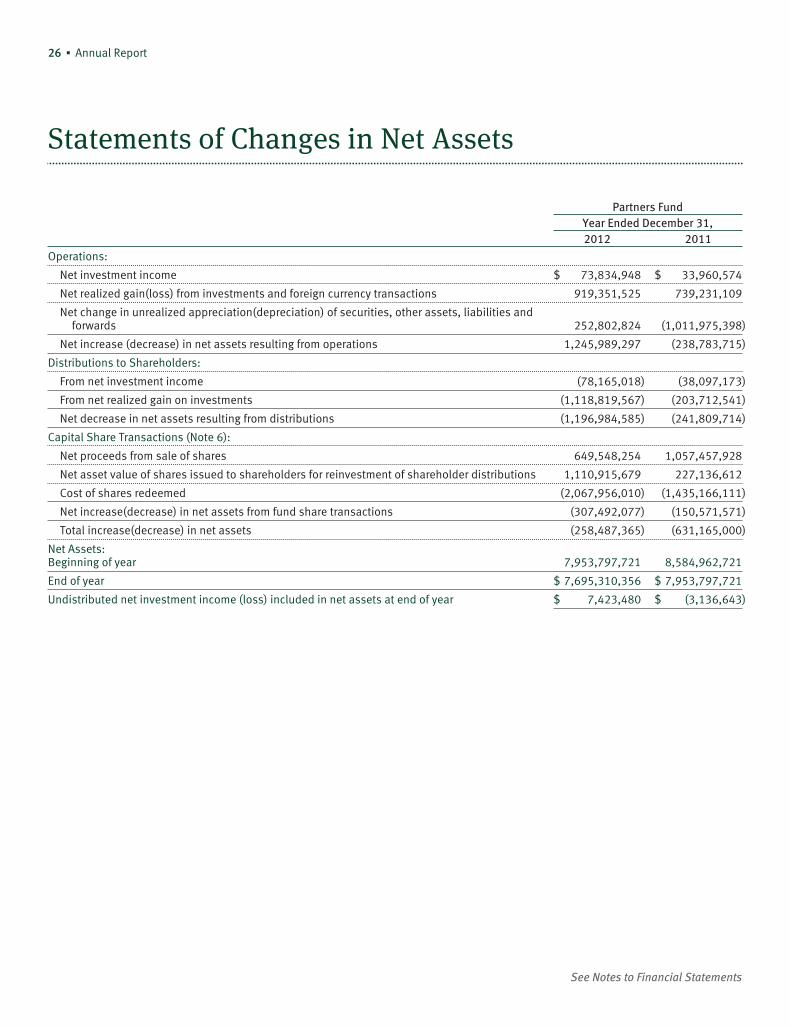
Statements of Changes in Net Assets
Partners FundYear Ended December 31,2012 2011
Operations:
Net investment income $ 73,834,948 $ 33,960,574
Net realized gain(loss) from investments and foreign currency transactions 919,351,525 739,231,109
Net change in unrealized appreciation(depreciation) of securities, other assets, liabilities andforwards 252,802,824 (1,011,975,398)
Net increase (decrease) in net assets resulting from operations 1,245,989,297 (238,783,715)
Distributions to Shareholders:
From net investment income (78,165,018) (38,097,173)
From net realized gain on investments (1,118,819,567) (203,712,541)
Net decrease in net assets resulting from distributions (1,196,984,585) (241,809,714)
Capital Share Transactions (Note 6):
Net proceeds from sale of shares 649,548,254 1,057,457,928
Net asset value of shares issued to shareholders for reinvestment of shareholder distributions 1,110,915,679 227,136,612
Cost of shares redeemed (2,067,956,010) (1,435,166,111)
Net increase(decrease) in net assets from fund share transactions (307,492,077) (150,571,571)
Total increase(decrease) in net assets (258,487,365) (631,165,000)
Net Assets:Beginning of year 7,953,797,721 8,584,962,721
End of year $ 7,695,310,356 $ 7,953,797,721
Undistributed net investment income (loss) included in net assets at end of year $ 7,423,480 $ (3,136,643)
See Notes to Financial Statements
Longleaf Partners Funds ▪ 27
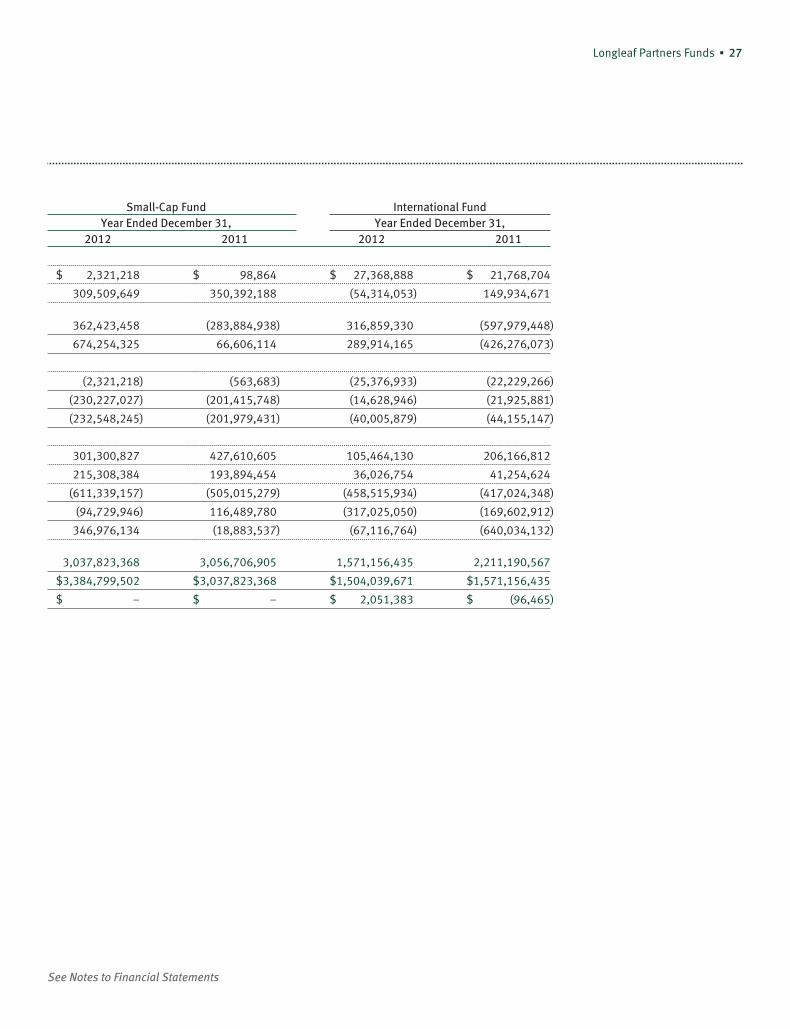
Small-Cap Fund International FundYear Ended December 31, Year Ended December 31,
2012 2011 2012 2011
$ 2,321,218 $ 98,864 $ 27,368,888 $ 21,768,704
309,509,649 350,392,188 (54,314,053) 149,934,671
362,423,458 (283,884,938) 316,859,330 (597,979,448)
674,254,325 66,606,114 289,914,165 (426,276,073)
(2,321,218) (563,683) (25,376,933) (22,229,266)
(230,227,027) (201,415,748) (14,628,946) (21,925,881)
(232,548,245) (201,979,431) (40,005,879) (44,155,147)
301,300,827 427,610,605 105,464,130 206,166,812
215,308,384 193,894,454 36,026,754 41,254,624
(611,339,157) (505,015,279) (458,515,934) (417,024,348)
(94,729,946) 116,489,780 (317,025,050) (169,602,912)
346,976,134 (18,883,537) (67,116,764) (640,034,132)
3,037,823,368 3,056,706,905 1,571,156,435 2,211,190,567
$3,384,799,502 $3,037,823,368 $1,504,039,671 $1,571,156,435
$ – $ – $ 2,051,383 $ (96,465)
See Notes to Financial Statements
28 ▪ Annual Report
Notes to Financial Statements
Note 1. OrganizationLongleaf Partners Fund, Longleaf Partners Small-Cap Fund, and Longleaf Partners International Fund(the “Funds”) are non-diversified and each is a series of Longleaf Partners Funds Trust, a Massachusettsbusiness trust, which is registered as an open-end management investment company under theInvestment Company Act of 1940, as amended.
Note 2. Significant Accounting Policies
Management EstimatesThe accompanying financial statements are prepared in accordance with accounting principles generallyaccepted in the United States of America; these principles may require the use of estimates by Fundmanagement. Actual results could differ from those estimates.
Security ValuationPortfolio securities listed or traded on a securities exchange (U.S. or foreign), on the NASDAQ nationalmarket, or any representative quotation system providing same day publication of actual prices, arevalued at the last sale price. If there are no transactions in the security that day, securities are valued atthe midpoint between the closing bid and ask prices or, if there are no such prices, the prior day’s close.
In the case of bonds and other fixed income securities, valuations may be furnished by a pricing servicewhich takes into account factors in addition to quoted prices (such as trading characteristics, yield,quality, coupon rate, maturity, type of issue, and other market data relating to the priced security orother similar securities) where taking such factors into account would lead to a more accurate reflectionof the fair market value of such securities.
When market quotations are not readily available, valuations of portfolio securities may be determinedin accordance with procedures established by and under the general supervision of the Funds’ Trustees.In determining fair value, the Board considers relevant qualitative and quantitative informationincluding news regarding significant market or security specific events. The Board may also utilize aservice provided by an independent third party to assist in fair valuation of certain securities. Thesefactors are subject to change over time and are reviewed periodically. Because the utilization of fair valuedepends on market activity, the frequency with which fair valuation may be used cannot be predicted.Estimated values may differ from the values that would have been used had a ready market for theinvestment existed.
Repurchase agreements are valued at cost which, combined with accrued interest, approximates marketvalue. Short-term U.S. Government obligations purchased with a remaining maturity of more than 60days are valued through pricing obtained through pricing services approved by the Funds’ Trustees.Obligations purchased with a remaining maturity of 60 days or less or existing positions that have lessthan 60 days to maturity generally are valued at amortized cost, which approximates market value.However, if amortized cost is deemed not to reflect fair value, the securities are valued at pricesfurnished by dealers who make markets in such securities or by an independent pricing service.
The Funds determine net asset values (“NAVs”) once a day, at the close of regular trading on the NewYork Stock Exchange (“Exchange”) (usually at 4:00 p.m. Eastern time) on days the Exchange is open forbusiness. The Exchange is closed for specified national holidays and on weekends. Foreign securities aregenerally priced at the latest market close in the foreign market, which may be at different times or daysthan the close of the Exchange. If events occur which could materially affect the NAV between the closeof the foreign market and normal pricing at the close of the Exchange, foreign securities may be fairvalued as determined by the Board of Trustees, consistent with any regulatory guidelines.
Longleaf Partners Funds ▪ 29
Accounting for InvestmentsFor financial reporting purposes, the Funds record security transactions on trade date. Realized gainsand losses on security transactions are determined using the specific identification method. Dividendincome is recognized on the ex-dividend date, except that certain dividends from foreign securities arerecorded as soon after the ex-dividend date as the Fund is able to obtain information on the dividend.Interest income and Fund expenses are recognized on an accrual basis.
Distributions to ShareholdersDividends and distributions to shareholders are recorded on the ex-dividend date.
Federal Income TaxesThe Funds’ policy is to comply with the requirements of the Internal Revenue Code that are applicable toregulated investment companies and to distribute substantially all taxable income to shareholders.Accordingly, no federal income tax provision is required. The Funds intend to make any requireddistributions to avoid the application of a 4% nondeductible excise tax. Distributions are determined inaccordance with income tax regulations which may differ from generally accepted accounting principles.Reclassifications are made within the Funds’ capital accounts to reflect income and gains available fordistribution under income tax regulations.
Foreign Currency TranslationsThe books and records of the Funds are maintained in U.S. dollars. Securities denominated in currenciesother than U.S. dollars are subject to changes in value due to fluctuations in exchange rates. Purchasesand sales of securities and income and expenses are translated into U.S. dollars at the prevailingexchange rate on the respective date of each transaction. The market values of investment securities,assets and liabilities are translated into U.S. dollars daily.
The Funds do not isolate the portion of net realized and unrealized gains or losses in equity securityinvestments which are attributable to changes in foreign exchange rates. Accordingly, the impact of suchchanges is included in the realized and unrealized gains or losses on the underlying equity securities.
Repurchase AgreementsThe Funds may engage in repurchase agreement transactions. The Fixed Income Clearing Corporation(“FICC”) sells U.S. government or agency securities to each Fund under agreements to repurchase thesesecurities at a stated repurchase price including interest for the term of the agreement, which is usuallyovernight or over a weekend. Each Fund, through FICC, receives delivery of the underlying U.S.government or agency securities as collateral, whose market value is required to be at least equal to therepurchase price. If FICC becomes bankrupt, the Fund might be delayed, or may incur costs or possiblelosses of principal and income, in selling the collateral.
When-Issued SecuritiesThe Funds may trade on a when-issued basis when a security has been authorized but not yet issued. In awhen-issued transaction, securities are purchased or sold but delivery or settlement is delayed until theunderlying stock is issued. Transactions in when-issued securities are subject to market fluctuations andrisk of loss prior to settlement. Their value is determined in the same manner as other securities.
OptionsThe Funds may purchase and sell (“write”) call and put options on various instruments includingsecurities to gain long or short exposure to the underlying instruments.
An option contract gives the buyer the right, but not the obligation, to buy(call) or sell(put) anunderlying item at a fixed exercise price on a certain date or during a specified period. The cost of
30 ▪ Annual Report
Notes to Financial Statements
securities acquired through the exercise of a call option is increased by the premiums paid. The proceedsfrom securities sold through the exercise of a purchased put option are decreased by the premiums paid.The cost of purchased options that expire unexercised are treated by the Funds, on expiration date, asrealized losses on investments.
When the Funds write an option, an amount equal to the premium received by the Funds is recorded as aliability and is subsequently adjusted to the current fair value of the option written. Premiums receivedfrom writing options that expire unexercised are treated by the Funds, on the expiration date, as realizedgains on written options. The difference between the premium and the amount paid on effecting aclosing transaction, including brokerage commissions, is also treated as a realized gain, or, if thepremium is less than the amount paid for the closing transaction, as a realized loss. If a call option isexercised, the premium is added to the proceeds from the sale of the underlying security in determiningwhether the Funds have a realized gain or loss. If a put option is exercised, the premium reduces the costbasis of the security purchased by the Funds.
The current market value of an exchange traded option is the last sales price. Over-the-counter optionsare valued in accordance with fair value procedures established by and under the general supervision ofthe Funds’ Trustees.
Risk of OptionsGains on investment in options may depend on correctly predicting the market value direction of theunderlying security. There can be no assurance that a liquid market will exist when a Fund seeks to closeout an option position and a Fund may experience losses as a result of such illiquidity. Listed optionsinvolve minimal counter-party risk since listed options are guaranteed against default by the exchangeon which they trade. When purchasing over-the-counter (OTC) options, the Funds bear the risk ofeconomic loss from counterparty default, equal to the market value of the option.
Swap ContractsThe Funds may enter into swap contracts for purposes of pursuing their investment objectives or as asubstitute for investing directly in securities (or shorting securities), or to hedge a position. Swaps aretwo-party contracts entered into primarily by institutional investors for periods ranging from a day tomore than one year. In a standard swap transaction, two parties agree to exchange the returns (ordifferentials in rates of return) earned or realized on particular predetermined investments orinstruments. The gross returns to be exchanged between the parties is calculated with respect to a“notional amount,” for example, the return on or increase in value of a particular dollar amount investedin a basket of securities. Most swap contracts entered into by the Funds calculate and settle theobligations of the parties to the agreement on a “net basis” with a single payment. Consequently, aFund’s current obligations (or rights) under a swap agreement will generally be equal only to the netamount to be paid or received under the agreement based on the relative values of such obligations (orrights). A Fund’s current obligations under a swap agreement will be accrued daily, offset against anyamounts owed to the Fund.
The market value of a swap contract is determined by marking the underlying security (securities) totheir last quoted value at the close of the NYSE, usually 4:00 p.m., Eastern Time. The swap’s marketvalue is then adjusted to accrue dividend or interest income, financing charges and/or other economicterms associated with the contract.
Risk of SwapsSwap contracts involve, to varying degrees, elements of market risk and exposure to loss in excess of theamount reflected in the Statement of Assets and Liabilities. The notional amounts reflect the extent of thetotal investment exposure each Fund has under the swap contract. The primary risks associated with the
Longleaf Partners Funds ▪ 31
use of swaps are imperfect correlation between movements in the notional amount and the price of theunderlying investments and the inability of counterparties to perform. A Fund bears the risk of loss of theamount expected to be received under a swap contract in the event of the default or bankruptcy of aswap counterparty.
Forward Currency ContractsForward currency contracts are commitments to purchase or sell a foreign currency at a future maturitydate at a prespecified price. The resulting obligation is marked-to-market daily using foreign currencyexchange rates supplied by an independent pricing service. An unrealized gain or loss is recorded for thedifference between the contract opening value and its current value. When a contract is closed ordelivery is taken, this gain or loss is realized. For federal tax purposes, gain or loss on open forwardcontracts in qualifying currencies are treated as realized and are subject to distribution at our excise taxyear-end date.
Risk of Forward Currency ContractsThe Funds may use forward currency contracts for hedging purposes to offset currency exposure inportfolio holdings, although they have ceased doing so as a routine practice. Forward contracts mayreduce the potential gain from a positive change in the relationship between the U.S. dollar and foreigncurrencies or, considered separately, may produce a loss. Not all foreign currencies can be effectivelyhedged; and the costs of hedging may outweigh the benefits. If our hedging strategy does not correlatewell with market and currency movements, price volatility of the portfolio could increase. Where a liquidsecondary market for forwards does not exist, the Funds may not be able to close their positions and insuch an event, the loss is theoretically unlimited. In addition, the Funds could be exposed to risks if thecounterparty to these contracts is unable to perform.
Counterparty Risk and CollateralThe Funds have entered in to collateral agreements with counterparties to mitigate risk on OTCderivatives. Collateral is generally determined based on the net unrealized gain or loss with eachcounterparty, subject to minimum exposure amounts. Collateral, both pledged by and for the benefit of aFund, is held in a segregated account at the Funds’ custodian bank and comprised of assets specific toeach agreement. See Note 13, “Counterparty Risk and Credit-Risk-Related Contingent Features onDerivative Instruments,” for additional information.
Note 3. Investment Counsel AgreementSoutheastern Asset Management, Inc. (“Southeastern”) serves as Investment Counsel to the Funds andreceives annual compensation, computed daily and paid monthly, in accordance with the followingschedule for the Partners Fund and Small-Cap Fund:
First $400 million of average daily net assets 1.00%
In excess of $400 million .75%
For the Partners and Small-Cap Funds, Southeastern has agreed to reduce its fees on a pro rata basis tothe extent that each Fund’s normal annual operating expenses (excluding taxes, interest, brokerage fees,and extraordinary expenses) exceed 1.5% of average annual net assets. No such reductions werenecessary for the current year.
The International Fund fee is calculated in accordance with the following schedule:
First $500 million of average daily net assets 1.20%
In excess of $500 million 1.00%
For this Fund, Southeastern has agreed to reduce its fees on a pro rata basis to the extent that the Fund’snormal annual operating expenses (excluding taxes, interest, brokerage fees, and extraordinaryexpenses) exceed 1.75% of average annual net assets. No reduction was necessary for the current year.
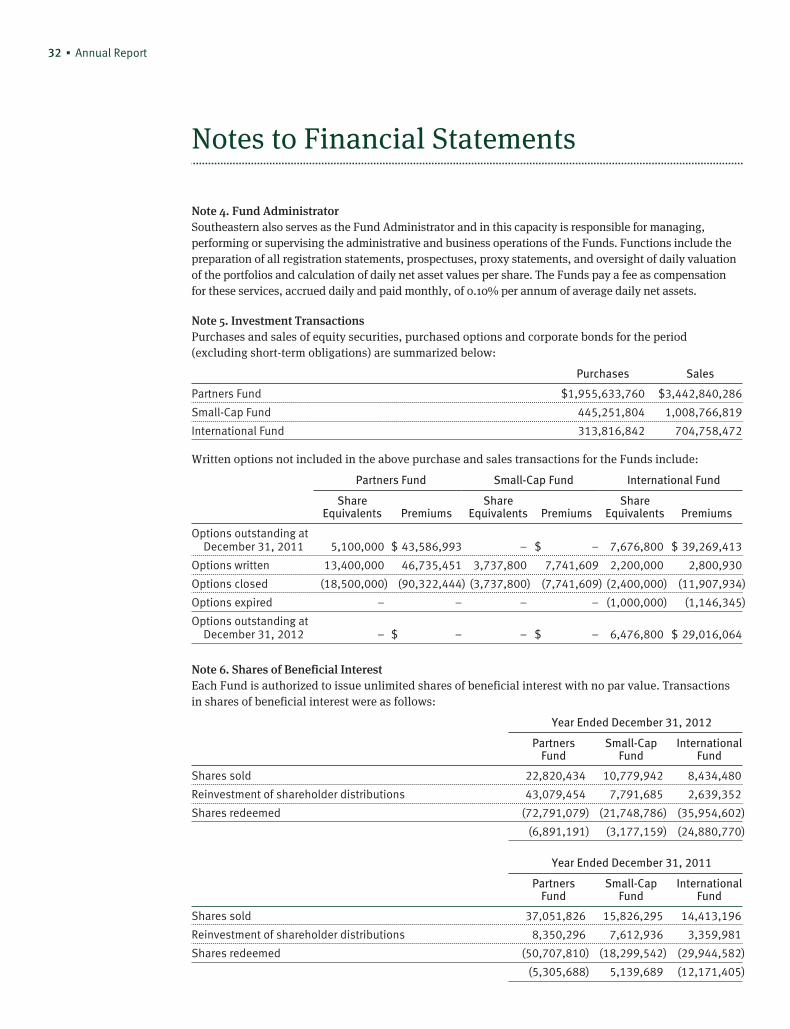
32 ▪ Annual Report
Notes to Financial Statements
Note 4. Fund AdministratorSoutheastern also serves as the Fund Administrator and in this capacity is responsible for managing,performing or supervising the administrative and business operations of the Funds. Functions include thepreparation of all registration statements, prospectuses, proxy statements, and oversight of daily valuationof the portfolios and calculation of daily net asset values per share. The Funds pay a fee as compensationfor these services, accrued daily and paid monthly, of 0.10% per annum of average daily net assets.
Note 5. Investment TransactionsPurchases and sales of equity securities, purchased options and corporate bonds for the period(excluding short-term obligations) are summarized below:
Purchases Sales
Partners Fund $1,955,633,760 $3,442,840,286
Small-Cap Fund 445,251,804 1,008,766,819
International Fund 313,816,842 704,758,472
Written options not included in the above purchase and sales transactions for the Funds include:
Partners Fund Small-Cap Fund International Fund
ShareEquivalents Premiums
ShareEquivalents Premiums
ShareEquivalents Premiums
Options outstanding atDecember 31, 2011 5,100,000 $ 43,586,993 – $ – 7,676,800 $ 39,269,413
Options written 13,400,000 46,735,451 3,737,800 7,741,609 2,200,000 2,800,930
Options closed (18,500,000) (90,322,444) (3,737,800) (7,741,609) (2,400,000) (11,907,934)
Options expired – – – – (1,000,000) (1,146,345)
Options outstanding atDecember 31, 2012 – $ – – $ – 6,476,800 $ 29,016,064
Note 6. Shares of Beneficial InterestEach Fund is authorized to issue unlimited shares of beneficial interest with no par value. Transactionsin shares of beneficial interest were as follows:
Year Ended December 31, 2012
PartnersFund
Small-CapFund
InternationalFund
Shares sold 22,820,434 10,779,942 8,434,480
Reinvestment of shareholder distributions 43,079,454 7,791,685 2,639,352
Shares redeemed (72,791,079) (21,748,786) (35,954,602)
(6,891,191) (3,177,159) (24,880,770)
Year Ended December 31, 2011
PartnersFund
Small-CapFund
InternationalFund
Shares sold 37,051,826 15,826,295 14,413,196
Reinvestment of shareholder distributions 8,350,296 7,612,936 3,359,981
Shares redeemed (50,707,810) (18,299,542) (29,944,582)
(5,305,688) 5,139,689 (12,171,405)
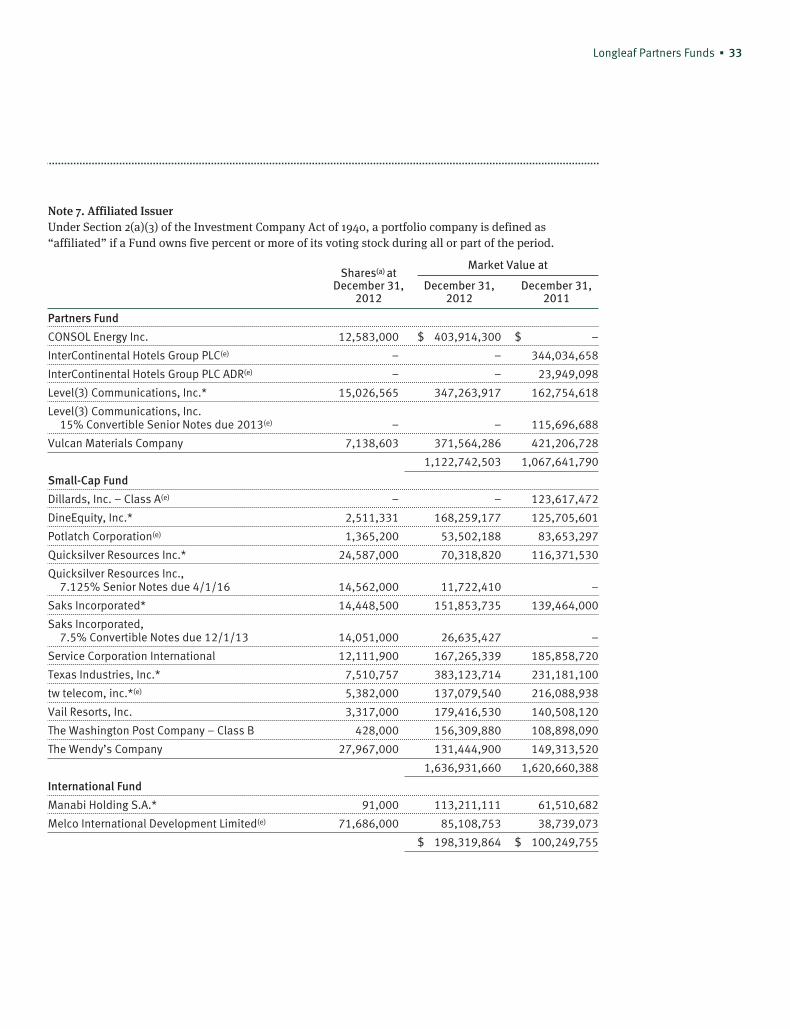
Longleaf Partners Funds ▪ 33
Note 7. Affiliated IssuerUnder Section 2(a)(3) of the Investment Company Act of 1940, a portfolio company is defined as“affiliated” if a Fund owns five percent or more of its voting stock during all or part of the period.
Shares(a) atDecember 31,
2012
Market Value at
December 31,2012
December 31,2011
Partners Fund
CONSOL Energy Inc. 12,583,000 $ 403,914,300 $ –
InterContinental Hotels Group PLC(e) – – 344,034,658
InterContinental Hotels Group PLC ADR(e) – – 23,949,098
Level(3) Communications, Inc.* 15,026,565 347,263,917 162,754,618
Level(3) Communications, Inc.15% Convertible Senior Notes due 2013(e) – – 115,696,688
Vulcan Materials Company 7,138,603 371,564,286 421,206,728
1,122,742,503 1,067,641,790
Small-Cap Fund
Dillards, Inc. – Class A(e) – – 123,617,472
DineEquity, Inc.* 2,511,331 168,259,177 125,705,601
Potlatch Corporation(e) 1,365,200 53,502,188 83,653,297
Quicksilver Resources Inc.* 24,587,000 70,318,820 116,371,530
Quicksilver Resources Inc.,7.125% Senior Notes due 4/1/16 14,562,000 11,722,410 –
Saks Incorporated* 14,448,500 151,853,735 139,464,000
Saks Incorporated,7.5% Convertible Notes due 12/1/13 14,051,000 26,635,427 –
Service Corporation International 12,111,900 167,265,339 185,858,720
Texas Industries, Inc.* 7,510,757 383,123,714 231,181,100
tw telecom, inc.*(e) 5,382,000 137,079,540 216,088,938
Vail Resorts, Inc. 3,317,000 179,416,530 140,508,120
The Washington Post Company – Class B 428,000 156,309,880 108,898,090
The Wendy’s Company 27,967,000 131,444,900 149,313,520
1,636,931,660 1,620,660,388
International Fund
Manabi Holding S.A.* 91,000 113,211,111 61,510,682
Melco International Development Limited(e) 71,686,000 85,108,753 38,739,073
$ 198,319,864 $ 100,249,755
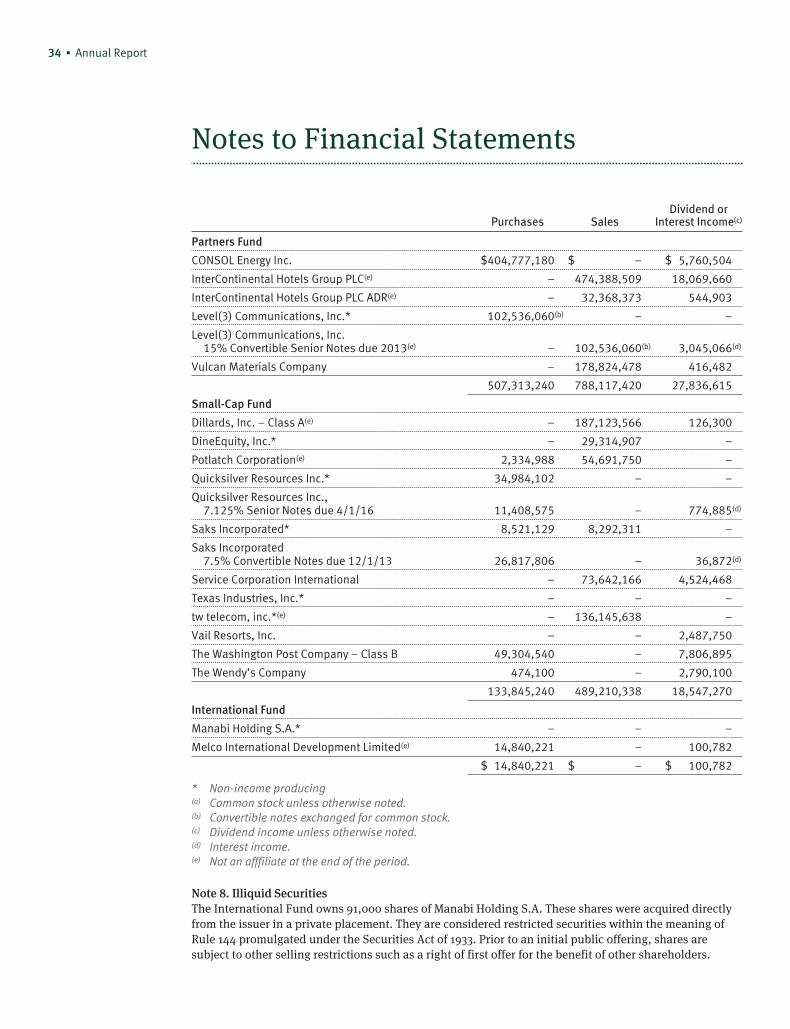
34 ▪ Annual Report
Notes to Financial Statements
Purchases SalesDividend or
Interest Income(c)
Partners Fund
CONSOL Energy Inc. $404,777,180 $ – $ 5,760,504
InterContinental Hotels Group PLC(e) – 474,388,509 18,069,660
InterContinental Hotels Group PLC ADR(e) – 32,368,373 544,903
Level(3) Communications, Inc.* 102,536,060(b) – –
Level(3) Communications, Inc.15% Convertible Senior Notes due 2013(e) – 102,536,060(b) 3,045,066(d)
Vulcan Materials Company – 178,824,478 416,482
507,313,240 788,117,420 27,836,615
Small-Cap Fund
Dillards, Inc. – Class A(e) – 187,123,566 126,300
DineEquity, Inc.* – 29,314,907 –
Potlatch Corporation(e) 2,334,988 54,691,750 –
Quicksilver Resources Inc.* 34,984,102 – –
Quicksilver Resources Inc.,7.125% Senior Notes due 4/1/16 11,408,575 – 774,885(d)
Saks Incorporated* 8,521,129 8,292,311 –
Saks Incorporated7.5% Convertible Notes due 12/1/13 26,817,806 – 36,872(d)
Service Corporation International – 73,642,166 4,524,468
Texas Industries, Inc.* – – –
tw telecom, inc.*(e) – 136,145,638 –
Vail Resorts, Inc. – – 2,487,750
The Washington Post Company – Class B 49,304,540 – 7,806,895
The Wendy’s Company 474,100 – 2,790,100
133,845,240 489,210,338 18,547,270
International Fund
Manabi Holding S.A.* – – –
Melco International Development Limited(e) 14,840,221 – 100,782
$ 14,840,221 $ – $ 100,782
* Non-income producing(a) Common stock unless otherwise noted.(b) Convertible notes exchanged for common stock.(c) Dividend income unless otherwise noted.(d) Interest income.(e) Not an afffiliate at the end of the period.
Note 8. Illiquid SecuritiesThe International Fund owns 91,000 shares of Manabi Holding S.A. These shares were acquired directlyfrom the issuer in a private placement. They are considered restricted securities within the meaning ofRule 144 promulgated under the Securities Act of 1933. Prior to an initial public offering, shares aresubject to other selling restrictions such as a right of first offer for the benefit of other shareholders.
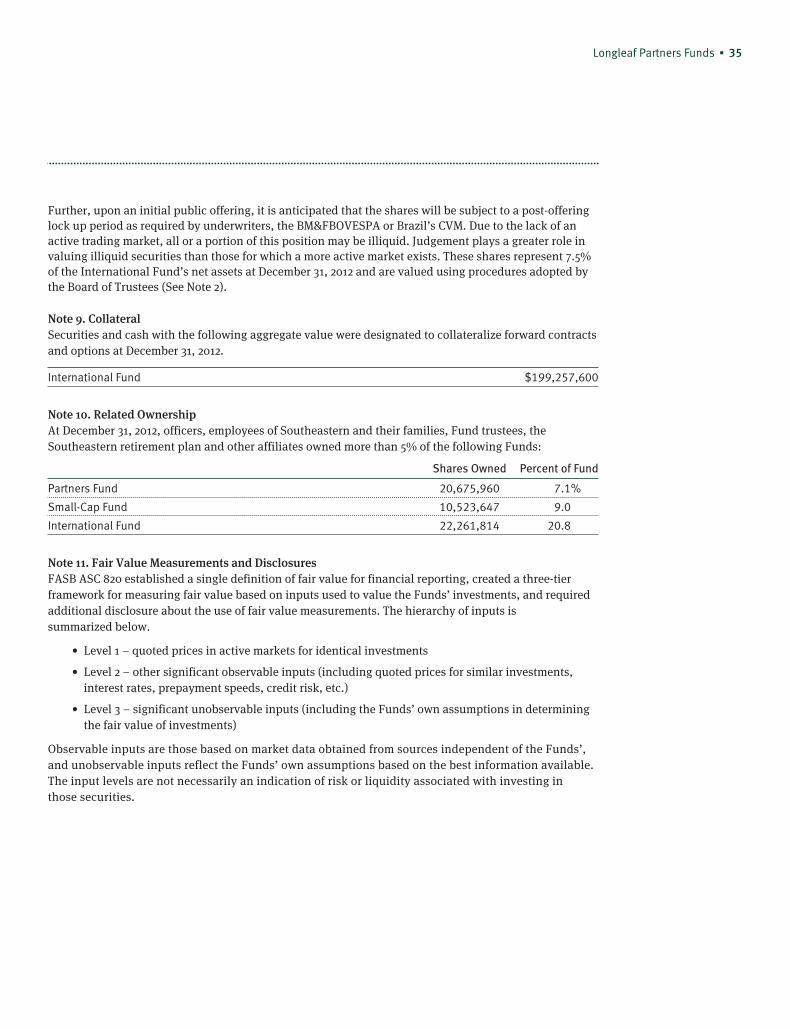
Longleaf Partners Funds ▪ 35
Further, upon an initial public offering, it is anticipated that the shares will be subject to a post-offeringlock up period as required by underwriters, the BM&FBOVESPA or Brazil’s CVM. Due to the lack of anactive trading market, all or a portion of this position may be illiquid. Judgement plays a greater role invaluing illiquid securities than those for which a more active market exists. These shares represent 7.5%of the International Fund’s net assets at December 31, 2012 and are valued using procedures adopted bythe Board of Trustees (See Note 2).
Note 9. CollateralSecurities and cash with the following aggregate value were designated to collateralize forward contractsand options at December 31, 2012.
International Fund $199,257,600
Note 10. Related OwnershipAt December 31, 2012, officers, employees of Southeastern and their families, Fund trustees, theSoutheastern retirement plan and other affiliates owned more than 5% of the following Funds:
Shares Owned Percent of Fund
Partners Fund 20,675,960 7.1%
Small-Cap Fund 10,523,647 9.0
International Fund 22,261,814 20.8
Note 11. Fair Value Measurements and DisclosuresFASB ASC 820 established a single definition of fair value for financial reporting, created a three-tierframework for measuring fair value based on inputs used to value the Funds’ investments, and requiredadditional disclosure about the use of fair value measurements. The hierarchy of inputs issummarized below.
• Level 1 – quoted prices in active markets for identical investments
• Level 2 – other significant observable inputs (including quoted prices for similar investments,interest rates, prepayment speeds, credit risk, etc.)
• Level 3 – significant unobservable inputs (including the Funds’ own assumptions in determiningthe fair value of investments)
Observable inputs are those based on market data obtained from sources independent of the Funds’,and unobservable inputs reflect the Funds’ own assumptions based on the best information available.The input levels are not necessarily an indication of risk or liquidity associated with investing inthose securities.
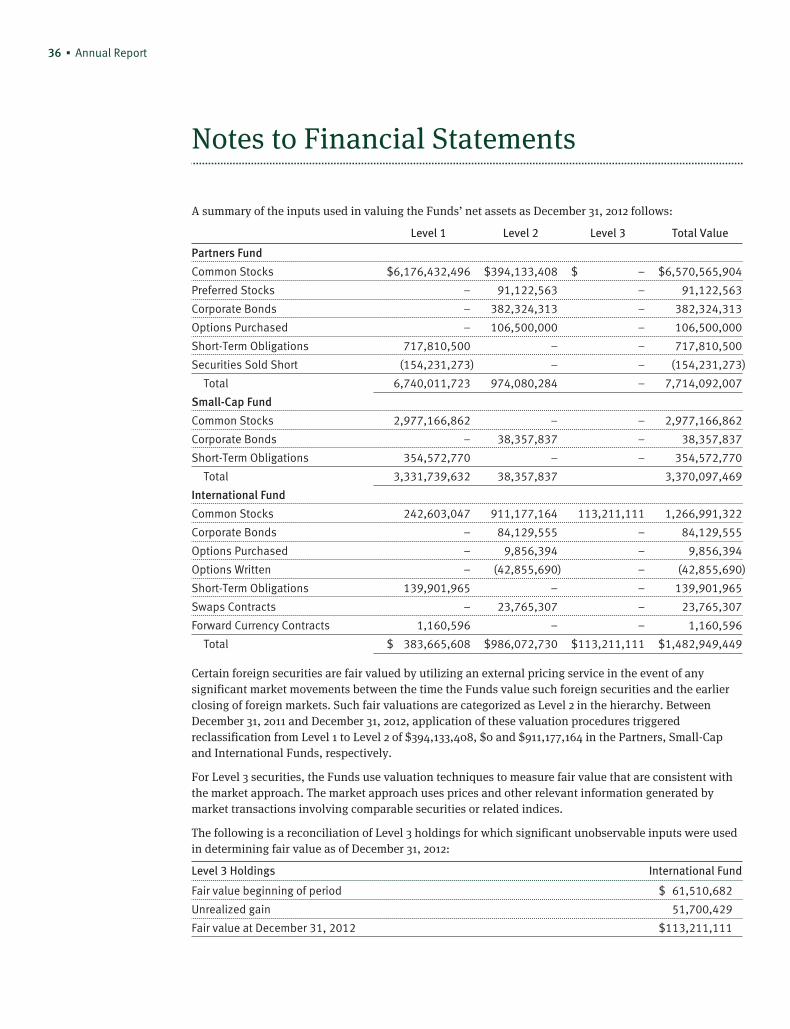
36 ▪ Annual Report
Notes to Financial Statements
A summary of the inputs used in valuing the Funds’ net assets as December 31, 2012 follows:
Level 1 Level 2 Level 3 Total Value
Partners Fund
Common Stocks $6,176,432,496 $394,133,408 $ – $6,570,565,904
Preferred Stocks – 91,122,563 – 91,122,563
Corporate Bonds – 382,324,313 – 382,324,313
Options Purchased – 106,500,000 – 106,500,000
Short-Term Obligations 717,810,500 – – 717,810,500
Securities Sold Short (154,231,273) – – (154,231,273)
Total 6,740,011,723 974,080,284 – 7,714,092,007
Small-Cap Fund
Common Stocks 2,977,166,862 – – 2,977,166,862
Corporate Bonds – 38,357,837 – 38,357,837
Short-Term Obligations 354,572,770 – – 354,572,770
Total 3,331,739,632 38,357,837 3,370,097,469
International Fund
Common Stocks 242,603,047 911,177,164 113,211,111 1,266,991,322
Corporate Bonds – 84,129,555 – 84,129,555
Options Purchased – 9,856,394 – 9,856,394
Options Written – (42,855,690) – (42,855,690)
Short-Term Obligations 139,901,965 – – 139,901,965
Swaps Contracts – 23,765,307 – 23,765,307
Forward Currency Contracts 1,160,596 – – 1,160,596
Total $ 383,665,608 $986,072,730 $113,211,111 $1,482,949,449
Certain foreign securities are fair valued by utilizing an external pricing service in the event of anysignificant market movements between the time the Funds value such foreign securities and the earlierclosing of foreign markets. Such fair valuations are categorized as Level 2 in the hierarchy. BetweenDecember 31, 2011 and December 31, 2012, application of these valuation procedures triggeredreclassification from Level 1 to Level 2 of $394,133,408, $0 and $911,177,164 in the Partners, Small-Capand International Funds, respectively.
For Level 3 securities, the Funds use valuation techniques to measure fair value that are consistent withthe market approach. The market approach uses prices and other relevant information generated bymarket transactions involving comparable securities or related indices.
The following is a reconciliation of Level 3 holdings for which significant unobservable inputs were usedin determining fair value as of December 31, 2012:
Level 3 Holdings International Fund
Fair value beginning of period $ 61,510,682
Unrealized gain 51,700,429
Fair value at December 31, 2012 $113,211,111
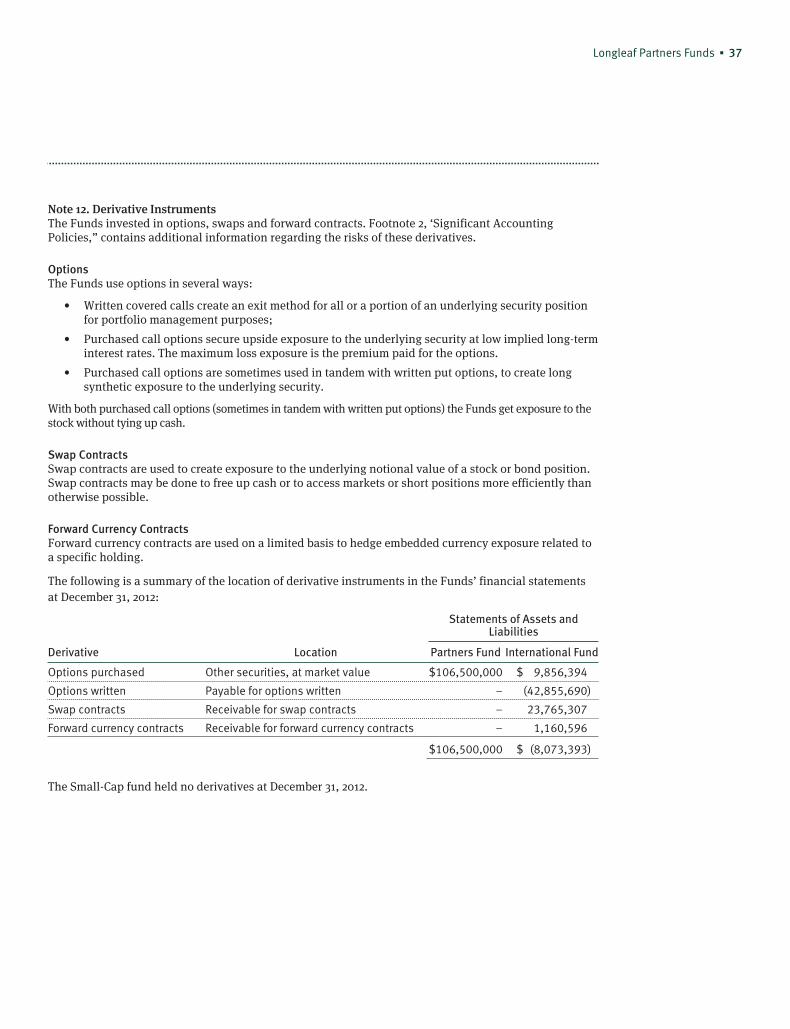
Longleaf Partners Funds ▪ 37
Note 12. Derivative InstrumentsThe Funds invested in options, swaps and forward contracts. Footnote 2, ‘Significant AccountingPolicies,” contains additional information regarding the risks of these derivatives.
OptionsThe Funds use options in several ways:
• Written covered calls create an exit method for all or a portion of an underlying security positionfor portfolio management purposes;
• Purchased call options secure upside exposure to the underlying security at low implied long-terminterest rates. The maximum loss exposure is the premium paid for the options.
• Purchased call options are sometimes used in tandem with written put options, to create longsynthetic exposure to the underlying security.
With both purchased call options (sometimes in tandem with written put options) the Funds get exposure to thestock without tying up cash.
Swap ContractsSwap contracts are used to create exposure to the underlying notional value of a stock or bond position.Swap contracts may be done to free up cash or to access markets or short positions more efficiently thanotherwise possible.
Forward Currency ContractsForward currency contracts are used on a limited basis to hedge embedded currency exposure related toa specific holding.
The following is a summary of the location of derivative instruments in the Funds’ financial statementsat December 31, 2012:
Statements of Assets andLiabilities
Derivative Location Partners Fund International Fund
Options purchased Other securities, at market value $106,500,000 $ 9,856,394
Options written Payable for options written – (42,855,690)
Swap contracts Receivable for swap contracts – 23,765,307
Forward currency contracts Receivable for forward currency contracts – 1,160,596
$106,500,000 $ (8,073,393)
The Small-Cap fund held no derivatives at December 31, 2012.
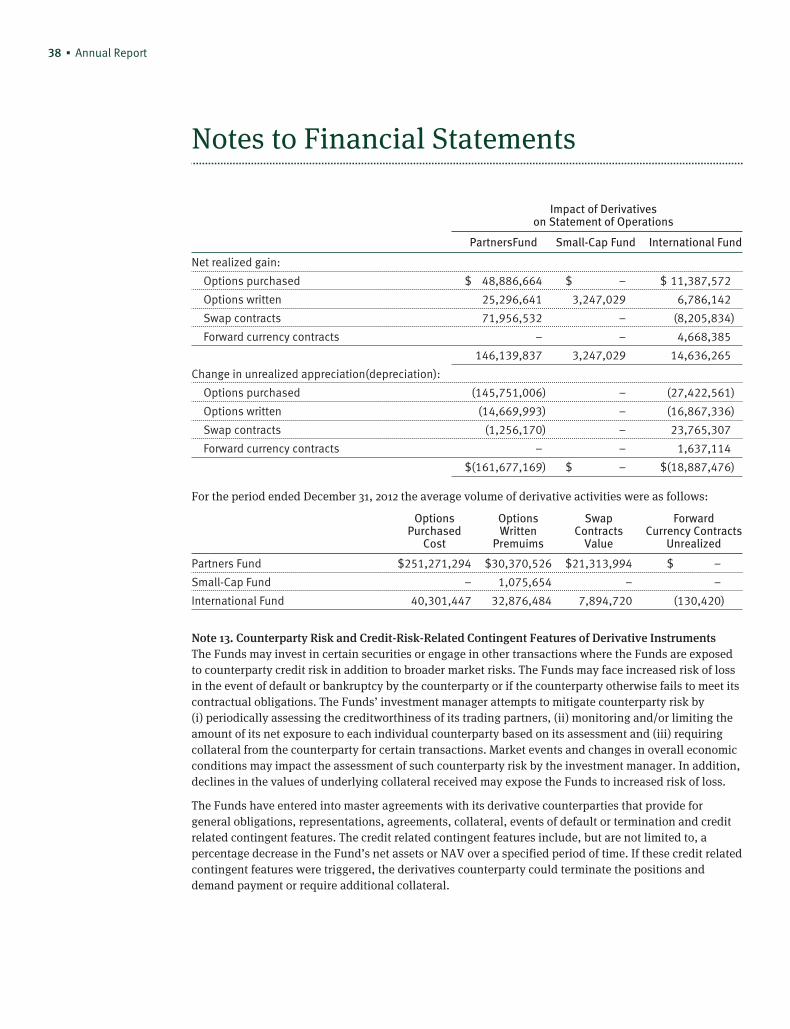
38 ▪ Annual Report
Notes to Financial Statements
Impact of Derivativeson Statement of Operations
PartnersFund Small-Cap Fund International Fund
Net realized gain:
Options purchased $ 48,886,664 $ – $ 11,387,572
Options written 25,296,641 3,247,029 6,786,142
Swap contracts 71,956,532 – (8,205,834)
Forward currency contracts – – 4,668,385
146,139,837 3,247,029 14,636,265
Change in unrealized appreciation(depreciation):
Options purchased (145,751,006) – (27,422,561)
Options written (14,669,993) – (16,867,336)
Swap contracts (1,256,170) – 23,765,307
Forward currency contracts – – 1,637,114
$(161,677,169) $ – $(18,887,476)
For the period ended December 31, 2012 the average volume of derivative activities were as follows:
OptionsPurchased
Cost
OptionsWritten
Premuims
SwapContracts
Value
ForwardCurrency Contracts
Unrealized
Partners Fund $251,271,294 $30,370,526 $21,313,994 $ –
Small-Cap Fund – 1,075,654 – –
International Fund 40,301,447 32,876,484 7,894,720 (130,420)
Note 13. Counterparty Risk and Credit-Risk-Related Contingent Features of Derivative InstrumentsThe Funds may invest in certain securities or engage in other transactions where the Funds are exposedto counterparty credit risk in addition to broader market risks. The Funds may face increased risk of lossin the event of default or bankruptcy by the counterparty or if the counterparty otherwise fails to meet itscontractual obligations. The Funds’ investment manager attempts to mitigate counterparty risk by(i) periodically assessing the creditworthiness of its trading partners, (ii) monitoring and/or limiting theamount of its net exposure to each individual counterparty based on its assessment and (iii) requiringcollateral from the counterparty for certain transactions. Market events and changes in overall economicconditions may impact the assessment of such counterparty risk by the investment manager. In addition,declines in the values of underlying collateral received may expose the Funds to increased risk of loss.
The Funds have entered into master agreements with its derivative counterparties that provide forgeneral obligations, representations, agreements, collateral, events of default or termination and creditrelated contingent features. The credit related contingent features include, but are not limited to, apercentage decrease in the Fund’s net assets or NAV over a specified period of time. If these credit relatedcontingent features were triggered, the derivatives counterparty could terminate the positions anddemand payment or require additional collateral.
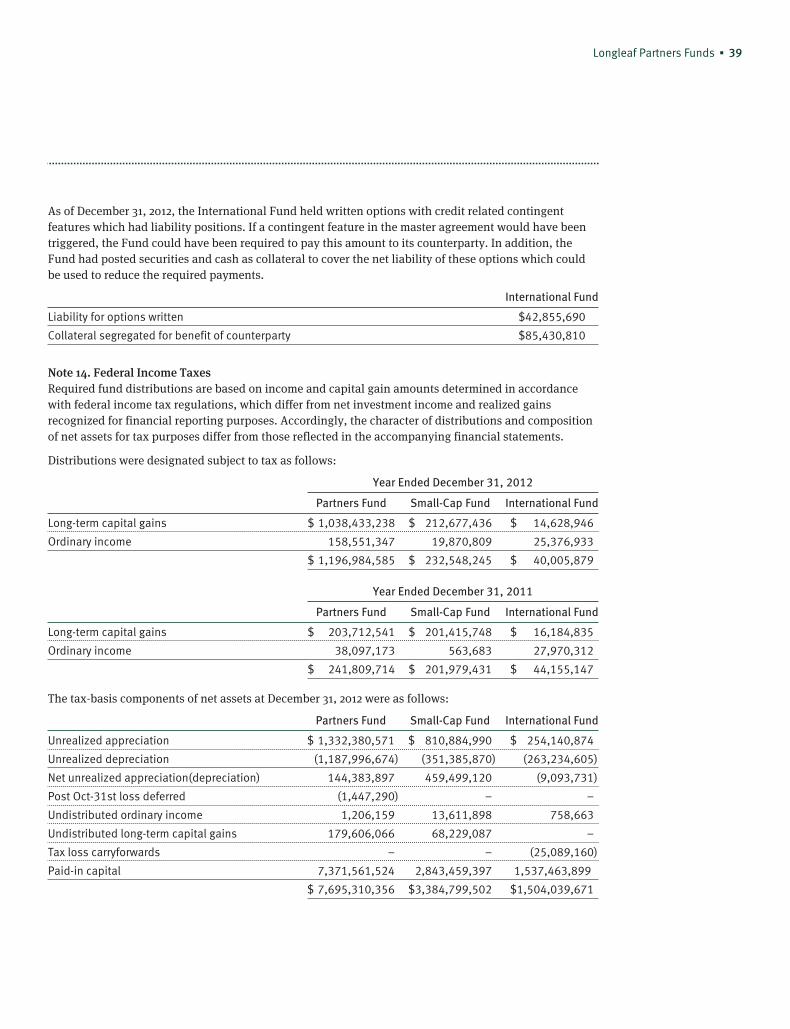
Longleaf Partners Funds ▪ 39
As of December 31, 2012, the International Fund held written options with credit related contingentfeatures which had liability positions. If a contingent feature in the master agreement would have beentriggered, the Fund could have been required to pay this amount to its counterparty. In addition, theFund had posted securities and cash as collateral to cover the net liability of these options which couldbe used to reduce the required payments.
International Fund
Liability for options written $42,855,690
Collateral segregated for benefit of counterparty $85,430,810
Note 14. Federal Income TaxesRequired fund distributions are based on income and capital gain amounts determined in accordancewith federal income tax regulations, which differ from net investment income and realized gainsrecognized for financial reporting purposes. Accordingly, the character of distributions and compositionof net assets for tax purposes differ from those reflected in the accompanying financial statements.
Distributions were designated subject to tax as follows:
Year Ended December 31, 2012
Partners Fund Small-Cap Fund International Fund
Long-term capital gains $ 1,038,433,238 $ 212,677,436 $ 14,628,946
Ordinary income 158,551,347 19,870,809 25,376,933
$ 1,196,984,585 $ 232,548,245 $ 40,005,879
Year Ended December 31, 2011
Partners Fund Small-Cap Fund International Fund
Long-term capital gains $ 203,712,541 $ 201,415,748 $ 16,184,835
Ordinary income 38,097,173 563,683 27,970,312
$ 241,809,714 $ 201,979,431 $ 44,155,147
The tax-basis components of net assets at December 31, 2012 were as follows:
Partners Fund Small-Cap Fund International Fund
Unrealized appreciation $ 1,332,380,571 $ 810,884,990 $ 254,140,874
Unrealized depreciation (1,187,996,674) (351,385,870) (263,234,605)
Net unrealized appreciation(depreciation) 144,383,897 459,499,120 (9,093,731)
Post Oct-31st loss deferred (1,447,290) – –
Undistributed ordinary income 1,206,159 13,611,898 758,663
Undistributed long-term capital gains 179,606,066 68,229,087 –
Tax loss carryforwards – – (25,089,160)
Paid-in capital 7,371,561,524 2,843,459,397 1,537,463,899
$ 7,695,310,356 $3,384,799,502 $1,504,039,671
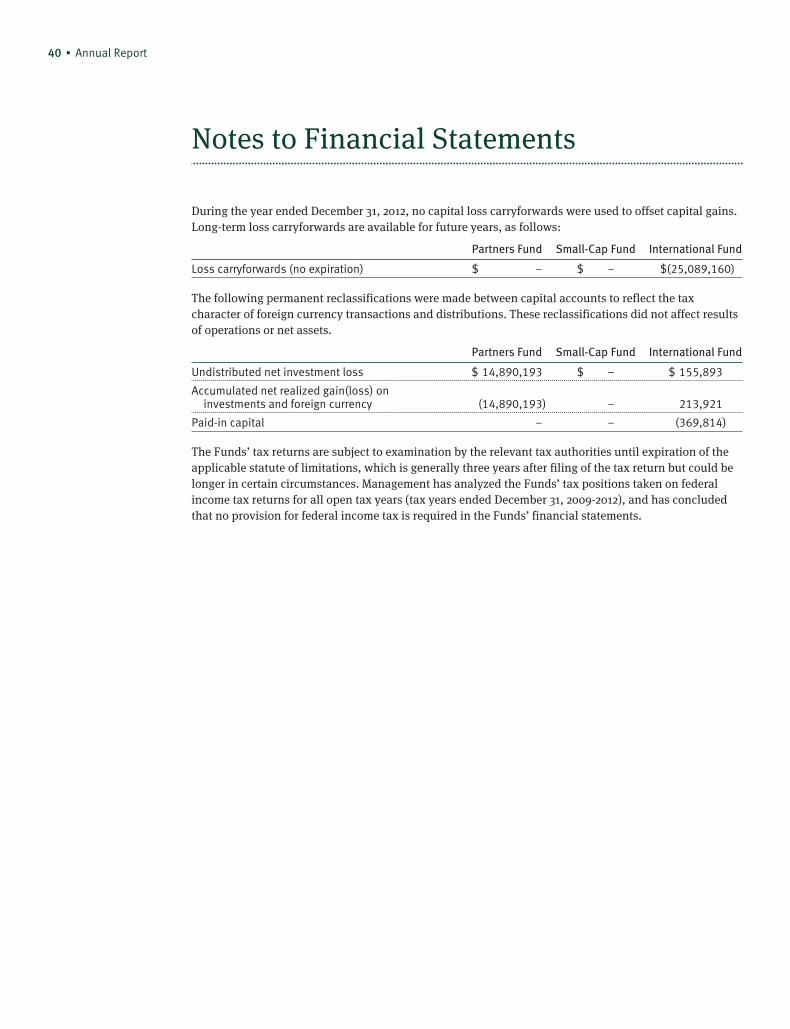
40 ▪ Annual Report
Notes to Financial Statements
During the year ended December 31, 2012, no capital loss carryforwards were used to offset capital gains.Long-term loss carryforwards are available for future years, as follows:
Partners Fund Small-Cap Fund International Fund
Loss carryforwards (no expiration) $ – $ – $(25,089,160)
The following permanent reclassifications were made between capital accounts to reflect the taxcharacter of foreign currency transactions and distributions. These reclassifications did not affect resultsof operations or net assets.
Partners Fund Small-Cap Fund International Fund
Undistributed net investment loss $ 14,890,193 $ – $ 155,893
Accumulated net realized gain(loss) oninvestments and foreign currency (14,890,193) – 213,921
Paid-in capital – – (369,814)
The Funds’ tax returns are subject to examination by the relevant tax authorities until expiration of theapplicable statute of limitations, which is generally three years after filing of the tax return but could belonger in certain circumstances. Management has analyzed the Funds’ tax positions taken on federalincome tax returns for all open tax years (tax years ended December 31, 2009-2012), and has concludedthat no provision for federal income tax is required in the Funds’ financial statements.

This page is intentionally left blank.
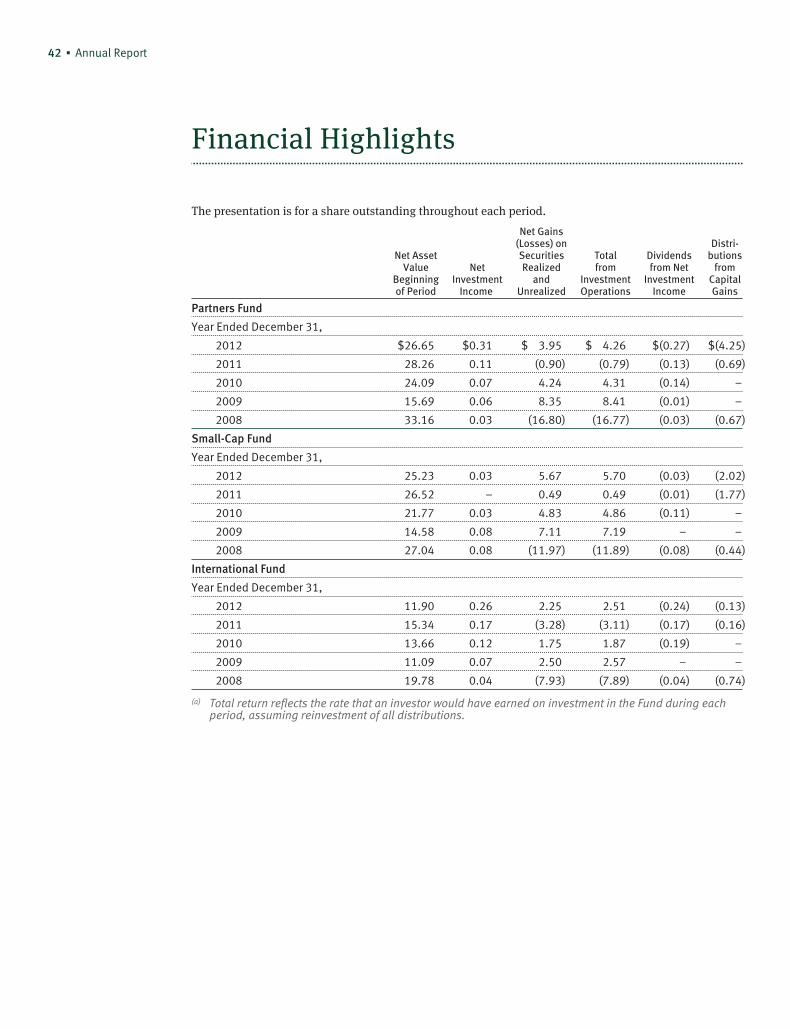
42 ▪ Annual Report
Financial Highlights
The presentation is for a share outstanding throughout each period.
Net AssetValue
Beginningof Period
NetInvestment
Income
Net Gains(Losses) onSecuritiesRealized
andUnrealized
Totalfrom
InvestmentOperations
Dividendsfrom Net
InvestmentIncome
Distri-butions
fromCapitalGains
Partners Fund
Year Ended December 31,
2012 $26.65 $0.31 $ 3.95 $ 4.26 $(0.27) $(4.25)
2011 28.26 0.11 (0.90) (0.79) (0.13) (0.69)
2010 24.09 0.07 4.24 4.31 (0.14) –
2009 15.69 0.06 8.35 8.41 (0.01) –
2008 33.16 0.03 (16.80) (16.77) (0.03) (0.67)
Small-Cap Fund
Year Ended December 31,
2012 25.23 0.03 5.67 5.70 (0.03) (2.02)
2011 26.52 – 0.49 0.49 (0.01) (1.77)
2010 21.77 0.03 4.83 4.86 (0.11) –
2009 14.58 0.08 7.11 7.19 – –
2008 27.04 0.08 (11.97) (11.89) (0.08) (0.44)
International Fund
Year Ended December 31,
2012 11.90 0.26 2.25 2.51 (0.24) (0.13)
2011 15.34 0.17 (3.28) (3.11) (0.17) (0.16)
2010 13.66 0.12 1.75 1.87 (0.19) –
2009 11.09 0.07 2.50 2.57 – –
2008 19.78 0.04 (7.93) (7.89) (0.04) (0.74)
(a) Total return reflects the rate that an investor would have earned on investment in the Fund during eachperiod, assuming reinvestment of all distributions.

Longleaf Partners Funds ▪ 43
Distri-butions
fromReturn ofCapital
TotalDistri-
butions
NetAssetValueEnd ofPeriod
TotalReturn(a)
Net AssetsEnd ofPeriod
(thousands)
Ratio ofExpenses
toAverage
Net Assets
Ratio ofNet
InvestmentIncome
toAverage
Net Assets
PortfolioTurnover
Rate
$ – $(4.52) $26.39 16.53% $7,695,310 0.91% 0.90% 25.53%
– (0.82) 26.65 (2.85) 7,953,798 0.91 0.39 23.55
– (0.14) 28.26 17.89 8,584,963 0.91 0.23 36.72
– (0.01) 24.09 53.60 8,039,189 0.91 0.26 28.54
– (0.70) 15.69 (50.60) 5,788,782 0.90 0.14 29.68
– (2.05) 28.88 22.96 3,384,800 0.92 0.07 14.70
– (1.78) 25.23 1.79 3,037,823 0.92 – 37.33
– (0.11) 26.52 22.32 3,056,707 0.93 0.14 16.67
– – 21.77 49.31 2,500,501 0.95 0.45 12.93
(0.05) (0.57) 14.58 (43.90) 1,803,685 0.93 0.37 22.61
– (0.37) 14.04 21.23 1,504,040 1.29 1.82 22.59
– (0.33) 11.90 (20.29) 1,571,156 1.37 1.07 48.87
– (0.19) 15.34 13.69 2,211,191 1.38 0.76 27.80
– – 13.66 23.17 2,165,459 1.59 0.55 20.15
(0.02) (0.80) 11.09 (39.60) 2,041,338 1.60 0.27 43.94
44 ▪ Annual Report
Report of Independent Registered PublicAccounting Firm
To the Trustees of Longleaf Partners Funds Trust and Shareholders of Longleaf Partners Fund, LongleafPartners Small-Cap Fund, and Longleaf Partners International Fund:
In our opinion, the accompanying statements of assets and liabilities, including the portfolios ofinvestments, and the related statements of operations and of changes in net assets and the financialhighlights present fairly, in all material respects, the financial position of Longleaf Partners Funds Trust(comprised of Longleaf Partners Fund, Longleaf Partners Small-Cap Fund, and Longleaf PartnersInternational Fund hereafter referred to as the “Funds”) at December 31, 2012, and the results of each oftheir operations for the year then ended, and the changes in each of their net assets for each of the twoyears in the period then ended and the financial highlights for each of the five years in the period thenended, in conformity with accounting principles generally accepted in the United States of America.These financial statements and financial highlights (hereafter referred to as “financial statements”) arethe responsibility of the Funds’ management; our responsibility is to express an opinion on thesefinancial statements based on our audits. We conducted our audits of these financial statements inaccordance with the standards of the Public Company Accounting Oversight Board (United States). Thosestandards require that we plan and perform the audit to obtain reasonable assurance about whether thefinancial statements are free of material misstatement. An audit includes examining, on a test basis,evidence supporting the amounts and disclosures in the financial statements, assessing the accountingprinciples used and significant estimates made by management, and evaluating the overall financialstatement presentation. We believe that our audits, which included confirmation of securities atDecember 31, 2012 by correspondence with the custodian and brokers, provide a reasonable basis for ouropinion.
PricewaterhouseCoopers LLPBaltimore, MarylandFebruary 13, 2013
Longleaf Partners Funds ▪ 45
Statement Regarding Basis for Approvalof Investment Advisory Contracts
Longleaf Partners Fund, Longleaf Partners Small-Cap Fund, and Longleaf Partners International Fund(the “Funds”) are non-diversified and each is a series of Longleaf Partners Funds Trust, a Massachusettsbusiness trust which is an open-end management investment company registered with the US Securitiesand Exchange Commission. Southeastern Asset Management, Inc. (“Southeastern”) acts as investmentcounsel and fund administrator under agreements with each Fund (the “Agreements”). Trustees for eachFund, including Trustees who are not “interested persons” of the Funds as that term is defined under theInvestment Company Act of 1940, as amended (the “Independent Trustees”), are responsible foroverseeing the performance of Southeastern and meet annually to review information specific to eachFund to determine whether or not the Agreements with Southeastern ought to be approved.
On August 7, 2012, Trustees for each Fund met to determine whether the Agreements with Southeasternshould be approved for the period November 1, 2012 to October 31, 2013. In advance of the meeting, theIndependent Trustees reviewed materials relating to the existing Agreements, including an independentexpense and performance summary prepared by Lipper Inc. The Lipper materials included comparisonsof each Fund with other funds in a comparable Lipper universe, as well as additional funds selected forcomparison by the Independent Trustees. Trustees reviewed this comparative Lipper data regardingmanagement and non-management fees and expenses, portfolio turnover, brokerage commissions,investment performance and long-term performance in light of total fund expenses (the “Lipper Data”).Other materials reviewed included information concerning the nature, extent and quality ofSoutheastern’s services, Southeastern’s profitability and financial results, including advisory fee revenueand separate account advisory fee schedules, and whether economies of scale are, or would be, sharedwith Fund investors as assets under management increase. Based on the information reviewed, as well asinformation received throughout the year and first-hand interaction with Southeastern’s personnel, theTrustees for each Fund unanimously approved the selection of Southeastern as adviser andadministrator, and the amounts to be paid by each Fund under Agreements with Southeastern.
In considering the Agreements, the Trustees did not identify any single factor as all-important orcontrolling, and each Trustee may have weighed various factors differently. The following summary doesnot detail all the factors considered, but discusses the material factors and the Trustees’ conclusions.
Nature, Extent and Quality of Services ProvidedWhile the investment performance of each Fund and Southeastern (discussed below) is relevant to anevaluation of the nature, extent and quality of services provided, the Trustees also consideredSoutheastern’s governing principles as significant. These principles are stated at the beginning of theFunds’ Prospectus:
• We will treat your investment as if it were our own.
• We will remain significant investors in Longleaf Partners Funds.
• We will invest for the long-term, while striving to maximize returns and minimize business, financial,purchasing power, regulatory and market risks.
• We will choose each equity investment based on its discount from our appraisal of corporate intrinsicvalue, its financial strength, its management, its competitive position, and our assessment of its futureearnings potential.
• We will focus our assets in our best ideas.
• We will not impose loads or 12b-l charges on mutual fund shareholders.
• We will consider closing to new investors if closing would benefit existing clients.
46 ▪ Annual Report
Statement Regarding Basis for Approvalof Investment Advisory Contracts
• We will discourage short-term speculators and market timers.
• We will continue our efforts to enhance shareholder services.
• We will communicate with our investment partners as candidly as possible.
The Trustees concluded that Southeastern had been successful in operating each Fund under thesegoverning principles, and that Longleaf shareholders had benefited from Southeastern’s execution of itsinvestment discipline over the long term, as well as its shareholder oriented approach. Southeastern’sactions on behalf of shareholders have gone beyond stock selection and included active engagementwith portfolio companies when necessary and involvement in the market structure debate. The Trusteeslooked favorably on Southeastern’s unique Code of Ethics requirement that employees use Longleaf forvirtually all public equity investing. The Trustees noted that, as one of the largest shareholder groups,Southeastern and its affiliates’ interests are aligned with other shareholders, facing the same risks,paying the same fees, and sharing the same motivation to achieve positive absolute returns. In addition,significant investment by Southeastern’s personnel has contributed to the economies of scale which havelowered fees and expenses for shareholders over time.
The Trustees recognized Southeastern’s consistent implementation of the governing principles, notingthat Southeastern and the Funds had continued to receive recognition in the press, and among industryobservers and participants, for the quality of its investment process, as well as its shareholderorientation and integrity. The Trustees expressed confidence in the research, analysis, knowledge and37-years’ experience of Southeastern. The Trustees concluded that shareholders buy the Funds primarilyto gain access to Southeastern’s investment expertise and shareholder orientation, and weighed thisheavily in approving the Agreements.
Trustees concluded that Southeastern’s administrative services, including fund accounting, legal,trading, shareholder reporting, compliance and oversight of Fund operations, had been high quality, andfavored approving Southeastern for another year. Trustees concluded that Southeastern had been open,responsive, timely and cooperative in providing information required to oversee the Funds.
Comparative Investment Performance of the Funds and AdviserUsing the Lipper Data, the Trustees compared each Fund through periods ended June 30, 2012, to othersimilar funds, as well as the following objective benchmarks: inflation plus 10%, and each Fund’smarket index plus 200 basis points. All three Longleaf Partners Funds’ long-term results laggedinflation plus 10%, but compared favorably to market indices. A significant factor to all Trustees wasSoutheastern’s courage to stand behind its convictions, following strict application of its investmentdiscipline, often buying or holding companies currently out of favor. The Trustees concluded that thisapproach is consistent with each Fund’s long-term investment horizon. Regarding the specifics of eachFund, the Trustees noted that Longleaf Partners Small-Cap Fund had rebounded strongly since the2008-2009 financial crisis, materially exceeding the Russell 2000 index for that period. Longleaf PartnersFund and Longleaf Partners International Fund had given back some of the post financial crisis gainsthat had been achieved through June 2010 and 2011, but Trustees discussed individual stocks and price-to-value ratios in these funds with Southeastern, who reported that significant unrealized valuecontinued to be present. In the context of historical analysis of Southeastern’s price-to-value ratios andtraditional pay-off patterns in Southeastern’s long-term holdings, the Trustees believed it was reasonableto conclude that Southeastern’s data supported the prospect of improved absolute returns over the longterm.
Longleaf Partners Funds ▪ 47
The Trustees reviewed after-tax performance information for each Fund and noted that taxableshareholders were benefited by Southeastern’s long-term, low turnover, tax efficient management styleas compared to funds with more frequent trading.
The Costs of the Services to be Provided and Profits to be Realized by the Investment Adviser and its Affiliatesfrom the Relationship with the FundThe Trustees considered each Fund’s management fee rates and expense ratios relative to industryaverages, advisory fees charged to Southeastern’s private account clients and similar funds selected byLipper and the Independent Trustees.
While Southeastern’s management fees for each Fund were above average, non- management expenseswere below average, due in part to Southeastern’s performance and/or oversight of various operatingfunctions. While the Trustees considered these fees separately, they viewed total expenses borne byshareholders as more important. In addition, the Trustees weighed favorably the fact that Southeasternhad foregone additional fee income in each Fund’s early years through application of the expenselimitation, and in later years by closing each Fund to protect shareholder interests. The Trustees notedthat Longleaf Partners Fund had been closed from July 2004 to January 2008, Longleaf PartnersInternational Fund had been closed from February 2004 to July 2006, and Longleaf Partners Small-CapFund had been closed since July 1997. The Trustees also recognized that Southeastern does not have anaffiliated entity providing transfer agent, custodian, broker dealer or services other than investmentmanagement and fund administration. Accordingly, Southeastern neither generates additional fees foritself through related entities, nor allocates Fund brokerage to pay its expenses. The transparency ofSoutheastern’s fees and lack of supplemental sources of revenue was a significant factor to the Trustees.
With respect to Longleaf Partners Fund and Longleaf Partners International Fund for the five andten year period ended June 30, 2012, the Funds charged below average total expenses when compared totheir Lipper universe. With respect to Longleaf Partners Small-Cap Fund, for both the 5 and 10 yearperiods, it generated above average returns with below average expenses compared to its Lipperuniverse. The Trustees took into account recent as well as long-term performance, Southeastern’s effortsto strengthen the international research team, the costs of maintaining overseas offices, as well as areduction in fees introduced in 2011, when evaluating the fee level of the International Fund. In light ofthe qualifications, experience, reputation, and performance of Southeastern with respect to each Fund,as well as the steps taken to limit or reduce receipt of fees over time, the Trustees concluded that feespaid to Southeastern by each Fund are reasonable.
The Trustees compared the fees paid to Southeastern by the Funds with those paid by Southeastern’sprivate account clients. To the extent private account fees were lower than Fund fees, the Trusteesconcluded that the range of services provided to the Funds is more extensive and the risks associatedwith operating SEC registered, publicly traded mutual funds are greater. Funds are more work because ofthe complex overlay of regulatory, tax and accounting issues which are unique to mutual funds. Inaddition, the work required to service shareholders is more extensive because of the significantly greaternumber and managing trading is more complex because of more frequent fund flows, as well as IRSdiversification compliance. With respect to risk, not only has regulation become more complex andburdensome, but the scrutiny of regulators and shareholders has gotten more intense. The Trusteesconcluded that reasonable justifications exist to the extent that there are differences in fee rates betweenthe two lines of business.
The Trustees reviewed reports of Southeastern’s financial position, including overall revenues andexpenses of the firm, as well as an Investment Manager Profitability Analysis prepared by Lipper Inc.
48 ▪ Annual Report
Statement Regarding Basis for Approvalof Investment Advisory Contracts
While the Trustees considered the profitability of Southeastern as a whole, and jointly determined withSoutheastern a method to allocate costs between mutual fund and private account activities, they did notevaluate on a Fund-by-Fund basis Southeastern’s profitability and/or costs. Because no generallyaccepted cost allocation methodology exists, and estimating the cost of providing services on a Fundspecific basis is difficult, Southeastern provided its complete financial statements to the Trustees andstipulated conservatively for renewal purposes that its operation of each Fund should be consideredhighly profitable, at least as profitable as, if not more profitable than, investment managers with similarassets under management. The Trustees concluded that significant profits were not unreasonable givenSoutheastern’s successful investment management and strong shareholder orientation, as well as steps ithad taken to limit or reduce its fees over time. As between the Funds and private account business, theTrustees acknowledged that cost allocation methods were not precise, but felt profits derived withrespect to the Funds were reasonable. The Trustees also gave significant weight to the preferences andexpectations of individual Fund shareholders and their relative sophistication, noting that the level ofassets under management (despite closing often, no sales force, or 12b-l plan) is a direct result ofSoutheastern’s successful asset management and strong shareholder orientation. Similarly, if ashareholder wants to redeem, he or she is not constrained by the thought of having to pay a redemptionfee or to recoup a front-end load. Thus, in assessing whether the costs of Southeastern’s services and itsresulting profits are reasonable, the Trustees considered it meaningful that the Funds’ asset baseconsists of shareholders who have freely chosen to retain access to Southeastern’s services, with fulldisclosure of advisory fee rates.
The Extent to which Economies of Scale would be Realized as each Fund Grows, and whether Current FeeLevels Reflect these Economies of Scale for the Benefit of Fund Investors
Because Southeastern’s fee structure for each Fund contains a breakpoint, economies of scale will berealized as each Fund grows. The Trustees noted that Southeastern bore costs in excess of each Fund’sexpense limitation in early years, and that total expenses of each Fund have declined as a percentage ofassets over time. Because fee levels for Longleaf Partners Fund and Longleaf Partners Small-Cap Fundcurrently reflected a greater sharing of economies of scale than the fee for Longleaf PartnersInternational Fund, and in order to reward the loyalty of International Fund shareholders, Southeasternrecommended a reduction in that Fund’s breakpoint from $2.5 billion to $500 million in 2011. The higherbreakpoint had been set in expectation that the International Fund could become as large as the PartnersFund. While it could still become that large in time, Southeastern was mindful that at current assetlevels, shareholders did not benefit from the breakpoint. With this breakpoint reduction, the Trusteeswere satisfied that breakpoints of each Fund were set at appropriate levels, and economies of scalewould be shared sufficiently with Fund shareholders.
ConclusionWhile the material factors that the Trustees considered are summarized above, each individual Trusteeconsidered and weighed in the aggregate all information prior to making a renewal decision. AllTrustees, including the Independent Trustees, concluded that Southeastern’s fee structure was fair andreasonable in light of the nature and quality of services provided, and that approval of the InvestmentCounsel and Fund Administration Agreements was in the best interest of each Fund and its shareholders.

This page is intentionally left blank.
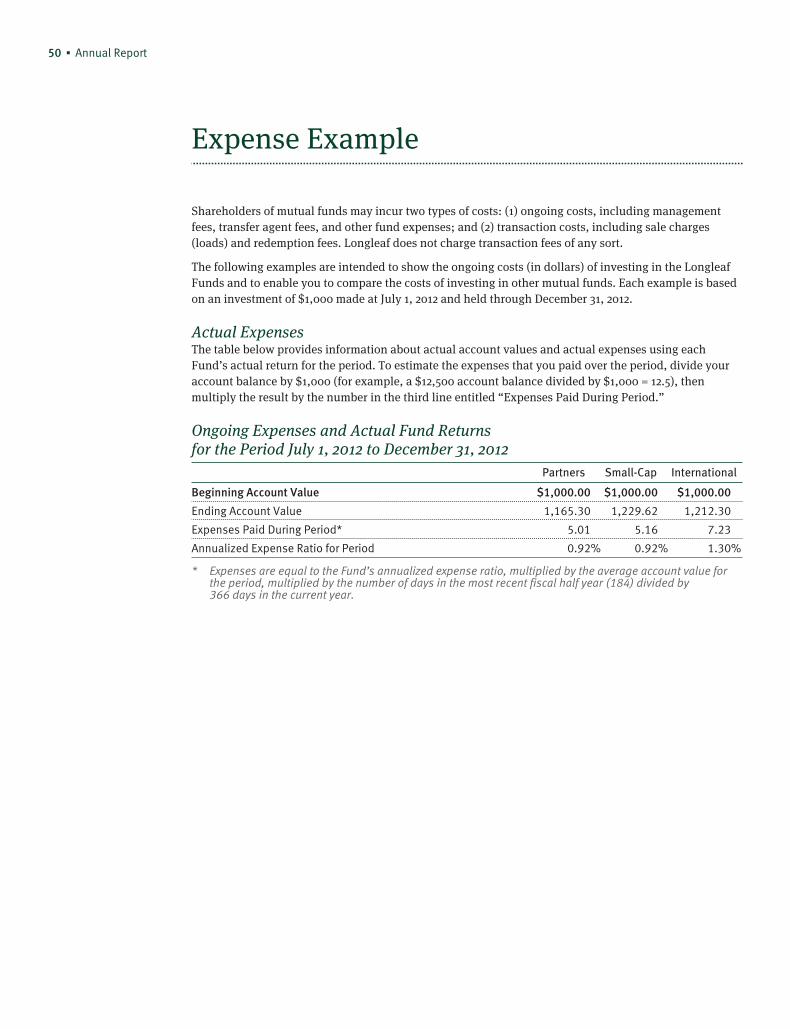
50 ▪ Annual Report
Expense Example
Shareholders of mutual funds may incur two types of costs: (1) ongoing costs, including managementfees, transfer agent fees, and other fund expenses; and (2) transaction costs, including sale charges(loads) and redemption fees. Longleaf does not charge transaction fees of any sort.
The following examples are intended to show the ongoing costs (in dollars) of investing in the LongleafFunds and to enable you to compare the costs of investing in other mutual funds. Each example is basedon an investment of $1,000 made at July 1, 2012 and held through December 31, 2012.
Actual ExpensesThe table below provides information about actual account values and actual expenses using eachFund’s actual return for the period. To estimate the expenses that you paid over the period, divide youraccount balance by $1,000 (for example, a $12,500 account balance divided by $1,000 = 12.5), thenmultiply the result by the number in the third line entitled “Expenses Paid During Period.”
Ongoing Expenses and Actual Fund Returnsfor the Period July 1, 2012 to December 31, 2012
Partners Small-Cap International
Beginning Account Value $1,000.00 $1,000.00 $1,000.00
Ending Account Value 1,165.30 1,229.62 1,212.30
Expenses Paid During Period* 5.01 5.16 7.23
Annualized Expense Ratio for Period 0.92% 0.92% 1.30%
* Expenses are equal to the Fund’s annualized expense ratio, multiplied by the average account value forthe period, multiplied by the number of days in the most recent fiscal half year (184) divided by366 days in the current year.
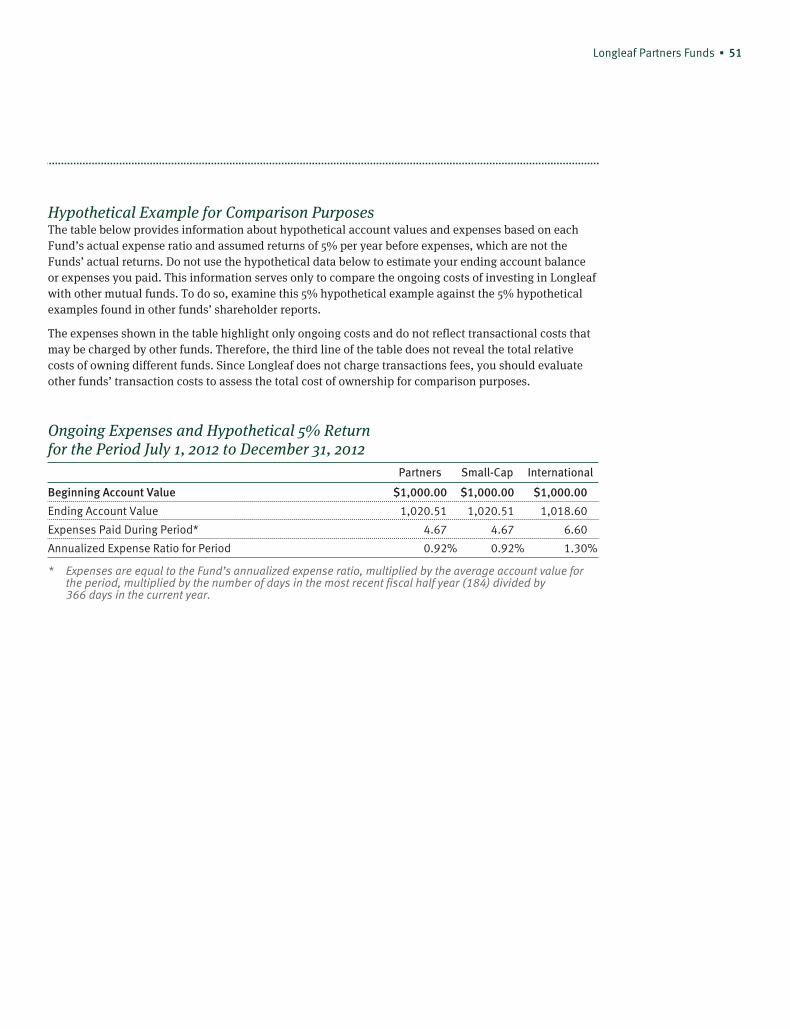
Longleaf Partners Funds ▪ 51
Hypothetical Example for Comparison PurposesThe table below provides information about hypothetical account values and expenses based on eachFund’s actual expense ratio and assumed returns of 5% per year before expenses, which are not theFunds’ actual returns. Do not use the hypothetical data below to estimate your ending account balanceor expenses you paid. This information serves only to compare the ongoing costs of investing in Longleafwith other mutual funds. To do so, examine this 5% hypothetical example against the 5% hypotheticalexamples found in other funds’ shareholder reports.
The expenses shown in the table highlight only ongoing costs and do not reflect transactional costs thatmay be charged by other funds. Therefore, the third line of the table does not reveal the total relativecosts of owning different funds. Since Longleaf does not charge transactions fees, you should evaluateother funds’ transaction costs to assess the total cost of ownership for comparison purposes.
Ongoing Expenses and Hypothetical 5% Returnfor the Period July 1, 2012 to December 31, 2012
Partners Small-Cap International
Beginning Account Value $1,000.00 $1,000.00 $1,000.00
Ending Account Value 1,020.51 1,020.51 1,018.60
Expenses Paid During Period* 4.67 4.67 6.60
Annualized Expense Ratio for Period 0.92% 0.92% 1.30%
* Expenses are equal to the Fund’s annualized expense ratio, multiplied by the average account value forthe period, multiplied by the number of days in the most recent fiscal half year (184) divided by366 days in the current year.
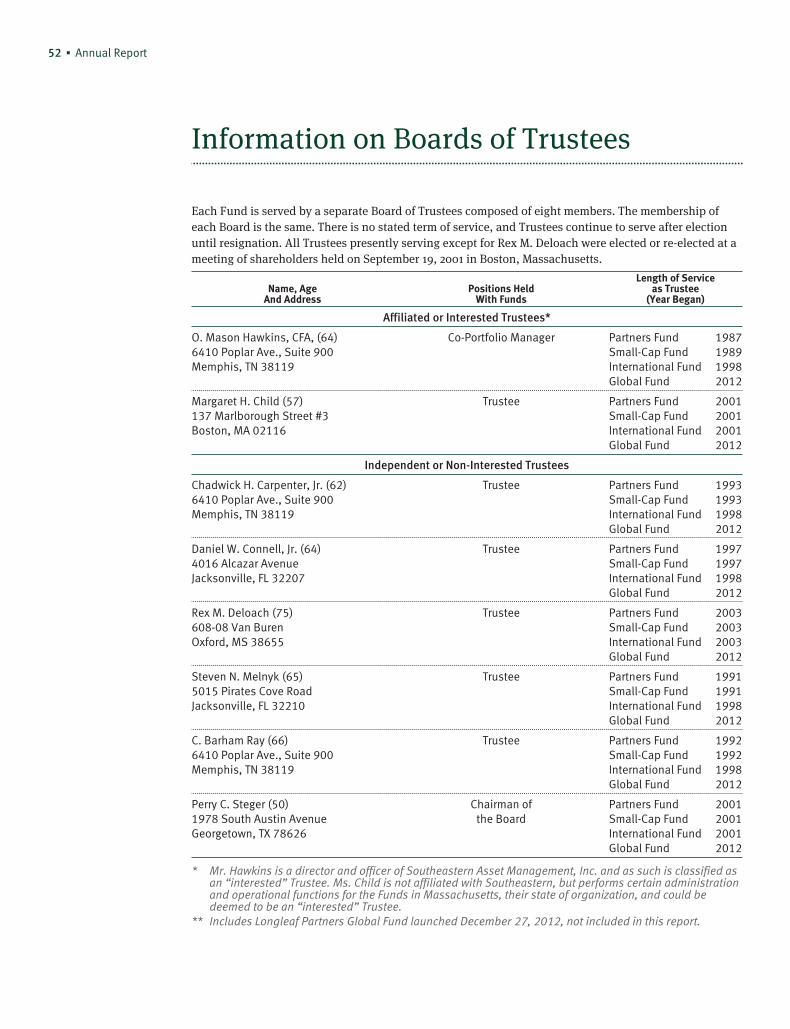
52 ▪ Annual Report
Information on Boards of Trustees
Each Fund is served by a separate Board of Trustees composed of eight members. The membership ofeach Board is the same. There is no stated term of service, and Trustees continue to serve after electionuntil resignation. All Trustees presently serving except for Rex M. Deloach were elected or re-elected at ameeting of shareholders held on September 19, 2001 in Boston, Massachusetts.
Name, AgeAnd Address
Positions HeldWith Funds
Length of Serviceas Trustee
(Year Began)
Affiliated or Interested Trustees*
O. Mason Hawkins, CFA, (64)6410 Poplar Ave., Suite 900Memphis, TN 38119
Co-Portfolio Manager Partners FundSmall-Cap FundInternational FundGlobal Fund
1987198919982012
Margaret H. Child (57)137 Marlborough Street #3Boston, MA 02116
Trustee Partners FundSmall-Cap FundInternational FundGlobal Fund
2001200120012012
Independent or Non-Interested Trustees
Chadwick H. Carpenter, Jr. (62)6410 Poplar Ave., Suite 900Memphis, TN 38119
Trustee Partners FundSmall-Cap FundInternational FundGlobal Fund
1993199319982012
Daniel W. Connell, Jr. (64)4016 Alcazar AvenueJacksonville, FL 32207
Trustee Partners FundSmall-Cap FundInternational FundGlobal Fund
1997199719982012
Rex M. Deloach (75)608-08 Van BurenOxford, MS 38655
Trustee Partners FundSmall-Cap FundInternational FundGlobal Fund
2003200320032012
Steven N. Melnyk (65)5015 Pirates Cove RoadJacksonville, FL 32210
Trustee Partners FundSmall-Cap FundInternational FundGlobal Fund
1991199119982012
C. Barham Ray (66)6410 Poplar Ave., Suite 900Memphis, TN 38119
Trustee Partners FundSmall-Cap FundInternational FundGlobal Fund
1992199219982012
Perry C. Steger (50)1978 South Austin AvenueGeorgetown, TX 78626
Chairman ofthe Board
Partners FundSmall-Cap FundInternational FundGlobal Fund
2001200120012012
* Mr. Hawkins is a director and officer of Southeastern Asset Management, Inc. and as such is classified asan “interested” Trustee. Ms. Child is not affiliated with Southeastern, but performs certain administrationand operational functions for the Funds in Massachusetts, their state of organization, and could bedeemed to be an “interested” Trustee.
** Includes Longleaf Partners Global Fund launched December 27, 2012, not included in this report.
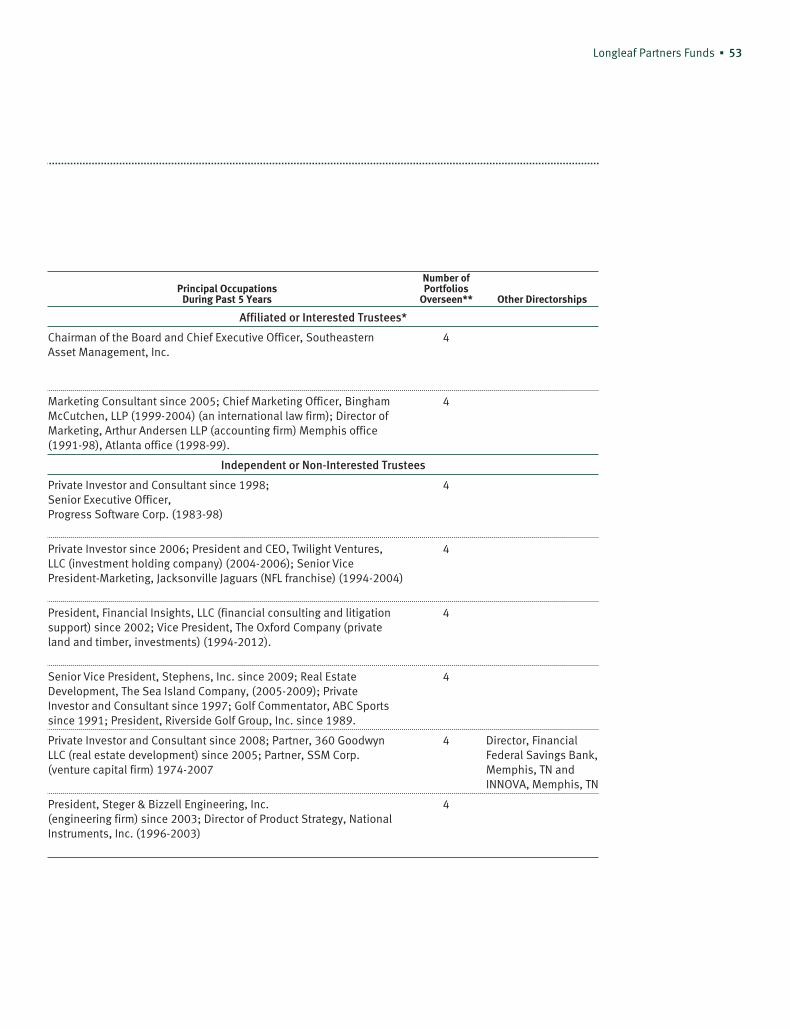
Longleaf Partners Funds ▪ 53
Principal OccupationsDuring Past 5 Years
Number ofPortfolios
Overseen** Other Directorships
Affiliated or Interested Trustees*
Chairman of the Board and Chief Executive Officer, SoutheasternAsset Management, Inc.
4
Marketing Consultant since 2005; Chief Marketing Officer, BinghamMcCutchen, LLP (1999-2004) (an international law firm); Director ofMarketing, Arthur Andersen LLP (accounting firm) Memphis office(1991-98), Atlanta office (1998-99).
4
Independent or Non-Interested Trustees
Private Investor and Consultant since 1998;Senior Executive Officer,Progress Software Corp. (1983-98)
4
Private Investor since 2006; President and CEO, Twilight Ventures,LLC (investment holding company) (2004-2006); Senior VicePresident-Marketing, Jacksonville Jaguars (NFL franchise) (1994-2004)
4
President, Financial Insights, LLC (financial consulting and litigationsupport) since 2002; Vice President, The Oxford Company (privateland and timber, investments) (1994-2012).
4
Senior Vice President, Stephens, Inc. since 2009; Real EstateDevelopment, The Sea Island Company, (2005-2009); PrivateInvestor and Consultant since 1997; Golf Commentator, ABC Sportssince 1991; President, Riverside Golf Group, Inc. since 1989.
4
Private Investor and Consultant since 2008; Partner, 360 GoodwynLLC (real estate development) since 2005; Partner, SSM Corp.(venture capital firm) 1974-2007
4 Director, FinancialFederal Savings Bank,Memphis, TN andINNOVA, Memphis, TN
President, Steger & Bizzell Engineering, Inc.(engineering firm) since 2003; Director of Product Strategy, NationalInstruments, Inc. (1996-2003)
4
54 ▪ Annual Report
Fund Information
The following additional information may beobtained for free by calling (800)445-9469,Option 1, or visiting longleafpartners.com, or onthe SEC’s website at sec.gov.
Proxy Voting Policies and ProceduresA description of Longleaf’s Proxy Voting Policiesand Procedures is included in the Statement ofAdditional Information (SAI).
Proxy Voting RecordInformation regarding how the Funds votedproxies relating to portfolio securities during themost recent 12-month period ended June 30 iscontained in Form N-PX.
Quarterly Portfolio HoldingsLongleaf files a complete schedule of portfolioholdings for the first and third quarters of eachfiscal year on Form N-Q, which is available on the
SEC’s website, and may be reviewed and copied atthe SEC’s Public Reference Room in Washington,D.C. Please call (800) SEC-0330 for information onthe operation of the Public Reference Room.
In addition to Form N-Q, Longleaf publishesreports for each calendar quarter. These reportsinclude complete schedules of portfolio holdings,as well as performance updates and managementdiscussion. We furnish Longleaf’s QuarterlyReports in lieu of Form N-Q to shareholders whorequest information about our first and thirdquarter portfolio holdings, and Semi-Annual andAnnual Reports for requests related to the secondand fourth quarters, respectively.
Fund TrusteesAdditional information about Fund Trustees isincluded in the Statement of AdditionalInformation (SAI).
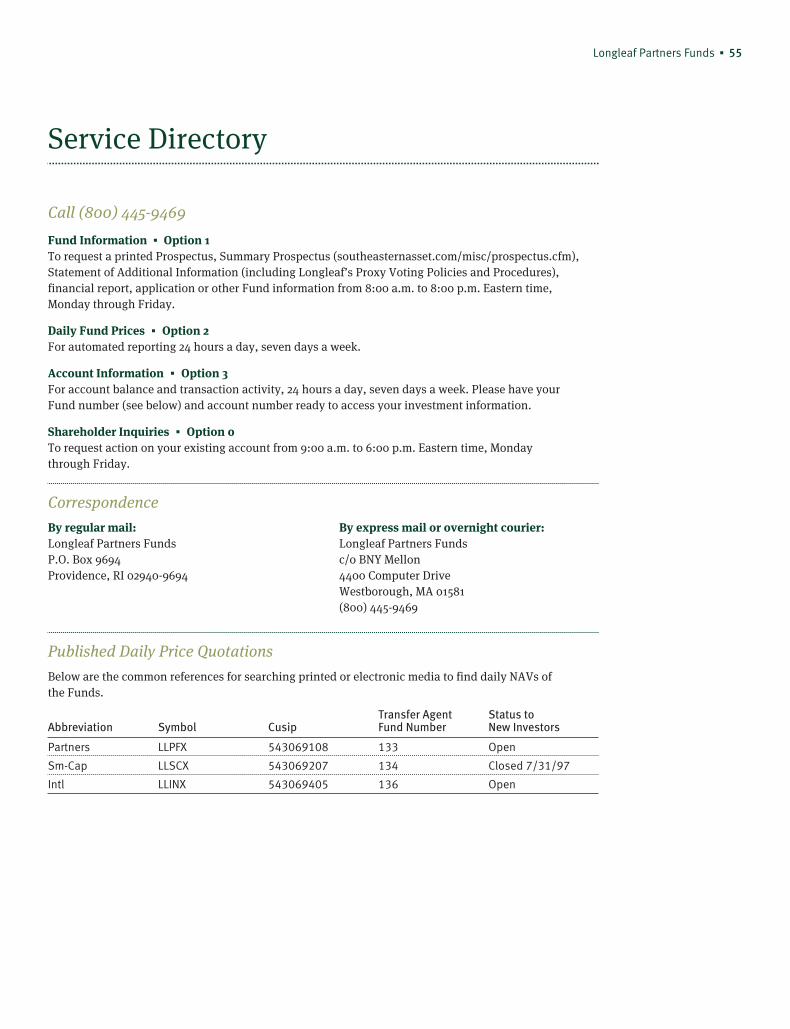
Longleaf Partners Funds ▪ 55
Service Directory
Call (800) 445-9469
Fund Information ▪ Option 1To request a printed Prospectus, Summary Prospectus (southeasternasset.com/misc/prospectus.cfm),Statement of Additional Information (including Longleaf’s Proxy Voting Policies and Procedures),financial report, application or other Fund information from 8:00 a.m. to 8:00 p.m. Eastern time,Monday through Friday.
Daily Fund Prices ▪ Option 2For automated reporting 24 hours a day, seven days a week.
Account Information ▪ Option 3For account balance and transaction activity, 24 hours a day, seven days a week. Please have yourFund number (see below) and account number ready to access your investment information.
Shareholder Inquiries ▪ Option 0To request action on your existing account from 9:00 a.m. to 6:00 p.m. Eastern time, Mondaythrough Friday.
Correspondence
By regular mail: By express mail or overnight courier:Longleaf Partners FundsP.O. Box 9694Providence, RI 02940-9694
Longleaf Partners Fundsc/o BNY Mellon4400 Computer DriveWestborough, MA 01581(800) 445-9469
Published Daily Price Quotations
Below are the common references for searching printed or electronic media to find daily NAVs ofthe Funds.
Abbreviation Symbol CusipTransfer AgentFund Number
Status toNew Investors
Partners LLPFX 543069108 133 Open
Sm-Cap LLSCX 543069207 134 Closed 7/31/97
Intl LLINX 543069405 136 Open
Governing Principles
We will treat your investment as if it were our own.
We will remain significant investors in Longleaf Partners Funds.
We will invest for the long term, while striving to maximize returns andminimize business, financial, purchasing power, regulatory andmarket risks.
We will choose each equity investment based on its discount from ourappraisal of corporate intrinsic value, its financial strength, itsmanagement, its competitive position, and our assessment of its futureearnings potential.
We will focus our assets in our best ideas.
We will not impose loads or 12b-1 charges on mutual fund shareholders.
We will consider closing to new investors if closing would benefitexisting clients.
We will discourage short-term speculators and market timers.
We will continue our efforts to enhance shareholder services.
We will communicate with our investment partners as candidly as possible.