Embed Size (px)
Citation preview
tween 2008 to 2013.
Comparing first quarter reve-
nue for a 10 year period, 2003
to 2013 shows an overall gain
of $367,820 or 5.39%.
General Fund ExpensesGeneral Fund ExpensesGeneral Fund ExpensesGeneral Fund Expenses
The total 2013 budgeted gen-
eral fund expenditures ap-
proved by the County Commis-
sioners equal $24,723,729 In
2013, the first quarter general
fund expenditures equaled
$9,808,584 which is 4.39%
less spent or encumbered
than 1st quarter 2012.
Salaries and benefits in-
creased $18,182 (.40%) over
2012. (con’t on page 2)
General Fund RevenueGeneral Fund RevenueGeneral Fund RevenueGeneral Fund Revenue
The total 2013 budgeted gen-
eral fund revenue equals
$23,296,182. The end of the
first quarter shows 30.9% of
revenue budgeted has been
received.
First quarter revenue received
in 2013 is $26,766 (.38%)
higher than first quarter 2012.
The increase in sales tax reve-
nue has helped Allen County
due to the reduced revenue in
other areas . The first quarter
2013 revenue is 5.23% higher
than the same period in 2012.
Currently Sales tax is 57% of
the entire general fund reve-
nue. Property taxes are 20%
Falling interest rates have
continued to hurt interest
income. In 2007, during the
first quarter interest income
was $781,258 compared to
1st quarter 2013 of $54,510.
Declining state reimburse-
ments have also had an ongo-
ing negative impact on county
funds with a loss of 57% be-
The Board of Commissioner’s
directed the Allen County Dog
Warden step up dog tag li-
cense enforcement in May.
This was in reaction to the
increase number of dog bite
calls the Dog Warden received.
Per the Ohio Revised Code, the
board of commissioners are
responsible for dog control
and oversee the dog warden
operations. The county auditor
is responsible for selling tags.
These departments work
closely together to make it as
easy as possible for dog own-
ers to purchase tags.
The increased enforcement
netted an additional 1,418
tags sold. Dog tags cost
$18.00. A penalty of $18.00
is added for delinquent tags.
The Dog Warden will continue
enforcement throughout
2013.
K e y F i n a n c i a l H i g h l i g h t s
S P E C I A L
P O I N T S O F
I N T E R E S T :
• 1st quarter finan-
cial information
• 1,418 dog tags
sold since May
2013.
• All properties sold
at Auditor Sale
• Decisions made
by the Board of
Revision
• 2012 Update,
values decreased
2.12% in Allen
County
I N S I D E T H I S
I S S U E :
Board of Revision 2
2012 Update 2
Congratulations Corner 3
Auditor Sales 3
1st Quarter Financial Report
4
Budget vs. Actual 5
Departmental Expenses 6
D o g T a g s
R H O N D A E D D Y - S T I E N E C K E R
A L L E N C O U N T Y A U D I T O R
Auditor News
05/23/2013 1st Quarter 2013
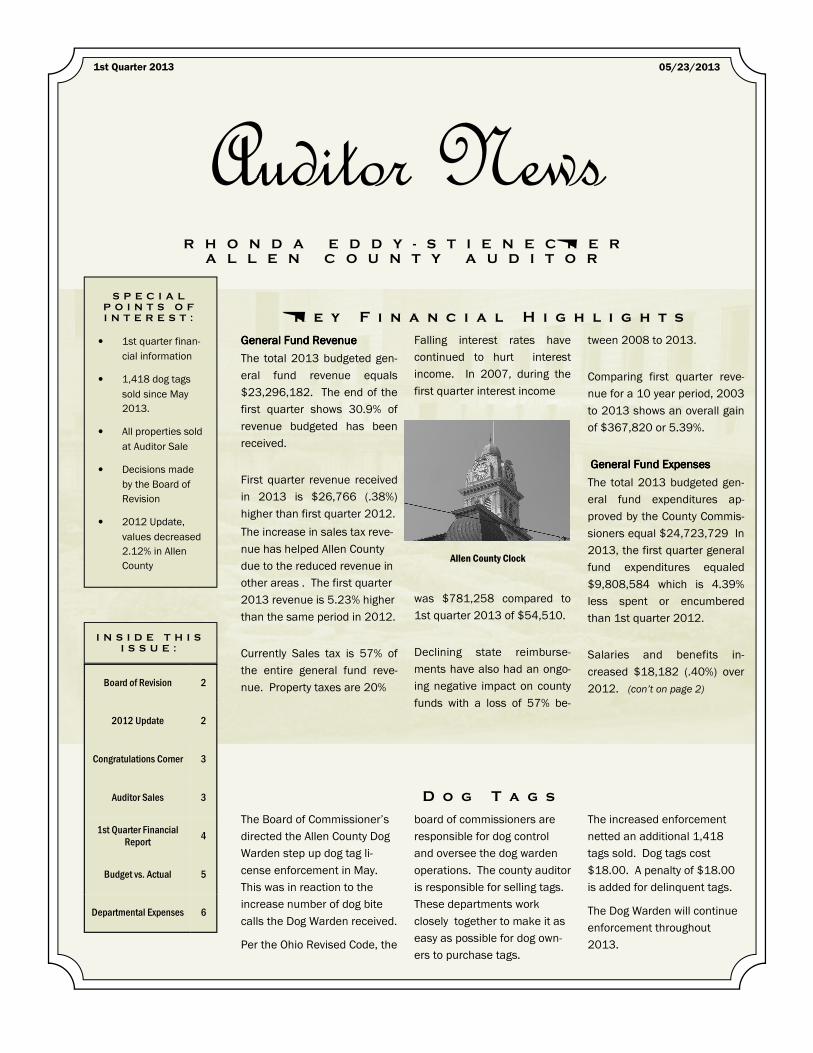
Allen County Clock
Taxpayers may petition the
Board of Revision (BOR) to
review their Real Property
Valuation (both residential
and commercial). The Ohio
Department of Taxation pro-
vides that the Complaint
against Valuation must be
filed with the County Auditor
between January 1 and
March 31. After the Board
reviews these petitions the
Taxpayer could receive an
offer of settlement letter
regarding the value of the
property. Or the Board may
schedule a formal hearing to
further review the property
value.
NOTICE
Tax Compliance Services is a
company that has sent a
mass mailing to property
owners in Allen County. The
company is urging property
owners to let them file a BOR
on their behalf in order to
lower property values, the company then charges 50%
of any savings. Please be
aware that property owners
can file the BOR themselves
at NO cost. The owners would
then receive 100% of the
savings. Please note that Tax
Compliance Services used
last year's values rather than
the updated values for this
year (which generally are less).
Contact our office If you have any questions regarding
the BOR process.
variables that influence the
market value of a property
other than comparable sales.
These variables include
amongst others, interest
rates, cost of land acquisi-
tion, construction and materi-
al costs. On the third year
update, between the six-year
reappraisal cycle, the values
are established based on a
comparable sales evaluation.
County Auditors across the
state are mandated by the
Department of Taxation to
conduct a comprehensive
county-wide reappraisal of
real estate properties every
six years to establish proper-
ty values for tax purposes. A
uniform approach produces a
fair estimate of what the
property would sell for on the
open market. There are many
Allen County completed the
2012 update which was reflect-
ed in calendar year 2013.
Overall, values decreased
2.17%. Agricultural values in-
creased (due to changes in
CAUV soil types), while resi-
dential, industrial, and com-
mercial properties decreased.
Table on last page represent
changes in values.
B o a r d o f R e v i s i o n H e a r i n g s
2 0 1 2 R e a l E s t a t e U p d a t e
P a g e 2 A u d i t o r N e w s
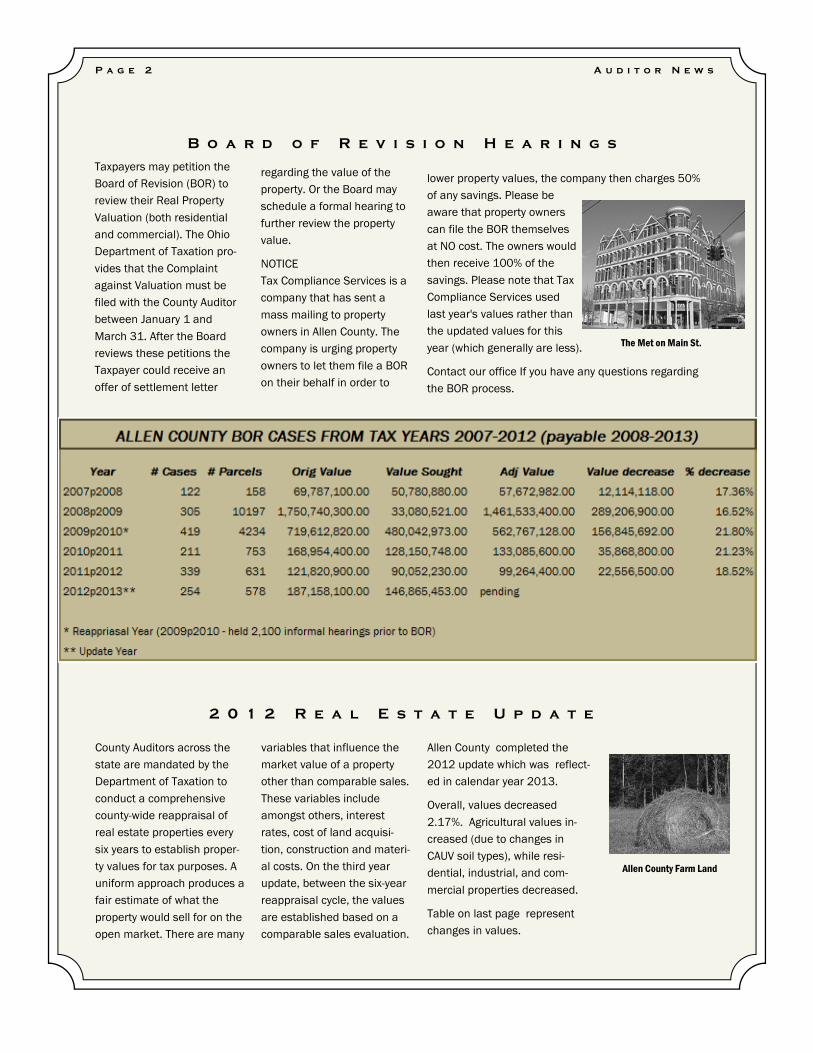
The Met on Main St.
Allen County Farm Land
P a g e 3 A u d i t o r N e w s
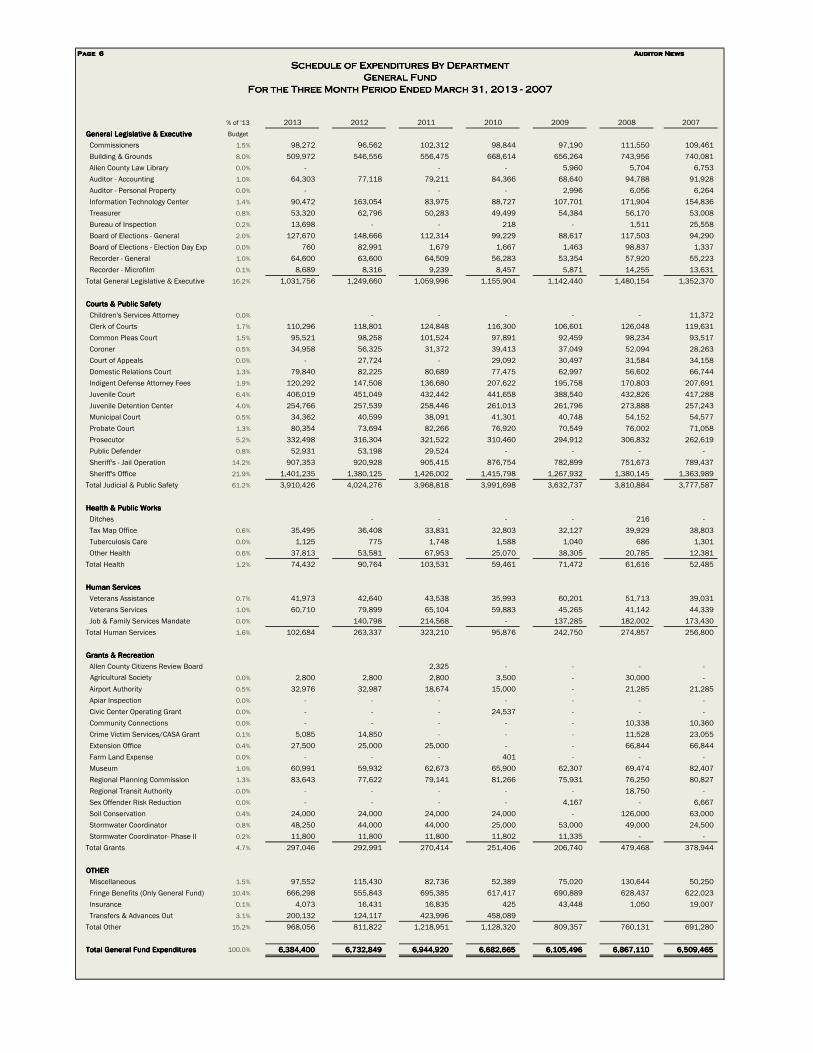
Office, Jail, Juvenile Court and
Juvenile Detention Center.
The total Judicial and Public
Safety departments make up
61.2% or $3,910,426 of the
entire funds spent during the
first quarter. These depart-
ments include all the Courts
and Public Safety departments.
The General Legislative &
All other levels of expenditures
decreased compared to 2012.
Actual dollars spent were
$6,384,400 or 25.8% of dol-
lars budgeted.
One of the most important
local services is law enforce-
ment. Allen County spent $2.9
million or 46.51% of the first
quarter budget on the Sheriff’s
E xecu t i v e depa r tmen ts
(including utilities) spent
16.2% of the first quarter
budget.
Comparing first quarter ex-
penditures for a 10 year peri-
od, 2003 to 2013 shows in-
crease spending of $550,983
or 9.45%.
See pages 4-6 for additional
information.
5713.012). The law requires
the County Auditor to involve a
qualified project manager in
each county-wide reappraisal
or triennial update . A quali-
fied project manager must
take a 30 hour course, pass
an exam and complete at least
7 hours of continuing educa-
tion in the next two years.
The areas covered include:
Concepts and principles of
mass appraisal, Methods of
data collection and data man-
agement, Assessment sales-
ratio study including various
measures of central tendency,
Traditional approaches of
property valuation, including
the cost approach, the sales
comparison approach, and the
income approach, Methods
and systems for model build-
ing and model calibration.
Congratulations go to Jane
Wright and Teresa Hunsaker in
the Allen County Auditor’s Of-
fice, Real Estate Department.
The are now certified Qualified Qualified Qualified Qualified
Project Managers Project Managers Project Managers Project Managers after com-
pleting a course with the Ohio
Ad Valorem School.
This was in response to a new
law passed by the State Legis-
latures that require the use of
a Qualified Project Manager in
County Appraisals. (ORC
K e y F i n a n c i a l H i g h l i g h t s
C O N G R A T U L A T I O N S C O R N E R
“Comparing 1st
quarter revenue
and expenditures
from 2003 to 2013… revenue
increased 5.39%
and expenditures
increased 9.45%
A u d i t o r S a l e s
The Auditor’s Office held an
Auditor Sale to auction 26 tax
delinquent properties on May
1st. Over 150 people attended
the sale. Some serious buyers,
others curious about the pro-
cess.
Seven of the 26 parcels includ-
ed a residential home. The
remaining 19 were va-
cant lots. The highest bid
was $39,000 for a home
at 423 S. Woodlawn. The
lowest bid was $25.00
for a vacant lot on S. Cen-
tral Ave.
The purchasers were
required to pay $300
down on the day of the sale
and the remainder paid with-
in 30 days. It is also the
purchasers responsible to
transfer the property.
The total proceeds for the
sale equaled $118,875.00
Another sale will be held by
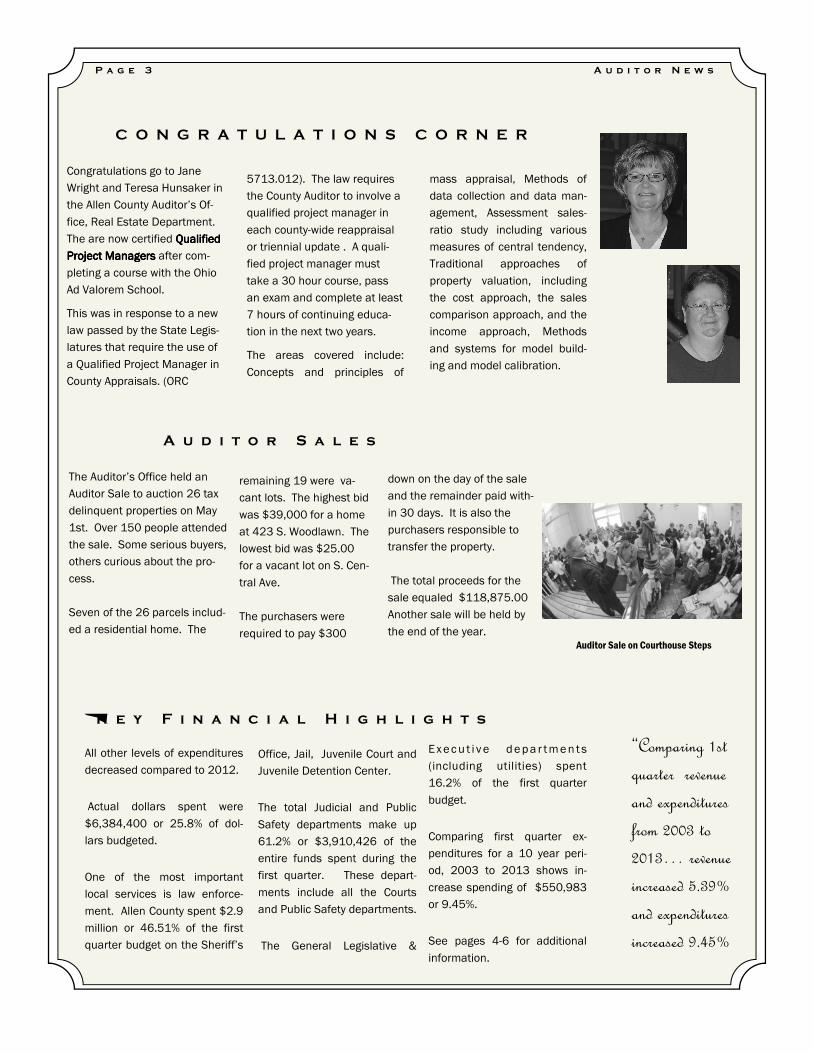
the end of the year. Auditor Sale on Courthouse Steps
Page 4Page 4Page 4Page 4 Auditor NewsAuditor NewsAuditor NewsAuditor News
Acutal Acutal Acutal Acutal Acutal Acutal Acutal Acutal Variance 2013Variance 2013Variance 2013Variance 2013 PercentPercentPercentPercent
2013201320132013 2012201220122012 compared to 2012compared to 2012compared to 2012compared to 2012 VarianceVarianceVarianceVariance
Revenues:Revenues:Revenues:Revenues:
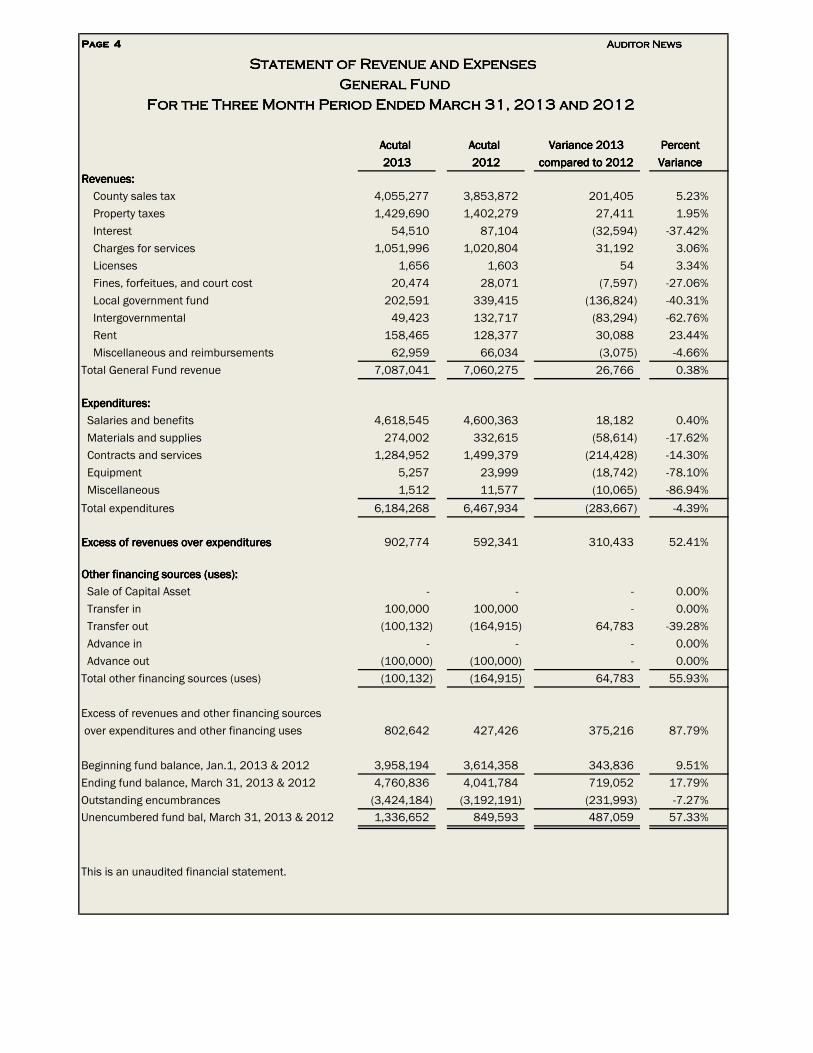
County sales tax 4,055,277 3,853,872 201,405 5.23%
Property taxes 1,429,690 1,402,279 27,411 1.95%
Interest 54,510 87,104 (32,594) -37.42%
Charges for services 1,051,996 1,020,804 31,192 3.06%
Licenses 1,656 1,603 54 3.34%
Fines, forfeitues, and court cost 20,474 28,071 (7,597) -27.06%
Local government fund 202,591 339,415 (136,824) -40.31%
Intergovernmental 49,423 132,717 (83,294) -62.76%
Rent 158,465 128,377 30,088 23.44%
Miscellaneous and reimbursements 62,959 66,034 (3,075) -4.66%
Total General Fund revenue 7,087,041 7,060,275 26,766 0.38%
Expenditures:Expenditures:Expenditures:Expenditures:
Salaries and benefits 4,618,545 4,600,363 18,182 0.40%
Materials and supplies 274,002 332,615 (58,614) -17.62%
Contracts and services 1,284,952 1,499,379 (214,428) -14.30%
Equipment 5,257 23,999 (18,742) -78.10%
Miscellaneous 1,512 11,577 (10,065) -86.94%
Total expenditures 6,184,268 6,467,934 (283,667) -4.39%
Excess of revenues over expendituresExcess of revenues over expendituresExcess of revenues over expendituresExcess of revenues over expenditures 902,774 592,341 310,433 52.41%
Other financing sources (uses):Other financing sources (uses):Other financing sources (uses):Other financing sources (uses):
Sale of Capital Asset - - - 0.00%
Transfer in 100,000 100,000 - 0.00%
Transfer out (100,132) (164,915) 64,783 -39.28%
Advance in - - - 0.00%
Advance out (100,000) (100,000) - 0.00%
Total other financing sources (uses) (100,132) (164,915) 64,783 55.93%
Excess of revenues and other financing sources
over expenditures and other financing uses 802,642 427,426 375,216 87.79%
Beginning fund balance, Jan.1, 2013 & 2012 3,958,194 3,614,358 343,836 9.51%
Ending fund balance, March 31, 2013 & 2012 4,760,836 4,041,784 719,052 17.79%
Outstanding encumbrances (3,424,184) (3,192,191) (231,993) -7.27%
Unencumbered fund bal, March 31, 2013 & 2012 1,336,652 849,593 487,059 57.33%
This is an unaudited financial statement.
Statement of Revenue and ExpensesStatement of Revenue and ExpensesStatement of Revenue and ExpensesStatement of Revenue and Expenses
General FundGeneral FundGeneral FundGeneral Fund
For the Three Month Period Ended March 31, 2013 and 2012For the Three Month Period Ended March 31, 2013 and 2012For the Three Month Period Ended March 31, 2013 and 2012For the Three Month Period Ended March 31, 2013 and 2012
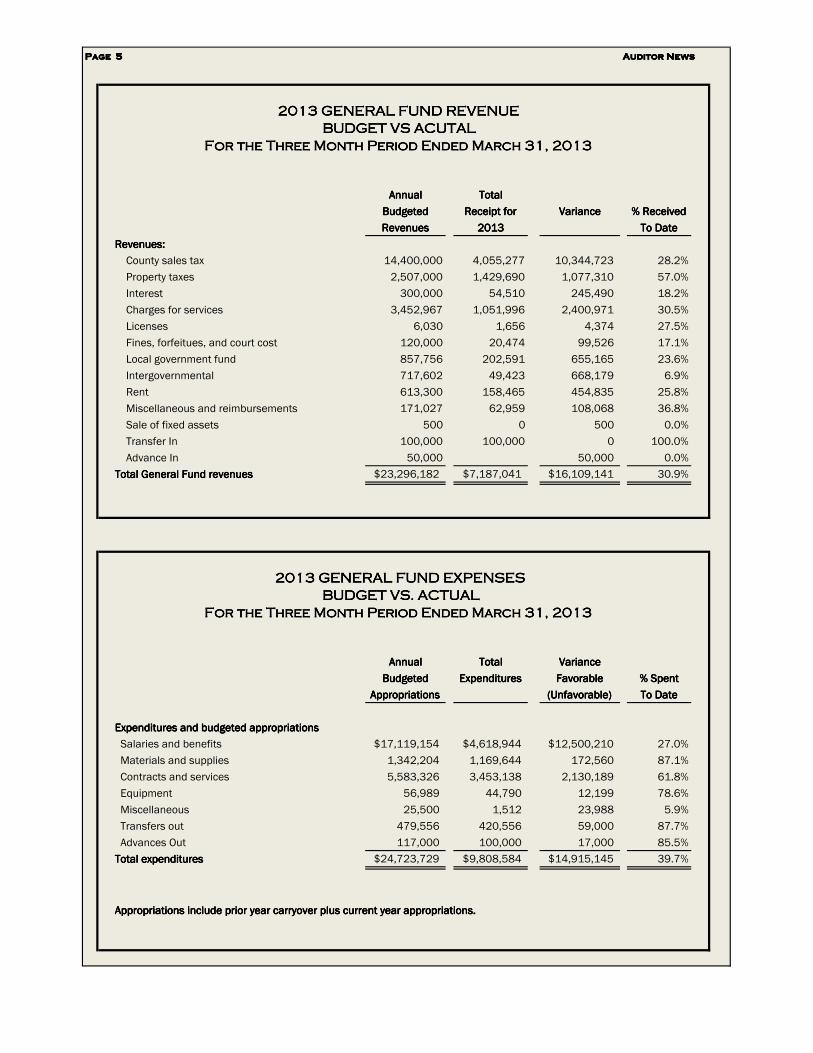
Page 5Page 5Page 5Page 5 Auditor NewsAuditor NewsAuditor NewsAuditor News
AnnualAnnualAnnualAnnual TotalTotalTotalTotal
BudgetedBudgetedBudgetedBudgeted Receipt forReceipt forReceipt forReceipt for VarianceVarianceVarianceVariance % Received% Received% Received% Received
RevenuesRevenuesRevenuesRevenues 2013201320132013 To DateTo DateTo DateTo Date
Revenues:Revenues:Revenues:Revenues:
County sales tax 14,400,000 4,055,277 10,344,723 28.2%
Property taxes 2,507,000 1,429,690 1,077,310 57.0%
Interest 300,000 54,510 245,490 18.2%
Charges for services 3,452,967 1,051,996 2,400,971 30.5%
Licenses 6,030 1,656 4,374 27.5%
Fines, forfeitues, and court cost 120,000 20,474 99,526 17.1%
Local government fund 857,756 202,591 655,165 23.6%
Intergovernmental 717,602 49,423 668,179 6.9%
Rent 613,300 158,465 454,835 25.8%
Miscellaneous and reimbursements 171,027 62,959 108,068 36.8%
Sale of fixed assets 500 0 500 0.0%
Transfer In 100,000 100,000 0 100.0%
Advance In 50,000 50,000 0.0%
Total General Fund revenuesTotal General Fund revenuesTotal General Fund revenuesTotal General Fund revenues $23,296,182 $7,187,041 $16,109,141 30.9%
AnnualAnnualAnnualAnnual TotalTotalTotalTotal VarianceVarianceVarianceVariance
BudgetedBudgetedBudgetedBudgeted ExpendituresExpendituresExpendituresExpenditures FavorableFavorableFavorableFavorable % Spent% Spent% Spent% Spent
AppropriationsAppropriationsAppropriationsAppropriations (Unfavorable)(Unfavorable)(Unfavorable)(Unfavorable) To DateTo DateTo DateTo Date
Expenditures and budgeted appropriationsExpenditures and budgeted appropriationsExpenditures and budgeted appropriationsExpenditures and budgeted appropriations
Salaries and benefits $17,119,154 $4,618,944 $12,500,210 27.0%
Materials and supplies 1,342,204 1,169,644 172,560 87.1%
Contracts and services 5,583,326 3,453,138 2,130,189 61.8%
Equipment 56,989 44,790 12,199 78.6%
Miscellaneous 25,500 1,512 23,988 5.9%
Transfers out 479,556 420,556 59,000 87.7%
Advances Out 117,000 100,000 17,000 85.5%
Total expendituresTotal expendituresTotal expendituresTotal expenditures $24,723,729 $9,808,584 $14,915,145 39.7%
Appropriations include prior year carryover plus current year appropriations.Appropriations include prior year carryover plus current year appropriations.Appropriations include prior year carryover plus current year appropriations.Appropriations include prior year carryover plus current year appropriations.
2013 GENERAL FUND REVENUE 2013 GENERAL FUND REVENUE 2013 GENERAL FUND REVENUE 2013 GENERAL FUND REVENUE
BUDGET VS ACUTAL BUDGET VS ACUTAL BUDGET VS ACUTAL BUDGET VS ACUTAL
For the Three Month Period Ended March 31, 2013For the Three Month Period Ended March 31, 2013For the Three Month Period Ended March 31, 2013For the Three Month Period Ended March 31, 2013
2013 GENERAL FUND EXPENSES2013 GENERAL FUND EXPENSES2013 GENERAL FUND EXPENSES2013 GENERAL FUND EXPENSES
BUDGET VS. ACTUALBUDGET VS. ACTUALBUDGET VS. ACTUALBUDGET VS. ACTUAL
For the Three Month Period Ended March 31, 2013For the Three Month Period Ended March 31, 2013For the Three Month Period Ended March 31, 2013For the Three Month Period Ended March 31, 2013
Page 6Page 6Page 6Page 6 Auditor NewsAuditor NewsAuditor NewsAuditor News
% of '13 2013 2012 2011 2010 2009 2008 2007
General Legislative & ExecutiveGeneral Legislative & ExecutiveGeneral Legislative & ExecutiveGeneral Legislative & Executive Budget
Commissioners 1.5% 98,272 96,562 102,312 98,844 97,190 111,550 109,461
Building & Grounds 8.0% 509,972 546,556 556,475 668,614 656,264 743,956 740,081
Allen County Law Library 0.0% - - - 5,960 5,704 6,753
Auditor - Accounting 1.0% 64,303 77,118 79,211 84,366 68,640 94,788 91,928
Auditor - Personal Property 0.0% - - - 2,996 6,056 6,264
Information Technology Center 1.4% 90,472 163,054 83,975 88,727 107,701 171,904 154,836
Treasurer 0.8% 53,320 62,796 50,283 49,499 54,384 56,170 53,008
Bureau of Inspection 0.2% 13,698 - - 218 - 1,511 25,558
Board of Elections - General 2.0% 127,670 148,666 112,314 99,229 88,617 117,503 94,290
Board of Elections - Election Day Exp 0.0% 760 82,991 1,679 1,667 1,463 98,837 1,337
Recorder - General 1.0% 64,600 63,600 64,509 56,283 53,354 57,920 55,223
Recorder - Microfilm 0.1% 8,689 8,316 9,239 8,457 5,871 14,255 13,631
Total General Legislative & Executive 16.2% 1,031,756 1,249,660 1,059,996 1,155,904 1,142,440 1,480,154 1,352,370
Courts & Public SafetyCourts & Public SafetyCourts & Public SafetyCourts & Public Safety
Children's Services Attorney 0.0% - - - - - 11,372
Clerk of Courts 1.7% 110,296 118,801 124,848 116,300 106,601 126,048 119,631
Common Pleas Court 1.5% 95,521 98,258 101,524 97,891 92,459 98,234 93,517
Coroner 0.5% 34,958 56,325 31,372 39,413 37,049 52,094 28,263
Court of Appeals 0.0% - 27,724 - 29,092 30,497 31,584 34,158
Domestic Relations Court 1.3% 79,840 82,225 80,689 77,475 62,997 56,602 66,744
Indigent Defense Attorney Fees 1.9% 120,292 147,508 136,680 207,622 195,758 170,803 207,691
Juvenile Court 6.4% 406,019 451,049 432,442 441,658 388,540 432,826 417,288
Juvenile Detention Center 4.0% 254,766 257,539 258,446 261,013 261,796 273,888 257,243
Municipal Court 0.5% 34,362 40,599 38,091 41,301 40,748 54,152 54,577
Probate Court 1.3% 80,354 73,694 82,266 76,920 70,549 76,002 71,058
Prosecutor 5.2% 332,498 316,304 321,522 310,460 294,912 306,832 262,619
Public Defender 0.8% 52,931 53,198 29,524 - - - -
Sheriff's - Jail Operation 14.2% 907,353 920,928 905,415 876,754 782,899 751,673 789,437
Sheriff's Office 21.9% 1,401,235 1,380,125 1,426,002 1,415,798 1,267,932 1,380,145 1,363,989
Total Judicial & Public Safety 61.2% 3,910,426 4,024,276 3,968,818 3,991,698 3,632,737 3,810,884 3,777,587
Health & Public WorksHealth & Public WorksHealth & Public WorksHealth & Public Works
Ditches - - - - 216 -
Tax Map Office 0.6% 35,495 36,408 33,831 32,803 32,127 39,929 38,803
Tuberculosis Care 0.0% 1,125 775 1,748 1,588 1,040 686 1,301
Other Health 0.6% 37,813 53,581 67,953 25,070 38,305 20,785 12,381
Total Health 1.2% 74,432 90,764 103,531 59,461 71,472 61,616 52,485
Human ServicesHuman ServicesHuman ServicesHuman Services
Veterans Assistance 0.7% 41,973 42,640 43,538 35,993 60,201 51,713 39,031
Veterans Services 1.0% 60,710 79,899 65,104 59,883 45,265 41,142 44,339
Job & Family Services Mandate 0.0% 140,798 214,568 - 137,285 182,002 173,430
Total Human Services 1.6% 102,684 263,337 323,210 95,876 242,750 274,857 256,800
Grants & Recreation Grants & Recreation Grants & Recreation Grants & Recreation
Allen County Citizens Review Board 2,325 - - - -
Agricultural Society 0.0% 2,800 2,800 2,800 3,500 - 30,000 -
Airport Authority 0.5% 32,976 32,987 18,674 15,000 - 21,285 21,285
Apiar Inspection 0.0% - - - - - - -
Civic Center Operating Grant 0.0% - - - 24,537 - - -
Community Connections 0.0% - - - - - 10,338 10,360
Crime Victim Services/CASA Grant 0.1% 5,085 14,850 - - - 11,528 23,055
Extension Office 0.4% 27,500 25,000 25,000 - - 66,844 66,844
Farm Land Expense 0.0% - - - 401 - - -
Museum 1.0% 60,991 59,932 62,673 65,900 62,307 69,474 82,407
Regional Planning Commission 1.3% 83,643 77,622 79,141 81,266 75,931 76,250 80,827
Regional Transit Authority 0.0% - - - - - 18,750 -
Sex Offender Risk Reduction 0.0% - - - - 4,167 - 6,667
Soil Conservation 0.4% 24,000 24,000 24,000 24,000 - 126,000 63,000
Stormwater Coordinator 0.8% 48,250 44,000 44,000 25,000 53,000 49,000 24,500
Stormwater Coordinator- Phase II 0.2% 11,800 11,800 11,800 11,802 11,335 - -
Total Grants 4.7% 297,046 292,991 270,414 251,406 206,740 479,468 378,944
OTHEROTHEROTHEROTHER
Miscellaneous 1.5% 97,552 115,430 82,736 52,389 75,020 130,644 50,250
Fringe Benefits (Only General Fund) 10.4% 666,298 555,843 695,385 617,417 690,889 628,437 622,023
Insurance 0.1% 4,073 16,431 16,835 425 43,448 1,050 19,007
Transfers & Advances Out 3.1% 200,132 124,117 423,996 458,089
Total Other 15.2% 968,056 811,822 1,218,951 1,128,320 809,357 760,131 691,280
Total General Fund ExpendituresTotal General Fund ExpendituresTotal General Fund ExpendituresTotal General Fund Expenditures 100.0% 6,384,4006,384,4006,384,4006,384,400 6,732,8496,732,8496,732,8496,732,849 6,944,9206,944,9206,944,9206,944,920 6,682,6656,682,6656,682,6656,682,665 6,105,4966,105,4966,105,4966,105,496 6,867,1106,867,1106,867,1106,867,110 6,509,4656,509,4656,509,4656,509,465
Schedule of Expenditures By DepartmentSchedule of Expenditures By DepartmentSchedule of Expenditures By DepartmentSchedule of Expenditures By Department
General FundGeneral FundGeneral FundGeneral Fund
For the Three Month Period Ended March 31, 2013 - 2007For the Three Month Period Ended March 31, 2013 - 2007For the Three Month Period Ended March 31, 2013 - 2007For the Three Month Period Ended March 31, 2013 - 2007
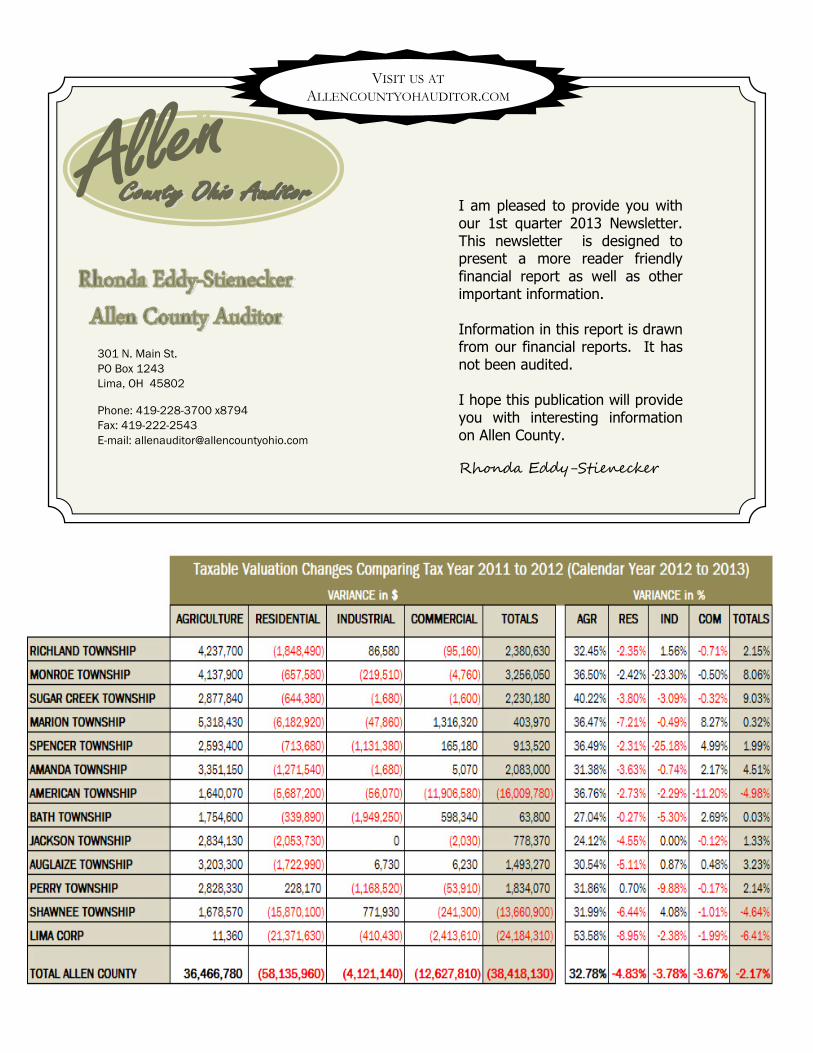
301 N. Main St.
PO Box 1243
Lima, OH 45802
Phone: 419-228-3700 x8794
Fax: 419-222-2543
E-mail: [email protected]
I am pleased to provide you with our 1st quarter 2013 Newsletter. This newsletter is designed to present a more reader friendly financial report as well as other important information. Information in this report is drawn from our financial reports. It has not been audited. I hope this publication will provide you with interesting information on Allen County. Rhonda Eddy-Stienecker
VISIT US AT
ALLENCOUNTYOHAUDITOR.COM
![Item-06-AI0000030418€¦ · ^E Á } v µ ] } v _ µ ] o ] v P W u ] Data 1st Qtr 2016 2nd Qtr 2016 3rd Qtr 2016 4th Qtr 2016 1st Qtr 2017 Permits $ Value Permits $ Value Permits](https://img.pdfslide.us/doc/110x75/5fcb107d1e181d01d75aae23/item-06-ai0000030418-e-v-v-o-v-p-w-u-data-1st-qtr-2016-2nd.jpg)
![BMBX Presentation - Copy.pptx [Read-Only]...2nd Qtr 2014 3rd Qtr 2014 4th Qtr 2014 1st Qtr 2015 2nd Qtr 2015 3rd Qtr 2015 Patients who developed issues requiring emergency care of](https://img.pdfslide.us/doc/110x75/5f23ef5e2f86d60d687ef19d/bmbx-presentation-copypptx-read-only-2nd-qtr-2014-3rd-qtr-2014-4th-qtr.jpg)