Embed Size (px)
Citation preview

Report #19
Royal Commission for Jubail and YanbuRoyal Commission at Yanbu
Strategic Planning and Investment Development Division Economic Planning Department
YANBU INDUSTRIAL CITYECONOMIC REVIEW 1ST Q. 2015

2
Yanb
u Ind
ustri
al Ci
tyEc
onom
ic Re
view
-1st
Q. 2
015
Strategic Planning & Investment Development Division, Economic Planning Department - RC Yanbu Strategic Planning & Investment Development Division, Economic Planning Department - RC Yanbu2 | P a g e
TABLE OF CONTENTS
# Contents Page # 1. Introduction 3 2. RC Mission, Vision , Value & Strategic Objectives 4 3. City Economic Highlights 5 4. Investments 6 5. General Land Use 7 6. Industrial Development 8-10 7. Employment and Population 11-12 8. Residential Development 13-14 9. Market Rental Rates 15-17
10. City Special Areas 18-19 11. City Economic Infrastructure 20-24 12. RC Yanbu - A Smart City 25 13. City Quality of Life 26 14. Major Events 27-30

3
Yanb
u Ind
ustri
al Ci
tyEc
onom
ic Re
view
-1st
Q. 2
015
Strategic Planning & Investment Development Division, Economic Planning Department - RC Yanbu Strategic Planning & Investment Development Division, Economic Planning Department - RC Yanbu
3 | P a g e
YANBU INDUSTRIAL CITY ECONOMIC REVIEW
1.1 INTRODUCTION The Economic Review is a means in understanding the Economic performance of a City . It also provides non-economic data which is useful for city administrators in the management of various economic aspects of the city.
The Yanbu Industrial City Economic Review is introduced by the Strategic Planning and Investment Development Division, Economic Planning Department which will be issued on a quarterly basis every year. This report cover a number of important economic indicators -GDP, RC and Private Sector total investments, Industry Growth, City Land Use, Employment, Property Rental market rates and other useful city level economic information.
1.2 OBJECTIVE The main objective of Yanbu Industrial City Economic Review are to gain better and more up-to-date understanding of the City level Economic Performances.
The Specific objectives: • To keep track of City Economic trends periodically. • To understand the changes in the economic structure of the city over the period of time. • To Generate Economic Awareness
1.3 APPROACH & METHODOLOGY This Economic Review is based on the data available from the Royal Commission (RC), Investors and Statistical sources as well as other related local and International sources.
The Economic indicators have been used in this report to assess different sectors in the city during a particular time frame which in turn helpful in the realization of: Royal Commission‘s Vision , Mission, Values and Strategic Objectives.

4
Yanb
u Ind
ustri
al Ci
tyEc
onom
ic Re
view
-1st
Q. 2
015
Strategic Planning & Investment Development Division, Economic Planning Department - RC Yanbu Strategic Planning & Investment Development Division, Economic Planning Department - RC Yanbu
4 | P a g e
2.0 ROYAL COMMISSION VISION, MISSION, VALUES & STRATEGIC OBJECTIVES
RC Vision The best choice for investors in petrochemical and energy-intensive industries and the leading contributor to the Kingdom’s growth.
RC Mission Plan, promote, develop & manage Petrochemicals and Energy intensive industrial cities through successful customer focus and partnerships with investors, employees, communities and other stakeholders.
RC Values
Customer Focus
Transparency
Accountability
High Performance
Team Work
Commitment
Loyalty
Fairness
Social
Responsibility
Strategic Objectives:
Growth: Expand industrial base through growth in number of cities and industrial output.
Tenant Portfolio: Optimize tenant portfolio by attracting investments of added value.
Cities of Excellence: Gain recognition as one of the top industrial cities globally.
Distinctive Staff: The best in attracting distinctive human resources in the Kingdom
Financial: Gradually develop financial sustainability and increased efficiency.
Vision
Mission
Values
Strategic Objectives

5
Yanb
u Ind
ustri
al Ci
tyEc
onom
ic Re
view
-1st
Q. 2
015
Strategic Planning & Investment Development Division, Economic Planning Department - RC Yanbu Strategic Planning & Investment Development Division, Economic Planning Department - RC Yanbu
5 | P a g e
YANBU INDUSTRIAL CITY ECONOMIC HIGHLIGHTS
INDICATOR DESCRIPTION TOTAL UNIT YEAR END
GDP
RC FOR JUBAIL,YANBU & RAS AL KHAIR CONTRIBUTION TO NATIONAL GDP 144.7 SR Billion
2014 RC YANBU SHARE IN THE
CONTRIBUTION TO NATIONAL GDP 39% In percentage
INVESTMENT RC YANBU AGGREGATE INVESTMENT 56.8 SR Billion 2014 PRIVATE SECTOR AGGREGATE INVESTMENT 167 SR Billion 2014
LAND EXISTING & EXPANSION AREA 605 Sq.KM 2014 EMPLOYMENT CITY TOTAL EMPLOYMENT 65,877 Nos.(Forecast)
INDUSTRY PRIMARY & SECONDARY, LIGHT AND SUPPORT INDUSTRIES 203
Nos.( in operation, Under construction, In design &Proposed) 2015
(1st. Quarter) COMMERCIAL COMMERCIAL ESTABLISHMENTS 749 Nos.(Registered)
OIL REFINING CITY REFINING CAPACITY >1.0 Million Barrel/day 2014
PRODUCTION RC- JUBAIL & YANBU SHARE IN THE WORLD PETROCHEMICAL PRODUCTION
10% Percentage 2014
EXPORTS KING FAHAD INDUSTRIAL PORT
81,667.939 Quantity in Tons (in one Yr)
2014 IMPORTS 9,794.224
Source: RC Annual Report-2014,RCY-QPR#233, RCY Int. Rd. Show - Lisbon, Portugal PPT

6
Yanb
u Ind
ustri
al Ci
tyEc
onom
ic Re
view
-1st
Q. 2
015
Strategic Planning & Investment Development Division, Economic Planning Department - RC Yanbu Strategic Planning & Investment Development Division, Economic Planning Department - RC Yanbu
6 | P a g e
YANBU INDUSTRIAL CITY MAIN ECONOMIC SECTORS INVESTMENT AGGREGATE INVESTMENTS & QUARTERLY PROGRESS AS OF 2015 1ST QUARTER:
“ Yanbu Industrial City is one of the stations Ideal for Foreign Direct
Investments”- CEO, RC Yanbu
143.131 SR in Billion
• Primary & Secondary Industrial capital Invesments (Industry in operation, U.construction ,Indesign & Proposed)
• 1st Quarter Progress: 775 Million SR
11.884 SR in Billion
• Light & Support Industrial capital Invesments (Industry in Operation,U.Construction, In design and Proposed )
• 1st Quarter Progress: 642 Million SR
10.323 SR in Billion
• Commercial & Residential Capital investment
• 1st Quarter Progress: 11 Million SR
RC Investment Is equal to 65% of GCC Industrial
Investment
Source: IDD Dept.-Industrial Quarterly Technical Report, SP &PM Dept: QPR# : 232, RCY Int. Rd. Show - Lisbon, Portugal PPT

7
Yanb
u Ind
ustri
al Ci
tyEc
onom
ic Re
view
-1st
Q. 2
015
Strategic Planning & Investment Development Division, Economic Planning Department - RC Yanbu Strategic Planning & Investment Development Division, Economic Planning Department - RC Yanbu
7 | P a g e
YANBU INDUSTRIAL CITY GENERAL LAND USE PLAN
Source: Master Plan Update Team
> YANBU INDUSTRIAL CITY EXISTING AREA=185 Sq. Km PLUS EXPANSION
> EXISTING INDUSTRIAL AREA
> EXISTING COMMUNITY AREA
> LAND AVAILABLE FOR FUTURE EXPANSION

8
Yanb
u Ind
ustri
al Ci
tyEc
onom
ic Re
view
-1st
Q. 2
015
Strategic Planning & Investment Development Division, Economic Planning Department - RC Yanbu Strategic Planning & Investment Development Division, Economic Planning Department - RC Yanbu
8 | P a g e
YANBU INDUSTRIAL CITY – INDUSTRIAL DEVELOPMENT
RC YANBU MAIN INDUSTRIAL PARTNERS
“A VIEW OF 40 YEARS’ OF SUCCESSFUL INDUSTRIAL DEVELOPMENT”<

9
Yanb
u Ind
ustri
al Ci
tyEc
onom
ic Re
view
-1st
Q. 2
015
Strategic Planning & Investment Development Division, Economic Planning Department - RC Yanbu Strategic Planning & Investment Development Division, Economic Planning Department - RC Yanbu
9 | P a g e
INDUSTRIES DEVELOPMENT STATUS
Source: Quarterly Industrial Technical Report of IDD Dept.
112 In operation 43 U.Construction 32 In design 16 Proposed = 203 Total Industries (as of 1st Q. 2015 )
As per data analysis, the actual Average Growth is 8.75 basic Industry
(Primary and Secondary) and 19.25 Light and Support Industry respectively
per decade between 1975 and 2014 in 40 years of its establishment.
Between 2004 and 2014 yr. end , Yanbu Industrial City has recorded highest
number of increase in Industries (basic Industry=14nos. and Light and support
Industry 19 nos.)
“As of 1st Quarter2015, an additional applications have been received to establish new
industries in Yanbu Industrial City.”
1975-84 1985-94 1995-04 2005-14Primary& Secondary 4 13 21 35Light & Support 10 23 29 77
Industrial Growth
Operation UnderConstruction
In Design Proposed
Light & Support 77 34 26 15Primary & Secondary 35 9 6 1
Industries Dev. Status as of 1st Q. 2015

10
Yanb
u Ind
ustri
al Ci
tyEc
onom
ic Re
view
-1st
Q. 2
015
Strategic Planning & Investment Development Division, Economic Planning Department - RC Yanbu Strategic Planning & Investment Development Division, Economic Planning Department - RC Yanbu
10 | P a g e
OIL REFINING & PETROCHEMICAL INDUSTRIES PRODUCTION CAPACITY
Industry
Production Capacity
(as of 2015 1st Qtr.)
Products
Saudi Aramco Crude Oil Terminal 4,500,000 BPD Crude Oil storage & Shipment
Saudi Aramco NGL Fraction Plant 580,000 BPD Ethane, Propane, Butane, Natural Gasoline
Saudi Aramco Yanbu Refinery 235,000 BPD LPG, gasoline, diesel, kerosene, fuel oil
Saudi Aramco-Exon Mobil Yanbu
Refinery (SAMREF) 400,000BPD Propane, Motor fuel, Jet fuel, diesel, fuel oil, sulfur
Saudi Aramco-Mobil Lubricating Oil Refinery (LUBREF)
2,000,000 BPY Lube oil base stocks
Saudi Yanbu Petrochemical Company(Yanpet)
2,600,000 TPY Polyethylene, Polypropylene, ethylene glycols
Arabian Industrial Fibers Co.
(IBN RUSHD) 725,000 TPY Xylenes, benzene, PTA,PET ,acetic acid
National Industrial Gases Co.(GAS) 3,500,000 TPY Oxygen, nitrogen
Yansab (olefins 2)
(So 3,361,000 TPY Polyethylene, Ethylene, Ethylene Glycol
Natpet 400,000 TPY Polyethylene, Polypropylene
Yasref 4,00,000 bpd Gasoline, Liquefied petroleum gases, sulfur & others
Note: BPD= barrels per day BPY = barrels per year TPY = tons per year
SOURCE: Investor Relation Dept.

11
Yanb
u Ind
ustri
al Ci
tyEc
onom
ic Re
view
-1st
Q. 2
015
Strategic Planning & Investment Development Division, Economic Planning Department - RC Yanbu Strategic Planning & Investment Development Division, Economic Planning Department - RC Yanbu
11 | P a g e
YANBU INDUSTRIAL CITY - EMPLOYMENT
51.4%
5.2%
0.7%
42.7%
Saudi N/S ArabWestern Eastern
5%
Yanbu Industrial City Total Employment Average annual growth rate between 2005 to 2014.(in 10yrs.)
8.5%
Yanbu Industrial City Saudi Employment Average annual growth rate between 2005 to 2014(10yrs.)
Employment by Economic Sectors by 2014 yr. end: Employment by Ethnicity by 2014 Yr. End:
41%
18%
17%
7%
7% 4%
3% 3%
Primary/ Secondary Industry
Light/ Support Industry
National Government Services
Municipal Government Services
Commercial/ Retail
Social Services
Construction
Utilities/ Transport
Employed Persons
by Year end of 2014:
65,877
“Female employment in Yanbu Industrial City is primarily in Health Services, Education, Retail Services and Banking”. Source: YIC Commercial Survey.
MAJOR ACHIEVEMENT OF RC
YANBU IN EMPLOYMENT SECTOR

12
Yanb
u Ind
ustri
al Ci
tyEc
onom
ic Re
view
-1st
Q. 2
015
Strategic Planning & Investment Development Division, Economic Planning Department - RC Yanbu Strategic Planning & Investment Development Division, Economic Planning Department - RC Yanbu
12 | P a g e
YANBU INDUSTRIAL CITY-POPULATION 5.7%
Yanbu Industrial City(Inside+outside) average annual growth rate of population
between 2003 to 2014.
≥ 6% Yanbu Industrial City(Inside+outside)
average annual growth rate of Saudi population between 2003 to 2014.
Yanbu Industrial City Population
1. Saudi Resident Population
(Living Inside the City) 88,025 52.5%
2. Non-Saudi Resident Population
(Living Inside the City) 17,388 10.4%
Sub -Total Total Population (Inside City ) 105,363 62.8%
3.
Saudi Non- Resident Living Outside the City (Yanbu –
sub-region) 39,931 24.0%
4.
Non-Saudi Non-MYAS Resident Living Outside the City (Yanbu
sub-region) 22,429 13.4%
Sub-Total Total Population(Outside city) 62,360 37.0% Grand Total
(Outside + Inside Yanbu Industrial City) 167,723 100%
Note: City Annual Forecast
“Saudi Population have been steadily
increasig in Yanbu Industrial City-Source: CAF
2003 2007 2014Saudi 63,381 69,531 127,956Non-Saudi 22,598 28,735 39,767
Population(Inside + Outside)

13
Yanb
u Ind
ustri
al Ci
tyEc
onom
ic Re
view
-1st
Q. 2
015
Strategic Planning & Investment Development Division, Economic Planning Department - RC Yanbu Strategic Planning & Investment Development Division, Economic Planning Department - RC Yanbu
13 | P a g e
YANBU INDUSTRIAL CITY RESIDENTIAL OVER VIEW
“A View of 40 years of Successful Residential Development”

14
Yanb
u Ind
ustri
al Ci
tyEc
onom
ic Re
view
-1st
Q. 2
015
Strategic Planning & Investment Development Division, Economic Planning Department - RC Yanbu Strategic Planning & Investment Development Division, Economic Planning Department - RC Yanbu
14 | P a g e
YANBU INDUSTRIAL CITY RESIDENTIAL DEVELOPMENT 785 Average increase of Residential units per
year between 1985 -2014 Residential Units consisting of Villas,
Townhouse, Apartments and Dorms
Residential Units Supply by Agency
3% Average annual Increase in Residential
Units(excluding Dorms) from 1985 – 2014 year end Source: Historical Data Analysis
74.5%
15%
8% 2.4%
RC
Companies
Investors
Individuals “558 Units
Were built in 1ST Quarter 2015 Source: Construction Dept.
23,326 Units Total Supply
including Dorms as of 1ST Q. 2015

15
Yanb
u Ind
ustri
al Ci
tyEc
onom
ic Re
view
-1st
Q. 2
015
Strategic Planning & Investment Development Division, Economic Planning Department - RC Yanbu Strategic Planning & Investment Development Division, Economic Planning Department - RC Yanbu
15 | P a g e
YANBU INDUSTRIAL CITY RESIDENTIAL MARKET RENTAL RATES
Housing Type Rental Rates (in Saudi Riyals/Year)
4TH Q.2014 1ST Q.2015 VILLAS
2 Bed Room 23,000-25,000 24,000-25,000
Q. Av. Change - 2%
3 Bed Room 45,000-48,000 45,000-48,000
Q. Av. Change - No Change 4 Bed Room 46,000-80,000 46,000-80,000
Q. Av. Change - No Change 5 Bed Room 60,000-85,000 60,000-85,000
Q. Av. Change - No Change 6 Bed Room 55,000-86,000 55,000-90,000
Q. Av. Change - 3%
7 Bed Room 70,000-110,000 70,000-110,000
Q. Av. Change - No Change
8 Bed Room 90,000-110,000 90,000-110,000
Q. Av. Change - No Change
TOWNHOUSE 3 Bed Room 40,000 –50,000 40,000 –55,000
Q. Av. Change - 2.7%
4 Bed Room 45,000-70,000 45,000-70,000
Q . Av. Change - No Change
APARTMENTS
1 Bed Room 14,000-19,000 14,000-20,000
Q. Av. Change - 2% 2 Bed Room 24,000-35,000 24,000-35,000
Q. Av. Change - No Change 3 Bed Room 25,000-42,000 25,000-42,000
Q. Av. Change - No Change
4 Bed Room 50,000-65,000 50,000-65,000
Q. Av. Change - No Change
Source: Real Estate Office and Collection of Information

16
Yanb
u Ind
ustri
al Ci
tyEc
onom
ic Re
view
-1st
Q. 2
015
Strategic Planning & Investment Development Division, Economic Planning Department - RC Yanbu Strategic Planning & Investment Development Division, Economic Planning Department - RC Yanbu
16 | P a g e
YANBU INDUSTRIAL CITY –COMMERCIAL DEVELOPMENT
“A View of 40 years of Successful Commercial Development”

17
Yanb
u Ind
ustri
al Ci
tyEc
onom
ic Re
view
-1st
Q. 2
015
Strategic Planning & Investment Development Division, Economic Planning Department - RC Yanbu Strategic Planning & Investment Development Division, Economic Planning Department - RC Yanbu
17 | P a g e
YANBU INDUSTRIAL CITY –COMMERCIAL CENTERS Commercial Centers: Retail and service operations at Yanbu Industrial City are classified into Three types of commercial centers:
- Local Centers - District Centers - Super District Centers
1. City Branded Commercial Partners:
RC YANBU MARKET RENTAL RATES :Retail & Office Commercial Establishments:
Description 4th Qtr. 2014 (SR/M ²/YEAR)
1st Qtr. 2015 (SR/M ²/YEAR)
RETAIL COMMERCIAL BUILDING RENT
400-1,800 400-1,800
Q. Av. Changes. - No Change
OFFICE COMMERCIAL BUILDING RENT
700-1,600 400-1,600
Q Av. Changes - No Change Source: Real Estate Offices & Information collection
“The Specialty shops and quality
restaurants are a priority in the City”
- YIC Quality of life Survey

18
Yanb
u Ind
ustri
al Ci
tyEc
onom
ic Re
view
-1st
Q. 2
015
Strategic Planning & Investment Development Division, Economic Planning Department - RC Yanbu Strategic Planning & Investment Development Division, Economic Planning Department - RC Yanbu
18 | P a g e
YANBU INDUSTRIAL CITY –SPECIAL AREAS
City Center & Waterfront Design View
“Over $ 250 million has been invested in developing just the Infrastructure of over 12 Kms of Prime Red Sea Coast with future investments in world-class resorts, Commercial and Recreational Facilities’’
- Source: Parsons Website.

19
Yanb
u Ind
ustri
al Ci
tyEc
onom
ic Re
view
-1st
Q. 2
015
Strategic Planning & Investment Development Division, Economic Planning Department - RC Yanbu Strategic Planning & Investment Development Division, Economic Planning Department - RC Yanbu
19 | P a g e
YANBU INDUSTRIAL CITY- SPECIAL AREAS CITY CENTER INVESTMENT OPPORTUNITIES CITY CENTER INVESTMENT OPPORTUNITIES
Source: Investment Dev. Dept. and Urban Planning Dept.

20
Yanb
u Ind
ustri
al Ci
tyEc
onom
ic Re
view
-1st
Q. 2
015
Strategic Planning & Investment Development Division, Economic Planning Department - RC Yanbu Strategic Planning & Investment Development Division, Economic Planning Department - RC Yanbu20 | P a g e
YANBU INDUSTRIAL CITY ECONOMIC INFRASTRUCTURE

21
Yanb
u Ind
ustri
al Ci
tyEc
onom
ic Re
view
-1st
Q. 2
015
Strategic Planning & Investment Development Division, Economic Planning Department - RC Yanbu Strategic Planning & Investment Development Division, Economic Planning Department - RC Yanbu
21 | P a g e
YANBU INDUSTRIAL CITY –REGIONAL SERVICES
21 International Flights Weekly
Flights to Four International Cities
and Three Cities within the
kingdom -Per Air Port Authority
More than 88% increase in operations &
133% increase in passenger traffic since
2008.- Per Ai Port Authority
22
Yanb
u Ind
ustri
al Ci
tyEc
onom
ic Re
view
-1st
Q. 2
015
Strategic Planning & Investment Development Division, Economic Planning Department - RC Yanbu Strategic Planning & Investment Development Division, Economic Planning Department - RC Yanbu
22 | P a g e
YANBU INDUSTRIAL CITY –PUBLIC TRANSPORT
1.
Travel and Tourist Agencies in the City: Saudi Airlines Al-Attar ACE British Airways Samara Travel Agency Al Zouman Travel Agency
Kanoo Transportation
Some contractors in Yanbu Industrial
City operate their own transportation
services to move workers between
camps and the work place.
23
Yanb
u Ind
ustri
al Ci
tyEc
onom
ic Re
view
-1st
Q. 2
015
Strategic Planning & Investment Development Division, Economic Planning Department - RC Yanbu Strategic Planning & Investment Development Division, Economic Planning Department - RC Yanbu
23 | P a g e
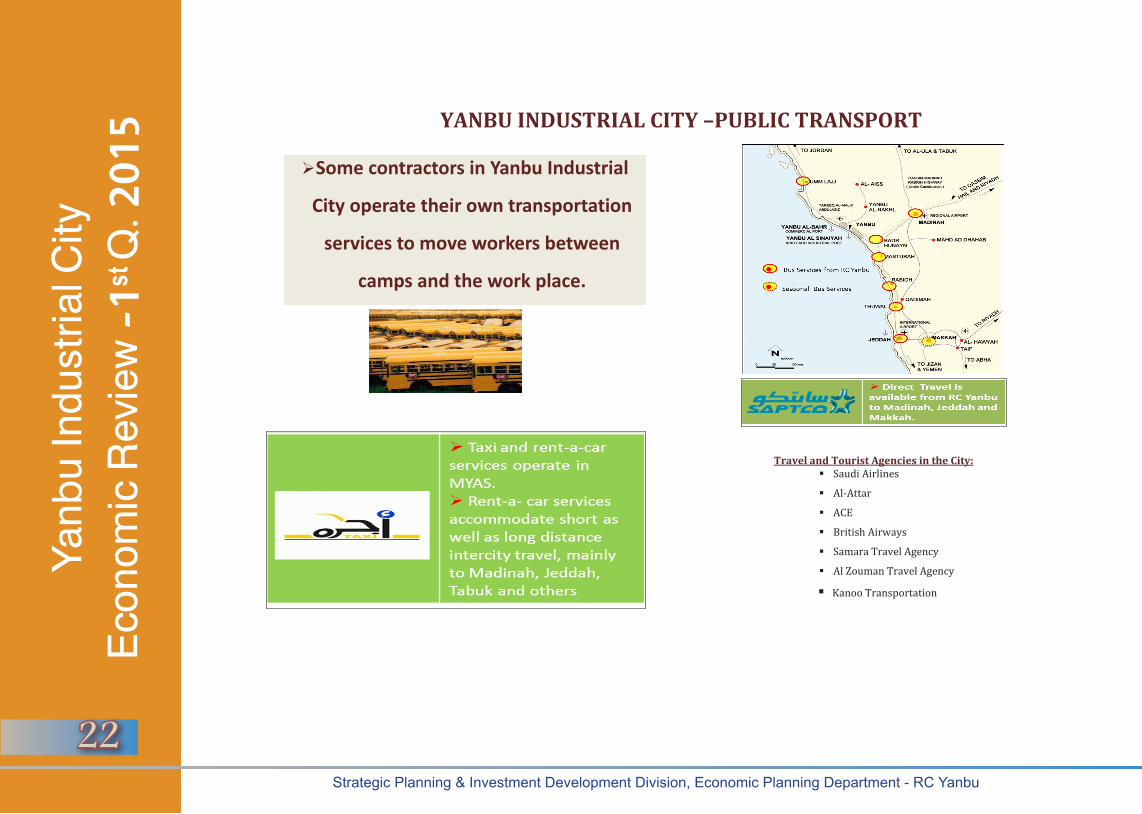
KING FAHD INDUSTRIAL PORT –IMPORTS AND EXPORTS
1st Qtr. 2015 Imports consists of 10% and Exports consists of
90%. Import Products consists of : Liquid Artificial Materials,
Solid/Liquid Materials, Oil Products. Export Products consists of : Liquid/Solid Petro-Chemical
Products, Solid Materials and Oil Products.
Note: KFIP Primary Exports are Oil Products.
Source: SP & PM and For more Information : visit:www.ports.gov.sa
YANBU INDUSTRIAL CITY –POWER & WATER FACILITIES
Imports (MM Tons) Exports(MM Tons)1.9 17.2
Imports & Exports as of 1st Q. 2015
Export & Import2010 83,544,2652011 90,715,5262012 101,014,1042013 92,391,6752014 91,462,163
2010 2011 2012 2013 2014
83.5
4
90.7
1
101.
14
92.3
5
91.0
0
2010 2011 2012 2013 2014
Imports and Exports Growth

24
Yanb
u Ind
ustri
al Ci
tyEc
onom
ic Re
view
-1st
Q. 2
015
Strategic Planning & Investment Development Division, Economic Planning Department - RC Yanbu Strategic Planning & Investment Development Division, Economic Planning Department - RC Yanbu
24 | P a g e
SOURCE: MARAFIQ
Power Supply & Demand as of 1st Q. 2015
Installed Power Generation Capacity
Firm Power Supply
Average Power Demand of the Quarter
Desalinated Water Production & Demand as of 1stQ. 2015
Installed Desalinated Water Production Capacity
Firm Desalinated Water Supply
Average Desalinated Water Demand
Coolant Seawater Production & Demand as of 1stQ. 2015
Inastalled Coolant Seawater Pumping Capacity
Firm Coolant Seawater Seawater Supply
Average Coolant Seawater Demand
1,631 MW
8,630 M³/hr.
6,754 M³/hr
5,253 M³/hr
560,799 M³/hr
374,574 M³/hr
700,000 M³/hr
1,226 MW
989.10 MW
23 | P a g e
KING FAHD INDUSTRIAL PORT –IMPORTS AND EXPORTS
1st Qtr. 2015 Imports consists of 10% and Exports consists of
90%. Import Products consists of : Liquid Artificial Materials,
Solid/Liquid Materials, Oil Products. Export Products consists of : Liquid/Solid Petro-Chemical
Products, Solid Materials and Oil Products.
Note: KFIP Primary Exports are Oil Products.
Source: SP & PM and For more Information : visit:www.ports.gov.sa
YANBU INDUSTRIAL CITY –POWER & WATER FACILITIES
Imports (MM Tons) Exports(MM Tons)1.9 17.2
Imports & Exports as of 1st Q. 2015
Export & Import2010 83,544,2652011 90,715,5262012 101,014,1042013 92,391,6752014 91,462,163
2010 2011 2012 2013 2014
83.5
4
90.7
1
101.
14
92.3
5
91.0
0
2010 2011 2012 2013 2014
Imports and Exports Growth

25
Yanb
u Ind
ustri
al Ci
tyEc
onom
ic Re
view
-1st
Q. 2
015
Strategic Planning & Investment Development Division, Economic Planning Department - RC Yanbu Strategic Planning & Investment Development Division, Economic Planning Department - RC Yanbu
25 | P a g e
YANBU INDUSTRIAL CITY – A SMART CITY: HIGHLIGHTS
RCY Signed Contract for a period of 20Yrs. with the Bayanat – Mobily as a Strategic Partner
Value Added Services:
UNIFIED OPERATION CENTER (UOC): - Real time view on all systems - Integrated Customer Profiles & Process - Faster response time - Team ready in any situation/any time - Mobile access & notification
CITY MANAGEMENT: - Roads, Lighting, Traffic Signals, Irrigation, Buildings, CCTV, Fire
Alarm, Water& Electricity waste, Asset management.
COMMUNITY PORTAL:
- Ability to interact with RCY management.
- Request for servicws - Follow up and ticketing - Mobile access and notification
SMART HOMES: - Ability to order smart home solution - Remotely manage and control home services - Monitor energy consumption - Integrated system alert when away - Mobile access and alarm
“Yanbu Industrial City, is the First Smart City in Saudi Arabia. RCY has
signed a strategic partnership agreement to
implement the Yanbu Smart City Project”.
- Dr. Alaa Nassif,
CEO, Royal Commission at Yanbu
23 | P a g e
KING FAHD INDUSTRIAL PORT –IMPORTS AND EXPORTS
1st Qtr. 2015 Imports consists of 10% and Exports consists of
90%. Import Products consists of : Liquid Artificial Materials,
Solid/Liquid Materials, Oil Products. Export Products consists of : Liquid/Solid Petro-Chemical
Products, Solid Materials and Oil Products.
Note: KFIP Primary Exports are Oil Products.
Source: SP & PM and For more Information : visit:www.ports.gov.sa
YANBU INDUSTRIAL CITY –POWER & WATER FACILITIES
Imports (MM Tons) Exports(MM Tons)1.9 17.2
Imports & Exports as of 1st Q. 2015
Export & Import2010 83,544,2652011 90,715,5262012 101,014,1042013 92,391,6752014 91,462,163
2010 2011 2012 2013 2014
83.5
4
90.7
1
101.
14
92.3
5
91.0
02010 2011 2012 2013 2014
Imports and Exports Growth

26
Yanb
u Ind
ustri
al Ci
tyEc
onom
ic Re
view
-1st
Q. 2
015
Strategic Planning & Investment Development Division, Economic Planning Department - RC Yanbu Strategic Planning & Investment Development Division, Economic Planning Department - RC Yanbu
26 | P a g e
YANBU INDUSTRIAL CITY – WiFI ZONE
“The City’s public wireless system (Free Wi-Fi Service) at present is accessible at the locations shown above. In course of time, all RC facilities, beaches, and tourist areas will be provided with free Wi-Fi services.”- Source: IT Dept.

27
Yanb
u Ind
ustri
al Ci
tyEc
onom
ic Re
view
-1st
Q. 2
015
Strategic Planning & Investment Development Division, Economic Planning Department - RC Yanbu Strategic Planning & Investment Development Division, Economic Planning Department - RC Yanbu
27 | P a g e
YANBU INDUSTRIAL CITY – QUALITY OF LIFE
23,326 Housing Units including Dormitories
> 711 Commercial Establishments (A few of them are not in Operation/renovation)
Health Facilities(Operational): Hospitals=3,Clinics=10
Industrial College(1) & Tech. Institute(1), University Colleges(2) and an English Learning Centre(1)
54 Schools and Kindergartens including International Schools
Public Library
One Festival Park & 15 Community Parks
Special Areas consisting of City Center & Waterfront
> 43 ha. Land developed for Recreation & Sports Facilities
More than 640.11 Km Paved road (Highway, Primary, Secondary, Tertiary Rds. Other
Roads & Parking Areas)
Safety & Security: 4 Fire Stations and well equipped City Security Team
“ Yanbu Industrial City is one of the Best Livable Communities” – UN Environment Program Award 2013
“ Waterfront Project investment is further enhancing quality of life in Yanbu Industrial City” - Parsons

28
Yanb
u Ind
ustri
al Ci
tyEc
onom
ic Re
view
-1st
Q. 2
015
Strategic Planning & Investment Development Division, Economic Planning Department - RC Yanbu Strategic Planning & Investment Development Division, Economic Planning Department - RC Yanbu
28 | P a g e
YANBU INDUSTRIAL CITY –1st Q. 2015 MAJOR EVENTS
President, Parsons- USA: Visit to RC Yanbu

29
Yanb
u Ind
ustri
al Ci
tyEc
onom
ic Re
view
-1st
Q. 2
015
Strategic Planning & Investment Development Division, Economic Planning Department - RC Yanbu Strategic Planning & Investment Development Division, Economic Planning Department - RC Yanbu
29 | P a g e
YANBU INDUSTRIAL CITY –MAJOR EVENTS
Flowers and Gardens Festival - 2015

30
Yanb
u Ind
ustri
al Ci
tyEc
onom
ic Re
view
-1st
Q. 2
015
Strategic Planning & Investment Development Division, Economic Planning Department - RC Yanbu Strategic Planning & Investment Development Division, Economic Planning Department - RC Yanbu30 | P a g e
Global achievements of the Royal Commission in Yanbu during the past year in 2014
31 | P a g e
SHOULD YOU HAVE ANY QUESTIONS OR
WISH TO DISCUSS ANY OF THE RELATED ISSUES OF ECONOMIC REVIEW
PLEASE CONTACT:
STRATEGIC PLANNING & INVESTMENT DEVELOPMENT DIVISION ECONOMIC PLANNING DEPARTMENT
CONTACT PHONE NO: + 966 14 321- 6636 /6427
“Industrialization” is our choice for diversifying our sources of Income – The Custodian of the Two Holy Mosques Late King Abdullah Bin Abdulaziz Al Saud

31
Yanb
u Ind
ustri
al Ci
tyEc
onom
ic Re
view
-1st
Q. 2
015
Strategic Planning & Investment Development Division, Economic Planning Department - RC Yanbu Strategic Planning & Investment Development Division, Economic Planning Department - RC Yanbu
31 | P a g e
SHOULD YOU HAVE ANY QUESTIONS OR
WISH TO DISCUSS ANY OF THE RELATED ISSUES OF ECONOMIC REVIEW
PLEASE CONTACT:
STRATEGIC PLANNING & INVESTMENT DEVELOPMENT DIVISION ECONOMIC PLANNING DEPARTMENT
CONTACT PHONE NO: + 966 14 321- 6636 /6427
“Industrialization” is our choice for diversifying our sources of Income – The Custodian of the Two Holy Mosques Late King Abdullah Bin Abdulaziz Al Saud
Royal Commission for Jubail and YanbuRoyal Commission at Yanbu
STRATEGIC PLANNING & INVESTMENT DEVELOPMENT DIVISIONECONOMIC PLANNING DEPARTMENT