Embed Size (px)
Citation preview

2021 First Quarter Investor Presentation
February 1, 2021
The Huntington National Bank is Member FDIC. ®, Huntington® and Huntington. Welcome.® are federally registered service marks of Huntington Bancshares Incorporated. ©2021 Huntington Bancshares Incorporated.

2021 First Quarter Investor Presentation
Table of Contents
2
Franchise and Leadership 3Economic Footprint 4
Leadership Team 5
Board of Directors 6
Environmental, Social, & Governance 10
Strategy 13Purpose Drives Performance 15
Digital Strategy 16
Financial Update 242020 and 4Q20 Highlights 25
Income Statement 30Net Interest Income 31
Net Interest Margin 32
Hedging Program Overview 33
Noninterest Income 34
Noninterest Expense 37
Balance Sheet 39
Earning Assets 40
Loan Composition 41
Commercial Loans 43
Consumer Loans 47
Investment Securities 56
Non‐Equity Funding 58
Deposit Composition 59
Wholesale Funding 61
Capital 63
Credit Quality 66
Allowance for Credit Losses 68
Financial Accommodations 70
Asset Quality and Reserve Trends 72
Appendix 78Non‐GAAP Reconciliations 81
Notes 84

Franchise and Leadership

2021 First Quarter Investor Presentation
Huntington Overview
We serve our customers through a banking network of over 800 retail branches as well as digital, telephone, and ATM banking capabilities.
RETAIL FOOTPRINT PRODUCTS:
ConsumerBusiness BankingCommercialWealth ManagementTrustInsurance
EXTENDED FOOTPRINT PRODUCTS:
Asset FinanceAutoCorporateHuntington Business CreditHuntington Public CapitalHuntington Technology FinanceNational SettlementsRV and MarineSpecialty Banking Verticals
OUR GEOGRAPHIC FOOTPRINT
15,477FTE Colleagues
1,322ATMs
839Branches(1)
$123BAssets
Over 150 yearsof serving the
financial needs of our customers
4See notes on slide 83

2021 First Quarter Investor Presentation
Experienced, Diverse Executive Leadership Team
8 newELT memberssince 2016
29 years average industry
experience
46%Executive
Leadership Team diversity
*Photo includes Rick Remiker (succeeded by Mr. Kleinman) and Nate Herman (succeeded by Ms. Van Treese) 5
Chairman, President, and CEOSteve Steinour
Consumer and Business BankingAndy Harmening
Regional Banking and the Private Client Group
Sandy Pierce
Commercial BankingScott Kleinman
Vehicle Finance Sandy Pierce
Finance & StrategyZach Wasserman
RiskHelga Houston
CreditRich Pohle
Human Resources and DiversityRaj Syal
Corporate OperationsMark Thompson
Technology and OperationsPaul Heller
Internal AuditMichael Van Treese
Communications and MarketingJulie Tutkovics
Legal and Public AffairsJana Litsey Business Segments
9 yearsaverage
Huntington experience

2021 First Quarter Investor Presentation
Deeply Engaged, Diverse Board of Directors
7new independent directors since
2016
38% Board diversity
5 yearsaverage Board
tenure
Our Board sets the strategy, risk management culture, and ethical standards for the entire organization
Our directors represent a well‐rounded diversity of skills, knowledge, and experience aligned with our strategy.
o Our Board is committed to board refreshment, ensuring fresh perspectives
ESG oversight
o The Nominating and Corporate Governance Committee oversees our ESG program
o Our ESG performance management framework ensures ESG considerations are integrated into all relevant Board Committee agendas for meaningful discussion, awareness, and governance actions
*Photo includes Kathleen Ransier, who retired from the Board in 20206

2021 First Quarter Investor Presentation
Board Commitment to Strong Corporate Governance and Engagement
7
Meetings 2010 2011 2012 2013 2014(1) 2015 2016 2017 2018 2019
HBI Board Meeting 12 9 13 16 12 15 15 16 17 12
HBI Audit Committee(2) 16 15 11 13 11 12 10 11 19 17
HBI Capital Planning Committee(3) 8 8
HBI Community Development Committee 4 4 4 4 4 7 4 4 4 4
HBI Compensation Committee 8 8 7 6 7 6 7 6 4 5
HBI Executive Committee 11 11 3 2 1 8 2 5 1
HBI NCG Committee 9 6 7 5 5 5 8 6 5 7
HBI Risk Oversight Committee(2) 20 16 24 20 21 15 20 18 18 16
HBI Technology Committee 5 4 4 4 4 4
Other(4) 33 14 7
TOTAL 121 77 69 66 66 72 82 74 76 66
See notes on slide 83

2021 First Quarter Investor Presentation
Experience/Background # of Directors
Audit / Financial Reporting 8
Client / Consumer Marketing, Branding & Communication 5
Technology / Cybersecurity 6
Compensation & Human Capital Management 10
Financial Services 8
Government, Public Policy & Regulatory 12
Risk Management 9
Legal 3
Strategic Planning / M&A 12
Public Company Executive 6
ESG (Environmental, Social, and Governance) 7
Payments 2
8
Board Skills, Knowledge, and ExperienceDirectors embody a well‐rounded variety of skills, knowledge, and experience, as demonstrated in the chart below

2021 First Quarter Investor Presentation
HBAN has instituted mechanisms to drive a high level of management and shareholder alignment, focusing decision making onlong‐term returns while maintaining our Board‐defined aggregate moderate‐to‐low risk appetite.
✔ Hold‐to‐retirement requirements on equity grants and awards
✔ Clawback provisions in all incentive compensation plans
✔ Equity ownership targets for CEO, ELT, and next ~50 managers
✔ Directors / Colleagues collectively represent top 10 shareholder (~28 million shares)
Board and CEOset the
“Tone at the Top”
“Everyone Owns Risk” culture
Disciplined management of credit risk
Significant investment in
risk management
Management / Shareholder AlignmentDriving reduced earnings volatility, more stable returns, higher capital generation, and stronger shareholder value creation
9
2021 First Quarter Investor Presentation
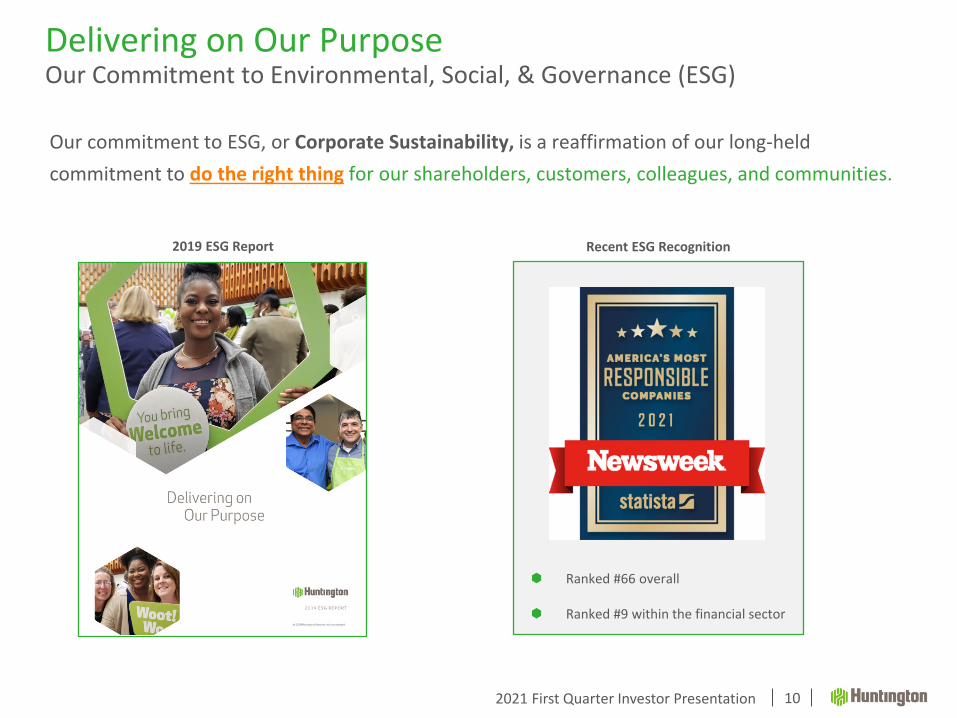
Ranked #66 overall
Ranked #9 within the financial sector
Recent ESG Recognition
Delivering on Our PurposeOur Commitment to Environmental, Social, & Governance (ESG)
10
Our commitment to ESG, or Corporate Sustainability, is a reaffirmation of our long‐held commitment to do the right thing for our shareholders, customers, colleagues, and communities.
2019 ESG Report

2021 First Quarter Investor Presentation
Our ESG Journey
2018Enhanced our ESG disclosures while grounding our report in materiality
2020Finalize our ESG goals and formalize our ESG policy & integration into business planning
2017Conducted a materiality assessment to determine issues of greatest importance to Huntington’s stakeholders and importance to the business
2019Established a formal ESG committee and began defining clear goals
2016Issued our first ESG report
11

2021 First Quarter Investor Presentation
ESG Highlights
• Our colleague‐first investment drives our performance
• We’re for People: Making a difference for our colleagues, customers, and communities
• We are committed to environmental responsibility and creating a sustainable future
• Financial performance
• Corporate governance and transparency
• Enterprise risk management
• Customer service, satisfaction, and advocacy
• Diversity and inclusion
• Ethical practices and purpose‐driven culture
• Data security and customer privacy
• Fair and responsible banking
#1 originator of SBA 7(a) loans
93% to goal in year 3 of 5‐year $16 billion community development plan; announced new $20 billion, five‐year plan
43% middle and executive management diversity
698 active sites in the U.S. Environmental Protection Agency ENERGY STAR® program
66% total workforce diversity41% year over year membership growth of our Green Team colleague affinity group
Our Approach Our Priorities Our Impact
12

Strategy

2021 First Quarter Investor Presentation
Building the Leading People‐First, Digitally‐Powered BankCreating a sustainable competitive advantage with focused investment in customer experience, product differentiation, and key growth initiatives
14
We are a Purpose‐driven company Our Purpose is to make people’s lives better, help businesses thrive, and strengthen the communities we serve
Drive organic growth across all business segments Deliver a superior customer experience through differentiated products, digital capabilities, market segmentation, and
tailored expertise
Leverage the value of our brand, our deeply‐rooted leadership in our communities, and our market‐leading convenience to efficiently acquire, deepen, and retain client relationships
Deliver sustainable, top quartile financial performance and efficiency Drive diversified revenue growth while maintaining rigorous expense management discipline and maximizing returns on organic
growth investments
Minimize earnings volatility through the cycle
Deliver top quartile returns on capital
Be a source of stability and resilience through enterprise risk management & balance sheet strength Maintain an aggregate moderate‐to‐low, through‐the‐cycle risk profile
Disciplined capital allocation and priorities (first fund organic growth, second maintain the dividend, and then other capital uses)

2021 First Quarter Investor Presentation
Purpose Drives PerformanceHuntington’s approach to shareholder value creation
The best way to achieve our long‐term financial goals and generate sustainable, through‐the‐cycle returns is to fulfill our purpose to make people’s lives better, help businesses thrive, and strengthen the communities we serve.
Our success is deeply interconnected with the success of the people andcommunities we serve.
15

2021 First Quarter Investor Presentation
Huntington’s Digital Evolution
16
Digital Differentiation and Transformation Building our Core
Digital Origination Expansion Branch Experience
Driving engagement and profitability through digital tools, AI, segmentation,
and mobility
Owning our online, mobile, and alerts platforms, leveraging agile
development, and partnering to further enhance customer experience
Ensuring our consumer and business banking customers can
open accounts digitally in all core product families
Leveraging digital technology to optimize sales & service and empower 3,500+ bankers across our footprint

2021 First Quarter Investor Presentation
Differentiating with Digital & Product100+ digital projects launched over 2 years, driving value
17
Customers that are engaged with The Hub tools demonstrate higher levels of satisfaction, lower levels of attrition, and higher profitability
The Hub
SavingsAutomation
PersonalizedInsights
MoneyManagement
Differentiated Digital Services
Track and analyze your spending and help you create and reach your financial goals
Spend Analysis, Savings Goals, & Budgets
Leveraging AI to provide personalized and proactive
insights
Duplicate charges, Returned check, Refund received
Use AI to analyze your spending habits, income, and upcoming expenses to find money you're not using in your accountE.g. E.g.
September ‘20
See notes on slide 83
When you overdraw your account, you have a $50 Safety
Zone before you incur an overdraft fee. If you overdraw your account by more than $50, you have 24‐Hour Grace giving
you more time to make a deposit and avoid a fee.
September ‘20
& $50 Safety Zone for Consumers and
Businesses
Now for Businesses
2 New Products

2021 First Quarter Investor Presentation
Digital Transformation
18
Tailored Customer Experiences
Customer centric experiences designed to support the unique needs of our Consumer, Business Banking,
Private Bank, and Commercial customers
Mobility
Invest in mobile as the platform of choice for our customers while leveraging new technology and AI to
enhance self service
Consumer• Budget• Goals• Credit & ID Monitoring• Automated Saving
Private Bank• My Team• Insights• Credit & ID Monitoring
Business• Cashflow• Treasury Services• Access Management
Payments• Bank to Bank Transfers• Zelle
Self Help• ChatBot (AI)• Schedule a Call Back
Enhanced Servicing• Card Controls• Enhanced Mortgage Servicing

2021 First Quarter Investor Presentation
Extending Digital Origination Capabilities
19
29% 28%
44%
4Q19 3Q20 4Q20
0%9%
36%
4Q19 3Q20 4Q20
0% 0%
2%
4Q19 3Q20 4Q20
In 2020, Huntington aggressively extended origination capabilities toensure all core product families
within consumer and business banking can originate digitally
Digital Capabilities 2019 2020
Consumer Checking
Consumer Savings
Consumer Credit Card
Mortgage
Home Equity
Business Checking
Business Savings
Business Lending
Digital Originations
New Consumer Deposit AccountsIncludes Checking, Savings, MMA
New Business Deposit AccountsIncludes Checking, Savings, MMA
Digitally‐Assisted Mortgage Applications

2021 First Quarter Investor Presentation
2.882.95 2.99 3.01 3.04
4Q19 1Q20 2Q20 3Q20 4Q20
Active Digital Users (Millions)
Consumer and Business Digital Engagement Metrics
20
+6% YoY
2.002.05
2.10 2.122.18
4Q19 1Q20 2Q20 3Q20 4Q20
Active Mobile Users (Millions)
+9% YoY
79.1 84.9113.4 101.7 105.8
23.2 23.8
26.022.5 22.6
4Q19 1Q20 2Q20 3Q20 4Q20
Digital Logins(Millions)
Mobile Online
+25% YoY
39% 38% 52%34%
55%
61% 62% 48%66%
45%
4Q19 1Q20 2Q20 3Q20 4Q20
Consumer Checking New Households
Digital vs Non‐Digital Acquisition
Digital Non‐Digital
23% 25% 32% 29% 30%
33% 34%34% 34% 35%
43% 42% 34% 37% 35%
4Q19 1Q20 2Q20 3Q20 4Q20
Mobile ATM Branch
102.3
139.4 128.4108.7
124.2
Consumer Check and Cash Deposit Transactions by Channel
2021 First Quarter Investor Presentation
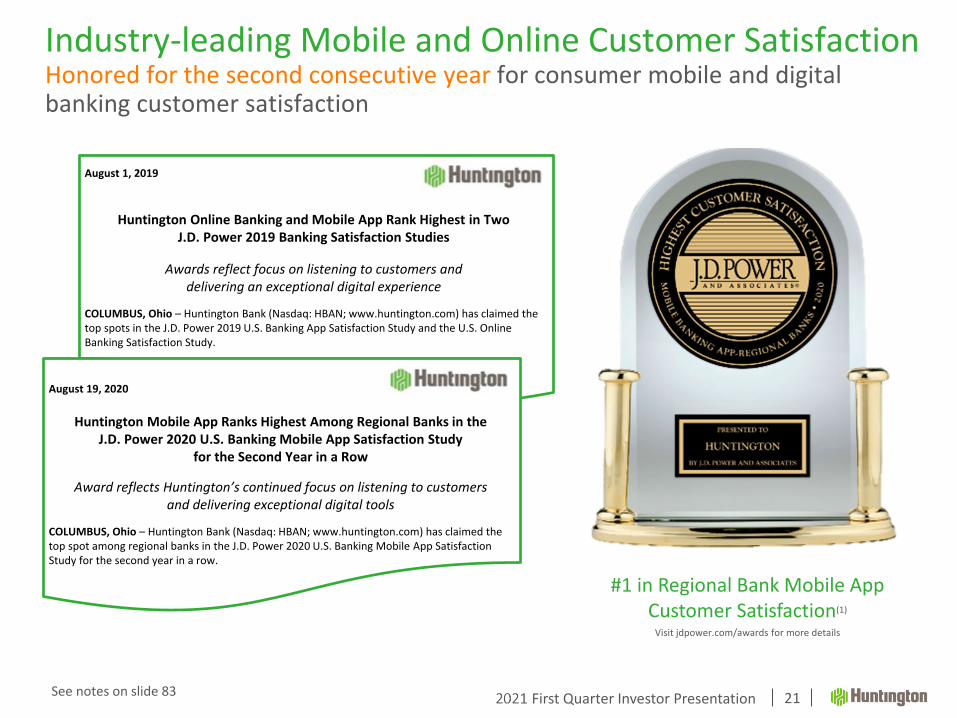
Industry‐leading Mobile and Online Customer SatisfactionHonored for the second consecutive year for consumer mobile and digital banking customer satisfaction
21
#1 in Regional Bank Mobile App Customer Satisfaction(1)
Visit jdpower.com/awards for more details
See notes on slide 83
August 1, 2019
Huntington Online Banking and Mobile App Rank Highest in Two J.D. Power 2019 Banking Satisfaction Studies
Awards reflect focus on listening to customers and delivering an exceptional digital experience
COLUMBUS, Ohio – Huntington Bank (Nasdaq: HBAN; www.huntington.com) has claimed the top spots in the J.D. Power 2019 U.S. Banking App Satisfaction Study and the U.S. Online Banking Satisfaction Study.
August 19, 2020
Huntington Mobile App Ranks Highest Among Regional Banks in theJ.D. Power 2020 U.S. Banking Mobile App Satisfaction Study
for the Second Year in a Row
Award reflects Huntington’s continued focus on listening to customersand delivering exceptional digital tools
COLUMBUS, Ohio – Huntington Bank (Nasdaq: HBAN; www.huntington.com) has claimed the top spot among regional banks in the J.D. Power 2020 U.S. Banking Mobile App Satisfaction Study for the second year in a row.

2021 First Quarter Investor Presentation
COVID Has Not Changed the Importance of Branches, But It Has Changed the Branch Experience
22
VirtualCollaboration
Remote Authentication
eSignIntegration
Appointment Setting
We leverage digital technology to optimize sales & service and empower 3,500+ bankers
across our footprint
Building the Leading People First, Digitally Powered Bank
Remote Account Opening
Digital Sales Collateral
Branch ToolsetBuilt on the premise of the customer physically being present in branch
Digital CapabilitiesBuilt to drive Product Selection, self service, and satisfaction

2021 First Quarter Investor Presentation
Branches represent a vital component in delivering a multi‐channel experience; branch usage trends continue to evolve toward sales and service
Steady consolidation strategy for the past several years with a 4% cumulative annual closure rate from 2016 through 2020 excluding divestitures and FMER‐related consolidations
#1 branch share in both Ohio and Michigan, allowing for future consolidations and efficiencies
1015
61 2
8
51
18
57
30
1,091
956 944
856 828
2016 2017 2018 2019 2020
Opened Closed Total Branches
Delivering a Multi‐Channel Customer ExperienceDigital and mobile adoption accelerating without diminishing branch importance
23
Physical Retail Full‐Service Branch Distribution Network
(2)
See notes on slide 83
(1)
(1)

Financial Update

2021 First Quarter Investor Presentation
2020 Full Year Financial HighlightsDelivered positive operating leverage for the 8th consecutive year
25
$4.8 billion
3% Y/Y
Revenue (FTE)
$0.69
46% Y/Y
EPS
$8.51
3% Y/Y
TBVPS
0.70%
61 basis points Y/Y
ROA
6.8%
6.1 percentage pts Y/Y
ROCE
8.9%
8.0 percentage pts Y/Y
ROTCE
Average loans increased $4.4 billion, or 6%, year‐over‐year
Average core deposits increased $8.7 billion, or 11%, year‐over‐year
Net interest margin of 2.99%, down 27 basis points from the prior year
Efficiency ratio of 56.9%, up from 56.6% in the prior year
Net charge‐off ratio of 57 basis points, up from 35 basis points in the prior year
Provision for credit losses of $1.0 billion, up from $287 million in the prior year
2021 First Quarter Investor Presentation
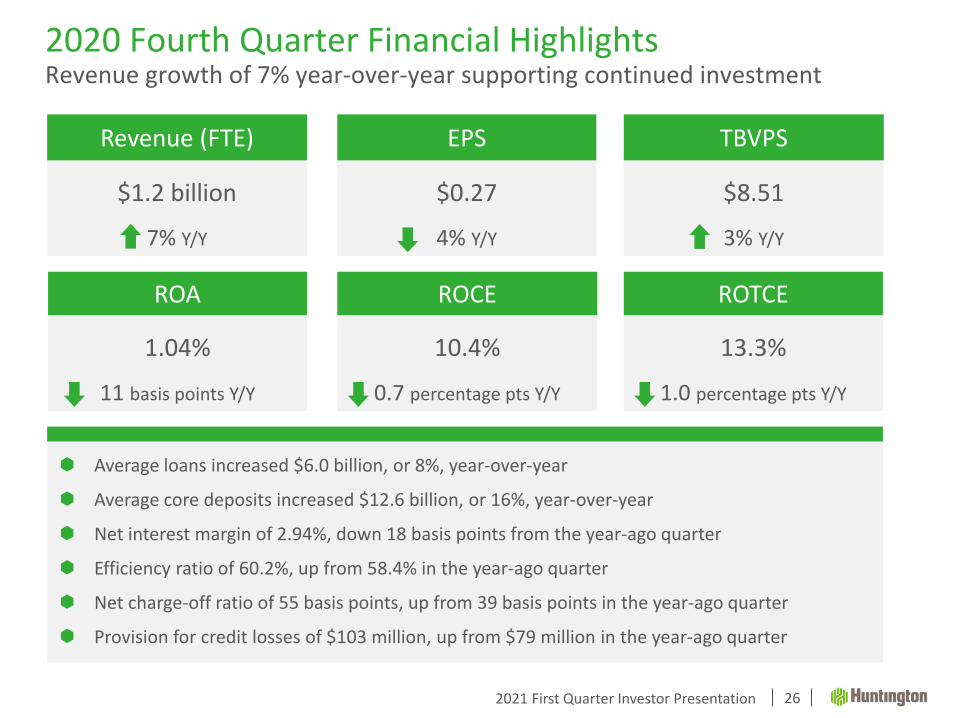
2020 Fourth Quarter Financial HighlightsRevenue growth of 7% year‐over‐year supporting continued investment
26
$1.2 billion
7% Y/Y
Revenue (FTE)
$0.27
4% Y/Y
EPS
$8.51
3% Y/Y
TBVPS
1.04%
11 basis points Y/Y
ROA
10.4%
0.7 percentage pts Y/Y
ROCE
13.3%
1.0 percentage pts Y/Y
ROTCE
Average loans increased $6.0 billion, or 8%, year‐over‐year
Average core deposits increased $12.6 billion, or 16%, year‐over‐year
Net interest margin of 2.94%, down 18 basis points from the year‐ago quarter
Efficiency ratio of 60.2%, up from 58.4% in the year‐ago quarter
Net charge‐off ratio of 55 basis points, up from 39 basis points in the year‐ago quarter
Provision for credit losses of $103 million, up from $79 million in the year‐ago quarter

2021 First Quarter Investor Presentation
Pretax, Pre‐Provision Earnings (PTPP)Solid growth in PTPP in face of challenging environment illustrates underlying earnings power
27
($ in millions) 4Q20 4Q19Y/Y Change
2020 2019Y/Y Change
$ % $ %
Net interest income (FTE) $830 $786 $44 6% $3,245 $3,239 $6 0%
Noninterest income $409 $372 $37 10% $1,591 $1,454 $137 9%
Total revenue $1,239 $1,158 $81 7% $4,836 $4,693 $143 3%
Noninterest expense $756 $701 $55 8% $2,795 $2,721 $74 3%
Pretax, Pre‐Provision Earnings (PTPP)* ‐ Non‐GAAP $483 $457 $26 6% $2,041 $1,972 $69 4%
Provision for credit losses $103 $79 $24 30% $1,048 $287 $761 265%
Net income available to common $281 $298 ($17) ‐6% $717 $1,337 ($620) ‐46%
*Note: Pretax, pre‐provision earnings is a non‐GAAP financial metric – reconciliation in table above

2021 First Quarter Investor Presentation
0.19%0.23% 0.20%
0.35%
0.57%
2016 2017 2018 2019 2020
Average Through‐the‐Cycle Target Range (35 bp – 55 bp)
$1.4
$1.8$1.9 $2.0 $2.0
2016 2017 2018 2019 2020
2.28%
Positioned for Strong Relative Performance Through‐the‐Cycle
28
48%52%4Q20
Avg Loans$81 B
52%48%
4Q20 Avg Core Deposits$92 B
Commercial Consumer
Well‐Diversified Balance SheetStrengthened Pretax Pre‐Provision Net Revenue (1)
Culture of Disciplined Credit Underwriting
$ billions
Strong Capital Base and Capital Management
As percentage of risk‐weighted assets1.78% 2.24% 2.23% 2.30%
8.0%
6.0%
4.5%
6.5%
6.5%
5.5%
14.5%
12.5%
10.0%
Total Risk‐Based Capital Ratio
Tier 1 Risk‐Based Capital Ratio
Common Equity Tier 1 (CET1) Ratio
Regulatory Minimum 4Q20 Buffer
See reconciliation on slide 81

2021 First Quarter Investor Presentation
Continued steady consumer loan production, particularly in home lending and vehicle finance
Record annual mortgage originations during 2020
Focus on household acquisition and continued growth in consumer noninterest‐bearing deposits
Targeting prime and super prime consumers aligned with our high‐FICO portfolios
52% of Loans
Strategic Portfolio MixThoughtful diversification is a vital component of our credit risk management
29
Consumer Bank
Period EndAs of 12/31/21:
Commercial and Business Bank
Strengthening commercial loan activity; pipelines higher than the year‐ago level
Excluding PPP, both utilization rates and new loan production being materially impacted by current economic environment
Targeting large corporations as well as secured businesses
Focus on deepening relationships (fee opportunities)
Period EndAs of 12/31/21:
48% of Loans
53% of Core
Deposits
47% of Core
Deposits

Income Statement

2021 First Quarter Investor Presentation
$786
$796 $797
$822
$830
3.12%
3.14%
2.94% 2.96% 2.94%
2.70%
2.90%
3.10%
3.30%
3.50%
3.70%
3.90%
$740.00
$750.00
$760.00
$770.00
$780.00
$790.00
$800.00
$810.00
$820.00
$830.00
$840.00
4Q19 1Q20 2Q20 3Q20 4Q20
Net Interest Income (FTE)
Net Interest Income Net Interest Margin
$ in millions
Net Interest IncomeYear‐over‐year 12% increase in average earning assets outpaced 18 basis points of net interest margin compression
31
+6%
NIM change LQ 3Q20: 2.96%
Rates / mix / other (0.03)
Hedging / derivatives +0.02
PPP forgiveness +0.02
PPP fee amortization (0.03)
Total change (0.02)
4Q20: 2.94%

2021 First Quarter Investor Presentation
Net Interest Margin (FTE)NIM down 18 basis points year‐over‐year reflecting lower market interest rates and inherent asset sensitivity of balance sheet
32
3.50%
2.70%2.58%
1.87%1.72%
0.65%0.53%
0.31%
0.19%0.08%
1.66%1.46%
0.47%0.30% 0.26%
0.57%
0.43%
0.08% 0.05% 0.02%
4Q19 1Q20 2Q20 3Q20 4Q20
Long‐Term Debt Core Consumer Deposits
Short‐Term Borrowings Core Commercial Deposits
4.03%3.88%
3.35%3.22% 3.13%
1.24%0.98%
0.57%0.39% 0.27%
3.12% 3.14%2.94% 2.96% 2.94%
0.33% 0.24% 0.16% 0.13% 0.08%
4Q19 1Q20 2Q20 3Q20 4Q20
Earning Asset Yield Cost of Int.‐Bearing Liabilities
Net Interest Margin Net Free Funds
Net Interest Margin Trends Components of Cost of Interest‐Bearing Liabilities

2021 First Quarter Investor Presentation
Active Hedges(1) Notional($B)
Wtd. Avg. Receive Rate/
Strike
Wtd. Avg. Pay Rate
Asset Swap – Sec. Port.(2) $3.1 0.15% 0.17%
Asset Swaps – CML Lns $6.5 1.81% 0.15%
Asset Floors $7.2 1.81% 0.15%
Floor Spreads (3) $0.4 2.50% / 1.50% 0.15%
Debt Swaps – 1mL $5.4 2.28% 0.15%
Debt Swaps – 3mL $0.8 1.31% 0.22%
Economic Hedge‐Floor Spreads(4) $1.0 1.75% / 1.00% 0.16%
Economic Hedge‐Caps $5.0 0.98% 0.15%
Economic Hedge‐Basis Swap $0.3 0.09% 0.10%
Total $29.7 1.56% 0.15%
Forward‐Starting Hedges(1)
Not.($B)
Wtd Avg. Rec. Rate/ Floor Strike
Wtd. Avg. Pay Rate
Active Dates
Asset Swap – Sec. Port.(2) $0.4 ‐ 0.68% Jan ‘21 –
Dec ‘33
Asset Swaps – CML Lns $0.8 1.24% ‐ Apr ‘21 –
Jun ‘24
Asset Floors ‐ ‐ ‐ ‐
Floor Spreads (3) $2.5 1.65% / 0.70% ‐ Mar ‘21 –May ‘26
Debt Swaps – 1mL ‐ ‐ ‐ ‐
Debt Swaps – 3mL ‐ ‐ ‐ ‐
Total $3.7 1.38% 0.68% ‐
Hybrid ARMs9% Variable
(>1‐month)4%
Variable (1‐month) Unhedged
19%Variable (1‐month) Hedged19%
Fixed49%
Loan by Rate Index(1)Hybrid ARMs
9% Variable (>1‐month)
4%
Variable (1‐month)
38%
Fixed49%
Loan by Rate Index(1)
Hedging Program Overview
33
Impact of Hedging
See notes on slide 83

2021 First Quarter Investor Presentation
$372
$430 $409
4Q19 3Q20 4Q20
Gain on sale3% BOLI
4% Insurance6%
Capital markets
8%
Other (incl. sec. loss)10%
Trust & inv mgmt12%
Cards & payment16%
Deposit svc chgs19%
Mtg banking22%
Noninterest IncomeMortgage banking income remained robust
34
Total Noninterest IncomeChange in Quarterly Noninterest Income Year‐over‐Year
4Q20 Noninterest Income
vs. Year‐Ago Quarter
Mortgage banking income increased 55%, reflecting higher volume and overall salable spreads, partially offset by a $16 million decrease in income from net mortgage servicing rights (MSR) risk management
The 2020 fourth quarter included no net gains or losses on sales of securities, while the year‐ago quarter included $22 million of net losses
Deposit service charges decreased 18%, primarily reflecting reduced customer activity and elevated deposits
55%
105%
10%
4%
2%
4%
‐18%
‐19%
‐18%
Mtg banking: +$32
Other & sec. losses: +$21
Capital Markets: +$3
Trust & inv mgmt: +$2
Cards & payment: +$1
Insurance: +$1
BOLI: ($3)
Gain on sale: ($3)
Deposit svc chgs: ($17)
+10%
Note: $ in millions unless otherwise noted

2021 First Quarter Investor Presentation
Mortgage Banking Noninterest Income Summary
35
$47 $54
$96
$120
$95
$11 $4
$(5)
$58 $58
$96
$122
$90
2.64%3.13%
3.93%
4.67%
3.85%
$(10)
$10
$30
$50
$70
$90
$110
$130
$150
4Q19 1Q20 2Q20 3Q20 4Q20
Mortgage Banking Income (MBI)
MBI less Net MSR Net MSR Secondary Mkt Spreads
($ in billions) 4Q20 3Q20 2Q20 1Q20 4Q19
Mortgage origination volume for sale 2.4) 2.6 2.3 1.4 1.5
Third party mortgage loans serviced(1) 23.5) 23.3 23.2 22.8 22.4Mortgage servicing rights(1) 0.2) 0.2 0.2 0.2 0.2
MSR % of investor servicing portfolio(1) 0.89%) 0.82% 0.74% 0.72% 0.95%
49% 45%35%
46% 44%
51% 55%65%
54% 56%
4Q19 1Q20 2Q20 3Q20 4Q20
Salable Production Mix
Purchased Refinanced
(1) End of period

2021 First Quarter Investor Presentation
Balance Sheet & Key Fee Income Drivers TrendsQuarterly growth driven by PPP, deposit inflows, and mortgage originations
36
Salable Mortgage Origination Volume ($ millions)
Period‐End Total Commercial Loan Balances ($ billions)
Debit Card Volume (YoY Change)
Period‐End Total Deposit Balances ($ billions)

2021 First Quarter Investor Presentation
$701 $712
$756
4Q19 3Q20 4Q20
Total Expense
Noninterest ExpenseContinued investment in talent and technology drive expense growth
37
Change in Quarterly Noninterest Expense Year‐over‐Year+8%
vs. Year‐Ago Quarter
Outside data processing and other services increased 25%, primarily driven by expenses related to technology investments
Other noninterest expense increased 33%, primarily reflecting a $20 million donation to the Columbus Foundation
Equipment expense increased 17%, primarily reflecting increased depreciation expense related to technology investments
58.4%
55.4% 55.9%
56.1%
60.2%
4Q19 1Q20 2Q20 3Q20 4Q20
Efficiency Ratio Trend
25%
33%
17%
49%
67%
0%
‐19%
‐5%
‐17%
Outside data processing: +$22
Other expense: +$19
Equipment: +$7
Professional services: +$7
Marketing: +$6
Personnel costs: +$0
Deposit & other insurance: ($2)
Net occupancy: ($2)
Amort. of intangibles: ($2)
Note: $ in millions unless otherwise noted

2021 First Quarter Investor Presentation
($ in millions) 4Q20 3Q20 4Q19 2020 2019Reported (GAAP)Income before income taxes $375 $358 $372 $972 $1,659Provision for income taxes $59 $55 $55 $155 $248Effective tax rate 15.8% 15.2% 14.8% 15.9% 15.0%
FTE AdjustmentIncome before income taxes $5 $5 $6 $21 $26Provision for income taxes $5 $5 $6 $21 $26
Adjusted (Non‐GAAP)Income before income taxes $380 $363 $378 $993 $1,685Provision for income taxes $65 $59 $61 $176 $275Effective tax rate 17.0% 16.4% 16.2% 17.7% 16.3%
Tax Rate SummaryReported vs. FTE adjusted
38

Balance Sheet

2021 First Quarter Investor Presentation
5%2%
1%4%
0%‐2%0%‐1%
‐4%
Total Securities: +$1.2Residential Mortgage: +$0.3
C&I: +$0.2RV and Marine: +$0.2Home Equity: +$0.0
Other Consumer: ($0.0)Automobile: ($0.0)
CRE: ($0.0)Other Earning Assets: ($0.3)
Average Growth Linked Quarter
Average Earning AssetsCommercial & industrial loans and elevated deposits at the Federal Reserve drive year‐over‐year earning asset growth
40
291%15%
4%7%17%5%2%
‐16%‐3%
Other Earning Assets: +$5.2C&I: +$4.5
Total Securities: +$0.9Residential Mortgage: +$0.8
RV and Marine: +$0.6CRE: +$0.4
Automobile: +$0.3Other Consumer: ($0.2)
Home Equity: ($0.3)
75% 75% 74% 74% 73%
23% 23% 24% 22% 21%$99.7 $100.1
$101.8 $109.0 $110.7
4Q19 1Q20 2Q20 3Q20 4Q20
Other EarningAssets
Total Securities
Total Loans
vs. Year‐Ago Quarter Average
Other earning assets increased 291%, driven by elevated deposits at the Federal Reserve Bank
C&I loans increased 15%, primarily reflecting the $6.2B of average Payroll Protection Program (PPP) loans
Residential mortgage increased 7%, reflecting robust mortgage production in the second half of 2020
RV and marine increased 17%, reflecting strong consumer demand and continued strong production levels
+12%
Note: $ in billions unless otherwise noted
Average Quarterly Growth Year‐over‐Year

2021 First Quarter Investor Presentation
Average Loan Composition: $81.1 Billion4Q20 average balances
41
43%
9%16%
11%
15%
5%
1%
Average Balance by Type
C&I $34.9BCommercial Real Estate $7.2BAuto $12.9BHome Equity $8.9BResidential Mortgage $12.1BRV/Marine $4.2BOther Consumer $1.0B
34%
33%
25%
8%
Average Balance by Segment
Consumer and Business Banking: $27.5BCommercial Banking: $26.7BVehicle Finance: $20.0BRegional Banking and Private Client Group: $6.8BTreasury/Other: $0.2B

2021 First Quarter Investor Presentation
Consumer and Commercial Asset Trends
42
Average ($ in billions) 2020 2020 vs 2019 4Q20 4Q20 vs
3Q20(1)4Q20 vs 4Q19
Commercial
Commercial and industrial loans $ 33.9 11) % $ 34.9 2) % 15) %
Commercial real estate:
Construction loans 1.2 (1) 1.1 (31) (8)
Commercial loans 5.9 3) 6.1 3) 8)
Total commercial loans 41.0 9) 42.0 1) 13)
Commercial bonds(2) 3.1 (2) 3.1 (9) 0)
Total commercial assets(2) 44.0 9) 45.1 1) 12)
Consumer
Automobile loans 12.8 4) 12.9 (1) 2)
Home equity loans 8.9 (5) 8.9 2) (3)
Residential mortgage loans 11.7 5) 12.1 10) 7)
RV and marine loans 3.9 12) 4.2 16) 17)
Other consumer loans 1.1 (14) 1.0 (6) (16)
Total consumer assets 38.4 2) 39.1 5) 3)
Total $ 82.5 6) % $ 84.2 2) % 8) %
See notes on slide 84

2021 First Quarter Investor Presentation
36%
13%26%
17%
8%
< $5 MM: $15.3B
$5 MM ‐ < $10 MM: $5.7B
$10 MM ‐ <$25 MM: $10.9B
$25 MM ‐ < $50 MM: $7.2B
$50 MM +: $3.5B
< $5 MM $5+ MM
1,7662%
69,32098%
$5 MM ‐ < $10 MM 810$10 MM ‐ < $25 MM 690$25 MM ‐ < $50 MM 219> $50 MM 47Total 1,766
Total Commercial Loans – GranularityEnd of period outstandings of $42.6 billion
43
Loans by Dollar Size# of Loans by Size

2021 First Quarter Investor Presentation
Commercial and Industrial: $35.4 Billion
44
Diversified by sector and geographically within our Midwest footprint; asset finance and specialty lending in extended footprint
Strategic focus on middle market companies with $20 ‐ $500 million in sales and Business Banking customers with <$20 million in sales
Lend to defined relationship‐oriented clients where we understand our client's market / industry and their durable competitive advantage
Underwrite to historical cash flows with collateral as a secondary repayment source while stress testing for lower earnings / higher interest rates
Follow disciplined credit policies and processes with quarterly review of criticized and classified loans
Credit Quality Review 4Q20 3Q20 2Q20 1Q20 4Q19
Period end balance ($ in billions) $35.4 $34.9 $34.9 $33.0 $30.7
30+ days PD and accruing 0.18% 0.20% 0.17% 0.33% 0.24%
90+ days PD and accruing(1) 0.03% 0.03% 0.04% 0.03% 0.04%
NCOs(2) 0.67% 0.90% 0.90% 1.09% 0.47%
NALs 1.00% 1.11% 1.39% 1.20% 1.05%
ALLL 2.65% 2.61% 2.65% 2.54% 1.53%
See notes on slide 84
2021 First Quarter Investor Presentation
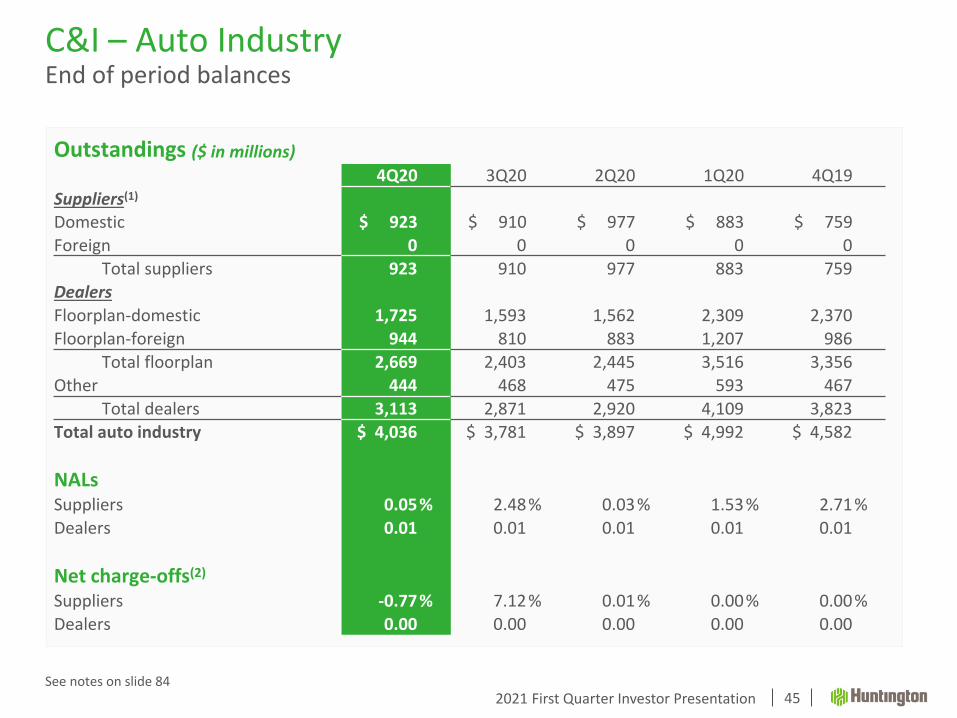
Outstandings ($ in millions)4Q20 3Q20 2Q20 1Q20 4Q19
Suppliers(1)Domestic $ 923 $ 910 $ 977 $ 883 $ 759Foreign 0 0 0 0 0
Total suppliers 923 910 977 883 759DealersFloorplan‐domestic 1,725 1,593 1,562 2,309 2,370Floorplan‐foreign 944 810 883 1,207 986
Total floorplan 2,669 2,403 2,445 3,516 3,356Other 444 468 475 593 467
Total dealers 3,113 2,871 2,920 4,109 3,823Total auto industry $ 4,036 $ 3,781 $ 3,897 $ 4,992 $ 4,582
NALsSuppliers 0.05% 2.48% 0.03% 1.53% 2.71%Dealers 0.01 0.01 0.01 0.01 0.01
Net charge‐offs(2)Suppliers ‐0.77% 7.12% 0.01% 0.00% 0.00%Dealers 0.00 0.00 0.00 0.00 0.00
C&I – Auto IndustryEnd of period balances
45See notes on slide 84

2021 First Quarter Investor Presentation
Long‐term, meaningful relationships with opportunities for additional cross‐sello Primarily Midwest footprint projects generating adequate return on capitalo Proven CRE participants… 28+ years average CRE experienceo >80% of the loans have personal guaranteeso >65% is within our geographic footprinto Portfolio remains within the Board established concentration limit
Commercial Real Estate: $7.2 Billion
46
Credit Quality Review 4Q20 3Q20 2Q20 1Q20 4Q19
Period end balance ($ in billions) $7.2 $7.2 $7.2 $7.0 $6.7
30+ days PD and accruing 0.11% 0.13% 0.04% 0.18% 0.06%
90+ days PD and accruing(1) 0.00% 0.00% 0.00% 0.00% 0.00%
NCOs(2) 1.81% 0.63% ‐0.03% ‐0.03% 0.00%
NALs 0.20% 0.21% 0.38% 0.42% 0.16%
ALLL 4.13% 4.87% 3.43% 2.28% 1.24%
See notes on slide 84

2021 First Quarter Investor Presentation
Huntington Auto FinanceSignificant presence in our markets and in our industry
47
11 strategically located regional offices servicing our dealer partners in 23 states:
Ohio New HampshireIndiana TennesseeMichigan MinnesotaWest Virginia New JerseyPennsylvania ConnecticutKentucky IowaIllinois North Dakota Wisconsin South DakotaMassachusetts TexasMaine KansasVermont MissouriRhode Island
Huntington is the 18th largest auto loan lenderand 9th largest auto loan bank lender in the U.S.(1)
Huntington is the #1 auto loan lender in the states of Ohio and Kentucky (1)
In Market
See notes on slide 84

2021 First Quarter Investor Presentation
Automobile: $12.8 Billion
48
Extensive relationships with high quality dealerso Huntington consistently in the market for nearly 70 yearso Dominant market position in the Midwest with ~4,200 dealerso Floorplan and dealership real estate lending, core deposit relationship, full Treasury
Management, Private Banking, etc. Relationships create the consistent flow of auto loans
o Prime customers, average FICO >760o LTVs average <93%o Custom Score utilized in conjunction with FICO to enhance predictive modelingo No auto leasing (exited leasing in 2008)
Operational efficiency and scale leverages expertiseo Highly scalable auto‐decision engine evaluates >70% of applications based on FICO and custom scoreo Underwriters directly compensated on credit performance by vintage
Credit Quality Review 4Q20 3Q20 2Q20 1Q20 4Q19
Period end balance ($ in billions) $12.8 $12.9 $12.7 $12.9 $12.8
30+ days PD and accruing 0.90% 0.69% 0.54% 0.88% 0.95%
90+ days PD and accruing 0.07% 0.07% 0.06% 0.06% 0.07%
NCOs 0.21% 0.31% 0.31% 0.22% 0.30%
NALs 0.03% 0.04% 0.06% 0.05% 0.03%
ALLL 1.30% 1.26% 1.40% 1.15% 0.45%

2021 First Quarter Investor Presentation
($ in billions) 2020 2019 2018 2017 2016 2015 2014 2013
Originations $5.9 $6.1 $5.8 $6.2 $5.8 $5.2 $5.2 $4.2
% new vehicles 47% 46% 47% 50% 49% 48% 49% 46%
Avg. LTV(1) 89% 90% 89% 88% 89% 90% 89% 89%Avg. FICO 775 772 766 767 765 764 764 760Weighted avg. original term (months) 70 70 69 69 68 68 67 67
Avg. Custom Score 411 410 409 409 396 396 397 395
Charge‐off % (annualized) 0.26% 0.26% 0.27% 0.36% 0.30% 0.23% 0.23% 0.19%
Auto Loans – Origination TrendsLoan originations from 2013 through 2020 demonstrate strong characteristics and continued improvements from pre‐2010
See notes on slide 8449
Credit scoring model most recently updated in January 2017 2016‐2019 net charge‐offs impacted by acquisition of FirstMerit, including purchase
accounting treatment of acquired portfolio

2021 First Quarter Investor Presentation
Credit Quality Review 4Q20 3Q20 2Q20 1Q20 4Q19
Period end balance ($ in billions) $8.9 $8.9 $8.9 $9.0 $9.1
30+ days PD and accruing 0.68% 0.47% 0.51% 0.80% 0.87%
90+ days PD and accruing 0.16% 0.12% 0.12% 0.13% 0.16%
NCOs 0.01% ‐0.02% 0.08% 0.19% 0.02%
NALs 0.75% 0.69% 0.60% 0.56% 0.58%
ALLL 1.41% 1.07% 1.10% 1.24% 0.50%
Focused on geographies within our Midwest footprint with relationship customers Focused on high quality borrowers… portfolio as of 4Q20:
o Average weighted FICO scores of 750+ o Average weighted LTVs of <85% for junior liens and <75% for 1st‐lienso Approximately 60% are 1st‐liens
Conservative underwriting – manage the probability of default with increased interest rates used to ensure affordability on variable rate HELOCs
Home Equity: $8.9 Billion
50

2021 First Quarter Investor Presentation
($ in billions) 2020 2019 2018 2017 2016 2015 2014 2013
Originations(1) $3.8 $3.7 $4.2 $4.3 $3.3 $2.9 $2.6 $2.2
Avg. LTV 68% 75% 77% 77% 78% 77% 76% 72%
Avg. FICO 784 778 773 775 781 781 780 780
Charge‐off % (annualized) 0.07% 0.08% 0.06% 0.05% 0.06% 0.23% 0.44% 0.99%
HPI Index(2) 241.9 228.5 218.6 208.5 198.2 187.7 179.6 170.7
Unemployment rate(3) 8.1% 3.7% 3.9% 4.4% 4.9% 5.3% 6.2% 7.4%
Home Equity – Origination Trends
Consistent origination strategy since 2010 HPI Index is at highest level since pre‐2007 – consistent with general assessment of the
overall market Focused on high quality borrowers… 4Q20 originations:
o Average weighted FICO scores of 750+ o Average weighted LTVs of <85% for junior liens and <75% for 1st‐lienso Approximately 66% are 1st‐liens
See notes on slide 8451

2021 First Quarter Investor Presentation
Credit Quality Review 4Q20 3Q20 2Q20 1Q20 4Q19
Period end balance ($ in billions) $12.1 $12.0 $11.6 $11.4 $11.4
30+ days PD and accruing 2.29% 2.28% 2.18% 2.10% 2.40%
90+ days PD and accruing 1.09% 1.18% 1.36% 1.15% 1.13%
NCOs 0.05% 0.03% 0.02% 0.02% 0.04%
NALs 0.72% 0.73% 0.57% 0.58% 0.62%
ALLL 0.65% 0.57% 0.38% 0.46% 0.20%
Traditional product mix focused on geographies within our Midwest footprint Early identification of at‐risk borrowers. “Home Savers” program has a 75%
success rate
Residential Mortgages: $12.1 Billion
52
2021 First Quarter Investor Presentation
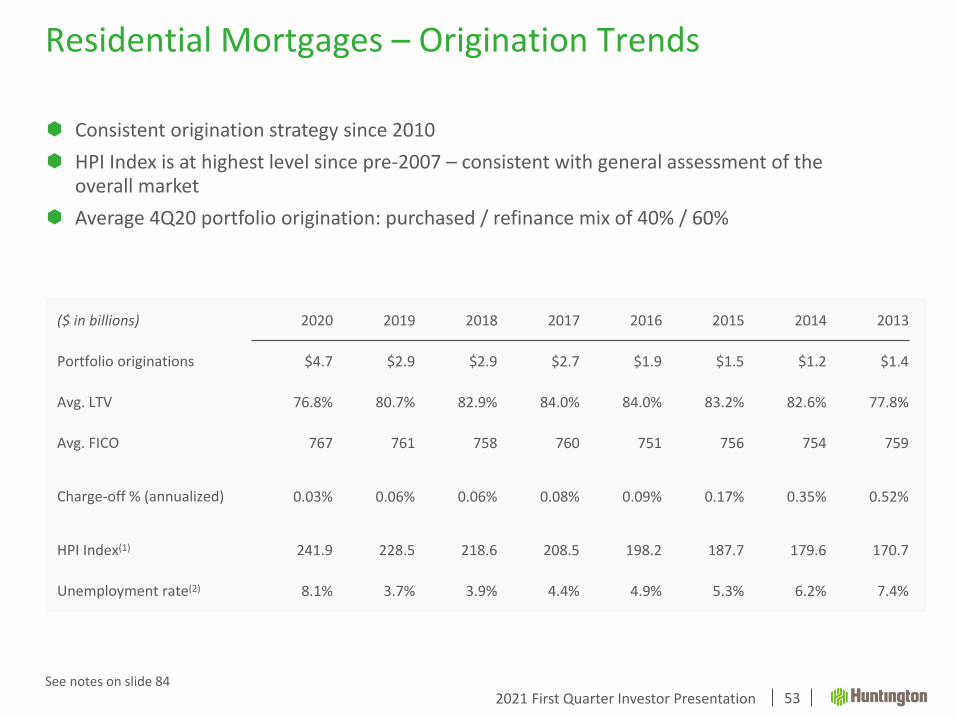
($ in billions) 2020 2019 2018 2017 2016 2015 2014 2013
Portfolio originations $4.7 $2.9 $2.9 $2.7 $1.9 $1.5 $1.2 $1.4
Avg. LTV 76.8% 80.7% 82.9% 84.0% 84.0% 83.2% 82.6% 77.8%
Avg. FICO 767 761 758 760 751 756 754 759
Charge‐off % (annualized) 0.03% 0.06% 0.06% 0.08% 0.09% 0.17% 0.35% 0.52%
HPI Index(1) 241.9 228.5 218.6 208.5 198.2 187.7 179.6 170.7
Unemployment rate(2) 8.1% 3.7% 3.9% 4.4% 4.9% 5.3% 6.2% 7.4%
Residential Mortgages – Origination Trends
Consistent origination strategy since 2010 HPI Index is at highest level since pre‐2007 – consistent with general assessment of the
overall market Average 4Q20 portfolio origination: purchased / refinance mix of 40% / 60%
See notes on slide 8453

2021 First Quarter Investor Presentation
Expansion of legacy FirstMerit product leveraging additional industry and regional credit and relationship manager expertise and Huntington Auto Finance’s existing infrastructure
Experienced team with 20+ years average industry experience
Centrally underwritten with focus on high super prime borrowers
Tightened underwriting standards to align with Huntington’s origination standards and risk appetite
Indirect origination via established dealers across 34 state footprint
o Entered business in 2016; 2017‐2018 expansion into new states primarily the Southeast and West
Recreational Vehicle & Marine
54
Legacy states (FirstMerit)
2017‐2018 expansion states

2021 First Quarter Investor Presentation
($ in billions) 2020 2019 2018 2017
Portfolio originations $1.6 $1.0 $1.4 $1.0
Avg. LTV(1) 108.0% 105.5% 105.6% 109.0%
Avg. FICO 808 800 799 791
Weighted avg. original term (months) 193 192 192 181
Charge‐off % (annualized) 0.31% 0.31% 0.32% 0.48%
RV and Marine: $4.2 Billion
See notes on slide 8455
Credit Quality Review 4Q20 3Q20 2Q20 1Q20 4Q19
Period end balance ($ in billions) $4.2 $4.1 $3.8 $3.6 $3.6
30+ days PD and accruing 0.54% 0.39% 0.33% 0.55% 0.52%
90+ days PD and accruing 0.06% 0.05% 0.05% 0.05% 0.05%
NCOs 0.21% 0.38% 0.37% 0.27% 0.39%
NALs 0.04% 0.03% 0.05% 0.04% 0.04%
ALLL 3.09% 2.80% 3.25% 2.67% 0.59%
Origination Trends

2021 First Quarter Investor Presentation
8.4
8.7
8.8
8.6
8.6 9.4 9.8
8.9
8.8
13.5
13.8
13.5
13.9
14.0 14
.4
13.9
13.4 14.8
$‐
$5
$10
$15
$20
$25
$30
4Q18
1Q19
2Q19
3Q19
4Q19
1Q20
2Q20
3Q20
4Q20
Held‐to‐maturity Available‐for‐sale
Securities Mix and Yield(1)
56
($ in billions)
2.45%2.52% 2.54% 2.51% 2.50% 2.50%
2.39%
2.28%
2.11%
3.04% 3.01%2.94%
2.87%2.79%
2.75%
2.39%
2.06%
1.72%
1.50%
1.75%
2.00%
2.25%
2.50%
2.75%
3.00%
3.25%
4Q18
1Q19
2Q19
3Q19
4Q19
1Q20
2Q20
3Q20
4Q20
Held‐to‐maturity Available‐for‐sale
Securities Portfolio YieldSecurities Portfolio Mix
See notes on slide 85

2021 First Quarter Investor Presentation
($mm) % of Remaining % of Remaining % of RemainingAFS Portfolio Carry Value Portfolio Life to Maturity Yield(3) Carry Value Portfolio Life to Maturity Yield(3) Carry Value Portfolio Life to Maturity Yield(3)
U.S. Treasuries 5 0.0% 1.7 0.14% 5 0.0% 105.9 0.14% 10 0.0% 0.3 1.68%Agency Debt 62 0.2% 2.9 2.53% 114 0.5% 2.8 2.51% 165 0.7% 3.3 2.53%Agency P/T 7,935 30.8% 22.5 1.59% 5,761 24.2% 24.2 1.60% 4,223 17.8% 27.4 2.94%Agency CMO 3,666 14.2% 25.1 2.39% 4,498 18.9% 25.2 2.08% 5,085 21.5% 25.8 2.59%Agency Multi-Family 1,163 4.5% 30.7 2.17% 807 3.4% 31.4 2.30% 976 4.1% 31.7 2.45%Municipal Securities(2) 60 0.2% 5.2 2.60% 63 0.3% 5.4 2.64% 64 0.3% 5.8 2.83%Other Securities 650 2.5% 11.6 2.18% 478 2.0% 12.4 2.27% 635 2.7% 13.2 3.18%Total AFS Securities 13,541 52.6% 23.2 1.87% 11,725 49.3% 24.3 1.84% 11,158 47.2% 25.7 2.72%
HTM PortfolioAgency Debt 246 1.0% 9.9 2.50% 256 1.1% 10.1 2.50% 293 1.2% 10.9 2.49%Agency P/T 3,715 14.4% 25.8 2.01% 2,926 12.3% 26.9 2.12% 2,463 10.4% 27.2 2.95%Agency CMO 1,778 6.9% 22.4 2.67% 1,959 8.2% 22.6 2.56% 2,351 9.9% 23.2 2.63%Agency Multi-Family 3,118 12.1% 33.0 2.97% 3,413 14.3% 33.2 2.91% 3,959 16.7% 34.0 2.61%Municipal Securities 3 0.0% 21.9 2.63% 3 0.0% 22.2 2.63% 4 0.0% 22.9 3.32%Total HTM Securities 8,861 34.4% 27.2 2.50% 8,557 36.0% 27.9 2.55% 9,070 38.3% 28.6 2.70%
Other AFS Equities 418 1.6% N/A N/A 421 1.8% N/A N/A 441 1.9% N/A N/A
AFS Direct Purchase Municipal Instruments(2) 2,944 11.4% 5.4 2.58% 3,082 13.0% 5.4 2.60% 2,991 12.6% 5.4 3.60%
Grand Total 25,765 100.0% 22.2 2.17% 23,785 100.0% 22.7 2.20% 23,659 100.0% 23.8 2.83%
December 31, 2020 September 30, 2020 December 31, 2019
AFS and HTM Securities Overview(1)
57See notes on slide 85

2021 First Quarter Investor Presentation
vs. Year‐Ago Quarter Average
Total core deposits increased 16%, primarily driven by business and commercial growth related to the PPP loans and increased liquidity levels in reaction to the economic downturn, consumer growth largely related to government stimulus, increased consumer and business banking account production, and reduced attrition
Core CDs decreased 69%, reflecting the maturity of balances related to the 2018 consumer deposit growth initiatives
Total debt decreased 24%, reflecting the repayment of short‐term borrowings, the maturity and issuance of long‐term debt, and the purchase of long‐term debt in 4Q20
5%
3%
3%
0%
‐3%
‐3%
‐27%
DDA‐Int. Bearing: +$1.2
DDA‐Nonint. Bearing: +$0.7
Savings / Other: +$0.3
MMA: ($0.1)
Noncore Deposits: ($0.1)
Borrowings & Other: ($0.3)
Core CDs: ($0.6)
Average Non‐Equity FundingDemand deposits drive robust year‐over‐year growth in core deposits
58
36%
25%
20%
6%
46%
‐19%
‐69%
DDA‐Nonint. Bearing: +$7.5
DDA‐Int. Bearing: +$5.0
Savings / Other: +$1.9
MMA: +$1.6
Noncore Deposits: +$1.3
Borrowings & Other: ($2.7)
Core CDs: ($3.3)
82% 81% 84% 85% 85%
3% 3%4% 4% 4%
10% 10%9% 9% 8%$96.8 $98.5
$106.2 $106.9 $108.1
4Q19 1Q20 2Q20 3Q20 4Q20
Short‐TermBorrowings & Other
Long‐Term Debt
Non‐Core Deposits
Core Deposits
Note: $ in billions unless otherwise noted
+12%
Average Growth Linked QuarterAverage Quarterly Growth Year‐over‐Year

2021 First Quarter Investor Presentation
Average Deposit Composition: $96.6 Billion4Q20 average balances
59
62%
25%
1% 7%5%
Average Balance by Segment
Consumer and Business Banking: $60.2B
Commercial Banking: $24.1B
Vehicle Finance: $0.8B
Regional Banking and Private Client Group: $6.9B
Treasury/Other: $4.7B
29%
26%
27%
12%
2%0%
4%
Average Balance by Type
Demand ‐ Noninterest Bearing $28.1BDemand ‐ Interest Bearing $25.1BMoney Market $26.1BSavings $11.5BCore CDs $1.5BOther Domestic Deps >$250,000 $0.1BBrokered Deps & Negotiable CDs $4.1B

2021 First Quarter Investor Presentation
Total Core Deposit Trends
60See notes on slide 85
Average ($ in billions) 2020 2020 vs 2019 4Q20 4Q20 vs
3Q20(1)4Q20 vs 4Q19
Commercial
Demand deposits – noninterest bearing $ 19.2 27) % $ 21.7 16) % 37) %
Demand deposits – interest bearing 13.7 20) 14.4 21) 23)
Total commercial DDA 32.9 24) 36.1 18) 31)
Other core deposits(2) 8.2 (0) 7.9 (17) (1)
Total commercial core deposits 41.0 18) 43.9 11) 24)
Consumer
Demand deposits – noninterest bearing 6.2 26) 6.5 (7) 33)
Demand deposits – interest bearing 9.8 16) 10.7 20) 27)
Total consumer DDA 16.0 19) 17.2 10) 29)
Other core deposits(2) 30.9 (1) 31.2 1) 1)
Total consumer core deposits 46.8 5) 48.4 4) 9)
Total
Demand deposits – noninterest bearing 25.3 26) 28.1 10) 36)
Demand deposits – interest bearing 23.5 18) 25.1 21) 25)
Other core deposits(2) 39.0 (1) 39.1 (3) 0)
Total core deposits $ 87.9 11) % $ 92.3 7) % 16) %

2021 First Quarter Investor Presentation
SeniorHoldCo
Senior Bank
HoldCoOutlook
PreferredEquityRating Agency
Moody’s Baa1 A3 Stable Baa3
Standard & Poor’s BBB+ A‐ Negative BB+
Fitch A‐ A‐ Negative BB+
DBRS Morningstar A A (high) Negative BBB
0.7 0.5 1.0 1.1
0.8
2.5
0.6
2.0
3.1
2.0 1.7
2.0 1.6
1.3
0.5
2015 2016 2017 2018 2019 2020Preferred Equity Issued Senior Debt Matured Senior Debt Issued Senior Debt Repurchased
Stable, Diversified Sources of Wholesale FundsHistorical issuance and current ratings
61
Wholesale Funding Issuances and Maturities ($ in billions)
Debt Credit Ratings Recent Highlights Issued $500 million 4.45% fixed rate reset non‐
cumulative perpetual preferred stock in August 2020
Issued $500 million 5.625% fixed rate reset non‐cumulative perpetual preferred stock in May 2020
Issued $750 million fixed rate 10‐year Holding Company at T+95 and $500 million fixed rate 3‐year bank notes at T+38 in January 2020
Total long term unsecured debt outstanding at Dec. 31, 2020 was $7.8B exclusive of non‐cumulative preferred.

2021 First Quarter Investor Presentation
Objectives
Maintain robust liquidity at the holding company
Reduce reliance on wholesale liabilities to the extent possible
Auto securitization also used as a source of funds and to reduce auto concentration
0.0
0.2
0.4
0.6
0.8
1.0
1.2
1Q21 3Q21 1Q22 3Q22 1Q23 3Q23 1Q24 3Q24 1Q25 3Q25
Quarterly Maturities Through 2025HoldCo Sr. HoldCo Sub Bank Sr.
$ in billions
Stable, Diversified Sources of Wholesale FundsSmooth runoff profile and optimization of funding costs
62
Senior Subordinated
2021 $1,850 ‐‐
2022 $1,900 ‐‐
2023 $1,250 $250
2024 $800 ‐‐
2025 $500 ‐‐
Annual Maturities ($ in millions)

Capital

2021 First Quarter Investor Presentation
$8.25 $8.28 $8.32
$8.43 $8.51
7.88%7.52%
7.28% 7.27% 7.16%6.70%
7.20%
7.70%
8.20%
8.70%
9.20%
9.70%
$7.50
$7.70
$7.90
$8.10
$8.30
$8.50
$8.70
4Q19 1Q20 2Q20 3Q20 4Q20
Tangible Common Equity
TBVPS TCE Ratio
Capital and LiquidityManaging capital and liquidity consistent with our aggregate moderate‐to‐low risk appetite
64
92%90%
86% 85%82%
$0.70
$0.75
$0.80
$0.85
$0.90
$0.95
4Q19 1Q20 2Q20 3Q20 4Q20
EOP Loan to Deposit Ratio
150% 147%
170%
183%188%
$1.40
$1.50
$1.60
$1.70
$1.80
$1.90
$2.00
4Q19 1Q20 2Q20 3Q20 4Q20
EOP Modified Liquidity Coverage Ratio
9.9% 9.5% 9.8% 9.9% 10.0%
1.4% 1.3% 1.9% 2.5% 2.5%1.8% 1.9%
2.0% 2.0% 2.0%13.0% 12.7%
13.8% 14.4% 14.5%
4Q19 1Q20 2Q20 3Q20 4Q20
Total Risk‐Based Capital Ratios
CET1 Preferred & Other Tier 1 ALLL & Other Tier 2
See notes on slide 85
(2) (2)(2)
(1)
(2)

2021 First Quarter Investor Presentation
There were 0.4 million shares repurchased in 4Q20 to offset compensation plan‐related share issuances
Change in Common Shares Outstanding
65
Share count in millions 4Q20 3Q20 2Q20 1Q20 4Q19 3Q19 2Q19 1Q19
Beginning shares outstanding 1,017 1,017 1,014 1,020 1,033 1,038 1,046 1,047
Employee equity compensation 0 0 3 1 0 0 3 2
Share repurchases 0 0 0 (7) (13) (5) (11) (2)
Ending shares outstanding 1,017 1,017 1,017 1,014 1,020 1,033 1,038 1,046
Average basic shares outstanding 1,017 1,017 1,016 1,018 1,029 1,035 1,045 1,047
Average diluted shares outstanding 1,036 1,031 1,029 1,035 1,047 1,051 1,060 1,066

Credit Quality

2021 First Quarter Investor Presentation
Strategic Credit Risk Management Actions Since 2009Positioned for top quartile through‐the‐cycle performance
67
2009
• Established clear credit risk appetite and aligned credit strategy and policy• Centralized credit and risk management (versus delegation to each region)• Established credit concentration limits• Identified core CRE customers based on financial strength and performance; began exiting non‐core
borrowers (greater than 90% of CRE customers)
2010 – 2011• Tightened consumer lending standards• Eliminated HELOC requiring balloon payments
2015 • Established leveraged lending policies and underwriting standards
2016• Increased equity requirements on CRE, particularly construction, retail, and multi‐family• Deep credit due diligence on FirstMerit acquisition (expectations met since)
2017
• Heightened underwriting standards for leveraged lending• Began leveraging well‐established Auto Finance underwriting infrastructure and standards in the
RV & Marine business • Curtailed new construction originations in long‐term care segment of healthcare
2018 – 2019 • Reduced exposure to 2nd‐lien high LTV home equity• Implemented FICO score adjustments in HELOC (as well as construction limits) and RV/Marine• Tightened limits on policy exceptions, particularly in middle market

2021 First Quarter Investor Presentation
Allowance for Credit Losses (ACL)Stable ACL coverage ratio
68
Multiple scenarios utilized while using November
baseline as foundation
While baseline outlook significantly improved quarter to
quarter, current COVID impacts are a headwind
The allowance reflects the ongoing sensitivity within
impacted industries and subjective adjustments to
reflect the current economic environment
ACL coverage steady linked quarter with a prudent
approach to the COVID uncertainty
$887
$1,603
$1,821 $1,878 $1,866
1.18% of loans
2.05% of loans
2.27% of loans
2.31% of loans
2.29% of loans
2.45% of loans ex. PPP
2.50% of loans ex. PPP
2.46% of loans ex. PPP
1.12% of loans
1.70% of loans
1.97% of loans
2.01% of loans
4Q19 ACL 1Q20 ACL 2Q20 ACL 3Q20 ACL 4Q20 ACL
Huntington Peer Median
(1)
(1) See reconciliation on slide 82
$ in millions
(1)(1)

2021 First Quarter Investor Presentation
Credit Quality – NPAs and TDRsOil and gas impacts waning as aggressive reduction strategy takes hold
69
Nonperforming Assets (NPAs):($ in millions) 4Q20 3Q20 Q/Q
Change
Commercial and Industrial $353 $388 ($35)
Oil & Gas within C&I 60 139 (79)
Commercial real estate 15 16 (1)
Automobile 4 5 (1)
Home equity 70 71 (1)
Residential mortgage 88 88 ‐‐)
RV and marine 2 1 1
Other consumer ‐‐ ‐‐ ‐‐)
Total NALs $532 $569 ($37)
Total other real estate, net 4 5 (1)
Other NPAs 27 28 (1)
Oil & Gas within HFS NPAs 0 9 (9)
Total NPAs $563 $602 ($39)
$442 $391 $425 $454 $503
$56$195
$288 $148 $60
0.66% 0.75% 0.89% 0.74% 0.69%
4Q19 1Q20 2Q20 3Q20 4Q20
Trend in Nonperforming Assets
All Other Oil & Gas NPA ratio
$186 $194 $244 $229 $182
$753 $758 $733 $747 $726
4Q19 1Q20 2Q20 3Q20 4Q20
Trend in Troubled Debt Restructured Loans (TDRs)
Nonaccruing Accruing
$139 $85 $108 $157 $205
$15$170 $138 $2
$0
4Q19 1Q20 2Q20 3Q20 4Q20
All Other Oil & Gas
Trend in Newly Categorized Nonperforming Assets

2021 First Quarter Investor Presentation
Remaining deferrals represent less than 1% of the loan portfolio, compared to 9% at the June 30 peak.
Active Commercial deferrals are down $4.8B from the June 30 peak. Only a modest amount of CRE and Business Banking deferrals remain.
o Select Hospitality customers remain in deferral status, but nearly all have resumed making payments.
o As expected, a modest amount of deferral requests within the total $1B SBA portfolio in 4Q20.
Active Consumer deferrals are down $1.8B from June 30 with the remainder centered on residential mortgage.
Working with our customers, we have removed any material forward risk from the deferral activity in 2020.
COVID Related Financial Accommodations
70
As of 6/30/20 As of 9/30/20 As of 12/31/20
$ in millions Deferral Balance
% of Portfolio Deferred
Deferral Balance
% of Portfolio Deferred
Deferral Balance
% of Portfolio Deferred
Change in Deferral Balance (vs. 6/30)
Commercial $4,995 12% $942 2% $151 < 1% ($4,844)
Consumer(1) $1,824 5% $304 < 1% $66 < 1% ($1,758)
Total $6,819 9% $1,246 2% $217 < 1% ($6,602)
See notes on slide 85

2021 First Quarter Investor Presentation
0.66%0.75%
0.89%
0.74% 0.69%
178%
273% 255%311% 331%
4Q19 1Q20 2Q20 3Q20 4Q20
NPA RatioACL / NPA Ratio
NPA Ratio and ALLL / NPA Ratios
1.18%
2.05%2.27% 2.31% 2.29%
1.04%
1.93%2.12% 2.21% 2.22%
4Q19 1Q20 2Q20 3Q20 4Q20
ACL Ratio
ALLL Ratio
3.64% 3.59%
4.95%4.35%
3.91%
4Q19 1Q20 2Q20 3Q20 4Q20
0.39%
0.62%0.54% 0.56% 0.55%
4Q19 1Q20 2Q20 3Q20 4Q20
Asset Quality and Reserve TrendsAsset quality metrics improving despite challenging economic considerations
71
Criticized Asset Ratio
Net Charge‐off Ratio ACL and ALLL Ratios

2021 First Quarter Investor Presentation
Credit Quality Trends Overview
72
4Q20 3Q20 2Q20 1Q20 4Q19
Net charge‐off ratio 0.55% 0.56% 0.54% 0.62% 0.39%
90+ days PD and accruing 0.21 0.22 0.24 0.21 0.23
NAL ratio(1) 0.65 0.70 0.81 0.72 0.62
NPA ratio(2) 0.69 0.74 0.89 0.75 0.66
Criticized asset ratio(3) 3.91 4.35 4.95 3.59 3.64
ALLL ratio 2.22 2.21 2.12 1.93 1.04
ALLL / NAL coverage 341 316 263 270 167
ALLL / NPA coverage 323 298 239 257 157
ACL ratio 2.29 2.31 2.27 2.05 1.18
ACL / NAL coverage 351 330 281 287 190
ACL / NPA coverage 331 311 255 273 178
See notes on slide 85

2021 First Quarter Investor Presentation
1.13% 1.15%
1.36%
1.18%1.09%
0.07% 0.06% 0.06% 0.07% 0.07%
0.16%0.13% 0.12% 0.12%
0.16%
0.42% 0.41%0.48%
0.42% 0.41%
4Q19 1Q20 2Q20 3Q20 4Q20
Residential Mortgages Auto Loans & Lease
Home Equity Total Consumer
2.40%
2.10% 2.18%2.28% 2.29%
0.95%0.88%
0.54%0.69%
0.90%
0.87% 0.80%0.51%
0.47%0.68%
1.36%1.22%
1.03% 1.11%1.26%
4Q19 1Q20 2Q20 3Q20 4Q20
Residential Mortgages Auto Loans & Lease
Home Equity Total Consumer
90+ Days30+ Days
Consumer Loan Delinquencies(1)
73See notes on slide 85

2021 First Quarter Investor Presentation
0.03% 0.03% 0.03% 0.02% 0.02%
4Q19 1Q20 2Q20 3Q20 4Q20
0.21%
0.30%
0.15%
0.19%
0.15%
4Q19 1Q20 2Q20 3Q20 4Q20
90+ Days(2)30+ Days(1)
Total Commercial Loan Delinquencies
74See notes on slide 85

2021 First Quarter Investor Presentation
Total Consumer LoansTotal Commercial Loans
$37 $34 $27 $24 $22
0.39% 0.35%0.30%
0.24% 0.22%
4Q19 1Q20 2Q20 3Q20 4Q20
NCOsAnnualized %
$19
$61
$20
$49
$78
$17
$22
$60
$40
$12
$36
$83 $80 $89 $90
0.38%
0.89%
0.75%
0.85% 0.86%
0.20%
0.65%
0.19%
0.47%0.74%
4Q19 1Q20 2Q20 3Q20 4Q20
Oil & Gas NCOs CML NCOs ex‐Oil & GasAnnualized %Annualized ex‐Oil & Gas
Net Charge‐Offs
75
($ in millions) ($ in millions)

2021 First Quarter Investor Presentation
($ in millions) 4Q20 3Q20 2Q20 1Q20 4Q19
NPA beginning‐of‐period $602 $713 $586 $498 $482
Additions / increases 248 190 279 274 175
Return to accruing status (108) (47) (25) (18) (20)
Loan and lease losses (73) (102) (61) (91) (48)
Payments (82) (77) (63) (70) (63)
Sales and other (24) (75) (3) (7) (28)
NPA end‐of‐period $563 $602 $713 $586 $498
Percent change (Q/Q) (6)% (16)% 22% 18% 3%
Nonperforming Asset Flow Analysis
76
End of Period

2021 First Quarter Investor Presentation
($ in millions) 4Q20 3Q20 2Q20 1Q20 4Q19
Criticized beginning‐of‐period $3,173 $3,601 $2,473 $2,394 $2,365
Additions / increases 473 355 1,411 510 479
Advances 86 120 329 187 109
Upgrades to “Pass” (395) (407) (111) (100) (174)
Paydowns (577) (429) (352) (435) (359)
Charge‐offs (61) (92) (24) (82) (38)
Moved to HFS 131 25 (125) (0) 13
Criticized end‐of‐period $2,830 $3,173 $3,601 $2,473 $2,394
Percent change (Q/Q) (11)% (12)% 46% 3% 1%
Criticized Commercial Loan Analysis
77
End of Period

Appendix

2021 First Quarter Investor Presentation
Disclaimer
79
CAUTION REGARDING FORWARD‐LOOKING STATEMENTSThis communication may contain certain forward‐looking statements, including, but not limited to, certain plans, expectations, goals, projections, and statements about the benefits of the proposed transaction, the plans, objectives, expectations and intentions of Huntington and TCF, the expected timing of completion of the transaction, and other statements that are not historical facts. Such statements are subject to numerous assumptions, risks, and uncertainties. Statements that do not describe historical or current facts, including statements about beliefs and expectations, are forward‐looking statements. Forward‐looking statements may be identified by words such as expect, anticipate, believe, intend, estimate, plan, target, goal, or similar expressions, or future or conditional verbs such as will, may, might, should, would, could, or similar variations. The forward‐looking statements are intended to be subject to the safe harbor provided by Section 27A of the Securities Act of 1933, Section 21E of the Securities Exchange Act of 1934, and the Private Securities Litigation Reform Act of 1995.
While there is no assurance that any list of risks and uncertainties or risk factors is complete, below are certain factors which could cause actual results to differ materially from those contained or implied in the forward‐looking statements: changes in general economic, political, or industry conditions; the magnitude and duration of the COVID‐19 pandemic and its impact on the global economy and financial market conditions and our business, results of operations, and financial condition; uncertainty in U.S. fiscal and monetary policy, including the interest rate policies of the Federal Reserve Board; volatility and disruptions in global capital and credit markets; movements in interest rates; reform of LIBOR; competitive pressures on product pricing and services; success, impact, and timing of our business strategies, including market acceptance of any new products or services including those implementing our “Fair Play” banking philosophy; the nature, extent, timing, and results of governmental actions, examinations, reviews, reforms, regulations, and interpretations, including those related to the Dodd‐Frank Wall Street Reform and Consumer Protection Act and the Basel III regulatory capital reforms, as well as those involving the OCC, Federal Reserve, FDIC, and CFPB; the occurrence of any event, change or other circumstances that could give rise to the right of one or both of the parties to terminate the merger agreement between Huntington and TCF; the outcome of any legal proceedings that may be instituted against Huntington or TCF; delays in completing the transaction; the failure to obtain necessary regulatory approvals (and the risk that such approvals may result in the imposition of conditions that could adversely affect the combined company or the expected benefits of the transaction); the failure to obtain shareholder approvals or to satisfy any of the other conditions to the transaction on a timely basis or at all; the possibility that the anticipated benefits of the transaction are not realized when expected or at all, including as a result of the impact of, or problems arising from, the integration of the two companies or as a result of the strength of the economy and competitive factors in the areas where Huntington and TCF do business; the possibility that the transaction may be more expensive to complete than anticipated, including as a result of unexpected factors or events; diversion of management’s attention from ongoing business operations and opportunities; potential adverse reactions or changes to business or employee relationships, including those resulting from the announcement or completion of the transaction; the ability to complete the transaction and integration of Huntington and TCF successfully; the dilution caused by Huntington’s issuance of additional shares of its capital stock in connection with the transaction; and other factors that may affect the future results of Huntington and TCF. Additional factors that could cause results to differ materially from those described above can be found in Huntington’s Annual Report on Form 10‐K for the year ended December 31, 2019 and in its subsequent Quarterly Reports on Form 10‐Q, including for the quarter ended September 30, 2020, each of which is on file with the Securities and Exchange Commission (the “SEC”) and available in the “Investor Relations” section of Huntington’s website, http://www.huntington.com, under the heading “Publications and Filings” and in other documents Huntington files with the SEC, and in TCF’s Annual Report on Form 10‐K for the year ended December 31, 2019 and in its subsequent Quarterly Reports on Form 10‐Q, including for the quarter ended September 30, 2020, each of which is on file with the SEC and available in the “Investor Relations” section of TCF’s website, http://www.tcfbank.com, under the heading “Financial Information” and in other documents TCF files with the SEC.
All forward‐looking statements speak only as of the date they are made and are based on information available at that time. Neither Huntington nor TCF assumes any obligation to update forward‐looking statements to reflect circumstances or events that occur after the date the forward‐looking statements were made or to reflect the occurrence of unanticipated events except as required by federal securities laws. As forward‐looking statements involve significant risks and uncertainties, caution should be exercised against placing undue reliance on such statements.

2021 First Quarter Investor Presentation
Basis of Presentation
80
Use of Non‐GAAP Financial MeasuresThis document contains GAAP financial measures and non‐GAAP financial measures where management believes it to be helpful in understanding Huntington’s results of operations or financial position. Where non‐GAAP financial measures are used, the comparable GAAP financial measure, as well as the reconciliation to the comparable GAAP financial measure, can be found in this document, conference call slides, or the Form 8‐K related to this document, all of which can be found in the Investor Relations section of Huntington’s website, http://www.huntington.com.
Annualized DataCertain returns, yields, performance ratios, or quarterly growth rates are presented on an “annualized” basis. This is done for analytical and decision‐making purposes to better discern underlying performance trends when compared to full‐year or year‐over‐year amounts. For example, loan and deposit growth rates, as well as net charge‐off percentages, are most often expressed in terms of an annual rate like 8%. As such, a 2% growth rate for a quarter would represent an annualized 8% growth rate.
Fully‐Taxable Equivalent Interest Income and Net Interest MarginIncome from tax‐exempt earning assets is increased by an amount equivalent to the taxes that would have been paid if this incomehad been taxable at statutory rates. This adjustment puts all earning assets, most notably tax‐exempt municipal securities and certain lease assets, on a common basis that facilitates comparison of results to results of competitors.
RoundingPlease note that columns of data in this document may not add due to rounding.

2021 First Quarter Investor Presentation
ReconciliationPretax Pre‐Provision Net Revenue (PPNR)
($ in millions) 2020 2019 2018 2017 2016
Net interest income – FTE $3,224 $3,239 $3,219 $3,052 $2,412
Noninterest income 1,591 1,454 1,321 1,307 1,151
Total revenue 4,836 4,693 4,540 4,359 3,563
Less: Significant Items 0 0 0 2 1
Less: gain / (loss) on securities (1) (24) (21) (4) 0
Total revenue – adjusted A 4,837 4,717 4,561 4,361 3,562
Noninterest expense 2,795 2,721 2,647 2,714 2,408
Less: Significant Items 0 0 0 154 239
Noninterest expense – adjusted B 2,795 2,721 2,647 2,560 2,169
Pretax pre‐provision net revenue (PPNR) A ‐ B $2,042 $1,996 $1,914 $1,801 $1,393
PPNR – Annualized $2,042 $1,996 $1,914 $1,801 $1,393
Risk‐weighted assets (RWA) $88,787 $87,513 $85,687 $80,340 $78,263
PPNR as % of RWA 2.30% 2.28% 2.23% 2.24% 1.78%
81

2021 First Quarter Investor Presentation
ReconciliationTangible common equity, ROTCE, and ACL ratio ex. PPP loans
82
($ in millions) 4Q20 3Q20 4Q19
Average common shareholders’ equity $10,749 $10,701 $10,681
Less: intangible assets and goodwill 2,185 2,195 2,228
Add: net tax effect of intangible assets 41 43 50
Average tangible common shareholders’ equity (A) $8,605 $8,549 $8,503
Net income available to common $281 $275 $298
Add: amortization of intangibles 10 10 12
Add: net of deferred tax (2) (2) (3)
Adjusted net income available to common 289 283 308
Adjusted net income available to common (annualized) (B) $1,156 $1,132 $1,232
Return on average tangible shareholders’ equity (B/A) 13.3% 13.2% 14.3%
($ in millions) 6/30 GAAP PPP Adj. 6/30 ex.
PPP9/30 GAAP PPP Adj. 9/30 ex.
PPP12/31 GAAP PPP Adj. 12/31
ex. PPP
Allowance for credit losses (ACL) (C)
$1,821 $3 $1,818 $1,878 $3 $1,875 $1,866 $3 $1,863
Total loans and leases (D) $80,139 $6,054 $74,085 $81,156 $6,211 $74,945 $81,608 $6,016 $75,592
ACL as % of total loans and leases (C/D)
2.27% 2.45% 2.31% 2.50% 2.29% 2.46%

2021 First Quarter Investor Presentation
Notes
83
Slide 4:(1) Includes Regional Banking and The Huntington Private Client Group offices
Slide 7:(1) Total does not include two 2020 Strategy Plan review sessions with the full Board(2) Total number of meetings for each of the Audit Committee and the Risk Oversight Committee include joint meetings of both committees(3) Function of Capital Planning Committee assumed by Risk Oversight Committee in 2012(4) Other includes HBI Special Committee (2010), Huntington Investment Company Oversight Committee (2016‐2017), and Integration Oversight
Committee (ad hoc 2016 & 2017)
Slide 17:(1) If your account is overdrawn, we’ll give you more time to make it right to avoid the overdraft fee. To find out how 24‐Hour Grace® works, visit
huntington.com/Grace. For the no overdraft fee $50 Safety Zone, your account is automatically closed in 60 days if it remains negative.
Slide 21:(1) Visit jdpower.com/awards for more details.
In 2020, Huntington received the highest score among regional banks ($55B to $150B in deposits) in the J.D. Power 2019‐2020 U.S. Banking Mobile App Satisfaction Study of customers’ satisfaction with their financial institution’s mobile applications for banking account management.
In 2019, Huntington ranked #1 in both the J.D. Power 2019 U.S. Banking App Satisfaction and U.S. Online Banking Satisfaction studies, receiving the highest score among all banks (i.e., national banks and regional banks) in both surveys.
Slide 23:(1) Excludes branches related to the FirstMerit acquisition(2) Excludes 32 branches divested in Wisconsin branch network sale
Slide 33:(1) As of 12/31/20(2) Pay fixed/receive float swap(3) Upper strike (%) / lower strike (%)(4) De‐designated floor spreads

2021 First Quarter Investor Presentation
Notes
84
Slide 42:(1) Linked‐quarter percent changes annualized(2) Includes commercial bonds booked as investment securities under GAAP
Slide 44:(1) All amounts represent accruing purchased impaired loans; under the applicable accounting guidance (ASC 310‐30), the loans were recorded
at fair value upon acquisition and remain in accruing status(2) Annualized
Slide 45:(1) Companies with > 25% of their revenue from the auto industry(2) Annualized
Slide 46:(1) All amounts represent accruing purchased impaired loans; under the applicable accounting guidance (ASC 310‐30), the loans were recorded
at fair value upon acquisition and remain in accruing status(2) Annualized
Slide 47:(1) Experian data from January 2020 through December 2020
Slide 49:(1) Auto LTV based on retail value
Slide 51:(1) Originations are based on commitment amounts(2) FHFA Regional HPI ENC Season‐Adj; U.S. and Census Division(3) Source: BLS.gov; average of monthly seasonally‐adjusted unemployment rate for period
Slide 53:(1) FHFA Regional HPI ENC Season‐Adj; U.S. and Census Division(2) Source: BLS.gov; average of monthly seasonally‐adjusted unemployment rate for period
Slide 55:(1) RV/Marine LTV based on wholesale value

2021 First Quarter Investor Presentation
Notes
85
Slide 56:(1) Averages balances; Trading Account and Other securities excluded
Slide 57:(1) End of period(2) Tax‐equivalent yield on municipal securities calculated as of December 31, 2020 using 21% corporate tax rate(3) Weighted average yields were calculated using carry value
Slide 60:(1) Linked‐quarter percent change annualized(2) Money market deposits, savings / other deposits, and core certificates of deposit
Slide 64:(1) As of December 31, 2019, Huntington is no longer subject to the Federal Reserve’s modified Liquidity Coverage Ratio.(2) December 31, 2020 figures are estimated. The 2020 capital ratios reflect Huntington’s election of a five‐year transition to delay for two
years the full impact of CECL on regulatory capital, followed by a three‐year transition period.
Slide 70:(1) Excludes GNMA guaranteed mortgage loans that entered forbearance and were subsequently repurchased.
Slide 72:(1) NALs divided by total loans and leases(2) NPAs divided by the sum of loans and leases, net other real estate owned, and other NPAs(3) Criticized assets = commercial criticized loans + consumer loans >60 DPD + OREO; Total criticized assets divided by the sum of loans and
leases, net other real estate owned, and other NPAs
Slide 73:(1) End of period; delinquent but accruing as a % of related outstandings at end of period
Slide 74:(1) Amounts include Huntington Technology Finance administrative lease delinquencies(2) Amounts include Huntington Technology Finance administrative lease delinquencies and accruing purchased impaired loans acquired in
the FirstMerit transaction. Under the applicable accounting guidance (ASC 310‐30), the accruing purchased impaired loans were recorded at fair value upon acquisition and remain in accruing status.

Mark A. MuthDirector of Investor Relations
Office: 614.480.4720E‐mail: [email protected]
For additional information, please visit:http://www.huntington.com
The Huntington National Bank is Member FDIC. ®, Huntington® and Huntington. Welcome.® are federally registered service marks of Huntington Bancshares Incorporated. ©2021 Huntington Bancshares Incorporated. (Nasdaq: HBAN)
Adrienne AtkinsonAsst. Dir. of Investor Relations
Office: 614.480.6077E‐mail: [email protected]