Embed Size (px)
Citation preview
1Q21 Financial Results
Advanced Info Service Plc.
5 May 2021
1
Core service revenue began to recover and deliver 1%QoQ increase
from recovered mobile revenue and robust growth in fixed broadband
Continuous 5G/4G network expansion led to increase in cost of
service 3.9%YoY; however, SG&A was well-managed and dropped -
12%YoY resulted in stabilized EBITDA with -0.8%YoY
Net profit decreased - 1.7%YoY and-7.3%QoQ
1Q21 Executive Summary
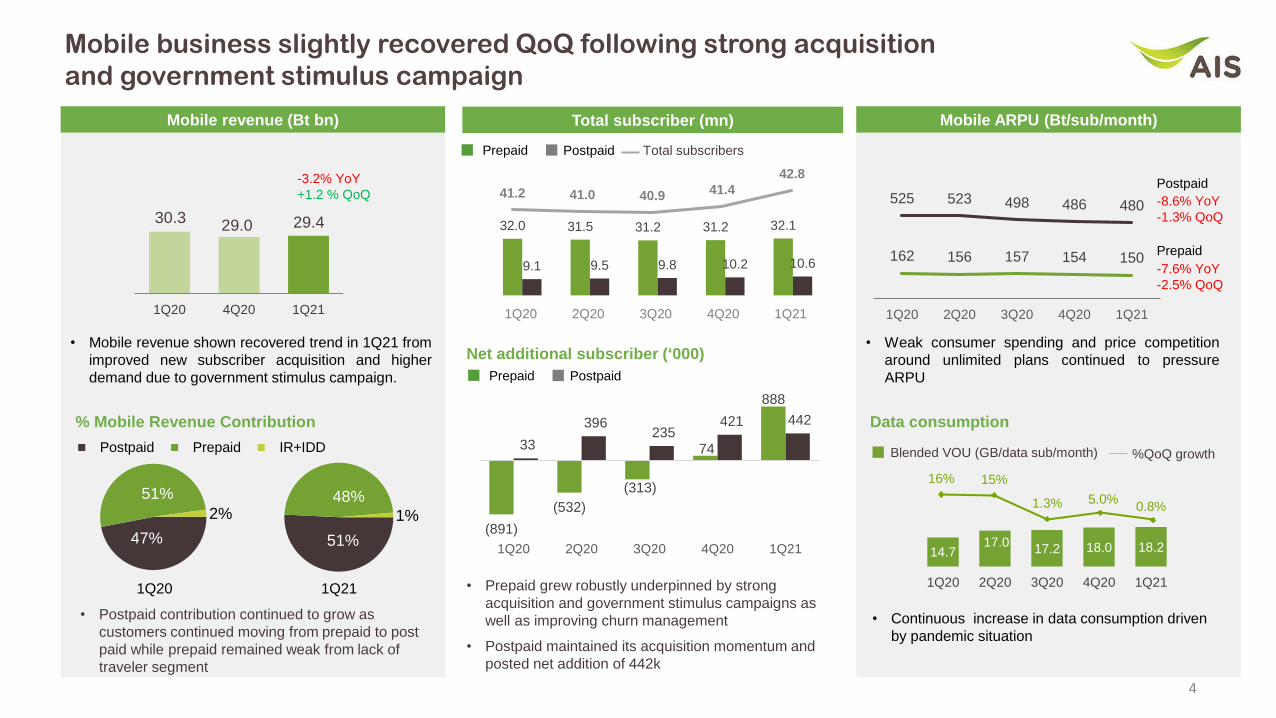
Mobile revenue recovered QoQ due to strong subscriber acquisition
as well as demand driven by government stimulus package.
Competition around data pricing with unlimited plan remained high
and still pressured ARPU
5G mobile subscribers reached 719k supported by new 5G handset
launch, on track to meet target at 1mn by the end 2021
ARPU uplift on early 5G adopter approximately 10-15%.
AIS Fibre added 95k and reached 1.43 million subscribers with
17%YoY growth
ARPU continued declining 10%YoY from new acquisition on low price
package
Enterprise non-mobile business continued to deliver low-teen digit
growth YoY following digitalization trend.
Mobile revenue slightly recovered QoQ
Fixed broadband and Enterprise business continued its
growth momentumStabilized EBITDA from recovered mobile business
and cost control
5G penetration is on track to meet 1mn year-end target
2

6,644
196 3
876,756
22,580
665 315
78422,77732,425
983
279 3933,090
1Q21 Performance: Stabilized EBITDA from recovered mobile business and well-managed cost
EBITDA (Bt mn)Core service revenue (Bt mn) Reported NPAT (Bt mn)
Interest, Tax, FX gain
& others
-2.0% YoY +7.1% YoY -14% YoY -0.9% YoY
-1.7% YoY-3% YoYFlat YoY-0.9% YoY
1Q20EBITDA
CoreService revenue
SG&A & others
Cost of service
1Q21EBITDA
1Q20NPAT
EBITDA D&A 1Q21NPAT
33.1 32.1 32.4
1Q20 4Q20 1Q21
Reported NPAT (Bt bn)
22.8 22.2 22.6
1Q20 4Q20 1Q21
6.8 7.2 6.6
1Q20 4Q20 1Q21
-0.9% YoY+1.6% QoQ -1.7% YoY
-7.3% QoQ
-2.0% YoY+1.0% QoQ
-3.2% YoY +3.5% YoY+17% YoY -2.0% YoY
1Q20 CoreService revenue
Mobile FBB 1Q21 CoreService revenue
Enterprise non-mobile
& others(Net of TOT partnership
& IC revenue)
• Core service revenue declined YoY from weak mobile offset by growth in FBB and enterprise; but slightly increased QoQ from rebounded mobile revenue
• EBITDA was stabilized QoQ from recovered service revenue and continuous cost management
• NPAT dropped - 1.7%YoY as D&A rose from spectrum acquisition and network investment while decreasing -7.3%QoQ from unrealized foreign exchange loss and
tax benefit in 4Q20
Core service revenue (Bt bn) EBITDA (Bt bn)
51%
48%
1%
4
Mobile business slightly recovered QoQ following strong acquisition
and government stimulus campaign
16% 15%
1.3% 5.0%0.8%
162 156 157 154 150
525 523 498 486 480
1Q20 2Q20 3Q20 4Q20 1Q21
• Weak consumer spending and price competition
around unlimited plans continued to pressure
ARPU
Total subscriber (mn)
Postpaid
Prepaid
-8.6% YoY
-1.3% QoQ
-7.6% YoY
-2.5% QoQ
30.3 29.0 29.4
1Q20 4Q20 1Q21
Mobile revenue (Bt bn)
-3.2% YoY
+1.2 % QoQ
• Mobile revenue shown recovered trend in 1Q21 from
improved new subscriber acquisition and higher
demand due to government stimulus campaign.
Mobile ARPU (Bt/sub/month)
47%
51%
2%
Postpaid Prepaid IR+IDD
1Q21
• Postpaid contribution continued to grow as
customers continued moving from prepaid to post
paid while prepaid remained weak from lack of
traveler segment
1Q20
% Mobile Revenue Contribution
41.2 41.0 40.9 41.4
42.8
32.0 31.5 31.2 31.2 32.1
9.1 9.5 9.8 10.2 10.6
1Q20 2Q20 3Q20 4Q20 1Q21
Total subscribersPrepaid Postpaid
%QoQ growth
14.717.0
17.2 18.0 18.2
1Q20 2Q20 3Q20 4Q20 1Q21
Blended VOU (GB/data sub/month)
• Continuous increase in data consumption driven
by pandemic situation
Data consumption
(891)
(532)
(313)
74
888
33
396 235
421 442
1Q20 2Q20 3Q20 4Q20 1Q21
Prepaid Postpaid
• Prepaid grew robustly underpinned by strong
acquisition and government stimulus campaigns as
well as improving churn management
• Postpaid maintained its acquisition momentum and
posted net addition of 442k
Net additional subscriber (‘000)
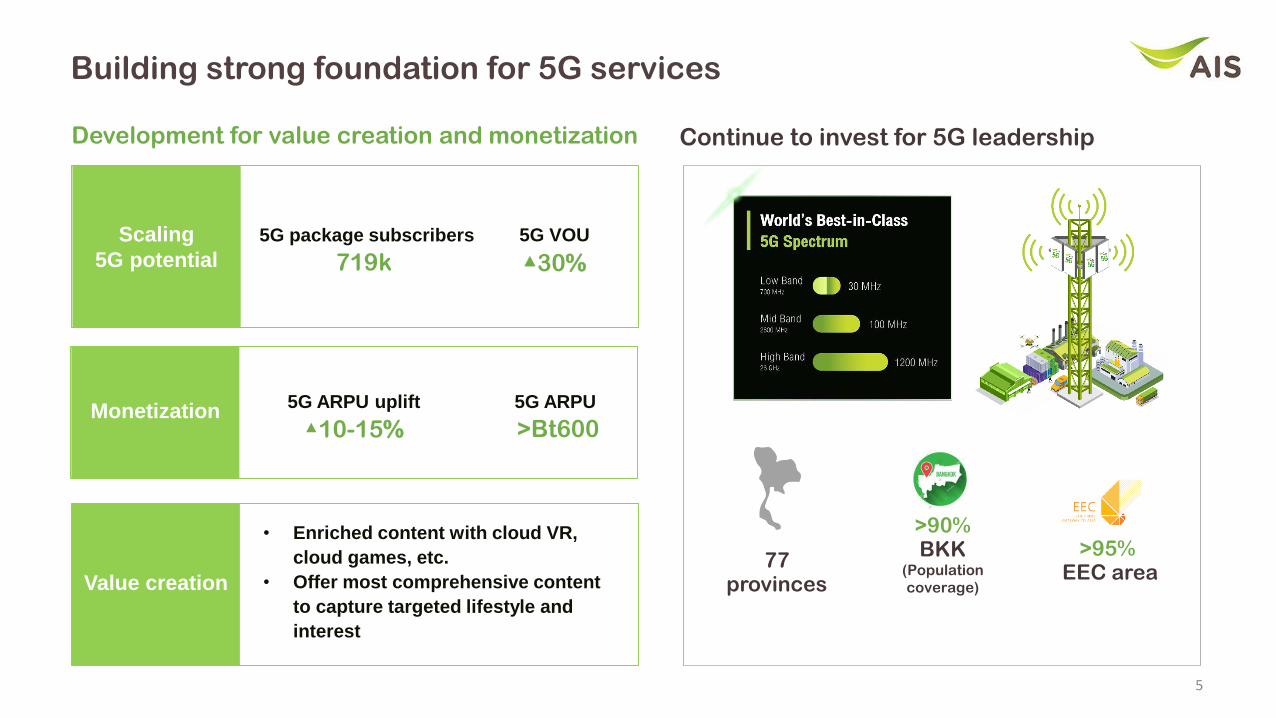
Scaling
5G potential
5
Building strong foundation for 5G services
5G package subscribers
719k
>95%EEC area
Continue to invest for 5G leadership
>90%BKK
(Population
coverage)
Development for value creation and monetization
5G ARPU
>Bt600
5G VOU
▲30%
77provinces
5G ARPU uplift
▲10-15%
• Enriched content with cloud VR,
cloud games, etc.
• Offer most comprehensive content
to capture targeted lifestyle and
interest
Monetization
Value creation

6
Home broadband continued its growth momentum
Despite soften ARPU, FBB continued to deliver high growth
• Despite eased price competition since 4Q20 , ARPU continued
declining 10%YoY from new acquisition on low price package
ARPU softened following the popularity of low price plan
514489 484 476 462
1Q20 2Q20 3Q20 4Q20 1Q21
-10% YoY
-3.0% QoQ
• With continuing trends for work and learn from home, FBB business
maintained its momentum with 17%YoY revenue growth.
YoY growth
ARPU
(Bt/sub/month)
FBB revenue (Bt mn)
1,640 1,683 1,785 1,852 1,919
1Q20 2Q20 3Q20 4Q20 1Q21
27% 22% 21% 17% 17%
Solid subscriber growth from rising demand for home connectivity
Net addition (‘000)
Ending subscriber
(‘000) 53
112
5381 95
1Q20 2Q20 3Q20 4Q20 1Q21
1,090 1,203 1,256 1,337 1,432
• FBB subscribers grew double-digit YoY with 95k net addition in 1Q21
• Target subscriber by end-21 maintained at 1.6mn
Emphasized churn management through 24-month contract
• The new package aims to enhance service quality beyond the industry for
better customer retention and reduce churn with contract length of 24 months.
6% revenue
Contribution
~12% subscriber
market share

7
Digitalization trend remained key growth driver in enterprise segment
Enterprise business remained resilient amidst the new outbreak
10%
1%
6%8% 10%
1Q20 2Q20 3Q20 4Q20 1Q21
%YoY revenue
Enterprise non-mobile revenue
• Enterprise non-mobile growth had rebounded to pre-Covid level
following demand for digital transformation
5%
-7%
0.5%1% 5%
1Q20 2Q20 3Q20 4Q20 1Q21
Enterprise Data service
(EDS)
%YoY revenue
101% 151% 106% 105%
80%
1Q20 2Q20 3Q20 4Q20 1Q21
• Cloud, Data center and ICT solution
grew double digit and expected to
deliver strong growth following
products and service expansion
%YoY revenue
Cloud, Data center
and ICT solutions
• EDS revenue regained growth
momentum after the corporate
resuming their operation
x
5G AGV
5G Smart Robot
• Deploy 5G to control and operate AGV car
which transport parts to production line, and between factories efficiently.
• Control and operate industrial robots used in
the production line such as Press, Brazing,
CNC, Heat & Cool and the assembly line
5G Active Dashboard
5G industrial pilot projects with in EEC area
• 5G to connect Servers with Machines to
enable monitoring of various production
processes.
Collaboration with
SNC FORMER to joint trial
industrial use case with 26GHz spectrum

292
72
364
41
68
94
57
32
47 25
18 17
119
127
57 25
8
1Q21 Cash flow Balance Sheet
Operating cash flow was healthy to support CAPEX,
spectrum payment, and dividend.
Investing cash flow was Bt14bn, including spectrum
payment of Bt8.8bn
Average finance costs = 2.5% p.a.
• Maintained investment grade credit ratings
• Fitch: national rating AA+ (THA), outlook stable
• S&P: BBB+, outlook stable
(Bt bn)
21.2
0.55.3
8.8
0.73.7 3.0
0.7
Operating Investing Financing Net cash
Op
era
tin
gca
sh
flo
w
Inco
me
ta
x p
aid
Ca
sh
d
ecre
ase
d
Fin
an
ce
co
st
Cash increase Cash decrease
0.8x 1.3x
0.4x 36%
Net debt to EBITDA Interest bearing debt
to Equity
Current ratio Return on Equity
Ca
sh
C
AP
EX
Equity
cash
spectrum
license
others spectrum
license
payable
interest-
bearing
debt
others
retained earningsothers
A/R
PPE
B/S1Q21
A/P
(Bt bn)
right
of use
lease
liability
Healthy Balance sheet and cash flow to support investment
Assets Liabilities
Le
ase
lia
bili
tie
s p
aid
Sp
ectr
um
lic
en
se
Repaym
ent
of
ST
& L
T b
orr
ow
ings
TFRS16
TFRS16
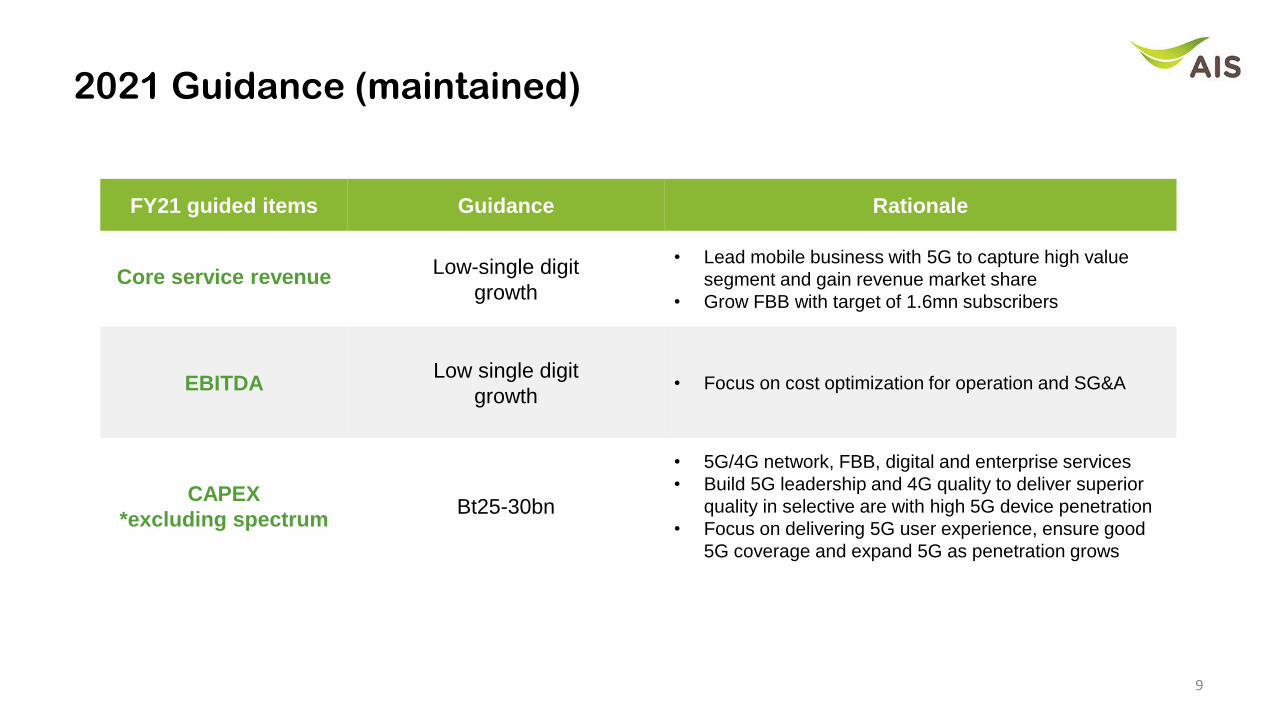
2021 Guidance (maintained)
FY21 guided items Guidance Rationale
Core service revenueLow-single digit
growth
• Lead mobile business with 5G to capture high value
segment and gain revenue market share
• Grow FBB with target of 1.6mn subscribers
EBITDALow single digit
growth• Focus on cost optimization for operation and SG&A
CAPEX
*excluding spectrumBt25-30bn
• 5G/4G network, FBB, digital and enterprise services
• Build 5G leadership and 4G quality to deliver superior
quality in selective are with high 5G device penetration
• Focus on delivering 5G user experience, ensure good
5G coverage and expand 5G as penetration grows
9

10
APPENDIX
47 125
58
11
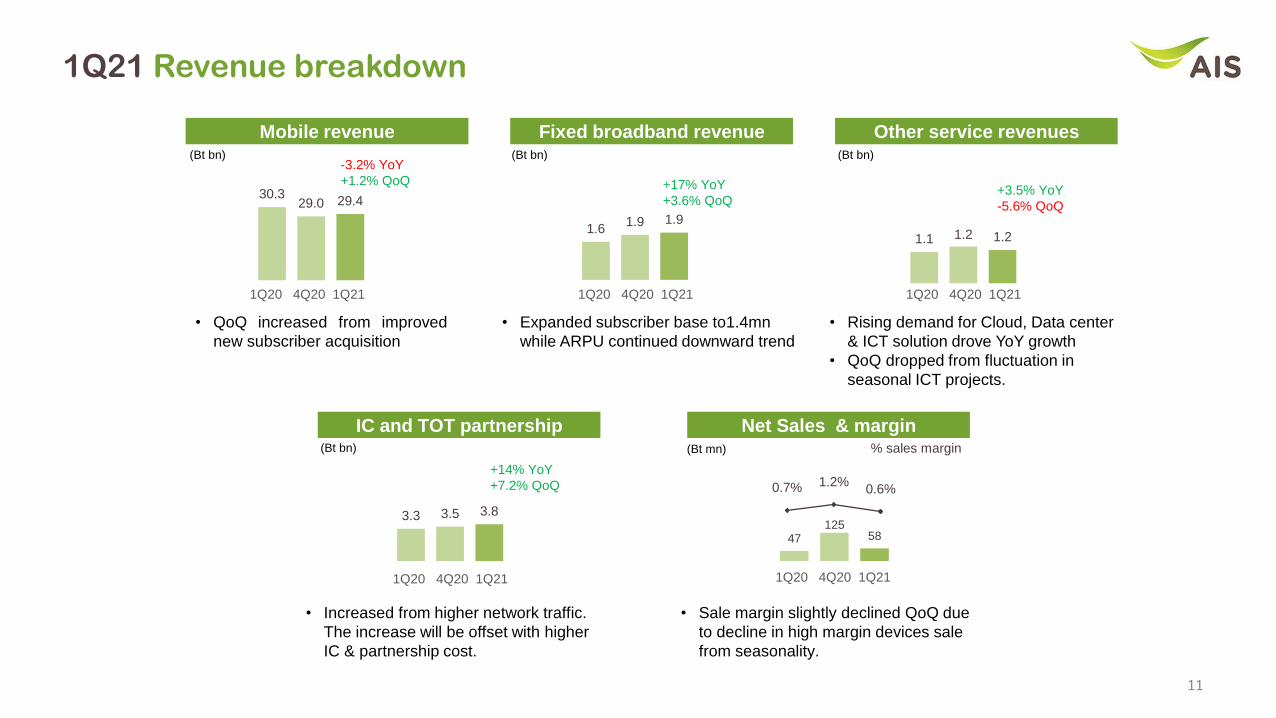
1Q21 Revenue breakdown
Mobile revenue Fixed broadband revenue Other service revenues
IC and TOT partnership Net Sales & margin
(Bt bn) (Bt bn) (Bt bn)
(Bt bn) (Bt mn) % sales margin
• Rising demand for Cloud, Data center
& ICT solution drove YoY growth
• QoQ dropped from fluctuation in
seasonal ICT projects.
• Increased from higher network traffic.
The increase will be offset with higher
IC & partnership cost.
• Sale margin slightly declined QoQ due
to decline in high margin devices sale
from seasonality.
• Expanded subscriber base to1.4mn
while ARPU continued downward trend
• QoQ increased from improved
new subscriber acquisition
30.3 29.0 29.4
1.6 1.9 1.9
1.1 1.2 1.2
3.3 3.5 3.8
0.7% 1.2%0.6%
+3.5% YoY
-5.6% QoQ
+17% YoY
+3.6% QoQ
-3.2% YoY
+1.2% QoQ
+14% YoY
+7.2% QoQ
1Q20 4Q20 1Q21 1Q20 4Q20 1Q21 1Q20 4Q20 1Q21
1Q20 4Q20 1Q21 1Q20 4Q20 1Q21
1.4 1.3 1.4
12
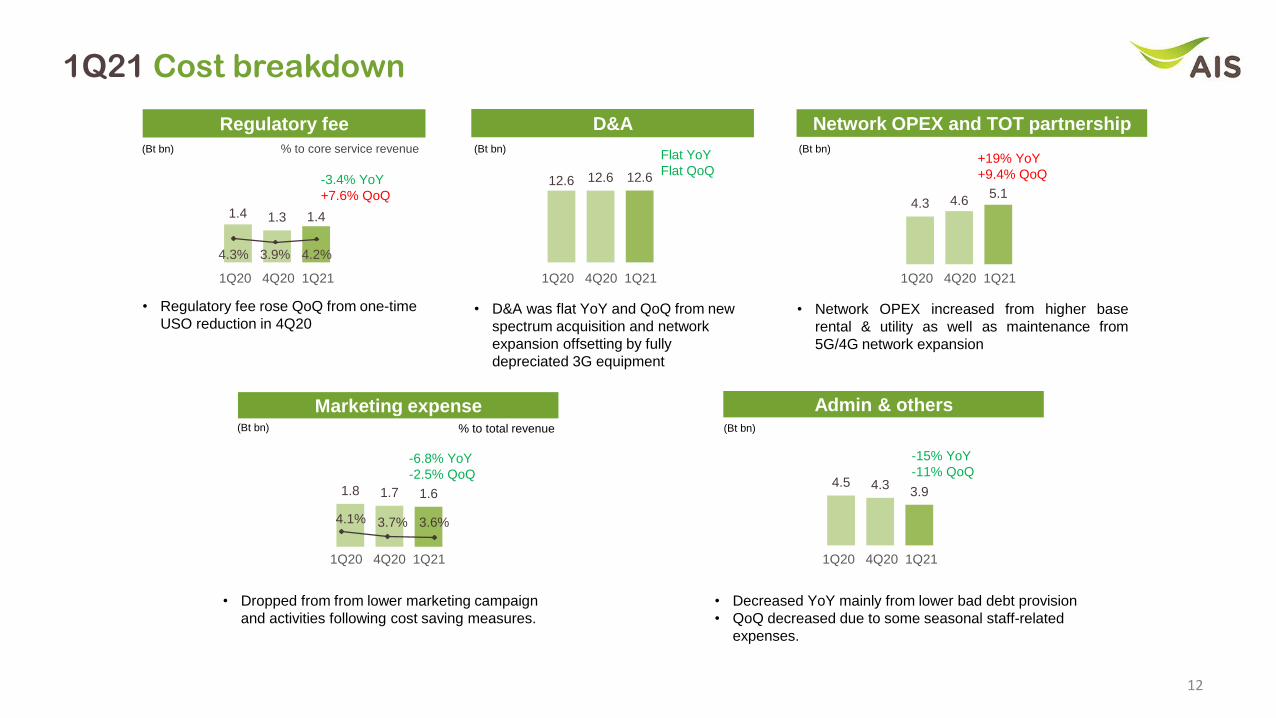
1Q21 Cost breakdown
Regulatory fee D&A Network OPEX and TOT partnership
Marketing expense Admin & others
• Regulatory fee rose QoQ from one-time
USO reduction in 4Q20• D&A was flat YoY and QoQ from new
spectrum acquisition and network
expansion offsetting by fully
depreciated 3G equipment
• Network OPEX increased from higher base
rental & utility as well as maintenance from
5G/4G network expansion
• Dropped from from lower marketing campaign
and activities following cost saving measures.
• Decreased YoY mainly from lower bad debt provision
• QoQ decreased due to some seasonal staff-related
expenses.
(Bt bn) (Bt bn) (Bt bn)
(Bt bn) (Bt bn)
-3.4% YoY
+7.6% QoQ
+19% YoY
+9.4% QoQ
% to total revenue
% to core service revenueFlat YoY
Flat QoQ12.6 12.6 12.6
4.3 4.6 5.1
1.8 1.7 1.6
-6.8% YoY
-2.5% QoQ4.5 4.3
3.9
-15% YoY
-11% QoQ
4.3% 3.9% 4.2%
4.1% 3.7% 3.6%
1Q20 4Q20 1Q21 1Q20 4Q20 1Q21 1Q20 4Q20 1Q21
1Q20 4Q20 1Q21 1Q20 4Q20 1Q21

Some statements made in this material are forward-looking statements with the relevant assumptions, which are subject to various risks and uncertainties. These include statements with respect to our corporate plans, strategies and
beliefs and other statements that are not historical facts. These statements can be identified by the use of forward-looking terminology such as “may”, “will”, “expect”, “anticipate”, “intend”, “estimate”, “continue” “plan” or other similar words.
The statements are based on our management’s assumptions and beliefs in light of the information currently available to us. These assumptions involve risks and uncertainties which may cause the actual results, performance or
achievements to be materially different from any future results, performance or achievements expressed or implied by such forward-looking statements. Please note that the company and executives/staff do not control and cannot
guarantee the relevance, timeliness, or accuracy of these statements.
Contact us
IR website: http://investor.ais.co.th
Email: [email protected]
Tel: +662 029 3145