Embed Size (px)
Citation preview
www.ibm.com/investor
1Q 2015 Earnings Presentation April!20,!2015!
www.ibm.com/investor 2
Forward Looking Statements and Non-GAAP Information
Certain comments made in this presentation may be characterized as forward looking under the Private Securities Litigation Reform Act of 1995. Forward-looking statements are based on the company's current assumptions regarding future business and financial performance. Those statements by their nature address matters that are uncertain to different degrees. Those statements involve a number of factors that could cause actual results to differ materially. Additional information concerning these factors is contained in the Company's filings with the SEC. Copies are available from the SEC, from the IBM web site, or from IBM Investor Relations. Any forward-looking statement made during this presentation speaks only as of the date on which it is made. The company assumes no obligation to update or revise any forward-looking statements. These charts and the associated remarks and comments are integrally related, and are intended to be presented and understood together.
In an effort to provide additional and useful information regarding the company’s financial results and other financial information as determined by generally accepted accounting principles (GAAP), the company also discusses, in its earnings press release and earnings presentation materials, certain non-GAAP information including "operating earnings" and other "operating" financial measures. The rationale for management’s use of this non-GAAP information, the reconciliation of that information to GAAP, and other related information are included in supplemental materials entitled “Non-GAAP Supplemental Materials” that are posted on the Company’s investor relations web site at http://www.ibm.com/investor/events/earnings/1q15.html The Non-GAAP Supplemental Materials are also included as Attachment II to the Company’s Form 8-K dated April 20, 2015.

www.ibm.com/investor 3
1Q15 Summary 1Q15 Yr/Yr
Revenue ($B) $19.6 0%* Yr/Yr As Reported (12%) Operating (Non-GAAP) EPS $2.91 9%
! Revenue performance improved to flat yr/yr • Strategic imperatives growth accelerated to >30% yr/yr • Core portfolio performance consistent with second half of 2014 • Systems Hardware driven by strong System z and return to growth in Power
! Margin expansion reflects ongoing shift to higher value
! Shifting investments and resources to address long-term opportunities
* Revenue growth rate @CC and excluding divested businesses
www.ibm.com/investor 4
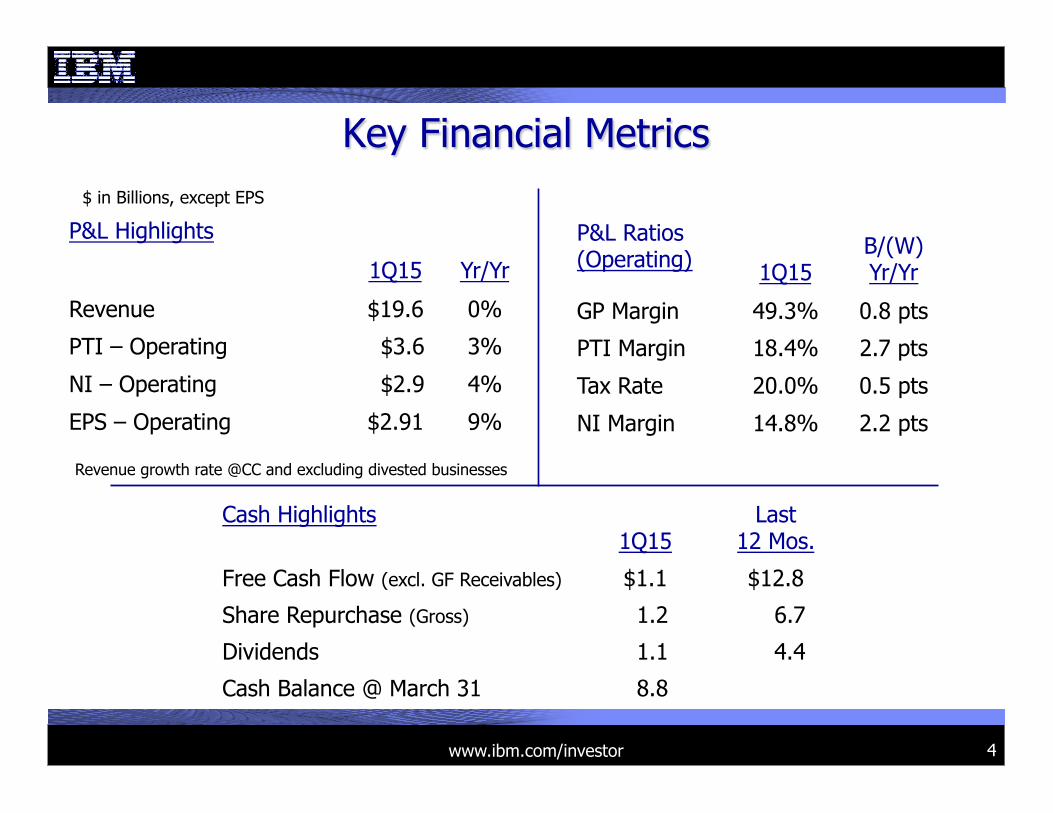
Key Financial Metrics
P&L Ratios (Operating)
1Q15
B/(W) Yr/Yr
GP Margin 49.3% 0.8 pts
PTI Margin 18.4% 2.7 pts
Tax Rate 20.0% 0.5 pts
NI Margin 14.8% 2.2 pts
P&L Highlights
1Q15
Yr/Yr
Revenue $19.6 0%
PTI – Operating $3.6 3%
NI – Operating $2.9 4%
EPS – Operating $2.91 9%
Cash Highlights 1Q15
Last 12 Mos.
Free Cash Flow (excl. GF Receivables) $1.1 $12.8
Share Repurchase (Gross) 1.2 6.7
Dividends 1.1 4.4
Cash Balance @ March 31 8.8
Revenue growth rate @CC and excluding divested businesses
$ in Billions, except EPS

www.ibm.com/investor
Revenue by Geography
1Q15
Yr/Yr
Americas $9.3 2%
Europe/ME/Africa 6.1 (2%)
Asia Pacific 4.1 (2%)
IBM $19.6 0%
Major Markets 0%
Growth Markets (1%)
BRIC Countries (3%)
$ in Billions
AP!ex.!Japan!
U.S.!+2%!!
EMEA!!!!!!
Canada/!!!!!LA!!!
Japan!+4%!
5
Revenue growth rates @CC and excluding divested businesses

www.ibm.com/investor 6
Revenue and Gross Profit Margin by Segment
1Q15
Yr/Yr
1Q15
Yr/Yr Pts
Global Technology Services $7.9 (1%) 37.4% (1.4 pts)
Global Business Services 4.3 (4%) 27.4% (1.8 pts)
Software 5.2 (2%) 86.6% (0.9 pts)
Systems Hardware 1.7 30% 44.5% 10.5 pts
Global Financing 0.5 (1%) 49.6% 3.5 pts
Total Revenue & Op. GP Margin $19.6 0% 49.3% 0.8 pts
$ in Billions
Operating Gross Profit Margin Revenue
Revenue growth rates @CC and excluding divested businesses
www.ibm.com/investor 7
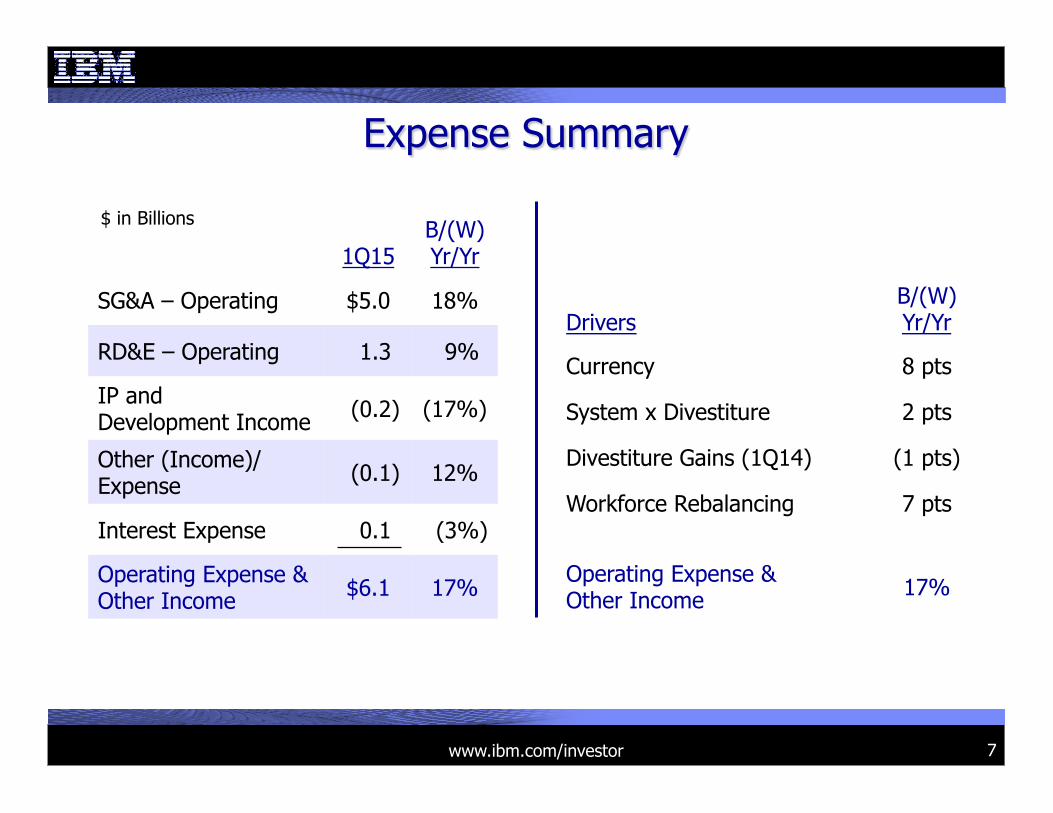
Expense Summary
1Q15
B/(W) Yr/Yr
SG&A – Operating $5.0 18%
RD&E – Operating 1.3 9%
IP and Development Income (0.2) (17%)
Other (Income)/Expense (0.1) 12%
Interest Expense 0.1 (3%)
Operating Expense & Other Income $6.1 17%
$ in Billions
Drivers
B/(W) Yr/Yr
Currency 8 pts
System x Divestiture 2 pts
Divestiture Gains (1Q14) (1 pts)
Workforce Rebalancing 7 pts
Operating Expense & Other Income 17%
www.ibm.com/investor 8
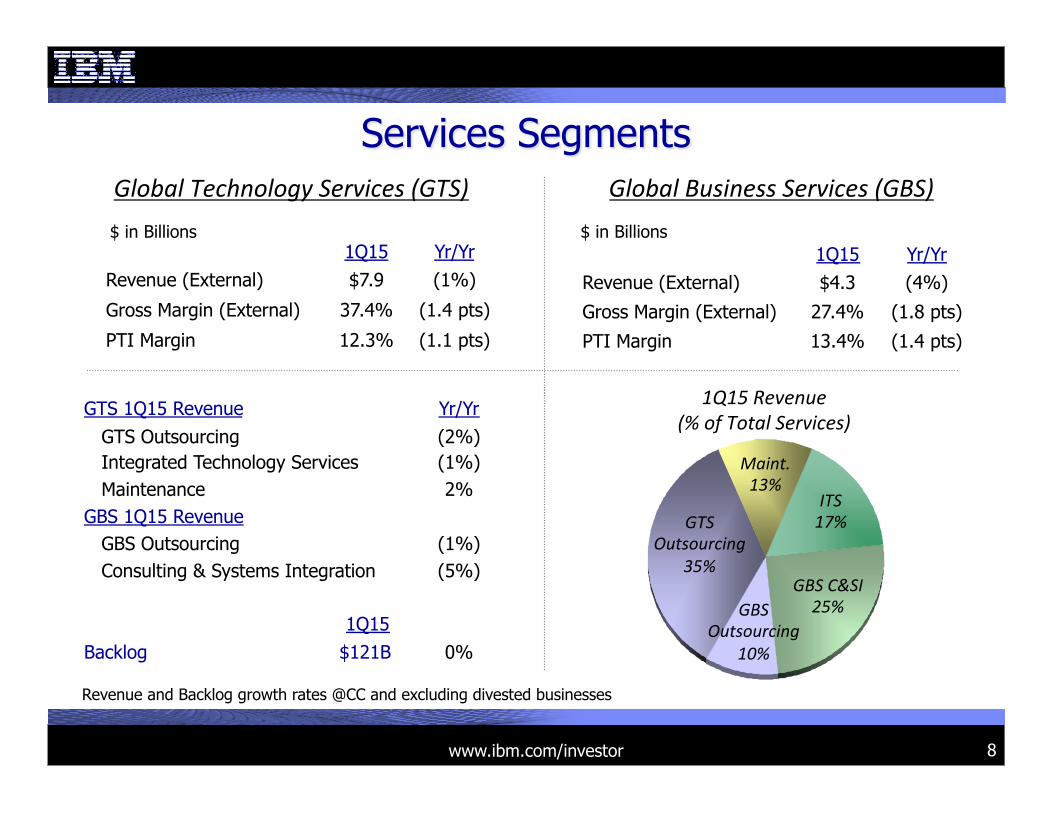
1Q15
Yr/Yr
Revenue (External) $7.9 (1%)
Gross Margin (External) 37.4% (1.4 pts)
PTI Margin 12.3% (1.1 pts)
Services Segments Global!Technology!Services!(GTS)! Global!Business!Services!(GBS)!
1Q15!Revenue!(%!of!Total!Services)!
$ in Billions 1Q15
Yr/Yr
Revenue (External) $4.3 (4%)
Gross Margin (External) 27.4% (1.8 pts)
PTI Margin 13.4% (1.4 pts)
$ in Billions
GTS 1Q15 Revenue
Yr/Yr
GTS Outsourcing (2%) Integrated Technology Services (1%) Maintenance 2% GBS 1Q15 Revenue GBS Outsourcing (1%) Consulting & Systems Integration (5%)
1Q15 Backlog $121B 0%
GTS!Outsourcing!!!
35%!!GBS!C&SI!!!!!!!!!
25%!
Maint.!!!13%!
ITS!17%!
GBS!Outsourcing!!!
10%!!
Revenue and Backlog growth rates @CC and excluding divested businesses
www.ibm.com/investor 9
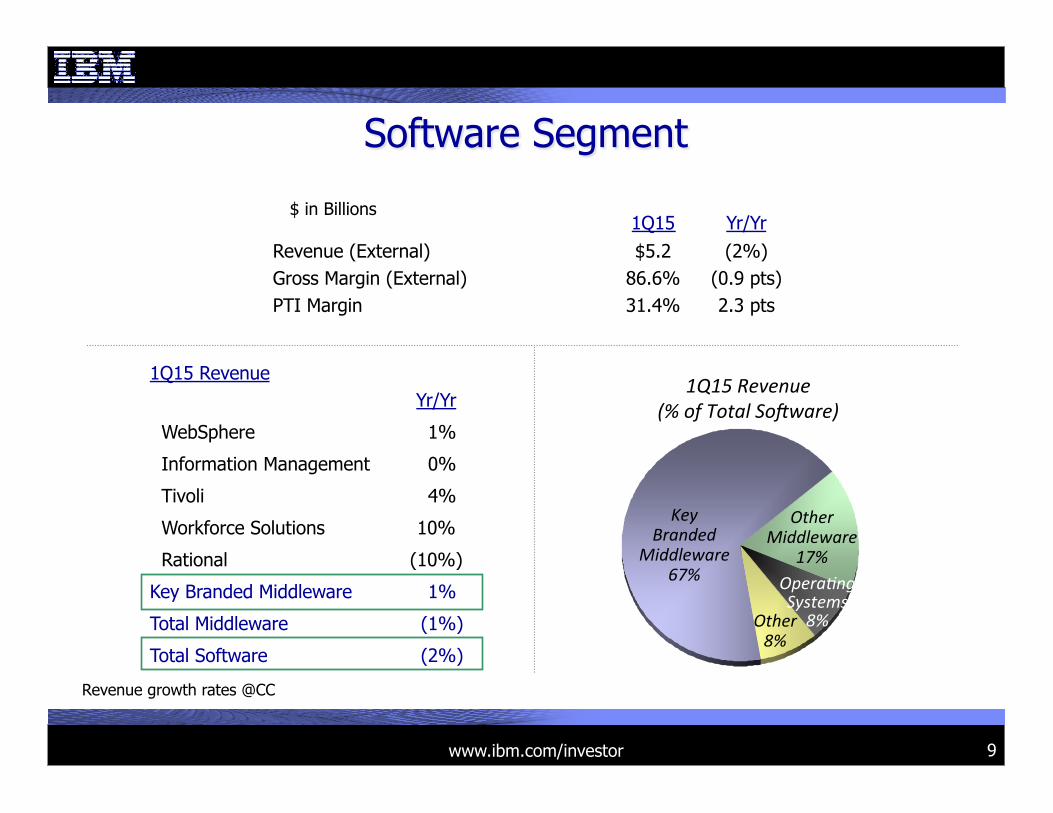
Software Segment
1Q15
Yr/Yr Revenue (External) $5.2 (2%) Gross Margin (External) 86.6% (0.9 pts) PTI Margin 31.4% 2.3 pts
1Q15 Revenue Yr/Yr
WebSphere 1%
Information Management 0%
Tivoli 4%
Workforce Solutions 10%
Rational (10%)
Key Branded Middleware 1%
Total Middleware (1%)
Total Software (2%)
1Q15!Revenue!!!!!!!!!!!!!(%!of!Total!SoUware)!
Key!!!!!!!Branded!
Middleware!!67%!! OperaYng!
Systems!!!!!!!8%!
Other!Middleware!!
17%!
Other!!!!!!!!!8%!
$ in Billions
Revenue growth rates @CC

www.ibm.com/investor 10
Systems Hardware Segment
1Q15
Yr/Yr
Revenue (External) $1.7 30% Gross Margin (External) 44.5% 10.5 pts PTI Margin 1.4% 21.2 pts
$ in Billions
1Q15!Revenue!(%!of!Total!Sys!Hardware)!1Q15 Revenue
Yr/Yr
System z 130%
Power Systems 1%
Storage (2%)
Total Systems Hardware 30%
Other!Revenue growth rates @CC and excluding divested business
Servers!!!!!!!69%!!
Storage!!!!!!!28%!!

www.ibm.com/investor 11
Cash Flow Summary
1Q15 B/(W) Yr/Yr
FY14
Net Cash from Operations $3.6 $0.3 $16.9
Less: Global Financing Receivables 1.6 (0.2) 0.7
Net Cash from Operations (excluding GF Receivables)
2.0 0.5 16.2
Net Capital Expenditures (0.9) 0.0 (3.8)
Free Cash Flow (excluding GF Receivables) 1.1 0.4 12.4
Acquisitions (0.1) 0.1 (0.7)
Divestitures 0.0 (0.4) 2.4
Dividends (1.1) (0.1) (4.3)
Share Repurchases (Gross) (1.2) 7.0 (13.7)
Non-GF Debt 0.4 (3.3) (1.3)
Other (includes GF A/R & GF Debt) 1.3 (2.1) 2.6
Change in Cash & Marketable Securities $0.3 $1.7 ($2.6)
$ in Billions
www.ibm.com/investor 12
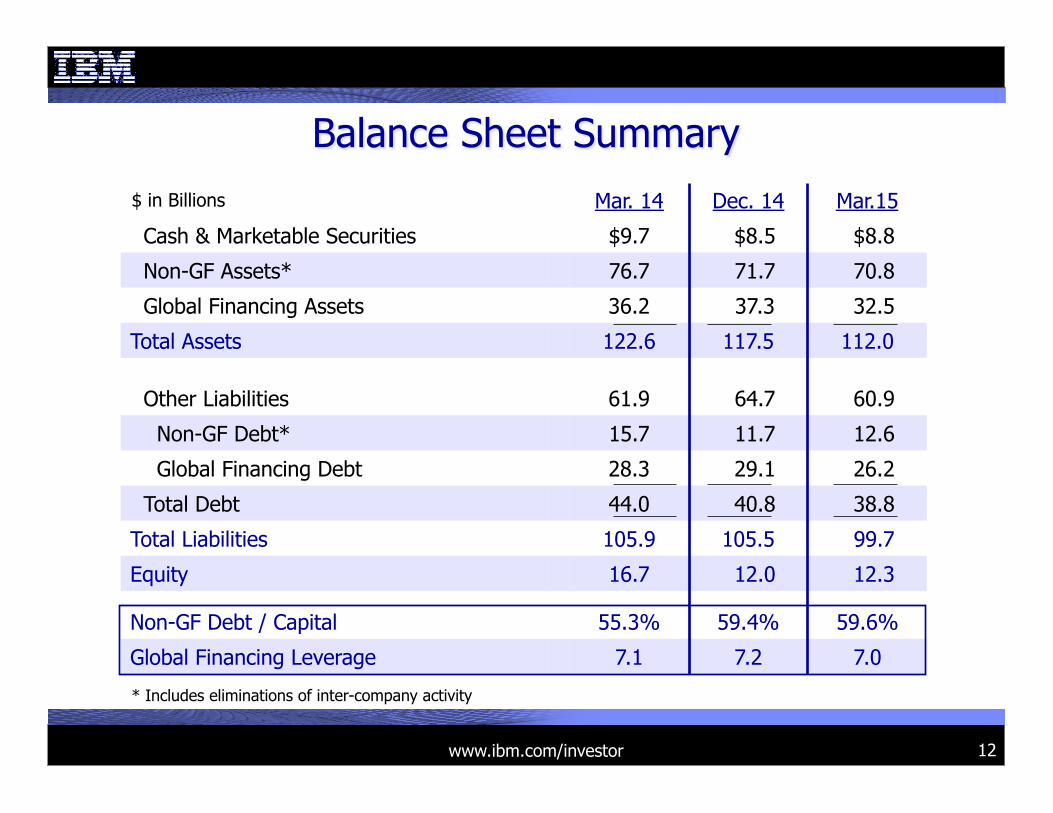
Mar. 14 Dec. 14 Mar.15
Cash & Marketable Securities $9.7 $8.5 $8.8
Non-GF Assets* 76.7 71.7 70.8
Global Financing Assets 36.2 37.3 32.5
Total Assets 122.6 117.5 112.0
Other Liabilities 61.9 64.7 60.9
Non-GF Debt* 15.7 11.7 12.6
Global Financing Debt 28.3 29.1 26.2
Total Debt 44.0 40.8 38.8
Total Liabilities 105.9 105.5 99.7
Equity 16.7 12.0 12.3
Non-GF Debt / Capital 55.3% 59.4% 59.6%
Global Financing Leverage 7.1 7.2 7.0
Balance Sheet Summary $ in Billions
* Includes eliminations of inter-company activity
www.ibm.com/investor 13
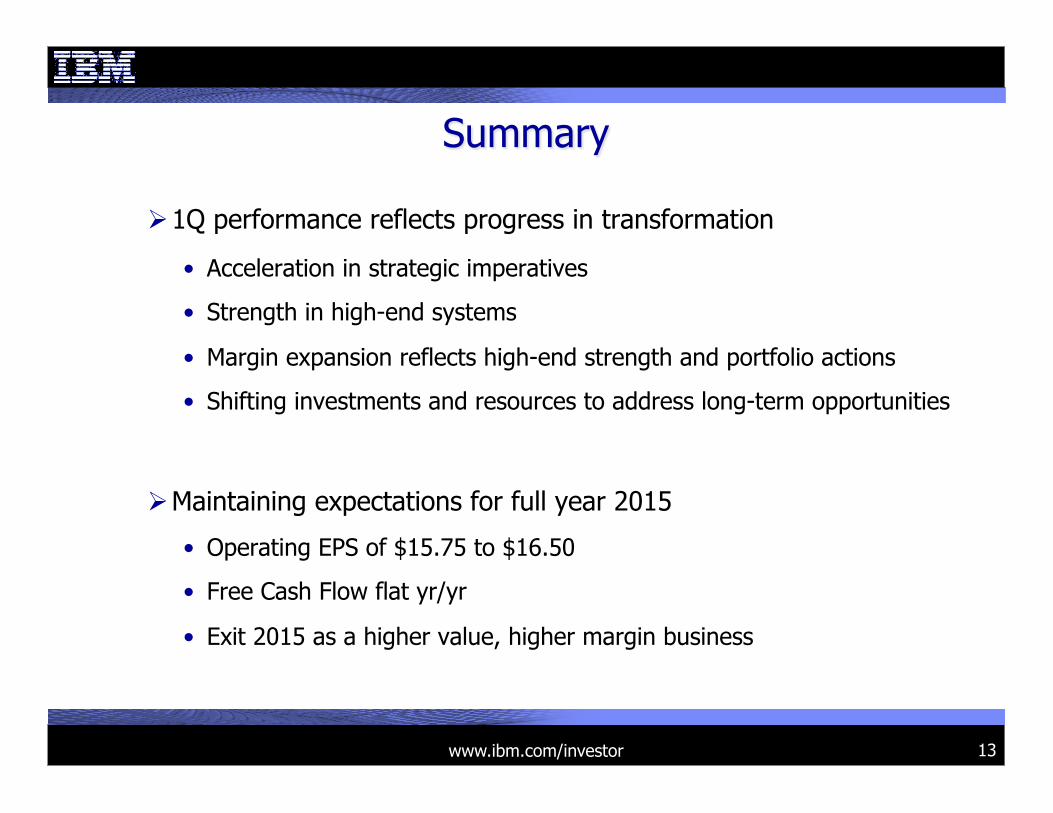
Summary
! 1Q performance reflects progress in transformation
• Acceleration in strategic imperatives
• Strength in high-end systems
• Margin expansion reflects high-end strength and portfolio actions
• Shifting investments and resources to address long-term opportunities
! Maintaining expectations for full year 2015
• Operating EPS of $15.75 to $16.50
• Free Cash Flow flat yr/yr
• Exit 2015 as a higher value, higher margin business

www.ibm.com/investor 14
www.ibm.com/investor 15
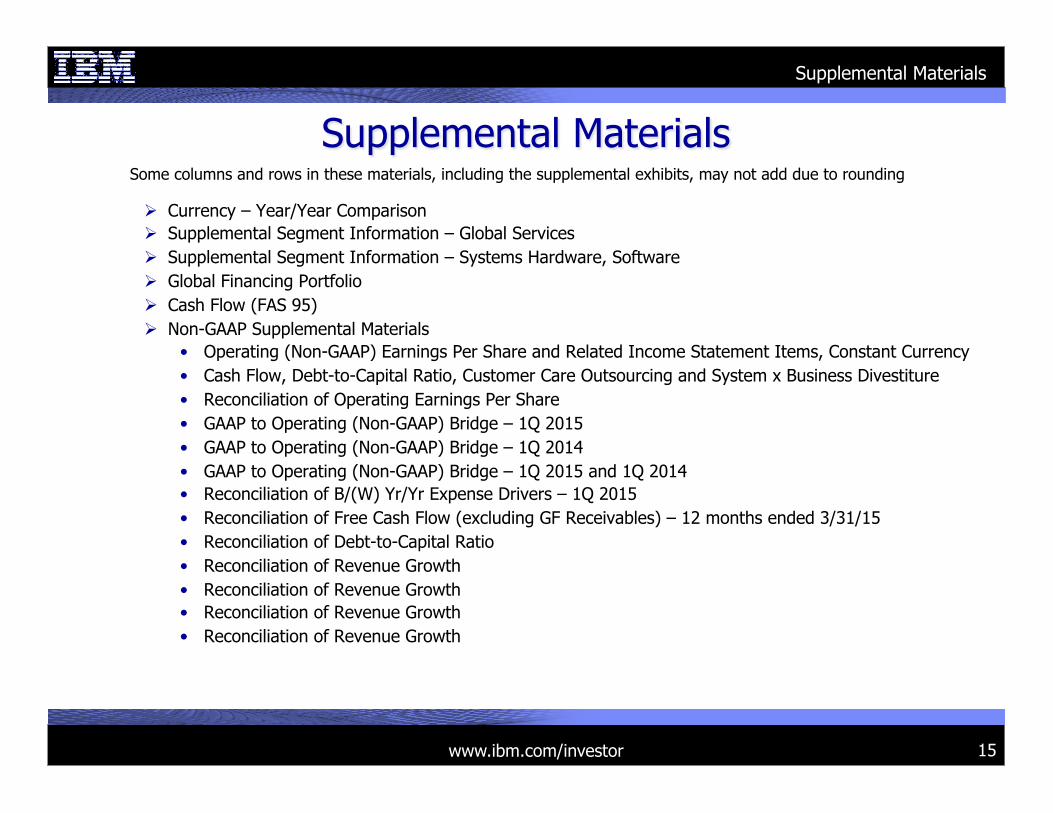
Supplemental Materials
! Currency – Year/Year Comparison ! Supplemental Segment Information – Global Services ! Supplemental Segment Information – Systems Hardware, Software ! Global Financing Portfolio ! Cash Flow (FAS 95) ! Non-GAAP Supplemental Materials
• Operating (Non-GAAP) Earnings Per Share and Related Income Statement Items, Constant Currency • Cash Flow, Debt-to-Capital Ratio, Customer Care Outsourcing and System x Business Divestiture • Reconciliation of Operating Earnings Per Share • GAAP to Operating (Non-GAAP) Bridge – 1Q 2015 • GAAP to Operating (Non-GAAP) Bridge – 1Q 2014 • GAAP to Operating (Non-GAAP) Bridge – 1Q 2015 and 1Q 2014 • Reconciliation of B/(W) Yr/Yr Expense Drivers – 1Q 2015 • Reconciliation of Free Cash Flow (excluding GF Receivables) – 12 months ended 3/31/15 • Reconciliation of Debt-to-Capital Ratio • Reconciliation of Revenue Growth • Reconciliation of Revenue Growth • Reconciliation of Revenue Growth • Reconciliation of Revenue Growth
Some columns and rows in these materials, including the supplemental exhibits, may not add due to rounding
Supplemental Materials
www.ibm.com/investor 16
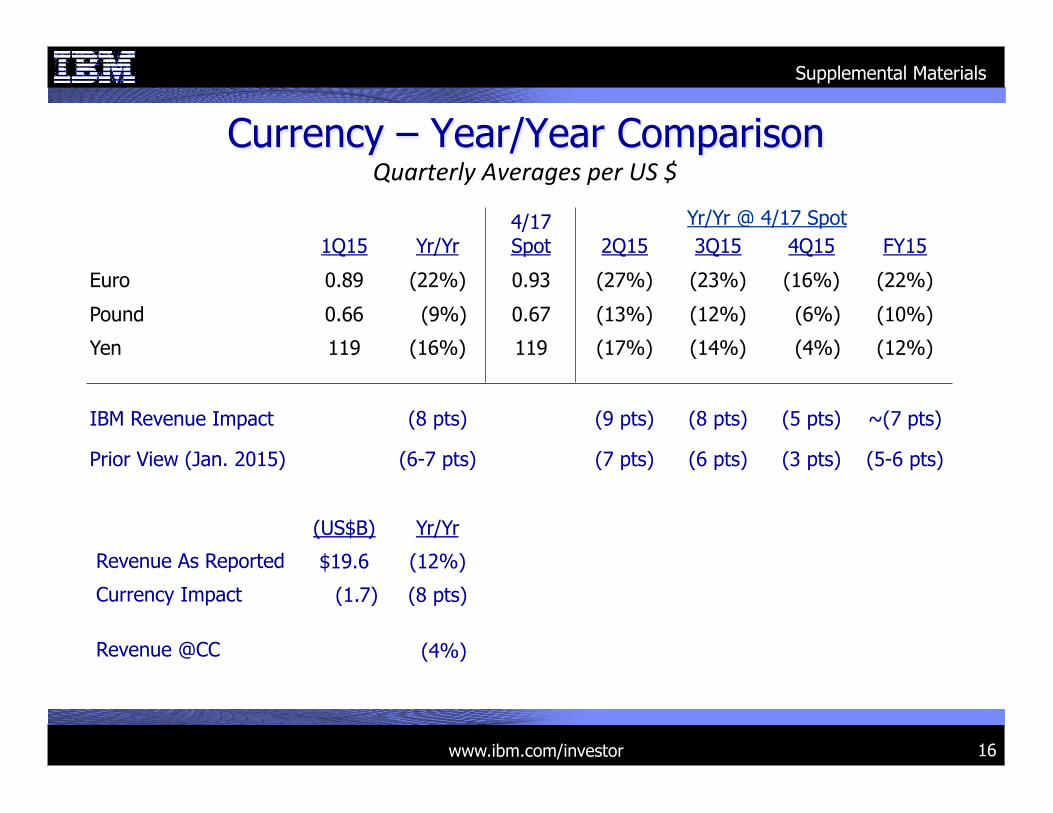
Currency – Year/Year Comparison
1Q15
Yr/Yr
4/17 Spot
2Q15
3Q15
4Q15
FY15
Euro 0.89 (22%) 0.93 (27%) (23%) (16%) (22%)
Pound 0.66 (9%) 0.67 (13%) (12%) (6%) (10%)
Yen 119 (16%) 119 (17%) (14%) (4%) (12%)
IBM Revenue Impact (8 pts) (9 pts) (8 pts) (5 pts) ~(7 pts)
Prior View (Jan. 2015) (6-7 pts) (7 pts) (6 pts) (3 pts) (5-6 pts)
(US$B) Yr/Yr
$19.6 (12%)
(1.7) (8 pts)
(4%)
Yr/Yr @ 4/17 Spot
Quarterly!Averages!per!US!$!
Revenue As Reported
Currency Impact
Revenue @CC
Supplemental Materials
www.ibm.com/investor 17
Supplemental Segment Information – 1Q 2015
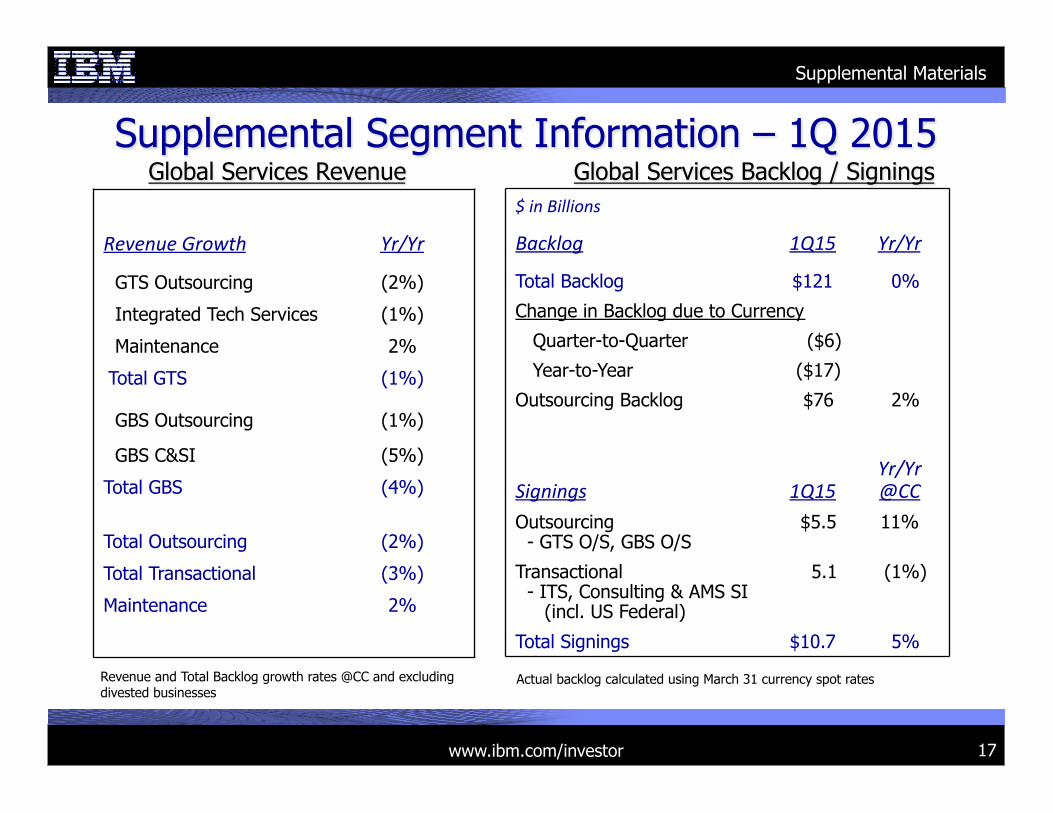
$!in!Billions!
Backlog! 1Q15! Yr/Yr!
Total Backlog $121 0%
Change in Backlog due to Currency
Quarter-to-Quarter ($6)
Year-to-Year ($17)
Outsourcing Backlog $76 2%
!Signings!
!1Q15!
Yr/Yr!@CC!
Outsourcing - GTS O/S, GBS O/S
$5.5 11%
Transactional - ITS, Consulting & AMS SI (incl. US Federal)
5.1 (1%)
Total Signings $10.7 5%
Actual backlog calculated using March 31 currency spot rates
Revenue!Growth! Yr/Yr!
GTS Outsourcing (2%)
Integrated Tech Services (1%)
Maintenance 2%
Total GTS (1%)
GBS Outsourcing (1%)
GBS C&SI (5%)
Total GBS (4%)
Total Outsourcing (2%)
Total Transactional (3%)
Maintenance 2%
Global Services Revenue Global Services Backlog / Signings
Supplemental Materials
Revenue and Total Backlog growth rates @CC and excluding divested businesses
www.ibm.com/investor 18
Supplemental Segment Information – 1Q 2015
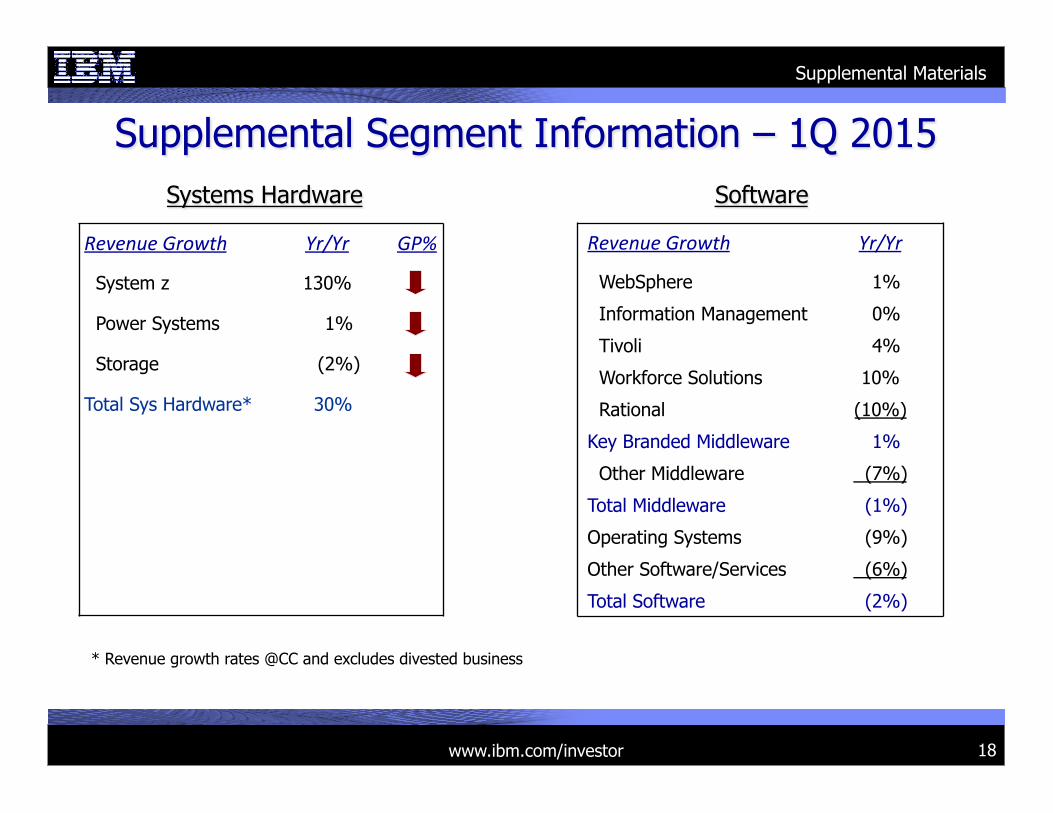
Revenue!Growth! Yr/Yr! GP%!
System z 130%
Power Systems 1%
Storage (2%)
Total Sys Hardware* 30%
Supplemental Materials
Systems Hardware Software
Revenue!Growth! Yr/Yr!
WebSphere 1%
Information Management 0%
Tivoli 4%
Workforce Solutions 10%
Rational (10%)
Key Branded Middleware 1%
Other Middleware (7%)
Total Middleware (1%)
Operating Systems (9%)
Other Software/Services (6%)
Total Software (2%)
* Revenue growth rates @CC and excludes divested business
www.ibm.com/investor
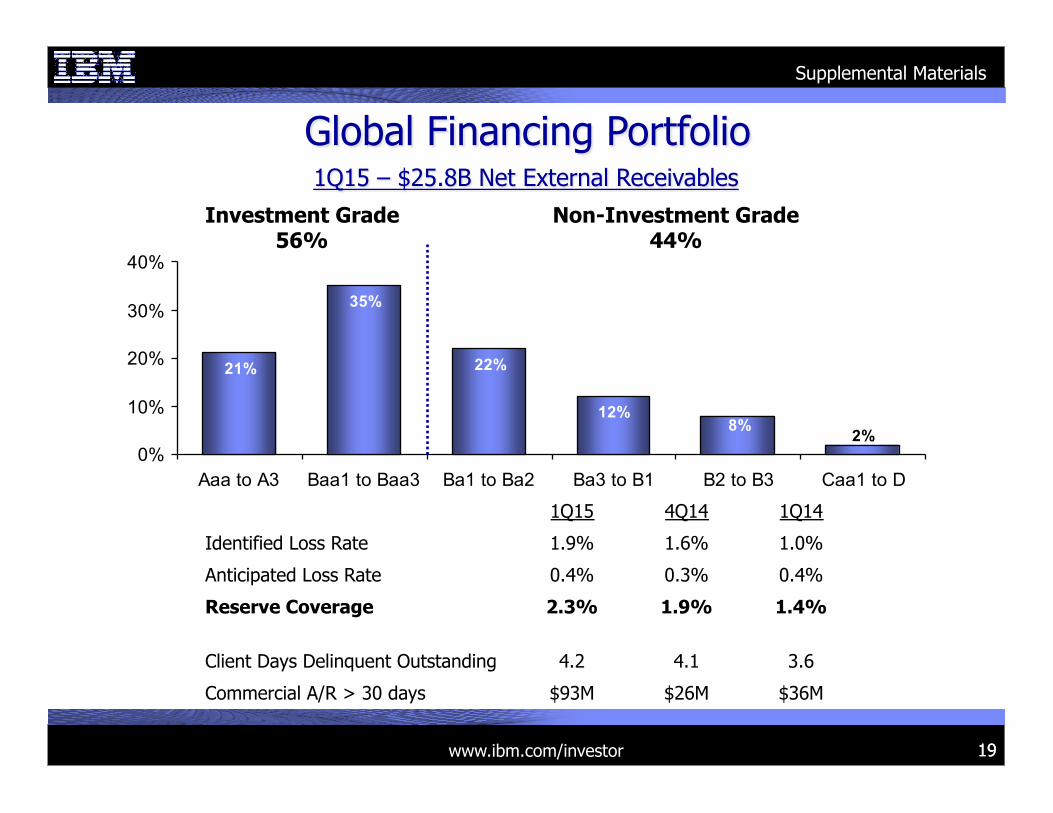
1Q15 4Q14 1Q14
Identified Loss Rate 1.9% 1.6% 1.0%
Anticipated Loss Rate 0.4% 0.3% 0.4%
Reserve Coverage 2.3% 1.9% 1.4%
Client Days Delinquent Outstanding 4.2 4.1 3.6
Commercial A/R > 30 days $93M $26M $36M
19 19 19
Global Financing Portfolio 1Q15 – $25.8B Net External Receivables
21%
35%
22%
12%8% 2%
0%
10%
20%
30%
40%
Aaa to A3 Baa1 to Baa3 Ba1 to Ba2 Ba3 to B1 B2 to B3 Caa1 to D
Non-Investment Grade 44%
Investment Grade 56%
Supplemental Materials
www.ibm.com/investor 20
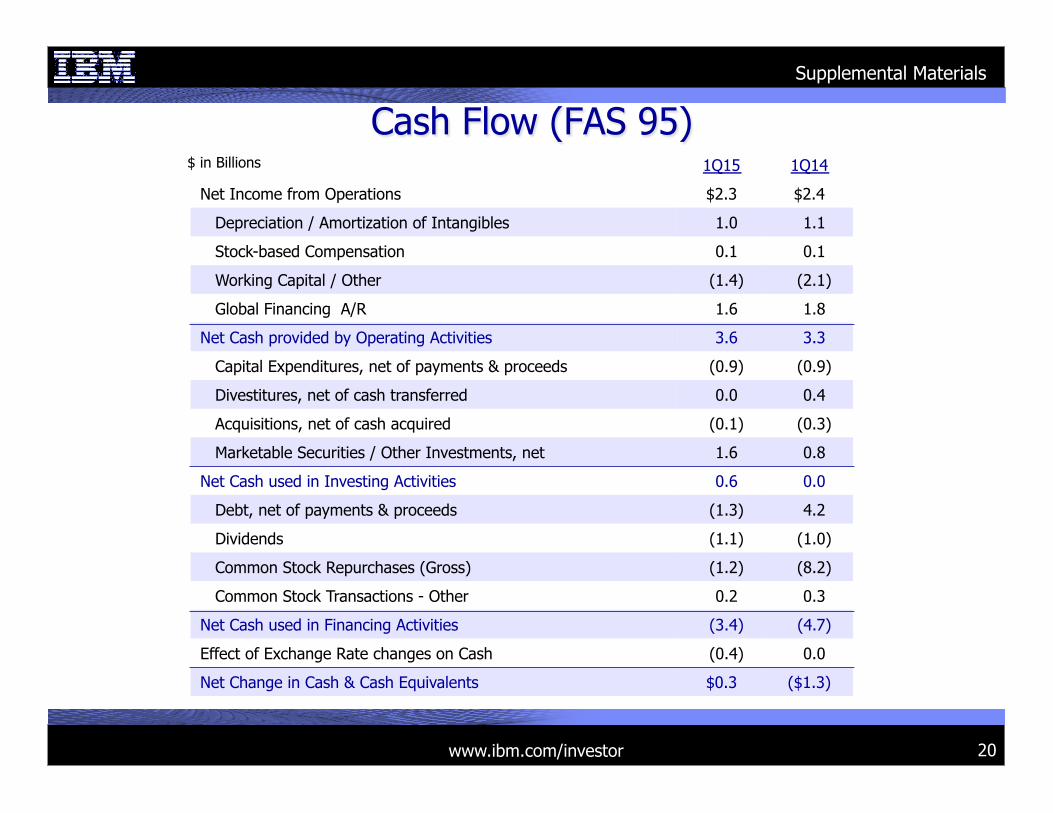
Cash Flow (FAS 95) 1Q15 1Q14
Net Income from Operations $2.3 $2.4
Depreciation / Amortization of Intangibles 1.0 1.1
Stock-based Compensation 0.1 0.1
Working Capital / Other (1.4) (2.1)
Global Financing A/R 1.6 1.8
Net Cash provided by Operating Activities 3.6 3.3
Capital Expenditures, net of payments & proceeds (0.9) (0.9)
Divestitures, net of cash transferred 0.0 0.4
Acquisitions, net of cash acquired (0.1) (0.3)
Marketable Securities / Other Investments, net 1.6 0.8
Net Cash used in Investing Activities 0.6 0.0
Debt, net of payments & proceeds (1.3) 4.2
Dividends (1.1) (1.0)
Common Stock Repurchases (Gross) (1.2) (8.2)
Common Stock Transactions - Other 0.2 0.3
Net Cash used in Financing Activities (3.4) (4.7)
Effect of Exchange Rate changes on Cash (0.4) 0.0
Net Change in Cash & Cash Equivalents $0.3 ($1.3)
$ in Billions
Supplemental Materials
www.ibm.com/investor 21 21
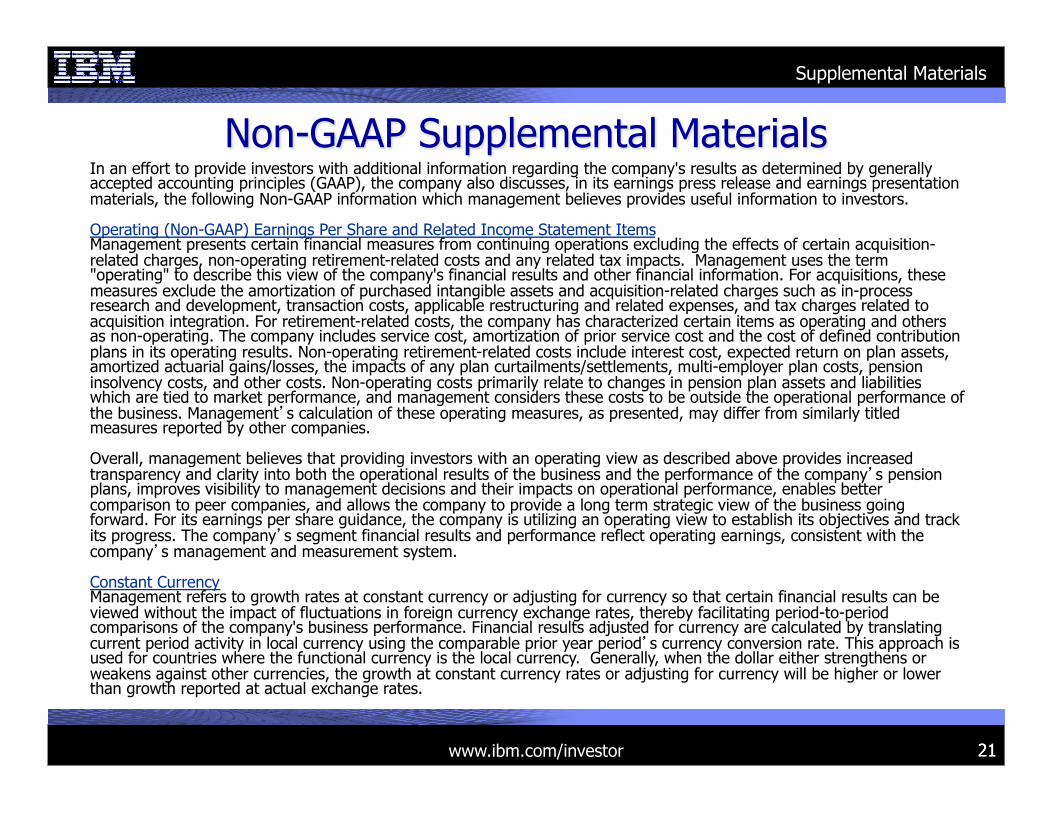
Non-GAAP Supplemental Materials In an effort to provide investors with additional information regarding the company's results as determined by generally accepted accounting principles (GAAP), the company also discusses, in its earnings press release and earnings presentation materials, the following Non-GAAP information which management believes provides useful information to investors. Operating (Non-GAAP) Earnings Per Share and Related Income Statement Items Management presents certain financial measures from continuing operations excluding the effects of certain acquisition-related charges, non-operating retirement-related costs and any related tax impacts. Management uses the term "operating" to describe this view of the company's financial results and other financial information. For acquisitions, these measures exclude the amortization of purchased intangible assets and acquisition-related charges such as in-process research and development, transaction costs, applicable restructuring and related expenses, and tax charges related to acquisition integration. For retirement-related costs, the company has characterized certain items as operating and others as non-operating. The company includes service cost, amortization of prior service cost and the cost of defined contribution plans in its operating results. Non-operating retirement-related costs include interest cost, expected return on plan assets, amortized actuarial gains/losses, the impacts of any plan curtailments/settlements, multi-employer plan costs, pension insolvency costs, and other costs. Non-operating costs primarily relate to changes in pension plan assets and liabilities which are tied to market performance, and management considers these costs to be outside the operational performance of the business. Management�s calculation of these operating measures, as presented, may differ from similarly titled measures reported by other companies. Overall, management believes that providing investors with an operating view as described above provides increased transparency and clarity into both the operational results of the business and the performance of the company�s pension plans, improves visibility to management decisions and their impacts on operational performance, enables better comparison to peer companies, and allows the company to provide a long term strategic view of the business going forward. For its earnings per share guidance, the company is utilizing an operating view to establish its objectives and track its progress. The company�s segment financial results and performance reflect operating earnings, consistent with the company�s management and measurement system. Constant Currency Management refers to growth rates at constant currency or adjusting for currency so that certain financial results can be viewed without the impact of fluctuations in foreign currency exchange rates, thereby facilitating period-to-period comparisons of the company's business performance. Financial results adjusted for currency are calculated by translating current period activity in local currency using the comparable prior year period�s currency conversion rate. This approach is used for countries where the functional currency is the local currency. Generally, when the dollar either strengthens or weakens against other currencies, the growth at constant currency rates or adjusting for currency will be higher or lower than growth reported at actual exchange rates.
Supplemental Materials
www.ibm.com/investor
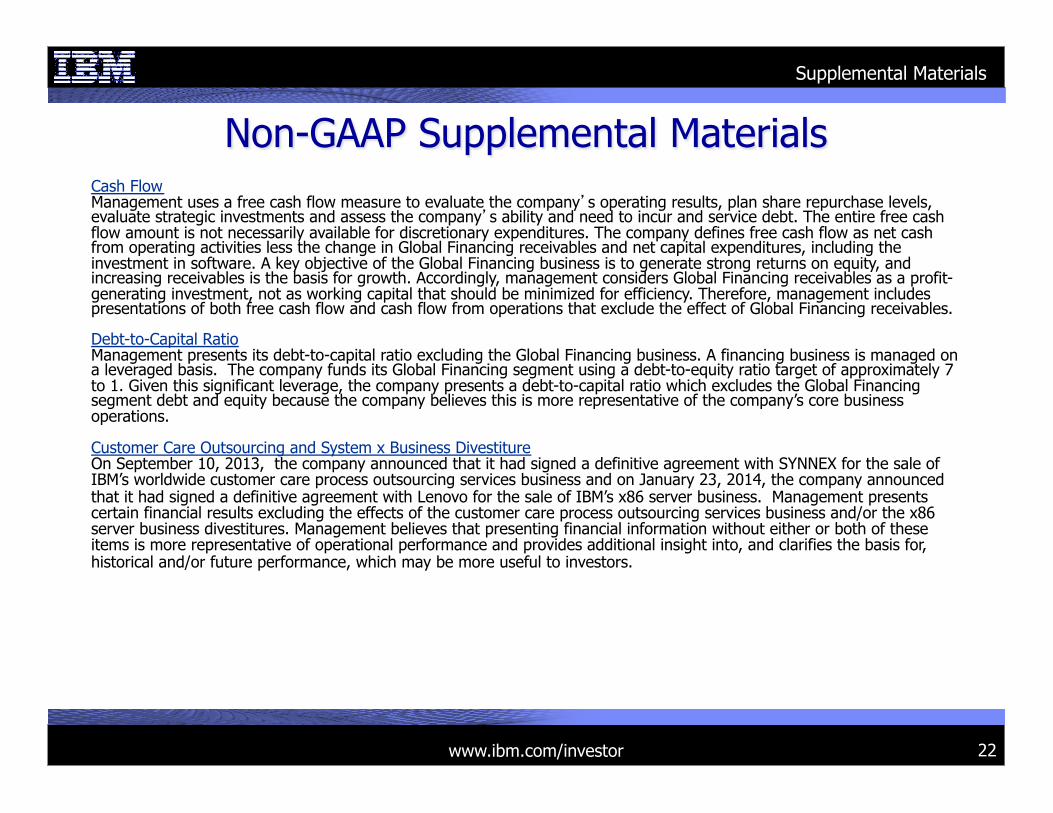
Non-GAAP Supplemental Materials Cash Flow Management uses a free cash flow measure to evaluate the company�s operating results, plan share repurchase levels, evaluate strategic investments and assess the company�s ability and need to incur and service debt. The entire free cash flow amount is not necessarily available for discretionary expenditures. The company defines free cash flow as net cash from operating activities less the change in Global Financing receivables and net capital expenditures, including the investment in software. A key objective of the Global Financing business is to generate strong returns on equity, and increasing receivables is the basis for growth. Accordingly, management considers Global Financing receivables as a profit-generating investment, not as working capital that should be minimized for efficiency. Therefore, management includes presentations of both free cash flow and cash flow from operations that exclude the effect of Global Financing receivables. Debt-to-Capital Ratio Management presents its debt-to-capital ratio excluding the Global Financing business. A financing business is managed on a leveraged basis. The company funds its Global Financing segment using a debt-to-equity ratio target of approximately 7 to 1. Given this significant leverage, the company presents a debt-to-capital ratio which excludes the Global Financing segment debt and equity because the company believes this is more representative of the company’s core business operations. Customer Care Outsourcing and System x Business Divestiture On September 10, 2013, the company announced that it had signed a definitive agreement with SYNNEX for the sale of IBM’s worldwide customer care process outsourcing services business and on January 23, 2014, the company announced that it had signed a definitive agreement with Lenovo for the sale of IBM’s x86 server business. Management presents certain financial results excluding the effects of the customer care process outsourcing services business and/or the x86 server business divestitures. Management believes that presenting financial information without either or both of these items is more representative of operational performance and provides additional insight into, and clarifies the basis for, historical and/or future performance, which may be more useful to investors.
Supplemental Materials
22
www.ibm.com/investor 23
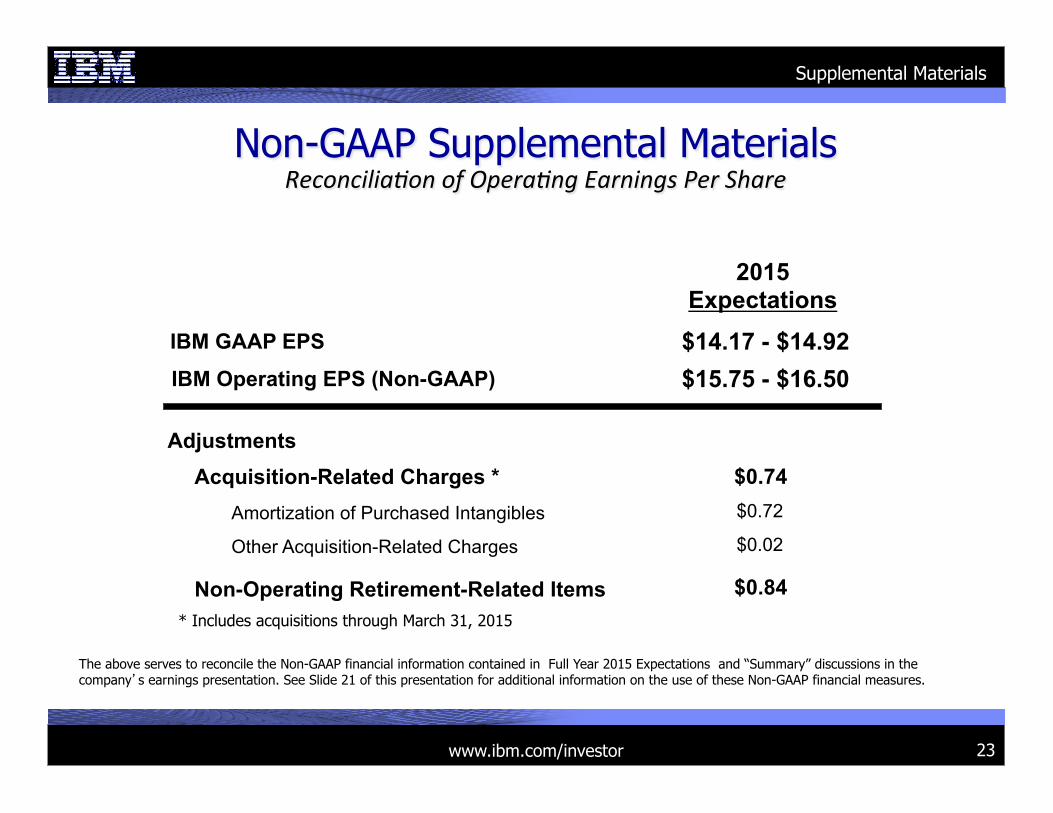
Non-GAAP Supplemental Materials ReconciliaYon!of!OperaYng!Earnings!Per!Share!
IBM Operating EPS (Non-GAAP)
Acquisition-Related Charges * Amortization of Purchased Intangibles
Other Acquisition-Related Charges
Non-Operating Retirement-Related Items
IBM GAAP EPS
Adjustments
2015 Expectations
$15.75 - $16.50 $14.17 - $14.92
$0.74 $0.72
$0.02
$0.84
The above serves to reconcile the Non-GAAP financial information contained in Full Year 2015 Expectations and “Summary” discussions in the company�s earnings presentation. See Slide 21 of this presentation for additional information on the use of these Non-GAAP financial measures.
Supplemental Materials
* Includes acquisitions through March 31, 2015
23
www.ibm.com/investor 24 24
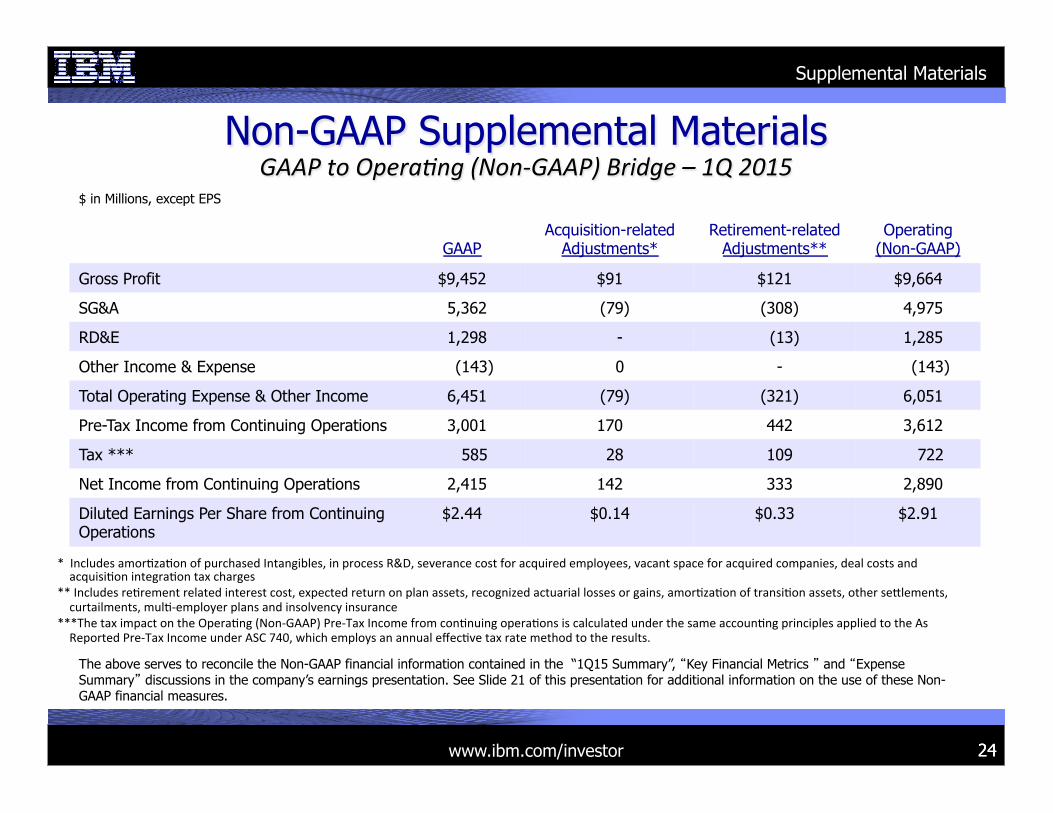
Non-GAAP Supplemental Materials GAAP!to!OperaYng!(NoncGAAP)!Bridge!–!1Q!2015!
$ in Millions, except EPS
GAAP
Acquisition-related Adjustments*
Retirement-related Adjustments**
Operating (Non-GAAP)
Gross Profit $9,452 $91 $121 $9,664
SG&A 5,362 (79) (308) 4,975
RD&E 1,298 - (13) 1,285
Other Income & Expense (143) 0 - (143)
Total Operating Expense & Other Income 6,451 (79) (321) 6,051
Pre-Tax Income from Continuing Operations 3,001 170 442 3,612
Tax *** 585 28 109 722
Net Income from Continuing Operations 2,415 142 333 2,890
Diluted Earnings Per Share from Continuing Operations
$2.44 $0.14 $0.33 $2.91
*""Includes"amor/za/on"of"purchased"Intangibles,"in"process"R&D,"severance"cost"for"acquired"employees,"vacant"space"for"acquired"companies,"deal"costs"and"acquisi/on"integra/on"tax"charges"
**"Includes"re/rement"related"interest"cost,"expected"return"on"plan"assets,"recognized"actuarial"losses"or"gains,"amor/za/on"of"transi/on"assets,"other"se@lements,"curtailments,"mul/Aemployer"plans"and"insolvency"insurance"
***The"tax"impact"on"the"Opera/ng"(NonAGAAP)"PreATax"Income"from"con/nuing"opera/ons"is"calculated"under"the"same"accoun/ng"principles"applied"to"the"As"Reported"PreATax"Income"under"ASC"740,"which"employs"an"annual"effec/ve"tax"rate"method"to"the"results."
"The above serves to reconcile the Non-GAAP financial information contained in the “1Q15 Summary”, �Key Financial Metrics � and �Expense Summary� discussions in the company’s earnings presentation. See Slide 21 of this presentation for additional information on the use of these Non-GAAP financial measures.
Supplemental Materials
www.ibm.com/investor 25 25
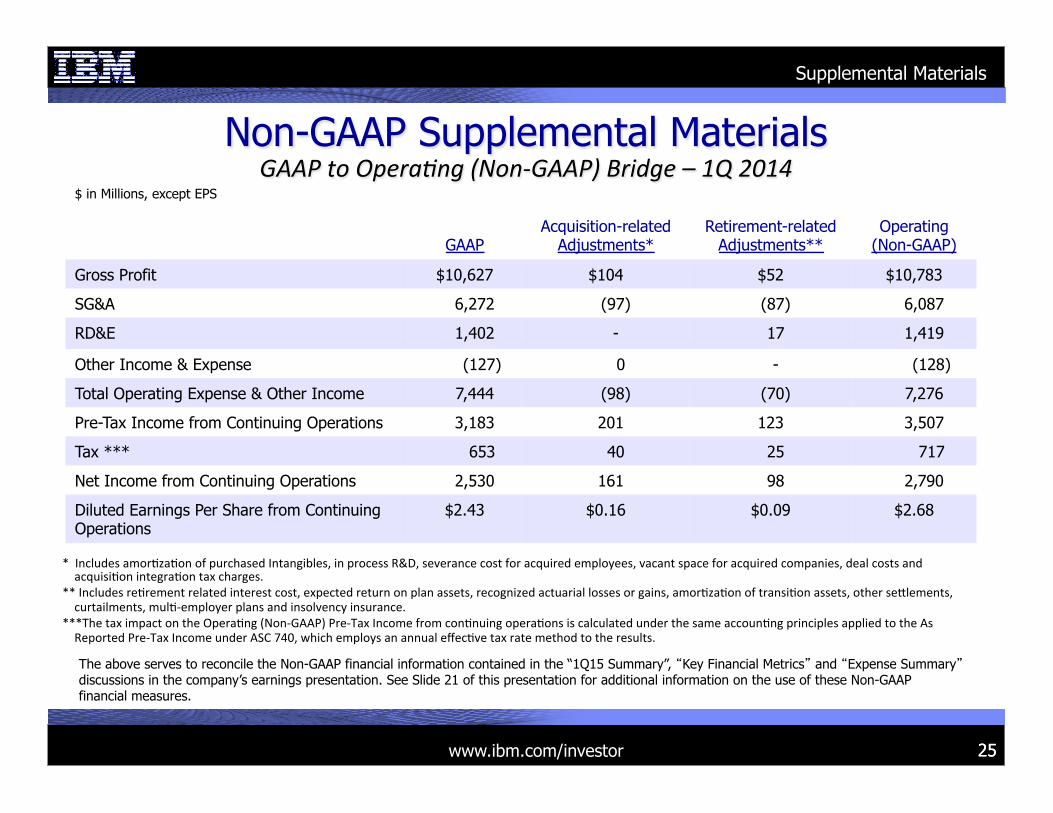
Non-GAAP Supplemental Materials GAAP!to!OperaYng!(NoncGAAP)!Bridge!–!1Q!2014!
$ in Millions, except EPS
GAAP
Acquisition-related Adjustments*
Retirement-related Adjustments**
Operating (Non-GAAP)
Gross Profit $10,627 $104 $52 $10,783
SG&A 6,272 (97) (87) 6,087
RD&E 1,402 - 17 1,419
Other Income & Expense (127) 0 - (128)
Total Operating Expense & Other Income 7,444 (98) (70) 7,276
Pre-Tax Income from Continuing Operations 3,183 201 123 3,507
Tax *** 653 40 25 717
Net Income from Continuing Operations 2,530 161 98 2,790
Diluted Earnings Per Share from Continuing Operations
$2.43 $0.16 $0.09 $2.68
*""Includes"amor/za/on"of"purchased"Intangibles,"in"process"R&D,"severance"cost"for"acquired"employees,"vacant"space"for"acquired"companies,"deal"costs"and"acquisi/on"integra/on"tax"charges."
**"Includes"re/rement"related"interest"cost,"expected"return"on"plan"assets,"recognized"actuarial"losses"or"gains,"amor/za/on"of"transi/on"assets,"other"se@lements,"curtailments,"mul/Aemployer"plans"and"insolvency"insurance."
***The"tax"impact"on"the"Opera/ng"(NonAGAAP)"PreATax"Income"from"con/nuing"opera/ons"is"calculated"under"the"same"accoun/ng"principles"applied"to"the"As"Reported"PreATax"Income"under"ASC"740,"which"employs"an"annual"effec/ve"tax"rate"method"to"the"results."
"The above serves to reconcile the Non-GAAP financial information contained in the “1Q15 Summary”, �Key Financial Metrics� and �Expense Summary� discussions in the company’s earnings presentation. See Slide 21 of this presentation for additional information on the use of these Non-GAAP financial measures.
Supplemental Materials
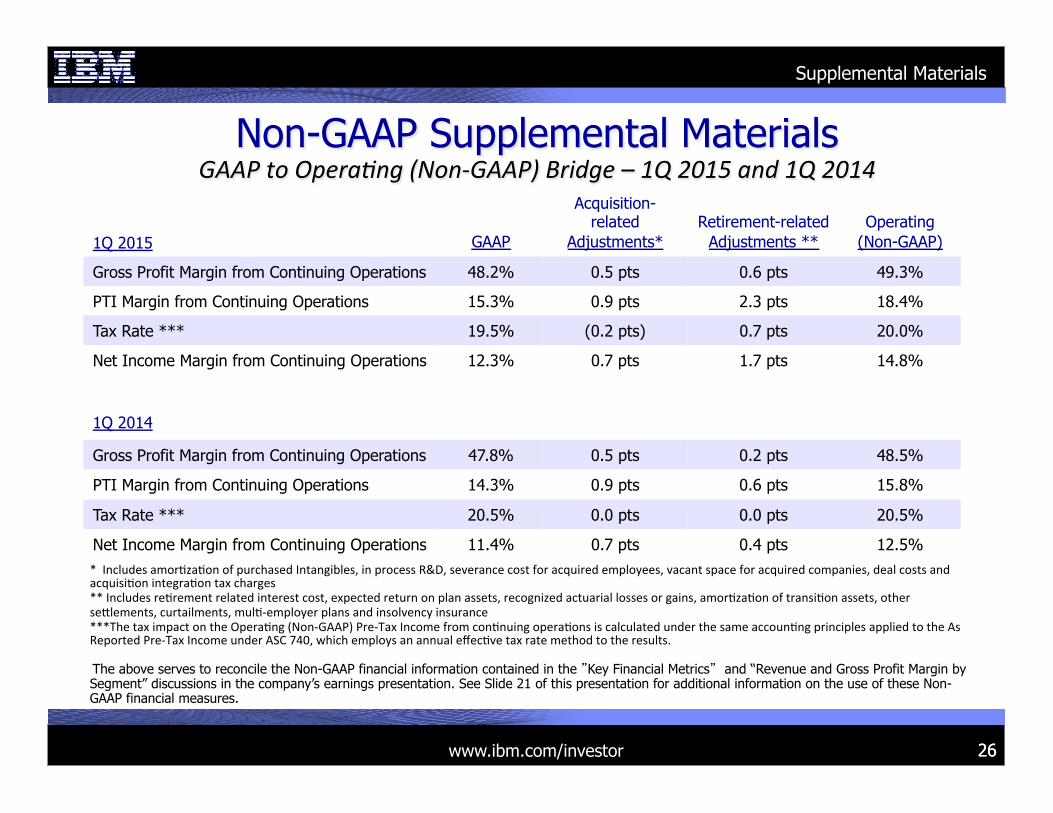
www.ibm.com/investor 26 26
1Q 2015
GAAP
Acquisition- related
Adjustments*
Retirement-related
Adjustments **
Operating
(Non-GAAP)
Gross Profit Margin from Continuing Operations 48.2% 0.5 pts 0.6 pts 49.3%
PTI Margin from Continuing Operations 15.3% 0.9 pts 2.3 pts 18.4%
Tax Rate *** 19.5% (0.2 pts) 0.7 pts 20.0%
Net Income Margin from Continuing Operations 12.3% 0.7 pts 1.7 pts 14.8%
1Q 2014
Gross Profit Margin from Continuing Operations 47.8% 0.5 pts 0.2 pts 48.5%
PTI Margin from Continuing Operations 14.3% 0.9 pts 0.6 pts 15.8%
Tax Rate *** 20.5% 0.0 pts 0.0 pts 20.5%
Net Income Margin from Continuing Operations 11.4% 0.7 pts 0.4 pts 12.5% *""Includes"amor/za/on"of"purchased"Intangibles,"in"process"R&D,"severance"cost"for"acquired"employees,"vacant"space"for"acquired"companies,"deal"costs"and"acquisi/on"integra/on"tax"charges"**"Includes"re/rement"related"interest"cost,"expected"return"on"plan"assets,"recognized"actuarial"losses"or"gains,"amor/za/on"of"transi/on"assets,"other"se@lements,"curtailments,"mul/Aemployer"plans"and"insolvency"insurance"***The"tax"impact"on"the"Opera/ng"(NonAGAAP)"PreATax"Income"from"con/nuing"opera/ons"is"calculated"under"the"same"accoun/ng"principles"applied"to"the"As"Reported"PreATax"Income"under"ASC"740,"which"employs"an"annual"effec/ve"tax"rate"method"to"the"results."""The above serves to reconcile the Non-GAAP financial information contained in the �Key Financial Metrics� and “Revenue and Gross Profit Margin by Segment” discussions in the company’s earnings presentation. See Slide 21 of this presentation for additional information on the use of these Non-GAAP financial measures.
Non-GAAP Supplemental Materials GAAP!to!OperaYng!(NoncGAAP)!Bridge!–!1Q!2015!and!1Q!2014!
Supplemental Materials
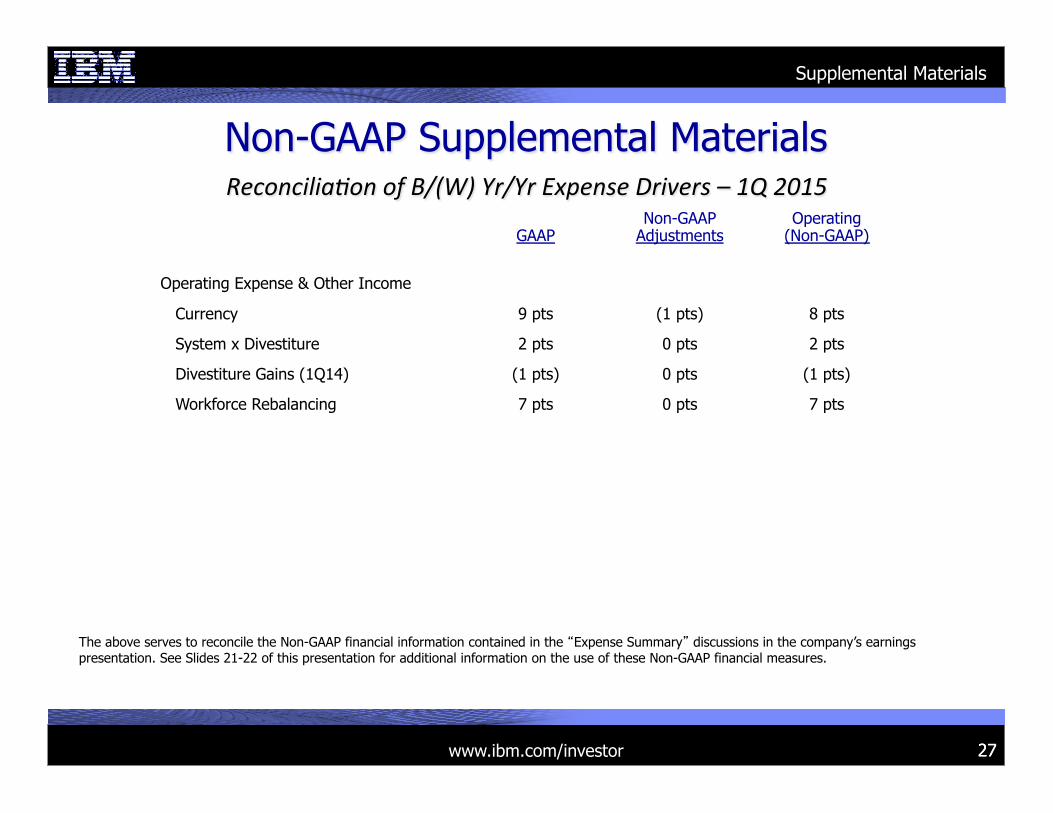
www.ibm.com/investor 27 27
GAAP
Non-GAAP Adjustments
Operating (Non-GAAP)
Operating Expense & Other Income
Currency 9 pts (1 pts) 8 pts
System x Divestiture 2 pts 0 pts 2 pts
Divestiture Gains (1Q14) (1 pts) 0 pts (1 pts)
Workforce Rebalancing 7 pts 0 pts 7 pts
Non-GAAP Supplemental Materials
The above serves to reconcile the Non-GAAP financial information contained in the �Expense Summary� discussions in the company’s earnings presentation. See Slides 21-22 of this presentation for additional information on the use of these Non-GAAP financial measures.
Supplemental Materials
ReconciliaYon!of!B/(W)!Yr/Yr!Expense!Drivers!–!1Q!2015!

www.ibm.com/investor 28
Non-GAAP Supplemental Materials
12 months ended
3/31/15
Net Cash from Operations $17.2
Less: Global Financing Receivables 0.5
Net Cash from Operations (excluding GF Receivables)
16.6
Net Capital Expenditures (3.8)
Free Cash Flow (excluding GF Receivables)
$12.8
$ in Billions
ReconciliaYon!of!Free!Cash!Flow!(excluding!GF!Receivables)!
The above serves to reconcile the Non-GAAP financial information contained in the �Key Financial Metrics� discussions in the company�s earnings presentation. See Slide 22 of this presentation for additional information on the use of these Non-GAAP financial measures.
Supplemental Materials
28
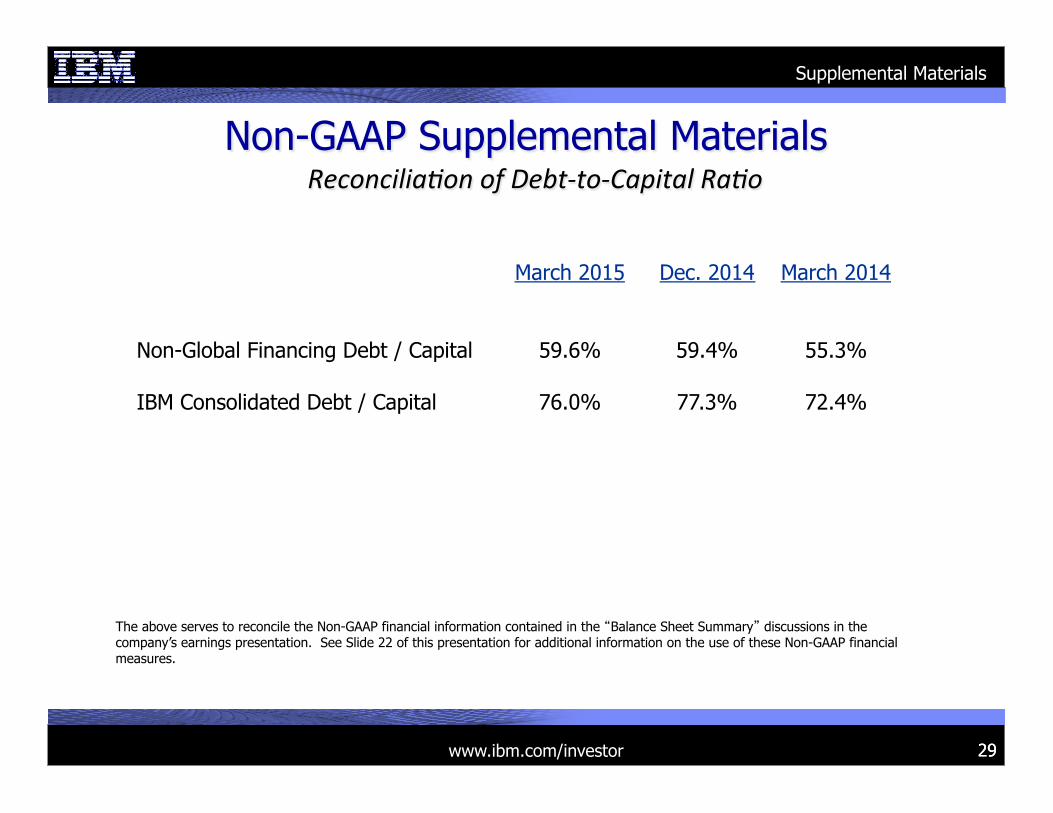
www.ibm.com/investor 29 29
ReconciliaYon!of!DebtctocCapital!RaYo!
March 2015 Dec. 2014 March 2014
Non-Global Financing Debt / Capital IBM Consolidated Debt / Capital
59.6%
76.0%
59.4%
77.3%
55.3%
72.4%
The above serves to reconcile the Non-GAAP financial information contained in the �Balance Sheet Summary� discussions in the company’s earnings presentation. See Slide 22 of this presentation for additional information on the use of these Non-GAAP financial measures.
Non-GAAP Supplemental Materials
Supplemental Materials

www.ibm.com/investor 30 30
Non-GAAP Supplemental Materials
IBM
GAAP (4%)
At Constant Currency (4%)
At Constant
Currency excl. Divested
Businesses (2%)
GAAP (12%)
At Constant Currency (8%)
At Constant
Currency excl. Divested
Businesses (2%)
ReconciliaYon!of!Revenue!Growth!!
4Q14 Yr/Yr
The above serves to reconcile the Non-GAAP financial information contained in the “Key Financial Metrics” discussions in the company�s earnings presentation. See Slides 21-22 of this presentation for additional information on the use of these Non-GAAP financial measures.
Supplemental Materials
3Q14 Yr/Yr
www.ibm.com/investor 31 31
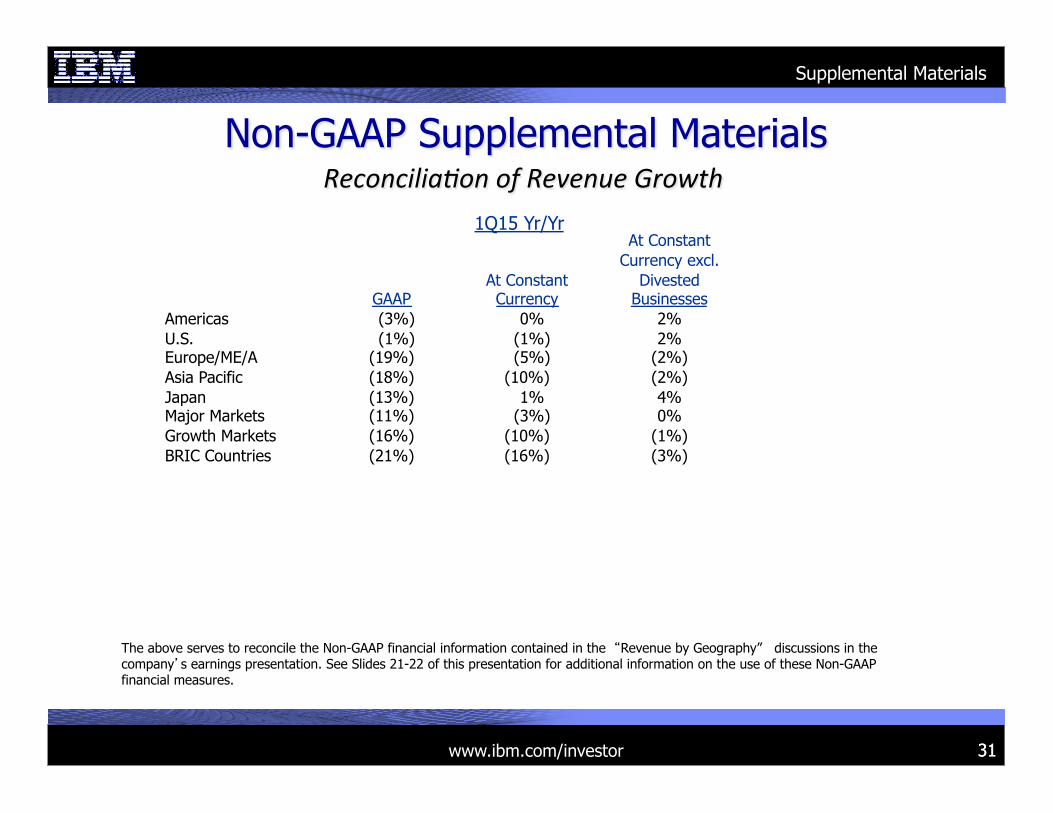
Non-GAAP Supplemental Materials
Americas U.S. Europe/ME/A Asia Pacific Japan Major Markets Growth Markets BRIC Countries
GAAP (3%) (1%) (19%) (18%) (13%) (11%) (16%) (21%)
At Constant Currency
0% (1%) (5%) (10%) 1%
(3%) (10%) (16%)
At Constant
Currency excl. Divested
Businesses 2% 2%
(2%) (2%) 4% 0%
(1%) (3%)
ReconciliaYon!of!Revenue!Growth!!1Q15 Yr/Yr
The above serves to reconcile the Non-GAAP financial information contained in the �Revenue by Geography” discussions in the company�s earnings presentation. See Slides 21-22 of this presentation for additional information on the use of these Non-GAAP financial measures.
Supplemental Materials
www.ibm.com/investor 32 32
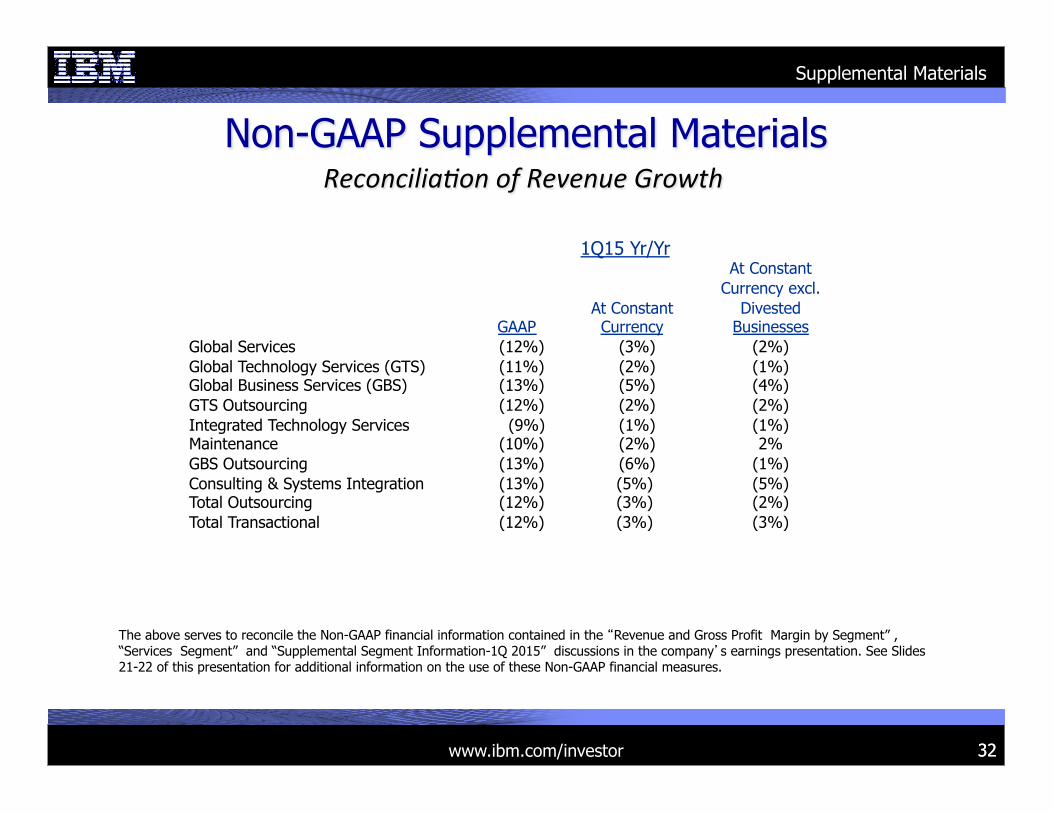
Non-GAAP Supplemental Materials
Global Services Global Technology Services (GTS) Global Business Services (GBS) GTS Outsourcing Integrated Technology Services Maintenance GBS Outsourcing Consulting & Systems Integration Total Outsourcing Total Transactional
GAAP (12%) (11%) (13%) (12%) (9%) (10%) (13%) (13%) (12%) (12%)
At Constant Currency (3%) (2%) (5%) (2%) (1%) (2%) (6%) (5%) (3%) (3%)
At Constant
Currency excl. Divested
Businesses (2%) (1%) (4%) (2%) (1%) 2%
(1%) (5%) (2%) (3%)
ReconciliaYon!of!Revenue!Growth!!
1Q15 Yr/Yr
The above serves to reconcile the Non-GAAP financial information contained in the �Revenue and Gross Profit Margin by Segment” , “Services Segment” and “Supplemental Segment Information-1Q 2015” discussions in the company�s earnings presentation. See Slides 21-22 of this presentation for additional information on the use of these Non-GAAP financial measures.
Supplemental Materials
www.ibm.com/investor 33 33
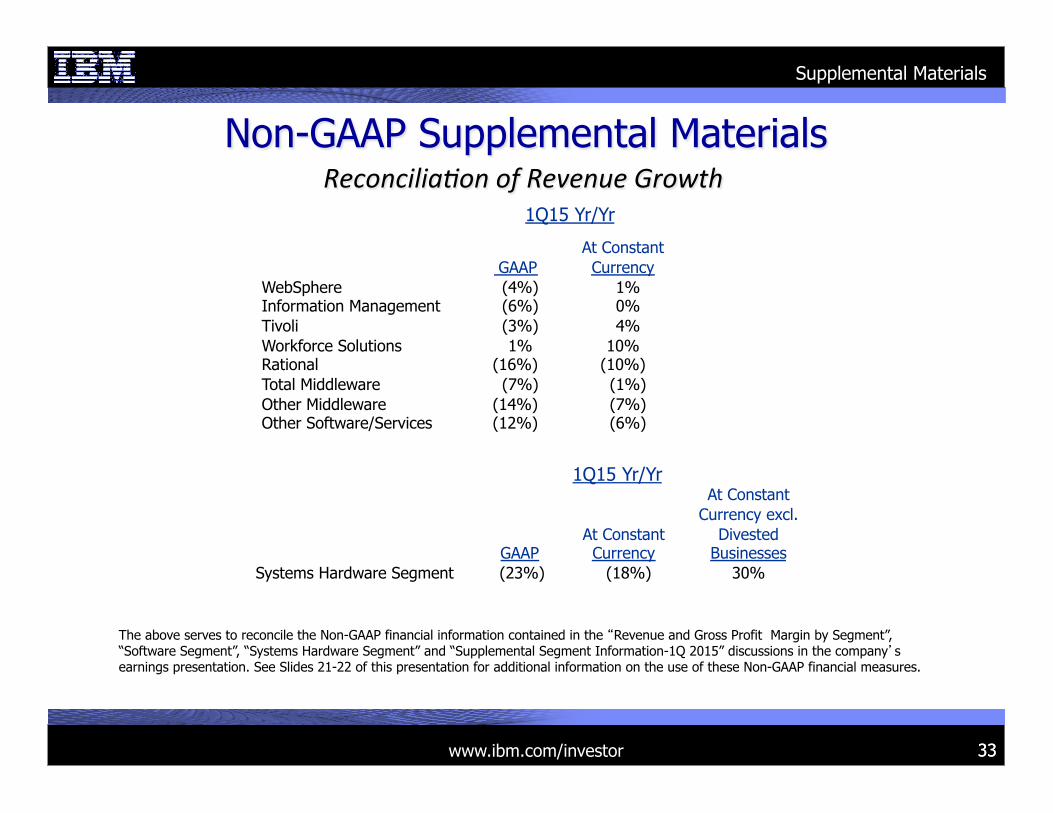
Non-GAAP Supplemental Materials
WebSphere Information Management Tivoli Workforce Solutions Rational Total Middleware Other Middleware Other Software/Services
GAAP (4%) (6%) (3%) 1%
(16%) (7%) (14%) (12%)
At Constant Currency
1% 0% 4% 10%
(10%) (1%) (7%) (6%)
ReconciliaYon!of!Revenue!Growth!!1Q15 Yr/Yr
Supplemental Materials
1Q15 Yr/Yr
Systems Hardware Segment
GAAP (23%)
At Constant Currency (18%)
At Constant
Currency excl. Divested
Businesses 30%
The above serves to reconcile the Non-GAAP financial information contained in the �Revenue and Gross Profit Margin by Segment”, “Software Segment”, “Systems Hardware Segment” and “Supplemental Segment Information-1Q 2015” discussions in the company�s earnings presentation. See Slides 21-22 of this presentation for additional information on the use of these Non-GAAP financial measures.
www.ibm.com/investor 34