Embed Size (px)
Citation preview
MAGIC POLYl\1ER GEL DOSIMETRY USING X-RAY COMPUTED
TOMOGRAPHY: A FEASIBILITY STUDY
by
MOHAMMAD ABDALLA MOHAMMAD ALJAMAL
Thesis submitted in fulfilment of the requirements for the degree
of Master of science (Medical Radiation) ,
June 2008
DEDICATION
I would like to dedicate my thesis to my parents, whose confidence in me has been
unwavering, and to my beloved brother and sisters. Thank you for the moral and financial
support that kept me afloat.
11
ACKNOWLEDGEMENTS
First of all, I would like to thank Allah for giving me the strength and courage to persevere
throughout the duration of this research proj ect.
I wish to acknowledge with greatest thanks to my father Mr. Abdalla Mohammad Aljamal
whom has been my source of inspiration because of his continuous support and
encouragement. My lovely mother who has dedicated all her life with sweat and blood to her
sons. My brother, Ahmad and my sisters whom has showed me their determination in which
gave me confidence to pursue my work and research.
I would like to express my utmost gratitude to my main supervisor, Associate Professor Dr.
Ahmad Zakria and to my co-supervisor, Dr. Shaharum Shamsuddin for their untiring
dedication, brilliant knowledge of research, exceptional advice, leadership, ideas, support
,encouragement and constructive comments throughout writing which without them none of
this research could have take place.
My deepest thanks go to Mr. Nik Ruzman for his advice and support during irradiation
process and special thanks to Mr. Zaky bin Hamn for his support during my scanning
process.
111
I would like to extend my grateful appreciation and thanks to all my friends, for their
friendship, unlimited help and support especially, Dr. Najeeb Abu Alroub, Dr. Kareem, Dr.
Naeem, , Dr. Zyiad kammal, Dr. Muath, Aidin Molouki , Suliman Tayseer, Venue ,Khairul
Azan, Amir, Khari,.
Lastly, but not the least, I would like to thank all my fellow colleagues and friends who have
directly or indirectly participated in making this study possible. While it might be not
possible to name them all here, their help is forever unforgettable.
IV
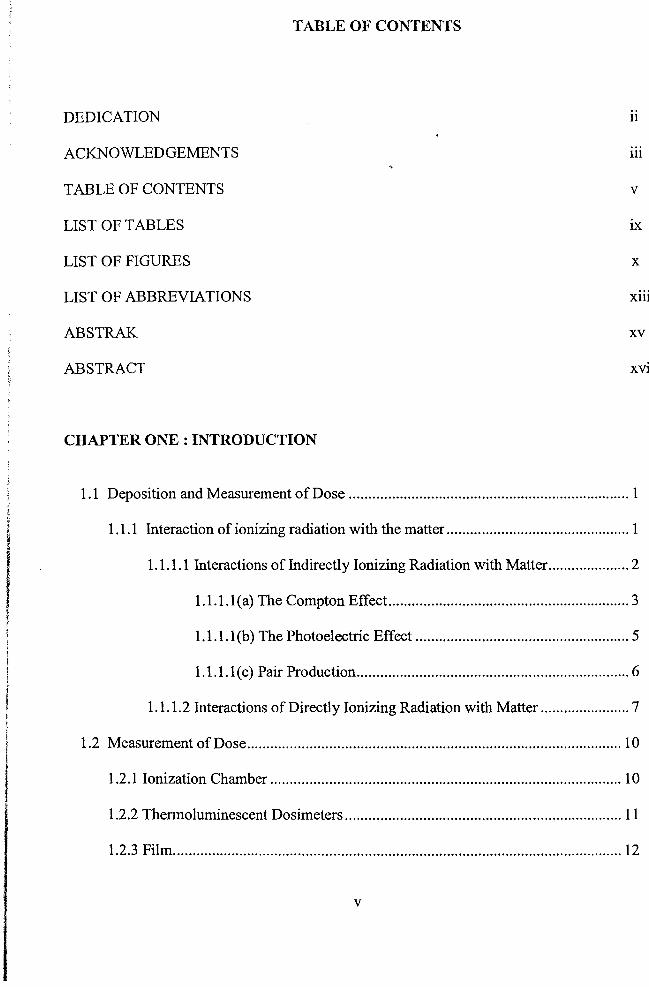
TABLE OF CONTENTS
DEDICATION 11
ACKNOWLEDGEMENTS 111
TABLE OF CONTENTS v
LIST OF TABLES IX
LIST OF FIGURES X
LIST OF ABBREVIATIONS X1l1
ABSTRAK xv
ABSTRACT xvii
CHAPTER ONE: INTRODUCTION
1.1 Deposition and Measurement of Dose ........................................................................ 1
1.1.1 Interaction of ionizing radiation with the matter ............................................... 1
1.1.1.1 Interactions of Indirectly Ionizing Radiation with Matter ..................... 2
1.1.1.I(a) The Compton Effect.. ............................................................ 3
1.1.1.1 (b) The Photoelectric Effect ....................................................... 5
1.1.1.1 (c) Pair Production ...................................................................... 6
1.1.1.2 Interactions of Directly Ionizing Radiation with Matter ....................... 7
1.2 Measurement of Dose ................................................................................................ 10
1.2.1 Ionization Chamber .......................................................................................... 10
1.2.2 Thermoluminescent Dosimeters ....................................................................... 11
1.2.3 Film ................................................................................................................... 12
v
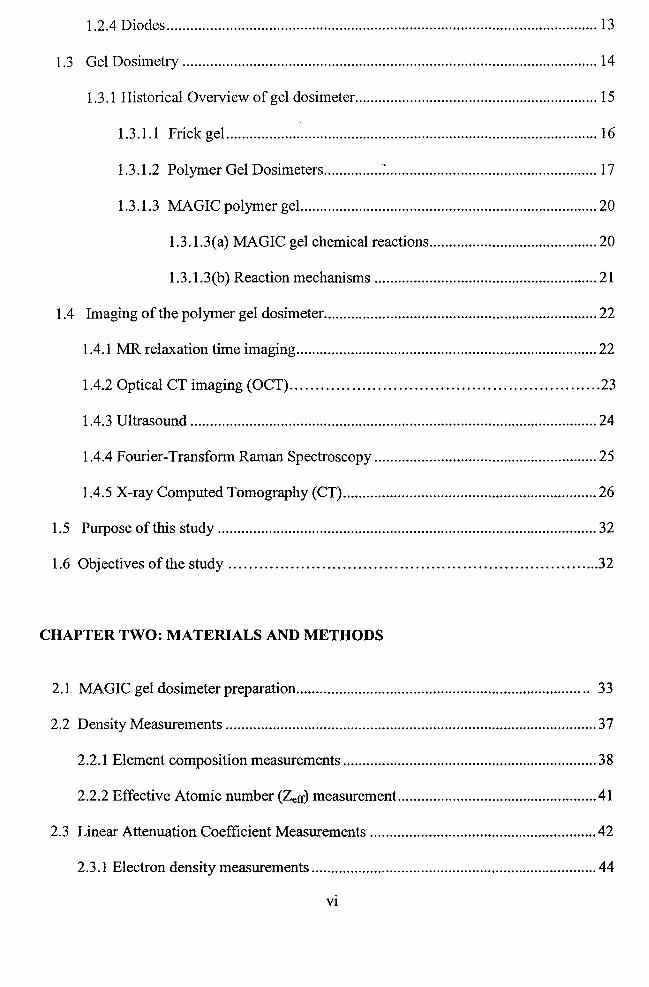
1.2.4 Diodes .............................................................................................................. 13
1.3 Gel Dosimetry .......................................................................................................... 14
1.3.1 Historical Overview of gel dosimeter .............................................................. 15
1.3.1.1 Frick gel ............................................................................................... 16
1.3.1.2 Polymer Gel Dosimeters ............... : ...................................................... 17
1.3.1.3 MAGIC polymer gel. ........................................................................... 20
1.3. 1.3 (a) MAGIC gel chemical reactions ........................................... 20
1.3.1.3(b) Reaction mechanisms ......................................................... 21
1.4 Imaging of the polymer gel dosimeter ...................................................................... 22
1.4.1 MR relaxation time imaging ............................................................................. 22
1.4.2 Optical CT imaging (OCT) ............................................................ 23
1.4.3 Ultrasound ........................................................................................................ 24
1.4.4 Fourier-Transform Raman Spectroscopy ......................................................... 25
1.4.5 X-ray Computed Tomography (CT) ................................................................. 26
1.5 Purpose of this study ................................................................................................. 32
1.6 Objectives of the study ........................................................................ 32
CHAPTER TWO: MATERIALS AND METHODS
2.1 MAGIC gel dosimeter preparation........................................................................... 33
2.2 Density Measurements ............................................................................................... 37
2.2.1 Element composition measurements ................................................................. 38
2.2.2 Effective Atomic number (Zeff) measurement.. ................................................. 41
2.3 Linear Attenuation Coefficient Measurements ......................................................... .42
2.3.1 Electron density measurements ......................................................................... 44
VI
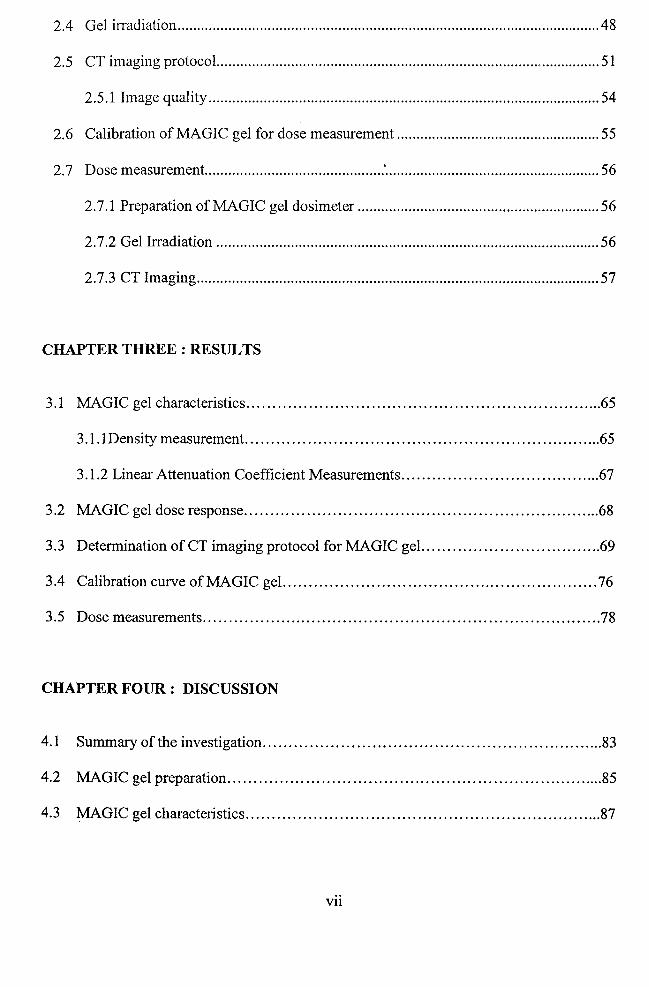
2.4 Gel irradiation ............................................................................................................ 48
2.5 CT ilnaging protocol. ................................................................................................. 51
2.5.1 Image quality .................................................................................................... 54
2.6 Calibration of MAGIC gel for dose measurement .................................................... 55
2.7 Dose measurement ............................................. : ....................................................... 56
2.7.1 Preparation of MAGIC gel dosimeter .............................................................. 56
2.7.2 Gel Irradiation .................................................................................................. 56
2.7.3 CT Imaging ....................................................................................................... 57
CHAPTERTHREE:RESULTS
3.1 MAGIC gel characteristics ..................................................................... 65
3. 1. 1 Density measurement ..................................................................... 65
3.1.2 Linear Attenuation Coefficient Measurements ....................................... 67
3.2 MAGIC gel dose response ..................................................................... 68
3.3 Determination of CT imaging protocol for MAGIC geL .................................. 69
3.4 Calibration curve of MAGIC geL ........................................................... 76
3.5 Dose measurements ............................................................................. 78
CHAPTER FOUR: DISCUSSION
4.1 Summary of the investigation .................................................................. 83
4.2 MAGIC gel preparation ......................................................................... 85
4.3 MAGIC gel characteristics ..................................................................... 87
Vll
4.3.1 Density Ineasurement. .................................................................... 87
4.3.2 Linear Attenuation Coefficient Measurements ........................................ 89
4.4 Dose-response of MAGIC geL ................................................................. 90
4.5 CT imaging protocol for MAGIC geL ........................................................ 91
4.6 Calibration curve of MAGIC gel.. ............................................................. 98
4.7 Dose measurements ............................................................................. 100
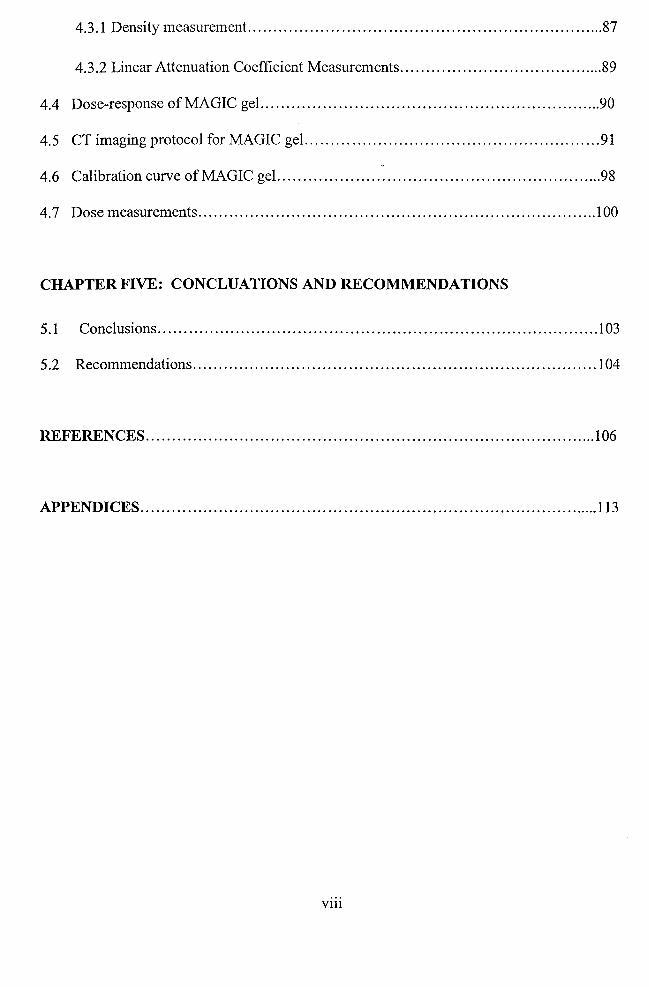
CHAPTER FIVE: CONCLUATIONS AND RECOMMENDATIONS
5.1 Conclusions .................................................................................... .! 03
5.2 Recommendations .............................................................................. 104
REFERENCES ... ................................................................................... .106
APPENDICES .................................................................................... ..... 113
Vlll
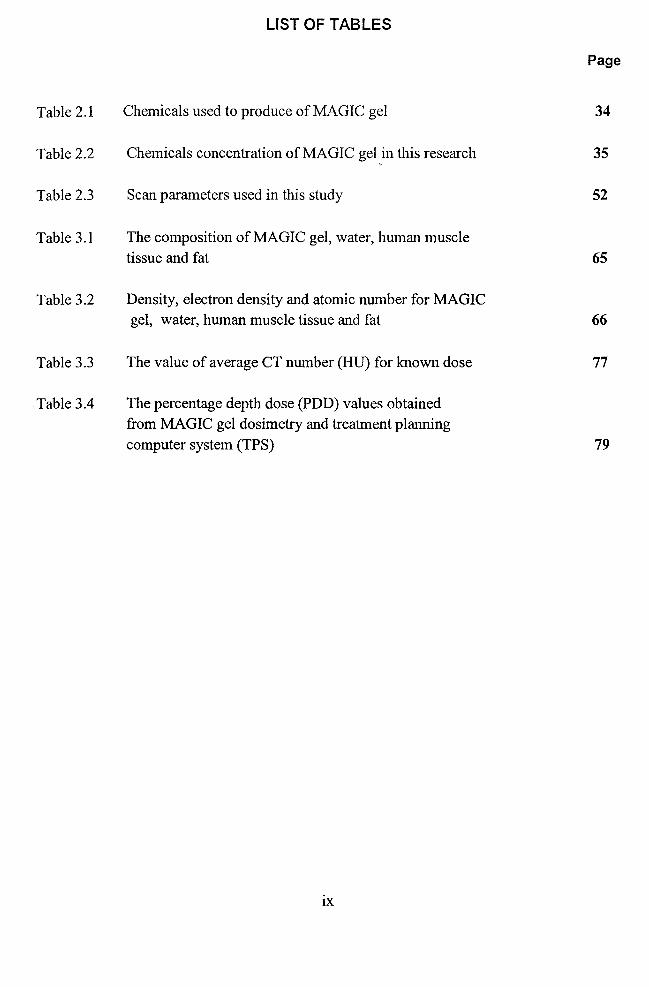
LIST OF TABLES
Page
Table 2.1 Chemicals used to produce of MAGIC gel 34
Table 2.2 Chemicals concentration of MAGIC gel}n this research 35
Table 2.3 Scan parameters used in this study 52
Table 3.1 The composition of MAGIC gel, water, human muscle tissue and fat 65
Table 3.2 Density, electron density and atomic number for MAGIC gel, water, human muscle tissue and fat 66
Table 3.3 The value of average CT number (HU) for known dose 77
Table 3.4 The percentage depth dose (PDD) values obtained from MAGIC gel dosimetry and treatment planning computer system (TPS) 79
IX
LIST OF FIGURES
Figure 1.1 A diagram representing therelative importance of the three main interactions in radiological physics,
the Compton effect, photoelectric effect, and pair production
Figure 1.2 A schematic diagram of the Compton effect
Figure 1.3 The photoelectric effect
Figure 1.4 Schematic of pair production
Figure 2.1 Volumetric glass flask
Figure 2.2 polystyrene cuvette
Figure 2.3 The linear attenuation coefficient measurements based on narrow beam geometry
Figure 2.4 The electron density measurements at a scattering angle of 90° using narrow beam geometry
Figure 2.5 Plastic container contains MAGIC gel
Figure 2.6 Arrangement of samples on a rectangle perspex holder
before irradiation
Figure 2.7 The samples on the rectangular perspex holder inside.the water bath during Irradiation
Figure 2.8 Arrangement of the irradiated gels of different dose within a circular perspex holder before CT scanning
Figure 2.9 The samples inside a cylindrical perspex phantom containing water for CT scanning
x
Page
3
4
5
6
41
46
46
47
49
49
50
58
59
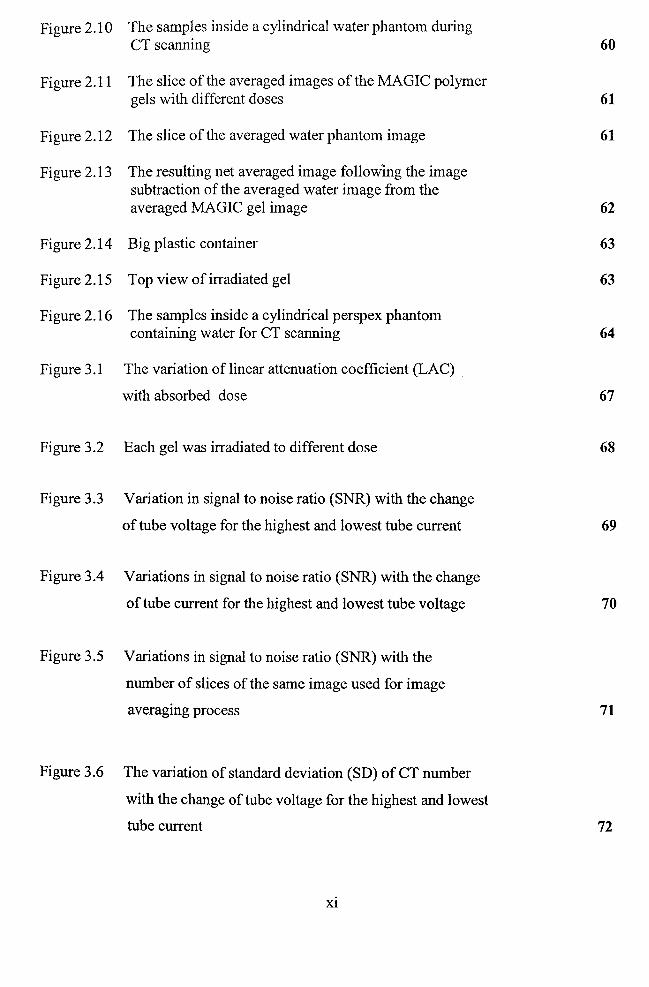
Figure 2.10 The samples inside a cylindrical water phantom during CT scanning
Figure 2.11 The slice of the averaged images ofthe MAGIC polymer gels with different doses
Figure 2.12 The slice of the averaged water phantom image
Figure 2.13 The resulting net averaged image following the image subtraction of the averaged water image from the averaged MAGIC gel image
Figure 2.14 Big plastic container
Figure 2.15 Top view of irradiated gel
Figure 2.16 The samples inside a cylindrical perspex phantom containing water for CT scanning
Figure 3.1 The variation of linear attenuation coefficient (LAC) .
with absorbed dose
Figure 3.2 Each gel was irradiated to different dose
Figure 3.3 Variation in signal to noise ratio (SNR) with the change
of tube voltage for the highest and lowest tube current
Figure 3.4 Variations in signal to noise ratio (SNR) with the change
of tube current for the highest and lowest tube voltage
Figure 3.5 Variations in signal to noise ratio (SNR) with the
number of slices of the same image used for image
averaging process
Figure 3.6 The variation of standard deviation (SD) of CT number
with the change of tube voltage for the highest and lowest
tube current
Xl
60
61
61
62
63
63
64
67
68
69
70
71
72
Figure 3.7 The variation in standard deviation (SD) of CT number
with the change of tube current for the highest and lowest
tube voltage
Figure 3.8 Variation in standard deviation (SD) with the number
of slices of the same image used for image averaging
Figure 3.9 The effect of image reconstruction algorithm on SD of
the CT image number
Figure 3.10 The variation in pixel intensity of net average CT image
With increasing dose
Figure 3 .11 Average CT number of the net averaged image versus dose for irradiated MAGIC gel
Figure 3.12 Percentage depth dose (PDD) from MAGIC gel dosimetry and TPS using 8 x 8cm2 field size
Figure 3.13 The beam profiles at Scm depth determined by
MAGIC gel dosimetry and treatment planning
computer system (TPS)
Figure 3.14 The beam profiles at 10cm depth determined by
MAGIC gel dosimetry and treatment planning
computer system (TPS)
xii
73
74
75
76
77
78
81
82
Am-241
BANG
CT
HPLC
HU
HUSM
IMRT
LAC
MAGAT
MAGIC
MCA
MRI
NIH
OCT
OD
PAG
PAGAT
PDD
ROI
SD
SNR
SRS
LIST OF ABBREVIATIONS
Amersham 241
BIS Acrylamide Nitrogen Gelatin
Computed Tomography
High Performance Liquid Chromatography
Hounsfield Unit
Hospital University Sains Malaysia
Intensity Modulated Radiotherapy
Linear Attenuation Coefficient
Methacrylic acid Gelatin and Tetrakis
Methacrylic and Ascorbic acids in Gelatin Initiated by Copper
Multi Channel Analyzer
Magnetic Resonance imaging
National Institutes of Health
Optical Computed Tomography
Optical Density
Polyacrylamide Gelatin
Polyacrylamide Gelatin and Tetrakis
Percentage Depth Dose
Region of Interest
Standard deviation
Signal to Noise Ratio
Stereotactic radiosurgery
Xlll
SRT Stereotactic radiotherapy
SSD Source to Surface Distance
THP Tetrakis phosphonium Chloride
TLD Thennoluminescent Dosimeter
TPS Treatment Planning System
US Ultrasound
XIV
DOSIMETRI GEL POLIMER MAGIC MENGGUNAKAN TOMOGRAFI
BERKOMPUTER SINAR-X : SATU KAJIAN KEBOLEHLAKSANAAN
ABSTRAK
Projek ini bertujuan mengkaji kebolehlaksanaan pembangunan sistem dosimetri gel polimer
MAGIC ("Methacrylic and Ascorbic acid in Gelatin Initiated by Copper") menggunakan
"helical multislice" tomografi berkomputer sinar-X di HUSM untuk menentukan taburan
dos. Gel MAGIC disediakan mengikut formula yang telah dicadangkan oleh Fong et ai.
(2001) dengan sedikit perubahan. Gel ini dikaji untuk melihat samada ia mempunyai ciri-ciri
yang sarna dengan air. Prinsip Archimedes digunakan untuk menentukan kepadatanjisim (P)
dan sementara itu pengiraan pecahan berat kandungan elemen dan nombor atomik efektif
(Zeff) gel juga dilakukan. Kepadatan elektron juga diukur pada suhu bilik dengan sudut
serakan 90°. Pemalar pengecilan linear (;t) gel yang tidak disinari, gel disinari dan air
ditentukan dengan menggunakan sumber Am-241 berdasarkan prinsip alur sempit. Ukuran
pemalar pengecilan linear gel MAGIC yang tidak disinari dan air adalah 0.84 ± 0.04 cm -1
dan 0.85 ± 0.02 cm-1 masing-masing. Keputusan ini menunjukkan bahawa gel polimer
MAGIC adalah setara dengan air. Data yang didapati dari gel yang disinari menunjukkan
wujudnya hubungan linear antara koefisien pengecilan linear dan dos bagi julat 2 ke 40 Gy.
Protokol pengimej an CT untuk menghasilkan imej gel disinari yang paling berkualiti telah
ditentukan bagi mendapatkan nilai dos. Gel disinari yang diletakkan di dalam fantom silinder
mengandungi air diimbas dengan menggunakan parameter imbasan yang sedia ada (kV, rnA,
dan 'reconstruction algorithm') dengan keluasan medan 25 x 25 cm2 dan ketebalan hirisan
5mm.
xv
Nisbah isyarat terhadap hingar (SNR) dan sisihan piawai (SD) adalah parameter yang dipilih
untuk menentukan kualiti imej selepas proses pemurataan imej dilakukan. Imej yang paling
berkualiti ialah imej yang mempunyai SNR tertinggi dan SD terendah dan parameter
imbasan yang sejajar digunakan sebagai protokol untuk mengimbas gel dipersinarkan.
Protokol imbasan dimana parameter imbasannya adalah 140 kV dan 400 rnA dengan
ketebalan hirisan 5 mm, masa dedahan 1000 ms, 'standard reconstruction algorithm' dan
dengan keluasan medan 25 x 25 cm2 menhasilkan imej yang paling berkualiti. Protokol
imbasan ini digunakan untuk mengambil imej gel MAGIC disinari dengan pelbagai dos
untuk menentukan hubungan antara purata nombor CT dan dos. Di dapati hubungan antara
nombor purata CT dan dos adalah linear antara 2 - 40 Gy di mana nombor CT (HU) -dos
sensitiviti adalah 0.30 ± 0.02 HU Gil. Bagi mengesahkan kegunaan gel dosimetri
berasaskan CT untuk mengukur dos, peratusan dos kedalaman (PDD) dan lengkung isodos
(profil alur) bagi alur foton berukuran 8 x 8 cm2 dari pemecut linear 6 MY diukur.
Pebandingan dibuat antara PDD dan lengkung isodos yang telah diukur dengan apa yang
telah dikira di dalam air menggunakan komputer perancangan rawatan radioterapi (TPS).
Ketidakakuran PDD gel disinari berbanding TPS pada kedalaman 5 cm dan 10 cm adalah
masing-masing ±1.8% dan ±2.1 %. Maksimum ketidakakuran PDD gel disinari berbanding
dengan kiraan TPS di dalam air adalah ±3 %. Maksimum ketidakakuran lengkung isodos gel
berbanding dengan kiraaan TPS di dalam air pada kedalaman 5 cm dan 10 cm adalah
masing-masing ±10% dan 11.6%.
Kesimpulannya, keputusan menunjukkan bahawa sistem dosimetri gel MAGIC berasaskan
CT menggunakan pengimbas CT di HUSM boleh menentukan dos foton bertenaga tinggi
dalam julat 2-40 Gy.
xvi
l\fAGIC rOLYMER GEL DOSIMETRY USING X-RAY COMPUTED
TOMOGRAPHY: A FEASIBILITY STUDY
ABSTRACT
The aim of this project is to carry out the feasibility study of developing MAGIC
(Methacrylic and Ascorbic acid in Gelatin Initiated by Copper) polymer gel dosimetry
system by utilising helical multislice X-ray computed tomography (CT) available in HUSM
to determine dose. The MAGIC gel was prepared based on the formulation proposed in the
literature by Fong et al. (2001) with some modifications. The characteristics of the gel were
studied for its water-equivalent properties. The mass density (P) was determined based on
Archimedes' principle. The weight fraction of elemental composition and the effective
atomic number (Zeff) were calculated. The electron density was also measured with 90 degree
scattering angle at room temperature. The linear attenuation coefficient (j1) of unirradiated
gel, irradiated gel, and water were determined using Am-241 based on narrow beam
geometry. The measured linear attenuation coefficient of unirradiated MAGIC gel and water
was found to be 0.84 ± 0.04 cm- I and 0.85 ± 0.02 cm- I respectively. The results showed that
the MAGIC gel is water-equivalent. The data obtained using irradiated gel showed a linear
relationship between linear attenuation coefficient and absorbed dose in the range 2 to 40 Gy.
The protocol for CT imaging to obtain the best quality image of irradiated MAGIC gel was
determined for evaluating dose information. The irradiated gel placed inside the cylindrical
water phantom was scanned using various available scan parameters (kV, rnA and
reconstruction algorithm) with the field of view 25 x 25 cm2 and 5 mm slice thickness.
XVll
The signal to noise ratio (SNR) and standard deviation (SD) were the parameters chosen to
determine the image quality after image averaging process was carried out. The image which
has the highest SNR and lowest SD was the best quality image and the corresponding scan
parameters were used as our protocol for scanning the irradiated gel. The scan parameters of
140 kV and 400 rnA with 5 rom slice thickness: 1000 ms exposure time, standard
reconstruction algorithm and 25 x 25 cm2 field of view were chosen as scanning protocol.
Using this scanning protocol, the irradiated MAGIC gels of different doses were imaged to
establish relation between average CT numbers and doses. A linear relation was found
between average CT numbers and doses in the range of 2-40 Gy with CT number (HU)-dose
sensitivity of 0.30 ± 0.02 HU Gil. In order to verify the usefulness of the CT based gel
dosimetry to measure dose, the percentage depth dose (PPD) and isodose curve (beam
profile) of 8 x 8cm2 field size photon beam from 6 MV linear accelerator were measured.
The measured PDD and isodose curves were compared with that calculated in water using
radiotherapy treatment planning computer system (TPS). The disagreement of irradiated gel
PDD compare to TPS at 5 cm and 10 cm depth were found to be ±1.8%, ±2.1 % respectively.
The maximum disagreement of gel PDD compare to TPS calculation in the water was ±3%.
The maximum disagreement of gel isodose curves compare to TPS calculation in the water at
5 cm and 10 cm measurements were ±10%, ±11.6% respectively. The results show that the
CT based MAGIC gel dosimetry system using HUSM CT scanner could determine the dose
of high energy photon in the range 2-40 Gy.
xviii

CHAPTER ONE
INTRODUCTION
Introduction
1.1 Deposition and Measurement of Dose
In radiotherapy dose may be deposited by electrons, y-rays, X-rays, protons, neutrons and a
number of other heavy charged particles. These particles are classed as ionizing radiation,
which is any radiation that has the ability to ionize atoms of the matter through which it
passes. The minimum energy required to eject an electron from an atom is approximately 4
eV. Therefore, any particle that possesses kinetic energy greater than 4 eV is considered to
be an "ionizing radiation". Similarly, photons whose energies are greater than 4 eV can be
considered to be "ionizing radiation". Ionizing radiation can be further sub-divided into two
groups: directly and indirectly ionizing radiation. Charged particles are considered to be
directly ionizing radiation since they have the ability to disrupt the atomic structure through
which they travel and produce chemical and biological changes. Conversely, X-rays and y
rays are classified as indirectly ionizing radiation because they do not directly cause
biological and chemical damage, but they can produce charged particles that will in turn
produce damage.
1.1.1 Interaction of ionizing radiation with the matter
Dose is deposited through the interactions of ionizing radiation with matter. A brief
discussion will be provided on the mechanisms of interaction for both indirectly and
directly ionizing radiation with matter.
1
1.1.1.1 Interactions of Indirectly Ionizing Radiation with Matter
In radiological physics there are three main types of interactions of 'Y-ray and X-ray photons
with matter that have to be considered. These are the Compton effect, the Photoelectric
effect and pair production.
These three interactions result in the transfer and deposition of energy to the medium. The
cross section of any interaction is a measure of the probability of that interaction occurring.
Each of these interactions, by way of its cross section, contributes to the coefficients of
mass attenuation (j1/p), mass-energy transfer (j1t!p), and mass-energy absorption (j1en/P)
coefficients. These interactions will be discussed in more detail below.
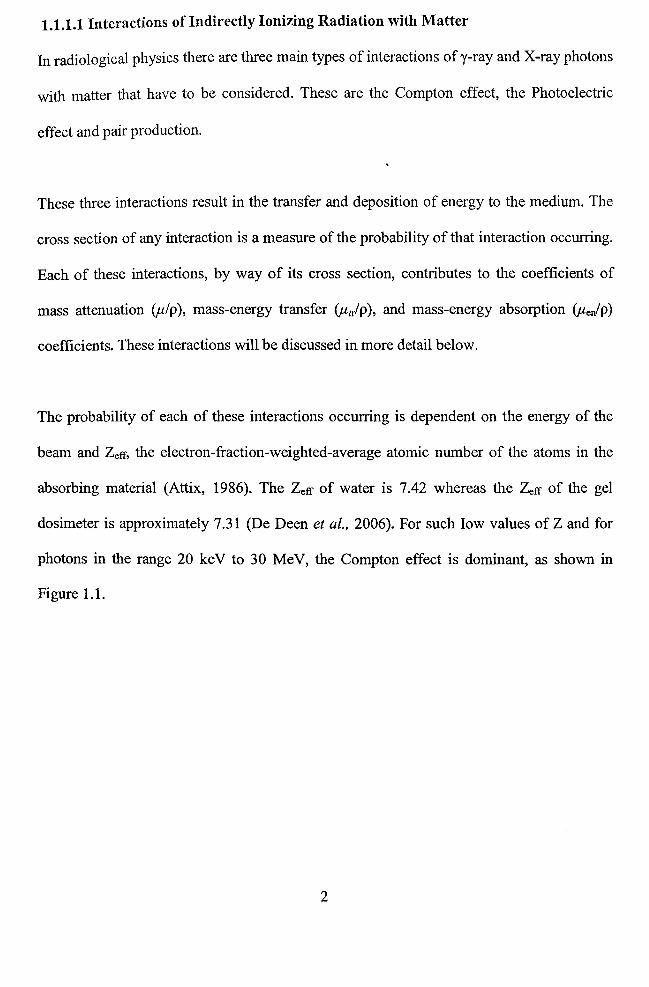
The probability of each of these interactions occurring is dependent on the energy of the
beam and Zeff, the electron-fraction-weighted-average atomic number of the atoms in the
absorbing material (Attix, 1986). The Zeff of water is 7.42 whereas the Zeff of the gel
dosimeter is approximately 7.31 (De Deen et al., 2006). For such low values of Z and for
photons in the range 20 keV to 30 MeV, the Compton effect is dominant, as shown in
Figure 1.1.
2
12Q
110
lQO
I to Pbi:>toelcetri<: tll¢ct to cfominmt
~ 70
~ 10 0
SO N 040
30
2D ~df'ea doaliDaDt
to
0.1 • 10 tOO
Photon Energy in MeV
Figure 1.1. A diagram representing the relative importance of the three main interactions in radiological physics, the Compton effect, photoelectric effect and pair production. The curve on the left hand-side indicates where the photoelectric mass attenuation coefficient, "TIp, equals the Compton mass attenuation coefficient,G/p .Similarly, the right hand-side curve is where the Compton mass attenuation coefficient, G/p, equals the pair production mass attenuation coefficient, kip (adapted from Attix, 1986)
1.1.1.1(a) The Compton Effect
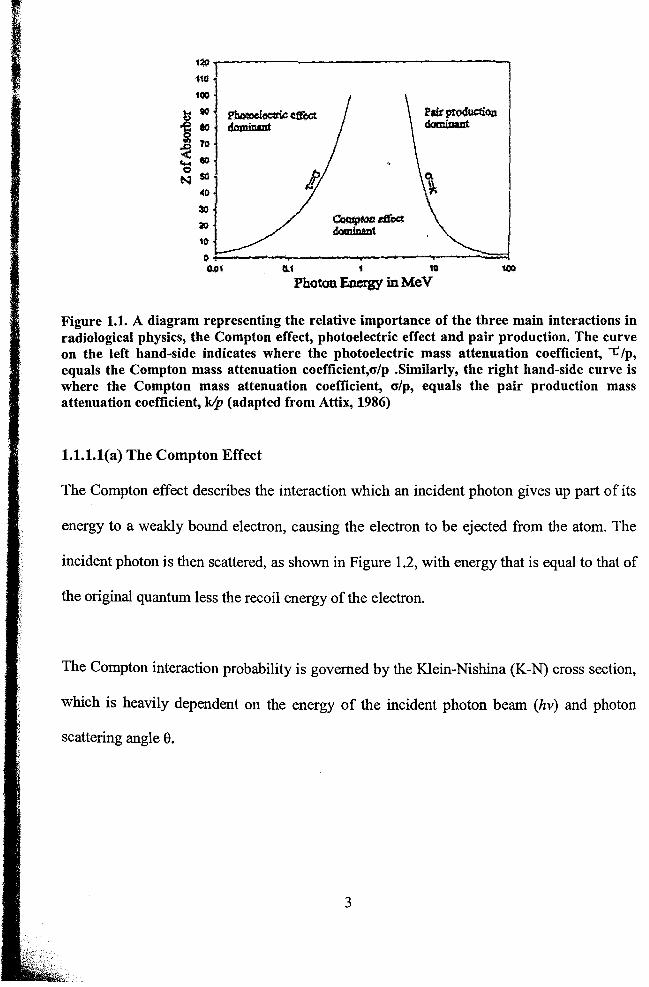
The Compton effect describes the interaction which an incident photon gives up part of its
energy to a weakly bound electron, causing the electron to be ejected from the atom. The
incident photon is then scattered, as shown in Figure 1.2, with energy that is equal to that of
the original quantum less the recoil energy of the electron.
The Compton interaction probability is governed by the Klein-Nishina (K-N) cross section,
which is heavily dependent on the energy of the incident photon beam (hv) and photon
scattering angle e.
3
The Compton mass attenuation coefficient, <J/p, is given by:
-.!L = ~ e<J ............... (1.1) P A
Where NA is Avogadro's number, A is the average mass number of the nuclei in the
material, Z is the average atomic number, and e<J is the total K-N cross section per electron.
The energy transfer coefficient, (<Jtr/p), describes the amount of energy that is transferred to
the recoil electron. This term is determined from a modification of the differential K-N
cross section and yields (e<Jtr!p), the K-N energy-transfer coefficient. The Compton mass
energy transfer coefficient can now be written as:
Q... = ~ e<J tr •••••••••••••••••• (1.2) P A
Figure 1.2. A schematic diagram of the Compton effect An incident with moment, Po strikes a stationary electron which then recoils with momentum P2. The scattered photon dep~rts with
momentum Pl(Attix, 1986)
4
1.1. 1.1 (b) The Photoelectric Effect
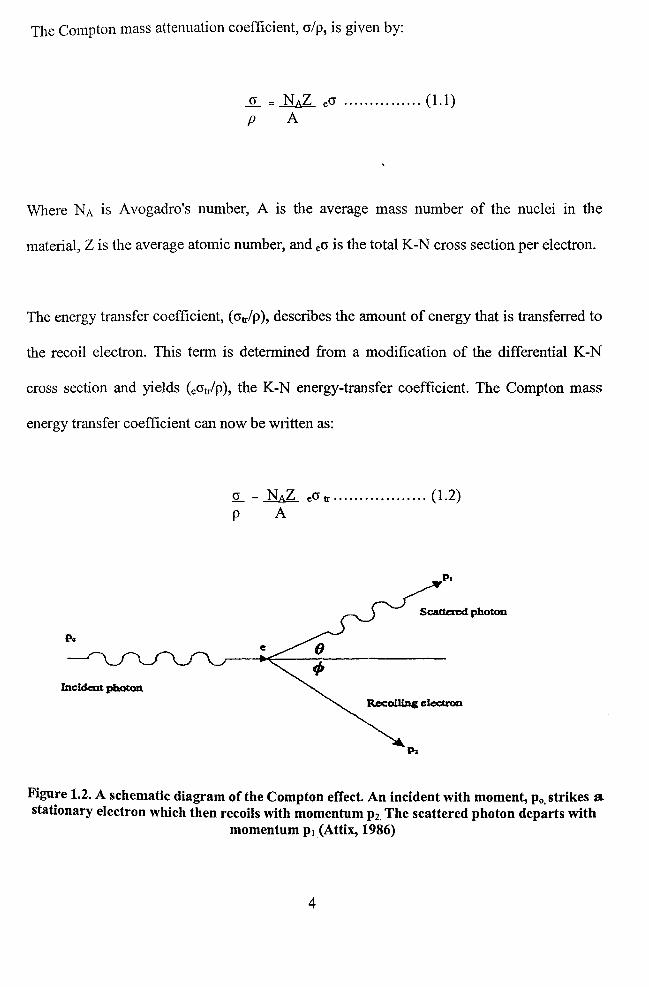
The photoelectric effect describes the interaction that occurs when an incident photon
relinquishes all of its energy to an atomic electron. The electron atomic subsequently
ejected from the atom, as shown in Figure 1.3. The energy of the electron is that of the
incident photon minus the binding energy of the electron.
The cross section for the photoelectric effect is not easily derived and most tables consist of
values obtained from experimental data. In the energy region in which the photoelectric
effect is dominant, that is for energies less than about 0.1 MeV.
The photoelectric mass attenuation coefficient, 'tIp, is found to be proportional to
(Zlh v) 3, i.e.:
't/pU(Zlhv)3 ................... (1.3)
where hv is the energy of the incident photon.
Atom
Photoelectron
Figure 1.3 The photoelectric effect (William, 2005)
5
, ...... . I I
1.1.1.1(c) Pair Production
For water equivalent material and for photons whose energy is greater than 1.02 MeV, there
is a probability that the photon will be completely absorbed through the mechanism of pair
production. Pair production occurs when a photon passes near the nucleus of an atom and is
subject to strong nuclear fields. The photon may suddenly disappear and emerge as a
positron-electron pair, as shown in Figure 1.4. Charge is conserved because the lepton pair
has opposite charges. Any energy in excess of 1.02 MeV is shared between the pair. Energy
and momentum cannot be conserved simultaneously.
Therefore, when discussing the production of a positron-electron pair, only energy IS
conserved and when one includes the nucleus into the system, only momentum IS
conserved. The probability of pair production occurring, measured by the pair production
coefficient, K, is proportional to Z2 per atom or to Z per electron or per gram.
Incident Photon
+ e
Figure 1.4 Schematic of pair production. An incident photon, passing through the Coulomb force field of an atomic nucleus, vanishes giving rise to a positron
electron pair (Khan, 1994)
6
I
I 1.1.1.2 Interactions of Directly Ionizing Radiation with Matter
Unlike indirectly ionizing radiation, the chance of interactions of charged particles
occurring with matter is considerably greater due to the Coulomb-force field that surrounds
the particles. A charged particle will interact with the electrons and nuclei of atom in the
immediate in its path. With each of these interactions, only a fraction of the charged
particle's initial kinetic energy is relinquished, and the particle therefore interacts with
many atoms before coming to rest. The term path- length describes the length of the path
that these particles take through matter. Another term, range, describes the expected
distance that these particles will travel before eventually coming to rest. Because of the
nature of these particles, their paths are not usually straight, and not even identical particles
will follow the same path. For electrons, especially, since their mass is quite small, there is
a considerable amount of scattering within the medium.
The interactions of charged particles with matter can be divided into three main categories:
soft collisions, hard collisions, and coulomb-force interactions with the external nuclear
field. These three interactions are incorporated into the expression for the mass stopping
power, used to describe the rate at which energy is lost per unit length: (dT / pdx) Y, T, Z;
Y, T, Z signifying that it is heavily dependent on the type of particle, Y, the particle's
kinetic energy, T, and the Z of the material. The mass stopping power is usually measured
in MeV cm2g"1.
7
The mass stopping power is usually further divided into the mass collision stopping power,
subscript c, and the mass radiative stopping power, sUbscript r :
(.!!L) ::: (.!!.) + (.!.!....) pdx pdx c pdt r
.~ .............. (1.4)
The mass radiative stopping power describes the rate at which bremsstrahlung is produced
by electrons and positrons. Bremsstrahiungs, also known as braking radiation, are X-rays
produced as the electron or positron decelerates (Attix 1986). Only electrons and positrons
produce bremsstrahlung due to their small mass. The mass radiative stopping power term is
essentially 'Zero for other charged particles. So-called soft collisions occur when the closest
distance of approach, or the impact parameter, is several atomic radii or greater. In this
interaction the Coulomb force field of the charged particle affects the atom as a whole. The
consequence is that the atom is either excited to a higher energy level or becomes ionized
through the ejection of a valence electron. Only a small fraction of the charged particle's
energy is transferred to the absorbing matter in a single interaction. But because large
numbers of such interactions occur, they account for more than half of the energy
transferred to the absorbing matter.
8
Hard collisions, also known as "knock-on" collisions, occur with the electrons in an atom
when the impact parameter of the particles is on the order of the atomic radius. These
electrons are ejected from their orbits with a considerable amount of energy. These ejected
electrons are called delta rays (8-rays). Also, characteristic X-rays and/or Auger electrons
can be produced if the ejected electron originates from an inner shell. The fraction of
energy dissipated via this interaction is comparable to that of the soft collision interactions,
even though its probability is much less than that of soft collisions.
\\Then a charged particle approaches the nucleus of an atom, the particle is scattered either
elastically, resulting in no energy loss, or inelastically, resulting in the ejection of an X-ray
photon. This interaction occurs most frequently with electrons. Due to the high percentage
of the interactions that result in elastic scattering, the electrons follow very tortuous paths.
This tendency increases with large Z and causes substantial backscattering. When the
interaction results in inelastic scattering, which occur a very small percentage of the time, a
significant amount of energy is given up which results in the production of bremsstrahlung.
9
1.2 Measurement of Dose
The traditional dosimeters used to measure dose distributions include ionization chamber,
diode, film, and thermoluminescent dosimeter (TLD). They will be reviewed in this section.
An overview of the various dosimetry techniques can also be found in the literature (Attix
et aI., 1986, 10hns and Cunningham, 1983).
1.2.1 Ionization Chamber
The ionization chamber is a highly precise dosimeter that is widely used in the field of
radiotherapy. The chamber consists of a gas, usually air, and two electrodes which are
responsible for collecting the ions created in the gas. The traditional ionization chamber is
the thimble chamber, which has a central electrode surrounded by wall material. The
molecules of the gas are ionized by an incoming radiation beam. Ion pairs arise from this
ionization, the positive ions being collected on the negative electrode and the negative ions
being collected on the positive electrode. The amount of charge collected is proportional to
the amount of radiation that is imparted. A voltage is the order of a few hundred unit must
be applied across the electrodes in order for the ion pairs to be collected, due to the
tendency of the ion pairs to recombine when there is little or no voltage.
10
The efficiency of the dosimeter increases as the amount of recombination decreases. The
amount of charge produced by the chamber is proportional to the energy absorbed in the
chamber. Over a 'wide range of photo/electron energies, the ratio of energy per unit charge,
known as (W/e), is found experimentally to be 33.97 J C 1 in air. This allows for accurate
measurement of dose. An added advantage of this dosimeter is that air cavity is nearly
tissue equivalent. This does not suggest that corrections for air cavities such as those found
in the human body should be ignored because the size of the ionization chamber air cavity
is small. 0.1 - 0.3 cm3, and therefore is said not to disrupt the photon fluency in the
medium.
For use of these chambers at high energies, a build-up cap is placed over the chamber.
Made out of material that is similar to tissue, this build-up cap aid in the establishment of
electronic equilibrium, the thickness of the build-up cap depends on the energy of the
incident beam. Ionization chambers are used as the "standard" against which most other
dosimetry techniques are calibrated.
1.2.2 Thermoluminescent Dosimeters
Thennoluminescent dosimeters, TLDs, are mainly composed of lithium fluoride in two
major fonns: powder and shaped solids. At the atomic level, the lithium fluoride atoms
fonn a crystalline pattern which is called a crystal lattice. The electrons are shared in this
lattice pattern, and when exposed to irradiation the electrons move from their atomic
location to locations called traps, where they remain trapped until the dosimeter is heated.
When the electrons are released through the heating process, they travel to the conduction
band and then fall to their lattice ground states, emitting light.
11
This light is measured by a photomultiplier tube in units of electric charge and is
proportional to the amount of radiation that was absorbed, expressed in cGy. TLDs may be
reused but at the cost of losing the infonnation; consequently, they can only be read out
once. Benefits of TLDs are that they are nearly independent of dose-rate and have a wide
dynamic range. Also Lif TLDs nearly tissue equivalent. For patient monitoring III
Radiotherapy, the typical size of a TLD shaped into a chip is 3 mm x 3 mm x 112 mm.
1.2.3 Film
Film, also known as photographic emulsions, consists of microscopic grains of silver
bromide dispersed in a gelatin layer on either or both sides of a supporting film. The
reaction that takes place when a beam is incident on film is that Ag + ions are converted to
Ag atoms. A latent image is produced and now the film is ready to be developed. During
the developing process all remaining ions are reduced to silver atoms and the bromine is
removed. The grains that have the latent image will have the ions reduced more rapidly.
What is left is opaque silver that can be measured optically. Optical density (OD) is the
parameter obtained from the transmission of light through the film and which is related to
dose. Some advantages of film are that it has good spatial resolution, is dose-rate
independent, and is easily obtained commercially.
Some major disadvantages of film are that it has a strong dependence on the incident
energy due the high Z of the material, the film batch and the processor. The high Z of film
increases the probability of photoelectric absorption occurring at low energies.
Furthennore, air gaps can arise when placing film in a phantom and cause inaccuracies in
measuring dose.
12
1.2.4 Diodes
Diodes, also known as semiConductor dosimeters, are solid state devices that measure dose
and dose rate. The most common diodes used are silicon diodes with p-i-n junctions. The p
region is where holes are located, the i region is called the intrinsic region, and the n region
is where excess electrons are located.
The diode is used either in a reversed-bias or an unbiased state. The incident radiation
creates electron-hole pairs. The electrons are then elevated to the conduction band while the
holes are left in the valence band. The resulting current which is related to the dose rate is
measured by an electrometer. The signal that is produced when the radiation is applied is
approximately 10 this greater than that produced in an ion chamber. This is due to the small
amount of energy required to produce an ion pair (W/e), the high density of the material
and high atomic number (Z).
Unfortunately, like film, diodes have energy dependence and therefore must be calibrated
against an ion chamber. The advantages of diodes are that they have good spatial resolution
and like TLDs can be placed on the skin of patients to measure localized surface doses. But
unlike TLDs, diodes are able to read and display the dose in real time. These detectors can
be used for both photons and electrons, but there is a different design for the two types of
radiation fields. For electrons, the p-type diode, where the holes are the majority carrier and
dominate the electrical conductivity, is used in dosimetry (Attix, 1986).
13
1.3 Gel Dosimetry
Modem radiotherapy tec1miques such as confonnal radiotherapy (stereotactic radiosurgery,
stereotactic radiotherapy and intensity modulated radiotherapy (IMRT)) are designed to
deliver highly confonnal radiation doses to tumours whilst sparing nearby sensitive tissues
from overly large doses. These procedure require complicated dose calculation based on
imaging data and the treatment planing computer alogrithms. To verify the accuracy of
these techniques the three dimensional (3D) radiation dose distribution must be measured
before treatment. Dosimeters such as ionization chambers and thennoluminescent devices
have limitations in that they only measure the dose at a point, and radiographic films could
only measure a 2 dimensional (2D) dose distribution.
Recently the polymer gel dosimetry has been shown to have potential in giving three
dimensioned dose infonnation with sub-mm spatial resolution. Gel dosimeters consist of a
gel infused with radiation sensitive materials. After irradiation a measurable change is
induced in the active materials which are held in position by the gel matrix, thus preserving
a spatial record of the irradiation.
The gel usually consists of water mixed with a gelling agent such as gelatin, agarose or
polyvinyl alcohol (PV A). Not only are they a 3D dosimeter, but the dosimeter itself is
shown to be tissue equivalent phantom and hence does not perturb the dose distribution
resulting in more accurate radiation dose distribution measurement. Because gels are
manufactured as a liquid they could be poured into containers of varying shape for
dosimetry purposes.
14
The biggest challenge in gel dosimetry at present is to extract dose information from the
irradiated gel dosimeter. Various methods have been proposed to extract the dose
distribution from in'adiated polymer gel including megnatic resonance imaging (MRI)
(Maryanski et al., 1994a), optical computed tomography (OCT) (Gore et al., 1996,
Maryanski et al., 1996), Raman spectroscopy (Baldock et a!., 1998a), X-ray computed
tomography (CT) (Hilts et al., 2000) and ultrasound (US) (Mather et al., 2002b).
1.3.1 Historical Overview of gel dosimeter
Since 1984 there has been a proliferation of research into gel dosimetry from groups
throughout the world. In 1999 the First International Workshop on Radiation Therapy Gel
Dosimetry (DOSGEL'99) took place in Lexington, USA and in 2001 the 2nd International
Conference on Radiation Gel Dosimetry took place in Brisbane, Australia. A third
conference has been in 2004 at the International Atomic Energy Agency in Vienna, Austria.
The 4th International conference on radiotherapy Gel dosimeter has been in 2006 at Ghent
University in Ghent, Belgium.
Radiation-sensitive gels were first developed in the 1950s when Day and Stein investigated
a color change upon irradiation of a gel containing Folin's phenol (Day et al., 1950). It was
later observed that irradiation induces polymerization in crystalline acrylamide (Mesrobian
et aI., 1954). In 1957, Andrews et a1. made measurements of photon and electron depth
doses using Fricke and agarose gel (Andrews et al., 1957). Later studies were done which
utilized Fricke solutions and gels, and in 1958, Hoecker and Watkins studied an alternative
method. This method was based on radiation-induced polymerization in monomer and gel
solution (MeJury et al., 2000).
15
1.3.1.1 Frick gel
The proposed method uses the Fricke ferrous sulphate chemical dosimeter solution (Fricke
et al., 1927). The conversion of ferrous (Fe2+) to ferric ions by ionizing radiation alters the
magnetic moment of the metal ion. As a result, the spin relaxation times (Tl and T2) of the
hydrogen nuclei in the aqueous gel are reduced. To 'obtain a gel, gelatin, agarose and
sephadex G-200 were used as gelling substances (Gore et al., 1984; Hiraoka et al., 1986).
Several basic experimental studies were performed on Fricke gels investigating the etIect of
the gelling substances and the relation between dose and sensitivity of ferrous sulphate
concentration (Hazle et al., 1991; Olsson et al., 1992a) and the relaxation mechanism at
different field strengths (Rousseau el at., 1994; Duzenli et al., 1994). It was shown that
adding a metal ion indicator such as xylenol orange induces color changes in the gel upon
irradiation enabling the gel to be scanned optically (Appleby et al., 1991). From theoretical
considerations, it is shown that the Fricke gels (agarose, gelatin and xylenol doped gels) are
water equivalent in the therapy range of electron and photon energies (Kron et al., 1994;
Chan et al., 1995).
A limitation in Fricke gel dosimeters is that the ferric ions diffuse throughout the gel
leading to degradation in spatial dose information within hours of irradiation (Olsson et at.,
1992b). In 1993 and 1994 Maryanski et al. published two papers reporting investigation of
a gel infused with radiation sensitive polymers which give rise to an MRl signal after
irradiation, and which does not suffer the diffusion problems of Fricke gel dosimeters
(Maryanski el al., 1993, 1994b).
16
1.3.1.2 Polymer Gel Dosimeters
polymer gel dosimeters consist of monomers mixed into a gel solution. The most widely
used monomer to date has been Acrylamide (AA) mixed with the cross linker N,N'
methylene-bis-acrylamide (BIS) (Maryanski et aI., 1993) although other chemicals have
been used such as I-vinyl-2-pyrrolidinone (Pappas et al.,1999) and 2-Hydroxyethylacrylate
(HEA) (Lepage et ai.,2001a).
Upon irradiation free radicals released during the radiolysis of the water within the gel
initiate polymerization and cross-linking of the monomers. The amount of free radicals
released is proportional to the dose received by the gel dosimeter and the resultant amount
of polymer formed is therefore also proportional to dose until an upper limit is reached.
After the upper dose limit is reached consumption of monomers results in a saturation
effect (Baldock et ai., 1998a).
Oxygen is an efficient scavenger of free radicals and must be removed from polymer gel
dosimeters prior to irradiation or the polymerization process will be inhibited (De Deene et
ai., 2001; Salomons et aI., 2002).This results in the requirement for specialized equipment,
manufacturing procedures and post-manufacture handling and has been a disadvantage of
using polymer gel dosimeters.
17
production of polymer gel dosimeters is achieved either by sealing the chemicals in mixing
flasks and flushing the gel and flask with nitrogen followed by pumping the gel from the
preparation flask into the phantom (Maryanski et aI., 1994a; Baldock et al., 1998b), or by
enclosing the chemicals and phantom in a glovebox flushed with nitrogen or argon and
completely preparing the polymer gel dosimeter within:
Mixing procedures for gelatin gels normally involve soaking the gelatin in water and
heating to approximately 50°C under continual stirring followed by adding the monomers
and stirring until they are dissolved (Baldock et aI., 1998b). For agarose gels the same
procedures are followed however the water and agarose mixture is heated to above 90°C to
allow the agarose to mix with the water and the solution is then cooled to 50°C before
adding the monomers. After the gel dosimeter is mixed it is poured into a phantom before
gelation occurs.
After a polymer gel dosimeter is manufactured it must remain oxygen free until it is
irradiated and polymerization has occurred. Phantom wall materials must therefore have a
low permeability to oxygen. Plastic and Perspex phantoms show signs that oxygen can
penetrate into the gel and degrade the dose information (Maryanski et ai., 1994a) whereas
glass and Barex (BP Chemicals) have shown to have low oxygen permeability for the
purposes of polymer gel dosimetry (Bonnett et ai., 1999; Baldock et ai., 1996).
18
Although these polymer gel dosimeters above have been validated in some clinical
applications, their use in the clinic has been limited. One of the reasons is the laborious
manufacturing process especially due to the procedure of avoiding oxygen to infiltrate the
gel. Attempts have been made to decrease the sensitivity to oxygen by binding the oxygen
in metallo-organic complexes. Although some oxygen effects may still be encountered,
these new normoxic gels are very promising as gel dosimeters, the first normoxic gel,
known by the name MAGIC gel (Fong et aI., 2001).
Based on the recommendation from previous works (De Deen et ai., 2002a; Venning et aI.,
2005) the characteristics of good polymer gel as dosimetry are:
1. It must be tissue or water equivalent, as the dosimeter itself must not perturb the dose
distribution.
2. It must have a linear dose response over a clinically useful range.
3. The dosimeter must be stable for a sufficiently long period to enable irradiation and
dose analysis.
4. The dosimeter must remam stable during shipment, unaffected by a variety of
environmental conditions throughout the analysis period.
6. It must be no toxicity in polymer gel.
19
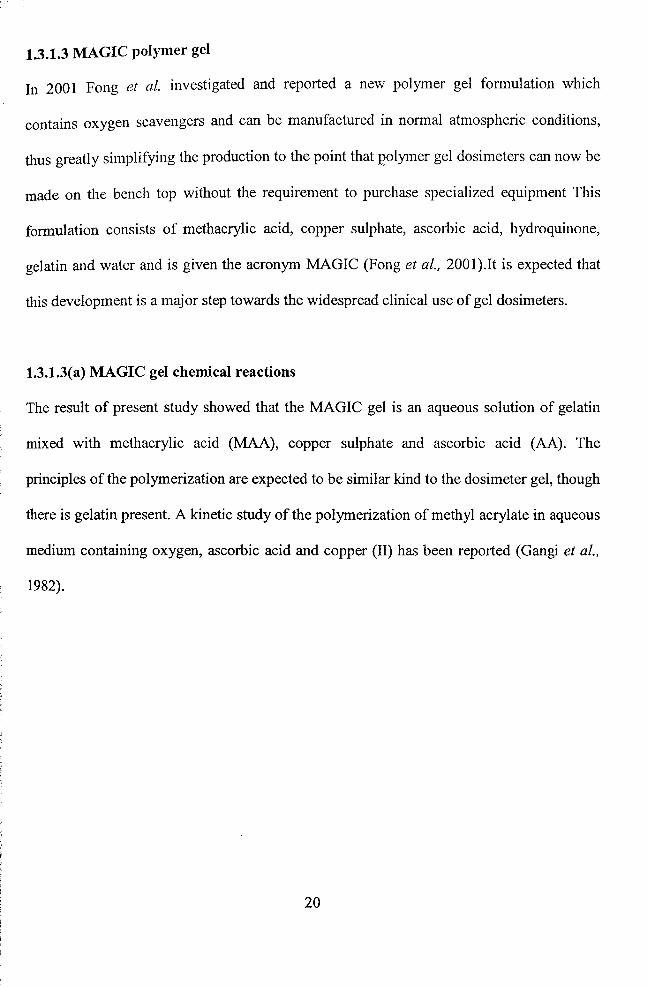
1.3.1.3 MAGIC polymer gel
In 2001 Fong et at. investigated and reported a new polymer gel fonnulation which
contains oxygen scavengers and can be manufactured in nonnal atmospheric conditions,
thus greatly simplifying the production to the point that p'olymer gel dosimeters can now be
made on the bench top without the requirement to purchase specialized equipment This
fonnulation consists of methacrylic acid, copper sulphate, ascorbic acid, hydroquinone,
gelatin and water and is given the acronym MAGIC (Fong et al., 2001).1t is expected that
this development is a major step towards the widespread clinical use of gel dosimeters.
1.3.1.3(a) MAGIC gel chemical reactions
The result of present study showed that the MAGIC gel is an aqueous solution of gelatin
mixed with methacrylic acid (MAA), copper sulphate and ascorbic acid (AA). The
principles of the polymerization are expected to be similar kind to the dosimeter gel, though
there is gelatin present. A kinetic study of the polymerization of methyl acrylate in aqueous
medium containing oxygen, ascorbic acid and copper (II) has been reported (Gangi et al.,
1982).
20
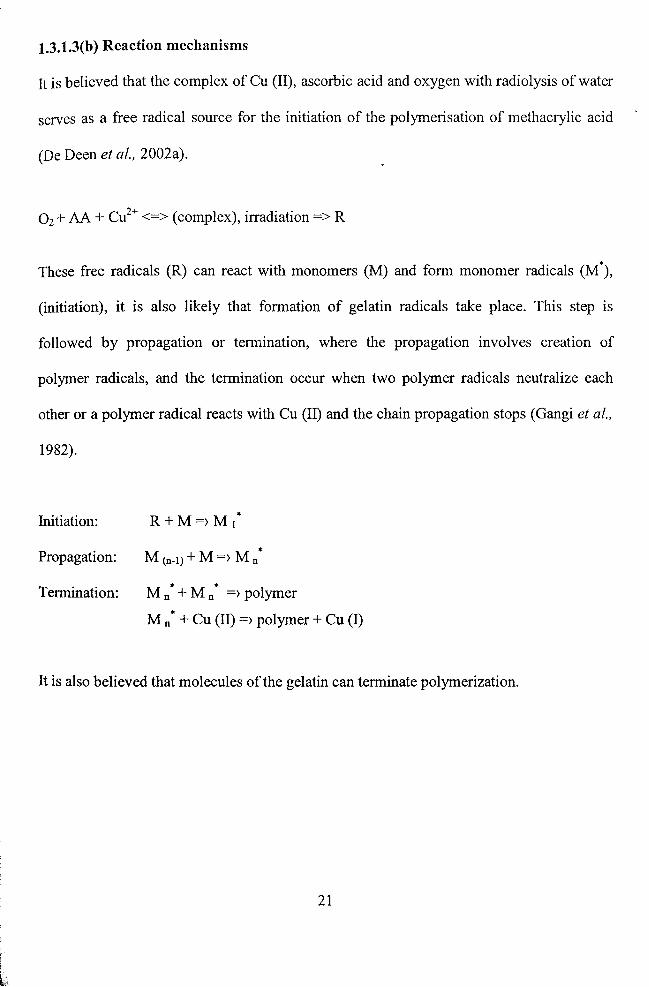
1.3.1.3(b) Reaction mechanisms
It is believed that the complex of Cu (II), ascorbic acid and oxygen with radiolysis of water
serves as a free radical source for the initiation of the polymerisation of methacrylic acid
(De Deen et at., 2002a).
O2 + AA + Cu2+ <=> (complex), irradiation => R
These free radicals (R) can react with monomers (M) and form monomer radicals (M*),
(initiation), it is also likely that formation of gelatin radicals take place. This step is
followed by propagation or termination, where the propagation involves creation of
polymer radicals, and the termination occur when two polymer radicals neutralize each
other or a polymer radical reacts with Cu (II) and the chain propagation stops (Gangi et at.,
1982).
Initiation: R+M=) M 1*
Propagation: M (n-I) + M =) M n*
Termination: M n· + M n· =) polymer
M n· + Cu (II) =) polymer + Cu (I)
It is also believed that molecules of the gelatin can terminate polymerization.
21
1.4 Imaging of the polymer gel dosimeter
One of the factors impeding the routine use of polymer gel dosimeters clinically has been
the difficulty involved in extracting accurate dose information through medical imaging
techniques. There are a number of methods used t~ extract dose information from gel
dosimeters.
1.4.1 MR relaxation time imaging
The main imaging modality of choice to date has been magnetic resonance imaging (MRI)
(Fong et at., 2001; De Deene et al., 2002a; De Deene et al., 2002b; Gustavsson et aI., 2003;
Scheib et at.,2004; Amin et al., 2004; Gear et al.,2006).
MRI allows the measurement of the longitudinal and transverse relaxation rates (Rl and
R2) of the dosimeter gels, from which dose maps can be calculated. Conventionally, the
corresponding relaxation times (Tl and T2) are measured, from which the rates can be
computed. Relaxation times are measured by applying radio frequency (RF) pulses to excite
the magnetization of the spin system, and then sampling during the return to equilibrium.
The transverse relaxation time T2 (=11R2) is measured by fitting data collected from at
least two points on the transverse relaxation curve following excitation. Two main
approaches to data collection are used (a) Single echo or Hahn spin echo sequence method.
(b) Multiple spin echo method (Baustert et aI., 2000). MRI was the method used by
Maryanski et al. (1994b) and has resulted in the most research activity to date. The amount
of polymerization is related to the absorbed dose (Maryanski et aI., 1996).
22
The transverse relaxation time, 12 is temperature sensitive, which means that polymer gel
dosimeters evaluated by this method must be brought to a stable temperature prior to
imaging (Maryanski et a!., 1997). Temperature drift in the polymer gel dosimeter during
imaging can cause a change in 12 (De Deene and De Wagter, 1999). Also the image plane
inhomogeneities and lengthy imaging times are included in the current limitations of MRI
(Oldham et a!., 2001).
1.4.2 Optical CT imaging (OCT)
Much research effort is being conducted into developing alternative methods to image the
dose distribution recorded in gel dosimeters. Techniques are being investigated to find
imaging techniques with less inherent noise than MRI and to eliminate reliance on MR
technology with its associated issues of limited access and high scanning cost (Oldham et
al.,2001).
Polymer gels can be easily visualized upon irradiation due to their opalescent appearance as
the radiation dose increases (Oldham et al., 2001, 2003). Qualitative testing can thus be
done by visual inspection or through the use of an optical densitometer (Maryanski et al.,
1996; Rae et a!., 1996). MeJury et al. (2000) performed an investigation that utilized
optical scanning as an imaging technique. Due to the increase in opacity of the gel upon
irradiation, they determined that it is possible to use the optical scanning technique to
generate a two-dimensional dose distribution. Light attenuation was found to be related to
polymer density and thus absorbed dose, with the understanding that light within a BANG-
1 gel is scattered rather than absorbed by the polymer particles.
23
Oldham et al. (2001) performed a study on the effectiveness of gel dosimetry and optical
CT (computerized tomography) scanning as a verification method for complex radiosurgery
deliveries and by extension IMRT deliveries. As the laser was stepped in increments of 1
rom across the flask, horizontal line scans were tak~n. A total of 100 projections were
acquired which corresponded to 180 degrees of projection data. The paper demonstrated
that the optical-CT scanning method for BANG-3 gels yielded 2D dose distribution with
good resolution.
The major applications of dosimetry using OCT have been for brachytherapy. External
beam treatments on large samples represent a challenge for the OCT method because of the
large pathlengths through the sample. This results in considerable signal attenuation,
requiring a high sensitivity and dynamic range in the detector (Doran et ai., 2001).
1.4.3 Ultrasound
Mather et ai. (2001, 2002a) showed that ultrasound could be used to investigate changes in
irradiated PAG polymer gels. In these studies, acoustic speed of propagation, attenuation
and transmitted signal intensity showed a strong variation with absorbed dose indicating the
potential of this technique.
Comparative studies of PAG and MAGIC polymer gels indicated that differences in
acoustic properties with absorbed dose were due to differences in the elastic modulus of the
materials (Mather et ai., 2002b). Further acoustic studies showed that the overall acoustic
attenuation, dose sensitivity and dynamic range were dependant on dosimeter formulation
(Mather et ai., 2003a).
24