Embed Size (px)
Citation preview

DETERMINATION OF THALLIUM BY VOLATILE COMPOUND GENERATION ATOMIC ABSORPTION SPECTROMETRY
A THESIS SUBMITTED TO THE GRADUATE SCHOOL OF NATURAL AND APPLIED SCIENCES
OF MIDDLE EAST TECHNICAL UNIVERSITY
BY
SEVAL ATAMAN
IN PARTIAL FULFILLMENT OF THE REQUIREMENTS FOR
THE DEGREE OF MASTER OF SCIENCE IN
CHEMISTRY
SEPTEMBER 2011

Approval of the Thesis;
DETERMINATION OF THALLIUM BY VOLATILE COMPOUND GENERATION ATOMIC ABSORPTION SPECTROMETRY
Submitted by SEVAL ATAMAN in a partial fulfillment of the requirements for the degree of Master of Science in Chemistry Department, Middle East Technical University by Prof. Dr. Canan Özgen Dean, Graduate School of Natural and Applied Sciences Prof. Dr. İlker Özkan Head of Department, Chemistry Prof Dr. O. Yavuz Ataman Supervisor, Chemistry Department, METU Examining Committee Members:
Date: 09.09.2011
Prof. Dr. E. Hale Göktürk Chemistry Department, METU
Prof. Dr. O. Yavuz Ataman Chemistry Department, METU
Prof. Dr. Ali Gökmen Chemistry Department, METU
Prof. Dr. Nusret Ertaş Faculty of Pharmacy, Gazi University
Assoc. Prof. Dr. Uğur Tamer Faculty of Pharmacy, Gazi University

iii
I hereby declare that all information in this document has been obtained and presented in accordance with academic rules and ethical conduct. I also declare that, as required by these rules and conduct, I have fully cited and referenced all material and results that are not original to this work.
Name, Last name: Seval Ataman
Signature

iv
ABSTRACT
DETERMINATION OF THALLIUM BY VOLATILE COMPOUND GENERATION ATOMIC
ABSORPTION SPECTROMETRY
Ataman, Seval
M.Sc., Department of Chemistry
Supervisor: Prof. Dr. O. Yavuz Ataman
September 2011, 69 pages
Determination of thallium is important due to its toxic effects on the
environment and human health. Extremely low abundance of thallium in earth
crust requires very sensitive and accurate methods for determination of this
element. Although volatile compound generation is a sensitive, fast and
economical method, thallium determination by this method has not been
sufficiently investigated in literature, because of the fact that the formation of
volatile forms of this element is a difficult task.
A continuous flow volatile compound generation system was developed and
parameters that affect the analytical signal were optimized. Sample solutions
were acidified with 0.5 mol/L HNO3 and prepared in 0.0005% (v/v) rhodamine B
and 1.0 mg/L Pd while 0.5% (m/v) NaBH4 stabilized in 0.5% (m/v) NaOH was used
as reductant. Fast decomposition and unstability of thallium volatile species
affected system performance negatively.
Flow injection volatile compound generation studies were carried out with a
special system. After optimizations, LOD and LOQ values were calculated as 12

v
ng/mL and 40 ng/mL according to peak height values in HNO3 medium. Similarly,
in HCl medium LOD and LOQ values were calculated as 14 ng/mL and 45 ng/mL.
Addition of Te and Pd to the sample solution containing co-enhancement
reagent rhodamine B improved volatile compound generation efficiency in peak
height by 3.6 and 9.3, respectively. Type of the acid used was affected peak
heights and peak shapes of Tl+ and Tl3+ volatile species and HNO3 medium gave
better results.
By changing the location of introduction for Ar gas, the sources of memory
effects and reasons of peak broadening were investigated. Most of the memory
effects were coming from the gas-liquid separator (GLS) or before the GLS, as
well as T-tube atomizer.
Nature and behavior of Tl volatile species were also investigated and it was
found that Tl and also Pd were generated in the form of nanoparticles.
Transmission electron microscopic (TEM) measurements prove the presence of
Tl nanoparticles in the analyte species transported to the atomizer by the effect
of carrier Ar gas.
Keywords: Thallium, volatile compound generation, enhancement reagent,
memory effect, atomic absorption spectrometry

vi
ÖZ
UÇUCU BİLEŞİK OLUŞTURMALI ATOMİK ABSORPSİYON SPEKTROMETRE İLE
TALYUM ELEMENTİNİN TAYİNİ
Ataman, Seval
Yüksek Lisans, Kimya Bölümü
Tez Yöneticisi: Prof. Dr. O. Yavuz Ataman
Eylül 2011, 69 sayfa
Çevreye ve insan sağlığı üzerindeki toksik etkileri nedeniyle talyum elementinin
tayini çok önemlidir. Doğada eser derişimlerde bulunan talyum elementinin
tayini çok hassas ve doğru yöntemlerin kullanılmasını gerektirmektedir. Uçucu
bileşik oluşturmalı atomik absorpsiyon spektrometri kolay, duyarlı ve ekonomik
bir yöntem olmasına rağmen talyum tayininde fazla kullanılmamaktadır; bunun
nedeni ise talyum için uçucu türleri oluşturmanın zor bir işlem olmasıdır.
Öncelikle sürekli akış uçucu bileşik oluşturmalı bir sistem geliştirilmiş ve analitik
sinyali etkileyen parametreler optimize edilmiştir. Örnek çözeltiler 0.5 mol/L
HNO3, 0.0005% (v/v) rodamin B ve 1.0 mg/L Pd içerisinde hazırlanmıştır; 0.5%
(m/v) NaOH içerisinde stabilize edilmiş NaBH4 ise indirgeyici çözelti olarak
kullanılmıştır. Kararsız ve hızlıca bozunan talyum uçucu türleri sistemin
performansını olumsuz yönde etkilemiştir.
Akışa enjeksiyonlu uçucu bileşik oluşturma çalışmaları özel tasarlanmış bir
sistemde yürütülmüştür. Gerekli parametrelerin optimizasyonlarından sonra
HNO3 ortamındaki gözlenebilme ve tayin sınırları sinyal yüksekliğine göre sırasıyla

vii
12 ng/mL ve 40 ng/mL olarak hesaplanmıştır. Benzer şekilde HCl ortamındaki
gözlenebilme ve tayin sınırları 14 ng/mL ve 45 ng/mL olarak hesaplanmıştır.
Yardımcı reaktif olarak kullanılan rodamin B içeren örnek çözeltiye Te ve Pd
elementlerinin eklenmesi uçucu bileşik oluşturma verimliliğini sırasıyla 3.6 ve 9.3
oranlarında arttırmıştır. Kullanılan asit türünün Tl+ ve Tl3+ uçucu türleri için sinyal
şekli ve yüksekliğini etkilediği belirlenmiş ve HNO3 içinde hazırlanmış
çözeltilerden daha iyi sonuçlar elde edilmiştir.
Ar gazının sisteme giriş noktası değiştirilerek pik genişlemesi ve hafıza etkisinin
sebepleri araştırılmıştır. Çalışmalar sonucunda T- tüp atomlaştırıcının da etkisi
olmasına rağmen hafıza etkisinin büyük oranda gaz sıvı ayırıcı (GLS) ve
öncesinden kaynaklandığı belirlenmiştir.
Tl uçucu türleri ve onların davranışlarının araştırıldığı çalışmada Tl ve Pd
elementlerinin nano tanecikler halinde oluştuğu belirlenmiştir. Geçirmeli
electron mikroskobu (TEM) ölçümleri Ar gazının yardımıyla atomlaştırıcıya
taşınan türlerin Tl nano tanecikleri olduğunu kanıtlamıştır.
Anahtar Kelimeler: Talyum, uçucu bileşik oluşturma, yardımcı reaktif, hafıza
etkisi, atomik absorpsiyon spektrometri

viii
To My Family

ix
ACKNOWLEDGEMENTS
I would like to express my gratitude to my supervisor Prof. Dr. O. Yavuz Ataman
not only for his guidance, support, encouragement, patience and for teaching us
how to become a good scientist but also for listening and helping us in many
ways.
I would like to thank to Yasin Arslan for his ideas, constructive comments,
guidance and contribution in each part of this study.
I am deeply grateful to Damla Parlar, Aida Nurioğlu, İlkem Evcimen and Erhan
Özdemir for their endless help in my work, support and friendship.
I should also thank to Sezgin Bakırdere and all Ataman Research Group members
for their understanding, patience, friendship and moral support.
Finally, my special appreciation and gratitude is devoted to my family for their
trust, patience and moral support which makes everything possible.

x
TABLE OF CONTENTS
ABSTRACT ................................................................................................................ iv
ÖZ ............................................................................................................................ vi
ACKNOWLEDGEMENTS ........................................................................................... ix
TABLE OF CONTENTS ................................................................................................ x
LIST OF TABLES ....................................................................................................... xii
LIST OF FIGURES .................................................................................................... xiii
LIST OF ABBREVIATIONS....................................................................................... xvii
CHAPTERS ................................................................................................................ 1
1. INTRODUCTION ............................................................................................... 1
1.1 Thallium ................................................................................................... 1
1.1.1 Occurrence and Production .............................................................. 2
1.1.2 Industrial Usage................................................................................. 3
1.1.3 Thallium and Health Effects .............................................................. 3
1.2 Atomic Absorption Spectrometry (AAS) ................................................. 4
1.2.1 Flame Atomic Absorption Spectrometry (FAAS) .............................. 5
1.2.2 Electrothermal Atomic Absorption Spectrometry (ETAAS) .............. 6
1.3 Volatile Compound Generation Atomic Absorption Spectrometry (VCGAAS) ............................................................................................................. 7
1.3.1 Hydride Generation Atomic Absorption Spectrometry (HGAAS) ..... 8
1.4 Systems for Hydride Generation ........................................................... 13
1.4.1 Batch Systems ................................................................................. 13
1.4.2 Flow Systems ................................................................................... 14
1.4.2.1 Continuous Flow Systems ..................................................... 15
1.4.2.2 Flow Injection Systems .......................................................... 15
1.5 Determination of Thallium .................................................................... 16
1.6 Aim of the Study .................................................................................... 18
2 EXPERIMENTAL .............................................................................................. 19

xi
2.1 Chemicals and Reagents ....................................................................... 19
2.2 Atomic Absorption Spectrometer ......................................................... 20
2.3 Continuous Flow Volatile Compound Generation System ................... 21
2.4 Flow Injection Volatile Compound Generation System ........................ 23
2.5 Procedures ............................................................................................ 25
2.5.1 Continuous Flow Volatile Compound Generation .......................... 25
2.5.2 Flow Injection Volatile Compound Generation .............................. 26
3 RESULTS AND DISCUSSION ............................................................................ 27
3.1 Continuous Flow Volatile Compound Generation System ................... 28
3.1.1 Optimization of NaBH4 and Sample Solution Flow Rates ............... 28
3.1.2 Optimization of Ar Flow Rate .......................................................... 30
3.1.3 Optimization of NaBH4 Concentration ............................................ 31
3.1.4 Optimization of HNO3 Concentration ............................................. 33
3.1.5 Results from Continuous Flow VCG System .................................... 35
3.2 Flow Injection Volatile Compound Generation System ........................ 36
3.2.1 Optimization of Ar Flow Rate .......................................................... 36
3.2.2 Optimization of NaBH4 and HCl Concentrations ............................. 38
3.2.3 Optimization of NaBH4 and Carrier Solution Flow Rates ................ 40
3.2.4 Optimization of Rhodamine B Concentration ................................. 41
3.2.5 Optimization of Sample Loop Volume ............................................ 43
3.2.6 Effect of HCl and HNO3 on VCG Efficiency of Tl+ and Tl3+ ............... 44
3.2.7 Effects of Enhancement Reagents .................................................. 47
3.2.8 Linear Ranges and Calibration Plots ................................................ 50
3.3 Reasons of Peak Broadening ................................................................. 55
3.4 Thallium Volatile Species ...................................................................... 58
4 CONCLUSIONS ............................................................................................... 64
REFERENCES .......................................................................................................... 66

xii
LIST OF TABLES
TABLES
Table 1 Chemical Vapor Generation in AAS (Tsalev, 1999). 8 Table 2 Molecular formulas and physical properties of some hydrides (Dědina & Tsalev, 1995). 10 Table 3 Operating conditions of AA spectrometer 20 Table 4 Optimized parameters for continuous flow volatile compound generation system. 36 Table 5 Analytical figures of merit of flow injection VCGAAS system. 52 Table 6 The comparison of characteristic mass and characteristic concentrations of the studies. 53 Table 7 Optimized parameters of flow injection VCGAAS system. 54 Table 8 Characteristic concentrations and enhancement factors of Pd and Te. 55

xiii
LIST OF FIGURES
FIGURES
Figure 1 Experimental setup designed by Kirchhoff and Bunsen for the investigation of line reversal in the sodium spectrum (Welz & Sperling, 1999). ... 4
Figure 2 Stages of hydride generation causing several interferences (Kumar & Riyazuddin, 2010). ................................................................................................. 12
Figure 3 Schematic representation of hydride generation using batch system (Dědina & Tsalev, 1995). ....................................................................................... 14
Figure 4 Schematic representation of the continuous flow volatile compound generation system. ................................................................................................ 21
Figure 5 Schematic representation of GLS used in continuous flow system. ....... 22
Figure 6 Schematic representation of externally heated quartz tube atomizer. . 23
Figure 7 Schematic representation of the flow injection volatile compound generation system. ................................................................................................ 24
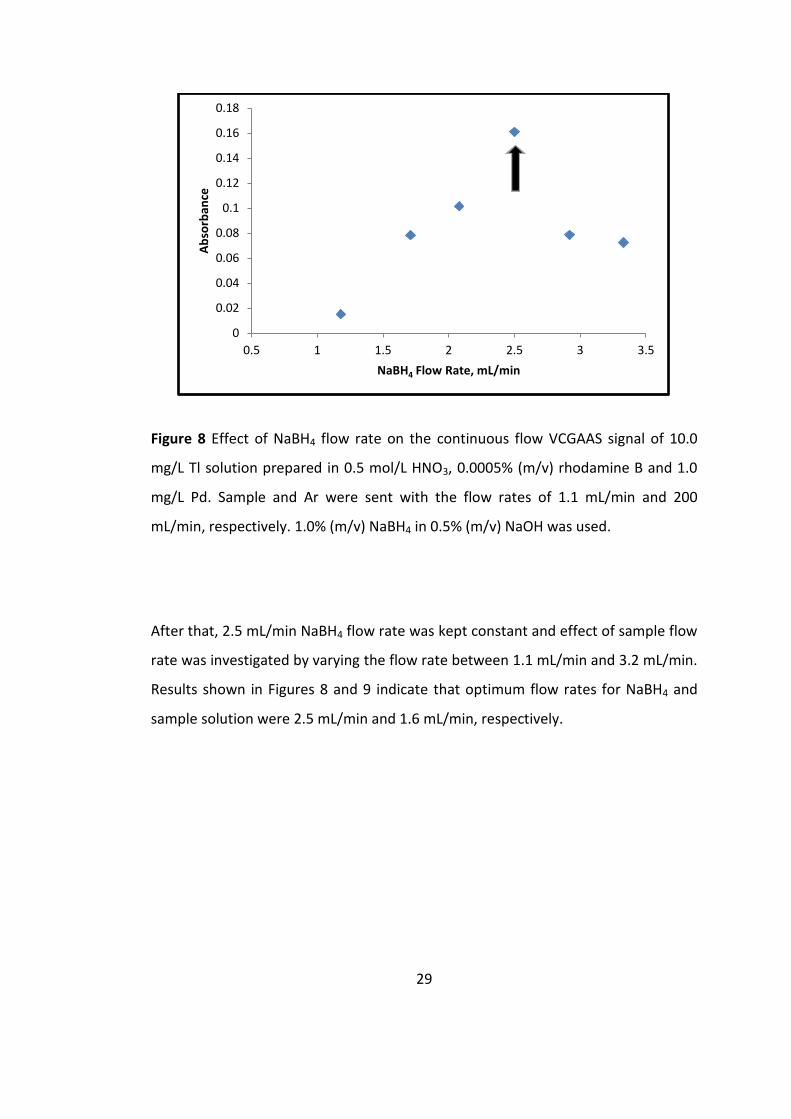
Figure 8 Effect of NaBH4 flow rate on the continuous flow VCGAAS signal of 10.0 mg/L Tl solution prepared in 0.5 mol/L HNO3, 0.0005% (m/v) rhodamine B and 1.0 mg/L Pd. Sample and Ar were sent with the flow rates of 1.1 mL/min and 200 mL/min, respectively. 1.0% (m/v) NaBH4 in 0.5% (m/v) NaOH was used. ........... 29
Figure 9 Effect of sample flow rate on the continuous flow VCGAAS signal of 10.0 mg/L Tl solution prepared in 0.5 mol/L HNO3, 0.0005% (m/v) rhodamine B and 1.0 mg/L Pd. 1.0% (m/v) NaBH4 in 0.5% (m/v) NaOH was used with a flow rate of 2.5 mL/min. Ar flow rate was set as 200 mL/min. ................................................ 30
Figure 10 Effect of Ar flow rate on the continuous flow VCGAAS signal of 10.0 mg/L Tl solution prepared in 0.5 mol/L HNO3, 0.0005% (m/v) rhodamine B and 1.0 mg/L Pd. Sample flow rate was 1.6 mL/min. 1.0% (m/v) NaBH4 in 0.5% (m/v) NaOH was used with a flow rate of 2.5 mL/min. .................................................. 31
Figure 11 Effect of NaBH4 concentration on the continuous flow VCGAAS signal of 10.0 mg/L Tl solution prepared in 0.5 mol/L HNO3, 0.0005% (m/v) rhodamine B and 1.0 mg/L Pd. 50.0 mL/min Ar flow rate was used. Sample and NaBH4 flow rates were set as 1.6 mL/min and 2.5 mL/min, respectively. NaBH4 solutions were stabilized in 0.5% (m/v) NaOH. ............................................................................. 32
Figure 12 Effect of NaBH4 concentration on the continuous flow VCGAAS signal of 1.0 mg/L Tl solution prepared in 0.5 mol/L HNO3, 0.0005% (m/v) rhodamine B and 1.0 mg/L Pd. 50.0 mL/min Ar flow rate was used. Sample and NaBH4 flow rates were set as 1.6 mL/min and 2.5 mL/min, respectively. NaBH4 solutions were stabilized in 0.5% (m/v) NaOH. ............................................................................. 33

xiv
Figure 13 Effect of HNO3 concentration on the continuous flow VCGAAS signal of 1.0 mg/L Tl solution prepared in 0.0005% (m/v) rhodamine B and 1.0 mg/L Pd. 50.0 mL/min Ar flow rate was used. 6.0% (m/v) NaBH4 solution was stabilized in 0.5% (m/v) NaOH. NaBH4 and acidified sample solution were sent with the flow rates of 2.5 mL/min and 1.6 mL/min, respectively. .............................................. 35
Figure 14 Effect of Ar flow rate on the flow injection VCGAAS signal of 1.0 mg/L Tl solution prepared in 0.5 mol/L HCl, 0.0005% (m/v) rhodamine B and 1.0 mg/L Pd. Carrier solution and 3.0% (m/v) NaBH4 stabilized in 0.5% (m/v) NaOH were sent with the flow rate of 0.8 mL/min. 100 µL loop volume was used for sample introduction. ......................................................................................................... 37
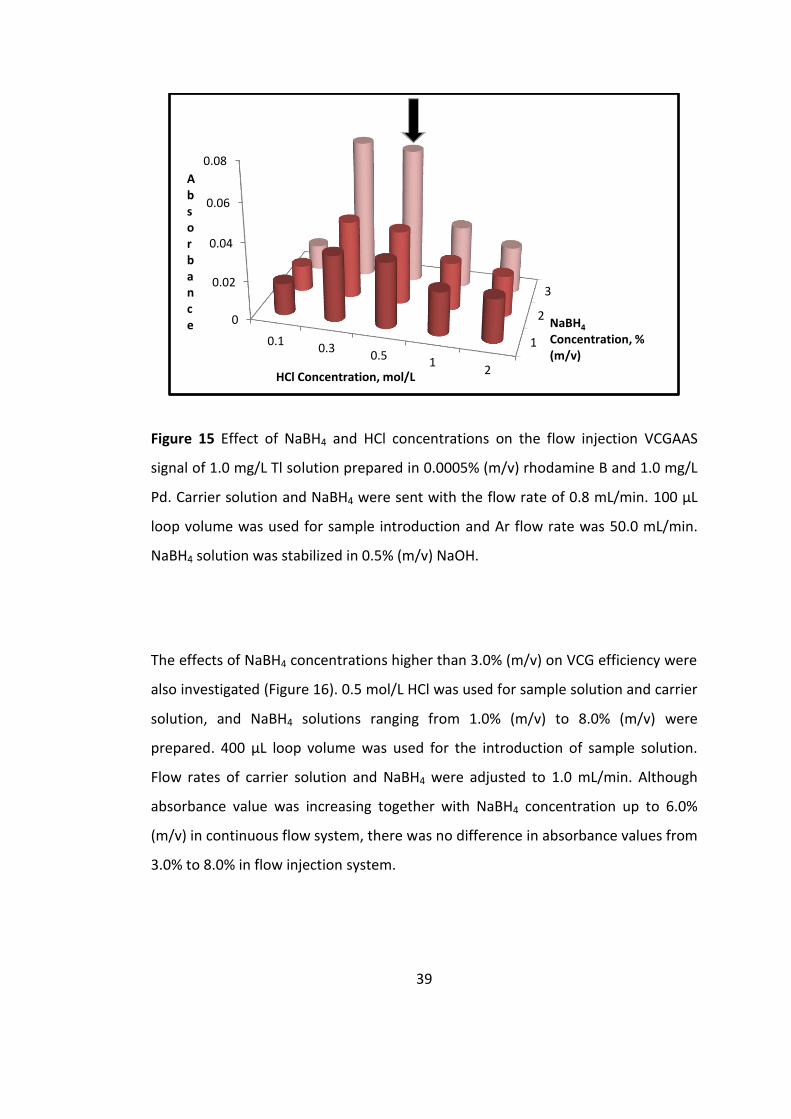
Figure 15 Effect of NaBH4 and HCl concentrations on the flow injection VCGAAS signal of 1.0 mg/L Tl solution prepared in 0.0005% (m/v) rhodamine B and 1.0 mg/L Pd. Carrier solution and NaBH4 were sent with the flow rate of 0.8 mL/min. 100 µL loop volume was used for sample introduction and Ar flow rate was 50.0 mL/min. NaBH4 solution was stabilized in 0.5% (m/v) NaOH. .............................. 39
Figure 16 Effect of NaBH4 on the flow injection VCGAAS signal of 1.0 mg/L Tl solution prepared in 0.0005% (m/v) rhodamine B, 0.5 mol/L HCl and 1.0 mg/L Pd. Carrier solution and NaBH4 were sent with the flow rate of 0.8 mL/min. 400 µL loop volume was used for sample introduction and Ar flow rate was set as 50.0 mL/min. NaBH4 solution was stabilized in 0.5% (m/v) NaOH. .............................. 40
Figure 17 Effect of NaBH4 and carrier solution flow rates on the flow injection VCGAAS signal of 1.0 mg/L Tl solution prepared in 0.0005% (m/v) rhodamine B, 0.5 mol/L HCl and 1.0 mg/L Pd. 3.0% (m/v) NaBH4 stabilized in 0.5% (m/v) NaOH was used. 100 µL loop volume was used for sample introduction and Ar flow rate was 50.0 mL/min. .................................................................................................. 41
Figure 18 Effect of rhodamine B concentration on the flow injection VCGAAS signal of 1.0 mg/L Tl solution prepared in 0.5 mol/L HCl and 1.0 mg/L Pd. Carrier solution and 3.0% (m/v) NaBH4 stabilized in 0.5% (m/v) NaOH were sent with the flow rate of 1.0 mL/min. 100 µL loop volume was used for sample introduction and Ar flow rate was 50.0 mL/min. ....................................................................... 42
Figure 19 a- Analytical signal obtained from 1.0 mg/L Tl prepared in 0.5 mol/L HCl, 0.005% (m/v) rhodamine B and 1.0 mg/L Pd. b- Analytical signal obtained from 1.0 mg/L Tl prepared in 0.5 mol/L HCl. 400 µL loop volume was used for sample introduction. ............................................................................................. 43
Figure 20 Effect of sample loop volume on the flow injection VCGAAS signal of 1.0 mg/L Tl solution prepared in 0.5 mol/L HCl, 0.005% (m/v) rhodamine B and 1.0 mg/L Pd. Carrier solution and 3.0% (m/v) NaBH4 stabilized in 0.5% (m/v) NaOH were sent with the flow rate of 1.0 mL/min. Ar flow rate was 50.0 mL/min. ............................................................................................................................... 44
Figure 21 Effects of HNO3 and HCl on the shape of VCGAAS signal of 1.0 mg/L Tl+ solution prepared in 0.005% (m/v) rhodamine B and 1.0 mg/L Pd. Acidity of the sample and carrier solution were 0.5 mol/L. Carrier solution and 3.0% (m/v) NaBH4 stabilized in 0.5% (m/v) NaOH were sent with the flow rate of 1.0 mL/min.

xv
Ar flow rate was 50.0 mL/min and 400 µL loop volume was used for sample introduction. ......................................................................................................... 45
Figure 22 Effects of HNO3 and HCl on the shape of VCGAAS signal of 1.0 mg/L Tl3+ solution prepared in 0.005% (m/v) rhodamine B and 1.0 mg/L Pd. Acidity of the sample and carrier solution were 0.5 mol/L. Carrier solution and 3.0% (m/v) NaBH4 stabilized in 0.5% (m/v) NaOH were sent with the flow rate of 1.0 mL/min. Ar flow rate was 50.0 mL/min and 400 µL loop volume was used for sample introduction. ......................................................................................................... 46
Figure 23 a- Decomposition process of sample solution prepared in HNO3. b- Sample solutions prepared in HCl and HNO3 after 30 days passed. ..................... 47
Figure 24 Effects of Pd concentration on the flow injection VCGAAS signal of 1.0 mg/L Tl+ solution prepared in 0.5 mol/L HNO3, 0.005% and (m/v) rhodamine B. Carrier solution and 3.0% (m/v) NaBH4 stabilized in 0.5% (m/v) NaOH were sent with the flow rate of 1.0 mL/min. Ar flow rate was 50.0 mL/min and 400 µL loop volume was used for sample introduction. .......................................................... 48
Figure 25 Effects of Te concentration on the flow injection VCGAAS signal of 1.0 mg/L Tl+ solution prepared in 0.5 mol/L HNO3, 0.005% and (m/v) rhodamine B. Carrier solution and 3.0% (m/v) NaBH4 stabilized in 0.5% (m/v) NaOH were sent with the flow rate of 1.0 mL/min. Ar flow rate was 50.0 mL/min and 400 µL loop volume was used for sample introduction. .......................................................... 49
Figure 26 Effects of 1.0 mg/L Pd and 8.0 mg/L Te on the shape of VGCAAS signal of 1.0 mg/L Tl+ solution prepared in 0.5 mol/L HNO3 and 0.005% (m/v) rhodamine B. Carrier solution and 3.0% (m/v) NaBH4 stabilized in 0.5% (m/v) NaOH were sent with the flow rate of 1.0 mL/min. Ar flow rate was set as 50.0 mL/min and 400 µL loop volume was used for sample introduction. .................. 50
Figure 27 Calibration data in 0.5 mol/L HNO3 and 0.5 mol/L HCl for the flow injection VCGAAS signal of 1.0 mg/L Tl+ solution prepared in 0.005% (m/v) rhodamine B and 1.0 mg/L Pd. Carrier solution and 3.0% (m/v) NaBH4 stabilized in 0.5% (m/v) NaOH were sent with the flow rate of 1.0 mL/min. Ar flow rate was set as 50.0 mL/min and 400 µL loop volume was used for sample introduction. 51
Figure 28 Linear portions of calibration plots in 0.5 mol/L HNO3 and 0.5 mol/L HCl for the flow injection VCGAAS signal of 1.0 mg/L Tl+ solution prepared in 0.005% (m/v) rhodamine B and 1.0 mg/L Pd. Carrier solution and 3.0% (m/v) NaBH4 stabilized in 0.5% (m/v) NaOH were sent with the flow rate of 1.0 mL/min. Ar flow rate was 50.0 mL/min and 400 µL loop volume was used for sample introduction. ......................................................................................................... 52
Figure 29 Analytical signal for 1.0 mg/L Tl+ solution prepared in 0.5 mol/L HNO3, 0.005% (m/v) rhodamine B and 1.0 mg/L Pd. Carrier solution and 3.0% (m/v) NaBH4 stabilized in 0.5% (m/v) NaOH were sent with the flow rate of 1.0 mL/min. Ar flow rate was set as 50.0 mL/min and 400 µL loop volume was used for sample introduction. ............................................................................................. 56
Figure 30 The positions of upstream and downstream of the GLS in flow injection VCG system. .......................................................................................................... 57

xvi
Figure 31 Effects of Ar sent from upstream and downstream of the GLS on the shape of VGCAAS signal of 1.0 mg/L Tl+ solution prepared in 0.5 mol/L HNO3, 0.005% (m/v) rhodamine B and 1.0 mg/L Pd. Carrier solution and 3.0% (m/v) NaBH4 stabilized in 0.5% (m/v) NaOH were sent with the flow rate of 1.0 mL/min. Ar flow rate was set as 50.0 mL/min and 400 µL loop volume was used for sample introduction. ............................................................................................. 58
Figure 32 0.2 µm-pore-size syringe filter placed downstream of the GLS. .......... 59
Figure 33 Analytical signal for 1.0 mg/L Tl+ solution prepared in 0.5 mol/L HCl, 0.005% (m/v) rhodamine B and 1.0 mg/L Pd when 0.2 µm-pore-size syringe filter placed downstream of the GLS. Conditions given on Table 6 were used. ........... 60
Figure 34 Analytical signal for 1.0 mg/L Sb solution prepared in 0.5 mol/L HCl when 0.2 µm-pore-size syringe filter placed downstream of the GLS. Carrier solution and 3.0% (m/v) NaBH4 stabilized in 0.5% (m/v) NaOH were sent with the flow rate of 1.0 mL/min. Ar flow rate was 50.0 mL/min and 400 µL loop volume was used for sample introduction. ....................................................................... 60
Figure 35 TEM image of thallium nanoparticles adsorbed onto carbon coated formvar film........................................................................................................... 61
Figure 36 EDS spectrum of thallium nanoparticles adsorbed onto carbon coated formvar film........................................................................................................... 62
Figure 37 TEM image of about 20 nm particle size thallium nanoparticle adsorbed onto carbon formvar film. ..................................................................................... 62
Figure 38 EDS spectrum of about 20 nm particle size thallium nanoparticle adsorbed onto carbon formvar film...................................................................... 63
Figure 39 EDS spectrum of background ................................................................ 63

xvii
LIST OF ABBREVIATIONS
AAS Atomic Absorption Spectrometry
AFS Atomic Fluorescence Spectrometry
C0 Characteristic Concentration
CHG Chemical Hydride Generation
E Enhancement Factor
ECHG Electrochemical Hydride Generation
EHQTA Externally Heated Quartz Tube Atomizer
ETAAS Electrothermal Atomic Absorption Spectrometry
FAAS Flame Atomic Absorption Spectrometry
GLS Gas Liquid Separator
GTA Graphite Tube Atomizer
HCL Hollow Cathode Lamp
HG Hydride Generation
HGAAS Hydride Generation Atomic Absorption Spectrometry
HGAFS Hydride Generation Atomic Fluorescence Spectrometry

xviii
HG-ETAAS Hydride Generation Electrothermal Atomic Absorption Spectrometry
ICPMS Inductively Coupled Plasma Mass Spectrometry
ICPOES Inductively Coupled Plasma Optical Emission Spectrometry
INAA Instrumental Neutron Activation Analysis
Id Inner Diameter
LOD Limit of Detection
LOQ Limit of Quantification
PTFE Polytetrafluoroethylene
QTA Quartz Tube Atomizer
RSD Relative Standard Deviation
VCGAAS Volatile Compound Generation Atomic Absorption Spectrometry

1
CHAPTER 1
CHAPTERS
INTRODUCTION
1. 2. INTROD 3. UCTION
1.1 Thallium
Thallium is an element with the symbol Tl, atomic number of 81, atomic mass of
204.4 g/mol, melting point of 304 oC and boiling point of 1473 oC. In 1861, thallium
was discovered by Sir William Crookes from the residues of sulfuric acid plant. The
name Thallium was originated from the Greek word thallos meaning “a green shoot
or twig” due to its green spectral line. Thallium which is grayish white metal shows
similar appearance to tin. This element is not only heavy but also soft and can be
easily cut with a knife (Blumenthal, Sellers, & Koval, 2006).
Nitric acid dissolves thallium and attacks this element considerably faster than
dilute sulfuric acid. Because of low solubility of the salt, thallium is sparingly soluble
in hydrochloric acid (Blumenthal, Sellers, & Koval, 2006).
Tl+ and Tl3+ are the two oxidation states of thallium. Stability of Tl+ in aqueous
solutions is higher; however, Tl3+ forms more stable complexes. Bioavailabity and
toxicity properties of the two oxidation states are different (Ensafı & Rezaei, 1998).
It has been stated that the lower valency state is more toxic (Ensafı & Rezaei, 1998)
and reactive than the trivalent state (Florence, 1986). Determination of Tl+ in the
environmental and biological samples is crucial since Tl+ ions exhibit more biological
activation. It has been proven that in the activation of enzymes, Tl+ can be replaced

2
with potassium ions (Hosseini, Chamsaz, Raissi, & Naseri, 2005) since it is an
analogue of potassium. The content of this element in the environment, its
speciation and circulation is important since the toxicity, adsorption and transport
properties can be affected by the redox state (Pérez-Ruiz, Martínez-Lozano, Tomás,
& Casajús, 1996). US Environmental Protection Agency introduces Thallium to the
list of 13 priority metals due to its high toxic properties (Scheckel, Lombi, Rock, &
Mclaughlin, 2004; Keith, & Telliard, 1979)
1.1.1 Occurrence and Production
The estimated abundance of thallium in the earth’s crust is 0.1-1.7 mg/kg. Sulphide
ores of zinc, copper and lead are the main sources. It is also present in granite,
shale, limestone, sandstone and coal (Kazantzis, 2000). Crookesite, lorandite and
hutchinsonite are the most notable minerals containing low concentrations of
thallium. In addition, very small quantities of this element exist in sea water and in
certain mineral waters. For this reason, it is one of the rarer metals (Anderson,
1953).
Thallium is discharged into the environment from the production of zinc, cadmium,
and lead and by combustion of coal that increase pollution levels in nature (Das,
Chakraborty, Cervera, & Guardia, 2006). Cement production and fossil combustion
stations are the principal sources that are responsible from pollution (Hosseini,
Chamsaz, Raissi, & Naseri, 2005) and people living in the vicinity of these areas are
subject to thallium poisoning.
3
1.1.2 Industrial Usage
Because of the fact that thallium is a toxic element its commercial applications are
very limited. With many metals, it forms a number of binary, ternary, and
quaternary eutectic alloys some of which have unique properties such as very low
coefficients of friction and acid resistance. In bearings and contact points Ag-Tl and
Au-Al-Tl, in the production of specific anodes Pb-Sn-Tl alloys have been used
(Blumenthal, Sellers, & Koval, 2006). Optical systems, low temperature
thermometers, dye pigments, photoelectric cells and chemical synthesis (Ensafı &
Rezaei, 1998), electrical and electronics industries, as electronic devices for semi
conductors, scintillation counters, mixed crystals for infrared instruments and laser
equipment are the main fields that thallium is used (Kazantzis, 2000).
1.1.3 Thallium and Health Effects
In spite of the fact that toxic effects of thallium were realized soon after its
discovery, there is still very little information in the literature dealing with the
prolonged exposures at low levels. It has been accepted that thallium is a
cumulative poison and it has teratogenic and mutagenic properties (Ebdon, Goodal,
Hill, Stockwell, & Thompson, 1995). As being more toxic to mammals than the
elements Hg, Cd and Pb, thallium has been stated as an important EPA priority
pollutant (Meeravali & Jiang, 2008).
Oral intake of 20-60 mg thallium/kg body weight within a week is fatal for an adult
although this dose for humans is not proved yet (Blumenthal, Sellers, & Koval,
2006). Inhalation of dust and fumes, ingestion of thallium contaminated food, and
hand or skin contact cause chronic thallium poisoning with the symptoms of
tiredness, fatique, headache and insomnia, nausea and vomiting, muscle and joint

4
pains, paraesthesia, numbness of fingers and toes (Kazantzis, 2000). In short time
exposures gastrointestinal irritation and disorders of the nervous system appears. In
the long term blood chemistry changes and also liver, kidney, intestinal and
testicular tissue are damaged (Das, Chakraborty, Cervera, & Guardia, 2006). Hair
loss and even death are also observed in prolonged and acute exposures
(Pavlíčkova, Zbíral, Smatanová, Habarta, Houserová, & Kubáň, 2006).
1.2 Atomic Absorption Spectrometry (AAS)
In the seventeenth century, history of optical spectroscopy began with the Sir Isaac
Newton who observed the splitting of sunlight into various colors when it is passed
through prism. Later, to understand the nature of light many studies have been
performed and in 1802 black lines in the sun’s spectrum were discovered by
Wollaston. Fraunhofer investigated these blank lines and attributed letters to the
strongest lines. Fraunhofer lines caused by absorption processes in the sun’s
atmosphere were later explained by Kirchhoff and Bunsen while studying on line
reversal in the spectra of alkali and alkaline-earth elements (Figure 1).
Figure 1 Experimental setup designed by Kirchhoff and Bunsen for the investigation
of line reversal in the sodium spectrum (Welz & Sperling, 1999).

5
According to the law formulated by Kirchhoff, if any material emits radiation at a
given wavelength, absorption of radiation for this material occurs in the same
wavelength (Welz & Sperling, 1999). Walsh and his colleagues developed hollow-
cathode lamps for AAS and encouraged some small companies for the production of
do-it-yourself atomic absorption spectrometers in the years between 1958 and
1962 (L'vov, 2005).
In AAS, a radiation source which emits electromagnetic radiation specific to the
analyte and an atom reservoir for introduction and atomization of the analyte are
required. Ground-state atoms of the analyte absorb the resonant radiation coming
from the radiation source and this absorption is used as the analytical signal
(Broekaert, 2005). Absorption of the electromagnetic radiation excites ground-
state atoms to higher electronic state.
Among the atomic spectroscopy methods, AAS is the most popular one. It is not
only well-established and robust method but also cheaper in terms of investment
and running costs (Dědina, 2010).
1.2.1 Flame Atomic Absorption Spectrometry (FAAS)
At the beginning years of AAS, for the atomization process flame atomizer was used
and air/acetylene flame was preferred mostly rather than nitrous oxide/acetylene.
Similarly, nebulization was a popular approach for the sample introduction
(Ataman, 2008).
The temperature of air/acetylene flame is not only high enough for sufficient
atomization but also not so high to cause significant ionization interferences. In
order to optimize the analytical conditions, composition of the burning gas mixture

6
can be changed. However, the temperature of air/acetylene flame is not enough for
the atomization of more than 30 elements such as V, Ti, Zr, Ta and the lanthanides;
nitrous oxide/acetylene flame is more suitable for these elements. Moreover, with
different temperatures, air/propane, air/hydrogen and oxygen/acetylene flames are
also available (Broekaert, 2005).
For sample introduction, FAAS is mostly applied with pneumatic nebulizers. It is
important that small droplets which are less than 10 µm in diameter must be
generated in the nebulization system and then they are transported and completely
vaporized in the flame. This enables high sensitivity and low magnitude of
volatilization of the interferences (Broekaert, 2005).
There are two important drawbacks affecting the sensitivity of FAAS. First one is
relatively low efficiency of sample introduction system with the nebulization
efficiency of 1-10%. Most of the sample is transported to the waste instead of
atomizer and this causes dilution of the analyte concentration in the measurement
zone in which the same volume is shared by source lamp beam and atoms.
Secondly, analyte atoms have very short residence time in the measurement zone
due to flame velocities and beam geometry (Ataman, 2008).
1.2.2 Electrothermal Atomic Absorption Spectrometry (ETAAS)
The drawback coming from the low transport efficiency of the pneumatic nebulizers
in FAAS has been overcome with ETAAS. In ETAAS, the sample is not transported to
the flame; rather, it is placed into a small atomizer tube which is located on the
optical path of the instrument (Bakırdere, et al., 2011). The holders in ETAAS are
usually graphite or metallic tube or cup furnaces. In this method, the sample is
heated resistively in order to atomize the sample completely (Broekaert, 2005). So

7
as to remove the solvent and contaminants before atomization, the temperature is
increased step by step. Atomization of sample which has the volume of 10-50 µL
takes place in a short time and a peak-shaped, time-dependent signal is obtained
(Welz & Sperling, 1999).
One disadvantage of ETAAS is the interferences in the atomization unit. In the
determination of the analytes presenting in a heavy matrix such as environmental
samples, interferences are the main problems that should be overcome. In addition,
temperature profile of the graphite tube atomizers is not homogeneous while
heating and the center of the tube is hotter than the edges. Inhomogeneous
atomization of the analyte atoms results with the formation of the multiple peaks
and peak broadening (Bakırdere, et al., 2011; Frech, & Baxter, 1996).
1.3 Volatile Compound Generation Atomic Absorption Spectrometry (VCGAAS)
Liquid and gaseous phase sample introduction modes are commonly used in an
atomic spectrometer. Gaseous-phase sample introduction techniques are generally
based on formation of volatile compounds which are usually generated by a
chemical reaction. In volatile compound generation technique, analyte in the liquid
sample is converted to the gaseous phase by an appropriate reaction (Dědina,
2010). Combination of AAS with volatile compound generation techniques offers
several advantages compared to conventional nebulization methods such as
improved selectivity, more efficient analyte atomization, elimination of nebulizer,
and analyte preconcentration (Arbab-Zavar, Chamsaz, Yousefi, & Ashraf, 2009).
Volatilization of the species can be performed by cold vapor, hydridization,
ethylation, propylation, halination, and photochemical vapor generation (Bakırdere,
et al., 2011). Elements determined by various chemical volatile compound

8
generation techniques are shown in Table 1 (Tsalev, 1999). Among these
techniques hydride generation has the greatest popularity.
Table 1 Chemical Vapor Generation in AAS (Tsalev, 1999).
Chemical system for vapour generation
Analytea
Hydride generation (HG)
As, Bi, Ge, (In), Pb, Sb, Se, Sn, Te, (Tl)
Cold vapour (CV) technique
Cd, Hg, (Cu?)
Ethylation
Bi, Cd, Co, Ge, Hg, Pb, Se, Sn, Tl
Butylation
Be, Ga, Hg, Pb, Sn, Zn
Carbonyl generation
Co, Fe, Ni
Chlorides
As, Bi, Cd, Ge, Mo, Pb, Sn, Tl, Zn
Fluorides
Ge, Mo, Re, U, V, W
Dithiocarbamates
Co, Cr, Cu
β-Diketonates
Al, Co, Cr, Cu, Fe, Mn, Ni, Pb, Zn
Miscellaneous VG techniques
B(CH3O)3, OsO4
aSpecies in bold itallic indicate straightforward analytical performance; species in parantheses indicate serious problems with that particular analyte.
1.3.1 Hydride Generation Atomic Absorption Spectrometry (HGAAS)
Hydride generation is defined as hydride release from the sample solution. In this
process, the analyte in an acidified sample solution is converted to hydride and
transferred to the gaseous phase. After that, released hydride is transported to the

9
atomizer by the help of carrier gas (Dědina & Tsalev, 1995). Hydride generation
technique consists of four steps:
a) Generation of the hydride
b) Collection of the hydride
c) Transfer of the hydride
d) Atomization of the hydride
Efficiency of each step affects the sensitivity of the system (Kumar & Riyazuddin,
2010). As, Pb Bi, Ge, Sn Sb, Se, and Te form analytically important hydrides and
some physical properties and hydrides of these elements are shown in Table 2
(Dědina & Tsalev, 1995).
10
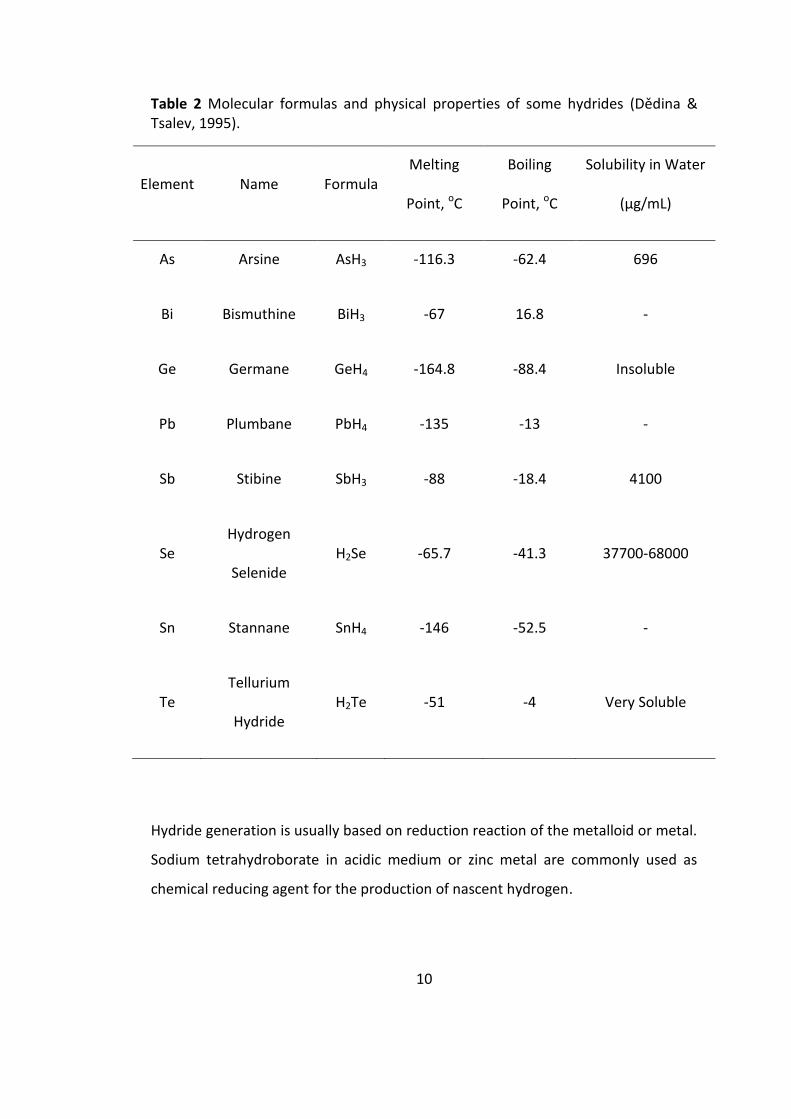
Table 2 Molecular formulas and physical properties of some hydrides (Dědina & Tsalev, 1995).
Element Name Formula Melting
Point, oC
Boiling
Point, oC
Solubility in Water
(µg/mL)
As Arsine AsH3 -116.3 -62.4 696
Bi Bismuthine BiH3 -67 16.8 -
Ge Germane GeH4 -164.8 -88.4 Insoluble
Pb Plumbane PbH4 -135 -13 -
Sb Stibine SbH3 -88 -18.4 4100
Se Hydrogen
Selenide H2Se -65.7 -41.3 37700-68000
Sn Stannane SnH4 -146 -52.5 -
Te Tellurium
Hydride H2Te -51 -4 Very Soluble
Hydride generation is usually based on reduction reaction of the metalloid or metal.
Sodium tetrahydroborate in acidic medium or zinc metal are commonly used as
chemical reducing agent for the production of nascent hydrogen.

11
Zn + 2H+ → Zn2+ + 2H
BH4- + H+ + 3H2O → H3BO3 + 8H
Am+ + (m+n) H → AHn + mH+
Nascent hydrogen plays role in metal or metalloid reduction and hydride formation
(Dědina, 2010). On the other hand, opponents of this idea claimed that nascent
hydrogen plays no role in the reduction process. In the generation process
hydrogen with no special reducing capacity is involved and generation of hydrides
can be considered as hydrogenation process (Laborda, Bolea, Baranguan, &
Castillo, 2002).
Tetrahydroborate/acid reaction is usually preferred to metal/acid reaction due to its
inherent advantages based on reaction time, reduction yield, and blank
contamination (Dědina, 2010).
Hydride generation is one of the most frequently used techniques for the
determination of trace elements mentioned above. The technique enables
speciation analysis of the hydride forming elements. In addition, separation of the
analyte from the matrix reduces interferences and also improves detection power
(Kumar & Riyazuddin, 2010). High transport efficiency and selectivity are also
important advantages. Using this technique, gas phase separation methods such as
gas chromatography can be employed in the speciation analysis of some elements
(Sturgeon, Guo, & Mester, 2005).
The steps of chemical reaction and hydride formation, separation of the volatile
compounds from the liquid solution, and atomization process are the sources of
interferences in hydride generation technique. There are four important factors
affecting significance of interferences.

12
The design of hydride generation system
Acid and reducing agent concentrations
The mixing order of reagents
Atomizer type
The main sources of these interferences are shown on Figure 2 and categorized as
gas phase and liquid phase (Kumar & Riyazuddin, 2010).
Figure 2 Stages of hydride generation causing several interferences (Kumar &
Riyazuddin, 2010).
There are some difficulties in the detection of noble and transition metals. The
nature and behavior of these elements is not clear. Because of unstability problem

13
and fast reaction conditions, mixing of the reagents and their separation must be as
fast as possible (Pohl, 2004).
1.4 Systems for Hydride Generation
There are several systems designed to determine hydride forming elements by
volatile compound generation AAS. Batch and flow systems has been frequently
used systems for this purpose.
1.4.1 Batch Systems
A glass or plastic vessel is used as the hydride generator and gas-liquid separator
(GLS) in batch systems. An example of batch generator can be seen in Figure 3.
Sample solution prepared in the acidic medium is placed inside the vessel and by
the injection of reductant solution hydrides begin to form. The carrier gas is
introduced to the system to separate volatile species from the liquid phase and to
transport these species to the atomizer used (Dědina & Tsalev, 1995).

14
Figure 3 Schematic representation of hydride generation using batch system
(Dědina & Tsalev, 1995).
The signal obtained in batch systems is proportional to the mass of the analyte in
the sample solution. With the addition of reductant solution, pH value and also
volume of hydrogen generation change with time. Changes in the hydride forming
efficiency during measurement affect the signal shape and integration will be
difficult. For this reason, using peak height measurements are generally preferred
(Welz & Sperling, 1999).
1.4.2 Flow Systems
Because of the fact that batch hydride generation systems operate manually, they
require more time and effort. The drawbacks of batch systems are eliminated in
continuous flow and flow injection systems which are automated systems. On the
contrary to the batch systems, reactions take place in the tubes and volatile species
are separated in the gas-liquid separators (Welz & Sperling, 1999).

15
1.4.2.1 Continuous Flow Systems
A constant flow of acidified sample solution, constant flow of reductant solution,
and carrier gas are mixed within the tube which is long enough to complete the
reaction. After that, the mixture is sent to the gas-liquid separator. Volatile hydride
species and carrier gas are separated from the liquid phase and transported to the
atomizer (Dědina & Tsalev, 1995).
In continuous flow systems, absorbance depends on concentration and signals
obtained are time-independent. Increasing the sample flow rate increases the
sensitivity; however, higher flow rates decrease separation and transport
efficiencies of volatile species (Welz & Sperling, 1999). Sample and reductant flow
rates, sample acidity, gas flow rate, analyte concentration and transport efficiency
are the factors affecting hydride supply function. Length of reaction coil is also
important. It should be long enough to complete the reaction properly (Dědina &
Tsalev, 1995).
The most important advantage of continuous flow systems is that reagents are
mixed with better pH control compared to batch systems. In addition when the
system reaches equilibrium, constant output signal is obtained (Campbell, 1992).
1.4.2.2 Flow Injection Systems
Working principle of flow injection systems is very similar to continuous flow
systems. The difference is that carrier solution and reductant are sent at constant
flow rates and a small volume of acidified sample solution is injected to the mixture
at regular intervals. Experimental set-up remains the same as in continuous flow
systems (Welz & Sperling, 1999).

16
In flow injection systems, a peak-shaped signal with some degree of tailing is
obtained (Broekaert, 2005). Increasing injected sample volume and decreasing flow
rate of carrier gas, in some case, help to improve the sensitivity (Dědina & Tsalev,
1995).
1.5 Determination of Thallium
Since thallium is present in samples at very low concentrations, accurate and
sensitive methods are required for the determination of low concentrations in
environmental and biological samples. Inductively coupled plasma mass
spectrometry (ICP-MS), laser-excited atomic florescence spectrometry (LEAFS),
electrothermal atomic absorption spectrometry (ETAAS), flame atomic absorption
spectrometry (FAAS), hydride generation atomic absorption spectrometry (HGAAS),
hydride generation integrated atom trap flame atomic absorption spectrometry
(HG-IAT-FAAS), flow injection hydride generation atomic absorption spectrometry
(FI-HGAAS), electrochemical hydride generation (ECHG), potentiometry and
voltammetry are usually applied for the determination of thallium.
Although ICP-MS offers sensitive results, it is an expensive analytical method due to
high running costs. There are only few studies in literature using LEAFS for
determination of thallium (Dadfarnia, Assadollahi, & Haji Shabani, 2007). ETAAS
offers several advantages such as low detection limit (LOD) and usability of low
sample volumes; however, it suffers from several interferences that make
appearance of errors inevitable (Hosseini, Chamsaz, Raissi, & Naseri, 2005). For
instance, in order to eliminate the interferences coming from the presence of
sodium chloride and iron, addition of different matrix modifiers is offered (Salvin, &
Manning, 1980; Shan, Ni, & Zhang, 1984; Vale, Silva, Welz, & Newka, 2002;
Zendelovska, & Stafilov, 2001). Stripping voltammetry is also one of the methods
17
that suffers from interferences by other metals, especially cadmium in thallium
determination despite its high sensitivity and ability to detect the redox species of
metals (Arbab-Zavar, Chamsaz, Yousefi, & Ashraf, 2009; Zen, & Wu, 1997). FAAS is
a simple and low cost method; however, in the determination of thallium low
sensitivity of this method for its trace determination at µg/L level is the main
problem. In most cases this can be handled by preconcentration (Dadfarnia,
Assadollahi, & Haji Shabani, 2007). Liquid-liquid extraction (Asami, Mizui, Shimada,
& Kubota, 1996), hydride generation (Zhu & Xu, 2000), solid phase extraction (Lin &
Nriagu, 1999) and flotation (Hosseini, Chamsaz, Raissi, & Naseri, 2005) are the
most frequently used methods for the preconcentration and separation stages.
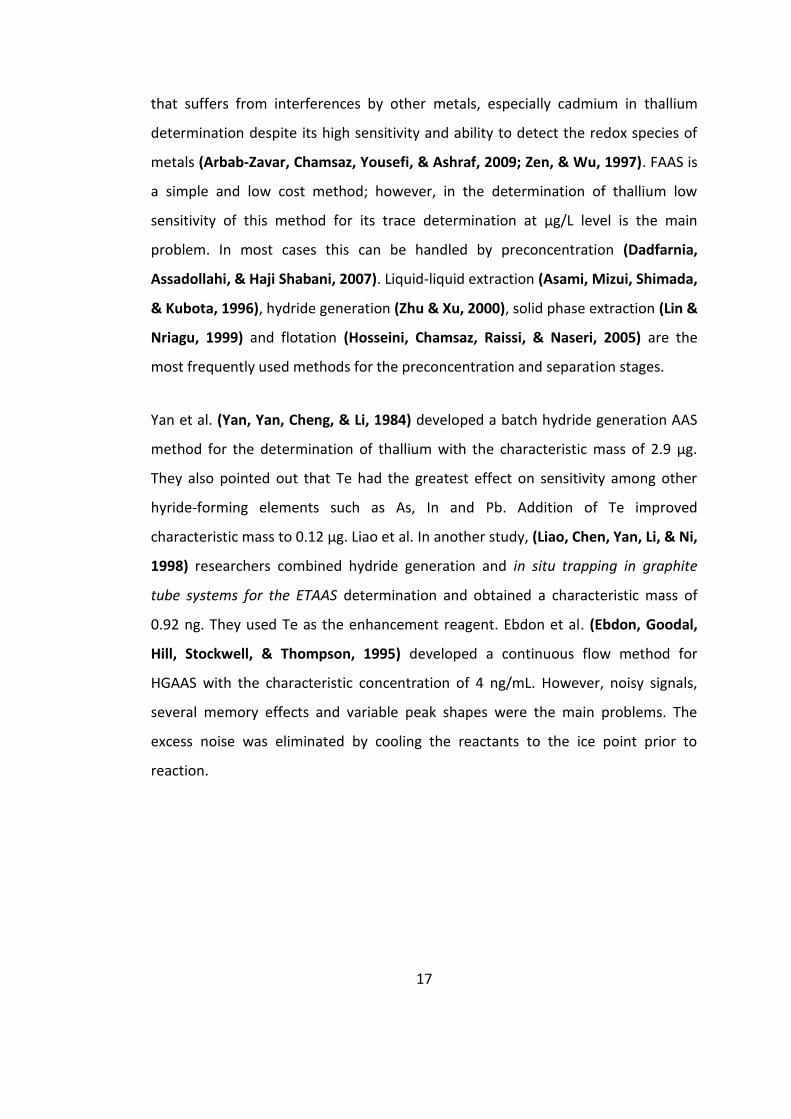
Yan et al. (Yan, Yan, Cheng, & Li, 1984) developed a batch hydride generation AAS
method for the determination of thallium with the characteristic mass of 2.9 µg.
They also pointed out that Te had the greatest effect on sensitivity among other
hyride-forming elements such as As, In and Pb. Addition of Te improved
characteristic mass to 0.12 µg. Liao et al. In another study, (Liao, Chen, Yan, Li, & Ni,
1998) researchers combined hydride generation and in situ trapping in graphite
tube systems for the ETAAS determination and obtained a characteristic mass of
0.92 ng. They used Te as the enhancement reagent. Ebdon et al. (Ebdon, Goodal,
Hill, Stockwell, & Thompson, 1995) developed a continuous flow method for
HGAAS with the characteristic concentration of 4 ng/mL. However, noisy signals,
several memory effects and variable peak shapes were the main problems. The
excess noise was eliminated by cooling the reactants to the ice point prior to
reaction.

18
1.6 Aim of the Study
Although interest in Tl determination has increased considerably in recent years,
most of the proposed methods used for this purpose lack the sensitivity required
for environmental samples. The main purpose of this study is to develop a sensitive
analytical technique for thallium determination and investigate the nature of
thallium volatile species. This will be achieved by using the advantages of flow
injection VCG method. By optimizing the parameters, quality of the analytical signal
obtained from Tl volatile species will be improved. After that, behavior and nature
of this volatile species will be examined by employing transmission electron
microscope (TEM) and energy dispersive X-ray spectrometry (EDS).

19
CHAPTER 2
2 EXPERIMENTAL
EXPERIMENTAL
2.1 Chemicals and Reagents
All reagents used during the studies were of analytical grade or higher purity. Tl
standard solutions used throughout the experiments were prepared daily by making
appropriate dilutions from the 1000 mg/L stock solutions of Tl+ and Tl3+ (High Purity,
Charleston). A 1000 mg/L Pd stock solution was prepared by dissolving solid
K2(PdCl6) in 1.0 mol/L HNO3. Working solutions of Te were prepared by making
dilutions from the 1000 mg/L stock solution of Te (Merck, Germany). Stock solution
of %0.1 (m/v) rhodamine B (Allied Chemical, Morristown) was prepared weekly in
deionized water and stored in refrigerator at dark. In order to acidify analyte
solutions, analytical grade 65% (w/w) HNO3 (Merck) and %37 (w/w) HCl (Merck,
Germany) were used. Appropriate amount of powdered proanalysis grade NaBH4
(Merck, Darmstadt, Germany) was dissolved in 0.5% NaOH (Riedel, Germany) for
the preparation of reductant solution. Solution was used directly without filtration.
Dilutions were made using 18 MΩ·cm deionized water obtained from a Millipore
(Molsheim, France) Milli-Q water purification system which was fed using the water
produced by Millipore Elix 5 electro deionization system. High purity Ar (99.999 %)
was used as carrier gas throughout the study.
All the glass and plastic apparatus were kept in 10% (v/v) HNO3 and rinsed with
deionized water before use so as to remove the all kind of contaminations; nitric

20
acid solution was prepared by 1+9 dilution of the concentrated reagent with
distilled water.
2.2 Atomic Absorption Spectrometer
For continuous flow and flow injection hydride generation studies a Varian AA140
(Victoria, Australia) atomic absorption spectrometer was used. The instrument was
equipped with a deuterium arc background correction system and 10.0 cm burner
head. Controlling and data processing was done with SpectrAA software (version
5.1). A Perkin Elmer uncoded Tl hollow cathode lamp was used as the radiation
source. The parameters of the instrument that are used in the experiments are
shown in Table 3.
Table 3 Operating conditions of AA spectrometer
Parameter Value
Measurement Wavelength, nm 276.8
Spectral Bandpass, nm
0.5
Lamp Current, mA
5.0
Flame Type
Stoichiometric Air/Acetylene
Measurement Mode Integration

21
2.3 Continuous Flow Volatile Compound Generation System
NaBH4 solution which is used as reductant and acidified sample solution are
pumped using yellow-blue color coded 1.27 mm id Tygon® peristaltic pump tubings.
Solutions are sent at constant flow rates by the help of Gilson Minipuls 3 (Villers Le
Bell, France) 4-channel peristaltic pumps. Waste solution is removed from the
system by Gilson Minipuls 3, 4-channel peristaltic pump. Carrier gas is introduced to
the system by the help of mass flow controller (Cole Palmer, USA). Continuous flow
VCG system used during the studies is shown in Figure 4.
For the junction points of tubings and carrier gas, 3 way T-shaped PTFE connectors
(Cole Palmer, Illinois, USA) were used. PTFE connection tubings (Cole Palmer) with
0.56 mm i.d. were used for the reaction and stripping coils.
Figure 4 Schematic representation of the continuous flow volatile compound
generation system.

22
So as to separate liquid and gaseous phases, laboratory made borosilicate gas-liquid
separator was placed after stripping coil. Schematic representation and dimensions
of the GLS are shown in Figure 5. Formed volatile species were transported to the
atomization unit by the help of 15.0 cm length 6.0 mm i.d. PTFE tubing.
Figure 5 Schematic representation of GLS used in continuous flow system.
An externally heated T-shaped quartz tube atomizer (Çalışkan Cam, Ankara, Turkey)
was used as the atomization unit throughout the study; its dimensions are given in
Figure 6. Quartz tube atomizer (QTA) consisted of a horizontal arm and an inlet arm.
Horizontal arm of the QTA was aligned in the optical path of the instrument and
placed 3.0 mm above the burner head by using QTA holding apparatus. Volatile
species are transported to the atomizer by the help of inlet arm.

23
Figure 6 Schematic representation of externally heated quartz tube atomizer.
New T-tubes were conditioned by using 100 mL of 10.0 mg/L Tl solution with the
continuous flow VCG method. Sample solution was prepared in 0.5 mol/L HNO3,
0.005% (m/v) rhodamine B and 1.0 mg/L Pd. 3.0% (m/v) NaBH4 stabilized in 0.5%
(m/v) NaOH was used as reductant and merged with the sample solution through
reaction coil. Ar was sent with the flow rate of 50.0 mL/min. The reason of
conditioning new tubes before using is to saturate T-tube and prevent fluctuations
in the signals.
2.4 Flow Injection Volatile Compound Generation System
Carrier solution and NaBH4 solution are pumped through yellow-blue color coded
1.27 mm id Tygon® peristaltic pump tubings by the help of Gilson Minipuls 3, 4-
24
channel peristaltic pumps. A manual injection valve with a 400 µL sample loop was
used to inject the sample to the flow injection system.
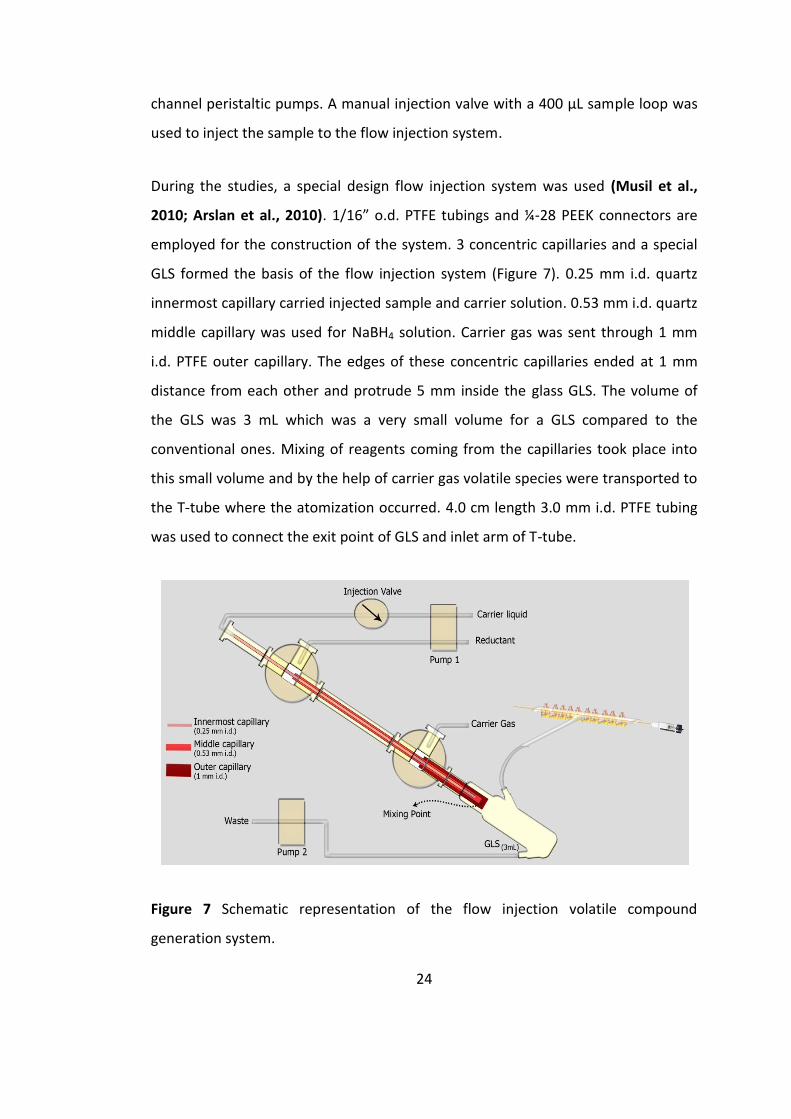
During the studies, a special design flow injection system was used (Musil et al.,
2010; Arslan et al., 2010). 1/16” o.d. PTFE tubings and ¼-28 PEEK connectors are
employed for the construction of the system. 3 concentric capillaries and a special
GLS formed the basis of the flow injection system (Figure 7). 0.25 mm i.d. quartz
innermost capillary carried injected sample and carrier solution. 0.53 mm i.d. quartz
middle capillary was used for NaBH4 solution. Carrier gas was sent through 1 mm
i.d. PTFE outer capillary. The edges of these concentric capillaries ended at 1 mm
distance from each other and protrude 5 mm inside the glass GLS. The volume of
the GLS was 3 mL which was a very small volume for a GLS compared to the
conventional ones. Mixing of reagents coming from the capillaries took place into
this small volume and by the help of carrier gas volatile species were transported to
the T-tube where the atomization occurred. 4.0 cm length 3.0 mm i.d. PTFE tubing
was used to connect the exit point of GLS and inlet arm of T-tube.
Figure 7 Schematic representation of the flow injection volatile compound
generation system.

25
The main characteristic of the system was the fast separation of the Tl volatile
species from the solution. On the contrary to other VCG systems, there were no
reaction and stripping coils. Reagents were mixed in a small volume and volatile
species were transported to the atomizer very quickly. By this way, most of the
memory effect coming from the reaction and stripping coils were eliminated.
Moreover, using small volume of GLS also reduced the memory effect coming from
the adsorptions on the glass surface.
2.5 Procedures
2.5.1 Continuous Flow Volatile Compound Generation
For the continuous flow VCG system, sample and NaBH4 flow rates were optimized
and used as 1.6 mL/min and 2.5 mL/min, respectively. Sample solution was acidified
with HNO3 to get a final solution 0.5 mol/L HNO3. Pd and rhodamine B were added
to the acidified sample solution to a final concentration of 1.0 mg/L and 0.0005%
(m/v), respectively. Reductant solution was made up of 6.0% (m/v) NaBH4 in 0.5%
(m/v) NaOH solution and it was merged with sample solution through 35.0 cm
length reaction coil. Carrier gas was sent with the optimized flow rate of 50 mL/min
and added to the system through 25.0 cm length stripping coil. An integrated signal
was collected for 10 seconds and each result was the mean of at least two replicate
measurements.

26
2.5.2 Flow Injection Volatile Compound Generation
So as to reach low detection limits in flow injection VCG system, parameters
affecting VCG efficiency were optimized by using 1.0 mg/L Tl solution. 0.5 mol/L
HNO3 was used as the carrier solution. Reductant solution was made up of 3.0%
(m/v) NaBH4 in 0.5% (m/v) NaOH and carrier gas flow rate was set to 50 mL/min.
Carrier solution and NaBH4 were sent with the flow rates of 1.0 mL/min. NaBH4,
carrier gas and the carrier solution containing sample plug were mixed at the
entrance point of the GLS. Generated volatile species were transported to the
atomizer by the help of carrier gas. Blank solution containing 0.5 mol/L HNO3,
0.005% (m/v) rhodamine B and 1.0 mg/L Pd was used to control the memory effect.

27
CHAPTER 3
3 RESULTS AND DISCUSSION
RESULTS AND DISCUSSION
This study involves development of sensitive analytical methods for the
determination of thallium at low detection limits.
First part of the study includes quantitative determination of thallium by continuous
flow volatile compound generation AAS system. In this part NaBH4, sample and Ar
flow rates, NaBH4 and HNO3 concentrations were optimized. Because of black
precipitates formed on the reaction and stripping coils, sensitivity and
reproducibility of the method were affected and further development could not be
done.
Second part consists of determination of thallium by a special flow injection volatile
compound generation AAS system. In this system, black precipitates causing
memory effect were eliminated and reproducible signals were obtained. Volatile
compound generation efficiency of thallium was improved by optimizing the
parameters. In addition, effects of enhancement reagents on volatile compound
generation efficiency were also investigated.
Third part involves investigation of reasons of peak broadening in the signals. By
changing the direction of Ar gas, the sources of memory effects causing peak
broadening in the signals were examined.

28
The last part involves qualitative characterization of volatile thallium species.
Samples adsorbed on the carbon/formvar coated Cu grids were examined in
transmission electron microscope and presence of Tl nanoparticles was proven.
3.1 Continuous Flow Volatile Compound Generation System
In this part of the study, volatile species were generated in continuous mode and
parameters were optimized to increase sensitivity.
3.1.1 Optimization of NaBH4 and Sample Solution Flow Rates
10.0 mg/L Tl was chosen as the starting concentration and sample solution was
prepared in 0.5 mol/L HNO3, 0.0005% (m/v) rhodamine B and 1.0 mg/L Pd. NaBH4
solution was made up of 1.0% (m/v) NaBH4 in 0.5% (m/v) NaOH. Ar flow rate was
set to 200 mL/min and kept constant during the experiment. 1.1 mL/min sample
flow rate was kept constant and NaBH4 flow rate was varied between 1.1 mL/min
and 3.3 mL/min to determine optimum flow rate. Results given in Figure 8 illustrate
that NaBH4 flow rate had a significant effect on VCG efficiency since absorbance
value increased about 9 times when NaBH4 flow rate was increased from 1.1
mL/min to 2.5 mL/min which was found as optimum.
29
Figure 8 Effect of NaBH4 flow rate on the continuous flow VCGAAS signal of 10.0
mg/L Tl solution prepared in 0.5 mol/L HNO3, 0.0005% (m/v) rhodamine B and 1.0
mg/L Pd. Sample and Ar were sent with the flow rates of 1.1 mL/min and 200
mL/min, respectively. 1.0% (m/v) NaBH4 in 0.5% (m/v) NaOH was used.
After that, 2.5 mL/min NaBH4 flow rate was kept constant and effect of sample flow
rate was investigated by varying the flow rate between 1.1 mL/min and 3.2 mL/min.
Results shown in Figures 8 and 9 indicate that optimum flow rates for NaBH4 and
sample solution were 2.5 mL/min and 1.6 mL/min, respectively.
0
0.02
0.04
0.06
0.08
0.1
0.12
0.14
0.16
0.18
0.5 1 1.5 2 2.5 3 3.5
Ab
sorb
ance
NaBH4 Flow Rate, mL/min

30
Figure 9 Effect of sample flow rate on the continuous flow VCGAAS signal of 10.0
mg/L Tl solution prepared in 0.5 mol/L HNO3, 0.0005% (m/v) rhodamine B and 1.0
mg/L Pd. 1.0% (m/v) NaBH4 in 0.5% (m/v) NaOH was used with a flow rate of 2.5
mL/min. Ar flow rate was set as 200 mL/min.
3.1.2 Optimization of Ar Flow Rate
The function of carrier gas is to transport volatile species to the atomizer.
Moreover, it may also help to strip volatile species out of sample solution. Carrier
gas is chosen with respect to atomizer performance and optimum economy (Dědina
& Tsalev, 1995). Carrier gas flow rate is one of the critical factors for system
performance since flow stability and flow rate affect the sensitivity and repeatability
of the method. Unstable gas flow rates cause fluctuations in the signals. For the
determination of Tl by VCG method, Ar was selected as the carrier gas. Effect of Ar
flow rate on absorbance values was examined with different flow rates varying from
25.0 mL/min to 300 mL/min. Absorbance value obtained in the absence of Ar gas
0
0.02
0.04
0.06
0.08
0.1
0.12
0.14
0.16
0.18
0.5 1 1.5 2 2.5 3 3.5
Ab
sorb
ance
Sample Flow Rate, mL/min

31
was also studied and 50.0 mL/min flow rate gave the best absorbance (Figure 10).
Experimental results showed that higher Ar flow rates results in low absorbance
values. The reason of signal decrease at higher flow rates is due to dilution effect of
the gas. Moreover, it may also affect residence time of the atoms in the
measurement zone. Signal decrease in the absence of Ar gas verified that it plays an
important role in the transportation of volatile Tl species to the atomizer.
Figure 10 Effect of Ar flow rate on the continuous flow VCGAAS signal of 10.0 mg/L
Tl solution prepared in 0.5 mol/L HNO3, 0.0005% (m/v) rhodamine B and 1.0 mg/L
Pd. Sample flow rate was 1.6 mL/min. 1.0% (m/v) NaBH4 in 0.5% (m/v) NaOH was
used with a flow rate of 2.5 mL/min.
3.1.3 Optimization of NaBH4 Concentration
Reductant solution and acid concentrations become important in optimizations due
to their significant effects on volatile compound generation efficiency of Tl. To see
0
0.05
0.1
0.15
0.2
0.25
0.3
0.35
0 50 100 150 200 250 300 350
Ab
sorb
ance
Argon Flow Rate, mL/min

32
the effect of NaBH4 concentration, HNO3 concentration of sample solution was kept
constant as 0.5 mol/L and NaBH4 solutions ranging from 1.0% (m/v) to 8.0% (m/v)
were prepared. All NaBH4 solutions were stabilized in 0.5% (m/v) NaOH. Results
shown in Figure 11 indicated that increasing NaBH4 concentration has a positive
effect on analytical signal and gives rise to rapid and efficient formation of volatile
species. VCG efficiency of Tl reached maximum with 6.0% (m/v) NaBH4 merged with
0.5 mol/L HNO3. This behavior may be explained by the fact that higher NaBH4
concentrations results in increased hydrogen radicals in the measurement zone.
Figure 11 Effect of NaBH4 concentration on the continuous flow VCGAAS signal of
10.0 mg/L Tl solution prepared in 0.5 mol/L HNO3, 0.0005% (m/v) rhodamine B and
1.0 mg/L Pd. 50.0 mL/min Ar flow rate was used. Sample and NaBH4 flow rates were
set as 1.6 mL/min and 2.5 mL/min, respectively. NaBH4 solutions were stabilized in
0.5% (m/v) NaOH.
0
0.2
0.4
0.6
0.8
1
1.2
1.4
0 2 4 6 8 10
Ab
sorb
ance
NaBH4 Concentration, % (m/v)

33
After this optimization, analyte signal reached to a reasonable value to decrease the
sample concentration. For this reason, further studies were carried out with 1.0
mg/L sample solution prepared in a same way and also same experiment was
repeated with this concentration. As can be seen from Figure 12, 6.0% (m/v) NaBH4
gave the best results again.
Figure 12 Effect of NaBH4 concentration on the continuous flow VCGAAS signal of
1.0 mg/L Tl solution prepared in 0.5 mol/L HNO3, 0.0005% (m/v) rhodamine B and
1.0 mg/L Pd. 50.0 mL/min Ar flow rate was used. Sample and NaBH4 flow rates were
set as 1.6 mL/min and 2.5 mL/min, respectively. NaBH4 solutions were stabilized in
0.5% (m/v) NaOH.
3.1.4 Optimization of HNO3 Concentration
Formation of volatile species strongly depends on HNO3 concentration in the
sample solution due to the fact that it affects pH of the reaction medium. 6.0%
0
0.05
0.1
0.15
0.2
0.25
2 3 4 5 6 7 8
Ab
sorb
ance
NaBH4 Concentration, % (m/v)

34
(m/v) NaBH4 was prepared in 0.5% (m/v) NaOH and mixed with sample solution
through reaction and stripping coils. HNO3 concentration of sample solution was
varied between 0.3 mol/L and 2.0 mol/L. It was indicated in Figure 13 that 0.5 mol/L
HNO3 was optimum concentration for the acidity. However, Tl volatile species are
unstable and decompose rapidly. That behavior is a problem discussed in the
literature many times (Ebdon et al., 1995; Zhu et al., 2000). During the studies, Tl
volatile species were decomposed and formed black precipitates in the system.
These black precipitates were adsorbed onto especially the reaction and stripping
coils. Saturation of the system with Tl black precipitates lead to enhancement of
signals. On the other hand, a serious memory effect problem was also encountered.
While taking signals in higher acid concentrations, it was observed that the degree
of saturation on the reaction and stripping coils with black precipitates decreased in
a considerable amount. For this reason it was difficult to decide about the optimum
acidity concentration. Consequently, it was not certain whether that signal decrease
resulted from high acid of the sample solution or due to the saturation loss on the
coils.

35
Figure 13 Effect of HNO3 concentration on the continuous flow VCGAAS signal of 1.0
mg/L Tl solution prepared in 0.0005% (m/v) rhodamine B and 1.0 mg/L Pd. 50.0
mL/min Ar flow rate was used. 6.0% (m/v) NaBH4 solution was stabilized in 0.5%
(m/v) NaOH. NaBH4 and acidified sample solution were sent with the flow rates of
2.5 mL/min and 1.6 mL/min, respectively.
3.1.5 Results from Continuous Flow VCG System
Due to unstable Tl volatile species, black precipitates in the coils and adsorptions on
the dead volume of the GLS caused serious memory problems. In the course of
HNO3 optimization, black precipitates changed their locations erratically. Changes in
the system saturation affected the signals and resulted in considerable decrease in
the absorbance values. As a result, reproducibility and sensitivity of the method
were lost and further optimizations could not be carried out. Parameters of the
continuous flow VCGAAS system which could be optimized were summarized in
Table 4.
0
0.05
0.1
0.15
0.2
0.25
0 0.5 1 1.5 2 2.5
Ab
sorb
ance
HNO3 Concentration, mol/L

36
Table 4 Optimized parameters for continuous flow volatile compound generation
system.
Parameter
Optimum Value
NaBH4 flow rate
2.5 mL/min
Sample flow rate
1.6 mL/min
Ar flow rate
50.0 mL/min
NaBH4 concentration
6.0% (m/v)
3.2 Flow Injection Volatile Compound Generation System
In this part of the study, Tl volatile species are generated in flow injection mode and
parameters were optimized to increase sensitivity.
3.2.1 Optimization of Ar Flow Rate
Flow injection VCG studies were carried out with 1.0 mg/L Tl solution. Sample
solution and carrier solution were acidified with HCl to get a final concentration of
0.5 mol/L HCl. Rhodamine B and Pd were added to the sample solution to a final
concentration of 0.0005% (m/v) and 1.0 mg/L, respectively. Sample was introduced
to the system by the help of 100 µL sample loop. 3.0% (m/v) NaBH4 stabilized in
0.5% (m/v) NaOH was used as reductant solution. Carrier solution and NaBH4 flow
rates were set as 0.8 mL/min and kept constant during the experiment. Different Ar
flow rates ranging from 10.0 mL/min to 300.0 mL/min were examined to see the

37
effects of flow rate on the signal shape and peak height (Figure 14). Signal decrease
at higher flow rates was observed due to dilution effect of the gas. On the other
hand, lower flow rates caused peaks to be distorted and tailed since the carrier flow
was not strong enough to strip out the volatile species effectively. In addition, at
lower flow rates water droplets were also observed in the 4.0 cm PTFE tubing used
to connect exit the port of the GLS and the inlet arm of T-tube. Water droplets in
the tubing affect system performance adversely and reduce signals. Considering the
effects on sensitivity and peak shape, 50.0 mL/min Ar flow rate was found as
optimum.
Figure 14 Effect of Ar flow rate on the flow injection VCGAAS signal of 1.0 mg/L Tl
solution prepared in 0.5 mol/L HCl, 0.0005% (m/v) rhodamine B and 1.0 mg/L Pd.
Carrier solution and 3.0% (m/v) NaBH4 stabilized in 0.5% (m/v) NaOH were sent with
the flow rate of 0.8 mL/min. 100 µL loop volume was used for sample introduction.
0
0.01
0.02
0.03
0.04
0.05
0.06
0.07
0.08
0 50 100 150 200 250 300 350
Ab
sorb
ance
Argon Flow Rate, mL/min

38
3.2.2 Optimization of NaBH4 and HCl Concentrations
VCG reaction conditions and system performance strongly depend on reductant and
acid concentrations used. Small changes in these concentrations affect pH of the
reaction medium and hydrogen radical concentration; these changes may lead to
significant differences in the analytical signals. HCl concentration of sample solution
and carrier solution were varied between 0.1 mol/L and 2.0 mol/L. NaBH4 solutions
ranging from 1.0% (m/v) to 3.0% (m/v) were stabilized in 0.5% (m/v) NaOH. 100 µL
loop volume was used to introduce the sample to the system. Reductant and carrier
solution were sent with the flow rate of 0.8 mL/min. The results obtained from the
optimization of NaBH4 and HCl concentrations are given in Figure 15. Considering
the peak shapes and reproducibility of the analytical signals, 0.5 mol/L HCl and 3.0%
(m/v) NaBH4 were chosen for further experiments; even though, a slightly higher
absorbance value was obtained from 0.3 mol/L HCl and 3.0% (m/v) NaBH4.
39
Figure 15 Effect of NaBH4 and HCl concentrations on the flow injection VCGAAS
signal of 1.0 mg/L Tl solution prepared in 0.0005% (m/v) rhodamine B and 1.0 mg/L
Pd. Carrier solution and NaBH4 were sent with the flow rate of 0.8 mL/min. 100 µL
loop volume was used for sample introduction and Ar flow rate was 50.0 mL/min.
NaBH4 solution was stabilized in 0.5% (m/v) NaOH.
The effects of NaBH4 concentrations higher than 3.0% (m/v) on VCG efficiency were
also investigated (Figure 16). 0.5 mol/L HCl was used for sample solution and carrier
solution, and NaBH4 solutions ranging from 1.0% (m/v) to 8.0% (m/v) were
prepared. 400 µL loop volume was used for the introduction of sample solution.
Flow rates of carrier solution and NaBH4 were adjusted to 1.0 mL/min. Although
absorbance value was increasing together with NaBH4 concentration up to 6.0%
(m/v) in continuous flow system, there was no difference in absorbance values from
3.0% to 8.0% in flow injection system.
1
2
3
0
0.02
0.04
0.06
0.08
0.1 0.3
0.5 1
2
NaBH4 Concentration, % (m/v)
Absorbance
HCl Concentration, mol/L

40
Figure 16 Effect of NaBH4 on the flow injection VCGAAS signal of 1.0 mg/L Tl
solution prepared in 0.0005% (m/v) rhodamine B, 0.5 mol/L HCl and 1.0 mg/L Pd.
Carrier solution and NaBH4 were sent with the flow rate of 0.8 mL/min. 400 µL loop
volume was used for sample introduction and Ar flow rate was set as 50.0 mL/min.
NaBH4 solution was stabilized in 0.5% (m/v) NaOH.
3.2.3 Optimization of NaBH4 and Carrier Solution Flow Rates
NaBH4 and carrier solution were pumped with different flow rates ranging 0.8
mL/min to 1.3 mL/min by the help of peristaltic pumps. Results given in Figure 17
demonstrated that analytical signal increased with increasing flow rates. Because of
the fact that small GLS with the volume of 3.0 mL was used for the flow injection
VCG of Tl as distinct from conventional VCG systems, higher flow rates caused
overflow of the GLS. In addition, water droplets on the PTFE tubing connected to
the exit point of GLS were noticed at higher flow rates. In order to prevent
0
0.05
0.1
0.15
0.2
0.25
0.3
0 2 4 6 8 10
Ab
sorb
ance
NaBH4 Concentration, % (m/v)

41
overflows of the GLS and water droplets on the tubing, 1.0 mL/min flow rate was
accepted as optimum for NaBH4 and carrier solutions.
Figure 17 Effect of NaBH4 and carrier solution flow rates on the flow injection
VCGAAS signal of 1.0 mg/L Tl solution prepared in 0.0005% (m/v) rhodamine B, 0.5
mol/L HCl and 1.0 mg/L Pd. 3.0% (m/v) NaBH4 stabilized in 0.5% (m/v) NaOH was
used. 100 µL loop volume was used for sample introduction and Ar flow rate was
50.0 mL/min.
3.2.4 Optimization of Rhodamine B Concentration
Rhodamine B which is an alkaline dye has been widely used for the determination
of Tl by VCG. It has been proven that as a co-enhancement reagent rhodamine B
increases peak height of analytical signal in the presence of Pd (Xu, Zhou, Du, &
Zhu, 2001). Sample solution was prepared in 0.5 mol/L HCl, 1.0 mg/L Pd and
rhodamine B. The concentration of rhodamine B was varied from 0.0005% (m/v) to
0
0.02
0.04
0.06
0.08
0.1
0.12
0.14
0.7 0.8 0.9 1 1.1 1.2 1.3 1.4
Ab
sorb
ance
Flow Rate, mL/min

42
0.01% (m/v) to see the effects on the peak height. According to experimental
results given in Figure 18, 0.005% (m/v) rhodamine B in the presence of 1.0 mg/L Pd
showed the best performance for enhancing VCG efficiency of Tl.
Figure 18 Effect of rhodamine B concentration on the flow injection VCGAAS signal
of 1.0 mg/L Tl solution prepared in 0.5 mol/L HCl and 1.0 mg/L Pd. Carrier solution
and 3.0% (m/v) NaBH4 stabilized in 0.5% (m/v) NaOH were sent with the flow rate of
1.0 mL/min. 100 µL loop volume was used for sample introduction and Ar flow rate
was 50.0 mL/min.
In the optimization of rhodamine B concentration with 100 µL sample loop, no
signal was obtained from the sample solution prepared in the absence of
rhodamine B and Pd. After that, loop volume was increased to 400 µL and
experiment was repeated in the same conditions (Figure 19). Analytical signal
obtained from 1.0 mg/L Tl prepared in 0.5 mol/L HCl can be seen in curve b in Figure
19. It was proved that 100 µL sample loop remained inadequate to obtain a
0
0.05
0.1
0.15
0.2
0.25
0.3
0.35
0 0.002 0.004 0.006 0.008 0.01 0.012
Ab
sorb
ance
Rhodamine B Concentration, %(m/v)

43
meaningful signal from the sample that did not contain rhodamine B and Pd. On the
other hand, presence of 0.005% (m/v) rhodamine B and 1.0 mol/L Pd hastened the
reaction and enhanced the peak height of the signal as can be seen from the curve
a. Peak-shaped and intense signal was obtained in a shorter time.
Figure 19 a- Analytical signal obtained from 1.0 mg/L Tl prepared in 0.5 mol/L HCl,
0.005% (m/v) rhodamine B and 1.0 mg/L Pd. b- Analytical signal obtained from 1.0
mg/L Tl prepared in 0.5 mol/L HCl. 400 µL loop volume was used for sample
introduction.
3.2.5 Optimization of Sample Loop Volume
In flow injection VCG system, sample in the sample loop was introduced to the
system by the help of a manual injection valve. Optimization of sample loop volume
is important because it affects analyte atom concentration in the measurement
zone. As can be seen from Figure 20, different loop volumes ranging 100 µL to 800
µL were examined. It was observed that there was a slight difference on absorbance
values obtained using 400 µL and 800 µL loop volumes. Considering reagent
Sample 023
Time
Abs
0,00
-0,10
0,33
0,10
0,20
0,0 600,0200,0 400,0
Zoom AutoscaleOverlay
a
b
(s)

44
consumption and sensitivity, 400 µL sample loop volume was chosen for further
experiments.
Figure 20 Effect of sample loop volume on the flow injection VCGAAS signal of 1.0
mg/L Tl solution prepared in 0.5 mol/L HCl, 0.005% (m/v) rhodamine B and 1.0 mg/L
Pd. Carrier solution and 3.0% (m/v) NaBH4 stabilized in 0.5% (m/v) NaOH were sent
with the flow rate of 1.0 mL/min. Ar flow rate was 50.0 mL/min.
3.2.6 Effect of HCl and HNO3 on VCG Efficiency of Tl+ and Tl3+
Considering toxic effects on human health and environment, determination of Tl at
lower detection limits is very important. However, in literature, there is no
agreement on the type of the acid which provides a better performance in the
determination of Tl. Liao et al. (Liao, Chen, Yan, Li, & Ni, 1998) used HCl for the
investigation of Tl VCG using in situ trapping in graphite tube by AAS. On the other
hand, Zhu et al. (Zhu & Xu, 2000) recommended using HNO3 for VCG of Tl since
0
0.05
0.1
0.15
0.2
0.25
0.3
0.35
0.4
0.45
0 200 400 600 800 1000
Ab
sorb
ance
Loop Volume, µL

45
formation of Tl-Cl complex in HCl medium caused unstable signals and reduction in
sensitivity. For this reason, the effects of different acids on the VCG efficiency of Tl
in different oxidation states were investigated. HCl and HNO3 were selected to
acidify the carrier solution and sample solutions of Tl+ and Tl3+. Acidified sample
solutions were prepared in the presence of rhodamine B and Pd with the final
concentrations of 0.005% (m/v) and 1.0 mg/L, respectively. Absorbance values
obtained from Tl+ species can be seen from Figure 21. It was clear that VCG
efficiency of Tl+ species was increasing in the presence of HNO3 and signals of HCl
solutions were more noisy and unstable.
Figure 21 Effects of HNO3 and HCl on the shape of VCGAAS signal of 1.0 mg/L Tl+
solution prepared in 0.005% (m/v) rhodamine B and 1.0 mg/L Pd. Acidity of the
sample and carrier solution were 0.5 mol/L. Carrier solution and 3.0% (m/v) NaBH4
stabilized in 0.5% (m/v) NaOH were sent with the flow rate of 1.0 mL/min. Ar flow
rate was 50.0 mL/min and 400 µL loop volume was used for sample introduction.
VCG efficiency of Tl+3 species also have been affected significantly by the type of the
acid used (Figure 22). Although, nearly the same absorbance values were obtained
Sample 008
Time
Abs
0,00
0,40
0,10
0,20
0,30
0,0 180,050,0 100,0 150,0
Zoom AutoscaleOverlay
Tl+ & HNO3
Tl+ & HCl
(s)

46
from Tl3+ and Tl+ species in the presence of HNO3, using HCl caused a significant
decrease in the signals of Tl3+ species. Fluctuations and excess noise in the analytical
signals were important problems in HCl medium.
Figure 22 Effects of HNO3 and HCl on the shape of VCGAAS signal of 1.0 mg/L Tl3+
solution prepared in 0.005% (m/v) rhodamine B and 1.0 mg/L Pd. Acidity of the
sample and carrier solution were 0.5 mol/L. Carrier solution and 3.0% (m/v) NaBH4
stabilized in 0.5% (m/v) NaOH were sent with the flow rate of 1.0 mL/min. Ar flow
rate was 50.0 mL/min and 400 µL loop volume was used for sample introduction.
In spite of the fact that HNO3 provided a better performance for both oxidation
states of Tl, sample solutions prepared in HCl remained stable for longer times. As
can be seen Figure 23-a, sample solutions containing rhodamine B were observed to
decompose even after a day in the presence of HNO3. Decomposition process was
faster when the solutions were subjected to sunlight and black precipitates were
observed in HNO3 solutions after about a month (Figure 23-b).
Sample 012
Time
Abs
0,00
0,40
0,10
0,20
0,30
0,0 180,050,0 100,0 150,0
Zoom AutoscaleOverlay
Tl3+
& HNO3
Tl3+
& HCl
(s)
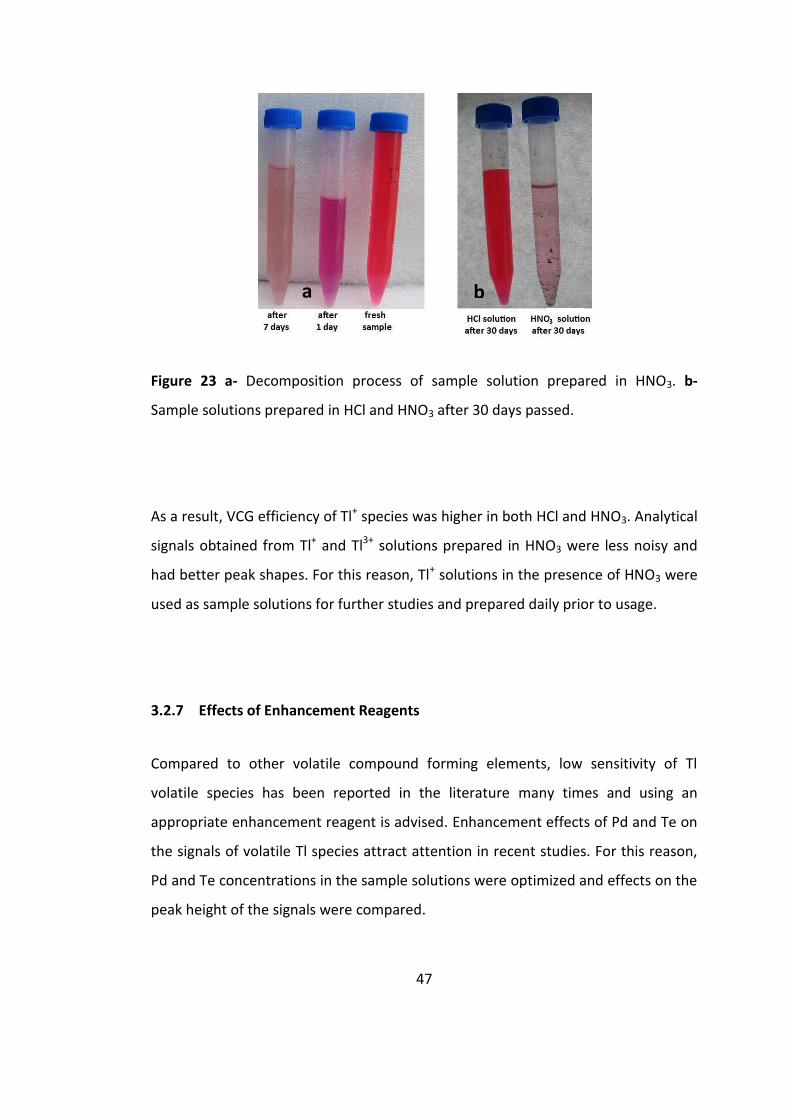
47
Figure 23 a- Decomposition process of sample solution prepared in HNO3. b-
Sample solutions prepared in HCl and HNO3 after 30 days passed.
As a result, VCG efficiency of Tl+ species was higher in both HCl and HNO3. Analytical
signals obtained from Tl+ and Tl3+ solutions prepared in HNO3 were less noisy and
had better peak shapes. For this reason, Tl+ solutions in the presence of HNO3 were
used as sample solutions for further studies and prepared daily prior to usage.
3.2.7 Effects of Enhancement Reagents
Compared to other volatile compound forming elements, low sensitivity of Tl
volatile species has been reported in the literature many times and using an
appropriate enhancement reagent is advised. Enhancement effects of Pd and Te on
the signals of volatile Tl species attract attention in recent studies. For this reason,
Pd and Te concentrations in the sample solutions were optimized and effects on the
peak height of the signals were compared.
a b

48
1.0 mg/L Tl+ solutions were prepared in the presence of HNO3 and rhodamine B to
get final concentrations of 0.5 mol/L and 0.005% (m/v), respectively. Pd
concentration in the sample solution was varied between 1.0 mg/L and 5.0 mg/L.
Sample solution in the absence of Pd was also examined. Results given in Figure 24
implied that presence of 1.0 mg/L Pd in the sample solution enhanced the analytical
signal significantly.
Figure 24 Effects of Pd concentration on the flow injection VCGAAS signal of 1.0
mg/L Tl+ solution prepared in 0.5 mol/L HNO3, 0.005% and (m/v) rhodamine B.
Carrier solution and 3.0% (m/v) NaBH4 stabilized in 0.5% (m/v) NaOH were sent with
the flow rate of 1.0 mL/min. Ar flow rate was 50.0 mL/min and 400 µL loop volume
was used for sample introduction.
The concentration of Te was altered from 1.0 mg/L to 15.0 mg/L in the optimization
process. As can be seen Figure 25, there was no difference in absorbance values
0
0.05
0.1
0.15
0.2
0.25
0.3
0.35
0.4
0 1 2 3 4 5 6
Ab
sorb
ance
Pd Concentration, mg/L

49
between 8.0 mg/L and 15.0 mg/L. So as to reduce reagent consumption, 8.0 mg/L
Te was selected as optimum.
Figure 25 Effects of Te concentration on the flow injection VCGAAS signal of 1.0
mg/L Tl+ solution prepared in 0.5 mol/L HNO3, 0.005% and (m/v) rhodamine B.
Carrier solution and 3.0% (m/v) NaBH4 stabilized in 0.5% (m/v) NaOH were sent with
the flow rate of 1.0 mL/min. Ar flow rate was 50.0 mL/min and 400 µL loop volume
was used for sample introduction.
Experimental results shown in Figure 26 indicated that enhancement factor of 1.0
mg/L Pd on the peak height of the signal was about 3 times higher than the 8.0
mg/L Te. Sensitivity improvement and reagent consumption were taken into
consideration and Pd provided the best performance for VCG of Tl and it was
chosen as the enhancement reagent.
0
0.02
0.04
0.06
0.08
0.1
0.12
0.14
0 2 4 6 8 10 12 14 16
Ab
sorb
ance
Te Concentration, mg/L

50
Figure 26 Effects of 1.0 mg/L Pd and 8.0 mg/L Te on the shape of VGCAAS signal of
1.0 mg/L Tl+ solution prepared in 0.5 mol/L HNO3 and 0.005% (m/v) rhodamine B.
Carrier solution and 3.0% (m/v) NaBH4 stabilized in 0.5% (m/v) NaOH were sent with
the flow rate of 1.0 mL/min. Ar flow rate was set as 50.0 mL/min and 400 µL loop
volume was used for sample introduction.
3.2.8 Linear Ranges and Calibration Plots
After all optimization studies were completed, analytical signals of Tl+ solutions
ranging from 0.1 mg/L to 5.0 mg/L were measured to determine the linear dynamic
range and calibration plot for HNO3 and HCl (Figure 27). Each data point is the mean
of three replicate measurements.
Sample 029
Time
Abs
0,00
0,42
0,10
0,20
0,30
0,0 180,050,0 100,0 150,0
Zoom AutoscaleOverlay
1.0 mg/L Pd
8.0 mg/L Te
(s)

51
Figure 27 Calibration data in 0.5 mol/L HNO3 and 0.5 mol/L HCl for the flow
injection VCGAAS signal of 1.0 mg/L Tl+ solution prepared in 0.005% (m/v)
rhodamine B and 1.0 mg/L Pd. Carrier solution and 3.0% (m/v) NaBH4 stabilized in
0.5% (m/v) NaOH were sent with the flow rate of 1.0 mL/min. Ar flow rate was set
as 50.0 mL/min and 400 µL loop volume was used for sample introduction.
It was observed that for the media using both acids the plot was linear between 0.1
mg/L and 2.0 mg/L Tl+. After this point, deviation from linearity was observed
(Figure 27). LOD and LOQ values were calculated from the standard deviation of 6
replicate measurements of the standard with lowest concentration of 0.1 mg/L. For
the calculation of characteristic concentration, absorbance value of 1.0 mg/L
standard was used. Linear portions of the calibration plots are shown in Figure 28.
Analytical figures of merit for flow injection VCGAAS are given in Table 5.
0
0.1
0.2
0.3
0.4
0.5
0.6
0.7
0.8
0.9
1
0 1 2 3 4 5 6
Ab
sorb
ance
Tl Concentration, mg/L
HCl
HNO3

52
Figure 28 Linear portions of calibration plots in 0.5 mol/L HNO3 and 0.5 mol/L HCl
for the flow injection VCGAAS signal of 1.0 mg/L Tl+ solution prepared in 0.005%
(m/v) rhodamine B and 1.0 mg/L Pd. Carrier solution and 3.0% (m/v) NaBH4
stabilized in 0.5% (m/v) NaOH were sent with the flow rate of 1.0 mL/min. Ar flow
rate was 50.0 mL/min and 400 µL loop volume was used for sample introduction.
Table 5 Analytical figures of merit of flow injection VCGAAS system.
Sample in the
presence of HCl Sample in the
presence of HNO3
Limit of Detection, LOD, 3s/m (N=6) ng/mL
14.0 12
Limit of Quantification, LOQ, 10s/m (N=6) ng/mL
45.0 40
Characteristic Concentration, C0, ng/mL
19.9 13.4
Linear Range, mg/L 0.1 – 2.0 0.1 – 2.0
Relative Standard Deviation, RSD% (N=6)
8.6 7.2
y = 0.2393x - 0.0187 R² = 0.9991
y = 0.3367x - 0.0174 R² = 0.9992
0
0.1
0.2
0.3
0.4
0.5
0.6
0.7
0 0.5 1 1.5 2 2.5
Ab
sorb
ance
Tl Concentration, mg/L
HCl
HNO3

53
The comparison between the results of this study and some studies from the
literature are summarized in Table 6.
Table 6 The comparison of characteristic mass and characteristic concentrations of
the studies.
Method Characteristic
Mass, ng
Characteristic concentration,
ng/mL Reference
VCGAAS 5.4 13.4 this study
Continuous flow HG
4
(Ebdon, Goodal, Hill, Stockwell, &
Thompson, 1995)
In-situ trapping in graphite tube AAS
0.92
(Liao, Chen, Yan, Li, & Ni, 1998)
HGAAS 120
(Yan, Yan, Cheng, & Li, 1984)
Optimized parameters of flow injection VCGAAS system are summarized in Table 7.

54
Table 7 Optimized parameters of flow injection VCGAAS system.
Parameter Optimum Value
Ar flow rate
50.0 mL/min
NaBH4 concentration
3.0% (m/v) in 0.5% (m/v) NaOH
Acidity
0.5 mol/L HNO3
NaBH4 and carrier liquid flow rates
1.0 mL/min
Rhodamine B concentration
0.005% (m/v)
Sample loop volume
400 µL
Pd concentration
1.0 mg/L
OR
Te concentration 8.0 mg/L
Enhancement factors of Pd and Te in the presence of rhodamine B is shown in Table
8. Significant enhancement factors were not obtained from sample solutions
containing only rhodamine B, or Pd or Te.

55
Table 8 Characteristic concentrations and enhancement factors of Pd and Te.
Sample C0, ng/mL Enhancement
1.0 mg/L Tl+ 125 1
1.0 mg/L Tl+
8.0 mg/L Te 34.5 3.6
0.005% (m/v) rhodamine B
1.0 mg/L Tl+
1.0 mg/L Pd 13.4 9.3
0.005% (m/v) rhodamine B
3.3 Reasons of Peak Broadening
In flow injection VCG system, 400 µL sample loop was used to introduce sample to
the system and flow rate of carrier solution was set as 1.0 mL/min. The signal
started about 10 seconds later from the injection. In that case the signal should
have been completed in about 30 seconds. Analytical signal for 1.0 mg/L Tl+ shown
in Figure 29 demonstrates that it takes about 150 seconds to complete the signal.
This is about five times longer than time required delivering the sample plug of the
loop volume to the generator.

56
Figure 29 Analytical signal for 1.0 mg/L Tl+ solution prepared in 0.5 mol/L HNO3,
0.005% (m/v) rhodamine B and 1.0 mg/L Pd. Carrier solution and 3.0% (m/v) NaBH4
stabilized in 0.5% (m/v) NaOH were sent with the flow rate of 1.0 mL/min. Ar flow
rate was set as 50.0 mL/min and 400 µL loop volume was used for sample
introduction.
In order to understand reasons of peak broadening, a 3-way valve was introduced
to the system. By this way, Ar was sent from either upstream or downstream of the
GLS (Figure 30). In the experiment, GLS was bypassed by the flow of carrier gas in
times 50 and 75 seconds using the downstream mode in this interval.
Sample 001
Time
Abs
0,00
0,40
0,10
0,20
0,30
0,0 180,050,0 100,0 150,0
Zoom AutoscaleOverlay (s)

57
Figure 30 The positions of upstream and downstream of the GLS in flow injection
VCG system.
Firstly, Ar was sent from the upstream of the GLS for 50 seconds. By the help of 3-
way valve, the direction of the gas was changed immediately and it was sent from
the downstream of the GLS. Ar flow from downstream resulted in decrease in the
analytical signal (Figure 31). After 25 seconds, the direction of Ar was changed to
upstream of the GLS again and increase in the analytical signal was observed. This
experiment revealed that most of the memory effect causing peak broadening in
the signals comes from the GLS or before the GLS. Moreover, in the time interval
between 50 and 75 seconds, the signal did not decrease to the baseline level. That
indicates that T-tube atomizer and/or connection tubings are also acting as some
source of memory effect.
Upstream of GLS
Downstream of GLS
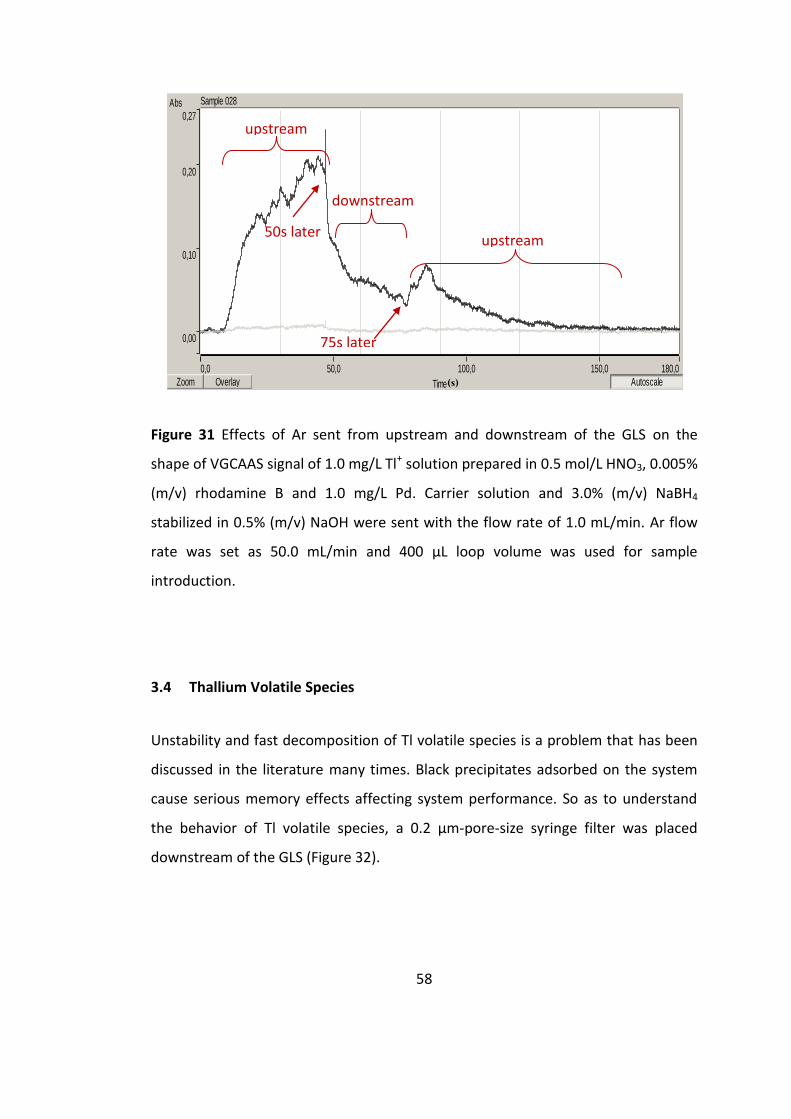
58
Figure 31 Effects of Ar sent from upstream and downstream of the GLS on the
shape of VGCAAS signal of 1.0 mg/L Tl+ solution prepared in 0.5 mol/L HNO3, 0.005%
(m/v) rhodamine B and 1.0 mg/L Pd. Carrier solution and 3.0% (m/v) NaBH4
stabilized in 0.5% (m/v) NaOH were sent with the flow rate of 1.0 mL/min. Ar flow
rate was set as 50.0 mL/min and 400 µL loop volume was used for sample
introduction.
3.4 Thallium Volatile Species
Unstability and fast decomposition of Tl volatile species is a problem that has been
discussed in the literature many times. Black precipitates adsorbed on the system
cause serious memory effects affecting system performance. So as to understand
the behavior of Tl volatile species, a 0.2 µm-pore-size syringe filter was placed
downstream of the GLS (Figure 32).
Sample 028
Time
Abs
0,00
0,27
0,10
0,20
0,0 180,050,0 100,0 150,0
Zoom AutoscaleOverlay
50s later
75s later
upstream
upstream
downstream
(s)

59
Figure 32 0.2 µm-pore-size syringe filter placed downstream of the GLS.
As can be seen from Figure 33, no signal was obtained in the presence of filter and
this indicated that Tl volatile species were trapped on the filter. In order to compare
the behavior of Tl volatile species with other volatile compound forming elements,
Sb was chosen as another hydride forming analyte and the experiment was
repeated in the same conditions. Analytical signal shown in Figure 34 proved that Sb
volatile species were not trapped on the filter and they were transported to the
atomizer.

60
Figure 33 Analytical signal for 1.0 mg/L Tl+ solution prepared in 0.5 mol/L HCl,
0.005% (m/v) rhodamine B and 1.0 mg/L Pd when 0.2 µm-pore-size syringe filter
placed downstream of the GLS. Conditions given on Table 6 were used.
Figure 34 Analytical signal for 1.0 mg/L Sb solution prepared in 0.5 mol/L HCl when
0.2 µm-pore-size syringe filter placed downstream of the GLS. Carrier solution and
3.0% (m/v) NaBH4 stabilized in 0.5% (m/v) NaOH were sent with the flow rate of 1.0
mL/min. Ar flow rate was 50.0 mL/min and 400 µL loop volume was used for sample
introduction.
Sample 012
Time
Abs
0,00
-0,07
0,38
0,10
0,20
0,30
0,0 180,050,0 100,0 150,0
Zoom AutoscaleOverlay
Sample 004
Time
Abs
0,00
-0,07
0,38
0,10
0,20
0,30
0,0 180,050,0 100,0 150,0
Zoom AutoscaleOverlay
(s)
(s)
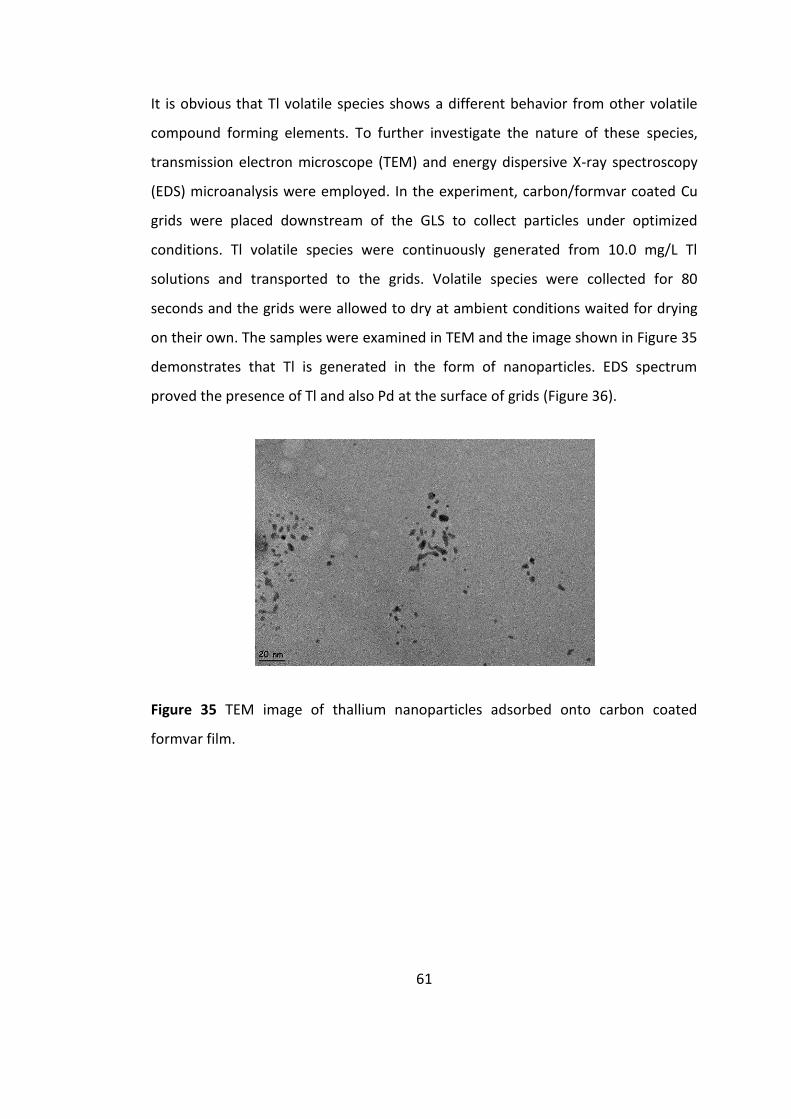
61
It is obvious that Tl volatile species shows a different behavior from other volatile
compound forming elements. To further investigate the nature of these species,
transmission electron microscope (TEM) and energy dispersive X-ray spectroscopy
(EDS) microanalysis were employed. In the experiment, carbon/formvar coated Cu
grids were placed downstream of the GLS to collect particles under optimized
conditions. Tl volatile species were continuously generated from 10.0 mg/L Tl
solutions and transported to the grids. Volatile species were collected for 80
seconds and the grids were allowed to dry at ambient conditions waited for drying
on their own. The samples were examined in TEM and the image shown in Figure 35
demonstrates that Tl is generated in the form of nanoparticles. EDS spectrum
proved the presence of Tl and also Pd at the surface of grids (Figure 36).
Figure 35 TEM image of thallium nanoparticles adsorbed onto carbon coated
formvar film.

62
Figure 36 EDS spectrum of thallium nanoparticles adsorbed onto carbon coated
formvar film.
The particle shown in Figure 37 has a diameter of about 20 nm and EDS spectrum of
this particle (Figure 38) supports the idea that it is a Tl nanoparticle. The intensive
Cu peak comes from the grid material. The proof, that it is a Tl nanoparticle, is
presented in Figure 39 showing EDS spectrum of background, obtained by using the
grid before the experiment involving Tl. In the background spectrum, there are no
peaks corresponding to Tl.
Figure 37 TEM image of about 20 nm particle size thallium nanoparticle adsorbed
onto carbon formvar film.

63
Figure 38 EDS spectrum of about 20 nm particle size thallium nanoparticle adsorbed
onto carbon formvar film.
Figure 39 EDS spectrum of background

64
CHAPTER 4
4 CONCLUSIONS
CONCLUSIONS
The main purpose of this study was the development of a sensitive analytical
method for the determination of thallium at low detection limits and to investigate
the nature of transportable thallium species.
The first part of the study involves determination of thallium by continuous flow
volatile compound generation AAS system. In this part NaBH4, sample and Ar flow
rates, NaBH4 and HNO3 concentrations were optimized. 50.0 mL/min Ar flow rate
found as optimum because of dilution effect of the higher flow rates and 6.0% (m/v)
NaBH4 enabled rapid and efficient formation of volatile species. During the
optimizations, black precipitates were observed in the reaction and stripping coils.
Adsorptions on the dead volume of the GLS and black precipitates in the tubings
caused serious memory problems. In the optimization of HNO3 concentration,
changes in the degree of the saturation of the system caused sensitivity loss and
further development could not be done.
Second part of the study involves determination of thallium by a special flow
injection volatile compound generation AAS system. The most important feature of
this system was that it was based on fast separation of gaseous phase from the
solution. This feature enabled reducing most of the memory effect. 0.5 mol/L
acidity and 3.0% (m/v) for NaBH4 concentration were effective in increasing the
analytical signal. In addition, 0.005% (m/v) rhodamine B in the presence of 1.0 mg/L

65
Pd hastened the reaction and enhanced peak height of the analytical signal. Type of
the acid used was affected peak height and peak shapes of the signals obtained
from Tl+ and Tl3+ species.
Third part deals with the reasons of peak broadening in the signals. The sources of
memory effects causing peak broadening in the signals were investigated by
changing the location of introduction for the Ar. It was found that, most of the
memory effect was coming from the GLS or before the GLS. T-tube atomizer was
also some source of memory.
The last part of the study was a search for the nature and behavior of the Tl volatile
species. It was shown that when a filter was placed in the system, no absorbance
value was obtained from Tl volatile species which were trapped on the filter.
According to TEM and EDS results, Tl and also Pd nanoparticles were retained on
the carbon/formvar coated Cu grids.

66
5
REFERENCES
Anderson, J. R. (1953). Detection and Determination of Thallium. Anal. Chem. , 25, 108-112.
Arbab-Zavar, M. H., Chamsaz, M., Yousefi, A., & Ashraf, N. (2009). Electrochemical Hydride
Generation of Thallium. Talanta , 79, 302-307.
Arslan, Y., Matoušek, T., Kratzer, J., Musil, S., Benada, O., Vobecký, M., et al. (2011). Gold
Volatile Compound Generation: Optimization, Efficiency and Characterization of the
Generated Form. J. Anal. At. Spectrom. , 26, 828-837.
Asami, T., Mizui, C., Shimada, T., & Kubota, M. (1996). Determination of Thallium in Solids
by Flame Atomic Absorption Spectrometry. Fresen. J. Anal. Chem. , 356, 348-351.
Ataman, O. Y. (2008). Vapor Generation and Atom Traps: Atomic Absorption Spectrometry
at the ng/L Level. Spectrochim. Acta, Part B , 63, 825-834.
Bakırdere, S., Aydın, F., Bakırdere, E. G., Titretir, S., Akdeniz, İ., Aydın, I., et al. (2011). From
mg/kg to pg/kg Levels: A Story of Trace Element Determination: A Review. Appl. Spectrosc.
Rev. , 46, 38-66.
Blumenthal, B., Sellers, K., & Koval, M. (2006). Thallium and Thallium Compounds. Kirk-
Othmer Encycl. Chem. Technol. , 23, 1-16.
Broekaert, J. A. (2005). Analytical Atomic Spectrometry with Flames and Plasmas (Second,
Completely Revised and Extended Edition ed.). Weinheim: WILEY-VCH.
Campbell, A. D. (1992). A Critical Survey of Hydride Generation Techniques in Atomic
Spectroscopy. Pure Appl. Chem. , 64, 227-244.
Dadfarnia, S., Assadollahi, T., & Haji Shabani, A. M. (2007). Speciation and Determination of
Thallium by On-line Microcolumn Separation/Preconcentration by Flow Injection-Flame
Atomic Absorption Spectrometry Using Immobilized Oxine as Sorbent. J. Hazard. Mater. ,
148, 446-452.
Das, A. K., Chakraborty, R., Cervera, M. L., & Guardia, M. d. (2006). Determination of
Thallium in Biological Samples. Anal. Bioanal. Chem. , 385, 665-670.
Dědina, J. (2010). Generation of Volatile Compounds for Analytical Atomic Spectroscopy.
Encyclopedia of Analytical Chemistry , DOI:10.1002/9780470027318.a9127.

67
Dědina, J., & Tsalev, D. L. (1995). Hydride Generation Atomic Absorption Spectrometry.
Chichester: John Wiley & Sons Ltd.
Ebdon, L., Goodal, P., Hill, S. J., Stockwell, P., & Thompson, K. C. (1995). Improved Thallium
Hydride Generation Using Continuous Flow Methodologies. J. Anal. At. Spectrom. , 10, 317-
320.
Ensafı, A. A., & Rezaei, B. (1998). Speciation of Thallium by Flow Injection Analysis with
Spectrofluorimetric Detection. Microchem. J. , 60, 75-83.
Florence, T. M. (1986). Electrochemical Approaches to Trace Element Speciation in Waters.
A Review. Analyst , 111, 489-505.
Frech, W., & Baxter, D. C. (1996). Spatial Distributions of Non-atomic Species in Graphite
Furnaces. Spectrochim. Acta, Part B , 51, 961-972.
Hosseini, M. S., Chamsaz, M., Raissi, H., & Naseri, Y. (2005). Flotation Separation and
Electrothermal Atomic Absorption Spectrometric Determination of Thallium in Wastewater
Samples. Anal. Chim. , 96, 109-116.
Kazantzis, G. (2000). Thallium in the Environment and Health Effects. Environ. Geochem.
Health , 22, 275-280.
Keith, L. H., & Telliard, W. (1979). ES&T Special Report: Priority Pollutants: I-a Perspective
View. Environ. Sci. Technol. , 13, 416-423.
Kumar, A. R., & Riyazuddin, P. (2010). Chemical Interferences in Hydride-Generation Atomic
Spectrometry. Trends Anal. Chem. , 29, 166-176.
Laborda, F., Bolea, E., Baranguan, M. T., & Castillo, J. R. (2002). Hydride Generation in
Analytical Chemistry and Nascent Hydrogen: When is it Going to be Over? Spectrochim.
Acta, Part B , 57, 797-802.
Liao, Y.-P., Chen, G., Yan, D., Li, A.-M., & Ni, Z.-M. (1998). Investigation of Thallium Hydride
Generation Using in Situ Trapping in Graphite Tube by Atomic Absorption Spectrometry.
Anal. Chim. Acta , 360, 209-214.
Lin, T. S., & Nriagu, J. O. (1999). Thallium Speciation in River Waters with Chelex-100 Resin.
Anal. Chim. Acta , 395, 301-307.
L'vov, B. L. (2005). Fifty Years of Atomic Absorption Spectrometry. J. Anal. Chem. , 60, 382-
392.
Meeravali, N. N., & Jiang, S.-J. (2008). Ultra-trace Speciation Analysis of Thallium in
Environmental Water Samples by Inductively Coupled Plasma Mass Spectrometry After a
Novel Sequental Mixed-micelle Cloud Point Extraction. J. Anal. At. Spectrom. , 23, 555-560.

68
Musil, S., Kratzer, J., Vobecký, M., Benada, O., & Matoušek, T. (2010). Silver Chemical Vapor
Generation for Atomic Absorption Spectrometry: Minimization of Transport Losses,
Interferences and Application to Water Analysis. J. Anal. At. Spectrom. , DOI:
10.1039/c0ja00018c.
Pavlíčkova, J., Zbíral, J., Smatanová, M., Habarta, P., Houserová, P., & Kubáň, V. (2006).
Uptake of Thallium from Naturally-Contaminated Soils into Vegetables. Food Addit.
Contam. , 23, 484-491.
Pérez-Ruiz, T., Martínez-Lozano, C., Tomás, V., & Casajús, R. (1996). Simple Flow Injection
Spectrofluorimetric Method for Speciation of Thallium. The Analyst , 121, 813-816.
Pohl, P. (2004). Recent Advances in Chemical Vapour Generation via Reaction with Sodium
tetrahydroborate. Trends Anal. Chem. , 23, 21-27.
Scheckel, K. G., Lombi, E., Rock, S. A., & Mclaughlin, M. J. (2004). In Vivo Synchrotron Study
of Thallium Speciation and Compartmentation in Iberis Intermedia. Environ. Sci. Technol. ,
38, 5095-5100.
Shan, X.-Q., Ni, Z.-M., & Zhang, L. (1984). Application of Matrix Modification in
Determination of Thallium in Waste Water by Graphite-Furnace Atomic-Absorption
Spectrometry. Talanta , 31, 150-152.
Slavin, W., & Manning, D. C. (1980). The L'vov Platform for Furnace Atomic Absorption
Analysis. Spectrochim. Acta, Part B , 35, 701-714.
Sturgeon, R. E., Guo, X., & Mester, Z. (2005). Chemical Vapor Generation: Are Further
Advances Yet Possible? Anal. Bioanal. Chem. , 382, 881-883.
Tsalev, D. L. (1999). Hyphenated Vapour Generation Atomic Absorption Spectrometric
Techniques. J. Anal. At. Spectrom. , 14, 147-162.
Vale, M. G., Silva, M. M., Welz, B., & Newka, R. (2002). Control of Spectral and Non-spectral
Interferences in the Determination of Thallium in River and Marine Sediments Using Solid
Sampling Electrothermal Atomic Absorption Spectrometry. J. Anal. At. Spectrom. , 17, 38-
45.
Welz, B., & Sperling, M. (1999). Atomic Absorption Spectrometry (3 ed.). Weinheim: WILEY-
VCH.
Xu, S., Zhou, H., Du, X., & Zhu, D. (2001). Enhancement Reagents for Response Signals of
Copper, Gold and Thallium in Flow Injection Vapor Generation AAS. Chem. J. Int. , 3, 29-34.
Yan, D., Yan, Z., Cheng, G.-S., & Li, A.-M. (1984). Determination of Indium and Thallium by
Hydride Generation and Atomic-Absorption Spectrometry. Talanta , 31, 133-134.

69
Zen, J.-M., & Wu, J.-W. (1997). Square-wave Voltammetric Stripping Analysis of Thallium(III)
at a Poly(4-vinylpyridine)/mercury Film Electrode. Electroanalysis , 9, 302-306.
Zendelovska, D., & Stafilov, T. (2001). Extraction Separation and Electrothermal Atomic
Absorption Spectrometric Determination of Thallium in Some Sulfide Minerals. Anal. Sci. ,
17, 425-428.
Zhu, D., & Xu, S. (2000). Enhancement of Thallium Response by Flow Injection Hydride
Generation AAS Using Palladium and Rhodamine B. At. Spectrosc. , 21, 136-142.


![SPEKTROMETRI MASSA - · PDF fileContoh spektrum asam ... radikal kation [M] ... CHEMICAL IONIZATION (NCI) mode • Dalam kondisi CI, reagen gas menghasilkan reagen ion](https://img.pdfslide.us/doc/110x75/5aaedbfe7f8b9a3a038ca8ce/spektrometri-massa-spektrum-asam-radikal-kation-m-chemical-ionization.jpg)