Embed Size (px)
Citation preview
1
1D and 2D Hydraulic Simulations for Bridge Scour Prediction: A Comparative Study
Xinbao Yu1 and Xiong (Bill) Yu2
1 Graduate Assistant, Department of Civil Engineering, Case Western Reserve University (10900 Euclid Ave., Cleveland, OH 44106, USA)
E-mail:[email protected] 2 Assistant Professor, Member ICSMGE, Department of Civil Engineering, Case Western Reserve University
(10900 Euclid Ave., Cleveland, OH 44106, USA) E-mail: [email protected]
This paper compares the use of 1D and 2D hydraulic models for bridge scour prediction. Two representative computational software developed by Federal Highway Administration (FHWA), HEC-RAS and Flo2dh, are used as the benchmark comparison bases. The procedures for model construction and scour estimation are illustrated by developing simulation examples. The comparison shows that 1D model using HEC-RAS, while is easy to construction, does not account for the effects of flow disturbance due to hydraulic obstructions. These include the spatial variation of the alignment angle, which significantly affects the depth of scour prediction. Higher dimensional mode such as Flo2dh captures the effects of flow field distribution. It is however difficult to use and requires deliberations to run proper simulations. Further development of computational simulation and visualization technologies is necessary and will help place computer aided bridge scour simulations into the hands of practitioners. Key Words : Hydraulic modeling of bridges, HEC-RAS, Flo2dh, Bridge Scour
1. INTRODUCTION The catastrophic collapse of the Schoharie Creek Bridge on the New York State Thruway in April 1987 during a near record flood, which caused 10 fatalities, focused the U.S. national attention on the bridge scour problem1). Bridge scour or bridge sediments scour is the lowering of streambed around bridge piers or abutments. Over the last few decades, scour is the most common cause of the collapse of in-service bridges. It also contributes to high construction and maintenance cost for bridges over waterways. Federal Highway Administration (FHWA) design guide requires bridge foundations to withstand the effects of scour induced by floods of 100-year return period. Evaluation of bridge scour is mandatory for the design of new bridges or rehabilitation of the existing ones. Accurate scour prediction is essential for implementing an economic countermeasure design. As computers become widely used in every aspects of engineering design, the way of performing
hydraulic analysis has also changed dramatically. Hydraulic modelers become more relied on the “user friendly” modeling programs. However, sometimes, modelers are more well-trained with the computer program, but less well-trained with the theory basis behind the program2). For bridge scour analysis there are various existing modeling systems, for 1D simulation such as HEC-RAS and WSPRO, 2D simulation such as Flo2dh and SED2D, or 3D simulation such as Flow3D and CCHE3D. The modelers are facing with difficult task of choosing the appropriate tools for a given application. One of the mostly widely used computer program for bridge scour analysis is HEC-RAS, a one dimensional hydraulic analyses program with scour estimation modules. It predicts scour at bridge crossing reasonably well for simple regular channel. It however was found either significantly overpredict or underpredict scour compared with actual field observation. For river channels with complex geometries or where lateral distribution of flow is of concern such as bridge openings, two or two
226
A-21 Fourth International Conference on Scour and Erosion 2008
2
dimensional model is preferred. Three-dimensional model provides the most realistic simulation of flow field under turbulence conditions adjacent to bridge piers and abutments. The modeling process, however, can be complex; besides, solving a 3D model requires significant amount of computational time. 1D and 2D hydraulic models remain most frequently used. With progresses in computational technology, this barrier will only be reduced with time. This paper presents a comparison study of 1D and 2D models for bridge scour simulation. HEC-RAS and FESWMS Flo2dh are selected as representatives of 1D and 2D models. The procedures in model construction and typical results of simulation from these two programs are compared. A few important aspects were highlighted such as the effects of spatial topography on the flow field distribution and bridge scour prediction.
2. BACKGROUND (1) Introduction to HEC-RAS HEC-RAS (River Analysis System) is bridge scour prediction software developed by the Army Corps of Engineers Hydrologic Engineering Center (HEC). It has been widely used by state DOTs and private design practitioners. The first version of HEC-RAS (version 1.0) was released in July of 1995. The most current version at the moment of writing is version 4.0 Beta. The detailed hydraulic evaluations have been performed using techniques outlined in Hydraulic Engineering Circular No. 183). It provides predictive scour-depth computations using parameters from a one-dimensional hydraulic analysis. Field observations show that bridge scour predicted by HEC-RAS generally overestimated the actual scour depth. One of the reasons is that scour prediction equations used in HEC-RAS was developed based on scaling up the laboratory results, which are difficult to satisfy both the hydraulic and hydrodynamic similitude. The assumption of one dimensional flow is another potential source of errors. The basic computational procedure in HEC-RAS is based on solving the one dimensional energy equation. Energy losses are accounted for by friction (Manning's equation) and contraction/expansion (coefficient multiplied by the change in velocity head). The momentum equation is utilized in situations where the water surface profile is rapidly varied. These situations include mixed flow regime calculations (i.e., hydraulic jumps), hydraulics of bridges, and evaluating profiles at river confluences
(stream junctions)4). (2) Introduction to FESWMS Flo2dh Flo2dh, part of the Federal Highway Administration’s (FHWA) Finite Element Surface-water Modeling System (FESWMS), is a two-dimensional finite element model that was developed by the U.S. Geological Survey in cooperation with the FHWA. The software was developed for analyzing backwater and flow distribution at width constrictions and highway crossings of rivers and flood plains5). It supports both supercritical and subcritical flow analysis. This code solves two dimensional flow equations based on the continuity of mass and momentum; it assumes a depth-averaged flow, as opposed to cross-section averaged flow in one dimensional models. This program can simulate movement of water and non-cohesive sediment in rivers, estuaries, and coastal waters. The software was special designed to model highway river crossings where complex hydraulic conditions exist, which is to address the shortcomings that conventional one-dimensional flow calculations cannot provide the needed level of solution details at these locations6). This code, however, has not enjoyed widespread use due to difficulty in use and also the very limited number of actual applications that subjected to field verification. (3) Models for Scour Prediction Computational software such as HEC-RAS and Flo2dh simulates the flow field under different levels of assumptions. They are combined with scour prediction formulas for scour depth estimation. Scour occurring at bridge crossing generally include three components: 1) Long-term aggradation and degradation of the river bed, 2) general scour at bridge (including contraction scour and other general scour), and 3) local scour at the piers or abutments3). Based on the existence of sediment transportation, scour was classified as clear-water scour and live-bed scour. Two of the scour prediction formulas (i.e., Froehlich equation (Eq. (1)) and HEC-18 equation (or CSU equation, Eq. (2)) available in both programs are introduced below.
( ) aDFryays += − 09.050
22.01
47.01
62.0'35.0 φ (1) where ys is the depth of pier scour; φ is Correction factor for pier nose shape: φ = 1.3 for square nose piers; φ = 1.0 for rounded nose piers; and φ = 0.7 for sharp nose (triangular) piers; a′ is the projected pier width with respect to the direction of the flow, feet
227
3
(m). y1 is the flow depth directly upstream of the pier in feet (m). Fr1 is Froude Number directly upstream of the pier; D50 is median diameter of the bed material, feet (m); a is the pier width4). 43.035.065.0
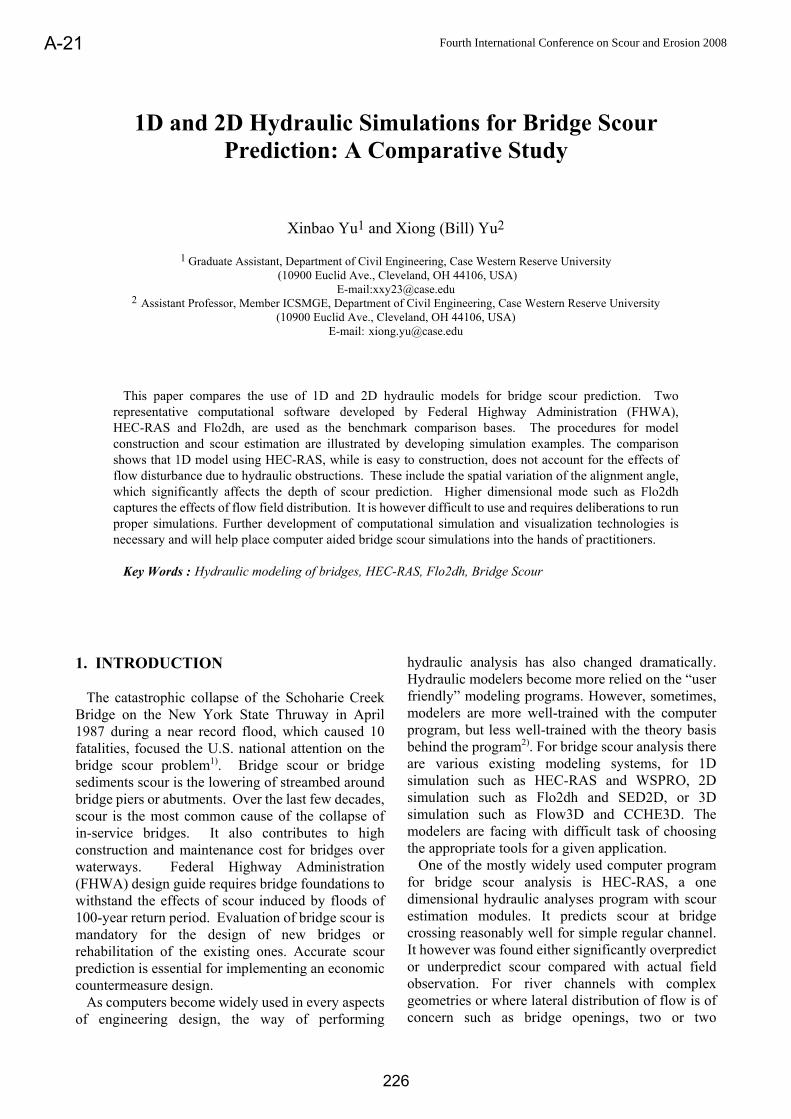
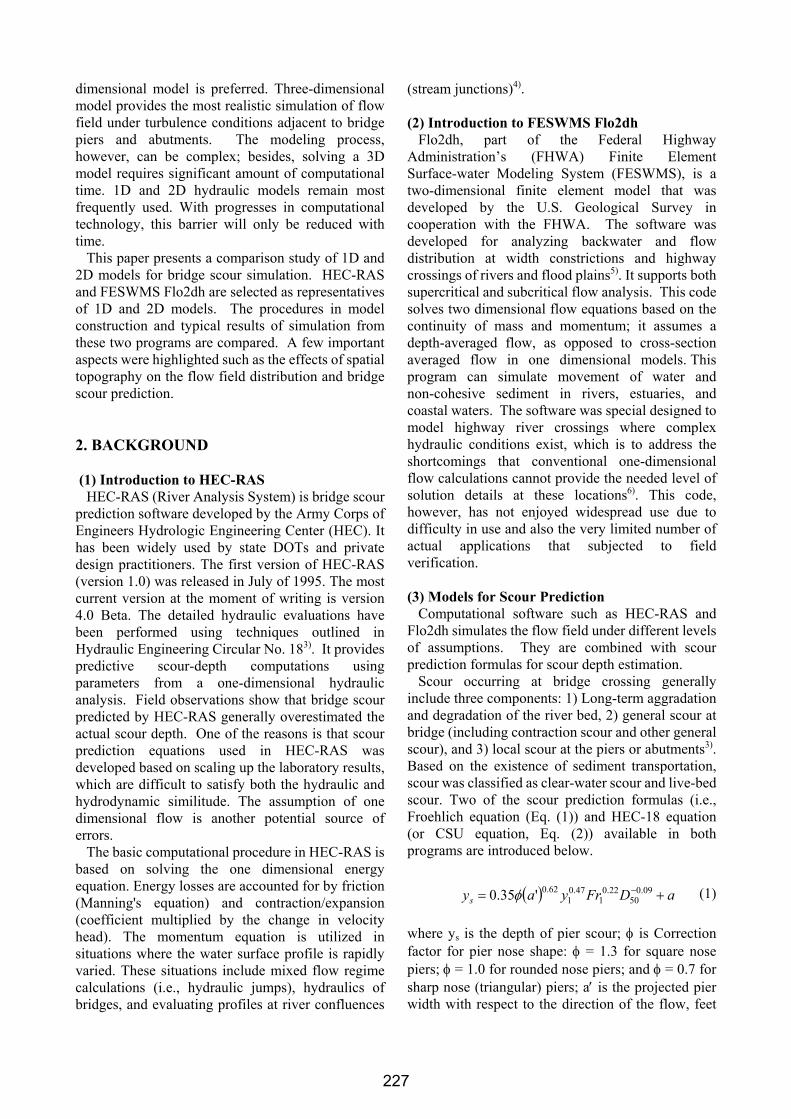
43210.2 aasl FrybKKKKd = (2) where K1 = pier shape factor, K2 = flow alignment factor, K3 = bed condition factor, K4 = bed armoring factor, b = pier width, ya = approach flow depth, Fra= approach flow Froude number, and Va = depth-averaged velocity of the approach flow6). Both HEC-RAS and Flo2dh predict scour depth utilizing the empirical scour prediction equation with the calculated quantities (for example, water depth and velocity of flow) or preset quantities (pier width, grain size of bed materials and other parameters). HEC-RAS can predict contraction scour, abutment scour and pier scour; while in Flo2dh, contraction scour and pier scour can be calculated. For comparison purpose, only pier scour is studied in the paper. 3. HYDRAULIC MODELING To perform scour analysis, a river model containing bridge crossing needs to be set up first. With this model, flow conditions (water depth and velocity of flow) at the bridge crossing can be determined. (1) Procedures of Modeling by HEC-RAS To calculate scour at bridges, a hydraulic model of the river reach that contains the bridge crossings must be developed at first. An example of HEC-RAS river model is shown in Figure 1. To calculate energy losses due to construction of bridge crossing, four user-defined cross sections need to be specified on the river channel near the bridge. The flow distribution option in the HEC-RAS software allows for additional output showing the distribution of flow for multiple subdivisions of the left and right riverbanks as well as the main channel. Information that can be output for each flow slice include the percentage of flow, flow area, wetted perimeter, conveyance, hydraulic depth and average velocity. Up to a maximum of 45 total slices can be output for each flow element (left riverbank, main channel, and right riverbank)4). After incorporating the flow distribution data and specifying the boundary conditions, steady flow analysis under subcritical regime can then be performed. This step determines the velocity and depth of flow around bridge crossing. An example output of flow
distribution at a bridge crossing section is shown in Figure 2. After the velocity and water level at the bridge cross section are obtained, scour analysis can be performed. For the pier scour analysis, the model has the option of using either the CSU equation (Eq. (2)) or the Froehlich equation (Eq. (1)). The predicted scour depth can then be visually presented. A screen shot of the program’s scour analysis module with result display is shown in Figure 3.
Figure 1. Screen shot of river model in HEC-RAS
0 500 1000 1500 2000 2500 30000
5
10
15
20
25
Bridge Scour - Example 11 Plan: Scour Plan 1 4/27/2008 Example Bridge
Station (ft)
Elev
atio
n (ft
)
Legend
EG PF 1
WS PF 1
Crit PF 1
4 ft/s
6 ft/s
8 ft/s
10 ft/s
12 ft/s
14 ft/s
Ground
Ineff
Bank Sta
.042 .032 .042
Figure 2. Output of flow distribution at the bridge cross section
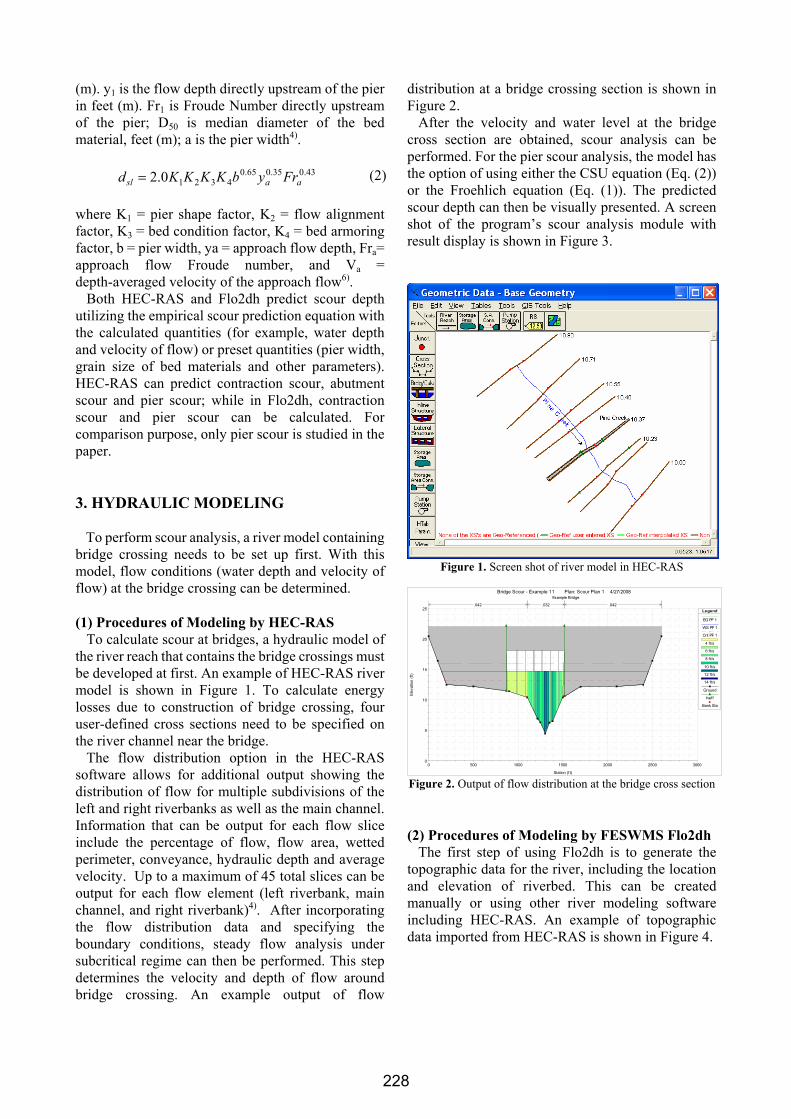
(2) Procedures of Modeling by FESWMS Flo2dh The first step of using Flo2dh is to generate the topographic data for the river, including the location and elevation of riverbed. This can be created manually or using other river modeling software including HEC-RAS. An example of topographic data imported from HEC-RAS is shown in Figure 4.
228
4
Figure 3. Screen shot of bridge scour analysis in HEC-RAS
Figure 4. Scatter data points for mesh generating
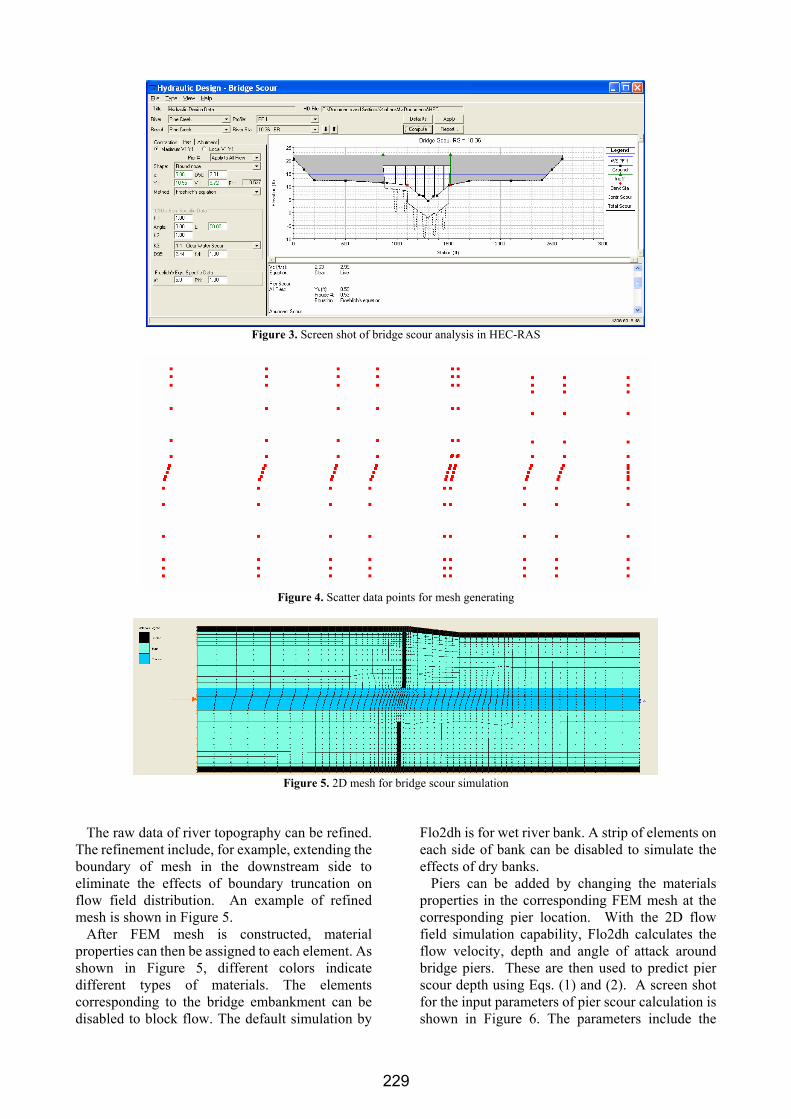
Figure 5. 2D mesh for bridge scour simulation
The raw data of river topography can be refined. The refinement include, for example, extending the boundary of mesh in the downstream side to eliminate the effects of boundary truncation on flow field distribution. An example of refined mesh is shown in Figure 5. After FEM mesh is constructed, material properties can then be assigned to each element. As shown in Figure 5, different colors indicate different types of materials. The elements corresponding to the bridge embankment can be disabled to block flow. The default simulation by
Flo2dh is for wet river bank. A strip of elements on each side of bank can be disabled to simulate the effects of dry banks. Piers can be added by changing the materials properties in the corresponding FEM mesh at the corresponding pier location. With the 2D flow field simulation capability, Flo2dh calculates the flow velocity, depth and angle of attack around bridge piers. These are then used to predict pier scour depth using Eqs. (1) and (2). A screen shot for the input parameters of pier scour calculation is shown in Figure 6. The parameters include the
229
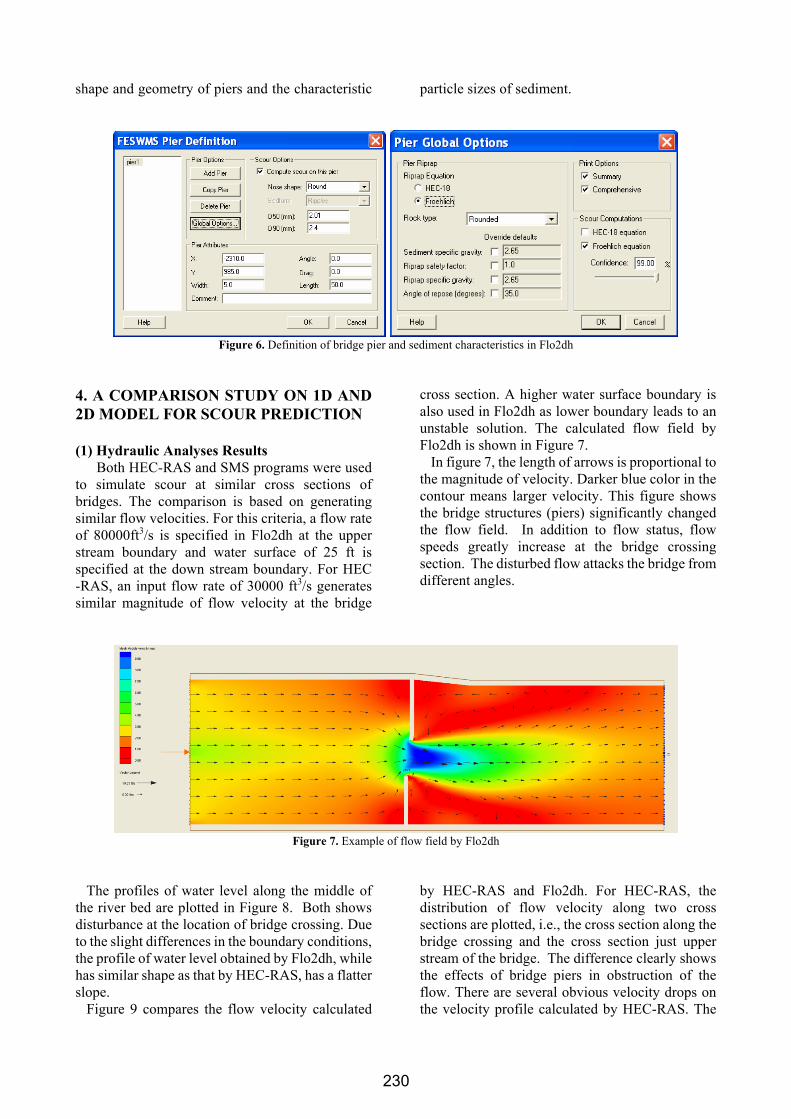
5
shape and geometry of piers and the characteristic particle sizes of sediment.
Figure 6. Definition of bridge pier and sediment characteristics in Flo2dh
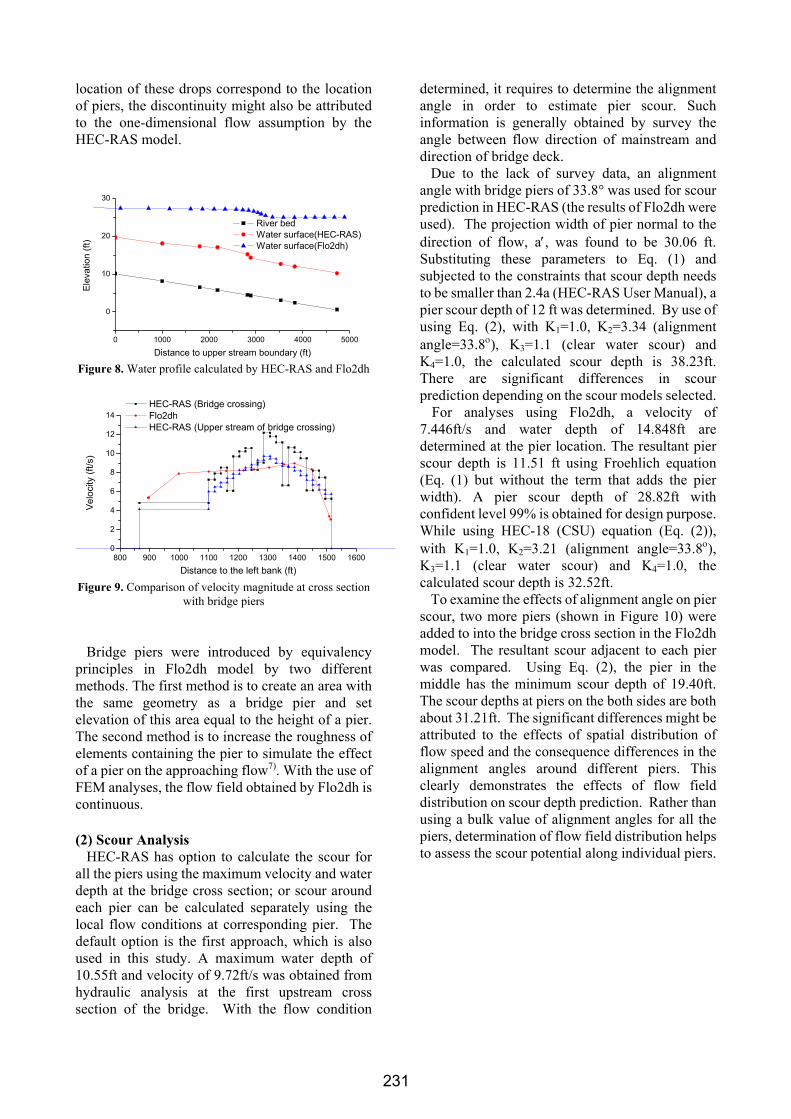
4. A COMPARISON STUDY ON 1D AND 2D MODEL FOR SCOUR PREDICTION (1) Hydraulic Analyses Results Both HEC-RAS and SMS programs were used to simulate scour at similar cross sections of bridges. The comparison is based on generating similar flow velocities. For this criteria, a flow rate of 80000ft3/s is specified in Flo2dh at the upper stream boundary and water surface of 25 ft is specified at the down stream boundary. For HEC -RAS, an input flow rate of 30000 ft3/s generates similar magnitude of flow velocity at the bridge
cross section. A higher water surface boundary is also used in Flo2dh as lower boundary leads to an unstable solution. The calculated flow field by Flo2dh is shown in Figure 7. In figure 7, the length of arrows is proportional to the magnitude of velocity. Darker blue color in the contour means larger velocity. This figure shows the bridge structures (piers) significantly changed the flow field. In addition to flow status, flow speeds greatly increase at the bridge crossing section. The disturbed flow attacks the bridge from different angles.
Figure 7. Example of flow field by Flo2dh
The profiles of water level along the middle of the river bed are plotted in Figure 8. Both shows disturbance at the location of bridge crossing. Due to the slight differences in the boundary conditions, the profile of water level obtained by Flo2dh, while has similar shape as that by HEC-RAS, has a flatter slope. Figure 9 compares the flow velocity calculated
by HEC-RAS and Flo2dh. For HEC-RAS, the distribution of flow velocity along two cross sections are plotted, i.e., the cross section along the bridge crossing and the cross section just upper stream of the bridge. The difference clearly shows the effects of bridge piers in obstruction of the flow. There are several obvious velocity drops on the velocity profile calculated by HEC-RAS. The
230
6
location of these drops correspond to the location of piers, the discontinuity might also be attributed to the one-dimensional flow assumption by the HEC-RAS model.
0 1000 2000 3000 4000 5000
0
10
20
30
River bed Water surface(HEC-RAS) Water surface(Flo2dh)
Elev
atio
n (ft
)
Distance to upper stream boundary (ft) Figure 8. Water profile calculated by HEC-RAS and Flo2dh
800 900 1000 1100 1200 1300 1400 1500 16000
2
4
6
8
10
12
14 HEC-RAS (Bridge crossing) Flo2dh HEC-RAS (Upper stream of bridge crossing)
Velo
city
(ft/s
)
Distance to the left bank (ft) Figure 9. Comparison of velocity magnitude at cross section
with bridge piers
Bridge piers were introduced by equivalency principles in Flo2dh model by two different methods. The first method is to create an area with the same geometry as a bridge pier and set elevation of this area equal to the height of a pier. The second method is to increase the roughness of elements containing the pier to simulate the effect of a pier on the approaching flow7). With the use of FEM analyses, the flow field obtained by Flo2dh is continuous. (2) Scour Analysis HEC-RAS has option to calculate the scour for all the piers using the maximum velocity and water depth at the bridge cross section; or scour around each pier can be calculated separately using the local flow conditions at corresponding pier. The default option is the first approach, which is also used in this study. A maximum water depth of 10.55ft and velocity of 9.72ft/s was obtained from hydraulic analysis at the first upstream cross section of the bridge. With the flow condition
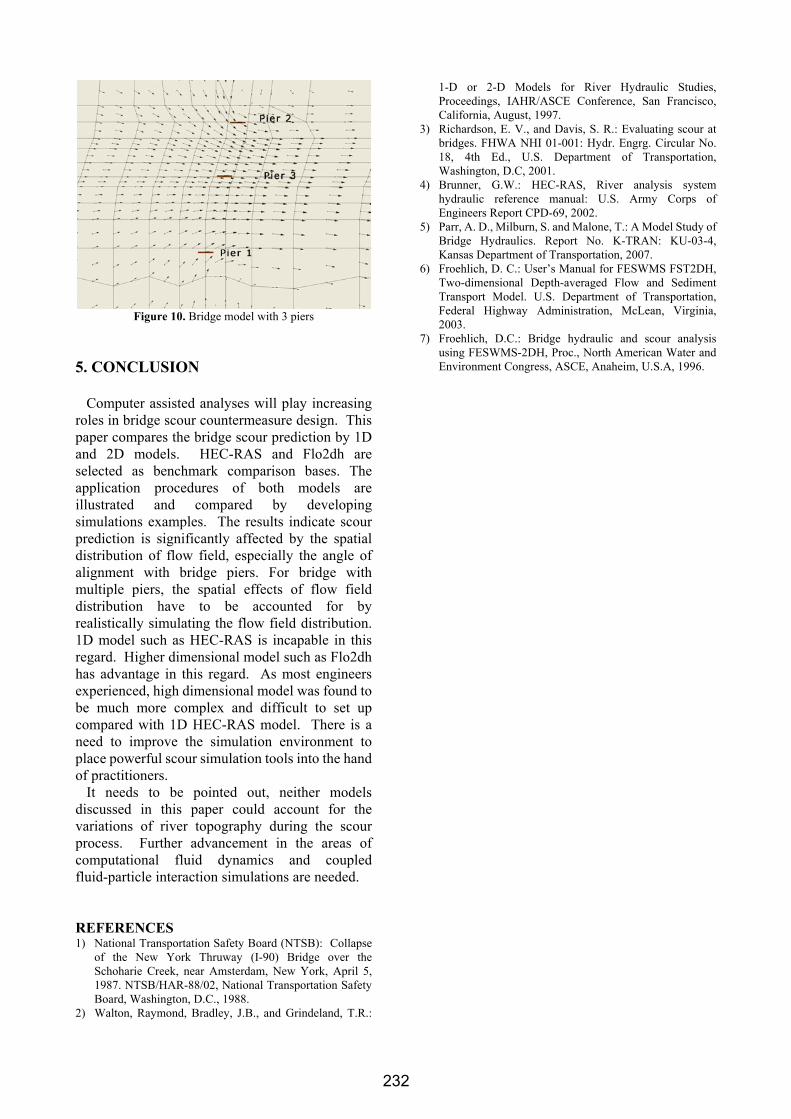
determined, it requires to determine the alignment angle in order to estimate pier scour. Such information is generally obtained by survey the angle between flow direction of mainstream and direction of bridge deck. Due to the lack of survey data, an alignment angle with bridge piers of 33.8° was used for scour prediction in HEC-RAS (the results of Flo2dh were used). The projection width of pier normal to the direction of flow, a′, was found to be 30.06 ft. Substituting these parameters to Eq. (1) and subjected to the constraints that scour depth needs to be smaller than 2.4a (HEC-RAS User Manual), a pier scour depth of 12 ft was determined. By use of using Eq. (2), with K1=1.0, K2=3.34 (alignment angle=33.8ο), K3=1.1 (clear water scour) and K4=1.0, the calculated scour depth is 38.23ft. There are significant differences in scour prediction depending on the scour models selected. For analyses using Flo2dh, a velocity of 7.446ft/s and water depth of 14.848ft are determined at the pier location. The resultant pier scour depth is 11.51 ft using Froehlich equation (Eq. (1) but without the term that adds the pier width). A pier scour depth of 28.82ft with confident level 99% is obtained for design purpose. While using HEC-18 (CSU) equation (Eq. (2)), with K1=1.0, K2=3.21 (alignment angle=33.8ο), K3=1.1 (clear water scour) and K4=1.0, the calculated scour depth is 32.52ft. To examine the effects of alignment angle on pier scour, two more piers (shown in Figure 10) were added to into the bridge cross section in the Flo2dh model. The resultant scour adjacent to each pier was compared. Using Eq. (2), the pier in the middle has the minimum scour depth of 19.40ft. The scour depths at piers on the both sides are both about 31.21ft. The significant differences might be attributed to the effects of spatial distribution of flow speed and the consequence differences in the alignment angles around different piers. This clearly demonstrates the effects of flow field distribution on scour depth prediction. Rather than using a bulk value of alignment angles for all the piers, determination of flow field distribution helps to assess the scour potential along individual piers.
231
7
Figure 10. Bridge model with 3 piers
5. CONCLUSION Computer assisted analyses will play increasing roles in bridge scour countermeasure design. This paper compares the bridge scour prediction by 1D and 2D models. HEC-RAS and Flo2dh are selected as benchmark comparison bases. The application procedures of both models are illustrated and compared by developing simulations examples. The results indicate scour prediction is significantly affected by the spatial distribution of flow field, especially the angle of alignment with bridge piers. For bridge with multiple piers, the spatial effects of flow field distribution have to be accounted for by realistically simulating the flow field distribution. 1D model such as HEC-RAS is incapable in this regard. Higher dimensional model such as Flo2dh has advantage in this regard. As most engineers experienced, high dimensional model was found to be much more complex and difficult to set up compared with 1D HEC-RAS model. There is a need to improve the simulation environment to place powerful scour simulation tools into the hand of practitioners. It needs to be pointed out, neither models discussed in this paper could account for the variations of river topography during the scour process. Further advancement in the areas of computational fluid dynamics and coupled fluid-particle interaction simulations are needed. REFERENCES 1) National Transportation Safety Board (NTSB): Collapse
of the New York Thruway (I-90) Bridge over the Schoharie Creek, near Amsterdam, New York, April 5, 1987. NTSB/HAR-88/02, National Transportation Safety Board, Washington, D.C., 1988.
2) Walton, Raymond, Bradley, J.B., and Grindeland, T.R.:
1-D or 2-D Models for River Hydraulic Studies, Proceedings, IAHR/ASCE Conference, San Francisco, California, August, 1997.
3) Richardson, E. V., and Davis, S. R.: Evaluating scour at bridges. FHWA NHI 01-001: Hydr. Engrg. Circular No. 18, 4th Ed., U.S. Department of Transportation, Washington, D.C, 2001.
4) Brunner, G.W.: HEC-RAS, River analysis system hydraulic reference manual: U.S. Army Corps of Engineers Report CPD-69, 2002.
5) Parr, A. D., Milburn, S. and Malone, T.: A Model Study of Bridge Hydraulics. Report No. K-TRAN: KU-03-4, Kansas Department of Transportation, 2007.
6) Froehlich, D. C.: User’s Manual for FESWMS FST2DH, Two-dimensional Depth-averaged Flow and Sediment Transport Model. U.S. Department of Transportation, Federal Highway Administration, McLean, Virginia, 2003.
7) Froehlich, D.C.: Bridge hydraulic and scour analysis using FESWMS-2DH, Proc., North American Water and Environment Congress, ASCE, Anaheim, U.S.A, 1996.
232