Embed Size (px)
Citation preview

1986-5
WCRP and ICTP Interpreting Climate Change Simulations: CapacityBuilding for Developing Nations Seminar
Curt Covey
26 - 30 November 2007
Lawrence Livermore National LaboratoryLivermore, California
USA
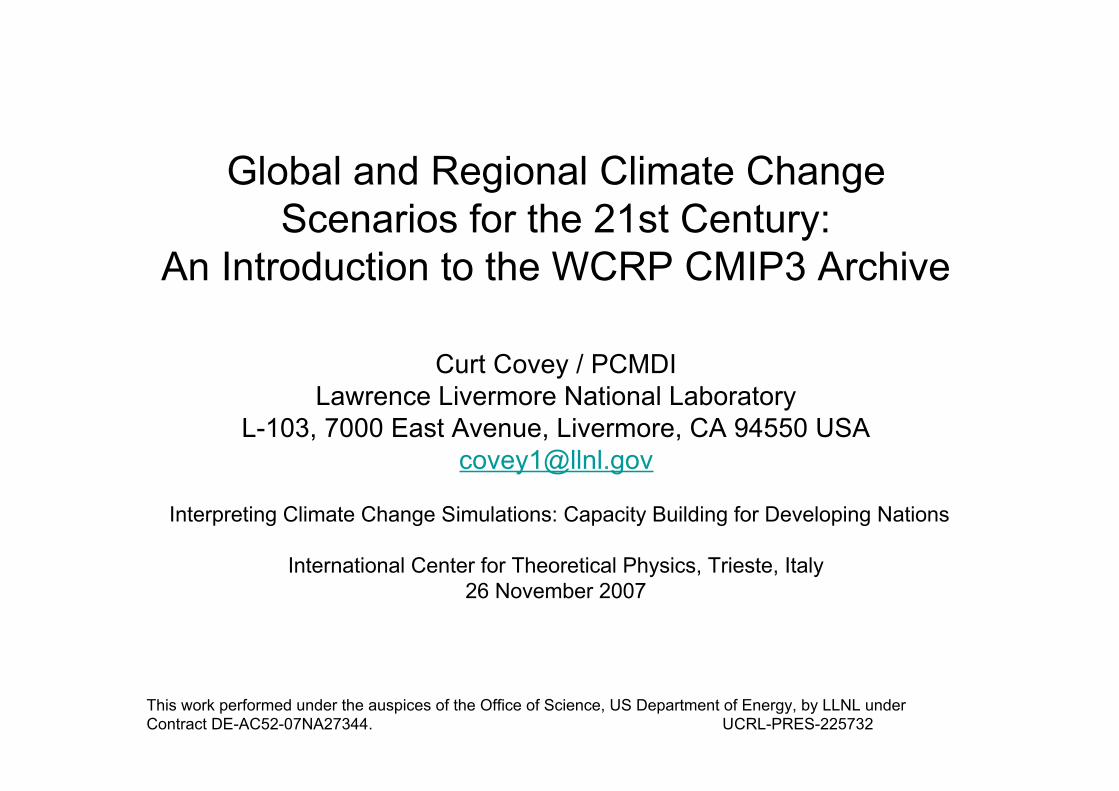
Global and Regional Climate ChangeScenarios for the 21st Century:
An Introduction to the WCRP CMIP3 Archive
Global and Regional Climate ChangeScenarios for the 21st Century:
An Introduction to the WCRP CMIP3 Archive
Curt Covey / PCMDILawrence Livermore National Laboratory
L-103, 7000 East Avenue, Livermore, CA 94550 [email protected]
Interpreting Climate Change Simulations: Capacity Building for Developing Nations
International Center for Theoretical Physics, Trieste, Italy26 November 2007
This work performed under the auspices of the Office of Science, US Department of Energy, by LLNL underContract DE-AC52-07NA27344. UCRL-PRES-225732

A brief history of the WCRP CMIP3 archiveof AOGCM output
. . . with a glossary of acronyms
1995: WCRP and PCMDI start CMIP1.1997: WCRP and PCMDI start CMIP2.2001: WCRP and PMCDI start CMIP2+.2003: WCRP asks PCMDI to collect
model output for IPCC’s upcoming4th Assessment Report.
2004: Data collection and registration ofdata-analysis projects begins.
2005: Deadline for project results to besubmitted for IPCC report -- butproject registration accelerates!
2006: “IPCC archive” renamed “CMIP3”archive.”
2007: IPCC 4th Assessment Reportpublished -- and CMIP3 projectregistration continues.
2008: CCSP SAP 3.1 published,* usingCMIP3 data.
• AOGCM = [coupled] Atmosphere-OceanGeneral Circulation Model
• CCSP = Climate Change ScienceProgram [USA]
• CMIPn = Coupled Model IntercomparisonProject, phase n
• IPCC = Intergovernmental Panel onClimate Change
• PCMDI = Program for Climate ModelDiagnosis and Intercomparison [at theLawrence Livermore National Laboratory,Livermore, California, USA]
• SAP = Synthesis and AssessmentProduct [for CCSP]
• USA = United States of America
• WCRP = World Climate ResearchProgram
* www.climatescience.gov/Library/sap/sap-summary.php: “ClimateChange Models: An Assessment of Strengths and Limitations”

It’s more than just 21stcentury scenarios!
100 200 300 400 500 600 700 800 900Simulated time since beginning of control run [ years ]
pre-industrialcontrol run*(e.g., “perpetual 1900”)
1900 2000 2100
1900 2000 2100
1900 2000 2100
20th, 21st, 22ndcentury simulations**
Run 1
Run 2
Run 3
* “Control run” means constant climate forcing (atmospheric CO2, solarenergy output, etc.). Perpetual 1990 = “present-day control.”** The ensemble members (Run 1, Run2, Run3, . . .) differ only in theirinitial conditions -- a measure of uncertainty due to chaotic effects.

Where do 21st century scenarios come from? For IPCC ...
A1B: “very rapid economicgrowth, global populationthat peaks in mid-centuryand declines thereafter, andthe rapid introduction of newand more efficienttechnologies”
A2: “continuously increasingpopulation ... per capitaeconomic growth andtechnological change morefragmented and slower”
B1: same population trendsas A1, “but with rapid changein economic structures ...introduction of clean andresource-efficienttechnologies ... includingimproved equity, but withoutadditional climate initiatives”
Future History“Story Lines”
A1B
A2
B1
Emissions Scenarios
A1B: CO2 at 720 ppm and starting to level off by end of centuryCH4 peaks mid-century, then declinesSO2 declines 75%
A2:CO2 > 800 ppm and growing rapidly by end of centuryCH4 increases throughout the centurySO2 peaks mid-century, then declines
B1:CO2 at 550 ppm and stable by end of centuryCH4 peaks early in century, then declinesSO2 declines 75%
Atmospheric ConcentrationScenarios
Economicmodels
Biogeochemicalmodels
Step (1) Step (2)

Step (3): Theoretical Climate Models
• EBM = Energy Balance Model (0-1D)
• EMIC = Earth-system Model of Intermediate Complexity (~2D, often
including biogeochemistry)
• RCM = Regional Climate Model (3D)
• GCM = General Circulation Model / Global Climate Model (3D, usually
not including biogeochemistry)– Computer program that simulates weather and climate around the world**
– Modified version of numerical weather prediction model
– Run for months → years → centuries simulated time
– Extra components added (ocean, sea ice, ...) but lower resolution
– Average over weather (extremely long-term forecasts not believable) toget climate (believable?)
Three good references:
IPCC reports (www.ipcc.ch -- Don’t be intimidated!)
McGuffie and Henderson-Sellers (2005) A Climate Modeling Primer
Washington and Parkinson (2005) An Introduction to Three-Dimensional Climate Modeling

Should we believe these models?
• Doubts about IPCC socio-economic models:– Economic growth rate for A1 implausible? I don’t think so, considering how
China and India are growing, but see• I. Castles and D. Henderson (2003) The IPCC emission scenarios: An economic-
statistical critique. Energy & Environment 14: 159-185• A Grubler et al. (2004) Emissions scenarios: A final response. Energy &
Environment 15: 11-24• A. Stegman (2006) How should emissions projections be evaluated? Climatic
Change 75: 1-7 – Population growth rate for A2 implausible? Maybe so, if there really are
limits to population growth.
• Uncertainty in biogeochemistry models – biosphere may amplify globalwarming:
From S. L. Thompson et al.(2004) GeophysicalResearch Letters 31: L23211
black dots observedgreen line — first modelred line — second model(with land biospheresaturation happening early)
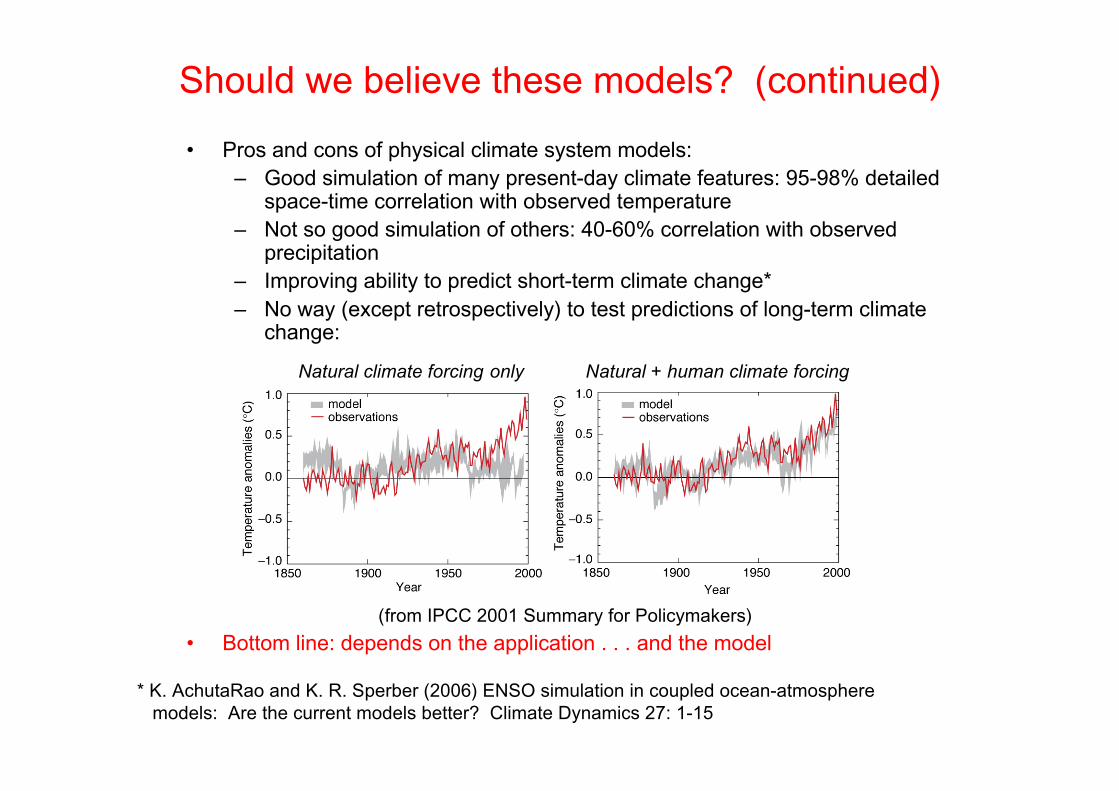
Should we believe these models? (continued)
• Pros and cons of physical climate system models:– Good simulation of many present-day climate features: 95-98% detailed
space-time correlation with observed temperature– Not so good simulation of others: 40-60% correlation with observed
precipitation– Improving ability to predict short-term climate change*– No way (except retrospectively) to test predictions of long-term climate
change:
(from IPCC 2001 Summary for Policymakers)
• Bottom line: depends on the application . . . and the model
* K. AchutaRao and K. R. Sperber (2006) ENSO simulation in coupled ocean-atmosphere models: Are the current models better? Climate Dynamics 27: 1-15
Natural climate forcing only Natural + human climate forcing

Past changes from North et al. (2006), Executive Summary, SurfaceTemperature Reconstructions for the Last 2000 Years, U.S. NationalAcademy of Sciences / National Research Council, ISBN 0-309-10225-1:
How would expected 21st centuryglobal warming compare with pastclimate changes?
Future rates of change from IPCC (2007):
lower limit = 1.1 °C / (2095 − 1990) upper limit = 6.4 °C / (2095 − 1990)
i.e., “The projected rate ofwarming is much larger thanthe observed changes duringthe 20th century and is verylikely to be without precedentduring at least the last 10,000years, based on paleoclimatedata.” (IPCC 2001)

What regional changes are possible in this century?
• More warming at high latitudes -- especially high northern latitudes• Speedup of hydrologic cycle: “the wet get wetter and the dry get drier.”
• For example (Meehl et al. 2006, Journal of Climate 19: 2597-2616):
• According to Hansen et al. 2007:“Ecosystems, wildlife, and humans would be subjected in the BAU [business as usualemissions] scenarios to conditions far outside their local experience” including
• Regional warming 5-10 x standard deviation for 20th century• Ice-free Arctic Ocean in summer (first time in 3 million years)• Melting Greenland ice sheet ⇒ ≥ 1 meter sea-level rise (maybe)
temperature changes in °C precipitation changes in mm / day
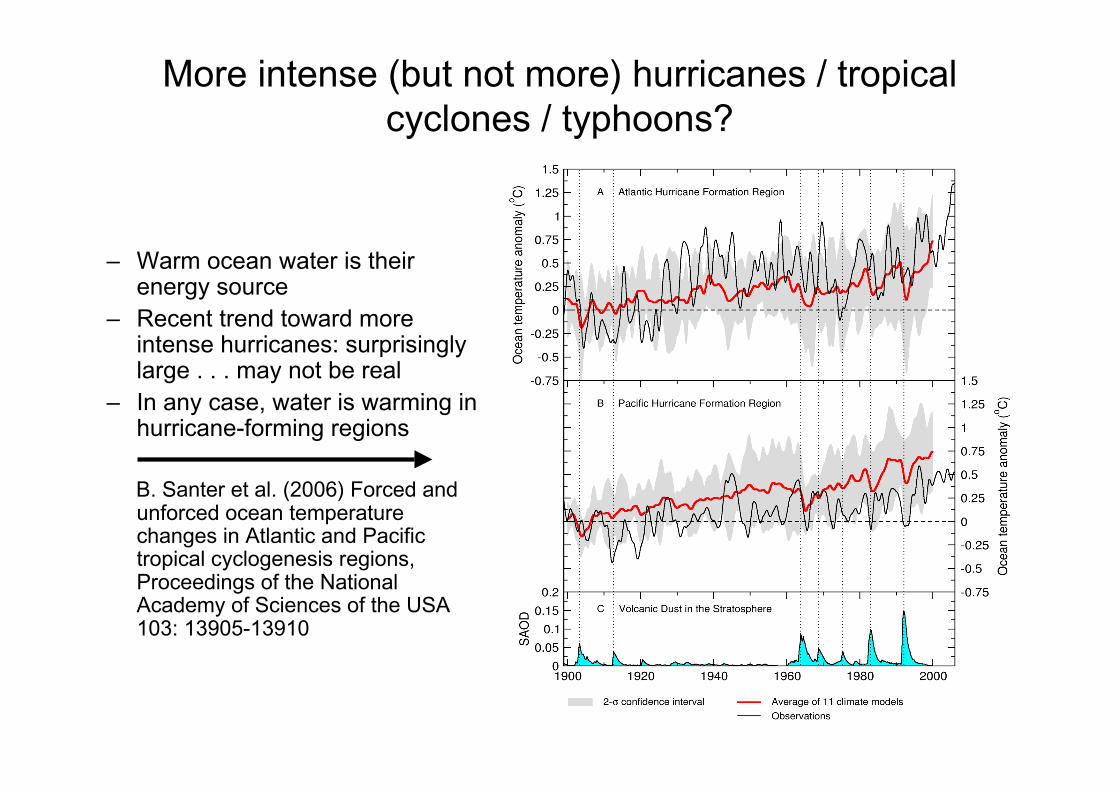
More intense (but not more) hurricanes / tropicalcyclones / typhoons?
– Warm ocean water is theirenergy source
– Recent trend toward moreintense hurricanes: surprisinglylarge . . . may not be real
– In any case, water is warming inhurricane-forming regions
B. Santer et al. (2006) Forced andunforced ocean temperaturechanges in Atlantic and Pacifictropical cyclogenesis regions,Proceedings of the NationalAcademy of Sciences of the USA103: 13905-13910

Q: Where can I get scenarios of 21st century global warming?A: CMIP3 / IPCC Database of Climate Model Output
• Total volume ~ 40 Terabytes• 23 models contributed by 19 institutions in 11 nations*
– Coupled atmosphere - ocean - sea ice - land surface GCMs– Many input scenarios
• Prescribed SST; doubled atmospheric CO2; 1% / yr increasing CO2• Pre-industrial and present-day “control runs” (constant climate forcing)• 20th century emissions, solar changes, volcanoes ...• 21st century low, medium, high (IPCC B1, A1B, A2) emissions scenarios• 22nd century continuations
– Many many output variables in standardized format, nomenclature, units• Mostly averaged over each month• Some daily-averaged data• A bit of 3-hourly data
• Available to anyone for noncommercial use:www-pcmdi.llnl.gov/ipcc/registration_procedure.php
* Australia, Canada, China, Denmark, France, Germany, Japan, Norway, Russia, UK, USA
contact Bob Drach and Karl Taylor, PCMDI / LLNL ([email protected])
What’s the catch?
• Data format is familiar to climatemodelers but unfamiliar to many others.
• You’re on your own for observationaldata.
. . . But there’s help on the Web.