Embed Size (px)
Citation preview
vV
PERATIVE HIGHWAY RESEARCH PROGRAM it' REPORT
1967 FREEWAY SURVEI LLANCE STUDY MARK TWAIN EXPRESSWA~ ST. LOUIS, MISSOURI J
MoDOT "TRANSPORTATION LIBRARY
MISSOURI STATE HIGHWAY DEPARTMENT BUREAU O F PUBLIC ROADS
So. • __ . _ -- ---
I I~
5 Q 1J . (I1Sill
fl v. 6 j·1J
1967 FREEWAY SURVEILLANCE STUDIES
MARK TWAIN EXPRESSWAY-SAINT LOUIS, MISSOURI
Prepared by
MISSOURI STATE HIGHWAY DEPARTMENT
Division of Highway Planning
November, 1968
in cooperation with
u.S. DEPARTMENT OF TRANSPORTATION FEDERAL HIGHWAY ADMINISTRATION
Bureau of Public Roads
The oplnlons , findings , and conclusions expressed in this publication are not necessarily those of the Bureau of Public Roads.
CONTENTS
Introduction .
Study Area .
Traffic Volumes
Densities
Summary
Figure
1
2
3
4
5
6
7
ILLUSTRATIONS
Mark Twain Expressway, St. Louis , Missouri.
Average October Weekday Traffic Volume .
Average October Peak Hour Traffic Volume .
Speed Vs. Density at selected Locations
Typical Urban Freeway Operation Under Various Traffic Density Levels .
Traffic Density Contours and Levels of Service During the Morning Peak Period on the Eastbound Lanes
Traffic Density Contours and Levels of Service During The Afternoon Peak Period on the Westbound Lanes .
Page
1
1
3
5
14
Page
2
4
6
8
9
10
11
Introduction
Since the movement of traffic is the purpose of freeways,
maintenance of satisfactory operating conditions is as impor
tant as maintenance of the physical structure .
This report is based on the freeway congestion studies
conducted in the summer of 1967 which were part of a continuing
surveillance of freeway operations in Missouri. This is the
second report on studies of this type on the Mark Twain Express
way. The first study was conducted during the summer of 1964
and the report published in October 1964. Should the need
develop , these studies should provide much of the information
necessary for the planning of control systems or measures designed
to improve traffic flow by pointing out areas where operations
have reached a critical level.
The primary purpose of this report is to provide an inven
tory of present operating conditions on the Mark Twain Expressway
in St . Louis rather than a detailed analysis of operations at any
location.
Study Area
The name Mark Twain Expressway applies to the portion of
Interstate Route 70 in the St. Louis Area. The area under study
begins at Carson Road and runs to Shreve Avenue, a distance of
5.29 miles. This is the same area covered in the study made in
1964.
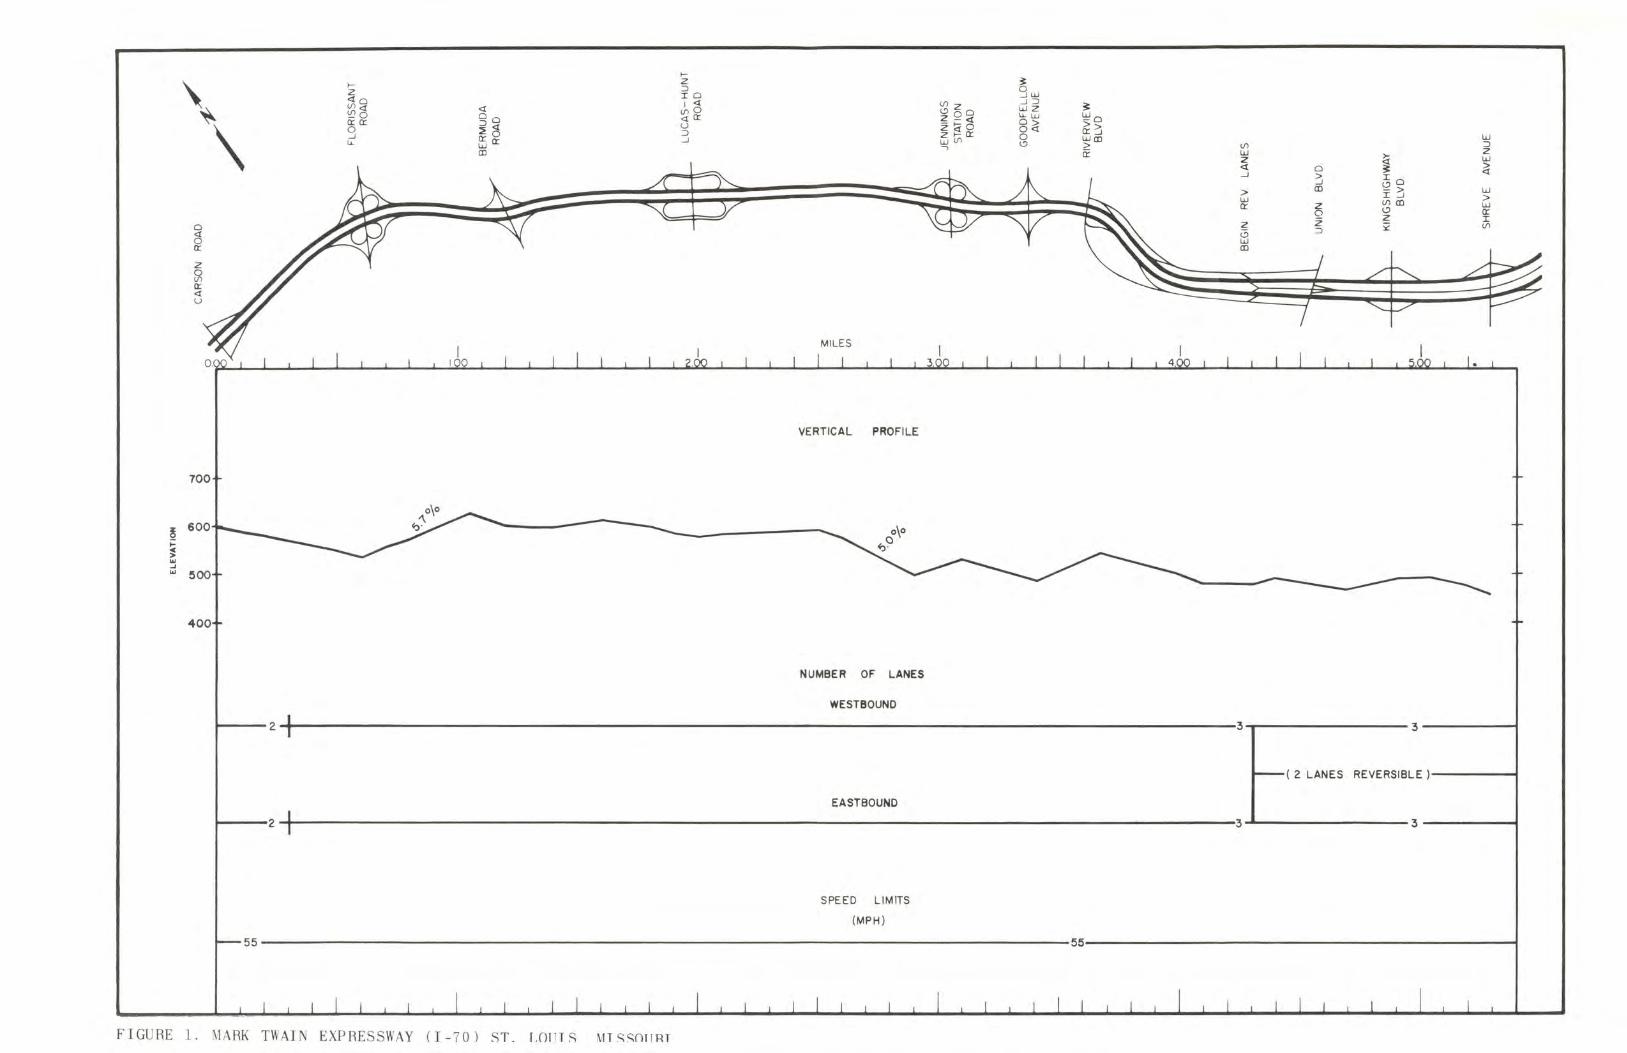
The geometrics of the s tudy section are shown in Figure 1.
The sketch at the top of the page has been distorted slightly so
1
f-
\ f- Z ~ Z
=:) Sw IO <to l<t ~ZO
.-I=:) ~ (f)<t <t (f)0 WZ
'!20 00 <to: Z Q <t U.W ~O 0:0: g~
\ 0
=:)<t u Z~O ~~ .-I ~O =:) Zf-OO: 0 W 150: .-I W(f) Wee u. \.:) > (f) =:) -, ee a: W
~ Z
Z W <t ci ~ ~ .-I
~ I . \.:)0
> CD I ~ w W > 0: Z (f)CD W
0 \.:) 0: Z Z I
0
~ ~ ~ r ~ Z 3£ (f)
<t 0 =:)
0 W 0: ee
Z 0 (f) Q:: <t U
•
VERTICAL PROFILE
100
~ 600
~
~ III ~ III 500
400
NUMBER OF LANES
WESTBOUND
~---2 I 3 i 3--------~
( 2 LANES REVERSIBLE )------4
EASTBOUND
~---2 I 3 i 3 -------4
SPEED LIMITS
(MPH)
55 55--------------------------------------------~
FIGURE 1. MARK TWAIN EXPRESSWAY (1-70) ST. 1.00ns MTSSnJ l RT
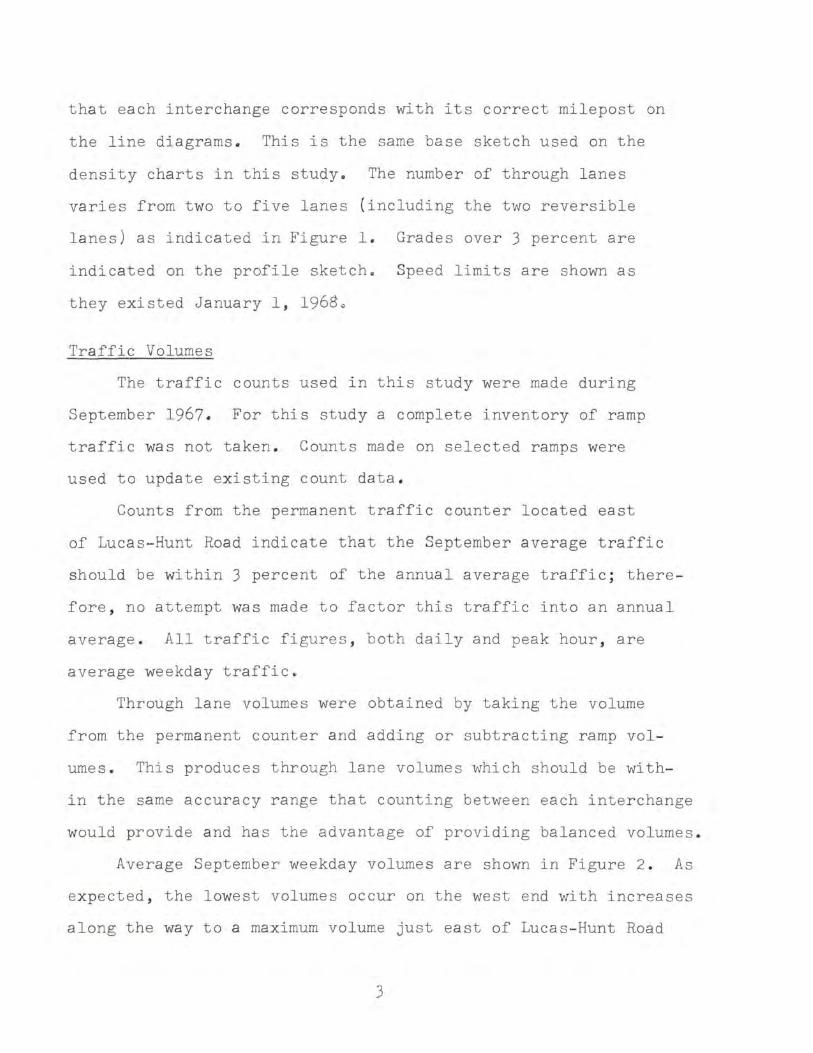
that each interchange corresponds with its correct milepost on
the line diagrams. This is the same base sketch used on the
density charts in this study. The number of through lanes
varies from two to five lanes (including the two reversible
lanes) as indicated in Figure 1. Grades over 3 percent are
indicated on the profile sketch. Speed limits are shown as
they existed January 1, 19680
Traffic Volumes
The traffic counts used in this study were made during
September 1967. For this study a complete inventory of ramp
traffic was not taken. Counts made on selected ramps were
used to update existing count data.
Counts from the permanent traffic counter located east
of Lucas-Hunt Road indicate that the September average traffic
should be within 3 percent of the annual average traffic ; there
fore, no attempt was made to factor this traffic into an annual
average. All traffic figures, both daily and peak hour , are
average weekday traffic.
Through lane volumes were obtained by taking the volume
from the permanent counter and adding or subtracting ramp vol
umes. This produces through lane volumes which should be with
in the same accuracy range that counting between each interchange
would provide and has the advantage of providing balanced volumes .
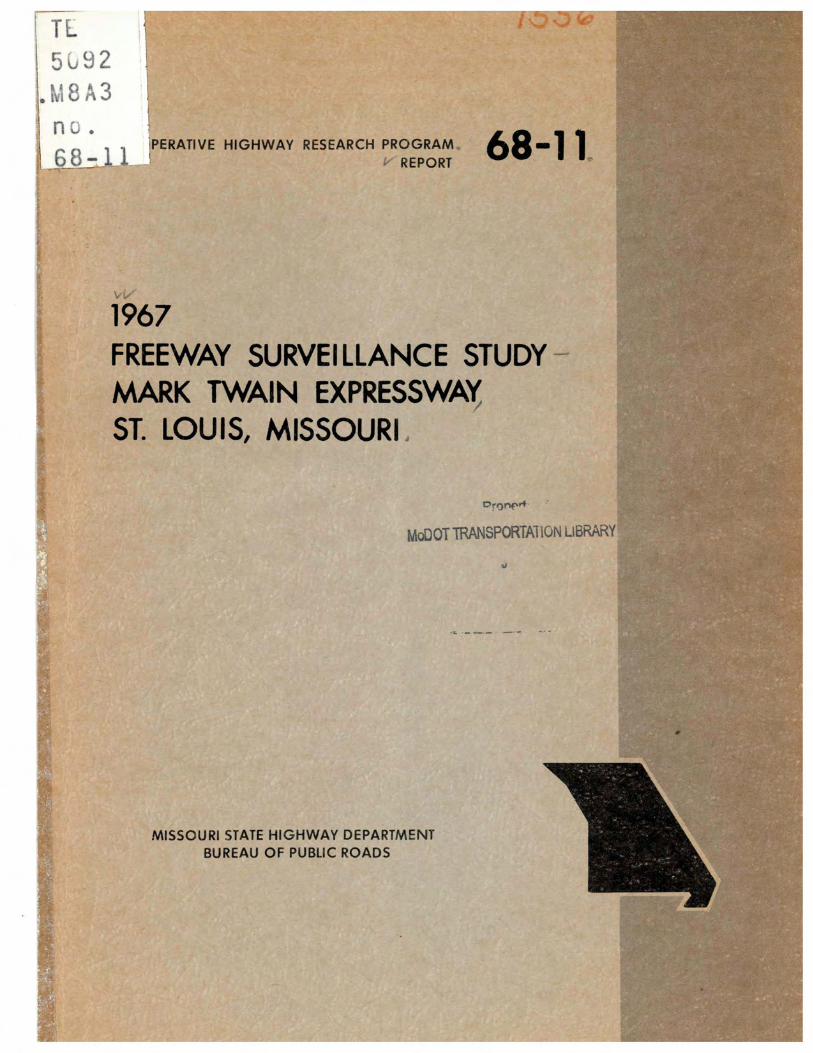
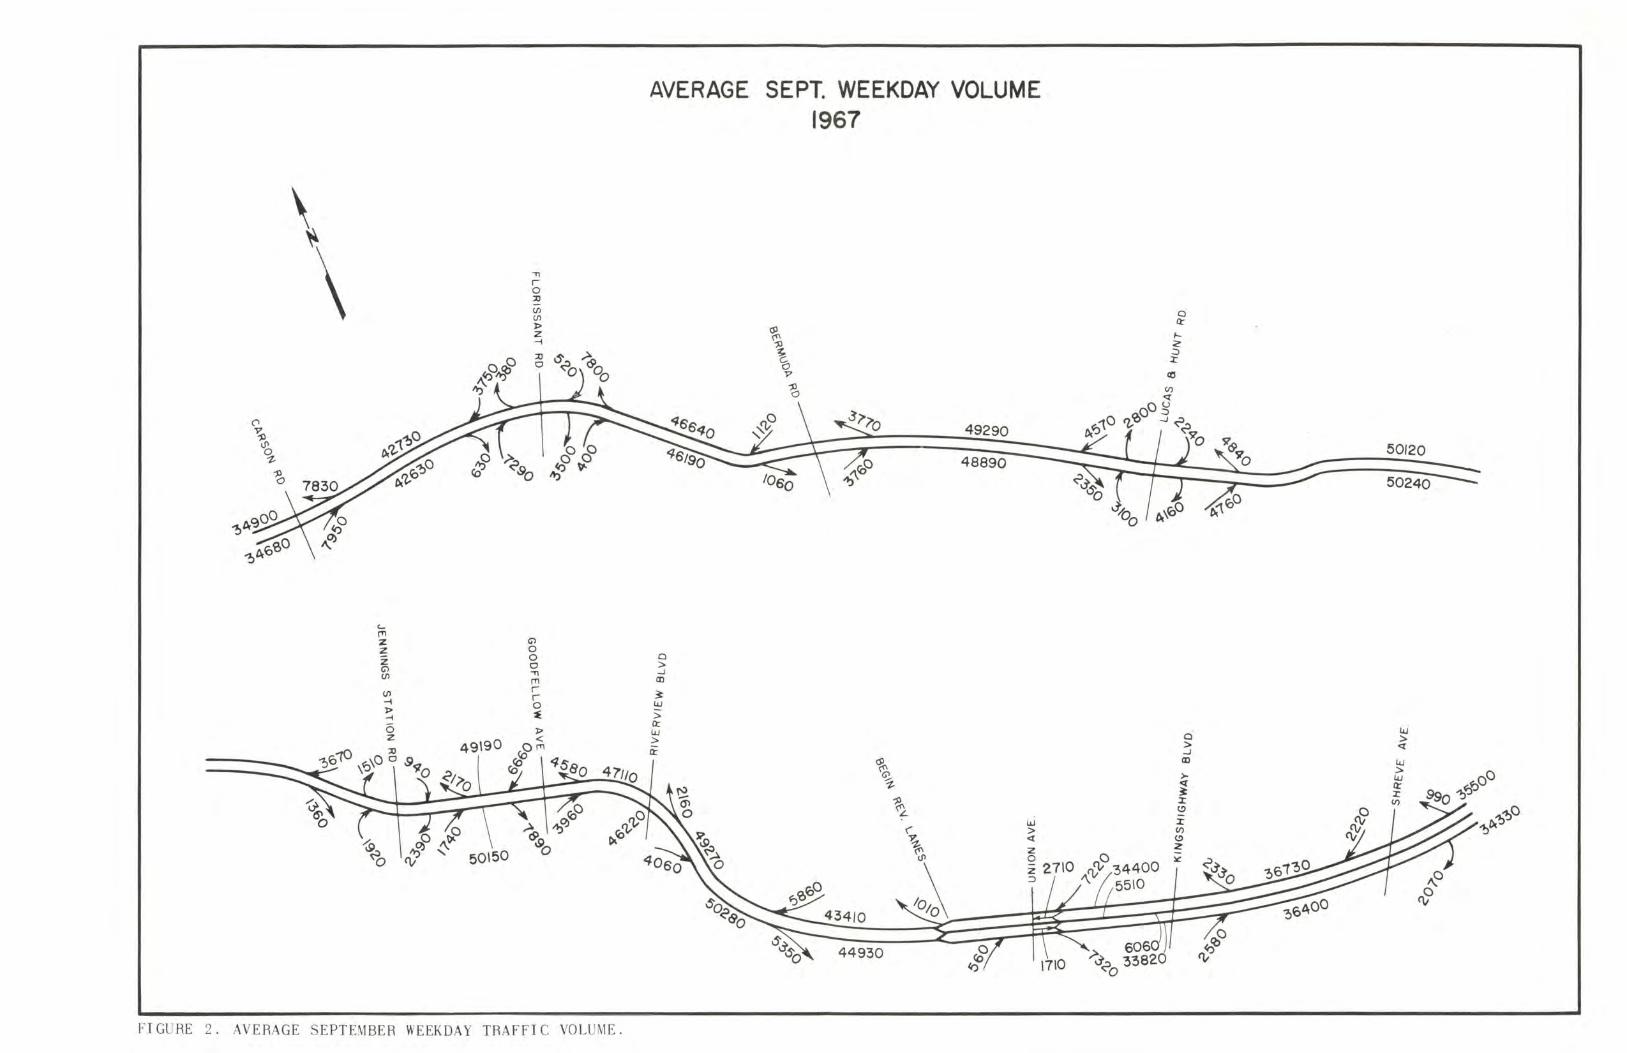
Average September weekday volumes are shown in Figure 2 . As
expected, the lowest volumes occur on the west end with increases
along the way to a maximum volume just east of Lucas-Hunt Road
3
\ ~ \ r 0 ::IJ (J) (J)
1> Z ~
::IJ 0
('\
~
~
'-('T1
Z G'l 0 Z 0 z 0 G'l ~ (J) rn r (J) r
~ 0 1> ~ -t
(5 1> < z
49\90 Orn (Q
(o~ \ <I§.80
FI GURE 2. AVERAGE SE PT EMBER WEEK DAY TRAFFI C VOLUME.
AVERAGE SEPT. WEEKDAY VOLUME 1967
Q
> ...J (I)
~ w > a:: w > a::
tP
~ t o
v
~
-=:i :-- 49290
% ~ 't-
~ L..
44930
~ ~
,:i
48890
w > <l
~J'~ o~
~o
Q ~
I~ :::> oX
«l
ci > ...J (I)
> : I (!)
I en (!) z ~
50/20
50240
w > <l
Interchange . At this location the two- way weekday volume appears
to exceed 100 , 000 vehicles . This is a sizable increase over the
counts taken in 1964 . A direct comparison cannot be made , however,
since the 1964 counts were daily rather than weekday .
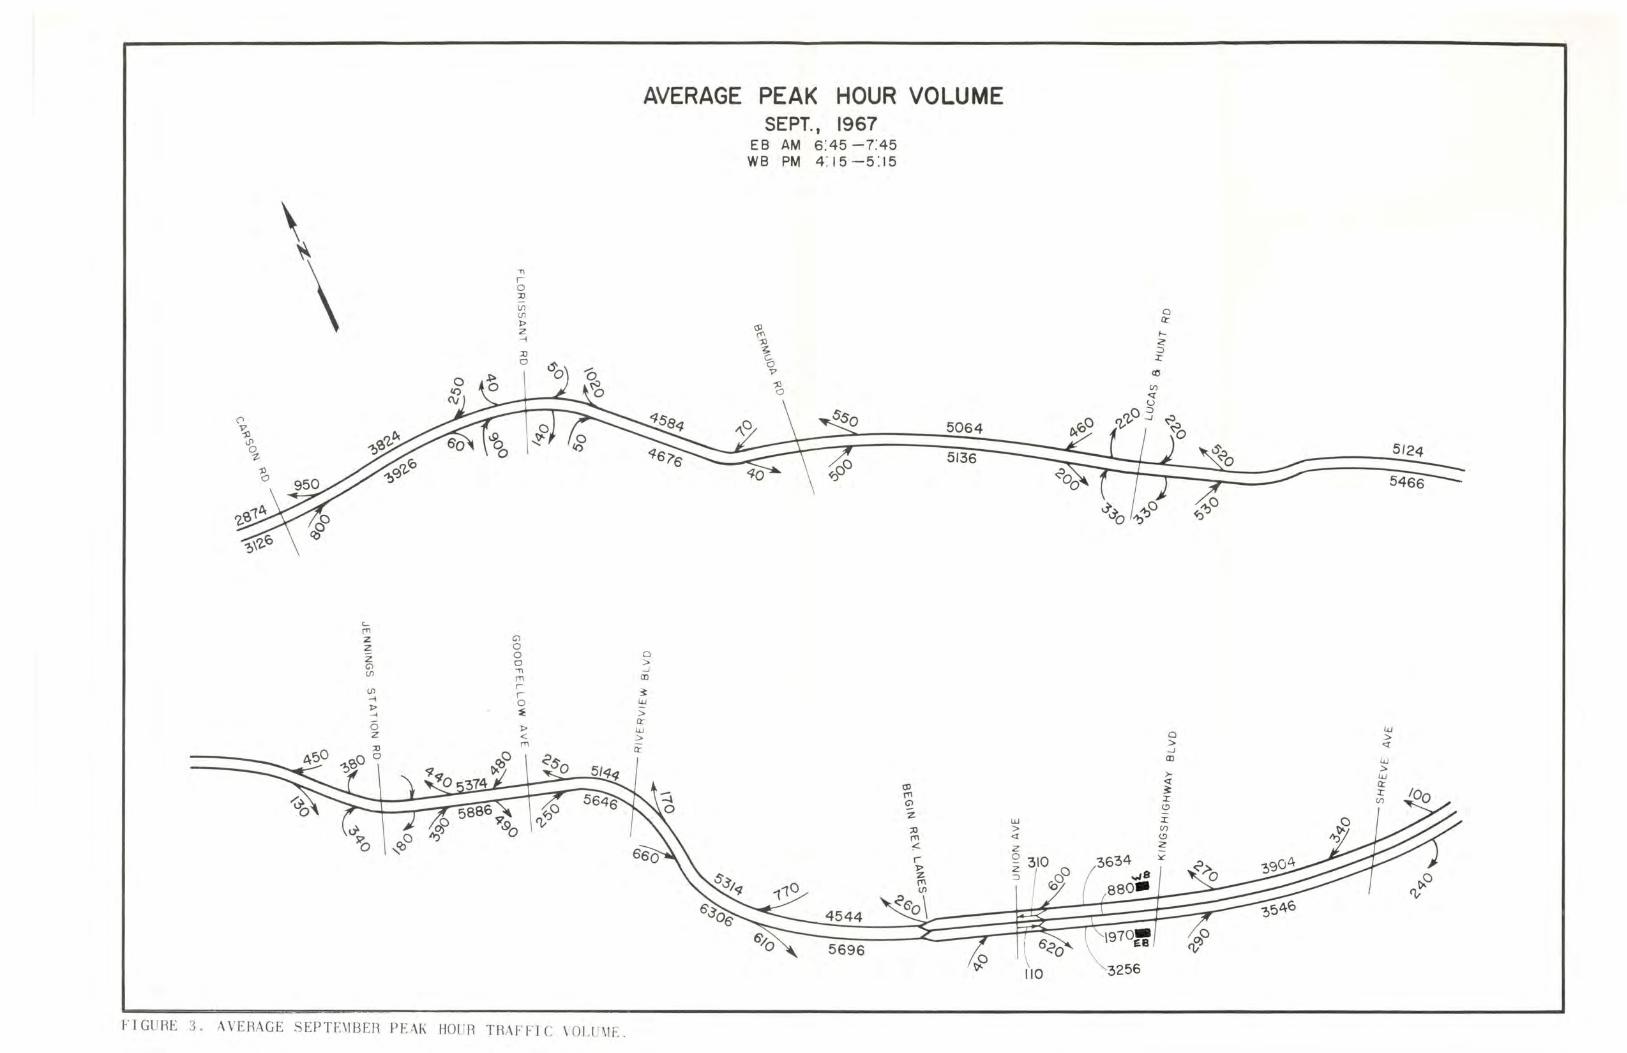
The volumes shown in Figure 3 are for the time period during
which the peak hour most often occurred on the ramps . This pro
vides approximate peak hour volumes with a balanced flow . The
actual peak volume at any specific location may be slightly
higher than shown .
The maximum volume during the A.M . peak hour (E . B. lanes)
occurs just east of Riverview Boulevard . The volume in either
direction generally decreases with movement we s tward along the
freeway .
The maximum P.M. peak hour volume (W . B. lanes) occurs just
west of Goodfellow Avenue. At this location the freeway is
three lanes , with an additional lane serving as an acceleration
deceleration ramp .
During the P. M. peak hour, the west end of the reversible
lanes , operating in the westbound direction , has a relatively
low volume (less than one-half the A.M. eastbound peak hour) .
This is apparently due to the difficulty in merging with traffic
in the through lanes .
Densities
The use of traffic dens ity, expres s ed in terms of vehicle s
per lane per mile, has been e stabli s hed a s a means of measuring
over-all operating conditions on freeways. Density , for this
study, was determined by counting the number of vehicles on each
5
\ ." I \ 0 AI (fl (fl
t:> Z ~
AI 0
(">
~~
'-[T1
Z Gl Z 0 Z 0 Gl 0 (fl ."
[T1
(fl I
~ I
t:> 0 ~ ~
is t:> Z <
[T1
FIGURE 3 . AVERAGE SEPTF:\lBER PEAK HOUR TRAFFIC \ ·OLU\lE.
AVERAGE PEAK HOUR VOLUME SEPT., 1967
a > --l II)
~ W :; Q: W > Q:
E B AM 6:45 -7:45 W B PM 4 : 1 5 - 5 : 15
\ v ,:l o
4544
5696
0) fT1 Gl
Z
5064
5/36
~
w > q
3634 ~8
880.
1970:1
""3256
a Q:
i--2 :::> x
co
a > --i II)
>q ~ X l?
X en l? z lC
5/24
5466
w > q
section of road as they appeared on aerial photographs. In order
to use density as a measure of operation, it is necessary to re
late it to some recognizable quantity, such as speed, which was
used in this case.
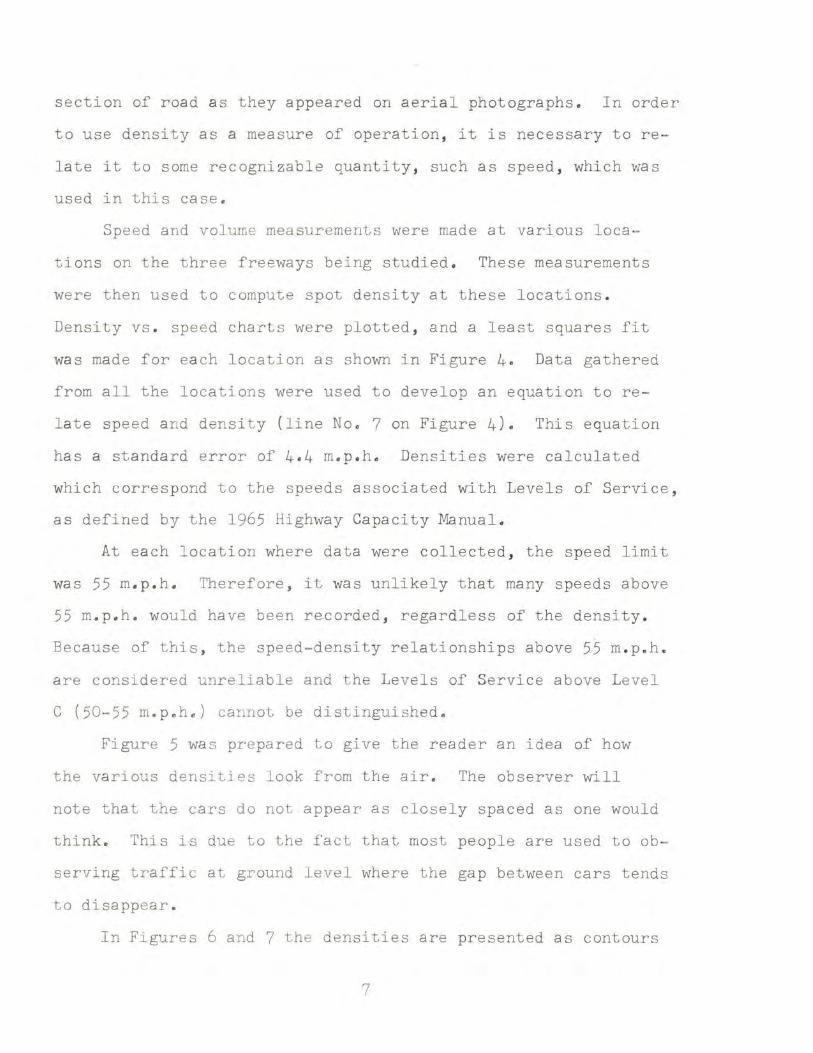
Speed and volume measurements were made at various loca
tions on the three freeways being studied. These measurements
were then used to compute spot density at these locations.
Density vs. speed charts were plotted, and a least squares fit
was made for each location as shown in Figure 4. Data gathered
from all the locations were used to develop an equation to re
late speed and density (line No.7 on Figure 4). This equation
has a standard error of 4.4 m.p.h. Densities were calculated
which correspond to the speeds associated with Levels of Service,
as defined by the 1965 Highway Capacity Manual.
At each location where data were collected , the speed limit
was 55 m.p.h. Therefore , it was unlikely that many speeds above
55 m.p.h. would have been recorded, regardless of the density.
Because of this, the speed-density relationships above 55 m.p.h.
are considered unreliable and the Levels of Service above Level
C (50-55 m.p.h.) cannot be distinguished.
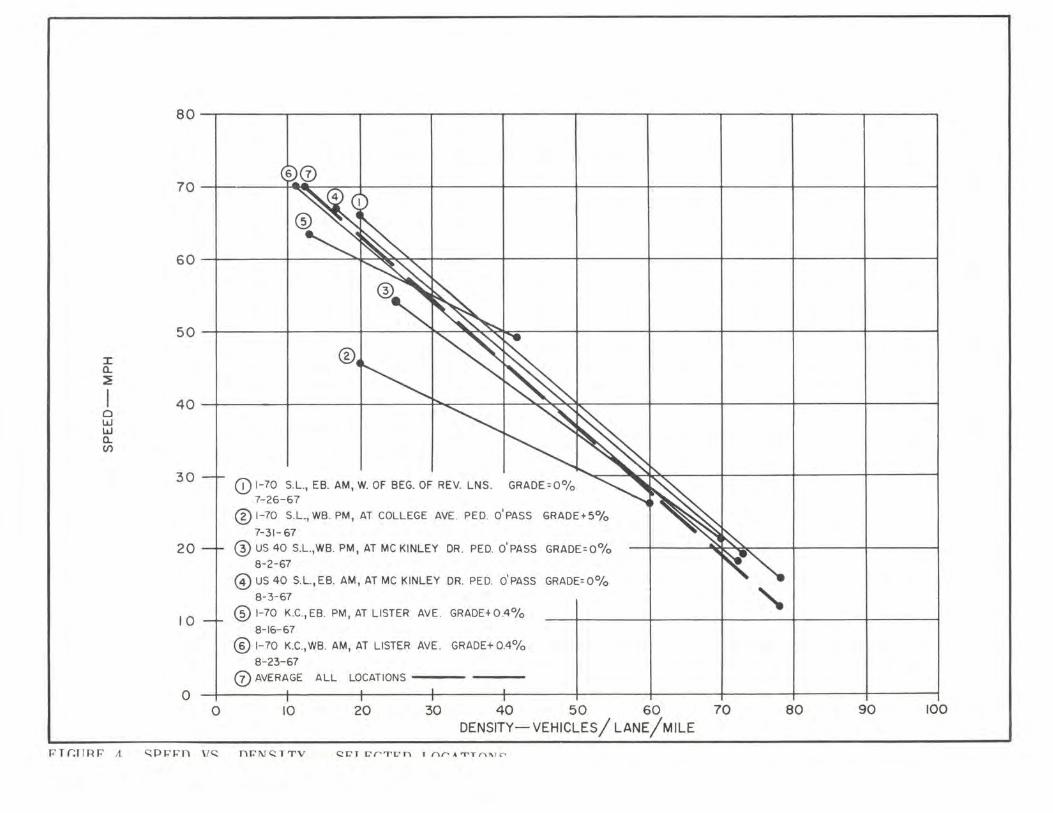
Figure 5 was prepared to give the reader an idea of how
the various densi ties look from the air . The observer will
note that the cars do not appear as closely spaced as one would
think . This is due to the fact that most people are used to ob
serving traffic at ground level where the gap between cars tends
to disappear.
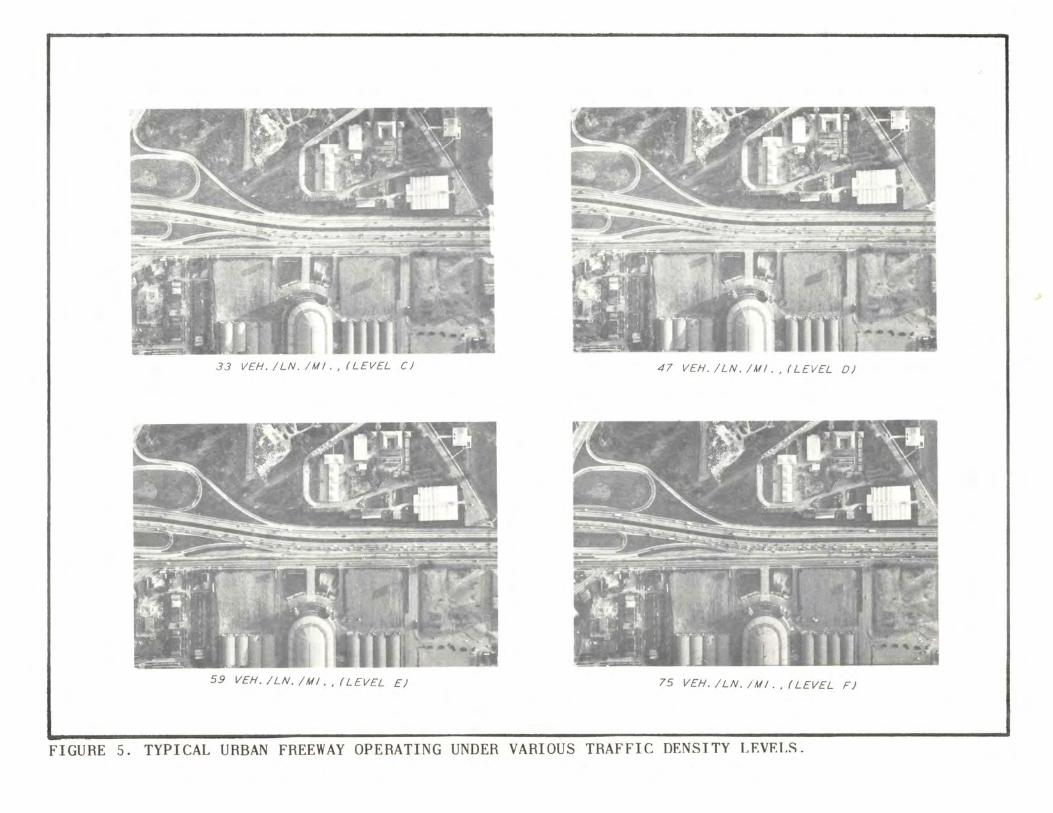
In Figures 6 and 7 the densities are presented as contours
7
J: a.. ~
I o w w a.. (/)
J;'Tr.rmJ;' A
80~------~------~-------r------.-------~------.-------.-------r------'------~
70 1--" =
60 ...... k~ ... ' ... I
50 10... ~ '<'?k::::
40 J't< ',""'<'\:"k:
30
20
10
o o
CD 1-70 S.L., EB. AM, W. OF BEG. OF REV. LNS . 7-26- 67
® 1-70 S.L., WB. PM, AT COLLEGE AVE . PED. O'PASS GRADE+50/ 0
7-31- 67
® US 40 SL,WB. PM, AT MC KINLEY DR . PED. O'PASS GRADE=O% 8-2-67
@ US 40 S.L., EB. AM, AT MC KINLEY DR. PED. O' PASS GRADE= 0%
8-3-67
® 1-70 K.C.,EB. PM, AT LISTER AVE . GRADE+O.4%
8-16-67
® 1-70 K.C., WB. AM, AT LISTER AVE . GRADE+ 0.4%
8-23-67
(i) AVERAGE ALL LOCATIONS ---- ----
10 20 30 40 50 60 70 DENSITY-VEHICLES/ LANE/MILE
~P~~n V~ n~N~TTV QDTI:'r''rvn , r\0ATTAl\10
" 80 90 100
33 VEH. ILN. 1M!., (LEVEL C) 47 VEH. ILN. 1M!., (LEVEL D)
59 VEH./LN . /M!., (LEVEL E) 75 VEH. ILN. /M! . , (LEVEL F)
FIGURE 5. TYPICAL URBAN FREEWAY OPERATING UNDER VARIOUS TRAFFIC DENSITY LEVELS .
~ ct I w :I ~
\ \
~ z ~ Q: ct U
..... z ~~ !Go ct Q:Q: 00 g ~8 lL ffiQ:
m
C:=J
..... z ::> IO
J,~ j ::> ...J
LEGEND LEVELS OF SERVICE
LEVEL C OR BETTER SPEED RANGE (MPH)
50 OR GREATER LEVEL D 40 TO 50 LEVEL E 30 TO 40
LESS THAN 30 VEHICLES/LANE/MILE -20
LEVEL F DENSITY CONTOURS
MIL
~~ ~ ...Jz wd ~~O liw ~~ 8~ ~i=;<5 Wm 8 ~
Z~Q: ~(J') ....,
Q:
LJ
FIGURE 6·. TRAFFIC DENSITY CONTOURS AND LEVELS OF SERVICE DURING THE MORNING PEAK PERIOD ON THE EASTBOUND LANES.
W
~ W ~ ~
(J') W
0 ~ ~ I .
W ~ <!)o
> -~ W
...J m
Vim Q:
:> <!)
I
W
~ Z (J')
Q:
Z ~ z ::> b3 m
D
O· .. .' .... ..
". . , ~ .
2 ~
I ~ 2 .....
\ \
~ z ~ 0:: <l U
..... Z
~Sf !!?o 0::0::
9 lJ...
..... Z ::>
<l
IO
00
l<l
~S VlO <lO::
ffio:: u ::>
CD
....J
~~ ~ l1iz We
VlZo lJ...w
~~ ~ Q <l
8~ WCD
z!cio g
~ z~o::
0::
WVl "'")
LEGEND LEVELS OF SERVICE SPEED RANGE (MPH)
LEVEL C OR BETTER 50 OR GREATER LEVEL D 40 TO 50 LEVEL E 30 TO 40 LEVEL F LESS THAN 30 DENSITY CONTOURS VEHICLES/LANE/MILE -20-
MILES
WEST BOUND
TRAFFC
o
o --30" 'j
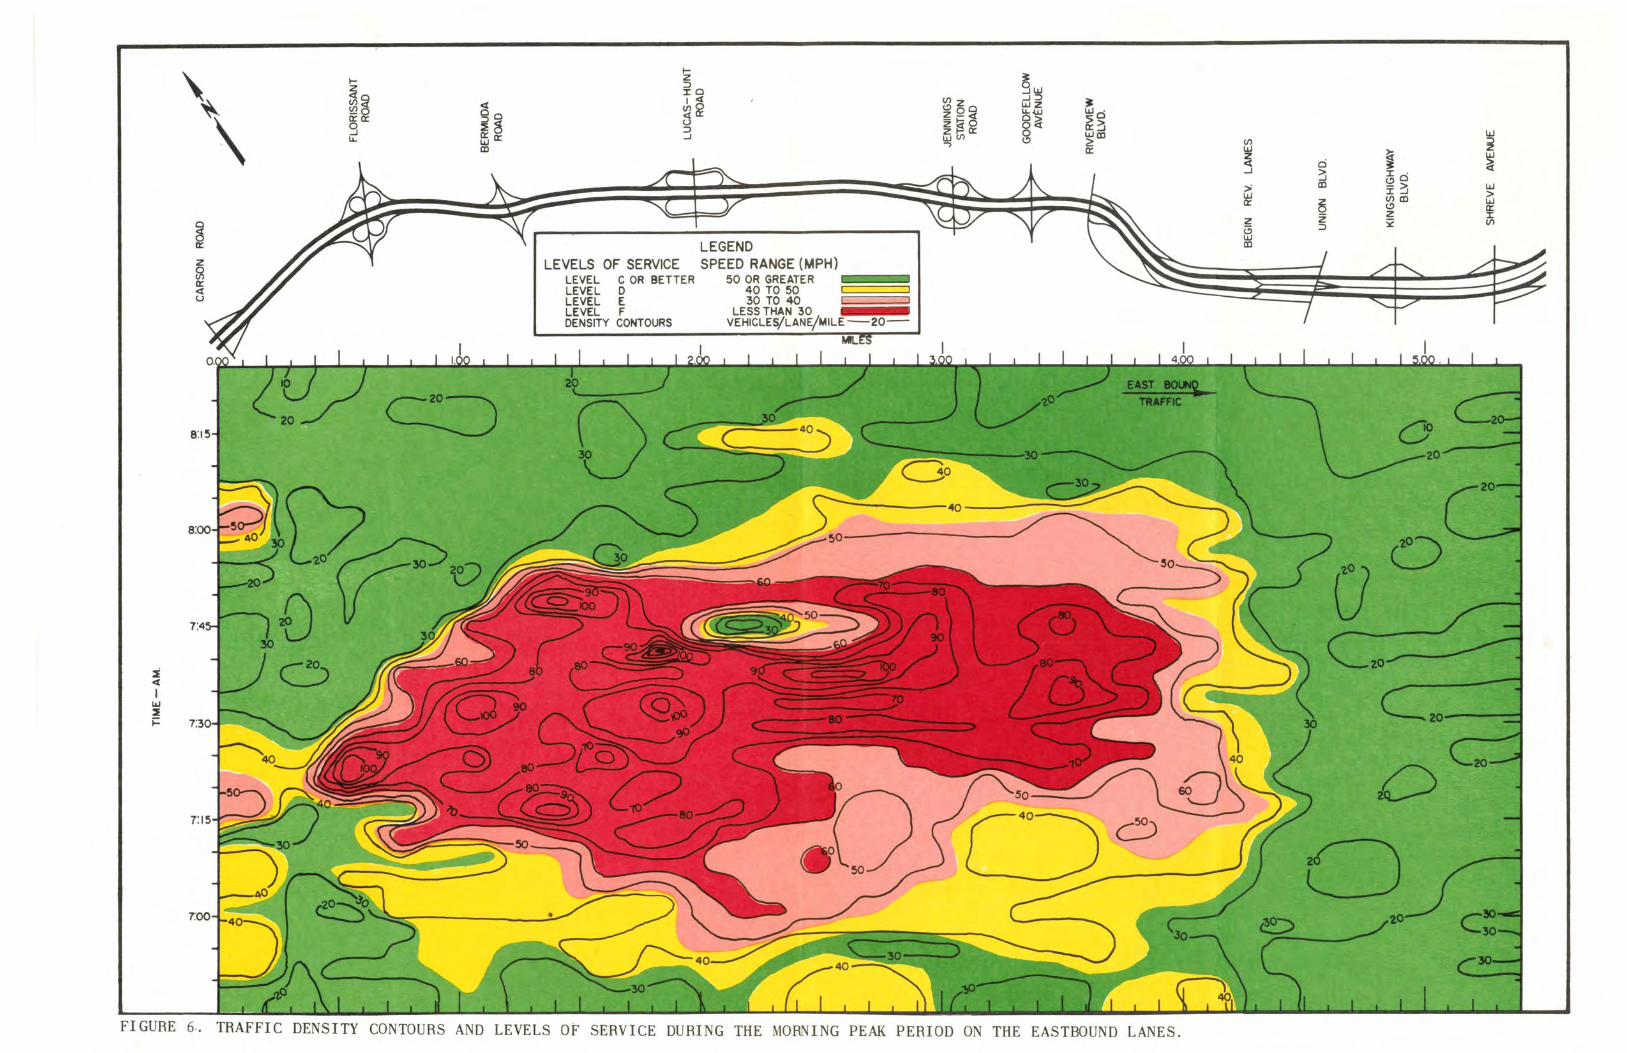
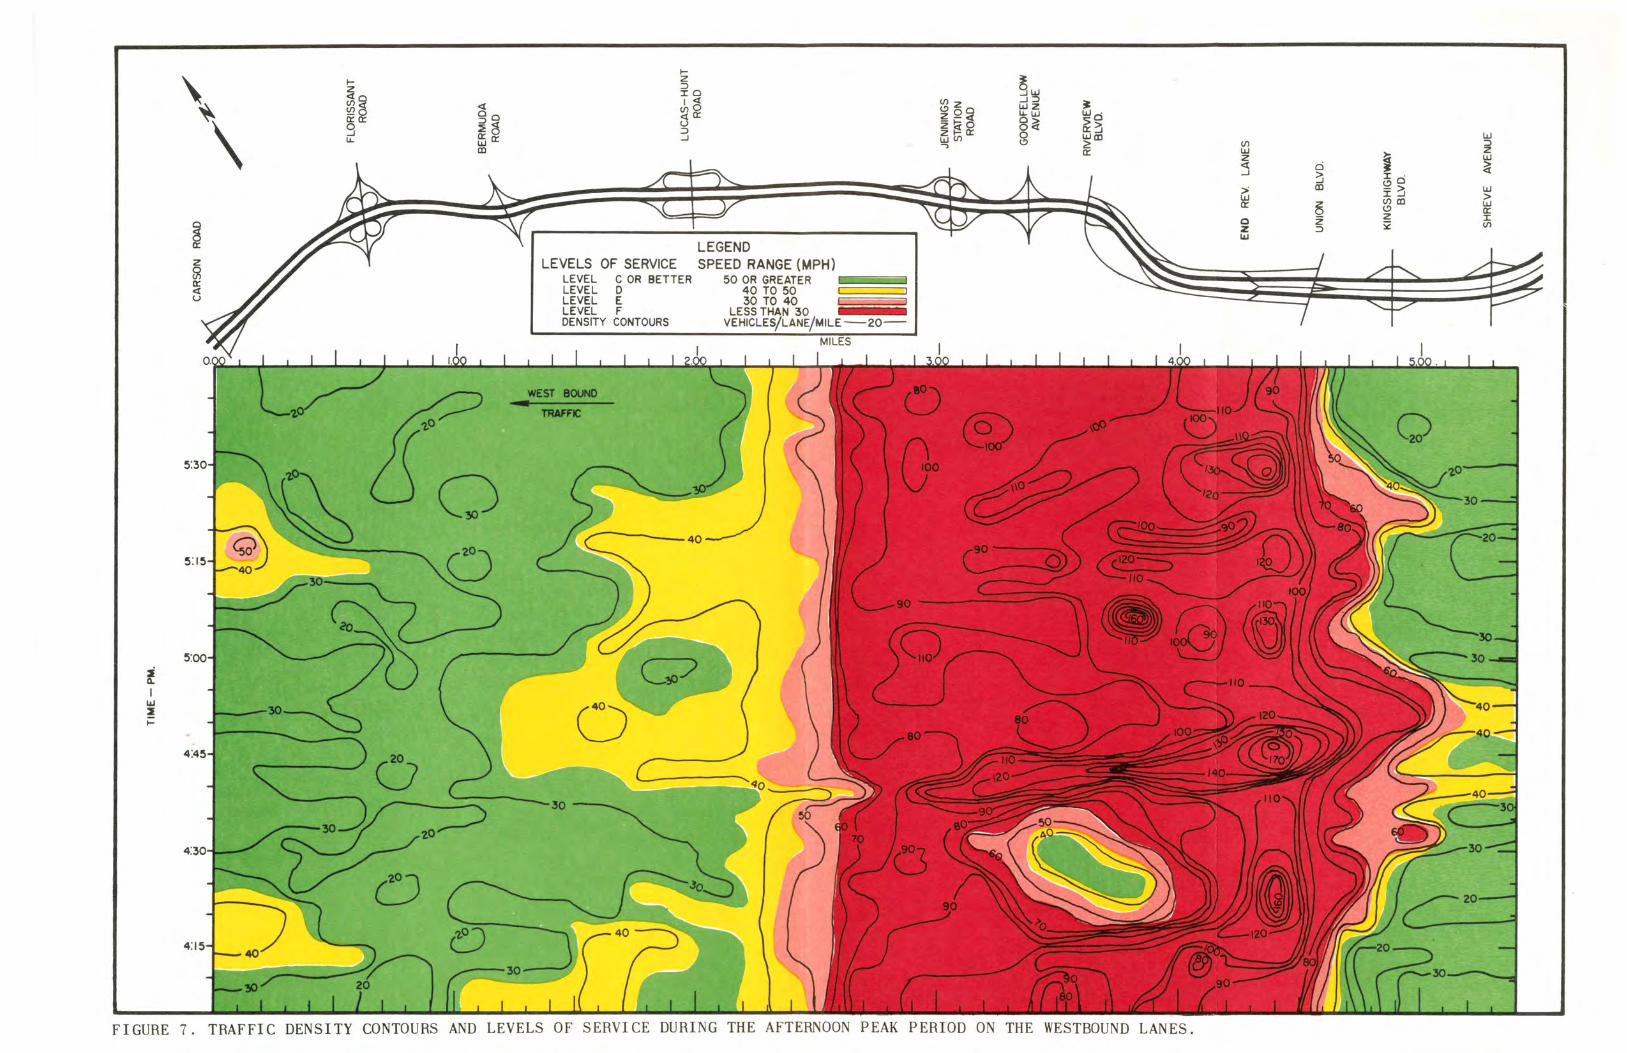
FIGURE 7. TRAFFIC DENSITY CONTOURS AND LEVELS OF SERVICE DURING THE AFTERNOON PEAK PERIOD ON THE WESTBOUND LANES.
W ::> Z W ~ ~
Vl W
e ~ ~ I .
W ~ (!)O
>
....J
-~ W
CD
~CD 0:: I
;>
~ (!)
Vl
W
Z 0::
Z :;;c 0 ::> z
~
on a time-distance chart. To reflect the equivalent level of
service, the density contours have been color coded. With the
use of color, the density charts are virtually self-explanatory.
Red indicates the lowest level of service (level F) , while green
indicates the best le vel that could be determined (level C or
better) •
It should be remembered that these charts represent opera-
tion on only one day, and while no unusual incidents were detected
on that day, daily variations in operating conditions do occure
The eastbound lanes (Figure 6) carry the heavy traffic and
are the lanes of interest during the morning peak period . Con~
gestion , or impending congestion (levels E and F) , is prevalent W'~~..f
throughout most of the study area -e a s t of the reversible lanes .
These conditions a~pear to prevail during the 7 to 8 A. M. peak
hour. This is the same general area where these conditions were
observed during the 1964 study, except in 1964 conditions were
much less severe.
It is difficult to pinpoint critical locations where con-
gestion first appears. The congestion appears at nearly the
same time in the entire area between Florissant Road and the
reversible lanes. The highest densities were found between
Bermuda Road and Lucas-Hunt RoadQ The congestion found west of
this section could be a result of back-up from this section.
Operating conditions in the westbound lanes on the day rep
resented in Figure 7 were rather extreme and difficult to analyze .
The extent of congestion is readily apparent. The area was con-
gested throughout the entire study period. This makes it impossible
1 ?
to determine the location or time when congesti on first occurs .
This area extends from the western terminus of the reversible
lanes to the crest of a 5 percent grade mi dway between Jennings
Sta tion Road and Lucas-Hunt Road. At times the congestion backs
up into the reversible lanes section as far as Kingshighway
Boulevard .
The congestion extends over the same area as found in the
1964 study , although in 1964 it was much less severe .
It is not apparent whether the congestion found on the 5
percent gra de west of Jennings Station Road originates there ,
or if it begins at the curve at Jennings Station Road and the
grade merely prevents the traffic from regaining normal operat
ing speeds .
The western terminus of the reversible lanes , where five
lanes merge into three , is the location of c onsi d e rable conges
tion . Vehicles in the reversible lanes form a single lane and
merge with the three through lanes . This is the apparent reason
for the high densities that occur periodically in the area . For
a brief period , this congestion in the merging area tied up
traffic to the extent that it wa s "metering" traffic and down
stream traffic began to operate under free flow conditions
(indicated by the pool of green in the middle of the red) .
Operating conditions on the day the westbound lanes were
filmed were somewhat poorer than anticipated . The early appear
ance of such heavy congestion may be an indication that some
incident , which caused a slowdown in traffic movement , may have
occurred earlier in the day_
13
Summary
Traffic volumes are continuing to increase on the Mark Twain
Expressway . October daily traffic now exceeds 100 , 000 vehicles.
Heavy densities and low levels of service are found through
out most of the A. M. peak hour on the eastbound lanes between
Florissant Road and the beginning of the reversible lanes .
During the P.M. peak period , the westbound lanes are heavily
congested between the reversible lanes and a point midway between
Jennings Station Road and Lucas-Hunt Road. While not covering
as long an area, the P.M. congestion is much more severe than
that found during the morning period . Any detailed study of
critical areas would include most of this area .
14
111I11111 111111~lll~il~llli~I~11I111 111111I1 RD0016302